Attached files
| file | filename |
|---|---|
| EX-32.2 - SECTION 906 CFO CERTIFICATION - WORTHINGTON INDUSTRIES INC | d240057dex322.htm |
| EX-32.1 - SECTION 906 CEO CERTIFICATION - WORTHINGTON INDUSTRIES INC | d240057dex321.htm |
| EX-31.2 - SECTION 302 CFO CERTIFICATION - WORTHINGTON INDUSTRIES INC | d240057dex312.htm |
| EX-31.1 - SECTION 302 CEO CERTIFICATION - WORTHINGTON INDUSTRIES INC | d240057dex311.htm |
Table of Contents

UNITED STATES
SECURITIES AND EXCHANGE COMMISSION
Washington, D.C. 20549
FORM 10-Q
| x | QUARTERLY REPORT PURSUANT TO SECTION 13 OR 15(d) OF THE SECURITIES EXCHANGE ACT OF 1934 |
For the quarterly period ended August 31, 2016
OR
| ¨ | TRANSITION REPORT PURSUANT TO SECTION 13 OR 15(d) OF THE SECURITIES EXCHANGE ACT OF 1934 |
For the transition period from to
Commission File Number 001-08399
WORTHINGTON INDUSTRIES, INC.
(Exact name of registrant as specified in its charter)
| Ohio |
31-1189815 | |
|
|
| |
| (State or other jurisdiction of incorporation or organization) |
(I.R.S. Employer Identification No.) | |
| 200 Old Wilson Bridge Road, Columbus, Ohio |
43085 | |
|
|
| |
| (Address of principal executive offices) |
(Zip Code) | |
| (614) 438-3210 |
| (Registrant’s telephone number, including area code) |
| Not applicable |
| (Former name, former address and former fiscal year, if changed since last report) |
Indicate by check mark whether the registrant (1) has filed all reports required to be filed by Section 13 or 15(d) of the Securities Exchange Act of 1934 during the preceding 12 months (or for such shorter period that the registrant was required to file such reports), and (2) has been subject to such filing requirements for the past 90 days.
YES x NO ¨
Indicate by check mark whether the registrant has submitted electronically and posted on its corporate Web site, if any, every Interactive Data File required to be submitted and posted pursuant to Rule 405 of Regulation S-T (§232.405 of this chapter) during the preceding 12 months (or for such shorter period that the registrant was required to submit and post such files).
YES x NO ¨
Indicate by check mark whether the registrant is a large accelerated filer, an accelerated filer, a non-accelerated filer, or a smaller reporting company. See the definitions of “large accelerated filer,” “accelerated filer” and “smaller reporting company” in Rule 12b-2 of the Exchange Act.
| Large accelerated filer |
x |
Accelerated filer |
¨ | |||
| Non-accelerated filer |
¨ (Do not check if a smaller reporting company) |
Smaller reporting company |
¨ |
Indicate by check mark whether the registrant is a shell company (as defined in Rule 12b-2 of the Exchange Act).
YES ¨ NO x
APPLICABLE ONLY TO CORPORATE ISSUERS:
Indicate the number of shares outstanding of each of the Issuer’s classes of common stock, as of the latest practicable date. On September 30, 2016, the number of Common Shares, without par value, issued and outstanding was 63,496,093.
Table of Contents
i
Table of Contents
Selected statements contained in this Quarterly Report on Form 10-Q, including, without limitation, in “PART I – Item 2. – Management’s Discussion and Analysis of Financial Condition and Results of Operations,” constitute “forward-looking statements” as that term is used in the Private Securities Litigation Reform Act of 1995 (the “Act”). Forward-looking statements reflect our current expectations, estimates or projections concerning future results or events. These statements are often identified by the use of forward-looking words or phrases such as “believe,” “expect,” “anticipate,” “may,” “could,” “intend,” “estimate,” “plan,” “foresee,” “likely,” “will,” “should” or other similar words or phrases. These forward-looking statements include, without limitation, statements relating to:
| • | outlook, strategy or business plans; |
| • | the ability to correct performance issues at operations; |
| • | future or expected growth, forward momentum, performance, sales, volumes, cash flows, earnings, balance sheet strengths, debt, financial condition or other financial measures; |
| • | pricing trends for raw materials and finished goods and the impact of pricing changes; |
| • | demand trends for us or our markets; |
| • | additions to product lines and opportunities to participate in new markets; |
| • | expected benefits from Transformation efforts; |
| • | anticipated capital expenditures and asset sales; |
| • | anticipated improvements and efficiencies in costs, operations, sales, inventory management, sourcing and the supply chain and the results thereof; |
| • | projected profitability potential, capacity and working capital needs; |
| • | the ability to make acquisitions and the projected timing, results, benefits, costs, charges and expenditures related to acquisitions, newly-created joint ventures, headcount reductions and facility dispositions, shutdowns and consolidations; |
| • | the alignment of operations with demand; |
| • | the ability to operate profitably and generate cash in down markets; |
| • | the ability to maintain margins and capture and maintain market share and to develop or take advantage of future opportunities, customer initiatives, new businesses, new products and new markets; |
| • | expectations for Company and customer inventories, jobs and orders; |
| • | expectations for the economy and markets or improvements therein; |
| • | expectations for increasing volatility or improving and sustaining earnings, earnings potential, margins or shareholder value; |
| • | effects of judicial rulings; and |
| • | other non-historical matters. |
Because they are based on beliefs, estimates and assumptions, forward-looking statements are inherently subject to risks and uncertainties that could cause actual results to differ materially from those projected. Any number of factors could affect actual results, including, without limitation, those that follow:
| • | the effect of national, regional and global economic conditions generally and within major product markets, including a recurrent slowing economy; |
| • | the effect of conditions in national and worldwide financial markets; |
| • | lower oil prices as a factor in demand for products; |
| • | product demand and pricing; |
| • | changes in product mix, product substitution and market acceptance of our products; |
| • | fluctuations in the pricing, quality or availability of raw materials (particularly steel), supplies, transportation, utilities and other items required by operations; |
| • | effects of facility closures and the consolidation of operations; |
| • | the effect of financial difficulties, consolidation and other changes within the steel, automotive, construction, oil and gas, and other industries in which we participate; |
| • | failure to maintain appropriate levels of inventories; |
| • | financial difficulties (including bankruptcy filings) of original equipment manufacturers, end-users and customers, suppliers, joint venture partners and others with whom we do business; |
| • | the ability to realize targeted expense reductions from headcount reductions, facility closures and other cost reduction efforts; |
| • | the ability to realize other cost savings and operational, sales and sourcing improvements and efficiencies, and other expected benefits from Transformation efforts, on a timely basis; |
ii
Table of Contents
| • | the overall success of, and the ability to integrate, newly-acquired businesses and joint ventures, maintain and develop their customers, and achieve synergies and other expected benefits and cost savings therefrom; |
| • | capacity levels and efficiencies, within facilities, within major product markets and within the industries in which we participate as a whole; |
| • | the effect of disruption in the business of suppliers, customers, facilities and shipping operations due to adverse weather, casualty events, equipment breakdowns, civil unrest, international conflicts or terrorist activities or other causes; |
| • | changes in customer demand, inventories, spending patterns, product choices, and supplier choices; |
| • | risks associated with doing business internationally, including economic, political and social instability, foreign currency exposure and the acceptance of our products in these markets; |
| • | the ability to improve and maintain processes and business practices to keep pace with the economic, competitive and technological environment; |
| • | the outcome of adverse claims experience with respect to workers’ compensation, product recalls or product liability, casualty events or other matters; |
| • | deviation of actual results from estimates and/or assumptions used by us in the application of our significant accounting policies; |
| • | level of imports and import prices in our markets; |
| • | the impact of judicial rulings and governmental regulations, both in the United States and abroad, including those adopted by the United States Securities and Exchange Commission and other governmental agencies as contemplated by the Dodd-Frank Wall Street Reform and Consumer Protection Act of 2010; |
| • | the effect of changes to healthcare laws in the United States, which may increase our healthcare and other costs and negatively impact our operations and financial results; |
| • | cyber security risks; and |
| • | other risks described from time to time in our filings with the United States Securities and Exchange Commission, including those described in “PART I – Item 1A. — Risk Factors” of our Annual Report on Form 10-K for the fiscal year ended May 31, 2016. |
We note these factors for investors as contemplated by the Act. It is impossible to predict or identify all potential risk factors. Consequently, you should not consider the foregoing list to be a complete set of all potential risks and uncertainties. Any forward-looking statements in this Quarterly Report on Form 10-Q are based on current information as of the date of this Quarterly Report on Form 10-Q, and we assume no obligation to correct or update any such statements in the future, except as required by applicable law.
iii
Table of Contents
Item 1. – Financial Statements
CONSOLIDATED BALANCE SHEETS
(In thousands)
(Unaudited)
| August 31, 2016 |
May 31, 2016 |
|||||||
| Assets |
||||||||
| Current assets: |
||||||||
| Cash and cash equivalents |
$ | 181,525 | $ | 84,188 | ||||
| Receivables, less allowances of $3,866 and $4,579 at August 31, 2016 and May 31, 2016, respectively |
416,529 | 439,688 | ||||||
| Inventories: |
||||||||
| Raw materials |
192,117 | 162,427 | ||||||
| Work in process |
104,418 | 86,892 | ||||||
| Finished products |
73,198 | 70,016 | ||||||
|
|
|
|
|
|||||
| Total inventories |
369,733 | 319,335 | ||||||
| Income taxes receivable |
2,498 | 10,535 | ||||||
| Assets held for sale |
10,052 | 10,079 | ||||||
| Prepaid expenses and other current assets |
52,129 | 51,290 | ||||||
|
|
|
|
|
|||||
| Total current assets |
1,032,466 | 915,115 | ||||||
| Investments in unconsolidated affiliates |
200,048 | 191,826 | ||||||
| Goodwill |
246,204 | 246,067 | ||||||
| Other intangible assets, net of accumulated amortization of $52,998 and $49,532 at August 31, 2016 and May 31, 2016, respectively |
92,689 | 96,164 | ||||||
| Other assets |
29,775 | 29,254 | ||||||
| Property, plant and equipment: |
||||||||
| Land |
18,537 | 18,537 | ||||||
| Buildings and improvements |
259,682 | 256,973 | ||||||
| Machinery and equipment |
974,219 | 945,951 | ||||||
| Construction in progress |
30,789 | 48,156 | ||||||
|
|
|
|
|
|||||
| Total property, plant and equipment |
1,283,227 | 1,269,617 | ||||||
| Less: accumulated depreciation |
702,456 | 686,779 | ||||||
|
|
|
|
|
|||||
| Total property, plant and equipment, net |
580,771 | 582,838 | ||||||
|
|
|
|
|
|||||
| Total assets |
$ | 2,181,953 | $ | 2,061,264 | ||||
|
|
|
|
|
|||||
| Liabilities and equity |
||||||||
| Current liabilities: |
||||||||
| Accounts payable |
$ | 325,299 | $ | 290,432 | ||||
| Short-term borrowings |
1,534 | 2,651 | ||||||
| Accrued compensation, contributions to employee benefit plans and related taxes |
69,204 | 75,105 | ||||||
| Dividends payable |
14,212 | 13,471 | ||||||
| Other accrued items |
49,453 | 45,056 | ||||||
| Income taxes payable |
15,639 | 2,501 | ||||||
| Current maturities of long-term debt |
867 | 862 | ||||||
|
|
|
|
|
|||||
| Total current liabilities |
476,208 | 430,078 | ||||||
| Other liabilities |
63,229 | 63,487 | ||||||
| Distributions in excess of investment in unconsolidated affiliate |
66,192 | 52,983 | ||||||
| Long-term debt |
577,408 | 577,491 | ||||||
| Deferred income taxes, net |
17,836 | 17,379 | ||||||
|
|
|
|
|
|||||
| Total liabilities |
1,200,873 | 1,141,418 | ||||||
| Shareholders’ equity - controlling interest |
855,962 | 793,371 | ||||||
| Noncontrolling interests |
125,118 | 126,475 | ||||||
|
|
|
|
|
|||||
| Total equity |
981,080 | 919,846 | ||||||
|
|
|
|
|
|||||
| Total liabilities and equity |
$ | 2,181,953 | $ | 2,061,264 | ||||
|
|
|
|
|
|||||
See notes to consolidated financial statements.
1
Table of Contents
CONSOLIDATED STATEMENTS OF EARNINGS
(In thousands, except per share amounts)
(Unaudited)
| Three Months Ended August 31, |
||||||||
| 2016 | 2015 | |||||||
| Net sales |
$ | 737,549 | $ | 758,147 | ||||
| Cost of goods sold |
590,267 | 645,131 | ||||||
|
|
|
|
|
|||||
| Gross margin |
147,282 | 113,016 | ||||||
| Selling, general and administrative expense |
81,056 | 75,951 | ||||||
| Impairment of long-lived assets |
— | 3,000 | ||||||
| Restructuring and other expense |
1,328 | 3,069 | ||||||
|
|
|
|
|
|||||
| Operating income |
64,898 | 30,996 | ||||||
| Other income (expense): |
||||||||
| Miscellaneous income (expense), net |
863 | (578 | ) | |||||
| Interest expense |
(7,870 | ) | (7,854 | ) | ||||
| Equity in net income of unconsolidated affiliates |
34,544 | 26,581 | ||||||
|
|
|
|
|
|||||
| Earnings before income taxes |
92,435 | 49,145 | ||||||
| Income tax expense |
23,899 | 14,150 | ||||||
|
|
|
|
|
|||||
| Net earnings |
68,536 | 34,995 | ||||||
| Net earnings attributable to noncontrolling interests |
2,969 | 3,027 | ||||||
|
|
|
|
|
|||||
| Net earnings attributable to controlling interest |
$ | 65,567 | $ | 31,968 | ||||
|
|
|
|
|
|||||
| Basic |
||||||||
| Average common shares outstanding |
61,885 | 63,993 | ||||||
|
|
|
|
|
|||||
| Earnings per share attributable to controlling interest |
$ | 1.06 | $ | 0.50 | ||||
|
|
|
|
|
|||||
| Diluted |
||||||||
| Average common shares outstanding |
64,337 | 66,065 | ||||||
|
|
|
|
|
|||||
| Earnings per share attributable to controlling interest |
$ | 1.02 | $ | 0.48 | ||||
|
|
|
|
|
|||||
| Common shares outstanding at end of period |
62,179 | 63,343 | ||||||
| Cash dividends declared per share |
$ | 0.20 | $ | 0.19 | ||||
See notes to consolidated financial statements.
2
Table of Contents
CONSOLIDATED STATEMENTS OF COMPREHENSIVE INCOME
(In thousands)
(Unaudited)
| Three Months Ended August 31, |
||||||||
| 2016 | 2015 | |||||||
| Net earnings |
$ | 68,536 | $ | 34,995 | ||||
| Other comprehensive income (loss): |
||||||||
| Foreign currency translation |
(665 | ) | 1,823 | |||||
| Pension liability adjustment, net of tax |
— | (8 | ) | |||||
| Cash flow hedges, net of tax |
625 | 630 | ||||||
|
|
|
|
|
|||||
| Other comprehensive income (loss) |
(40 | ) | 2,445 | |||||
|
|
|
|
|
|||||
| Comprehensive income |
68,496 | 37,440 | ||||||
| Comprehensive income attributable to noncontrolling interests |
2,973 | 2,971 | ||||||
|
|
|
|
|
|||||
| Comprehensive income attributable to controlling interest |
$ | 65,523 | $ | 34,469 | ||||
|
|
|
|
|
|||||
See notes to consolidated financial statements.
3
Table of Contents
CONSOLIDATED STATEMENTS OF CASH FLOWS
(In thousands)
(Unaudited)
| Three Months Ended August 31, |
||||||||
| 2016 | 2015 | |||||||
| Operating activities: |
||||||||
| Net earnings |
$ | 68,536 | $ | 34,995 | ||||
| Adjustments to reconcile net earnings to net cash provided by operating activities: |
||||||||
| Depreciation and amortization |
21,831 | 21,440 | ||||||
| Impairment of long-lived assets |
- | 3,000 | ||||||
| Provision for (benefit from) deferred income taxes |
20 | (5,540 | ) | |||||
| Bad debt (income) expense |
(81 | ) | 10 | |||||
| Equity in net income of unconsolidated affiliates, net of distributions |
3,898 | (5,513 | ) | |||||
| Net loss on sale of assets |
4,396 | 1,606 | ||||||
| Stock-based compensation |
3,136 | 3,777 | ||||||
| Changes in assets and liabilities: |
||||||||
| Receivables |
16,954 | 42,629 | ||||||
| Inventories |
(50,398 | ) | (7,824 | ) | ||||
| Prepaid expenses and other current assets |
7,162 | 11,166 | ||||||
| Other assets |
1,246 | 442 | ||||||
| Accounts payable and accrued expenses |
43,061 | 41,626 | ||||||
| Other liabilities |
1,144 | (3,187 | ) | |||||
|
|
|
|
|
|||||
| Net cash provided by operating activities |
120,905 | 138,627 | ||||||
|
|
|
|
|
|||||
| Investing activities: |
||||||||
| Investment in property, plant and equipment |
(16,316 | ) | (38,497 | ) | ||||
| Investments in unconsolidated affiliates |
- | (1,687 | ) | |||||
| Proceeds from sale of assets |
157 | 131 | ||||||
|
|
|
|
|
|||||
| Net cash used by investing activities |
(16,159 | ) | (40,053 | ) | ||||
|
|
|
|
|
|||||
| Financing activities: |
||||||||
| Net repayments of short-term borrowings |
(1,117 | ) | (68,511 | ) | ||||
| Proceeds from long-term debt |
- | 921 | ||||||
| Principal payments on long-term debt |
(219 | ) | (208 | ) | ||||
| Proceeds from (payments for) issuance of common shares |
5,821 | (602 | ) | |||||
| Payments to noncontrolling interests |
- | (3,336 | ) | |||||
| Repurchase of common shares |
- | (27,582 | ) | |||||
| Dividends paid |
(11,894 | ) | (11,551 | ) | ||||
|
|
|
|
|
|||||
| Net cash used by financing activities |
(7,409 | ) | (110,869 | ) | ||||
|
|
|
|
|
|||||
| Increase (decrease) in cash and cash equivalents |
97,337 | (12,295 | ) | |||||
| Cash and cash equivalents at beginning of period |
84,188 | 31,067 | ||||||
|
|
|
|
|
|||||
| Cash and cash equivalents at end of period |
$ | 181,525 | $ | 18,772 | ||||
|
|
|
|
|
|||||
See notes to consolidated financial statements.
4
Table of Contents
NOTES TO CONSOLIDATED FINANCIAL STATEMENTS
(Unaudited)
NOTE A – Basis of Presentation
The consolidated financial statements include the accounts of Worthington Industries, Inc. and consolidated subsidiaries (collectively, “we,” “our,” “Worthington,” or the “Company”). Investments in unconsolidated affiliates are accounted for using the equity method. Significant intercompany accounts and transactions are eliminated.
dHybrid Systems, LLC (“dHybrid”), Spartan Steel Coating, LLC (“Spartan”), TWB Company, L.L.C. (“TWB”), Worthington Arıtaş Basınçlı Kaplar Sanayi (“Worthington Aritas”), Worthington Energy Innovations, LLC (“WEI”), and Worthington Specialty Processing (“WSP”) in which we own controlling interests of 79.59%, 52%, 55%, 75%, 75%, and 51%, respectively, are consolidated with the equity owned by the other joint venture members shown as noncontrolling interests in our consolidated balance sheets, and their portions of net earnings and other comprehensive income (loss) (“OCI”) shown as net earnings or comprehensive income attributable to noncontrolling interests in our consolidated statements of earnings and consolidated statements of comprehensive income, respectively.
These unaudited consolidated financial statements have been prepared in accordance with accounting principles generally accepted in the United States of America (“U.S. GAAP”) for interim financial information and with the instructions to Form 10-Q and Article 10 of Regulation S-X of the Securities and Exchange Commission (“SEC”). Accordingly, they do not include all of the information and notes required by U.S. GAAP for complete financial statements. In the opinion of management, all adjustments, which are of a normal and recurring nature, except those which have been disclosed elsewhere in this Quarterly Report on Form 10-Q, necessary for a fair presentation of the consolidated financial statements for these interim periods, have been included. Operating results for the three months ended August 31, 2016 are not necessarily indicative of the results that may be expected for the fiscal year ending May 31, 2017 (“fiscal 2017”). For further information, refer to the consolidated financial statements and notes thereto included in the Annual Report on Form 10-K for the fiscal year ended May 31, 2016 (“fiscal 2016”) of Worthington Industries, Inc. (the “2016 Form 10-K”).
The preparation of financial statements in conformity with U.S. GAAP requires management to make estimates and assumptions that affect the amounts reported in the consolidated financial statements and accompanying notes. Actual results could differ from those estimates.
Recently Adopted Accounting Standards
In February 2015, amended accounting guidance was issued that revised consolidation requirements in order to provide financial statement users with a more useful presentation of an entity’s economic and operational results. The amended guidance revises the consolidation requirements for limited partnerships, the considerations surrounding the primary beneficiary determination and the consolidation of certain investment funds and is effective for fiscal years beginning after December 15, 2015, including interim periods within those fiscal years. The Company adopted this amended guidance on a prospective basis effective June 1, 2016. The adoption of this guidance did not impact our financial position or results of operations.
In April 2015, amended accounting guidance was issued that requires debt issuance costs related to a recognized debt liability to be presented in the balance sheet as a direct deduction from the carrying amount of the corresponding debt liability itself. The amended guidance does not apply to line-of-credit arrangements. Accordingly, issuance costs related to line-of-credit arrangements will continue to be presented as an asset and amortized ratably over the term of the arrangement. The amended guidance is effective for fiscal years beginning after December 15, 2015, including interim periods within those fiscal years. The Company adopted this guidance on a retrospective basis effective June 1, 2016. As a result, debt issuance costs totaling $2,405,000 and $2,491,000 as of August 31, 2016 and May 31, 2016, respectively, have been presented as a component of the carrying amount of long-term debt reported in our consolidated balance sheets. These amounts were previously capitalized and reported within other assets.
In September 2015, amended accounting guidance was issued regarding adjustments to provisional amounts recorded in conjunction with a business combination. The amended guidance requires the acquirer to recognize adjustments to provisional amounts identified during the measurement period in the reporting period in which such
5
Table of Contents
adjustments are identified, rather than retrospectively adjusting previously reported amounts. The amended guidance is effective for fiscal years beginning after December 15, 2015, including interim periods within those fiscal years. The Company adopted this amended guidance on a prospective basis effective June 1, 2016. The adoption of this guidance did not impact our financial position or results of operations.
In March 2016, amended accounting guidance was issued that simplifies the accounting for share-based payments. The amended guidance impacts several aspects of the accounting for share-based payment transactions, including the income tax consequences, forfeitures, statutory withholding requirements, and classification in the statement of cash flows. The Company early adopted this guidance during the fourth quarter of fiscal 2016. As required for early adoption in an interim period, all adjustments have been reflected as of the beginning of fiscal 2016. Accordingly, income tax expense for the three months ended August 31, 2015 has been restated to reflect excess tax benefits associated with share-based payments totaling $558,000 in current income tax expense, rather than in paid-in capital.
Recently Issued Accounting Standards
In May 2014, amended accounting guidance was issued that replaces most existing revenue recognition guidance under U.S. GAAP. The amended guidance requires an entity to recognize the amount of revenue to which it expects to be entitled for the transfer of promised goods or services to customers. Subsequently, additional guidance was issued on several areas including guidance intended to improve the operability and understandability of the implementation of principal versus agent considerations and clarifications on the identification of performance obligations and implementation of guidance related to licensing. The amended guidance is effective for annual reporting periods beginning after December 15, 2017, including interim periods within that reporting period. We are in the process of evaluating the effect this guidance will have on our consolidated financial position and results of operations. The amended guidance permits the use of either the retrospective or cumulative effect transition method. We have not selected a transition method nor have we determined the effect of the amended guidance on our ongoing financial reporting.
In July 2015, amended accounting guidance was issued regarding the measurement of inventory. The amended guidance requires that inventory accounted for under the first-in, first-out (FIFO) or average cost methods be measured at the lower of cost and net realizable value, where net realizable value represents the estimated selling price of inventory in the ordinary course of business, less reasonably predictable costs of completion, disposal, and transportation. The amended guidance has no impact on inventory accounted for under the last-in, first-out (LIFO) or retail inventory methods. The amended guidance is effective prospectively for fiscal years beginning after December 15, 2016, including interim periods within those fiscal years. Early adoption is permitted as of the beginning of an interim or annual reporting period. We do not expect the adoption of this amended accounting guidance to have a material impact on our financial position or results of operations.
In February 2016, amended accounting guidance was issued that replaces most existing lease accounting guidance under U.S. GAAP. Among other changes, the amended guidance requires that lease assets and liabilities be recognized on the balance sheet by lessees for those leases classified as operating leases under previous guidance. The amended guidance is effective for fiscal years beginning after December 15, 2018, including interim periods within those fiscal years. Early adoption is permitted, and the change is to be applied using a modified retrospective approach as of the beginning of the earliest period presented. We are in the process of evaluating the effect this guidance will have on our consolidated financial position and results of operations, and we have not determined the effect of the amended guidance on our ongoing financial reporting.
In March 2016, amended accounting guidance was issued regarding derivative instruments designated as hedging instruments. The amended guidance clarifies that a change in the counterparty to such a hedging instrument does not, in and of itself, require dedesignation of that hedging relationship provided that all other hedge accounting criteria continue to be met. The amended guidance is effective for fiscal years beginning after December 15, 2016, including interim periods within those fiscal years. Early adoption is permitted, and the change may be applied either prospectively or retrospectively. We do not expect the adoption of this amended accounting guidance to have a material impact on our financial position or results of operations.
In June 2016, amended accounting guidance was issued related to the measurement of credit losses on financial instruments. The amended guidance changes the impairment model for most financial assets to require measurement and recognition of expected credit losses for financial assets held. The amended guidance is effective for fiscal years beginning after December 15, 2019, including interim periods within those fiscal years. We are in the process
6
Table of Contents
of evaluating the effect this guidance will have on our consolidated financial position and results of operations, and we have not determined the effect of the amended guidance on our ongoing financial reporting.
In August 2016, amended accounting guidance was issued to clarify the proper cash flow presentation of certain specific types of cash payments and cash receipts. The amended guidance is effective for fiscal years beginning after December 15, 2017, including interim periods within those fiscal years. Early adoption is permitted. We are in the process of evaluating the effect this guidance will have on our consolidated financial position, results of operations and cash flows, and we have not determined the effect of the amended guidance on our ongoing financial reporting.
NOTE B – Investments in Unconsolidated Affiliates
Our investments in affiliated companies that we do not control, either through majority ownership or otherwise, are accounted for using the equity method. These include ArtiFlex Manufacturing, LLC (“ArtiFlex”) (50%), Clarkwestern Dietrich Building Systems LLC (“ClarkDietrich”) (25%), Samuel Steel Pickling Company (31.25%), Serviacero Planos, S. de R. L. de C.V. (“Serviacero”) (50%), Worthington Armstrong Venture (“WAVE”) (50%), and Zhejiang Nisshin Worthington Precision Specialty Steel Co., Ltd. (10%).
We received distributions from unconsolidated affiliates totaling $38,442,000 during the three months ended August 31, 2016. We have received cumulative distributions from WAVE in excess of our investment balance totaling $66,192,000 at August 31, 2016. In accordance with the applicable accounting guidance, these excess distributions are reclassified to the liabilities section of our consolidated balance sheet. We will continue to record our equity in the net income of WAVE as a debit to the investment account, and if it becomes positive, it will again be shown as an asset on our consolidated balance sheet. If it becomes obvious that any excess distribution may not be returned (upon joint venture liquidation or otherwise), we will recognize any balance classified as a liability as income immediately.
We use the “cumulative earnings” approach for determining cash flow presentation of distributions from our unconsolidated joint ventures. Distributions received are included in our consolidated statements of cash flows as operating activities, unless the cumulative distributions received, less distributions received in prior periods that were determined to be returns of investment, exceed our portion of the cumulative equity in the net earnings of the joint venture, in which case the excess distributions are deemed to be returns of the investment and are classified as investing activities in our consolidated statements of cash flows.
Combined financial information for our unconsolidated affiliates is summarized as follows:
| (in thousands) | August 31, 2016 |
May 31, 2016 |
||||||
| Cash |
$ | 51,269 | $ | 112,122 | ||||
| Other current assets |
513,318 | 446,796 | ||||||
| Noncurrent assets |
355,777 | 352,370 | ||||||
|
|
|
|
|
|||||
| Total assets |
$ | 920,364 | $ | 911,288 | ||||
|
|
|
|
|
|||||
| Current liabilities |
$ | 125,082 | $ | 112,491 | ||||
| Short-term borrowings |
8,315 | 11,398 | ||||||
| Current maturities of long-term debt |
2,913 | 3,297 | ||||||
| Long-term debt |
265,301 | 266,942 | ||||||
| Other noncurrent liabilities |
22,678 | 21,034 | ||||||
| Equity |
496,075 | 496,126 | ||||||
|
|
|
|
|
|||||
| Total liabilities and equity |
$ | 920,364 | $ | 911,288 | ||||
|
|
|
|
|
|||||
7
Table of Contents
| Three Months Ended August 31, |
||||||||
| (in thousands) | 2016 | 2015 | ||||||
| Net sales |
$ | 417,115 | $ | 404,463 | ||||
| Gross margin |
124,197 | 89,018 | ||||||
| Operating income |
94,397 | 61,246 | ||||||
| Depreciation and amortization |
6,820 | 8,097 | ||||||
| Interest expense |
2,148 | 2,159 | ||||||
| Income tax expense |
7,518 | 2,560 | ||||||
| Net earnings |
86,067 | 62,926 | ||||||
The financial results of WSP have been included in the amounts presented in the tables above through March 1, 2016. Effective March 1, 2016, the Company obtained effective control over the operations of WSP. As a result, WSP’s results have been consolidated within the financial results of Steel Processing since that date with the minority member’s portion of earnings eliminated within earnings attributable to noncontrolling interests.
NOTE C – Impairment of Long-Lived Assets
We review the carrying value of our long-lived assets, including intangible assets with definite useful lives, for impairment whenever events or changes in circumstances indicate that the carrying value of an asset or asset group may not be recoverable.
Impairment testing of long-lived assets with definite useful lives involves a comparison of the sum of the undiscounted future cash flows of the asset or asset group to its respective carrying amount. If the sum of the undiscounted future cash flows exceeds the carrying amount, then no impairment exists. If the carrying amount exceeds the sum of the undiscounted future cash flows, then a second step is performed to determine the amount of impairment, which would be recorded as an impairment charge in our consolidated statement of earnings.
No impairment charges were recognized during the first quarter of fiscal 2017.
During the first quarter of fiscal 2016, management finalized its plan to close the Engineered Cabs facility in Florence, South Carolina and transfer the majority of the business to the Engineered Cabs facility in Greeneville, Tennessee. Under the plan, certain machinery and equipment was transferred to the Greeneville facility to support higher volume requirements. Management reevaluated the recoverability of the remaining assets and determined that long-lived assets with a carrying value of $4,059,000 were impaired. As a result, these long-lived assets were written down to their estimated fair value of $1,059,000 resulting in an impairment charge of $3,000,000 during the first quarter of fiscal 2016. The Company ceased production at the Florence facility on September 30, 2015.
NOTE D – Restructuring and Other Expense
We consider restructuring activities to be programs whereby we fundamentally change our operations such as closing and consolidating manufacturing facilities, moving manufacturing of a product to another location, and rationalizing headcount.
8
Table of Contents
A progression of the liabilities associated with our restructuring activities, combined with a reconciliation to the restructuring and other expense financial statement caption in our consolidated statement of earnings for the three months ended August 31, 2016 is summarized as follows:
| (in thousands) | Beginning Balance |
Expense | Payments | Adjustments | Ending Balance |
|||||||||||||||
| Early retirement and severance |
$ | 1,831 | $ | 190 | $ | (890 | ) | $ | 8 | $ | 1,139 | |||||||||
| Facility exit and other costs |
653 | 1,027 | (529 | ) | - | 1,151 | ||||||||||||||
|
|
|
|
|
|
|
|
|
|
|
|||||||||||
| $ | 2,484 | 1,217 | $ | (1,419 | ) | $ | 8 | $ | 2,290 | |||||||||||
|
|
|
|
|
|
|
|
|
|||||||||||||
| Net loss on sale of assets |
111 | |||||||||||||||||||
|
|
|
|||||||||||||||||||
| Restructuring and other expense |
$ | 1,328 | ||||||||||||||||||
|
|
|
|||||||||||||||||||
Facility exit costs in the current year consisted primarily of costs incurred in connection with the closures of the Company’s stainless steel business, Precision Specialty Metals, Inc. (“PSM”) and the Florence, South Carolina facility in Engineered Cabs.
The total liability as of August 31, 2016 is expected to be paid in the next twelve months.
NOTE E – Contingent Liabilities and Commitments
We are defendants in certain legal actions. In the opinion of management, the outcome of these actions, which is not clearly determinable at the present time, would not significantly affect our consolidated financial position or future results of operations. We believe that environmental issues will not have a material effect on our capital expenditures, consolidated financial position or future results of operations.
NOTE F – Guarantees
We do not have guarantees that we believe are reasonably likely to have a material current or future effect on our consolidated financial condition, changes in financial condition, revenues or expenses, results of operations, liquidity, capital expenditures or capital resources. However, as of August 31, 2016, we were party to an operating lease for an aircraft in which we have guaranteed a residual value at the termination of the lease. The maximum obligation under the terms of this guarantee was approximately $10,198,000 at August 31, 2016. Based on current facts and circumstances, we have estimated the likelihood of payment pursuant to this guarantee is not probable and, therefore, no amount has been recognized in our consolidated financial statements.
NOTE G – Debt and Receivables Securitization
We maintain a $500,000,000 multi-year revolving credit facility (the “Credit Facility”) with a group of lenders that matures in April 2020. Borrowings under the Credit Facility typically have maturities of less than one year. However, we can extend the term of amounts borrowed by renewing these borrowings for the term of the Credit Facility. We have the option to borrow at rates equal to an applicable margin over the LIBOR, Prime rate or Fed Funds rate. The applicable margin is determined by our credit rating. There were no borrowings outstanding under the Credit Facility at August 31, 2016.
We also maintain a $100,000,000 revolving trade accounts receivable securitization facility (the “AR Facility”) which expires in January 2018. Pursuant to the terms of the AR Facility, certain of our subsidiaries sell their accounts receivable without recourse, on a revolving basis, to Worthington Receivables Corporation (“WRC”), a wholly-owned, consolidated, bankruptcy-remote subsidiary. In turn, WRC may sell without recourse, on a revolving basis, up to $100,000,000 of undivided ownership interests in this pool of accounts receivable to a third-party bank. We retain an undivided interest in this pool and are subject to risk of loss based on the collectability of the receivables from this retained interest. Because the amount eligible to be sold excludes receivables more than 90 days past due, receivables offset by an allowance for doubtful accounts due to bankruptcy or other cause, concentrations over certain limits with specific customers and certain reserve amounts, we believe additional risk of loss is minimal. As of August 31, 2016, no undivided ownership interests in this pool of accounts receivable had been sold.
We also had letters of credit totaling $15,359,000 outstanding as of August 31, 2016. These letters of credit
9
Table of Contents
have been issued to third parties and had no amounts drawn against them at August 31, 2016.
NOTE H – Comprehensive Income
The following table summarizes the tax effects on each component of OCI for the three months ended August 31:
| 2016 | 2015 | |||||||||||||||||||||||
| Before-Tax | Tax | Net-of-Tax | Before-Tax | Tax | Net-of-Tax | |||||||||||||||||||
| (in thousands) | ||||||||||||||||||||||||
| Foreign currency translation |
$ | (665 | ) | $ | - | $ | (665 | ) | $ | 1,823 | $ | - | $ | 1,823 | ||||||||||
| Pension liability adjustment |
- | - | - | (8 | ) | - | (8 | ) | ||||||||||||||||
| Cash flow hedges |
1,088 | (463 | ) | 625 | 1,238 | (608 | ) | 630 | ||||||||||||||||
|
|
|
|
|
|
|
|
|
|
|
|
|
|||||||||||||
| Other comprehensive income (loss) |
$ | 423 | $ | (463 | ) | $ | (40 | ) | $ | 3,053 | $ | (608 | ) | $ | 2,445 | |||||||||
|
|
|
|
|
|
|
|
|
|
|
|
|
|||||||||||||
NOTE I – Changes in Equity
The following table provides a summary of the changes in total equity, shareholders’ equity attributable to controlling interest, and equity attributable to noncontrolling interests for the three months ended August 31, 2016:
| Controlling Interest | ||||||||||||||||||||||||
| (in thousands) | Additional Paid-in Capital |
Accumulated Other Comprehensive Loss, Net of Tax |
Retained Earnings |
Total | Non- controlling Interests |
Total | ||||||||||||||||||
| Balance at May 31, 2016 |
$ | 298,984 | $ | (28,565 | ) | $ | 522,952 | $ | 793,371 | $ | 126,475 | $ | 919,846 | |||||||||||
| Net earnings |
- | - | 65,567 | 65,567 | 2,969 | 68,536 | ||||||||||||||||||
| Other comprehensive income (loss) |
- | (45 | ) | - | (45 | ) | 5 | (40 | ) | |||||||||||||||
| Common shares issued, net of withholding tax |
5,821 | - | - | 5,821 | - | 5,821 | ||||||||||||||||||
| Common shares in NQ plans |
634 | - | - | 634 | - | 634 | ||||||||||||||||||
| Stock-based compensation |
3,491 | - | - | 3,491 | - | 3,491 | ||||||||||||||||||
| Cash dividends declared |
- | - | (12,877 | ) | (12,877 | ) | - | (12,877 | ) | |||||||||||||||
| Dividends to noncontrolling interest |
- | - | - | - | (4,331 | ) | (4,331 | ) | ||||||||||||||||
|
|
|
|
|
|
|
|
|
|
|
|
|
|||||||||||||
| Balance at August 31, 2016 |
$ | 308,930 | $ | (28,610 | ) | $ | 575,642 | $ | 855,962 | $ | 125,118 | $ | 981,080 | |||||||||||
|
|
|
|
|
|
|
|
|
|
|
|
|
|||||||||||||
The components of the changes in accumulated other comprehensive loss were as follows:
| (in thousands) | Foreign Currency Translation |
Pension Liability Adjustment |
Cash Flow Hedges |
Accumulated Other Comprehensive Loss |
||||||||||||
| Balance as of May 31, 2016 |
$ | (18,728 | ) | $ | (17,061 | ) | $ | 7,224 | $ | (28,565 | ) | |||||
| Other comprehensive income (loss) before reclassifications |
(670 | ) | - | 733 | 63 | |||||||||||
| Reclassification adjustments to income (a) |
- | - | 355 | 355 | ||||||||||||
| Income taxes |
- | - | (463 | ) | (463 | ) | ||||||||||
|
|
|
|
|
|
|
|
|
|||||||||
| Balance as of August 31, 2016 |
$ | (19,398 | ) | $ | (17,061 | ) | $ | 7,849 | $ | (28,610 | ) | |||||
|
|
|
|
|
|
|
|
|
|||||||||
| (a) | The statement of earnings classification of amounts reclassified to income for cash flow hedges is disclosed in “NOTE N – Derivative Instruments and Hedging Activities.” |
10
Table of Contents
NOTE J – Stock-Based Compensation
Non-Qualified Stock Options
During the three months ended August 31, 2016, we granted non-qualified stock options covering a total of 111,000 common shares under our stock-based compensation plans. The option price of $42.30 per share was equal to the market price of the underlying common shares at the grant date. The fair value of these stock options, based on the Black-Scholes option-pricing model, calculated at the grant date, was $11.60 per share. The calculated pre-tax stock-based compensation expense for these stock options, after an estimate for forfeitures, is $1,146,000 and will be recognized on a straight-line basis over the three-year vesting period. The following assumptions were used to value these stock options:
| Dividend yield |
2.59 | % | ||
| Expected volatility |
36.86 | % | ||
| Risk-free interest rate |
1.15 | % | ||
| Expected term (years) |
6.0 |
Expected volatility is based on the historical volatility of our common shares and the risk-free interest rate is based on the United States Treasury strip rate for the expected term of the stock options. The expected term was developed using historical exercise experience.
Service-Based Restricted Common Shares
During the three months ended August 31, 2016, we granted an aggregate of 115,625 service-based restricted common shares under our stock-based compensation plans. The fair value of these restricted common shares was equal to the closing market price of the underlying common shares on the date of grant, or $42.30 per share. The calculated pre-tax stock-based compensation expense for these restricted common shares, after an estimate for forfeitures, is $4,353,000 and will be recognized on a straight-line basis over the three-year service-based vesting period.
Performance Share Awards
We have awarded performance shares to certain key employees under our stock-based compensation plans. These performance shares are earned based on the level of achievement with respect to corporate targets for cumulative corporate economic value added, earnings per share growth and, in the case of business unit executives, business unit operating income targets for the three-year periods ending May 31, 2017, 2018 and 2019. These performance share awards will be paid, to the extent earned, in common shares of the Company in the fiscal quarter following the end of the applicable three-year performance period. The fair values of our performance shares are determined by the closing market prices of the underlying common shares at their respective grant dates and the pre-tax stock-based compensation expense is based on our periodic assessment of the probability of the targets being achieved and our estimate of the number of common shares that will ultimately be issued. During the three months ended August 31, 2016, we granted performance share awards covering an aggregate of 68,500 common shares (at target levels). The calculated pre-tax stock-based compensation expense for these performance shares is $2,809,000 and will be recognized over the three-year performance period.
NOTE K – Income Taxes
Income tax expense for the three months ended August 31, 2016 and August 31, 2015 reflected estimated annual effective income tax rates of 31.2% and 31.7%, respectively. The annual effective income tax rates exclude any impact from the inclusion of net earnings attributable to noncontrolling interests in our consolidated statements of earnings. Net earnings attributable to noncontrolling interests are primarily a result of our WSP, Spartan, Worthington Aritas, and TWB consolidated joint ventures. The earnings attributable to the noncontrolling interests in WSP, Spartan and TWB’s U.S. operations do not generate tax expense to Worthington since the investors in WSP, Spartan and TWB’s U.S. operations are taxed directly based on the earnings attributable to them. The tax expense of Worthington Aritas (a foreign corporation), and TWB’s wholly-owned foreign corporations, is reported in our consolidated tax expense. Management is required to estimate the annual effective income tax rate based upon its forecast of annual pre-tax income for domestic and foreign operations. Our actual effective income tax rate for fiscal 2017 could be materially different from the forecasted rate as of August 31, 2016.
11
Table of Contents
NOTE L – Earnings per Share
The following table sets forth the computation of basic and diluted earnings per share attributable to controlling interest for the three months ended August 31, 2016 and 2015:
| Three Months Ended August 31, |
||||||||
| (in thousands, except per share amounts) | 2016 | 2015 | ||||||
| Numerator (basic & diluted): |
||||||||
| Net earnings attributable to controlling interest – income available to common shareholders |
$ | 65,567 | $ | 31,968 | ||||
| Denominator: |
||||||||
| Denominator for basic earnings per share attributable to controlling interest – weighted average common shares |
61,885 | 63,993 | ||||||
| Effect of dilutive securities |
2,452 | 2,072 | ||||||
|
|
|
|
|
|||||
| Denominator for diluted earnings per share attributable to controlling interest – adjusted weighted average common shares |
64,337 | 66,065 | ||||||
|
|
|
|
|
|||||
| Basic earnings per share attributable to controlling interest |
$ | 1.06 | $ | 0.50 | ||||
| Diluted earnings per share attributable to controlling interest |
$ | 1.02 | $ | 0.48 | ||||
Stock options and restricted common shares covering 161,429 and 318,904 common shares for the three months ended August 31, 2016 and 2015, respectively, have been excluded from the computation of diluted earnings per share because the effect of their inclusion would have been anti-dilutive.
12
Table of Contents
NOTE M – Segment Operations
Summarized financial information for our reportable segments is shown in the following table:
| Three Months Ended August 31, |
||||||||
| (in thousands) | 2016 | 2015 | ||||||
| Net sales |
||||||||
| Steel Processing |
$ | 505,674 | $ | 490,800 | ||||
| Pressure Cylinders |
205,209 | 224,394 | ||||||
| Engineered Cabs |
25,581 | 38,617 | ||||||
| Other |
1,085 | 4,336 | ||||||
|
|
|
|
|
|||||
| Total net sales |
$ | 737,549 | $ | 758,147 | ||||
|
|
|
|
|
|||||
| Operating income (loss) |
||||||||
| Steel Processing |
$ | 54,782 | $ | 23,638 | ||||
| Pressure Cylinders |
14,105 | 16,819 | ||||||
| Engineered Cabs |
(1,843 | ) | (9,291 | ) | ||||
| Other |
(2,146 | ) | (170 | ) | ||||
|
|
|
|
|
|||||
| Total operating income |
$ | 64,898 | $ | 30,996 | ||||
|
|
|
|
|
|||||
| Impairment of long-lived assets |
||||||||
| Steel Processing |
$ | - | $ | - | ||||
| Pressure Cylinders |
- | - | ||||||
| Engineered Cabs |
- | 3,000 | ||||||
| Other |
- | - | ||||||
|
|
|
|
|
|||||
| Total impairment of long-lived assets |
$ | - | $ | 3,000 | ||||
|
|
|
|
|
|||||
| Restructuring and other expense (income) |
||||||||
| Steel Processing |
$ | 966 | $ | 462 | ||||
| Pressure Cylinders |
146 | 731 | ||||||
| Engineered Cabs |
206 | 1,878 | ||||||
| Other |
10 | (2 | ) | |||||
|
|
|
|
|
|||||
| Total restructuring and other expense |
$ | 1,328 | $ | 3,069 | ||||
|
|
|
|
|
|||||
| (in thousands) | August 31, 2016 |
May 31, 2016 |
||||||
| Total assets |
||||||||
| Steel Processing |
$ | 871,588 | $ | 819,853 | ||||
| Pressure Cylinders |
766,070 | 787,786 | ||||||
| Engineered Cabs |
70,471 | 75,124 | ||||||
| Other |
473,824 | 378,501 | ||||||
|
|
|
|
|
|||||
| Total assets |
$ | 2,181,953 | $ | 2,061,264 | ||||
|
|
|
|
|
|||||
13
Table of Contents
NOTE N – Derivative Instruments and Hedging Activities
We utilize derivative instruments to manage exposure to certain risks related to our ongoing operations. The primary risks managed through the use of derivative instruments include interest rate risk, foreign currency exchange rate risk and commodity price risk. While certain of our derivative instruments are designated as hedging instruments, we also enter into derivative instruments that are designed to hedge a risk, but are not designated as hedging instruments and therefore do not qualify for hedge accounting. These derivative instruments are adjusted to current fair value through earnings at the end of each period.
Interest Rate Risk Management – We are exposed to the impact of interest rate changes. Our objective is to manage the impact of interest rate changes on cash flows and the market value of our borrowings. We utilize a mix of debt maturities along with both fixed-rate and variable-rate debt to manage changes in interest rates. In addition, we enter into interest rate swaps to further manage our exposure to interest rate variations related to our borrowings and to lower our overall borrowing costs.
Foreign Currency Rate Risk Management – We conduct business in several major international currencies and are therefore subject to risks associated with changing foreign currency exchange rates. We enter into various contracts that change in value as foreign currency exchange rates change to manage this exposure. Such contracts limit exposure to both favorable and unfavorable currency fluctuations. The translation of foreign currencies into United States dollars also subjects us to exposure related to fluctuating foreign currency exchange rates; however, derivative instruments are not used to manage this risk.
Commodity Price Risk Management – We are exposed to changes in the price of certain commodities, including steel, natural gas, zinc and other raw materials, and our utility requirements. Our objective is to reduce earnings and cash flow volatility associated with forecasted purchases and sales of these commodities to allow management to focus its attention on business operations. Accordingly, we enter into derivative contracts to manage the associated price risk.
We are exposed to counterparty credit risk on all of our derivative instruments. Accordingly, we have established and maintain strict counterparty credit guidelines. We have credit support agreements in place with certain counterparties to limit our credit exposure. These agreements require either party to post cash collateral if its cumulative market position exceeds a predefined liability threshold. At August 31, 2016, we had posted total cash collateral of $152,000 to our margin accounts. Amounts posted to the margin accounts accrue interest at market rates and are required to be refunded in the period in which the cumulative market position falls below the required threshold. We do not have significant exposure to any one counterparty and management believes the risk of loss is remote and, in any event, would not be material.
Refer to “NOTE O – Fair Value” for additional information regarding the accounting treatment for our derivative instruments, as well as how fair value is determined.
14
Table of Contents
The following table summarizes the fair value of our derivative instruments and the respective financial statement caption in which they were recorded in our consolidated balance sheet at August 31, 2016:
| Asset Derivatives | Liability Derivatives | |||||||||||
| (in thousands) | Balance Sheet Location |
Fair Value |
Balance Sheet Location |
Fair Value |
||||||||
| Derivatives designated as hedging instruments: |
||||||||||||
| Commodity contracts |
Receivables | $ | 10,337 | Accounts payable | $ | 31 | ||||||
| Other assets | 850 | Other liabilities | - | |||||||||
|
|
|
|
|
|||||||||
| 11,187 | 31 | |||||||||||
|
|
|
|
|
|||||||||
| Interest rate contracts |
Receivables | - | Accounts payable | 175 | ||||||||
| Other assets | - | Other liabilities | 320 | |||||||||
|
|
|
|
|
|||||||||
| - | 495 | |||||||||||
|
|
|
|
|
|||||||||
| Totals |
$ | 11,187 | $ | 526 | ||||||||
|
|
|
|
|
|||||||||
| Derivatives not designated as hedging instruments: |
||||||||||||
| Commodity contracts |
Receivables | $ | 3,737 | Accounts payable | $ | 151 | ||||||
| Other assets | 75 | Other liabilities | - | |||||||||
|
|
|
|
|
|||||||||
| 3,812 | 151 | |||||||||||
|
|
|
|
|
|||||||||
| Foreign currency contracts |
Receivables | - | Accounts payable | 31 | ||||||||
|
|
|
|
|
|||||||||
| Totals |
$ | 3,812 | $ | 182 | ||||||||
|
|
|
|
|
|||||||||
| Total Derivative Instruments |
$ | 14,999 | $ | 708 | ||||||||
|
|
|
|
|
|||||||||
The amounts in the table above reflect the fair value of the Company’s derivative contracts on a net basis. Had these amounts been recognized on a gross basis, the aggregate impact would have been a $200,000 decrease in receivables with a corresponding decrease in accounts payable.
15
Table of Contents
The following table summarizes the fair value of our derivative instruments and the financial statement caption in which they were recorded in the consolidated balance sheet at May 31, 2016:
| Asset Derivatives | Liability Derivatives | |||||||||||||
| (in thousands) | Balance Sheet Location |
Fair Value |
Balance Sheet Location |
Fair Value |
||||||||||
| Derivatives designated as hedging instruments: |
||||||||||||||
| Commodity contracts |
Receivables |
$ | 13,224 | Accounts payable |
$ | 696 | ||||||||
| Other assets |
3,589 | Other liabilities |
80 | |||||||||||
|
|
|
|
|
|||||||||||
| 16,813 | 776 | |||||||||||||
|
|
|
|
|
|||||||||||
| Interest rate contracts |
Receivables |
- | Accounts payable |
155 | ||||||||||
| Other assets |
- | Other liabilities |
306 | |||||||||||
|
|
|
|
|
|||||||||||
| - | 461 | |||||||||||||
|
|
|
|
|
|||||||||||
| Totals |
$ | 16,813 | $ | 1,237 | ||||||||||
|
|
|
|
|
|||||||||||
| Derivatives not designated as hedging instruments: |
||||||||||||||
| Commodity contracts |
Receivables |
$ | 4,660 | Accounts payable |
$ | 761 | ||||||||
| Other assets |
317 | Other liabilities |
- | |||||||||||
|
|
|
|
|
|||||||||||
| 4,977 | 761 | |||||||||||||
|
|
|
|
|
|||||||||||
| Foreign currency contracts |
Receivables |
- | Accounts payable |
15 | ||||||||||
|
|
|
|
|
|||||||||||
| - | 15 | |||||||||||||
|
|
|
|
|
|||||||||||
| Totals |
$ | 4,977 | $ | 776 | ||||||||||
|
|
|
|
|
|||||||||||
| Total Derivative Instruments |
$ | 21,790 | $ | 2,013 | ||||||||||
|
|
|
|
|
|||||||||||
The amounts in the table above reflect the fair value of the Company’s derivative contracts on a net basis. Had these amounts been recognized on a gross basis, the aggregate impact would have been a $300,000 decrease in receivables with a corresponding decrease in accounts payable.
Cash Flow Hedges
We enter into derivative instruments to hedge our exposure to changes in cash flows attributable to interest rates and commodity price fluctuations associated with certain forecasted transactions. These derivative instruments are designated and qualify as cash flow hedges. Accordingly, the effective portion of the gain or loss on the derivative instrument is reported as a component of OCI and reclassified into earnings in the same financial statement caption associated with the forecasted transaction and in the same period during which the hedged transaction affects earnings. The ineffective portion of the gain or loss on the derivative instrument is recognized in earnings immediately.
The following table summarizes our cash flow hedges outstanding at August 31, 2016:
| (in thousands) | Notional Amount |
Maturity Date | ||||
| Commodity contracts |
$ | 60,267 | September 2016 - December 2017 | |||
| Interest rate contracts |
17,072 | September 2019 | ||||
16
Table of Contents
The following table summarizes the gain (loss) recognized in OCI and the loss reclassified from accumulated OCI into earnings for derivative instruments designated as cash flow hedges during the three months ended August 31, 2016 and 2015:
| Location of | Location of | |||||||||||||||
| Loss | Loss | Gain | Gain | |||||||||||||
| Reclassified | Reclassified | (Ineffective | (Ineffective | |||||||||||||
| Gain (Loss) | from | from | Portion) | Portion) | ||||||||||||
| Recognized | Accumulated | Accumulated | and Excluded | and Excluded | ||||||||||||
| in OCI | OCI | OCI | from | from | ||||||||||||
| (Effective | (Effective | (Effective | Effectiveness | Effectiveness | ||||||||||||
| (in thousands) | Portion) | Portion) |
Portion) | Testing |
Testing | |||||||||||
| For the three months ended August 31, 2016: |
||||||||||||||||
| Commodity contracts |
$ | 769 | Cost of goods sold | $ | (252 | ) | Cost of goods sold | $ | - | |||||||
| Interest rate contracts |
(36 | ) | Interest expense | (103 | ) | Interest expense | - | |||||||||
|
|
|
|
|
|
|
|||||||||||
| Totals |
$ | 733 | $ | (355 | ) | $ | - | |||||||||
|
|
|
|
|
|
|
|||||||||||
| For the three months ended August 31, 2015: |
||||||||||||||||
| Commodity contracts |
$ | (8,126 | ) | Cost of goods sold | $ | (9,187 | ) | Cost of goods sold | $ | - | ||||||
| Interest rate contracts |
34 | Interest expense | (139 | ) | Interest expense | - | ||||||||||
| Foreign currency contracts |
- | Miscellaneous income, net | (4 | ) | Miscellaneous income, net | - | ||||||||||
|
|
|
|
|
|
|
|||||||||||
| Totals |
$ | (8,092 | ) | $ | (9,330 | ) | $ | - | ||||||||
|
|
|
|
|
|
|
|||||||||||
The estimated net amount of the losses recognized in accumulated OCI at August 31, 2016 expected to be reclassified into net earnings within the succeeding twelve months is $9,008,000 (net of tax of $5,568,000). This amount was computed using the fair value of the cash flow hedges at August 31, 2016, and will change before actual reclassification from OCI to net earnings during the fiscal years ending May 31, 2017 and 2018.
Economic (Non-designated) Hedges
We enter into foreign currency contracts to manage our foreign currency exchange rate exposure related to inter-company and financing transactions that do not meet the requirements for hedge accounting treatment. We also enter into certain commodity contracts that do not qualify for hedge accounting treatment. Accordingly, these derivative instruments are adjusted to current market value at the end of each period through earnings.
The following table summarizes our economic (non-designated) derivative instruments outstanding at August 31, 2016:
| (in thousands) | Notional Amount |
Maturity Date(s) | ||||
| Commodity contracts |
$ | 24,809 | September 2016 - August 2018 | |||
| Foreign currency contracts |
18,847 | September 2016 - August 2017 | ||||
17
Table of Contents
The following table summarizes the gain (loss) recognized in earnings for economic (non-designated) derivative financial instruments during the three months ended August 31, 2016 and 2015:
| Gain (Loss) Recognized | ||||||||||||
| in Earnings for the Three Months Ended |
||||||||||||
| Location of Gain (Loss) | August 31, | |||||||||||
| (in thousands) | Recognized in Earnings | 2016 | 2015 | |||||||||
| Commodity contracts |
Cost of goods sold | $ | 2,908 | $ | (2,755 | ) | ||||||
| Foreign currency contracts |
Miscellaneous expense, net | (66 | ) | — | ||||||||
|
|
|
|
|
|||||||||
| Total |
$ | 2,842 | $ | (2,755 | ) | |||||||
|
|
|
|
|
|||||||||
The gain (loss) on the foreign currency derivatives significantly offsets the gain (loss) on the hedged item.
NOTE O – Fair Value
Fair value is defined as the price that would be received to sell an asset or paid to transfer a liability in an orderly transaction between market participants at the measurement date. Fair value is an exit price concept that assumes an orderly transaction between willing market participants and is required to be based on assumptions that market participants would use in pricing an asset or a liability. Current accounting guidance establishes a three-tier fair value hierarchy as a basis for considering such assumptions and for classifying the inputs used in the valuation methodologies. This hierarchy requires entities to maximize the use of observable inputs and minimize the use of unobservable inputs. The three levels of inputs used to measure fair values are as follows:
| Level 1 |
– | Observable prices in active markets for identical assets and liabilities. | ||
| Level 2 |
– | Inputs other than quoted prices included within Level 1 that are observable for the assets and liabilities, either directly or indirectly. | ||
| Level 3 |
– | Unobservable inputs that are supported by little or no market activity and that are significant to the fair value of the assets and liabilities. | ||
Recurring Fair Value Measurements
At August 31, 2016, our assets and liabilities measured at fair value on a recurring basis were as follows:
| (in thousands) | Quoted Prices in Active Markets (Level 1) |
Significant Other Observable Inputs (Level 2) |
Significant Unobservable Inputs (Level 3) |
Totals | ||||||||||||
| Assets |
||||||||||||||||
| Derivative contracts (1) |
$ | - | $ | 14,999 | $ | - | $ | 14,999 | ||||||||
|
|
|
|
|
|
|
|
|
|||||||||
| Total assets |
$ | - | $ | 14,999 | $ | - | $ | 14,999 | ||||||||
|
|
|
|
|
|
|
|
|
|||||||||
| Liabilities |
||||||||||||||||
| Derivative contracts (1) |
$ | - | $ | 708 | $ | - | $ | 708 | ||||||||
| Contingent consideration obligation (2) |
- | - | 4,519 | 4,519 | ||||||||||||
|
|
|
|
|
|
|
|
|
|||||||||
| Total liabilities |
$ | - | $ | 708 | $ | 4,519 | $ | 5,227 | ||||||||
|
|
|
|
|
|
|
|
|
|||||||||
18
Table of Contents
At May 31, 2016, our assets and liabilities measured at fair value on a recurring basis were as follows:
| (in thousands) | Quoted Prices in Active Markets (Level 1) |
Significant Other Observable Inputs (Level 2) |
Significant Unobservable Inputs (Level 3) |
Totals | ||||||||||||
| Assets |
||||||||||||||||
| Derivative contracts (1) |
$ | - | $ | 21,790 | $ | - | $ | 21,790 | ||||||||
|
|
|
|
|
|
|
|
|
|||||||||
| Total assets |
$ | - | $ | 21,790 | $ | - | $ | 21,790 | ||||||||
|
|
|
|
|
|
|
|
|
|||||||||
| Liabilities |
||||||||||||||||
| Derivative contracts (1) |
$ | - | $ | 2,013 | $ | - | $ | 2,013 | ||||||||
| Contingent consideration obligations (2) |
- | - | 4,519 | 4,519 | ||||||||||||
|
|
|
|
|
|
|
|
|
|||||||||
| Total liabilities |
$ | - | $ | 2,013 | $ | 4,519 | $ | 6,532 | ||||||||
|
|
|
|
|
|
|
|
|
|||||||||
| (1) | The fair value of our derivative contracts is based on the present value of the expected future cash flows considering the risks involved, including non-performance risk, and using discount rates appropriate for the respective maturities. Market observable, Level 2 inputs are used to determine the present value of the expected future cash flows. Refer to “NOTE N – Derivative Instruments and Hedging Activities” for additional information regarding our use of derivative instruments. |
| (2) | The fair value of the contingent consideration obligations is determined using a probability weighted cash flow approach based on management’s projections of future cash flows of the acquired businesses. The fair value measurement was based on Level 3 inputs not observable in the market. |
The fair value of non-derivative financial instruments included in the carrying amounts of cash and cash equivalents, receivables, notes receivable, income taxes receivable, other assets, accounts payable, short-term borrowings, accrued compensation, contributions to employee benefit plans and related taxes, other accrued items, income taxes payable and other liabilities approximate carrying value due to their short-term nature. The fair value of long-term debt, including current maturities, based upon models utilizing market observable (Level 2) inputs and credit risk, was $611,710,000 and $609,245,000 at August 31, 2016 and May 31, 2016, respectively. The carrying amount of long-term debt, including current maturities, was $578,275,000 and $578,353,000 at August 31, 2016 and May 31, 2016, respectively.
19
Table of Contents
Item 2. – Management’s Discussion and Analysis of Financial Condition and Results of Operations
Selected statements contained in this “Item 2. – Management’s Discussion and Analysis of Financial Condition and Results of Operations” constitute “forward-looking statements” as that term is used in the Private Securities Litigation Reform Act of 1995. Such forward-looking statements are based, in whole or in part, on management’s beliefs, estimates, assumptions and currently available information. For a more detailed discussion of what constitutes a forward-looking statement and of some of the factors that could cause actual results to differ materially from such forward-looking statements, please refer to the “Safe Harbor Statement” in the beginning of this Quarterly Report on Form 10-Q and “Part I - Item 1A. - Risk Factors” of our Annual Report on Form 10-K for the fiscal year ended May 31, 2016.
Introduction
The following discussion and analysis of market and industry trends, business developments, and the results of operations and financial position of Worthington Industries, Inc., together with its subsidiaries (collectively, “we,” “our,” “Worthington,” or our “Company”), should be read in conjunction with our consolidated financial statements and notes thereto included in “Item 1. – Financial Statements” of this Quarterly Report on Form 10-Q. Our Annual Report on Form 10-K for the fiscal year ended May 31, 2016 (“fiscal 2016”) includes additional information about Worthington, our operations and our consolidated financial position and should be read in conjunction with this Quarterly Report on Form 10-Q.
As of August 31, 2016, excluding our joint ventures, we operated 29 manufacturing facilities worldwide, principally in three operating segments, which correspond with our reportable business segments: Steel Processing, Pressure Cylinders and Engineered Cabs. Our remaining operating segment consists of Worthington Energy Innovations (“WEI”), which does not meet the applicable aggregation criteria or quantitative thresholds for separate disclosure, and therefore is combined and reported in the “Other” category.
We also held equity positions in 12 active joint ventures, which operated 51 manufacturing facilities worldwide, as of August 31, 2016. Six of these joint ventures are consolidated with the equity owned by the other joint venture member(s) shown as noncontrolling interests in our consolidated balance sheets, and their portion of net earnings and other comprehensive income (loss) shown as net earnings or comprehensive income attributable to noncontrolling interests in our consolidated statements of earnings and consolidated statements of comprehensive income, respectively. The remaining six of these joint ventures are accounted for using the equity method.
Overview
The Company benefited from rising steel prices and strong demand in the automotive and construction end markets during the first quarter of fiscal 2017. Increases in flat steel prices during the first half of calendar 2016 led to an improved pricing spread in Steel Processing and had a significant impact on earnings. Weakness in the oil & gas equipment end market continues to weigh on our Pressure Cylinders business. The Company has reduced costs in an attempt to match demand in this market.
Equity in net income of unconsolidated affiliates (“equity income”) was up $7.9 million, or 30%, from the prior year quarter driven by a $6.0 million increase at ClarkDietrich and improvements at ArtiFlex and Serviacero. Lower steel costs and strong automotive and construction markets in the U.S. are benefiting these businesses. We received distributions from unconsolidated joint ventures of $38.4 million during the quarter.
Recent Business Developments
| • | During the quarter, the Company completed the exit of the businesses within its former Construction Services operating segment. |
| • | On September 28, 2016, the Board of Directors of Worthington Industries, Inc. (the “Board”) declared a quarterly dividend of $0.20 per share payable on December 29, 2016 to shareholders of record on December 15, 2016. |
20
Table of Contents
Market & Industry Overview
We sell our products and services to a diverse customer base and a broad range of end markets. The breakdown of our net sales by end market for the first quarter of each of fiscal 2017 and fiscal 2016 is illustrated in the following chart:
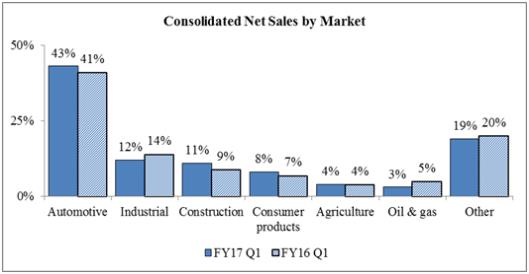
The automotive industry is one of the largest consumers of flat-rolled steel, and thus the largest end market for our Steel Processing operating segment. Approximately 63% of the net sales of our Steel Processing operating segment are to the automotive market. North American vehicle production, primarily by Ford, General Motors and FCA US (the “Detroit Three automakers”), has a considerable impact on the activity within this operating segment. The majority of the net sales of three of our unconsolidated joint ventures are also to the automotive end market.
Approximately 13% of the net sales of our Steel Processing operating segment and 52% of the net sales of our Engineered Cabs operating segment are to the construction market. The construction market is also the predominant end market for two of our unconsolidated joint ventures: WAVE and ClarkDietrich. While the market price of steel significantly impacts these businesses, there are other key indicators that are meaningful in analyzing construction market demand, including U.S. gross domestic product (“GDP”), the Dodge Index of construction contracts and, in the case of ClarkDietrich, trends in the relative price of framing lumber and steel.
Substantially all of the net sales of our Pressure Cylinders operating segment, and approximately 24% and 48% of the net sales of our Steel Processing and Engineered Cabs operating segments, respectively, are to other markets such as consumer products, industrial, lawn and garden, agriculture, oil & gas equipment, heavy truck, mining, forestry and appliance. Given the many different products that make up these net sales and the wide variety of end markets, it is very difficult to detail the key market indicators that drive these portions of our business. However, we believe that the trend in U.S. GDP growth is a good economic indicator for analyzing these operating segments.
21
Table of Contents
We use the following information to monitor our costs and demand in our major end markets:
| Three Months Ended August 31, | ||||||||||||
| 2016 | 2015 | Inc / (Dec) | ||||||||||
| U.S. GDP (% growth year-over-year) 1 |
1.5 | % | 1.4 | % | 0.1 | % | ||||||
| Hot-Rolled Steel ($ per ton) 2 |
$ | 617 | $ | 461 | $ | 156 | ||||||
| Detroit Three Auto Build (000’s vehicles) 3 |
2,380 | 2,318 | 62 | |||||||||
| No. America Auto Build (000’s vehicles) 3 |
4,563 | 4,393 | 170 | |||||||||
| Zinc ($ per pound) 4 |
$ | 0.84 | $ | 0.88 | $ | (0.04 | ) | |||||
| Natural Gas ($ per mcf) 5 |
$ | 2.00 | $ | 2.78 | $ | (0.78 | ) | |||||
| On-Highway Diesel Fuel Prices ($ per gallon) 6 |
$ | 2.39 | $ | 2.75 | $ | (0.36 | ) | |||||
| Crude Oil - WTI ($ per barrel) 6 |
$ | 46.04 | $ | 51.20 | $ | (5.16 | ) | |||||
| 1 | 2015 figures based on revised actuals 2 CRU Hot-Rolled Index; period average 3 IHS Global 4 LME Zinc; period average 5 NYMEX Henry Hub Natural Gas; period average 6 Energy Information Administration; period average |
U.S. GDP growth rate trends are generally indicative of the strength in demand and, in many cases, pricing for our products. A year-over-year increase in U.S. GDP growth rates is indicative of a stronger economy, which generally increases demand and pricing for our products. Conversely, decreasing U.S. GDP growth rates generally indicate a weaker economy. Changes in U.S. GDP growth rates can also signal changes in conversion costs related to production and in selling, general and administrative (“SG&A”) expense.
The market price of hot-rolled steel is one of the most significant factors impacting our selling prices and operating results. When steel prices fall, we typically have higher-priced material flowing through cost of goods sold, while selling prices compress to what the market will bear, negatively impacting our results. On the other hand, in a rising price environment, our results are generally favorably impacted, as lower-priced material purchased in previous periods flows through cost of goods sold, while our selling prices increase at a faster pace to cover current replacement costs.
The following table presents the average quarterly market price per ton of hot-rolled steel during fiscal 2017 (first quarter), fiscal 2016 and fiscal 2015:
| (Dollars per ton 1 ) | ||||||||||||
| Fiscal Year | ||||||||||||
| 2017 | 2016 | 2015 | ||||||||||
| 1st Quarter |
$ | 617 | $ | 461 | $ | 673 | ||||||
| 2nd Quarter |
N/A | $ | 419 | $ | 651 | |||||||
| 3rd Quarter |
N/A | $ | 383 | $ | 578 | |||||||
| 4th Quarter |
N/A | $ | 507 | $ | 464 | |||||||
| Annual Avg. |
N/A | $ | 443 | $ | 592 | |||||||
| 1 | CRU Hot-Rolled Index, period average |
No single customer contributed more than 10% of our consolidated net sales during the first quarter of fiscal 2017. While our automotive business is largely driven by the production schedules of the Detroit Three automakers, our customer base is much broader and includes other domestic manufacturers and many of their suppliers. During the first quarter of fiscal 2017, overall vehicle production for the Detroit Three automakers was up 3% and North American vehicle production as a whole increased 4%.
Certain other commodities, such as zinc, natural gas and diesel fuel, represent a significant portion of our cost of goods sold, both directly through our plant operations and indirectly through transportation and freight expense.
22
Table of Contents
Results of Operations
First Quarter – Fiscal 2017 Compared to Fiscal 2016
Consolidated Operations
The following table presents consolidated operating results for the periods indicated:
| Three Months Ended August 31, | ||||||||||||||||||||
| % of | % of | Increase/ | ||||||||||||||||||
| (In millions) | 2016 | Net sales | 2015 | Net sales | (Decrease) | |||||||||||||||
| Net sales |
$ | 737.5 | 100.0 | % | $ | 758.1 | 100.0 | % | $ | (20.6 | ) | |||||||||
| Cost of goods sold |
590.2 | 80.0 | % | 645.1 | 85.1 | % | (54.9 | ) | ||||||||||||
|
|
|
|
|
|
|
|||||||||||||||
| Gross margin |
147.3 | 20.0 | % | 113.0 | 14.9 | % | 34.3 | |||||||||||||
| Selling, general and administrative expense |
81.1 | 11.0 | % | 75.9 | 10.0 | % | 5.2 | |||||||||||||
| Impairment of long-lived assets |
— | 0.0 | % | 3.0 | 0.4 | % | (3.0 | ) | ||||||||||||
| Restructuring and other expense |
1.3 | 0.2 | % | 3.1 | 0.4 | % | (1.8 | ) | ||||||||||||
|
|
|
|
|
|
|
|||||||||||||||
| Operating income |
64.9 | 8.8 | % | 31.0 | 4.1 | % | 33.9 | |||||||||||||
| Miscellaneous income (expense), net |
0.9 | 0.1 | % | (0.6 | ) | -0.1 | % | 1.5 | ||||||||||||
| Interest expense |
(7.9 | ) | -1.1 | % | (7.9 | ) | -1.0 | % | — | |||||||||||
| Equity in net income of unconsolidated affiliates (1) |
34.5 | 4.7 | % | 26.6 | 3.5 | % | 7.9 | |||||||||||||
| Income tax expense |
(23.9 | ) | -3.2 | % | (14.1 | ) | -1.9 | % | (9.8 | ) | ||||||||||
|
|
|
|
|
|
|
|||||||||||||||
| Net earnings |
68.5 | 9.3 | % | 35.0 | 4.6 | % | 33.5 | |||||||||||||
| Net loss attributable to noncontrolling interests |
(2.9 | ) | -0.4 | % | (3.0 | ) | -0.4 | % | 0.1 | |||||||||||
|
|
|
|
|
|
|
|||||||||||||||
| Net earnings attributable to controlling interest |
$ | 65.6 | 8.9 | % | $ | 32.0 | 4.2 | % | $ | 33.6 | ||||||||||
|
|
|
|
|
|
|
|||||||||||||||
| (1) Equity income by unconsolidated affiliate |
||||||||||||||||||||
| WAVE |
$ | 20.7 | $ | 22.0 | $ | (1.3 | ) | |||||||||||||
| ClarkDietrich |
8.6 | 2.6 | 6.0 | |||||||||||||||||
| Serviacero |
2.0 | 0.8 | 1.2 | |||||||||||||||||
| ArtiFlex |
2.9 | 1.5 | 1.4 | |||||||||||||||||
| WSP |
— | 0.8 | (0.8 | ) | ||||||||||||||||
| Other |
0.3 | (1.1 | ) | 1.4 | ||||||||||||||||
|
|
|
|
|
|
|
|||||||||||||||
| Total |
$ | 34.5 | $ | 26.6 | $ | 7.9 | ||||||||||||||
|
|
|
|
|
|
|
|||||||||||||||
Net earnings attributable to controlling interest for the three months ended August 31, 2016 increased $33.6 million from the comparable period in the prior year. Net sales and operating highlights were as follows:
| • | Net sales decreased $20.6 million from the comparable period in the prior year on lower volume, partially offset by higher average selling prices. Lower overall volume reduced net sales by $28.6 million on decreases in certain Pressure Cylinders businesses and Engineered Cabs, partially offset by contributions from the consolidation of the WSP joint venture effective March 1, 2016. |
| • | Gross margin increased $34.3 million from the comparable period in the prior year on a favorable pricing spread in Steel Processing due primarily to inventory holding gains in the current quarter compared to inventory holding losses in the prior year quarter, partially offset by lower volume in Pressure Cylinders. |
| • | SG&A expense increased $5.2 million over the comparable prior year period driven by the impact of acquisitions, higher profit sharing and bonus expense and a $1.5 million increase in accrued legal expense. |
| • | Restructuring and other expense of $1.3 million in the current period consisted primarily of $0.8 million of facility exist costs related to the ongoing closure of Precision Specialty Metals (“PSM”) and $0.2 million of facility exit costs related to the closure of the Florence, South Carolina facility in Engineered Cabs. For additional financial information regarding the Company’s restructuring activities, refer to “Item 1. – Financial Statements – Notes to Consolidated Financial Statements – NOTE D – Restructuring and Other Expense” of this Quarterly Report on Form 10-Q. |
23
Table of Contents
| • | Interest expense of $7.9 million was unchanged from the comparable period in the prior year. |
| • | Equity income increased $7.9 million from the comparable period in the prior year to $34.5 million driven primarily by a $6.0 million increase at ClarkDietrich and improvements at ArtiFlex and Serviacero. Lower steel costs and strong automotive and construction markets in the U.S. are benefiting these businesses. We received distributions of $38.4 million from our unconsolidated affiliates during the quarter. For additional financial regarding our unconsolidated affiliates, refer to “Item 1. – Financial Statements – Notes to Consolidated Financial Statements – NOTE B – Investments in Unconsolidated Affiliates” of this Quarterly Report on Form 10-Q. |
| • | Income tax expense increased $9.8 million from the comparable period in the prior year due primarily to higher earnings. The increase in tax expense was partially offset by the following items recorded in the current quarter: (i) a $4.6 million tax benefit associated with share-based payment awards, and (ii) a $1.2 million tax benefit related to foreign tax credits. The current quarter expense was calculated using an estimated annual effective income tax rate of 31.2% versus 31.7% in the prior year quarter. Refer to “Item 1. – Financial Statements – Notes to Consolidated Financial Statements – NOTE K – Income Taxes” of this Quarterly Report on Form 10-Q for more information on our tax rates. |
Segment Operations
Steel Processing
The following table presents a summary of operating results for our Steel Processing operating segment for the periods indicated:
| Three Months Ended August 31, | ||||||||||||||||||||
| % of | % of | Increase/ | ||||||||||||||||||
| (Dollars in millions) | 2016 | Net sales | 2015 | Net sales | (Decrease) | |||||||||||||||
| Net sales |
$ | 505.7 | 100.0 | % | $ | 490.8 | 100.0 | % | $ | 14.9 | ||||||||||
| Cost of goods sold |
413.0 | 81.7 | % | 433.8 | 88.4 | % | (20.8 | ) | ||||||||||||
|
|
|
|
|
|
|
|||||||||||||||
| Gross margin |
92.7 | 18.3 | % | 57.0 | 11.6 | % | 35.7 | |||||||||||||
| Selling, general and administrative expense |
36.9 | 7.3 | % | 32.9 | 6.7 | % | 4.0 | |||||||||||||
| Restructuring and other expense |
1.0 | 0.2 | % | 0.5 | 0.1 | % | 0.5 | |||||||||||||
|
|
|
|
|
|
|
|||||||||||||||
| Operating income |
$ | 54.8 | 10.8 | % | $ | 23.6 | 4.8 | % | $ | 31.2 | ||||||||||
|
|
|
|
|
|
|
|||||||||||||||
| Material cost |
$ | 312.7 | $ | 348.2 | $ | (35.5 | ) | |||||||||||||
| Tons shipped (in thousands) |
1,032 | 866 | 166 | |||||||||||||||||
Net sales and operating highlights were as follows:
| • | Net sales increased $14.9 million from the comparable period in the prior year on the combined impact of higher volume and higher average selling prices. Higher volume favorably impacted net sales by $8.9 million and was driven by the consolidation of the WSP joint venture effective March 1, 2016, partially offset by the closure of the Company’s stainless steel business, PSM. The remaining increase in net sales was due to higher average selling prices. The mix of direct versus toll tons processed was 52% to 48% compared to 60% to 40% in the prior year quarter. The change in mix was primarily the result of the consolidation of the WSP joint venture. |
| • | Operating income increased $31.2 million from the comparable period in the prior year driven by a higher spread between average selling prices and material cost due primarily to inventory holding gains in the current quarter compared to inventory holding losses in the prior year quarter. Higher SG&A expense, driven by the consolidation of WSP and higher profit sharing and bonus expense, combined with current period restructuring activities partially offset the overall increase in operating income. Restructuring and other expense in the current quarter consisted primarily of costs related to the ongoing closure of PSM. |
24
Table of Contents
Pressure Cylinders
The following table presents a summary of operating results for our Pressure Cylinders operating segment for the periods indicated:
| Three Months Ended August 31, | ||||||||||||||||||||
| % of | % of | Increase/ | ||||||||||||||||||
| (Dollars in millions) | 2016 | Net sales | 2015 | Net sales | (Decrease) | |||||||||||||||
| Net sales |
$ | 205.2 | 100.0 | % | $ | 224.4 | 100.0 | % | $ | (19.2 | ) | |||||||||
| Cost of goods sold |
154.0 | 75.0 | % | 170.0 | 75.8 | % | (16.0 | ) | ||||||||||||
|
|
|
|
|
|
|
|||||||||||||||
| Gross margin |
51.2 | 25.0 | % | 54.4 | 24.2 | % | (3.2 | ) | ||||||||||||
| Selling, general and administrative expense |
37.0 | 18.0 | % | 36.9 | 16.4 | % | 0.1 | |||||||||||||
| Restructuring and other expense |
0.1 | 0.0 | % | 0.7 | 0.3 | % | (0.6 | ) | ||||||||||||
|
|
|
|
|
|
|
|||||||||||||||
| Operating income |
$ | 14.1 | 6.9 | % | $ | 16.8 | 7.5 | % | $ | (2.7 | ) | |||||||||
|
|
|
|
|
|
|
|||||||||||||||
| Material cost |
$ | 85.5 | $ | 99.1 | $ | (13.6 | ) | |||||||||||||
| Net sales by principal class of products: |
||||||||||||||||||||
| Consumer products |
$ | 60.6 | $ | 55.0 | $ | 5.6 | ||||||||||||||
| Industrial products |
90.0 | 105.1 | (15.1 | ) | ||||||||||||||||
| Alternative fuels |
29.8 | 24.8 | 5.0 | |||||||||||||||||
| Oil & gas equipment |
14.5 | 32.9 | (18.4 | ) | ||||||||||||||||
| Cryogenics |
10.3 | 6.6 | 3.7 | |||||||||||||||||
|
|
|
|
|
|
|
|||||||||||||||
| Total Pressure Cylinders |
$ | 205.2 | $ | 224.4 | $ | (19.2 | ) | |||||||||||||
|
|
|
|
|
|
|
|||||||||||||||
| Units shipped by principal class of products: |
||||||||||||||||||||
| Consumer products |
12,088,912 | 11,977,945 | 110,967 | |||||||||||||||||
| Industrial products |
6,561,139 | 7,147,952 | (586,813 | ) | ||||||||||||||||
| Alternative fuels |
136,062 | 91,956 | 44,106 | |||||||||||||||||
| Oil & gas equipment |
756 | 1,320 | (564 | ) | ||||||||||||||||
| Cryogenics |
4,854 | 237 | 4,617 | |||||||||||||||||
|
|
|
|
|
|
|
|||||||||||||||
| Total Pressure Cylinders |
18,791,723 | 19,219,410 | (427,687 | ) | ||||||||||||||||
|
|
|
|
|
|
|
|||||||||||||||
Net sales and operating highlights were as follows:
| • | Net sales decreased $19.2 million from the comparable period in the prior year. The decrease was driven almost exclusively by lower overall volume due primarily to declines in the oil & gas equipment and industrial products businesses. |
| • | Operating income decreased $2.7 million from the comparable period in the prior year primarily due to declines in the oil & gas equipment business, as improvements in the consumer products business offset smaller declines in the industrial products and cryogenics businesses. |
25
Table of Contents
Engineered Cabs
The following table presents a summary of operating results for our Engineered Cabs operating segment for the periods indicated:
| Three Months Ended August 31, | ||||||||||||||||||||
| (In millions) | 2016 | % of Net sales |
2015 | % of Net sales |
Increase/ (Decrease) |
|||||||||||||||
| Net sales |
$ | 25.6 | 100.0 | % | $ | 38.6 | 100.0 | % | $ | (13.0 | ) | |||||||||
| Cost of goods sold |
23.3 | 91.0 | % | 37.6 | 97.4 | % | (14.3 | ) | ||||||||||||
|
|
|
|
|
|
|
|||||||||||||||
| Gross margin |
2.3 | 9.0 | % | 1.0 | 2.6 | % | 1.3 | |||||||||||||
| Selling, general and administrative expense |
3.9 | 15.2 | % | 5.4 | 14.0 | % | (1.5 | ) | ||||||||||||
| Impairment of long-lived assets |
- | 0.0 | % | 3.0 | 7.8 | % | (3.0 | ) | ||||||||||||
| Restructuring and other expense |
0.2 | 0.8 | % | 1.9 | 4.9 | % | (1.7 | ) | ||||||||||||
|
|
|
|
|
|
|
|||||||||||||||
| Operating loss |
$ | (1.8 | ) | -7.0 | % | $ | (9.3 | ) | -24.1 | % | $ | 7.5 | ||||||||
|
|
|
|
|
|
|
|||||||||||||||
| Material cost |
$ | 11.2 | $ | 18.0 | $ | (6.8 | ) | |||||||||||||
Net sales and operating highlights were as follows:
| • | Net sales decreased $13.0 million from the comparable period in the prior year due to declines in market demand. |
| • | Operating loss improved $7.5 million to $1.8 million, primarily due to lower impairment and restructuring charges, improved gross margin and lower SG&A expense. |
Other
The Other category includes the WEI operating segment, which does not meet the quantitative thresholds for separate disclosure. Certain income and expense items not allocated to our operating segments are also included in the Other category, including costs associated with our captive insurance company. The following table presents a summary of operating results for the Other category for the periods indicated:
| Three Months Ended August 31, | ||||||||||||||||||||
| (In millions) | 2016 | % of Net sales |
2015 | % of Net sales |
Increase/ (Decrease) |
|||||||||||||||
| Net sales |
$ | 1.1 | 100.0 | % | $ | 4.3 | 100.0 | % | $ | (3.2 | ) | |||||||||
| Cost of goods sold |
- | 0.0 | % | 3.7 | 86.0 | % | (3.7 | ) | ||||||||||||
|
|
|
|
|
|
|
|||||||||||||||
| Gross margin |
1.1 | 100.0 | % | 0.6 | 14.0 | % | 0.5 | |||||||||||||
| Selling, general and administrative expense |
3.2 | 290.9 | % | 0.8 | 18.6 | % | 2.4 | |||||||||||||
|
|
|
|
|
|
|
|||||||||||||||
| Operating loss |
$ | (2.1 | ) | -190.9 | % | $ | (0.2 | ) | -4.7 | % | $ | (1.9 | ) | |||||||
|
|
|
|
|
|
|
|||||||||||||||
Net sales and operating highlights were as follows:
| • | Net sales decreased $3.2 million from the comparable period in the prior year as the former Construction Services operating segment has ceased operations. |
| • | Operating loss of $2.1 million in the current period was driven primarily by a $1.5 million increase in accrued legal expense. |
26
Table of Contents
Liquidity and Capital Resources
During the three months ended August 31, 2016, we generated $120.9 million of cash from operating activities, invested $16.3 million in property, plant and equipment, and paid dividends of $11.9 million on our common shares. The following table summarizes our consolidated cash flows for the three months ended August 31, 2016 and 2015:
| Three Months Ended | ||||||||
| August 31, | ||||||||
| (in millions) | 2016 | 2015 | ||||||
| Net cash provided by operating activities |
$ | 120.9 | $ | 138.6 | ||||
| Net cash used by investing activities |
(16.2 | ) | (40.1 | ) | ||||
| Net cash used by financing activities |
(7.4 | ) | (110.8 | ) | ||||
|
|
|
|
|
|||||
| Increase (decrease) in cash and cash equivalents |
97.3 | (12.3 | ) | |||||
| Cash and cash equivalents at beginning of period |
84.2 | 31.1 | ||||||
|
|
|
|
|
|||||
| Cash and cash equivalents at end of period |
$ | 181.5 | $ | 18.8 | ||||
|
|
|
|
|
|||||
We believe we have access to adequate resources to meet the needs of our existing businesses for normal operating costs, mandatory capital expenditures, debt redemptions, dividend payments, and working capital. These resources include cash and cash equivalents, cash provided by operating activities and unused lines of credit. We also believe that we have adequate access to the financial markets to allow us to be in a position to sell long-term debt or equity securities. However, uncertainty and volatility in the financial markets may impact our ability to access capital and the terms under which we can do so.
Operating Activities
Our business is cyclical and cash flows from operating activities may fluctuate during the year and from year to year due to economic conditions. We rely on cash and short-term borrowings to meet cyclical increases in working capital needs. These needs generally rise during periods of increased economic activity or increasing raw material prices due to higher levels of inventory and accounts receivable. During economic slowdowns, or periods of decreasing raw material costs, working capital needs generally decrease as a result of the reduction of inventories and accounts receivable.
Net cash provided by operating activities was $120.9 million during the three months ended August 31, 2016 compared to $138.6 million in the comparable period of fiscal 2016. The decrease was driven primarily by an increase in working capital levels as a result of higher average steel prices partially offset by higher net earnings.
Investing Activities
Net cash used by investing activities was $16.2 million during the three months ended August 31, 2016 compared to $40.1 million in the prior year period. The decrease from the prior year period was driven primarily by lower capital expenditures.
Investment activities are largely discretionary, and future investment activities could be reduced significantly, or eliminated, as economic conditions warrant. We assess acquisition opportunities as they arise, and such opportunities may require additional financing. There can be no assurance, however, that any such opportunities will arise, that any such acquisitions will be consummated, or that any needed additional financing will be available on satisfactory terms when required.
Financing Activities
Net cash used by financing activities was $7.4 million during the three months ended August 31, 2016 compared to $110.8 million in the comparable prior year period. During the first three months of fiscal 2017, we paid dividends of $11.9 million on our common shares and received $5.8 million of proceeds from the issuance of common shares.
27
Table of Contents
As of August 31, 2016, we were in compliance with our short-term and long-term financial debt covenants. These debt agreements do not include credit rating triggers or material adverse change provisions. Our credit ratings at August 31, 2016 were unchanged from those reported as of May 31, 2016.
Common shares - The Board declared a quarterly dividend of $0.20 per common share for the first quarter of fiscal 2017 compared to $0.19 per common share for the first quarter of fiscal 2016. Dividends paid on our common shares totaled $11.9 million and $11.6 million during the three months ended August 31, 2016 and 2015, respectively. On September 28, 2016, the Board declared a quarterly dividend of $0.20 per common share payable on December 29, 2016 to shareholders of record on December 15, 2016.
On June 25, 2014, the Board authorized the repurchase of up to 10,000,000 of our outstanding common shares. A total of 5,953,855 common shares have been repurchased under this authorization, leaving 4,046,145 common shares available for repurchase. No common shares were repurchased under this authorization during the first quarter of fiscal 2017.
The common shares available for repurchase under this authorization may be purchased from time to time, with consideration given to the market price of the common shares, the nature of other investment opportunities, cash flows from operations, general economic conditions and other relevant considerations. Repurchases may be made on the open market or through privately negotiated transactions.
Dividend Policy
We currently have no material contractual or regulatory restrictions on the payment of dividends. Dividends are declared at the discretion of the Board. The Board reviews the dividend quarterly and establishes the dividend rate based upon our consolidated financial condition, results of operations, capital requirements, current and projected cash flows, business prospects, and other relevant factors. While we have paid a dividend every quarter since becoming a public company in 1968, there is no guarantee that payments will continue in the future. We currently have no material contractual or regulatory restrictions on the payment of dividends.
Contractual Cash Obligations and Other Commercial Commitments
Our contractual cash obligations and other commercial commitments have not changed significantly from those disclosed in “Part II – Item 7. – Management’s Discussion and Analysis of Financial Condition and Results of Operations – Contractual Cash Obligations and Other Commercial Commitments” of our 2016 Form 10-K, other than the changes in borrowings, as described in “Part I – Item 1. – Financial Statements – NOTE G – Debt and Receivables Securitization” of this Quarterly Report on Form 10-Q.
Off-Balance Sheet Arrangements
We do not have guarantees or other off-balance sheet financing arrangements that we believe are reasonably likely to have a material current or future effect on our consolidated financial condition, changes in financial condition, revenues or expenses, results of operations, liquidity, capital expenditures or capital resources. However, as of August 31, 2016, we were party to an operating lease for an aircraft in which we have guaranteed a residual value at the termination of the lease. The maximum obligation under the terms of this guarantee was approximately $10.2 million at August 31, 2016. Based on current facts and circumstances, we have estimated the likelihood of payment pursuant to this guarantee is not probable and, therefore, no amounts have been recognized in our consolidated financial statements.
Recently Adopted Accounting Standards
In February 2015, amended accounting guidance was issued that revised consolidation requirements in order to provide financial statement users with a more useful presentation of an entity’s economic and operational results. The amended guidance revises the consolidation requirements for limited partnerships, the considerations surrounding the primary beneficiary determination and the consolidation of certain investment funds and is effective for fiscal years beginning after December 15, 2015, including interim periods within those fiscal years. The Company adopted this amended guidance on a prospective basis effective June 1, 2016. The adoption of this guidance did not impact our financial position or results of operations.
In April 2015, amended accounting guidance was issued that requires debt issuance costs related to a recognized debt liability to be presented in the balance sheet as a direct deduction from the carrying amount of the
28
Table of Contents
corresponding debt liability itself. The amended guidance does not apply to line-of-credit arrangements. Accordingly, issuance costs related to line-of-credit arrangements will continue to be presented as an asset and amortized ratably over the term of the arrangement. The amended guidance is effective for fiscal years beginning after December 15, 2015, including interim periods within those fiscal years. The Company adopted this guidance on a retrospective basis effective June 1, 2016. As a result, debt issuance costs totaling $2.4 million and $2.5 million as of August 31, 2016 and May 31, 2016, respectively, have been presented as a component of the carrying amount of long-term debt reported in our consolidated balance sheets. These amounts were previously capitalized and reported within other assets.
In September 2015, amended accounting guidance was issued regarding adjustments to provisional amounts recorded in conjunction with a business combination. The amended guidance requires the acquirer to recognize adjustments to provisional amounts identified during the measurement period in the reporting period in which such adjustments are identified, rather than retrospectively adjusting previously reported amounts. The amended guidance is effective for fiscal years beginning after December 15, 2015, including interim periods within those fiscal years. The Company adopted this amended guidance on a prospective basis effective June 1, 2016. The adoption of this guidance did not impact our financial position or results of operations.
In March 2016, amended accounting guidance was issued that simplifies the accounting for share-based payments. The amended guidance impacts several aspects of the accounting for share-based payment transactions, including the income tax consequences, forfeitures, statutory withholding requirements, and classification in the statement of cash flows. The Company early adopted this guidance during the fourth quarter of fiscal 2016. As required for early adoption in an interim period, all adjustments have been reflected as of the beginning of fiscal 2016. Accordingly, income tax expense for the three months ended August 31, 2015 has been restated to reflect excess tax benefits associated with share-based payments totaling $558,000 in current income tax expense, rather than in paid-in capital.
Recently Issued Accounting Standards
In May 2014, amended accounting guidance was issued that replaces most existing revenue recognition guidance under U.S. GAAP. The amended guidance requires an entity to recognize the amount of revenue to which it expects to be entitled for the transfer of promised goods or services to customers. Subsequently, additional guidance was issued on several areas including guidance intended to improve the operability and understandability of the implementation of principal versus agent considerations and clarifications on the identification of performance obligations and implementation of guidance related to licensing. The amended guidance is effective for annual reporting periods beginning after December 15, 2017, including interim periods within that reporting period. We are in the process of evaluating the effect this guidance will have on our consolidated financial position and results of operations. The amended guidance permits the use of either the retrospective or cumulative effect transition method. We have not selected a transition method nor have we determined the effect of the amended guidance on our ongoing financial reporting.
In July 2015, amended accounting guidance was issued regarding the measurement of inventory. The amended guidance requires that inventory accounted for under the first-in, first-out (FIFO) or average cost methods be measured at the lower of cost and net realizable value, where net realizable value represents the estimated selling price of inventory in the ordinary course of business, less reasonably predictable costs of completion, disposal, and transportation. The amended guidance has no impact on inventory accounted for under the last-in, first-out (LIFO) or retail inventory methods. The amended guidance is effective prospectively for fiscal years beginning after December 15, 2016, including interim periods within those fiscal years. Early adoption is permitted as of the beginning of an interim or annual reporting period. We do not expect the adoption of this amended accounting guidance to have a material impact on our financial position or results of operations.
In February 2016, amended accounting guidance was issued that replaces most existing lease accounting guidance under U.S. GAAP. Among other changes, the amended guidance requires that lease assets and liabilities be recognized on the balance sheet by lessees for those leases classified as operating leases under previous guidance. The amended guidance is effective for fiscal years beginning after December 15, 2018, including interim periods within those fiscal years. Early adoption is permitted, and the change is to be applied using a modified retrospective approach as of the beginning of the earliest period presented. We are in the process of evaluating the effect this guidance will have on our consolidated financial position and results of operations, and we have not determined the effect of the amended guidance on our ongoing financial reporting.
In March 2016, amended accounting guidance was issued regarding derivative instruments designated as
29
Table of Contents
hedging instruments. The amended guidance clarifies that a change in the counterparty to such a hedging instrument does not, in and of itself, require dedesignation of that hedging relationship provided that all other hedge accounting criteria continue to be met. The amended guidance is effective for fiscal years beginning after December 15, 2016, including interim periods within those fiscal years. Early adoption is permitted, and the change may be applied either prospectively or retrospectively. We do not expect the adoption of this amended accounting guidance to have a material impact on our financial position or results of operations.
In June 2016, amended accounting guidance was issued related to the measurement of credit losses on financial instruments. The amended guidance changes the impairment model for most financial assets to require measurement and recognition of expected credit losses for financial assets held. The amended guidance is effective for fiscal years beginning after December 15, 2019, including interim periods within those fiscal years. We are in the process of evaluating the effect this guidance will have on our consolidated financial position and results of operations, and we have not determined the effect of the amended guidance on our ongoing financial reporting.
In August 2016, amended accounting guidance was issued to clarify the proper cash flow presentation of certain specific types of cash payments and cash receipts. The amended guidance is effective for fiscal years beginning after December 15, 2017, including interim periods within those fiscal years. Early adoption is permitted. We are in the process of evaluating the effect this guidance will have on our consolidated financial position, results of operations and cash flows, and we have not determined the effect of the amended guidance on our ongoing financial reporting.
Critical Accounting Policies
The discussion and analysis of our financial condition and results of operations is based upon our consolidated financial statements, which have been prepared in accordance with U.S. GAAP. The preparation of these consolidated financial statements requires us to make estimates and assumptions that affect the reported amounts of assets and liabilities and the disclosure of contingent assets and liabilities at the date of the consolidated financial statements and the reported amounts of revenues and expenses during the reporting periods. We continually evaluate our estimates, including those related to our valuation of receivables, intangible assets, accrued liabilities, income and other tax accruals, and contingencies and litigation. We base our estimates on historical experience and various other assumptions that we believe to be reasonable under the circumstances. These results form the basis for making judgments about the carrying values of assets and liabilities that are not readily obtained from other sources. Critical accounting policies are defined as those that require our significant judgments and involve uncertainties that could potentially result in materially different results under different assumptions and conditions. Although actual results historically have not deviated significantly from those determined using our estimates, our financial position or results of operations could be materially different if we were to report under different conditions or to use different assumptions in the application of such policies. Our critical accounting policies have not significantly changed from those discussed in “Part II – Item 7. – Management’s Discussion and Analysis of Financial Condition and Results of Operations – Critical Accounting Policies” of our 2016 Form 10-K.
We review our receivables on an ongoing basis to ensure they are properly valued. Based on this review, we believe our reserve for doubtful accounts is adequate. However, if the economic environment and market conditions deteriorate, particularly in the automotive and construction markets where our exposure is greatest, additional reserves may be required. We recognize revenue upon transfer of title and risk of loss provided evidence of an arrangement exists, pricing is fixed and determinable, and the ability to collect is probable. In circumstances where the collection of payment is not probable at the time of shipment, we defer recognition of revenue until payment is collected.
We review the carrying value of our long-lived assets, including intangible assets with definite useful lives, for impairment whenever events or changes in circumstances indicate that the carrying value of an asset or asset group may not be recoverable.
Impairment testing of long-lived assets with definite useful lives involves a comparison of the sum of the undiscounted future cash flows of the asset or asset group to its respective carrying amount. If the sum of the undiscounted future cash flows exceeds the carrying amount, then no impairment exists. If the carrying amount exceeds the sum of the undiscounted future cash flows, then a second step is performed to determine the amount of impairment, which would be recorded as an impairment charge in our consolidated statement of earnings.
No impairment charges were recognized during the first quarter of fiscal 2017.
30
Table of Contents
During the first quarter of fiscal 2016, management finalized its plan to close the Engineered Cabs facility in Florence, South Carolina and transfer the majority of the business to the Engineered Cabs facility in Greeneville, Tennessee. Under the plan, certain machinery and equipment was transferred to the Greeneville facility to support higher volume requirements. Management reevaluated the recoverability of the remaining assets and determined that long-lived assets with a carrying value of $4.1 million were impaired. As a result, these long-lived assets were written down to their estimated fair value of $1.1 million resulting in an impairment charge of $3.0 million during the first quarter of fiscal 2016. The Company ceased production at the Florence facility on September 30, 2015.
Goodwill and intangible assets with indefinite lives are not amortized, but instead are tested for impairment annually, during the fourth quarter, or more frequently if events or changes in circumstances indicate that impairment may be present. Application of goodwill impairment testing involves judgment, including but not limited to, the identification of reporting units and estimation of the fair value of each reporting unit. A reporting unit is defined as an operating segment or one level below an operating segment. With the exception of Pressure Cylinders, we test goodwill at the operating segment level as we have determined that the characteristics of the reporting units within each operating segment are similar and allow for their aggregation in accordance with the applicable accounting guidance. For our Pressure Cylinders operating segment, the oil & gas equipment business has been treated as a separate reporting unit since the second quarter of fiscal 2016.
The goodwill impairment test consists of comparing the fair value of each reporting unit, determined using discounted cash flows, to each reporting unit’s respective carrying value. If the estimated fair value of a reporting unit exceeds its carrying value, there is no impairment. If the carrying amount of the reporting unit exceeds its estimated fair value, goodwill impairment is indicated. The amount of the impairment is determined by comparing the fair value of the net assets of the reporting unit, excluding goodwill, to its estimated fair value, with the difference representing the implied fair value of the goodwill. If the implied fair value of the goodwill is lower than its carrying value, the difference is recorded as an impairment charge in our consolidated statements of earnings. The impairment test for indefinite-lived intangible assets consists of a comparison of the fair value of the intangible asset to its carrying value. If the carrying value of the intangible asset exceeds its fair value, the difference is recorded as an impairment charge in our consolidated statements of earnings. We performed our annual impairment evaluation of goodwill and other indefinite-lived intangible assets during the fourth quarter of fiscal 2016 and concluded that the fair value of each reporting unit exceeded its carrying value; therefore, no impairment charges were recognized. Additionally, no impairment indicators were present with regard to our goodwill or intangible assets with indefinite useful lives during the three months ended August 31, 2016.
Item 3. - Quantitative and Qualitative Disclosures About Market Risk
Market risks have not changed significantly from those disclosed in “Part II - Item 7A. – Quantitative and Qualitative Disclosures About Market Risk” of our 2016 Form 10-K.
Item 4. - Controls and Procedures
Evaluation of Disclosure Controls and Procedures
We maintain disclosure controls and procedures [as defined in Rules 13a-15(e) and 15d-15(e) under the Securities Exchange Act of 1934, as amended (the “Exchange Act”)] that are designed to provide reasonable assurance that information required to be disclosed in the reports that we file or submit under the Exchange Act is recorded, processed, summarized and reported within the time periods specified in the Securities and Exchange Commission’s rules and forms, and that such information is accumulated and communicated to our management, including our principal executive officer and our principal financial officer, as appropriate to allow timely decisions regarding required disclosure.
Management, with the participation of our principal executive officer and our principal financial officer, performed an evaluation of the effectiveness of our disclosure controls and procedures as of the end of the period covered by this Quarterly Report on Form 10-Q (the fiscal quarter ended August 31, 2016). Based on that evaluation, our principal executive officer and our principal financial officer have concluded that such disclosure controls and procedures were effective at a reasonable assurance level as of the end of the period covered by this Quarterly Report on Form 10-Q.
31
Table of Contents
Changes in Internal Control Over Financial Reporting
There were no changes that occurred during the period covered by this Quarterly Report on Form 10-Q (the fiscal quarter ended August 31, 2016) in our internal control over financial reporting (as defined in Rules 13a-15(f) and 15d-15(f) under the Exchange Act) that have materially affected, or are reasonably likely to materially affect, our internal control over financial reporting.
Various legal actions, which generally have arisen in the ordinary course of business, are pending against the Company. None of this pending litigation, individually or collectively, is expected to have a material adverse effect on our consolidated financial position, results of operations or cash flows.
There are certain risks and uncertainties in our business that could cause our actual results to differ materially from those anticipated. In “PART I – Item 1A. – Risk Factors” of the Annual Report on Form 10-K of Worthington Industries, Inc. for the fiscal year ended May 31, 2016 (the “2016 Form 10-K”), as filed with the Securities and Exchange Commission on August 1, 2016, and available at www.sec.gov or at www.worthingtonindustries.com, we included a detailed discussion of our risk factors. Our risk factors have not changed significantly from those disclosed in our 2016 Form 10-K. These risk factors should be read carefully in connection with evaluating our business and in connection with the forward-looking statements and other information contained in this Quarterly Report on Form 10-Q. Any of the risks described in our 2016 Form 10-K could materially affect our business, consolidated financial condition or future results and the actual outcome of matters as to which forward-looking statements are made. The risk factors described in our 2016 Form 10-K are not the only risks we face. Additional risks and uncertainties not currently known to us, or that we currently deem to be immaterial, also may materially adversely affect our business, financial condition and/or future results.
Item 2. – Unregistered Sales of Equity Securities and Use of Proceeds
The following table provides information about purchases made by, or on behalf of, Worthington Industries, Inc. or any “affiliated purchaser” (as defined in Rule 10b-18(a) (3) under the Securities Exchange Act of 1934, as amended) of common shares of Worthington Industries, Inc. during each month of the fiscal quarter ended August 31, 2016:
| Period |
Total Number of Common Shares Purchased |
Average Price Paid per Common Share |
Total Number of Common Shares Purchased as Part of Publicly Announced Plans or Programs |
Maximum Number of Common Shares that May Yet Be Purchased Under the Plans or Programs (1) |
||||||||||||
| June 1-30, 2016 (2) |
86,060 | $ | 39.87 | - | 4,046,145 | |||||||||||
| July 1-31, 2016 |
- | $ | - | - | 4,046,145 | |||||||||||
| August 1-31, 2016 |
- | $ | - | - | 4,046,145 | |||||||||||
|
|
|
|
|
|
|
|||||||||||
| Total |
86,060 | $ | 39.87 | - | ||||||||||||
|
|
|
|
|
|
|
|||||||||||
| (1) | The number shown represents, as of the end of each period, the maximum number of common shares that could be purchased under the publicly announced repurchase authorization then in effect. On June 26, 2014, Worthington Industries, Inc. announced that on June 25, 2014, the Board of Directors had authorized the repurchase of up to 10,000,000 of Worthington Industries’ outstanding common shares. A total of 4,046,145 common shares were available under this repurchase authorization at August 31, 2016. |
32
Table of Contents
The common shares available for repurchase under this authorization may be purchased from time to time, with consideration given to the market price of the common shares, the nature of other investment opportunities, cash flows from operations, general economic conditions and other appropriate factors. Repurchases may be made on the open market or through privately negotiated transactions.
| (2) | Includes an aggregate of 86,060 common shares surrendered by employees in June 2016 to satisfy tax withholding obligations upon the exercise of stock options and vesting of restricted common shares. These common shares were not counted against the share repurchase authorization in effect throughout the first quarter of fiscal 2017 and discussed in footnote (1) above. |
Item 3. – Defaults Upon Senior Securities
Not applicable
Item 4. – Mine Safety Disclosures
Not applicable
Not applicable
| 10.1 | Summary of Annual Base Salaries Approved for Named Executive Officers of Worthington Industries, Inc. (Incorporated herein by reference to Exhibit 10.65 to the Annual Report on Form 10-K of Worthington Industries, Inc. for the fiscal year ended May 31, 2016 (SEC File No. 1-8399)) | |||
| 10.2 | Summary of Annual Cash Incentive Bonus Awards, Long-Term Performance Awards, Stock Options and Restricted Common Shares granted in Fiscal 2017 for Named Executive Officers (Incorporated herein by reference to Exhibit 10.71 to the Annual Report on Form 10-K of Worthington Industries, Inc. for the fiscal year ended May 31, 2016 (SEC File No. 1-8399)) | |||
| 10.3 | Second Amendment to the Worthington Industries, Inc. Amended and Restated 2006 Equity Incentive Plan for Non-Employee Directors (Incorporated herein by reference to Exhibit 10.1 to the Current Report on Form 8-K of Worthington Industries, Inc. dated October 3, 2016 and filed with the SEC on the same day (SEC File No. 1-8399)) | |||
| 31.1 | Rule 13a - 14(a) / 15d - 14(a) Certifications (Principal Executive Officer) * | |||
| 31.2 | Rule 13a - 14(a) / 15d - 14(a) Certifications (Principal Financial Officer) * | |||
| 32.1 | Certifications of Principal Executive Officer Pursuant to 18 U.S.C. Section 1350, as Adopted Pursuant to Section 906 of the Sarbanes-Oxley Act of 2002** | |||
| 32.2 | Certifications of Principal Financial Officer Pursuant to 18 U.S.C. Section 1350, as Adopted Pursuant to Section 906 of the Sarbanes-Oxley Act of 2002** | |||
| 101.INS | XBRL Instance Document # | |||
| 101.SCH | XBRL Taxonomy Extension Schema Document # | |||
| 101.PRE | XBRL Taxonomy Extension Presentation Linkbase Document # | |||
| 101.LAB | XBRL Taxonomy Extension Label Linkbase Document # | |||
| 101.CAL | XBRL Taxonomy Extension Calculation Linkbase Document # | |||
| 101.DEF | XBRL Taxonomy Extension Definition Linkbase Document # | |||
33
Table of Contents
| * | Filed herewith. |
| ** | Furnished herewith. |
| # | Attached as Exhibit 101 to this Quarterly Report on Form 10-Q of Worthington Industries, Inc. are the following documents formatted in XBRL (Extensible Business Reporting Language): |
| (i) | Consolidated Balance Sheets at August 31, 2016 and May 31, 2016; |
| (ii) | Consolidated Statements of Earnings for the three months ended August 31, 2016 and 2015; |
| (iii) | Consolidated Statements of Comprehensive Income for the three months ended August 31, 2016 and 2015; |
| (iv) | Consolidated Statements of Cash Flows for the three months ended August 31, 2016 and 2015; and |
| (v) | Notes to Consolidated Financial Statements. |
34
Table of Contents
Pursuant to the requirements of the Securities Exchange Act of 1934, the Registrant has duly caused this report to be signed on its behalf by the undersigned thereunto duly authorized.
| WORTHINGTON INDUSTRIES, INC. | ||||||
| Date: October 11, 2016 |
By: |
/s/ B. Andrew Rose | ||||
| B. Andrew Rose, | ||||||
| Executive Vice President and Chief Financial Officer | ||||||
| (On behalf of the Registrant and as Principal | ||||||
| Financial Officer) | ||||||
35
Table of Contents
| Exhibit No. |
Description |
Location | ||
| 10.1 | Summary of Annual Base Salaries Approved for Named Executive Officers of Worthington Industries, Inc. |
Incorporated herein by reference to Exhibit 10.65 to the Annual Report on Form 10-K of Worthington Industries, Inc. for the fiscal year ended May 31, 2016 (SEC File No. 1-8399) | ||
| 10.2 | Summary of Annual Cash Incentive Bonus Awards, Long-Term Performance Awards, Stock Options and Restricted Common Shares granted in Fiscal 2017 for Named Executive Officers |
Incorporated herein by reference to Exhibit 10.71 to the Annual Report on Form 10-K of Worthington Industries, Inc. for the fiscal year ended May 31, 2016 (SEC File No. 1-8399) | ||
| 10.3 | Second Amendment to the Worthington Industries, Inc. Amended and Restated 2006 Equity Incentive Plan for Non-Employee Directors |
Incorporated herein by reference to Exhibit 10.1 to the Current Report on Form 8-K of Worthington Industries, Inc. dated October 3, 2016 and filed with the SEC on the same day (SEC File No. 1-8399) | ||
| 31.1 | Rule 13a - 14(a) / 15d - 14(a) Certifications (Principal Executive Officer) |
Filed herewith | ||
| 31.2 | Rule 13a - 14(a) / 15d - 14(a) Certifications (Principal Financial Officer) |
Filed herewith | ||
| 32.1 | Certifications of Principal Executive Officer Pursuant to 18 U.S.C. Section 1350, as Adopted Pursuant to Section 906 of the Sarbanes-Oxley Act of 2002 |
Furnished herewith | ||
| 32.2 | Certifications of Principal Financial Officer Pursuant to 18 U.S.C. Section 1350, as Adopted Pursuant to Section 906 of the Sarbanes-Oxley Act of 2002 |
Furnished herewith | ||
| 101.INS | XBRL Instance Document |
Submitted electronically herewith # | ||
| 101.SCH | XBRL Taxonomy Extension Schema Document |
Submitted electronically herewith # | ||
| 101.PRE | XBRL Taxonomy Extension Presentation Linkbase Document |
Submitted electronically herewith # | ||
| 101.LAB | XBRL Taxonomy Extension Label Linkbase Document |
Submitted electronically herewith # | ||
| 101.CAL | XBRL Taxonomy Extension Calculation Linkbase Document |
Submitted electronically herewith # | ||
| 101.DEF | XBRL Taxonomy Extension Definition Linkbase Document |
Submitted electronically herewith # | ||
36
Table of Contents
| # | Attached as Exhibit 101 to this Quarterly Report on Form 10-Q of Worthington Industries, Inc. are the following documents formatted in XBRL (Extensible Business Reporting Language): |
| (i) | Consolidated Balance Sheets at August 31, 2016 and May 31, 2016; |
| (ii) | Consolidated Statements of Earnings for the three months ended August 31, 2016 and 2015; |
| (iii) | Consolidated Statements of Comprehensive Income for the three months ended August 31, 2016 and 2015; |
| (iv) | Consolidated Statements of Cash Flows for the three months ended August 31, 2016 and 2015; and |
| (v) | Notes to Consolidated Financial Statements. |
37