Attached files
| file | filename |
|---|---|
| EX-32.1 - SECTION 906 CEO CERTIFICATION - StoneX Group Inc. | intlexhibit3213312016.htm |
| EX-32.2 - SECTION 906 CFO CERTIFICATION - StoneX Group Inc. | intlexhibit3223312016.htm |
| EX-31.1 - SECTION 302 CEO CERTIFICATION - StoneX Group Inc. | intlexhibit3113312016.htm |
| EX-31.2 - SECTION 302 CFO CERTIFICATION - StoneX Group Inc. | intlexhibit3123312016.htm |
UNITED STATES
SECURITIES AND EXCHANGE COMMISSION
Washington, D.C. 20549
____________________
FORM 10-Q
____________________
(Mark One)
x | QUARTERLY REPORT PURSUANT TO SECTION 13 OR 15(d) OF THE SECURITIES EXCHANGE ACT OF 1934 |
OR
o | TRANSITION REPORT PURSUANT TO SECTION 13 OR 15(d) OF THE SECURITIES EXCHANGE ACT OF 1934 |
For the Transition Period From to
Commission File Number 000-23554
____________________
INTL FCStone Inc.
(Exact name of registrant as specified in its charter)
____________________
Delaware | 59-2921318 | |
(State or other jurisdiction of incorporation or organization) | (I.R.S. Employer Identification No.) | |
New York, NY 10017
(Address of principal executive offices) (Zip Code)
(212) 485-3500
(Registrant’s telephone number, including area code)
____________________
Indicate by check mark whether the registrant (1) has filed all reports required to be filed by Section 13 or 15(d) of the Securities Exchange Act of 1934 during the preceding 12 months (or for such shorter period that the registrant was required to file such reports), and (2) has been subject to such filing requirements for the past 90 days. Yes x No o
Indicate by check mark whether the registrant has submitted electronically and posted on its corporate Web site, if any, every Interactive Data File required to be submitted and posted pursuant to Rule 405 of Regulation S-T (§232.405 of this chapter) during the preceding 12 months (or for such shorter period that the registrant was required to submit and post such files). Yes x No o
Indicate by check mark whether the registrant is a large accelerated filer, an accelerated filer, a non-accelerated filer, or smaller reporting company. See the definitions of “large accelerated filer,” “accelerated filer” and “smaller reporting company” in Rule 12b-2 of the Exchange Act.
Large accelerated filer | o | Accelerated filer | x | |
Non-accelerated filer (Do not check if a smaller reporting company) | o | Smaller reporting company | o | |
Indicate by check mark whether the registrant is a shell company (as defined in Rule 12b-2 of the Exchange Act). Yes o No x
As of May 2, 2016, there were 18,573,816 shares of the registrant’s common stock outstanding.
INTL FCStone Inc.
Quarterly Report on Form 10-Q for the Quarterly Period Ended March 31, 2016
Table Of Contents
Page | ||
Part I. FINANCIAL INFORMATION | ||
Item 1. | ||
Item 2. | ||
Item 3. | ||
Item 4. | ||
Part II. OTHER INFORMATION | ||
Item 1. | ||
Item 1A. | ||
Item 2. | ||
Item 6. | ||
PART I. FINANCIAL INFORMATION
Item 1. Financial Statements
INTL FCStone Inc.
Condensed Consolidated Balance Sheets
(in millions, except par value and share amounts) | March 31, 2016 | September 30, 2015 | |||||
(Unaudited) | |||||||
ASSETS | |||||||
Cash and cash equivalents | $ | 203.2 | $ | 268.1 | |||
Cash, securities and other assets segregated under federal and other regulations (including $570.9 and $515.5 at fair value at March 31, 2016 and September 30, 2015, respectively) | 931.5 | 756.9 | |||||
Securities purchased under agreements to resell | 701.4 | 325.3 | |||||
Deposits with and receivables from: | |||||||
Exchange-clearing organizations (including $895.7 and $1,009.4 at fair value at March 31, 2016 and September 30, 2015, respectively) | 1,423.8 | 1,533.5 | |||||
Broker-dealers, clearing organizations and counterparties (including $(16.0) and $(52.9) at fair value at March 31, 2016 and September 30, 2015, respectively) | 167.3 | 277.6 | |||||
Receivables from customers, net | 101.7 | 217.3 | |||||
Notes receivable, net | 65.7 | 78.4 | |||||
Income taxes receivable | 9.1 | 10.6 | |||||
Financial instruments owned, at fair value (includes securities pledged as collateral that can be sold or repledged of $50.8 and $170.7 at March 31, 2016 and September 30, 2015, respectively) | 1,864.9 | 1,421.9 | |||||
Physical commodities inventory (including precious metals of $2.8 and $15.2 at fair value at March 31, 2016 and September 30, 2015, respectively) | 31.2 | 32.8 | |||||
Deferred income taxes, net | 29.9 | 28.2 | |||||
Property and equipment, net | 24.2 | 19.7 | |||||
Goodwill and intangible assets, net | 57.4 | 58.1 | |||||
Other assets | 46.6 | 41.6 | |||||
Total assets | $ | 5,657.9 | $ | 5,070.0 | |||
LIABILITIES AND STOCKHOLDERS' EQUITY | |||||||
Liabilities: | |||||||
Accounts payable and other accrued liabilities (including $1.5 and $3.3 at fair value at March 31, 2016 and September 30, 2015, respectively) | $ | 113.4 | $ | 144.8 | |||
Payables to: | |||||||
Customers | 2,458.0 | 2,593.5 | |||||
Broker-dealers, clearing organizations and counterparties (including $1.9 and $1.6 at fair value at March 31, 2016 and September 30, 2015, respectively) | 325.2 | 262.9 | |||||
Lenders under loans | 151.5 | 41.6 | |||||
Senior unsecured notes | 45.5 | 45.5 | |||||
Income taxes payable | 6.5 | 9.0 | |||||
Payables under repurchase agreements | 1,115.7 | 1,007.3 | |||||
Financial instruments sold, not yet purchased, at fair value | 1,033.9 | 568.3 | |||||
Total liabilities | 5,249.7 | 4,672.9 | |||||
Commitments and contingencies (Note 11) | |||||||
Stockholders' Equity: | |||||||
Preferred stock, $0.01 par value. Authorized 1,000,000 shares; no shares issued or outstanding | — | — | |||||
Common stock, $0.01 par value. Authorized 30,000,000 shares; 20,460,788 issued and 18,688,729 outstanding at March 31, 2016 and 20,184,556 issued and 18,812,803 outstanding at September 30, 2015 | 0.2 | 0.2 | |||||
Common stock in treasury, at cost - 1,772,059 and 1,371,753 shares at March 31, 2016 and September 30, 2015, respectively | (37.2 | ) | (26.8 | ) | |||
Additional paid-in capital | 245.7 | 240.8 | |||||
Retained earnings | 223.7 | 200.4 | |||||
Accumulated other comprehensive loss, net | (24.2 | ) | (17.5 | ) | |||
Total stockholders' equity | 408.2 | 397.1 | |||||
Total liabilities and stockholders' equity | $ | 5,657.9 | $ | 5,070.0 | |||
See accompanying notes to condensed consolidated financial statements.
1
INTL FCStone Inc.
Condensed Consolidated Income Statements
(Unaudited)
Three Months Ended March 31, | Six Months Ended March 31, | ||||||||||||||
(in millions, except share and per share amounts) | 2016 | 2015 | 2016 | 2015 | |||||||||||
Revenues: | |||||||||||||||
Sales of physical commodities | $ | 3,548.0 | $ | 14,291.6 | $ | 6,800.6 | $ | 27,785.9 | |||||||
Trading gains, net | 80.7 | 84.8 | 160.4 | 155.1 | |||||||||||
Commission and clearing fees | 52.1 | 47.2 | 101.2 | 96.7 | |||||||||||
Consulting and management fees | 9.6 | 9.3 | 19.3 | 19.7 | |||||||||||
Interest income | 18.5 | 9.0 | 27.2 | 12.1 | |||||||||||
Other income | — | 0.1 | 0.1 | 0.2 | |||||||||||
Total revenues | 3,708.9 | 14,442.0 | 7,108.8 | 28,069.7 | |||||||||||
Cost of sales of physical commodities | 3,542.8 | 14,285.5 | 6,791.4 | 27,775.7 | |||||||||||
Operating revenues | 166.1 | 156.5 | 317.4 | 294.0 | |||||||||||
Transaction-based clearing expenses | 32.9 | 31.8 | 62.7 | 61.2 | |||||||||||
Introducing broker commissions | 13.2 | 12.3 | 26.0 | 24.5 | |||||||||||
Interest expense | 7.1 | 4.5 | 13.1 | 7.2 | |||||||||||
Net operating revenues | 112.9 | 107.9 | 215.6 | 201.1 | |||||||||||
Compensation and other expenses: | |||||||||||||||
Compensation and benefits | 65.2 | 63.1 | 128.3 | 119.5 | |||||||||||
Communication and data services | 7.3 | 7.2 | 15.2 | 13.9 | |||||||||||
Occupancy and equipment rental | 3.2 | 3.8 | 6.5 | 6.9 | |||||||||||
Professional fees | 2.7 | 3.1 | 5.6 | 6.4 | |||||||||||
Travel and business development | 2.3 | 2.5 | 5.5 | 5.3 | |||||||||||
Depreciation and amortization | 2.2 | 1.8 | 4.1 | 3.7 | |||||||||||
Bad debts | 2.6 | 2.8 | 4.6 | 2.8 | |||||||||||
Other | 7.4 | 5.5 | 13.7 | 10.9 | |||||||||||
Total compensation and other expenses | 92.9 | 89.8 | 183.5 | 169.4 | |||||||||||
Income before tax | 20.0 | 18.1 | 32.1 | 31.7 | |||||||||||
Income tax expense | 5.5 | 5.1 | 8.8 | 9.3 | |||||||||||
Net income | $ | 14.5 | $ | 13.0 | $ | 23.3 | $ | 22.4 | |||||||
Earnings per share: | |||||||||||||||
Basic | $ | 0.77 | $ | 0.68 | $ | 1.24 | $ | 1.18 | |||||||
Diluted | $ | 0.76 | $ | 0.67 | $ | 1.22 | $ | 1.16 | |||||||
Weighted-average number of common shares outstanding: | |||||||||||||||
Basic | 18,592,643 | 18,599,011 | 18,621,337 | 18,546,377 | |||||||||||
Diluted | 18,755,450 | 18,957,780 | 18,821,822 | 18,743,033 | |||||||||||
See accompanying notes to condensed consolidated financial statements.
2
INTL FCStone Inc.
Condensed Consolidated Statements of Comprehensive Income
(Unaudited)
Three Months Ended March 31, | Six Months Ended March 31, | ||||||||||||||
(in millions) | 2016 | 2015 | 2016 | 2015 | |||||||||||
Net income | $ | 14.5 | $ | 13.0 | $ | 23.3 | $ | 22.4 | |||||||
Other comprehensive (loss) income, net of tax: | |||||||||||||||
Foreign currency translation adjustment | (1.3 | ) | (0.8 | ) | (6.9 | ) | (1.1 | ) | |||||||
Pension liabilities adjustment | — | — | (0.2 | ) | — | ||||||||||
Net unrealized gain on available-for-sale securities | — | 2.3 | — | 3.4 | |||||||||||
Reclassification of adjustments included in net income: | |||||||||||||||
Periodic pension costs (included in compensation and benefits) | — | — | 0.4 | — | |||||||||||
Reclassification adjustment for gains included in net income: | — | — | 0.4 | — | |||||||||||
Other comprehensive (loss) income | (1.3 | ) | 1.5 | (6.7 | ) | 2.3 | |||||||||
Comprehensive income | $ | 13.2 | $ | 14.5 | $ | 16.6 | $ | 24.7 | |||||||
See accompanying notes to condensed consolidated financial statements.
3
INTL FCStone Inc.
Condensed Consolidated Cash Flows Statements
(Unaudited)
Six Months Ended March 31, | |||||||
(in millions) | 2016 | 2015 | |||||
Cash flows from operating activities: | |||||||
Net income | $ | 23.3 | $ | 22.4 | |||
Adjustments to reconcile net income to net cash (used in) provided by operating activities: | |||||||
Depreciation and amortization | 3.9 | 3.7 | |||||
Bad debts | 4.6 | 2.8 | |||||
Deferred income taxes | (1.8 | ) | 2.3 | ||||
Amortization of debt issuance costs and debt discount | 0.5 | 0.5 | |||||
Amortization of share-based compensation | 2.5 | 1.8 | |||||
Loss on sale of property and equipment | 0.3 | 0.4 | |||||
Changes in operating assets and liabilities, net: | |||||||
Cash, securities and other assets segregated under federal and other regulations | (174.1 | ) | (244.8 | ) | |||
Securities purchased under agreements to resell | (377.0 | ) | 3.6 | ||||
Deposits with and receivables from exchange-clearing organizations | 111.7 | 313.0 | |||||
Deposits with and receivables from broker-dealers, clearing organizations, and counterparties | 128.5 | (66.5 | ) | ||||
Receivables from customers, net | 108.8 | (18.1 | ) | ||||
Notes receivable, net | 12.7 | (11.9 | ) | ||||
Income taxes receivable | 0.5 | (0.3 | ) | ||||
Financial instruments owned, at fair value | (454.5 | ) | (356.6 | ) | |||
Physical commodities inventory | 1.6 | (19.6 | ) | ||||
Other assets | (4.8 | ) | (15.7 | ) | |||
Accounts payable and other accrued liabilities | (25.6 | ) | (9.6 | ) | |||
Payables to customers | (144.6 | ) | (36.5 | ) | |||
Payables to broker-dealers, clearing organizations and counterparties | 62.3 | 123.8 | |||||
Income taxes payable | (0.1 | ) | (1.0 | ) | |||
Payables under repurchase agreements | 108.3 | 87.6 | |||||
Financial instruments sold, not yet purchased, at fair value | 465.7 | 222.5 | |||||
Net cash (used in) provided by operating activities | (147.3 | ) | 3.8 | ||||
Cash flows from investing activities: | |||||||
Cash paid for acquisitions, net | — | (7.8 | ) | ||||
Purchase of property and equipment | (8.0 | ) | (1.9 | ) | |||
Net cash used in investing activities | (8.0 | ) | (9.7 | ) | |||
Cash flows from financing activities: | |||||||
Net change in payable to lenders under loans | 110.3 | 23.3 | |||||
Payments of note payable | (0.4 | ) | — | ||||
Deferred payments on acquisitions | (2.7 | ) | (2.2 | ) | |||
Debt issuance costs | (1.9 | ) | (0.1 | ) | |||
Exercise of stock options | 1.7 | 1.9 | |||||
Share repurchases | (10.3 | ) | (4.7 | ) | |||
Excess income tax benefit on stock options and awards | 0.7 | 0.4 | |||||
Net cash provided by financing activities | 97.4 | 18.6 | |||||
Effect of exchange rates on cash and cash equivalents | (7.0 | ) | (0.5 | ) | |||
Net (decrease) increase in cash and cash equivalents | (64.9 | ) | 12.2 | ||||
Cash and cash equivalents at beginning of period | 268.1 | 231.3 | |||||
Cash and cash equivalents at end of period | $ | 203.2 | $ | 243.5 | |||
Supplemental disclosure of cash flow information: | |||||||
Cash paid for interest | $ | 11.8 | $ | 5.0 | |||
Income taxes paid, net of cash refunds | $ | 9.2 | $ | 7.6 | |||
Supplemental disclosure of non-cash investing and financing activities: | |||||||
Identified intangible assets and goodwill on acquisitions | $ | — | $ | 3.0 | |||
Additional consideration payable related to acquisitions, net | $ | 0.3 | $ | 1.7 | |||
Payable related to repurchase of stock | $ | 0.1 | $ | — | |||
Acquisition of business: | |||||||
Assets acquired | $ | — | $ | 1,011.4 | |||
Liabilities assumed | — | (995.1 | ) | ||||
Total net assets acquired | $ | — | $ | 16.3 | |||
Deferred consideration payable related to acquisitions | $ | — | $ | 5.0 | |||
Escrow deposits related to acquisitions | $ | — | $ | 5.0 | |||
See accompanying notes to condensed consolidated financial statements.
4
INTL FCStone Inc.
Condensed Consolidated Statement of Stockholders’ Equity
(Unaudited)
(in millions) | Common Stock | Treasury Stock | Additional Paid-in Capital | Retained Earnings | Accumulated Other Comprehensive Loss | Total | |||||||||||||||||
Balances as of September 30, 2015 | $ | 0.2 | $ | (26.8 | ) | $ | 240.8 | $ | 200.4 | $ | (17.5 | ) | $ | 397.1 | |||||||||
Net income | 23.3 | 23.3 | |||||||||||||||||||||
Other comprehensive loss | (6.7 | ) | (6.7 | ) | |||||||||||||||||||
Exercise of stock options | 2.4 | 2.4 | |||||||||||||||||||||
Share-based compensation | 2.5 | 2.5 | |||||||||||||||||||||
Repurchase of stock | (10.4 | ) | — | (10.4 | ) | ||||||||||||||||||
Balances as of March 31, 2016 | $ | 0.2 | $ | (37.2 | ) | $ | 245.7 | $ | 223.7 | $ | (24.2 | ) | $ | 408.2 | |||||||||
See accompanying notes to condensed consolidated financial statements.
5
INTL FCStone Inc.
Notes to Condensed Consolidated Financial Statements
(Unaudited)
Note 1 – Basis of Presentation and Consolidation and Recently Issued Accounting Standards
INTL FCStone Inc., a Delaware corporation, and its consolidated subsidiaries (collectively “INTL” or “the Company”), form a diversified, global financial services organization providing financial products and advisory and execution services to help clients access market liquidity, maximize profits and manage risk. The Company’s services include comprehensive risk management advisory services for commercial customers; execution of listed futures and options on futures contracts on all major commodity exchanges; structured over-the-counter (“OTC”) products in a wide range of commodities; physical trading and hedging of precious metals and select other commodities; trading of more than 150 foreign currencies; market-making in international equities; fixed income; debt origination and asset management.
The Company provides these services to a diverse group of more than 20,000 accounts, representing approximately 11,000 consolidated clients located throughout the world, including producers, processors and end-users of nearly all widely-traded physical commodities to manage their risks and enhance margins; to commercial counterparties who are end-users of the firm’s products and services; to governmental and non-governmental organizations; and to commercial banks, brokers, institutional investors and major investment banks.
Basis of Presentation and Consolidation
The accompanying condensed consolidated balance sheet as of September 30, 2015, which has been derived from audited financial statements, and the unaudited interim condensed consolidated financial statements have been prepared pursuant to the rules and regulations of the Securities and Exchange Commission (“SEC”). Certain information and note disclosures normally included in annual financial statements prepared in accordance with accounting principles generally accepted in the United States of America (“U.S. GAAP”) have been condensed or omitted pursuant to those rules and regulations. The Company believes that the disclosures made are adequate to make the information presented not misleading. In the opinion of management, all adjustments (consisting of normal recurring accruals) considered necessary for a fair presentation of the condensed consolidated financial statements for the interim periods presented have been reflected as required by Rule 10-01 of Regulation S-X.
Operating results for interim periods are not necessarily indicative of the results that may be expected for the full year. It is suggested that these interim condensed consolidated financial statements should be read in conjunction with the Company’s audited consolidated financial statements and related notes contained in the Company’s Form 10-K for the fiscal year ended September 30, 2015 filed with the SEC.
These condensed consolidated financial statements include the accounts of INTL FCStone Inc. and all other entities in which the Company has a controlling financial interest. All material intercompany transactions and balances have been eliminated in consolidation.
The Company’s fiscal year end is September 30, and the fiscal quarters end on December 31, March 31, June 30 and September 30. Unless otherwise stated, all dates refer to fiscal years and fiscal interim periods.
The preparation of condensed consolidated financial statements in conformity with U.S. GAAP requires management to make estimates and assumptions that affect the reported amounts of assets and liabilities, disclosure of contingent liabilities as of the date of the financial statements and the reported amounts of revenue and expenses during the reporting period. The most significant of these estimates and assumptions relate to fair value measurement for financial instruments and investments, revenue recognition, the provision for potential losses from bad debts, valuation of inventories, valuation of goodwill and intangible assets, self-insurance liabilities, incomes taxes and contingencies. Although these and other estimates and assumptions are based on the best available information, actual results could be materially different from these estimates.
In the condensed consolidated income statements, the total revenues reported combine gross revenues for the physical commodities business and net revenues for all other businesses. The subtotal ‘operating revenues’ in the condensed consolidated income statements is calculated by deducting physical commodities cost of sales from total revenues. The subtotal ‘net operating revenues’ in the condensed consolidated income statements is calculated as operating revenues less transaction-based clearing expenses, introducing broker commissions and interest expense. Transaction-based clearing expenses represent variable expenses paid to executing brokers, exchanges, clearing organizations and banks in relation to our transactional volumes. Introducing broker commissions include commission paid to non-employee third parties that have introduced customers to the Company. Net operating revenues represent revenues available to pay variable compensation to risk management consultants and traders and direct non-variable expenses, as well as variable and non-variable expenses of operational and administrative employees.
6
Change in Precious Metals Accounting
The Company engages in trading activities in a variety of physical commodities, including actively trading precious metals whereby the Company provides a full range of trading and hedging capabilities, including OTC products, to select producers, consumers, and investors. In the Company’s precious metals trading activities, it acts as a principal, committing its own capital to buy and sell precious metals on a spot and forward basis.
On April 10, 2015 (the “transfer date”), the Company transitioned the portion of its precious metals business conducted through its unregulated domestic subsidiary, INTL Commodities Inc., to its United Kingdom based broker-dealer subsidiary, INTL FCStone Ltd. INTL FCStone Ltd is regulated by the Financial Conduct Authority (“FCA”), the regulator of the financial services industry in the United Kingdom.
In anticipation of the transfer of the precious metals business, INTL Commodities Inc. liquidated all of its precious metals inventory as of the transfer date. Subsequent to the transfer, precious metals inventory held by INTL FCStone Ltd. is measured at fair value, with changes in fair value included as a component of ‘trading gains, net’ on the condensed consolidated income statement, in accordance with U.S. GAAP accounting requirements for broker-dealers. Precious metals inventory held by subsidiaries that are not broker-dealers continues to be valued at the lower of cost or market value.
Prior to the transfer, INTL Commodities Inc. precious metals sales and costs of sales were recorded on a gross basis in accordance with the Revenue Recognition Topic of the Accounting Standards Codification (“ASC”). Subsequent to the transfer, INTL FCStone Ltd. precious metals sales and cost of sales are presented on a net basis and included as a component of ‘trading gains, net’ on the condensed consolidated income statements, in accordance with U.S GAAP accounting requirements for broker-dealers. Precious metals sales and cost of sales for subsidiaries that are not broker-dealers continue to be recorded on a gross basis.
The change had no effect on the Company’s operating revenues, income before tax, or net income. Management has historically assessed the performance of the physical commodities businesses on an operating revenues basis, and continues to do so.
Recent Accounting Pronouncements
In May 2014, the Financial Accounting Standards Board (“FASB”) issued Accounting Standards Update (ASU) 2014-09, “Revenue from Contracts with Customers (Topic 606).” ASU 2014-09 completes the joint effort by the FASB and International Accounting Standards Board (IASB) to improve financial reporting by creating common revenue recognition guidance for GAAP and International Financial Reporting Standards (IFRS). In March 2016, the FASB issued ASU 2016-08, “Revenue from Contracts with Customers (Topic 606): Principal versus Agent Considerations (Reporting Revenue Gross versus Net).” ASU 2016-08 clarifies the implementation guidance on principal versus agent considerations. In April 2016, the FASB issued ASU 2016-10, “Revenue from Contracts with Customers (Topic 606): Identifying Performance Obligations and Licensing.” ASU 2016-10 clarifies the implementation guidance on identifying performance obligations. These ASUs apply to all companies that enter into contracts with customers to transfer goods or services. These ASUs are effective for public entities for interim and annual reporting periods beginning after December 15, 2017. Early adoption is permitted only as of annual reporting periods beginning after December 15, 2016, including interim periods within that reporting period. The Company expects to adopt this guidance starting with the first quarter of fiscal year 2019. Entities have the choice to apply these ASUs either retrospectively to each reporting period presented or by recognizing the cumulative effect of applying these standards at the date of initial application and not adjusting comparative information. The Company is currently evaluating the requirements of these standards and has not yet determined the impact on our condensed consolidated financial statements.
In March 2016, the FASB issued ASU 2016-09, “Compensation – Stock Compensation (Topic 718): Improvements to Employee Share-Based Payment Accounting.” ASU 2016-09 simplifies the accounting for share-based payment award transactions including: income tax consequences, classification of awards as either equity or liabilities and classification on the statement of cash flows. ASU 2016-09 is effective for fiscal years beginning after December 15, 2016, including interim periods within those fiscal years. Early adoption is permitted. The Company expects to adopt this guidance starting with the first quarter of fiscal year 2018. The Company is currently evaluating the requirements of ASU 2016-09 and has not yet determined the impact on our condensed consolidated financial statements.
In February 2016, the FASB issued ASU No. 2016-02, Leases (Topic 842), which supersedes ASC 840, Leases. This ASU is based on the principle that entities should recognize assets and liabilities arising from leases. The ASU does not significantly change the lessees’ recognition, measurement and presentation of expenses and cash flows from the previous accounting standard. The ASU’s primary change is the requirement for entities to recognize a lease liability for payments and a right of use asset representing the right to use the leased asset during the term on operating lease arrangements. Lessees are permitted to make an accounting policy election to not recognize the asset and liability for leases with a term of twelve months or less. Lessors’ accounting under the ASC is largely unchanged from the previous accounting standard. In addition, the ASU expands the disclosure requirements of lease arrangements. Lessees and lessors will use a modified retrospective transition approach,
7
which includes a number of practical expedients. This guidance is effective for fiscal years beginning after December 15, 2018, including interim periods within those fiscal years. The Company expects to adopt this guidance starting with the first quarter of fiscal year 2020. The Company has not determined the potential effects on the condensed consolidated financial statements.
In January 2016, the FASB issued ASU No. 2016-01, Financial Instruments--Overall (Subtopic 825-10): Recognition and Measurement of Financial Assets and Financial Liabilities. ASU No. 2016-01 addresses the recognition, measurement, presentation and disclosure of financial assets and liabilities. The guidance primarily affects the accounting for equity investments, financial liabilities under the fair value option and the presentation and disclosure requirements for financial instruments. In addition, the guidance clarifies the valuation allowance assessment when recognizing deferred tax assets resulting from unrealized losses on available-for-sale debt securities. This guidance is effective for the Company in the first quarter of fiscal 2019, and early adoption is not permitted, with certain exceptions. The amendments are required to be applied by means of a cumulative-effect adjustment on the balance sheet as of the beginning of the fiscal year of adoption. The Company is currently assessing the impact, if any, the guidance may have upon adoption.
In April 2015, the FASB issued ASU No. 2015-03, Interest – Imputation of Interest (Subtopic 835-30). ASU 2015-03 requires that debt issuance costs related to a recognized debt liability be presented in the balance sheet as a direct deduction from the carrying amount of that debt liability. In June 2015, the FASB issued ASU 2015-15 as an amendment to this guidance to address the absence of authoritative guidance for debt issuance costs related to line-of-credit arrangements. The SEC staff stated that they would not object to an entity deferring and presenting debt issuance costs as an asset and subsequently amortizing the deferred debt issuance costs ratably over the term of the line-of-credit arrangement, regardless of whether there are any outstanding borrowings on the line-of-credit arrangement. The ASU is effective for public entities for annual periods beginning after December 15, 2015, and interim periods within those annual reporting periods. Early adoption is permitted for financial statements that have not been previously issued. The guidance will be applied on a retrospective basis. The Company expects to adopt this guidance starting with the first quarter of fiscal year 2017. The adoption of this standard is not expected to have a material impact on the condensed consolidated financial statements.
Note 2 – Earnings per Share
The Company presents basic and diluted earnings per share (“EPS”) using the two-class method which requires all outstanding unvested share-based payment awards that contain rights to non-forfeitable dividends and therefore participate in undistributed earnings with common stockholders be included in computing earnings per share. Under the two-class method, net earnings are reduced by the amount of dividends declared in the period for each class of common stock and participating security. The remaining undistributed earnings are then allocated to common stock and participating securities, based on their respective rights to receive dividends. Restricted stock awards granted to certain employees and directors contain non-forfeitable rights to dividends at the same rate as common stock, and are considered participating securities. Basic EPS has been computed by dividing net income by the weighted-average number of common shares outstanding. The following is a reconciliation of the numerator and denominator of the diluted net income per share computations for the periods presented below.
Three Months Ended March 31, | Six Months Ended March 31, | ||||||||||||||
(in millions, except share amounts) | 2016 | 2015 | 2016 | 2015 | |||||||||||
Numerator: | |||||||||||||||
Net income | $ | 14.5 | $ | 13.0 | $ | 23.3 | $ | 22.4 | |||||||
Less: Allocation to participating securities | (0.3 | ) | (0.3 | ) | (0.4 | ) | (0.5 | ) | |||||||
Net income allocated to common stockholders | $ | 14.2 | $ | 12.7 | $ | 22.9 | $ | 21.9 | |||||||
Diluted net income | $ | 14.5 | $ | 13.0 | $ | 23.3 | $ | 22.4 | |||||||
Less: Allocation to participating securities | (0.3 | ) | (0.3 | ) | (0.4 | ) | (0.5 | ) | |||||||
Diluted net income allocated to common stockholders | $ | 14.2 | $ | 12.7 | $ | 22.9 | $ | 21.9 | |||||||
Denominator: | |||||||||||||||
Weighted average number of: | |||||||||||||||
Common shares outstanding | 18,592,643 | 18,599,011 | 18,621,337 | 18,546,377 | |||||||||||
Dilutive potential common shares outstanding: | |||||||||||||||
Share-based awards | 162,807 | 358,769 | 200,485 | 196,656 | |||||||||||
Diluted weighted-average shares | 18,755,450 | 18,957,780 | 18,821,822 | 18,743,033 | |||||||||||
The dilutive effect of share-based awards is reflected in diluted net income per share by application of the treasury stock method, which includes consideration of unamortized share-based compensation expense required under the Compensation – Stock Compensation Topic of the ASC.
Options to purchase 986,339 and 999,125 shares of common stock for the three months ended March 31, 2016 and 2015, respectively, and options to purchase 900,665 and 1,275,944 shares of common stock for the six months ended March 31, 2016 and 2015, respectively, were excluded from the calculation of diluted earnings per share as they would have been anti-dilutive.
8
Note 3 – Assets and Liabilities, at Fair Value
The Company’s assets and liabilities reported at fair value are included in the following captions on the condensed consolidated balance sheets:
• | Cash and cash equivalents |
• | Cash, securities and other assets segregated under federal and other regulations |
• | Deposits with and receivables from exchange-clearing organizations, broker-dealers, clearing organizations and counterparties |
• | Financial instruments owned and sold, not yet purchased |
• | Physical commodities inventory |
• | Accounts payable and other accrued liabilities |
• | Payables to broker-dealers, clearing organizations and counterparties |
Fair Value Hierarchy
The majority of financial assets and liabilities on the condensed consolidated balance sheets are reported at fair value. Cash is reported at the balance held at financial institutions. Cash equivalents includes money market funds, which are valued at period-end at the net asset value provided by the fund’s administrator, and certificates of deposit, which are stated at cost plus accrued interest, which approximates fair value. Cash, securities and other assets segregated under federal and other regulations include the value of cash collateral as well as the value of other pledged investments, primarily U.S. Treasury bills and obligations issued by government sponsored entities and commodities warehouse receipts. Deposits with and receivables from exchange-clearing organizations, broker-dealers, clearing organizations and counterparties and payables to broker-dealers, clearing organizations and counterparties include the value of cash collateral as well as the value of money market funds and other pledged investments, primarily U.S. Treasury bills and obligations issued by government sponsored entities and mortgage-backed and asset-backed securities. These balances also include the fair value of exchange-traded futures and options on futures and exchange-cleared swaps and options determined by prices on the applicable exchange. Financial instruments owned and sold, not yet purchased include the value of U.S. and foreign government obligations, corporate debt securities, derivative financial instruments, exchange stock, commodities warehouse receipts and leases, mutual funds and investments in managed funds. The fair value of exchange common stock is determined by quoted market prices. Physical commodities inventory includes precious metals that are a part of the trading activities of the regulated broker-dealer subsidiary and is recorded at fair value using spot prices. The carrying value of receivables from customers, net and notes receivable, net approximates fair value, given their short duration. Payables to lenders under loans carry variable rates of interest and thus approximate fair value. The fair value of the Company’s senior unsecured notes is estimated to be $46.9 million (carrying value of $45.5 million) as of March 31, 2016, based on the transaction prices at public exchanges for this issuance.
Receivables from broker-dealers, clearing organizations and counterparties include amounts receivable for securities sold but not yet delivered by the Company on settlement date (“fails-to-deliver”) and net receivables arising from unsettled trades. Payables to broker-dealers, clearing organizations and counterparties primarily include amounts payable for securities purchased, but not yet received by the Company on settlement date (“fails-to-receive”), net payables arising from unsettled trades and bonds loaned transactions. Due to their short-term nature, receivables from and payables to broker-dealers, clearing organizations and counterparties approximate fair value.
The fair value estimates presented in the condensed consolidated financial statements are based on pertinent information available to management as of March 31, 2016 and September 30, 2015. Although management is not aware of any factors that would significantly affect the estimated fair value amounts, such amounts have not been comprehensively revalued for purposes of these condensed consolidated financial statements since that date and current estimates of fair value may differ significantly from the amounts presented in the condensed consolidated financial statements.
Cash equivalents, securities, commodities warehouse receipts, derivative financial instruments, commodities leases, exchange common stock and contingent liabilities are carried at fair value, on a recurring basis, and are classified and disclosed into three levels in the fair value hierarchy. Except as disclosed in Note 6, the Company did not have any fair value adjustments for assets or liabilities measured at fair value on a non-recurring basis during the six months ended March 31, 2016.
The three levels of the fair value hierarchy under the Fair Value Measurement Topic of the ASC are:
Level 1 - Unadjusted quoted prices in active markets that are accessible at the measurement date for identical, unrestricted assets or liabilities;
Level 2 - Quoted prices for identical or similar assets or liabilities in markets that are less active, that is, markets in which there are few transactions for the asset or liability that are observable for substantially the full term; and
Level 3 - Prices or valuation techniques that require inputs that are both significant to the fair value measurement and unobservable (i.e., supported by little or no market activity).
9
The following tables set forth the Company’s financial and nonfinancial assets and liabilities accounted for at fair value, on a recurring basis, as of March 31, 2016 by level in the fair value hierarchy. There were no assets or liabilities that were measured at fair value on a nonrecurring basis as of March 31, 2016.
March 31, 2016 | |||||||||||||||||||
(in millions) | Level 1 | Level 2 | Level 3 | Netting and Collateral (1) | Total | ||||||||||||||
Assets: | |||||||||||||||||||
Unrestricted cash equivalents - certificate of deposits | $ | 1.2 | $ | — | $ | — | $ | — | $ | 1.2 | |||||||||
Commodities warehouse receipts | 18.1 | — | — | — | 18.1 | ||||||||||||||
U.S. government obligations | — | 552.8 | — | — | 552.8 | ||||||||||||||
Securities and other assets segregated under federal and other regulations | 18.1 | 552.8 | — | — | 570.9 | ||||||||||||||
Money market funds | 652.7 | — | — | — | 652.7 | ||||||||||||||
U.S. government obligations | — | 215.2 | — | — | 215.2 | ||||||||||||||
Derivatives | 2,001.7 | — | — | (1,973.9 | ) | 27.8 | |||||||||||||
Deposits with and receivables from exchange-clearing organizations | 2,654.4 | 215.2 | — | (1,973.9 | ) | 895.7 | |||||||||||||
"To be announced" (TBA) and forward settling securities | — | 2.9 | — | (2.1 | ) | 0.8 | |||||||||||||
Derivatives | — | 201.1 | — | (217.9 | ) | (16.8 | ) | ||||||||||||
Deposits with and receivables from broker-dealers, clearing organizations and counterparties | — | 204.0 | — | (220.0 | ) | (16.0 | ) | ||||||||||||
Common and preferred stock and American Depositary Receipts (“ADRs”) | 55.4 | 1.8 | 0.3 | — | 57.5 | ||||||||||||||
Exchangeable foreign ordinary equities and ADRs | 140.6 | 1.9 | — | — | 142.5 | ||||||||||||||
Corporate and municipal bonds | 32.5 | 1.9 | 3.3 | — | 37.7 | ||||||||||||||
U.S. government obligations | — | 643.7 | — | — | 643.7 | ||||||||||||||
Foreign government obligations | — | 10.5 | — | — | 10.5 | ||||||||||||||
Mortgage-backed securities | — | 698.8 | — | — | 698.8 | ||||||||||||||
Derivatives | 213.2 | 1,488.2 | — | (1,475.2 | ) | 226.2 | |||||||||||||
Commodities leases | — | 145.8 | — | (117.3 | ) | 28.5 | |||||||||||||
Commodities warehouse receipts | 6.5 | — | — | — | 6.5 | ||||||||||||||
Exchange firm common stock | 5.8 | — | — | — | 5.8 | ||||||||||||||
Mutual funds and other | 7.2 | — | — | — | 7.2 | ||||||||||||||
Financial instruments owned | 461.2 | 2,992.6 | 3.6 | (1,592.5 | ) | 1,864.9 | |||||||||||||
Physical commodities inventory, net - precious metals | 2.8 | — | — | — | 2.8 | ||||||||||||||
Total assets at fair value | $ | 3,137.7 | $ | 3,964.6 | $ | 3.6 | $ | (3,786.4 | ) | $ | 3,319.5 | ||||||||
Liabilities: | |||||||||||||||||||
Accounts payable and other accrued liabilities - contingent liabilities | $ | — | $ | — | $ | 1.5 | $ | — | $ | 1.5 | |||||||||
TBA and forward settling securities | — | 4.1 | — | (2.1 | ) | 2.0 | |||||||||||||
Derivatives | 2,001.9 | 261.9 | — | (2,263.9 | ) | (0.1 | ) | ||||||||||||
Payable to broker-dealers, clearing organizations and counterparties | 2,001.9 | 266.0 | — | (2,266.0 | ) | 1.9 | |||||||||||||
Common and preferred stock and ADRs | 33.4 | 1.3 | — | — | 34.7 | ||||||||||||||
Exchangeable foreign ordinary equities and ADRs | 138.7 | 4.1 | — | — | 142.8 | ||||||||||||||
Corporate and municipal bonds | 8.6 | — | — | — | 8.6 | ||||||||||||||
U.S. government obligations | — | 608.4 | — | — | 608.4 | ||||||||||||||
Mortgage-backed securities | — | 0.8 | — | — | 0.8 | ||||||||||||||
Derivatives | 216.5 | 1,410.9 | — | (1,447.6 | ) | 179.8 | |||||||||||||
Commodities leases | — | 167.2 | — | (108.4 | ) | 58.8 | |||||||||||||
Financial instruments sold, not yet purchased | 397.2 | 2,192.7 | — | (1,556.0 | ) | 1,033.9 | |||||||||||||
Total liabilities at fair value | $ | 2,399.1 | $ | 2,458.7 | $ | 1.5 | $ | (3,822.0 | ) | $ | 1,037.3 | ||||||||
(1) | Represents cash collateral and the impact of netting across the levels of the fair value hierarchy. Netting among positions classified within the same level is included in that level. |
10
The following table sets forth the Company’s financial and nonfinancial assets and liabilities accounted for at fair value, on a recurring basis, as of September 30, 2015 by level in the fair value hierarchy.
September 30, 2015 | |||||||||||||||||||
(in millions) | Level 1 | Level 2 | Level 3 | Netting and Collateral (1) | Total | ||||||||||||||
Assets: | |||||||||||||||||||
Unrestricted cash equivalents - certificates of deposits | $ | 1.3 | $ | — | $ | — | $ | — | $ | 1.3 | |||||||||
Commodities warehouse receipts | 22.1 | — | — | — | 22.1 | ||||||||||||||
U.S. government obligations | — | 493.4 | — | — | 493.4 | ||||||||||||||
Securities and other assets segregated under federal and other regulations | 22.1 | 493.4 | — | — | 515.5 | ||||||||||||||
Money market funds | 431.8 | — | — | — | 431.8 | ||||||||||||||
U.S. government obligations | — | 501.4 | — | — | 501.4 | ||||||||||||||
Derivatives | 3,615.9 | — | — | (3,539.7 | ) | 76.2 | |||||||||||||
Deposits with and receivables from exchange-clearing organizations | 4,047.7 | 501.4 | — | (3,539.7 | ) | 1,009.4 | |||||||||||||
TBA and forward settling securities | — | 1.2 | — | (1.0 | ) | 0.2 | |||||||||||||
Derivatives | 0.1 | 537.9 | — | (591.1 | ) | (53.1 | ) | ||||||||||||
Deposits with and receivables from broker-dealers, clearing organizations and counterparties | 0.1 | 539.1 | — | (592.1 | ) | (52.9 | ) | ||||||||||||
Common and preferred stock and ADRs | 23.7 | 1.9 | 0.5 | — | 26.1 | ||||||||||||||
Exchangeable foreign ordinary equities and ADRs | 82.9 | 6.6 | — | — | 89.5 | ||||||||||||||
Corporate and municipal bonds | 26.1 | 2.0 | 3.2 | — | 31.3 | ||||||||||||||
U.S. government obligations | — | 513.4 | — | — | 513.4 | ||||||||||||||
Foreign government obligations | — | 12.1 | — | — | 12.1 | ||||||||||||||
Mortgage-backed securities | — | 699.5 | — | — | 699.5 | ||||||||||||||
Derivatives | 278.5 | 1,702.0 | — | (1,949.9 | ) | 30.6 | |||||||||||||
Commodities leases | — | 64.6 | — | (57.0 | ) | 7.6 | |||||||||||||
Commodities warehouse receipts | 2.8 | — | — | — | 2.8 | ||||||||||||||
Exchange firm common stock | 5.6 | — | — | — | 5.6 | ||||||||||||||
Mutual funds and other | 3.4 | — | — | — | 3.4 | ||||||||||||||
Financial instruments owned | 423.0 | 3,002.1 | 3.7 | (2,006.9 | ) | 1,421.9 | |||||||||||||
Physical commodities inventory, net - precious metals | 15.2 | — | — | — | 15.2 | ||||||||||||||
Total assets at fair value | $ | 4,509.4 | $ | 4,536.0 | $ | 3.7 | $ | (6,138.7 | ) | $ | 2,910.4 | ||||||||
Liabilities: | |||||||||||||||||||
Accounts payable and other accrued liabilities - contingent liabilities | $ | — | $ | — | $ | 3.3 | $ | — | $ | 3.3 | |||||||||
TBA and forward settling securities | — | 2.6 | — | (1.0 | ) | 1.6 | |||||||||||||
Derivatives | 3,491.3 | 528.7 | — | (4,020.0 | ) | — | |||||||||||||
Payable to broker-dealers, clearing organizations and counterparties | 3,491.3 | 531.3 | — | (4,021.0 | ) | 1.6 | |||||||||||||
Common and preferred stock and ADRs | 18.0 | 0.6 | — | — | 18.6 | ||||||||||||||
Exchangeable foreign ordinary equities and ADRs | 89.0 | 1.0 | — | — | 90.0 | ||||||||||||||
U.S. government obligations | — | 341.0 | — | — | 341.0 | ||||||||||||||
Foreign government obligations | — | 6.4 | — | — | 6.4 | ||||||||||||||
Mortgage-backed securities | — | 2.8 | — | — | 2.8 | ||||||||||||||
Derivatives | 264.0 | 1,723.5 | — | (1,933.4 | ) | 54.1 | |||||||||||||
Commodities leases | — | 99.1 | — | (43.7 | ) | 55.4 | |||||||||||||
Financial instruments sold, not yet purchased | 371.0 | 2,174.4 | — | (1,977.1 | ) | 568.3 | |||||||||||||
Total liabilities at fair value | $ | 3,862.3 | $ | 2,705.7 | $ | 3.3 | $ | (5,998.1 | ) | $ | 573.2 | ||||||||
(1) | Represents cash collateral and the impact of netting across the levels of the fair value hierarchy. Netting among positions classified within the same level is included in that level. |
Realized and unrealized gains and losses are included in ‘trading gains, net’ and ‘interest income’ in the condensed consolidated income statements.
11
Information on Level 3 Financial Assets and Liabilities
The Company’s financial assets at fair value classified in level 3 of the fair value hierarchy as of March 31, 2016 and September 30, 2015 are summarized below:
(in millions) | March 31, 2016 | September 30, 2015 | |||||
Total level 3 assets | $ | 3.6 | $ | 3.7 | |||
Level 3 assets for which the Company bears economic exposure | $ | 3.6 | $ | 3.7 | |||
Total assets | $ | 5,657.9 | $ | 5,070.0 | |||
Total assets at fair value | $ | 3,319.5 | $ | 2,910.4 | |||
Total level 3 assets as a percentage of total assets | 0.1 | % | 0.1 | % | |||
Level 3 assets for which the Company bears economic exposure as a percentage of total assets | 0.1 | % | 0.1 | % | |||
Total level 3 assets as a percentage of total financial assets at fair value | 0.1 | % | 0.1 | % | |||
The following tables set forth a summary of changes in the fair value of the Company’s level 3 financial assets and liabilities during the three and six months ended March 31, 2016 and 2015, including a summary of unrealized gains (losses) during the respective periods on the Company’s level 3 financial assets and liabilities still held as of March 31, 2016.
Level 3 Financial Assets and Financial Liabilities For the Three Months Ended March 31, 2016 | |||||||||||||||||||||||||||
(in millions) | Balances at beginning of period | Realized gains (losses) during period | Unrealized gains (losses) during period | Purchases/issuances | Settlements | Transfers in or (out) of Level 3 | Balances at end of period | ||||||||||||||||||||
Assets: | |||||||||||||||||||||||||||
Common stock and ADRs | $ | 0.3 | $ | — | $ | — | $ | — | $ | — | $ | — | $ | 0.3 | |||||||||||||
Corporate and municipal bonds | 3.2 | — | 0.1 | — | — | — | 3.3 | ||||||||||||||||||||
$ | 3.5 | $ | — | $ | 0.1 | $ | — | $ | — | $ | — | $ | 3.6 | ||||||||||||||
Liabilities: | |||||||||||||||||||||||||||
Contingent liabilities | $ | 3.5 | $ | — | $ | 0.1 | $ | — | $ | (2.1 | ) | $ | — | $ | 1.5 | ||||||||||||
Level 3 Financial Assets and Financial Liabilities For the Six Months Ended March 31, 2016 | |||||||||||||||||||||||||||
(in millions) | Balances at beginning of period | Realized gains (losses) during period | Unrealized gains (losses) during period | Purchases/issuances | Settlements | Transfers in or (out) of Level 3 | Balances at end of period | ||||||||||||||||||||
Assets: | |||||||||||||||||||||||||||
Common stock and ADRs | $ | 0.5 | $ | — | $ | (0.2 | ) | $ | — | $ | — | $ | — | $ | 0.3 | ||||||||||||
Corporate and municipal bonds | 3.2 | — | 0.1 | — | — | — | 3.3 | ||||||||||||||||||||
$ | 3.7 | $ | — | $ | (0.1 | ) | $ | — | $ | — | $ | — | $ | 3.6 | |||||||||||||
Liabilities: | |||||||||||||||||||||||||||
Contingent liabilities | $ | 3.3 | $ | — | $ | 0.3 | $ | — | $ | (2.1 | ) | $ | — | $ | 1.5 | ||||||||||||
Level 3 Financial Assets and Financial Liabilities For the Three Months Ended March 31, 2015 | |||||||||||||||||||||||||||
(in millions) | Balances at beginning of period | Realized gains (losses) during period | Unrealized gains (losses) during period | Purchases/issuances | Settlements | Transfers in or (out) of Level 3 | Balances at end of period | ||||||||||||||||||||
Assets: | |||||||||||||||||||||||||||
Common stock and ADRs | $ | 0.6 | $ | — | $ | (0.1 | ) | $ | — | $ | — | $ | — | $ | 0.5 | ||||||||||||
Corporate and municipal bonds | 3.5 | — | 0.1 | — | — | — | 3.6 | ||||||||||||||||||||
$ | 4.1 | $ | — | $ | — | $ | — | $ | — | $ | — | $ | 4.1 | ||||||||||||||
Liabilities: | |||||||||||||||||||||||||||
Contingent liabilities | $ | 2.2 | $ | — | $ | 0.1 | $ | 1.5 | $ | (0.7 | ) | $ | — | $ | 3.1 | ||||||||||||
12
Level 3 Financial Assets and Financial Liabilities For the Six Months Ended March 31, 2015 | |||||||||||||||||||||||||||
(in millions) | Balances at beginning of period | Realized gains (losses) during period | Unrealized gains (losses) during period | Purchases/issuances | Settlements | Transfers in or (out) of Level 3 | Balances at end of period | ||||||||||||||||||||
Assets: | |||||||||||||||||||||||||||
Common stock and ADRs | $ | 0.7 | $ | — | $ | (0.2 | ) | $ | — | $ | — | $ | — | $ | 0.5 | ||||||||||||
Corporate and municipal bonds | 3.6 | — | — | — | — | — | 3.6 | ||||||||||||||||||||
$ | 4.3 | $ | — | $ | (0.2 | ) | $ | — | $ | — | $ | — | $ | 4.1 | |||||||||||||
Liabilities: | |||||||||||||||||||||||||||
Contingent liabilities | $ | 5.5 | $ | — | $ | 0.2 | $ | 1.5 | $ | (4.1 | ) | $ | — | $ | 3.1 | ||||||||||||
In accordance with the Fair Value Measurements Topic of the ASC, the Company has estimated on a recurring basis each period the fair value of debentures issued by a single asset owning company of Suriwongse Hotel located in Chiang Mai, Thailand. As of March 31, 2016, the Company’s investment in the hotel is $3.3 million, and included within the corporate and municipal bonds classification in the level 3 financial assets and financial liabilities tables. The Company has classified its investment in the hotel within level 3 of the fair value hierarchy because the fair value is determined using significant unobservable inputs, which include projected cash flows. These cash flows are discounted employing present value techniques. The Company estimates the fair value of its investment in these debentures by using a management-developed forecast, which is based on the income approach. There has been no significant change in the fair value of the debentures during the three and six months ended March 31, 2016 and 2015.
The Company is required to make additional future cash payments based on certain financial performance measures of its acquired businesses. The Company is required to remeasure the fair value of the cash earn-out arrangements on a recurring basis in accordance with the guidance in the Business Combinations Topic of the ASC. The Company has classified its liabilities for the contingent earn-out arrangements within level 3 of the fair value hierarchy because the fair value is determined using significant unobservable inputs, which include projected cash flows. The estimated fair value of the earn-outs is based upon management-developed forecasts, a level 3 input in the fair value hierarchy. These cash flows are discounted employing present value techniques in arriving at fair value. The discount rate was developed using market participant company data and there have been no significant changes in the interest rate environment. From the dates of acquisition to March 31, 2016, certain acquisitions have had changes in the estimates of undiscounted cash flows, based on actual performances fluctuating from estimates. The fair value of the contingent consideration increased $0.1 million during the three months ended March 31, 2016 and 2015, respectively, and increased $0.3 million and $0.2 million during the six months ended March 31, 2016 and 2015, respectively, with the corresponding amount classified as ‘other’ in the condensed consolidated income statements.
The Company reports transfers in and out of levels 1, 2 and 3, as applicable, using the fair value of the securities as of the beginning of the reporting period in which the transfer occurred. The Company did not have any transfers in and out of levels 1, 2, and 3 during the three and six months ended March 31, 2016 and 2015.
Note 4 – Financial Instruments with Off-Balance Sheet Risk and Concentrations of Credit Risk
The Company is party to certain financial instruments with off-balance sheet risk in the normal course of its business. The Company has sold financial instruments that it does not currently own and will therefore be obliged to purchase such financial instruments at a future date. The Company has recorded these obligations in the condensed consolidated financial statements as of March 31, 2016 at the fair values of the related financial instruments. The Company will incur losses if the fair value of the underlying financial instruments increases subsequent to March 31, 2016. The total of $1,033.9 million as of March 31, 2016 includes $179.8 million for derivative contracts, which represents a liability to the Company based on their fair values as of March 31, 2016.
Derivatives
The Company utilizes derivative products in its trading capacity as a dealer in order to satisfy client needs and mitigate risk. The Company manages risks from both derivatives and non-derivative cash instruments on a consolidated basis. The risks of derivatives should not be viewed in isolation, but in aggregate with the Company’s other trading activities. The majority of the Company’s derivative positions are included in the condensed consolidated balance sheets in ‘deposits with and receivables from exchange-clearing organizations’, ‘financial instruments owned and sold, not yet purchased, at fair value’ and payables to broker-dealers, clearing organizations and counterparties’.
The Company employs an interest rate risk management strategy that uses derivative financial instruments in the form of interest rate swaps to manage a portion of the aggregate interest rate position. The Company’s objective is to invest the majority of customer deposits in high quality, short-term investments and swap the resulting variable interest earnings into the medium-
13
term interest stream. The risk mitigation of these interest rate swaps is not within the documented hedging designation requirements of the Derivatives and Hedging Topic of the ASC, and as a result they are recorded at fair value, with changes in the fair value of the interest rate swaps recorded within 'trading gains, net' in the condensed consolidated income statements. At March 31, 2016, the Company had $375.0 million in notional principal of interest rate swaps outstanding with a weighted-average remaining life of 21 months.
Listed below are the fair values of the Company’s derivative assets and liabilities as of March 31, 2016 and September 30, 2015. Assets represent net unrealized gains and liabilities represent net unrealized losses.
March 31, 2016 | September 30, 2015 | ||||||||||||||
(in millions) | Assets (1) | Liabilities (1) | Assets (1) | Liabilities (1) | |||||||||||
Derivative contracts not accounted for as hedges: | |||||||||||||||
Exchange-traded commodity derivatives | $ | 1,849.6 | $ | 1,962.8 | $ | 3,443.6 | $ | 3,313.8 | |||||||
OTC commodity derivatives | 1,277.8 | 1,234.1 | 1,621.2 | 1,650.7 | |||||||||||
Exchange-traded foreign exchange derivatives | 18.9 | 25.4 | 27.8 | 20.6 | |||||||||||
OTC foreign exchange derivatives | 623.2 | 510.9 | 892.2 | 865.4 | |||||||||||
Exchange-traded interest rate derivatives | 105.1 | 120.2 | 126.8 | 136.0 | |||||||||||
Equity index derivatives | 29.5 | 37.8 | 22.8 | 21.0 | |||||||||||
TBA and forward settling securities | 3.0 | 4.1 | 1.2 | 2.6 | |||||||||||
Gross fair value of derivative contracts | 3,907.1 | 3,895.3 | 6,135.6 | 6,010.1 | |||||||||||
Impact of netting and collateral | (3,669.1 | ) | (3,713.6 | ) | (6,081.7 | ) | (5,954.4 | ) | |||||||
Total fair value included in ‘Deposits with and receivables from exchange-clearing organizations’ | $ | 27.8 | $ | 76.2 | |||||||||||
Total fair value included in ‘Deposits with and receivables from broker-dealers, clearing organizations and counterparties’ | $ | (16.0 | ) | $ | (52.9 | ) | |||||||||
Total fair value included in ‘Financial instruments owned, at fair value’ | $ | 226.2 | $ | 30.6 | |||||||||||
Total fair value included in ‘Payables to broker-dealers, clearing organizations and counterparties | $ | 1.9 | $ | 1.6 | |||||||||||
Fair value included in ‘Financial instruments sold, not yet purchased, at fair value’ | $ | 179.8 | $ | 54.1 | |||||||||||
(1) | As of March 31, 2016 and September 30, 2015, the Company’s derivative contract volume for open positions were approximately 3.9 million and 4.1 million contracts, respectively. |
The Company’s derivative contracts are principally held in its Commercial Hedging and Clearing and Execution Services segments. The Company assists its Commercial Hedging segment customers in protecting the value of their future production by entering into option or forward agreements with them on an OTC basis. The Company also provides its Commercial Hedging segment customers with option products, including combinations of buying and selling puts and calls. The Company mitigates its risk by offsetting the customer’s transaction simultaneously with one of the Company’s trading counterparties or with a similar but not identical position on the exchange. The risk mitigation of these offsetting trades is not within the documented hedging designation requirements of the Derivatives and Hedging Topic of the ASC. These derivative contracts are traded along with cash transactions because of the integrated nature of the markets for these products. The Company manages the risks associated with derivatives on an aggregate basis along with the risks associated with its proprietary trading and market-making activities in cash instruments as part of its firm-wide risk management policies. In particular, the risks related to derivative positions may be partially offset by inventory, unrealized gains in inventory or cash collateral paid or received.
The Company has derivative instruments, which consist of mortgage-backed TBA securities and forward settling transactions that are used to manage risk exposures in the trading inventory of the Company’s domestic fixed income institutional business. The fair value on these transactions are recorded in receivables or payables to broker-dealers, clearing organizations and counterparties. Realized and unrealized gains and losses on securities and derivative transactions are reflected in ‘trading gains, net’.
14
The Company enters into TBA securities transactions for the sole purpose of managing risk associated with the purchase of mortgage pass-through securities. TBA securities are included within deposits with and receivables from and payables to broker-dealers, clearing organizations and counterparties. Forward settling securities represent non-regular way securities and are included in financial instruments owned and sold. As of March 31, 2016 and September 30, 2015, these transactions are summarized as follows:
March 31, 2016 | September 30, 2015 | ||||||||||||||
(in millions) | Gain / (Loss) | Notional Amounts | Gain / (Loss) | Notional Amounts | |||||||||||
Unrealized gain on TBA securities purchased within receivables from and payables to broker-dealers, clearing organizations and counterparties and related notional amounts (1) | $ | 2.0 | $ | 523.3 | $ | 0.6 | $ | 194.6 | |||||||
Unrealized loss on TBA securities purchased within receivables from and payables to broker-dealers, clearing organizations and counterparties and related notional amounts (1) | $ | — | $ | 41.1 | $ | (0.2 | ) | $ | 163.7 | ||||||
Unrealized gain on TBA securities sold within receivables from and payables to broker-dealers, clearing organizations and counterparties and related notional amounts (1) | $ | 0.1 | $ | (142.0 | ) | $ | 0.4 | $ | (314.1 | ) | |||||
Unrealized loss on TBA securities sold within receivables from and payables to broker-dealers, clearing organizations and counterparties and related notional amounts (1) | $ | (3.5 | ) | $ | (1,052.1 | ) | $ | (2.0 | ) | $ | (563.8 | ) | |||
Unrealized gain on forward settling securities purchased within receivables from and payables to broker-dealers, clearing organizations and counterparties and related notional amounts | $ | 0.8 | $ | 251.5 | $ | 0.1 | $ | 163.4 | |||||||
Unrealized gain on forward settling securities sold within receivables from and payables to broker-dealers, clearing organizations and counterparties and related notional amounts | $ | (0.6 | ) | $ | (234.8 | ) | $ | (0.4 | ) | $ | (286.3 | ) | |||
(1) The notional amounts of these instruments reflect the extent of the Company's involvement in TBA securities and do not represent risk of loss due to counterparty non-performance. | |||||||||||||||
The following table sets forth the Company’s gains (losses) related to derivative financial instruments for the three and six months ended March 31, 2016 and 2015, in accordance with the Derivatives and Hedging Topic of the ASC. The gains set forth below are included in ‘trading gains, net’ in the condensed consolidated income statements.
Three Months Ended March 31, | Six Months Ended March 31, | ||||||||||||||
(in millions) | 2016 | 2015 | 2016 | 2015 | |||||||||||
Commodities | $ | 5.0 | $ | 21.2 | $ | 25.0 | $ | 46.4 | |||||||
Foreign exchange | 1.8 | 1.7 | 3.6 | 3.9 | |||||||||||
Interest rate | 2.9 | 0.1 | 1.0 | 0.1 | |||||||||||
TBA and forward settling securities | (5.7 | ) | 2.5 | (5.0 | ) | 2.5 | |||||||||
Net gains from derivative contracts | $ | 4.0 | $ | 25.5 | $ | 24.6 | $ | 52.9 | |||||||
Credit Risk
In the normal course of business, the Company purchases and sells financial instruments, commodities and foreign currencies as either principal or agent on behalf of its customers. If either the customer or counterparty fails to perform, the Company may be required to discharge the obligations of the nonperforming party. In such circumstances, the Company may sustain a loss if the fair value of the financial instrument or foreign currency is different from the contract value of the transaction.
The majority of the Company’s transactions and, consequently, the concentration of its credit exposure are with commodity exchanges, customers, broker-dealers and other financial institutions. These activities primarily involve collateralized and uncollateralized arrangements and may result in credit exposure in the event that a counterparty fails to meet its contractual obligations. The Company’s exposure to credit risk can be directly impacted by volatile financial markets, which may impair the ability of counterparties to satisfy their contractual obligations. The Company seeks to control its credit risk through a variety of reporting and control procedures, including establishing credit and/or position limits based upon a review of the counterparties’ financial condition and credit ratings. The Company monitors collateral levels on a daily basis for compliance with regulatory and internal guidelines and requests changes in collateral levels as appropriate.
The Company is a party to financial instruments in the normal course of its business through customer and proprietary trading accounts in exchange-traded and OTC derivative instruments. These instruments are primarily the result of the execution of orders for commodity futures, options on futures and forward foreign currency contracts on behalf of its customers, substantially all of which are transacted on a margin basis. Such transactions may expose the Company to significant credit risk in the event margin requirements are not sufficient to fully cover losses which customers may incur. The Company controls the risks associated with these transactions by requiring customers to maintain margin deposits in compliance with individual exchange regulations and internal guidelines. The Company monitors required margin levels daily and, therefore, may require
15
customers to deposit additional collateral or reduce positions when necessary. The Company also establishes credit limits for customers, which are monitored daily. The Company evaluates each customer’s creditworthiness on a case by case basis. Clearing, financing, and settlement activities may require the Company to maintain funds with or pledge securities as collateral with other financial institutions. Generally, these exposures to both customers and exchanges are subject to master netting, or customer agreements, which reduce the exposure to the Company by permitting receivables and payables with such customers to be offset in the event of a customer default. Management believes that the margin deposits held as of March 31, 2016 and September 30, 2015 were adequate to minimize the risk of material loss that could be created by positions held at that time. Additionally, the Company monitors collateral fair value on a daily basis and adjusts collateral levels in the event of excess market exposure. Generally, these exposures to both customers and counterparties are subject to master netting or customer agreements which reduce the exposure to the Company.
Derivative financial instruments involve varying degrees of off-balance sheet market risk whereby changes in the fair values of underlying financial instruments may result in changes in the fair value of the financial instruments in excess of the amounts reflected in the condensed consolidated balance sheets. Exposure to market risk is influenced by a number of factors, including the relationships between the financial instruments and the Company’s positions, as well as the volatility and liquidity in the markets in which the financial instruments are traded. The principal risk components of financial instruments include, among other things, interest rate volatility, the duration of the underlying instruments and changes in foreign exchange rates. The Company attempts to manage its exposure to market risk through various techniques. Aggregate market limits have been established and market risk measures are routinely monitored against these limits.
Note 5 – Receivables From Customers, Net and Notes Receivable, Net
The allowance for doubtful accounts related to receivables from customers was $12.9 million as of March 31, 2016 and $10.2 million as of September 30, 2015. The allowance for doubtful accounts related to notes receivable was $0.2 million and $1.0 million as of March 31, 2016 and September 30, 2015, respectively.
During the three months ended March 31, 2016, the Company recorded bad debt expense of $2.6 million, including provision increases for bad debts primarily related to $1.3 million of customer receivables in the Physical Ag’s & Energy component of the Company’s Physical Commodities segment, $1.1 million of customer deficits in the Company’s Commercial Hedging segment and $0.2 million related to short-term notes receivable origination in the Securities segment. During the three months ended March 31, 2015, the Company recorded bad debt expense of$2.8 million, including provision increases of $2.6 million and direct write-offs of $0.3 million, net of recoveries of $0.1 million. These provision increases were primarily related to LME customer deficits and notes receivable related to loans pertaining to a former acquisition.
During the six months ended March 31, 2016, the Company recorded bad debt expense of $4.6 million, primarily related to $1.5 million of customer receivables in the Physical Ag’s & Energy component of the Company’s Physical Commodities segment, $2.7 million of customer deficits in the Company’s Commercial Hedging segment and$0.3 million related to short-term notes receivable origination in the Securities segment. During the six months ended March 31, 2015, the Company recorded bad debt expense of $2.8 million, primarily related to LME customer deficits, notes receivable related to loans pertaining to a former acquisition and the charge-off of uncollectible service fees.
The Company originates short-term notes receivable from customers with the outstanding balances typically being insured 90% to 98% by a third party, including accrued interest, subject to applicable deductible amounts. The total balance outstanding under insured notes receivable was $6.6 million and $41.4 million as of March 31, 2016 and September 30, 2015, respectively. The Company has sold $3.5 million and $30.7 million of the insured portion of the notes through non-recourse participation agreements with other third parties as of March 31, 2016 and September 30, 2015, respectively. The Company has completed its exit of the majority of this activity during the three months ended March 31, 2016. The Company believes the run-off of the remaining activity will have a minimal impact on the Company.
See discussion of notes receivable related to commodity repurchase agreements in Note 10.
Note 6 – Physical Commodities Inventory
The carrying values of the Company’s inventory, which consist of all finished commodities inventory, are $31.2 million and $32.8 million as of March 31, 2016 and September 30, 2015, respectively.
As a result of the declining market prices of certain commodities, the Company has recorded lower of cost or market (“LCM”) adjustments for physical commodities inventory of $0.2 million and $0.3 million as of March 31, 2016 and September 30, 2015, respectively. The adjustments are included in ‘cost of sales of physical commodities’ in the condensed consolidated income statements.
16
Note 7 – Goodwill
The carrying value of goodwill is allocated to the Company’s operating segments as follows:
(in millions) | March 31, 2016 | September 30, 2015 | |||||
Commercial Hedging | $ | 30.7 | $ | 30.7 | |||
Global Payments | 6.3 | 6.3 | |||||
Physical Commodities | 2.4 | 2.4 | |||||
Securities | 8.1 | 8.1 | |||||
Goodwill | $ | 47.5 | $ | 47.5 | |||
Note 8 – Intangible Assets
The gross and net carrying values of intangible assets as of the balance sheet dates, by major intangible asset class are as follows:
March 31, 2016 | September 30, 2015 | ||||||||||||||||||||||
(in millions) | Gross Amount | Accumulated Amortization | Net Amount | Gross Amount | Accumulated Amortization | Net Amount | |||||||||||||||||
Intangible assets subject to amortization | |||||||||||||||||||||||
Trade name | $ | 1.1 | $ | (0.3 | ) | $ | 0.8 | $ | — | $ | — | $ | — | ||||||||||
Software programs/platforms | 2.7 | (2.3 | ) | 0.4 | 2.7 | (2.3 | ) | 0.4 | |||||||||||||||
Customer base | 14.0 | (5.3 | ) | 8.7 | 14.0 | (4.9 | ) | 9.1 | |||||||||||||||
17.8 | (7.9 | ) | 9.9 | 16.7 | (7.2 | ) | 9.5 | ||||||||||||||||
Intangible assets not subject to amortization | |||||||||||||||||||||||
Trade name | — | — | — | 1.1 | — | 1.1 | |||||||||||||||||
Total intangible assets | $ | 17.8 | $ | (7.9 | ) | $ | 9.9 | $ | 17.8 | $ | (7.2 | ) | $ | 10.6 | |||||||||
During the six months ended March 31, 2016, as part of the periodic assessment of useful lives of the intangible assets, the Company determined the indefinite-lived trade names, related to the Risk Management Incorporated and RMI Consulting, Inc. (the “RMI Companies”) acquisitions, were no longer considered to be indefinite. The Company is intending to phase out the use of those trade names in the future. The value of the RMI Companies’ trade names of $1.1 million was recorded in the Commercial Hedging segment.
The RMI Companies’ trade names were determined to have a remaining finite useful life of approximately two years. The trade names were not deemed to be impaired, however, the value of the trade names was transferred from the indefinite-lived category to intangible assets subject to amortization and will be amortized over the estimated two year useful life. The Company recorded amortization for the trade names of $0.3 million, within 'depreciation and amortization' on the condensed consolidated income statement, during the six months ended March 31, 2016.
Amortization expense related to intangible assets was $0.8 million for the six months ended March 31, 2016 and 2015.
As of March 31, 2016, the estimated future amortization expense was as follows:
(in millions) | |||
Fiscal 2016 (remaining six months) | $ | 0.8 | |
Fiscal 2017 | 1.6 | ||
Fiscal 2018 | 1.0 | ||
Fiscal 2019 | 1.0 | ||
Fiscal 2020 and thereafter | 5.5 | ||
$ | 9.9 | ||
17
Note 9 – Credit Facilities
Variable-Rate Credit Facilities
The Company has four committed credit facilities under which the Company and its subsidiaries may borrow up to $370.0 million, subject to the terms and conditions for these facilities. The amounts outstanding under these credit facilities are short term borrowings and carry variable rates of interest, thus approximating fair value. The Company’s credit facilities consist of the following:
• | $205 million facility available to INTL FCStone Inc. for general working capital requirements. The Company amended the credit facility on March 18, 2016 resulting in an increase in the commitment from $140 million to $205 million, an extension of the maturity date to March 18, 2019, and the ability to increase the facility by an additional $50 million in the aggregate in one or more increases at any time prior to six months before the maturity date with the satisfaction of certain conditions. The Company paid debt issuance costs of $1.8 million in connection with the amendment of the credit facility, which are being amortized over the amended thirty-six month term. |
• | $75 million facility available to the Company’s wholly owned subsidiary, INTL FCStone Financial Inc., for short-term funding of margin to commodity exchanges. The facility is subject to annual review and guaranteed by INTL FCStone Inc. |
• | $65 million facility available to the Company’s wholly owned subsidiary, FCStone Merchant Services, LLC, for financing traditional commodity financing arrangements and commodity repurchase agreements. The facility is subject to annual review and is guaranteed by INTL FCStone Inc. The Company amended the credit facility on March 15, 2016 resulting in an increase in the commitment from $40 million to $65 million. |
• | $25 million facility available to the Company’s wholly owned subsidiary, INTL FCStone Ltd, for short-term funding of margin to commodity exchanges. The facility is subject to annual review and is guaranteed by INTL FCStone Inc. |
The Company also has a secured, uncommitted loan facility, under which the Company’s wholly owned subsidiary, INTL FCStone Financial Inc. may borrow up to $50.0 million, collateralized by commodity warehouse receipts, to facilitate U.S. commodity exchange deliveries of its customers, subject to certain terms and conditions of the credit agreement.
Note Payable to Bank
In April 2015, the Company obtained a $4.0 million loan from a commercial bank, secured by equipment purchased with the proceeds. The note is payable in monthly installments, ending in March 2020. The note bears interest at a rate per annum equal to LIBOR plus 2.00%.
Senior Unsecured Notes
In July 2013, the Company completed the offering of $45.5 million aggregate principal amount of the Company’s 8.5% Senior Notes due 2020 (the “Notes”). The net proceeds of the sale of the Notes are being used for general corporate purposes. The Notes bear interest at a rate of 8.5% per year (payable quarterly on January 30, April 30, July 30 and October 30 of each year). The Notes mature on July 30, 2020. The Company may redeem the Notes, in whole or in part, at any time on and after July 30, 2016, at a redemption price equal to 100% of the principal amount redeemed plus accrued and unpaid interest to, but not including, the redemption date. The Company incurred debt issuance costs of $1.7 million in connection with the issuance of the Notes, which are being amortized over the term of the Notes.
18
The following table sets forth a listing of credit facilities, the committed amounts as of March 31, 2016 on the facilities, and outstanding borrowings on the facilities as well as indebtedness on a promissory note and on senior notes as of March 31, 2016 and September 30, 2015:
(in millions) | |||||||||||||||
Credit Facilities | Amounts Outstanding | ||||||||||||||
Borrower | Security | Renewal / Expiration Date | Total Commitment | March 31, 2016 | September 30, 2015 | ||||||||||
INTL FCStone Inc. | Pledged shares of certain subsidiaries | March 18, 2019 | $ | 205.0 | $ | 105.9 | $ | 28.0 | |||||||
INTL FCStone Financial Inc. | None | April 6, 2017 | 75.0 | — | — | ||||||||||
INTL FCStone Financial Inc. | Commodity warehouse receipts | n/a | — | — | — | ||||||||||
FCStone Merchants | Certain commodities assets | May 1, 2017 | 65.0 | 42.4 | 10.0 | ||||||||||
INTL FCStone Ltd | None | October 31, 2016 | 25.0 | — | — | ||||||||||
$ | 370.0 | 148.3 | 38.0 | ||||||||||||
Note Payable to Bank | |||||||||||||||
Monthly installments, due March 2020 and secured by certain equipment | 3.2 | 3.6 | |||||||||||||
Senior Unsecured Notes | |||||||||||||||
8.50% senior notes, due July 30, 2020 | 45.5 | 45.5 | |||||||||||||
Total indebtedness | $ | 197.0 | $ | 87.1 | |||||||||||
As reflected above, $165 million of the Company’s committed credit facilities are scheduled to expire within twelve months of this filing. The Company intends to renew or replace this facility when it expires, and based on the Company’s liquidity position and capital structure, the Company believes it will be able to do so.
The Company’s credit facility agreements contain financial covenants relating to financial measures on a consolidated basis, as well as on a certain stand-alone subsidiary basis, including minimum tangible net worth, minimum regulatory capital, minimum net unencumbered liquid assets, maximum net loss, minimum fixed charge coverage ratio and maximum funded debt to net worth ratio. Failure to comply with these covenants could result in the debt becoming payable on demand. As of March 31, 2016, the Company was in compliance with all of its financial covenants under its credit facilities.
Note 10 – Commodity and Other Repurchase Agreements and Collateralized Transactions
The Company’s outstanding notes receivable in connection with sale/repurchase agreements, under which customers sell certain commodity inventory and agree to repurchase the commodity inventory at a future date at either a fixed or floating rate, as of March 31, 2016 and September 30, 2015 were $49.1 million and $26.7 million, respectively.
The obligations outstanding related to commodities sold under repurchase agreements that are recorded in ‘lenders under loans’ as of March 31, 2016 and September 30, 2015 were $42.4 million and $10.0 million, respectively.
The Company enters into securities purchased under agreements to resell and payables under repurchase agreements primarily to finance financial instruments, acquire securities to cover short positions or to acquire securities for settlement. These agreements are recorded at their contractual amounts plus accrued interest. The related interest is recorded in the condensed consolidated income statements as interest income or interest expense, as applicable. In connection with these agreements and transactions, it is the policy of the Company to receive or pledge cash or securities to adequately collateralize such agreements and transactions in accordance with general industry guidelines and practices. The value of the collateral is valued daily and the Company may require counterparties to deposit additional collateral or return collateral pledged, when appropriate. The carrying amounts of these agreements and transactions approximate fair value due to their short-term nature and the level of collateralization.
The Company pledges financial instruments owned to collateralize repurchase agreements. At March 31, 2016, on a settlement date basis, financial instruments owned of $50.8 million were pledged as collateral under repurchase agreements. The counterparty has the right to repledge the collateral in connection with these transactions. These financial instruments owned have been pledged as collateral and have been parenthetically disclosed on the condensed consolidated balance sheet.
In addition, as of March 31, 2016, the Company pledged settlement date financial instruments owned of $977.4 million and securities received under reverse repurchase agreements of $111.2 million to cover collateral for tri-party repurchase agreements. For these securities, the counterparty does not have the right to sell or repledge the collateral.
19
At March 31, 2016, the Company has accepted collateral that it is permitted by contract or custom to sell or repledge. This collateral consists primarily of securities received in reverse repurchase agreements. The fair value of such collateral at March 31, 2016, was approximately $702.5 million of which $589.4 million was used to cover securities sold short which are recorded in financial instruments sold, not yet purchased on the condensed consolidated balance sheet. In the normal course of business, this collateral is used by the Company to cover financial instruments sold, not yet purchased and to obtain financing in the form of repurchase agreements. At March 31, 2016, substantially all of the above collateral had been delivered against financial instruments sold, not yet purchased or repledged by the Company to obtain financing.
Note 11 – Commitments and Contingencies
Legal Proceedings
From time to time and in the ordinary course of business, the Company is involved in various legal actions and proceedings, including tort claims, contractual disputes, employment matters, workers’ compensation claims and collections. The Company carries insurance that provides protection against certain types of claims, up to the policy limits of the insurance.
As of March 31, 2016 and September 30, 2015, the condensed consolidated balance sheets include loss contingency accruals recorded prior to these periods then ended, which are not material, individually or in the aggregate, to the Company’s financial position or liquidity. In the opinion of management, possible exposure from loss contingencies in excess of the amounts accrued, is not likely to be material to the Company’s earnings, financial position or liquidity.
Sentinel Litigation
Prior to its July 1, 2015 merger into INTL FCStone Financial Inc., the Company’s subsidiary FCStone, LLC, had a portion of its excess segregated funds invested with Sentinel Management Group Inc. (“Sentinel”), a registered futures commission merchant (“FCM”) and an Illinois-based money manager that provided cash management services to other FCMs. In August 2007, Sentinel halted redemptions to customers and sold certain of the assets it managed to an unaffiliated third party at a significant discount. On August 17, 2007, subsequent to Sentinel’s sale of certain assets, Sentinel filed for bankruptcy protection. In aggregate,$15.5 million of FCStone, LLC’s $21.9 million in invested funds were returned to it before and after Sentinel’s bankruptcy petition.
In August 2008, the bankruptcy trustee of Sentinel filed adversary proceedings against FCStone, LLC, and a number of other FCMs in the Bankruptcy Court for the Northern District of Illinois. The case was subsequently reassigned to the United States District Court, for the Northern District of Illinois. In the complaint, the trustee is seeking avoidance of alleged transfers or withdrawals of funds received by FCStone, LLC and other FCMs within 90 days prior to the filing of the Sentinel bankruptcy petition, as well as avoidance of post-petition distributions and disallowance of the proof of claim filed by FCStone, LLC. The trustee seeks recovery of pre- and post-petition transfers totaling approximately $15.5 million.
The trial of this matter took place, as a test case, during October 2012. The trial court entered a judgment against FCStone, LLC on January 4, 2013. On January 17, 2013, the trial court entered an agreed order, staying execution and enforcement, pending an appeal of the judgment. On March 19, 2014, the appeal court ruled in favor of FCStone, LLC. On April 16, 2014, the trustee filed a petition for rehearing of the appeal. On May 19, 2014, the U.S. Court of Appeals for the Seventh Circuit denied the petition. The trustee did not file a writ for certiorari with the U.S. Supreme Court during the time allotted to do so.
On February 10, 2015, based on a new theory, the trustee filed a motion for judgment against FCStone, LLC in the United States District Court, for the Northern District of Illinois, seeking to claw back the post-petition transfer of $14.5 million and to recover the funds held in reserve in the name of FCStone, LLC. FCStone, LLC filed its opposition brief and an associated motion for judgment on March 17, 2015. The trustee filed its reply briefs on April 7, 2015 and the Company filed its reply briefs on April 22, 2015.
On March 28, 2016 the United States District Court for the Northern District of Illinois entered an order in favor of FCStone, LLC (now INTL FCStone Financial Inc.) and against the Trustee on the Trustee’s post-petition claim, in light of the Seventh Circuit’s opinion. The same court ruled against INTL FCStone Financial and in favor of the Trustee with respect to the funds held in reserve accounts.
On April 25, 2016, INTL FCStone Financial filed a Notice of Appeal to the United States Court of Appeals for the Seventh Circuit relating to the portion of the final judgment dated March 28, 2016 of the district court and INTL FCStone Financial’s claim to funds in reserve accounts. On April 26, 2016, the Trustee filed a Notice of Appeal from the March 28, 2016 final judgment of the district court.
The Company has determined that losses related to the Trustee’s appeal are neither probable nor reasonably possible. The Company believes the case is without merit and intends to defend itself vigorously.
20
Our assessments are based on estimates and assumptions that have been deemed reasonable by management, but that may later prove to be incomplete or inaccurate, and unanticipated events and circumstances may occur that might cause us to change those estimates and assumptions.
Contractual Commitments
Contingent Liabilities - Acquisitions
Under the terms of the purchase agreements related to the acquisitions listed below, the Company has obligations to pay additional consideration if specific conditions and earnings targets are met. In accordance with the Business Combinations Topic of the ASC, the fair value of the additional consideration is recognized as a contingent liability as of the acquisition date. The contingent liability for these estimated additional purchase price considerations of $1.5 million and $3.3 million are included in ‘accounts payable and other accrued liabilities’ in the condensed consolidated balance sheets as of March 31, 2016 and September 30, 2015. The acquisition date fair value of additional consideration is remeasured to its fair value each reporting period, with changes in fair value recorded in current earnings. The change in fair value during the six months ended March 31, 2016 and 2015 were increases of $0.3 million and $0.2 million, respectively, and are included in ‘other’ in the condensed consolidated income statements.
The Company has a contingent liability relating to the December 2012 acquisition of the accounts of Tradewire Securities, LLC, which may result in the payment of additional purchase price consideration. The present value of the estimated total purchase price, including contingent consideration, is $4.5 million as of March 31, 2016, of which $0.9 million remains outstanding and is included in ‘accounts payable and other accrued liabilities’ in the condensed consolidated balance sheet.
The Company has a contingent liability relating to the January 2015 acquisition of G.X. Clarke, which may result in the payment of additional purchase price consideration. The contingent consideration, which in no event shall exceed $1.5 million, is expected to be paid in two payments. The present value of the estimated total purchase price, including contingent consideration, is $28.5 million as of March 31, 2016, of which $0.6 million remains outstanding and is included in ‘accounts payable and other accrued liabilities’ in the condensed consolidated balance sheet.
Self-Insurance
The Company self-insures its costs related to medical and dental claims. The Company is self-insured, up to a stop loss amount, for eligible participating employees and retirees, and for qualified dependent medical and dental claims, subject to deductibles and limitations. As of March 31, 2016, the Company had $1.1 million accrued for self-insured medical and dental claims included in ‘accounts payable and other liabilities’ in the condensed consolidated balance sheet.
21
Note 12 – Capital and Other Regulatory Requirements
The Company’s activities are subject to significant governmental regulation, both in the United States and overseas. The subsidiaries of the Company were in compliance with all of their regulatory requirements as of March 31, 2016, as follows:
(in millions) | As of March 31, 2016 | |||||||||||
Subsidiary | Regulatory Authority | Jurisdiction | Requirement Type | Actual | Minimum Requirement | |||||||
INTL FCStone Financial Inc. | Securities and Exchange Commission ("SEC") and Commodity Futures Trading Commission ("CFTC") | United States | Net capital | $ | 126.9 | $ | 64.8 | |||||
INTL FCStone Financial Inc. | CFTC | United States | Segregated funds | $ | 1,884.0 | $ | 1,831.2 | |||||
INTL FCStone Financial Inc. | CFTC | United States | Secured funds | $ | 123.6 | $ | 106.9 | |||||
INTL FCStone Ltd(1) | Financial Conduct Authority ("FCA") | United Kingdom | Net capital | $ | 136.1 | $ | 70.7 | |||||
INTL FCStone Ltd | FCA | United Kingdom | Segregated funds | $ | 51.1 | $ | 44.9 | |||||
INTL Netherlands BV(1) | FCA | United Kingdom | Net capital | $ | 135.3 | $ | 70.8 | |||||
INTL FCStone DTVM Ltda. | Brazilian Central Bank and Securities and Exchange Commission of Brazil | Brazil | Capital adequacy | $ | 2.2 | $ | 0.4 | |||||
INTL Gainvest S.A. | National Securities Commission ("CNV") | Argentina | Capital adequacy | $ | 6.3 | $ | 0.1 | |||||
INTL Gainvest S.A. | CNV | Argentina | Net capital | $ | 3.9 | $ | 0.1 | |||||
INTL CIBSA S.A. | CNV | Argentina | Capital adequacy | $ | 5.7 | $ | 1.1 | |||||
INTL CIBSA S.A. | CNV | Argentina | Net capital | $ | 7.6 | $ | 0.6 | |||||
(1) INTL Netherlands BV is a holding company that includes the ownership equity of INTL FCStone Ltd. The associated net capital amounts and minimum requirements should not be considered in aggregate.
Certain other non-U.S. subsidiaries of the Company are also subject to capital adequacy requirements promulgated by authorities of the countries in which they operate. As of March 31, 2016, these subsidiaries were in compliance with their local capital adequacy requirements.
Note 13 – Other Expenses
Other expenses for the three and six months ended March 31, 2016 and 2015 consisted of the following:
Three Months Ended March 31, | Six Months Ended March 31, | ||||||||||||||
(in millions) | 2016 | 2015 | 2016 | 2015 | |||||||||||
Contingent consideration, net | $ | 0.1 | $ | — | $ | 0.3 | $ | 0.2 | |||||||
Insurance | 0.3 | 0.4 | 0.7 | 0.9 | |||||||||||
Advertising, meetings and conferences | 2.3 | 0.7 | 3.0 | 1.3 | |||||||||||
Non-trading hardware and software maintenance and software licensing | 1.3 | 1.1 | 2.8 | 2.3 | |||||||||||
Office supplies and printing | 0.3 | 0.3 | 0.6 | 0.6 | |||||||||||
Other clearing related expenses | 0.3 | 0.3 | 0.5 | 0.6 | |||||||||||
Other non-income taxes | 1.1 | 0.9 | 2.1 | 1.9 | |||||||||||
Other | 1.7 | 1.8 | 3.7 | 3.1 | |||||||||||
Total other expenses | $ | 7.4 | $ | 5.5 | $ | 13.7 | $ | 10.9 | |||||||
22
Note 14 – Accumulated Other Comprehensive Income (Loss)
Comprehensive income consists of net income and other gains and losses affecting stockholders’ equity that, under U.S. GAAP, are excluded from net income. Other comprehensive income (loss) includes net actuarial losses from defined benefit pension plans, unrealized gains on available-for-sale securities, and gains and losses on foreign currency translations.
The following table summarizes the changes in accumulated other comprehensive income (loss) for the six months ended March 31, 2016.
(in millions) | Foreign Currency Translation Adjustment | Pension Benefits Adjustment | Accumulated Other Comprehensive Loss | |||||||||
Balances as of September 30, 2015 | $ | (12.7 | ) | $ | (4.8 | ) | $ | (17.5 | ) | |||
Other comprehensive (loss) income, net of tax before reclassifications | (6.9 | ) | (0.2 | ) | (7.1 | ) | ||||||
Amounts reclassified from AOCI, net of tax | — | 0.4 | 0.4 | |||||||||
Net current period other comprehensive (loss) income, net of tax | (6.9 | ) | 0.2 | (6.7 | ) | |||||||
Balances as of March 31, 2016 | $ | (19.6 | ) | $ | (4.6 | ) | $ | (24.2 | ) | |||
Note 15 – Income Taxes
In determining the quarterly provision for income taxes, management uses an estimated annual effective tax rate which is based on the expected annual income and statutory tax rates in the various jurisdictions in which it operates. The Company’s effective tax rate differs from the U.S. statutory rate primarily due to state and local taxes, and differing statutory tax rates applied to the income of non-U.S. subsidiaries. The Company records the tax effect of certain discrete items, including the effects of changes in tax laws, tax rates and adjustments with respect to valuation allowances or other unusual or nonrecurring tax adjustments, in the interim period in which they occur, as an addition to, or reduction from, the income tax provision, rather than being included in the estimated effective annual income tax rate. In addition, jurisdictions with a projected loss for the year or a year-to-date loss where no tax benefit can be recognized are excluded from the estimated annual effective income tax rate.
The Company is required to assess its deferred tax assets and the need for a valuation allowance at each reporting period. This assessment requires judgment on the part of management with respect to benefits that may be realized. The Company will record a valuation allowance against deferred tax assets when it is considered more likely than not that all or a portion of the deferred tax assets will not be realized.
The valuation allowance for deferred tax assets as of March 31, 2016 and September 30, 2015 was $3.2 million. The valuation allowances as of March 31, 2016 and September 30, 2015 were primarily related to U.S. state and local and foreign net operating loss carryforwards that, in the judgment of management, are not more likely than not to be realized. In assessing the realizability of deferred tax assets, management considers whether it is more likely than not that some or all of the deferred tax assets will not be realized.
The Company incurred U.S. federal, state, and local taxable income (losses) for the fiscal years ended September 30, 2015, 2014, and 2013 of $17.7 million, $(18.4) million, and $(24.5) million, respectively. There are no significant differences between actual levels of past taxable income and the results of operations, before income taxes in these jurisdictions. When evaluating if U.S. federal, state, and local deferred tax assets are realizable, the Company considered deferred tax liabilities of $2.4 million that are scheduled to reverse from 2016 to 2019 and $1.0 million of deferred tax liabilities associated with unrealized gains in securities which the Company could sell, if necessary. Furthermore, the Company considered its ability to implement business and tax planning strategies that would allow the remaining U.S. federal, state, and local deferred tax assets, net of valuation allowances, to be realized within approximately 11 years. Based on the tax planning strategies that are prudent and feasible, management believes that it is more likely than not that the Company will realize the tax benefit of the deferred tax assets, net of the existing valuation allowance, in the future. However, the realization of deferred income taxes is dependent on future events, and changes in estimate in future periods could result in adjustments to the valuation allowance.
Income tax expense of $5.5 million and $5.1 million for the three months ended March 31, 2016 and 2015 and income tax expense of$8.8 million and $9.3 million for the six months ended March 31, 2016 and 2015, respectively, reflect estimated federal, foreign and state taxes.
For the three months ended March 31, 2016 and March 31, 2015, the Company’s effective tax rate was28%. For the six months ended March 31, 2016, the Company’s effective tax rate was 27% compared to29% for the six months ended March 31, 2015. The effective tax rate is lower due to income mix in foreign jurisdictions.
The Company and its subsidiaries file income tax returns with the U.S. federal jurisdiction and various state and foreign jurisdictions. The Company has open tax years ranging from September 30, 2008 through September 30, 2015 with U.S.
23
federal and state and local taxing authorities. In the U.K., the Company has open tax years ending September 30, 2014 to September 30, 2015. In Brazil, the Company has open tax years ranging from December 31, 2010 through December 31, 2015. In Argentina, the Company has open tax years ranging from December 31, 2009 to September 30, 2015. The Company’s U.S. net operating loss carry back claim is being reviewed by the Joint Committee of Taxation. The Company expects to receive a full refund.
Note 16 – Segment Analysis
The Company reports its operating segments based on services provided to customers. The Company’s business activities are managed as operating segments and organized into reportable segments as follows:
• | Commercial Hedging (includes components Financial Agricultural (Ag’s) & Energy and LME metals) |
• | Global Payments |
• | Securities (includes components Equity market-making, Debt Trading, Investment Banking, and Asset Management) |
• | Physical Commodities (includes components Precious metals and Physical Ag’s & Energy) |
• | Clearing and Execution Services (includes components Clearing and Execution Services and FX Prime Brokerage) |
The total revenues reported combine gross revenues for the physical commodities business for subsidiaries that are not broker-dealers and net revenues for all other businesses. In order to reflect the way that the Company’s management views the results, the table below also reflects the segment contribution to ‘operating revenues’, which is shown on the face of the condensed consolidated income statements and which is calculated by deducting physical commodities cost of sales from total revenues.
Segment data includes the profitability measure of net contribution by segment. Net contribution is one of the key measures used by management to assess the performance of each segment and for decisions regarding the allocation of the Company’s resources. Net contribution is calculated as revenue less direct cost of sales, transaction-based clearing expenses, variable compensation, introducing broker commissions, and interest expense. Variable compensation paid to risk management consultants/traders generally represents a fixed percentage of an amount equal to revenues generated, and in some cases, revenues produced less transaction-based clearing charges, base salaries and an overhead allocation.
Segment data also includes segment income which is calculated as net contribution less non-variable direct expenses of the segment. These non-variable direct expenses include trader base compensation and benefits, operational employee compensation and benefits, communication and data services, business development, professional fees, bad debt expense and other direct expenses.
Inter-segment revenues, charges, receivables and payables are eliminated upon consolidation, except revenues and costs related to foreign currency transactions undertaken on an arm’s length basis by the foreign exchange trading business for the securities business.
On a recurring basis, the Company sweeps excess cash from certain operating segments to a centralized corporate treasury function in exchange for an intercompany receivable asset. The intercompany receivable asset is eliminated during consolidation, and therefore this practice may impact reported total assets between segments.
24
Information for the reportable segments is shown in accordance with the Segment Reporting Topic of the ASC as follows:
Three Months Ended March 31, | Six Months Ended March 31, | ||||||||||||||
(in millions) | 2016 | 2015 | 2016 | 2015 | |||||||||||
Total revenues: | |||||||||||||||
Commercial Hedging | $ | 54.7 | $ | 64.7 | $ | 110.1 | $ | 133.1 | |||||||
Global Payments | 17.4 | 18.4 | 35.7 | 33.6 | |||||||||||
Securities | 45.6 | 36.1 | 94.4 | 53.3 | |||||||||||
Physical Commodities | 3,550.7 | 14,291.9 | 6,805.2 | 27,788.6 | |||||||||||
Clearing and Execution Services | 33.3 | 31.5 | 63.1 | 62.7 | |||||||||||
Corporate unallocated | 7.2 | (0.6 | ) | 0.3 | (1.6 | ) | |||||||||
Total | $ | 3,708.9 | $ | 14,442.0 | $ | 7,108.8 | $ | 28,069.7 | |||||||
Operating revenues (loss): | |||||||||||||||
Commercial Hedging | $ | 54.7 | $ | 64.7 | $ | 110.1 | $ | 133.1 | |||||||
Global Payments | 17.4 | 18.4 | 35.7 | 33.6 | |||||||||||
Securities | 45.6 | 36.1 | 94.4 | 53.3 | |||||||||||
Physical Commodities | 7.9 | 6.4 | 13.8 | 12.9 | |||||||||||
Clearing and Execution Services | 33.3 | 31.5 | 63.1 | 62.7 | |||||||||||
Corporate unallocated | 7.2 | (0.6 | ) | 0.3 | (1.6 | ) | |||||||||
Total | $ | 166.1 | $ | 156.5 | $ | 317.4 | $ | 294.0 | |||||||
Net operating revenues (loss): | |||||||||||||||
Commercial Hedging | $ | 43.6 | $ | 53.7 | $ | 87.9 | $ | 110.7 | |||||||
Global Payments | 15.5 | 16.1 | 31.8 | 29.6 | |||||||||||
Securities | 31.8 | 25.5 | 67.8 | 35.5 | |||||||||||
Physical Commodities | 6.8 | 5.9 | 11.5 | 11.5 | |||||||||||
Clearing and Execution Services | 10.4 | 9.2 | 20.8 | 18.7 | |||||||||||
Corporate unallocated | 4.8 | (2.5 | ) | (4.2 | ) | (4.9 | ) | ||||||||
Total | $ | 112.9 | $ | 107.9 | $ | 215.6 | $ | 201.1 | |||||||
Net contribution: | |||||||||||||||
(Revenues less cost of sales of physical commodities, transaction-based clearing expenses, variable bonus compensation, introducing broker commissions and interest expense) | |||||||||||||||
Commercial Hedging | $ | 30.5 | $ | 39.3 | $ | 62.2 | $ | 79.9 | |||||||
Global Payments | 12.4 | 12.8 | 25.4 | 23.6 | |||||||||||
Securities | 25.0 | 19.6 | 54.5 | 26.2 | |||||||||||
Physical Commodities | 5.3 | 4.5 | 8.7 | 8.9 | |||||||||||
Clearing and Execution Services | 8.2 | 7.5 | 16.1 | 15.0 | |||||||||||
Total | $ | 81.4 | $ | 83.7 | $ | 166.9 | $ | 153.6 | |||||||
Segment income: | |||||||||||||||
(Net contribution less non-variable direct segment costs) | |||||||||||||||
Commercial Hedging | $ | 13.8 | $ | 21.7 | $ | 28.8 | $ | 46.6 | |||||||
Global Payments | 9.3 | 9.9 | 19.3 | 18.1 | |||||||||||
Securities | 18.2 | 12.2 | 40.1 | 13.9 | |||||||||||
Physical Commodities | 1.9 | 2.4 | 2.9 | 4.9 | |||||||||||
Clearing and Execution Services | 3.5 | 2.9 | 7.0 | 6.5 | |||||||||||
Total | $ | 46.7 | $ | 49.1 | $ | 98.1 | $ | 90.0 | |||||||
Reconciliation of segment income to income before tax: | |||||||||||||||
Segment income | $ | 46.7 | $ | 49.1 | $ | 98.1 | $ | 90.0 | |||||||
Net costs not allocated to operating segments | 26.7 | 31.0 | 66.0 | 58.3 | |||||||||||
Income before tax | $ | 20.0 | $ | 18.1 | $ | 32.1 | $ | 31.7 | |||||||
(in millions) | As of March 31, 2016 | As of September 30, 2015 | |||||||||||||
Total assets: | |||||||||||||||
Commercial Hedging | $ | 1,435.4 | $ | 1,548.1 | |||||||||||
Global Payments | 195.2 | 207.3 | |||||||||||||
Securities | 2,427.5 | 1,861.0 | |||||||||||||
Physical Commodities | 333.3 | 190.9 | |||||||||||||
Clearing and Execution Services | 1,177.2 | 1,163.8 | |||||||||||||
Corporate unallocated | 89.3 | 98.9 | |||||||||||||
Total | $ | 5,657.9 | $ | 5,070.0 | |||||||||||
25
Item 2. Management’s Discussion and Analysis of Financial Condition and Results of Operations
Throughout this document, unless the context otherwise requires, the terms “Company”, “we”, “us” and “our” refer to INTL FCStone Inc. and its consolidated subsidiaries. INTL FCStone Inc. is a Delaware corporation.
The following discussion and analysis should be read in conjunction with the financial statements and notes thereto appearing elsewhere in this report. This Quarterly Report on Form 10-Q contains “forward-looking statements” within the meaning of Section 27A of the Securities Act of 1933 and Section 21E of the Securities Exchange Act of 1934. These forward-looking statements involve known and unknown risks and uncertainties, many of which are beyond the control of INTL FCStone Inc. and its subsidiaries, including adverse changes in economic, political and market conditions, losses from our market-making and trading activities arising from counter-party failures and changes in market conditions, the possible loss of key personnel, the impact of increasing competition, the impact of changes in government regulation, the possibility of liabilities arising from violations of federal and state securities laws and the impact of changes in technology in the securities and commodities trading industries. Although we believe that our forward-looking statements are based upon reasonable assumptions regarding our business and future market conditions, there can be no assurances that our actual results will not differ materially from any results expressed or implied by our forward-looking statements. We undertake no obligation to publicly update or revise any forward-looking statements, whether as a result of new information, future events or otherwise. We caution readers that any forward-looking statements are not guarantees of future performance.
Overview
INTL FCStone Inc. is a diversified, global financial services organization providing financial products and advisory and execution services that help our clients access market liquidity, maximize profits and manage risk.
We are a leader in the development of specialized financial services in commodities, securities, global payments, foreign exchange and other markets. Our revenues are derived primarily from financial products and advisory services that fulfill our clients’ real needs and provide bottom-line benefits to their businesses. We create added value for our clients by providing access to global financial markets using our industry and financial expertise, deep partner and network relationships, insight and guidance, and integrity and transparency. Our client-first approach differentiates us from large banking institutions, engenders trust, and has enabled us to establish leadership positions in a number of complex fields in financial markets around the world.
Our leadership positions span markets such as commodity risk management advisory services; global payments; market-making in international equities and other securities; fixed income; physical trading and hedging of precious metals and select other commodities; execution of listed futures and options on futures contracts on all major commodity exchanges and foreign currency trading, among others. These businesses are supported by our global infrastructure of regulated operating subsidiaries, advanced technology platform and team of more than 1,200 employees. We currently have more than 20,000 clients, located in more than 130 countries.
Our clients include producers, processors and end-users of nearly all widely traded physical commodities; commercial counterparties who are end-users of our products and services; governmental and non-governmental organizations; and commercial banks, asset managers, insurance companies, brokers, institutional investors and major investment banks. We believe our clients value us for our focus on their needs, our expertise and flexibility, our global reach, our ability to provide access to hard-to-reach markets and opportunities, and our status as a well-capitalized and regulatory-compliant organization.
We believe we are well positioned to capitalize on key trends impacting the financial services sector. Among others, these trends include the impact of increased regulation on banking institutions and other financial services providers; increased consolidation, especially of smaller sub-scale financial services providers; the growing importance and complexity of conducting secure cross-border transactions; and the demand among financial institutions to transact with well-capitalized counterparties.
We focus on mitigating exposure to market risk, ensuring adequate liquidity to maintain daily operations and making non-interest expenses variable, to the greatest extent possible.
26
Executive Summary
We achieved 6% growth in operating revenues in the second quarter of 2016, led by our Securities segment which increased its operating revenues $9.5 million compared to the prior year. In addition, our Clearing and Execution Services (“CES”) and Physical Commodity segments increased operating revenues $1.8 and $1.5 million, respectively versus the prior year. These increases were tempered by a $10.0 million decline in our Commercial Hedging segment as well as a $1.0 million decline in Global Payments operating revenues. Corporate Unallocated segment revenues increased $7.8 million, primarily as a result of unrealized gains in our interest rate management program as discussed below.
The strong growth in our Securities segment operating revenues was as a result of a widening of spreads in our equity market making business as well as improved performance in our debt trading business, including both our domestic institutional fixed income business as well as in our Argentina operations. The increases in CES operating revenues were a result of increased rate per contract in the exchange traded business and increased volumes in our foreign exchange customer prime brokerage activities, while the increases in Physical Commodities operating revenues were primarily driven by a widening of spreads in the precious metals business driven by market volatility.
The decline in our core Commercial Hedging operating revenues was driven by a decline in over-the-counter (“OTC”) volumes, particularly in Latin and South American grain markets as well as the decline in energy market prices and volatility. These declines were partially offset by increased exchange-traded volumes in the domestic grain markets. Global Payments operating revenues declined 5%, despite an increase in the number of payments versus the prior year, as the average revenue per trade declined.
Interest income on customer deposits remains constrained by historically low short term interest rates, however, interest income in our Commercial Hedging and CES segments increased $0.8 million over the prior year period as a result of the continued implementation of our interest rate management program, despite a 4% decline in average customer equity. As discussed further in the Operating Revenues section of the Results of Operations, we recorded a $6.9 million before tax unrealized gain on the marked-to-market fluctuations on investments held by the Company as part of the interest rate management program. These unrealized fluctuations are reported in the Corporate Unallocated segment of our segmental results and are not allocated to the Commercial Hedging or CES segments.
On the expense side, we continue to focus on maintaining our variable cost model and limiting the growth of our non-variable expenses. To that end, variable expenses were 57% of total expenses in the second quarter of 2016 compared to 58% in the prior year, while non-variable expenses increased by 5% between the two periods, primarily as a result of increased compensation and benefits related to our expansion of our information technology department and increase in meeting and hosted conference expenses. Overall, net income increased 12% to $14.5 million in the second quarter as compared to the prior year.
27
Selected Summary Financial Information
Results of Operations
Total revenues reported combine gross revenues for the physical commodities business and net revenues for all other businesses. In order to reflect the way that we view the results, the table below reflects the calculation of the subtotal ‘operating revenues’, which is calculated by deducting physical commodities cost of sales from total revenues.
Set forth below is a discussion of the results of our operations, as viewed by management, for the three and six months ended March 31, 2016 and 2015.
Financial Information (Unaudited)
Three Months Ended March 31, | Six Months Ended March 31, | ||||||||||||||||||||
(in millions) | 2016 | % Change | 2015 | 2016 | % Change | 2015 | |||||||||||||||
Revenues: | |||||||||||||||||||||
Sales of physical commodities | $ | 3,548.0 | (75 | )% | $ | 14,291.6 | $ | 6,800.6 | (76 | )% | $ | 27,785.9 | |||||||||
Trading gains, net | 80.7 | (5 | )% | 84.8 | 160.4 | 3 | % | 155.1 | |||||||||||||
Commission and clearing fees | 52.1 | 10 | % | 47.2 | 101.2 | 5 | % | 96.7 | |||||||||||||
Consulting and management fees | 9.6 | 3 | % | 9.3 | 19.3 | (2 | )% | 19.7 | |||||||||||||
Interest income | 18.5 | 106 | % | 9.0 | 27.2 | 125 | % | 12.1 | |||||||||||||
Other income | — | (100 | )% | 0.1 | 0.1 | (50 | )% | 0.2 | |||||||||||||
Total revenues | 3,708.9 | (74 | )% | 14,442.0 | 7,108.8 | (75 | )% | 28,069.7 | |||||||||||||
Cost of sales of physical commodities | 3,542.8 | (75 | )% | 14,285.5 | 6,791.4 | (76 | )% | 27,775.7 | |||||||||||||
Operating revenues | 166.1 | 6 | % | 156.5 | 317.4 | 8 | % | 294.0 | |||||||||||||
Transaction-based clearing expenses | 32.9 | 3 | % | 31.8 | 62.7 | 2 | % | 61.2 | |||||||||||||
Introducing broker commissions | 13.2 | 7 | % | 12.3 | 26.0 | 6 | % | 24.5 | |||||||||||||
Interest expense | 7.1 | 58 | % | 4.5 | 13.1 | 82 | % | 7.2 | |||||||||||||
Net operating revenues | 112.9 | 5 | % | 107.9 | 215.6 | 7 | % | 201.1 | |||||||||||||
Compensation and other expenses | 92.9 | 3 | % | 89.8 | 183.5 | 8 | % | 169.4 | |||||||||||||
Income before tax | 20.0 | 10 | % | 18.1 | 32.1 | 1 | % | 31.7 | |||||||||||||
Income tax expense | 5.5 | 8 | % | 5.1 | 8.8 | (5 | )% | 9.3 | |||||||||||||
Net income | $ | 14.5 | 12 | % | $ | 13.0 | $ | 23.3 | 4 | % | $ | 22.4 | |||||||||
Balance Sheet information: | March 31, 2016 | % Change | March 31, 2015 | ||||||||||||||||||
Total assets | $ | 5,657.9 | 27 | % | $ | 4,462.6 | |||||||||||||||
Payables to lenders under loans | $ | 151.5 | 231 | % | $ | 45.8 | |||||||||||||||
Senior unsecured notes | $ | 45.5 | — | % | $ | 45.5 | |||||||||||||||
Stockholders’ equity | $ | 408.2 | 10 | % | $ | 369.5 | |||||||||||||||
The selected data table below reflects key operating metrics used by management in evaluating our product lines, for the periods indicated:
Three Months Ended March 31, | Six Months Ended March 31, | ||||||||||||||||||||
2016 | % Change | 2015 | 2016 | % Change | 2015 | ||||||||||||||||
Volumes and Other Data: | |||||||||||||||||||||
Exchange-traded volume (contracts, 000’s) | 26,596.2 | 2 | % | 26,182.7 | 50,821.3 | (1 | )% | 51,359.1 | |||||||||||||
OTC volume (contracts, 000’s) | 302.0 | (33 | )% | 448.8 | 616.7 | (17 | )% | 739.0 | |||||||||||||
Global payments (# of payments, 000’s) | 101.1 | 14 | % | 88.7 | 196.7 | 25 | % | 157.4 | |||||||||||||
Gold equivalent ounces traded (000’s) | 21,619.3 | (43 | )% | 38,145.1 | 45,139.1 | (37 | )% | 71,565.4 | |||||||||||||
Equity market-making (gross dollar volume, millions) | $ | 26,108.5 | (3 | )% | $ | 26,927.2 | $ | 50,407.2 | (1 | )% | $ | 51,061.2 | |||||||||
Foreign exchange prime brokerage volume (U.S. notional, millions) | $ | 154,108.5 | 43 | % | $ | 108,135.9 | $ | 278,660.1 | 24 | % | $ | 224,037.6 | |||||||||
Average assets under management (U.S. dollar, millions) | $ | 515.4 | (8 | )% | $ | 562.5 | $ | 581.9 | — | % | $ | 580.5 | |||||||||
Average customer equity (millions) | $ | 1,817.0 | (4 | )% | $ | 1,894.2 | $ | 1,820.9 | (8 | )% | $ | 1,979.2 | |||||||||
28
Operating Revenues
Three Months Ended March 31, 2016 Compared to Three Months Ended March 31, 2015
Operating revenues increased 6% to $166.1 million in the second quarter compared to $156.5 million in the prior year. Operating revenues for the second quarter included a $6.9 million before tax unrealized gain on interest rate swaps and U.S. Treasury notes related to our on-going interest rate management program. Under this program, on a quarterly basis, we evaluate our overall level of short term investable balances, net of our variable rate debt, and either invest a portion of these investable balances in medium term U.S. Treasury notes or enter into interest rate swaps intended to swap out short term variable interest earnings into a medium-term interest stream. Under this program, we do not actively trade in such instruments and intend to hold these investment to their maturity date, however in accordance with U.S. GAAP, the change in fair value of the interest rate swaps and the investment holdings are included in operating revenues in the current period.
In addition to this unrealized gain, operating revenue growth was driven by strong growth in our Securities segment which added $9.5 million in the second quarter, however this was mostly offset by weaker performance in our Commercial Hedging segment, which experienced a $10.0 million decline in operating revenues versus the prior year. The Clearing and Execution Services (“CES”) and Physical Commodities segments added $1.8 million and $1.5 million, respectively, compared to the prior year. Global Payments segment operating revenues declined $1.0 million versus the prior year.
Operating revenues in our largest segment, Commercial Hedging, decreased 15% in the second quarter to $54.7 million, as a $2.0 million increase in exchange-traded revenues was more than offset by a $12.0 million decrease in OTC revenues. An 18% increase in customer volumes, particularly in the domestic grain markets and our London operations, drove the increase in exchange-traded revenues. A 33% decline in OTC customer volumes, as a result of low energy market prices and volatility as well as lower customer volumes in Latin and South America, drove the decline in OTC revenues.
Operating revenues in our Securities segment increased 26% to $45.6 million in the second quarter compared to the prior year. This was the first quarter in the Securities segment in which both the current quarter and the prior year period included the result of the institutional fixed income business acquired from G.X. Clarke. A $1.0 million increase in operating revenues in the institutional fixed income business versus the prior year as well as improved performance in our Argentina operations and the municipal bond business also contributed to the growth in operating revenues. In addition, operating revenues in the equity market making business increased $4.2 million, driven by improved market conditions, resulting in a widening of spreads in this business.
Operating revenues in our Global Payments segment decreased modestly in the second quarter to $17.4 million compared to the prior year, as a 14% increase in the number of global payments made was more than offset by a narrowing of spreads in this business due to a continuing increase in lower dollar value per payment transaction volume from financial institutions.
Operating revenues in our CES segment increased $1.8 million to $33.3 million in the second quarter. Exchange-traded commission and clearing fee revenues increased $0.7 million, despite a 2% decline in exchange-traded volumes, as a result of the overall business mix. Increased market volatility drove a $0.7 million increase in operating revenues in the customer prime brokerage produce line, with customer volumes increasing 43% in the second quarter compared to the prior year.
Our Physical Commodity segment operating revenues increased $1.5 million compared to the prior year period as a result of a widening of spreads in the precious metals business which added $1.1 million in the second quarter. The Physical Ag’s & Energy business also added $0.4 million in operating revenues versus the prior year.
Overall interest income increased $9.5 million to $18.5 million in the second quarter. Historically, our interest income has been driven by the average customer equity in our Commercial Hedging and CES segments, as well as short term interest rates. Our acquisition of G.X. Clarke, resulted in a significant change to our aggregate level of interest income. In the second quarter, the institutional fixed income business added $3.8 million in interest income versus the prior year. Interest income in our Commercial Hedging and CES segments increased $0.8 million, despite a 4% decrease in average customer equity, as a result of the continued implementation of our interest rate management program. Of the $6.9 million before tax unrealized gain in this program, discussed above, $4.6 million of this unrealized gain is recorded as interest income on the Condensed Consolidated Income Statement, while the remaining $2.3 million is recorded in trading gains, net.
See Segment Information below for additional information on activity in each of the segments.
Six Months Ended March 31, 2016 Compared to Six Months Ended March 31, 2015
Our operating revenues for the current six months ended and the prior year were $317.4 million and $294.0 million, respectively. Operating revenues for the current six months ended include a $0.2 million before tax unrealized loss on interest rate swaps and U.S. Treasury notes related to our on-going interest rate management program as discussed above.
Operating revenue growth in the current six months ended was driven by strong growth in our Securities segment which increased $41.1 million compared to the prior year, as well as a $2.1 million increase in Global Payments operating revenues.
29
Operating revenues increased $0.4 million and $0.9 million in our CES and Physical Commodities segments, respectively. However, these increases were tempered by a $23.0 million decline in our Commercial Hedging segment.
Operating revenues in our Commercial Hedging segment decreased 17% in the current six months ended to $110.1 million, as OTC revenues decreased $23.2 million to $35.5 million as a result of a 17% decline in OTC volumes, primarily in the Latin and South American markets and a narrowing of spreads driven by lower energy prices and volatility. Exchange-traded revenues increased $0.8 million to $64.0 million in the current six months ended as customer volumes increased 14%, primarily in the domestic grain markets, however this was tempered by an 11% decline in the average rate per contract.
Operating revenues in our Securities segment increased 77% in the current six months ended to $94.4 million, primarily as a result of a $29.9 million increase in our Debt Trading product line, while Equity market-making and Asset Management added $6.5 million and $4.7 million, respectively. The increase in Debt Trading operating revenues was primarily a result of the acquisition of G.X. Clarke, which was effective January 1, 2015 and thus only contributed operating revenues beginning in the second quarter of fiscal 2015, as well as the strong performance in Argentina related to the devaluation of the Argentine Peso.
Operating revenues in our Global Payments segment increased 6% in the current six months ended to $35.7 million compared to the prior year, driven by a 25% increase in the number of global payments made, however spreads have narrowed in this business due to a continuing increase in lower dollar value per payment transaction volume from financial institutions.
Physical Commodity segment operating revenues increased $0.9 million compared to the prior year period, as a $2.1 million increase in Precious metals operating revenues were partially offset by a $1.2 million decline in the Physical Agricultural & Energy commodity product line.
Operating revenues in our CES segment increased 1% in the current six months ended to $63.1 million. Exchange-traded commission and clearing fee revenues decreased $1.3 million, to $48.7 million as a result of a 5% decline in exchange-traded volumes. This decline was more than offset by the $1.2 million increase in operating revenues in our customer prime brokerage product line, driven by increased market volatility in foreign exchange markets, as well as the $0.5 million increase in interest income.
Overall, interest income increased $15.1 million to $27.2 million in the current six months ended, significantly impacted by the acquisition of G.X. Clarke which added $17.0 million in interest income during the current six months ended versus $5.2 million in the prior year. The continued implementation of our interest rate management program and an increase in interest income in our precious metals business also contributed to the increase in interest income.
See Segment Information below for additional information on activity in each of the segments.
Interest and Transactional Expenses
Three Months Ended March 31, 2016 Compared to Three Months Ended March 31, 2015
Transaction-based clearing expenses: Transaction-based clearing expenses increased 3% to $32.9 million in the second quarter compared to $31.8 million in the prior year, and were 20% of operating revenues in the second quarter as well as in the prior year.
Introducing broker commissions: Introducing broker commissions increased 7% to $13.2 million in the second quarter compared to $12.3 million in the prior year, and were 8% of operating revenues in the second quarter as well as in the prior year. The increase in expense is primarily due to increased activity in our Debt Trading component in Argentina.
Interest expense: Interest expense increased 58% to $7.1 million in the second quarter compared to $4.5 million in the prior year. The increase in expense is primarily related to the fixed income trading activities from our Rates Division, which resulted in higher interest expense of $1.9 million. Additionally, higher average borrowings outstanding on the credit facility available for working capital needs resulted in increased expense.
Six Months Ended March 31, 2016 Compared to Six Months Ended March 31, 2015
Transaction-based clearing expenses: Transaction-based clearing expenses increased 2% to $62.7 million in the current six months ended compared to $61.2 million in the prior year, and were 20% of operating revenues in the current six months ended compared to 21% in the prior year.
Introducing broker commissions: Introducing broker commissions increased 6% to $26.0 million in the current six months ended compared to $24.5 million in the prior year, and were 8% of operating revenues in the current six months ended as well as the prior year. The increase in expense is primarily due to increased activity in our Debt Trading and Equities components, partially offset by lower introducing broker commissions in our CES component.
30
Interest expense: Interest expense increased 82% to $13.1 million in the current six months ended compared to $7.2 million in the prior year. This increase is primarily related to the fixed income trading activities from our Rates Division, acquired on January 1, 2015, which resulted in higher interest expense of $4.6 million. Additionally, higher average borrowings outstanding on the credit facility available for working capital needs and higher activity associated with our finance programs resulted in increased expense.
Net Operating Revenues
Net operating revenues is one of the key measures used by management to assess the performance of our operating segments. Net operating revenue is calculated as operating revenue less transaction-based clearing expenses, introducing broker commissions and interest expense. Transaction-based clearing expenses represent variable expenses paid to executing brokers, exchanges, clearing organizations and banks in relation to our transactional volumes. Introducing broker commissions include commission paid to non-employee third parties that have introduced customers to us. Net operating revenues represent revenues available to pay variable compensation to risk management consultants, traders and administrative employees as well as non-variable expenses.
Three Months Ended March 31, 2016 Compared to Three Months Ended March 31, 2015
Net operating revenues increased $5.0 million, or 5%, to $112.9 million in the second quarter compared to $107.9 million in the prior year.
Six Months Ended March 31, 2016 Compared to Six Months Ended March 31, 2015
Net operating revenues increased $14.5 million, or 7%, to $215.6 million in the current six months ended compared to $201.1 million in the prior year.
Compensation and Other Expenses
The following table shows a summary of expenses, other than interest and transactional expenses.
Three Months Ended March 31, | Six Months Ended March 31, | ||||||||||||||||||||
(in millions) | 2016 | % Change | 2015 | 2016 | % Change | 2015 | |||||||||||||||
Compensation and benefits: | |||||||||||||||||||||
Fixed compensation and benefits | $ | 31.6 | 5 | % | $ | 30.0 | $ | 61.5 | 8 | % | $ | 56.8 | |||||||||
Variable compensation and benefits | 33.6 | 2 | % | 33.1 | 66.8 | 7 | % | 62.7 | |||||||||||||
65.2 | 3 | % | 63.1 | 128.3 | 7 | % | 119.5 | ||||||||||||||
Other non-compensation expenses: | |||||||||||||||||||||
Communication and data services | 7.3 | 1 | % | 7.2 | 15.2 | 9 | % | 13.9 | |||||||||||||
Occupancy and equipment rental | 3.2 | (16 | )% | 3.8 | 6.5 | (6 | )% | 6.9 | |||||||||||||
Professional fees | 2.7 | (13 | )% | 3.1 | 5.6 | (13 | )% | 6.4 | |||||||||||||
Travel and business development | 2.3 | (8 | )% | 2.5 | 5.5 | 4 | % | 5.3 | |||||||||||||
Depreciation and amortization | 2.2 | 22 | % | 1.8 | 4.1 | 11 | % | 3.7 | |||||||||||||
Bad debts | 2.6 | (7 | )% | 2.8 | 4.6 | 64 | % | 2.8 | |||||||||||||
Other expense | 7.4 | 35 | % | 5.5 | 13.7 | 26 | % | 10.9 | |||||||||||||
27.7 | 4 | % | 26.7 | 55.2 | 11 | % | 49.9 | ||||||||||||||
Total compensation and other expenses | $ | 92.9 | 3 | % | $ | 89.8 | $ | 183.5 | 8 | % | $ | 169.4 | |||||||||
Three Months Ended March 31, 2016 Compared to Three Months Ended March 31, 2015
Compensation and Other Expenses: Compensation and other expenses increased $3.1 million, or 3%, to $92.9 million in the second quarter compared to $89.8 million in the prior year.
Compensation and Benefits: Total compensation and benefits expense increased 3% to $65.2 million in the second quarter compared to $63.1 million in the prior year. Total compensation and benefits were 39% of operating revenues in the second quarter compared to 40% in the prior year. The variable portion of compensation and benefits increased by 2% to $33.6 million in the second quarter compared to $33.1 million in the prior year. Variable compensation and benefits were 30% of net operating revenues in the second quarter compared to 31% in the prior year. Administrative, centralized operations and executive incentive compensation was $6.9 million in the second quarter compared to $6.4 million in the prior year.
The fixed portion of compensation and benefits increased 5% to $31.6 million in the second quarter compared to $30.0 million in the prior year. Non-variable salaries increased $0.4 million, or 2%, primarily due to additional headcount, including an expansion in our information technology department. Employee benefits, excluding share-based compensation, increased $0.5
31
million in the second quarter, primarily due to higher employer health care costs. Share-based compensation is a component of the fixed portion, and includes stock option and restricted stock expense. Share-based compensation was $1.7 million in the second quarter compared with $0.9 million in the prior year, primarily due to an increase in restricted stock expense. The number of employees decreased 1% to 1,259 at the end of the second quarter compared to 1,273 at the beginning of the second quarter. The number of employees at the end of the prior year period was 1,196.
Other Non-Compensation Expenses: Other non-compensation expenses increased 4% to $27.7 million in the second quarter compared to $26.7 million in the prior year. Occupancy and equipment rental decreased $0.6 million, primarily due to the prior year including a lease buyout cost of an aircraft. Professional fees decreased $0.4 million, primarily related to a decrease in legal fees. Depreciation and amortization increased $0.4 million, primarily related to the premature disposal of certain leasehold improvements. Other expenses increased primarily due to the costs of holding our internal bi-annual global sales meeting during January 2016.
Bad debts decreased $0.2 million over the prior year. During the second quarter, bad debts were $2.6 million and primarily related to $1.4 million of customer receivables in our Physical Ag’s & Energy component of our Physical Commodities segment, $1.0 million of customer deficits in our Commercial Hedging segment and $0.2 million related to short-term notes receivable origination in our Securities segment. Bad debt expense in the prior year was $2.8 million and primarily related to LME customer deficits, notes receviable related to loans pertaining to a former acquisition and the charge-off of uncollectible service fees.
Provision for Taxes: The effective income tax rate was 28% in the second quarter and in the prior year. The effective income tax rate can vary from period to period depending on, among other factors, the geographic and business mix of our earnings. Our effective income tax rate during both periods was lower than the U.S. federal statutory rate primarily due to a higher mix of earnings taxed at lower rates in foreign jurisdictions.
Six Months Ended March 31, 2016 Compared to Six Months Ended March 31, 2015
Compensation and Other Expenses: Compensation and other expenses increased $14.1 million, or 8%, to $183.5 million in the current six months ended compared to $169.4 million in the prior year.
Compensation and Benefits: Compensation and benefits expense increased $8.8 million to $128.3 million compared to $119.5 million in the prior year. Total compensation and benefits were 40% of operating revenues in the current six months ended compared to 41% of operating revenues in the prior year. The variable portion of compensation and benefits increased 7% to $66.8 million in the current six months ended compared to $62.7 million in the prior year. Variable compensation and benefits were 31% of net operating revenues in the current six months ended as well as in the prior year. Administrative, centralized operations and executive incentive compensation was $13.9 million in the current six months ended compared to $10.3 million in the prior year, primarily related to the acquisition of the Rates Division in January 2015 as well as increased administrative headcount.
The fixed portion of compensation and benefits increased to $61.5 million in the current six months ended compared to $56.8 million in the prior year. Non-variable salaries increased $2.9 million, or 7%, primarily due to incremental costs from the acquisition of the Rates Division in January 2015 and headcount increases across certain administrative departments. Employee benefits, excluding share-based compensation, increased $1.5 million in the current six months ended, primarily due to higher employer health care costs. Share-based compensation is a component of the fixed portion, and includes stock option and restricted stock expense. Share-based compensation was $2.5 million in the current six months ended compared to $1.8 million in the prior year. The number of employees increased 2% to 1,259 at the end of the second quarter compared to 1,231 at the end of fiscal 2015. The number of employees at the end of the prior year period was 1,196.
Other Non-Compensation Expenses: Other non-interest expenses increased 11% to $55.2 million in the current six months ended compared to $49.9 million in the prior year. Communication and data services expenses increased $1.3 million, primarily due to increases in market information expenses related to the acquisition of the Rates Division. Professional fees decreased $0.8 million, primarily related to lower legal fees. Depreciation and amortization increased $0.4 million, primarily related to the premature disposal of certain leasehold improvements. Other expenses increased primarily due to the costs of holding our internal bi-annual global sales meeting during January 2016.
Bad debt expense increased $1.8 million over the prior year. In the current six months ended, bad debts were $4.6 million and primarily related to $1.5 million of customer receivables in our Physical Ag’s & Energy component of our Physical Commodities segment, $2.7 million of customer deficits in our Commercial Hedging segment and $0.3 million related to short-term notes receivable origination in our Securities segment. Bad debt expense in the prior year was $2.8 million and primarily related to LME customer deficits, notes receivable related to loans pertaining to a former acquisition and the charge-off of uncollectible service fees.
32
Provision for Taxes: The effective income tax rate was 27% in the current six months ended compared to 29% in the prior year. The effective income tax rate can vary from period to period depending on, among other factors, the geographic and business mix of our earnings. Our effective income tax rate during both periods was lower than the U.S. federal statutory rate primarily due to a higher mix of earnings taxed at lower rates in foreign jurisdictions.
Unallocated Costs and Expenses
The following table is a breakout of our unallocated costs and expenses from the total costs and expenses shown above. The unallocated costs and expenses include certain shared services such as information technology, accounting and treasury, credit and risk, legal and compliance, and human resources and other activities.
Three Months Ended March 31, | Six Months Ended March 31, | ||||||||||||||||||||
(in millions) | 2016 | % Change | 2015 | 2016 | % Change | 2015 | |||||||||||||||
Compensation and benefits: | |||||||||||||||||||||
Fixed compensation and benefits | $ | 11.7 | 26 | % | $ | 9.3 | $ | 21.8 | 22 | % | $ | 17.9 | |||||||||
Variable compensation and benefits | 6.3 | 5 | % | 6.0 | 12.7 | 35 | % | 9.4 | |||||||||||||
18.0 | 18 | % | 15.3 | 34.5 | 26 | % | 27.3 | ||||||||||||||
Other non-compensation expenses: | |||||||||||||||||||||
Communication and data services | 1.4 | 17 | % | 1.2 | 2.7 | 17 | % | 2.3 | |||||||||||||
Occupancy and equipment rental | 3.1 | (16 | )% | 3.7 | 6.4 | (6 | )% | 6.8 | |||||||||||||
Professional fees | 1.5 | (25 | )% | 2.0 | 3.2 | (26 | )% | 4.3 | |||||||||||||
Travel and business development | 0.5 | — | % | 0.5 | 1.1 | (8 | )% | 1.2 | |||||||||||||
Depreciation and amortization | 1.8 | 29 | % | 1.4 | 3.3 | 10 | % | 3.0 | |||||||||||||
Bad debts | — | (100 | )% | 1.1 | — | (100 | )% | 1.1 | |||||||||||||
Other expense | 5.2 | 44 | % | 3.6 | 10.6 | 33 | % | 8.0 | |||||||||||||
13.5 | — | % | 13.5 | 27.3 | 2 | % | 26.7 | ||||||||||||||
Total compensation and other expenses | $ | 31.5 | 9 | % | $ | 28.8 | $ | 61.8 | 14 | % | $ | 54.0 | |||||||||
Total unallocated costs and other expenses increased $2.7 million to $31.5 million in the second quarter compared to $28.8 million in the prior year. Compensation and benefits increased $2.7 million, or 18% to $18.0 million in the second quarter compared to $15.3 million in the prior year.
Total unallocated costs and other expenses increased $7.8 million, or 14%, to $61.8 million in the current six months ended compared to $54.0 million in the prior year. Compensation and benefits increased $7.2 million, or 26% to $34.5 million in the current six months ended compared to $27.3 million in the prior year.
During the current six months ended, the increases in fixed and variable compensation and benefits is primarily related to the incremental costs from the acquisition of G.X. Clarke, higher management incentives earned in Argentina and expansion of our information technology department. The decrease in professional fees is primarily due to lower legal costs related to regulatory matters over the prior year. The increase in other expense is primarily related to higher centralized operations costs and costs of holding our internal bi-annual global sales meeting during January 2016. Excluding the incremental unallocated costs from the acquisition of G.X. Clarke, total compensation and other expenses increased 10% over the prior year.
33
Variable vs. Fixed Expenses
Three Months Ended March 31, | Six Months Ended March 31, | ||||||||||||||||||||||||||
(in millions) | 2016 | % of Total | 2015 | % of Total | 2016 | % of Total | 2015 | % of Total | |||||||||||||||||||
Variable compensation and benefits | $ | 33.6 | 24 | % | $ | 33.1 | 25 | % | $ | 66.8 | 25 | % | $ | 62.7 | 25 | % | |||||||||||
Transaction-based clearing expenses | 32.9 | 24 | % | 31.8 | 24 | % | 62.7 | 23 | % | 61.2 | 23 | % | |||||||||||||||
Introducing broker commissions | 13.2 | 9 | % | 12.3 | 9 | % | 26.0 | 9 | % | 24.5 | 10 | % | |||||||||||||||
Total variable expenses | 79.7 | 57 | % | 77.2 | 58 | % | 155.5 | 57 | % | 148.4 | 58 | % | |||||||||||||||
Fixed compensation and benefits | 31.6 | 23 | % | 30.0 | 22 | % | 61.5 | 23 | % | 56.8 | 22 | % | |||||||||||||||
Other fixed expenses | 25.1 | 18 | % | 23.9 | 18 | % | 50.6 | 18 | % | 47.1 | 19 | % | |||||||||||||||
Bad debts and impairments | 2.6 | 2 | % | 2.8 | 2 | % | 4.6 | 2 | % | 2.8 | 1 | % | |||||||||||||||
Total non-variable expenses | 59.3 | 43 | % | 56.7 | 42 | % | 116.7 | 43 | % | 106.7 | 42 | % | |||||||||||||||
Total non-interest expenses | $ | 139.0 | 100 | % | $ | 133.9 | 100 | % | $ | 272.2 | 100 | % | $ | 255.1 | 100 | % | |||||||||||
We seek to make our non-interest expenses variable to the greatest extent possible, and to keep our fixed costs as low as possible. The table above shows an analysis of our variable expenses and non-variable expenses as a percentage of total non-interest expenses for the three and six months ended March 31, 2016 and 2015, respectively.
Our variable expenses include variable compensation paid to traders and risk management consultants, bonuses paid to operational, administrative, and executive employees, transaction-based clearing expenses and introducing broker commissions. As a percentage of total non-interest expenses, variable expenses were 57% in the second quarter compared to 58% in the prior year. As a percentage of total non-interest expenses, variable expenses were 57% in the current six months ended compared to 58% in the prior year.
Segment Information
Our business activities are managed as operating segments and organized into reportable segments as follows:
INTL FCStone Inc. | |||||||||||||
Commercial Hedging | Global Payments | Securities | Physical Commodities | Clearing and Execution Services (“CES”) | |||||||||
Components: | Component: | Components: | Components: | Components: | |||||||||
- Financial Ag’s & Energy | - Global Payments | - Equity market- making | - Precious metals | - Clearing and Execution Services | |||||||||
- LME metals | - Debt Trading | - Physical Ag’s & Energy | - FX Prime Brokerage | ||||||||||
- Investment Banking | |||||||||||||
- Asset Management | |||||||||||||
We report our operating segments based on services provided to customers. Net contribution is one of the key measures used by management to assess the performance of each segment and for decisions regarding the allocation of our resources. Net contribution is calculated as revenue less direct cost of sales, transaction-based clearing expenses, introducing broker commissions, interest expense and variable compensation. Variable compensation paid to risk management consultants and traders generally represents a fixed percentage of an amount equal to revenues generated, and in some cases, revenues generated less transaction-based clearing expense and related charges, base salaries and an overhead allocation.
Segment income is calculated as net contribution less non-variable direct expenses of the segment. These non-variable direct expenses include trader base compensation and benefits, operational charges, communication and data services, business development, professional fees, bad debt expense, trade errors and direct marketing expenses.
34
Total Segment Results
The following table shows summary information concerning all of our business segments combined.
Three Months Ended March 31, | Six Months Ended March 31, | ||||||||||||||||||||||
(in millions) | 2016 | % of Operating Revenues | 2015 | % of Operating Revenues | 2016 | % of Operating Revenues | 2015 | % of Operating Revenues | |||||||||||||||
Sales of physical commodities | $ | 3,548.0 | $ | 14,291.6 | $ | 6,800.6 | $ | 27,785.9 | |||||||||||||||
Trading gains, net | 77.3 | 84.8 | 158.5 | 155.3 | |||||||||||||||||||
Commission and clearing fees | 52.1 | 47.2 | 101.2 | 96.7 | |||||||||||||||||||
Consulting and management fees | 9.3 | 9.3 | 18.7 | 19.7 | |||||||||||||||||||
Interest income | 15.1 | 9.7 | 29.5 | 13.7 | |||||||||||||||||||
Other | (0.1 | ) | — | — | — | ||||||||||||||||||
Total revenues | 3,701.7 | 14,442.6 | 7,108.5 | 28,071.3 | |||||||||||||||||||
Cost of sales of physical commodities | 3,542.8 | 14,285.5 | 6,791.4 | 27,775.7 | |||||||||||||||||||
Operating revenues | 158.9 | 100% | 157.1 | 100% | 317.1 | 100% | 295.6 | 100% | |||||||||||||||
Transaction-based clearing expenses | 32.3 | 20% | 31.5 | 20% | 61.6 | 19% | 60.6 | 21% | |||||||||||||||
Introducing broker commissions | 13.2 | 8% | 12.3 | 8% | 26.0 | 8% | 24.5 | 8% | |||||||||||||||
Interest expense | 5.3 | 3% | 2.9 | 2% | 9.7 | 3% | 4.5 | 2% | |||||||||||||||
Net operating revenues | 108.1 | 110.4 | 219.8 | 206.0 | |||||||||||||||||||
Variable direct compensation and benefits | 26.7 | 17% | 26.7 | 17% | 52.9 | 17% | 52.4 | 18% | |||||||||||||||
Net contribution | 81.4 | 83.7 | 166.9 | 153.6 | |||||||||||||||||||
Non-variable direct expenses | 34.7 | 22% | 34.6 | 22% | 68.8 | 22% | 63.6 | 22% | |||||||||||||||
Segment income | $ | 46.7 | $ | 49.1 | $ | 98.1 | $ | 90.0 | |||||||||||||||
Three Months Ended March 31, 2016 Compared to Three Months Ended March 31, 2015
Net contribution for all of our business segments decreased 3% to $81.4 million in the second quarter compared to $83.7 million in the prior year. Segment income decreased 5% to $46.7 million in the second quarter compared to $49.1 million in the prior year.
Six Months Ended March 31, 2016 Compared to Six Months Ended March 31, 2015
Net contribution for all of our business segments increased 9% to $166.9 million in the current six months ended compared to $153.6 million in the prior year. Segment income increased 9% to $98.1 million in the current six months ended compared to $90.0 million in the prior year.
Commercial Hedging
We serve our commercial clients through our team of risk management consultants, providing a high-value-added service that we believe differentiates us from our competitors and maximizes the opportunity to retain our clients. Our risk management consulting services are designed to quantify and monitor commercial entities’ exposure to commodity and financial risk. Upon assessing this exposure, we develop a plan to control and hedge these risks with post-trade reporting against specific client objectives. Our clients are assisted in the execution of their hedging strategies through a wide range of products from listed exchange-traded futures and options, to basic OTC instruments that offer greater flexibility, to structured OTC products designed for customized solutions.
Our services span virtually all traded commodity markets, with the largest concentrations in agricultural and energy commodities (consisting primarily of grains, energy and renewable fuels, coffee, sugar, cotton, and food service) and base metals products listed on the LME. Our base metals business includes a position as a Category One ring dealing member of the LME, providing execution, clearing and advisory services in exchange-traded futures and OTC products. We also provide execution of foreign currency forwards and options as well as a wide range of structured product solutions to our commercial customers who are seeking cost-effective hedging strategies. Generally, our clients direct their own trading activity, and our risk management consultants do not have discretionary authority to transact trades on behalf of our clients.
35
The following table provides the financial performance for Commercial Hedging for the periods indicated.
Three Months Ended March 31, | Six Months Ended March 31, | ||||||||||||||||||
(in millions) | 2016 | % Change | 2015 | 2016 | % Change | 2015 | |||||||||||||
Sales of physical commodities | $ | — | — | $ | — | $ | — | — | $ | — | |||||||||
Trading gains, net | 26.9 | (31)% | 39.0 | 54.7 | (30)% | 78.6 | |||||||||||||
Commission and clearing fees | 22.4 | 11% | 20.2 | 44.8 | 3% | 43.3 | |||||||||||||
Consulting and management fees | 3.4 | (11)% | 3.8 | 6.7 | (14)% | 7.8 | |||||||||||||
Interest income | 2.1 | 24% | 1.7 | 3.9 | 15% | 3.4 | |||||||||||||
Other | (0.1 | ) | n/m | — | — | — | — | ||||||||||||
Total revenues | 54.7 | (15)% | 64.7 | 110.1 | (17)% | 133.1 | |||||||||||||
Cost of sales of physical commodities | — | — | — | — | — | — | |||||||||||||
Operating revenues | 54.7 | (15)% | 64.7 | 110.1 | (17)% | 133.1 | |||||||||||||
Transaction-based clearing expenses | 6.7 | 2% | 6.6 | 13.5 | 2% | 13.2 | |||||||||||||
Introducing broker commissions | 4.3 | (2)% | 4.4 | 8.5 | (7)% | 9.1 | |||||||||||||
Interest expense | 0.1 | n/m | — | 0.2 | 100% | 0.1 | |||||||||||||
Net operating revenues | 43.6 | (19)% | 53.7 | 87.9 | (21)% | 110.7 | |||||||||||||
Variable direct compensation and benefits | 13.1 | (9)% | 14.4 | 25.7 | (17)% | 30.8 | |||||||||||||
Net contribution | 30.5 | (22)% | 39.3 | 62.2 | (22)% | 79.9 | |||||||||||||
Non-variable direct expenses | 16.7 | (5)% | 17.6 | 33.4 | —% | 33.3 | |||||||||||||
Segment income | $ | 13.8 | (36)% | $ | 21.7 | $ | 28.8 | (38)% | $ | 46.6 | |||||||||
The following tables set forth transactional revenues and selected data for Commercial Hedging for the periods indicated.
Exchange-traded | |||||||||||||||||||
Three Months Ended March 31, | Six Months Ended March 31, | ||||||||||||||||||
2016 | % Change | 2015 | 2016 | % Change | 2015 | ||||||||||||||
Transactional revenues (in millions): | |||||||||||||||||||
Agricultural | $ | 15.8 | 12% | $ | 14.1 | $ | 32.2 | 6% | $ | 30.5 | |||||||||
Energy and renewable fuels | 1.5 | 15% | 1.3 | 2.9 | —% | 2.9 | |||||||||||||
LME metals | 13.4 | 2% | 13.2 | 25.7 | —% | 25.6 | |||||||||||||
Other | 1.7 | (6)% | 1.8 | 3.2 | (24)% | 4.2 | |||||||||||||
$ | 32.4 | 7% | $ | 30.4 | $ | 64.0 | 1% | $ | 63.2 | ||||||||||
Selected data: | |||||||||||||||||||
Volume (contracts, 000’s) | 5,653.3 | 18% | 4,793.4 | 11,184.3 | 14% | 9,848.8 | |||||||||||||
Average rate per contract (1) | $ | 5.62 | (10)% | $ | 6.25 | $ | 5.61 | (11)% | $ | 6.33 | |||||||||
Average customer equity (millions) | $ | 875.1 | 6% | $ | 823.7 | $ | 877.8 | —% | $ | 876.9 | |||||||||
(1) Give-up fee revenues included in exchange-traded transactional revenues are excluded from the calculation of exchange-traded average rate per contract.
OTC | |||||||||||||||||||
Three Months Ended March 31, | Six Months Ended March 31, | ||||||||||||||||||
2016 | % Change | 2015 | 2016 | % Change | 2015 | ||||||||||||||
Transactional revenues (in millions): | |||||||||||||||||||
Agricultural | $ | 9.9 | (42)% | $ | 17.0 | $ | 19.7 | (36)% | $ | 30.8 | |||||||||
Energy and renewable fuels | 5.5 | (39)% | 9.0 | 12.0 | (44)% | 21.3 | |||||||||||||
Other | 1.4 | (50)% | 2.8 | 3.8 | (42)% | 6.6 | |||||||||||||
$ | 16.8 | (42)% | $ | 28.8 | $ | 35.5 | (40)% | $ | 58.7 | ||||||||||
Selected data: | |||||||||||||||||||
Volume (contracts, 000’s) | 302.0 | (33)% | 448.8 | 616.7 | (17)% | 739.0 | |||||||||||||
Average rate per contract (1) | $ | 53.72 | (14)% | $ | 62.39 | $ | 55.52 | (28)% | $ | 76.64 | |||||||||
(1) Cash brokerage revenues included in OTC transactional revenues are excluded from the calculation of OTC average rate per contract.
36
Three Months Ended March 31, 2016 Compared to Three Months Ended March 31, 2015
Operating revenues decreased 15% to $54.7 million in the second quarter compared to $64.7 million in the prior year. Exchange-traded revenues increased 7%, to $32.4 million in the second quarter, resulting primarily from strong growth in agricultural commodity revenues, particularly in the domestic grain markets as well as growth in our London operations. Overall exchange-traded contract volume increased 18% and the average rate per contract decreased 10% to $5.62.
OTC revenues decreased 42%, to $16.8 million in the second quarter, primarily driven by lower customer volumes in Latin and South America as well the effect of low energy prices and volatility which drove a decline in energy and renewable fuels OTC revenues. Overall OTC volumes decreased 33%, particularly in agricultural commodities, while the average rate per contract declined 14% compared to the prior year.
Consulting and management fees declined $0.4 million versus the prior year, while interest income, which remains constrained by low short-term interest rates, increased 24%, to $2.1 million compared to the prior year. The increase in interest income is primarily driven by the continued implementation of our interest rate management program, an increase in short-term rates, as well as a 6% increase in average customer equity.
Segment income decreased to $13.8 million in the second quarter compared to $21.7 million in the prior year, primarily as a result of the decrease in OTC revenues. Variable expenses, excluding interest, expressed as a percentage of operating revenues increased to 44% compared to 39% in the prior year, primarily as the result of an increase in transaction-based clearing expenses and variable compensation.
Six Months Ended March 31, 2016 Compared to Six Months Ended March 31, 2015
Operating revenues decreased 17% to $110.1 million in the current six months ended compared to $133.1 million in the prior year. Exchange-traded revenues increased 1%, to $64.0 million in the current six months ended, driven by a 14% increase in exchange-traded customer volumes, primarily in the domestic grain markets. This increase was partially offset by a decline in the average rate per contract to $5.61, due to the decrease in business from introducing brokers in agricultural commodities as well as a narrowing of spreads in the LME metals business.
OTC revenues decreased 40% to $35.5 million in the current six months ended compared to $58.7 million in the prior year as OTC volumes declined 17% to 616.7 thousand contracts in the current six months ended compared to 739.0 thousand in the prior year. The OTC volume decline was primarily driven by lower customer volumes in Latin and South America as well the effect of low energy prices and volatility which drove a decline in energy and renewable fuels OTC revenues. In addition, we experienced lower spreads across virtually all commodity sectors leading to the decline in overall OTC revenues.
Consulting and management fees decreased 14% to $6.7 million in the current six months ended versus $7.8 million in the prior year, while interest income, which remains constrained by low short-term interest rate, increased 15%, to $3.9 million in the current six months ended compared to $3.4 million in the prior year. The increase in interest income was primarily driven by the continued implementation of our interest rate management program and an increase in short-term rates, while average customer equity was relatively flat with the prior year.
Segment income decreased 38% to $28.8 million in the current six months ended compared to $46.6 million in the prior year, as a result of the decline in operating revenues. Variable expenses, excluding interest, expressed as a percentage of operating revenues were 43% in the current six months ended as compared to 40% in the prior year, primarily as a result of an increase in transaction based clearing fees.
Global Payments
We provide global payment solutions to banks and commercial businesses as well as charities, non-governmental organizations and government organizations. We offer payments services in over 150 currencies, throughout more than 130 countries, which we believe is more than any other payments solution provider, and provide competitive and transparent pricing. Through our technology platform, full-service electronic execution capability and commitment to customer service, we believe we are able to provide simple and fast execution, ensuring delivery of funds in any of these countries quickly through our global network of correspondent banks. In this business, we primarily act as a principal in buying and selling foreign currencies on a spot basis. We derive revenue from the difference between the purchase and sale prices.
We believe our clients value our ability to provide exchange rates that are significantly more competitive than those offered by large international banks, a competitive advantage that stems from our years of foreign exchange expertise focused on smaller, less liquid currencies. Additionally, as a member of SWIFT (Society for Worldwide Interbank Financial Telecommunication), we are able to offer our services to large money center and global banks seeking more competitive international payment services.
37
The following table provides the financial performance and selected data for Global Payments for the periods indicated.
Three Months Ended March 31, | Six Months Ended March 31, | ||||||||||||||||||
(in millions) | 2016 | % Change | 2015 | 2016 | % Change | 2015 | |||||||||||||
Revenues: | |||||||||||||||||||
Sales of physical commodities | $ | — | — | $ | — | $ | — | — | $ | — | |||||||||
Trading gains, net | 16.7 | (8)% | 18.1 | 34.4 | 5% | 32.9 | |||||||||||||
Commission and clearing fees | 0.7 | 133% | 0.3 | 1.3 | 86% | 0.7 | |||||||||||||
Consulting and management fees | — | — | — | — | — | — | |||||||||||||
Interest income | — | — | — | — | — | — | |||||||||||||
Other income | — | — | — | — | — | — | |||||||||||||
Total revenues | 17.4 | (5)% | 18.4 | 35.7 | 6% | 33.6 | |||||||||||||
Cost of sales of physical commodities | — | — | — | — | — | — | |||||||||||||
Operating revenues | 17.4 | (5)% | 18.4 | 35.7 | 6% | 33.6 | |||||||||||||
Transaction-based clearing expenses | 1.1 | 22% | 0.9 | 2.1 | 24% | 1.7 | |||||||||||||
Introducing broker commissions | 0.8 | (43)% | 1.4 | 1.8 | (22)% | 2.3 | |||||||||||||
Interest expense | — | — | — | — | — | — | |||||||||||||
Net operating revenues | 15.5 | (4)% | 16.1 | 31.8 | 7% | 29.6 | |||||||||||||
Variable direct compensation and benefits | 3.1 | (6)% | 3.3 | 6.4 | 7% | 6.0 | |||||||||||||
Net contribution | 12.4 | (3)% | 12.8 | 25.4 | 8% | 23.6 | |||||||||||||
Non-variable direct expenses | 3.1 | 7% | 2.9 | 6.1 | 11% | 5.5 | |||||||||||||
Segment income | $ | 9.3 | (6)% | $ | 9.9 | $ | 19.3 | 7% | $ | 18.1 | |||||||||
Selected data: | |||||||||||||||||||
Global payments (number of trades, 000’s) | 101.1 | 14% | 88.7 | 196.7 | 25% | 157.4 | |||||||||||||
Average revenue per trade | $ | 172.11 | (17)% | $ | 207.44 | $ | 181.49 | (15)% | $ | 213.47 | |||||||||
Three Months Ended March 31, 2016 Compared to Three Months Ended March 31, 2015
Operating revenues decreased 5% to $17.4 million in the second quarter compared to $18.4 million in the prior year. This decline in operating revenues was primarily driven by a narrowing of spreads in the foreign exchange markets, which drove a 17% decrease in the average revenue per trade. The volume of payments made increased 14% as we continued to benefit from an increase in financial institutions and other customers utilizing our electronic transaction order system.
Segment income decreased 6% to $9.3 million in the second quarter compared to $9.9 million in the prior year. This decrease primarily resulted from the decrease in operating revenues during the second quarter as well as slight increase in non-variable trade system expenses. Variable expenses, excluding interest, expressed as a percentage of operating revenues decreased to 29% compared to 30% in the prior year.
Six Months Ended March 31, 2016 Compared to Six Months Ended March 31, 2015
Operating revenues increased 6% to $35.7 million in the current six months ended compared to $33.6 million in the prior year. This operating revenue growth was driven by a 25% increase in the volume of payments made. An increase in volumes from financial institutions resulted in a lower average size of payment made, resulting in a 15% decrease in the average revenue per trade.
Segment income increased 7% to $19.3 million in the current six months ended compared to $18.1 million in the prior year. This increase primarily resulted from the increase in operating revenues partially offset by an increase in fixed compensation and benefits and trade system expenses. Variable expenses, excluding interest, expressed as a percentage of operating revenues decreased to 29% compared to 30% in the prior year.
Securities
We provide value-added solutions that facilitate cross-border trading. We believe our clients value our ability to manage complex transactions, including foreign exchange, utilizing our local understanding of market convention, liquidity and settlement protocols around the world. Our clients include U.S.-based regional and national broker-dealers and institutions investing or executing client transactions in international markets and foreign institutions seeking access to the U.S. securities markets. We are one of the leading market makers in foreign securities, including unlisted ADRs, Global Depository Receipts (“GDRs”) and foreign ordinary shares. We make markets in over 1,600 ADRs, GDRs and foreign ordinary shares, of which
38
over 1,300 trade in the OTC market. In addition, we will, on request, make prices in more than 10,000 unlisted foreign securities. We are also a broker-dealer in Argentina, where we are active in providing institutional executions in the local capital markets.
Following our acquisition of G.X. Clarke, we act as an institutional dealer in fixed income securities, including U.S. Treasury, U.S. government agency, agency mortgage-backed and agency asset-backed securities to a client base including asset managers, commercial bank trust and investment departments, broker-dealers, and insurance companies. In addition, we provide a full range of corporate finance advisory services to our middle market clients, including capital market solutions and a wide array of advisory services across a broad spectrum of industries. Our advisory services span mergers and acquisitions, liability management, restructuring opinions and valuations. We also originate, structure and place a wide array of debt instruments in the international capital markets. These instruments include complex asset-backed securities (primarily in Argentina), unsecured bond and loan issues, negotiable notes and other trade-related debt instruments used in cross-border trade finance. On occasion, we may invest our own capital in debt instruments before selling them. We also actively trade in a variety of international debt instruments as well as operate an asset management business in which we earn fees, commissions and other revenues for management of third party assets and investment gains or losses on our investments in funds and proprietary accounts managed either by our investment managers or by independent investment managers.
The following table provides the financial performance for Securities for the periods indicated.
Three Months Ended March 31, | Six Months Ended March 31, | ||||||||||||||||||
(in millions) | 2016 | % Change | 2015 | 2016 | % Change | 2015 | |||||||||||||
Revenues: | |||||||||||||||||||
Sales of physical commodities | $ | — | — | $ | — | $ | — | — | $ | — | |||||||||
Trading gains, net | 27.3 | 14% | 23.9 | 58.0 | 71% | 33.9 | |||||||||||||
Commission and clearing fees | 3.0 | 114% | 1.4 | 6.2 | 170% | 2.3 | |||||||||||||
Consulting and management fees | 5.3 | 15% | 4.6 | 10.6 | 7% | 9.9 | |||||||||||||
Interest income | 10.0 | 61% | 6.2 | 19.6 | 172% | 7.2 | |||||||||||||
Other income | — | — | — | — | — | — | |||||||||||||
Total revenues | 45.6 | 26% | 36.1 | 94.4 | 77% | 53.3 | |||||||||||||
Cost of sales of physical commodities | — | — | — | — | — | — | |||||||||||||
Operating revenues | 45.6 | 26% | 36.1 | 94.4 | 77% | 53.3 | |||||||||||||
Transaction-based clearing expenses | 6.5 | 2% | 6.4 | 12.4 | 8% | 11.5 | |||||||||||||
Introducing broker commissions | 3.4 | 89% | 1.8 | 7.0 | 126% | 3.1 | |||||||||||||
Interest expense | 3.9 | 63% | 2.4 | 7.2 | 125% | 3.2 | |||||||||||||
Net operating revenues | 31.8 | 25% | 25.5 | 67.8 | 91% | 35.5 | |||||||||||||
Variable direct compensation and benefits | 6.8 | 15% | 5.9 | 13.3 | 43% | 9.3 | |||||||||||||
Net contribution | 25.0 | 28% | 19.6 | 54.5 | 108% | 26.2 | |||||||||||||
Non-variable direct expenses | 6.8 | (8)% | 7.4 | 14.4 | 17% | 12.3 | |||||||||||||
Segment income | $ | 18.2 | 49% | $ | 12.2 | $ | 40.1 | 188% | $ | 13.9 | |||||||||
The following table sets forth operating revenues by product line and selected data for Securities for the periods indicated.
Three Months Ended March 31, | Six Months Ended March 31, | ||||||||||||||||||
2016 | % Change | 2015 | 2016 | % Change | 2015 | ||||||||||||||
Operating revenues by product line (in millions): | |||||||||||||||||||
Equity market-making | $ | 19.5 | 27% | $ | 15.3 | $ | 34.3 | 23% | $ | 27.8 | |||||||||
Debt trading | 19.8 | 22% | 16.2 | 45.7 | 189% | 15.8 | |||||||||||||
Investment banking | 1.6 | 45% | 1.1 | 2.8 | —% | 2.8 | |||||||||||||
Asset management | 4.7 | 34% | 3.5 | 11.6 | 68% | 6.9 | |||||||||||||
$ | 45.6 | 26% | $ | 36.1 | $ | 94.4 | 77% | $ | 53.3 | ||||||||||
Selected data: | |||||||||||||||||||
Equity market-making (gross dollar volume, millions) | $ | 26,108.5 | (3)% | $ | 26,927.2 | $ | 50,407.2 | (1)% | $ | 51,061.2 | |||||||||
Equity revenue per $1,000 traded | $ | 0.75 | 32% | $ | 0.57 | $ | 0.68 | 26% | $ | 0.54 | |||||||||
Average assets under management (millions) | $ | 515.4 | (8)% | $ | 562.5 | $ | 581.9 | —% | $ | 580.5 | |||||||||
39
Three Months Ended March 31, 2016 Compared to Three Months Ended March 31, 2015
Operating revenues increased 26% to $45.6 million in the second quarter compared to $36.1 million in the prior year.
Operating revenues in our Securities segment are comprised of activities in four product lines, equity market-making, debt trading, investment banking and asset management. Operating revenues in equity market-making increased 27% in the second quarter compared to the prior year, despite a 3% decrease in the gross dollar volume traded, as spreads widened driving a 32% increase in the average revenue per $1,000 traded. Equity market-making operating revenues include the trading profits we earn before the related expense deduction for ADR conversion fees. These ADR fees are included in the consolidated income statements as ‘transaction-based clearing expenses’.
Operating revenues in debt trading increased 22% in the second quarter compared to the prior year, primarily as a result of continued growth in our domestic institutional fixed income business as well as improved performance in our Argentina operations in the second quarter. Operating revenues in investment banking increased 45% compared to the prior year. Asset management operating revenues increased 34% in the second quarter primarily related to an increase in fair value of investments, despite an 8% decrease in average assets under management to $515.4 million in the second quarter compared to $562.5 million in the prior year, which were impacted by the devaluation of the Argentine peso.
Segment income increased 49% to $18.2 million in the second quarter compared to $12.2 million in the prior year, primarily as a result of the increases in equity market-making and debt trading operating revenues. Variable expenses, excluding interest, expressed as a percentage of operating revenues decreased to 37% in the second quarter compared to 39% in the prior year.
Six Months Ended March 31, 2016 Compared to Six Months Ended March 31, 2015
Operating revenues increased 77% to $94.4 million in the current six months ended compared to $53.3 million in the prior year.
Operating revenues in Equity market-making increased 23% in the current six months ended compared to the prior year, as favorable market conditions drove a 26% increase in the average revenue per $1,000 traded.
Operating revenues in Debt Trading increased to $45.7 million in the current six months ended compared to $15.8 million in the prior year. This increase in operating revenues was a result of the acquisition of G.X. Clarke, which was effective on January 1, 2015 and thus only contributed operating revenues beginning in the second quarter of the prior year, as well as strong performance in Argentina as the result of the effect of the devaluation of the Argentine peso. Investment Banking operating revenues were flat in the current six months ended compared to the prior year, while asset management revenues increased 68% in the current six months ended to $11.6 million compared to $6.9 million in the prior year, primarily as a result of the effect of devaluation of the Argentine peso. Average assets under management were $581.9 million in the current six months ended compared to $580.5 million in the prior year.
Segment income increased 188% to $40.1 million in the current six months ended compared to $13.9 million in the prior year, primarily as a result of the strong performance in Equity market making and Debt Trading. Variable expenses, excluding interest, expressed as a percentage of operating revenues decreased to 35% in the current six months ended compared to 45% in the prior year, as the G.X. Clarke acquisition added significant operating revenues with a relatively low transaction-based clearing expense structure.
Physical Commodities
This segment consists of our physical precious metals trading and physical agricultural and energy commodity businesses. In precious metals, we provide a full range of trading and hedging capabilities, including OTC products, to select producers, consumers, and investors. In our trading activities, we act as a principal, committing our own capital to buy and sell precious metals on a spot and forward basis.
Our physical agricultural and energy commodity business provides financing to commercial commodity-related companies against physical inventories, including grain, lumber, meats, energy products and renewable fuels. We use sale and repurchase agreements to purchase commodities evidenced by warehouse receipts, subject to a simultaneous agreement to sell such commodities back to the original seller at a later date. These transactions are accounted for as product financing arrangements, and accordingly no commodity inventory, purchases or sales are recorded. Additionally, we engage as a principal in physical purchase and sale transactions related to inputs to the renewable fuels and feed ingredient industries.
On April 10, 2015 (the “transfer date”), we transitioned the portion of our precious metals business conducted through our unregulated domestic subsidiary, INTL Commodities Inc., to our United Kingdom based broker-dealer subsidiary, INTL FCStone Ltd. INTL FCStone Ltd is regulated by the Financial Conduct Authority (“FCA”), the regulator of the financial services industry in the United Kingdom. This transfer resulted in a change in the valuation of precious metals inventory held by INTL FCStone Ltd as well as the presentation of INTL FCStone Ltd’s precious metals sales and cost of sales. See Note 1 of the Condensed Consolidated Financial Statements for further information.
40
Precious metals inventory held by our subsidiaries that are not broker-dealers continues to be valued at the lower of cost or market value. Precious metals sales and cost of sales for subsidiaries that are not broker-dealers continue to be recorded on a gross basis. In our physical agricultural and energy commodities business, we value our inventory at the lower of cost or market and record revenues on a gross basis.
Operating revenues and losses from our commodities derivatives activities are included in ‘trading gains, net’ in the condensed consolidated income statements. We generally mitigate the price risk associated with commodities held in inventory through the use of derivatives. We do not elect hedge accounting under U.S. GAAP in accounting for this price risk mitigation.
The following table provides the financial performance for Physical Commodities for the periods indicated.
Three Months Ended March 31, | Six Months Ended March 31, | ||||||||||||||||||
(in millions) | 2016 | % Change | 2015 | 2016 | % Change | 2015 | |||||||||||||
Revenues: | |||||||||||||||||||
Sales of physical commodities | $ | 3,548.0 | (75)% | $ | 14,291.6 | $ | 6,800.6 | (76)% | $ | 27,785.9 | |||||||||
Trading gains (losses), net | 0.7 | n/m | (1.2 | ) | — | n/m | (0.3 | ) | |||||||||||
Commission and clearing fees | 0.1 | —% | 0.1 | 0.2 | (50)% | 0.4 | |||||||||||||
Consulting and management fees | 0.2 | (60)% | 0.5 | 0.6 | (50)% | 1.2 | |||||||||||||
Interest income | 1.7 | 89% | 0.9 | 3.8 | 171% | 1.4 | |||||||||||||
Other income | — | — | — | — | — | — | |||||||||||||
Total revenues | 3,550.7 | (75)% | 14,291.9 | 6,805.2 | (76)% | 27,788.6 | |||||||||||||
Cost of sales of physical commodities | 3,542.8 | (75)% | 14,285.5 | 6,791.4 | (76)% | 27,775.7 | |||||||||||||
Operating revenues | 7.9 | 23% | 6.4 | 13.8 | 7% | 12.9 | |||||||||||||
Transaction-based clearing expenses | 0.1 | —% | 0.1 | 0.3 | —% | 0.3 | |||||||||||||
Introducing broker commissions | — | n/m | — | 0.1 | —% | 0.1 | |||||||||||||
Interest expense | 1.0 | 150% | 0.4 | 1.9 | 90% | 1.0 | |||||||||||||
Net operating revenues | 6.8 | 15% | 5.9 | 11.5 | —% | 11.5 | |||||||||||||
Variable direct compensation and benefits | 1.5 | 7% | 1.4 | 2.8 | 8% | 2.6 | |||||||||||||
Net contribution | 5.3 | 18% | 4.5 | 8.7 | (2)% | 8.9 | |||||||||||||
Non-variable direct expenses | 3.4 | 62% | 2.1 | 5.8 | 45% | 4.0 | |||||||||||||
Segment income | $ | 1.9 | (21)% | $ | 2.4 | $ | 2.9 | (41)% | $ | 4.9 | |||||||||
The following tables set forth operating revenue by product line and selected data for Physical Commodities for the periods indicated.
Precious Metals | |||||||||||||||||||
Three Months Ended March 31, | Six Months Ended March 31, | ||||||||||||||||||
2016 | % Change | 2015 | 2016 | % Change | 2015 | ||||||||||||||
Total revenues | $ | 3,470.9 | (76)% | $ | 14,238.9 | $ | 6,638.9 | (76)% | $ | 27,675.1 | |||||||||
Cost of sales of physical commodities | 3,465.9 | (76)% | 14,235.0 | 6,629.4 | (76)% | 27,667.7 | |||||||||||||
Operating revenues | $ | 5.0 | 28% | $ | 3.9 | $ | 9.5 | 28% | $ | 7.4 | |||||||||
Selected data: | |||||||||||||||||||
Gold equivalent ounces traded (000’s) | 21,619.3 | (43)% | 38,145.1 | 45,139.1 | (37)% | 71,565.4 | |||||||||||||
Average revenue per ounce traded | $ | 0.23 | 130% | $ | 0.10 | $ | 0.21 | 110% | $ | 0.10 | |||||||||
Physical Ag’s & Energy | |||||||||||||||||||
Three Months Ended March 31, | Six Months Ended March 31, | ||||||||||||||||||
2016 | % Change | 2015 | 2016 | % Change | 2015 | ||||||||||||||
Total revenues | $ | 79.8 | 51% | $ | 53.0 | $ | 166.3 | 47% | $ | 113.5 | |||||||||
Cost of sales of physical commodities | 76.9 | 52% | 50.5 | 162.0 | 50% | 108.0 | |||||||||||||
Operating revenues | $ | 2.9 | 16% | $ | 2.5 | $ | 4.3 | (22)% | $ | 5.5 | |||||||||
41
Three Months Ended March 31, 2016 Compared to Three Months Ended March 31, 2015
Operating revenues for Physical Commodities increased 23% to $7.9 million in the second quarter compared to $6.4 million in the prior year.
Precious Metals operating revenues increased 28% to $5.0 million in the second quarter compared to $3.9 million in the prior year. Operating revenues increased from the prior year period, despite a 43% decline in the number of ounces traded as spreads widened in this business driving a 130% increase in the average revenue per ounce traded.
Operating revenues in Physical Ag’s & Energy increased 16% to $2.9 million in the second quarter compared to the prior year. The increase in operating revenues is primarily due to an increase in our customer volumes in the feed ingredient industry.
Segment income decreased 21% to $1.9 million in the second quarter compared to $2.4 million in the prior year, primarily as a result of a $1.3 million increase in bad debt expense in Physical Ag’s & Energy, related to customers in the renewal fuels industry.
Six Months Ended March 31, 2016 Compared to Six Months Ended March 31, 2015
Operating revenues for Physical Commodities increased to $13.8 million in the current six months ended compared to $12.9 million in the prior year.
Precious Metals operating revenues increased 28% to $9.5 million in the current six months ended compared to $7.4 million in the prior year. The increase in operating revenues was primarily driven by a widening of spreads due to market conditions, partially offset by a 37% decrease in the number of ounces traded.
Operating revenues in Physical Ag’s & Energy decreased 22% to $4.3 million in the current six months ended compared to $5.5 million in the prior year. The decrease in operating revenues is primarily due to a decline in overall customer volumes in the renewable fuels industry.
Segment income decreased 41% to $2.9 million in the current six months ended compared to $4.9 million in the prior year and was primarily a result of an increase in interest expense as a well as a $1.4 million increase in bad debt expense in the Physical Ag’s & Energy business.
Clearing and Execution Services
We seek to provide competitive and efficient clearing and execution of exchange-traded futures and options for the institutional and professional trader market segments. Through our platform, client orders are accepted and directed to the appropriate exchange for execution. We then facilitate the clearing of clients’ transactions. Clearing involves the matching of clients’ trades with the exchange, the collection and management of client margin deposits to support the transactions, and the accounting and reporting of the transactions to clients. We seek to leverage our capabilities and capacity by offering facilities management or outsourcing solutions to other FCMs.
In addition, we provide prime brokerage foreign exchange services to financial institutions and professional traders. We provide our clients with the full range of OTC products, including 24-hour a day execution of spot, forwards and options as well as non-deliverable forwards in both liquid and exotic currencies. We also operate a proprietary foreign exchange desk that arbitrages the exchange-traded foreign exchange markets with the cash markets.
42
The following table provides the financial performance and selected data for Clearing and Execution Services for the periods indicated.
Three Months Ended March 31, | Six Months Ended March 31, | ||||||||||||||||||
(in millions) | 2016 | % Change | 2015 | 2016 | % Change | 2015 | |||||||||||||
Sales of physical commodities | $ | — | — | $ | — | $ | — | — | $ | — | |||||||||
Trading gains, net | 5.7 | 14% | 5.0 | 11.4 | 12% | 10.2 | |||||||||||||
Commission and clearing fees | 25.9 | 3% | 25.2 | 48.7 | (3)% | 50.0 | |||||||||||||
Consulting and management fees | 0.4 | —% | 0.4 | 0.8 | —% | 0.8 | |||||||||||||
Interest income | 1.3 | 44% | 0.9 | 2.2 | 29% | 1.7 | |||||||||||||
Other | — | — | — | — | — | — | |||||||||||||
Total revenues | 33.3 | 6% | 31.5 | 63.1 | 1% | 62.7 | |||||||||||||
Cost of physical commodities sold | — | — | — | — | — | — | |||||||||||||
Operating revenues | 33.3 | 6% | 31.5 | 63.1 | 1% | 62.7 | |||||||||||||
Transaction-based clearing expenses | 17.9 | 2% | 17.5 | 33.3 | (2)% | 33.9 | |||||||||||||
Introducing broker commissions | 4.7 | —% | 4.7 | 8.6 | (13)% | 9.9 | |||||||||||||
Interest expense | 0.3 | 200% | 0.1 | 0.4 | 100% | 0.2 | |||||||||||||
Net operating revenues | 10.4 | 13% | 9.2 | 20.8 | 11% | 18.7 | |||||||||||||
Variable direct compensation and benefits | 2.2 | 29% | 1.7 | 4.7 | 27% | 3.7 | |||||||||||||
Net contribution | 8.2 | 9% | 7.5 | 16.1 | 7% | 15.0 | |||||||||||||
Non-variable direct expenses | 4.7 | 2% | 4.6 | 9.1 | 7% | 8.5 | |||||||||||||
Segment income | $ | 3.5 | 21% | $ | 2.9 | $ | 7.0 | 8% | $ | 6.5 | |||||||||
Selected data: | |||||||||||||||||||
Exchange-traded volume (contracts, 000’s) | 20,943.0 | (2)% | 21,389.3 | 39,637.0 | (5)% | 41,510.3 | |||||||||||||
Exchange-traded average rate per contract (1) | $ | 1.16 | 4% | $ | 1.12 | $ | 1.15 | 1% | $ | 1.14 | |||||||||
Average customer equity (millions) | $ | 941.9 | (12)% | $ | 1,070.6 | $ | 943.1 | (14)% | $ | 1,102.2 | |||||||||
Foreign exchange prime brokerage volume (U.S. notional, millions) | $ | 154,108.5 | 43% | $ | 108,135.9 | $ | 278,660.1 | 24% | $ | 224,037.6 | |||||||||
(1) Give-up fee revenues included in commission and clearing fees have been excluded from the calculation of exchange-traded average rate per contract.
Three Months Ended March 31, 2016 Compared to Three Months Ended March 31, 2015
Operating revenues increased 6% to $33.3 million in the second quarter compared to $31.5 million in the prior year. Operating revenues are primarily generated from three sources: commission and clearing fee revenues from the execution and clearing of exchange-traded futures and options on futures contracts, trading gains, net, which primarily represents the spread retained in OTC foreign exchange customer prime brokerage activities, and interest income derived from cash balances in our customers’ accounts.
Commission and clearing fee revenues increased to $25.9 million in the second quarter compared to $25.2 million in the prior year despite a 2% decline in exchange-traded volumes as the average rate per contract increased 4% compared to the prior year period as a result of business mix. Interest income increased 44% to $1.3 million in the second quarter primarily as a result of the continued implementation of our interest rate management program and an increase in short-term rates. This was partially offset by a 12% decrease in average customer equity to $941.9 million.
Operating revenues in our customer prime brokerage product line, reflected on the “trading gains, net” line increased 14% to $5.7 million in the second quarter compared to $5.0 million in the prior year, as a result of a 43% increase in foreign exchange volumes driven by higher market volatility.
Segment income increased to $3.5 million in the second quarter compared to $2.9 million in the prior year, primarily as a result of the increase in operating revenues and a decline in variable expenses as a percentage of operating revenues. Variable expenses, excluding interest, as a percentage of operating revenues were 74% in the second quarter compared to 76% in the prior year.
Six Months Ended March 31, 2016 Compared to Six Months Ended March 31, 2015
Operating revenues increased 1% to $63.1 million in the current six months ended compared to $62.7 million in the prior year.
43
Commission and clearing fee revenues decreased 3% to $48.7 million in the current six months ended, as a result of a 5% decline in exchange-traded volumes, which was partially offset by a 1% increase in the average rate per contract compared to the prior-year period. Interest income, which continues to be constrained by the effect of low short term interest rates, was $2.2 million in the current six months ended compared to $1.7 million in the prior year. The increase in interest income was primarily driven by the continued implementation of our interest rate management program and an increase in short-term rates. This was partially offset by a 14% decrease in the average level of customer equity to $943.1 million compared to the prior year.
Operating revenues in our customer prime brokerage product line, reflected on the “trading gains, net” line increased 12% to $11.4 million in the current six months ended compared to $10.2 million in the prior year, as a result of a 24% increase in foreign exchange volumes as a result of market volatility.
Segment income increased to $7.0 million in the current six months ended compared to $6.5 million in the prior year, primarily as a result of the increase in operating revenues partially offset by an increase in non-variable compensation and benefits. Variable expenses, excluding interest, as a percentage of operating revenues declined to 74% in the current six months ended compared to 76% in the prior year.
Liquidity, Financial Condition and Capital Resources
Overview
Liquidity is defined as our ability to generate sufficient amounts of cash to meet all of our cash needs. Liquidity is of critical importance to us and imperative to maintain our operations on a daily basis.
In INTL FCStone Financial, our broker-dealer/FCM subsidiary, we have responsibilities to meet margin calls at all exchanges on a daily basis and intra-day basis, if necessary. We require our customers to make any required margin deposits the next business day, and we require our largest customers to make intra-day margin payments during periods of significant price movement. Margin required to be posted to the exchanges is a function of the net open positions of our customers and the required margin per contract. INTL FCStone Financial is subject to minimum capital requirements under Section 4(f)(b) of the Commodity Exchange Act, Part 1.17 of the rules and regulations of the CFTC and the SEC Uniform Net Capital Rule 15c3-1 under the Securities Exchange Act of 1934. These rules specify the minimum amount of capital that must be available to support our clients’ open trading positions, including the amount of assets that INTL FCStone Financial must maintain in relatively liquid form, and are designed to measure general financial integrity and liquidity.
INTL FCStone Ltd, our UK regulated subsidiary, is required to be compliant with the UK’s Individual Liquidity Adequacy Standards (“ILAS”). To comply with these standards, we have implemented daily liquidity procedures, conduct periodic reviews of liquidity by stressed scenarios, and have created liquidity buffers.
In addition, in our physical commodities trading, commercial hedging OTC, securities and foreign exchange trading activities, we may be called upon to meet margin calls with our various trading counterparties based upon the underlying open transactions we have in place with those organizations.
We continuously review our overall credit and capital needs to ensure that our capital base, both stockholders’ equity and debt, as well as available credit facilities can appropriately support the anticipated financing needs of our operating subsidiaries.
As of March 31, 2016, we had total equity capital of $408.2 million, $45.5 million aggregate principal amount of our issued 8.5% senior unsecured notes, due in July 2020 and outstanding bank loans of $151.5 million.
A substantial portion of our assets are liquid. As of March 31, 2016, approximately 96% of our assets consisted of cash; securities purchased under agreements to resell; deposits with and receivables from exchange-clearing organizations, broker-dealers, clearing organizations and counterparties; customer receivables, marketable financial instruments and investments, and physical commodities inventory. All assets that are not customer and counterparty deposits are financed by our equity capital, senior unsecured notes, bank loans, short-term borrowings from financial instruments sold, not yet purchased and under repurchase agreements, and other payables.
As of March 31, 2016, we had deferred tax assets totaling $29.9 million. We are required to assess our deferred tax assets and the need for a valuation allowance at each reporting period. In assessing our ability to realize deferred tax assets, we consider whether it is more likely than not that we will not realize some or all of the deferred tax assets. We are required to record a valuation allowance against deferred tax assets when it is considered more likely than not that all or a portion of our deferred tax assets will not be realized. The valuation allowance for deferred tax assets as of March 31, 2016 and September 30, 2015 was $3.2 million. The valuation allowances as of March 31, 2016 and September 30, 2015 were primarily related to U.S. state and local and foreign net operating loss carryforwards that, in the judgment of management, are not more likely than not to be realized.
44
We incurred U.S. federal, state, and local taxable income (losses) for the years ended September 30, 2015, 2014, and 2013 of $17.7 million, ($18.4) million, and ($24.5) million, respectively. There are no significant differences between actual levels of past taxable income and the results of operations, before income taxes in these jurisdictions. When evaluating if U.S. federal, state, and local deferred tax assets are realizable, we considered deferred tax liabilities of $2.4 million that are scheduled to reverse from 2016 to 2019 and $1.0 million of deferred tax liabilities associated with unrealized gains in securities which we could sell, if necessary. Furthermore, we considered our ability to implement business and tax planning strategies that would allow the remaining U.S. federal, state, and local deferred tax assets, net of valuation allowances, to be realized within approximately 11 years. Based on the tax planning strategies that are prudent and feasible, management believes that it is more likely than not that we will realize the tax benefit of the deferred tax assets, net of the existing valuation allowance, in the future. However, the realization of deferred income taxes is dependent on future events, and changes in estimate in future periods could result in adjustments to the valuation allowance.
Customer and Counterparty Credit and Liquidity Risk
Our operations expose us to credit risk of default of our customers and counterparties. The risk includes liquidity risk to the extent our customers or counterparties are unable to make timely payment of margin or other credit support. These risks expose us indirectly to the financing and liquidity risks of our customers and counterparties, including the risks that our customers and counterparties may not be able to finance their operations.
As a clearing broker, we act on behalf of our customers for all trades consummated on exchanges. We must pay initial and variation margin to the exchanges, on a net basis, before we receive the required payments from our customers. Accordingly, we are responsible for our customers’ obligations with respect to these transactions, which exposes us to significant credit risk. Our customers are required to make any required margin deposits the next business day, and we require our largest customers to make intra-day margin payments during periods of significant price movement. Our clients are required to maintain initial margin requirements at the level set by the respective exchanges, but we have the ability to increase the margin requirements for customers based on their open positions, trading activity, or market conditions.
With OTC derivative transactions, we act as a principal, which exposes us to the credit risk of both our customers and the counterparties with which we offset our customer positions. As with exchange-traded transactions, our OTC transactions require that we meet initial and variation margin payments on behalf of our customers before we receive the required payment from our customers. OTC customers are required to post sufficient collateral to meet margin requirements based on Value-at-Risk models as well as variation margin requirement based on the price movement of the commodity or security in which they transact. Our customers are required to make any required margin deposits the next business day, and we may require our largest clients to make intra-day margin payments during periods of significant price movement. We have the ability to increase the margin requirements for customers based on their open positions, trading activity, or market conditions. On a limited basis, we provide credit thresholds to certain customers, based on internal evaluations and monitoring of customer creditworthiness.
In addition, with OTC transactions, we are at risk that a counterparty will fail to meet its obligations when due. We would then be exposed to the risk that the settlement of a transaction which is due a customer will not be collected from the respective counterparty with which the transaction was offset. We continuously monitor the credit quality of our respective counterparties and mark our positions held with each counterparty to market on a daily basis.
In our debt trading business, we enter into receivable under repurchase agreements and payables under repurchase agreements primarily to finance inventory positions, acquire securities to cover short positions or to acquire securities for settlement. We either receive or pledge securities to adequately collateralize such agreements and transactions. The value of this collateral is marked-to-market on a daily basis and we may require counterparties, or be required, to deposit additional collateral or return collateral pledged, when appropriate.
Information related to bad debt expense for the six months ended March 31, 2016 and 2015 can be found in Note 5 of the Condensed Consolidated Financial Statements.
Primary Sources and Uses of Cash
Our assets and liabilities may vary significantly from period to period due to changing customer requirements, economic and market conditions and our growth. Our total assets as of March 31, 2016 and September 30, 2015, were $5,657.9 million and $5,070.0 million, respectively. Our operating activities generate or utilize cash as a result of net income or loss earned or incurred during each period and fluctuations in our assets and liabilities. The most significant fluctuations arise from changes in the level of customer activity, commodities prices and changes in the balances of financial instruments and commodities inventory. INTL FCStone Financial and INTL FCStone Ltd occasionally uses their margin line credit facilities, on a short-term basis, to meet intraday settlements with the commodity exchanges prior to collecting margin funds from their customers.
45
The majority of the assets of INTL FCStone Financial are restricted from being transferred to its parent or other affiliates due to specific regulatory requirements. These restrictions have no impact on our ability to meet our cash obligations, and no impact is expected in the future.
We have liquidity and funding policies and processes in place that are intended to maintain significant flexibility to address both company-specific and industry liquidity needs. The majority of our excess funds are held with high quality institutions, under highly-liquid reverse repurchase agreements, U.S. government obligations and AA-rated money market investments. We do not hold any direct investments in the general obligations of any sovereign nations.
As of March 31, 2016, $152.1 million of cash, cash equivalent and available-for-sale investment securities was held by our foreign subsidiaries. If these funds are needed for operations in the U.S., we would be required to accrue and pay U.S. taxes to repatriate these funds, up to the amount of undistributed foreign earnings of $262.9 million. However, our intent is to indefinitely reinvest these funds outside of the U.S., and our current plans do not demonstrate a need to repatriate them to fund our U.S. operations.
As of March 31, 2016, $142.5 million of financial instruments owned and $142.8 million of financial instruments sold, not yet purchased, are exchangeable foreign equities and ADRs.
As of March 31, 2016, we had $45.5 million outstanding in aggregate principal amount of our 8.5% Senior Notes due 2020 (the “Notes”). The Notes were issued in July 2013, and bear interest at a rate of 8.5% per year (payable quarterly on January 30, April 30, July 30 and October 30 of each year). The Notes mature on July 30, 2020. We may redeem the Notes, in whole or in part, at any time on and after July 30, 2016, at a redemption price equal to 100% of the principal amount redeemed plus accrued and unpaid interest to, but not including, the redemption date.
In April 2015, we obtained a $4.0 million loan from a commercial bank, secured by equipment purchased with the proceeds. The note is payable in monthly installments, ending in March 2020. As of March 31, 2016, the current amount outstanding on the loan was $3.2 million.
As of March 31, 2016, we had four committed bank credit facilities, totaling $370.0 million, of which $148.3 million was outstanding. Additional information regarding our bank credit facilities can be found in Note 9 of the Condensed Consolidated Financial Statements. The credit facilities include:
• | A three-year syndicated loan facility, committed until March 18, 2019, under which INTL FCStone Inc. is entitled to borrow up to $205.0 million, subject to certain terms and conditions of the credit agreement. The loan proceeds are used to finance working capital needs of us and certain subsidiaries. We amended the credit facility on March 18, 2016 resulting in an increase in the commitment from $140 million to $205 million, an extension of the maturity date to March 18, 2019, and the ability to increase the facility by an additional $50 million in the aggregate in one or more increases at any time prior to six months before the maturity date with the satisfaction of certain conditions. We paid debt issuance costs of $1.8 million in connection with the amendment of the credit facility, which are being amortized over the amended thirty-six month term. |
• | An unsecured syndicated loan facility, committed until April 6, 2017, under which our subsidiary, INTL FCStone Financial Inc. is entitled to borrow up to $75.0 million, subject to certain terms and conditions of the credit agreement. This facility is intended to provide short-term funding of margin to commodity exchanges as necessary. |
• | A syndicated loan facility, committed until May 1, 2017, under which our subsidiary, FCStone Merchant Services, LLC is entitled to borrow up to $65.0 million, subject to certain terms and conditions of the credit agreement. The loan proceeds are used to finance traditional commodity financing arrangements and commodity repurchase agreements. The Company amended the credit facility on March 15, 2016 resulting in an increase in the commitment from $40 million to $65 million |
• | An unsecured syndicated loan facility, committed until October 31, 2016, under which our subsidiary, INTL FCStone Ltd is entitled to borrow up to $25.0 million, subject to certain terms and conditions of the credit agreement. This facility is intended to provide short-term funding of margin to commodity exchanges as necessary. |
As reflected above, $165 million of the Company’s committed credit facilities are scheduled to expire within twelve months of this filing. We intend to renew or replace these facilities as they expire, and based on our liquidity position and capital structure, we believe we will be able to do so.
Additionally, we have a secured, uncommitted loan facility, under which our subsidiary, INTL FCStone Financial Inc. may borrow up to $50.0 million, collateralized by commodity warehouse receipts, to facilitate U.S. commodity exchange deliveries of its customers, subject to certain terms and conditions of the credit agreement.
Our facility agreements contain certain financial covenants relating to financial measures on a consolidated basis, as well as on a certain stand-alone subsidiary basis, including minimum tangible net worth, minimum regulatory capital, minimum net unencumbered liquid assets, maximum net loss, minimum fixed charge coverage ratio and maximum funded debt to net worth
46
ratio. Failure to comply with any such covenants could result in the debt becoming payable on demand. As of March 31, 2016, we and our subsidiaries are in compliance with all of our financial covenants under the outstanding facilities.
We have contingent liabilities relating to certain acquisitions we have completed since December 2012. See Note 11 to the Condensed Consolidated Financial Statements for additional information on these contingent liabilities. The contingent liabilities for these estimated additional discounted purchase price considerations total $1.5 million as of March 31, 2016, and are included in ‘accounts payable and other accrued liabilities’ in the condensed consolidated balance sheets. We estimate cash payments during the next twelve months, related to these contingent liabilities, to be $0.9 million.
We contributed $0.8 million to our defined benefit pension plans during the six months ended March 31, 2016, and expect to contribute further a minimum of $1.3 million to the plans during the remainder of fiscal 2016.
Other Capital Considerations
Our activities are subject to various significant governmental regulations and capital adequacy requirements, both in the U.S. and overseas. Certain of our other non-U.S. subsidiaries are also subject to capital adequacy requirements promulgated by authorities of the countries in which they operate.
Our subsidiaries are in compliance with all of their capital regulatory requirements as of March 31, 2016. Additional information on these net capital and minimum net capital requirements can be found in Note 12 of the Condensed Consolidated Financial Statements.
The Dodd-Frank Act created a comprehensive new regulatory regime governing the OTC and listed derivatives markets and their participants by requiring, among other things: centralized clearing of standardized derivatives (with certain stated exceptions); the trading of clearable derivatives on swap execution facilities or exchanges; and registration and comprehensive regulation of new categories of market participants as “swap dealers” and swap “introducing brokers.” Our subsidiary, INTL FCStone Markets, LLC, is a provisionally registered swap dealer. Some important rules, such as those setting capital and margin requirements, have not been finalized or fully implemented, and it is too early to predict with any degree of certainty how we will be affected.
We are reviewing the regulatory changes that will be introduced by the Markets in Financial Instruments Directive (“MIFID 2”)and the Markets in Financial Instruments Regulation (“MIFIR”) to assess the impact this legislation is likely to have on our United Kingdom business when implemented in 2017. Among other things, the legislation will impose additional transaction and position reporting requirements, disclosure obligations, as well as requiring certain over-the-counter derivatives to be traded on organized trading facilities (“OTFs”).
Cash Flows
Our cash and cash equivalents decreased from $268.1 million as of September 30, 2015 to $203.2 million as of March 31, 2016, a net decrease of $64.9 million. Net cash of $147.3 million was used in operating activities, $8.0 million was used in investing activities and net cash of $97.4 million was provided by financing activities, of which $110.3 million was borrowed from lines of credit and increased the amounts payable to lenders under loans. Fluctuations in exchange rates decreased our cash and cash equivalents by $7.0 million.
In the commodities industry, companies report trading activities in the operating section of the statement of cash flows. Due to the daily price volatility in the commodities market, as well as changes in margin requirements, fluctuations in the balances of deposits held at various exchanges, marketable securities and customer commodity accounts may occur from day-to-day. A use of cash, as calculated on the consolidated statement of cash flows, includes unrestricted cash transferred and pledged to the exchanges or guarantee funds. These funds are held in interest-bearing deposit accounts at the exchanges, and based on daily exchange requirements, may be withdrawn and returned to unrestricted cash. Additionally, in our unregulated OTC and foreign exchange operations, cash deposits received from customers are reflected as cash provided from operations. Subsequent transfer of these cash deposits to counterparties or exchanges to margin their open positions will be reflected as an operating use of cash to the extent the transfer occurs in a different period than the cash deposit was received.
We continuously evaluate opportunities to expand our business. Investing activities include $8.0 million in capital expenditures for property, plant and equipment in the current six months ended, compared to $1.9 million in the prior year. The increase in capital expenditures is primarily due to the purchase of IT equipment and trade system software as well as costs of leasehold improvements.
Apart from what has been disclosed above, there are no known trends, events or uncertainties that have had or are likely to have a material impact on our liquidity, financial condition and capital resources. Based upon our current operations, we believe that cash flows from operations, available cash and available borrowings under our credit facilities will be adequate to meet our future liquidity needs.
47
Commitments
Information about our commitments and contingent liabilities is contained in Note 11 of the Condensed Consolidated Financial Statements.
Off Balance Sheet Arrangements
We are party to certain financial instruments with off-balance sheet risk in the normal course of business as a registered securities broker-dealer, futures commission merchant, U.K. based Financial Services Firm, provisionally registered swap dealer and from our market-making and proprietary trading in the foreign exchange and commodities trading activities. These financial instruments include futures, forward and foreign exchange contracts, exchange-traded and OTC options, mortgage-backed TBAs, and interest rate swaps. Derivative financial instruments involve varying degrees of off-statement of financial condition market risk whereby changes in the fair values of underlying financial instruments may result in changes in the fair value of the financial instruments in excess of the amounts reflected in the statement of financial condition. Exposure to market risk is influenced by a number of factors, including the relationships between the financial instruments and the Company’s positions, as well as the volatility and liquidity in the markets in which the financial instruments are traded. The principal risk components of financial instruments include, among other things, interest rate volatility, the duration of the underlying instruments and changes in commodity pricing and foreign exchange rates. The Company attempts to manage its exposure to market risk through various techniques. Aggregate market limits have been established and market risk measures are routinely monitored against these limits. Derivative contracts are traded along with cash transactions because of the integrated nature of the markets for such products. We manage the risks associated with derivatives on an aggregate basis along with the risks associated with our proprietary trading and market-making activities in cash instruments as part of our firm-wide risk management policies.
As part of the activities discussed above, we carry short positions. We sell financial instruments that we do not own, borrow the financial instruments to make good delivery, and therefore are obliged to purchase such financial instruments at a future date in order to return the borrowed financial instruments. We recorded these obligations in the condensed consolidated financial statements as of March 31, 2016 and September 30, 2015, at fair value of the related financial instruments, totaling $1,033.9 million and $568.3 million, respectively. These positions are held to offset the risks related to financial assets owned, and reported in our condensed consolidated balance sheets in ‘financial instruments owned, at fair value’, and ‘physical commodities inventory, net’. We will incur losses if the fair value of the financial instruments sold, not yet purchased, increases subsequent to March 31, 2016, which might be partially or wholly offset by gains in the value of assets held as of March 31, 2016. The totals of $1,033.9 million and $568.3 million include a net liability of $179.8 million and $54.1 million for derivatives, based on their fair value as of March 31, 2016 and September 30, 2015, respectively.
Except as discussed above, there have been no material changes to the off balance sheet arrangements discussed in the Management’s Discussion and Analysis of our Annual Report on Form 10-K for the fiscal year ended September 30, 2015.
Effects of Inflation
Because our assets are, to a large extent, liquid in nature, they are not significantly affected by inflation. Increases in our expenses, such as compensation and benefits, transaction-based clearing expenses, occupancy and equipment rental, due to inflation, may not be readily recoverable from increasing the prices of our services. While rising interest rates are generally favorable for us, to the extent that inflation has other adverse effects on the financial markets and on the value of the financial instruments held in inventory, it may adversely affect our financial position and results of operations.
Critical Accounting Policies
See our critical accounting policies discussed in the Management’s Discussion and Analysis of the most recent annual report filed on Form 10-K. There have been no material changes to these policies.
Item 3. Quantitative and Qualitative Disclosures about Market Risk
Credit Risk
See Note 4 to the Condensed Consolidated Financial Statements, ‘Financial Instruments with Off-Balance Sheet Risk and Concentrations of Credit Risk’.
Market Risk
We conduct our market-making and trading activities predominantly as a principal, which subjects our capital to significant risks. These risks include, but are not limited to, absolute and relative price movements, price volatility and changes in
48
liquidity, over which we have virtually no control. Our exposure to market risk varies in accordance with the volume of client-driven market-making transactions, the size of the proprietary positions and the volatility of the financial instruments traded.
We seek to mitigate exposure to market risk by utilizing a variety of qualitative and quantitative techniques:
• | Diversification of business activities and instruments; |
• | Limitations on positions; |
• | Allocation of capital and limits based on estimated weighted risks; and |
• | Daily monitoring of positions and mark-to-market profitability. |
We utilize derivative products in a trading capacity as a dealer to satisfy client needs and mitigate risk. We manage risks from both derivatives and non-derivative cash instruments on a consolidated basis. The risks of derivatives should not be viewed in isolation, but in aggregate with our other trading activities.
Management believes that the volatility of revenues is a key indicator of the effectiveness of our risk management techniques. The graph below summarizes volatility of our daily revenue, determined on a marked-to-market basis, during the six months ended March 31, 2016.
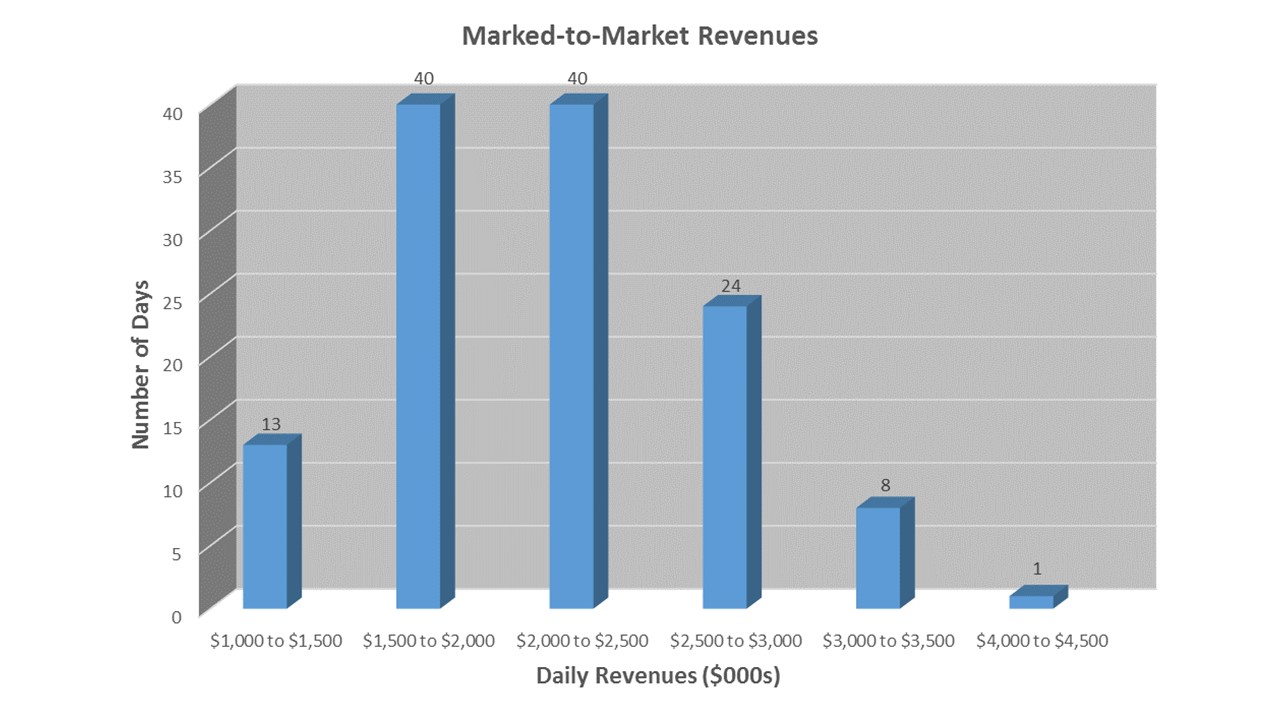
In our Securities market-making and trading activities, we maintain inventories of equity and debt securities. In our Physical Commodities segment, our positions include physical inventories, forwards, futures and options on futures. Our commodity trading activities are managed as one consolidated book for each commodity encompassing both cash positions and derivative instruments. We monitor the aggregate position for each commodity in equivalent physical ounces, metric tons or other relevant unit.
Interest Rate Risk
In the ordinary course of our operations, we have interest rate risk from the possibility that changes in interest rates will affect the values of financial instruments and impact interest income earned. Within our domestic institutional fixed income business, we maintain a significant amount of trading assets and liabilities which are sensitive to changes in interest rates. These trading activities consists primarily of securities trading in connection with U.S. Treasury, U.S. government agency, agency mortgage-backed and agency asset-backed obligations. Derivative instruments, which consist of futures, mortgage-backed “to be announced” (TBA) securities and forward settling transactions, are used to manage risk exposures in the trading inventory. The Company enters into TBA securities transactions for the sole purpose of managing risk associated with the purchase of mortgage pass-through securities.
In addition, we generate interest income from the positive spread earned on customer deposits. We typically invest in U.S. Treasury bills, notes, and obligations issued by government sponsored entities, reverse repurchase agreements involving U.S. Treasury bills and government obligations or AA-rated money market funds. We have an investment policy which establishes
49
acceptable standards of credit quality and limits the amount of funds that can be invested within a particular fund and institution.
We employ an interest rate management strategy, where we use derivative financial instruments in the form of interest rate swaps and outright purchases of medium term U.S. Treasury notes to manage a portion of our aggregate interest rate position. On a quarterly basis, we evaluate our overall level of short term investable balances, net of our of variable rate debt, and either invest a portion of these investable balances in medium term U.S. Treasury notes or enter into interest rate swaps when a sufficient interest rate spread exists between short term and medium term rates exist. Under this strategy, excluding cash deposits and our investments in AA-rated money market funds, the weighted average time to maturity of our portfolio is not to exceed 24 months in duration.
As part of this strategy, we currently hold $680 million in par value of medium term U.S. Treasury notes and $375 million in notional principal of interest rate swap derivative contracts, with the remainder being held in short term U.S. Treasury bills and AA-rated money market fund investments. The weighted-average time to maturity of the portfolio, excluding cash deposits and our investments in AA-rated money market funds, is 22 months. The U.S. Treasury notes and interest rate swaps are not designated for hedge accounting treatment, and changes in their fair values, which are volatile and can fluctuate from period to period, are recorded in earnings on a quarterly basis. During the three months ended March 31, 2016, operating revenues included unrealized gains of $6.9 million related to the change in fair value of these U.S. Treasury notes and interest rate swaps. During the six months ended March 31, 2016, operating revenues included unrealized gains of $0.2 million related to the change in fair value of these U.S. Treasury notes and interest rate swaps.
We manage interest expense using a combination of variable and fixed rate debt as well as including the average outstanding borrowings in our calculations of the notional value of interest rate swaps to be entered into as part of our interest rate management strategy discussed above. The debt instruments are carried at their unpaid principal balance which approximates fair value. At March 31, 2016, $148.3 million of our debt was variable-rate debt. We are subject to earnings and liquidity risks for changes in the interest rate on this debt. As of March 31, 2016, we had $48.7 million outstanding in fixed-rate long-term debt. There are no earnings or liquidity risks associated with our fixed-rate debt.
Item 4. Controls and Procedures
In connection with the filing of this Form 10-Q, our management, including the Chief Executive Officer and Chief Financial Officer, evaluated the effectiveness of our disclosure controls and procedures (as such term is defined in Rules 13a-15(e) and 15d-15(e) under the Securities Exchange Act of 1934, as amended) as of March 31, 2016. Our Chief Executive Officer and Chief Financial Officer have concluded that our disclosure controls and procedures were effective as of March 31, 2016.
There are limitations inherent in any internal control, such as the possibility of human error and the circumvention or overriding of controls. A control system, no matter how well conceived and operated, can provide only reasonable, not absolute, assurance that the objectives of the control system are met. As a result, there can be no assurance that a control system will succeed in preventing all possible instances of error and fraud. Our disclosure controls and procedures are designed to provide reasonable assurance of achieving their objectives, and the conclusions our Chief Executive Officer and Chief Financial Officer are made at the “reasonable assurance” level.
There were no changes in our internal controls over financial reporting during the quarter ended March 31, 2016 that materially affected, or are reasonably likely to materially affect, our internal control over financial reporting.
PART II
Item 1. Legal Proceedings
From time to time and in the ordinary course of business, we are involved in various legal and regulatory actions and proceedings, including tort claims, contractual disputes, employment matters, workers’ compensation claims and collections. We carry insurance that provides protection against certain types of claims, up to the policy limits of our insurance.
Sentinel Litigation
Prior to our July 1, 2015 merger of into INTL FCStone Financial Inc., our subsidiary FCStone, LLC, had a portion of its excess segregated funds invested with Sentinel Management Group Inc. (“Sentinel”), a registered futures commission merchant(“FCM”) and an Illinois-based money manager that provided cash management services to other FCMs. In August 2007, Sentinel halted redemptions to customers and sold certain of the assets it managed to an unaffiliated third party at a significant discount. On August 17, 2007, subsequent to Sentinel’s sale of certain assets, Sentinel filed for bankruptcy protection. In aggregate, $15.5 million of FCStone, LLC’s $21.9 million in invested funds were returned to it before and after Sentinel’s bankruptcy petition.
50
In August 2008, the bankruptcy trustee of Sentinel filed adversary proceedings against FCStone, LLC, and a number of other FCMs in the Bankruptcy Court for the Northern District of Illinois. The case was subsequently reassigned to the United States District Court, for the Northern District of Illinois. In the complaint, the trustee sought avoidance of alleged transfers or withdrawals of funds received by FCStone, LLC and other FCMs within 90 days prior to the filing of the Sentinel bankruptcy petition, as well as avoidance of post-petition distributions and disallowance of the proof of claim filed by FCStone, LLC. The trustee sought recovery of pre- and post-petition transfers totaling approximately $15.5 million.
The trial of this matter took place, as a test case, during October 2012. The trial court entered a judgment against FCStone, LLC on January 4, 2013. On January 17, 2013, the trial court entered an agreed order, staying execution and enforcement, pending an appeal of the judgment. On March 19, 2014, the appeal court ruled in favor of FCStone, LLC. In April 2014, the trustee filed a petition for rehearing of the appeal. In May 2014, the U.S. Court of Appeals for the Seventh Circuit denied the petition. The trustee did not file a writ for certiorari with the U.S. Supreme Court during the time allotted to do so.
On February 10, 2015, based on a new theory, the trustee filed a motion for judgment against FCStone, LLC in the United States District Court, for the Northern District of Illinois, seeking to claw back the post-petition transfer of $14.5 million and to recover the funds held in reserve in the name of FCStone, LLC. FCStone, LLC filed its opposition brief and an associated motion for judgment on March 17, 2015. The trustee filed its reply briefs on April 7, 2015 and we filed our reply briefs on April 22, 2015.
On March 28, 2016, the United States District Court for the Northern District of Illinois entered an order in favor of FCStone, LLC (now INTL FCStone Financial Inc.) and against the Trustee on the Trustee’s post-petition claim, in light of the Seventh Circuit’s opinion. The same court ruled against INTL FCStone Financial and in favor of the Trustee with respect to the funds held in reserve accounts.
On April 25, 2016, INTL FCStone Financial filed a Notice of Appeal to the United States Court of Appeals for the Seventh Circuit relating to the portion of the final judgment dated March 28, 2016 of the district court and INTL FCStone Financial’s claim to funds in reserve accounts. On April 26, 2016, the Trustee filed his Notice of Appeal from the March 28, 2016 final judgment of the district court.
We have determined that losses related to the Trustee’s appeal are neither probable nor reasonably possible. We believe the case is without merit and intend to defend ourselves vigorously.
Our assessments are based on estimates and assumptions that have been deemed reasonable by management, but that may later prove to be incomplete or inaccurate, and unanticipated events and circumstances may occur that might cause us to change those estimates and assumptions.
Item 1A. Risk Factors
In addition to the other information set forth in this report, information regarding risks affecting us appears in Part I, Item 1A our Annual Report on Form 10-K for the fiscal year ended September 30, 2015. These are not the only risks we face. Additional risks and uncertainties not currently known to us or that management currently considers to be non-material may in the future adversely affect our business, financial condition and operating results. There have been no material changes to our risk factors since the filing of our Form 10-K.
Item 2. Unregistered Sales of Equity Securities and Use of Proceeds
On August 20, 2015, our Board of Directors authorized for fiscal year 2016 the repurchase of up to 1.0 million shares of our outstanding common stock from time to time in open market purchase and private transactions, commencing on October 1, 2015 and ending on September 30, 2016, subject to the discretion of the senior management team to implement our stock repurchase plan, and subject to market conditions and as permitted by securities laws and other legal, regulatory and contractual requirements and covenants.
Our common stock repurchase program activity for the three months ended March 31, 2016 was as follows.
Period | Total Number of Shares Purchased(1) | Average Price Paid per Share | Total Number of Shares Purchased as Part of Publicly Announced Program | Maximum Number of Shares Remaining to be Purchased Under the Program | ||||||||
January 1, 2016 to January 31, 2016 | — | $ | — | — | 1,000,000 | |||||||
February 1, 2016 to February 29, 2016 | 280,238 | 25.70 | 280,238 | 719,762 | ||||||||
March 1, 2016 to March 31, 2016 | 120,068 | 26.34 | 120,068 | 599,694 | ||||||||
Total | 400,306 | $ | 25.89 | 400,306 | ||||||||
51
Item 6. Exhibits
10.1 | Amendment to Secured Clearance Advance Facility Agreement entered into as of January 5, 2016, by and between INTL FCStone Financial Inc. as Customer and JPMorgan Chase Bank, N.A. (incorporated by reference from the Company’s Current Report on Form 8-K filed with the SEC on January 8, 2016). | |
10.2 | INTL FCStone Inc. 2016 Executive Performance Plan (filed as Appendix A to the definitive proxy statement on Schedule 14A dated January 15, 2016 and incorporated herein by reference). | |
10.3 | INTL FCStone Inc. 2016 Long-Term Performance Incentive Plan (filed as Appendix B to the definitive proxy statement on Schedule 14A dated January 15, 2016 and incorporated herein by reference). | |
10.4 | Third Amendment to Credit Agreement entered into as of March 18, 2016 with Bank of America, N.A., as Administrative Agent, Lender, L/C Issuer and Swing Line Lender, Capital One, National Association, as Syndication Agent and a Lender, Bank Hapoalim B.M., BMO Harris Bank N.A., BankUnited, N.A. and Barclays Bank PLC, as additional Lenders, and with the lenders from time to time parties thereto (incorporated by reference from the Company’s Current Report on Form 8-K filed with the SEC on March 23, 2016). | |
31.1 | Certification of Chief Executive Officer, pursuant to Rule 13a—14(a). | |
31.2 | Certification of Chief Financial Officer, pursuant to Rule 13a—14(a). | |
32.1 | Certification of Chief Executive Officer, pursuant to 18 U.S.C. Section 1350, as adopted pursuant to Section 906 of the Sarbanes-Oxley Act of 2002. | |
32.2 | Certification of Chief Financial Officer, pursuant to 18 U.S.C. Section 1350, as adopted pursuant to Section 906 of the Sarbanes-Oxley Act of 2002. | |
Signatures
Pursuant to the requirements of the Securities Exchange Act of 1934, the registrant has duly caused this report to be signed on its behalf by the undersigned thereunto duly authorized.
INTL FCStone Inc.
Date: | May 4, 2016 | /s/ Sean M. O’Connor | ||
Sean M. O’Connor | ||||
Chief Executive Officer | ||||
Date: | May 4, 2016 | /s/ William J. Dunaway | ||
William J. Dunaway | ||||
Chief Financial Officer | ||||
52