Attached files
| file | filename |
|---|---|
| EX-31.1 - SECTION 302 CEO CERTIFICATION - StoneX Group Inc. | iaacexhibit31103312011.htm |
| EX-32.1 - SECTION 906 CEO CERTIFICATION - StoneX Group Inc. | iaacexhibit32103312011.htm |
| EX-31.2 - SECTION 302 CFO CERTIFICATION - StoneX Group Inc. | iaacexhibit31203312011.htm |
| EX-32.2 - SECTION 906 CFO CERTIFICATION - StoneX Group Inc. | iaacexhibit32203312011.htm |
UNITED STATES
SECURITIES AND EXCHANGE COMMISSION
Washington, D.C. 20549
____________________
FORM 10-Q
____________________
(Mark One)
x | QUARTERLY REPORT PURSUANT TO SECTION 13 OR 15(d) OF THE SECURITIES EXCHANGE ACT OF 1934 |
OR
o | TRANSITION REPORT PURSUANT TO SECTION 13 OR 15(d) OF THE SECURITIES EXCHANGE ACT OF 1934 |
For the Transition Period From to
Commission File Number 000-23554
____________________
INTL FCStone Inc.
(Exact name of registrant as specified in its charter)
____________________
Delaware | 59-2921318 | |
(State or other jurisdiction of incorporation or organization) | (I.R.S. Employer Identification No.) | |
New York, NY 10017
(Address of principal executive offices) (Zip Code)
(212) 485-3500
(Registrant’s telephone number, including area code)
____________________
Indicate by check mark whether the registrant (1) has filed all reports required to be filed by Section 13 or 15(d) of the Securities Exchange Act of 1934 during the preceding 12 months (or for such shorter period that the registrant was required to file such reports), and (2) has been subject to such filing requirements for the past 90 days. Yes x No o
Indicate by check mark whether the registrant has submitted electronically and posted on its corporate Web site, if any, every Interactive Data File required to be submitted and posted pursuant to Rule 305 of Regulation S-T (§232.405 of this chapter) during the preceding 12 months (or for such shorter period that the registrant was required to submit and post such files). Yes o No o
Indicate by check mark whether the registrant is a large accelerated filer, an accelerated filer, a non-accelerated filer, or smaller reporting company.
Large accelerated filer | o | Accelerated filer | x | |
Non-accelerated filer | o | Smaller reporting company | o | |
Indicate by check mark whether the registrant is a shell company (as defined in Rule 12b-2 of the Exchange Act). Yes o No x
As of May 6, 2011, there were 18,181,972 shares of the registrant’s common stock outstanding.
INTL FCStone Inc.
INDEX
Page | ||
Part I. FINANCIAL INFORMATION | ||
Item 1. | ||
Item 2. | ||
Item 3. | ||
Item 4. | ||
Part II. OTHER INFORMATION | ||
Item 1. | ||
Item 1A. | ||
Part I. FINANCIAL INFORMATION
Item 1. Financial Statements
INTL FCStone Inc.
Condensed Consolidated Balance Sheets
(in millions, except par value and share amounts) | March 31, 2011 | September 30, 2010 | |||||
(Unaudited) | |||||||
ASSETS | |||||||
Cash and cash equivalents | $ | 135.0 | $ | 81.9 | |||
Cash, securities and other assets segregated under federal and other regulations (including $24.8 and $0.8 at fair value at March 31, 2011 and September 30, 2010, respectively) | 64.9 | 15.3 | |||||
Securities purchased under agreements to resell | 77.2 | 342.0 | |||||
Deposits and receivables from: | |||||||
Exchange-clearing organizations (including $996.8 and $906.4 at fair value at March 31, 2011 and September 30, 2010, respectively) | 1,046.5 | 903.4 | |||||
Broker-dealers, clearing organizations and counterparties (including $16.0 and $56.1 at fair value at March 31, 2011 and September 30, 2010, respectively) | 123.2 | 173.9 | |||||
Receivables from customers, net | 158.1 | 78.0 | |||||
Notes receivable, net | 46.0 | 29.2 | |||||
Income taxes receivable | 8.4 | 9.4 | |||||
Financial instruments owned, at fair value | 338.5 | 159.8 | |||||
Physical commodities inventory, at cost | 163.0 | 125.0 | |||||
Deferred income taxes | 20.1 | 21.0 | |||||
Property and equipment, net | 10.2 | 7.3 | |||||
Goodwill and intangible assets, net | 57.2 | 53.4 | |||||
Other assets | 23.6 | 22.1 | |||||
Total assets | $ | 2,271.9 | $ | 2,021.7 | |||
LIABILITIES AND EQUITY | |||||||
Liabilities: | |||||||
Accounts payable and other accrued liabilities (including $30.5 and $32.3 at fair value at March 31, 2011 and September 30, 2010) | $ | 107.1 | $ | 99.4 | |||
Payables to: | |||||||
Customers | 1,285.2 | 1,351.0 | |||||
Broker-dealers, clearing organizations and counterparties | 2.8 | 3.9 | |||||
Lenders under loans and overdrafts | 32.0 | 114.9 | |||||
Income taxes payable | 7.9 | 2.8 | |||||
Financial instruments sold, not yet purchased, at fair value | 554.8 | 189.6 | |||||
1,989.8 | 1,761.6 | ||||||
Subordinated debt | — | 0.5 | |||||
Convertible subordinated notes payable | 10.0 | 16.7 | |||||
Total liabilities | 1,999.8 | 1,778.8 | |||||
Commitments and contingencies (see Notes 12 and 13) | |||||||
Equity: | |||||||
INTL FCStone Inc. stockholders’ equity: | |||||||
Preferred stock, $.01 par value. Authorized 1,000,000 shares; no shares issued or outstanding | — | — | |||||
Common stock, $.01 par value. Authorized 30,000,000 shares; 18,114,565 issued and 18,103,308 outstanding at March 31, 2011 and 17,612,792 issued and 17,601,535 outstanding at September 30, 2010 | 0.2 | 0.2 | |||||
Common stock in treasury, at cost - 11,257 shares at March 31, 2011 and September 30, 2010 | (0.1 | ) | (0.1 | ) | |||
Additional paid-in capital | 193.8 | 184.6 | |||||
Retained earnings | 79.1 | 59.7 | |||||
Accumulated other comprehensive loss | (2.2 | ) | (3.1 | ) | |||
Total INTL FCStone Inc. stockholders’ equity | 270.8 | 241.3 | |||||
Noncontrolling interests | 1.3 | 1.6 | |||||
Total equity | 272.1 | 242.9 | |||||
Total liabilities and equity | $ | 2,271.9 | $ | 2,021.7 | |||
1
INTL FCStone Inc.
Condensed Consolidated Income Statements
(Unaudited)
Three Months Ended March 31, | Six Months Ended March 31, | ||||||||||||||
(in millions, except share and per share amounts) | 2011 | 2010 | 2011 | 2010 | |||||||||||
Revenues: | |||||||||||||||
Sales of physical commodities | $ | 14,506.4 | $ | 8,995.7 | $ | 30,715.2 | $ | 16,945.4 | |||||||
Trading gains | 30.9 | 25.7 | 47.9 | 27.5 | |||||||||||
Commission and clearing fees | 36.9 | 27.0 | 74.5 | 56.9 | |||||||||||
Consulting and management fees | 5.5 | 4.4 | 10.0 | 8.6 | |||||||||||
Interest income | 3.0 | 1.7 | 5.5 | 3.1 | |||||||||||
Other income | 0.3 | 0.1 | 0.7 | 0.1 | |||||||||||
Total revenues | 14,583.0 | 9,054.6 | 30,853.8 | 17,041.6 | |||||||||||
Cost of sales of physical commodities | 14,470.0 | 8,989.3 | 30,644.1 | 16,916.7 | |||||||||||
Operating revenues | 113.0 | 65.3 | 209.7 | 124.9 | |||||||||||
Interest expense | 3.3 | 2.3 | 7.1 | 4.8 | |||||||||||
Net revenues | 109.7 | 63.0 | 202.6 | 120.1 | |||||||||||
Non-interest expenses: | |||||||||||||||
Compensation and benefits | 43.1 | 23.0 | 85.6 | 47.1 | |||||||||||
Clearing and related expenses | 20.2 | 15.3 | 40.4 | 33.8 | |||||||||||
Communication and data services | 3.4 | 2.7 | 6.9 | 5.3 | |||||||||||
Introducing broker commissions | 6.0 | 4.7 | 11.4 | 8.9 | |||||||||||
Occupancy and equipment rental | 2.2 | 1.4 | 4.0 | 3.0 | |||||||||||
Professional fees | 1.9 | 1.9 | 4.0 | 3.7 | |||||||||||
Depreciation and amortization | 1.1 | 0.2 | 2.1 | 0.4 | |||||||||||
Bad debts and impairments | 2.1 | (0.4 | ) | 4.5 | 0.2 | ||||||||||
Other | 6.4 | 4.5 | 14.5 | 8.5 | |||||||||||
Total non-interest expenses | 86.4 | 53.3 | 173.4 | 110.9 | |||||||||||
Income from continuing operations, before tax | 23.3 | 9.7 | 29.2 | 9.2 | |||||||||||
Income tax expense | 8.0 | 3.5 | 10.1 | 3.3 | |||||||||||
Income from continuing operations | 15.3 | 6.2 | 19.1 | 5.9 | |||||||||||
Income from discontinued operations, net of tax | — | 1.2 | 0.2 | 0.4 | |||||||||||
Income before extraordinary loss | 15.3 | 7.4 | 19.3 | 6.3 | |||||||||||
Extraordinary loss | — | — | — | (3.4 | ) | ||||||||||
Net income | 15.3 | 7.4 | 19.3 | 2.9 | |||||||||||
Add: Net loss attributable to noncontrolling interests | 0.1 | — | 0.1 | 0.3 | |||||||||||
Net income attributable to INTL FCStone Inc. common stockholders | $ | 15.4 | $ | 7.4 | $ | 19.4 | $ | 3.2 | |||||||
Basic earnings per share: | |||||||||||||||
Income from continuing operations attributable to INTL FCStone Inc. common stockholders | $ | 0.87 | $ | 0.36 | $ | 1.09 | $ | 0.35 | |||||||
Income from discontinued operations attributable to INTL FCStone Inc. common stockholders | — | 0.07 | 0.01 | 0.02 | |||||||||||
Extraordinary loss attributable to INTL FCStone Inc. common stockholders | — | — | — | (0.19 | ) | ||||||||||
Net income attributable to INTL FCStone Inc. common stockholders | $ | 0.87 | $ | 0.43 | $ | 1.10 | $ | 0.18 | |||||||
Diluted earnings per share: | |||||||||||||||
Income from continuing operations attributable to INTL FCStone Inc. common stockholders | $ | 0.81 | $ | 0.34 | $ | 1.02 | $ | 0.34 | |||||||
Income from discontinued operations attributable to INTL FCStone Inc. common stockholders | — | 0.07 | 0.01 | 0.02 | |||||||||||
Extraordinary loss attributable to INTL FCStone Inc. common stockholders | — | — | — | (0.19 | ) | ||||||||||
Net income attributable to INTL FCStone Inc. common stockholders | $ | 0.81 | $ | 0.41 | $ | 1.03 | $ | 0.17 | |||||||
Weighted-average number of common shares outstanding: | |||||||||||||||
Basic | 17,830,888 | 17,319,170 | 17,622,306 | 17,271,940 | |||||||||||
Diluted | 19,224,588 | 18,483,752 | 19,181,158 | 17,821,990 | |||||||||||
Amounts attributable to INTL FCStone Inc. common stockholders: | |||||||||||||||
Income from continuing operations, net of tax | $ | 15.4 | $ | 6.2 | $ | 19.2 | $ | 6.2 | |||||||
Income from discontinued operations, net of tax | — | 1.2 | 0.2 | 0.4 | |||||||||||
Extraordinary loss | — | — | — | (3.4 | ) | ||||||||||
Net income | $ | 15.4 | $ | 7.4 | $ | 19.4 | $ | 3.2 | |||||||
See accompanying notes to condensed consolidated financial statements.
2
INTL FCStone Inc.
Condensed Consolidated Cash Flows Statements
(Unaudited)
Six Months Ended March 31, | |||||||
(in millions) | 2011 | 2010 | |||||
Cash flows from operating activities: | |||||||
Net cash provided by operating activities | $ | 152.7 | $ | 88.9 | |||
Cash flows from investing activities: | |||||||
Cash paid for acquisitions, net | (10.4 | ) | (1.2 | ) | |||
Purchase of exchange memberships and common stock | (3.4 | ) | — | ||||
Sale of exchange memberships and common stock | 1.3 | — | |||||
Deconsolidation of affiliates | — | (0.3 | ) | ||||
Purchase of property and equipment | (3.9 | ) | (1.5 | ) | |||
Net cash used in investing activities | (16.4 | ) | (3.0 | ) | |||
Cash flows from financing activities: | |||||||
Net change in payable to lenders under loans and overdrafts | (82.8 | ) | (36.5 | ) | |||
Repayment of subordinated debt | (0.5 | ) | (51.0 | ) | |||
Debt issuance costs | (1.2 | ) | — | ||||
Exercise of stock options | 1.2 | 0.7 | |||||
Income tax benefit on stock options and awards | 0.1 | 0.1 | |||||
Net cash used in financing activities | (83.2 | ) | (86.7 | ) | |||
Effect of exchange rates on cash and cash equivalents | — | 0.1 | |||||
Net increase (decrease) in cash and cash equivalents | 53.1 | (0.7 | ) | ||||
Cash and cash equivalents at beginning of period | 81.9 | 60.5 | |||||
Cash and cash equivalents at end of period | $ | 135.0 | $ | 59.8 | |||
Supplemental disclosure of cash flow information: | |||||||
Cash paid for interest | $ | 4.3 | $ | 4.7 | |||
Income taxes paid, net of cash refunds | $ | 2.2 | $ | (38.7 | ) | ||
Supplemental disclosure of non-cash investing and financing activities: | |||||||
Conversion of subordinated notes to common stock, net | $ | 6.8 | $ | — | |||
See accompanying notes to condensed consolidated financial statements.
3
INTL FCStone Inc.
Condensed Consolidated Statements of Stockholders’ Equity
(Unaudited)
(in millions) | Common Stock | Treasury Stock | Additional Paid-in Capital | Retained Earnings | Accumulated Other Comprehensive Loss | Noncontrolling Interests | Total | ||||||||||||||||||||
Balances as of September 30, 2010 | $ | 0.2 | $ | (0.1 | ) | $ | 184.6 | $ | 59.7 | $ | (3.1 | ) | $ | 1.6 | $ | 242.9 | |||||||||||
Components of comprehensive income: | |||||||||||||||||||||||||||
Net income (loss) | 19.4 | (0.1 | ) | 19.3 | |||||||||||||||||||||||
Change in foreign currency translation | (0.1 | ) | (0.1 | ) | |||||||||||||||||||||||
Change in unrealized loss on derivative instruments | 1.1 | 1.1 | |||||||||||||||||||||||||
Change in unrealized gain or loss on available-for-sale securities | (0.1 | ) | (0.1 | ) | |||||||||||||||||||||||
Total comprehensive income | $ | 20.2 | |||||||||||||||||||||||||
Redemption of fund units | (0.2 | ) | (0.2 | ) | |||||||||||||||||||||||
Exercise of stock options | 1.3 | 1.3 | |||||||||||||||||||||||||
Stock-based compensation | 1.1 | 1.1 | |||||||||||||||||||||||||
Convertible note conversions | 6.8 | 6.8 | |||||||||||||||||||||||||
Balances as of March 31, 2011 | $ | 0.2 | $ | (0.1 | ) | $ | 193.8 | $ | 79.1 | $ | (2.2 | ) | $ | 1.3 | $ | 272.1 | |||||||||||
See accompanying notes to condensed consolidated financial statements.
4
INTL FCStone Inc.
Notes to Condensed Consolidated Financial Statements
(Unaudited)
Note 1 – Basis of Presentation and Consolidation and Recently Issued Accounting Standards
INTL FCStone Inc., a Delaware corporation, together with its consolidated subsidiaries (collectively “INTL” or “the Company”) form a financial services group focused on domestic and select international markets. The Company’s services include comprehensive risk management advisory services for commercial customers; execution of listed futures and options on futures contracts on all major commodity exchanges; structured over-the-counter (OTC) products in a wide range of commodities; physical trading and hedging of precious and base metals and select other commodities; trading of more than 130 foreign currencies; market-making in international equities; debt origination and asset management. During the quarter ended March 31, 2011, the Company changed its name from International Assets Holding Corporation to INTL FCStone Inc., following approval of the name change by the Company's stockholders.
The Company provides these services to a diverse group of approximately 10,000 customers located throughout the world, including producers, processors and end-users of nearly all widely-traded physical commodities to manage their risks and enhance margins; to commercial counterparties who are end-users of the firm’s products and services; to governmental and non-governmental organizations; and to commercial banks, brokers, institutional investors and major investment banks.
Basis of Presentation and Consolidation
The accompanying condensed consolidated balance sheet as of September 30, 2010, which has been derived from audited financial statements, and the unaudited interim condensed consolidated financial statements have been prepared pursuant to the rules and regulations of the Securities and Exchange Commission ("SEC"). Certain information and note disclosures normally included in annual financial statements prepared in accordance with accounting principles generally accepted in the United States of America ("U.S. GAAP") have been condensed or omitted pursuant to those rules and regulations. The Company believes that the disclosures made are adequate to make the information presented not misleading. In the opinion of management, all adjustments (consisting of normal recurring accruals) considered necessary for a fair presentation of the condensed consolidated financial statements for the interim periods presented have been reflected as required by Rule 10-01 of Regulation S-X.
Operating results for interim periods are not necessarily indicative of the results that may be expected for the full year. It is suggested that these interim condensed consolidated financial statements should be read in conjunction with the Company’s audited consolidated financial statements and related notes contained in the Company’s Form 10-K for the fiscal year ended September 30, 2010 filed with the SEC.
These condensed consolidated financial statements include the accounts of INTL FCStone Inc. and its subsidiaries. Intercompany transactions and balances have been eliminated in consolidation. In accordance with the Consolidation Topic of the Accounting Standards Codification (ASC), the Company consolidates any variable interest entities for which it is the primary beneficiary, as defined.
The Company has a majority interest in the Blackthorn Multi-Advisor Fund, LP (the “Blackthorn Fund”). The Blackthorn Fund is a commodity investment pool, which allocates most of its assets to third-party commodity trading advisors and other investment managers. The Blackthorn Fund engages in speculative trading of a wide variety of commodity futures and option contracts, securities and other financial instruments. In addition to the majority interest that was acquired, a subsidiary of the Company is also the general partner of the Blackthorn Fund. Under the provisions of the Consolidations Topic of the ASC, the Company is required to consolidate the Blackthorn Fund as a variable interest entity since it is the general partner and owns a majority interest. The creditors of the Blackthorn Fund have no recourse to the general assets of the Company.
The Blackthorn Fund had net assets of $4.9 million as of March 31, 2011. The net assets of the Blackthorn fund consisted of cash and cash equivalents of $1.2 million, deposits and receivables from broker-dealers, clearing organizations and counterparties of $2.8 million, investments in managed funds of $1.2 million and $0.3 million in accounts payable and other accrued liabilities at March 31, 2011. Accordingly, the noncontrolling interest shown in the balance sheet includes the noncontrolling interest of the Blackthorn Fund of $1.4 million as of March 31, 2011. See Note 6 for discussion of fair value of the financial assets and liabilities.
Our fiscal year end is September 30, and our fiscal quarters end on December 31, March 31, June 30 and September 30. Unless otherwise stated, all dates refer to our fiscal years and fiscal interim periods.
5
The preparation of condensed consolidated financial statements in conformity with U.S. GAAP requires management to make estimates and assumptions that affect the reported amounts of assets, liabilities, revenue, and expenses. The most significant of these estimates and assumptions relate to fair value measurements for financial instruments and investments and the provision for potential losses from bad debts. Provisions for estimated bad debts are recorded on a specific identification basis. Although these and other estimates and assumptions are based on the best available information, actual results could be materially different from these estimates.
Reclassifications
In the six months ended March 31, 2011, the Company reclassified give-up fee revenue in the amount of $0.9 million within the condensed consolidated income statement to the financial statement line caption 'Commission and clearing fees', from 'Consulting and management fees'. Additionally, reclassifications in the amount of $0.3 million and $0.6 million have been made to the three and six month periods ended March 31, 2010, respectively, to conform to the current year presentation. These reclassifications had no effect on previously reported total or net revenues.
Recently Issued Accounting Standards
In June 2009, new guidance was issued on transfers and servicing of financial assets to eliminate the concept of a qualifying special-purpose entity, change the requirements for off balance sheet accounting for financial assets including limiting the circumstances where off balance sheet treatment for a portion of a financial asset is allowable, and require additional disclosures. The guidance was effective at the beginning of the Company’s 2011 fiscal year. The adoption of this guidance did not have a material impact on the Company’s consolidated financial statements.
In June 2009, new guidance was issued to revise the approach to determine when a variable interest entity (VIE) should be consolidated. The new consolidation model for VIEs considers whether the Company has the power to direct the activities that most significantly impact the VIEs economic performance and shares in the significant risks and rewards of the entity. The guidance on VIEs requires companies to continually reassess VIEs to determine if consolidation is appropriate and provide additional disclosures. The guidance was effective for the beginning of the Company’s 2011 fiscal year. The adoption of this guidance did not have a material impact on the Company’s consolidated financial statements.
In January 2010, new guidance was issued to require new disclosures and clarify existing disclosure requirements about fair value measurements as set forth in the Fair Value Measurements and Disclosures Topic in the ASC. The guidance requires that a reporting entity should disclose separately the amounts of significant transfers in and out of Level 1 and Level 2 fair value measurements and describe the reasons for the transfers; and in the reconciliation for fair value measurements using significant unobservable inputs, a reporting entity should present separately information about purchases, sales, issuances, and settlements. In addition, the guidance clarifies that for purposes of reporting fair value measurement for each class of assets and liabilities, a reporting entity needs to use judgment in determining the appropriate classes of assets and liabilities; and a reporting entity should provide disclosures about the valuation techniques and inputs used to measure fair value for both recurring and nonrecurring fair value measurements. This guidance was effective for the Company as of the quarter ended March 31, 2010 except for the detailed level 3 roll forward disclosure, which is effective for fiscal years beginning after December 15, 2010. The adoption of this guidance will not have a material impact on the Company’s disclosures in its consolidated financial statements.
Note 2 – Income Taxes
In determining the quarterly provision for income taxes, management uses an estimated annual effective tax rate which is based on the expected annual income and statutory tax rates in the various jurisdictions in which it operates. The Company’s effective tax rate differs from the U.S. statutory rate primarily due to state and local taxes, and differing statutory tax rates applied to the income of non-U.S. subsidiaries. The Company records the tax effect of certain discrete items, including the effects of changes in tax laws, tax rates and adjustments with respect to valuation allowances or other unusual or nonrecurring tax adjustments, in the interim period in which they occur, as an addition to, or reduction from, the income tax provision, rather than being included in the estimated effective annual income tax rate. In addition, jurisdictions with a projected loss for the year or a year-to-date loss where no tax benefit can be recognized are excluded from the estimated annual effective income tax rate.
The Company is required to assess its deferred tax assets and the need for a valuation allowance at each reporting period. This assessment requires judgment on the part of management with respect to benefits that may be realized. The Company will record a valuation allowance against deferred tax assets when it is considered more likely than not that all or a portion of our deferred tax assets will not be realized.
6
The income tax expense from continuing operations of $8.0 million and $3.5 million for the three months ended March 31, 2011 and 2010, respectively, and income tax expense from continuing operations of $10.1 million and $3.3 million for the six months ended March 31, 2011 and 2010, respectively, reflect estimated federal, foreign and state taxes. For the three months ended March 31, 2011, the Company’s effective tax rate was 34%, compared to 36% for the three months ended March 31, 2010. For the six months ended March 31, 2011, the Company's effective tax rate was 35%, compared to 36% for the six months ended March 31, 2010.
The Company and its subsidiaries file income tax returns with the U.S. federal jurisdiction, various states, and various foreign jurisdictions. The Internal Revenue Service has commenced an examination of the U.S. income tax return of FCStone Group, Inc. ("FCStone") for its fiscal year ended August 31, 2009. FCStone is a wholly-owned subsidiary acquired on September 30, 2009. Additionally, both INTL and FCStone are under separate state examinations for various periods, ranging from August 31, 2006 through September 30, 2009.
Note 3 – Earnings per Share
Basic earnings per share (EPS) has been computed by dividing net income by the weighted-average number of common shares outstanding. The following is a reconciliation of the numerator and denominator of the diluted net income per share computations for the periods presented below.
Three Months Ended March 31, | Six Months Ended March 31, | ||||||||||||||
(in millions, except share amounts) | 2011 | 2010 | 2011 | 2010 | |||||||||||
Numerator: | |||||||||||||||
Income from continuing operations | $ | 15.4 | $ | 6.2 | $ | 19.2 | $ | 6.2 | |||||||
Add: Interest on convertible debt, net of tax | 0.1 | 0.2 | 0.3 | — | |||||||||||
Diluted income from continuing operations | 15.5 | 6.4 | 19.5 | 6.2 | |||||||||||
Add: Income from discontinued operations | — | 1.2 | 0.2 | 0.4 | |||||||||||
Less: Extraordinary loss | — | — | — | (3.4 | ) | ||||||||||
Diluted net income | $ | 15.5 | $ | 7.6 | $ | 19.7 | $ | 3.2 | |||||||
Denominator: | |||||||||||||||
Weighted average number of: | |||||||||||||||
Common shares outstanding | 17,830,888 | 17,319,170 | 17,622,306 | 17,271,940 | |||||||||||
Dilutive potential common shares outstanding: | |||||||||||||||
Share-based awards | 930,929 | 507,646 | 961,692 | 550,050 | |||||||||||
Convertible debt | 462,771 | 656,936 | 597,160 | — | |||||||||||
Diluted weighted-average shares | 19,224,588 | 18,483,752 | 19,181,158 | 17,821,990 | |||||||||||
The dilutive effect of share-based awards is reflected in diluted net income per share by application of the treasury stock method, which includes consideration of unamortized share-based compensation expense required under the Compensation – Stock Compensation Topic of the ASC. The dilutive effect of convertible debt is reflected in diluted net income per share by application of the if-converted method.
Options to purchase 394,179 and 848,562 shares of common stock for the three months ended March 31, 2011 and 2010, respectively, and 395,485 and 848,562 shares of common stock for the six months ended March 31, 2011 and 2010, respectively, were excluded from the calculation of diluted earnings per share because they would have been anti-dilutive.
The Company has unvested share-based payment awards that are considered participating securities and should be included in the computation of basic EPS using the two-class method. The Company has omitted disclosures related to the two-class method as the impact of the computation does not have a material effect on the condensed consolidated financial statements. Had the required disclosures been made for the three months ended March 31, 2011 and 2010, respectively, the Company’s basic earnings per share would have been reduced by approximately $0.01 per share.
7
Note 4 – Receivables from customers and notes receivable, net
On March 31, 2011, the commodities market experienced an upward limit price movement on a certain commodity, and as a result, certain exchange-traded derivative contracts, which would normally be valued using quoted market prices were priced using a valuation model - see Note 6. This market event caused a significant increase in receivables from customers related to margin balances as of the balance sheet date. The Company has subsequently collected all margin balances from its customers related to this market event.
Receivables from customers, net and notes receivable, net include a provision for bad debts, which reflects our best estimate of probable losses inherent in the receivables from customers and notes receivable. The Company provides for an allowance for doubtful accounts based on a specific-identification basis. The Company continually reviews its provision for bad debts. The allowance for doubtful accounts related to receivables from customers is $9.2 million and $4.9 million at March 31, 2011 and September 30, 2010, respectively.
During the three and six months ended March 31, 2011, the Company recorded charges to bad debt expense of $0.3 million and $4.5 million, respectively, primarily related to a customer to whom the Company had consigned gold, in the C&RM segment and a clearing customer deficit account in the CES segment. During the three and six months ended March 31, 2011, the Company recorded recoveries of $0.1 million and $1.9 million, respectively, of bad debt expense, including $1.3 million following a settlement relating to a disputed trade that was “given-up” to FCStone during the quarter ended June 30, 2010 by another futures commission merchant (FCM) for a customer that held an account with us.
As a result of the acquisition of FCStone, the Company acquired certain notes receivable of $133.7 million at September 30, 2009, consisting of promissory notes from certain customers and an introducing broker which arose from previous customer account deficits, of which the Company estimated collectability to be $16.7 million. During the three months ended March 31, 2011, the Company recovered $11.4 million as partial payment against the promissory notes receivable from these certain customers, and charged off $111.5 million against the allowance for notes receivable related to these certain customer account deficits. Total recoveries from these certain customers and introducing broker through March 31, 2011 is $14.3 million, and at March 31, 2011, remaining notes receivable related to these certain customer account deficits was $2.4 million. The Company expects to collect the remaining amounts from the introducing broker, by withholding commissions due on future revenues collected by the Company, and through credit insurance, although no assurance can be given as to the timing of collection. The allowance for doubtful accounts related to total notes receivable was $2.1 million at March 31, 2011, and $114.3 million at September 30, 2010.
Activity in the allowance for doubtful accounts and notes was as follows:
(in millions) | |||
Balance, September 30, 2010 | $ | 119.2 | |
Provision for bad debts | 4.5 | ||
Transfer in (1) | 2.5 | ||
Deductions: | |||
Charge-offs | (113.0 | ) | |
Recoveries | (1.9 | ) | |
Balance, March 31, 2011 | $ | 11.3 | |
(1) | During the three months ended December 31, 2010, certain open position derivative contracts, which had a $2.5 million credit reserve at September 30, 2010 were closed, and the deficit account balance was reclassified from financial instruments owned to a receivable from customer. Accordingly, the previously established credit reserve amount was transferred into the allowance for doubtful accounts during the three months ended December 31, 2010. |
Additionally, in the normal course of operations the Company accepts notes receivable under sale/repurchase agreements with customers whereby the customers sell certain commodity inventory and agree to repurchase the commodity inventory at a future date at either a fixed or floating rate. These transactions are short-term in nature, and are treated as secured borrowings rather than commodity inventory, purchases and sales in the Company’s condensed consolidated financial statements. At March 31, 2011 and September 30, 2010, the Company had outstanding notes receivable of $42.9 million and $13.6 million, respectively, related to this program.
8
Note 5 – Exchange Memberships and Stock
The Company holds certain commodity exchange membership seats and commodity exchange firm common stock, which are pledged for clearing purposes, providing the Company the right to process trades directly with the various exchanges. The Company acquired additional exchange firm common stock during the six months ended March 31, 2011 at a cost of $3.3 million. Exchange memberships and common stocks pledged for clearing purposes are recorded at cost. The cost basis for exchange memberships and common stock pledged for clearing purposes was $14.0 million and $11.9 million at March 31, 2011 and September 30, 2010, respectively, and is included within ‘Other assets’ on the condensed consolidated balance sheets. The fair value of the exchange memberships and common stock pledged for clearing purposes was $14.0 million and $9.8 million at March 31, 2011 and September 30, 2010, respectively. In January 2011, excess shares of exchange firm common stock, with a cost basis of $1.2 million, were sold, resulting in a nominal gain. The fair value of exchange stock is determined by quoted market prices, and the fair value of exchange memberships is determined by recent sale transactions. The Company monitors the fair value of exchange membership seats and common stock on a quarterly basis, and considers the current unrealized loss to be a temporary impairment.
Note 6 – Assets and Liabilities, at Fair Value
The Company’s financial and nonfinancial assets and liabilities reported at fair value are included within the following captions on the condensed consolidated balance sheets:
• | Cash and cash equivalents |
• | Securities segregated under federal and other regulations |
• | Securities purchased under agreements to resell |
• | Deposits and receivables from exchange-clearing organizations |
• | Deposits and receivables from broker-dealers, clearing organizations and counterparties |
• | Financial instruments owned |
• | Accounts payable and other accrued liabilities |
• | Payables to customers |
• | Financial instruments sold, not yet purchased |
The table below sets forth an analysis of the carrying value of financial instruments owned and financial instruments sold, not yet purchased. This is followed by tables that provide the information required by the Fair Value Measurements and Disclosures Topic of the ASC for all financial assets and liabilities that are carried at fair value.
March 31, 2011 | September 30, 2010 | ||||||||||||||
(in millions) | Owned | Sold, not yet purchased | Owned | Sold, not yet purchased | |||||||||||
Common stock and ADR’s | $ | 22.1 | $ | 22.9 | $ | 17.4 | $ | 8.5 | |||||||
Exchangeable foreign ordinary equities and ADR’s | 19.5 | 13.0 | 6.6 | 7.5 | |||||||||||
Corporate and municipal bonds | 10.3 | — | 13.1 | — | |||||||||||
U.S. and foreign government obligations | 15.0 | 1.0 | 8.7 | 0.2 | |||||||||||
Derivatives | 83.0 | 186.8 | 40.2 | 87.6 | |||||||||||
Commodities leases and unpriced positions | 185.9 | 331.1 | 69.2 | 85.8 | |||||||||||
Mutual funds and other | 0.7 | — | 2.1 | — | |||||||||||
Investment in managed funds | 2.0 | — | 2.5 | — | |||||||||||
$ | 338.5 | $ | 554.8 | $ | 159.8 | $ | 189.6 | ||||||||
Fair Value Hierarchy
The majority of financial assets and liabilities on the condensed consolidated balance sheets are reported at fair value. Cash and cash equivalents are reported at the balance held at financial institutions. Deposits with and receivables from exchange-clearing organizations and broker-dealers and FCMs and payables to customers and exchange-clearing organizations include the value of cash collateral as well as the value of money market funds and other pledged investments, primarily U.S. Treasury bills and securities issued by government sponsored entities. These balances also include the fair value of futures and options on futures determined by prices on the applicable exchange. Financial instruments owned and sold, not yet purchased include the value of U.S. and foreign government obligations, corporate debt securities, derivative financial instruments, commodities, mutual funds and investments in managed funds. The fair value of exchange common stock is determined by quoted market prices, and the fair value of exchange memberships is determined by recent sale transactions. Notes payable and subordinated debt carry variable rates of interest and thus approximate fair value.
9
The following tables set forth the Company’s financial and nonfinancial assets and liabilities accounted for at fair value, on a recurring basis, as of March 31, 2011 and September 30, 2010 by level within the fair value hierarchy. There were no assets or liabilities that were measured at fair value on a nonrecurring basis as of March 31, 2011. As required by the Fair Value Measurements and Disclosures Topic of the ASC, financial and nonfinancial assets and liabilities measured on recurring and nonrecurring basis are classified in their entirety based on the lowest level of input that is significant to the fair value measurement. The three levels of the fair value hierarchy under the Fair Value Measurements and Disclosures Topic of the ASC are:
Level 1: unadjusted quoted prices in active markets that are accessible at the measurement date for identical, unrestricted assets or liabilities;
Level 2: quoted prices in markets that are not active, or inputs that are observable, either directly or indirectly, for substantially the full term of the asset or liability; and
Level 3: prices or valuation techniques that require inputs that are both significant to the fair value measurement and unobservable (i.e., supported by little or no market activity).
March 31, 2011 | |||||||||||||||||||
(in millions) | Level 1 | Level 2 | Level 3 | Netting and Collateral (1) | Total | ||||||||||||||
Assets: | |||||||||||||||||||
Unrestricted cash equivalents - money market funds | $ | 1.6 | $ | — | $ | — | $ | — | $ | 1.6 | |||||||||
Commodities warehouse receipts | 22.5 | — | — | — | 22.5 | ||||||||||||||
U.S. and foreign government obligations | — | 2.3 | — | — | 2.3 | ||||||||||||||
Securities and other assets segregated under federal and other regulations | 22.5 | 2.3 | — | — | 24.8 | ||||||||||||||
Securities purchased under agreements to resell | 77.2 | — | — | — | 77.2 | ||||||||||||||
Money market funds | 388.0 | — | — | — | 388.0 | ||||||||||||||
U.S. and foreign government obligations | — | 1,212.2 | — | — | 1,212.2 | ||||||||||||||
Mortgage-backed securities | — | 9.4 | — | — | 9.4 | ||||||||||||||
Derivatives | 7,722.3 | 317.5 | — | (8,652.6 | ) | (612.8 | ) | ||||||||||||
Deposits and receivables from exchange-clearing organizations | 8,110.3 | 1,539.1 | — | (8,652.6 | ) | 996.8 | |||||||||||||
Deposits and receivables from broker-dealers, clearing organizations and counterparties - U.S. and foreign government obligations | — | 0.5 | — | — | 0.5 | ||||||||||||||
Common stock and ADR’s | 39.2 | 1.2 | 1.2 | — | 41.6 | ||||||||||||||
Corporate and municipal bonds | — | 5.0 | 5.3 | — | 10.3 | ||||||||||||||
U.S. and foreign government obligations | 8.9 | 6.1 | — | — | 15.0 | ||||||||||||||
Derivatives (2) | 409.5 | 994.0 | — | (1,320.5 | ) | 83.0 | |||||||||||||
Commodities leases and unpriced positions | — | 300.8 | — | (114.9 | ) | 185.9 | |||||||||||||
Mutual funds and other | 0.3 | — | 0.4 | — | 0.7 | ||||||||||||||
Investment in managed funds | — | 1.2 | 0.8 | — | 2.0 | ||||||||||||||
Financial instruments owned | 457.9 | 1,308.3 | 7.7 | (1,435.4 | ) | 338.5 | |||||||||||||
Total assets at fair value | $ | 8,669.5 | $ | 2,850.2 | $ | 7.7 | $ | (10,088.0 | ) | $ | 1,439.4 | ||||||||
Liabilities: | |||||||||||||||||||
Accounts payable and other accrued liabilities - contingent liabilities | $ | — | $ | — | $ | 30.5 | $ | — | $ | 30.5 | |||||||||
Payables to customers - derivatives | 8,075.0 | 1,079.6 | — | (9,154.6 | ) | — | |||||||||||||
Common stock and ADR’s | 35.0 | 0.9 | — | — | 35.9 | ||||||||||||||
U.S. and foreign government obligations | — | 1.0 | — | — | 1.0 | ||||||||||||||
Derivatives (2) | 422.6 | 924.1 | — | (1,159.9 | ) | 186.8 | |||||||||||||
Commodities leases and unpriced positions | — | 433.2 | — | (102.1 | ) | 331.1 | |||||||||||||
Financial instruments sold, not yet purchased | 457.6 | 1,359.2 | — | (1,262.0 | ) | 554.8 | |||||||||||||
Total liabilities at fair value | $ | 8,532.6 | $ | 2,438.8 | $ | 30.5 | $ | (10,416.6 | ) | $ | 585.3 | ||||||||
(1) | Represents cash collateral and the impact of netting across the levels of the fair value hierarchy. Netting among positions classified within the same level are included in that level. |
(2) | The derivatives include net unrealized gains (losses) that are reclassified to deposits and receivables from broker-dealers, clearing organizations and counterparties and receivables from customers of $15.5 million as of March 31, 2011, as a result of netting and collateral. |
10
September 30, 2010 | |||||||||||||||||||
(in millions) | Level 1 | Level 2 | Level 3 | Netting and Collateral (1) | Total | ||||||||||||||
Assets: | |||||||||||||||||||
Unrestricted cash equivalents - money market funds | $ | 0.3 | $ | — | $ | — | $ | — | $ | 0.3 | |||||||||
U.S. and foreign government obligations | — | 0.8 | — | — | 0.8 | ||||||||||||||
Securities segregated under federal and other regulations | — | 0.8 | — | — | 0.8 | ||||||||||||||
Securities purchased under agreements to resell | 342.0 | — | — | — | 342.0 | ||||||||||||||
Money market funds | 428.2 | — | — | — | 428.2 | ||||||||||||||
U.S. and foreign government obligations | — | 988.1 | — | — | 988.1 | ||||||||||||||
Mortgage-backed securities | — | 10.0 | — | — | 10.0 | ||||||||||||||
Derivatives | 4,228.1 | — | — | (4,748.0 | ) | (519.9 | ) | ||||||||||||
Deposits and receivables from exchange-clearing organizations | 4,656.3 | 998.1 | — | (4,748.0 | ) | 906.4 | |||||||||||||
Common stock and ADR’s | 22.1 | 0.7 | 1.2 | — | 24.0 | ||||||||||||||
Corporate and municipal bonds | — | 5.1 | 8.0 | — | 13.1 | ||||||||||||||
U.S. and foreign government obligations | 2.8 | 5.9 | — | — | 8.7 | ||||||||||||||
Derivatives (2) | 186.0 | 897.9 | — | (1,043.7 | ) | 40.2 | |||||||||||||
Commodities leases and unpriced positions | — | 201.9 | — | (132.7 | ) | 69.2 | |||||||||||||
Mutual funds and other | 1.7 | — | 0.4 | — | 2.1 | ||||||||||||||
Investment in managed funds | — | 1.9 | 0.6 | — | 2.5 | ||||||||||||||
Financial instruments owned | 212.6 | 1,113.4 | 10.2 | (1,176.4 | ) | 159.8 | |||||||||||||
Total assets at fair value | $ | 5,211.2 | $ | 2,112.3 | $ | 10.2 | $ | (5,924.4 | ) | $ | 1,409.3 | ||||||||
Liabilities: | |||||||||||||||||||
Accounts payable and other accrued liabilities - contingent liabilities | $ | — | $ | 32.3 | $ | — | $ | 32.3 | |||||||||||
Payables to customers - derivatives | 5,451.0 | — | — | (5,451.0 | ) | — | |||||||||||||
Common stock and ADR’s | 15.5 | 0.5 | — | — | 16.0 | ||||||||||||||
U.S. and foreign government obligations | — | 0.2 | — | — | 0.2 | ||||||||||||||
Derivatives (2) | 189.3 | 859.5 | — | (961.2 | ) | 87.6 | |||||||||||||
Commodities leases and unpriced positions | — | 127.2 | — | (41.4 | ) | 85.8 | |||||||||||||
Financial instruments sold, not yet purchased | 204.8 | 987.4 | — | (1,002.6 | ) | 189.6 | |||||||||||||
Total liabilities at fair value | $ | 5,655.8 | $ | 987.4 | $ | 32.3 | $ | (6,453.6 | ) | $ | 221.9 | ||||||||
(1) | Represents cash collateral and the impact of netting across the levels of the fair value hierarchy. Netting among positions classified within the same level are included in that level. |
(2) | The derivatives include net unrealized gains (losses) that are reclassified to deposits and receivables from broker-dealers, clearing organizations and counterparties and receivables from customers of $56.1 million as of September 30, 2010, as a result of netting and collateral. |
Realized and unrealized gains and losses are included within ‘Trading gains’ in the condensed consolidated income statement.
Information on Level 3 Financial Assets and Liabilities
The Company’s financial assets at fair value classified within level 3 of the fair value hierarchy are summarized below:
(in millions) | As of March 31, 2011 | As of September 30, 2010 | |||||
Total level 3 assets | $ | 7.7 | $ | 10.2 | |||
Level 3 assets for which the Company bears economic exposure | $ | 7.7 | $ | 10.2 | |||
Total assets | $ | 2,271.9 | $ | 2,021.7 | |||
Total financial assets at fair value | $ | 1,439.4 | $ | 1,409.3 | |||
Total level 3 assets as a percentage of total assets | 0.3 | % | 0.5 | % | |||
Level 3 assets for which the Company bears economic exposure as a percentage of total assets | 0.3 | % | 0.5 | % | |||
Total level 3 assets as a percentage of total financial assets at fair value | 0.5 | % | 0.7 | % | |||
11
The following tables set forth a summary of changes in the fair value of the Company’s level 3 financial assets and liabilities during the three and six months ended March 31, 2011 including a summary of unrealized gains (losses) during the three and six months on the Company’s level 3 financial assets and liabilities still held at March 31, 2011.
Level 3 Financial Assets and Financial Liabilities For the Three Months Ended March 31, 2011 | |||||||||||||||||||||||
(in millions) | Balances at beginning of period | Realized gains (losses) during period | Unrealized gains (losses) during period | Purchases, issuances, settlements | Transfers in or (out) of Level 3 | Balances at end of period | |||||||||||||||||
Assets: | |||||||||||||||||||||||
Common stock and ADR’s | $ | 1.2 | $ | — | $ | — | $ | — | $ | — | $ | 1.2 | |||||||||||
Corporate and municipal bonds | 8.1 | — | (2.8 | ) | — | — | 5.3 | ||||||||||||||||
Mutual funds and other | 0.4 | — | — | — | — | 0.4 | |||||||||||||||||
Investment in managed funds | 0.6 | — | 0.2 | — | — | 0.8 | |||||||||||||||||
$ | 10.3 | $ | — | $ | (2.6 | ) | $ | — | $ | — | $ | 7.7 | |||||||||||
Liabilities - | |||||||||||||||||||||||
Contingent liabilities | $ | 30.0 | $ | — | $ | 0.5 | $ | — | $ | — | $ | 30.5 | |||||||||||
Level 3 Financial Assets and Financial Liabilities For the Six Months Ended March 31, 2011 | |||||||||||||||||||||||
(in millions) | Balances at beginning of period | Realized gains (losses) during period | Unrealized gains (losses) during period | Purchases, issuances, settlements | Transfers in or (out) of Level 3 | Balances at end of period | |||||||||||||||||
Assets: | |||||||||||||||||||||||
Common stock and ADR’s | $ | 1.2 | $ | — | $ | — | $ | — | $ | — | $ | 1.2 | |||||||||||
Corporate and municipal bonds | 8.0 | — | (2.7 | ) | — | — | 5.3 | ||||||||||||||||
Mutual funds and other | 0.4 | — | — | — | — | 0.4 | |||||||||||||||||
Investment in managed funds | 0.6 | — | 0.2 | — | — | 0.8 | |||||||||||||||||
$ | 10.2 | $ | — | $ | (2.5 | ) | $ | — | $ | — | $ | 7.7 | |||||||||||
Liabilities - | |||||||||||||||||||||||
Contingent liabilities | $ | 32.3 | $ | — | $ | 1.9 | $ | (3.7 | ) | $ | — | $ | 30.5 | ||||||||||
In August 2008, INTL Asia Pte, Ltd., a subsidiary of the Company, arranged a 550 million Thai Baht ("THB"), an $18 million U.S. dollar ("USD") equivalent, issue of debentures for the single asset owning company of Suriwongse Hotel located in Chiang Mai, Thailand. The debentures have a 9.5% coupon and were scheduled to mature in August 2011. The Company arranged for the sale of 375.5 million THB ($12.6 USD) of the debentures to two investors and the Company retained debentures in the amount of 174.5 million THB ($5.4 USD). The debentures are secured by a mortgage on the land and hotel buildings, the personal guarantee of the owner, and conditional assignments of accounts and agreements.
The proceeds of this issue were to be used to refinance the previous loan to the hotel owner, finance the hotel's renovation and fund interest up to 50.0 million THB. Renovations were initially planned to be completed by April 2011 and the outstanding debentures were to be refinanced following the completion of renovations. The renovations have been delayed and are currently expected to be completed by February 2012.
In addition, the political and economic conditions in Thailand over the past two years have impacted the performance of the hotel. Following the interest capitalization period, the hotel owner was able to meet four quarterly interest payments on the debentures, however the hotel owner defaulted on the interest payment that was due in March 2011. The Company and other debenture holders are currently in restructuring discussions with the hotel owner as a result of the renovation delays.
In accordance with the Fair Value Measurements and Disclosures Topic of the ASC, the Company has estimated the fair value of the debentures on a recurring basis each period. The Company has classified its investment in the hotel within level 3 of the fair value hierarchy because the fair value is determined using significant unobservable inputs, which include projected cash flows. These cash flows are discounted employing present value techniques. At March 31, 2011, due to the issues discussed previously, the Company estimated the fair value of its investment in these debentures by using a management-developed forecast, which is based on the income approach. This valuation model assigned a fair value for the debentures held by the Company of $3.7 million at March 31, 2011, and accordingly the Company has recorded a loss of $1.7 million, representing an other than temporary impairment, for the three and six months ended March 31, 2011.
12
The Company is required to make additional future cash payments based on certain financial performance measures of its acquired businesses. The Company is required to remeasure the fair value of the cash earnout arrangements on a recurring basis in accordance with the guidance in the Business Combinations Topic of the ASC. The Company has classified its net liabilities for the contingent earnout arrangements within level 3 of the fair value hierarchy because the fair value is determined using significant unobservable inputs, which include projected cash flows. The estimated fair value of the contingent purchase consideration is based upon management-developed forecasts, a level 3 input in the fair value hierarchy. These cash flows are discounted employing present value techniques in arriving at the acquisition-date fair value. The discount rate was developed using market participant company data, a level 2 input in the fair value hierarchy. From the dates of acquisition to March 31, 2011, there have been no significant changes in the estimates of undiscounted cash flows. During the three and six months ended March 31, 2011, $0.5 million and $1.9 million, respectively, was accreted to the fair value of the contingent consideration for the passage of time, with the corresponding expense classified as other operating expense in the accompanying condensed consolidated income statement.
Level 3 Financial Assets and Financial Liabilities For the Three Months Ended March 31, 2010 | |||||||||||||||||||||||
(in millions) | Balances at beginning of period | Realized gains (losses) during period | Unrealized gains (losses) during period | Purchases, issuances, settlements | Transfers in or (out) of Level 3 | Balances at end of period | |||||||||||||||||
Assets: | |||||||||||||||||||||||
Common stock and ADR’s | $ | 1.2 | $ | — | $ | — | $ | — | $ | — | $ | 1.2 | |||||||||||
Corporate and municipal bonds | 4.7 | — | 0.1 | — | — | 4.8 | |||||||||||||||||
U.S. and foreign government obligations | — | — | — | — | — | — | |||||||||||||||||
Mutual funds and other | 0.4 | — | 0.1 | — | — | 0.5 | |||||||||||||||||
Investment in managed funds | 2.7 | — | (0.1 | ) | (0.6 | ) | — | 2.0 | |||||||||||||||
$ | 9.0 | $ | — | $ | 0.1 | $ | (0.6 | ) | $ | — | $ | 8.5 | |||||||||||
Level 3 Financial Assets and Financial Liabilities For the Six Months Ended March 31, 2010 | |||||||||||||||||||||||
(in millions) | Balances at beginning of period | Realized gains (losses) during period | Unrealized gains (losses) during period | Purchases, issuances, settlements | Transfers in or (out) of Level 3 | Balances at end of period | |||||||||||||||||
Assets: | |||||||||||||||||||||||
Common stock and ADR’s | $ | 1.2 | $ | — | $ | — | $ | — | $ | — | $ | 1.2 | |||||||||||
Corporate and municipal bonds | 4.3 | — | 0.1 | 0.4 | — | 4.8 | |||||||||||||||||
U.S. and foreign government obligations | 0.7 | — | — | — | (0.7 | ) | — | ||||||||||||||||
Mutual funds and other | 0.4 | — | 0.1 | — | — | 0.5 | |||||||||||||||||
Investment in managed funds | 2.7 | — | (0.1 | ) | (0.6 | ) | — | 2.0 | |||||||||||||||
$ | 9.3 | $ | — | $ | 0.1 | $ | (0.2 | ) | $ | (0.7 | ) | $ | 8.5 | ||||||||||
The Company reports transfers in and out of levels 1, 2 and 3, as applicable, using the fair value of the securities as of the beginning of the reporting period in which the transfer occurred.
The value of an exchange-traded derivative contract is equal to the unrealized gain or loss on the contract determined by marking the contract to the current settlement price for a like contract on the valuation date of the contract. A settlement price may not be used if the market makes a limit move with respect to a particular derivative contract or if the securities underlying the contract experience significant price fluctuations after the determination of the settlement price. When a settlement price cannot be used, derivative contracts will be valued at their fair market value as determined in good faith pursuant to procedures adopted by management of the Company.
On March 31, 2011, the commodities market experienced an upward limit price movement on a certain commodity. As a result, certain exchange-traded derivative contracts, which would normally be valued using quoted market prices and classified as level 1 within the fair value hierarchy, were priced using a valuation model using observable inputs. Due to the change in valuation techniques because of the limit move, derivative assets of $317.5 million and derivative liabilities of $1,079.6 million were transferred from level 1 and were classified as level 2 at March 31, 2011.
The Company did not have any additional significant transfers between level 1 and level 2 fair value measurements for the three months and six months ended March 31, 2011.
13
The Company transferred $0.7 million of U.S. and foreign obligations from level 3 to level 2 during the six months ended March 31, 2010. The Company re-evaluated the observability of the inputs for the fair value of the securities that were transferred into level 2 from level 3 and determined that there was improvement in the market for these securities and that resulted in the Company being able to utilize inputs that were observable.
The following tables summarize the amortized cost basis, the aggregate fair value and gross unrealized holding gains and losses of the Company’s investment securities classified as available-for-sale at March 31, 2011 and September 30, 2010:
March 31, 2011 | |||||||||||||||
Amounts included in financial instruments owned: | |||||||||||||||
Amortized Cost | Unrealized Holding (1) | Estimated Fair Value | |||||||||||||
(in millions) | Gains | (Losses) | |||||||||||||
U.S. government securities and federal agency obligations | $ | 5.0 | $ | — | $ | — | $ | 5.0 | |||||||
Corporate bonds | 5.0 | — | — | 5.0 | |||||||||||
$ | 10.0 | $ | — | $ | — | $ | 10.0 | ||||||||
(1) | Unrealized gain/loss on financial instruments owned as of March 31, 2011, is less than $0.1 million. |
Amounts included in deposits with and receivables from exchange-clearing organizations: | |||||||||||||||
Amortized Cost | Unrealized Holding | Estimated Fair Value | |||||||||||||
(in millions) | Gains | (Losses) | |||||||||||||
U.S. government securities and federal agency obligations | $ | 1,185.7 | $ | 0.3 | $ | — | $ | 1,186.0 | |||||||
Mortgage-backed securities | 9.2 | 0.1 | — | 9.3 | |||||||||||
$ | 1,194.9 | $ | 0.4 | $ | — | $ | 1,195.3 | ||||||||
September 30, 2010 | |||||||||||||||
Amounts included in financial instruments owned: | |||||||||||||||
Amortized Cost | Unrealized Holding (1) | Estimated Fair Value | |||||||||||||
(in millions) | Gains | (Losses) | |||||||||||||
U.S. government securities and federal agency obligations | $ | 5.0 | $ | — | $ | — | $ | 5.0 | |||||||
Corporate bonds | 5.1 | — | — | 5.1 | |||||||||||
$ | 10.1 | $ | — | $ | — | $ | 10.1 | ||||||||
(1) | Unrealized gains/losses on financial instruments as of September 30, 2010, is less than $0.1 million. |
Amounts included in deposits with and receivables from exchange-clearing organizations: | |||||||||||||||
Amortized Cost | Unrealized Holding | Estimated Fair Value | |||||||||||||
(in millions) | Gains | (Losses) | |||||||||||||
U.S. government securities and federal agency obligations | $ | 936.0 | $ | 0.4 | $ | — | $ | 936.4 | |||||||
Mortgage-backed securities | 10.1 | — | (0.1 | ) | 10.0 | ||||||||||
$ | 946.1 | $ | 0.4 | $ | (0.1 | ) | $ | 946.4 | |||||||
14
At March 31, 2011 and September 30, 2010, investments in debt securities classified as available-for-sale (AFS) mature as follows:
March 31, 2011 | |||||||||||
Due in | Estimated Fair Value | ||||||||||
(in millions) | Less than 1 year | 1 year or more | |||||||||
U.S. government securities and federal agency obligations | $ | 1,186.0 | $ | 5.0 | $ | 1,191.0 | |||||
Corporate bonds | 5.0 | — | 5.0 | ||||||||
Mortgage-backed securities | — | 9.3 | 9.3 | ||||||||
$ | 1,191.0 | $ | 14.3 | $ | 1,205.3 | ||||||
September 30, 2010 | |||||||||||
Due in | Estimated Fair Value | ||||||||||
(in millions) | Less than 1 year | 1 year or more | |||||||||
U.S. government securities and federal agency obligations | $ | 876.0 | $ | 65.4 | $ | 941.4 | |||||
Corporate bonds | — | 5.1 | 5.1 | ||||||||
Mortgage-backed securities | — | 10.0 | 10.0 | ||||||||
$ | 876.0 | $ | 80.5 | $ | 956.5 | ||||||
There were no sales of AFS Securities during three and six months ended March 31, 2011 and 2010, and as a result, no realized gains or losses were recorded for the three and six months ended March 31, 2011 and 2010.
For the purposes of the maturity schedule, mortgage-backed securities, which are not due at a single maturity date, have been allocated over maturity groupings based on the expected maturity of the underlying collateral. Mortgage-backed securities may mature earlier than their stated contractual maturities because of accelerated principal repayments of the underlying loans.
Note 7 – Financial Instruments with Off-Balance Sheet Risk and Concentrations of Credit Risk
The Company is party to certain financial instruments with off-balance sheet risk in the normal course of its business. The Company has sold financial instruments that it does not currently own and will therefore be obliged to purchase such financial instruments at a future date. The Company has recorded these obligations in the condensed consolidated financial statements at March 31, 2011 at the fair values of the related financial instruments. The Company will incur losses if the fair value of the underlying financial instruments increases subsequent to March 31, 2011. The total of $554.8 million at March 31, 2011 includes $186.8 million for derivative contracts, which represent a liability to the Company based on their fair values as of March 31, 2011.
Derivatives
The Company utilizes derivative products in its trading capacity as a dealer in order to satisfy client needs and mitigate risk. The Company manages risks from both derivatives and non-derivative cash instruments on a consolidated basis. The risks of derivatives should not be viewed in isolation, but in aggregate with the Company’s other trading activities. The majority of the Company’s derivative positions are included within the balance sheets under the caption ‘financial instruments owned, at fair value’, ‘deposits and receivables from exchange-clearing organizations’ and ‘financial instruments sold, not yet purchased, at fair value’.
The Company utilizes an interest rate risk management strategy, using derivative financial instruments in the form of interest rate swaps, to manage a portion of the aggregate interest rate position. The Company’s objective is to invest the majority of customer segregated deposits in high quality, short-term investments and swap the resulting variable interest earnings into the medium-term interest stream, by using a strip of interest rate swaps that mature every quarter, in order to achieve the two year moving average of the two year swap rate. The risk mitigation of these interest rate swaps is not within the documented hedging designation requirements of the Derivatives and Hedging Topic of the ASC and as a result they are recorded at fair value, with changes in the mark-to-market valuation of the financial instruments recorded in earnings on a quarterly basis.
15
Listed below are the fair values of the Company's derivative assets and liabilities as of March 31, 2011 and September 30, 2010. Assets represent net unrealized gains and liabilities represent net unrealized losses.
March 31, 2011 | September 30, 2010 | ||||||||||||||
(In millions) | Assets (1) | Liabilities (1) | Assets (1) | Liabilities (1) | |||||||||||
Derivative contracts not accounted for as hedges: | |||||||||||||||
Exchange-traded commodity derivatives | $ | 7,951.6 | $ | 9,031.4 | $ | 4,126.2 | $ | 5,332.6 | |||||||
OTC commodity derivatives | 1,059.6 | 1,070.5 | 563.3 | 562.9 | |||||||||||
Exchange-traded foreign exchange derivatives | 30.5 | 53.6 | 84.6 | 98.7 | |||||||||||
OTC Foreign exchange derivatives (2) | 341.3 | 274.8 | 512.6 | 478.3 | |||||||||||
Interest rate derivatives | 7.0 | 7.2 | 22.5 | 18.6 | |||||||||||
Equity index derivatives | 53.3 | 63.8 | 2.8 | 7.6 | |||||||||||
Derivative contracts accounted for as hedges: | |||||||||||||||
Interest rate derivatives | — | — | — | 1.1 | |||||||||||
Gross fair value of derivative contracts | 9,443.3 | 10,501.3 | 5,312.0 | 6,499.8 | |||||||||||
Counterparty netting | |||||||||||||||
Impact of netting and collateral | (9,973.1 | ) | (10,314.5 | ) | (5,791.7 | ) | (6,412.2 | ) | |||||||
Total fair value included in ‘Deposits and receivables from exchange-clearing organizations’ | $ | (612.8 | ) | $ | (519.9 | ) | |||||||||
Total fair value included in ‘Financial instruments owned, at fair value’ | $ | 83.0 | $ | 40.2 | |||||||||||
Fair value included in ‘Financial instruments sold, not yet purchased, at fair value’ | $ | 186.8 | $ | 87.6 | |||||||||||
(1) | As of March 31, 2011 and September 30, 2010, the Company’s derivative contract volume for open positions was approximately 5.0 million and 3.5 million contracts, respectively. |
(2) | In accordance with agreements with counterparties, the Company is allowed to periodically take advances against its open trade fair value. These amounts exclude advances against open trade fair value of $50.9 million and $27.0 million outstanding at March 31, 2011 and September 30, 2010, respectively. |
The Company’s derivative contracts are principally held in its Commodities and Risk Management Services (C&RM) segment. The Company assists its C&RM segment customers in protecting the value of their future production by entering into option or forward agreements with them on an OTC basis. The Company also provides its C&RM segment customers with sophisticated option products, including combinations of buying and selling puts and calls. The Company mitigates its risk by effecting offsetting trades with market counterparties. The risk mitigation of these offsetting trades is not within the documented hedging designation requirements of the Derivatives and Hedging Topic of the ASC. These derivative contracts are traded along with cash transactions because of the integrated nature of the markets for these products. The Company manages the risks associated with derivatives on an aggregate basis along with the risks associated with its proprietary trading and market-making activities in cash instruments as part of its firm-wide risk management policies. In particular, the risks related to derivative positions may be partially offset by inventory, unrealized gains in inventory or cash collateral paid or received.
The following table sets forth the firm’s gains/(losses) related to derivative financial instruments for the three and six months ended March 31, 2011 and 2010, in accordance with the Derivatives and Hedging Topic of the ASC. The gains/(losses) set forth below are included in ‘Trading gains’ in the consolidated income statements.
Three Months Ended March 31, | Six Months Ended March 31, | ||||||||||||||
(in millions) | 2011 | 2010 | 2011 | 2010 | |||||||||||
Gains (losses) from derivative contracts | $ | (7.2 | ) | $ | 4.9 | $ | (26.4 | ) | $ | (13.2 | ) | ||||
Periodically, the Company uses interest rate swap contracts to hedge certain forecasted transactions. The Company’s primary objective in holding these types of derivatives is to reduce the volatility of earnings and cash flows associated with changes in interest rates. The Company has two interest rate swap contracts at March 31, 2011, each with a notional amount of $50 million, which were entered into in order to hedge potential changes in cash flows resulting from the Company’s variable rate LIBOR based borrowings. These derivatives will mature in less than four months.
16
The interest rate swaps were initially classified under the Derivatives and Hedging Topic of the ASC as cash flow hedges. As a result of decreased borrowings by the Company in fiscal year 2010, it was determined that one of the interest rate swaps no longer met the criteria, specified under the Derivatives and Hedging Topic, to allow for the deferral of the effective portion of unrecognized hedging gains or losses in other comprehensive income or loss since all of the forecasted variable interest payments are not expected to occur. However, the Company expected that a portion of those forecasted transactions were still going to occur. As a result, the Company had a loss of $0.2 million, net of tax, as of December 31, 2010 remaining in accumulated other comprehensive income or loss relating to transactions that were still expected to occur for the discontinued hedge.
At December 31, 2010, the remaining unrecognized loss relating to both interest rate swaps in accumulated other comprehensive income (loss) was $0.6 million, net of tax. That amount was expected to be recognized in earnings as the forecasted payments affected interest expense. However, at the end of the three months ended March 31, 2011, the Company's borrowing levels decreased significantly and it was determined that the remaining swap no longer met the criteria for the deferral of the effective portion of unrecognized hedging gains or losses and the Company discontinued hedge accounting for the remaining swap. In addition, as the Company does not expect the borrowing levels to increase significantly before the swaps mature, the remaining balances were recognized in earnings during the three months ended March 31, 2011, The Company recognized a loss of $0.3 million, net of tax, for the three months ended March 31, 2011, as a result of the discontinuation of hedge accounting which is included in ‘Trading gains’ on the condensed consolidated income statements.
Credit Risk
In the normal course of business, the Company purchases and sells financial instruments, commodities and foreign currencies as either principal or agent on behalf of its customers. If either the customer or counterparty fails to perform, the Company may be required to discharge the obligations of the nonperforming party. In such circumstances, the Company may sustain a loss if the fair value of the financial instrument or foreign currency is different from the contract value of the transaction.
The majority of the Company’s transactions and, consequently, the concentration of its credit exposure are with commodity exchanges, customers, broker-dealers and other financial institutions. These activities primarily involve collateralized and uncollateralized arrangements and may result in credit exposure in the event that a counterparty fails to meet its contractual obligations. The Company’s exposure to credit risk can be directly impacted by volatile financial markets, which may impair the ability of counterparties to satisfy their contractual obligations. The Company seeks to control its credit risk through a variety of reporting and control procedures, including establishing credit limits based upon a review of the counterparties’ financial condition and credit ratings. The Company monitors collateral levels on a daily basis for compliance with regulatory and internal guidelines and requests changes in collateral levels as appropriate.
The Company is a party to financial instruments in the normal course of its business through customer and proprietary trading accounts in exchange-traded and OTC derivative instruments. These instruments are primarily the execution of orders for commodity futures, options on futures and forward foreign currency contracts on behalf of its customers, substantially all of which are transacted on a margin basis. Such transactions may expose the Company to significant credit risk in the event margin requirements are not sufficient to fully cover losses which customers may incur. The Company controls the risks associated with these transactions by requiring customers to maintain margin deposits in compliance with individual exchange regulations and internal guidelines. The Company monitors required margin levels daily and, therefore, may require customers to deposit additional collateral or reduce positions when necessary. The Company also establishes credit limits for customers, which are monitored daily. The Company evaluates each customer’s creditworthiness on a case by case basis. Clearing, financing, and settlement activities may require the Company to maintain funds with or pledge securities as collateral with other financial institutions. Generally, these exposures to both customers and exchanges are subject to master netting, or customer agreements, which reduce the exposure to the Company by permitting receivables and payables with such customers to be offset in the event of a customer default. Management believes that the margin deposits held at March 31, 2011 and September 30, 2010 were adequate to minimize the risk of material loss that could be created by positions held at that time. Additionally, the Company monitors collateral fair value on a daily basis and adjusts collateral levels in the event of excess market exposure. Generally, these exposures to both customers and counterparties are subject to master netting, or customer agreements which reduce the exposure to the Company.
The Company is also a party to a guarantee of payment and performance by a third party of an ethanol marketing agreement with a risk management customer which would require the Company to purchase the output of the customer if the third party could not perform under the marketing agreement. The guarantee does not have a set term, and the underlying agreement cannot be terminated by the third party unless the customer breaches the agreement. The maximum potential amount of future payments required under the guarantee cannot be estimated because the underlying marketing agreement does not specify the amount or the price of the ethanol to be purchased during the term of the agreement. The price of the ethanol to be purchased is at the discretion of the Company.
17
Derivative financial instruments involve varying degrees of off-balance sheet market risk whereby changes in the fair values of underlying financial instruments may result in changes in the fair value of the financial instruments in excess of the amounts reflected in the condensed consolidated balance sheets. Exposure to market risk is influenced by a number of factors, including the relationships between the financial instruments and the Company’s positions, as well as the volatility and liquidity in the markets in which the financial instruments are traded. The principal risk components of financial instruments include, among other things, interest rate volatility, the duration of the underlying instruments and changes in foreign exchange rates. The Company attempts to manage its exposure to market risk through various techniques. Aggregate market limits have been established and market risk measures are routinely monitored against these limits.
Note 8 – Physical Commodities Inventory
Physical commodities inventory is valued at the lower of cost or fair value, determined using the weighted-average cost method. Commodities in process include commodities in the process of being recycled. At March 31, 2011 and September 30, 2010, $163.0 million and $124.8 million, respectively, of physical commodities inventory served as collateral under one of the Company’s credit facilities, as detailed further in Note 11. The carrying values of the Company’s inventory at March 31, 2011 and September 30, 2010 are shown below.
(in millions) | March 31, 2011 | September 30, 2010 | |||||
Commodities in process | $ | 4.5 | $ | 3.6 | |||
Finished commodities | 158.5 | 121.4 | |||||
Physical commodities inventory, at cost | $ | 163.0 | $ | 125.0 | |||
Note 9 – Goodwill
The goodwill acquired during the six months ended March 31, 2011, within the C&RM segment, related to an acquisition that was considered immaterial to the Company – see Note 16. The carrying value of goodwill as of the balance sheet dates by segment is as follows:
(in millions) | March 31, 2011 | September 30, 2010 | |||||
Commodity and Risk Management Services | $ | 30.9 | $ | 28.7 | |||
Foreign Exchange | 6.3 | 6.3 | |||||
Securities | 1.5 | 1.5 | |||||
Other | 3.8 | 3.8 | |||||
Goodwill | $ | 42.5 | $ | 40.3 | |||
Note 10 – Intangible Assets
Intangible assets acquired during the six months ended March 31, 2011 relate to an acquisition, as discussed in Note 16. The gross and net carrying values of intangible assets as of the balance sheet dates, by major intangible asset class are as follows:
March 31, 2011 | September 30, 2010 | ||||||||||||||||||||||
(in millions) | Gross Amount | Accumulated Amortization | Net Amount | Gross Amount | Accumulated Amortization | Net Amount | |||||||||||||||||
Intangible assets subject to amortization | |||||||||||||||||||||||
Noncompete agreement | $ | 3.7 | $ | (1.1 | ) | $ | 2.6 | $ | 3.3 | $ | (0.5 | ) | $ | 2.8 | |||||||||
Trade name | 0.6 | (0.5 | ) | 0.1 | 0.8 | (0.4 | ) | 0.4 | |||||||||||||||
Software programs/platforms | 2.1 | (0.4 | ) | 1.7 | 2.1 | (0.2 | ) | 1.9 | |||||||||||||||
Customer base | 8.9 | (0.7 | ) | 8.2 | 7.4 | (0.4 | ) | 7.0 | |||||||||||||||
15.3 | (2.7 | ) | 12.6 | 13.6 | (1.5 | ) | 12.1 | ||||||||||||||||
Intangible assets not subject to amortization | |||||||||||||||||||||||
Trade name | 2.1 | — | 2.1 | 1.0 | — | 1.0 | |||||||||||||||||
Total intangible assets | $ | 17.4 | $ | (2.7 | ) | $ | 14.7 | $ | 14.6 | $ | (1.5 | ) | $ | 13.1 | |||||||||
18
Amortization expense related to intangible assets was $0.6 million and $42.5 thousand for the three months ended March 31, 2011 and 2010, and $1.2 million and $0.1 million for the six months ended March 31, 2011 and 2010, respectively. At March 31, 2011, the estimated future amortization expense was as follows:
(in millions) | |||
Fiscal 2011 (remaining six months) | $ | 1.2 | |
Fiscal 2012 | 2.2 | ||
Fiscal 2013 | 1.6 | ||
Fiscal 2014 | 0.9 | ||
Fiscal 2015 | 0.7 | ||
Fiscal 2016 | 0.4 | ||
Fiscal 2017 and thereafter | 5.6 | ||
$ | 12.6 | ||
Note 11 – Credit Facilities
As of March 31, 2011, the Company had four credit facilities under which the Company may borrow up to $365.0 million, subject to certain conditions. The amounts outstanding under these credit facilities are short term borrowings and carry variable rates of interest, thus approximating fair value.
A summary of the Company’s credit facilities in place at March 31, 2011 is as follows:
• | A one-year, renewable, revolving syndicated committed loan facility expiring on September 21, 2011 under which the Company’s subsidiary, INTL Commodities, Inc. (INTL Commodities) is entitled to borrow up to $140 million, subject to certain conditions. The loan proceeds are used to finance the activities of INTL Commodities and are secured by its assets. The facility is guaranteed by the Company. |
• | A three-year syndicated committed loan facility established on October 29, 2010 under which the Company is entitled to borrow up to $75 million, subject to certain conditions. The loan proceeds are used to finance working capital needs of the Company and certain subsidiaries. |
• | An unsecured committed line of credit, expiring June 22, 2011, with a syndicate of lenders under which the Company’s subsidiary, FCStone, LLC may borrow up to $75 million. This line is intended to provide short term funding of margin to commodity exchanges as necessary. The line is subject to annual review, and the Company is currently in discussions with the lender and expects to renew the facility during the third quarter of fiscal 2011. |
• | A one-year committed borrowing facility with a syndicate of lenders expiring on December 1, 2011 under which the Company’s subsidiary, FCStone Financial, Inc. is entitled to borrow up to $75 million, subject to certain conditions. The loan proceeds are used to finance traditional commodity financing arrangements. |
The Company’s credit facilities and outstanding borrowings were as follows as of March 31, 2011 and September 30, 2010:
(in millions) | Amounts Outstanding | ||||||||||||
Security | Renewal / Expiration Date | Total Commitment | March 31, 2011 | September 30, 2010 | |||||||||
Certain pledged shares | October 1, 2013 | $ | 75.0 | $ | 0.5 | $ | — | ||||||
Certain foreign exchange assets | Terminated October 2010 | — | — | 12.5 | |||||||||
Certain pledged shares | Terminated October 2010 | — | — | 11.9 | |||||||||
Certain commodities assets | September 21, 2011 | 140.0 | — | 90.5 | |||||||||
None | June 22, 2011 | 75.0 | — | — | |||||||||
Certain commodities assets | December 1, 2011 | 75.0 | 31.5 | — | |||||||||
None | Terminated December 2010 | — | — | 0.5 | |||||||||
$ | 365.0 | $ | 32.0 | $ | 115.4 | ||||||||
19
During fiscal 2011, $215 million of the Company’s committed credit facilities are scheduled to expire. While there is no guarantee that we will be able to replace current agreements when they expire, based on our strong liquidity position and capital structure the Company believes it will be able to do so.
The Company’s facility agreements contain covenants relating to financial measures such as minimum net worth, minimum working capital, minimum regulatory capital, minimum cumulative EBITDA and minimum interest coverage ratios. Failure to comply with any such covenants could result in the debt becoming payable on demand. As of March 31, 2011 the Company was in compliance with all of its covenants under its credit facilities.
Note 12 – Convertible Subordinated Notes
The Company had $10.0 million and $16.7 million in aggregate principal amount of the Company’s senior subordinated convertible notes due September 2011 (the Notes) outstanding as of March 31, 2011 and September 30, 2010, respectively. The Notes are general unsecured obligations of the Company and bear interest at the rate of 7.625% per annum, payable quarterly in arrears.
During the six months ended March 31, 2011, holders of $6.7 million in principal amount of the Notes converted the principal and accrued interest of $0.1 million into 313,102 shares of common stock of the Company. As of March 31, 2011, the remaining Notes are convertible by the holders into 458,926 shares of common stock of the Company at a conversion price of $21.79 per share. Subsequent to March 31, 2011, the Company received a conversion notice from a note holder to convert an additional $1.0 million of principal amount of the Notes.
If the dollar-volume weighted-average price of the common stock exceeds $38.25 per share, subject to certain adjustments, for any twenty out of thirty consecutive trading days, the Company will have the right to require the holders of the Notes to convert all or any portion of the Notes into shares of common stock at the then-applicable conversion price.
In the event that the consolidated net interest coverage ratio, as set forth in the Notes, for the 12 months preceding the end of any fiscal quarter is less than 2.0, the interest rate on the Notes will be increased by 2.0% to 9.625% per annum, effective as of the first day of the following fiscal quarter. Through the quarter ended March 31, 2011, the consolidated net interest coverage ratio has exceeded 2.0 and no such increase has been necessary.
The Company entered into a separate Registration Rights Agreement with the holders of the Notes, under which the Company was required to file with the SEC a Registration Statement on Form S-3 within a specified period of time. The Registration Statement was declared effective by the SEC on October 24, 2006. The Company is required, under the Registration Rights Agreement, to maintain the effectiveness of the Registration Statement, failing which it could become liable to pay holders of the Notes liquidated damages of 1% of the value of the Notes, plus a further 1% for every 30 days that it remains ineffective thereafter, up to an aggregate maximum of 10% of the value of the Notes. At March 31, 2011 the Company was in compliance with its requirements under the Registration Rights Agreement.
Note 13 – Commitments and Contingencies
Legal Proceedings
Securities Litigation
FCStone and certain officers of FCStone were named as defendants in an action filed in the United States District Court for the Western District of Missouri on July 15, 2008. A consolidated amended complaint (“CAC”) was subsequently filed on September 25, 2009. As alleged in the CAC, the action purports to be brought as a class action on behalf of purchasers of FCStone common stock between November 15, 2007 and February 24, 2009. The CAC seeks to hold defendants liable under Section 10(b) and Section 20(a) of the Securities Exchange Act of 1934 and concerns disclosures included in FCStone's fiscal year 2008 public filings. Specifically, the CAC relates to FCStone's public disclosures regarding an interest rate hedge, a bad debt expense arising from unprecedented events in the cotton trading market, and certain disclosures beginning on November 3, 2008 related to losses it expected to incur arising primarily from a customer energy trading account. FCStone and the named officers moved to dismiss the action. Although the Court denied that motion on November 16, 2010, it limited the action to the public disclosures made on November 3 and 4, 2008 related to the energy trading account. The action is now in discovery and plaintiffs are currently seeking to certify the relevant class as those stockholders who purchased FCStone stock between April 14, 2008 and February 24, 2009. The Company and the FCStone defendants believe the action is meritless and the FCStone defendants are defending this action vigorously.
20
In August 2008, a shareholder derivative action was filed against FCStone and certain directors of FCStone in the Circuit Court of Platte County, Missouri, alleging breaches of fiduciary duties, waste of corporate assets and unjust enrichment. An amended complaint was subsequently filed in May 2009 to add claims based upon the losses sustained by FCStone arising out of a customer's energy trading account. On July 7, 2009, the same plaintiff filed a motion for leave to amend the existing case to add a purported class action claim on behalf of the holders of FCStone common stock.
On July 8, 2009, a purported shareholder class action complaint was filed against FCStone and its directors, as well as the Company in the Circuit Court of Clay County, Missouri. The complaint alleged that FCStone and its directors breached their fiduciary duties by failing to maximize stockholder value in connection with the contemplated acquisition of FCStone by the Company. This complaint was subsequently consolidated with the complaint filed in the Circuit Court of Platte County, Missouri. The plaintiffs subsequently filed an amended consolidated complaint which does not assert any claims against the Company. This complaint purports to be filed derivatively on FCStone and the Company's behalf and against certain of FCStone current and former directors and officers and directly against the same individuals. The Company, FCStone, and the defendants filed motions to dismiss on multiple grounds. That motion is fully briefed and pending decision.
In addition, the staff of the Fort Worth Regional Office of the SEC is conducting a formal investigation of FCStone's disclosures and accounting for losses associated with the energy trading account, which occurred prior to the Company's acquisition of FCStone on September 30, 2009. In March 2011, certain employees of the Company testified before the SEC in connection with this investigation. The Company and FCStone are cooperating fully with the SEC staff in its investigation, but cannot predict the scope, duration or outcome of the matter.
On February 24, 2011, the Company's Board of Directors formed a special committee to conduct an independent investigation of FCStone's disclosures and accounting for losses associated with the energy trading account. The Company's Board of Directors determined that it would be appropriate and consistent with its governance and oversight responsibilities to form the special committee to investigate these matters as they pertain to the private litigation and the SEC investigation described above. The special committee, which is comprised solely of independent directors of the Company who were not formerly directors of FCStone, has retained an independent law firm to represent and assist it in its review.
Convertible Note Holder Litigation
On October 20, 2010, three investors in the Company's senior subordinated convertible notes due September 2011 (the “Notes”), consisting of Highbridge International LLC, LBI Group Inc. and Iroquois Master Fund Ltd., filed suit against the Company, claiming that the acquisition by the Company of FCStone in September 2009 resulted in a change of control as defined in the Notes and that, as a result, the Company should have afforded them the opportunity to have the Notes redeemed at a 15% premium. The investors also claimed the right to penalty interest at the rate of 15% per annum established in the Notes. The investors held Notes with a principal amount of $13.0 million at the time of the commencement of the litigation.
On April 21, 2011 the Company's motion to dismiss the investors' lawsuit was denied. Accordingly, the lawsuit is expected to proceed to trial. Prior to April 21, 2011, one of the investors, Iroquois Master Fund Ltd., converted $3.0 million of its $4.0 million investment in principal amount of the Notes, and accrued interest, into 139,136 shares of common stock of the Company. On April 25, 2011, Iroquois Master Fund Ltd. converted the remaining $1.0 million, and accrued interest, into 46,133 shares of common stock of the Company. Following these conversions, $9.0 million in principal amount of the Notes held by the investors remain outstanding.
Sentinel Litigation
On January 21, 2011 the bankruptcy trustee of Sentinel Management Group, Inc. filed a motion for summary judgment on various counts in the adversary proceedings filed in August 2008 against one of the Company's subsidiaries, FCStone, LLC, and a number of other FCMs. The nature of these adversary proceedings has been disclosed in previous filings of the Company.
Apart from the above, there have been no material developments in previously reported litigation, and no other reportable events have occurred during the quarter ended March 31, 2011 or through the date of this filing.
21
Contractual Commitments
Contingent Liabilities - Acquisitions
The Company has a contingent liability relating to the acquisition of Hencorp Becstone Futures, L.C., which was renamed INTL Hencorp Futures, LLC ("Hencorp Futures"), which occurred during the first quarter of 2011, which may result in the payment of additional consideration – see Note 16. The acquisition date fair value of additional consideration is remeasured to its fair value each quarter, with changes in fair value recorded in earnings. The change in fair value for the three and six months ended March 31, 2011 was an increase of $0.2 million, respectively, and is included within ‘Other expense’ in the condensed consolidated income statements. The present value of the estimated total purchase price, including contingent consideration, is $6.1 million at March 31, 2011, of which $2.5 million has not been paid and is included within ‘accounts payable and other liabilities’ in the condensed consolidated balance sheets.
The Company has a contingent liability relating to the acquisition of the Hanley Companies, which occurred during the fourth quarter of 2010, which may result in the payment of additional consideration. The acquisition date fair value of additional consideration is remeasured to its fair value each quarter, with changes in fair value recorded in earnings. The change in fair value for the three and six months ended March 31, 2011 was an increase of $0.5 million and $1.7 million, respectively, and is included within ‘Other expense’ in the condensed consolidated income statements. The present value of the estimated total purchase price, including contingent consideration, is $49.1 million at March 31, 2011, of which $17.3 million has not been paid and is included within ‘accounts payable and other liabilities’ in the condensed consolidated balance sheets.
The Company has a contingent liability relating to the acquisition of the RMI Companies, which occurred during the third quarter of 2010, which may result in the payment of additional consideration. The acquisition date fair value of additional consideration is remeasured to its fair value each quarter, with changes in fair value recorded in earnings. The change in fair value for the three and six months ended March 31, 2011 was a decrease of $0.2 million and no change, respectively, and is included within ‘other expense’ in the condensed consolidated income statements. The present value of the estimated total purchase price, including contingent consideration, is $16.7 million at March 31, 2011, of which $10.7 million has not been paid and is included within ‘Accounts payable and other liabilities’ in the condensed consolidated balance sheets.
The Company had a contingent liability relating to the acquisition of Compania Inversora Bursatil S.A. Sociedad de Bolsa (CIBSA). The Company paid approximately $1.7 million on the date of purchase and was obligated to make additional payments, depending on the level of revenues achieved. Under the purchase agreement, the Company was obligated to pay an amount equal to 25% of the net revenues if such net revenues are in excess of $2.5 million and up to $3.0 million, 35% of the net revenues in excess of $3.0 million and up to $4.0 million, and 40% of the net revenues in excess of $4.0 million for each of the two twelve-month periods ending March 31, 2010 and 2011 to the sellers as additional consideration. The net revenues for the twelve-month period ended March 31, 2011 were below the minimum target, so no further amounts will be paid.
On April 7, 2011, the Company's wholly-owned subsidiary in the United Kingdom, INTL Global Currencies Limited, agreed to acquire the issued share capital of Ambrian Commodities Limited, the London Metals Exchange brokerage subsidiary of Ambrian Capital Plc. Closing of the deal is subject to approval by the Financial Services Authority (“FSA”) as a change of control. The purchase consideration will be equal to net asset value (NAV), which is estimated to be $17.0 million. Upon obtaining FSA approval, the Company will pay 75 percent of the estimated NAV, with the balance being paid ten days after completion of a closing balance sheet audit. See additional discussion of the acquisition in Note 20.
Convertible Subordinated Notes
As discussed in Note 12 – Convertible Subordinated Notes, the Notes may be converted into shares of common stock of the Company at any time by the holders. The Notes also contain a provision to increase the interest rate by 2%, subject to certain conditions measured on a quarterly basis.
Exchange Member Guarantees
The Company is a member of various exchanges that trade and clear futures and option contracts. Associated with its memberships, the Company may be required to pay a proportionate share of the financial obligations of another member who may default on its obligations to the exchanges. While the rules governing different exchange memberships vary, in general the Company’s guarantee obligations would arise only if the exchange had previously exhausted its resources. In addition, any such guarantee obligation would be apportioned among the other non-defaulting members of the exchange. Any potential contingent liability under these membership agreements cannot be estimated. The Company has not recorded any contingent liability in the condensed consolidated financial statements for these agreements and believes that any potential requirement to make payments under these agreements is remote.
22
Impairment
The Company recorded an impairment charge of $0.7 million in the first quarter of 2010 in connection with INTL Sieramet LLC, a corporation in which it holds a 55% equity interest. This amount is recorded within ‘Bad debts and impairments’ in the condensed consolidated income statements for the six months ended March 31, 2010. The impairment charge recognizes the pending liquidation of INTL Sieramet and the possibility that there may be incomplete recovery of the full value of its assets.
Change in Control Contingency
In connection with the acquisition of FCStone, certain of FCStone’s management and executive officers are participants in FCStone’s Change in Control Severance Plan (the “Severance Plan"). The Severance Plan provides that if during the two-year period following the completion of the merger agreement, a participant terminates their employment for “good reason” or the Company terminates the participant’s employment other than for “cause” or on account of death or disability, the Company will be committed to pay certain compensation amounts to the participant in a lump sum amount. The maximum potential commitment for all participants is $4.5 million. At March 31, 2011, no actions have occurred or are anticipated which would trigger payments under the Severance Plan.
Note 14 – Capital and Other Regulatory Requirements
FCStone, LLC is a registered commodity futures commission merchant with the Commodity Futures Trading Commission (the “CFTC”) servicing customers primarily in grain, energy and food service-related businesses. Pursuant to the rules, regulations, and requirements of the CFTC and other regulatory agencies, FCStone, LLC is required to maintain certain minimum net capital as defined in such rules, regulations, and requirements. Net capital and the related net capital requirement may fluctuate on a daily basis. Pursuant to the requirements of the Commodity Exchange Act, funds deposited by customers of FCStone relating to futures and options on futures in regulated commodities must be carried in separate accounts which are designated as segregated customers’ accounts.
The Company’s subsidiary INTL Trading, Inc. ("INTL Trading") is a registered broker dealer and member of the Financial Industry Regulatory Authority (FINRA) and is subject to the SEC Uniform Net Capital Rule 15c3-1. This rule requires the maintenance of minimum net capital, and requires that the ratio of aggregate indebtedness to net capital not exceed 15 to 1. A further requirement is that equity capital may not be withdrawn if this ratio would exceed 10 to 1 after such withdrawal.
The Company’s subsidiary FCStone Australia Pty Ltd (FCStone Australia) is regulated by the Australian Securities and Investment Commission and is subject to a surplus liquid funds requirement. FCStone Australia is also regulated by the New Zealand Clearing Limited, and is subject to a capital adequacy requirement.
The Company’s subsidiary FCC Investments, Inc. is a registered broker-dealer and a member of FINRA, and is subject to the SEC Uniform Net Capital Rule 15c3-1.
The Company's subsidiaries, Risk Management Incorporated and Hencorp Futures, are regulated by the CFTC and the National Futures Association and are both subject to a minimum capital requirement.
The Company is in compliance with all of its regulatory requirements at March 31, 2011, as follows:
(in millions) | As of March 31, 2011 | ||||||||||
Subsidiary | Regulatory Authority | Requirement Type | Actual | Minimum Requirement | |||||||
FCStone, LLC | CFTC | Net capital | $ | 109.6 | $ | 71.9 | |||||
FCStone, LLC | CFTC | Segregated funds | $ | 1,272.1 | $ | 1,228.0 | |||||
INTL Trading | SEC | Net capital | $ | 2.4 | $ | 1.0 | |||||
FCC Investments, Inc. | SEC | Net capital | $ | 0.4 | $ | 0.3 | |||||
FCStone Australia | Australian Securities and Investment Commission | Net capital | $ | 4.1 | $ | 0.6 | |||||
FCStone Australia | New Zealand Clearing Ltd | Capital adequacy | $ | 1.9 | $ | 1.0 | |||||
Risk Management Incorporated | CFTC | Net capital | $ | 0.7 | $ | 0.1 | |||||
Hencorp Futures | CFTC | Net capital | $ | 1.0 | $ | 0.1 | |||||
Certain other non-U.S. subsidiaries of the Company are also subject to capital adequacy requirements promulgated by authorities of the countries in which they operate. As of March 31, 2011, these subsidiaries were in compliance with their local capital adequacy requirements.
23
Note 15 – Stock-Based Compensation
Stock-based compensation expense is included within compensation and benefits in the condensed consolidated income statements and totaled $0.5 million for the three months ended March 31, 2011 and 2010, and $1.1 million and $0.8 million for the six months ended March 31, 2011 and 2010, respectively.
Stock Option Plans
The Company sponsors a stock option plan for its directors, officers, employees and consultants. At March 31, 2011, 741,048 shares were authorized for future grant under this plan. Awards that expire or are canceled generally become available for issuance again under the plan. We settle stock option exercises with newly issued shares of common stock.
Fair value is estimated at the grant date based on a Black-Scholes-Merton option-pricing model using the following weighted-average assumptions:
Six Months Ended March 31, | |||||
2011 | 2010 | ||||
Expected stock price volatility | 77 | % | 85 | % | |
Expected dividend yield | — | % | — | % | |
Risk free interest rate | 0.72 | % | 1.46 | % | |
Average expected life (in years) | 2.94 | 2.80 | |||
Expected stock price volatility rates are based on the historical volatility of the Company’s common stock. The Company has not paid dividends in the past and does not currently expect to do so in the future. Risk free interest rates are based on the U.S. Treasury yield curve in effect at the time of grant for periods corresponding with the expected life of the option or award. The average expected life represents the estimated period of time that options or awards granted are expected to be outstanding, based on the Company’s historical share option exercise experience for similar option grants.
The following is a summary of stock option activity through March 31, 2011:
Shares Available for Grant | Number of Options Outstanding | Weighted Average Price | Weighted Average Grant Date Fair Value | Weighted Average Remaining Term (in years) | Aggregate Intrinsic Value ($ millions) | |||||||||||||||
Balances at September 30, 2010 | 744,871 | 1,476,500 | $ | 20.42 | $ | 8.93 | 3.68 | $ | 8.4 | |||||||||||
Granted | (51,323 | ) | 51,323 | $ | 23.46 | $ | 11.66 | |||||||||||||
Exercised | (117,921 | ) | $ | 10.78 | $ | 7.59 | ||||||||||||||
Forfeited | 1,000 | (1,000 | ) | $ | 15.18 | $ | 8.06 | |||||||||||||
Expired | 46,500 | (46,500 | ) | $ | 28.83 | $ | 14.44 | |||||||||||||
Balances at March 31, 2011 | 741,048 | 1,362,402 | $ | 21.08 | $ | 8.96 | 3.52 | $ | 14.3 | |||||||||||
Exercisable at March 31, 2011 | 854,043 | $ | 27.98 | $ | 11.68 | 3.50 | $ | 6.3 | ||||||||||||
The total compensation cost not yet recognized for non-vested awards of $1.5 million at March 31, 2011 has a weighted-average period of 2.55 years over which the compensation expense is expected to be recognized. The total intrinsic value of options exercised during the six months ended March 31, 2011 and 2010 was $1.6 million and $0.9 million, respectively.
Restricted Stock Plan
The Company sponsors a restricted stock plan for its directors, officers and employees. At March 31, 2011, 357,586 shares were authorized for future grant under our restricted stock plan. Awards that expire or are canceled generally become available for issuance again under the plan. The Company settles restricted stock with newly issued shares of common stock.
24
The following is a summary of restricted stock activity through March 31, 2011:
Shares Available for Grant | Number of Shares Outstanding | Weighted Average Grant Date Fair Value | Weighted Average Remaining Term (in years) | Aggregate Intrinsic Value ($ millions) | ||||||||||||
Balances at September 30, 2010 | 430,882 | 240,368 | $ | 13.66 | 2.13 | $ | 4.4 | |||||||||
Granted | (73,296 | ) | 73,296 | $ | 23.17 | |||||||||||
Vested | (70,445 | ) | $ | 16.53 | ||||||||||||
Balances at March 31, 2011 | 357,586 | 243,219 | $ | 15.69 | 2.15 | $ | 6.2 | |||||||||
The total compensation cost not yet recognized of $3.1 million at March 31, 2011 has a weighted-average period of 2.15 years over which the compensation expense is expected to be recognized. Compensation expense is amortized on a straight-line basis over the vesting period. Restricted stock grants are included in the Company’s total issued and outstanding common shares.
Note 16 – Acquisitions
On October 1, 2010, the Company acquired all of the ownership interests in Hencorp Futures, the commodity futures operation of Miami-based Hencorp Becstone. Hencorp Futures specializes in the development and execution of risk-management programs designed to hedge price volatility in a number of widely traded commodities, including coffee, sugar, cocoa, grains and energy products. The transaction will enable the Company to round out its portfolio of commodity risk management services to include a more robust capability in soft commodities, especially coffee, where Hencorp Futures has established a substantial presence and reputation globally, and especially in Central and South America.
The acquisition of Hencorp Futures is not significant on an individual basis, and the purchase price consisted of an initial payment of $2.3 million, two payments totaling $1.4 million, representing the adjusted tangible equity of Hencorp Futures as of September 30, 2010, four contingent payments which will be based on Hencorp Futures’ net income for each of the four years after the closing and a final contingent payment based on the average net income of the second, third and fourth years. The present value of the estimated total purchase price, including contingent consideration, at the acquisition date was approximately $6.0 million.
The Company has made a preliminary allocation of the purchase costs among tangible assets, identified intangible assets with determinable useful lives, intangible assets with indefinite lives and goodwill. The preliminary intangible assets and goodwill recognized in this transaction were assigned to the C&RM segment. The Company is in the process of finalizing third-party valuations of the intangible assets and contingent liabilities. Purchase costs allocated to intangible assets with determinable useful lives are $1.7 million, which will be amortized over the remaining useful lives of the assets, and include customer relationships of $1.3 million (twenty-year weighted-average useful life) and non-compete agreements of $0.4 million (two-year weighted-average useful life). Purchase costs allocated to intangible assets with indefinite lives are $0.8 million, and relate to a trade name. Goodwill of $2.1 million has been calculated as the excess of the fair value of the consideration transferred over the fair value of the identified net assets acquired and liabilities assumed, and is expected to be deductible for tax purposes.
Under the terms of the purchase agreements, the Company has obligations to pay additional consideration if specific conditions and earnings targets are met, as described above. In accordance with the Business Combinations Topic of the ASC, the fair value of the additional consideration is recognized as a contingent liability as of the acquisition date. The acquisition date fair value of additional consideration is estimated to be $2.3 million. The contingent liability for the estimated additional consideration is included in the ‘accounts payable and other accrued liabilities’ caption of the condensed consolidated balance sheet at March 31, 2011. The contingent liability recorded represents the fair value of the expected consideration to be paid based on the forecasted sales during the four year period and a discount rate being applied to those future payments. At the end of each reporting period after the acquisition date, the contingent payment will be remeasured to its fair value, with changes in fair value recorded in earnings - see Note 13. The Company’s consolidated financial statements include the operating results of Hencorp Futures from the date of acquisition.
25
Note 17 – Discontinued Operations
Effective May 1, 2010, the Company sold its interest in INTL Capital Limited (INTL Capital) to an independent third party for a purchase price equal to book value. The subsidiary operated an asset management business in Dubai. The results of operations for INTL Capital, which were previously included within the other segment, are included within discontinued operations on the condensed consolidated income statements. For the three and six months ended March 31, 2010, the Company recorded a loss, net of tax, related to INTL Capital of $0.2 million and $0.4 million, respectively, within discontinued operations.
On June 10, 2010, the board of directors of Agora-X, LLC (Agora) agreed to discontinue the operations of the entity. Since the discontinuation of operations of Agora occurred within the one year assessment period, beginning with the Company’s loss of controlling interest, the Company determined that Agora had met the criteria established with the guidance in the Presentation of Financial Statements – Discontinued Operations Topic of the ASC for reporting discontinued operations. In accordance with the guidance, the results of Agora, including the Company’s 15% share of the losses from January 1, 2010 through June 30, 2010, were included within discontinued operations, net of tax, on the condensed consolidated income statements. For the three months ended March 31, 2010, the Company recorded a pre-tax loss and a loss, net of tax, related to Agora of $2.6 million and $1.5 million, respectively, and for the six months ended March 31, 2010, the Company recorded a pre-tax loss and a loss, net of tax, related to Agora of $1.5 million and $0.8 million, respectively, within discontinued operations. For the six months ended March 31, 2011, the Company recorded a gain, net of tax, related to the liquidation of Agora-X of $0.2 million. The results of Agora were previously included within the Other segment.
Note 18 – Segment Analysis
The Company reports its operating segments based on services provided to customers. The Company’s activities are divided into the following five functional areas:
• | Commodity and Risk Management Services |
• | Foreign Exchange |
• | Securities |
• | Clearing and Execution Services |
• | Other |
To conform to the current quarterly presentation, the Company has reclassified certain prior period segment total asset amounts. On a periodic basis, the Company sweeps excess cash from operating segments to a centralized corporate treasury function in exchange for an intercompany receivable asset. The intercompany receivable asset is eliminated during consolidation, and therefore this practice may impact reported total assets between segments.
Commodity and Risk Management Services (C&RM)
The Company serves its commercial customers through its force of approximately 145 risk management consultants with a high value added service that differentiates us from other competitors and maximizes the opportunity to retain customers. The Integrated Risk Management Program ("IRMP®") involves providing customers with commodity risk management consulting services that are designed to develop a customized long term hedging program to help them mitigate their exposure to commodity price risk and maximize the amount and certainty of their operating profits. Customers are assisted in the execution of their hedging strategies through the Company’s exchange-traded futures and options clearing and execution operations and through access to more customized alternatives provided by the OTC trading desk. Generally, customers direct their own trading activity and risk management consultants do not have discretionary authority to transact trades on behalf of customers. When transacting OTC contracts with customers, the Company may offset the customer’s transaction simultaneously with one of its trading counterparties. Alternatively, the OTC trade desk will accept a customer transaction and offset that transaction with a similar but not identical position on the exchange.
In addition, the Company provides a full range of trading and hedging capabilities to select producers, consumers, recyclers and investors in precious metals and certain base metals. Acting as a principal, the Company commits its own capital to buy and sell the metals on a spot and forward basis.
The Company records its physical commodities revenues on a gross basis. Operating revenues and losses from the Company’s commodities derivatives activities are recorded in ‘Trading gains’. Inventory for the commodities business is valued at the lower of cost or fair value under the provisions of the Inventory Topic of the ASC. The Company generally mitigates the price risk associated with commodities held in inventory through the use of derivatives. The Company does not elect hedge accounting under U.S. GAAP in accounting for this price risk mitigation. In such situations, unrealized gains in inventory are not recognized under U.S. GAAP, but unrealized gains and losses in related derivative positions are recognized under U.S. GAAP. As a result, the Company’s reported earnings from commodities trading may be subject to significant volatility when calculated under U.S. GAAP.
26
Foreign Exchange
The Company provides treasury, global payment and foreign exchange services to financial institutions, multi-national corporations, government organizations and charitable organizations as well as assisting commercial customers with the execution of foreign exchange hedging strategies. The Company transacts in over 130 currencies and specializes in smaller, more difficult emerging markets where there is limited liquidity. In addition, the Company executes trades based on the foreign currency flows inherent in the Company’s existing business activities. The Company primarily acts as a principal in buying and selling foreign currencies on a spot basis. The Company derives revenue from the difference between the purchase and sale prices.
The Company also provides spot foreign currency trading for a customer base of eligible contract participants and high net worth retail customers as well as operating a proprietary foreign exchange desk which arbitrages the futures and cash markets.
Securities
Through INTL Trading, the Company acts as a wholesale market maker in select foreign securities including unlisted ADRs and foreign ordinary shares. INTL Trading provides execution and liquidity to national broker-dealers, regional broker-dealers and institutional investors.
The Company also originates, structures and places a wide array of emerging market debt instruments in the international and domestic capital markets. These instruments include complex asset backed securities, unsecured bond and loan issues, negotiable notes and other trade-related debt instruments used in cross-border trade finance. On occasions the Company may invest its own capital in debt instruments before selling them. It also actively trades in a variety of international debt instruments.
Clearing and Execution Services (CES)
The Company seeks to provide competitive and efficient clearing and execution of exchange-traded futures and options for the institutional and professional trader market segments. Through its platform, customer orders are accepted and directed to the appropriate exchange for execution. The Company then facilitates the clearing of customers’ transactions. Clearing involves the matching of customers’ trades with the exchange, the collection and management of margin deposits to support the transactions, and the accounting and reporting of the transactions to customers. The Company seeks to leverage its capabilities and capacity by offering facilities management or outsourcing solutions to other FCMs.
Other
This segment consists of the Company’s asset management and commodity financing and facilitation business. The asset management revenues include fees, commissions and other revenues received by the Company for management of third party assets and investment gains or losses on the Company’s investments in funds and proprietary accounts managed either by the Company’s investment managers or by independent investment managers.
The Company operates a commodity financing and facilitation business which provides financing to commercial commodity-related companies against physical inventories, including grain, lumber, meats, energy products and renewable fuels. Sale and repurchase agreements are used to purchase commodities evidenced by warehouse receipts, subject to a simultaneous agreement to sell such commodities back to the original seller at a later date. These transactions are accounted for as product financing arrangements, and accordingly no commodity inventory, purchases or sales are recorded.
The total revenues reported combine gross revenues for the physical commodities business and net revenues for all other businesses. In order to reflect the way that the Company’s management views the results, the tables below also reflect the segmental contribution to ‘Operating revenues’, which is shown on the face of the condensed consolidated income statements and which is calculated by deducting physical commodities cost of sales from total revenues.
Segment data includes the profitability measure of net contribution by segment. Net contribution is one of the key measures used by management to assess the performance of each segment and for decisions regarding the allocation of the Company’s resources. Net contribution is calculated as revenue less direct cost of sales, clearing and related expenses, variable compensation, introducing broker commissions and interest expense. Variable compensation paid to traders generally represents a fixed percentage of an amount equal to revenues generated, and in some cases, revenues produced less clearing and related charges, base salaries and an overhead allocation.
27
The segment data also includes segment income which is calculated as net contribution less certain non-variable direct expenses of the segment. These non-variable direct expenses include trader base compensation and benefits, operational employee compensation and benefits, communication and data services, travel, professional fees, bad debt expense and other direct expenses.
Inter-segment revenues, charges, receivables and payables are eliminated upon consolidation, except revenues and costs related to foreign currency transactions undertaken on an arm’s length basis by the foreign exchange trading business for the securities business. The foreign exchange trading business competes for this business as it does for any other business. If its rates are not competitive, the securities businesses buy or sell their foreign currency through other market counter-parties.
28
Information concerning operations in these segments of business is shown in accordance with the Segment Reporting Topic of the ASC as follows:
Three Months Ended March 31, | Six Months Ended March 31, | ||||||||||||||
(in millions) | 2011 | 2010 | 2011 | 2010 | |||||||||||
Total revenues: | |||||||||||||||
Commodity and risk management services | $ | 14,531.9 | $ | 9,018.5 | $ | 30,755.8 | $ | 16,967.4 | |||||||
Foreign exchange | 13.0 | 10.9 | 27.5 | 24.0 | |||||||||||
Securities | 9.8 | 5.0 | 17.7 | 10.4 | |||||||||||
Clearing and execution services | 18.3 | 14.4 | 35.4 | 30.5 | |||||||||||
Other | 10.7 | 6.6 | 17.8 | 10.6 | |||||||||||
Corporate unallocated | (0.7 | ) | (0.8 | ) | (0.4 | ) | (1.3 | ) | |||||||
Total | $ | 14,583.0 | $ | 9,054.6 | $ | 30,853.8 | $ | 17,041.6 | |||||||
Operating revenues (loss): | |||||||||||||||
Commodity and risk management services | $ | 69.5 | $ | 33.6 | $ | 123.6 | $ | 56.9 | |||||||
Foreign exchange | 13.0 | 10.9 | 27.5 | 24.0 | |||||||||||
Securities | 9.8 | 5.0 | 17.7 | 10.4 | |||||||||||
Clearing and execution services | 18.3 | 14.4 | 35.4 | 30.5 | |||||||||||
Other | 3.1 | 2.2 | 5.9 | 4.4 | |||||||||||
Corporate unallocated | (0.7 | ) | (0.8 | ) | (0.4 | ) | (1.3 | ) | |||||||
Total | $ | 113.0 | $ | 65.3 | $ | 209.7 | $ | 124.9 | |||||||
Net contribution: | |||||||||||||||
(Revenues less cost of sales, clearing and related expenses, variable bonus compensation, introducing broker commissions and interest expense): | |||||||||||||||
Commodity and risk management services | $ | 44.0 | $ | 21.2 | $ | 71.7 | $ | 31.5 | |||||||
Foreign exchange | 8.1 | 6.6 | 17.1 | 14.3 | |||||||||||
Securities | 4.7 | 3.1 | 9.2 | 5.7 | |||||||||||
Clearing and execution services | 4.7 | 1.6 | 8.0 | 3.8 | |||||||||||
Other | 2.2 | 1.9 | 3.9 | 3.6 | |||||||||||
Total | $ | 63.7 | $ | 34.4 | $ | 109.9 | $ | 58.9 | |||||||
Net segment income: | |||||||||||||||
(Operating revenues less interest expense and direct costs allocated to segments): | |||||||||||||||
Commodity and risk management services | $ | 31.6 | $ | 13.6 | $ | 45.6 | $ | 17.4 | |||||||
Foreign exchange | 6.2 | 5.0 | 13.3 | 11.2 | |||||||||||
Securities | (0.2 | ) | 1.6 | 1.4 | 2.9 | ||||||||||
Clearing and execution services | 2.1 | 0.1 | 4.3 | 1.0 | |||||||||||
Other | 1.2 | 1.1 | 2.0 | 2.1 | |||||||||||
Total | $ | 40.9 | $ | 21.4 | $ | 66.6 | $ | 34.6 | |||||||
Reconciliation of segment income to income from continuing operations before tax: | |||||||||||||||
Net contribution allocated to segments | $ | 40.9 | $ | 21.4 | $ | 66.6 | $ | 34.6 | |||||||
Costs not allocated to operating segments | 17.6 | 11.7 | 37.4 | 25.4 | |||||||||||
Income from continuing operations, before tax | $ | 23.3 | $ | 9.7 | $ | 29.2 | $ | 9.2 | |||||||
As of March 31, 2011 | As of September 30, 2010 | ||||||||||||||
Total assets: | |||||||||||||||
Commodity and risk management services | $ | 1,163.1 | $ | 1,182.8 | |||||||||||
Foreign exchange | 161.3 | 117.6 | |||||||||||||
Securities | 84.6 | 49.5 | |||||||||||||
Clearing and execution services | 708.5 | 594.9 | |||||||||||||
Other | 59.2 | 30.8 | |||||||||||||
Corporate unallocated | 95.2 | 46.1 | |||||||||||||
Total | $ | 2,271.9 | $ | 2,021.7 | |||||||||||
29
Note 19 – FCStone Purchase Price Allocation
On September 30, 2009, the Company acquired FCStone through the issuance of 8,239,319 shares of the Company’s common stock. The allocation of purchase price to assets acquired and liabilities assumed as of the date of acquisition resulted in negative goodwill of $18.5 million which was recognized as an extraordinary item in the Company’s consolidated income statement for the fiscal year ended September 30, 2009.
During the three months ended December 31, 2009, management revised the estimate of state tax allocations resulting in a reduction in the consolidated effective state tax rate. As a result, the net deferred tax assets decreased by $3.4 million, including a change in estimate related to the valuation of state net operating loss carryforwards. The Company’s change in estimate was the result of revised revenue apportionment factors in certain jurisdictions due to analysis and activities completed subsequent to the filing of the fiscal year ended September 30, 2009 financial statements. Typically, changes within the measurement period that result from new information about facts and circumstances that existed at the acquisition date are recognized through a corresponding adjustment to goodwill. However, in the absence of goodwill recorded in connection with this transaction, the $3.4 million decrease in net deferred tax assets has been reported as an extraordinary loss in the condensed consolidated income statement for the six months ended March 31, 2010.
Note 20 – Subsequent Events
During April 2011, a holder of $1.0 million in principal amount of the Notes converted the principal and accrued interest into 46,133 shares of common stock of the Company.
On April 7, 2011, the Company's wholly-owned subsidiary in the United Kingdom (“UK”), INTL Global Currencies Limited, agreed to acquire 100 percent of the issued share capital of Ambrian Commodities Limited ("ACL"), the London Metals Exchange ("LME") brokerage subsidiary of Ambrian Capital Plc. The London-based ACL, currently a non-clearing LME member, specializes in the development and execution of risk-management programs designed to hedge price fluctuations in base metals for a wide variety of producers, manufacturers and fabricators. ACL has a niche focus on smaller industrial clients, including lead recyclers, brass producers, zinc galvanizers, metal refineries and copper foil producers that use LME futures and options for hedging raw material costs or output prices.
The acquisition is conditional upon the approval by the UK Financial Services Authority of the proposed change of control of ACL, following which the company will be renamed INTL FCStone (Europe) Limited. The purchase consideration will be equal to net asset value, which is approximately $17.0 million. The acquisition is not expected to have any immediate impact on the Company's earnings. This transaction is not considered to be material.
30
Item 2. Management’s Discussion and Analysis of Financial Condition and Results of Operations
The following discussion and analysis should be read in conjunction with the financial statements and notes thereto appearing elsewhere in this report. This Quarterly Report on Form 10-Q contains “forward-looking statements” within the meaning of Section 27A of the Securities Act of 1933 and Section 21E of the Securities Exchange Act of 1934. These forward-looking statements involve known and unknown risks and uncertainties, many of which are beyond the control of INTL FCStone Inc. and its subsidiaries (collectively “INTL” or “the Company”), including adverse changes in economic, political and market conditions, losses from the Company’s market-making and trading activities arising from counter-party failures and changes in market conditions, the possible loss of key personnel, the impact of increasing competition, the impact of changes in government regulation, the possibility of liabilities arising from violations of federal and state securities laws and the impact of changes in technology in the securities and commodities trading industries. Although the Company believes that its forward-looking statements are based upon reasonable assumptions regarding its business and future market conditions, there can be no assurances that the Company’s actual results will not differ materially from any results expressed or implied by the Company’s forward-looking statements. The Company undertakes no obligation to publicly update or revise any forward-looking statements, whether as a result of new information, future events or otherwise. Readers are cautioned that any forward-looking statements are not guarantees of future performance.
Recent Legislation Affecting the Financial Services Industry
On July 21, 2010, the President signed into law the Dodd-Frank Wall Street Reform and Consumer Protection Act (the “Dodd-Frank Act”). The Dodd-Frank Act contains a variety of provisions designed to regulate financial markets, including credit and derivatives transactions. Many aspects of the Dodd-Frank Act are subject to rulemaking that will take effect over several years, thus making it difficult to assess the impact of the statute on the financial industry, including the Company, at this time. The Company will continue to monitor all applicable developments in the implementation of the Dodd-Frank Act and expects to adapt successfully to any new applicable legislative and regulatory requirements.
Principal Activities
INTL forms a financial services group employing approximately 836 people in offices in twelve countries. We provide comprehensive risk management consulting services to mid-sized commercial customers. We also utilize our expertise and capital to provide foreign exchange and treasury services, securities execution, physical commodities trading services and execution in both listed futures and option contracts as well as structured over-the-counter (OTC) products in a wide range of commodities.
We are a customer centric organization which focuses on acquiring and building long-term relationships with our customers by providing consistent, quality execution and value added financial solutions, with the goal of earning the premium spreads that allow us to achieve our financial objectives.
We provide these services to a diverse group of more than 10,000 customers located in more than 100 countries, including producers, processors and end-users of nearly all widely-traded physical commodities to manage their risks and enhance margins; to commercial counterparties who are end-users of the firm’s products and services; to governmental and non-governmental organizations; and to commercial banks, brokers, institutional investors and major investment banks.
The Company engages in direct sales efforts to seek new customers, with a strategy of extending our services to potential customers who are similar in size and operations to our existing customer base, as well as different kinds of customers that have risk management needs that could be effectively met by our services. We plan to expand our services into new business product lines and new geographic regions, particularly in Asia, Europe, Australia, Latin America and Canada.
The Company’s activities are divided into the following five functional areas consisting of Commodity and Risk Management Services (C&RM), Foreign Exchange, Securities, Clearing and Execution Services (CES), and Other.
Commodity and Risk Management Services (C&RM)
We serve our commercial customers through a force of approximately 145 risk management consultants who seek to provide high value added service that differentiates the Company from our competitors and maximizes the opportunity to retain customers. The Integrated Risk Management Program (IRMP®) involves providing customers with commodity risk management consulting services with a goal of developing a customized long term hedging program to help them mitigate their exposure to commodity price risk and maximize the amount and certainty of their operating profits. Customers are assisted in the execution of their hedging strategies through the Company’s exchange-traded futures and options clearing and execution operations and through access to more customized alternatives provided by the OTC trading desk. Generally, customers direct their own trading activity and risk management consultants do not have discretionary authority to transact trades on behalf of
31
customers. When transacting OTC contracts with a customer, the Company may offset the customer’s transaction simultaneously with one of its trading counterparties. Alternatively, the OTC trade desk will accept a customer transaction and offset that transaction with a similar but not identical position on the exchange.
We also provide a full range of trading and hedging capabilities to select producers, consumers, recyclers and investors in precious metals and certain base metals and other commodities. Acting as a principal, the Company commits its own capital to buy and sell the metals on a spot and forward basis.
The Company records all of its physical commodities revenues on a gross basis. Operating revenues and losses from the Company’s commodities derivatives activities are recorded within ‘Trading gains’ on the condensed consolidated income statements. Inventory for the commodities business is valued at the lower of cost or fair value, under the provisions of the Inventory Topic of the ASC. The Company generally mitigates the price risk associated with commodities held in inventory through the use of derivatives. The Company does not elect hedge accounting under accounting principles generally accepted in the United States of America (U.S. GAAP) in accounting for price risk mitigation. In such situations, unrealized gains in inventory are not recognized under U.S. GAAP, but unrealized gains and losses in related derivative positions are recognized under U.S. GAAP. As a result, the Company’s reported earnings from commodities trading may be subject to significant volatility.
Foreign Exchange
The Company provides treasury, global payment and foreign exchange services to financial institutions, multi-national corporations, government organizations and charitable organizations. We also assist commercial customers with the execution of foreign exchange hedging strategies. The Company transacts in over 130 currencies and specializes in smaller, more difficult emerging markets where there is limited liquidity. In addition, the Company executes trades based on the foreign currency flows inherent in the Company’s existing business activities. The Company primarily acts as a principal in buying and selling foreign currencies on a spot basis. The Company derives revenue from the difference between the purchase and sale prices.
The Company also provides spot foreign currency trading for a customer base of eligible contract participants and high net worth retail customers as well as operating a proprietary foreign exchange desk which arbitrages the futures and cash markets.
Securities
Through INTL Trading, Inc. ("INTL Trading"), the Company acts as a wholesale market maker in select foreign securities including unlisted ADRs and foreign ordinary shares and provides execution in select debt instruments and exchange traded funds (ETFs). INTL Trading provides execution and liquidity to national broker-dealers, regional broker-dealers and institutional investors.
The Company makes markets in approximately 800 ADRs and foreign ordinary shares traded in the OTC market. In addition, the Company will, on request, make prices in more than 8,000 other ADRs and foreign common shares. As a market-maker, the Company provides trade execution services by offering to buy shares from, or sell shares to, broker-dealers and institutions. The Company displays the prices at which it is willing to buy and sell these securities and adjusts its prices in response to market conditions. When acting as principal, the Company commits its own capital and derives revenue from the difference between the prices at which the Company buys and sells shares. The Company also earns commissions by executing trades on an agency basis.
While the Company’s customers are other broker-dealers and institutions, the business tends to be driven by the needs of the private clients of those broker-dealers and institutions. The size of private client trades may be uneconomical for the in-house international equities trading desks of our customers to execute. The Company is able to provide execution of smaller trades at profitable margins.
The Company provides a full range of investment banking advisory services to commercial customers including the issuance of loans or equity. On occasion we may invest our own capital in debt instruments before selling them into the market.
Clearing and Execution Services (CES)
The Company seeks to provide competitive and efficient clearing and execution of exchange-traded futures and options for the institutional and professional trader market segments. Through its platform, customer orders are accepted and directed to the appropriate exchange for execution. The Company then facilitates the clearing of customers’ transactions. Clearing involves the matching of customers’ trades with the exchange, the collection and management of margin deposits to support the transactions, and the accounting and reporting of the transactions to customers. The Company seeks to leverage its capabilities and capacity by offering facilities management or outsourcing solutions to other futures commission merchants (FCM’s).
32
Other
This segment consists of the Company’s asset management and commodity financing and facilitation businesses. The asset management revenues include fees, commissions and other revenues received by the Company for management of third party assets and investment gains or losses on the Company’s investments in funds and proprietary accounts managed either by the Company’s investment managers or by independent investment managers.
We operate a commodity financing and facilitation business that makes loans to commercial commodity-related companies against physical inventories, including grain, lumber, meats, energy products and renewable fuels. Sale and repurchase agreements are used to purchase commodities evidenced by warehouse receipts, subject to a simultaneous agreement to sell such commodity inventory back to the original seller at a later date. These transactions are accounted for as product financing arrangements, and accordingly no commodity inventory, purchases or sales are recorded.
Executive Summary
During the three and six months ended March 31, 2011, the Company achieved strong growth as both operating and adjusted operating revenues increased in all segments over the prior year periods. Increases in commodity volatility, higher commodity prices and the effect of acquisitions and global expansion efforts made in the last twelve months resulted in substantially higher volumes and revenues in the C&RM segment. The key acquisition of Hanley Trading, LLC and related companies (the “Hanley Companies”) has expanded our structured OTC product offering to our commercial customers, and the acquisition of Risk Management Incorporated and RMI Consulting, Inc. (the “RMI Companies”) strengthened our execution and consulting capabilities in the natural gas markets. The acquisition of Hencorp Becstone Futures, L.C. ("Hencorp Futures") at the beginning of fiscal year 2011, will expand our risk management capabilities on a global scale into the coffee markets as well as solidify our presence in the important Central and South American commodity markets.
The acquisition of the Provident Group increased revenues in the debt capital markets business and the global recovery in retail activity in the equity markets led to increased levels of activity in our equities market making business. The Company's interest income has doubled over both the three and six month periods of the prior year as exchange traded and OTC customer deposits have increased, although historically low short term interest rates continued to dampen the effect of these increases.
Selected Summary Financial Information
As discussed in previous filings and elsewhere in this Form 10-Q, the requirements of U.S. GAAP to carry derivatives at fair value but physical commodities inventory at the lower of cost or fair value have a significant temporary impact on our reported earnings. Under U.S. GAAP, gains and losses on commodities inventory and derivatives which the Company intends to be offsetting are often recognized in different periods. Additionally, U.S. GAAP does not require us to reflect changes in estimated values of forward commitments to purchase and sell commodities.
For these reasons, management assesses the Company’s operating results on a marked-to-market basis. Management relies on these adjusted operating results to evaluate the performance of the Company’s commodities business segment and its personnel.
Under “Adjusted Non-GAAP Data” in the tables below are the Company’s adjusted operating revenues, adjusted net income and adjusted stockholders’ equity, which have been adjusted to reflect the marked-to-market differences in the Company’s commodities business during each period (in the case of operating revenues and net income) and the cumulative differences (in the case of stockholders’ equity). The Company has also included the estimated tax liability which would have been incurred as a result of these adjustments, utilizing a blended tax rate of 37.5%.
The Company determines the fair value of physical commodities inventory on a marked-to-market basis by applying quoted market prices to the inventory owned by the Company on the balance sheet date. In the Company’s precious metals business, the Company obtains the closing COMEX nearby futures price for the last business day of the month and then adjusts that price to reflect an exchange for physical transaction, utilizing bids obtained from one or more market participants. In the Company’s base metals business, for copper inventory, the Company obtains the closing COMEX or LME nearby futures price and then adjusts that price to reflect any freight charges to the relevant delivery point. For the Company’s lead inventory, the Company obtains the closing LME nearby futures month price and then adjusts that price to reflect any tolling and freight charges to the relevant delivery point. If valued as fair value assets under GAAP, our physical commodities inventory would be classified as level 2 assets.
33
Adjusted Non-GAAP Financial Information
Three Months Ended March 31, | Six Months Ended March 31, | ||||||||||||||
(in millions, except ratio) | 2011 | 2010 | 2011 | 2010 | |||||||||||
U.S. GAAP Data (Unaudited): | |||||||||||||||
Operating revenues | $ | 113.0 | $ | 65.3 | $ | 209.7 | $ | 124.9 | |||||||
Income from continuing operations, before tax | 23.3 | 9.7 | 29.2 | 9.2 | |||||||||||
Net income attributable to INTL FCStone Inc. common stockholders | 15.4 | 7.4 | 19.4 | 3.2 | |||||||||||
Stockholders’ equity | 270.8 | 244.2 | |||||||||||||
Adjusted Non-GAAP Data (Unaudited): | |||||||||||||||
Data adjusted (on a marked to market basis): | |||||||||||||||
Operating revenues as stated above | $ | 113.0 | $ | 65.3 | $ | 209.7 | $ | 124.9 | |||||||
Marked-to-market adjustment (non-GAAP) | (14.0 | ) | (4.8 | ) | (1.9 | ) | 0.8 | ||||||||
Adjusted operating revenues, marked to market (non-GAAP) | $ | 99.0 | $ | 60.5 | $ | 207.8 | $ | 125.7 | |||||||
Income from continuing operations, before tax, as stated above | $ | 23.3 | $ | 9.7 | $ | 29.2 | $ | 9.2 | |||||||
Marked-to-market adjustment (Non-GAAP) | (14.0 | ) | (4.8 | ) | (1.9 | ) | 0.8 | ||||||||
Adjusted income from continuing operations, before tax (non-GAAP) | $ | 9.3 | $ | 4.9 | $ | 27.3 | $ | 10.0 | |||||||
Net income attributable to INTL FCStone Inc. common stockholders, as stated above | $ | 15.4 | $ | 7.4 | $ | 19.4 | $ | 3.2 | |||||||
Marked-to-market adjustment (non-GAAP) | (14.0 | ) | (4.8 | ) | (1.9 | ) | 0.8 | ||||||||
Tax effect at blended rate of 37.5% | 5.2 | 1.8 | 0.7 | (0.3 | ) | ||||||||||
Adjusted net income attributable to INTL FCStone Inc. common stockholders (non-GAAP) | $ | 6.6 | $ | 4.4 | $ | 18.2 | $ | 3.7 | |||||||
Stockholders’ equity, as stated above | $ | 270.8 | $ | 244.2 | |||||||||||
Cumulative marked-to-market adjustment (non-GAAP) | 15.1 | 11.8 | |||||||||||||
Tax effect at blended rate of 37.5% | (5.7 | ) | (4.4 | ) | |||||||||||
Adjusted stockholders’ equity (non-GAAP) | $ | 280.2 | $ | 251.6 | |||||||||||
Adjusted operating revenues, adjusted net income and adjusted stockholders’ equity are financial measures that are not recognized by U.S. GAAP, and should not be considered as alternatives to operating revenues, net income or stockholders’ equity calculated under U.S. GAAP or as an alternative to any other measures of performance derived in accordance with U.S. GAAP. The Company has included these non-GAAP financial measures because it believes that they permit investors to make more meaningful comparisons of performance between the periods presented. In addition, these non-GAAP measures are used by management in evaluating the Company’s performance.
Results of Operations
Set forth below is the Company’s discussion of the results of its operations, as viewed by management, for the three and six months ended March 31, 2011 and 2010, respectively. The quarters will be referred to in this discussion as “Q2 2011” and “Q2 2010”, and the six month periods as "YTD 2011" and "YTD 2010". This discussion refers to both U.S. GAAP results and adjusted marked-to-market information, in accordance with the information presented above under the heading ‘Adjusted Non-GAAP Financial Information’. For the Foreign Exchange, Securities, Clearing and Execution Services and Other segments, there are no differences between the U.S. GAAP results and the adjusted marked-to-market results. Only the Commodity and Risk Management Services segment has differences between the U.S. GAAP results and the adjusted marked-to-market results. This means that there are differences between the U.S. GAAP basis and the non-GAAP basis numbers for total operating revenues, total contribution and net income. Please note that any term below that contains the word ‘adjusted’ refers to non-GAAP, marked-to-market information.
The discussion below relates only to continuing operations. All revenues and expenses relating to discontinued operations have been removed from disclosures of total revenues and expenses in all periods and are reflected in a net discontinued operations number.
34
Financial Overview (Unaudited)
Three Months Ended March 31, | Six Months Ended March 31, | ||||||||||||||||||||
(in millions) | 2011 | % Change | 2010 | 2011 | % Change | 2010 | |||||||||||||||
Operating revenues | $ | 113.0 | 73 | % | $ | 65.3 | $ | 209.7 | 68 | % | $ | 124.9 | |||||||||
Marked-to-market adjustment (non-GAAP) | (14.0 | ) | 192 | % | (4.8 | ) | (1.9 | ) | n/m | 0.8 | |||||||||||
Adjusted operating revenues (non-GAAP) | 99.0 | 64 | % | 60.5 | 207.8 | 65 | % | 125.7 | |||||||||||||
Interest expense | 3.3 | 43 | % | 2.3 | 7.1 | 48 | % | 4.8 | |||||||||||||
Adjusted net revenues (non-GAAP) | 95.7 | 64 | % | 58.2 | 200.7 | 66 | % | 120.9 | |||||||||||||
Non-interest expenses | 86.4 | 62 | % | 53.3 | 173.4 | 56 | % | 110.9 | |||||||||||||
Adjusted income from operations, before tax (non-GAAP) | $ | 9.3 | 90 | % | $ | 4.9 | $ | 27.3 | 173 | % | $ | 10.0 | |||||||||
Reconciliation of net revenues from GAAP to adjusted, non-GAAP numbers: | |||||||||||||||||||||
Net revenues | $ | 109.7 | $ | 63.0 | $ | 202.6 | $ | 120.1 | |||||||||||||
Marked-to-market adjustment (non-GAAP) | (14.0 | ) | (4.8 | ) | (1.9 | ) | 0.8 | ||||||||||||||
Adjusted net revenues (non-GAAP) | $ | 95.7 | $ | 58.2 | $ | 200.7 | $ | 120.9 | |||||||||||||
Reconciliation of income from operations, before tax from GAAP to adjusted, non-GAAP numbers: | |||||||||||||||||||||
Income before income tax and minority interest | $ | 23.3 | $ | 9.7 | $ | 29.2 | $ | 9.2 | |||||||||||||
Marked-to-market adjustment (non-GAAP) | (14.0 | ) | (4.8 | ) | (1.9 | ) | 0.8 | ||||||||||||||
Adjusted income from operations, before tax (non-GAAP) | $ | 9.3 | $ | 4.9 | $ | 27.3 | $ | 10.0 | |||||||||||||
Q2 2011 Operating Revenues vs. Q2 2010 Operating Revenues
The Company’s operating revenues under U.S. GAAP for Q2 2011 and Q2 2010 were $113 million and $65.3 million respectively. This 73% increase in operating revenue was primarily driven by a 107% increase in the operating revenues in the C&RM segment. In addition, there were increases in operating revenues of 19% in the Foreign Exchange segment, 96% in the Securities segment, 27% in the CES segment and 41% in the Other segment over the prior year quarter.
Operating revenues increased significantly in the C&RM segment in Q2 2011, due to increases in (i) exchange traded and OTC volumes of 46% and 143%, respectively over the prior year period, with exchange traded growth driven by agricultural commodity volatility and the acquisitions of RMI and Hencorp Futures while the increase in OTC volumes primarily resulted from our grain, sugar, and cotton product lines, particularly in Brazil, (ii) an increase in structured OTC transactions following the acquisition of the Hanley Companies at the beginning of the fourth quarter of fiscal 2010,(iii) an increase in volumes traded in our precious metals product line, primarily in Singapore and Dubai, and (iv) widening spreads in our base metals product line.
Operating revenues in the Foreign Exchange segment in Q2 2011 increased as a result of higher volumes in global payments business and increase arbitrage opportunities in our cash versus exchange traded foreign exchange arbitrage desk driven by market volatility. Operating revenues in the Securities segment in Q2 2011 benefited from an increase in demand from retail investors in our international equities market-making business as the overall equities markets recovered as well as revenues generated in the debt capital markets following the acquisition of Provident in Q1 2011. Operating revenues in the CES segment in Q2 2011 rose slightly over the prior year period as a result of increasing volumes, however, operating revenues in this segment continue to be constrained by low short term interest rates. See the segmental analysis below for additional information on activity in each of the segments.
The Company’s adjusted operating revenues were $99.0 million in Q2 2011, compared with $60.5 million in Q2 2010, an increase of $38.5 million, or 64%. The only difference between operating revenues and adjusted operating revenues, a non-GAAP measure, is the gross mark-to-market adjustment of $(14.0) million and $(4.8) million for Q2 2011 and Q2 2010, respectively. The gross marked-to-market adjustment only affects the adjusted operating revenues in the C&RM segment. Adjusted operating revenues are identical to operating revenues in all other segments.
35
YTD 2011 Operating Revenues vs. YTD 2010 Operating Revenues
The Company’s operating revenues under U.S. GAAP for YTD 2011 and YTD 2010 were $209.7 million and $124.9 million, respectively. This 68% increase in operating revenue was primarily driven by a 117% increase in the operating revenues in the C&RM segment. In addition, there were increases in operating revenues of 15% in the Foreign Exchange segment, 70% in the Securities segment, 16% in the CES segment and 34% in the Other segment over the prior year period.
Operating revenues increased significantly in the C&RM segment in YTD 2011, due to increases in exchange traded and OTC volumes of 36% and 153%, respectively over the prior year period, driven by an increase in volatility in agricultural commodities and as well as an expanded customer base as a result of recent acquisitions and geographic expansion. In addition, our precious metals product line revenues increased with greater trading activity while base metal product line revenues expanded with widening spreads driven by market volatility. Operating revenues in the Foreign Exchange segment in YTD 2011 increased as a result of higher volumes in the global payments business, while commercial hedging and speculative customer revenues were relatively flat with the prior year period. The operating revenues increased on our cash versus exchange traded foreign exchange arbitrage desk. Operating revenues in the Securities segment in YTD 2011 benefited from an increase in demand from retail investors in our international equities market-making business as the overall equities markets recovered as well as the acquisition of the Provident Group which increased revenues in the debt capital markets. Operating revenues in the CES segment in YTD 2011 rose slightly over the prior year period as market volatility resulted in higher exchange traded volumes. However, operating revenues in this segment continue to be constrained by low short term interest rates. See the segmental analysis below for additional information on activity in each of the segments.
The Company’s adjusted operating revenues were $207.8 million in YTD 2011, compared with $125.7 million in YTD 2010, an increase of $82.1 million, or 65%. The only difference between operating revenues and adjusted operating revenues, a non-GAAP measure, is the gross mark-to-market adjustment of $(1.9) million and $0.8 million for YTD 2011 and YTD 2010, respectively. The gross marked-to-market adjustment only affects the adjusted operating revenues in the C&RM segment. Adjusted operating revenues are identical to operating revenues in all other segments.
Q2 2011 Interest expense vs. Q2 2010 Interest expense
Interest expense: Interest expense increased from $2.3 million for Q2 2010 to $3.3 million for Q2 2011. This increase in interest expense was primarily attributable to increases in committed line of credit fees on renewed and expanded credit facilities in the fourth quarter of 2010 and first quarter of 2011 as well as an increase in the overall average borrowings during Q2 2011 as compared to the prior year period. In mid-2008 the Company entered into two three-year interest rate swaps for a total of $100 million. These were designated as cash flow hedges. The Company had previously discontinued hedge accounting for one of the swaps. As a result of a decrease in projected levels of borrowings, the Company has discontinued hedge accounting for the remaining swap at the end of Q2 2011 which resulted in reclassifying a portion of the deferred loss to earnings during the period. See Note 7 to the condensed consolidated financial statements for further information. The effective portion of the change in cash flows from the interest rate swap during Q2 2011 had the effect of increasing the Company’s reported interest expense by $0.5 million.
YTD 2011 Interest expense vs. YTD 2010 Interest expense
Interest expense: Interest expense increased from $4.8 million for YTD 2010 to $7.1 million for YTD 2011. This increase in interest expense was primarily driven by increases in committed line of credit fees on renewed and expanded credit facilities in the fourth quarter of 2010 and first quarter of 2011 as well as an increase in the commodity financing business during YTD 2011. In mid-2008 the Company entered into two three-year interest rate swaps for a total of $100 million. These were designated as cash flow hedges. The Company had previously discontinued hedge accounting for one of the swaps. The remaining swap was discontinued at the end of the current quarter, which resulted in reclassifying a portion of the deferred loss to earnings during the period. See Note 7 to the condensed consolidated financial statements for further information. The effective portion of the change in cash flows from the interest rate swap during YTD 2011 had the effect of increasing the Company’s reported interest expense by $1.0 million.
36
Non-interest expenses
The following table shows a summary of our non-interest expenses.
Three Months Ended March 31, | Six Months Ended March 31, | ||||||||||||||||||||
(in millions) | 2011 | % Change | 2010 | 2011 | % Change | 2010 | |||||||||||||||
NON-INTEREST EXPENSES | |||||||||||||||||||||
Compensation and benefits | $ | 43.1 | 87 | % | $ | 23.0 | $ | 85.6 | 82 | % | $ | 47.1 | |||||||||
Clearing and related expenses | 20.2 | 32 | % | 15.3 | 40.4 | 20 | % | 33.8 | |||||||||||||
Other non-interest expenses | |||||||||||||||||||||
Communication and data services | 3.4 | 26 | % | 2.7 | 6.9 | 30 | % | 5.3 | |||||||||||||
Introducing broker commissions | 6.0 | 28 | % | 4.7 | 11.4 | 28 | % | 8.9 | |||||||||||||
Occupancy and equipment rental | 2.2 | 57 | % | 1.4 | 4.0 | 33 | % | 3.0 | |||||||||||||
Professional fees | 1.9 | — | % | 1.9 | 4.0 | 8 | % | 3.7 | |||||||||||||
Depreciation and amortization | 1.1 | 450 | % | 0.2 | 2.1 | 425 | % | 0.4 | |||||||||||||
Bad debts and impairments | 2.1 | (625 | )% | (0.4 | ) | 4.5 | 2,150 | % | 0.2 | ||||||||||||
Other expense | 6.4 | 42 | % | 4.5 | 14.5 | 71 | % | 8.5 | |||||||||||||
23.1 | 54 | % | 15.0 | 47.4 | 58 | % | 30.0 | ||||||||||||||
Total non-interest expenses | $ | 86.4 | 62 | % | $ | 53.3 | $ | 173.4 | 56 | % | $ | 110.9 | |||||||||
Q2 2011 Non-Interest Expenses vs. Q2 2010 Non-Interest Expenses
Total Non-Interest Expenses: Non-interest expenses increased by 62% from $53.3 million in Q2 2010 to $86.4 million in Q2 2011.
Compensation and Benefits: Compensation and benefits expense increased by 87% from 23.0 million to $43.1 million, and represented 50% and 43% of total non-interest expenses in Q2 2011 and Q2 2010, respectively. Total compensation and benefits were 38% of operating revenues and 44% of adjusted operating revenues in Q2 2011, respectively, compared to 35% and 38% in Q2 2010, respectively. The variable portion of compensation and benefits increased by 118% from $9.9 million in Q2 2010 to $21.4 million in Q2 2011, mainly as a result of the 73% increase in operating revenues and 64% increase in adjusted operating revenues, as compared to the prior year. The fixed portion of compensation and benefits increased 66% from $13.1 million to $21.7 million. The number of employees increased from 773 at the beginning of Q2 2011 to 836 at the end of Q2 2011, compared with 630 employees at the end of Q2 2010, primarily as a result of the acquisitions of the RMI Companies, the Hanley Companies, Provident Group and Hencorp Futures.
Clearing and Related Expenses: Clearing and related expenses increased by 32% from $15.3 million in Q2 2010 to $20.2 million in Q2 2011. This increase was primarily due to a 12% increase in exchange traded customer volume as well as increased trading volumes in the C&RM segment following the acquisition of the Hanley Companies in the fourth quarter of fiscal year 2010.
Other Non-Interest Expenses: Other non-interest expenses increased by 54% from $15.0 million in Q2 2010 to $23.1 million in Q2 2011. Introducing broker commissions increased $1.3 million over the prior year period primarily related to an increase in exchange traded volumes in the C&RM and CES segments. As a result of the acquisitions of the RMI Companies, Hanley Companies, Provident Group and Hencorp Futures and the relocation of office space, communications and data services and occupancy and equipment rental increased $0.7 million and $0.8 million, respectively. Depreciation and amortization increased $0.9 million in Q2 2011, primarily due to the $0.6 million increase in amortization of identifiable intangible assets from the acquisitions made in fiscal 2010.
Other non-interest expenses include bad debt expense, net of recoveries, and impairments of $2.1 million. During Q2, the Company recorded a loss of $1.7 million related to the fair value adjustment of its investment in debentures for the single asset owning company of Suriwongse Hotel located in Chiang Mai, Thailand, originally issued in August 2008, as more fully described in Note 6 - Assets and Liabilities, at Fair Value to the condensed consolidated financial statements. Also, during Q2 2011, the Company recorded charges to bad debt expense of $0.3 million, primarily related to a clearing customer in the CES segment.
Additionally, within ‘Other expense’, the Company recorded $0.5 million in expense during Q2 2011 related to the revaluation of contingent liabilities related to potential additional consideration to be paid for the acquisitions of the RMI Companies, Hanley Companies and Hencorp Futures.
37
Provision for Taxes: The effective income tax rate on a U.S. GAAP basis was 34% in Q2 2011, compared with 36% in Q2 2010. The effective income tax rate can vary from period to period depending on, among other factors, the geographic and business mix of our earnings.
Non-controlling Interest: This represents the non-controlling interests in the Blackthorn Multi-Advisor Fund, LP, a majority interest acquired with the Hanley Companies.
Loss (Income) from Discontinued Operations: In May 2010, the Company sold its interest in INTL Capital Limited to an independent third party for a purchase price equal to book value. The subsidiary operated an asset management business in Dubai. Additionally, during 2010, the Company discontinued the operations of Agora-X, LLC, as it was determined that its carrying value would no longer be recoverable and was in fact impaired. The results of operations for INTL Capital and Agora-X were previously included within the Other segment, and are presented within discontinued operations on the consolidated income statements. The Company recognized an aggregate loss on discontinued operations of $1.5 million, net of taxes, for Q2 2010.
YTD 2011 Non-Interest Expenses vs. YTD 2010 Non-Interest Expenses
Total Non-Interest Expenses: Non-interest expenses increased by 56% from $110.9 million in YTD 2010 to $173.4 million in YTD 2011.
Compensation and Benefits: Compensation and benefits expense increased by 82% from $47.1 million to $85.6 million, and represented 49% and 42% of total non-interest expenses in YTD 2011 and YTD 2010, respectively. Total compensation and benefits were 41% of operating revenues and adjusted operating revenues in YTD 2011, respectively, compared to 38% and 37% in YTD 2010, respectively. The variable portion of compensation and benefits increased by 107% from $21.1 million in YTD 2010 to $43.4 million in YTD 2011, mainly as a result of the 68% increase in operating revenues as compared to the prior year. The fixed portion of compensation and benefits increased 62% from $26.0 million to $42.2 million. The number of employees increased from 729 at the beginning of fiscal year 2011 to 836 at the end of Q2 2011, compared with 630 employees at the end of Q2 2010, primarily as a result of the acquisitions of the RMI Companies, the Hanley Companies, Provident Group (“Provident”) and Hencorp Futures.
Clearing and Related Expenses: Clearing and related expenses increased by 20% from $33.8 million in YTD 2010 to $40.4 million in YTD 2011. This increase was primarily due to a 10% increase in exchange traded customer volume as well as increased trading volumes in the C&RM segment following the acquisition of the Hanley Companies in the fourth quarter of fiscal year 2010.
Other Non-Interest Expenses: Other non-interest expenses increased by 58% from $30.0 million in YTD 2010 to $47.4 million in YTD 2011. Introducing broker commissions increased $2.5 million over the prior year period primarily related to an increase in exchange traded volumes in the C&RM and CES segments. As a result of the acquisitions of the RMI Companies, Hanley Companies, Provident Group and Hencorp Futures and the relocation of office space, communications and data services and occupancy and equipment rental increased $1.6 million and $1.0 million, respectively. Depreciation and amortization increased $1.7 million, primarily due to the $1.1 million increase in the amortization of identifiable intangible assets from the acquisitions made in fiscal 2010.
Other non-interest expenses include bad debt expense, net of recoveries, and impairments of $4.5 million. During YTD 2011, the Company recorded a loss of $1.7 million related to the fair value adjustment of its investment in debentures for the single asset owning company of Suriwongse Hotel located in Chiang Mai, Thailand, originally issued in August 2008, as more fully described in Note 6 - Assets and Liabilities, at Fair Value to the condensed consolidated financial statements. Additionally, during YTD 2011, the Company recorded charges to bad debt expense of $4.5 million, primarily related to a customer to whom the Company had consigned gold and a clearing customer in the CES segment. During YTD 2011, the Company recorded recoveries from bad debts of $1.9 million, including a recovery of $1.3 million following a settlement relating to a disputed trade that was “given-up” to FCStone in Q3 2010.
Additionally, within ‘Other expense’, the Company recorded $1.9 million in expense during YTD 2011 related to the revaluation of contingent liabilities related to potential additional consideration to be paid for the acquisitions of the RMI Companies, Hanley Companies and Hencorp Futures. The Company also accrued additional contingent consideration during YTD 2011 related to the acquisitions of Downes & O’Neill and Globecot in the amount of $1.6 million, which is included within ‘Other expense’.
Provision for Taxes: The effective income tax rate on a U.S. GAAP basis was 35%, in YTD 2011, compared with 36% in YTD 2010. The effective income tax rate can vary from period to period depending on, among other factors, the geographic and business mix of our earnings.
38
Non-controlling Interest: This represents the non-controlling interests in the Blackthorn Multi-Advisor Fund, LP, a majority interest acquired with the Hanley Companies.
Loss (Income) from Discontinued Operations: In May 2010, the Company sold its interest in INTL Capital Limited to an independent third party for a purchase price equal to book value. The subsidiary operated an asset management business in Dubai. Additionally, during 2010, the Company discontinued the operations of Agora-X, LLC, as it was determined that its carrying value would no longer be recoverable and was in fact impaired. The results of operations for INTL Capital and Agora-X were previously included within the Other segment, and are presented within discontinued operations on the consolidated income statements. The Company recognized an aggregate gain of $0.2 million from discontinued operations, net of taxes for YTD 2011 and an aggregate loss on discontinued operations of $0.8 million, net of taxes, for YTD 2010.
Variable vs. Fixed Expenses
Three Months Ended March 31, | Six Months Ended March 31, | ||||||||||||||||||||||||||
(in millions) | 2011 | % of Total | 2010 | % of Total | 2011 | % of Total | 2010 | % of Total | |||||||||||||||||||
VARIABLE vs. FIXED EXPENSES | |||||||||||||||||||||||||||
Variable clearing and related expenses | $ | 19.5 | 22 | % | $ | 15.1 | 28 | % | $ | 39.1 | 22 | % | $ | 33.2 | 30 | % | |||||||||||
Variable compensation | 21.4 | 25 | % | 9.9 | 19 | % | 43.4 | 25 | % | 21.1 | 19 | % | |||||||||||||||
Introducing broker commissions | 5.9 | 7 | % | 4.7 | 9 | % | 11.3 | 7 | % | 8.9 | 8 | % | |||||||||||||||
Total variable expenses | 46.8 | 54 | % | 29.7 | 56 | % | 93.8 | 54 | % | 63.2 | 57 | % | |||||||||||||||
Fixed expenses | 37.5 | 44 | % | 24.0 | 45 | % | 75.1 | 43 | % | 47.5 | 43 | % | |||||||||||||||
Bad debts and impairments | 2.1 | 2 | % | (0.4 | ) | (1 | )% | 4.5 | 3 | % | 0.2 | — | % | ||||||||||||||
Total non-variable expenses | 39.6 | 46 | % | 23.6 | 44 | % | 79.6 | 46 | % | 47.7 | 43 | % | |||||||||||||||
Total non-interest expenses | $ | 86.4 | 100 | % | $ | 53.3 | 100 | % | $ | 173.4 | 100 | % | $ | 110.9 | 100 | % | |||||||||||
The Company aims to make its non-interest expenses variable to the greatest extent possible, and to keep its fixed costs as low as possible. The table above shows an analysis of the Company’s total non-interest expenses for the three and six months ended March 31, 2011 and 2010, respectively. Variable expenses consist of clearing and related expenses, variable compensation paid to traders, bonuses paid to operational employees and introducing broker commissions. As a percentage of total non-interest expenses, variable expenses decreased from 56% in Q2 2010 to 54% in Q2 2011. As a percentage of total non-interest expenses, variable expenses decreased from 57% in YTD 2010 to 54% in YTD 2011.
Segment Information
The following table shows information concerning the Company’s principal business segments.
Three Months Ended December 31, | Six Months Ended December 31, | ||||||||||||||||||||
(in millions) | 2011 | % Change | 2010 | 2011 | % Change | 2010 | |||||||||||||||
SEGMENTAL RESULTS | |||||||||||||||||||||
Commodity and Risk Management Services (C&RM) | |||||||||||||||||||||
Operating revenues | $ | 69.5 | 107 | % | $ | 33.6 | $ | 123.6 | 117 | % | $ | 56.9 | |||||||||
Gross marked-to-market adjustment (non-GAAP) | (14.0 | ) | 192 | % | (4.8 | ) | (1.9 | ) | n/m | 0.8 | |||||||||||
Adjusted operating revenues (non-GAAP) | 55.5 | 93 | % | 28.8 | 121.7 | 111 | % | 57.7 | |||||||||||||
Interest expense | 2.2 | 57 | % | 1.4 | 4.2 | 75 | % | 2.4 | |||||||||||||
Variable direct expenses | 23.3 | 112 | % | 11.0 | 47.7 | 107 | % | 23.0 | |||||||||||||
Adjusted net contribution (non-GAAP) | 30.0 | 83 | % | 16.4 | 69.8 | 116 | % | 32.3 | |||||||||||||
Non-variable direct expenses | 12.4 | 63 | % | 7.6 | 26.1 | 85 | % | 14.1 | |||||||||||||
Adjusted segment income (non-GAAP) | 17.6 | 100 | % | 8.8 | 43.7 | 140 | % | 18.2 | |||||||||||||
Foreign Exchange | |||||||||||||||||||||
Operating revenues | $ | 13.0 | 19 | % | $ | 10.9 | $ | 27.5 | 15 | % | $ | 24.0 | |||||||||
39
Interest expense | 0.3 | 50 | % | 0.2 | 0.6 | 100 | % | 0.3 | |||||||||||||
Variable direct expenses | 4.7 | 15 | % | 4.1 | 9.8 | 4 | % | 9.4 | |||||||||||||
Net contribution | 8.0 | 21 | % | 6.6 | 17.1 | 20 | % | 14.3 | |||||||||||||
Non-variable direct expenses | 1.8 | 13 | % | 1.6 | 3.8 | 23 | % | 3.1 | |||||||||||||
Segment income | 6.2 | 24 | % | 5.0 | 13.3 | 19 | % | 11.2 | |||||||||||||
Securities | |||||||||||||||||||||
Operating revenues | $ | 9.8 | 96 | % | $ | 5.0 | $ | 17.7 | 70 | % | $ | 10.4 | |||||||||
Interest expense | 0.1 | — | % | 0.1 | 0.2 | — | % | 0.2 | |||||||||||||
Variable direct expenses | 4.9 | 172 | % | 1.8 | 8.3 | 84 | % | 4.5 | |||||||||||||
Net contribution | 4.8 | 55 | % | 3.1 | 9.2 | 61 | % | 5.7 | |||||||||||||
Non-variable direct expenses | 5.0 | 233 | % | 1.5 | 7.8 | 179 | % | 2.8 | |||||||||||||
Segment (loss) income | (0.2 | ) | n/m | 1.6 | 1.4 | (52 | )% | 2.9 | |||||||||||||
Clearing & Execution Services (CES) | |||||||||||||||||||||
Operating revenues | $ | 18.3 | 27 | % | $ | 14.4 | $ | 35.4 | 16 | % | $ | 30.5 | |||||||||
Interest expense | 0.1 | (75 | )% | 0.4 | 0.5 | (55 | )% | 1.1 | |||||||||||||
Variable direct expenses | 13.4 | 8 | % | 12.4 | 26.9 | 5 | % | 25.6 | |||||||||||||
Net contribution | 4.8 | 200 | % | 1.6 | 8.0 | 111 | % | 3.8 | |||||||||||||
Non-variable direct expenses | 2.7 | 80 | % | 1.5 | 3.7 | 32 | % | 2.8 | |||||||||||||
Segment income | 2.1 | n/m | 0.1 | 4.3 | 330 | % | 1.0 | ||||||||||||||
Other | |||||||||||||||||||||
Operating revenues | $ | 3.1 | 41 | % | $ | 2.2 | $ | 5.9 | 34 | % | $ | 4.4 | |||||||||
Interest expense | 0.4 | n/m | (0.1 | ) | 0.8 | n/m | — | ||||||||||||||
Variable direct expenses | 0.6 | 50 | % | 0.4 | 1.2 | 50 | % | 0.8 | |||||||||||||
Net contribution | 2.1 | 11 | % | 1.9 | 3.9 | 8 | % | 3.6 | |||||||||||||
Non-variable direct expenses | 0.9 | 13 | % | 0.8 | 1.9 | 27 | % | 1.5 | |||||||||||||
Segment income | 1.2 | 9 | % | 1.1 | 2.0 | (5 | )% | 2.1 | |||||||||||||
Total Segmental Results | |||||||||||||||||||||
Operating revenues | $ | 113.7 | 72 | % | $ | 66.1 | $ | 210.1 | 66 | % | $ | 126.2 | |||||||||
Gross marked-to-market adjustment (non-GAAP) | (14.0 | ) | 192 | % | (4.8 | ) | (1.9 | ) | n/m | 0.8 | |||||||||||
Adjusted operating revenues (non-GAAP) | 99.7 | 63 | % | 61.3 | 208.2 | 64 | % | 127.0 | |||||||||||||
Interest expense | 3.1 | 55 | % | 2.0 | 6.3 | 58 | % | 4.0 | |||||||||||||
Variable direct expenses | 46.9 | 58 | % | 29.7 | 93.9 | 48 | % | 63.3 | |||||||||||||
Adjusted net contribution (non-GAAP) | 49.7 | 68 | % | 29.6 | 108.0 | 81 | % | 59.7 | |||||||||||||
Non-variable direct expenses | 22.8 | 75 | % | 13.0 | 43.3 | 78 | % | 24.3 | |||||||||||||
Adjusted net segment income (non-GAAP) | $ | 26.9 | 62 | % | $ | 16.6 | $ | 64.7 | 83 | % | $ | 35.4 | |||||||||
Reconciliation of C&RM net contribution from GAAP to adjusted, non-GAAP numbers: | |||||||||||||||||||||
Total C&RM net contribution | $ | 44.0 | $ | 21.2 | $ | 71.7 | $ | 31.5 | |||||||||||||
Gross marked-to-market adjustment (non-GAAP) | (14.0 | ) | (4.8 | ) | (1.9 | ) | 0.8 | ||||||||||||||
C&RM adjusted net contribution (non-GAAP) | $ | 30.0 | $ | 16.4 | $ | 69.8 | $ | 32.3 | |||||||||||||
Reconciliation of C&RM segment income from GAAP to adjusted, non-GAAP numbers: | |||||||||||||||||||||
Total C&RM segment income | $ | 31.6 | $ | 13.6 | $ | 45.6 | $ | 17.4 | |||||||||||||
Gross marked-to-market adjustment (non-GAAP) | (14.0 | ) | (4.8 | ) | (1.9 | ) | 0.8 | ||||||||||||||
C&RM adjusted segment income (non-GAAP) | $ | 17.6 | $ | 8.8 | $ | 43.7 | $ | 18.2 | |||||||||||||
Reconciliation of total operating revenues from GAAP to adjusted, non-GAAP numbers: | |||||||||||||||||||||
Total operating revenues | $ | 113.0 | $ | 65.3 | $ | 209.7 | $ | 124.9 | |||||||||||||
40
Gross marked-to-market adjustment (non-GAAP) | (14.0 | ) | (4.8 | ) | (1.9 | ) | 0.8 | ||||||||||||||
Operating revenue not assigned to a segment | 0.7 | 0.8 | 0.4 | 1.3 | |||||||||||||||||
Adjusted segment operating revenues (non-GAAP) | $ | 99.7 | $ | 61.3 | $ | 208.2 | $ | 127.0 | |||||||||||||
Reconciliation of net contribution from GAAP to adjusted, non-GAAP numbers: | |||||||||||||||||||||
Total net contribution | $ | 63.7 | $ | 34.4 | $ | 109.9 | $ | 58.9 | |||||||||||||
Gross marked-to-market adjustment (non-GAAP) | (14.0 | ) | (4.8 | ) | (1.9 | ) | 0.8 | ||||||||||||||
Adjusted net contribution (non-GAAP) | $ | 49.7 | $ | 29.6 | $ | 108.0 | $ | 59.7 | |||||||||||||
Reconciliation of segment income from GAAP to adjusted, non-GAAP numbers: | |||||||||||||||||||||
Total net segment income | $ | 40.9 | $ | 21.4 | $ | 66.6 | $ | 34.6 | |||||||||||||
Gross marked-to-market adjustment (non-GAAP) | (14.0 | ) | (4.8 | ) | (1.9 | ) | 0.8 | ||||||||||||||
Adjusted net segment income (non-GAAP) | $ | 26.9 | $ | 16.6 | $ | 64.7 | $ | 35.4 | |||||||||||||
Q2 2011 vs. Q2 2010 Segmental Analysis
The net contribution of all the Company’s business segments increased 85% to $63.7 million in Q2 2011 as compared to 34.4 million in Q2 2010. The adjusted net contribution of all the Company’s business segments increased 67% to $49.7 million in Q2 2011 as compared with $29.6 million in Q2 2010.
Net contribution is one of the key measures used by management to assess the performance of each segment and for decisions regarding the allocation of the Company’s resources. Net contribution is calculated as revenue less direct cost of sales, interest expense, clearing and related expenses, introducing broker commissions and variable compensation. Variable compensation paid to traders represents a fixed percentage of an amount equal to revenues produced less clearing and related charges, base salaries and an overhead allocation.
Total segment income was $40.9 million in Q2 2011, compared with $21.4 million in Q2 2010. Total adjusted segment income was $26.9 million in Q2 2011, compared with $16.6 million in Q2 2010.
Segment income is calculated as net contribution less certain non-variable direct expenses of the segment. These non-variable direct expenses include trader base compensation and benefits, operational employee compensation and benefits, communication and data services, travel, professional fees and bad debt expense.
Commodity and Risk Management Services – Operating revenues under U.S. GAAP increased from $33.6 million in Q2 2010 to $69.5 million in Q2 2011. Adjusted operating revenues increased by 93% from $28.8 million in Q2 2010 to $55.5 million in Q2 2011. Operating revenues within this segment are primarily driven by the soft commodities, precious metals and base metals product lines.
Within the soft commodities, exchange traded and OTC volumes increased 46% and 143%, respectively over the year ago period, which includes primarily agricultural and energy commodities. An increase in underlying volatility in agricultural commodities caused by the effect of increasing worldwide demand, particularly in corn, wheat, dairy products and cotton, as well as traction gained in the Company's Australian operations, and renewed activity from Chinese customers were the main components of the increase in exchange traded volumes. In addition, exchange traded and consulting revenues increased in the natural gas markets following the acquisition of the RMI Companies in Q3 2010 and in the coffee markets following the acquisition of Hencorp Futures at the beginning of Q1 2011. OTC volumes and revenues increased over the year ago period, most notable in Brazil as economic conditions have improved and the commodities traded by the Company expand from soybeans and sugar to include corn and cotton. The acquisition of the Hanley Companies in Q4 2010 led to an increased offering of structured OTC products to our commercial customers, contributing to the significant increase in operating revenues in Q2 2011. Interest income more than doubled over the prior year period as the absolute level of customer deposits increased significantly in both the exchange traded and OTC customer base. However, interest income remains a modest contributor to operating revenues given the historically low level of short term interest rates.
Precious metals operating revenues decreased from $3.3 million in Q2 2010 to $3.0 million in Q2 2011, primarily due to rising gold prices. Precious metals adjusted operating revenues increased from $4.0 million in Q2 2010 to $4.7 million in Q2 2011. This increase was primarily a result of an increase in the number of ounces traded as compared to the prior year period as business activity increased globally, particularly in the Singapore and Dubai markets, partially offset by a narrowing of spreads.
41
Base metals operating revenues increased from $8.7 million in Q2 2010 to $20.8 million in Q2 2011. Base metals adjusted operating revenues increased from $3.1 million in Q2 2010 to $5.0 million in Q2 2011. These increases were driven by widening spreads resulting from price volatility on relatively flat volumes.
Segment income increased from $13.6 million in Q2 2010 to $31.6 million in Q2 2011. Adjusted segment income increased from $8.8 million to $17.6 million.
Foreign exchange trading – Operating revenues increased by 19% from $10.9 million in Q2 2010 to $13.0 million in Q2 2011. The operating revenues in the Company’s global payments business increased as volumes increased significantly from the prior year period as global economic conditions have improved and the Company experienced continued growth in the number of financial institutions utilizing the Company's treasury services.
In the first quarter of 2011, both commercial hedging and customer speculative foreign exchange business increased over the prior year period. The proprietary foreign exchange arbitrage desk experienced an increase in the level of arbitrage opportunities in the cash versus futures markets as market volumes increased over the prior year period.
Segment income increased 24% from $5.0 million in Q2 2011 to $6.2 million in Q2 2011. Variable expenses expressed as a percentage of operating revenues decreased from 38% to 36%, primarily as a result of lower revenues on the proprietary foreign exchange arbitrage desk.
Securities – Operating revenues increased by 96% from $5.0 million in Q2 2010 to $9.8 million in Q2 2011.Operating revenues in the equities market-making business increased $1.4 million over the prior year period to $5.4 million in Q2 2011. These revenues are largely dependent on overall market volume and volatility, and with the increased levels of activity in the global equity markets, the retail customer business which drives the Company’s equity market making activities has increased. Equity market-making operating revenues include the trading profits earned by the Company before the related expense deduction for ADR conversion fees. These ADR fees are included in the condensed consolidated income statements as clearing and related expenses.
The debt capital markets business increased $3.3 million over the prior year period to $4.4 million, primarily driven by the acquisition of the Provident Group in Q1 2011. This business focuses on a wide range of services including the arranging and placing of debt issues, merger and acquisition advisory services and asset backed securitization as well as debt trading in the international markets.
The Company recorded a loss of $1.7 million for the three months ended March 31, 2011 related to the fair value adjustment of its investment in debentures for the single asset owning company of Suriwongse Hotel located in Chiang Mai, Thailand, originally issued in August 2008. Renovations to be financed by the debentures have been delayed and are currently expected to be completed by February 2012. The hotel owner defaulted on the interest payment that was due in March 2011, and the Company and other debenture holders are currently in restructuring discussions with the hotel owner as a result of the renovation delays. See Note 6 - Assets and Liabilities, at Fair Value to the condensed consolidated financial statements.
Segment income decreased from $1.6 million in Q2 2010 to a loss of $0.2 million in Q2 2011. Variable expenses expressed as a percentage of operating revenues increased from 36% to 50%, primarily related to variable compensation in the debt capital markets business.
Clearing and execution services – Operating revenues in the segment were $18.3 million for Q2 2011 as compared to $14.4 million for Q2 2010. Operating revenues are primarily generated from two sources: commission and clearing fee revenues from the execution and clearing of exchange-traded futures and options contracts, and interest income derived from cash balances in our customers’ accounts.
Commission and clearing fee revenues increased primarily as a result of a 8% increase in exchange traded volumes driven by an increase in overall market volatility. Q2 2010 operating revenues included a trading loss of $1.9 million related to open commodity positions acquired from an under-margined customer. Interest income declined slightly as higher average customer balances were more than offset by a decline in short term interest rates in this segment.
Segment income increased $2.0 million from $0.1 million in Q2 2010 to $2.1 million in Q2 2011. Variable expenses as a percentage of operating revenues declined from 86% to 73% and are primarily clearing and related expenses.
Other – The Company’s asset management revenues include management and performance fees, commissions and other revenues received by the Company for management of third party assets and investment gains or losses on the Company’s investments in funds or proprietary accounts managed either by the Company’s investment managers or by independent investment managers. In addition, this segment’s revenues include interest income and fees earned in relation to commodity financing transactions as well as a limited amount of principal physical commodity sales transactions related to inputs to the renewable fuels industry.
42
Operating revenues increased 41% from $2.2 million in Q2 2010 to $3.1 million in Q2 2011. Assets under management at March 31, 2011 were approximately $370 million compared with approximately $412 million at March 31, 2010. Management fees were relatively flat with the prior year period. Operating revenues in the grain financing and physical commodity origination business increased 271% to $1.4 million in Q2 2011, with an increase in the amount of committed credit facilities driving this increase. Segment income was $1.2 million in Q2 2011 as compared to $1.1 million in Q2 2010.
YTD 2011 vs. YTD 2010 Segmental Analysis
The net contribution of all the Company’s business segments increased 87% to $109.9 million in YTD 2011 as compared to $58.9 million in YTD 2010. The adjusted net contribution of all the Company’s business segments increased 80% to $108.0 million in YTD 2011 as compared with $59.7 million in YTD 2010.
Net contribution is one of the key measures used by management to assess the performance of each segment and for decisions regarding the allocation of the Company’s resources. Net contribution is calculated as revenue less direct cost of sales, interest expense, clearing and related expenses, introducing broker commissions and variable compensation. Variable compensation paid to traders represents a fixed percentage of an amount equal to revenues produced less clearing and related charges, base salaries and an overhead allocation.
Total segment income was $66.6 million in YTD 2011, compared with $34.6 million in YTD 2010. Total adjusted segment income was $64.7 million in YTD 2011, compared with $35.4 million in YTD 2010.
Segment income is calculated as net contribution less certain non-variable direct expenses of the segment. These non-variable direct expenses include trader base compensation and benefits, operational employee compensation and benefits, communication and data services, travel, professional fees and bad debt expense.
Commodity and Risk Management Services – Operating revenues under U.S. GAAP increased from $56.9 million in YTD 2010 to $123.6 million in YTD 2011. Adjusted operating revenues increased by 111% from $57.7 million in YTD 2010 to $121.7 million in YTD 2011. Operating revenues within this segment are primarily driven by the soft commodities, precious metals and base metals product lines.
Within the soft commodities, exchange traded and OTC volumes increased 36% and 153%, respectively over the year ago period, which includes primarily agricultural and energy commodities. An increase in underlying volatility in agricultural commodities, the effect of rising agricultural commodity prices, and the contribution of recent acquisitions were the main drivers of the increase in exchange traded volumes. Exchange traded and consulting revenues increased as a result of the acquisition of the RMI Companies in Q3 2010 primarily in the natural gas markets and Hencorp Futures at the beginning of Q1 2011 primarily in the coffee markets. Over the counter volumes and revenues increased over the year ago period as global economic conditions have improved, particularly in the Brazilian markets where commodities traded by the Company have expanded to included corn and cotton in addition to the historical soybeans and sugar. In addition, volatile energy markets have increased the demand for the Company's OTC risk management strategies and recent acquisitions have led to a more diversified OTC customer base including the natural gas and coffee markets. Furthermore, the acquisition of the Hanley Companies in Q4 2010 has led to an increased offering of structured OTC products to our commercial customers, contributing to the significant increase in operating revenues in YTD 2011. Interest income increased 132% over the prior year period as the absolute level of customer deposits increased significantly with the increase in exchange traded and OTC volumes. However, interest income remains a modest contributor to operating revenues given the historically low level of short term interest rates.
Precious metals operating revenues increased from $5.8 million in YTD 2010 to $8.4 million in YTD 2011. Precious metals adjusted operating revenues increased from $7.5 million in YTD 2010 to $10.2 million in YTD 2011. These increases were primarily a result of significant increase in the number of ounces traded as compared to the prior year period as business activity increased globally, particularly in the Singapore and Dubai markets.
Base metals operating revenues increased from $8.6 million in YTD 2010 to $13.3 million in YTD 2011. Base metals adjusted operating revenues increased from $7.8 million in YTD 2010 to $9.7 million in YTD 2011. These increases primarily resulted from higher margins partially offset by lower trading volumes.
Segment income increased from $17.4 million in YTD 2010 to $45.6 million in YTD 2011. Adjusted segment income increased from $18.2 million to $43.7 million. Segment income in YTD 2011 was affected by a bad debt provision of $3.3 million related to a precious metals customer to whom the Company had consigned gold.
Foreign exchange trading – Operating revenues increased by 15% from $24.0 million in YTD 2010 to $27.5 million in YTD 2011. The volume of trades in the Company’s global payments business increased significantly from the prior year period as the segment continued to benefit from an increase in financial institutions and other customers, our ability to offer an electronic transaction order system to our customers and improving global economic conditions.
43
In the first quarter of 2011, the customer speculative foreign exchange business decreased slightly over prior year levels, while commercial hedging activity was flat. The proprietary foreign exchange arbitrage desk revenues increased with increased arbitrage opportunities in the cash versus futures markets as industry volumes improved.
Segment income increased 19% from $11.2 million in YTD 2011 to $13.3 million in YTD 2011. Variable expenses expressed as a percentage of operating revenues decreased from 39% to 36%, primarily as a result of lower clearing and related as well as reduced introducing broker commissions.
Securities – Operating revenues increased by 70% from $10.4 million in YTD 2010 to $17.7 million in YTD 2011. Operating revenues in the equities market-making business increased 27% from the prior year quarter to $11.1 million. Operating revenues in the debt capital markets business increased from $1.7 million in YTD 2010 to $6.7 million in YTD 2011.
Operating revenues in the equities market-making business are largely dependent on overall volume and volatility, and with the increased levels of activity in the global equity markets, the retail customer business which drives the Company’s equity market making activities has increased. Equity market-making operating revenues include the trading profits earned by the Company before the related expense deduction for ADR conversion fees. These ADR fees are included in the condensed consolidated income statements as clearing and related expenses.
The increase in the operating revenues in the debt capital markets business, was primarily driven by the acquisition of the Provident Group in Q1 2100. This business focuses on a wide range of services including the arranging and placing of debt issues, merger and acquisition advisory services and asset backed securitization as well as debt trading in the international markets.
The Company recorded a loss of $1.7 million for the six months ended March 31, 2011 related to the fair value adjustment of its investment in debentures for the single asset owning company of Suriwongse Hotel located in Chiang Mai, Thailand, originally issued in August 2008. Renovations to be financed by the debentures have been delayed and are currently expected to be completed by February 2012. The hotel owner defaulted on the interest payment that was due in March 2011, and the Company and other debenture holders are currently in restructuring discussions with the hotel owner as a result of the renovation delays. See Note 6 - Assets and Liabilities, at Fair Value to the condensed consolidated financial statements.
Segment income decreased 52%, from $2.9 million in YTD 2010 to $1.4 million in YTD 2011, primarily as a result of the fair value adjustment. Variable expenses expressed as a percentage of operating revenues increased from 43% to 47%.
Clearing and execution services – Operating revenues in the segment were $35.4 million for YTD 2011 as compared to $30.5 million for YTD 2010. Operating revenues are primarily generated from two sources: commission and clearing fee revenues from the execution and clearing of exchange-traded futures and options contracts, and interest income derived from cash balances in our customers’ accounts.
Commission and clearing fee revenues increased primarily as a result of a 6% increase in exchange traded volumes. YTD 2010 revenues included a $2.3 million trading loss related to open commodity positions acquired from an under-margined customer. Interest income increased moderately, although it continued to be constrained by historically low short term interest rates.
Segment income increased $3.3 million from $1.0 million in YTD 2010 to $4.3 million in YTD 2011. Variable expenses as a percentage of operating revenues declined from 84% to 76% and are primarily clearing and related expenses.
Other – The Company’s asset management revenues include management and performance fees, commissions and other revenues received by the Company for management of third party assets and investment gains or losses on the Company’s investments in funds or proprietary accounts managed either by the Company’s investment managers or by independent investment managers. In addition, this segment’s revenues include interest income and fees earned in relation to commodity financing transactions as well as a limited amount of principal physical commodity sales transactions related to inputs to the renewable fuels industry.
Operating revenues increased 34% from $4.4 million in YTD 2010 to $5.9 million in YTD 2011. Assets under management at March 31, 2011 were approximately $370 million compared with approximately $412 million at March 31, 2010. Management fees were flat in YTD 2011 over the prior year period, at $1.7 million. Operating revenues in the grain financing and physical commodity origination business increased 285% to $2.4 million in YTD 2011, primarily as a result of an increase in committed credit lines and increased demand for fats and oils origination from commercial customers. Segment income was $2.0 million in YTD 2011 as compared to $2.1 million in YTD 2010.
44
Liquidity, Financial Condition and Capital Resources
Overview
Liquidity is of critical importance to us and imperative to maintain our operations on a daily basis. In FCStone, LLC, the Company’s FCM subsidiary, we have responsibilities to meet margin calls at all exchanges on a daily basis and intra-day basis, if necessary. Our customers are required to make any required margin deposits the next business day, and we require our largest customers to make intra-day margin payments during periods of significant price movement. Margin required to be posted to the exchanges is a function of the net open positions of our customers and the required margin per contract.
In addition, in our commodities trading, Commodity and Risk Management OTC, securities and foreign exchange trading activities, we may be called upon to meet margin calls with our various trading counterparties based upon the underlying open transactions we have in place with those counterparties.
The Company continuously reviews its overall credit and capital needs to ensure that its capital base, both stockholders’ equity and debt, as well as available credit facilities can appropriately support the anticipated financing needs of its operating subsidiaries.
At March 31, 2011, the Company had total equity capital of $270.8 million, bank loans of $32.0 million and convertible subordinated notes of $10.0 million.
A substantial portion of the Company’s assets are liquid. At March 31, 2011, approximately 93% of the Company’s assets consisted of cash; deposits and receivables from exchange-clearing organizations, broker-dealers, clearing organizations, FCM’s, and counterparties; customer receivables, marketable financial instruments and investments, and physical commodities inventory, at cost. All assets that are not customer and counterparty deposits, are financed by the Company’s equity capital, convertible subordinated notes, bank loans, short-term borrowings from financial instruments sold, not yet purchased, and other payables.
Customer and Counterparty Credit and Liquidity Risk
Our operations expose us to credit risk of default of our customers and counterparties. The risk includes liquidity risk to the extent our customers or counterparties are unable to make timely payment of margin or other credit support. These risks expose us indirectly to the financing and liquidity risks of our customers and counterparties, including the risks that our customers and counterparties may not be able to finance their operations. Throughout the commodities and securities industries, continued volatility in commodity prices has required increased lines of credit, and placed a strain on working capital debt facilities. In many cases, our customers have been forced to increase leverage to unprecedented levels in order for them to continue to carry inventory and properly execute hedging strategies. Continuing volatility in the financial markets has tightened credit further.
As a clearing broker, we act on behalf of our customers for all trades consummated on exchanges. We must pay initial and variation margin to the exchanges before we receive the required payments from our customers. Accordingly, we are responsible for our customers’ obligations with respect to these transactions, which exposes us to significant credit risk. Our customers are required to make any required margin deposits the next business day, and we require our largest customers to make intra-day margin payments during periods of significant price movement. Our clients are required to maintain initial margin requirements at the level set by the respective exchanges, but we have the ability to increase the margin requirements for customers based on their open positions, trading activity, or market conditions.
With OTC derivative transactions, we act as a principal, which exposes us to the credit risk of both our customers and the counterparties with which we offset our customer positions. As with exchange-traded transactions, our OTC transactions require that we meet initial and variation margin payments on behalf of our customers before we receive the required payment from our customers. OTC customers are required to post sufficient collateral to meet margin requirements based on Value at Risk models as well as variation margin requirement based on the price movement of the commodity or security in which they transact. Our customers are required to make any required margin deposits the next business day, and we may require our largest clients to make intra-day margin payments during periods of significant price movement. We have the ability to increase the margin requirements for customers based on their open positions, trading activity, or market conditions.
In addition, with OTC transactions, we are at risk that a counterparty will fail to meet its obligations when due. We would then be exposed to the risk that the settlement of a transaction which is due a customer will not be collected from the respective counterparty with which the transaction was offset. We continuously monitor the credit quality of our respective counterparties and mark our positions held with each counterparty to market on a daily basis.
45
On March 31, 2011, the commodities market experienced an upward limit price movement on a certain commodity, and as a result, certain exchange-traded derivative contracts, which would normally be valued using quoted market prices were priced using a valuation model, as more fully described in Note 6 - Assets and Liabilities, at Fair Value to the condensed consolidated financial statements. This market event caused a significant increase in receivables from customers related to margin balances as of the balance sheet date. The Company has subsequently collected all margin balances from its customers related to this market event.
As a result of the acquisition of FCStone, the Company acquired notes receivable of $133.7 million at September 30, 2009 from certain customers and an introducing broker which arose from previous customer account deficits, of which the Company estimated collectability to be $16.7 million. During the three months ended March 31, 2011, the Company recovered $11.4 million as partial payment against the promissory notes receivable from these certain customers, and charged off $111.5 million against the allowance for notes receivable related to these customer account deficits. Total recoveries from these certain customers and introducing broker through March 31, 2011 is $14.3 million, and at March 31, 2011, notes receivable related to these customer account deficits were $2.4 million. The Company expects to collect the remaining amounts from the introducing broker, by withholding commissions due on future revenues collected by the Company, and through credit insurance, although no assurance can be given as to the timing of collection.
During the three and six months ended March 31, 2011, the Company recorded charges to bad debt expense of $0.3 million and $4.5 million, respectively, primarily related to a customer to whom the Company had consigned gold within the C&RM segment, and a clearing customer deficit account in the CES segment. During the three and six months ended March 31, 2011, the Company recorded recoveries of $0.1 million and $1.9 million, respectively, of bad debt expense, including $1.3 million following a settlement relating to a disputed trade that was “given-up” to FCStone during the quarter ended June 30, 2010 by another futures commission merchant for a customer that held an account with us.
Primary Sources and Uses of Cash
The Company’s assets and liabilities may vary significantly from period to period due to changing customer requirements, economic and market conditions and the growth of the Company. The Company’s total assets at March 31, 2011 and September 30, 2010, were $2,271.9 million and $2,021.7 million, respectively. The Company’s operating activities generate or utilize cash as a result of net income or loss earned or incurred during each period and fluctuations in its assets and liabilities. The most significant fluctuations arise from changes in the level of customer activity, commodities prices and changes in the balances of financial instruments and commodities inventory. FCStone, LLC, our FCM subsidiary, occasionally uses its margin line credit facilities, on a short-term basis, to meet intraday settlements with the commodity exchanges prior to collecting margin funds from our customers.
We have liquidity and funding policies and processes in place that are intended to maintain significant flexibility to address both company-specific and industry liquidity needs. The majority of our excess funds are held with high quality institutions, under highly-liquid reverse repurchase agreements, with a maturity of typically three days or less, U.S. Government Treasury and Agency securities and AA-rated money market investments.
At March 31, 2011, approximately $19.5 million of the Company’s financial instruments owned and $13.0 million of financial instruments sold, not yet purchased, are exchangeable foreign equities and American Depository Receipts.
As of March 31, 2011, the Company had four bank credit facilities totaling $365.0 million, of which $32.0 million was outstanding. The credit facilities include:
A one-year, renewable, revolving syndicated committed loan facility expiring on September 21, 2011 under which the Company’s subsidiary, INTL Commodities, Inc. (INTL Commodities) is entitled to borrow up to $140.0 million, subject to certain conditions. The loan proceeds are used to finance the activities of INTL Commodities and are secured by its assets. The facility is guaranteed by the Company.
A three-year syndicated committed loan facility established on October 29, 2010 under which the Company is entitled to borrow up to $75.0 million, subject to certain conditions. The loan proceeds are used to finance working capital needs of the Company and certain subsidiaries.
An unsecured committed line of credit, expiring June 22, 2011, with a syndicate of lenders under which the Company’s subsidiary, FCStone, LLC may borrow up to $75.0 million. This line is intended to provide short term funding of margin to commodity exchanges as necessary. The line is subject to annual review, and the Company is currently in discussions with the lender and expects to renew the facility during the third quarter of fiscal 2011.
A one-year committed borrowing facility with a syndicate of lenders expiring on December 1, 2011, under which the Company’s subsidiary, FCStone Financial, Inc. is entitled to borrow up to $75.0 million, subject to certain conditions. The loan proceeds are used to finance traditional commodity financing arrangements.
46
The Company’s facility agreements contain covenants relating to financial measures such as minimum net worth, minimum working capital, minimum regulatory capital and minimum interest coverage ratios. Failure to comply with any such covenants could result in the debt becoming payable on demand. The Company and its subsidiaries are in compliance with all of its covenants under the outstanding facilities.
In September 2006, the Company completed a private placement of $27 million of 7.625% subordinated convertible notes (the Notes), and at September 30, 2010, $16.7 million in principal amount of the Notes remained outstanding. During the six months ended March 31, 2011, holders of $6.7 million in principal amount of the Notes converted the principal and interest of $0.1 million into 313,102 shares of common stock of the Company. As of March 31, 2011, the remaining Notes are convertible, at the discretion of the note holders, into 458,926 shares of common stock of the Company at a conversion price of $21.79 per share. The Notes contain customary anti-dilutive provisions. The Company may require conversion at any time if the dollar volume-weighted-average share price exceeds $38.25 for 20 out of any 30 consecutive trading days. Subsequent to March 31, 2011, the Company received a conversion notice from a note holder to convert an additional $1.0 million of principal amount of the Notes. The Notes mature in September 2011.
Set forth below is the calculation of consolidated EBITDA and consolidated cash interest expense, as defined in the Notes, for the trailing twelve month period ended March 31, 2011:
(in millions) | For the Trailing Twelve Months Ended March 31, 2011 (non-GAAP) | ||
Income from continuing operations | $ | 25.2 | |
Noncontrolling interests | (0.1 | ) | |
Income tax | 12.7 | ||
Depreciation and amortization | 3.3 | ||
Stock compensation amortization | 2.0 | ||
Interest expense | 12.2 | ||
Change in unrealized fair value gain in physical commodities inventory | — | ||
Other mark-to-market adjustments | 3.3 | ||
Consolidated EBITDA (non-GAAP) | $ | 58.6 | |
Interest expense | $ | 12.2 | |
Less: amortization of deferred financing costs | 0.2 | ||
Consolidated cash interest expense (non-GAAP) | $ | 12.0 | |
Adjusted consolidated EBITDA is a financial measure that is not recognized by U.S. GAAP, and should not be considered as an alternative to any other measures of performance derived in accordance with U.S. GAAP. The Company has included this non-GAAP financial measure because it is required under the terms of the Notes.
On October 20, 2010, three investors in the Company's senior subordinated convertible notes dues September 2011 (the Notes), consisting of Highbridge International LLC, LBI Group Inc. and Iroquois Master Fund Ltd., filed suit against the Company, claiming that the acquisition by the Company of FCStone Group, Inc. in September 2009 resulted in a change of control as defined in the Notes; and that, as a result, the Company should have afforded the investors the opportunity to have the Notes redeemed at a 15% premium. The investors also claimed the right to penalty interest at the rate of 15% per annum established in the Notes. The investors held Notes with a principal amount of $13.0 million at the time of the commencement of the litigation.
On April 21, 2011 the Company's motion to dismiss the investors' lawsuit was denied. Accordingly, the lawsuit is expected to proceed to trial. Prior to April 21, 2011, one of the Investors, Iroquois Master Fund Ltd., converted $3.0 million of its $4.0 million investment in principal amount of the Notes, and accrued interest, into 139,136 shares of common stock of the Company. On April 25, 2011 Iroquois Master Fund Ltd. converted the remaining $1.0 million, and accrued interest, into 46,133 shares of common stock of the Company. Following these conversions, $9.0 million in principal amount of the Notes held by the investors remain outstanding.
47
On April 7, 2009, the Company acquired CIBSA, a leading securities broker-dealer based in Argentina. The Company paid approximately $1.7 million on the date of purchase and was obligated to make additional payments over the next two years, depending on the level of revenues achieved. Under the purchase agreement, the Company was obligated to pay an amount equal to 25% of the net revenues in excess of $2.5 million up to $3.0 million, 35% of the net revenues in excess of $3.0 million up to $4.0 million, and 40% of the net revenues in excess of $4.0 million for each of the two twelve-month periods ending March 31, 2010 and 2011 to the sellers as additional consideration. Any amounts paid under this agreement are recorded as goodwill. The Company paid $0.8 million in May 2010 as additional consideration relating to the provisions of this agreement. The net revenues for the twelve-month period ended March 31, 2011 were below the minimum target, so no further amounts of additional consideration will be paid.
On April 1, 2010, the Company acquired the RMI Companies. The purchase price consists of an initial payment of $6.0 million, a contingent payment of $3.1 million based on the net income of the RMI Companies for the twelve month period ended March 31, 2011, and two contingent payments which will be based on the net income of the RMI Companies for each of the next two twelve-month periods ending March 31, 2012 and 2013. The present value of the estimated total purchase price, including contingent consideration, is $16.7 million at March 31, 2011, of which $10.7 million has not been paid and is included within accounts payable and other liabilities in the condensed consolidated balance sheet.
On July 2, 2010, the Company acquired the Hanley Companies. The purchase price consisted of an amount equal to the sum of the following: (1) an initial payment to be made at the closing of $7.5 million; (2) two payments equaling $24.3 million for the adjusted net asset value of the Hanley Companies as of June 30, 2010; (3) three additional payments equal to 15% of the adjusted earnings before interest and taxes (the Adjusted EBIT) of the soft commodities derivatives business of the Hanley Companies and FCStone Trading LLC (the “Derivatives Division ) for each twelve month period during the three year period commencing on July 1, 2010, subject to an annual limit of $7.0 million and an overall maximum of $12.5 million; and (4) a final payment based on the cumulative Adjusted EBIT of the Derivatives Division for the three year period commencing on July 1, 2010. In the event that the cumulative Adjusted EBIT equals or exceeds $100 million, then the final EBIT Payment will be equal to $10 million. In the event that the cumulative Adjusted EBIT is greater than $80 million, but less than $100 million, then the final EBIT Payment will be equal to the product of: (A) $10 million, and (B) a fraction, the numerator of which is the amount by which the cumulative Adjusted EBIT exceeds $80 million, and the denominator of which is $20 million. The present value of the estimated total purchase price, including contingent consideration, is $49.1 million at March 31, 2011, of which $17.3 million has not been paid and is included within accounts payable and other liabilities in the condensed consolidated balance sheet.
On October 1, 2010, the Company acquired Hencorp Futures. The purchase price consisted of an initial payment of $2.3 million, four contingent payments which will be based on Hencorp Futures’ net income for each of the four years after the closing and a final contingent payment based on the average net income of the second, third and fourth years. The estimated total purchase price, including contingent consideration is approximately $6.1 million at March 31, 2011, of which $2.5 million has not been paid and is included within accounts payable and other liabilities in the condensed consolidated balance sheet.
The Company contributed $0.6 million to its defined benefit pension plans during the three months ended March 31, 2011, and expects to contribute an additional $0.6 million to the plan during fiscal 2011, which represents the minimum funding requirement.
Other Capital Considerations
Our futures commission merchant (FCM) subsidiary, FCStone LLC is subject to various regulations and capital adequacy requirements. Pursuant to the rules, regulations, and requirements of the CFTC and other self-regulatory organizations, FCStone LLC is required to maintain certain minimum net capital as defined in such rules, regulations, and requirements. Net capital will fluctuate on a daily basis.
INTL Trading, a broker-dealer subsidiary, is subject to the net capital requirements of the SEC relating to liquidity and net capital levels. The Company’s ability to receive distributions from INTL Trading is restricted by regulations of the SEC. The Company’s right to receive distributions from its subsidiaries is also subject to the rights of the subsidiaries’ creditors, including customers of INTL Trading.
FCStone Australia Pty, Ltd ("FCStone Australia") is regulated by the Australian Securities and Investment Commission and is subject to a surplus liquid funds requirement. FCStone Australia is also regulated by the New Zealand Clearing Limited, and is subject to a capital adequacy requirement.
FCC Investments, Inc., a broker-dealer subsidiary, is subject to the net capital requirements of the SEC relating to liquidity and net capital levels.
48
Risk Management Incorporated and INTL Hencorp Futures, LLC are regulated by the CFTC and the National Futures Association and are both subject to a minimum capital requirement.
The Company is in compliance with all of its capital regulatory requirements at March 31, 2011. Additional information on these net capital and minimum net capital requirements can be found within Note 14 of the condensed consolidated financial statements.
Certain other non-U.S. subsidiaries of the Company are also subject to capital adequacy requirements promulgated by authorities of the countries in which they operate. As of March 31, 2011, these subsidiaries were in compliance with their local capital adequacy requirements.
Cash Flows
The Company’s cash and cash equivalents increased from $81.9 million at September 30, 2010 to $135.0 million at March 31, 2011, a net increase of $53.1 million. Net cash of $152.7 million was provided by operating activities, $16.4 million was used in investing activities and net cash of $83.2 million was used in financing activities, of which $82.8 million was repaid on lines of credit and decreased the amounts payable to lenders under loans and overdrafts and $0.5 million was repayment of subordinated debt. Fluctuations in exchange rates had no material effect on the Company’s cash and cash equivalents.
The Company is continuously evaluating opportunities to expand its business. Expansion of the Company’s activities will require funding and will have an effect on liquidity.
Apart from what has been disclosed above, there are no known trends, events or uncertainties that have had or are likely to have a material impact on the liquidity, financial condition and capital resources of the Company.
Commitments
Information about the Company’s commitments and contingent liabilities is contained in Note 12 of the condensed consolidated financial statements.
The Company’s senior subordinated convertible notes, as described in Note 11 of the Notes to the condensed consolidated financial statements, are due in September 2011 if they are not converted or redeemed prior to their due date.
Off Balance Sheet Arrangements
The Company is party to certain financial instruments with off-balance sheet risk in the normal course of business as a registered securities broker-dealer and futures commission merchant and from its market making and proprietary trading in the foreign exchange and commodities trading business. As part of these activities, the Company carries short positions. For example, it sells financial instruments that it does not own, borrows the financial instruments to make good delivery, and therefore is obliged to purchase such financial instruments at a future date in order to return the borrowed financial instruments. The Company has recorded these obligations in the condensed consolidated financial statements at March 31, 2011 and September 30, 2010, at fair value of the related financial instruments, totaling $554.8 million and $189.6 million, respectively. These positions are held to offset the risks related to financial assets owned and reported on the Company’s condensed consolidated balance sheets under ‘Financial instruments owned, at fair value’, and ‘Physical commodities inventory, at cost. The Company will incur losses if the fair value of the financial instruments sold, not yet purchased, increases subsequent to March 31, 2011 and September 30, 2010, which might be partially or wholly offset by gains in the value of assets held at March 31, 2011 and September 30, 2010. The total of $554.8 million and $189.6 million includes a net liability of $186.8 million and $87.6 million for derivatives, based on their fair value as of March 31, 2011 and September 30, 2010, respectively.
In the Company’s foreign exchange and commodities trading business segments, the Company will hold options and futures contracts resulting from market-making and proprietary trading activities in the Company’s foreign exchange/commodities trading business segment. The Company assists its customers in its commodities trading business to protect the value of their future production (precious or base metals) by selling them put options on an OTC basis. The Company also provides its commodities trading business customers with sophisticated option products, including combinations of buying and selling puts and calls. The Company mitigates its risk by effecting offsetting options with market counterparties or through the purchase or sale of exchange traded commodities futures. The risk mitigation of offsetting options is not within the documented hedging designation requirements of the Derivatives and Hedging Topic of the ASC.
49
In the Company’s C&RM segment, the Company will generally offset the customer’s transaction simultaneously with one of our trading counterparties when transacting OTC and foreign exchange contracts with our customers. On a limited basis, our OTC and foreign exchange trade desks will accept a customer transaction and will offset that transaction with a similar but not identical position on the exchange. These unmatched transactions are intended to be short-term in nature and are conducted to facilitate the most effective transaction for our customer.
Derivative contracts are traded along with cash transactions because of the integrated nature of the markets for such products. The Company manages the risks associated with derivatives on an aggregate basis along with the risks associated with its proprietary trading and market-making activities in cash instruments as part of its firm-wide risk management policies.
The Company is a member of various commodity exchanges and clearing organizations. Under the standard membership agreement, all members are required to guarantee the performance of other members and, accordingly, in the event another member is unable to satisfy its obligations to the exchange, may be required to fund a portion of the shortfall. Our liability under these arrangements is not quantifiable and could exceed the cash and securities we have posted as collateral at the exchanges. However, management believes that the potential for us to be required to make payments under these arrangements is remote. Accordingly, no contingent liability for these arrangements has been recorded in the condensed consolidated balance sheets as of March 31, 2011 and September 30, 2010.
Critical Accounting Policies
The Company’s condensed consolidated financial statements are prepared in accordance with U.S. GAAP. The Company’s significant accounting policies are described in the Summary of Significant Accounting Policies in the condensed consolidated financial statements set forth in the Company’s 10-K for the year ended September 30, 2010.
The Company believes that of its significant accounting policies, those described below may, in limited instances, involve a high degree of judgment and complexity. These critical accounting policies may require estimates and assumptions that affect the amounts of assets, liabilities, revenues and expenses reported in the condensed consolidated financial statements. Due to their nature, estimates involve judgment based upon available information. Actual results or amounts could differ from estimates and the difference could have a material impact on the financial statements. Therefore, understanding these policies is important in understanding the reported and potential future results of operations and the financial position of the Company.
Valuation of Financial Instruments and Foreign Currencies. Substantially all financial instruments are reflected in the condensed consolidated financial statements at fair value or amounts that approximate fair value. These financial instruments include: cash, cash equivalents, and financial instruments purchased under agreements to resell; deposits with clearing organizations; financial instruments owned; and financial instruments sold but not yet purchased. Unrealized gains and losses related to these financial instruments, which are not customer owned positions, are reflected in earnings. Where available, the Company uses prices from independent sources such as listed market prices, or broker or dealer price quotations. Fair values for certain derivative contracts are derived from pricing models that consider current market and contractual prices for the underlying financial instruments or commodities, as well as time value and yield curve or volatility factors underlying the positions. In some cases, even though the value of a security is derived from an independent market price or broker or dealer quote, certain assumptions may be required to determine the fair value. However, these assumptions may be incorrect and the actual value realized upon disposition could be different from the current carrying value. The value of foreign currencies, including foreign currencies sold, not yet purchased, are converted into its U.S. dollar equivalents at the foreign exchange rates in effect at the close of business at the end of the accounting period. For foreign currency transactions completed during each reporting period, the foreign exchange rate in effect at the time of the transaction is used.
The application of the valuation process for financial instruments and foreign currencies is critical because these items represent a significant portion of the Company’s total assets. Valuations for substantially all of the financial instruments held by the Company are available from independent publishers of market information. The valuation process may involve estimates and judgments in the case of certain financial instruments with limited liquidity and OTC derivatives. Given the wide availability of pricing information, the high degree of liquidity of the majority of the Company’s assets, and the relatively short periods for which they are typically held in inventory, there is insignificant sensitivity to changes in estimates and insignificant risk of changes in estimates having a material effect on the Company. The basis for estimating the valuation of any financial instruments has not undergone any change.
Revenue Recognition. The revenues of the Company are derived principally from realized and unrealized trading income in securities, derivative instruments, commodities and foreign currencies purchased or sold for the Company’s account. Realized and unrealized trading income is recorded on a trade date basis. Securities owned and securities sold, not yet purchased and foreign currencies sold, not yet purchased, are stated at fair value with related changes in unrealized appreciation or depreciation reflected in ‘Trading gains’. Fee and interest income are recorded on the accrual basis and dividend income is recognized on the ex-dividend date.
50
Revenue on commodities that are purchased for physical delivery to customers and that are not readily convertible into cash is recognized at the point in time when the commodity has been shipped, title and risk of loss has been transferred to the customer, and the following conditions have been met: persuasive evidence of an arrangement exists, the price is fixed and determinable, and collectability of the resulting receivable is reasonably assured.
The critical aspect of revenue recognition for the Company is recording all known transactions as of the trade date of each transaction for the financial period. The Company has developed systems for each of its businesses to capture all known transactions. Recording all known transactions involves reviewing trades that occur after the financial period that relate to the financial period. The accuracy of capturing this information is dependent upon the completeness and accuracy of data capture of the operations systems and the Company’s clearing firm.
Physical Commodities Inventory. Physical commodities inventory is stated at the lower of cost or fair value, determined using the weighted-average price method. The Company generally mitigates the price risk associated with physical commodities held in inventory through the use of derivatives. The Company does not elect hedge accounting under U.S. GAAP in accounting for this price mitigation. Any unrealized gains in physical commodities inventory are not recognized under U.S. GAAP, but unrealized gains and losses in related derivative positions are recognized under U.S. GAAP. As a result, the Company’s reported commodities trading earnings are subject to volatility.
Effects of Inflation
Because the Company’s assets are, to a large extent, liquid in nature, they are not significantly affected by inflation. Increases in the Company’s expenses, such as compensation and benefits, clearing and related expenses, occupancy and equipment rental, due to inflation, may not be readily recoverable from increasing the prices of services offered by the Company. In addition, to the extent that inflation results in rising interest rates or has other adverse effects on the financial markets and on the value of the financial instruments held in inventory, it may adversely affect the Company’s financial position and results of operations.
Item 3. Quantitative and Qualitative Disclosures about Market Risk
See also Note 7 to the condensed consolidated financial statements, ‘Financial Instruments with Off-Balance Sheet Risk and Concentrations of Credit Risk’.
Market Risk
The Company conducts its market-making and trading activities predominantly as a principal, which subjects its capital to significant risks. These risks include, but are not limited to, absolute and relative price movements, price volatility and changes in liquidity, over which the Company has virtually no control. The Company’s exposure to market risk varies in accordance with the volume of client-driven market-making transactions, the size of the proprietary positions and the volatility of the financial instruments traded.
The Company seeks to mitigate exposure to market risk by utilizing a variety of qualitative and quantitative techniques:
• | Diversification of business activities and instruments; |
• | Limitations on positions; |
• | Allocation of capital and limits based on estimated weighted risks; and |
• | Daily monitoring of positions and mark-to-market profitability. |
The Company utilizes derivative products in a trading capacity as a dealer to satisfy client needs and mitigate risk. The Company manages risks from both derivatives and non-derivative cash instruments on a consolidated basis. The risks of derivatives should not be viewed in isolation, but in aggregate with the Company’s other trading activities.
51
Management believes that the volatility of revenues is a key indicator of the effectiveness of its risk management techniques. The graph below summarizes volatility of the Company’s daily revenue, determined on a marked-to-market basis, during the six months ended March 31, 2011.
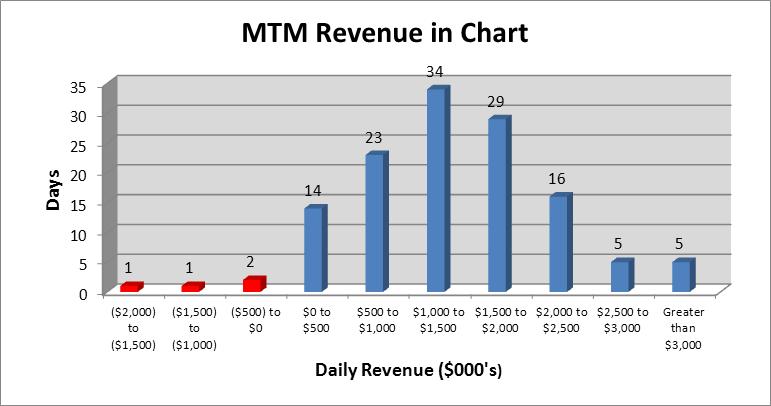
In the Company’s securities market-making and trading activities, the Company maintains inventories of equity and debt securities. In the Company’s commodities market-making and trading activities, the Company’s positions include physical inventories, forwards, futures and options. The Company’s commodity trading activities are managed as one consolidated book for each commodity encompassing both cash positions and derivative instruments. The Company monitors the aggregate position for each commodity in equivalent physical ounces or metric tons.
Interest Rate Risk
In the ordinary course of our operations, we have interest rate risk from the possibility that changes in interest rates will affect the values of financial instruments and impact interest income earned. We generate interest income from the positive spread earned on customer deposits. We typically invest in U.S. Treasury and Agency securities, reverse repurchase agreements involving U.S. Treasury and Agency securities or AA rate money market funds. We have an investment policy which establishes acceptable standards of credit quality and limits the amount of funds that can be invested within a particular fund and institution.
In April 2010, we implemented an interest rate risk management strategy using derivative financial instruments in the form of interest rate swaps to manage a portion of our aggregate interest rate position. Our objective is to invest the majority of customer segregated deposits in high quality, short-term investments and swap the resulting variable interest earnings into the medium-term interest stream, by using a strip of interest rate swaps that mature every quarter, and enable us to achieve the two year moving average of the two year swap rate. These interest rate swaps are not designated for hedge accounting treatment, and changes in the marked-to-market valuations of the financial instruments are recorded in earnings on a quarterly basis.
We manage interest expense using floating rate debt and through interest rate swap transactions. Refer to Note 7 to the condensed consolidated financial statements for information on the interest rate swap transactions. The debt instruments are carried at their unpaid principal balance which approximates fair value. With the exception of our convertible notes, all of the debt outstanding at March 31, 2011, has a variable interest rate.
Item 4. Controls and Procedures
In connection with the filing of this Form 10-Q, the Company’s management, including the Chief Executive Officer and Chief Financial Officer, evaluated the effectiveness of the Company’s disclosure controls and procedures as of March 31, 2011. The Company’s Chief Executive Officer and Chief Financial Officer have concluded that the Company’s disclosure controls and procedures were effective as of March 31, 2011.
A control system can provide only reasonable, not absolute, assurance that the objectives of the control system are met. As a result, there can be no assurance that a control system will succeed in preventing all possible instances of error and fraud. The Company’s disclosure controls and procedures are designed to provide reasonable assurance of achieving their objectives, and the conclusions of the Company’s Chief Executive Officer and Chief Financial Officer are made at the “reasonable assurance” level.
There were no changes in the Company’s internal controls over financial reporting during the quarter ended March 31, 2011 that materially affected, or are reasonably likely to materially affect, the Company’s internal control over financial reporting.
52
Part II. OTHER INFORMATION
Item 1. Legal Proceedings
FCStone and certain officers of FCStone were named as defendants in an action filed in the United States District Court for the Western District of Missouri on July 15, 2008. A consolidated amended complaint (“CAC”) was subsequently filed on September 25, 2009. As alleged in the CAC, the action purports to be brought as a class action on behalf of purchasers of FCStone common stock between November 15, 2007 and February 24, 2009. The CAC seeks to hold defendants liable under Section 10(b) and Section 20(a) of the Securities Exchange Act of 1934 and concerns disclosures included in FCStone's fiscal year 2008 public filings. Specifically, the CAC relates to FCStone's public disclosures regarding an interest rate hedge, a bad debt expense arising from unprecedented events in the cotton trading market, and certain disclosures beginning on November 3, 2008 related to losses it expected to incur arising primarily from a customer energy trading account. FCStone and the named officers moved to dismiss the action. Although the Court denied that motion on November 16, 2010, it limited the action to the public disclosures made on November 3 and 4, 2008 related to the energy trading account. The action is now in discovery and plaintiffs are currently seeking to certify the relevant class as those stockholders who purchased FCStone stock between April 14, 2008 and February 24, 2009. The Company and the FCStone defendants believe the action is meritless and the FCStone defendants are defending this action vigorously.
In August 2008, a shareholder derivative action was filed against FCStone and certain directors of FCStone in the Circuit Court of Platte County, Missouri, alleging breaches of fiduciary duties, waste of corporate assets and unjust enrichment. An amended complaint was subsequently filed in May 2009 to add claims based upon the losses sustained by FCStone arising out of a customer's energy trading account. On July 7, 2009, the same plaintiff filed a motion for leave to amend the existing case to add a purported class action claim on behalf of the holders of FCStone common stock.
On July 8, 2009, a purported shareholder class action complaint was filed against FCStone and its directors, as well as the Company in the Circuit Court of Clay County, Missouri. The complaint alleged that FCStone and its directors breached their fiduciary duties by failing to maximize stockholder value in connection with the contemplated acquisition of FCStone by the Company. This complaint was subsequently consolidated with the complaint filed in the Circuit Court of Platte County, Missouri. The plaintiffs subsequently filed an amended consolidated complaint which does not assert any claims against the Company. This complaint purports to be filed derivatively on FCStone and the Company's behalf and against certain of FCStone current and former directors and officers and directly against the same individuals. The Company, FCStone, and the defendants filed motions to dismiss on multiple grounds. That motion is fully briefed and pending decision.
In addition, the staff of the Fort Worth Regional Office of the Securities and Exchange Commission (the “SEC”) is conducting a formal investigation of FCStone's disclosures and accounting for losses associated with the energy trading account, which occurred prior to the Company's acquisition of FCStone on September 30, 2009. In March 2011, certain employees of the Company testified before the SEC in connection with this investigation. The Company and FCStone are cooperating fully with the SEC staff in its investigation, but cannot predict the scope, duration or outcome of the matter.
On February 24, 2011, the Company's Board of Directors formed a special committee to conduct an independent investigation of FCStone's disclosures and accounting for losses associated with the energy trading account. The Company's Board of Directors determined that it would be appropriate and consistent with its governance and oversight responsibilities to form the special committee to investigate these matters as they pertain to the private litigation and the SEC investigation described above. The special committee, which is comprised solely of independent directors of the Company who were not formerly directors of FCStone, has retained an independent law firm to represent and assist it in its review.
On October 20, 2010, three investors in the Company's senior subordinated convertible notes due September 2011 (the “Notes”), consisting of Highbridge International LLC, LBI Group Inc. and Iroquois Master Fund Ltd., filed suit against the Company, claiming that the acquisition by the Company of FCStone Group, Inc. in September 2009 resulted in a change of control as defined in the Notes; and that, as a result, the Company should have afforded them the opportunity to have the Notes redeemed at a 15% premium. The investors also claimed the right to penalty interest at the rate of 15% per annum established in the Notes. The investors held Notes with a principal amount of $13.0 million at the time of the commencement of the litigation.
On April 21, 2011 the Company's motion to dismiss the investors' lawsuit was denied. Accordingly, the lawsuit is expected to proceed to trial. Prior to April 21, 2011, one of the investors, Iroquois Master Fund Ltd., converted $3.0 million of its $4.0 million investment in principal amount of the Notes, and accrued interest, into 139,136 shares of common stock of the Company. On April 25, 2011 Iroquois Master Fund Ltd. converted the remaining $1.0 million, and accrued interest, into 46,133 shares of common stock of the Company. Following these conversions, $9.0 million in principal amount of the Notes held by the investors remain outstanding.
53
On January 21, 2011 the bankruptcy trustee of Sentinel Management Group, Inc. filed a motion for summary judgment on various counts in the adversary proceedings filed in August 2008 against one of the Company's subsidiaries, FCStone, LLC, and a number of other futures commission merchants. The nature of these adversary proceedings has been disclosed in previous filings of the Company.
Apart from this, there have been no material developments in previously reported litigation, and no other reportable events have occurred during the quarter ended March 31, 2011 or through the date of this filing.
Item 1A. Risk Factors
In addition to the other information set forth in this report, information regarding risks affecting the Company appears in Part I, Item 1A of the Company’s Annual Report on Form 10-K for the fiscal year ended September 30, 2010. These are not the only risks facing the Company. Additional risks and uncertainties not currently known to us or that management currently considers to be non-material may in the future adversely affect the Company’s business, financial condition and operating results. There have been no material changes to our risk factors since the filing of the Company’s Form 10-K.
Item 6. Exhibits
31.1 | Certification of Chief Executive Officer, pursuant to Rule 13a – 14(a). | ||
31.2 | Certification of Chief Financial Officer, pursuant to Rule 13a – 14(a). | ||
32.1 | Certification of Chief Executive Officer, pursuant to 18 U.S.C. Section 1350, as adopted pursuant to Section 906 of the Sarbanes-Oxley Act of 2002. | ||
32.2 | Certification of Chief Financial Officer, pursuant to 18 U.S.C. Section 1350, as adopted pursuant to Section 906 of the Sarbanes-Oxley Act of 2002. | ||
54
Signatures
Pursuant to the requirements of the Securities Exchange Act of 1934, the registrant has duly caused this report to be signed on its behalf by the undersigned, thereunto duly authorized.
INTL FCStone Inc.
Date: | May 10, 2011 | /s/ Sean M. O'Connor | ||
Sean M. O'Connor | ||||
Chief Executive Officer | ||||
Date: | May 10, 2011 | /s/ William J. Dunaway | ||
William J. Dunaway | ||||
Chief Financial Officer | ||||
55