Attached files
| file | filename |
|---|---|
| EX-21 - SUBSIDIARES - StoneX Group Inc. | intlexhibit2109302015.htm |
| EX-23.1 - CONSENT OF AUDITOR - StoneX Group Inc. | intlexhibit23109302015.htm |
| EX-32.2 - SECTION 906 CFO CERTIFICATION - StoneX Group Inc. | intlexhibit32209302015.htm |
| EX-31.1 - SECTION 302 CEO CERTIFICATION - StoneX Group Inc. | intlexhibit31109302015.htm |
| EX-31.2 - SECTION 302 CFO CERTIFICATION - StoneX Group Inc. | intlexhibit31209302015.htm |
| EX-32.1 - SECTION 906 CEO CERTIFICATION - StoneX Group Inc. | intlexhibit32109302015.htm |
UNITED STATES
SECURITIES AND EXCHANGE COMMISSION
Washington, D.C. 20549
FORM 10-K
x ANNUAL REPORT PURSUANT TO SECTION 13 OR 15(d) OF THE SECURITIES EXCHANGE
ACT OF 1934
For the Fiscal Year Ended September 30, 2015
o TRANSITION REPORT PURSUANT TO SECTION 13 OR 15(d) OF THE SECURITIES
EXCHANGE ACT OF 1934
For the transition period from to
Commission File Number 000-23554
INTL FCStone Inc.
(Exact name of registrant as specified in its charter)
Delaware | 59-2921318 | |
(State or other jurisdiction of incorporation or organization) | (I.R.S. Employer Identification No.) | |
New York, NY 10017
(Address of principal executive offices) (Zip Code)
(212) 485-3500
(Registrant’s telephone number, including area code)
Securities registered under Section 12(b) of the Act:
Title of each class | Name of each exchange on which registered | |
Common Stock, $0.01 par value | NASDAQ Global Market | |
8.5% Senior Notes due 2020 | NASDAQ Global Market | |
Securities registered under Section 12(g) of the Act: None
Indicate by check mark if the registrant is a well-known seasoned issuer, as defined in Rule 405 of the Securities Act. Yes o No x
Indicate by check mark if the registrant is not required to file reports pursuant to Section 13 or Section 15(d) of the Act. Yes o No x
Indicate by check mark whether the registrant (1) has filed all reports required to be filed by Section 13 or 15(d) of the Securities Exchange Act of 1934 during the preceding 12 months (or for such shorter period that the registrant was required to file such reports), and (2) has been subject to such filing requirements for the past 90 days. Yes x No o
Indicate by check mark whether the registrant has submitted electronically and posted on its corporate Web site, if any, every Interactive Data File required to be submitted and posted pursuant to Rule 405 of Regulation S-T (§ 232.405 of this chapter) during the preceding 12 months (or for such shorter period that the registrant was required to submit and post such files). Yes x No o
Indicate by check mark if disclosure of delinquent filers pursuant to Item 405 of Regulation S-K (§ 229.405 of this chapter) is not contained herein, and will not be contained, to the best of registrant’s knowledge, in definitive proxy or information statements incorporated by reference in Part III of this Form 10-K or any amendment to this Form 10-K. x
Indicate by check mark whether the registrant is a large accelerated filer, an accelerated filer, a non-accelerated filer, or smaller reporting company. See the definitions of “large accelerated filer,” “accelerated filer” and “smaller reporting company” in Rule 12b-2 of the Exchange Act.
Large accelerated filer | o | Accelerated filer | x | |
Non-accelerated filer | o | Smaller reporting company | o | |
Indicate by check mark whether the registrant is a shell company (as defined in Rule 12b-2 of the Exchange Act). Yes o No x
As of March 31, 2015, the aggregate market value of the common stock held by non-affiliates of the registrant was approximately $453.5 million.
As of December 7, 2015, there were 18,909,437 shares of the registrant’s common stock outstanding.
Document Incorporated by Reference
Certain portions of the definitive Proxy Statement for the Registrant’s Annual Meeting of Stockholders to be held on February 25, 2016 are incorporated by reference into Part III of this Annual Report on Form 10-K.
INTL FCStone Inc.
Annual Report on Form 10-K for the Fiscal Year Ended September 30, 2015
Table Of Contents
Page | ||
PART I | ||
Item 1. | ||
Item 1A. | ||
Item 1B. | ||
Item 2. | ||
Item 3. | ||
Item 4. | ||
PART II | ||
Item 5. | ||
Item 6. | ||
Item 7. | ||
Item 7A. | ||
Item 8. | ||
Item 9. | ||
Item 9A. | ||
Item 9B. | ||
PART III | ||
Item 10. | ||
Item 11. | ||
Item 12. | ||
Item 13. | ||
Item 14. | ||
PART IV | ||
Item 15. | ||
Cautionary Statement about Forward-Looking Statements
Certain statements in this report, other than purely historical information, including estimates, projections, statements relating to our business plans, objectives and expected operating results, and the assumptions upon which those statements are based, are “forward-looking statements” within the meaning of the Private Securities Litigation Reform Act of 1995, Section 27A of the Securities Act of 1933 and Section 21E of the Securities Exchange Act of 1934. Forward-looking statements are based on current expectations and assumptions that are subject to risks and uncertainties which may cause actual results to differ materially from the forward-looking statements. A detailed discussion of these and other risks and uncertainties that could cause actual results and events to differ materially from such forward-looking statements is included in the section entitled “Risk Factors” (refer to Part I, Item 1A). We undertake no obligation to update or revise publicly any forward-looking statements, whether as a result of new information, future events or otherwise.
PART I
Item 1. Business
Overview of Business and Strategy
We are a diversified, global financial services organization providing financial products and advisory and execution services that help our clients access market liquidity, maximize profits and manage risk. We are a leader in the development of specialized financial services in commodities, securities, global payments, foreign exchange and other markets. Our revenues are derived primarily from financial products and advisory services that fulfill our clients’ real needs and provide bottom-line benefits to their businesses. We create added value for our clients by providing access to global financial markets using our industry and financial expertise, deep partner and network relationships, insight and guidance, and integrity and transparency. Our client-first approach differentiates us from large banking institutions, engenders trust, and has enabled us to establish leadership positions in a number of complex fields in financial markets around the world.
Our leadership positions span markets such as commodity risk management advisory services; global payments; market-making in international equities and other securities; fixed income; physical trading and hedging of precious metals and select other commodities; execution of listed futures and options on futures contracts on all major commodity exchanges and foreign currency trading, among others. These businesses are supported by our global infrastructure of regulated operating subsidiaries, advanced technology platform and team of more than 1,200 employees. We currently have more than 20,000 clients, located in over 130 countries.
Our clients include producers, processors and end-users of nearly all widely traded physical commodities; commercial counterparties who are end-users of our products and services; governmental and non-governmental organizations; and commercial banks, asset managers, insurance companies, brokers, institutional investors and major investment banks. We believe our clients value us for our focus on their needs, our expertise and flexibility, our global reach, our ability to provide access to hard-to-reach markets and opportunities, and our status as a well-capitalized and regulatory-compliant organization.
We believe we are well positioned to capitalize on key trends impacting the financial services sector. Among others, these trends include the impact of increased regulation on banking institutions and other financial services providers; increased consolidation, especially of smaller sub-scale financial services providers; the growing importance and complexity of conducting secure cross-border transactions; and the demand among financial institutions to transact with well-capitalized counterparties.
We engage in direct sales efforts to seek new customers, with a strategy of extending our services to potential customers who are similar in size and operations to our existing customer base, as well as other kinds of customers that have risk management needs that could be effectively met by our services. In executing this plan, we intend to both target new geographic locations and expand the services offered in current locations, where there is an unmet demand for our services particularly in areas where commodity price controls have been recently lifted. In addition, in select instances we pursue small to medium sized acquisitions in which we target customer-centric organizations to expand our product offerings and/or geographic presence.
Our strategy is to utilize a centralized and disciplined process for capital allocation, risk management and cost control, while delegating the execution of strategic objectives and day-to-day management to experienced individuals. This requires high quality managers, a clear communication of performance objectives and strong financial and compliance controls. We believe this strategy will enable us to build a scalable and significantly larger organization that embraces an entrepreneurial approach to business, supported and underpinned by strong central controls.
INTL FCStone Inc. is a Delaware corporation formed in October 1987.
3
Available Information
Our internet address is www.intlfcstone.com. Our annual reports on Form 10-K, quarterly reports on Form 10-Q, current reports on Form 8-K, statements of changes in beneficial ownership and press releases are available free of charge in the Investor Relations section of this website. Our website also includes information regarding our corporate governance, including our Code of Ethics, which governs our directors, officers and employees.
Capabilities
Clearing and Execution
We provide execution services on a wide variety of technology platforms in a number of markets. We provide clearing and execution of listed futures and options on futures contracts on all major commodity exchanges worldwide, and are a member of all major United States (“U.S.”) and European commodity exchanges. We provide global payments and treasury services in more than 130 countries to a broad array of commercial customers, including financial institutions, multi-national corporations, and governmental and charitable organizations.
Advisory Services
We provide value-added advisory services in a variety of financial markets by working with commercial clients to systematically identify and quantify exposures to commodity price risks. We then develop strategic plans to effectively manage these risks with a view to protecting margins and mitigating exposures through our proprietary Integrated Risk Management Program (“IRMP®”).
We provide commercial customers with a full range of investment banking services from optimizing the customer’s capital structure through the issuance of loans, debt or equity securities, and advisory services including mergers, acquisitions and restructurings. In addition, we participate in the underwriting and trading of municipal securities.
Through our asset management activities, we leverage our specialist expertise in niche markets to provide institutional investors with tailored investment products.
Physical Trading
We trade in a variety of physical commodities, primarily precious metals, as well as select soft commodities including various agricultural oils, animal fats and feed ingredients. We offer customers efficient off-take or supply services, as well as logistics management. Through these trading activities, we have the ability to offer complex hedging structures as part of each physical contract to provide customers with enhanced price risk mitigation.
OTC / Market-Making
We offer customized and complex solutions in the OTC markets designed to help customers mitigate their specific market risks. We offer these solutions on a global basis across many markets, including virtually all traded commodities, foreign currencies and interest rates. We integrate this process from product design through execution of the underlying components of the structured risk product to transaction reporting and valuation.
We also provide market-making and execution in a variety of financial products including commodity options, unlisted American Depository Receipts (“ADRs”) and Global Depository Receipts (“GDRs”), foreign ordinary shares, and foreign currencies. In addition, we are an institutional dealer in fixed income securities including U.S. Treasury, U.S. government agency and agency mortgage-backed securities.
Trading Revenues
In our business, we may act as principal in the purchase and sale of individual securities, currencies, commodities, or derivative instruments with our customers. These transactions may be offset simultaneously with another customer or counterparty, offset with similarly but not identical positions on an exchange, made from inventory, or aggregated with other purchases to provide liquidity intra-day, for a number of days, or in some cases even longer periods (during which fair value may fluctuate). In addition, in our Clearing and Execution Services segment, we operate a proprietary foreign exchange desk which arbitrages the futures and cash markets.
Operating Segments
We organize our business activities into five functional areas: Commercial Hedging, Global Payments, Securities, Physical Commodities and Clearing and Execution Services.
Commercial Hedging
We serve our commercial clients through our team of risk management consultants, providing a high-value-added service that we believe differentiates us from our competitors and maximizes the opportunity to retain our clients. Our risk management
4
consulting services are designed to quantify and monitor commercial entities’ exposure to commodity and financial risk. Upon assessing this exposure, we develop a plan to control and hedge these risks with post-trade reporting against specific client objectives. Our clients are assisted in the execution of their hedging strategies through a wide range of products from listed exchange-traded futures and options, to basic OTC instruments that offer greater flexibility, to structured OTC products designed for customized solutions.
Our services span virtually all traded commodity markets, with the largest concentrations in agricultural and energy commodities (consisting primarily of grains, energy and renewable fuels, coffee, sugar, cotton, and food service) and base metals products listed on the London Metals Exchange (“LME”). Our base metals business includes a position as a Category One ring dealing member of the LME, providing execution, clearing and advisory services in exchange-traded futures and OTC products. We also provide execution of foreign currency forwards and options as well as a wide range of structured product solutions to our commercial customers who are seeking cost-effective hedging strategies. Generally, our clients direct their own trading activity, and our risk management consultants do not have discretionary authority to transact trades on behalf of our clients.
Within this segment, our risk management consultants organize their marketing efforts into customer industry product lines, and currently serve customers in the following areas:
• | Financial Agricultural & Energy |
◦ | Agricultural - |
▪ | Grain elevator operators, grain merchandisers, traders, processors, manufacturers and end-users. |
▪ | Livestock production, feeding and processing, dairy and users of agricultural commodities in the food industry. |
▪ | Coffee, sugar and cocoa producers, processors and end-users. |
▪ | Global fiber, textile and apparel industry. |
◦ | Energy and renewable fuels - |
▪ | Producers, refiners, wholesalers, transportation companies, convenience store chains, automobile and truck fleet operators, industrial companies, railroads, and municipalities. |
▪ | Consumers of natural gas including some of the largest natural gas consumers in North America, including municipalities and large manufacturing firms, as well as major utilities. |
▪ | Ethanol and biodiesel producers and end-users. |
◦ | Other - |
▪ | Lumber mills, wholesalers, distributors and end-users. |
▪ | Commercial entities seeking to hedge their foreign exchange exposures. |
• | LME Metals |
◦ | Commercial - |
▪ | Producers, consumers and merchants of copper, aluminum, zinc, lead, nickel, tin and other ferrous products. |
◦ | Institutional - |
▪ | Commodity trading advisors and hedge funds seeking clearing and execution of LME and NYMEX/COMEX base metal products. |
Global Payments
We provide global payment solutions to banks and commercial businesses as well as charities and non-governmental organizations and government organizations. We offer payments services in more than 130 countries, which we believe is more than any other payments solution provider, and provide competitive and transparent pricing. Through our technology platform, full-service electronic execution capability and commitment to customer service, we believe we are able to provide simple and fast execution, ensuring delivery of funds in any of these countries quickly through our global network of correspondent banks. In this business, we primarily act as a principal in buying and selling foreign currencies on a spot basis. We derive revenue from the difference between the purchase and sale prices.
We believe our clients value our ability to provide exchange rates that are significantly more competitive than those offered by large international banks, a competitive advantage that stems from our years of foreign exchange expertise focused on smaller, less liquid currencies. Additionally, as a member of SWIFT (Society for Worldwide Interbank Financial Telecommunication), we are able to offer our services to large money center and global banks seeking more competitive international payments services.
5
Securities
We provide value-added solutions that facilitate cross-border trading and believe our clients value our ability to manage complex transactions, including foreign exchange, utilizing our local understanding of market convention, liquidity and settlement protocols around the world. Our clients include U.S.-based regional and national broker-dealers and institutions investing or executing client transactions in international markets and foreign institutions seeking access to the U.S. securities markets. We are one of the leading market makers in foreign securities, including unlisted ADRs, GDRs and foreign ordinary shares. We make markets in over 1,600 ADRs, GDRs and foreign ordinary shares, of which over 1,300 trade in the OTC market. In addition, we will, on request, make prices in more than 10,000 unlisted foreign securities. We are a broker-dealer in Argentina where we are active in providing institutional executions in the local capital markets.
Following our acquisition of G.X. Clarke & Co., we act as an institutional dealer in fixed income securities, including U.S. Treasury, U.S. government agency and agency mortgage-backed securities to a client base including asset managers, commercial bank trust and investment departments, broker-dealers and insurance companies.
In addition, we provide a full range of corporate finance advisory services to our middle market clients, including capital market solutions and a wide array of advisory services across a broad spectrum of industries. Our advisory services span mergers and acquisitions, liability management, restructuring opinions and valuations. We also originate, structure and place a wide array of debt instruments in the international and domestic capital markets. These instruments include complex asset-backed securities (primarily in Argentina), unsecured bond and loan issues, negotiable notes and other trade-related debt instruments used in cross-border trade finance. On occasion, we may invest our own capital in debt instruments before selling them. We also actively trade in a variety of international debt instruments as well as operate an asset management business in which we earn fees, commissions and other revenues for management of third party assets and investment gains or losses on our investments in funds and proprietary accounts managed either by our investment managers or by independent investment managers.
Physical Commodities
This segment consists of our physical precious metals trading and physical agricultural and energy commodity businesses. In precious metals, we provide a full range of trading and hedging capabilities, including OTC products, to select producers, consumers, and investors. In our trading activities, we act as a principal, committing our own capital to buy and sell precious metals on a spot and forward basis.
Our physical agricultural and energy commodity business provides financing to commercial commodity-related companies against physical inventories, including grain, lumber, meats, energy products and renewable fuels. We use sale and repurchase agreements to purchase commodities evidenced by warehouse receipts, subject to a simultaneous agreement to sell such commodities back to the original seller at a later date. These transactions are accounted for as product financing arrangements, and accordingly no commodity inventory, purchases or sales are recorded. Additionally, we engage as a principal in physical purchase and sale transactions related to inputs to the renewable fuels and feed ingredient industries.
During 2015, we transitioned the portion of our precious metals business conducted through our unregulated domestic subsidiary, INTL Commodities Inc., to our United Kingdom based broker-dealer subsidiary, INTL FCStone Ltd, which is regulated by the Financial Conduct Authority (“FCA”), the regulator of the financial services industry in the United Kingdom. This transfer resulted in a change in the valuation of precious metals inventory held by INTL FCStone Ltd., as well as the presentation of INTL FCStone Ltd.’s precious metals sales and cost of sales. See Note 1 of the Consolidated Financial Statements for further information.
Precious metals inventory held by our subsidiaries that are not broker-dealers continues to be valued at the lower of cost or market value. Precious metals sales and cost of sales for subsidiaries that are not broker-dealers continue to be recorded on a gross basis. In our physical agricultural and energy commodity business, we value our inventory at the lower of cost or market and record revenues on a gross basis.
During the second quarter of fiscal 2013, as a result of a change in management strategy in our base metals product line, we elected to pursue an exit of our physical base metals business through the sale and orderly liquidation of then-current open positions. We completed the exit of the physical base metals business during the second quarter of fiscal 2014. We have reclassified the physical base metals activities in the financial statements for all periods presented as discontinued operations.
Operating revenues and losses from our commodities derivatives activities are included in ‘trading gains, net’ in the consolidated income statements. We generally mitigate the price risk associated with commodities held in inventory through the use of derivatives. We do not elect hedge accounting under U.S. GAAP in accounting for this price risk mitigation.
Clearing and Execution Services (“CES”)
We seek to provide competitive and efficient clearing and execution of exchange-traded futures and options for the institutional and professional trader market segments. Through our platform, client orders are accepted and directed to the appropriate
6
exchange for execution. We then facilitate the clearing of clients’ transactions. Clearing involves the matching of clients’ trades with the exchange, the collection and management of client margin deposits to support the transactions, and the accounting and reporting of the transactions to clients. We seek to leverage our capabilities and capacity by offering facilities management or outsourcing solutions to other futures commission merchants (“FCM’s”).
In addition, we provide prime brokerage foreign exchange services to financial institutions and professional traders. We provide our clients with the full range of OTC products, including 24-hour a day execution of spot, forwards and options as well as non-deliverable forwards in both liquid and exotic currencies. We also operate a proprietary foreign exchange desk that arbitrages the exchange-traded foreign exchange markets with the cash markets.
INTL FCStone Financial Inc. (“INTL FCStone Financial”) is a dually registered broker-dealer/FCM and a clearing member of all major U.S. commodity futures exchanges including the Chicago Mercantile Exchange and its divisions: the Chicago Board of Trade, the New York Mercantile Exchange and the COMEX Division; InterContinental Exchange, Inc. (“ICE”) Futures US, and the Minneapolis Grain Exchange (“MGEX”). INTL FCStone Financial is also a member of ICE Europe Ltd and as of September 30, 2015, was the third largest independent FCM in the United States, as measured by required customer segregated assets, not affiliated with a major financial institution or commodity intermediary, end-user or producer. As of September 30, 2015, INTL FCStone Financial had $1.8 billion in required customer segregated assets.
Acquisitions and Internal Subsidiary Consolidation during Fiscal Year 2015
G.X. Clarke & Co.
Effective January 1, 2015, we acquired all of the partnership interests of G.X. Clarke & Co. (“G.X. Clarke”), an SEC registered institutional dealer in fixed income securities. G.X. Clarke is based in New Jersey, transacts in U.S. Treasury, U.S. government agency and agency mortgage-backed securities, and was a member of the Financial Industry Regulatory Authority (“FINRA”) with an institutional client base consisting of asset managers, commercial bank trust and investment departments, broker-dealers, and insurance companies. The purchase price is equal to G.X. Clarke's net tangible book value at closing of $25.9 million plus a premium of $1.5 million, and up to an additional $1.5 million over the next three years, subject to the achievement of certain profitability thresholds. In conjunction with the acquisition, the name of G.X. Clarke was changed to INTL FCStone Partners L.P. Our consolidated financial statements include the operating results of INTL FCStone Partners L.P. from the date of acquisition.
Internal Subsidiary Consolidation
Effective July 1, 2015, we merged three of our wholly-owned regulated U.S. subsidiaries into our wholly owned regulated U.S. subsidiary, INTL FCStone Securities Inc., and the surviving entity was renamed INTL FCStone Financial Inc. and is registered as both a broker-dealer and a FCM. As such, the assets, liabilities and equity of FCStone, LLC, INTL FCStone Partners L.P., and FCC Investments, Inc. were transferred into INTL FCStone Financial.
Disposals during Fiscal Year 2014
Completed Exit of Physical Base Metals Business
During fiscal 2013, we began an exit of our physical base metals business through the sale and orderly liquidation of then-current open positions. We elected to allow the $100.0 million credit facility which supported this business to expire without renewal. The exit of the physical base metals business was substantially completed by the end of fiscal 2013, including the termination of the physical base metals trading team and certain operational support personnel. The remaining open contract positions were fulfilled during fiscal 2014, at which time we reclassified the physical base metals activities in the financial statements as discontinued operations. We continue to operate the component of our base metals business related to non-physical assets conducted primarily through the London Metals Exchange.
Acquisitions and Disposals during Fiscal Year 2013
Tradewire Acquisition
In December 2012, we acquired certain institutional accounts from Tradewire Securities, LLC (“Tradewire Securities”), a Miami-based securities broker-dealer servicing customers throughout Latin America and a wholly owned subsidiary of Tradewire Group Ltd. We transferred these accounts to our broker-dealer subsidiary, INTL FCStone Securities. As part of the transaction, we hired more than 20 professional staff from Tradewire Securities’ securities broker-dealer business based in Miami, Florida. These professionals provide global brokerage services to a wide range of customers, including hedge funds, pension funds, broker-dealers and banks located in Latin America, North America and Europe. This acquisition was not significant on an individual basis. Our consolidated financial statements include the operating results of the acquired accounts from the date of acquisition.
7
Gletir Agente De Valores S.A. Disposal
In February 2013, we sold all of our ownership interest in Gletir Agente De Valores S.A., to Gletir Financial Corp, an non-affiliated third party. Previously the ownership interest was held by our subsidiaries INTL Netherlands B.V. and Gainvest Asset Management Ltda.
Competition
The international commodities and financial markets are highly competitive and rapidly evolving. In addition, these markets are dominated by firms with significant capital and personnel resources that are not matched by our resources. We expect these competitive conditions to continue in the future, although the nature of the competition may change as a result of ongoing changes in the regulatory environment. The financial crisis has produced opportunities for us to expand our activities and may produce further opportunities. We believe that we can compete successfully with other commodities and financial intermediaries in the markets we seek to serve, based on our expertise, products and quality of consulting and execution services.
We compete with a large number of firms in the exchange-traded futures and options on futures execution sector and in the OTC derivatives sector. We compete primarily on the basis of diversity and value of services offered, and to a lesser extent on price. Our competitors in the exchange-traded futures and options sector include international brokerage firms, national brokerage firms, regional brokerage firms (both cooperatives and non-cooperatives) as well as local introducing brokers, with competition driven by price level and quality of service. Many of these competitors also offer OTC trading programs. In addition, there are a number of financial firms and physical commodities firms that participate in the OTC markets, both directly in competition with us and indirectly through firms like us. We compete in the OTC market by making specialized OTC transactions available to our customers in contract sizes that are smaller than those usually available from major counterparties.
Investor interest in the markets we serve impact and will continue to impact our activities. The instruments traded in these markets compete with a wide range of alternative investment instruments. We seek to counterbalance changes in demand in specified markets by undertaking activities in multiple uncorrelated markets.
Technology has increased competitive pressures on commodities and financial intermediaries by improving dissemination of information, making markets more transparent and facilitating the development of alternative execution mechanisms. In certain instances, we compete by providing technology-based solutions to facilitate customer transactions and solidify customer relationships.
Administration and Operations
We employ operations personnel to supervise and, for certain products, complete the clearing and settlement of transactions.
INTL FCStone Financial’s securities transactions are cleared through Broadcort, a division of Merrill Lynch, Pierce, Fenner & Smith, Inc and Pershing LLC, a subsidiary of The Bank of New York Mellon Corporation. In relation to security transactions, INTL FCStone Financial does not hold customer funds or directly clear or settle securities transactions.
We utilize front-end electronic trading, back office and accounting systems to process transactions on a daily basis. In some cases these systems are integrated. The systems provide record keeping, trade reporting to exchange clearing, internal risk controls, and reporting to government and regulatory entities, corporate managers, risk managers and customers. A third-party service bureau located in Hopkins, MN maintains our futures and options back office system. It has a disaster recovery site in Salem, NH.
We hold customer funds in relation to certain of our activities. In regulated entities, these customer funds are segregated, but in unregulated entities they are not. For a further discussion of customer segregated funds in our regulated entities, please see the “Customer Segregated Assets” discussion below.
Our administrative staff manages our internal financial controls, accounting functions, office services and compliance with regulatory requirements.
Governmental Regulation and Exchange Membership
Our activities are subject to significant governmental regulation, both in the U.S. and overseas. Failure to comply with regulatory requirements could result in administrative or court proceedings, censure, fines, issuance of cease-and-desist orders, or suspension or disqualification of the regulated entity, its officers, supervisors or representatives. The regulatory environment in which we operate is subject to frequent change and these changes directly impact our business and operating results.
The commodities industry in the U.S. is subject to extensive regulation under federal law. We are required to comply with a wide range of requirements imposed by the Commodity Futures Trading Commission (the “CFTC”), the National Futures Association (the “NFA”) and the Chicago Mercantile Exchange, which is our designated self-regulatory organization. We are
8
also a member of the Chicago Mercantile Exchange’s divisions: the Chicago Board of Trade, the New York Mercantile Exchange and COMEX, ICE Futures US, ICE Europe Ltd, and the Minneapolis Grain Exchange. These regulatory bodies protect customers by imposing requirements relating to capital adequacy, licensing of personnel, conduct of business, protection of customer assets, record-keeping, trade-reporting and other matters.
The securities industry in the U.S. is subject to extensive regulation under federal and state securities laws. We must comply with a wide range of requirements imposed by the Securities and Exchange Commission (the “SEC”), state securities commissions, the Municipal Securities Rulemaking Board (“MSRB”) and FINRA. These regulatory bodies safeguard the integrity of the financial markets and protect the interests of investors in these markets. They also impose minimum capital requirements on regulated entities.
The Financial Conduct Authority (“FCA”), the regulator of the financial services industry in the United Kingdom, regulates our subsidiary, INTL FCStone Ltd., as a Financial Services Firm under part IV of the Financial Services and Markets Act 2000. The regulations impose daily regulatory capital, as well as conduct of business, governance, and other requirements. The conduct of business rules include those that govern the treatment of client money and other assets which, under certain circumstances for certain classes of clients must be segregated from the firm’s own assets.
The Dodd-Frank Wall Street Reform and Consumer Protection Act (the “Dodd-Frank Act”) created a comprehensive new regulatory regime governing the OTC and listed derivatives markets and their participants by requiring, among other things: centralized clearing of standardized derivatives (with certain stated exceptions); the trading of clearable derivatives on swap execution facilities or exchanges; and registration and comprehensive regulation of new categories of market participants as “swap dealers” and swap “introducing brokers.” Our wholly owned subsidiary, INTL FCStone Markets, LLC, is registered as a provisionally registered swap dealer. Some important rules, such as those setting capital and margin requirements, have not been finalized or fully implemented, and it is too early to predict with any degree of certainty how we will be affected. We will continue to monitor all applicable developments in the implementation of the Dodd-Frank Act. The legislation and implementing regulations affect not only us, but also our customers and counterparties.
The USA PATRIOT Act contains anti-money laundering and financial transparency laws and mandates the implementation of various regulations applicable to broker-dealers and other financial services companies. The USA PATRIOT Act seeks to promote cooperation among financial institutions, regulators and law enforcement entities in identifying parties that may be involved in terrorism or money laundering. Anti-money laundering laws outside of the U.S. contain similar provisions. We believe that we have implemented, and that we maintain, appropriate internal practices, procedures and controls to enable us to comply with the provisions of the USA PATRIOT Act and other anti-money laundering laws.
The U.S. maintains various economic sanctions programs administered by the U.S. Treasury Department’s Office of Foreign Assets Control (“OFAC”). The OFAC administered sanctions take many forms, but generally prohibit or restrict trade and investment in and with sanctions targets, and in some cases require blocking of the target’s assets. Violations of any of the OFAC-administered sanctions are punishable by civil fines, criminal fines, and imprisonment. We established policies and procedures designed to comply with applicable OFAC requirements. Although we believe that our policies and procedures are effective, there can be no assurance that our policies and procedures will effectively prevent us from violating the OFAC-administered sanctions in every transaction in which we may engage.
Net Capital Requirements
INTL FCStone Financial is subject to minimum capital requirements under Section 4(f)(b) of the Commodity Exchange Act, Part 1.17 of the rules and regulations of the CFTC and the SEC Uniform Net Capital Rule 15c3-1 under the Securities Exchange Act of 1934. These rules specify the minimum amount of capital that must be available to support our clients’ open trading positions, including the amount of assets that INTL FCStone Financial must maintain in relatively liquid form, and are designed to measure general financial integrity and liquidity. Net capital and the related net capital requirement may fluctuate on a daily basis. Compliance with minimum capital requirements may limit our operations if we cannot maintain the required levels of capital and restrict the ability of INTL FCStone Financial to make distributions to us. Moreover, any change in these rules or the imposition of new rules affecting the scope, coverage, calculation or amount of capital we are required to maintain could restrict our ability to operate our business and adversely affect our operations.
INTL FCStone Ltd., a Financial Services Firm regulated by the FCA is subject to a daily net capital requirement.
The Australian Securities and Investment Commission regulates INTL FCStone Pty. Ltd. It is subject to a net tangible asset capital requirement. In addition, INTL FCStone Pty. Ltd. is also subject to a capital adequacy requirements of New Zealand Clearing Limited.
The Brazilian Central Bank and Securities and Exchange Commission of Brazil regulates INTL FCStone DTVM Ltda. (“INTL FCStone DTVM”). It is a registered broker-dealer and is subject to a capital adequacy requirement.
9
The Comision Nacional de Valores regulates Gainvest S.A. Sociedad Gerente de FCI and INTL CIBSA S.A. and they are subject to net capital and capital adequacy requirements. The Rosario Futures Exchange and the General Inspector of Justice regulate INTL Capital, S.A. It is subject to a capital adequacy requirement.
Certain of our other non-U.S. subsidiaries are also subject to capital adequacy requirements promulgated by authorities of the countries in which they operate.
All of our subsidiaries are in compliance with all of their capital regulatory requirements as of September 30, 2015. Additional information on these net capital and minimum net capital requirements can be found in Note 12 to the Consolidated Financial Statements.
Segregated Customer Assets
INTL FCStone Financial maintains customer segregated deposits from its customers relating to their trading of futures and options on futures on U.S. commodities exchanges held with INTL FCStone Financial, making it subject to CFTC regulation 1.20, which specifies that such funds must be held in segregation and not commingled with the firm’s own assets. INTL FCStone Financial maintains acknowledgment letters from each depository at which it maintains customer segregated deposits in which the depository acknowledges the nature of funds on deposit in the account. In addition, CFTC regulations require filing of a daily segregation calculation which compares the assets held in customers segregated depositories (“segregated assets”) to the firm’s total segregated assets held on deposit from customers (“segregated liabilities”). The amount of customer segregated assets must be in excess of the segregated liabilities owed to customers and any shortfall in such assets must be immediately communicated to the CFTC. As of September 30, 2015, INTL FCStone Financial maintained $49.3 million in segregated assets in excess of its segregated liabilities.
In addition, INTL FCStone Financial is subject to CFTC regulation 1.25, which governs the acceptable investment of customer segregated assets. This regulation allows for the investment of customer segregated assets in readily marketable instruments including U.S. Treasury securities, municipal securities, government sponsored enterprise securities, certificates of deposit, commercial paper and corporate notes or bonds which are guaranteed by the U.S. under the Temporary Liquidity Guarantee Program, interest in money market mutual funds, and repurchase transactions with unaffiliated entities in otherwise allowable securities. INTL FCStone Financial predominately invests its customer segregated assets in U.S. Treasury securities and money market mutual funds.
INTL FCStone Ltd. is subject to certain business rules, including those that govern the treatment of client money and other assets which under certain circumstances for certain classes of client must be segregated from the firm’s own assets. As of September 30, 2015, INTL FCStone Ltd. was in compliance with the applicable segregated funds requirements.
Secured Customer Assets
INTL FCStone Financial maintains customer secured deposits from its customers funds relating to their trading of futures and options on futures traded on, or subject to the rules of, a foreign board of trade held with INTL FCStone Financial, making it subject to CFTC Regulation 30.7, which requires that such funds must be carried in separate accounts in an amount sufficient to satisfy all of INTL FCStone Financial’s current obligations to customers trading foreign futures and foreign options on foreign commodity exchanges or boards of trade, which are designated as secured customers’ accounts. As of September 30, 2015, INTL FCStone Financial maintained $20.4 million in secured assets in excess of its secured liabilities.
Foreign Operations
We operate in a number of foreign jurisdictions, including Canada, Ireland, the United Kingdom, Argentina, Brazil, Colombia, Uruguay, Paraguay, Mexico, Nigeria, Dubai, China, South Korea, Hong Kong, Australia and Singapore. We established wholly owned subsidiaries in Uruguay and Nigeria but do not have offices or employees in those countries.
INTL FCStone Ltd. is domiciled in the United Kingdom, and subject to regulation by the FCA.
In Argentina, the activities of Gainvest S.A. Sociedad Gerente de FCI and INTL CIBSA S.A. are subject to regulation by the Comision Nacional de Valores and the activities of INTL Capital, S.A. are subject to regulation by the Rosario Futures Exchange and the General Inspector of Justice.
In Brazil, the activities of FCStone do Brasil are subject to regulation by BM&F Bovespa, and the activities of INTL FCStone DTVM Ltda. are regulated by the Brazilian Central Bank and Securities and Exchange Commission of Brazil.
The activities of INTL Commodities DMCC are subject to regulation by the Dubai Multi Commodities Centre.
INTL FCStone Pte. Ltd. is subject to regulation by the Monetary Authority of Singapore.
INTL FCStone Pty. Ltd. is subject to regulation by the Australian Securities and Investments Commission and New Zealand Clearing Ltd.
10
INTL FCStone (Hong Kong) Limited holds a type 2 derivatives license and is subject to regulation by the Securities & Futures Commission of Hong Kong.
Business Risks
We seek to mitigate the market and credit risks arising from our financial trading activities through an active risk management program. The principal objective of this program is to limit trading risk to an acceptable level while maximizing the return generated on the risk assumed.
We have a defined risk policy administered by our risk management committee, which reports to the risk committee of our board of directors. We established specific exposure limits for inventory positions in every business, as well as specific issuer limits and counterparty limits. We designed these limits to ensure that in a situation of unexpectedly large or rapid movements or disruptions in one or more markets, systemic financial distress, the failure of a counterparty or the default of an issuer, the potential estimated loss will remain within acceptable levels. The risk committee of our board of directors reviews the performance of the risk management committee on a quarterly basis to monitor compliance with the established risk policy.
Employees
As of September 30, 2015, we employed 1,231 people globally: 822 in the U.S., 176 in the United Kingdom, 82 in Brazil, 62 in Argentina, 40 in Singapore, 13 in Dubai, 13 in Australia, 9 in Paraguay, 8 in China, and 6 in Hong Kong. None of our employees operate under a collective bargaining agreement, and we have not suffered any work stoppages or labor disputes. Many of our employees are subject to employment agreements, certain of which contain non-competition provisions.
Item 1A. Risk Factors
We face a variety of risks that could adversely impact our financial condition and results of operations, including the following:
Our ability to achieve consistent profitability is subject to uncertainty due to the nature of our businesses and the markets in which we operate. During the fiscal year ended September 30, 2015 we recorded net income of $55.7 million, compared to net income of $19.3 million in fiscal 2014 and in fiscal 2013.
Our revenues and operating results may fluctuate significantly in the future because of the following factors:
• | Market conditions, such as price levels and volatility in the commodities, securities and foreign exchange markets in which we operate; |
• | Changes in the volume of our market-making and trading activities; |
• | Changes in the value of our financial instruments, currency and commodities positions and our ability to manage related risks; |
• | The level and volatility of interest rates; |
• | The availability and cost of funding and capital; |
• | Our ability to manage personnel, overhead and other expenses; |
• | Changes in execution and clearing fees; |
• | The addition or loss of sales or trading professionals; |
• | Changes in legal and regulatory requirements; and |
• | General economic and political conditions. |
Although we continue our efforts to diversify the sources of our revenues, it is likely that our revenues and operating results will continue to fluctuate substantially in the future and such fluctuations could result in losses. These losses could have a material adverse effect on our business, financial condition and operating results.
The manner in which we account for our commodities inventory and forward commitments may increase the volatility of our reported earnings. Our net income is subject to volatility due to the manner in which we report our commodities inventory. Our inventory held in subsidiaries which are not broker-dealers is stated at the lower of cost or market value. We generally mitigate the price risk associated with our commodities inventory through the use of derivatives. This price risk mitigation does not generally qualify for hedge accounting under U.S. GAAP. In such situations, any unrealized gains in inventory in our non-broker dealer subsidiaries are not recognized under U.S. GAAP, but unrealized gains and losses in related derivative positions are recognized under U.S. GAAP. Additionally, in certain circumstances, U.S. GAAP does not permit us to reflect changes in estimated values of forward commitments to purchase and sell commodities. The forward commitments to purchase and sell commodities, which we do not reflect in our consolidated balance sheets, do not qualify as a derivative under the Derivatives and Hedging Topic of the ASC. As a result, our reported earnings from these business segments are subject to greater volatility than the earnings from our other business segments.
Our indebtedness could adversely affect our financial condition. As of September 30, 2015, our total consolidated indebtedness was $87.1 million, and we may increase our indebtedness in the future as we continue to expand our business. Our indebtedness could have important consequences, including:
11
• | increasing our vulnerability to general adverse economic and industry conditions; |
• | requiring that a portion of our cash flow from operations be used for the payment of interest on our debt, thereby reducing our ability to use our cash flow to fund working capital, capital expenditures, acquisitions and general corporate requirements; |
• | limiting our ability to obtain additional financing to fund future working capital, capital expenditures, acquisitions and general corporate requirements; |
• | limiting our flexibility in planning for, or reacting to, changes in our business and the securities industry; and |
• | restricting our ability to pay dividends or make other payments. |
We may be able to incur additional indebtedness in the future, including secured indebtedness. If new indebtedness is added to our current indebtedness levels, the related risks that we now face could intensify.
Committed credit facilities currently available to us might not be renewed. We currently have four committed credit facilities under which we may borrow up to $280.0 million, consisting of:
• | a $140.0 million facility available to INTL FCStone Inc., for general working capital requirements, committed until September 20, 2016. |
• | a $75.0 million facility available to our wholly owned subsidiary, INTL FCStone Financial, for short-term funding of margin to commodity exchanges, committed until April 7, 2016. |
• | a $40.0 million committed facility available to our wholly owned subsidiary, FCStone Merchant Services, LLC, for financing traditional commodity financing arrangements and commodity repurchase agreements, committed until May 1, 2016. |
• | a $25.0 million facility available to our wholly owned subsidiary, INTL FCStone Ltd., for short-term funding of margin to commodity exchanges, committed until October 31, 2016. |
During fiscal 2016, $255 million of our committed credit facilities are scheduled to expire. There is no guarantee that we will be successful in renewing, extending or rearranging these facilities.
It is possible that these facilities might not be renewed at the end of their commitment periods and that we will be unable to replace them with other facilities. If our credit facilities are unavailable or insufficient to support future levels of business activities, we may need to raise additional funds externally, either in the form of debt or equity. If we cannot raise additional funds on acceptable terms, we may not be able to develop or enhance our business, take advantage of future opportunities or respond to competitive pressure or unanticipated requirements, leading to reduced profitability.
Our failure to successfully integrate the operations of businesses acquired by us in the last twelve months could have a material adverse effect on our business, financial condition and operating results. Since September 30, 2014, we have acquired G.X. Clarke. We will need to meet challenges to realize the expected benefits and synergies of this acquisition, including:
• | integrating the management teams, strategies, cultures, technologies and operations of the acquired companies; |
• | retaining and assimilating the key personnel of acquired companies; |
• | retaining existing clients of the acquired companies; |
• | creating uniform standards, controls, procedures, policies and information systems; and |
• | achieving revenue growth because of risks involving (1) the ability to retain clients, (2) the ability to sell the services and products of the acquired companies to the existing clients of our other business segments, and (3) the ability to sell the services and products of our other business segments to the existing clients of the acquired companies. |
The accomplishment of these objectives will involve considerable risk, including:
• | the potential disruption of each company’s ongoing business and distraction of their respective management teams; |
• | unanticipated expenses related to technology integration; and |
• | potential unknown liabilities associated with the acquisition. |
It is possible that the integration process could result in the loss of the technical skills and management expertise of key employees, the disruption of the ongoing businesses or inconsistencies in standards, controls, procedures and policies due to possible cultural conflicts or differences of opinions on technical decisions and product road maps that adversely affect our ability to maintain relationships with customers, counterparties, and employees or to achieve the anticipated benefits of the acquisition.
We face risks associated with our market-making and trading activities. We conduct our market-making and trading activities predominantly as a principal, which subjects our capital to significant risks. These activities involve the purchase, sale or short sale for customers and for our own account of financial instruments, including equity and debt securities, commodities and foreign exchange. These activities are subject to a number of risks, including risks of price fluctuations, rapid changes in the liquidity of markets and counterparty creditworthiness.
12
These risks may limit our ability to either resell financial instruments we purchased or to repurchase securities we sold in these transactions. In addition, we may experience difficulty borrowing financial instruments to make delivery to purchasers to whom we sold short, or lenders from whom we have borrowed. From time to time, we have large position concentrations in securities of a single issuer or issuers in specific countries and markets. This concentration could result in higher trading losses than would occur if our positions and activities were less concentrated.
The success of our market-making activities depends on:
• | the price volatility of specific financial instruments, currencies and commodities, |
• | our ability to attract order flow; |
• | the skill of our personnel; |
• | the availability of capital; and |
• | general market conditions. |
To attract market-trading, market-making and trading business, we must be competitive in:
• | providing enhanced liquidity to our customers; |
• | the efficiency of our order execution; |
• | the sophistication of our trading technology; and |
• | the quality of our customer service. |
In our role as a market maker and trader, we attempt to derive a profit from the difference between the prices at which we buy and sell financial instruments, currencies and commodities. However, competitive forces often require us to:
• | match the quotes other market makers display; and |
• | hold varying amounts of financial instruments, currencies and commodities in inventory. |
By having to maintain inventory positions, we are subject to a high degree of risk. We cannot ensure that we will be able to manage our inventory risk successfully or that we will not experience significant losses, either of which could materially adversely affect our business, financial condition and operating results.
We operate as a principal in the OTC derivatives markets which involves the risks associated with commodity derivative instruments. We offer OTC derivatives to our customers in which we act as a principal counterparty. We endeavor to simultaneously offset the commodity price risk of the instruments by establishing corresponding offsetting positions with commodity counterparties, or alternatively we may offset those transactions with similar but not identical positions on an exchange. To the extent that we are unable to simultaneously offset an open position or the offsetting transaction is not fully effective to eliminate the commodity derivative risk, we have market risk exposure on these unmatched transactions. Our exposure varies based on the size of the overall positions, the terms and liquidity of the instruments brokered, and the amount of time the positions remain open.
To the extent an unhedged position is not disposed of intra-day, adverse movements in the commodities underlying these positions or a downturn or disruption in the markets for these positions could result in a substantial loss. In addition, any principal gains and losses resulting from these positions could on occasion have a disproportionate effect, positive or negative, on our financial condition and results of operations for any particular reporting period.
Transactions involving OTC derivative contracts may be adversely affected by fluctuations in the level, volatility, correlation or relationship between market prices, rates, indices and/or other factors. These types of instruments may also suffer from illiquidity in the market or in a related market.
OTC derivative transactions are subject to unique risks. OTC derivative transactions are subject to the risk that, as a result of mismatches or delays in the timing of cash flows due from or to counterparties in OTC derivative transactions or related hedging, trading, collateral or other transactions, we or our counterparty may not have adequate cash available to fund its current obligations.
We could incur material losses pursuant to OTC derivative transactions because of inadequacies in or failures of our internal systems and controls for monitoring and quantifying the risk and contractual obligations associated with OTC derivative transactions and related transactions or for detecting human error, systems failure or management failure.
OTC derivative transactions may be modified or terminated only by mutual consent of the original parties and subject to agreement on individually negotiated terms. Accordingly it may not be possible to modify, terminate or offset obligations or exposure to the risk associated with a transaction prior to its scheduled termination date.
We may have difficulty managing our growth. We have experienced significant growth in our business. Our operating revenues grew from $398.9 million in fiscal 2011 to $624.3 million in fiscal 2015.
This growth required, and will continue to require, us to increase our investment in management personnel, financial and management systems and controls, and facilities. In the absence of continued revenue growth, the costs associated with our expected growth would cause our operating margins to decline from current levels. In addition, as is common in the financial
13
industry, we are and will continue to be highly dependent on the effective and reliable operation of our communications and information systems.
The scope of procedures for assuring compliance with applicable rules and regulations changes as the size and complexity of our business increases. In response, we have implemented and continue to revise formal compliance procedures.
It is possible that we will not be able to manage our growth successfully. Our inability to do so could have a material adverse effect on our business, financial condition and operating results.
Our risk management policies and procedures may leave us exposed to unidentified or unanticipated risk, which could harm our business. We have devoted significant resources to develop our risk management policies and procedures and expect to continue to do so in the future. However, our risk management policies and procedures may not be fully effective in mitigating our risk exposure in all market environments or against all types of risk, including risks that are unidentified or unanticipated. Our risk management policies and procedures require, among other things, that we properly record and verify many thousands of transactions and events each day, and that we continuously monitor and evaluate the size and nature of our or our clients' positions and the associated risks. In light of the high volume of transactions, it is impossible for us to review and assess every single transaction or to monitor at every moment in time our or our customers' positions and the associated risks.
Our policies and procedures used to identify, monitor and control a variety of risks, including risks related to human error, customer defaults, market movements, fraud and money-laundering, are established and reviewed by the Risk Committee of our Board of Directors. Some of our methods for managing risk are discretionary by nature and are based on internally developed controls and observed historical market behavior, and also involve reliance on standard industry practices. These methods may not adequately prevent losses, particularly as they relate to extreme market movements, which may be significantly greater than historical fluctuations in the market. Our risk management policies and procedures also may not adequately prevent losses due to technical errors if our testing and quality control practices are not effective in preventing software or hardware failures. In addition, we may elect to adjust our risk management policies and procedures to allow for an increase in risk tolerance, which could expose us to the risk of greater losses. Our risk management policies and procedures rely on a combination of technical and human controls and supervision that are subject to error and failure. These policies and procedures may not protect us against all risks or may protect us less than anticipated, in which case our business, financial condition and results of operations and cash flows may be materially adversely affected.
We are exposed to the credit risk of our customers and counterparties and their failure to meet their financial obligations could adversely affect our business. We have substantial credit risk in both our securities and commodities businesses. As a market-maker of OTC and listed securities and a dealer in fixed income securities, we conduct the majority of our securities transactions as principal with institutional counterparties. We clear our securities transactions through unaffiliated clearing brokers. Substantially all of our equity and debt securities are held by these clearing brokers. Our clearing brokers have the right to charge us for losses that result from a counterparty’s failure to fulfill its contractual obligations.
As a clearing broker in futures and option transactions, we act on behalf of our customers for all trades consummated on exchanges. We must pay initial and variation margin to the exchanges before we receive the required payments from our customers. Accordingly, we are responsible for our customers’ obligations with respect to these transactions, including margin payments, which exposes us to significant credit risk. Customer positions which represent a significant percentage of open positions in a given market or concentrations in illiquid markets may expose us to the risk that we are not able to liquidate a customer’s position in a manner which does not result in a deficit in that customers account. A substantial part of our working capital is at risk if customers default on their obligations to us and their account balances and security deposits are insufficient to meet all of their obligations.
We act as a principal for OTC commodity and foreign exchange derivative transactions, which exposes us to both the credit risk of our customers and the counterparties with which we offset the customer’s position. As with exchange-traded transactions, our OTC transactions require that we meet initial and variation margin payments on behalf of our customers before we receive the required payment from our customers. In addition, with OTC transactions, there is a risk that a counterparty will fail to meet its obligations when due. We would then be exposed to the risk that a settlement of a transaction which is due a customer will not be collected from the respective counterparty with which the transaction was offset. Customers and counterparties that owe us money, securities or other assets may default on their obligations to us due to bankruptcy, lack of liquidity, operational failure or other reasons.
We act as a principal in our physical commodities trading activities which exposes us to the credit risk of our counterparties and customers in these activities. Any metals or other physical commodities positions are held by third party custodians.
Although we have procedures for reviewing credit exposures to specific customers and counterparties to address present credit concerns, default risk may arise from events or circumstances that are difficult to detect or foresee, including rapid changes in securities, commodity and foreign exchange price levels. Some of our risk management methods depend upon the evaluation of information regarding markets, clients or other matters that are publicly available or otherwise accessible by us. That
14
information may not, in all cases, be accurate, complete, up-to-date or properly evaluated. In addition, concerns about, or a default by, one institution could lead to significant liquidity problems, losses or defaults by other institutions, which in turn could adversely affect us. We may be materially and adversely affected in the event of a significant default by our customers and counterparties.
In our securities and commodities trading businesses we rely on the ability of our clearing brokers to adequately discharge their obligations on a timely basis. We also depend on the solvency of our clearing brokers and custodians. Any failure by a clearing broker to adequately discharge its obligations on a timely basis, or insolvency of a clearing broker or custodian, or any event adversely affecting our clearing brokers or custodians, could have a material adverse effect on our business, financial condition and operating results.
As a clearing member firm of commodities clearing houses in the U.S. and abroad, we are also exposed to clearing member credit risk. Commodities clearing houses require member firms to deposit cash and/or government securities to a clearing fund. If a clearing member defaults in its obligations to the clearing house in an amount larger than its own margin and clearing fund deposits, the shortfall is absorbed pro rata from the deposits of the other clearing members. Several clearing houses of which we are members also have the authority to assess their members for additional funds if the clearing fund is depleted. A large clearing member default could result in a substantial cost to us if we are required to pay such assessments.
Our net operating revenues may decrease due to changes in market volume, prices or liquidity. Declines in the volume of securities, commodities and foreign exchange transactions and in market liquidity generally may result in lower revenues from market-making and trading activities. Changes in price levels of securities and commodities and foreign exchange rates also may result in reduced trading activity and reduce our revenues from market-making transactions. Changed price levels also can result in losses from changes in the fair value of securities and commodities held in inventory. Sudden sharp changes in fair values of securities and commodities can result in:
• | illiquid markets; |
• | fair value losses arising from positions held by us; |
• | the failure of buyers and sellers of securities and commodities to fulfill their settlement obligations, |
• | redemptions from funds managed in our asset management business segment and consequent reductions in management fees; |
• | reductions in accrued performance fees in our asset management business segment; and |
• | increases in claims and litigation. |
Any change in market volume, price or liquidity or any other of these factors could have a material adverse effect on our business, financial condition and operating results.
Our net operating revenues may decrease due to changes in customer trading volumes which are dependent in large part on commodity prices and commodity price volatility. Customer trading volumes are largely driven by the degree of volatility—the magnitude and frequency of fluctuations—in prices of commodities. Higher volatility increases the need to hedge contractual price risk and creates opportunities for arbitrage trading. Energy and agricultural commodities markets periodically experience significant price volatility. In addition to price volatility, increases in commodity prices lead to increased trading volume. As prices of commodities rise, especially energy prices, new participants enter the markets to address their growing risk-management needs or to take advantage of greater trading opportunities. Sustained periods of stability in the prices of commodities or generally lower prices could result in lower trading volumes and, potentially, lower revenues. Lower volatility and lower volumes could lead to lower customer balances held on deposit, which in turn may reduce the amount of interest revenue based on these deposits.
Factors that are particularly likely to affect price volatility and price levels of commodities include:
• | supply and demand of commodities; |
• | weather conditions affecting certain commodities; |
• | national and international economic and political conditions; |
• | perceived stability of commodities and financial markets; |
• | the level and volatility of interest rates and inflation; and |
• | financial strength of market participants. |
Any one or more of these factors may reduce price volatility or price levels in the markets for commodities trading, which in turn could reduce trading activity in those markets. Moreover, any reduction in trading activity could reduce liquidity which in turn could further discourage existing and potential market participants and thus accelerate any decline in the level of trading activity in these markets.
Our net operating revenues may be impacted by diminished market activity due to adverse economic, political and market conditions. The amount of our revenues depends in part on the level of activity in the securities, foreign exchange and commodities markets in which we conduct business. The level of activity in these markets is directly affected by numerous national and international factors that are beyond our control, including:
15
• | economic, political and market conditions; |
• | the availability of short-term and long-term funding and capital; |
• | the level and volatility of interest rates; |
• | legislative and regulatory changes; and |
• | currency values and inflation. |
Any one or more of these factors may reduce the level of activity in these markets, which could result in lower revenues from our market-making and trading activities. Any reduction in revenues or any loss resulting from these factors could have a material adverse effect on our business, financial condition and operating results.
We depend on our management team. Our future success depends, in large part, upon our management team who possess extensive knowledge and management skills with respect to securities, commodities and foreign exchange businesses we operate. The unexpected loss of services of any of our executive officers could adversely affect our ability to manage our business effectively or execute our business strategy. Although some of these officers have employment contracts with us, they are generally not required to remain with us for a specified period of time.
We depend on our ability to attract and retain key personnel. Competition for key personnel and other highly qualified management, sales, trading, compliance and technical personnel is significant. It is possible that we will be unable to retain our key personnel and to attract, assimilate or retain other highly qualified personnel in the future. The loss of the services of any of our key personnel or the inability to identify, hire, train and retain other qualified personnel in the future could have a material adverse effect on our business, financial condition and operating results.
From time to time, other companies in the financial sector have experienced losses of sales and trading professionals. The level of competition to attract these professionals is intense. It is possible that we will lose professionals due to increased competition or other factors in the future. The loss of a sales and trading professional, particularly a senior professional with broad industry expertise, could have a material adverse effect on our business, financial condition and operating results.
In the event of employee misconduct or error, our business may be harmed. There have been a number of highly publicized cases involving fraud or other misconduct by employees of financial services firms in recent years. Employee misconduct or error could subject us to legal liability, financial losses and regulatory sanctions and could seriously harm our reputation and negatively affect our business. Misconduct by employees could include engaging in improper or unauthorized transactions or activities, failing to properly supervise other employees or improperly using confidential information. Employee errors, including mistakes in executing, recording or processing transactions for customers, could cause us to enter into transactions that clients may disavow and refuse to settle, which could expose us to the risk of material losses even if the errors are detected and the transactions are unwound or reversed. If our clients are not able to settle their transactions on a timely basis, the time in which employee errors are detected may be increased and our risk of material loss could be increased. The risk of employee error or miscommunication may be greater for products that are new or have non-standardized terms. It is not always possible to deter employee misconduct or error, and the precautions we take to detect and prevent this activity may not be effective in all cases.
Internal or third party computer systems failures, capacity constraints and breaches of security could increase our operating costs and/or credit losses, decrease net operating revenues and cause us to lose clients. We are heavily dependent on the capacity and reliability of the computer and communications systems supporting our operations, whether owned and operated internally or by third parties, including those used for execution and clearance of our customer’s trades and our market making activities. We receive and process a large portion of our trade orders through electronic means, such as through public and private communications networks. These computer and communications systems and networks are subject to performance degradation or failure from any number of reasons, including loss of power, acts of war or terrorism, human error, natural disasters, fire, sabotage, hardware or software malfunctions or defects, computer viruses, intentional acts of vandalism, customer error or misuse, lack of proper maintenance or monitoring and similar events. Our systems, or those of our third party providers, may fail or operate slowly, causing one or more of the following:
• | unanticipated disruptions in service to our clients; |
• | slower response times; |
• | delays in our clients’ trade execution; |
• | failed settlement of trades; |
• | decreased client satisfaction with our services; |
• | incomplete, untimely or inaccurate accounting, recording, reporting or processing of trades; |
• | financial losses; |
• | litigation or other client claims; and |
• | regulatory sanctions. |
The occurrence of degradation or failure of the communications and computer systems on which we rely may lead to financial losses, litigation or arbitration claims filed by or on behalf of our customers and regulatory investigations and sanctions,
16
including by the CFTC, which require that our trade execution and communications systems be able to handle anticipated present and future peak trading volumes. Any such degradation or failure could also have a negative effect on our reputation, which in turn could cause us to lose existing customers to our competitors or make it more difficult for us to attract new customers in the future. Further, any financial loss that we suffer as a result of such degradations or failures could be magnified by price movements of contracts involved in transactions impacted by the degradation or failure, and we may be unable to take corrective action to mitigate any losses we suffer.
We are subject to extensive government regulation. The securities and commodities futures industries are subject to extensive regulation under federal, state and foreign laws. In addition, the SEC, the CFTC, FINRA, MSRB, the NFA, the CME Group and other self-regulatory organizations, commonly referred to as SROs, state securities commissions, and foreign securities regulators require compliance with their respective rules and regulations. These regulatory bodies are responsible for safeguarding the integrity of the financial markets and protecting the interests of participants in those markets.
As participants in various financial markets, we may be subject to regulation concerning certain aspects of our business, including:
• | trade practices; |
• | the way we communicate with, and disclose risks to clients; |
• | financial and reporting requirements and practices; |
• | client identification and anti-money laundering requirements; |
• | capital structure; |
• | record retention; and |
• | the conduct of our directors, officers and employees. |
Failure to comply with any of these laws, rules or regulations could result in adverse consequences. We and certain of our officers and employees have, in the past, been subject to claims arising from acts that regulators asserted were in contravention of these laws, rules and regulations. These claims resulted in the payment of fines and settlements. It is possible that we and our officers and other employees will be subject to similar claims in the future. An adverse ruling against us or our officers and other employees could result in our or our officers and other employees being required to pay a substantial fine or settlement and could result in a suspension or revocation of required registrations or memberships. Such sanctions could have a material adverse effect on our business, financial condition and operating results.
The regulatory environment in which we operate is subject to change. On November 14, 2013, the CFTC finalized new rules known as “Enhancing Customer Protections Rules”. These provisions, among other things, require enhanced customer protections, risk management programs, internal monitoring and controls, capital and liquidity standards, customer disclosures, and auditing and examination programs for FCMs. These rule changes, additional legislation or regulations, changes required under the Dodd-Frank Wall Street Reform and Consumer Protection Act (the “Dodd-Frank Act”) and any new or revised regulation by the SEC, the CFTC, other U.S. or foreign governmental regulatory authorities, SROs, MSRB or FINRA could have a material adverse effect on our business, financial condition and operating results. Changes in the interpretation or enforcement of existing laws and rules by these governmental authorities, SROs, MSRB and FINRA could also have a material adverse effect on our business, financial condition and operating results. Failure to comply with current or future legislation or regulations that apply to our operations could subject us to fines, penalties, or material restrictions on our business in the future.
Additional regulation, changes in existing laws and rules, or changes in interpretations or enforcement of existing laws and rules often directly affect financial services firms. We cannot predict what effect any such changes might have. Our business, financial condition and operating results may be materially affected by both regulations that are directly applicable to us and regulations of general application. Our level of trading and market-making activities can be affected not only by such legislation or regulations of general applicability, but also by industry-specific legislation or regulations.
We have incurred significant additional operational and compliance costs to meet the requirements of recent legislation and related regulations. This legislation and the related regulations may significantly affect our business in the future. Recent market and economic conditions have led to legislation and regulation affecting the financial services industry. These changes could eventually have an effect on our revenue and profitability, limit our ability to pursue certain business opportunities, impact the value of assets that we hold, require us to change certain business practices, impose additional costs on us, and otherwise adversely affect our business. Accordingly, we cannot provide assurance that new legislation and regulation will not eventually have an adverse effect on our business, results of operations, cash flows and financial condition.
The principal legislation is the Dodd-Frank Act which creates a comprehensive new regulatory regime governing the OTC and listed derivatives markets and their participants by requiring, among other things: centralized clearing of standardized derivatives (with certain stated exceptions); the trading of clearable derivatives on swap execution facilities or exchanges; and registration and comprehensive regulation of new categories of market participants as “swap dealers” and swap “introducing brokers.” The Dodd-Frank Act grants regulatory authorities, such as the CFTC and the SEC, broad rule-making authority to implement various provisions of the Dodd-Frank Act, including comprehensive regulation of the OTC derivatives market.
17
These regulators will continue to exercise, their expanded rule-making powers in ways that will affect how we conduct our business.
We have incurred and expect to continue to incur significant costs to comply with these regulatory requirements. We have also incurred and expect to continue to incur significant costs related to the development, operation and enhancement of our technology relating to trade execution, trade reporting, surveillance, record keeping and data reporting obligations, compliance and back-up and disaster recovery plans designed to meet the requirements of the regulators.
Changes that will be required in our OTC and clearing businesses may adversely impact our results of operations. Following the implementation of all of the rules contemplated by the Dodd-Frank Act, the markets for cleared and non-cleared swaps may be less robust, there may be less volume and liquidity in these markets and there may be less demand for our services. Certain banks and other institutions will be limited in their conduct of proprietary trading and will be further limited or prohibited from trading in certain derivatives. The new rules, including the restrictions on the trading activities for certain banks and large institutions, could impact transaction volumes and liquidity in these markets and our revenues would be adversely impacted as a result.
Changes that will be required in our OTC and clearing businesses may also adversely impact our cash flows and financial condition. Registration will impose substantial new requirements upon these entities including, among other things, capital and margin requirements, business conduct standards and record keeping and data reporting obligations. Increased regulatory oversight could also impose administrative burdens on us related to, among other things, responding to regulatory examinations or investigations. We provisionally registered our subsidiary, INTL FCStone Markets, LLC, as a swap dealer on December 31, 2012. Most of the rules affecting this business have now been finalized, and external business conduct rules came into effect on May 1, 2013. Nevertheless, some important rules, such as those setting capital and margin requirements, have not been finalized or fully implemented, and it is too early to predict with any degree of certainty how we will be affected.
The European Markets Infrastructure Regulation (“EMIR”) is the European regulations on OTC derivatives, central counterparties and trade repositories. The EMIR has been implemented across the European Economic Area member states by the European Securities and Markets Authority (“ESMA”). The EMIR has imposed new requirements on our European operations, including (a) reporting derivatives to a trade repository; (b) putting in place certain risk management procedures for OTC derivative transactions that are not cleared; (c) changes to our clearing account models and increased central counterparty margin requirements. Reporting requirements came into effect in February 2014 and most risk mitigation procedures were set at the end of 2013. European institutions have yet to decide what collateral obligations will be applicable to non-cleared OTC transactions. ESMA is evaluating and setting clearing obligations for certain OTC derivatives. INTL FCStone Ltd will comply with these EMIR provisions when finalized and relevant to its activities.
In addition to the EMIR, the FCA will be enforcing additional European Union issued regulations such as Market Abuse Directive extending the scope of previous rules to Commodities (2016) and the Markets in Financial Instruments Directive II(“MiFID II”) for which implementation is scheduled for 2017. It is likely some of MiFID II provisions implementation might be postponed to 2018. Principal areas of impact related to this directive will involve organized trade facilities for trading OTC non-equity products, client type re-assessment, investor protection, enhanced conflict of interest and execution policies and increased transparency and reporting.
The increased costs associated with compliance, and the changes that will be required in our OTC and clearing businesses, may adversely impact our results of operations, cash flows, and/or financial condition.
We are subject to net capital requirements. The SEC, FINRA and the CFTC require our dually registered broker-dealer/FCM subsidiary, INTL FCStone Financial Inc. to maintain specific levels of net capital. Failure to maintain the required net capital may subject this subsidiary to suspension or revocation of registration by the SEC, and suspension or expulsion by FINRA and other regulatory bodies and may subject this subsidiary to limitations on its activities, including suspension or revocation of its registration by the CFTC and suspension or expulsion by the NFA and various exchanges of which it is a member.
The FCA requires our UK subsidiary, INTL FCStone Ltd. to maintain specific levels of net capital. Failure to maintain the required net capital may subject INTL FCStone Ltd. to suspension or revocation of its registration by the FCA.
Ultimately, any failure to meet capital requirements by our dually registered broker-dealer/FCM subsidiary or our UK subsidiary could result in liquidation of the subsidiary. Failure to comply with the net capital rules could have material and adverse consequences such as limiting their operations, or restricting us from withdrawing capital from these subsidiaries.
In addition, a change in the net capital rules, the imposition of new rules or any unusually large charge against net capital could limit our operations that require the intensive use of capital. They could also restrict our ability to withdraw capital from these subsidiaries. Any limitation on our ability to withdraw capital could limit our ability to pay cash dividends, repay debt and repurchase shares of our outstanding stock. A significant operating loss or any unusually large charge against net capital could adversely affect our ability to expand or even maintain our present levels of business, which could have an adverse effect on our business, financial condition and operating results.
18
We are subject to margin funding requirements on short notice. Our business involves establishment and carrying of substantial open positions for customers on futures exchanges and in the OTC derivatives markets. We are required to post and maintain margin or credit support for these positions. Although we collect margin or other deposits from our customers for these positions, significant adverse price movements can occur which will require us to post margin or other deposits on short notice, whether or not we are able to collect additional margin or credit support from our customers. We maintain borrowing facilities for the purpose of funding margin and credit support and have systems to endeavor to collect margin and other deposits from customers on a same-day basis, there can be no assurance that these facilities and systems will be adequate to eliminate the risk of margin calls in the event of severe adverse price movements affecting open positions of our customers. Generally, if a customer is unable to meet its margin call, we promptly liquidate the customer’s account. However, there can be no assurance that in each case the liquidation of the account will not result in a loss to us or that liquidation will be feasible, given market conditions, size of the account and tenor of the positions.
Low short-term interest rates negatively impact our profitability. The level of prevailing short-term interest rates affects our profitability because we derive a portion of our revenue from interest earned from the investment of funds deposited with us by our customers. As of September 30, 2015, we had $1.9 billion in customer segregated assets, the majority of which are generally invested in U.S. Treasury securities and money market mutual funds. Our financial performance generally benefits from rising interest rates. Higher interest rates increase the amount of interest income earned from these customer deposits. If short-term interest rates remain low or continue to fall, our revenues derived from interest will decline which would negatively impact our profitability.
Short-term interest rates are highly sensitive to factors that are beyond our control, including general economic conditions and the policies of various governmental and regulatory authorities. In particular, decreases in the federal funds rate by the Board of Governors of the Federal Reserve System usually lead to decreasing interest rates in the U.S., which generally lead to a decrease in short-term interest rates.
We may issue additional equity securities. The issuance of additional common stock or securities convertible into our common stock could result in dilution of the ownership interest in us held by existing stockholders. We are authorized to issue, without stockholder approval, a significant number of additional shares of our common stock and securities convertible into either common stock or preferred stock.
We are subject to risks relating to litigation and potential securities and commodities law liability. We face significant legal risks in our businesses, including risks related to currently pending litigation involving the Company. Many aspects of our business involve substantial risks of liability, including liability under federal and state securities and commodities laws, other federal, state and foreign laws and court decisions, as well as rules and regulations promulgated by the SEC, the CFTC, FINRA, MSRB, the NFA, the FCA and other regulatory bodies. Substantial legal liability or significant regulatory action against us and our subsidiaries could have adverse financial effects or cause significant reputational harm to us, which in turn could seriously harm our business prospects. Any such litigation could lead to more volatility of our stock price.
For a further discussion of litigation risks, see Item 3—Legal Proceedings below and Note 11 - Commitments and Contingencies in the Consolidated Financial Statements.
We are subject to intense competition. We derive a significant portion of our revenues from market-making and trading activities involving securities and commodities. The market for these services, particularly market-making services through electronic communications gateways, is rapidly evolving and intensely competitive. We expect competition to continue and intensify in the future. We compete primarily with wholesale, national, and regional broker-dealers and FCMs, as well as electronic communications networks. We compete primarily on the basis of our expertise and quality of service.
We also derive a significant portion of our revenues from commodities risk management services. The commodity risk management industry is very competitive and we expect competition to continue to intensify in the future. Our primary competitors in this industry include both large, diversified financial institutions and commodity-oriented businesses, smaller firms that focus on specific products or regional markets and independent FCMs.
A number of our competitors have significantly greater financial, technical, marketing and other resources than we have. Some of them may:
• | offer alternative forms of financial intermediation as a result of superior technology and greater availability of information; |
• | offer a wider range of services and products than we offer; |
• | be larger and better capitalized; |
• | have greater name recognition; and |
• | have more extensive customer bases. |
These competitors may be able to respond more quickly to new or evolving opportunities and customer requirements. They may also be able to undertake more extensive promotional activities and offer more attractive terms to customers. Recent
19
advances in computing and communications technology are substantially changing the means by which market-making services are delivered, including more direct access on-line to a wide variety of services and information. This has created demand for more sophisticated levels of customer service. Providing these services may entail considerable cost without an offsetting increase in revenues. In addition, current and potential competitors have established or may establish cooperative relationships or may consolidate to enhance their services and products. New competitors or alliances among competitors may emerge and they may acquire significant market share.
We cannot assure you that we will be able to compete effectively with current or future competitors or that the competitive pressures we face will not have an adverse effect on our business, financial condition and operating results.
Our business could be adversely affected if we are unable to retain our existing customers or attract new customers. The success of our business depends, in part, on our ability to maintain and increase our customer base. Customers in our market are sensitive to, among other things, the costs of using our services, the quality of the services we offer, the speed and reliability of order execution and the breadth of our service offerings and the products and markets to which we offer access. We may not be able to continue to offer the pricing, service, speed and reliability of order execution or the service, product and market breadth that customers desire. In addition, once our risk management consulting customers have become better educated with regard to sources of risk and the tools available to facilitate the management of this risk and we have provided them with recommended hedging strategies, they may no longer continue paying monthly fees for these services. Furthermore, our existing customers, including IRMP customers, are not generally obligated to use our services and can switch providers of clearing and execution services or decrease their trading activity conducted through us at any time. As a result, we may fail to retain existing customers or be unable to attract new customers. Our failure to maintain or attract customers could have an adverse effect on our business, financial condition and operating results.
We rely on relationships with introducing brokers for obtaining some of our customers. The failure to maintain these relationships could adversely affect our business. We have relationships with introducing brokers who assist us in establishing new customer relationships and provide marketing and customer service functions for some of our customers. These introducing brokers receive compensation for introducing customers to us. Many of our relationships with introducing brokers are non-exclusive or may be canceled on relatively short notice. In addition, our introducing brokers have no obligation to provide new customer relationships or minimum levels of transaction volume. Our failure to maintain these relationships with these introducing brokers or the failure of these introducing brokers to establish and maintain customer relationships would result in a loss of revenues, which could adversely affect our business.
Certain provisions of Delaware law and our charter may adversely affect the rights of holders of our common stock and make a takeover of us more difficult. We are organized under the laws of the State of Delaware. Certain provisions of Delaware law may have the effect of delaying or preventing a change in control. In addition, certain provisions of our certificate of incorporation may have anti-takeover effects and may delay, defer or prevent a takeover attempt that a stockholder might consider in its best interest. Our certificate of incorporation authorizes the board to determine the terms of our unissued series of preferred stock and to fix the number of shares of any series of preferred stock without any vote or action by our stockholders. As a result, the board can authorize and issue shares of preferred stock with voting or conversion rights that could adversely affect the voting or other rights of holders of our common stock. In addition, the issuance of preferred stock may have the effect of delaying or preventing a change of control, because the rights given to the holders of a series of preferred stock may prohibit a merger, reorganization, sale, liquidation or other extraordinary corporate transaction.
Our stock price is subject to volatility. The market price of our common stock has been and can be expected to be subject to fluctuation as a result of a variety of factors, many of which are beyond our control, including:
• | actual or anticipated variations in our results of operations; |
• | announcements of new products by us or our competitors; |
• | technological innovations by us or our competitors; |
• | changes in earnings estimates or buy/sell recommendations by financial analysts; |
• | the operating and stock price performance of other companies; |
• | general market conditions or conditions specific in specific markets; |
• | conditions or trends affecting our industry or the economy generally; |
• | announcements relating to strategic relationships or acquisitions; and |
• | risk factors and uncertainties set forth elsewhere in this Form 10-K. |
Because of this volatility, we may fail to meet the expectations of our stockholders or of securities analysts, and the trading prices of our common stock could decline as a result. In addition, any negative change in the public’s perception of the securities industry could depress our stock price regardless of our operating results.
Future sales by existing stockholders could depress the market price of our common stock. If our stockholders sell substantial amounts of our common stock in the public market, the market price of our common stock could fall. Such sales also might make it more difficult for us to sell equity securities in the future at a time and price that we deem appropriate.
20
Our international operations involve special challenges that we may not be able to meet, which could adversely affect our financial results. We engage in a significant amount of business with customers in the international markets. Certain additional risks are inherent in doing business in international markets, particularly in a regulated industry. These risks include:
• | the inability to manage and coordinate the various regulatory requirements of multiple jurisdictions that are constantly evolving and subject to unexpected change; |
• | tariffs and other trade barriers; |
• | difficulties in recruiting and retaining personnel, and managing international operations; |
• | difficulties of debt collection in foreign jurisdictions; |
• | potentially adverse tax consequences; and |
• | reduced protection for intellectual property rights. |
Our operations are subject to the political, legal and economic risks associated with politically unstable and less developed regions of the world, including the risk of war and other international conflicts and actions by governmental authorities, insurgent groups, terrorists and others. Specifically, we conduct business in countries whose currencies may be unstable. Future instability in such currencies or the imposition of governmental or regulatory restrictions on such currencies could impede our foreign business and our ability to collect on collateral held in such currencies.
Our operations are required to comply with the laws and regulations of foreign governmental and regulatory authorities of each country in which we conduct business, and if we violate these regulations, we may be subject to significant penalties. The financial services industry is subject to extensive laws, rules and regulations in every country in which we operate. Firms that engage in commodity futures brokerage, securities and derivatives trading and investment banking must comply with the laws, rules and regulations imposed by the governing country, state, regulatory bodies and self-regulatory bodies with governing authority over such activities. Such laws, rules and regulations cover all aspects of the financial services business, including, but not limited to, sales and trading methods, trade practices, use and safekeeping of customers’ funds and securities, capital structure, anti-money laundering and anti-bribery and corruption efforts, recordkeeping and the conduct of directors, officers and employees.
Each of our regulators supervises our business activities to monitor compliance with such laws, rules and regulations in the relevant jurisdiction. In addition, if there are instances in which our regulators question our compliance with laws, rules, and regulations, they may investigate the facts and circumstances to determine whether we have complied. At any moment in time, we may be subject to one or more such investigation or similar reviews. At this time, we believe all such investigations, and similar reviews are insignificant in scope and immaterial to us. However, there can be no assurance that, in the future, the operations of our businesses will not violate such laws, rules, and regulations and that related investigations and similar reviews could result in adverse regulatory requirements, regulatory enforcement actions and/or fines.
Additional legislation, changes in rules, changes in the interpretation or enforcement of existing laws and rules, or the entering into businesses that subject us to new rules and regulations may directly affect our business, results of operations and financial condition.
We are reviewing the regulatory changes that will be introduced by the Markets in Financial Instruments Directive II (“MIFID II”) and the Markets in Financial Instruments Regulation (“MIFIR”) to assess the impact this legislation is likely to have on our United Kingdom business which is expected to be implemented in 2017. Among other things, the legislation will impose additional transaction and position reporting requirements, disclosure obligations, as well as requiring certain over-the-counter derivatives to be traded on organized trading facilities (“OTFs”).
If we are unable to manage any of these risks effectively, our business could be adversely affected.
Item 1B. Unresolved Staff Comments
We have received no written comments regarding our periodic or current reports from the staff of the SEC that were issued 180 days or more preceding the end of our fiscal year 2015 that remain unresolved.
Item 2. Properties
The Company maintains offices in New York, New York; Winter Park, Florida; West Des Moines, Iowa; Chicago, Illinois; Kansas City, Missouri; St. Louis, Missouri; Jersey City, New Jersey; Bloomfield, Nebraska; Omaha, Nebraska; Minneapolis, Minnesota; Bloomington, Illinois; Miami, Florida; Indianapolis, Indiana; Bowling Green, Ohio; Nashville, Tennessee; Lawrence, Kansas; Mobile, Alabama; Boca Raton, Florida; Twin Falls, Idaho; Seoul, South Korea; Buenos Aires, Argentina; Campinas, Brazil; Sao Paulo, Brazil; Maringa, Brazil; Passo Fundo, Brazil; Goiania, Brazil; Recife, Brazil; Sorriso, Brazil; Asuncion and Ciudad del Este, Paraguay; Bogota, Colombia; London, United Kingdom; Dublin, Ireland; Dubai, United Arab Emirates; Singapore, Singapore; Beijing and Shanghai, China; Hong Kong, and Sydney, Australia. All of our offices and other principal business properties are leased, except for the space in Buenos Aires, which we own. We believe that our leased and owned facilities are adequate to meet anticipated requirements for our current lines of business.
21
Item 3. Legal Proceedings
In addition to the matters discussed below, from time to time and in the ordinary course of business, we are involved in various legal actions and proceedings, including tort claims, contractual disputes, employment matters, workers’ compensation claims and collections. We carry insurance that provides protection against certain types of claims, up to the policy limits of our insurance. In the opinion of management, possible exposure from loss contingencies in excess of the amounts accrued, and in addition to the possible losses discussed below, is not material to our earnings, financial position or liquidity.
The following is a summary of our significant legal matters.
Securities Litigation and Regulatory Proceedings
In January 2014, a purported class action was filed in the United States District Court for the Southern District of New York against the Company and certain of our officers and directors. The complaint alleged violations of federal securities laws, and claimed that the Company issued false and misleading information concerning its business and prospects. The action sought unspecified damages on behalf of persons who purchased the Company's shares between February 17, 2010 and December 16, 2013. The lead plaintiff’s amended complaint was filed in June 2014. Our motion to dismiss the complaint was filed in July 2014. At the court hearing on February 4, 2015, our motion was granted and the amended complaint was dismissed, however the lead plaintiff was given leave to amend its complaint. The lead plaintiff’s second amended complaint was filed on March 6, 2015, and it narrowed the purported class to persons who purchased Company’s shares between December 15, 2010 and December 16, 2013. On March 27, 2015, we filed a motion to dismiss the second amended complaint. The lead plaintiff’s memorandum in opposition was filed on April 13, 2015, and our reply in support of its motion to dismiss the second amended complaint was filed on April 27, 2015. The matter was heard on July 9, 2015 and on July 13, 2015 the second amended complaint was dismissed in its entirety, with prejudice and without leave to replead.
During fiscal 2014, settlement of a previously disclosed shareholder class action complaint against us and our directors originating in August 2008 was approved, resulting in a payment of $0.3 million after consideration of insurance coverage, recorded as expense in fiscal 2014.
During fiscal 2013, we reached a settlement with the CFTC in connection with its investigation of the losses that occurred in 2008 and 2009 in a customer energy trading account of our former wholly owned subsidiary FCStone, LLC. Effective July 1, 2015, FCStone, LLC was merged with other certain wholly owned subsidiaries, and is now known as INTL FCStone Financial Inc. The CFTC’s findings, neither admitted nor denied by us, were that FCStone, LLC violated CFTC Regulation 166.3 in that it failed to diligently supervise its officers’ and employees’ activities relating to risks associated with its customers’ accounts, and in particular one account controlled by two of FCStone, LLC’s customers who traded in natural gas futures, swaps and option contracts. The settlement resulted in a payment of $1.5 million recorded as expense in fiscal 2013.
Sentinel Litigation
Prior to the July 1, 2015 merger of certain wholly owned subsidiaries, our former subsidiary, FCStone, LLC, had a portion of its excess segregated funds invested with Sentinel Management Group Inc. (“Sentinel”), a registered FCM and an Illinois-based money manager that provided cash management services to other FCMs. In August 2007, Sentinel halted redemptions to customers and sold certain of the assets it managed to an unaffiliated third party at a significant discount. On August 17, 2007, subsequent to Sentinel’s sale of certain assets, Sentinel filed for bankruptcy protection. In aggregate, $15.5 million of FCStone, LLC’s $21.9 million in invested funds were returned to it before and after Sentinel’s bankruptcy petition.
In August 2008, the bankruptcy trustee of Sentinel filed adversary proceedings against FCStone, LLC, and a number of other FCMs in the Bankruptcy Court for the Northern District of Illinois. The case was subsequently reassigned to the United States District Court, for the Northern District of Illinois. In the complaint, the trustee sought avoidance of alleged transfers or withdrawals of funds received by FCStone, LLC and other FCMs within 90 days prior to the filing of the Sentinel bankruptcy petition, as well as avoidance of post-petition distributions and disallowance of the proof of claim filed by FCStone, LLC. The trustee sought recovery of pre- and post-petition transfers totaling approximately $15.5 million.
The trial of this matter took place, as a test case, during October 2012. The trial court entered a judgment against FCStone, LLC on January 4, 2013. On January 17, 2013, the trial court entered an agreed order, staying execution and enforcement, pending an appeal of the judgment. On March 19, 2014, the appeal court ruled in favor of FCStone, LLC. In April 2014, the trustee filed a petition for rehearing of the appeal. In May 2014, the U.S. Court of Appeals for the Seventh Circuit denied the petition. The trustee did not file a writ for certiorari with the U.S. Supreme Court during the time allotted to do so. The Company continues to be involved in litigation against the trustee to recover its share of the cash held in reserve accounts under Sentinel’s Fourth Amended Chapter 11 Plan of Liquidation.
On February 10, 2015, based on a new theory, the trustee filed a motion for judgment against FCStone, LLC in the United States District Court, for the Northern District of Illinois, seeking to claw back the post-petition transfer of $14.5 million and to recover the funds held in reserve in the name of FCStone, LLC. FCStone, LLC filed its opposition brief and an associated
22
motion for judgment on March 17, 2015. The trustee filed its reply briefs on April 7, 2015 and we filed our reply briefs on April 22, 2015. We have determined that losses related to this matter are neither probable nor reasonably possible. We believe the case is without merit and intend to defend ourselves vigorously.
Our assessments are based on estimates and assumptions that have been deemed reasonable by management, but that may later prove to be incomplete or inaccurate, and unanticipated events and circumstances may occur that might cause us to change those estimates and assumptions.
Item 4. Mine Safety Disclosures
Not applicable.
23
PART II
Item 5. Market for Registrant’s Common Equity, Related Stockholder Matters and Issuer Purchases of Equity Securities
Our common stock is listed on The NASDAQ Stock Market LLC (“NASDAQ”) under the symbol ‘INTL’. Our common stock trades on the NASDAQ Global Select Market. As of September 30, 2015, there were approximately 324 registered holders of record of our common stock. The high and low sales prices per share of our common stock for each full quarterly period during fiscal 2015 and 2014 were as follows:
Price Range | ||||||||
High | Low | |||||||
2015: | ||||||||
Fourth Quarter | $ | 35.22 | $ | 24.50 | ||||
Third Quarter | $ | 37.15 | $ | 29.74 | ||||
Second Quarter | $ | 30.44 | $ | 19.25 | ||||
First Quarter | $ | 20.70 | $ | 16.96 | ||||
2014: | ||||||||
Fourth Quarter | $ | 20.29 | $ | 17.32 | ||||
Third Quarter | $ | 20.20 | $ | 17.76 | ||||
Second Quarter | $ | 19.24 | $ | 17.24 | ||||
First Quarter | $ | 21.10 | $ | 17.95 | ||||
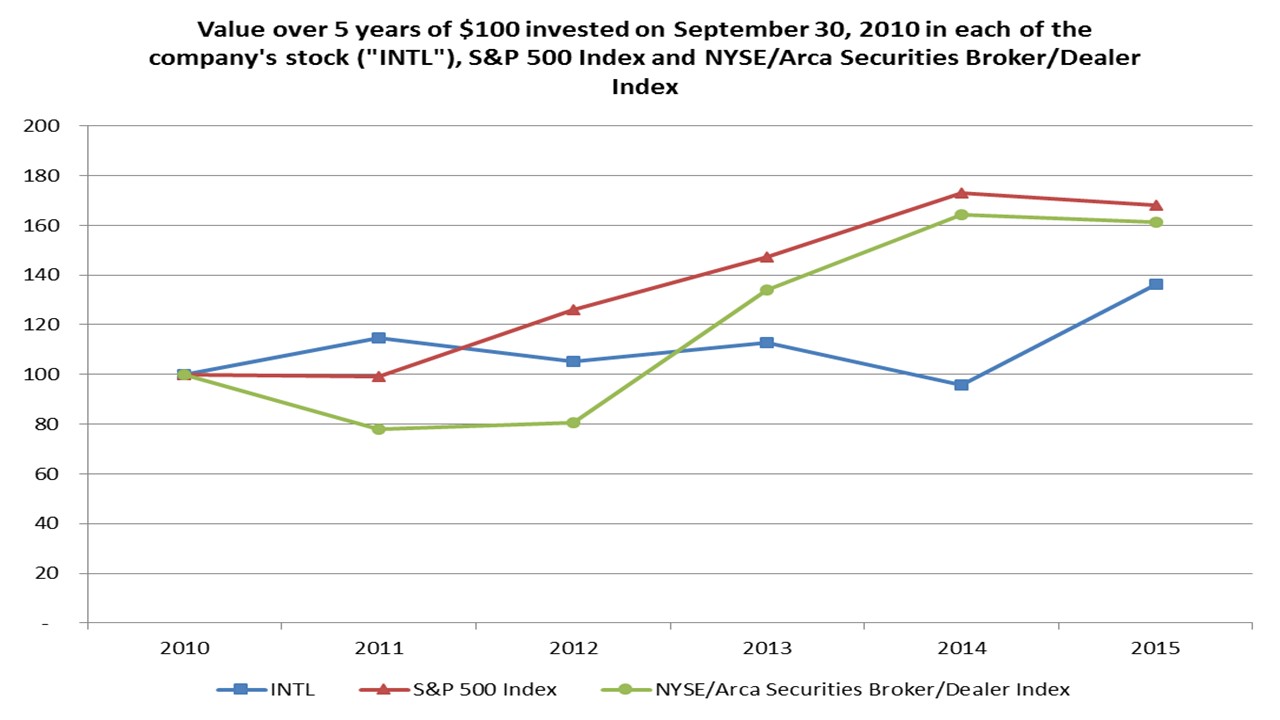
We have never declared any cash dividends on our common stock, and do not currently have any plans to pay dividends on our common stock. The payment of cash dividends in the future is subject to the discretion of the Board of Directors and will depend on our earnings, financial condition, capital requirements, contractual restrictions and other relevant factors. Our credit agreements currently prohibit the payment of cash dividends by us.
On December 10, 2014, our Board of Directors authorized the repurchase of up to 1.0 million shares of our outstanding common stock from time to time in open market purchases and private transactions, subject to the discretion of the senior management team to implement our stock repurchase plan, and subject to market conditions and as permitted by securities laws and other legal, regulatory and contractual requirements and covenants.
24
Our common stock repurchase program activity for the three months ended September 30, 2015 was as follows:
Period | Total Number of Shares Purchased(1) | Average Price Paid per Share | Total Number of Shares Purchased as Part of Publicly Announced Program | Maximum Number of Shares Remaining to be Purchased Under the Program | ||||||||
July 1, 2015 to July 31, 2015 | — | $ | — | — | 775,491 | |||||||
August 1, 2015 to August 31, 2015 | — | — | — | 775,491 | ||||||||
September 1, 2015 to September 30, 2015 | 204,271 | 23.33 | — | 775,491 | ||||||||
Total | 204,271 | $ | 23.33 | — | ||||||||
(1) The September 2015 activity represents shares released to us from an escrow account established in connection with the acquisition of certain assets of Provident Group in September 2010. The shares held in escrow were to be released to the individual sellers, over a five year period from the date of closing based on net profits, in accordance with the provisions of the acquisition agreement. Certain terms of the agreement were not met, and the shares were forfeited to us and recorded as treasury stock at the end of the five year period.
Information relating to compensation plans under which our equity securities are authorized for issuance is set forth in Part III, Item 12 of our Annual Report on Form 10-K.
25
Item 6. Selected Financial Data
The following selected financial and operating data are derived from our consolidated financial statements and should be read in conjunction with Management’s Discussion and Analysis of Financial Condition and Results of Operations, included in Item 7 and our Consolidated Financial Statements included in Item 8.
Selected Summary Financial Information
Year Ended September 30, | |||||||||||||||||||
(in millions, except share and per share amounts) | 2015 | 2014 | 2013 | 2012 | 2011 | ||||||||||||||
Operating revenues | $ | 624.3 | $ | 490.9 | $ | 468.2 | $ | 448.1 | $ | 398.9 | |||||||||
Transaction-based clearing expenses | 122.7 | 108.5 | 110.1 | 105.3 | 75.4 | ||||||||||||||
Introducing broker commissions | 52.7 | 49.9 | 40.5 | 31.0 | 24.0 | ||||||||||||||
Interest expense | 17.1 | 10.5 | 7.9 | 5.6 | 6.4 | ||||||||||||||
Net operating revenues | 431.8 | 322.0 | 309.7 | 306.2 | 293.1 | ||||||||||||||
Compensation and other expenses: | |||||||||||||||||||
Compensation and benefits | 251.1 | 201.9 | 198.7 | 197.2 | 170.6 | ||||||||||||||
Communication and data services | 28.1 | 25.8 | 23.1 | 22.4 | 15.4 | ||||||||||||||
Occupancy and equipment rental | 13.5 | 12.3 | 12.0 | 11.0 | 8.9 | ||||||||||||||
Professional fees | 12.5 | 14.9 | 12.4 | 12.6 | 10.3 | ||||||||||||||
Travel and business development | 10.5 | 9.9 | 10.4 | 10.4 | 8.0 | ||||||||||||||
Depreciation and amortization | 7.2 | 7.3 | 8.0 | 7.2 | 4.7 | ||||||||||||||
Bad debts and impairments | 7.3 | 5.5 | 0.8 | 1.5 | 5.8 | ||||||||||||||
Other | 23.5 | 18.4 | 23.1 | 21.4 | 21.3 | ||||||||||||||
Total compensation and other expenses | 353.7 | 296.0 | 288.5 | 283.7 | 245.0 | ||||||||||||||
Income from continuing operations, before tax | 78.1 | 26.0 | 21.2 | 22.5 | 48.1 | ||||||||||||||
Income tax expense | 22.4 | 6.4 | 2.6 | 5.5 | 18.2 | ||||||||||||||
Net income from continuing operations | 55.7 | 19.6 | 18.6 | 17.0 | 29.9 | ||||||||||||||
(Loss) income from discontinued operations, net of tax | — | (0.3 | ) | 0.7 | (4.3 | ) | 4.8 | ||||||||||||
Net income | 55.7 | 19.3 | 19.3 | 12.7 | 34.7 | ||||||||||||||
Add: Net loss attributable to noncontrolling interests | — | — | — | 0.1 | 0.1 | ||||||||||||||
Net income attributable to INTL FCStone Inc. common stockholders | $ | 55.7 | $ | 19.3 | $ | 19.3 | $ | 12.8 | $ | 34.8 | |||||||||
Earnings per share: | |||||||||||||||||||
Basic | $ | 2.94 | $ | 1.01 | $ | 1.01 | $ | 0.67 | $ | 1.93 | |||||||||
Diluted | $ | 2.87 | $ | 0.98 | $ | 0.97 | $ | 0.64 | $ | 1.83 | |||||||||
Number of shares: | |||||||||||||||||||
Basic | 18,525,374 | 18,528,302 | 18,443,233 | 18,282,939 | 17,618,085 | ||||||||||||||
Diluted | 18,932,235 | 19,132,302 | 19,068,497 | 19,156,899 | 18,567,454 | ||||||||||||||
Selected Balance Sheet Information: | |||||||||||||||||||
Total assets | $ | 5,070.0 | $ | 3,039.7 | $ | 2,848.0 | $ | 2,953.0 | $ | 2,632.0 | |||||||||
Lenders under loans | $ | 41.6 | $ | 22.5 | $ | 61.0 | $ | 218.2 | $ | 77.4 | |||||||||
Senior unsecured notes | $ | 45.5 | $ | 45.5 | $ | 45.5 | $ | — | $ | — | |||||||||
Convertible notes | $ | — | $ | — | $ | — | $ | — | $ | 16.7 | |||||||||
Stockholders’ equity | $ | 397.1 | $ | 345.4 | $ | 335.4 | $ | 313.2 | $ | 292.6 | |||||||||
Other Data: | |||||||||||||||||||
Return on average stockholders’ equity (from continuing operations) (a) | 15.0 | % | 5.8 | % | 5.7 | % | 5.6 | % | 11.2 | % | |||||||||
EBITDA (b) | $ | 102.4 | $ | 43.8 | $ | 37.1 | $ | 35.3 | $ | 59.2 | |||||||||
Employees, end of period | 1,231 | 1,141 | 1,094 | 1,074 | 904 | ||||||||||||||
Compensation and benefits as a percentage of operating revenues | 40.2 | % | 41.1 | % | 42.4 | % | 44.0 | % | 42.8 | % | |||||||||
(a) | For all periods presented, the return on average stockholders’ equity (from continuing operations) excludes the effects of discontinued operations and net loss attributable to noncontrolling interests. |
(b) | See “Non-GAAP Financial Measure” below. |
26
Non-GAAP Financial Measure
EBITDA consists of net income from continuing operations before interest expense, income tax expense and depreciation and amortization. We have included EBITDA in our Form 10-K because we use it as an important supplemental measure of our performance and believe that it is frequently used by securities analysts, investors and other interested persons in the evaluation of companies in our industry, some of which present EBITDA when reporting their financial results. EBITDA is a financial measure that is not recognized by U.S. GAAP, and should not be considered as an alternative to operating revenues, net operating revenues, net income from continuing operations, net income or stockholders’ equity calculated under U.S. GAAP or as an alternative to any other measures of performance derived in accordance with U.S. GAAP. The following table reconciles EBITDA with our net income from continuing operations.
Year Ended September 30, | |||||||||||||||||||
(in millions) | 2015 | 2014 | 2013 | 2012 | 2011 | ||||||||||||||
Net income from continuing operations | $ | 55.7 | $ | 19.6 | $ | 18.6 | $ | 17.0 | $ | 29.9 | |||||||||
Plus: interest expense | 17.1 | 10.5 | 7.9 | 5.6 | 6.4 | ||||||||||||||
Plus: depreciation and amortization | 7.2 | 7.3 | 8.0 | 7.2 | 4.7 | ||||||||||||||
Plus: income taxes | 22.4 | 6.4 | 2.6 | 5.5 | 18.2 | ||||||||||||||
EBITDA | $ | 102.4 | $ | 43.8 | $ | 37.1 | $ | 35.3 | $ | 59.2 | |||||||||
Item 7. Management’s Discussion and Analysis of Financial Condition and Results of Operations
The following discussion should be read together with the Consolidated Financial Statements and Notes thereto appearing elsewhere in this Annual Report on Form 10-K. Certain statements in “Management’s Discussion and Analysis of Financial Condition and Results of Operations” are forward-looking statements that involve known and unknown risks and uncertainties, many of which are beyond our control. Words such as “may”, “will”, “should”, “would”, “anticipates”, “expects”, “intends”, “plans”, “believes”, “seeks”, “estimates” and similar expressions identify such forward-looking statements. The forward-looking statements contained herein are based on current expectations and entail various risks and uncertainties that could cause actual results to differ materially from those expressed in such forward-looking statements. Factors that might cause such a difference include, among other things, those set forth under “Risk Factors” and those appearing elsewhere in this Form 10-K. Readers are cautioned not to place undue reliance on these forward-looking statements, which reflect management’s analysis only as of the date hereof. We assume no obligation to update these forward-looking statements to reflect actual results or changes in factors or assumptions affecting forward-looking statements. Readers are cautioned that any forward-looking statements are not guarantees of future performance.
Overview
INTL FCStone Inc. is a diversified, global financial services organization providing financial products and advisory and execution services that help our clients access market liquidity, maximize profits and manage risk. We are a leader in the development of specialized financial services in commodities, securities, global payments, foreign exchange and other markets. Our revenues are derived primarily from financial products and advisory services that fulfill our clients’ real needs and provide bottom-line benefits to their businesses. We create added value for our clients by providing access to global financial markets using our industry and financial expertise, deep partner and network relationships, insight and guidance, and integrity and transparency. Our client-first approach differentiates us from large banking institutions, engenders trust, and has enabled us to establish leadership positions in a number of complex fields in financial markets around the world.
Our leadership positions span markets such as commodity risk management advisory services; global payments; market-making in international equities and other securities; fixed income; physical trading and hedging of precious metals and select other commodities; execution of listed futures and options on futures contracts on all major commodity exchanges and foreign currency trading, among others. These businesses are supported by our global infrastructure of regulated operating subsidiaries, advanced technology platform and team of more than 1,200 employees. We currently have more than 20,000 clients, located in more than 130 countries.
Our clients include producers, processors and end-users of nearly all widely traded physical commodities; commercial counterparties who are end-users of our products and services; governmental and non-governmental organizations; and commercial banks, asset managers, insurance companies, brokers, institutional investors and major investment banks. We believe our clients value us for our focus on their needs, our expertise and flexibility, our global reach, our ability to provide access to hard-to-reach markets and opportunities, and our status as a well-capitalized and regulatory-compliant organization.
We believe we are well positioned to capitalize on key trends impacting the financial services sector. Among others, these trends include the impact of increased regulation on banking institutions and other financial services providers; increased consolidation, especially of smaller sub-scale financial services providers; the growing importance and complexity of
27
conducting secure cross-border transactions; and the demand among financial institutions to transact with well-capitalized counterparties.
We focus on mitigating exposure to market risk, ensuring adequate liquidity to maintain daily operations and making non-interest expenses variable, to the greatest extent possible. We report our operating segments based on services provided to clients. Our activities are divided into the following functional areas consisting of Commercial Hedging, Global Payments, Securities, Physical Commodities, and Clearing and Execution Services (“CES”).
Recent Events Affecting the Financial Services Industry
The Dodd-Frank Act created a comprehensive new regulatory regime governing the OTC and listed derivatives markets and their participants by requiring, among other things: centralized clearing of standardized derivatives (with certain stated exceptions); the trading of clearable derivatives on swap execution facilities or exchanges; and registration and comprehensive regulation of new categories of market participants as “swap dealers” and swap “introducing brokers.” Our subsidiary, INTL FCStone Markets, LLC, is a provisionally registered swap dealer. Some important rules, such as those setting capital and margin requirements, have not been finalized or fully implemented, and it is too early to predict with any degree of certainty how we will be affected. We will continue to monitor all applicable developments in the implementation of the Dodd-Frank Act. The legislation and implementing regulations affect not only us, but also many of our customers and counterparties.
We are reviewing the regulatory changes that will be introduced by the Markets in Financial Instruments Directive II (“MIFID II”) and the Markets in Financial Instruments Regulation (“MIFIR”) to assess the impact this legislation is likely to have on our
United Kingdom business when implemented. Implementation is expected in 2017 and the legislation will impose, among other things, additional transaction and position reporting requirements, disclosure obligations, as well as requiring certain over-the-counter derivatives to be traded on organized trading facilities (“OTFs”).
Fiscal 2015 Highlights
• | Record overall operating revenues of $624.3 million, as well as record operating revenues in our Commercial Hedging, Global Payments and Securities segments. |
• | Completed the acquisition of G.X. Clarke & Co., an SEC registered institutional dealer in fixed income securities. |
• | Excluding incremental expenses of the G.X. Clarke business acquired, fixed expenses increased modestly at 3%, versus fiscal 2014. |
• | Realized a 15.0% return on equity for fiscal 2015, equal to our internal target for the Company. |
• | Completed the consolidation of four of our U.S. regulated subsidiaries, forming one financial services firm which is dually registered as a broker-dealer and an FCM, realizing capital and other synergies. |
Executive Summary
We experienced strong revenue growth across all of our business segments during fiscal 2015, increasing 27% versus the prior year, led by our Securities, Commercial Hedging and Global Payment segments. Overall, segment income increased 46% while net income from continuing operations increased 184% to $55.7 million in fiscal 2015. Global Payments continued its growth, adding an additional $14.9 million in segment income in fiscal 2015 to $43.2 million, while our Securities and Commercial Hedging segments increased segment income by 93% and 27%, respectively. Segment income in our CES segment more than doubled versus the prior year, while Physical Commodities declined modestly.
Our Securities segment’s strong growth in operating performance was a result of a 44% increase in equity market-making volumes as well as the acquisition of G.X. Clarke, which added an incremental $31.4 million in operating revenues since the acquisition on January 1, 2015. The growth in Global Payments segment income was attributable to the continued on-boarding of additional financial institutions to our platform which led to an increase of 70% in the number of payments made compared to the prior year. This growth was partially tempered by a narrowing of the average revenue per payment.
The growth in our core Commercial Hedging segment income was primarily the result of increased interest income on customer deposits and an increase in exchange-traded revenues, particularly on the LME. In addition, OTC volumes increased 24% versus the prior year, driven by strong performance in the agricultural commodities.
In our CES segment, increased interest income as well as a 64% increase in foreign exchange prime brokerage volumes drove the improved performance versus the prior year. Exchange-traded volumes in this segment increased 5%, however exchange-traded operating revenues were relatively flat as a result of a 5% decline in the average rate per contract due to the overall business mix. Our Physical Commodity segment income declined 2% versus the prior year, as a 13% increase in operating revenues was offset by $2.8 million of bad debt provisions, primarily related to a customer in the renewable fuels industry.
In connection with the merger of our wholly owned U.S. subsidiaries, we transferred our remaining available-for-sale of securities to the trading category during the fourth quarter of fiscal 2015. The transfer resulted in $3.3 million, net of tax, of unrealized gains not previously recognized in earnings. See further discussion in our Results of Operations.
28
On the expense side, we continue to focus on maintaining our variable cost model and limiting the growth of our non-variable expenses. To that end, variable expenses were 59% of total expenses in fiscal 2015 compared to 56% in the fiscal 2014. Non-variable expenses increased 8% year-over-year, primarily as a result of incremental expenses from the acquisition of G.X. Clarke.
Selected Summary Financial Information
Discontinued Operations
During fiscal 2013, we began an exit of our physical base metals business through the sale and orderly liquidation of then-current open positions. We completed the exit of the physical base metals business during fiscal 2014. The physical base metals activities in the financial statements for fiscal 2014 and 2013 are presented as discontinued operations. We continue to operate the portion of our base metals business related to non-physical assets, conducted primarily through the LME in our Commercial Hedging segment.
Results of Operations
Set forth below is our discussion of the results of our operations, as viewed by management, for the fiscal years ended September 30, 2015, 2014, and 2013.
The discussion below relates only to continuing operations. All revenues and expenses, including income tax expense, relating to discontinued operations have been removed from disclosures of total revenues and expenses for the applicable periods, and are reported net in our consolidated income statements in “(loss) income from discontinued operations, net of tax”.
Financial Overview
The following table shows an overview of our financial results:
Financial Overview (Unaudited)
Year Ended September 30, | |||||||||||||||||
(in millions) | 2015 | % Change | 2014 | % Change | 2013 | ||||||||||||
Operating revenues | $ | 624.3 | 27 | % | $ | 490.9 | 5 | % | $ | 468.2 | |||||||
Transaction-based clearing expenses | 122.7 | 13 | % | 108.5 | (1 | )% | 110.1 | ||||||||||
Introducing broker commissions | 52.7 | 6 | % | 49.9 | 23 | % | 40.5 | ||||||||||
Interest expense | 17.1 | 63 | % | 10.5 | 33 | % | 7.9 | ||||||||||
Net operating revenues | 431.8 | 34 | % | 322.0 | 4 | % | 309.7 | ||||||||||
Compensation and other expenses | 353.7 | 19 | % | 296.0 | 3 | % | 288.5 | ||||||||||
Income from continuing operations, before tax | $ | 78.1 | 200 | % | $ | 26.0 | 23 | % | $ | 21.2 | |||||||
The selected data table below reflects key operating metrics used by management in evaluating our product lines, for the periods indicated:
Year Ended September 30, | |||||||||||||||||
2015 | % Change | 2014 | % Change | 2013 | |||||||||||||
Volumes and Other Data: | |||||||||||||||||
Exchange-traded volume (contracts, 000’s) | 99,879.2 | 7 | % | 93,566.6 | (7 | )% | 100,749.9 | ||||||||||
OTC volume (contracts, 000’s) | 1,670.0 | 24 | % | 1,342.1 | 8 | % | 1,245.1 | ||||||||||
Global payments (# of payments, 000’s) | 325.4 | 70 | % | 191.5 | 36 | % | 140.8 | ||||||||||
Gold equivalent ounces traded (000’s) | 126,365.5 | 60 | % | 79,127.1 | (15 | )% | 93,256.8 | ||||||||||
Equity market-making (gross dollar volume, millions) | $ | 107,052.9 | 44 | % | $ | 74,162.9 | 29 | % | $ | 57,705.8 | |||||||
Foreign exchange prime brokerage volume (U.S. notional, millions) | $ | 449,344.1 | 45 | % | $ | 310,297.5 | 6 | % | $ | 292,526.7 | |||||||
Average assets under management (U.S. dollar, millions) | $ | 572.1 | 8 | % | $ | 530.9 | 15 | % | $ | 462.3 | |||||||
Average customer segregated equity (millions) | $ | 1,788.2 | — | % | $ | 1,789.9 | 7 | % | $ | 1,674.9 | |||||||
29
Operating Revenues
Year Ended September 30, 2015 Compared to Year Ended September 30, 2014
Operating revenues for fiscal 2015 and fiscal 2014 were $624.3 million and $490.9 million, respectively. All of our business segments experienced operating revenue growth compared to the prior year, led by our Securities and Commercial Hedging segments which increased $49.5 million and $38.4 million, respectively. In addition, operating revenues in our Global Payments segment increased $21.6 million, while our CES and Physical Commodities segments increased $9.7 million and $2.6 million, respectively.
Operating revenues in our Commercial Hedging segment increased 17% in fiscal 2015 to $262.4 million, as exchange-traded revenues increased $20.1 million to $129.4 million and OTC revenues increased $16.1 million to $111.0 million in fiscal 2015. Strong growth in our LME metals business combined with improved market conditions in the domestic agricultural markets, drove a 16% increase in exchange-traded volumes. OTC revenues increased as a result of a 24% increase in volumes while the average rate per contract declined 6% compared to the prior year. Growth in agricultural commodity OTC revenues and the addition of interest rate OTC derivatives to our customer offering helped to drive the growth in OTC revenues.
Operating revenues in our Securities segment increased 62% in fiscal 2015 to $129.8 million, primarily as a result of a $17.5 million increase in our equity market-making product line, as well as the acquisition of G.X. Clarke which added $31.4 million in incremental revenues to our debt trading product line.
Operating revenues in our Global Payments segment increased 39% in fiscal 2015 to a record $77.0 million compared to the prior year, driven by a 70% increase in the number of global payments made, however spreads have narrowed in this business due to a continuing increase in lower dollar value per payment transaction volume from financial institutions.
Physical Commodity segment operating revenues increased 13% to $23.2 million in fiscal 2015 as a result of a 60% increase in the number of ounces traded in precious metals, which was partially offset by a decrease of customer activity in the physical agricultural and energy commodity product line.
Operating revenues in our CES segment increased 9% in fiscal 2015 to $123.4 million. Exchange-traded commission and clearing fee revenues were relatively flat with the prior year at $96.5 million, while operating revenues in our customer prime brokerage product line increased $7.4 million to $21.5 million in fiscal 2015 as a result of increased market volatility in foreign exchange markets.
Interest income increased $31.4 million to $39.4 million in fiscal 2015 compared to fiscal 2014, and was significantly impacted by the acquisition of G.X. Clarke, which added $19.6 million in interest income during the nine months following the acquisition effective January 1, 2015. In addition, while average customer segregated equity was relatively flat with the prior year, the continued implementation of our interest rate management program, resulted in an aggregate $5.2 million increase in interest income in our Commercial Hedging and CES segments.
On July 1, 2015, the Company merged three of its wholly owned U.S. subsidiaries (FCStone, LLC, INTL FCStone Partners L.P., and FCC Investments, Inc.) into its wholly owned subsidiary, INTL FCStone Securities Inc., and renamed the surviving subsidiary INTL FCStone Financial Inc. INTL FCStone Financial is registered as a broker-dealer with FINRA and is registered as a futures commission merchant with the CFTC and NFA.
In connection with the merger of wholly owned subsidiaries, the Company transferred its remaining available-for-sale investments, at fair value, to the trading category in accordance with the accounting requirements for broker-dealers. The July 1, 2015 transfer of securities resulted in $5.4 million of pre-tax unrealized gains not previously recognized in earnings being included in operating revenues during the fourth quarter of fiscal 2015. In addition, operating revenues for fiscal 2015 include a $1.2 million pre-tax gain on the sale of common stock held in the Intercontinental Exchange, Inc.
Year Ended September 30, 2014 Compared to Year Ended September 30, 2013
Operating revenues for fiscal 2014 and fiscal 2013 were $490.9 million and $468.2 million, respectively. This $22.7 million, or 5% increase in operating revenues primarily resulted from strong revenue growth in our Commercial Hedging, Global Payments and Securities segments. Operating revenues in the Commercial Hedging and Securities segments increased $22.0 million and $10.3 million, respectively, while Global Payments increased $14.5 million, or 35%, over the prior year. These increases were partially offset by declines in our Physical Commodities and CES segments of $6.2 million and $7.6 million, respectively. Also, fiscal 2013 operating revenues included a $9.2 million realized gain on the sale of shares of the LME and Kansas City Board of Trade.
Operating revenues in our Commercial Hedging segment increased 11% to $224.0 million, primarily as a result of a $15.6 million increase in exchange-traded revenues driven by growth in growth in the agricultural commodity and LME metals markets, as the agricultural market conditions improved and our LME product line expanded into the Far Eastern markets. Also
30
contributing to this growth was a $6.0 million increase in OTC revenues, driven by growth in the energy and renewable fuels markets.
Operating revenues in our Global Payments segment increased $14.5 million to $55.4 million in fiscal 2014, compared to fiscal 2013, driven by a 36% increase in the number of global payments made as we continue to be successful in adding and on-boarding financial institutions to our electronic transaction order system.
The increase in operating revenues in our Securities segment was primarily a result of $5.2 million increase in asset management revenues in Argentina, as well as a $3.9 million increase in debt trading revenues. Debt trading revenues increased from continued growth in our export financing business, as well as from increased customer activity in the Latin American and Argentina markets. Physical Commodity segment operating revenues decreased as the result of a 15% decline in the number of ounces traded in our precious metals product line, particularly in the Far Eastern markets, as well as diminished customer activity in our physical agricultural and energy business.
Operating revenues in our CES segment decreased as exchange-traded commission and clearing fee revenues decreased $1.1 million, primarily as a result of a 10% decline in exchange-traded volumes and partially offset by an improvement in the overall average commission rate per contract. In addition, operating revenues in our customer prime brokerage product line declined $6.5 million as a result of a narrowing of spreads in the foreign exchange markets and declining performance on our arbitrage desk. See Segment Information below for additional information on activity in each of the segments.
Interest and Transactional Expenses
Year Ended September 30, 2015 Compared to Year Ended September 30, 2014
Transaction-based clearing expenses: Transaction-based clearing expenses increased 13% to $122.7 million in fiscal 2015 compared to $108.5 million in fiscal 2014, and were 20% of operating revenues in fiscal 2015 compared to 22% in fiscal 2014. The increase in expense is primarily related to higher exchange clearing costs in our CES and LME metals activities resulting from increased contract volumes. Additionally, increases in our Global Payments and Equities operating revenues resulted in higher transactional charges.
Introducing broker commissions: Introducing broker commissions increased 6% to $52.7 million in fiscal 2015 compared to $49.9 million in fiscal 2014, and were 8% of operating revenues in fiscal 2015 compared to 10% in fiscal 2014. The increase in expense is primarily due to increased activity in our Financial Ag’s & Energy and Global Payments components, while the decrease in the percentage of introducing broker commissions to operating revenues is a result of increased non-introducing broker sourced revenues, including interest income.
Interest expense: Interest expense increased to $17.1 million in fiscal 2015 compared to $10.5 million in fiscal 2014. The increase in interest expense is primarily related to $5.8 million of incremental expense from the acquisition of G.X. Clarke. Additionally, higher average borrowings outstanding on the corporate credit facility available for working capital needs resulted in increased expense.
Year Ended September 30, 2014 Compared to Year Ended September 30, 2013
Transaction-based clearing expenses: Transaction-based clearing expenses decreased 1% to $108.5 million in fiscal 2014 compared to $110.1 million in fiscal 2013, and were 22% of operating revenues in fiscal 2014 compared to 24% in fiscal 2013. Decreases in expense in our CES segment, resulting from lower exchange-traded contract volumes and FX prime brokerage activities, were nearly offset by higher ADR conversion fees in our Securities segment’s equity market-making business and exchange clearing costs in our LME metals activities in our Commercial Hedging segment.
Introducing broker commissions: Introducing broker commissions increased 23% to $49.9 million in fiscal 2014 compared to $40.5 million in fiscal 2013, and were 10% of operating revenues in fiscal 2014 compared to 9% in fiscal 2013. This increase is primarily due to the higher volume of payments in our Global Payments segment, and an increase in LME metals activity. Also, increased activity in our Financial Ag’s & Energy component of our Commercial Hedging segment resulted in an increase in introducing broker commission expenses.
Interest expense: Interest expense increased to $10.5 million in fiscal 2014 compared to $7.9 million in fiscal 2013. This increase is primarily related to the coupon interest and amortization of related debt financing costs, which aggregate to $1.1 million per quarter, related to our offering of 8.5% Senior Notes due July 2020 completed during the fourth quarter of fiscal 2013. The increase was partially offset by a decrease in interest expense related to commodity financing and facilitation activities due to lower average outstanding borrowings during fiscal 2014.
31
Net Operating Revenues
Net operating revenues is one of the key measures used by management to assess the performance of our operating segments. Net operating revenue is calculated as operating revenue less transaction-based clearing expenses, introducing broker commissions and interest expense. Transaction-based clearing expenses represent variable expenses paid to executing brokers, exchanges, clearing organizations and banks in relation to our transactional volumes. Introducing broker commissions include commission paid to non-employee third parties that have introduced customers to us. Net operating revenues represent revenues available to pay variable compensation to risk management consultants and traders and direct non-variable expenses, as well as variable and non-variable expenses of operational and administrative employees.
Year Ended September 30, 2015 Compared to Year Ended September 30, 2014
Net operating revenues increased $109.8 million, or 34%, to $431.8 million in fiscal 2015 compared to $322.0 million in fiscal 2014.
Year Ended September 30, 2014 Compared to Year Ended September 30, 2013
Net operating revenues increased $12.3 million, or 4%, to $322.0 million in fiscal 2014 compared to $309.7 million in fiscal 2013.
Compensation and Other Expenses
The following table shows a summary of expenses, other than interest and transactional expenses.
Year Ended September 30, | |||||||||||||||||
(in millions) | 2015 | % Change | 2014 | % Change | 2013 | ||||||||||||
Compensation and benefits: | |||||||||||||||||
Fixed compensation and benefits | $ | 115.3 | 7 | % | $ | 108.0 | (2 | )% | $ | 110.7 | |||||||
Variable compensation and benefits | 135.8 | 45 | % | 93.9 | 7 | % | 88.0 | ||||||||||
251.1 | 24 | % | 201.9 | 2 | % | 198.7 | |||||||||||
Other non-compensation expenses: | |||||||||||||||||
Communication and data services | 28.1 | 9 | % | 25.8 | 12 | % | 23.1 | ||||||||||
Occupancy and equipment rental | 13.5 | 10 | % | 12.3 | 3 | % | 12.0 | ||||||||||
Professional fees | 12.5 | (16 | )% | 14.9 | 20 | % | 12.4 | ||||||||||
Travel and business development | 10.5 | 6 | % | 9.9 | (5 | )% | 10.4 | ||||||||||
Depreciation and amortization | 7.2 | (1 | )% | 7.3 | (9 | )% | 8.0 | ||||||||||
Bad debts and impairments | 7.3 | 33 | % | 5.5 | 588 | % | 0.8 | ||||||||||
Other expense | 23.5 | 28 | % | 18.4 | (20 | )% | 23.1 | ||||||||||
102.6 | 9 | % | 94.1 | 5 | % | 89.8 | |||||||||||
Total compensation and other expenses | $ | 353.7 | 19 | % | $ | 296.0 | 3 | % | $ | 288.5 | |||||||
Year Ended September 30, 2015 Compared to Year Ended September 30, 2014
Compensation and Other Expenses: Compensation and other expenses increased $57.7 million, or 19%, to $353.7 million in fiscal 2015 compared to $296.0 million in fiscal 2014.
Compensation and Benefits: Total compensation and benefits expenses increased 24% to $251.1 million in fiscal 2015 compared to $201.9 million in fiscal 2014. Total compensation and benefits were 40% of operating revenues in fiscal 2015 compared to 41% of operating revenues in fiscal 2014. The variable portion of compensation and benefits increased 45% to $135.8 million in fiscal 2015 compared to $93.9 million in fiscal 2014. Variable compensation and benefits were 31% of net operating revenues in fiscal 2015 compared to 29% in fiscal 2014, as the front office compensation, as a percentage of net operating revenues, increased modestly and also due to higher administrative and executive incentive compensation. Administrative and executive incentive compensation was $25.1 million in fiscal 2015 compared to $12.2 million in fiscal 2014, primarily related to incremental expense from the acquisition of G.X. Clarke, as well as our significantly improved financial performance.
The fixed portion of compensation and benefits increased 7% to $115.3 million in fiscal 2015 compared to $108.0 million in fiscal 2014. Non-variable salaries increased $8.0 million, or 10%, primarily due to incremental costs from the acquisition of G.X. Clarke, and additional headcount increases across certain front office and administrative departments. Employee benefits, excluding share-based compensation, increased $2.3 million in fiscal 2015, primarily due to higher employer health care and
32
retirement costs. Share-based compensation is a component of the fixed portion, and includes stock option and restricted stock expense. Stock option expense was $1.6 million in fiscal 2015 compared to $1.4 million in fiscal 2014. Restricted stock expense was $2.0 million in fiscal 2015 compared to $2.9 million in fiscal 2014. The number of employees increased 8% to 1,231 at the end of fiscal 2015 compared to 1,141 at the end of fiscal 2014.
Other Non-Compensation Expenses: Other non-compensation expenses increased by 9% to $102.6 million in fiscal 2015 compared to $94.1 million in fiscal 2014. Communication and data services expenses increased $2.3 million, primarily due to increases in market information expenses related to incremental costs from the acquisition of G.X. Clarke and expansion of our Financial Ag’s & Energy business activities. Professional fees decreased $2.4 million, primarily due to lower legal, consultancy, and service costs.
Bad debts and impairments increased $1.8 million year-over-year. During fiscal 2015, bad debts were $7.3 million, primarily related to $2.8 million of customer receivables in our Physical Ag’s & Energy component of our Physical Commodities segment, $2.3 million of OTC customer deficits and $0.6 million of LME customer deficits in our Commercial Hedging segment, $0.5 million of uncollectible service fees and notes in our Securities segment, and $1.1 million of notes receivable related to loans pertaining to a former acquisition. During fiscal 2014, bad debts were $5.5 million, net of recoveries of $0.2 million, including $3.8 million in our Commercial Hedging segment, primarily related to account deficits from a Hong Kong commercial LME customer and Brazilian OTC Financial Ag’s & Energy customers. Additionally, we recorded bad debts of $0.9 million in our Physical Commodities segment related to renewable fuels activity in our Physical Ag’s & Energy component, and $0.7 million in our Securities segment primarily related to a charge-off of uncollectible service fees.
Other expense increased $5.1 million, primarily as a result of the change in the revaluation of contingent liabilities related to certain business combinations. During fiscal 2015, we recorded $1.8 million of additional consideration related to the acquisition of G.X. Clarke and Tradewire Securities. During fiscal 2014, we revised downward the additional consideration to be paid for the transfer of accounts from Tradewire Securities, partially offset by an increase in the additional consideration paid for the acquisition of Hencorp Futures, netting to an expense recovery of $2.0 million - See Note 11 to the Consolidated Financial Statements.
Provision for Taxes: The effective income tax rate on income from continuing operations was 29% in fiscal 2015 compared to 25% in fiscal 2014. The effective income tax rate can vary from period to period depending on, among other factors, the geographic and business mix of our earnings. Generally, when the percentage of pretax earnings generated from the U.S. increases, our effective income tax rate increases. Our effective income tax rate during both periods was lower than the U.S. federal statutory rate primarily due to a higher mix of earnings taxed at lower rates in foreign jurisdictions.
Year Ended September 30, 2014 Compared to Year Ended September 30, 2013
Compensation and Other Expenses: Compensation and other expenses increased $7.5 million, or 3%, to $296.0 million in fiscal 2014 compared to $288.5 million in fiscal 2013.
Compensation and Benefits: Total compensation and benefits expenses increased 2% to $201.9 million in fiscal 2014 compared to $198.7 million in fiscal 2013. Total compensation and benefits were 41% of operating revenues in fiscal 2014 compared to 42% of operating revenues in fiscal 2013. The variable portion of compensation and benefits increased 7% to $93.9 million in fiscal 2014 compared to $88.0 million in fiscal 2013. Variable compensation and benefits were 29% of net operating revenues in fiscal 2014 compared to 28% in fiscal 2013. Administrative and executive incentive compensation was $12.2 million in fiscal 2014 compared to $11.5 million in fiscal 2013.
The fixed portion of compensation and benefits decreased 2% to $108.0 million in fiscal 2014 compared to $110.7 million in fiscal 2013. Non-variable salaries increased $1.1 million, or 1%. Employee benefits increased $1.7 million in fiscal 2014. Share-based compensation is also a component of the fixed portion, and includes stock option and restricted stock expense. Stock option expense was $1.4 million in fiscal 2014 compared to $1.9 million in fiscal 2013. Restricted stock expense was $2.9 million in fiscal 2014 compared to $7.4 million in fiscal 2013. The decrease in restricted stock expense is primarily related to the acceleration of expense in the fourth quarter of fiscal 2013, resulting from the retirement of an executive of one of our wholly owned subsidiaries. The number of employees increased 4% to 1,141 at the end of fiscal 2014 compared to 1,094 at the end of fiscal 2013.
Other Non-Compensation Expenses: Other non-compensation expenses increased by 5% to $94.1 million in fiscal 2014 compared to $89.8 million in fiscal 2013. Communication and data services expenses increased $2.7 million, primarily due to increases in market information expenses and trading software costs among the Financial Ag’s & Energy OTC and LME businesses and higher costs in our foreign exchange prime brokerage business related to trade system conversions. Professional fees increased $2.5 million, primarily due to consultancy costs for the FCStone risk review, service costs related to our restatement of the 2012 and 2011 consolidated financial statements, and higher legal costs. Depreciation and amortization decreased $0.7 million, primarily due to lower amortization of intangible assets, as certain intangibles became fully amortized during fiscal 2013.
33
Bad debts and impairments increased $4.7 million year-over-year. During fiscal 2014, bad debts were $5.5 million, net of recoveries of $0.2 million, including $3.8 million in our Commercial Hedging segment, primarily related to account deficits from a Hong Kong commercial LME customer and Brazilian OTC Financial Ag’s & Energy customers. Additionally, we recorded bad debts of $0.9 million in our Physical Commodities segment related to renewable fuels activity in our Physical Ag’s & Energy component, and $0.7 million in our Securities segment primarily related to a charge-off of uncollectible service fees. During fiscal 2013, bad debts and impairments were $0.8 million, and included $0.1 million of impairment charges on intangible assets and $0.7 million of bad debt expense, net of recoveries of $0.1 million, primarily related to a charge-off of uncollectible service fees in our Securities segment.
Other expense decreased $4.7 million, primarily as a result of the change in the revaluation of contingent liabilities related to certain business combinations. During fiscal 2014, we revised downward the additional consideration to be paid for the transfer of accounts from Tradewire Securities, partially offset by an increase in the additional consideration to be paid for the acquisition of Hencorp Futures, netting to an expense recovery of $2.0 million. During fiscal 2013, we accrued additional contingent consideration of $3.0 million primarily related to the acquisitions of the Hanley Companies and Hencorp Futures and the transfer of accounts from Tradewire Securities. Additionally, increases in non-trading technology costs and hosted conferences were partially offset by fiscal 2013 including a regulatory settlement of $1.5 million - See Note 11 to the Consolidated Financial Statements.
Provision for Taxes: The effective income tax rate on income from continuing operations was 25% in fiscal 2014 compared to 13% in fiscal 2013. The effective income tax rate can vary from period to period depending on, among other factors, the geographic and business mix of our earnings. In fiscal 2013, we released a portion of the valuation allowance for state net operating loss carryforwards and changed our state tax rate, resulting in a decrease in the effective tax rate.
Unallocated Costs and Expenses
The following table is a breakout of our unallocated costs and expenses from the total costs and expenses shown above. The unallocated costs and expenses include certain shared services such as information technology, accounting and treasury, credit and risk, legal and compliance, and human resources and other activities.
Year Ended September 30, | |||||||||||||||||
(in millions) | 2015 | % Change | 2014 | % Change | 2013 | ||||||||||||
Compensation and benefits: | |||||||||||||||||
Fixed compensation and benefits | $ | 36.7 | 5 | % | $ | 34.8 | (7 | )% | $ | 37.6 | |||||||
Variable compensation and benefits | 23.1 | 89 | % | 12.2 | 7 | % | 11.4 | ||||||||||
59.8 | 27 | % | 47.0 | (4 | )% | 49.0 | |||||||||||
Other non-compensation expenses: | |||||||||||||||||
Communication and data services | 4.5 | 5 | % | 4.3 | 13 | % | 3.8 | ||||||||||
Occupancy and equipment rental | 13.4 | 10 | % | 12.2 | 2 | % | 12.0 | ||||||||||
Professional fees | 7.6 | (20 | )% | 9.5 | 44 | % | 6.6 | ||||||||||
Travel and business development | 2.3 | 5 | % | 2.2 | — | % | 2.2 | ||||||||||
Depreciation and amortization | 5.8 | (6 | )% | 6.2 | (10 | )% | 6.9 | ||||||||||
Bad debts and impairments | 1.1 | — | % | — | — | % | — | ||||||||||
Other expense | 17.8 | 35 | % | 13.2 | (19 | )% | 16.2 | ||||||||||
52.5 | 10 | % | 47.6 | — | % | 47.7 | |||||||||||
Total compensation and other expenses | $ | 112.3 | 19 | % | $ | 94.6 | (2 | )% | $ | 96.7 | |||||||
Year Ended September 30, 2015 Compared to Year Ended September 30, 2014
Total unallocated costs and other expenses increased $17.7 million to $112.3 million in fiscal 2015 compared to $94.6 million in fiscal 2014. Compensation and benefits increased $12.8 million, or 27% to $59.8 million in fiscal 2015 compared to $47.0 million in fiscal 2014. During fiscal 2015, the increase in variable compensation and benefits is primarily related to our improved financial performance over the prior year and the incremental costs from the acquisition of G.X. Clarke. The decrease in professional fees is primarily due to lower legal and consultancy costs related to legal and regulatory matters over the prior year. The increase in other expense is primarily related to the previously discussed change in the revaluation of contingent liabilities related to certain business combinations. Excluding the impacts of the revaluation of contingent liabilities and the incremental unallocated costs from the acquisition of G.X. Clarke, total compensation and other expenses increased 7% over the prior year.
34
Year Ended September 30, 2014 Compared to Year Ended September 30, 2013
Total unallocated costs and other expenses decreased $2.1 million, or 2%, to $94.6 million in fiscal 2014 compared to $96.7 million in fiscal 2013. Compensation and benefits decreased $2.0 million, or 4% to $47.0 million in fiscal 2014 compared to $49.0 million in fiscal 2013. The increase in professional fees is primarily due to legal costs related to regulatory and employment matters and service costs related to our restatement of the 2012 and 2011 consolidated financial statements.
Variable vs. Fixed Expenses
Year Ended September 30, | ||||||||||||||||||||
(in millions) | 2015 | % of Total | 2014 | % of Total | 2013 | % of Total | ||||||||||||||
Variable compensation and benefits | $ | 135.8 | 26 | % | $ | 93.9 | 21 | % | $ | 88.0 | 20 | % | ||||||||
Transaction-based clearing expenses | 122.7 | 23 | % | 108.5 | 24 | % | 110.1 | 25 | % | |||||||||||
Introducing broker commissions | 52.7 | 10 | % | 49.9 | 11 | % | 40.5 | 9 | % | |||||||||||
Total variable expenses | 311.2 | 59 | % | 252.3 | 56 | % | 238.6 | 54 | % | |||||||||||
Fixed compensation and benefits | 115.3 | 22 | % | 108.0 | 24 | % | 110.7 | 26 | % | |||||||||||
Other fixed expenses | 95.3 | 18 | % | 88.6 | 19 | % | 89.0 | 20 | % | |||||||||||
Bad debts and impairments | 7.3 | 1 | % | 5.5 | 1 | % | 0.8 | — | % | |||||||||||
Total non-variable expenses | 217.9 | 41 | % | 202.1 | 44 | % | 200.5 | 46 | % | |||||||||||
Total non-interest expenses | $ | 529.1 | 100 | % | $ | 454.4 | 100 | % | $ | 439.1 | 100 | % | ||||||||
We seek to make our non-interest expenses variable to the greatest extent possible, and to keep our fixed costs as low as possible. The table above shows an analysis of our variable expenses and non-variable expenses as a percentage of total non-interest expenses for the years ended September 30, 2015, 2014, and 2013.
Our variable expenses consist of variable compensation paid to traders and risk management consultants, bonuses paid to operational, administrative and executive employees, transaction-based clearing expenses and introducing broker commissions. As a percentage of total non-interest expenses, variable expenses were 59% in fiscal 2015, 56% in fiscal 2014 and 54% in fiscal 2013.
Segment Information
Our business activities are managed as operating segments and organized into reportable segments as follows:
INTL FCStone Inc. | |||||||||||||
Commercial Hedging | Global Payments | Securities | Physical Commodities | Clearing and Execution Services | |||||||||
Components: | Component: | Components: | Components: | Components: | |||||||||
- Financial Ag’s & Energy | - Global Payments | - Equity market- making | - Precious metals | - Clearing and Execution Services | |||||||||
- LME metals | - Debt Trading | - Physical Ag’s & Energy | - FX Prime Brokerage | ||||||||||
- Investment Banking | |||||||||||||
- Asset Management | |||||||||||||
We report our operating segments based on services provided to customers. Net contribution is one of the key measures used by management to assess the performance of each segment and for decisions regarding the allocation of our resources. Net contribution is calculated as revenues less direct cost of sales, interest expense, transaction-based clearing expenses, introducing broker commissions and variable compensation. Variable compensation paid to risk management consultants and traders generally represents a fixed percentage of an amount equal to revenues generated, and in some cases, revenues produced less transaction-based clearing expense and related charges, base salaries and an overhead allocation.
Segment income is calculated as net contribution less non-variable direct expenses of the segment. These non-variable direct expenses include trader base compensation and benefits, operational employee compensation and benefits, communication and data services, business development, professional fees, bad debt expense, trade errors and direct marketing expenses.
35
Total Segment Results
The following table shows summary information concerning all of our business segments combined.
Year Ended September 30, | |||||||||||||||||
(in millions) | 2015 | % of Operating Revenues | 2014 | % of Operating Revenues | 2013 | % of Operating Revenues | |||||||||||
Operating revenues | $ | 615.8 | 100% | $ | 494.0 | 100% | $ | 461.0 | 100% | ||||||||
Transaction-based clearing expenses | 121.0 | 20% | 107.8 | 22% | 109.7 | 24% | |||||||||||
Introducing broker commissions | 52.7 | 9% | 49.9 | 10% | 40.5 | 9% | |||||||||||
Interest expense | 10.8 | 2% | 5.4 | 1% | 5.6 | 1% | |||||||||||
Net operating revenues | 431.3 | 330.9 | 305.2 | ||||||||||||||
Variable direct compensation and benefits | 110.7 | 18% | 81.7 | 17% | 76.5 | 17% | |||||||||||
Net contribution | 320.6 | 249.2 | 228.7 | ||||||||||||||
Non-variable direct expenses | 132.5 | 22% | 120.4 | 24% | 115.7 | 25% | |||||||||||
Segment income | $ | 188.1 | $ | 128.8 | $ | 113.0 | |||||||||||
Year Ended September 30, 2015 Compared to Year Ended September 30, 2014
The net contribution of all our business segments increased 29% to $320.6 million in fiscal 2015 compared to $249.2 million in fiscal 2014. Segment income increased 46% to $188.1 million in fiscal 2015 compared to $128.8 million in fiscal 2014.
Year Ended September 30, 2014 Compared to Year Ended September 30, 2013
The net contribution of all our business segments increased 9% to $249.2 million in fiscal 2014 compared to $228.7 million in fiscal 2013. Segment income increased 14% to $128.8 million in fiscal 2014 compared to $113.0 million in fiscal 2013.
Commercial Hedging
We serve our commercial clients through our team of risk management consultants, providing a high-value-added service that we believe differentiates us from our competitors and maximizes the opportunity to retain our clients. Our risk management consulting services are designed to quantify and monitor commercial entities’ exposure to commodity and financial risk. Upon assessing this exposure, we develop a plan to control and hedge these risks with post-trade reporting against specific client objectives. Our clients are assisted in the execution of their hedging strategies through a wide range of products from listed exchange-traded futures and options, to basic OTC instruments that offer greater flexibility, to structured OTC products designed for customized solutions.
Our services span virtually all traded commodity markets, with the largest concentrations in agricultural and energy commodities (consisting primarily of grains, energy and renewable fuels, coffee, sugar, cotton, and food service) and base metals products listed on the LME. Our base metals business includes a position as a Category One ring dealing member of the LME, providing execution, clearing and advisory services in exchange-traded futures and OTC products. We also provide execution of foreign currency forwards and options as well as a wide range of structured product solutions to our commercial customers who are seeking cost-effective hedging strategies. Generally, our clients direct their own trading activity, and our risk management consultants do not have discretionary authority to transact trades on behalf of our clients.
36
The following table provides the financial performance for Commercial Hedging for the periods indicated.
Year Ended September 30, | |||||||||||||||||
(in millions) | 2015 | % Change | 2014 | % Change | 2013 | ||||||||||||
Trading gains, net | $ | 152.3 | 23 | % | $ | 124.3 | 9 | % | $ | 114.3 | |||||||
Commission and clearing fees | 88.0 | 10 | % | 79.9 | 17 | % | 68.4 | ||||||||||
Consulting and management fees | 15.1 | (4 | )% | 15.7 | 4 | % | 15.1 | ||||||||||
Interest income | 7.0 | 71 | % | 4.1 | (2 | )% | 4.2 | ||||||||||
Operating revenues | 262.4 | 17 | % | 224.0 | 11 | % | 202.0 | ||||||||||
Transaction-based clearing expenses | 27.6 | 10 | % | 25.0 | 5 | % | 23.7 | ||||||||||
Introducing broker commissions | 19.9 | 9 | % | 18.2 | 21 | % | 15.0 | ||||||||||
Interest expense | 0.2 | (33 | )% | 0.3 | — | % | 0.3 | ||||||||||
Net operating revenues | 214.7 | 19 | % | 180.5 | 11 | % | 163.0 | ||||||||||
Variable direct compensation and benefits | 63.0 | 32 | % | 47.9 | 11 | % | 43.3 | ||||||||||
Net contribution | 151.7 | 14 | % | 132.6 | 11 | % | 119.7 | ||||||||||
Non-variable direct expenses | 66.1 | 1 | % | 65.3 | 4 | % | 62.6 | ||||||||||
Segment income | $ | 85.6 | 27 | % | $ | 67.3 | 18 | % | $ | 57.1 | |||||||
The following tables set forth transactional revenues and selected data for Commercial Hedging for the periods indicated.
Exchange-traded | |||||||||||||||
Year Ended September 30, | |||||||||||||||
2015 | % Change | 2014 | % Change | 2013 | |||||||||||
Transactional revenues (in millions): | |||||||||||||||
Agricultural | $ | 62.0 | 7% | $ | 57.9 | 14% | 50.8 | ||||||||
Energy and renewable fuels | 6.8 | 19% | 5.7 | (10)% | 6.3 | ||||||||||
LME metals | 52.8 | 37% | 38.6 | 30% | 29.8 | ||||||||||
Other | 7.8 | 10% | 7.1 | 4% | 6.8 | ||||||||||
$ | 129.4 | 18% | $ | 109.3 | 17% | 93.7 | |||||||||
Selected data: | |||||||||||||||
Volume (contracts, 000’s) | 20,686.1 | 16% | 17,827.2 | 9% | 16,356.5 | ||||||||||
Average rate per contract (1) | $ | 6.16 | 2% | $ | 6.04 | 8% | $ | 5.61 | |||||||
Average customer segregated equity (millions) | $ | 844.8 | (4)% | $ | 878.2 | (3)% | $ | 900.8 | |||||||
(1) Give-up fee revenues included in exchange-traded transactional revenues have been excluded from the calculation of exchange-traded average rate per contract.
OTC | |||||||||||||||
Year Ended September 30, | |||||||||||||||
2015 | % Change | 2014 | % Change | 2013 | |||||||||||
Transactional revenues (in millions): | |||||||||||||||
Agricultural | $ | 68.3 | 24% | $ | 54.9 | —% | 54.9 | ||||||||
Energy and renewable fuels | 33.3 | 3% | 32.4 | 50% | 21.6 | ||||||||||
Other | 9.4 | 24% | 7.6 | (39)% | 12.4 | ||||||||||
$ | 111.0 | 17% | $ | 94.9 | 7% | 88.9 | |||||||||
Selected data: | |||||||||||||||
Volume (contracts, 000’s) | 1,670.0 | 24% | 1,342.1 | 8% | 1,245.1 | ||||||||||
Average rate per contract (1) | $ | 64.19 | (6)% | $ | 68.25 | —% | $ | 68.35 | |||||||
(1) Cash brokerage revenues included in OTC transactional revenues have been excluded from the calculation of OTC average rate per contract.
37
For information about the assets of this segment, see Note 22 to the Consolidated Financial Statements.
Year Ended September 30, 2015 Compared to Year Ended September 30, 2014
Operating revenues increased 17% to $262.4 million in fiscal 2015 compared to $224.0 million in fiscal 2014. Exchange-traded revenues increased 18% to $129.4 million in fiscal 2015, resulting primarily from strong growth in LME metals revenues, driven by increased customer activity and expansion activities in the Far East. In addition, agricultural commodity exchange- traded revenues increased as a result of increased volatility and an increase in customer hedging activity related to the large domestic crop in calendar 2014 being purchased by our customers. Overall exchange-traded contract volume increased 16% and the average rate per contract increased to $6.16.
OTC revenues increased 17% to $111.0 million in fiscal 2015, primarily driven by strong performance in agricultural commodities, in particular grains, coffee, dairy and sugar. Energy and renewable fuels OTC revenues increased modestly compared to the prior year. OTC volumes increased 24% to 1.7 million contracts in fiscal 2015 compared to 1.3 million in fiscal 2014, while the average rate per contract declined 6% compared to the prior year.
Consulting and management fees decreased 4% to $15.1 million in fiscal 2015 compared to fiscal 2014 while interest income, which remains constrained by low short-term interest rates, increased 71%, to $7.0 million in fiscal 2015 compared to $4.1 million in fiscal 2014. The increase in interest income is driven by the implementation of our interest rate management program which includes an extension of the duration of our U.S. Treasury investments and the utilization of interest rate swaps to manage a portion of our interest rate position, which was partially offset by a 4% decrease in average customer equity.
Segment income increased 27% to $85.6 million in fiscal 2015 compared to $67.3 million in fiscal 2014, driven by the increase in operating revenues. Variable expenses, excluding interest, expressed as a percentage of operating revenues increased to 42% in fiscal 2015 compared to 41% in fiscal 2014.
Year Ended September 30, 2014 Compared to Year Ended September 30, 2013
Operating revenues increased 11% to $224.0 million in fiscal 2014 compared to $202.0 million in fiscal 2013. Exchange-traded revenues increased 17% to $109.3 million in fiscal 2014, driven primarily by growth in agricultural commodity and LME metals revenues. Agricultural commodity exchange-traded revenues benefited from improved market conditions in the domestic grain and global coffee markets. The LME metals revenue growth was driven by increased customer activity and expansion activities in the Far East. Overall exchange-traded contract volume increased 9% and the average rate per contract increased to $6.04 primarily driven by an increase in business from introducing brokers, as evidenced by the $3.2 million increase in introducing broker commission expense and overall business mix.
OTC revenues increased 7% to $94.9 million in fiscal 2014, with growth in energy and renewable fuels revenues offset by declines in foreign exchange hedging revenues, while agricultural commodity hedging revenues were flat. OTC volumes increased 8% to 1.3 million contracts in fiscal 2014 compared to 1.2 million in fiscal 2013.
Consulting and management fees increased 4% to $15.7 million in fiscal 2014 compared to fiscal 2013 while interest income, which remains constrained by low short-term interest rates, declined 2%, to $4.1 million in fiscal 2014 compared to $4.2 million in fiscal 2013, driven by a 3% decrease in average customer equity as a result of lower exchange-traded margin requirements.
Segment income increased 18% to $67.3 million in fiscal 2014 compared to $57.1 million in fiscal 2013, driven by the increase in operating revenues, partially offset by a $3.8 million increase in bad debt expense. Variable expenses expressed as a percentage of operating revenues remained unchanged at 41% in fiscal 2014 and fiscal 2013.
Global Payments
We provide global payment solutions to banks and commercial businesses as well as charities and non-governmental organizations and government organizations. We offer payments services in more than 130 countries, which we believe is more than any other payments solution provider, and provide competitive and transparent pricing. Through our technology platform, full-service electronic execution capability and commitment to customer service, we believe we are able to provide simple and fast execution, ensuring delivery of funds in any of these countries quickly through our global network of correspondent banks. In this business, we primarily act as a principal in buying and selling foreign currencies on a spot basis. We derive revenue from the difference between the purchase and sale prices.
We believe our clients value our ability to provide exchange rates that are significantly more competitive than those offered by large international banks, a competitive advantage that stems from our years of foreign exchange expertise focused on smaller, less liquid currencies. Additionally, as a member of SWIFT (Society for Worldwide Interbank Financial Telecommunication), we are able to offer our services to large money center and global banks seeking more competitive international payments services.
38
The following table provides the financial performance and selected data for Global Payments for the periods indicated.
Year Ended September 30, | |||||||||||||||||
(in millions) | 2015 | % Change | 2014 | % Change | 2013 | ||||||||||||
Operating revenues | $ | 77.1 | 39 | % | $ | 55.4 | 35 | % | $ | 40.9 | |||||||
Transaction-based clearing expenses | 3.5 | 35 | % | 2.6 | (7 | )% | 2.8 | ||||||||||
Introducing broker commissions | 5.0 | 16 | % | 4.3 | 378 | % | 0.9 | ||||||||||
Interest expense | 0.1 | (67 | )% | 0.3 | (40 | )% | 0.5 | ||||||||||
Net operating revenues | 68.5 | 42 | % | 48.2 | 31 | % | 36.7 | ||||||||||
Variable direct compensation and benefits | 14.0 | 32 | % | 10.6 | 22 | % | 8.7 | ||||||||||
Net contribution | 54.5 | 45 | % | 37.6 | 34 | % | 28.0 | ||||||||||
Non-variable direct expenses | 11.2 | 20 | % | 9.3 | 24 | % | 7.5 | ||||||||||
Segment income | $ | 43.3 | 53 | % | $ | 28.3 | 38 | % | $ | 20.5 | |||||||
Selected data: | |||||||||||||||||
Global payments (number of trades, 000’s) | 325.4 | 70% | 191.5 | 36 | % | 140.8 | |||||||||||
Average revenue per trade | $ | 236.94 | (18)% | $ | 289.30 | — | % | $ | 290.48 | ||||||||
For information about the assets of this segment, see Note 22 to the Consolidated Financial Statements.
Year Ended September 30, 2015 Compared to Year Ended September 30, 2014
Operating revenues increased 39% to $77.1 million in fiscal 2015 compared to $55.4 million in fiscal 2014. The operating revenue growth was driven by a 70% increase in the volume of payments made. An increase in volumes from financial institutions resulted in a lower average size of payment made, producing an 18% decrease in the average revenue per trade.
Segment income increased 53% to $43.3 million in fiscal 2015 compared to $28.3 million in fiscal 2014. The increase primarily resulted from the higher operating revenues partially offset by a $1.9 million increase in non-variable expenses. Variable expenses, excluding interest, expressed as a percentage of operating revenues decreased to 29% in fiscal 2015 compared to 32% in fiscal 2014.
Year Ended September 30, 2014 Compared to Year Ended September 30, 2013
Operating revenues increased 35% to $55.4 million in fiscal 2014 compared to $40.9 million in fiscal 2013. The operating revenue growth was driven by a 36% increase in the volume of trades while the average revenue per trade remained relatively unchanged. We continue to benefit from an increase in the number of clients transacting, including financial institutions, as well as our ability to offer an electronic transaction order system to our clients.
Segment income increased 38% to $28.3 million in fiscal 2014 compared to $20.5 million in fiscal 2013. The increase primarily resulted from the higher operating revenues partially offset by a $1.3 million increase in non-variable compensation and benefits. Variable expenses expressed as a percentage of operating revenues increased to 32% in fiscal 2014 compared to 30% in fiscal 2013, primarily as a result of an increase in introducing broker commissions due to new customer revenue mix.
Securities
We provide value-added solutions that facilitate cross-border trading. We believe our clients value our ability to manage complex transactions, including foreign exchange, utilizing our local understanding of market convention, liquidity and settlement protocols around the world. Our clients include U.S.-based regional and national broker-dealers and institutions investing or executing client transactions in international markets and foreign institutions seeking access to the U.S. securities markets. We are one of the leading market makers in foreign securities, including unlisted ADRs, GDRs and foreign ordinary shares. We make markets in over 1,600 ADRs, GDRs and foreign ordinary shares, of which over 1,300 trade in the OTC market. In addition, we will, on request, make prices in more than 10,000 unlisted foreign securities. We are a broker-dealer in Argentina where we are active in providing institutional executions in the local capital markets.
Following our acquisition of G.X. Clarke effective January 1, 2015, we act as an institutional dealer in fixed income securities, including U.S. Treasury, U.S. government agency and agency mortgage-backed securities to a client base including asset managers, commercial bank trust and investment departments, broker-dealers, and insurance companies. In addition, we provide a full range of corporate finance advisory services to our middle market clients, including capital market solutions and a wide array of advisory services across a broad spectrum of industries. Our advisory services span mergers and acquisitions, liability management, restructuring opinions and valuations. We also originate, structure and place a wide array of debt
39
instruments in the international and domestic capital markets. These instruments include complex asset-backed securities (primarily in Argentina), unsecured bond and loan issues, negotiable notes and other trade-related debt instruments used in cross-border trade finance. On occasion, we may invest our own capital in debt instruments before selling them. We also actively trade in a variety of international debt instruments as well as operate an asset management business in which we earn fees, commissions and other revenues for management of third party assets and investment gains or losses on our investments in funds and proprietary accounts managed either by our investment managers or by independent investment managers.
The following table provides the financial performance for Securities for the periods indicated.
Year Ended September 30, | |||||||||||||||||
(in millions) | 2015 | % Change | 2014 | % Change | 2013 | ||||||||||||
Operating revenues | $ | 129.8 | 62 | % | $ | 80.3 | 15 | % | $ | 70.0 | |||||||
Transaction-based clearing expenses | 23.7 | 37 | % | 17.3 | 8 | % | 16.0 | ||||||||||
Introducing broker commissions | 8.5 | 49 | % | 5.7 | 39 | % | 4.1 | ||||||||||
Interest expense | 9.0 | 233 | % | 2.7 | 42 | % | 1.9 | ||||||||||
Net operating revenues | 88.6 | 62 | % | 54.6 | 14 | % | 48.0 | ||||||||||
Variable direct compensation and benefits | 21.2 | 55 | % | 13.7 | 32 | % | 10.4 | ||||||||||
Net contribution | 67.4 | 65 | % | 40.9 | 9 | % | 37.6 | ||||||||||
Non-variable direct expenses | 26.9 | 35 | % | 19.9 | 10 | % | 18.1 | ||||||||||
Segment income | $ | 40.5 | 93 | % | $ | 21.0 | 8 | % | $ | 19.5 | |||||||
The following table sets forth operating revenues by product line and selected data for Securities for the periods indicated.
Year Ended September 30, | |||||||||||||||
2015 | % Change | 2014 | % Change | 2013 | |||||||||||
Operating revenues by product line (in millions): | |||||||||||||||
Equity market-making | $ | 57.7 | 44% | $ | 40.2 | 3% | $ | 39.1 | |||||||
Debt trading | 48.6 | 191% | 16.7 | 30% | 12.8 | ||||||||||
Investment banking | 9.5 | 1% | 9.4 | 1% | 9.3 | ||||||||||
Asset management | 14.0 | —% | 14.0 | 59% | 8.8 | ||||||||||
$ | 129.8 | 62% | $ | 80.3 | 15% | $ | 70.0 | ||||||||
Selected data: | |||||||||||||||
Equity market-making (gross dollar volume, millions) | $ | 107,052.9 | 44% | $ | 74,162.9 | 29% | $ | 57,705.8 | |||||||
Equity revenue per $1,000 traded | $ | 0.54 | —% | $ | 0.54 | (21)% | $ | 0.68 | |||||||
Average assets under management (millions) | $ | 572.1 | 8% | $ | 530.9 | 15% | $ | 462.3 | |||||||
For information about the assets of this segment, see Note 22 to the Consolidated Financial Statements.
Year Ended September 30, 2015 Compared to Year Ended September 30, 2014
Operating revenues increased 62% to $129.8 million in fiscal 2015 compared to $80.3 million in fiscal 2014.
Operating revenues from equity market-making increased 44%, to $57.7 million in fiscal 2015 compared to fiscal 2014, as favorable market conditions drove a 44% increase in the gross dollar volume traded, while the average revenue per $100 traded was flat with the prior year.
Operating revenues from debt trading increased 191% to $48.6 million in fiscal 2015 compared to fiscal 2014. The increase in operating revenues resulted from the acquisition of G.X. Clarke, adding an incremental $31.4 million in operating revenues. Investment banking operating revenues increased 1% in fiscal 2015 compared to fiscal 2014, while asset management revenues in fiscal 2015 were flat compared to fiscal 2014. Average assets under management were $572.1 million in fiscal 2015 compared to $530.9 million in fiscal 2014.
Segment income increased 93% to $40.5 million in fiscal 2015 compared to $21.0 million in fiscal 2014 primarily as a result of the strong performance in equity market making and the acquisition of G.X. Clarke. Variable expenses, excluding interest, expressed as a percentage of operating revenues decreased to 41% in fiscal 2015 compared to 46% in fiscal 2014, as G.X. Clarke has relatively low transaction-based clearing expenses.
40
Year Ended September 30, 2014 Compared to Year Ended September 30, 2013
Operating revenues increased 15% to $80.3 million in fiscal 2014 compared to $70.0 million in fiscal 2013.
Operating revenues from equity market-making increased 3%, to $40.2 million in fiscal 2014 compared to fiscal 2013, primarily as a result of a 29% increase in the gross dollar volume traded due to an increase in customer demand for our services, given the overall increase in industry volumes. The impact on operating revenues from increased volume was partially offset by a narrowing of margins.
Operating revenues from debt trading increased 30% to $16.7 million in fiscal 2014 compared to fiscal 2013. The increase in operating revenues was a result of an increase in export financing revenues, as well as increased customer activity in Latin America and Argentina. Investment banking operating revenues increased 1% in fiscal 2014 compared to fiscal 2013, while asset management revenues increased 59% in fiscal 2014 compared to fiscal 2013 driven by both an increase in assets under management and performance of the underlying funds. Average assets under management were $530.9 million in fiscal 2014 compared to $462.3 million in fiscal 2013.
Segment income increased 8% to $21.0 million in fiscal 2014 compared to $19.5 million in fiscal 2013 primarily as a result of the increase in operating revenues, partially offset by a $1.4 million increase in non-variable compensation and benefits. Variable expenses expressed as a percentage of operating revenues increased to 46% in fiscal 2014 compared to 44% in fiscal 2013, driven by an increase in introducing broker commissions and variable direct compensation and benefits.
Physical Commodities
This segment consists of our physical precious metals trading and physical agricultural and energy commodity businesses. In precious metals, we provide a full range of trading and hedging capabilities, including OTC products, to select producers, consumers, and investors. In our trading activities, we act as a principal, committing our own capital to buy and sell precious metals on a spot and forward basis.
Our physical agricultural and energy commodity business provides financing to commercial commodity-related companies against physical inventories, including grain, lumber, meats, energy products and renewable fuels. We use sale and repurchase agreements to purchase commodities evidenced by warehouse receipts, subject to a simultaneous agreement to sell such commodities back to the original seller at a later date. These transactions are accounted for as product financing arrangements, and accordingly no commodity inventory, purchases or sales are recorded. Additionally, we engage as a principal in physical purchase and sale transactions related to inputs to the renewable fuels and feed ingredient industries.
On April 10, 2015 (the “transfer date”), we transitioned the portion of our precious metals business conducted through our unregulated domestic subsidiary, INTL Commodities Inc., to our United Kingdom based broker-dealer subsidiary, INTL FCStone Ltd., which is regulated by the FCA, the regulator of the financial services industry in the United Kingdom. This transfer resulted in a change in the valuation of precious metals inventory held by INTL FCStone Ltd. as well as the presentation of INTL FCStone Ltd.’s precious metals sales and cost of sales. See Note 1 of the Consolidated Financial Statements for further information.
Precious metals inventory held by our subsidiaries that are not broker-dealers continues to be valued at the lower of cost or market value. Precious metals sales and cost of sales for subsidiaries that are not broker-dealers continue to be recorded on a gross basis. In our physical agricultural and energy commodities business, we value our inventory at the lower of cost or market value and record revenues on a gross basis.
During fiscal 2013, we began an exit of our physical base metals business through the sale and orderly liquidation of then-current open positions. We completed the exit of the physical base metals business during fiscal 2014. We have reclassified the physical base metals activities in the financial statements for fiscal 2014 and fiscal 2013 as discontinued operations.
Operating revenues and losses from our commodities derivatives activities are included in ‘trading gains, net’ in the consolidated income statements. We generally mitigate the price risk associated with commodities held in inventory through the use of derivatives. We do not elect hedge accounting under U.S. GAAP in accounting for this price risk mitigation.
41
The following table provides the financial performance for Physical Commodities for the periods indicated.
Year Ended September 30, | |||||||||||||||||
(in millions) | 2015 | % Change | 2014 | % Change | 2013 | ||||||||||||
Operating revenues | $ | 23.1 | 12 | % | $ | 20.6 | (23 | )% | $ | 26.8 | |||||||
Transaction-based clearing expenses | 0.4 | (33 | )% | 0.6 | (14 | )% | 0.7 | ||||||||||
Introducing broker commissions | 0.3 | (25 | )% | 0.4 | 100 | % | 0.2 | ||||||||||
Interest expense | 1.2 | (29 | )% | 1.7 | (32 | )% | 2.5 | ||||||||||
Net operating revenues | 21.2 | 18 | % | 17.9 | (24 | )% | 23.4 | ||||||||||
Variable direct compensation and benefits | 4.3 | 13 | % | 3.8 | (36 | )% | 5.9 | ||||||||||
Net contribution | 16.9 | 20 | % | 14.1 | (19 | )% | 17.5 | ||||||||||
Non-variable direct expenses | 11.1 | 35 | % | 8.2 | 9 | % | 7.5 | ||||||||||
Segment income | $ | 5.8 | (2 | )% | $ | 5.9 | (41 | )% | $ | 10.0 | |||||||
The following tables set forth operating revenue by product line and selected data for Physical Commodities for the periods indicated.
Precious Metals | |||||||||||||||
Year Ended September 30, | |||||||||||||||
2015 | % Change | 2014 | % Change | 2013 | |||||||||||
Total revenues | $ | 33,816.4 | 9% | $ | 31,142.5 | (25)% | $ | 41,746.7 | |||||||
Cost of sales of physical commodities | 33,802.2 | 9% | 31,131.4 | (25)% | 41,731.7 | ||||||||||
Operating revenues | $ | 14.2 | 28% | $ | 11.1 | (26)% | $ | 15.0 | |||||||
Selected data: | |||||||||||||||
Gold equivalent ounces traded (000’s) | 126,365.5 | 60% | 79,127.1 | (15)% | 93,256.8 | ||||||||||
Average revenue per ounce traded | $ | 0.11 | (21)% | $ | 0.14 | (13)% | $ | 0.16 | |||||||
Physical Ag’s & Energy | |||||||||||||||
Year Ended September 30, | |||||||||||||||
2015 | % Change | 2014 | % Change | 2013 | |||||||||||
Total revenues | $ | 275.6 | (18)% | $ | 337.7 | 11% | $ | 305.3 | |||||||
Cost of sales of physical commodities | 266.6 | (19)% | 328.2 | 12% | 293.4 | ||||||||||
Operating revenues | $ | 9.0 | (5)% | $ | 9.5 | (20)% | $ | 11.9 | |||||||
For information about the assets of this segment, see Note 22 to the Consolidated Financial Statements.
Year Ended September 30, 2015 Compared to Year Ended September 30, 2014
Operating revenues increased 12% to $23.1 million in fiscal 2015 compared to $20.6 million in fiscal 2014.
Precious metals operating revenues increased 28% to $14.2 million in fiscal 2015 compared to $11.1 million in fiscal 2014. The increase in operating revenues is a result of a 60% increase in the number of ounces traded, primarily in the Far Eastern markets, however this was partially offset by a narrowing of spreads due to market conditions.
Operating revenues in Physical Ag’s & Energy decreased 5% to $9.0 million in fiscal 2015 compared to $9.5 million in fiscal 2014. The decrease in operating revenues is primarily due to a decline in commercial commodity-related financing transactions.
Segment income decreased 2% to $5.8 million in fiscal 2015 compared to $5.9 million in fiscal 2014, and primarily resulted from the decline in operating revenues and a $2.8 million increase in bad debt expense in Physical Ag’s & Energy, related to a customer in the renewable fuels industry. Variable expenses expressed as a percentage of operating revenues decreased to 22% in fiscal 2015 compared to 23% in fiscal 2014.
Year Ended September 30, 2014 Compared to Year Ended September 30, 2013
Operating revenues decreased 23% to $20.6 million in fiscal 2014 compared to $26.8 million in fiscal 2013.
42
Precious metals operating revenues decreased 26% to $11.1 million in fiscal 2014 compared to $15.0 million in fiscal 2013. The decline in operating revenues is a result of a 15% decrease in the number of ounces traded, primarily in the Far Eastern markets, as well as a decline in the average revenue per ounce traded.
Operating revenues in the physical agricultural and energy commodity product line decreased 20% to $9.5 million in fiscal 2014 compared to $11.9 million in fiscal 2013. The decrease in operating revenues is primarily due to a decline in customer volumes as a result of market conditions.
Segment income decreased 41% to $5.9 million in fiscal 2014 compared to $10.0 million in fiscal 2013, and primarily resulted from the decline in operating revenues and $0.9 million of bad debts in the Physical Ag’s & Energy product line, related to renewable fuels activity. Variable expenses expressed as a percentage of operating revenues decreased to 23% in fiscal 2014 compared to 25% in fiscal 2013, due to a decrease in variable direct compensation and benefits.
Clearing and Execution Services
We seek to provide competitive and efficient clearing and execution of exchange-traded futures and options for the institutional and professional trader market segments. Through our platform, client orders are accepted and directed to the appropriate exchange for execution. We then facilitate the clearing of clients’ transactions. Clearing involves the matching of clients’ trades with the exchange, the collection and management of client margin deposits to support the transactions, and the accounting and reporting of the transactions to clients. We seek to leverage our capabilities and capacity by offering facilities management or outsourcing solutions to other FCMs.
In addition, we provide prime brokerage foreign exchange services to financial institutions and professional traders. We provide our clients with the full range of OTC products, including 24-hour a day execution of spot, forwards and options as well as non-deliverable forwards in both liquid and exotic currencies. We also operate a proprietary foreign exchange desk that arbitrages the exchange-traded foreign exchange markets with the cash markets.
The following table provides the financial performance and selected data for Clearing and Execution Services for the periods indicated.
Year Ended September 30, | |||||||||||||||||
(in millions) | 2015 | % Change | 2014 | % Change | 2013 | ||||||||||||
Trading gains, net | $ | 21.5 | 52 | % | $ | 14.1 | (32 | )% | $ | 20.6 | |||||||
Commission and clearing fees | 96.5 | — | % | 96.3 | (1 | )% | 97.4 | ||||||||||
Consulting and management fees | 1.6 | (11 | )% | 1.8 | (10 | )% | 2.0 | ||||||||||
Interest income | 3.8 | 153 | % | 1.5 | 15 | % | 1.3 | ||||||||||
Operating revenues | $ | 123.4 | 9 | % | $ | 113.7 | (6 | )% | $ | 121.3 | |||||||
Transaction-based clearing expenses | 65.8 | 6 | % | 62.3 | (6 | )% | 66.5 | ||||||||||
Introducing broker commissions | 19.0 | (11 | )% | 21.3 | 5 | % | 20.3 | ||||||||||
Interest expense | 0.3 | (25 | )% | 0.4 | — | % | 0.4 | ||||||||||
Net operating revenues | 38.3 | 29 | % | 29.7 | (13 | )% | 34.1 | ||||||||||
Variable direct compensation and benefits | 8.2 | 44 | % | 5.7 | (30 | )% | 8.2 | ||||||||||
Net contribution | 30.1 | 25 | % | 24.0 | (7 | )% | 25.9 | ||||||||||
Non-variable direct expenses | 17.2 | (3 | )% | 17.7 | (12 | )% | 20.0 | ||||||||||
Segment income | $ | 12.9 | 105 | % | $ | 6.3 | 7 | % | $ | 5.9 | |||||||
Selected data: | |||||||||||||||||
Exchange-traded volume (contracts, 000’s) | 79.2 | 5 | % | 75.7 | (10 | )% | 84.4 | ||||||||||
Exchange-traded average rate per contract (1) | $ | 1.15 | (5 | )% | $ | 1.21 | 10 | % | $ | 1.10 | |||||||
Average customer segregated equity (millions) | 943.4 | 3 | % | 911.7 | 18 | % | 774.1 | ||||||||||
Foreign exchange prime brokerage volume (U.S. notional, millions) | 449,344.1 | 45 | % | 310,297.5 | 6 | % | 292,526.7 | ||||||||||
(1) Give-up fee revenues included in commission and clearing fees have been excluded from the calculation of exchange-traded average rate per contract.
For information about the assets of this segment, see Note 22 to the Consolidated Financial Statements.
43
Year Ended September 30, 2015 Compared to Year Ended September 30, 2014
Operating revenues increased 9% to $123.4 million in fiscal 2015 compared to $113.7 million in fiscal 2014.
Commission and clearing fee revenues was relatively flat at $96.5 million in fiscal 2015, compared to $96.3 million in fiscal 2014, as a 5% increase in exchange-traded volumes was mostly offset by a lower average rate per contract compared to fiscal 2014. Interest income, which continues to be constrained by the effect of low short-term interest rates, was $3.8 million in fiscal 2015 compared to $1.5 million in fiscal 2014. The increase in interest income was the result of a 3% increase in the average level of customer segregated equity to $943.4 million in fiscal 2015 compared to $911.7 million in fiscal 2014, and the implementation of our interest rate management program.
Operating revenues from customer prime brokerage, reflected on the “trading gains, net” line above, increased 52% to $21.5 million in fiscal 2015 compared to $14.1 million in fiscal 2014, as a result of a 45% increase in foreign exchange volumes as a result of increased foreign currency market volatility.
Segment income increased 105% to $12.9 million in fiscal 2015 compared to $6.3 million in fiscal 2014, primarily as a result of the increase in operating revenues and a decline in variable expenses as a percentage of operating revenues driven by lower introducing broker expenses. Variable expenses, excluding interest, as a percentage of operating revenues were 75% in fiscal 2015 compared to 79% in fiscal 2014.
Year Ended September 30, 2014 Compared to Year Ended September 30, 2013
Operating revenues decreased 6% to $113.7 million in fiscal 2014 compared to $121.3 million in fiscal 2013.
Commission and clearing fee revenues decreased 1% to $96.3 million in fiscal 2014, as a result of a 10% decrease in exchange-traded volumes, which was mostly offset by an increase in our average rate per contract compared to fiscal 2013. Interest income, which continues to be constrained by the effect of low short-term interest rates, was $1.5 million in fiscal 2014 compared to $1.3 million in fiscal 2013. The average level of customer segregated equity increased 18% to $911.7 million in fiscal 2014 compared to $774.1 million in fiscal 2013.
Operating revenues from customer prime brokerage, reflected on the “trading gains, net” line above, decreased 32% to $14.1 million in fiscal 2014 compared to $20.6 million in fiscal 2013, despite a 6% increase in foreign exchange volumes as a result of declining spreads and lower performance on the arbitrage desk.
Segment income increased 7% to $6.3 million in fiscal 2014 compared to $5.9 million in fiscal 2013, primarily as a result of a decline in professional fees, and from fiscal 2013 including a $1.5 million regulatory settlement in non-variable direct expenses. Variable expenses as a percentage of operating revenues were 79% in fiscal 2014 compared to 78% in fiscal 2013, primarily a result of an increase in introducing broker commissions.
Liquidity, Financial Condition and Capital Resources
Overview
Liquidity is defined as our ability to generate sufficient amounts of cash to meet all of our cash needs. Liquidity is of critical importance to us and imperative to maintaining our operations on a daily basis.
On July 1, 2015, we merged three of our wholly owned subsidiaries (FCStone, LLC, INTL FCStone Partners L.P., and FCC Investments, Inc.) into INTL FCStone Securities, and renamed the surviving subsidiary INTL FCStone Financial Inc. INTL FCStone Financial is registered as a broker-dealer with FINRA and is registered as a futures commission merchant with the CFTC and NFA.
In INTL FCStone Financial, our broker-dealer/FCM subsidiary, we have responsibilities to meet margin calls at all exchanges on a daily basis and intra-day basis, if necessary. We require our customers to make any required margin deposits the next business day, and we require our largest customers to make intra-day margin payments during periods of significant price movement. Margin required to be posted to the exchanges is a function of the net open positions of our customers and the required margin per contract. INTL FCStone Financial is subject to minimum capital requirements under Section 4(f)(b) of the Commodity Exchange Act, Part 1.17 of the rules and regulations of the CFTC and the SEC Uniform Net Capital Rule 15c3-1 under the Securities Exchange Act of 1934. These rules specify the minimum amount of capital that must be available to support our clients’ open trading positions, including the amount of assets that INTL FCStone Financial must maintain in relatively liquid form, and are designed to measure general financial integrity and liquidity.
INTL FCStone Ltd, our UK regulated subsidiary, is required to be compliant with the UK’s Individual Liquidity Adequacy Standards (“ILAS”). To comply with these standards, we have implemented daily liquidity procedures, conduct periodic reviews of liquidity by stressed scenarios, and have created liquidity buffers.
44
In addition, in our physical commodities trading, commercial hedging OTC, securities and foreign exchange trading activities, we may be called upon to meet margin calls with our various trading counterparties based upon the underlying open transactions we have in place with those counterparties.
We continuously review our overall credit and capital needs to ensure that our capital base, both stockholders’ equity and debt, as well as available credit facilities can appropriately support the anticipated financing needs of our operating subsidiaries.
As of September 30, 2015, we had total equity capital of $397.1 million, $45.5 million aggregate principal amount of our issued 8.5% senior unsecured notes, due in July 2020 and bank loans of $41.6 million.
A substantial portion of our assets are liquid. As of September 30, 2015, approximately 95% of our assets consisted of cash; securities purchased under agreements to resell; deposits and receivables from exchange-clearing organizations, broker-dealers, clearing organizations and counterparties; customer receivables, marketable financial instruments and investments, and physical commodities inventory. All assets that are not customer and counterparty deposits are financed by our equity capital, senior unsecured notes, bank loans, short-term borrowings from financial instruments sold, not yet purchased and under repurchase agreements, and other payables.
As of September 30, 2015, we had deferred tax assets totaling $28.2 million. We are required to assess our deferred tax assets and the need for a valuation allowance at each reporting period. In assessing the realizability of deferred tax assets, we consider whether it is more likely than not that we will not realize some or all of the deferred tax assets. We are required to record a valuation allowance against deferred tax assets when it is considered more likely than not that all or a portion of our deferred tax assets will not be realized. The valuation allowance for deferred tax assets as of September 30, 2015 and September 30, 2014 was $3.2 million and $2.8 million, respectively. The valuation allowances as of September 30, 2015 and September 30, 2014 were primarily related to U.S. state and local and foreign net operating loss carryforwards that, in the judgment of management, are not more likely than not to be realized.
We incurred U.S. federal, state, and local taxable income/(losses) for the years ended September 30, 2015, 2014, and 2013 of $17.7 million, $(18.4) million, and $(24.5) million, respectively. There are no significant differences between actual levels of past taxable income and the results of continuing operations, before income taxes in these jurisdictions. U.S. federal, state, and local taxable losses incurred during the year ended September 30, 2013 were attributable to a decrease in exchange-traded and OTC derivative transactional volumes and revenue caused by consecutive droughts in the U.S., as well as losses incurred in the physical base metals business. During 2013, we elected to pursue an exit of our physical base metals business through an orderly liquidation of open positions, which was completed during fiscal 2014. When evaluating if U.S. federal, state, and local deferred taxes are realizable, we considered deferred tax liabilities of $2.4 million that are scheduled to reverse from 2016 to 2019 and $1.0 million of deferred tax liabilities associated with unrealized gains in securities which we could sell, if necessary. Furthermore, we considered our ability to implement business and tax planning strategies that would allow the remaining U.S. federal, state, and local deferred tax assets, net of valuation allowances, to be realized within 10 years. Based on the tax planning strategies that are prudent and feasible, management believes that it is more likely than not that we will realize the tax benefit of the deferred tax assets, net of the existing valuation allowance, in the future. However, the realization of deferred income taxes is dependent on future events, and changes in estimate in future periods could result in adjustments to the valuation allowance.
Customer and Counterparty Credit and Liquidity Risk
Our operations expose us to credit risk of default of our customers and counterparties. The risk includes liquidity risk to the extent our customers or counterparties are unable to make timely payment of margin or other credit support. These risks expose us indirectly to the financing and liquidity risks of our customers and counterparties, including the risks that our customers and counterparties may not be able to finance their operations.
As a clearing broker, we act on behalf of our customers for all trades consummated on exchanges. We must pay initial and variation margin to the exchanges, on a net basis, before we receive the required payments from our customers. Accordingly, we are responsible for our customers’ obligations with respect to these transactions, which exposes us to significant credit risk. Our customers are required to make any required margin deposits the next business day, and we require our largest customers to make intra-day margin payments during periods of significant price movement. Our clients are required to maintain initial margin requirements at the level set by the respective exchanges, but we have the ability to increase the margin requirements for customers based on their open positions, trading activity, or market conditions.
With OTC derivative transactions, we act as a principal, which exposes us to the credit risk of both our customers and the counterparties with which we offset our customer positions. As with exchange-traded transactions, our OTC transactions require that we meet initial and variation margin payments on behalf of our customers before we receive the required payment from our customers. OTC customers are required to post sufficient collateral to meet margin requirements based on Value-at-Risk models as well as variation margin requirement based on the price movement of the commodity or security in which they transact. Our customers are required to make any required margin deposits the next business day, and we may require our
45
largest clients to make intra-day margin payments during periods of significant price movement. We have the ability to increase the margin requirements for customers based on their open positions, trading activity, or market conditions. On a limited basis, we provide credit thresholds to certain customers, based on internal evaluations and monitoring of customer creditworthiness.
In addition, with OTC transactions, we are at risk that a counterparty will fail to meet its obligations when due. We would then be exposed to the risk that the settlement of a transaction which is due a customer will not be collected from the respective counterparty with which the transaction was offset. We continuously monitor the credit quality of our respective counterparties and mark our positions held with each counterparty to market on a daily basis.
In our debt trading business, we enter into receivable under reverse repurchase agreements and payables under repurchase agreements primarily to finance inventory positions, acquire securities to cover short positions or to acquire securities for settlement. We either receive or pledge securities to adequately collateralize such agreements and transactions. The value of this collateral is marked-to-market on a daily basis and we may require counterparties, or be required, to deposit additional collateral or return collateral pledged, when appropriate.
During the fiscal years ended September 30, 2015, 2014, and 2013, we recorded bad debts, net of recoveries of $7.3 million, $5.5 million, and $0.7 million, respectively. During the year ended September 30, 2015, primarily related to $2.8 million of customer receivables in our Physical Ag’s & Energy component of our Physical Commodities segment, $2.3 million of OTC customer deficits and $0.6 million of LME customer deficits in our Commercial Hedging segment, $0.5 million of uncollectible service fees and notes in our Securities segment, and $1.1 million of notes receivable related to loans pertaining to a former acquisition. During the year ended September 30, 2014, our bad debts included $3.8 million in our Commercial Hedging segment, related to account deficits from a Hong Kong commercial LME customer and Brazilian OTC Financial Ag’s & Energy customers, $0.9 million in our Physical Ag’s & Energy component, related to renewable fuels activity, and $0.7 million in our Securities segment related to charge-offs of uncollectible service fees. Additional information related to bad debts, net of recoveries, for the fiscal years ended September 30, 2015, 2014, and 2013 is set forth in Note 5 of the Consolidated Financial Statements.
Primary Sources and Uses of Cash
Our assets and liabilities may vary significantly from period to period due to changing customer requirements, economic and market conditions and our growth. Our total assets as of September 30, 2015 and September 30, 2014, were $5,070.0 million and $3,039.7 million, respectively. Our operating activities generate or utilize cash as a result of net income or loss earned or incurred during each period and fluctuations in our assets and liabilities. The most significant fluctuations arise from changes in the level of customer activity, commodities prices and changes in the balances of financial instruments and commodities inventory. INTL FCStone Financial and INTL FCStone Ltd. occasionally uses their margin line credit facilities, on a short-term basis, to meet intraday settlements with the commodity exchanges prior to collecting margin funds from their customers.
The majority of the assets of INTL FCStone Financial Inc. are restricted from being transferred to its parent or other affiliates due to specific regulatory requirements. These restrictions have no impact on our ability to meet our cash obligations, and no impact is expected in the future.
We have liquidity and funding policies and processes in place that are intended to maintain significant flexibility to address both company-specific and industry liquidity needs. The majority of our excess funds are held with high-quality institutions, under highly-liquid reverse repurchase agreements, U.S. government obligations and AA-rated money market investments. We do not hold any direct investments in the general obligations of any sovereign nations.
As of September 30, 2015, $220.0 million of cash, cash equivalents and available-for-sale investment securities was held by our foreign subsidiaries. If these funds are needed for operations in the U.S., we would be required to accrue and pay U.S. taxes to repatriate these funds, up to the amount of undistributed earnings of $227.2 million. However, our intent is to indefinitely reinvest these funds outside of the U.S., and our current plans do not demonstrate a need to repatriate them to fund our U.S. operations.
As of September 30, 2015, approximately $89.5 million of our financial instruments owned and $90.0 million of financial instruments sold, not yet purchased, are exchangeable foreign equities and ADRs.
As of September 30, 2015, we had $45.5 million outstanding in aggregate principal amount of our 8.5% Senior Notes due 2020 (the “Notes”). The Notes were issued in July 2013, and bear interest at a rate of 8.5% per year (payable quarterly on January 30, April 30, July 30 and October 30 of each year). The Notes mature on July 30, 2020. We may redeem the Notes, in whole or in part, at any time on and after July 30, 2016, at a redemption price equal to 100% of the principal amount redeemed plus accrued and unpaid interest to, but not including, the redemption date. We incurred debt issuance costs of $1.7 million in connection with the issuance of the Notes, which are being amortized over the term of the Notes.
In April 2015, we obtained a $4.0 million loan from a commercial bank, secured by equipment purchased with the proceeds. The note is payable in monthly installments, ending in March 2020.
46
As of September 30, 2015, we had four committed bank credit facilities, totaling $280.0 million, of which $38.0 million was outstanding. The credit facilities include:
• | A three-year syndicated loan facility, committed until September 20, 2016, under which INTL FCStone Inc. is entitled to borrow up to $140 million, subject to certain terms and conditions of the credit agreement. The loan proceeds are used to finance working capital needs of us and certain subsidiaries. We paid debt issuance costs of $1.5 million in connection with the issuance of this credit facility, which are being amortized over the thirty-six month term of the facility. |
• | An unsecured syndicated loan facility, committed until April 7, 2016, under which our subsidiary, INTL FCStone Financial is entitled to borrow up to $75 million, subject to certain terms and conditions of the credit agreement. This line of credit is intended to provide short-term funding of margin to commodity exchanges as necessary. |
• | A syndicated borrowing facility, committed until May 1, 2016, under which our subsidiary, FCStone Merchant Services, LLC is entitled to borrow up to $40 million, subject to certain terms and conditions of the credit agreement. The loan proceeds are used to finance traditional commodity financing arrangements and commodity repurchase agreements. |
• | An unsecured syndicated loan facility, committed until October 31, 2016, under which our subsidiary, INTL FCStone Ltd is entitled to borrow up to $25 million, subject to certain terms and conditions of the credit agreement. This facility is intended to provide short-term funding of margin to commodity exchanges as necessary. |
Additional information regarding the committed bank credit facilities can be found in Note 10 of the Consolidated Financial Statements. During fiscal 2015, $255 million of our committed credit facilities are scheduled to expire. We intend to renew or replace these facilities as they expire, and based on our liquidity position and capital structure, we believe we will be able to do so.
In May 2015, we obtained a secured, uncommitted loan facility, under which our subsidiary, INTL FCStone Financial may borrow up to $50.0 million, collateralized by commodity warehouse receipts, to facilitate U.S. commodity exchange deliveries of its customers, subject to certain terms and conditions of the credit agreement.
Our facility agreements contain certain financial covenants relating to financial measures on a consolidated basis, as well as on a certain stand-alone subsidiary basis, including minimum net worth, minimum regulatory capital, minimum net unencumbered liquid assets, maximum net loss, minimum fixed charge coverage ratio and maximum funded debt to net worth ratio. Failure to comply with any such covenants could result in the debt becoming payable on demand. We and our subsidiaries are in compliance with all of our financial covenants under the outstanding facilities.
We have contingent liabilities relating to several acquisitions we have completed since December 2012. See Note 11 to the Consolidated Financial Statements for additional information on these contingent liabilities. Under the terms of the purchase agreements, we have obligations to pay additional consideration if specific conditions and earnings targets are met. In accordance with the Business Combinations Topic of the ASC, the fair value of the additional consideration is recognized as a contingent liability as of the acquisition date. The acquisition date fair value of additional consideration is remeasured to its fair value each reporting period, with changes in fair value recorded in current earnings. The contingent liabilities for these estimated additional discounted purchase price considerations totaled $3.3 million as of September 30, 2015, and are included in ‘accounts payable and other accrued liabilities’ in the consolidated balance sheets. We estimate cash payments related to these contingent liabilities to be $3.1 million during fiscal 2016 and $0.8 million during fiscal 2018.
We contributed $2.2 million to our defined benefit pension plans during the year ended September 30, 2015, and expect to contribute $2.1 million to the plans during fiscal 2016, which represents the minimum funding requirement.
Other Capital Considerations
Our activities are subject to significant governmental regulations and capital adequacy requirements, both in the U.S. and overseas. Certain other of our non-U.S. subsidiaries are also subject to capital adequacy requirements promulgated by authorities of the countries in which they operate.
Our subsidiaries are in compliance with all of their capital regulatory requirements as of September 30, 2015. Additional information on these net capital and minimum net capital requirements can be found in Note 12 of the Consolidated Financial Statements.
The Dodd-Frank Act created a comprehensive new regulatory regime governing the OTC and listed derivatives markets and their participants by requiring, among other things: centralized clearing of standardized derivatives (with certain stated exceptions); the trading of clearable derivatives on swap execution facilities or exchanges; and registration and comprehensive regulation of new categories of market participants as “swap dealers” and swap “introducing brokers.” Our subsidiary, INTL FCStone Markets, LLC, is a provisionally registered swap dealer. Some important rules, such as those setting capital and
47
margin requirements, have not been finalized or fully implemented, and it is too early to predict with any degree of certainty how we will be affected.
Cash Flows
Our cash and cash equivalents increased from $231.3 million as of September 30, 2014 to $268.1 million as of September 30, 2015, a net increase of $36.8 million. Net cash of $37.9 million was provided by operating activities, $15.5 million was used in investing activities and net cash of $15.0 million was provided by financing activities, of which $15.5 million was drawn on lines of credit and increased the amounts payable to lenders under loans, $2.2 million was paid out as earn-outs on acquisitions and $4.7 million was used to repurchase shares. Fluctuations in exchange rates caused a reduction of $0.6 million to our cash and cash equivalents.
In the commodities industry, companies report trading activities in the operating section of the statement of cash flows. Due to the daily price volatility in the commodities market, as well as changes in margin requirements, fluctuations in the balances of deposits held at various exchanges, marketable securities and customer commodity accounts may occur from day-to-day. A use of cash, as calculated on the consolidated statement of cash flows, includes unrestricted cash transferred and pledged to the exchanges or guarantee funds. These funds are held in interest-bearing deposit accounts at the exchanges, and based on daily exchange requirements, may be withdrawn and returned to unrestricted cash. Additionally, within our unregulated OTC and foreign exchange operations, cash deposits received from customers are reflected as cash provided from operations. Subsequent transfer of these cash deposits to counterparties or exchanges to margin their open positions will be reflected as an operating use of cash to the extent the transfer occurs in a different period than the cash deposit was received.
In July 2015, we received proceeds of $2.1 million from the sale of our shares in ICE.
Capital expenditures included in investing activities for property, plant and equipment totaled $9.1 million in fiscal 2015, increasing from $4.3 million in fiscal 2014. The increase in capital expenditures is primarily due to the replacement of a leased aircraft with a purchased aircraft during the current year, that was financed with a note payable, which is included in financing activities.
On December 10, 2014, our Board of Directors authorized repurchase of up to 1.0 million shares of our outstanding common stock from time to time in open market purchases and private transactions, subject to the discretion of the senior management team to implement our stock repurchase plan, and subject to market conditions and as permitted by securities laws and other legal and regulatory requirements. During fiscal 2015, we have repurchased 224,509 shares of our outstanding common stock in open market transactions, for an aggregate purchase price of $4.5 million. During fiscal 2014, we repurchased 513,800 shares of our outstanding common stock in open market transactions, for an aggregate purchase price of $9.7 million. During fiscal 2013, we repurchased 200,109 shares of our outstanding common stock in open market transactions, for an aggregate purchase price of $3.7 million.
Apart from what has been disclosed above, there are no known trends, events or uncertainties that have had or are likely to have a material impact on our liquidity, financial condition and capital resources.
Contractual Obligations
The following table summarizes our cash payment obligations as of September 30, 2015:
Payments Due by Period | |||||||||||||||||||
(in millions) | Total | Less than 1 year | 1 - 3 Years | 3 - 5 Years | After 5 Years | ||||||||||||||
Operating lease obligations | $ | 41.8 | $ | 7.2 | $ | 11.8 | $ | 10.6 | $ | 12.2 | |||||||||
Purchase obligations(1) | 333.9 | 333.9 | — | — | — | ||||||||||||||
Senior unsecured notes | 45.5 | — | — | — | 45.5 | ||||||||||||||
Contingent acquisition consideration | 3.9 | 3.1 | 0.8 | — | — | ||||||||||||||
Other | 9.0 | 2.0 | 3.4 | 1.5 | 2.1 | ||||||||||||||
$ | 434.1 | $ | 346.2 | $ | 16.0 | $ | 12.1 | $ | 59.8 | ||||||||||
(1) Represents an estimate of contractual purchase commitments in the ordinary course of business primarily for the purchase of precious and base metals. Unpriced contract commitments have been estimated using September 30, 2015 fair values. The purchase commitments for less than one year will be partially offset by corresponding sales commitments of $217.0 million.
48
Total contractual obligations exclude defined benefit pension obligations. In fiscal 2016, we anticipate making contributions of $2.1 million to defined benefit plans. Additional information on the funded status of these plans can be found in Note 15 of the Consolidated Financial Statements.
Based upon our current operations, we believe that cash flow from operations, available cash and available borrowings under our credit facilities will be adequate to meet our future liquidity needs.
Off Balance Sheet Arrangements
We are party to certain financial instruments with off-balance sheet risk in the normal course of business as a registered securities broker-dealer and FCM and from our market-making and proprietary trading in the foreign exchange and commodities trading business. These financial instruments include futures, forward and foreign exchange contracts, exchange-traded and OTC options, mortgage-backed TBAs, and interest rate swaps. Derivative financial instruments involve varying degrees of off-statement of financial condition market risk whereby changes in the fair values of underlying financial instruments may result in changes in the fair value of the financial instruments in excess of the amounts reflected in the statement of financial condition. Exposure to market risk is influenced by a number of factors, including the relationships between the financial instruments and the Company’s positions, as well as the volatility and liquidity in the markets in which the financial instruments are traded. The principal risk components of financial instruments include, among other things, interest rate volatility, the duration of the underlying instruments and changes in commodity pricing and foreign exchange rates. The Company attempts to manage its exposure to market risk through various techniques. Aggregate market limits have been established and market risk measures are routinely monitored against these limits. Derivative contracts are traded along with cash transactions because of the integrated nature of the markets for such products. We manage the risks associated with derivatives on an aggregate basis along with the risks associated with our proprietary trading and market-making activities in cash instruments as part of our firm-wide risk management policies.
A significant portion of these instruments are primarily the execution of orders for commodity futures and options on futures contracts on behalf of its customers, substantially all of which are transacted on a margin basis. Such transactions may expose the Company to significant credit risk in the event margin requirements are not sufficient to fully cover losses which customers may incur. The Company controls the risks associated with these transactions by requiring customers to maintain margin deposits in compliance with individual exchange regulations and internal guidelines. The Company monitors required margin levels daily and, therefore, may require customers to deposit additional collateral or reduce positions when necessary. The Company also establishes contract limits for customers, which are monitored daily. The Company evaluates each customer’s creditworthiness on a case-by-case basis. Clearing, financing, and settlement activities may require the Company to maintain funds with or pledge securities as collateral with other financial institutions. Generally, these exposures to exchanges are subject to netting of open positions and collateral, while exposures to customers are subject to netting, per the terms of the customer agreements, which reduce the exposure to the Company by permitting receivables and payables with such customers to be offset in the event of a customer default. Management believes that the margin deposits held are adequate to minimize the risk of material loss that could be created by positions held as of September 30, 2015. Additionally, the Company monitors collateral fair value on a daily basis and adjusts collateral levels in the event of excess market exposure. Generally, these exposures to both counterparties and customers are subject to master netting agreements and the terms of the customer agreements, which reduce the exposure to the Company.
As a broker-dealer in U.S. Treasury obligations, U.S. government agency obligations, and agency mortgage-backed obligations, the Company is engaged in various securities trading, borrowing and lending activities servicing solely institutional counterparties. The Company’s exposure to credit risk associated with the nonperformance of counterparties in fulfilling their contractual obligations pursuant to these securities transactions and market risk associated with the sale of securities not yet purchased can be directly impacted by volatile trading markets which may impair their ability to satisfy outstanding obligations to the Company. In the event of non-performance and unfavorable market price movements, the Company may be required to purchase or sell financial instruments, which may result in a loss to the Company.
We transact OTC and foreign exchange contracts with our customers, and our OTC and foreign exchange trade desks will generally offset the customer’s transaction simultaneously with one of our trading counterparties or will offset that transaction with a similar, but not identical, position on the exchange. These unmatched transactions are intended to be short-term in nature and are conducted to facilitate the most effective transaction for our customer.
Additionally, we hold options and futures on options contracts resulting from market-making and proprietary trading activities in these product lines. We assist customers in our commodities trading business to protect the value of their future production (precious or base metals) by selling them put options on an OTC basis. We also provide our commodities trading business customers with sophisticated option products, including combinations of buying and selling puts and calls. We mitigate our risk by effecting offsetting options with market counterparties or through the purchase or sale of exchange-traded commodities futures. The risk mitigation of offsetting options is not within the documented hedging designation requirements of the Derivatives and Hedging Topic of the ASC.
49
We also carry short positions, selling financial instruments that we do not own and borrowing financial instruments to make good delivery, and therefore we are obliged to purchase such financial instruments at a future date in order to return the borrowed financial instruments. We have recorded these obligations in the consolidated financial statements at September 30, 2015 and September 30, 2014, at fair value of the related financial instruments, totaling $568.3 million and $264.0 million, respectively. These positions are held to offset the risks related to financial assets owned, and reported in our consolidated balance sheets in ‘financial instruments owned, at fair value’, and ‘physical commodities inventory’. We will incur losses if the fair value of the financial instruments sold, not yet purchased, increases subsequent to September 30, 2015, which might be partially or wholly offset by gains in the value of assets held as of September 30, 2015. The totals of $568.3 million and $264.0 million include a net liability of $54.1 million and $84.4 million for derivatives, based on their fair value as of September 30, 2015 and September 30, 2014, respectively.
The Company does not anticipate non-performance by counterparties in the above situations. The Company has a policy of reviewing the credit standing of each counterparty with which it conducts business. The Company has credit guidelines that limit the Company’s current and potential credit exposure to any one counterparty. The Company administers limits, monitors credit exposure, and periodically reviews the financial soundness of counterparties. The Company manages the credit exposure relating to its trading activities in various ways, including entering into collateral arrangements and limiting the duration of exposure. Risk is mitigated in certain cases by closing out transactions and entering into risk reducing transactions.
We are a member of various commodity exchanges and clearing organizations. Under the standard membership agreement, all members are required to guarantee the performance of other members and, accordingly, in the event another member is unable to satisfy its obligations to the exchange, we may be required to fund a portion of the shortfall. Our liability under these arrangements is not quantifiable and could exceed the cash and securities we have posted as collateral at the exchanges. However, management believes that the potential for us to be required to make payments under these arrangements is remote. Accordingly, no contingent liability for these arrangements has been recorded in the consolidated balance sheets as of September 30, 2015 and 2014.
Effects of Inflation
Because our assets are, to a large extent, liquid in nature, they are not significantly affected by inflation. Increases in our expenses, such as compensation and benefits, transaction-based clearing expenses, occupancy and equipment rental, due to inflation, may not be readily recoverable from increasing the prices of our services. While rising interest rates are generally favorable for us, to the extent that inflation has other adverse effects on the financial markets and on the value of the financial instruments held in inventory, it may adversely affect our financial position and results of operations.
Critical Accounting Policies
The preparation of consolidated financial statements in conformity with U.S. GAAP requires management to make estimates and assumptions that affect the reported amounts of assets and liabilities, disclosure of contingent liabilities at the date of the financial statements and the reported amounts of revenue and expenses during the reported period. The accounting estimates and assumptions discussed in this section are those that we consider the most critical to the financial statements. We believe these estimates and assumptions can involve a high degree of judgment and complexity. Due to their nature, estimates involve judgment based upon available information. Actual results or amounts could differ from estimates and the difference could have a material impact on the financial statements. Therefore, understanding these policies is important in understanding our reported and potential future results of operations and financial position.
Valuation of Financial Instruments and Foreign Currencies. Substantially all financial instruments are reflected in the consolidated financial statements at fair value or amounts that approximate fair value. These financial instruments include: cash and cash equivalents; cash, securities and other assets segregated under federal and other regulations; financial instruments purchased under agreements to resell; deposits with clearing organizations; financial instruments owned; and financial instruments sold but not yet purchased. Unrealized gains and losses related to these financial instruments, which are not customer owned positions, are reflected in earnings. Where available, we use prices from independent sources such as listed market prices, or broker or dealer price quotations. Fair values for certain derivative contracts are derived from pricing models that consider current market and contractual prices for the underlying financial instruments or commodities, as well as time value and yield curve or volatility factors underlying the positions. In some cases, even though the value of a security is derived from an independent market price or broker or dealer quote, certain assumptions may be required to determine the fair value. However, these assumptions may be incorrect and the actual value realized upon disposition could be different from the current carrying value. The value of foreign currencies, including foreign currencies sold, not yet purchased, are converted into its U.S. dollar equivalents at the foreign exchange rates in effect at the close of business at the end of the accounting period. For foreign currency transactions completed during each reporting period, the foreign exchange rate in effect at the time of the transaction is used.
50
The application of the valuation process for financial instruments and foreign currencies is critical because these items represent a significant portion of our total assets. Valuations for substantially all of the financial instruments held are available from independent publishers of market information. The valuation process may involve estimates and judgments in the case of certain financial instruments with limited liquidity and OTC derivatives. Given the wide availability of pricing information, the high degree of liquidity of the majority of our assets, and the relatively short periods for which they are typically held in inventory, there is insignificant sensitivity to changes in estimates and insignificant risk of changes in estimates having a material effect on our financial statements. The basis for estimating the valuation of any financial instruments has not undergone any change.
Revenue Recognition. A significant portion of our revenues are derived principally from realized and unrealized trading income in securities, derivative instruments, commodities and foreign currencies purchased or sold for our account. We record realized and unrealized trading income on a trade date basis. We state securities owned and securities sold, not yet purchased and foreign currencies sold, not yet purchased, at fair value with related changes in unrealized appreciation or depreciation reflected in ‘trading gains, net’ in the consolidated income statements. We record fee and interest income on the accrual basis and dividend income is recognized on the ex-dividend date.
Revenue on commodities that are purchased for physical delivery to customers and that are not readily convertible into cash is recognized at the point in time when the commodity has been shipped, title and risk of loss has been transferred to the customer, and the following conditions have been met: persuasive evidence of an arrangement exists, the price is fixed and determinable, and collectability of the resulting receivable is reasonably assured.
The critical aspect of revenue recognition is recording all known transactions as of the trade date of each transaction for the financial period. We have developed systems for each of our businesses to capture all known transactions. Recording all known transactions involves reviewing trades that occur after the financial period that relate to the financial period. The accuracy of capturing this information is dependent upon the completeness and accuracy of data capture of the operations systems and our clearing firms.
Income Taxes. We are subject to income taxes in the U.S. and numerous foreign jurisdictions. Significant judgment is required in determining the consolidated provision for income taxes and in evaluating tax positions, including evaluating uncertainties. As a result, the company recognizes tax liabilities based on estimates of whether additional taxes and interest will be due. These tax liabilities are recognized when despite our belief that our tax return positions are supportable, we believe that certain positions may not be fully sustained upon review by the relevant tax authorities.
Income taxes are accounted for under the asset and liability method. Deferred tax assets and liabilities are recognized for the estimated future tax consequences attributable to differences between the financial statement carrying amounts of existing assets and liabilities and their respective tax bases. Deferred tax assets and liabilities are measured using enacted tax rates in effect for the year in which those temporary differences are expected to be recovered or settled. The effect on deferred tax assets and liabilities of a change in tax rates is recognized in income in the period that includes the enactment date. Significant judgment is also required in determining any valuation allowance recorded against deferred tax assets. In assessing the need for a valuation allowance, management considers all available evidence for each jurisdiction including past operating results, estimates of future taxable income, and the feasibility of ongoing tax planning strategies. In the event that we change our determination as to the amount of deferred tax assets that can be realized, we will adjust our valuation allowance with a corresponding impact to income tax expense in the period in which such determination is made.
We believe that our accruals for tax liabilities are adequate for all open audit years based on our assessment of many factors including past experience and interpretations of tax law. This assessment relies on estimates and assumptions and may involve series of complex judgments about future events. To the extent that new information becomes available which causes us to change our judgment regarding the adequacy of existing tax liabilities, such changes to tax liabilities will impact income tax expense in the period in which such determination is made. The consolidated provision for income taxes will change period to period based on non-recurring events, such as the settlement of income tax audits and changes in tax law, as well as recurring factors including the geographic mix of income before taxes, state and local taxes, and the effects of various global income tax strategies.
Item 7A. Quantitative and Qualitative Disclosures about Market Risk
See also Note 4 to the Consolidated Financial Statements, ‘Financial Instruments with Off-Balance Sheet Risk and Concentrations of Credit Risk’.
Market Risk
We conduct our market-making and trading activities predominantly as a principal, which subjects our capital to significant risks. These risks include, but are not limited to, absolute and relative price movements, price volatility and changes in
51
liquidity, over which we have virtually no control. Our exposure to market risk varies in accordance with the volume of client-driven market-making transactions, the size of the proprietary positions and the volatility of the financial instruments traded.
We seek to mitigate exposure to market risk by utilizing a variety of qualitative and quantitative techniques:
• | Diversification of business activities and instruments; |
• | Limitations on positions; |
• | Allocation of capital and limits based on estimated weighted risks; and |
• | Daily monitoring of positions and mark-to-market profitability. |
We utilize derivative products in a trading capacity as a dealer to satisfy client needs and mitigate risk. We manage risks from both derivatives and non-derivative cash instruments on a consolidated basis. The risks of derivatives should not be viewed in isolation, but in aggregate with our other trading activities.
Management believes that the volatility of revenues is a key indicator of the effectiveness of its risk management techniques.
The graph below summarizes volatility of our daily revenue, determined on a marked-to-market basis, during the year ended September 30, 2015.
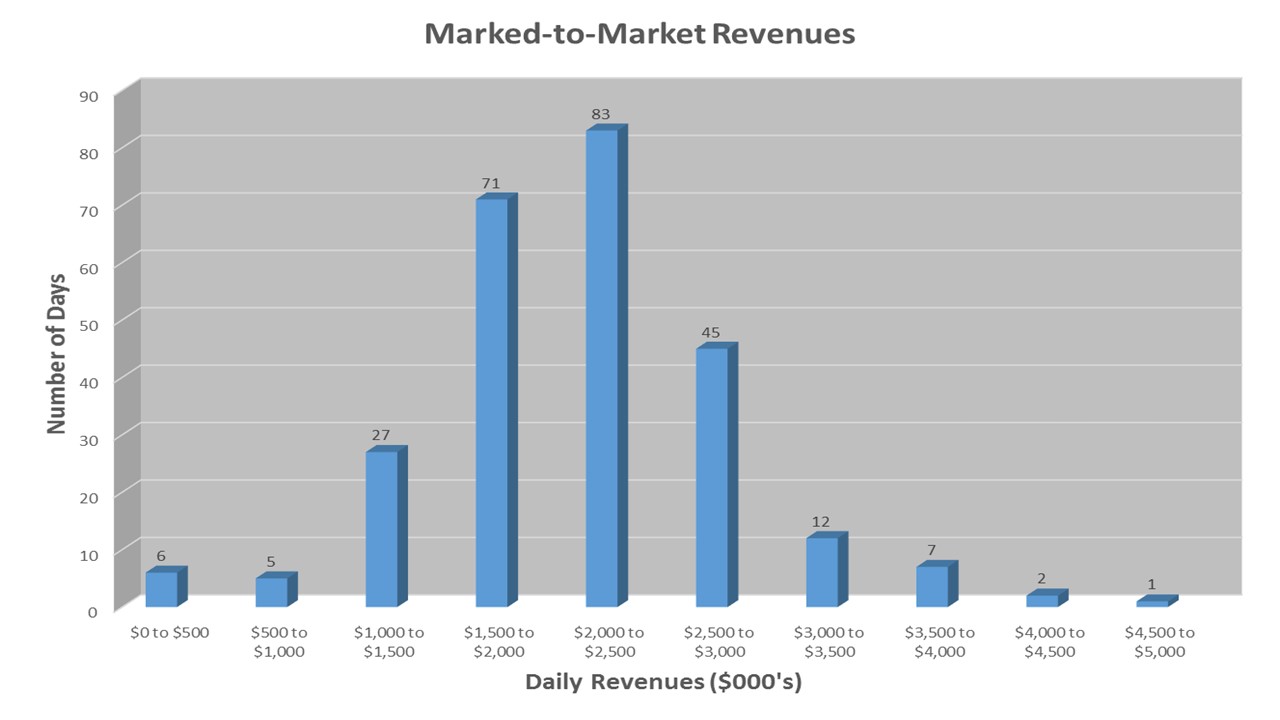
In our Securities market-making and trading activities, we maintain inventories of equity and debt securities. In our Physical Commodities segment, our positions include physical inventories, forwards, futures and options on futures. Our commodity trading activities are managed as one consolidated book for each commodity encompassing both cash positions and derivative instruments.We monitor the aggregate position for each commodity in equivalent physical ounces, metric tons, or other relevant unit.
Interest Rate Risk
In the ordinary course of our operations, we have interest rate risk from the possibility that changes in interest rates will affect the values of financial instruments and impact interest income earned. Following the acquisition of G.X. Clarke (see Note 18 to the Consolidated Financial Statements), the Company acquired a significant amount of trading assets and liabilities which are sensitive to changes in interest rates. G.X. Clarke’s trading activities consists primarily of securities trading in connection with U.S. Treasury obligations, U.S. government agency obligations, and agency mortgage-backed obligations. Derivative instruments, which consist of futures, mortgage-backed “to be announced” (TBA) securities and forward settling transactions, are used to manage risk exposures in the newly acquired subsidiary’s trading inventory. The Company enters into TBA securities transactions for the sole purpose of managing risk associated with the purchase of mortgage pass-through securities.
In addition, we generate interest income from the positive spread earned on customer deposits. We typically invest in U.S. Treasury bills, notes, and obligations issued by government sponsored entities, reverse repurchase agreements involving U.S. Treasury bills and government obligations or AA-rated money market funds. We have an investment policy which establishes
52
acceptable standards of credit quality and limits the amount of funds that can be invested within a particular fund and institution.
Since mid-2010, we have employed an interest rate management strategy, where we have used derivative financial instruments in the form of interest rate swaps to manage a portion of our aggregate interest rate position. Our objective is to invest the majority of customer segregated deposits in high quality, short-term investments and swap the resulting variable interest earnings into a medium-term interest stream when a sufficient interest rate spread exists between the two durations, by using a strip of interest rate swaps that mature every quarter, and enable us to achieve the two-year moving average of the two-year swap rate. These interest rate swaps are not designated for hedge accounting treatment, and changes in the fair values of these interest rate swaps, which are volatile and can fluctuate from period to period, are recorded in earnings on a quarterly basis.
During the prior year, we amended this interest management strategy, to include outright purchases of medium term U.S. Treasury notes. Under this amended program, on a quarterly basis, we evaluate our overall level of short term investable balances, net of our of variable rate debt, and either invest a portion of these investable balances in medium term U.S. Treasury notes or enter into interest rate swaps as described above, when a sufficient interest rate spread exists between short term and medium term rates exist. Under this strategy, excluding cash deposits and our investments in AA-rated money market funds, the weighted average time to maturity of our portfolio is not to exceed 24 months in duration. As part of this strategy we hold $680 million in par value of medium term U.S. Treasury notes and $375 million in interest rate swap derivative contracts, with the remainder being held in short term U.S. Treasury bills and AA-rated money market fund investments and the weighted average time to maturity of the portfolio, excluding cash deposits and our investments in AA-rated money market funds is 19 months.
We manage interest expense using a combination of variable and fixed rate debt as well as including the average outstanding borrowings in our calculations of the notional value of interest rate swaps to be entered into as part of our interest rate management strategy discussed above. Refer to Note 4 to the Consolidated Financial Statements for information on the interest rate swap transactions. The debt instruments are carried at their unpaid principal balance which approximates fair value. As of September 30, 2015, $38.0 million of our debt was variable-rate debt. We are subject to earnings and liquidity risks for changes in the interest rate on this debt. As of September 30, 2015, we had $49.1 million outstanding in fixed-rate long-term debt. There are no earnings or liquidity risks associated with our fixed-rate debt.
53
ITEM 8. Financial Statements and Supplementary Data
Report of Independent Registered Public Accounting Firm
The Board of Directors and Stockholders
INTL FCStone Inc.:
We have audited INTL FCStone Inc. and subsidiaries’ (the Company) internal control over financial reporting as of September 30, 2015, based on criteria established in Internal Control - Integrated Framework (2013) issued by the Committee of Sponsoring Organizations of the Treadway Commission. The Company’s management is responsible for maintaining effective internal control over financial reporting and for its assessment of the effectiveness of internal control over financial reporting, included in the accompanying Management’s Report on Internal Control over Financial Reporting appearing under Item 9A of the Company’s September 30, 2015 annual report on Form 10-K. Our responsibility is to express an opinion on the Company’s internal control over financial reporting based on our audit.
We conducted our audit in accordance with the standards of the Public Company Accounting Oversight Board (United States). Those standards require that we plan and perform the audit to obtain reasonable assurance about whether effective internal control over financial reporting was maintained in all material respects. Our audit included obtaining an understanding of internal control over financial reporting, assessing the risk that a material weakness exists, and testing and evaluating the design and operating effectiveness of internal control based on the assessed risk. Our audit also included performing such other procedures as we considered necessary in the circumstances. We believe that our audit provides a reasonable basis for our opinion.
A company’s internal control over financial reporting is a process designed to provide reasonable assurance regarding the reliability of financial reporting and the preparation of financial statements for external purposes in accordance with generally accepted accounting principles. A company’s internal control over financial reporting includes those policies and procedures that (1) pertain to the maintenance of records that, in reasonable detail, accurately and fairly reflect the transactions and dispositions of the assets of the company; (2) provide reasonable assurance that transactions are recorded as necessary to permit preparation of financial statements in accordance with generally accepted accounting principles, and that receipts and expenditures of the company are being made only in accordance with authorizations of management and directors of the company; and (3) provide reasonable assurance regarding prevention or timely detection of unauthorized acquisition, use, or disposition of the company’s assets that could have a material effect on the financial statements.
Because of its inherent limitations, internal control over financial reporting may not prevent or detect misstatements. Also, projections of any evaluation of effectiveness to future periods are subject to the risk that controls may become inadequate because of changes in conditions, or that the degree of compliance with the policies or procedures may deteriorate.
In our opinion, the Company maintained, in all material respects, effective internal control over financial reporting as of September 30, 2015, based on criteria established in Internal Control - Integrated Framework (2013) issued by the Committee of Sponsoring Organizations of the Treadway Commission.
Management’s assessment of the effectiveness of the Company’s internal control over financial reporting as of September 30, 2015 excluded G.X. Clarke & Co. (G.X. Clarke), acquired with effect from January 1, 2015. Our audit of internal control over financial reporting of the Company also excluded an evaluation of the internal control over financial reporting of G.X. Clarke.
We also have audited, in accordance with the standards of the Public Company Accounting Oversight Board (United States), the consolidated balance sheets of the Company as of September 30, 2015 and 2014, and the related consolidated statements of income, comprehensive income, cash flows, and stockholders’ equity for each of the years in the three-year period ended September 30, 2015, as well as the accompanying financial statement schedule. Our report dated December 9, 2015 expressed an unqualified opinion on those consolidated financial statements and the accompanying financial statement schedule.
/s/ KPMG LLP
Kansas City, Missouri
December 9, 2015
54
Report of Independent Registered Public Accounting Firm
The Board of Directors and Stockholders
INTL FCStone Inc.:
We have audited the accompanying consolidated balance sheets of INTL FCStone Inc. and subsidiaries (the Company) as of September 30, 2015 and 2014, and the related consolidated statements of income, comprehensive income, cash flows, and stockholders’ equity for each of the years in the three‑year period ended September 30, 2015. In connection with our audits of the consolidated financial statements, we also have audited the accompanying financial statement schedule. These consolidated financial statements and financial statement schedule are the responsibility of the Company’s management. Our responsibility is to express an opinion on these consolidated financial statements and financial statement schedule based on our audits.
We conducted our audits in accordance with the standards of the Public Company Accounting Oversight Board (United States). Those standards require that we plan and perform the audit to obtain reasonable assurance about whether the financial statements are free of material misstatement. An audit includes examining, on a test basis, evidence supporting the amounts and disclosures in the financial statements. An audit also includes assessing the accounting principles used and significant estimates made by management, as well as evaluating the overall financial statement presentation. We believe that our audits provide a reasonable basis for our opinion.
In our opinion, the consolidated financial statements referred to above present fairly, in all material respects, the financial position of the Company as of September 30, 2015 and 2014, and the results of its operations and its cash flows for each of the years in the three‑year period ended September 30, 2015, in conformity with U.S. generally accepted accounting principles. Also in our opinion, the related financial statement schedule, when considered in relation to the basic consolidated financial statements taken as a whole, presents fairly, in all material respects, the information set forth therein.
As discussed in Note 1 to the consolidated financial statements, subsequent to the transfer of the portion of precious metals business conducted through INTL Commodities Inc. to INTL FCStone Ltd., this portion of precious metals sales and cost of sales are presented on a net basis as a component of trading gains, net. Prior to the transfer, these precious metals sales and cost of sales were recorded on a gross basis.
We also have audited, in accordance with the standards of the Public Company Accounting Oversight Board (United States), the Company’s internal control over financial reporting as of September 30, 2015, based on criteria established in Internal Control - Integrated Framework (2013) issued by the Committee of Sponsoring Organizations of the Treadway Commission, and our report dated December 9, 2015 expressed an unqualified opinion on the effectiveness of the Company’s internal control over financial reporting.
/s/ KPMG LLP
Kansas City, Missouri
December 9, 2015
55
INTL FCStone Inc.
Consolidated Balance Sheets
(in millions, except par value and share amounts) | September 30, 2015 | September 30, 2014 | |||||
ASSETS | |||||||
Cash and cash equivalents | $ | 268.1 | $ | 231.3 | |||
Cash, securities and other assets segregated under federal and other regulations (including $515.5 and $15.3 at fair value at September 30, 2015 and September 30, 2014 respectively) | 756.9 | 448.0 | |||||
Securities purchased under agreements to resell | 325.3 | — | |||||
Deposits with and receivables from: | |||||||
Exchange-clearing organizations (including $1,009.4 and $1,255.4 at fair value at September 30, 2015 and September 30, 2014, respectively) | 1,533.5 | 1,731.4 | |||||
Broker-dealers, clearing organizations and counterparties (including $(52.9) and $(1.1) at fair value at September 30, 2015 and September 30, 2014, respectively) | 277.6 | 123.0 | |||||
Receivable from customers, net | 217.3 | 55.6 | |||||
Notes receivable, net | 78.4 | 65.2 | |||||
Income taxes receivable | 10.6 | 10.8 | |||||
Financial instruments owned, at fair value (includes securities pledged as collateral that can be sold or repledged of $170.7) | 1,421.9 | 197.9 | |||||
Physical commodities inventory (including precious metals of $15.2 at fair value at September 30, 2015) | 32.8 | 40.0 | |||||
Deferred income taxes, net | 28.2 | 32.0 | |||||
Property and equipment, net | 19.7 | 15.9 | |||||
Goodwill and intangible assets, net | 58.1 | 58.0 | |||||
Other assets | 41.6 | 30.6 | |||||
Total assets | $ | 5,070.0 | $ | 3,039.7 | |||
LIABILITIES AND EQUITY | |||||||
Liabilities: | |||||||
Accounts payable and other accrued liabilities (including $3.3 and $5.5 at fair value at September 30, 2015 and September 30, 2014) | $ | 144.8 | $ | 114.1 | |||
Payable to: | |||||||
Customers | 2,593.5 | 2,228.7 | |||||
Broker-dealers, clearing organizations and counterparties (including $1.6 at fair value at September 30, 2015) | 262.9 | 11.9 | |||||
Lenders under loans | 41.6 | 22.5 | |||||
Senior unsecured notes | 45.5 | 45.5 | |||||
Income taxes payable | 9.0 | 7.6 | |||||
Securities sold under agreements to repurchase | 1,007.3 | — | |||||
Financial instruments sold, not yet purchased, at fair value | 568.3 | 264.0 | |||||
Total liabilities | 4,672.9 | 2,694.3 | |||||
Commitments and contingencies (Note 11) | |||||||
Stockholders’ equity: | |||||||
Preferred stock, $0.01 par value. Authorized 1,000,000 shares; no shares issued or outstanding | — | — | |||||
Common stock, $0.01 par value. Authorized 30,000,000 shares; 20,184,556 issued and 18,812,803 outstanding at September 30, 2015 and 19,826,635 issued and 18,883,662 outstanding at September 30, 2014 | 0.2 | 0.2 | |||||
Common stock in treasury, at cost - 1,371,753 shares at September 30, 2015 and 942,973 shares at September 30, 2014 | (26.8 | ) | (17.5 | ) | |||
Additional paid-in capital | 240.8 | 229.6 | |||||
Retained earnings | 200.4 | 144.7 | |||||
Accumulated other comprehensive loss, net | (17.5 | ) | (11.6 | ) | |||
Total stockholders’ equity | 397.1 | 345.4 | |||||
Total liabilities and stockholders’ equity | $ | 5,070.0 | $ | 3,039.7 | |||
See accompanying notes to consolidated financial statements.
56
INTL FCStone Inc.
Consolidated Income Statements
Year Ended September 30, | |||||||||||
(in millions, except share and per share amounts) | 2015 | 2014 | 2013 | ||||||||
Revenues: | |||||||||||
Sales of physical commodities | $ | 34,089.9 | $ | 33,546.4 | $ | 42,031.2 | |||||
Trading gains, net | 328.6 | 244.5 | 244.0 | ||||||||
Commission and clearing fees | 192.5 | 180.7 | 173.3 | ||||||||
Consulting and management fees | 42.5 | 42.1 | 35.1 | ||||||||
Interest income | 39.4 | 8.0 | 8.9 | ||||||||
Other income | 0.3 | 0.7 | 0.9 | ||||||||
Total revenues | 34,693.2 | 34,022.4 | 42,493.4 | ||||||||
Cost of sales of physical commodities | 34,068.9 | 33,531.5 | 42,025.2 | ||||||||
Operating revenues | 624.3 | 490.9 | 468.2 | ||||||||
Transaction-based clearing expenses | 122.7 | 108.5 | 110.1 | ||||||||
Introducing broker commissions | 52.7 | 49.9 | 40.5 | ||||||||
Interest expense | 17.1 | 10.5 | 7.9 | ||||||||
Net operating revenues | 431.8 | 322.0 | 309.7 | ||||||||
Compensation and other expenses: | |||||||||||
Compensation and benefits | 251.1 | 201.9 | 198.7 | ||||||||
Communication and data services | 28.1 | 25.8 | 23.1 | ||||||||
Occupancy and equipment rental | 13.5 | 12.3 | 12.0 | ||||||||
Professional fees | 12.5 | 14.9 | 12.4 | ||||||||
Travel and business development | 10.5 | 9.9 | 10.4 | ||||||||
Depreciation and amortization | 7.2 | 7.3 | 8.0 | ||||||||
Bad debts and impairments | 7.3 | 5.5 | 0.8 | ||||||||
Other | 23.5 | 18.4 | 23.1 | ||||||||
Total compensation and other expenses | 353.7 | 296.0 | 288.5 | ||||||||
Income from continuing operations, before tax | 78.1 | 26.0 | 21.2 | ||||||||
Income tax expense | 22.4 | 6.4 | 2.6 | ||||||||
Net income from continuing operations | 55.7 | 19.6 | 18.6 | ||||||||
(Loss) income from discontinued operations, net of tax | — | (0.3 | ) | 0.7 | |||||||
Net income | $ | 55.7 | $ | 19.3 | $ | 19.3 | |||||
Basic earnings per share: | |||||||||||
Income from continuing operations | $ | 2.94 | $ | 1.03 | $ | 0.97 | |||||
(Loss) income from discontinued operations | — | (0.02 | ) | 0.04 | |||||||
Net income per common share | $ | 2.94 | $ | 1.01 | $ | 1.01 | |||||
Diluted earnings per share: | |||||||||||
Income from continuing operations | $ | 2.87 | $ | 1.00 | $ | 0.93 | |||||
(Loss) income from discontinued operations | — | (0.02 | ) | 0.04 | |||||||
Net income per common share | $ | 2.87 | $ | 0.98 | $ | 0.97 | |||||
Weighted-average number of common shares outstanding: | |||||||||||
Basic | 18,525,374 | 18,528,302 | 18,443,233 | ||||||||
Diluted | 18,932,235 | 19,132,302 | 19,068,497 | ||||||||
See accompanying notes to consolidated financial statements.
57
INTL FCStone Inc.
Consolidated Statements of Comprehensive Income
Year Ended September 30, | |||||||||||
(in millions) | 2015 | 2014 | 2013 | ||||||||
Net income | $ | 55.7 | $ | 19.3 | $ | 19.3 | |||||
Other comprehensive income (loss), net of tax: | |||||||||||
Foreign currency translation adjustment | (4.0 | ) | (4.6 | ) | (1.8 | ) | |||||
Pension liabilities adjustment | (1.5 | ) | (0.8 | ) | 2.9 | ||||||
Net unrealized gain on available-for-sale securities | 2.7 | 0.2 | 0.6 | ||||||||
Reclassification of adjustment for gains included in net income: | |||||||||||
Foreign currency translation adjustment (included in other income) | — | — | (0.1 | ) | |||||||
Periodic pension costs (included in compensation and benefits) | 0.3 | 0.2 | 0.8 | ||||||||
Realized gain on available-for-sale securities (included in trading gains, net and interest income) | (5.4 | ) | (0.1 | ) | (8.3 | ) | |||||
Income tax expense from reclassification adjustments (included in income tax expense) | 2.0 | (0.1 | ) | 1.7 | |||||||
Reclassification adjustment for gains included in net income | (3.1 | ) | — | (5.9 | ) | ||||||
Other comprehensive loss | (5.9 | ) | (5.2 | ) | (4.2 | ) | |||||
Comprehensive income | $ | 49.8 | $ | 14.1 | $ | 15.1 | |||||
See accompanying notes to consolidated financial statements.
58
INTL FCStone Inc.
Consolidated Cash Flows Statements
Year Ended September 30, | |||||||||||
(in millions) | 2015 | 2014 | 2013 | ||||||||
Cash flows from operating activities: | |||||||||||
Net income | $ | 55.7 | $ | 19.3 | $ | 19.3 | |||||
Adjustments to reconcile net income to net cash provided by operating activities: | |||||||||||
Depreciation and amortization | 7.2 | 7.3 | 8.0 | ||||||||
Provision for bad debts and impairments | 7.3 | 5.5 | 0.8 | ||||||||
Deferred income taxes | 4.8 | (6.8 | ) | (7.8 | ) | ||||||
Amortization of debt issuance costs and debt discount | 0.9 | 1.0 | 1.2 | ||||||||
Amortization of share-based compensation expense | 3.6 | 4.3 | 9.3 | ||||||||
Loss on sale of property and equipment | 0.5 | 0.3 | 0.4 | ||||||||
Gain on disposal of affiliate | — | — | (0.4 | ) | |||||||
Gain on sale of exchange memberships and common stock | (1.2 | ) | — | (9.1 | ) | ||||||
Changes in operating assets and liabilities, net: | |||||||||||
Cash, securities and other assets segregated under federal and other regulations | (315.0 | ) | (1.3 | ) | (95.1 | ) | |||||
Change in securities purchased under agreements to resell | 15.2 | — | — | ||||||||
Deposits and receivables from exchange-clearing organizations | 195.1 | (159.2 | ) | 42.3 | |||||||
Deposits and receivables from broker-dealers, clearing organizations, and counterparties | (150.2 | ) | 1.1 | (53.4 | ) | ||||||
Receivable from customers, net | (169.0 | ) | 32.0 | (23.7 | ) | ||||||
Notes receivable, net | (14.5 | ) | (27.9 | ) | 66.6 | ||||||
Income taxes receivable | — | 4.2 | (0.2 | ) | |||||||
Financial instruments owned, at fair value | (565.0 | ) | (42.6 | ) | 3.1 | ||||||
Physical commodities inventory | 7.1 | 17.8 | 72.7 | ||||||||
Other assets | (16.2 | ) | 0.1 | 4.3 | |||||||
Accounts payable and other accrued liabilities | 23.2 | 1.9 | (0.2 | ) | |||||||
Payable to customers | 332.1 | 191.5 | 24.0 | ||||||||
Payable to broker-dealers, clearing organizations and counterparties | 251.1 | (5.2 | ) | (22.3 | ) | ||||||
Income taxes payable | 1.7 | 5.2 | 0.5 | ||||||||
Change in securities sold under agreements to repurchase | 186.0 | — | — | ||||||||
Financial instruments sold, not yet purchased, at fair value | 177.5 | 84.1 | 4.6 | ||||||||
Net cash provided by operating activities | 37.9 | 132.6 | 44.9 | ||||||||
Cash flows from investing activities: | |||||||||||
Disposal and deconsolidation of affiliates | — | — | 0.2 | ||||||||
Cash paid for acquisitions, net | (7.8 | ) | — | — | |||||||
Purchase of exchange memberships and common stock | (0.7 | ) | — | (0.3 | ) | ||||||
Sale of exchange memberships and common stock | 2.1 | — | 10.1 | ||||||||
Purchase of property and equipment | (9.1 | ) | (4.3 | ) | (4.9 | ) | |||||
Net cash (used in) provided by investing activities | (15.5 | ) | (4.3 | ) | 5.1 | ||||||
Cash flows from financing activities: | |||||||||||
Net change in payable to lenders under loans | 15.5 | (38.5 | ) | (157.2 | ) | ||||||
Payments related to earn-outs on acquisitions | (2.2 | ) | (1.6 | ) | (12.0 | ) | |||||
Proceeds from issuance of senior unsecured notes | — | — | 45.5 | ||||||||
Proceeds from note payable | 4.0 | — | — | ||||||||
Repayment of note payable | (0.4 | ) | — | — | |||||||
Share repurchase | (4.7 | ) | (9.7 | ) | (3.9 | ) | |||||
Debt issuance costs | (0.2 | ) | (0.3 | ) | (3.7 | ) | |||||
Exercise of stock options | 2.5 | 1.4 | 1.5 | ||||||||
Income tax benefit on stock options and awards | 0.5 | (0.1 | ) | 0.1 | |||||||
Net cash provided by (used in) financing activities | 15.0 | (48.8 | ) | (129.7 | ) | ||||||
Effect of exchange rates on cash and cash equivalents | (0.6 | ) | (4.3 | ) | (0.5 | ) | |||||
Net increase (decrease) in cash and cash equivalents | 36.8 | 75.2 | (80.2 | ) | |||||||
Cash and cash equivalents at beginning of period | 231.3 | 156.1 | 236.3 | ||||||||
Cash and cash equivalents at end of period | $ | 268.1 | $ | 231.3 | $ | 156.1 | |||||
59
(continued) | |||||||||||
Year Ended September 30, | |||||||||||
(in millions) | 2015 | 2014 | 2013 | ||||||||
Supplemental disclosure of cash flow information: | |||||||||||
Cash paid for interest | $ | 15.8 | $ | 9.6 | $ | 8.9 | |||||
Income taxes paid, net of cash refunds | $ | 15.3 | $ | 3.0 | $ | 10.2 | |||||
Supplemental disclosure of non-cash investing and financing activities: | |||||||||||
Identified intangible assets and goodwill on acquisitions | $ | 1.6 | $ | 0.5 | $ | 5.6 | |||||
Additional consideration payable related to acquisitions | $ | 1.9 | $ | (1.8 | ) | $ | 8.2 | ||||
Acquisition of business: | |||||||||||
Assets acquired | $ | 1,011.4 | $ | — | $ | — | |||||
Liabilities acquired | (995.1 | ) | — | — | |||||||
Total net assets acquired | $ | 16.3 | $ | — | $ | — | |||||
Deferred consideration payable related to acquisitions | $ | 5.0 | $ | — | $ | — | |||||
Escrow deposits related to acquisitions | $ | 5.0 | $ | — | $ | — | |||||
See accompanying notes to consolidated financial statements.
60
INTL FCStone Inc.
Consolidated Statements of Stockholders’ Equity
(in millions) | Common Stock | Treasury Stock | Additional Paid-in Capital | Retained Earnings | Accumulated Other Comprehensive Loss | Total | |||||||||||||||||
Balances as of September 30, 2012 | $ | 0.2 | $ | (4.1 | ) | $ | 213.2 | $ | 106.1 | $ | (2.2 | ) | $ | 313.2 | |||||||||
Net income | 19.3 | 19.3 | |||||||||||||||||||||
Other comprehensive loss | (4.2 | ) | (4.2 | ) | |||||||||||||||||||
Exercise of stock options | 1.5 | 1.5 | |||||||||||||||||||||
Share-based compensation | 9.3 | 9.3 | |||||||||||||||||||||
Repurchase of stock | (3.7 | ) | (0.2 | ) | (3.9 | ) | |||||||||||||||||
Stock held in escrow for business combination | 0.2 | 0.2 | |||||||||||||||||||||
Balances as of September 30, 2013 | 0.2 | (7.8 | ) | 224.0 | 125.4 | (6.4 | ) | 335.4 | |||||||||||||||
Net income | 19.3 | 19.3 | |||||||||||||||||||||
Other comprehensive loss | (5.2 | ) | (5.2 | ) | |||||||||||||||||||
Exercise of stock options | 1.3 | 1.3 | |||||||||||||||||||||
Share-based compensation | 4.3 | 4.3 | |||||||||||||||||||||
Repurchase of stock | (9.7 | ) | — | (9.7 | ) | ||||||||||||||||||
Balances as of September 30, 2014 | 0.2 | (17.5 | ) | 229.6 | 144.7 | (11.6 | ) | 345.4 | |||||||||||||||
Net income | 55.7 | 55.7 | |||||||||||||||||||||
Other comprehensive loss | (5.9 | ) | (5.9 | ) | |||||||||||||||||||
Exercise of stock options | 3.0 | 3.0 | |||||||||||||||||||||
Share-based compensation | 3.6 | 3.6 | |||||||||||||||||||||
Repurchase of stock | (4.5 | ) | (0.2 | ) | (4.7 | ) | |||||||||||||||||
Stock held in escrow for business combination | (4.8 | ) | 4.8 | — | |||||||||||||||||||
Balances as of September 30, 2015 | $ | 0.2 | $ | (26.8 | ) | $ | 240.8 | $ | 200.4 | $ | (17.5 | ) | $ | 397.1 | |||||||||
See accompanying notes to consolidated financial statements.
61
INTL FCStone Inc.
Notes to Consolidated Financial Statements
Note 1 – Description of Business and Significant Accounting Policies
INTL FCStone Inc., a Delaware corporation, and its consolidated subsidiaries (collectively “INTL” or “the Company”), form a financial services group focused on domestic and select international markets. The Company’s services include comprehensive risk management advisory services for commercial customers; execution of listed futures and options on futures contracts on all major commodity exchanges; structured over-the-counter (“OTC”) products in a wide range of commodities; physical trading and hedging of precious and base metals and select other commodities; trading of more than 150 foreign currencies; market-making in international equities; fixed income; debt origination and asset management.
The Company provides these services to a diverse group of more than 20,000 accounts, representing approximately 11,000 consolidated customers located throughout the world, including producers, processors and end-users of nearly all widely-traded physical commodities to manage their risks and enhance margins; to commercial counterparties who are end-users of the firm’s products and services; to governmental and non-governmental organizations; and to commercial banks, brokers, institutional investors and major investment banks.
Basis of Presentation
The accompanying consolidated financial statements include the accounts of INTL FCStone Inc. and all other entities in which the Company has a controlling financial interest. All material intercompany transactions and balances have been eliminated in consolidation.
Unless otherwise stated herein, all references to fiscal 2015, fiscal 2014, and fiscal 2013 refer to the Company’s fiscal years ended September 30.
Use of Estimates
The preparation of consolidated financial statements in conformity with accounting principles generally accepted in the United States of America (“U.S. GAAP”) requires management to make estimates and assumptions that affect the reported amounts of assets and liabilities, disclosure of contingent liabilities as of the date of the financial statements and the reported amounts of revenue and expenses during the reporting period. The most significant of these estimates and assumptions relate to fair value measurements for financial instruments and investments, revenue recognition, the provision for potential losses from bad debts, valuation of inventories, valuation of goodwill and intangible assets, self-insurance liabilities, incomes taxes and contingencies. These estimates are based on management’s best knowledge of current events and actions the Company may undertake in the future. The Company reviews all significant estimates affecting the financial statements on a recurring basis and records the effect of any necessary adjustments prior to their issuance. Although these and other estimates and assumptions are based on the best available information, actual results could be materially different from these estimates.
Internal Subsidiary Consolidation
Effective July 1, 2015, the Company merged three of its wholly-owned regulated U.S. subsidiaries into its wholly owned regulated U.S. subsidiary, INTL FCStone Securities Inc., and the surviving entity was renamed INTL FCStone Financial Inc. and is registered as both a broker-dealer and a FCM. As such, the assets, liabilities and equity of FCStone, LLC, INTL FCStone Partners L.P., and FCC Investments, Inc. were transferred into INTL FCStone Financial.
Foreign Currency Translation
Assets and liabilities recorded in foreign currencies are translated at the exchange rates prevailing on the balance sheet date. Revenue and expenses are translated at average rates of exchange prevailing during the period. Gains or losses on translation of the financial statements of a non-United States (“U.S.”) operation, when the functional currency is other than the U.S. dollar, are recorded in other comprehensive income (“OCI”), net of tax, a component of stockholders’ equity. Foreign currency remeasurement gains or losses on transactions in nonfunctional currencies are included in ‘trading gains, net’ in the consolidated income statements.
62
Cash and Cash Equivalents
The Company considers cash held at banks and all highly liquid investments, including certificates of deposit, which may be withdrawn at any time at the discretion of the Company without penalty, to be cash and cash equivalents. Cash and cash equivalents consist of cash, foreign currency, money market funds and certificates of deposit not deposited with or pledged to exchange-clearing organizations, broker-dealers, clearing organizations or counterparties. The money market funds are valued at period-end at the net asset value provided by the fund’s administrator, which approximates fair value. Certificates of deposit are stated at cost plus accrued interest, which approximates fair value. The Company has an investment policy, which limits the maximum amount placed in any one fund and with any one institution in order to reduce credit risk. The Company does not believe that it is exposed to significant risk on cash and cash equivalents.
Cash, Securities and Other Assets Segregated under Federal and other Regulations
Pursuant to requirements of the Commodity Exchange Act in the U.S. and similarly in the United Kingdom (“UK”), pursuant to the Markets in Financial Instruments Implementing Directive 2006/73/EC underpinning the Client Asset or ‘CASS’ rules in the Financial Services Authority (“FSA”) handbook, funds deposited by customers relating to futures and options on futures contracts in regulated commodities must be carried in separate accounts which are designated as segregated customer accounts. The deposits in segregated customer accounts are not commingled with the funds of the Company. Under the FSA’s rules, certain categories of clients may choose to opt-out of segregation. As of September 30, 2015 and 2014, cash, securities and other assets segregated under federal and other regulations consisted of cash held at banks and money market funds of approximately $240.0 million and $432.1 million, respectively, U.S. government securities and U.S. government agency obligations of approximately $493.4 million and $0.5 million, respectively, and commodities warehouse receipts of approximately $22.1 million and $14.8 million, respectively (see fair value measurements discussion in Note 3).
Deposits and Receivables from Exchange-Clearing Organizations, Broker-dealers, Clearing Organizations and Counterparties, and Payables to Broker-dealers, Clearing Organizations and Counterparties
As required by the regulations of the U.S. Commodity Futures Trading Commission (“CFTC”) and the aforementioned FSA handbook, customer funds received to margin, guarantee, and/or secure commodity futures transactions are segregated and accounted for separately from the general assets of the Company. Deposits with exchange-clearing organizations, broker-dealers and counterparties pertain primarily to deposits made to satisfy margin requirements on customer and proprietary open futures and options on futures positions and to satisfy the requirements set by clearing exchanges for clearing membership. The Company also pledges margin deposit with various counterparties for OTC derivative contracts, and these deposits are also included in deposits and receivables from broker-dealers and counterparties. Deposits with and receivables from exchange-clearing organizations and broker-dealers and counterparties are reported gross, except where a right of offset exists. As of September 30, 2015 and 2014, the Company had cash and cash equivalents on deposit with or pledged to exchange-clearing organizations, broker-dealers and counterparties of $0.9 billion and $1.3 billion, respectively.
These balances also include securities pledged by the Company on behalf of customers and customer-owned securities that are pledged. It is the Company’s practice to include customer owned securities on its consolidated balance sheets, as the rights to those securities have been transferred to the Company under the terms of the futures trading agreement. Securities pledged include U.S. Treasury bills and instruments backed by U.S. government sponsored entities and government-sponsored enterprise backed mortgage-backed securities (“mortgage-backed securities”). Securities that are not customer-owned are adjusted to fair value with associated changes in unrealized gains or losses recorded through current period earnings. For customer owned securities, the change in fair value is offset against the payable to customers with no impact recognized on the consolidated income statements.
The securities, primarily U.S. government obligations and mortgage-backed securities, held by INTL FCStone Financial Inc. (“INTL FCStone Financial”), a subsidiary of the Company, as collateral or as margin have been deposited with exchange-clearing organizations, broker-dealers or other counterparties. The fair value of these securities was approximately $0.5 billion and $0.7 billion as of September 30, 2015 and 2014, respectively.
Management has considered guidance required by the Transfers and Servicing Topic of the ASC as it relates to securities pledged by customers to margin their accounts. Based on a review of the agreements with the customer, management believes the transferor surrenders control over those assets because: (a) the transferred assets have been isolated from the transferor—put presumptively beyond the reach of the transferor and its creditors, even in bankruptcy or other receivership, (b) each transferee has the right to pledge or exchange the assets (or beneficial interests) it received, and no condition both constrains the transferee (or holder) from taking advantage of its right to pledge or exchange and provides more than a trivial benefit to the transferor and (c) the transferor does not maintain effective control over the transferred assets through either (1) an agreement that both entitles and obligates the transferor to repurchase or redeem them before their maturity or (2) the ability to unilaterally cause the holder to return specific assets, other than through a cleanup call. Under this guidance, the Company reflects the customer collateral assets and corresponding liabilities in the Company’s consolidated balance sheets as of September 30, 2015 and 2014.
63
In addition to margin, deposits with exchange-clearing organizations include guaranty deposits. The guaranty deposits are held by the clearing organization for use in potential default situations by one or more members of the clearing organization. The guaranty deposits may be applied to the Company’s obligations to the clearing organization, or to the clearing organization’s obligations to other clearing members or third parties.
The Company maintains customer omnibus and proprietary accounts with other counterparties, and the equity balances in those accounts along with any margin cash or securities deposited with the carrying broker are included in deposits and receivables from broker-dealers and counterparties.
Receivables from and payables to exchange-clearing organizations are also comprised of amounts due from or due to exchange-clearing organizations for daily variation settlements on open futures and options on futures positions. The variation settlements due from or due to exchange-clearing organizations are paid in cash on the following business day.
Deposits and receivables from broker-dealers, clearing organizations and counterparties, and payables to broker-dealers, clearing organizations and counterparties also include amounts related to the value of customers cross-currency payment transactions related to the Global Payments segment. These amounts arise due to a clearing period before the funds are received and payments are made, which usually is one to two business days.
Deposits and receivables with exchange-clearing organizations also includes the unrealized gains and losses associated with the customers’ options on futures contracts. See discussion in the Financial Instruments and Derivatives section below for additional information on the treatment of derivative contracts. For customer owned derivative contracts, the fair value is offset against the payable to customers with no impact recognized on the consolidated income statements.
Receivable from and Payable to Customers
Receivable from customers, net of the allowance for doubtful accounts, include the total of net deficits in individual exchange-traded and OTC trading accounts carried by the Company. Customer deficits arise from realized and unrealized trading losses on futures, options on futures, swaps and forwards and amounts due on cash and margin transactions. Customer deficit accounts are reported gross of customer accounts that contain net credit or positive balances, except where a right of offset exists. Net deficits in individual exchange-traded and OTC trading accounts include both secured and unsecured deficit balances due from customers as of the balance sheet date. Secured deficit amounts are backed by U.S. Treasury bills and notes and commodity warehouse receipts. These U.S Treasury bills and notes and commodity warehouse receipts are not netted against the secured deficit amounts, as the conditions for right of setoff have not been met.
Payable to customers represent the total of customer accounts with credit or positive balances. Customer accounts are used primarily in connection with commodity transactions and include gains and losses on open commodity trades as well as securities and other deposits made as required by the Company, the exchange-clearing organizations or other clearing organizations. Customer accounts with credit or positive balances are reported gross of customer deficit accounts, except where a right of offset exists.
Receivables from and payables to customers also include amounts related to the value of customers cross-currency payment transactions related to the Global Payments segment. These amounts arise due to a clearing period before the funds are received and payments are made, which usually is one to two business days.
The future collectability of the receivable from customers can be impacted by the Company’s collection efforts, the financial stability of its customers, and the general economic climate in which it operates. The Company evaluates accounts that it believes may become uncollectible on a specific identification basis, through reviewing daily margin deficit reports, the historical daily aging of the receivables, and by monitoring the financial strength of its customers. The Company may unilaterally close customer trading positions in certain circumstances. In addition, to evaluate customer margining and collateral requirements, customer positions are stress tested regularly and monitored for excessive concentration levels relative to the overall market size.
The Company generally charges off an outstanding receivable balance when all economically sensible means of recovery have been exhausted. That determination considers information such as the occurrence of significant changes in the customer’s financial position such that the customer can no longer pay the obligation, or that the proceeds from collateral will not be sufficient to pay the balance.
Notes Receivable
The Company originates short-term notes receivable from customers with the outstanding balances typically being insured 90% to 98% by a third party, including accrued interest, subject to applicable deductible amounts. The Company may sell the insured portion of the notes through non-recourse participation agreements with other third parties. See discussion of notes receivable related to commodity repurchase agreements below.
64
Accrual of commodity financing income on any note is discontinued when, in the opinion of management, there is reasonable doubt as to the timely collectability of interest or principal. Nonaccrual notes are returned to an accrual status when, in the opinion of management, the financial position of the borrower indicates there is no longer any reasonable doubt as to the timely payment of principal and interest. The Company records a charge against earnings for notes receivable losses when management believes that collectability of the principal is unlikely.
Physical Commodities Inventory
Physical commodities inventories, except as described below, are stated at the lower of cost or market (“LCM”), using the weighted-average price and first-in first-out costing method. Cost includes finished commodity or raw material and processing costs related to the purchase and processing of inventories.
Prior to the transfer of the Company’s precious metals business (see following discussion), precious metals inventory held by INTL Commodities Inc. was valued at LCM under the provisions of the Inventory Topic of the Accounting Standards Codification (“ASC”), using the weighted-average price and first-in first-out costing method. Subsequent to the transfer, precious metals inventory held by INTL FCStone Ltd. is measured at fair value, with changes in fair value included as a component of ‘trading gains, net’ on the consolidated income statements.
Change in Precious Metals Accounting
The Company engages in trading activities in a variety of physical commodities, including actively trading precious metals whereby the Company provides a full range of trading and hedging capabilities, including OTC products, to select producers, consumers, and investors. In the Company’s precious metals trading activities, it acts as a principal, committing its own capital to buy and sell precious metals on a spot and forward basis.
On April 10, 2015 (the “transfer date”), the Company transitioned the portion of its precious metals business conducted through its unregulated domestic subsidiary, INTL Commodities Inc., to its United Kingdom based broker-dealer subsidiary, INTL FCStone Ltd. INTL FCStone Ltd. is regulated by the Financial Conduct Authority (“FCA”), the regulator of the financial services industry in the United Kingdom.
In anticipation of the transfer of the precious metals business, INTL Commodities Inc. liquidated all of its precious metals inventory as of the transfer date. Subsequent to the transfer, precious metals inventory held by INTL FCStone Ltd. is measured at fair value, with changes in fair value included as a component of ‘trading gains, net’ on the consolidated income statement, in accordance with U.S. GAAP accounting requirements for broker-dealers. Precious metals inventory held by subsidiaries that are not broker-dealers continues to be valued at the lower of cost or market value.
Property and Equipment
Property and equipment is stated at cost, net of accumulated depreciation and amortization and depreciated using the straight-line method over the estimated useful lives of the assets. Leasehold improvements are amortized on a straight-line basis over the estimated useful life of the improvement or the term of the lease, whichever is shorter. Certain costs of software developed or obtained for internal use are capitalized and amortized over the estimated useful life of the software. Expenditures for maintenance, repairs, and minor replacements are charged against earnings, as incurred. Expenditures that increase the value or productive capacity of assets are capitalized. When property and equipment are retired, sold, or otherwise disposed of, the asset’s carrying amount and related accumulated depreciation are removed from the accounts and any gain or loss is included in earnings.
Goodwill and Identifiable Intangible Assets
Goodwill is the cost of acquired companies in excess of the fair value of identifiable net assets at acquisition date. In accordance with the Intangibles – Goodwill and Other Topic of the ASC, goodwill is tested for impairment on an annual basis at the fiscal year-end, and between annual tests if indicators of potential impairment exist, using a fair-value-based approach. No impairment of goodwill has been identified during any of the periods presented.
Identifiable intangible assets subject to amortization are amortized using the straight-line method over their estimated period of benefit, ranging from two to twenty years. Identifiable intangible assets are tested for impairment whenever events or changes in circumstances suggest that an asset’s or asset group’s carrying value may not be fully recoverable in accordance with the Intangibles – Goodwill and Other Topic of the ASC. Residual value is presumed to be zero. Identifiable intangible assets not subject to amortization are reviewed at each reporting period to re-evaluate if the intangible asset’s useful life remains indefinite. Additionally, intangible assets not subject to amortization are tested annually for impairment at the fiscal year-end, and between annual tests if indicators of potential impairment exist, using a fair-value-based approach.
65
Financial Instruments and Derivatives
Financial instruments owned and sold, not yet purchased, at fair value consist of financial instruments carried at fair value or amounts that approximate fair value, with related unrealized changes in gains or losses recognized in earnings, except for securities classified as available-for-sale. The fair value of a financial instrument is the amount at which the instrument could be exchanged in a current transaction between willing parties, other than in a forced or liquidation sale.
The Company accounts for its securities pledged on behalf of customers and proprietary securities as trading securities in accordance with U.S. GAAP accounting requirements for broker-dealers.
Investment in managed funds, at fair value represents investments in funds managed by the Company’s fund managers. The investments are valued at period-end at the net asset value provided by the fund’s administrator.
Commodities warehouse receipts are valued at the cash price, or the nearby futures prices in the absence of a cash price, for the commodity based on published market quotes. For commodities warehouse receipts, the change in fair value is offset against the payable to customers with no impact on the consolidated income statements.
The Company utilizes derivative instruments to manage exposures to foreign currency, commodity price and interest rate risks for the Company and its customers. The Company’s objectives for holding derivatives include reducing, eliminating, and efficiently managing the economic impact of these exposures as effectively as possible. Derivative instruments are recognized as either assets or liabilities and are measured at fair value. The accounting for changes in the fair value of a derivative depends on the intended use of the derivative and the resulting designation. For a derivative instrument designated as a cash flow hedge, the effective portion of the derivative’s gain or loss is initially recorded in OCI, net of tax, and is subsequently recognized in earnings when the hedged exposure affects earnings. The ineffective portion of the gain or loss is recognized in earnings. Gains and losses from changes in fair values of derivatives that are not designated as cash flow hedges for accounting purposes are recognized in earnings.
The Company’s derivative contracts consist of exchange-traded and OTC derivatives. Fair values of exchange-traded derivatives are generally determined from quoted market prices. OTC derivatives are valued using valuation models. The valuation models used to derive the fair values of OTC derivatives require inputs including contractual terms, market prices, yield curves and measurements of volatility. The Company uses similar models to value similar instruments. Where possible, the Company verifies the values produced by pricing models by comparing them to market transactions. Inputs may involve judgment where market prices are not readily available. The Company does not elect hedge accounting under the Derivatives and Hedging Topic of the ASC in accounting for derivatives used as economic hedges on its commodities.
The Company provides clearing and execution of exchange-traded futures and options on futures for middle-market intermediaries, end-users, producers of commodities and the institutional and professional trader market segments. The Company has a subsidiary that is a registered broker-dealer and futures commission merchant (“FCM”), clearing on various exchanges. A primary source of revenues for the Company’s BD/FCM are commissions and clearing fees derived from executing and clearing orders for commodity futures contracts and options on futures on behalf of its customers.
The Company also brokers foreign exchange forwards, options and cash, or spot, transactions between customers and external counterparties. A portion of the contracts are arranged on an offsetting basis, limiting the Company’s risk to performance of the two offsetting parties. The offsetting nature of the contracts eliminates the effects of market fluctuations on the Company’s operating results. Due to the Company’s role as a principal participating in both sides of these contracts, the amounts are presented gross on the consolidated balance sheets at their respective fair values, net of offsetting assets and liabilities.
During fiscal 2014, the Company concluded its business activities related to speculative trading and holding proprietary positions in futures, options and swaps, including corn, wheat, soybeans, sugar. Since some of the derivatives held or sold by the Company were for speculative trading purposes, those derivative instruments were not designated as hedging instruments and accordingly, the changes in fair value during the period were recorded in the consolidated income statements as a component of ‘trading gains, net’ (see Note 4).
The Company holds proprietary positions in its foreign exchange line of business. On a limited basis, the Company’s foreign exchange trade desk will accept a customer transaction and will offset that transaction with a similar but not identical position with a counterparty. These unmatched transactions are intended to be short-term in nature and are often conducted to facilitate the most effective transaction for the Company’s customer. These spot and forward contracts are accounted for as free-standing derivatives and reported in the consolidated balance sheets at their fair values. The Company does not seek hedge accounting treatment for these derivatives, and accordingly, the changes in fair value during the period are recorded in the consolidated income statements in ‘trading gains, net’ (see Note 4). In applying the guidance in the Balance Sheet-Offsetting Topic of the ASC, the Company’s accounting policy is such that open contracts with the same customer are netted at the account level, in accordance with netting arrangements in place with each party, as applicable and rights to reclaim cash collateral or obligations to return cash collateral are netted against fair value amounts recognized for derivative instruments with the same customer in accordance with the master netting arrangements in place with each customer.
66
The Company may lease commodities to or from customers or counterparties, or advance commodities to customers on an unpriced basis, receiving payment when they become priced. These are valued at fair value utilizing the fair value option based on guidance in the Financial Instruments Topic of the ASC. As permitted by the fair value option election, the entire instrument is recorded at fair value in the consolidated balance sheets as a component of ‘financial instruments owned and sold, not yet purchased’. Due to the short term nature of the instruments, the balance of the agreements is not materially different than the recorded fair value. The corresponding change in fair value of the instrument is recognized in the consolidated income statements as a component of ‘trading gains, net’ for the fiscal years ended September 30, 2015, 2014, and 2013. The Company does elect to value all of their commodities lease agreements at fair value using the fair value option. See fair value measurements in Note 3.
Exchange Memberships and Stock
The Company is required to hold certain exchange membership seats and exchange firm common stock and pledge them for clearing purposes, in order to provide the Company the right to process trades directly with the various exchanges. Exchange memberships include seats on the Chicago Board of Trade (“CBOT”), the Minneapolis Grain Exchange, the New York Mercantile Exchange (“NYMEX”), the Commodity Exchange, Inc. (“COMEX”) Division of the New York Mercantile Exchange, Mercado de Valores de Buenos Aires S.A. (“MERVAL”), the Chicago Mercantile Exchange (“CME”) Growth and Emerging Markets, InterContinental Exchange, Inc. (“ICE”) Futures US, ICE Europe Ltd and London Metal Exchange (“LME”). Exchange firm common stock include shares of CME Group, Inc., ICE and LME.
Exchange memberships and firm common stocks pledged for clearing purposes are recorded at cost and are included in ‘other assets’ on the consolidated balance sheets. Equity investments in exchange firm common stock not pledged for clearing purposes are classified as trading securities and recorded at fair value, with unrealized gains and losses recorded as a component of “trading gains, net” on the consolidated income statements. Equity investments in exchange firm common stock not pledged for clearing purposes are included in ‘financial instruments owned’ on the consolidated balance sheets.
The cost basis for exchange memberships and firm common stock pledged for clearing purposes was $9.9 million and $10.3 million as of September 30, 2015 and 2014, respectively. The fair value of exchange memberships and firm common stock pledged for clearing purposes was $7.6 million and $9.7 million as of September 30, 2015 and 2014, respectively. The fair value of exchange firm common stock is determined by quoted market prices, and the fair value of exchange memberships is determined by recent sale transactions. The Company monitors the fair value of exchange membership seats and firm common stock on a quarterly basis, and does not consider any current unrealized losses on individual exchange memberships to be anything other than a temporary impairment.
Commodity and Other Repurchase Agreements and Collateralized Transactions
In the normal course of operations the Company accepts notes receivable under sale/repurchase agreements with customers whereby the customers sell certain commodity inventory or other investments and agree to repurchase the commodity inventory or investment at a future date at either a fixed or floating rate. These transactions are short-term in nature, and in accordance with the guidance contained in the Transfers and Servicing Topic of the ASC, are treated as secured borrowings rather than commodity inventory and purchases and sales in the Company’s consolidated financial statements.
Additionally, the Company participates in transactions involving commodities or other investments sold under repurchase agreements (“repos”). In accordance with the guidance contained in the Transfers and Servicing Topic of the ASC, these transactions are treated as secured borrowings that are recorded as a liability in the consolidated balance sheets. Commodities or investments sold under repurchase agreements are reflected at the amount of cash received in connection with the transactions. The Company may be required to provide additional collateral based on the fair value of the underlying asset.
Business Combinations
Acquisitions are accounted for as business combinations in accordance with the provisions of the Business Combinations Topic of the ASC. Under this accounting guidance most of the assets and liabilities acquired and assumed are measured at fair value as of the acquisition date. Certain contingent liabilities acquired require remeasurement at fair value in each subsequent reporting period. Noncontrolling interests are initially measured at fair value and classified as a separate component of equity. Acquisition related costs, such as fees for attorneys, accountants, and investment bankers, are expensed as incurred and are not capitalized as part of the purchase price. For all acquisitions, regardless of the consummation date, deferred tax assets, valuation allowances, and uncertain tax position adjustments occurring after the measurement period are recorded as a component of income, rather than adjusted through goodwill.
Determining the fair value of certain assets and liabilities acquired is subjective in nature and often involves the use of significant estimates and assumptions. Estimating the fair value of the assets and liabilities acquired requires significant judgment.
67
Contingent Consideration
The Company estimates and records the acquisition date estimated fair value of contingent consideration as part of purchase price consideration for acquisitions. Additionally, each reporting period, the Company estimates changes in the fair value of contingent consideration, and any change in fair value is recognized in the consolidated income statement. An increase in the earn-out expected to be paid will result in a charge to operations in the period that the anticipated fair value of contingent consideration increases, while a decrease in the earn-out expected to be paid will result in a credit to operations in the period that the anticipated fair value of contingent consideration decreases. The estimate of the fair value of contingent consideration requires subjective assumptions to be made of future operating results, discount rates, and probabilities assigned to various potential operating result scenarios. Future revisions to these assumptions could materially change the estimate of the fair value of contingent consideration and, therefore, materially affect the Company’s future financial results.
Additional Paid-In Capital
The Company’s additional paid-in capital (“APIC”) consists of stockholder contributions that are in excess of par value of common stock. Included in APIC are amounts related to the exercise of stock options, share-based compensation and shares held in escrow.
In September 2010, the Company acquired certain assets of Provident Group (“Provident”). The purchase price for the assets and services of the sellers was $5.0 million. Subsequent to closing, the individual sellers placed the entire purchase price into an escrow account and the funds were used to purchase outstanding shares of the Company on the open market. There were 214,325 shares purchased and placed into escrow as a result of this agreement. The entire purchase price was recorded as a reduction in additional paid in capital as shares held in escrow for business combinations. The shares held in escrow for business combinations were to be released to the individual sellers, over a five year period from the date of closing based on net profits, in accordance with the provisions of the acquisition agreement. At September 30, 2015, the end of the five year period, the terms of the agreement were not met and 204,271 shares were forfeited to the Company and recorded as treasury stock. In accordance with the acquisition agreement, there were no shares earned or released during the years ended September 30, 2015 and 2014, while 6,799 shares were earned and subsequently released to the sellers during the year ended September 30, 2013, and 3,255 shares were earned and subsequently released prior to fiscal 2013.
Revenue Recognition
Sales of physical commodities revenue are recognized when persuasive evidence of an arrangement exists, delivery has occurred, the fee is fixed or determinable, and collectability is reasonably assured. The Company reports its physical commodities revenues, except as described below, on a gross basis, with the corresponding cost of sales shown separately, in accordance with the guidelines provided in the Revenue Recognition Topic of the ASC.
Change in Precious Metals Accounting
Prior to the transfer, INTL Commodities Inc. precious metals sales and costs of sales were recorded on a gross basis in accordance with the Revenue Recognition Topic of the ASC. Subsequent to the transfer, INTL FCStone Ltd. precious metals sales and cost of sales are presented on a net basis and included as a component of ‘trading gains, net’ on the consolidated income statements, in accordance with U.S GAAP accounting requirements for broker-dealers. Precious metals sales and cost of sales for subsidiaries that are not broker-dealers continue to be recorded on a gross basis.
The change has no effect on the Company’s operating revenues, income from continuing operations, or net income. Management has historically assessed the performance of the physical commodities businesses on an operating revenue basis, and continues to do so.
Trading gains, net include brokerage fees and margins generated from OTC derivative trades executed with customers and other counterparties and are recognized when trades are executed. Trading gains, net also include activities where the Company acts as principal in the purchase and sale of individual securities, currencies, commodities or derivative instruments with customers. These transactions may be offset simultaneously with another customer or counterparty, offset with similar but not identical positions on an exchange, made from inventory, or may be aggregated with other purchases to provide liquidity intraday, for a number of days, or in some cases, particularly the base metals business, even longer periods (during which fair value may fluctuate). In addition, trading gains, net includes activities from the Company’s operations of a proprietary foreign exchange desk which arbitrages the futures and cash markets (see additional discussion in the Financial Instruments and Derivatives policy note for revenue recognition on proprietary trading activities). Net dealer inventory and investment gains are recognized on a trade-date basis and include realized gains or losses and changes in unrealized gains or losses on investments at fair value. Dividend income and dividend expense, on short equity positions, are recognized net, in ‘trading gain, net’ on the ex-dividend date.
Commissions on futures contracts are recognized on a half-turn basis in two equal parts. The first half is recognized when the contract is opened and the second half is recognized when the transaction is closed. Commissions on options on futures
68
contracts are generally recognized on a half-turn basis, except that full commissions are recognized on options expected to expire without being exercised or offset. Commissions and fees are charged at various rates based on the type of account, the products traded, and the method of trade. Clearing and transaction fees are charged to customers on a per exchange contract basis based on the trade date. Such fees are for clearing customers’ exchange trades and include fees charged to the Company by the various futures exchanges. See discussion of transaction-based clearing expenses below.
Consulting and management fees include risk management consulting fees which are billed and recognized as revenue on a monthly basis when risk management services are provided. Such agreements are generally for one year periods, but are cancelable by either party upon providing thirty days written notice to the other party and the amounts are not variable based on customer trading activities. Asset management fees are recognized as they are earned based on fees due at each period-end date. These include performance fees based on the amount that is due under the formula for exceeding performance targets as of the period-end date. Fee income for structuring and arrangement of debt transactions and management and investment advisory income is recorded when the services related to the underlying transactions are provided and success fees are recorded when complete, as determined under the terms of the assignment or engagement.
Interest income, generated primarily from investments and customer inventory financing, is recognized on an accrual basis. Interest from investments is generated from securities purchased using customer funds deposited with the Company to satisfy margin requirements, net of interest returned to customers, and from securities acquired through internally-generated company funds. Interest also includes unrealized gains and losses on securities owned and those deposited with other parties.
Revenue generally is recognized net of any taxes collected from customers and subsequently remitted to governmental authorities.
Cost of Revenue
Cost of sales of physical commodities include finished commodity or raw material and processing costs along with operating costs relating to the receipt, storage and delivery of the physical commodities.
Compensation and Benefits
Compensation and benefits consists primarily of salaries, incentive compensation, variable compensation, including commissions, related payroll taxes and employee benefits. The Company classifies employees as either risk management consultants / traders, operational or administrative personnel, which includes the executive officers. Variable compensation paid to risk management consultants and traders generally represents a fixed percentage of revenues generated, and in some cases, revenues produced less direct costs and an overhead allocation. The Company accrues commission expense on a trade date basis.
Share-Based Compensation
The Company accounts for share-based compensation in accordance with the guidance of the Compensation-Stock Compensation Topic of the ASC. The cost of employee services received in exchange for a share-based award is generally measured based on the grant-date fair value of the award. Share-based employee awards that require future service are amortized over the relevant service period. Expected forfeitures are included in determining share-based employee compensation expense. For option awards granted, compensation cost is recognized on a straight-line basis over the vesting period for the entire award.
Transaction-Based Clearing Expenses
Clearing fees and related expenses include primarily variable expenses for clearing and settlement services, including fees the Company pays to executing brokers, exchanges, clearing organizations and banks. These fees are based on transaction volume, and recorded as expense on the trade date. Clearing fees are passed on to customers and are presented gross in the consolidated statements of income under the Revenue Recognition Topic of the ASC, as the Company acts as a principal for these transactions.
Introducing Broker Commissions
Introducing broker commissions include commissions paid to non-employee third parties that have introduced customers to the Company. Introducing brokers are individuals or organizations that maintain relationships with customers and accept futures and options orders from those customers. The Company directly provides all account, transaction and margining services to introducing brokers, including accepting money, securities and property from the customers. The commissions are determined and settled monthly.
69
Income Taxes
Income tax expense includes U.S. federal, state and local and foreign income taxes. Certain items of income and expense are not reported in tax returns and financial statements in the same year. The tax effect of such temporary differences is reported as deferred income taxes. Tax provisions are computed in accordance with the Income Taxes Topic of the ASC.
Comprehensive Income
Comprehensive income consists of net income and other gains and losses affecting stockholders’ equity that, under U.S. GAAP, are excluded from net income. Other comprehensive income (loss) includes net actuarial losses from defined benefit pension plans, gains and losses on foreign currency translations, and changes in the fair value of interest rate swap agreements, to the extent they are, or previously were, effective as cash flow hedges.
Noncontrolling Interest and Variable Interest Entities
In accordance with the Consolidation Topic of the ASC, the Company consolidates any variable interest entities for which it is the primary beneficiary, as defined. The Company applies the equity method of accounting when the Company does not have a controlling interest in an entity, but exerts significant influence over the entity.
Preferred Stock
The Company is authorized to issue one million shares of preferred stock, par value of $0.01 per share, in one or more classes or series to be established by the Company’s board of directors. As of September 30, 2015 and 2014, no preferred shares were outstanding and the Company’s board of directors had not yet established any class or series of shares.
Recent Accounting Pronouncements
On May 28, 2014, the Financial Accounting Standards Board (“FASB”) issued Accounting Standards Update (“ASU”) 2014-09, Revenue from Contracts with Customers, which requires an entity to recognize the amount of revenue to which it expects to be entitled for the transfer of promised goods or services to customers. The ASU will replace most existing revenue recognition guidance in U.S. GAAP when it becomes effective. For public entities, the ASU is effective for fiscal years, and interim periods within those years, beginning after December 15, 2017. Early application is not permitted. The Company expects to adopt this guidance starting with the first quarter of fiscal year 2019. The standard permits the use of either the retrospective or cumulative effect transition method. The Company is evaluating the effect that ASU 2014-09 will have on its consolidated financial statements and related disclosures. The Company has not yet selected a transition method nor has it determined the effect of the standard on its ongoing financial reporting.
In June 2014, the FASB issued ASU 2014-11, Transfers and Servicing: Repurchase-to-Maturity Transactions, Repurchase Financings, and Disclosures, which changes the accounting for repurchase-to-maturity transactions to secured borrowing accounting. Additionally, for repurchase financing arrangements, the amendments of this ASU require separate accounting for a transfer of a financial asset executed contemporaneously with a repurchase agreement with the same counterparty, which will result in secured borrowing accounting for the repurchase agreement. For public entities, the ASU is effective for the first interim or annual period beginning after December 15, 2014. Earlier application is not permitted. The Company adopted this guidance starting with the second quarter of fiscal year 2015. The adoption of this guidance did not have a material impact on the Company’s consolidated financial statements.
In August 2014, the FASB issued ASU 2014-15, Presentation of Financial Statements - Going Concern: Disclosures of Uncertainties about an Entity’s Ability to Continue as a Going Concern, which requires management to evaluate whether there are conditions or events that raise substantial doubt about the entity’s ability to continue as a going concern within one year after the date that the financial statements are issued or are available to be issued. This ASU also requires management to disclose certain information depending on the results of the going concern evaluation. The provisions of this ASU are effective for annual periods ending after December 15, 2016, and for interim and annual periods thereafter. Early adoption is permitted. This amendment is applicable to the Company for the fiscal year ending September 30, 2017. The adoption of this standard is not expected to have a material impact on the consolidated financial statements.
In January 2015, the FASB issued ASU 2015-01, Income Statement - Extraordinary and Unusual Items: Simplifying Income Statement Presentation by Eliminating the Concept of Extraordinary Items, which eliminates from U.S. GAAP the concept of extraordinary items. The ASU retains and expands the existing presentation and disclosure guidance for items that are unusual in nature or occur infrequently to also include items that are both unusual in nature and infrequently occurring. The provisions of this ASU are effective for annual periods and interim periods within those annual periods beginning after December 15, 2015. Early adoption is permitted, provided that presentation applied to the beginning of the fiscal year of adoption. This amendment is applicable to the Company beginning October 1, 2016. The adoption of this standard is not expected to have a material impact on the consolidated financial statements.
70
In April 2015, the FASB issued ASU 2015-03, Interest- Imputation of Interest (Subtopic 835-03) - Simplifying the Presentation of Debt Issuance Costs which requires unamortized debt issuance costs to be presented as a reduction of the corresponding debt liability rather than a separate asset. Amortization of the costs is reported as interest expense. The provisions of this ASU are effective for fiscal years, and interim periods within those fiscal years, beginning after December 15, 2015. Early adoption is allowed for all entities for financial statements that have not been previously issued. Entities should apply the new guidance retrospectively to all prior periods. The guidance is applicable to the Company beginning October 1, 2016. The adoption of this standard is not expected to have a material impact on the consolidated financial statements.
In July 2015, the FASB issued ASU No, 2015-11, "Inventory (Topic 330): Simplifying the Measurement of Inventory." Topic 330, Inventory, currently requires an entity to measure inventory at the lower of cost or market. Market could be replacement cost, net realizable value, or net realizable value less an approximately normal profit margin. The amendments do not apply to inventory that is measured using last-in, first-out (LIFO) or the retail inventory method. The amendments apply to all other inventory, which includes inventory that is measured using first-in, first-out (FIFO) or average cost. An entity should measure in scope inventory at the lower of cost and net realizable value. Net realizable value is the estimated selling prices in the ordinary course of business, less reasonably predictable costs of completion, disposal, and transportation. Subsequent measurement is unchanged for inventory measured using LIFO or the retail inventory method. The amendments are effective for fiscal years beginning after December 15, 2016, including interim periods within those fiscal years. The amendments should be applied prospectively with earlier application permitted as of the beginning of an interim or annual reporting period. The guidance is applicable to the Company beginning October 1, 2017. The adoption of this standard is not expected to have a material impact on the consolidated financial statements.
In September 2015, FASB issued ASU No.2015-16, Business Combinations (Topic 805): Simplifying the Accounting for Measurement-Period Adjustments. The amendments in ASU 2015-16 require that an acquirer recognize adjustments to provisional amounts that are identified during the measurement period in the reporting period in which the adjustment amounts are determined. The amendments are effective for fiscal years beginning after December 15, 2015, including interim periods within those fiscal years. The amendments should be applied prospectively to adjustments to provisional amounts that occur after the effective date of this update with earlier application permitted for financial statements that have not been issued. The guidance is applicable to the Company beginning October 1, 2016. The adoption of this standard is not expected to have a material impact on the consolidated financial statements.
Note 2 – Earnings per Share
The Company presents basic and diluted earnings per share (“EPS”) using the two-class method which requires all outstanding unvested share-based payment awards that contain rights to non-forfeitable dividends and therefore participate in undistributed earnings with common stockholders be included in computing earnings per share. Under the two-class method, net earnings are reduced by the amount of dividends declared in the period for each class of common stock and participating security. The remaining undistributed earnings are then allocated to common stock and participating securities, based on their respective rights to receive dividends. Restricted stock awards granted to certain employees and directors and shares formerly held in trust for the Provident Group acquisition contain non-forfeitable rights to dividends at the same rate as common stock, and are considered participating securities.
71
Basic EPS has been computed by dividing net income by the weighted-average number of common shares outstanding. The following is a reconciliation of the numerator and denominator of the diluted net income per share computations for the periods presented below.
Year Ended September 30, | |||||||||||
(in millions, except share amounts) | 2015 | 2014 | 2013 | ||||||||
Numerator: | |||||||||||
Income from continuing operations | $ | 55.7 | $ | 19.6 | $ | 18.6 | |||||
Less: Allocation to participating securities | (1.3 | ) | (0.5 | ) | (0.7 | ) | |||||
Income from continuing operations allocated to common stockholders | $ | 54.4 | $ | 19.1 | $ | 17.9 | |||||
Income (loss) from discontinued operations | $ | — | $ | (0.3 | ) | $ | 0.7 | ||||
Less: Allocation to participating securities | — | — | (0.1 | ) | |||||||
Income (loss) from discontinued operations allocated to common stockholders | $ | — | $ | (0.3 | ) | $ | 0.6 | ||||
Diluted net income | $ | 55.7 | $ | 19.3 | $ | 19.3 | |||||
Less: Allocation to participating securities | (1.3 | ) | (0.5 | ) | (0.8 | ) | |||||
Diluted net income allocated to common stockholders | $ | 54.4 | $ | 18.8 | $ | 18.5 | |||||
Denominator: | |||||||||||
Weighted average number of: | |||||||||||
Common shares outstanding | 18,525,374 | 18,528,302 | 18,443,233 | ||||||||
Dilutive potential common shares outstanding: | |||||||||||
Share-based awards | 406,861 | 604,000 | 625,264 | ||||||||
Diluted weighted-average shares | 18,932,235 | 19,132,302 | 19,068,497 | ||||||||
The dilutive effect of share-based awards is reflected in diluted net income per share by application of the treasury stock method, which includes consideration of unamortized share-based compensation expense required under the Compensation – Stock Compensation Topic of the ASC.
Options to purchase 997,459, 1,120,985 and 1,447,688 shares of common stock for fiscal years ended September 30, 2015, 2014, and 2013, respectively, were excluded from the calculation of diluted earnings per share because they would have been anti-dilutive.
Note 3 – Assets and Liabilities, at Fair Value
The Company’s financial and nonfinancial assets and liabilities reported at fair value are included in the following captions on the consolidated balance sheets:
• | Cash and cash equivalents |
• | Cash, securities and other assets segregated under federal and other regulations |
• | Deposits and receivables from exchange-clearing organizations, broker-dealers, clearing organizations and counterparties |
• | Financial instruments owned and sold, not yet purchased |
• | Physical commodities inventory |
• | Accounts payable and other accrued liabilities |
• | Payable to broker-dealers, clearing organizations and counterparties |
Fair Value Hierarchy
As required by the Fair Value Measurement Topic of the ASC, financial and nonfinancial assets and liabilities are classified in their entirety based on the lowest level of input that is significant to the fair value measurement. The hierarchy gives the highest priority to unadjusted quoted prices in active markets for identical assets or liabilities (Level 1 measurements) and the lowest priority to unobservable inputs (Level 3 measurements). A market is active if there are sufficient transactions on an ongoing basis to provide current pricing information for the asset or liability, pricing information is released publicly, and price quotations do not vary substantially either over time or among market makers. Observable inputs reflect the assumptions market participants would use in pricing the asset or liability developed based on market data obtained from sources independent of the reporting entity. The guidance requires the Company to consider counterparty credit risk of all parties to outstanding derivative instruments that would be considered by a market participant in the transfer or settlement of such contracts (exit price). The Company’s exposure to credit risk on derivative financial instruments relates to the portfolio of OTC derivative contracts as all exchange-traded contracts held can be settled on an active market with the credit guarantee by the
72
respective exchange. The Company requires each counterparty to deposit margin collateral for all OTC instruments and is also required to deposit margin collateral with counterparties. The Company has assessed the nature of these deposits and used its discretion to adjust each based on the underlying credit considerations for the counterparty and determined that the collateral deposits minimize the exposure to counterparty credit risk in the evaluation of the fair value of OTC instruments as determined by a market participant.
The majority of financial assets and liabilities on the consolidated balance sheets are reported at fair value. Cash is reported at the balance held at financial institutions. Cash equivalents includes money market funds, which are valued at period-end at the net asset value provided by the fund’s administrator, and certificates of deposit, which are stated at cost plus accrued interest, which approximates fair value. Cash, securities and other assets segregated under federal and other regulations include the value of cash collateral as well as the value of other pledged investments, primarily U.S. Treasury bills and obligations issued by government sponsored entities and commodities warehouse receipts. Deposits with and receivables from exchange-clearing organizations and broker-dealers, clearing organizations and counterparties and payable to customers and broker-dealers, clearing organizations and counterparties include the value of cash collateral as well as the value of money market funds and other pledged investments, primarily U.S. Treasury bills and obligations issued by government sponsored entities and mortgage-backed securities. These balances also include the fair value of exchange-traded futures and options on futures and exchange-cleared swaps and options determined by prices on the applicable exchange. Financial instruments owned and sold, not yet purchased include the value of U.S. and foreign government obligations, corporate debt securities, derivative financial instruments, commodities, mutual funds and investments in managed funds. The fair value of exchange common stock is determined by quoted market prices, and the fair value of exchange memberships is determined by recent sale transactions. Physical commodities inventory includes precious metals that are a part of the trading activities of the regulated broker-dealer subsidiary and is recorded at fair value using spot prices. The carrying value of receivables from customers, net and notes receivable, net approximates fair value, given their short duration. Payables to lenders under loans carry variable rates of interest and thus approximate fair value. The fair value of the Company’s senior unsecured notes is estimated to be $46.6 million (carrying value of $45.5 million) as of September 30, 2015, based on the transaction prices at public exchanges for the same or similar issues.
As part of the acquisition of G.X. Clarke, the Company acquired amounts receivable from and payable to broker-dealers, clearing organizations and counterparties in connection with U.S. Treasury obligations, U.S. government agency obligations, and agency mortgage-backed obligations. Receivables from broker-dealers, clearing organizations and counterparties primarily include amounts receivable for securities sold but not yet delivered by the Company on settlement date (“fails-to-deliver”) and net receivables arising from unsettled trades. Payables to broker-dealers, clearing organizations and counterparties primarily include amounts payable for securities purchased, but not yet received by the Company on settlement date (“fails-to-receive”), net payables arising from unsettled trades. Due to their short-term nature, receivables from and payables to broker-dealers, clearing organizations and counterparties approximate fair value.
Also as part of the acquisition of G.X. Clarke, the Company acquired a significant amount of trading assets and liabilities. G.X. Clarke’s trading activities consists primarily of securities trading in connection with U.S. Treasury obligations, U.S. government agency obligations, and agency mortgage-backed obligations. The acquired assets and liabilities, including derivatives, are recorded on a trade date basis at fair value.
The fair value estimates presented herein are based on pertinent information available to management as of September 30, 2015 and 2014. Although management is not aware of any factors that would significantly affect the estimated fair value amounts, such amounts have not been comprehensively revalued for purposes of these financial statements since that date and current estimates of fair value may differ significantly from the amounts presented herein.
Cash equivalents, securities, commodities warehouse receipts, derivative financial instruments and contingent liabilities are carried at fair value, on a recurring basis, and are classified and disclosed into three levels in the fair value hierarchy. The Company did not have any fair value adjustments for assets or liabilities measured at fair value on a non-recurring basis during the years ended September 30, 2015 and 2014. The three levels of the fair value hierarchy under the Fair Value Measurement Topic of the ASC are:
Level 1 - Unadjusted quoted prices in active markets that are accessible at the measurement date for identical, unrestricted assets or liabilities. Level 1 consists of financial assets and liabilities whose fair values are estimated using quoted market prices. Included in Level 1 are money market funds, certificates of deposit, commodities warehouse receipts, common stock and American Depositary Receipts (“ADRs”), some U.S. and foreign obligations, physical precious metals commodities, equity investments in exchange firms, some mutual funds, as well as futures and options on futures contracts traded on national exchanges, exchange-cleared swaps and options which are valued using exchange closing prices, and OTC swaps and options contracts using quoted prices from national exchanges in which the Company executes transactions for customer and proprietary accounts;
73
Level 2 - Quoted prices for identical or similar assets or liabilities in markets that are less active, that is, markets in which there are few transactions for the asset or liability that are observable for substantially the full term. Included in Level 2 are those financial assets and liabilities for which fair values are estimated using models or other valuation methodologies. These models are primarily industry-standard models that consider various observable inputs, including time value, yield curve, volatility factors, observable current market and contractual prices for the underlying financial instruments, as well as other relevant economic measures. Included in Level 2 are U.S. and foreign government obligations, mortgage-backed securities, some common stock and ADRs, corporate and municipal bonds, some mutual funds, investments in managed funds and OTC forwards, swaps, and options; and
Level 3 - Prices or valuation techniques that require inputs that are both significant to the fair value measurement and unobservable (i.e., supported by little or no market activity). Level 3 comprises financial assets and liabilities whose fair value is estimated based on internally developed models or methodologies utilizing significant inputs that are not readily observable from objective sources. Included in Level 3 are common stock and ADRs, some corporate and municipal bonds, some other investments and contingent liabilities.
74
The following tables set forth the Company’s financial and nonfinancial assets and liabilities accounted for at fair value, on a recurring basis, as of September 30, 2015 and September 30, 2014 by level in the fair value hierarchy. There were no assets or liabilities that were measured at fair value on a nonrecurring basis as of September 30, 2015 and 2014.
September 30, 2015 | |||||||||||||||||||
(in millions) | Level 1 | Level 2 | Level 3 | Netting and Collateral (1) | Total | ||||||||||||||
Assets: | |||||||||||||||||||
Unrestricted cash equivalents - certificates of deposits | $ | 1.3 | $ | — | $ | — | $ | — | $ | 1.3 | |||||||||
Commodities warehouse receipts | 22.1 | — | — | — | 22.1 | ||||||||||||||
U.S. government obligations | — | 493.4 | — | — | 493.4 | ||||||||||||||
Securities and other assets segregated under federal and other regulations | 22.1 | 493.4 | — | — | 515.5 | ||||||||||||||
Money market funds | 431.8 | — | — | — | 431.8 | ||||||||||||||
U.S. government obligations | — | 501.4 | — | — | 501.4 | ||||||||||||||
Derivatives | 3,615.9 | — | — | (3,539.7 | ) | 76.2 | |||||||||||||
Deposits and receivables from exchange-clearing organizations | 4,047.7 | 501.4 | — | (3,539.7 | ) | 1,009.4 | |||||||||||||
“To be announced” (TBA) and forward settling securities | — | 1.2 | — | (1.0 | ) | 0.2 | |||||||||||||
Derivatives | 0.1 | 537.9 | — | (591.1 | ) | (53.1 | ) | ||||||||||||
Deposits and receivables from broker-dealers, clearing organizations and counterparties | 0.1 | 539.1 | — | (592.1 | ) | (52.9 | ) | ||||||||||||
Common and preferred stock and ADRs | 23.7 | 1.9 | 0.5 | — | 26.1 | ||||||||||||||
Exchangeable foreign ordinary equities and ADRs | 82.9 | 6.6 | — | — | 89.5 | ||||||||||||||
Corporate and municipal bonds | 26.1 | 2.0 | 3.2 | — | 31.3 | ||||||||||||||
U.S. government obligations | — | 513.4 | — | — | 513.4 | ||||||||||||||
Foreign government obligations | — | 12.1 | — | — | 12.1 | ||||||||||||||
Mortgage-backed securities | — | 699.5 | — | — | 699.5 | ||||||||||||||
Derivatives | 278.5 | 1,702.0 | — | (1,949.9 | ) | 30.6 | |||||||||||||
Commodities leases | — | 64.6 | — | (57.0 | ) | 7.6 | |||||||||||||
Commodities warehouse receipts | 2.8 | — | — | — | 2.8 | ||||||||||||||
Exchange firm common stock | 5.6 | — | — | — | 5.6 | ||||||||||||||
Mutual funds and other | 3.4 | — | — | — | 3.4 | ||||||||||||||
Financial instruments owned | 423.0 | 3,002.1 | 3.7 | (2,006.9 | ) | 1,421.9 | |||||||||||||
Physical commodities inventory - precious metals | 15.2 | — | — | — | 15.2 | ||||||||||||||
Total assets at fair value | $ | 4,509.4 | $ | 4,536.0 | $ | 3.7 | $ | (6,138.7 | ) | $ | 2,910.4 | ||||||||
Liabilities: | |||||||||||||||||||
Accounts payable and other accrued liabilities - contingent liabilities | $ | — | $ | — | $ | 3.3 | $ | — | $ | 3.3 | |||||||||
TBA and forward settling securities | — | 2.6 | — | (1.0 | ) | 1.6 | |||||||||||||
Derivatives | 3,491.3 | 528.7 | — | (4,020.0 | ) | — | |||||||||||||
Payables to broker-dealers, clearing organizations and counterparties | 3,491.3 | 531.3 | — | (4,021.0 | ) | 1.6 | |||||||||||||
Common and preferred stock and ADRs | 18.0 | 0.6 | — | — | 18.6 | ||||||||||||||
Exchangeable foreign ordinary equities and ADRs | 89.0 | 1.0 | — | — | 90.0 | ||||||||||||||
U.S. government obligations | — | 341.0 | — | — | 341.0 | ||||||||||||||
Foreign government obligations | — | 6.4 | — | — | 6.4 | ||||||||||||||
Mortgage-backed securities | — | 2.8 | — | — | 2.8 | ||||||||||||||
Derivatives | 264.0 | 1,723.5 | — | (1,933.4 | ) | 54.1 | |||||||||||||
Commodities leases | — | 99.1 | — | (43.7 | ) | 55.4 | |||||||||||||
Financial instruments sold, not yet purchased | 371.0 | 2,174.4 | — | (1,977.1 | ) | 568.3 | |||||||||||||
Total liabilities at fair value | $ | 3,862.3 | $ | 2,705.7 | $ | 3.3 | $ | (5,998.1 | ) | $ | 573.2 | ||||||||
(1) | Represents cash collateral and the impact of netting across the levels of the fair value hierarchy. Netting among positions classified within the same level are included in that level. |
75
September 30, 2014 | |||||||||||||||||||
(in millions) | Level 1 | Level 2 | Level 3 | Netting and Collateral (1) | Total | ||||||||||||||
Assets: | |||||||||||||||||||
Unrestricted cash equivalents - certificates of deposits | $ | 1.5 | $ | — | $ | — | $ | — | $ | 1.5 | |||||||||
Commodities warehouse receipts | 14.8 | — | — | — | 14.8 | ||||||||||||||
U.S. government obligations | — | 0.5 | — | — | 0.5 | ||||||||||||||
Securities and other assets segregated under federal and other regulations | 14.8 | 0.5 | — | — | 15.3 | ||||||||||||||
Money market funds | 826.8 | — | — | — | 826.8 | ||||||||||||||
U.S. government obligations | — | 702.5 | — | — | 702.5 | ||||||||||||||
Derivatives | 3,397.1 | — | — | (3,671.0 | ) | (273.9 | ) | ||||||||||||
Deposits and receivables from exchange-clearing organizations | 4,223.9 | 702.5 | — | (3,671.0 | ) | 1,255.4 | |||||||||||||
Deposits and receivables from broker-dealers, clearing organizations and counterparties - derivatives | 549.0 | — | — | (550.1 | ) | (1.1 | ) | ||||||||||||
Common and preferred stock and ADRs | 66.8 | 15.0 | 0.7 | — | 82.5 | ||||||||||||||
Exchangeable foreign ordinary equities and ADRs | 27.2 | — | — | — | 27.2 | ||||||||||||||
Corporate and municipal bonds | 7.1 | 9.0 | 3.6 | — | 19.7 | ||||||||||||||
U.S. government obligations | — | 0.3 | — | — | 0.3 | ||||||||||||||
Foreign government obligations | — | 10.7 | — | — | 10.7 | ||||||||||||||
Derivatives | 332.4 | 2,328.3 | — | (2,616.4 | ) | 44.3 | |||||||||||||
Commodities leases | — | 60.1 | — | (58.0 | ) | 2.1 | |||||||||||||
Commodities warehouse receipts | 3.6 | — | — | — | 3.6 | ||||||||||||||
Exchange firm common stock | 4.8 | — | — | — | 4.8 | ||||||||||||||
Mutual funds and other | 2.7 | — | — | — | 2.7 | ||||||||||||||
Financial instruments owned | 444.6 | 2,423.4 | 4.3 | (2,674.4 | ) | 197.9 | |||||||||||||
Total assets at fair value | $ | 5,233.8 | $ | 3,126.4 | $ | 4.3 | $ | (6,895.5 | ) | $ | 1,469.0 | ||||||||
Liabilities: | |||||||||||||||||||
Accounts payable and other accrued liabilities - contingent liabilities | $ | — | $ | — | $ | 5.5 | $ | — | $ | 5.5 | |||||||||
Payable to broker-dealers, clearing organizations and counterparties - derivatives | 3,469.8 | — | — | (3,469.8 | ) | — | |||||||||||||
Common and preferred stock and ADRs | 92.8 | 2.6 | — | — | 95.4 | ||||||||||||||
Exchangeable foreign ordinary equities and ADRs | 5.8 | — | — | — | 5.8 | ||||||||||||||
Corporate and municipal bonds | 2.8 | — | — | — | 2.8 | ||||||||||||||
Derivatives | 327.0 | 2,257.7 | — | (2,500.3 | ) | 84.4 | |||||||||||||
Commodities leases | — | 176.0 | — | (100.4 | ) | 75.6 | |||||||||||||
Financial instruments sold, not yet purchased | 428.4 | 2,436.3 | — | (2,600.7 | ) | 264.0 | |||||||||||||
Total liabilities at fair value | $ | 3,898.2 | $ | 2,436.3 | $ | 5.5 | $ | (6,070.5 | ) | $ | 269.5 | ||||||||
(1) | Represents cash collateral and the impact of netting across the levels of the fair value hierarchy. Netting among positions classified within the same level are included in that level. |
Realized and unrealized gains and losses are included in ‘trading gains, net’ in the consolidated income statements.
76
Information on Level 3 Financial Assets and Liabilities
The Company’s financial assets at fair value classified within level 3 of the fair value hierarchy as of September 30, 2015 and 2014 are summarized below:
(in millions) | September 30, 2015 | September 30, 2014 | |||||
Total level 3 assets | $ | 3.7 | $ | 4.3 | |||
Level 3 assets for which the Company bears economic exposure | $ | 3.7 | $ | 4.3 | |||
Total assets | $ | 5,070.0 | $ | 3,039.7 | |||
Total financial assets at fair value | $ | 2,910.4 | $ | 1,469.0 | |||
Total level 3 assets as a percentage of total assets | 0.1 | % | 0.1 | % | |||
Level 3 assets for which the Company bears economic exposure as a percentage of total assets | 0.1 | % | 0.1 | % | |||
Total level 3 assets as a percentage of total financial assets at fair value | 0.1 | % | 0.3 | % | |||
The following tables set forth a summary of changes in the fair value of the Company’s level 3 financial assets and liabilities during the fiscal years ended September 30, 2015 and 2014, including a summary of unrealized gains (losses) during the fiscal year ended on the Company’s level 3 financial assets and liabilities still held as of September 30, 2015.
Level 3 Financial Assets and Financial Liabilities For the Year Ended September 30, 2015 | |||||||||||||||||||||||||||
(in millions) | Balances at beginning of period | Realized gains (losses) during period | Unrealized gains (losses) during period | Purchases/ issuances | Settlements | Transfers in or (out) of Level 3 | Balances at end of period | ||||||||||||||||||||
Assets: | |||||||||||||||||||||||||||
Common and preferred stock and ADRs | $ | 0.7 | $ | — | $ | (0.2 | ) | $ | — | $ | — | $ | — | $ | 0.5 | ||||||||||||
Corporate and municipal bonds | 3.6 | — | (0.4 | ) | — | — | — | 3.2 | |||||||||||||||||||
$ | 4.3 | $ | — | $ | (0.6 | ) | $ | — | $ | — | $ | — | $ | 3.7 | |||||||||||||
(in millions) | Balances at beginning of period | Realized gains (losses) during period | Remeasurement gains (losses) during period | Acquisitions | Settlements | Transfers in or (out) of Level 3 | Balances at end of period | ||||||||||||||||||||
Liabilities: | |||||||||||||||||||||||||||
Contingent liabilities | $ | 5.5 | $ | — | $ | 1.8 | $ | 0.1 | $ | (4.1 | ) | $ | — | $ | 3.3 | ||||||||||||
Level 3 Financial Assets and Financial Liabilities For the Year Ended September 30, 2014 | |||||||||||||||||||||||||||
(in millions) | Balances at beginning of period | Realized gains (losses) during period | Unrealized gains (losses) during period | Purchases/ issuances | Settlements | Transfers in or (out) of Level 3 | Balances at end of period | ||||||||||||||||||||
Assets: | |||||||||||||||||||||||||||
Common and preferred stock and ADRs | $ | 0.7 | $ | — | $ | — | $ | — | $ | — | $ | — | $ | 0.7 | |||||||||||||
Corporate and municipal bonds | 3.5 | — | 0.1 | — | — | — | 3.6 | ||||||||||||||||||||
$ | 4.2 | $ | — | $ | 0.1 | $ | — | $ | — | $ | — | $ | 4.3 | ||||||||||||||
(in millions) | Balances at beginning of period | Realized gains (losses) during period | Remeasurement gains (losses) during period | Acquisitions | Settlements | Transfers in or (out) of Level 3 | Balances at end of period | ||||||||||||||||||||
Liabilities: | |||||||||||||||||||||||||||
Contingent liabilities | $ | 9.6 | $ | — | $ | (2.3 | ) | $ | 0.5 | $ | (2.3 | ) | $ | — | $ | 5.5 | |||||||||||
In accordance with the Fair Value Measurement Topic of the ASC, the Company has estimated on a recurring basis each period the fair value of debentures issued by a single asset owning company of Suriwongse Hotel located in Chiang Mai, Thailand. As of September 30, 2015, the Company’s investment in the hotel is $3.2 million, and included within the corporate and municipal bonds classification in the level 3 financial assets and financial liabilities tables. The Company has classified its investment in the hotel within level 3 of the fair value hierarchy because the fair value is determined using significant unobservable inputs,
77
which include projected cash flows. These cash flows are discounted employing present value techniques. The Company estimates the fair value of its investment in these debentures by using a management-developed forecast, which is based on the income approach. The Company continues to monitor the hotel renovation process and evaluate the fair value of the debentures. There has been no significant change in the fair value of the debentures, and no additional loss has been recognized during the years ended September 30, 2015, 2014 and 2013.
The Company is required to make additional future cash payments based on certain financial performance measures of its acquired businesses. The Company is required to remeasure the fair value of the cash earnout arrangements on a recurring basis in accordance with the guidance in the Business Combinations Topic of the ASC. The Company has classified its liabilities for the contingent earnout arrangements within level 3 of the fair value hierarchy because the fair value is determined using significant unobservable inputs, which include projected cash flows. The estimated fair value of the contingent purchase consideration is based upon management-developed forecasts, a level 3 input in the fair value hierarchy. These cash flows are discounted employing present value techniques in arriving at fair value. The discount rate was developed using market participant company data and there have been no significant changes in the discount rate environment. From the dates of acquisition to September 30, 2015, certain acquisitions have had changes in the estimates of undiscounted cash flows, based on actual performances fluctuating from estimates. During the fiscal years ended September 30, 2015 and 2014, the fair value of the contingent consideration increased $1.8 million and decreased $2.3 million, respectively, with the corresponding income or expense classified as ‘other’ in the consolidated income statements.
The value of an exchange-traded derivative contract is equal to the unrealized gain or loss on the contract determined by marking the contract to the current settlement price for a like contract on the valuation date of the contract. A settlement price may not be used if the market makes a limit move with respect to a particular derivative contract or if the securities underlying the contract experience significant price fluctuations after the determination of the settlement price. When a settlement price cannot be used, derivative contracts will be valued at their fair value as determined in good faith pursuant to procedures adopted by management of the Company.
The Company reports transfers in and out of levels 1, 2 and 3, as applicable, using the fair value of the securities as of the beginning of the reporting period in which the transfer occurred. The Company did not have any additional significant transfers between level 1 and level 2 fair value measurements for the fiscal years ended September 30, 2015 and 2014.
The Company has classified equity investments in exchange firms’ common stock not pledged for clearing purposes as trading. The investments are recorded at fair value, with unrealized gains and losses recorded, net of taxes, included in earnings. As of September 30, 2015, the cost and fair value of the equity investments in exchange firms is $3.7 million and $5.6 million, respectively. As of September 30, 2014, the cost and fair value of the equity investments in exchange firms was $3.7 million and $4.8 million, respectively.
In June 2015, the Company sold shares of common stock in the Intercontinental Exchange, Inc. (“ICE”). The Company was required to hold these ICE shares for clearing purposes and, as a result, the shares were being held at cost on the consolidated balance sheet. The Company recorded a receivable for the proceeds of $2.1 million, which was received in July 2015, and recognized a gain of $1.2 million before taxes, during the year ended September 30, 2015, in connection with the sale of these shares.
For the fiscal year ended September 30, 2015, the Company reclassified the unrealized gain remaining in AOCI of approximately $3.3 million, net of income tax expense of $2.0 million, into earnings.
In December 2012, the Company sold its exchange membership seats in the Board of Trade of Kansas City, Missouri, Inc. (“KCBT”), in connection with the acquisition of the KCBT by Chicago Mercantile Exchange (“CME”). The Company was required to hold these exchange membership seats for clearing purposes and, as a result, the associated KCBT shares were being held at cost on the consolidated balance sheet. The Company received proceeds of $1.5 million and recognized a gain of $0.9 million before taxes, during the fiscal year ended September 30, 2013, in connection with the sale of these seats.
During the year ended September 30, 2014, the Company sold all of its investments in mortgage-backed securities and the U.S. government obligations there were held as of September 30, 2014, matured, and as a result, realized gains of $0.1 million, net of tax, were reclassified from OCI for the year ended September 30, 2014.
Except as discussed previously, there were no other sales of AFS Securities during years ended September 30, 2015 and September 30, 2014, and as a result, no additional realized gains or losses were recorded for the years ended September 30, 2015 and September 30, 2014. The company recognized changes in unrealized gains on available-for-sale securities of $2.7 million during the year ended September 30, 2015.
78
Note 4 – Financial Instruments with Off-Balance Sheet Risk and Concentrations of Credit Risk
The Company is party to certain financial instruments with off-balance sheet risk in the normal course of its business. The Company has sold financial instruments that it does not currently own and will therefore be obliged to purchase such financial instruments at a future date. The Company has recorded these obligations in the consolidated financial statements as of September 30, 2015 at the fair values of the related financial instruments. The Company will incur losses if the fair value of the underlying financial instruments increases subsequent to September 30, 2015. The total of $568.3 million as of September 30, 2015 includes $54.1 million for derivative contracts, which represent a liability to the Company based on their fair values as of September 30, 2015.
Derivatives
The Company utilizes derivative products in its trading capacity as a dealer in order to satisfy client needs and mitigate risk. The Company manages risks from both derivatives and non-derivative cash instruments on a consolidated basis. The risks of derivatives should not be viewed in isolation, but in aggregate with the Company’s other trading activities. The majority of the Company’s derivative positions are included in the consolidating balance sheets in ‘deposits and receivables from exchange-clearing organizations’, ‘financial instruments owned and sold, not yet purchased, at fair value’ and ‘payables to broker-dealers, clearing organizations and counterparties’.
The Company employs an interest rate risk management strategy that uses derivative financial instruments in the form of interest rate swaps to manage a portion of the aggregate interest rate position. The Company’s objective is to invest the majority of customer segregated deposits in high quality, short-term investments and swap the resulting variable interest earnings into the medium-term interest stream. The risk mitigation of these interest rate swaps is not within the documented hedging designation requirements of the Derivatives and Hedging Topic of the ASC, and as a result they are recorded at fair value, with changes in the marked-to-market valuation of the financial instruments recorded within 'trading gains, net' in the consolidated income statements. At September 30, 2015, the Company had $375 million in notional principal of interest rate swaps outstanding with a weighted-average life of 27 months.
Listed below are the fair values of the Company’s derivative assets and liabilities as of September 30, 2015 and 2014. Assets represent net unrealized gains and liabilities represent net unrealized losses.
September 30, 2015 | September 30, 2014 | ||||||||||||||
(in millions) | Assets (1) | Liabilities (1) | Assets (1) | Liabilities (1) | |||||||||||
Derivative contracts not accounted for as hedges: | |||||||||||||||
Exchange-traded commodity derivatives | $ | 3,443.6 | $ | 3,313.8 | $ | 3,777.7 | $ | 3,255.4 | |||||||
OTC commodity derivatives | 1,621.2 | 1,650.7 | 1,852.3 | 1,842.9 | |||||||||||
Exchange-traded foreign exchange derivatives | 27.8 | 20.6 | 93.5 | 90.2 | |||||||||||
OTC foreign exchange derivatives | 892.2 | 865.4 | 808.0 | 741.8 | |||||||||||
Exchange-traded interest rate derivatives | 126.8 | 136.0 | 13.4 | 10.2 | |||||||||||
Equity index derivatives | 22.8 | 21.0 | 61.9 | 114.0 | |||||||||||
TBA and forward settling securities | 1.2 | 2.6 | — | — | |||||||||||
Gross fair value of derivative contracts | 6,135.6 | 6,010.1 | 6,606.8 | 6,054.5 | |||||||||||
Impact of netting and collateral | (6,081.7 | ) | (5,954.4 | ) | (6,837.5 | ) | (5,970.1 | ) | |||||||
Total fair value included in ‘Deposits and receivables from exchange-clearing organizations’ | $ | 76.2 | $ | (273.9 | ) | ||||||||||
Total fair value included in ‘Deposits and receivables from broker-dealers, clearing organizations and counterparties’ | $ | (52.9 | ) | $ | (1.1 | ) | |||||||||
Total fair value included in ‘Financial instruments owned, at fair value’ | $ | 30.6 | $ | 44.3 | |||||||||||
Total fair value included in ‘Payables to broker-dealers, clearing organizations and counterparties | $ | 1.6 | $ | — | |||||||||||
Fair value included in ‘Financial instruments sold, not yet purchased, at fair value’ | $ | 54.1 | $ | 84.4 | |||||||||||
(1) | As of September 30, 2015 and 2014, the Company’s derivative contract volume for open positions was approximately 4.1 million and 4.5 million contracts, respectively. |
The Company’s derivative contracts are principally held in its Commodities and Risk Management Services (“Commercial Hedging”) segment. The Company assists its Commercial Hedging segment customers in protecting the value of their future
79
production by entering into option or forward agreements with them on an OTC basis. The Company also provides its Commercial Hedging segment customers with option products, including combinations of buying and selling puts and calls. The Company mitigates its risk by generally offsetting the customer’s transaction simultaneously with one of the Company’s trading counterparties or will offset that transaction with a similar but not identical position on the exchange. The risk mitigation of these offsetting trades is not within the documented hedging designation requirements of the Derivatives and Hedging Topic of the ASC. These derivative contracts are traded along with cash transactions because of the integrated nature of the markets for these products. The Company manages the risks associated with derivatives on an aggregate basis along with the risks associated with its proprietary trading and market-making activities in cash instruments as part of its firm-wide risk management policies. In particular, the risks related to derivative positions may be partially offset by inventory, unrealized gains in inventory or cash collateral paid or received.
Also as part of the acquisition of G.X. Clarke, the Company acquired derivative instruments, which consist of futures, mortgage-backed TBA securities and forward settling transactions, that are used to manage risk exposures in the newly acquired subsidiary’s trading inventory. The fair value on these transactions are recorded in receivables or payables to broker-dealers, clearing organizations and counterparties. Realized and unrealized gains and losses on securities and derivative transactions are reflected in ‘trading gains, net’.
The Company enters into TBA securities transactions for the sole purpose of managing risk associated with the purchase of mortgage pass-through securities. TBA securities are included within payables to broker-dealers, clearing organizations and counterparties. Forward settling securities represent non-regular way securities and are included in financial instruments owned and sold. As of September 30, 2015, these transactions are summarized as follows (in millions):
Gain / (Loss) | Notional Amounts | ||||||
Unrealized gain on TBA securities purchased within payables to broker-dealers, clearing organizations and counterparties and related notional amounts (1) | $ | 0.6 | $ | 194.6 | |||
Unrealized loss on TBA securities purchased within payables to broker-dealers, clearing organizations and counterparties and related notional amounts (1) | $ | (0.2 | ) | $ | 163.7 | ||
Unrealized gain on TBA securities sold within payables to broker-dealers, clearing organizations and counterparties and related notional amounts (1) | $ | 0.4 | $ | (314.1 | ) | ||
Unrealized loss on TBA securities sold within payables to broker-dealers, clearing organizations and counterparties and related notional amounts (1) | $ | (2.0 | ) | $ | (563.8 | ) | |
Unrealized gain on forward settling securities purchased within receivables from broker-dealers, clearing organizations and counterparties and related notional amounts | $ | 0.1 | $ | 163.4 | |||
Unrealized loss on forward settling securities sold within payables to broker-dealers, clearing organizations and counterparties and related notional amounts | $ | (0.4 | ) | $ | (286.3 | ) | |
(1) The notional amounts of these instruments reflect the extent of the Company's involvement in TBA securities and do not represent risk of loss due to counterparty non-performance. | |||||||
The following table sets forth the Company’s net gains (losses) related to derivative financial instruments for the fiscal years ended September 30, 2015, 2014, and 2013, in accordance with the Derivatives and Hedging Topic of the ASC. The net gains (losses) set forth below are included in ‘trading gains, net’ in the consolidated income statements.
Year Ended September 30, | |||||||||||
(in millions) | 2015 | 2014 | 2013 | ||||||||
Commodities | $ | 78.6 | $ | 65.7 | $ | 84.6 | |||||
Foreign exchange | 7.5 | 7.5 | 11.6 | ||||||||
Interest rate and equity | 3.2 | — | 0.1 | ||||||||
TBA and forward settling securities | (5.1 | ) | — | — | |||||||
Net gains from derivative contracts | $ | 84.2 | $ | 73.2 | $ | 96.3 | |||||
Credit Risk
In the normal course of business, the Company purchases and sells financial instruments, commodities and foreign currencies as either principal or agent on behalf of its customers. If either the customer or counterparty fails to perform, the Company may be required to discharge the obligations of the nonperforming party. In such circumstances, the Company may sustain a loss if the fair value of the financial instrument or foreign currency is different from the contract value of the transaction.
The majority of the Company’s transactions and, consequently, the concentration of its credit exposure are with commodity exchanges, customers, broker-dealers and other financial institutions. These activities primarily involve collateralized and uncollateralized arrangements and may result in credit exposure in the event that a counterparty fails to meet its contractual
80
obligations. The Company’s exposure to credit risk can be directly impacted by volatile financial markets, which may impair the ability of counterparties to satisfy their contractual obligations. The Company seeks to control its credit risk through a variety of reporting and control procedures, including establishing credit limits based upon a review of the counterparties’ financial condition and credit ratings. The Company monitors collateral levels on a daily basis for compliance with regulatory and internal guidelines and requests changes in collateral levels as appropriate.
The Company is a party to financial instruments in the normal course of its business through customer and proprietary trading accounts in exchange-traded and OTC derivative instruments. These instruments are primarily the execution of orders for commodity futures, options on futures and forward foreign currency contracts on behalf of its customers, substantially all of which are transacted on a margin basis. Such transactions may expose the Company to significant credit risk in the event margin requirements are not sufficient to fully cover losses which customers may incur. The Company controls the risks associated with these transactions by requiring customers to maintain margin deposits in compliance with individual exchange regulations and internal guidelines. The Company monitors required margin levels daily and, therefore, may require customers to deposit additional collateral or reduce positions when necessary. The Company also establishes credit limits for customers, which are monitored daily. The Company evaluates each customer’s creditworthiness on a case by case basis. Clearing, financing, and settlement activities may require the Company to maintain funds with or pledge securities as collateral with other financial institutions. Generally, these exposures to both customers and exchanges are subject to master netting, or customer agreements, which reduce the exposure to the Company by permitting receivables and payables with such customers to be offset in the event of a customer default. Management believes that the margin deposits held as of September 30, 2015 and September 30, 2014 were adequate to minimize the risk of material loss that could be created by positions held at that time. Additionally, the Company monitors collateral fair value on a daily basis and adjusts collateral levels in the event of excess market exposure. Generally, these exposures to both customers and counterparties are subject to master netting, or customer agreements which reduce the exposure to the Company.
Derivative financial instruments involve varying degrees of off-balance sheet market risk whereby changes in the fair values of underlying financial instruments may result in changes in the fair value of the financial instruments in excess of the amounts reflected in the consolidated balance sheets. Exposure to market risk is influenced by a number of factors, including the relationships between the financial instruments and the Company’s positions, as well as the volatility and liquidity in the markets in which the financial instruments are traded. The principal risk components of financial instruments include, among other things, interest rate volatility, the duration of the underlying instruments and changes in commodity pricing and foreign exchange rates. The Company attempts to manage its exposure to market risk through various techniques. Aggregate market limits have been established and market risk measures are routinely monitored against these limits.
Note 5 – Receivables From Customers, Net and Notes Receivable, Net
Receivables from customers, net and notes receivable, net include an allowance for bad debts, which reflects the Company’s best estimate of probable losses inherent in the receivables from customers and notes receivable. The Company provides for an allowance for doubtful accounts based on a specific-identification basis. The Company continually reviews its allowance for bad debts. The allowance for doubtful accounts related to receivables from customers was $10.2 million and $5.7 million as of September 30, 2015 and 2014, respectively. The allowance for doubtful accounts related to notes receivable was $1.0 million and $0.1 million as of September 30, 2015 and 2014, respectively.
During the year ended September 30, 2015, the Company recorded bad debt expense, net of recoveries, of $7.3 million, including provision increases of $6.6 million and direct write-offs of $0.7 million, offset by minimal recoveries. The increase in bad debts during fiscal 2015 related to $2.8 million of receivables from a renewable fuels customer in the Physical Commodities segment, $2.3 million of OTC customer deficits and $0.6 million of LME customer deficits in the Commercial Hedging segment, $0.5 million of uncollectible service fees and notes in our Securities segment, and $1.1 million of notes receivable related to loans pertaining to a former acquisition.
During the year ended September 30, 2014, the Company recorded bad debt expense, net of recoveries, of $5.5 million, including provision increases of $5.1 million and direct write-offs of $0.6 million, offset by recoveries of $0.2 million. The provision increases during fiscal 2014 was $3.8 million in the Commercial Hedging segment, primarily related to account deficits from a Hong Kong commercial LME customer and Brazilian OTC Financial Ag’s & Energy customers. Additionally, the Company recorded bad debts of $0.9 million in the Physical Commodities segment, related to renewable fuels activity, and $0.7 million in the Securities segment primarily related to charge-offs of uncollectible service fees.
During the year ended September 30, 2013, the Company recorded bad debt expense, net of recoveries, of $0.7 million, including provision increases of $0.2 million and direct write-offs of $0.6 million, offset by recoveries of $0.1 million. The provision increase during fiscal 2013 was primarily related to customer deficits in the Commercial Hedging segment, and the direct write-offs were primarily related to investment banking advisory services in the Securities segment.
81
Activity in the allowance for doubtful accounts and notes for the years ended September 30, 2015, 2014, and 2013 was as follows:
(in millions) | 2015 | 2014 | 2013 | ||||||||
Balance, beginning of year | $ | 5.8 | $ | 1.2 | $ | 1.0 | |||||
Provision for bad debts | 6.0 | 5.3 | 0.2 | ||||||||
Deductions: | |||||||||||
Charge-offs | (0.6 | ) | (0.7 | ) | — | ||||||
Balance, end of year | $ | 11.2 | $ | 5.8 | $ | 1.2 | |||||
The Company originates short-term notes receivable from customers with the outstanding balances typically being insured 90% to 98% by a third party, including accrued interest, subject to applicable deductible amounts. The total balance outstanding under insured notes receivable was $41.4 million and $33.8 million as of September 30, 2015 and 2014, respectively. The Company has sold $30.7 million and $25.8 million of the insured portion of the notes through non-recourse participation agreements with other third parties as of September 30, 2015 and 2014, respectively.
See discussion of notes receivable related to commodity repurchase agreements in Note 13.
Note 6 – Physical Commodities Inventory
The carrying values of the Company’s inventory, which consist of all finished commodities, are $32.8 million and $40.0 million as of September 30, 2015 and 2014, respectively.
As a result of declining market prices for some commodities towards the end of the fiscal year, the Company has recorded LCM adjustments for physical commodities inventory of $0.3 million and $1.0 million as of September 30, 2015 and 2014, respectively. The adjustments are included in ‘cost of sales of physical commodities’ in the consolidated income statements.
Note 7 – Property and Equipment, net
Property and equipment are stated at cost, and reported net of accumulated depreciation on the consolidated balance sheets. Depreciation on plant and equipment is calculated on the straight-line method over the estimated useful lives of the assets. The estimated useful lives of property and equipment range from 3 to 10 years. During the fiscal years ended September 30, 2015, 2014, and 2013, depreciation expense was $5.7 million, $5.7 million and $5.8 million, respectively.
A summary of property and equipment, at cost less accumulated depreciation as of September 30, 2015 and 2014 is as follows:
(in millions) | September 30, 2015 | September 30, 2014 | |||||
Property and equipment: | |||||||
Furniture and fixtures | $ | 5.2 | $ | 5.2 | |||
Software | 9.0 | 6.2 | |||||
Equipment | 16.1 | 10.9 | |||||
Leasehold improvements | 9.9 | 9.3 | |||||
Total property and equipment | 40.2 | 31.6 | |||||
Less accumulated depreciation | (20.5 | ) | (15.7 | ) | |||
Property and equipment, net | $ | 19.7 | $ | 15.9 | |||
Note 8 – Goodwill
Goodwill allocated to the Company’s operating segments as of September 30, 2015 and 2014 is as follows:
(in millions) | September 30, 2015 | September 30, 2014 | |||||
Commercial Hedging | $ | 30.7 | $ | 30.7 | |||
Global Payments | 6.3 | 6.3 | |||||
Physical Commodities | 2.4 | 2.4 | |||||
Securities | 8.1 | 8.1 | |||||
Goodwill | $ | 47.5 | $ | 47.5 | |||
82
Note 9 – Intangible Assets
Intangible assets of $1.6 million, attributed to customer relationships and software programs/platforms, acquired during the fiscal year ended September 30, 2015 relate to an acquisition, as discussed in note 18.
The gross and net carrying values of intangible assets as of the balance sheet dates, by major intangible asset class are as follows:
September 30, 2015 | September 30, 2014 | ||||||||||||||||||||||
(in millions) | Gross Amount | Accumulated Amortization | Net Amount | Gross Amount | Accumulated Amortization | Net Amount | |||||||||||||||||
Intangible assets subject to amortization: | |||||||||||||||||||||||
Software programs/platforms | $ | 2.7 | $ | (2.3 | ) | $ | 0.4 | $ | 2.2 | $ | (1.9 | ) | $ | 0.3 | |||||||||
Customer base | 14.0 | (4.9 | ) | 9.1 | 12.9 | (3.8 | ) | 9.1 | |||||||||||||||
16.7 | (7.2 | ) | 9.5 | 15.1 | (5.7 | ) | 9.4 | ||||||||||||||||
Intangible assets not subject to amortization: | |||||||||||||||||||||||
Trade name | 1.1 | — | 1.1 | 1.1 | — | 1.1 | |||||||||||||||||
Total intangible assets | $ | 17.8 | $ | (7.2 | ) | $ | 10.6 | $ | 16.2 | $ | (5.7 | ) | $ | 10.5 | |||||||||
Amortization expense related to intangible assets was $1.5 million, $1.6 million, and $2.2 million for the fiscal years ended September 30, 2015, 2014, and 2013, respectively.
The estimated future amortization expense as of September 30, 2015 is as follows (in millions):
Year ending September 30, | |||
2016 | $ | 1.0 | |
2017 | 1.0 | ||
2018 | 1.0 | ||
2019 | 1.1 | ||
2020 and thereafter | 5.4 | ||
$ | 9.5 | ||
Note 10 – Credit Facilities
Variable-Rate Credit Facilities
The Company has four committed credit facilities under which the Company and its subsidiaries may borrow up to $280.0 million, subject to the terms and conditions for these facilities. The amounts outstanding under these credit facilities are short term borrowings and carry variable rates of interest, thus approximating fair value. The Company’s credit facilities are as follows:
A three-year syndicated committed loan facility established on September 20, 2013 under which $140 million is available to the Company for general working capital requirements. The line of credit is secured by a pledge of shares held in certain of the Company’s subsidiaries. Unused portions of the loan facility require a commitment fee of 0.625% on the unused commitment. Borrowings under the facility bear interest at the Eurodollar Rate, as defined, plus 3.00% or Base Rate, as defined, plus 2.00%, and averaged 5.25% as of September 30, 2015. The agreement contains financial covenants related to consolidated tangible net worth, consolidated funded debt to net worth ratio, consolidated fixed charge coverage ratio and consolidated net unencumbered liquid assets, as defined. The Company was in compliance with these financial covenants as of September 30, 2015. The Company paid debt issuance costs of $1.5 million in connection with the issuance of this credit facility, which are being amortized over the thirty-six month term of the facility.
An unsecured syndicated committed line of credit, established on June 21, 2010 and renewed by amendment on March 30, 2015, under which $75 million is available to the Company’s subsidiary, INTL FCStone Financial to provide short term funding of margin to commodity exchanges as necessary. This line of credit is subject to annual review, and the continued availability of this line of credit is subject to INTL FCStone Financial’s financial condition and operating results continuing to be satisfactory as set forth in the agreement. Unused portions of the margin line require a commitment fee of 0.50% on the unused commitment. Borrowings under the margin line are on a demand basis and bear interest at the Base Rate, as defined, plus 2.00%, which was 5.25% as of September 30, 2015. The agreement contains financial covenants related to INTL FCStone Financial’s tangible net worth, excess net capital and maximum net loss over a trailing twelve month period, as defined. INTL
83
FCStone Financial was in compliance with these covenants as of September 30, 2015. The facility is guaranteed by the Company.
A syndicated committed borrowing facility established on August 10, 2012, and amended on May 1, 2015, under which $40.0 million is available to the Company’s subsidiary, FCStone Merchant Services, LLC (“FCStone Merchants”) for financing traditional commodity financing arrangements and commodity repurchase agreements. The facility is secured by the assets of FCStone Merchants, and guaranteed by the Company. Unused portions of the borrowing facility require a commitment fee of 0.50% on the unused commitment. The borrowings outstanding under the facility bear interest at a rate per annum equal to the Base Rate plus Applicable Margin, as defined, which averaged 4.25% as of September 30, 2015. The agreement contains financial covenants related to tangible net worth, as defined. FCStone Merchants was in compliance with this covenant as of September 30, 2015. FCStone Merchants paid minimal debt issuance costs in connection with this credit facility.
A syndicated committed borrowing facility established on November 15, 2013, and amended on November 10, 2015, under which $25.0 million is available to the Company’s subsidiary, INTL FCStone, Ltd for short term funding of margin to commodity exchanges. The borrowings outstanding under the facility bear interest at a rate per annum equal to 2.50% plus the Federal Funds Rate, as defined. The agreement contains financial covenants related to consolidated tangible net worth, as defined. INTL FCStone Ltd was in compliance with this covenant as of September 30, 2015. INTL FCStone, Ltd paid minimal debt issuance costs in connection with this credit facility. The facility is guaranteed by the Company.
The Company also has a secured, uncommitted loan facility, under which the Company’s wholly owned subsidiary, Financial may borrow up to $50.0 million, collateralized by commodity warehouse receipts, to facilitate U.S. commodity exchange deliveries of its customers, subject to certain terms and conditions of the credit agreement.
Note Payable to Bank
In April 2015, the Company obtained a $4.0 million loan from a commercial bank, secured by equipment purchased with the proceeds. The note is payable in monthly installments, ending in March 2020. The note bears interest at a rate per annum equal to LIBOR plus 2.00%.
Senior Unsecured Notes
In July 2013, the Company completed the offering of $45.5 million aggregate principal amount of the Company’s 8.5% Senior Notes due 2020 (the “Notes”). The net proceeds of the sale of the Notes are being used for general corporate purposes. The Notes bear interest at a rate of 8.5% per year (payable quarterly on January 30, April 30, July 30 and October 30 of each year). The Notes will mature on July 30, 2020. The Company may redeem the Notes, in whole or in part, at any time on and after July 30, 2016, at a redemption price equal to 100% of the principal amount redeemed plus accrued and unpaid interest to, but not including, the redemption date. The Company incurred debt issuance costs of $1.7 million in connection with the issuance of the Notes, which are being amortized over the term of the Notes.
The following table sets forth a listing of credit facilities, the committed amounts as of September 30, 2015 on the facilities, and outstanding borrowings on the facilities as well as indebtedness on a promissory note an on senior notes as of September 30, 2015 and 2014:
(in millions) | |||||||||||||||
Credit Facilities | Amounts Outstanding | ||||||||||||||
Borrower | Security | Renewal / Expiration Date | Total Commitment | September 30, 2015 | September 30, 2014 | ||||||||||
INTL FCStone Inc. | Certain pledged shares of certain subsidiares | September 20, 2016 | $ | 140.0 | $ | 28.0 | $ | 15.0 | |||||||
FCStone, LLC | None | April 7, 2016 | 75.0 | — | — | ||||||||||
FCStone, LLC | Commodity warehouse receipts | n/a | — | — | — | ||||||||||
FCStone Merchants | Certain commodities assets | May 1, 2016 | 40.0 | 10.0 | 7.5 | ||||||||||
INTL FCStone, Ltd | None | October 31, 2016 | 25.0 | — | — | ||||||||||
$ | 280.0 | 38.0 | 22.5 | ||||||||||||
Note Payable to Bank | |||||||||||||||
Monthly installments, due March 2020 and secured by certain equipment | 3.6 | — | |||||||||||||
Senior Unsecured Notes | |||||||||||||||
8.50% senior notes, due July 30, 2020 | 45.5 | 45.5 | |||||||||||||
Total indebtedness | $ | 87.1 | $ | 68.0 | |||||||||||
84
As reflected above, $255 million of the Company’s committed credit facilities are scheduled to expire during the fiscal year ended September 30, 2016. The Company intends to renew or replace these facilities as they expire, and based on the Company’s liquidity position and capital structure, the Company believes it will be able to do so.
Note 11 – Commitments and Contingencies
Legal Proceedings
Certain conditions may exist as of the date the financial statements are issued, which may result in a loss to the Company but which will only be resolved when one or more future events occur or fail to occur. The Company assesses such contingent liabilities, and such assessment inherently involves an exercise of judgment. In assessing loss contingencies related to legal proceedings that are pending against the Company or unasserted claims that may result in such proceedings, the Company’s legal counsel evaluates the perceived merits of any legal proceedings or unasserted claims as well as the perceived merits of the amount of relief sought or expected to be sought therein.
If the assessment of a contingency indicates that it is probable that a material loss had been incurred at the date of the financial statements and the amount of the liability can be estimated, then the estimated liability would be accrued in the Company’s financial statements. If the assessment indicates that a potentially material loss contingency is not probable, but is reasonably possible, or is probable but cannot be estimated, then the nature of the contingent liability, together with an estimate of the range of possible loss if determinable and material, would be disclosed. Neither accrual nor disclosure is required for loss contingencies that are deemed remote. The Company accrues legal fees related to contingent liabilities as they are incurred.
In addition to the matters discussed below, from time to time and in the ordinary course of business, the Company is involved in various legal actions and proceedings, including tort claims, contractual disputes, employment matters, workers’ compensation claims and collections. The Company carries insurance that provides protection against certain types of claims, up to the policy limits of the insurance.
As of September 30, 2015 and 2014, the consolidated balance sheets include loss contingency accruals, recorded during and prior to these fiscal years then ended, which are not material, individually or in the aggregate, to the Company’s financial position or liquidity. In the opinion of management, possible exposure from loss contingencies in excess of the amounts accrued, and in addition to the possible losses discussed below, is not material to the Company’s earnings, financial position or liquidity.
The following is a summary of significant legal matters involving the Company.
Securities Litigation and Regulatory Proceedings
On January 13, 2014, a purported class action was filed in the United States District Court for the Southern District of New York against the Company and certain of the Company’s officers and directors. The complaint alleges violations of federal securities laws, and claims that the Company has issued false and misleading information concerning its business and prospects. The action seeks unspecified damages on behalf of persons who purchased the Company's shares between February 17, 2010 and December 16, 2013. The lead plaintiff’s amended complaint was filed in June 2014. The Company’s motion to dismiss the complaint was filed in July 2014. At the court hearing on February 4, 2015, the Company’s motion was granted and the amended complaint was dismissed, however the lead plaintiff was given leave to amend its complaint. The lead plaintiff’s second amended complaint was filed on March 6, 2015, and it narrowed the purported class to persons who purchased Company’s shares between December 15, 2010 and December 16, 2013. On March 27, 2015, the Company filed a motion to dismiss the second amended complaint. The lead plaintiff’s memorandum in opposition was filed on April 13, 2015 and the Company’s reply in support of its motion to dismiss the second amended complaint was filed on April 27, 2015. The matter was heard on July 9, 2015 and on July 13, 2015 the second amended complaint was dismissed in its entirety, with prejudice and without leave to replead.
During fiscal 2014, settlement of a previously disclosed shareholder class action complaint against the Company and its directors originating in August 2008 was approved, resulting in a payment of $0.3 million after consideration of insurance coverage, recorded as expense in fiscal 2014.
During fiscal 2013, the Company reached a settlement with the CFTC in connection with its investigation of the losses that occurred in 2008 and 2009 in a customer energy trading account of the Company’s former wholly owned subsidiary FCStone, LLC. Effective July 1, 2015, FCStone, LLC was merged with other certain wholly owned subsidiaries, and is now known as INTL FCStone Financial Inc. The CFTC’s findings, neither admitted nor denied by us, were that FCStone, LLC violated CFTC Regulation 166.3 in that it failed to diligently supervise its officers’ and employees’ activities relating to risks associated with its customers’ accounts, and in particular one account controlled by two of FCStone’s customers who traded in natural gas futures, swaps and option contracts. The settlement resulted in a payment of $1.5 million recorded as expense in fiscal 2013.
85
Sentinel Litigation
Prior to the July 1, 2015 merger of certain wholly owned subsidiaries, the Company’s former subsidiary FCStone, LLC, had a portion of its excess segregated funds invested with Sentinel Management Group Inc. (“Sentinel”), a registered FCM and an Illinois-based money manager that provided cash management services to other FCMs. In August 2007, Sentinel halted redemptions to customers and sold certain of the assets it managed to an unaffiliated third party at a significant discount. On August 17, 2007, subsequent to Sentinel’s sale of certain assets, Sentinel filed for bankruptcy protection. In aggregate, $15.5 million of FCStone, LLC’s $21.9 million in invested funds were returned to it before and after Sentinel’s bankruptcy petition.
In August 2008, the bankruptcy trustee of Sentinel filed adversary proceedings against FCStone, LLC, and a number of other FCMs in the Bankruptcy Court for the Northern District of Illinois. The case was subsequently reassigned to the United States District Court, for the Northern District of Illinois. In the complaint, the trustee is seeking avoidance of alleged transfers or withdrawals of funds received by FCStone, LLC and other FCMs within 90 days prior to the filing of the Sentinel bankruptcy petition, as well as avoidance of post-petition distributions and disallowance of the proof of claim filed by FCStone, LLC. The trustee seeks recovery of pre- and post-petition transfers totaling approximately $15.5 million.
The trial of this matter took place, as a test case, during October 2012. The trial court entered a judgment against FCStone, LLC on January 4, 2013. On January 17, 2013, the trial court entered an agreed order, staying execution and enforcement, pending an appeal of the judgment. On March 19, 2014, the appeal court ruled in favor of FCStone, LLC. On April 16, 2014, the trustee filed a petition for rehearing of the appeal. On May 19, 2014, the U.S. Court of Appeals for the Seventh Circuit denied the petition. The trustee did not file a writ for certiorari with the U.S. Supreme Court during the time allotted to do so. The Company continues to be involved in litigation against the trustee to recover its share of the cash held in reserve accounts under Sentinel’s Fourth Amended Chapter 11 Plan of Liquidation.
On February 10, 2015, based on a new theory, the trustee filed a motion for judgment against FCStone in the United States District Court, for the Northern District of Illinois, seeking to claw back the post-petition transfer of $14.5 million and to recover the funds held in reserve in the name of FCStone. FCStone filed its opposition brief and an associated motion for judgment on March 17, 2015. The trustee filed its reply briefs on April 7, 2015 and the Company filed its reply briefs on April 22, 2015. The Company has determined that losses related to this matter are neither probable nor reasonably possible. The Company believes the case is without merit and intends to defend itself vigorously.
Our assessments are based on estimates and assumptions that have been deemed reasonable by management, but that may later prove to be incomplete or inaccurate, and unanticipated events and circumstances may occur that might cause us to change those estimates and assumptions.
Contractual Commitments
Contingent Liabilities - Acquisitions
Under the terms of the purchase agreements, related to the acquisitions listed below, the Company has obligations to pay additional consideration if specific conditions and earnings targets are met. In accordance with the Business Combinations Topic of the ASC, the fair value of the additional consideration is recognized as a contingent liability as of the acquisition date. The contingent liability for these estimated additional purchase price considerations of $3.3 million and $5.5 million are included in ‘accounts payable and other accrued liabilities’ in the consolidated balance sheets as of September 30, 2015 and 2014, respectively. The acquisition date fair value of additional consideration is remeasured to its fair value each reporting period, with changes in fair value recorded in current earnings. The change in fair value during the years ended September 30, 2015, 2014, and 2013 were an increase of $1.8 million, decrease of $2.3 million and increase of $2.6 million , respectively, and are included in ‘other’ in the consolidated income statements.
The Company has a contingent liability relating to the January 2015 acquisition of G.X. Clarke, which may result in the payment of additional purchase price consideration. The contingent consideration, which in no event shall exceed $1.5 million, is expected to be paid in two payments. See additional discussion of the acquisition and contingent consideration in Note 18 - Acquisitions. The estimated total purchase price, including contingent consideration, is $27.5 million as of September 30, 2015, of which $1.0 million remains outstanding and is included in ‘accounts payable and other accrued liabilities’ in the consolidated balance sheet.
The Company has a contingent liability relating to the December 2012 acquisition of the accounts of Tradewire Securities, LLC, as described in Note 18, which may result in the payment of additional purchase price consideration. The contingent liability recorded represents the fair value of the expected consideration to be paid, based on the forecasted adjusted pre-tax net earnings during three annual periods and a six month period, after the third annual period, following the closing of the acquisition, for a total of four payments, with a discount rate being applied to those future payments. The present value of the estimated total purchase price, including contingent consideration, is $4.4 million as of September 30, 2015, of which $2.3 million remains outstanding and is included in ‘accounts payable and other accrued liabilities’ in the consolidated balance sheet.
86
Operating Leases
The Company is obligated under various noncancelable operating leases for the rental of office facilities, automobiles, service obligations and certain office equipment, and accounts for these lease obligations on a straight line basis. The expense associated with operating leases amounted to $10.1 million, $9.5 million and $9.2 million, for fiscal years ended September 30, 2015, 2014, and 2013, respectively. The expenses associated with the operating leases and service obligations are reported in the consolidated income statements in ‘occupancy and equipment rental’, ‘transaction-based clearing expenses’ and ‘other’ expenses.
Future aggregate minimum lease payments under noncancelable operating leases as of September 30, 2015 are as follows:
(in millions) | |||
Year ending September 30, | |||
2016 | $ | 7.2 | |
2017 | 6.3 | ||
2018 | 5.5 | ||
2019 | 5.4 | ||
2020 | 5.2 | ||
Thereafter | 12.2 | ||
$ | 41.8 | ||
Purchase Commitments
The Company determines an estimate of contractual purchase commitments in the ordinary course of business primarily for the purchase of precious metals. Unpriced contract commitments have been estimated using September 30, 2015 fair values. The purchase commitments and other obligations as of September 30, 2015 for less than one year, one to three years and three to five years were $335.9 million, $3.4 million and $1.5 million, respectively. There were $2.1 million purchase commitments and other obligations after five years as of September 30, 2015. The purchase commitments for less than one year will be partially offset by corresponding sales commitments of $217 million.
Exchange Member Guarantees
The Company is a member of various exchanges that trade and clear futures and option contracts. Associated with its memberships, the Company may be required to pay a proportionate share of the financial obligations of another member who may default on its obligations to the exchanges. While the rules governing different exchange memberships vary, in general the Company’s guarantee obligations would arise only if the exchange had previously exhausted its resources. In addition, any such guarantee obligation would be apportioned among the other non-defaulting members of the exchange. Any potential contingent liability under these membership agreements cannot be estimated. The Company has not recorded any contingent liability in the consolidated financial statements for these agreements and believes that any potential requirement to make payments under these agreements is remote.
Self-Insurance
On January 1, 2014, the Company entered into a program to self-insure its costs related to medical and dental claims. The Company is self-insured, up to a stop loss amount, for eligible participating employees and retirees, and for qualified dependent medical and dental claims, subject to deductibles and limitations. Liabilities are recognized based on claims filed and an estimate of claims incurred but not reported. The Company has purchased stop-loss coverage to limit its exposure on a per claim basis and in aggregate in the event that aggregated actual claims would exceed 120% of actuarially estimated claims. The Company is insured for covered costs in excess of these limits. Although the ultimate outcome of these matters may exceed the amounts recorded and additional losses may be incurred, the Company does not believe that any additional potential exposure for such liabilities will have a material adverse effect on the Company’s consolidated financial position or results of operations. As of September 30, 2015, the Company had $0.8 million accrued for self-insured medical and dental claims included in ‘accounts payable and other liabilities’ in the consolidated balance sheet.
Note 12 – Regulatory Requirements and Subsidiary Dividend Restrictions
The Company’s subsidiary INTL FCStone Financial is registered as a broker dealer and member of the Financial Industry Regulatory Authority (“FINRA”) subject to the SEC Uniform Net Capital Rule 15c3-1, which requires the maintenance of minimum net capital. INTL FCStone Financial is also a commodity futures commission merchant registered with the CFTC and subject to the net capital requirements of the CFTC Regulation 1.17. Under the more restrictive of these rules, INTL FCStone Financial is required to maintain “adjusted net capital”, equivalent to the greater of $1,000,000 or 8 percent of
87
customer and noncustomer risk maintenance margin requirements on all positions, as defined in such rules, regulations, and requirements. Net capital and the related net capital requirement may fluctuate on a daily basis. INTL FCStone Financial also has restriction on dividends, which restricts the withdrawal of equity capital if the planned withdrawal would reduce net capital, subsequent to haircuts and charges, to an amount less than 120% of the greatest minimum requirement.
Pursuant to the requirements of the Commodity Exchange Act, funds deposited by customers of INTL FCStone Financial relating to their trading of futures and options on futures on a U.S. commodities exchange must be carried in separate accounts which are designated as segregated customers’ accounts. Pursuant to the requirements of the CFTC, funds deposited by customers of INTL FCStone Financial relating to their trading of futures and options on futures traded on, or subject to the rules of, a foreign board of trade must be carried in separate accounts in an amount sufficient to satisfy all of INTL FCStone Financial’s current obligations to customers trading foreign futures and foreign options on foreign commodity exchanges or boards of trade, which are designated as secured customers’ accounts. See Additional Information of INTL FCStone Financial Related to Customer Segregated and Secured Funds further below for additional information regarding INTL FCStone Financial’s calculation of segregated and secured customer funds.
The Company’s subsidiary INTL FCStone Ltd. is regulated by the Financial Conduct Authority (“FCA”), the regulator of the financial services industry in the United Kingdom, as a Financial Services Firm under part IV of the Financial Services and Markets Act 2000. The regulations impose daily regulatory capital, as well as conduct of business, governance, and other requirements. The conduct of business rules include those that govern the treatment of client money and other assets which under certain circumstances for certain classes of client must be segregated from the firm’s own assets.
The Company’s subsidiary INTL FCStone Pty Ltd is regulated by the Australian Securities and Investment Commission and is subject to a net tangible asset capital requirement. INTL FCStone Pty Ltd is also regulated by New Zealand Clearing Limited, and is subject to a capital adequacy requirement.
FCStone Commodity Services (Europe), Ltd. is domiciled in Ireland and subject to regulation by the Central Bank of Ireland, and is subject to a net capital requirement.
INTL FCStone DTVM Ltda. (“INTL FCStone DTVM”) is a registered broker-dealer and regulated by the Brazilian Central Bank and Securities and Exchange Commission of Brazil, and is subject to a capital adequacy requirement.
All subsidiaries of the Company are in compliance with all of their regulatory requirements as of September 30, 2015, as follows:
(in millions) | As of September 30, 2015 | ||||||||||
Subsidiary | Regulatory Authority | Requirement Type | Actual | Minimum Requirement | |||||||
INTL FCStone Financial Inc. | SEC and CFTC | Net capital | $ | 146.3 | $ | 67.2 | |||||
INTL FCStone Financial Inc. | CFTC | Segregated funds | $ | 1,880.2 | $ | 1,830.9 | |||||
INTL FCStone Financial Inc. | CFTC | Secured funds | $ | 85.6 | $ | 65.2 | |||||
INTL FCStone Ltd | FCA (United Kingdom) | Net capital | $ | 110.8 | $ | 59.7 | |||||
INTL FCStone Ltd | FCA (United Kingdom) | Segregated funds | $ | 149.9 | $ | 149.9 | |||||
INTL Netherlands BV | FCA (United Kingdom) | Net capital | $ | 100.9 | $ | 59.9 | |||||
INTL FCStone Pty Ltd. | Australian Securities and Investment Commission | Net capital | $ | 1.7 | $ | 0.7 | |||||
INTL FCStone Pty Ltd. | Australian Securities and Investment Commission | Segregated funds | $ | 23.3 | $ | 12.5 | |||||
INTL FCStone Pty Ltd. | New Zealand Clearing Ltd | Capital adequacy | $ | 11.4 | $ | 3.2 | |||||
INTL FCStone DTVM Ltda. | Brazilian Central Bank and Securities and Exchange Commission of Brazil | Capital adequacy | $ | 2.6 | $ | 0.4 | |||||
Gainvest S.A. Sociedad Gerente de FCI | Comision Nacional de Valores | Capital adequacy | $ | 6.4 | $ | 0.2 | |||||
Gainvest S.A. Sociedad Gerente de FCI | Comision Nacional de Valores | Net capital | $ | 0.4 | $ | 0.1 | |||||
INTL Capital S.A. | General Inspector of Justice (Argentina) | Net capital | $ | 12.1 | $ | 9.9 | |||||
INTL CIBSA S.A. | Comision Nacional de Valores | Capital adequacy | $ | 5.1 | $ | 1.7 | |||||
INTL CIBSA S.A. | Comision Nacional de Valores | Net capital | $ | 9.1 | $ | 0.9 | |||||
Certain other non-U.S. subsidiaries of the Company are also subject to capital adequacy requirements promulgated by authorities of the countries in which they operate. As of September 30, 2015, these subsidiaries were in compliance with their local capital adequacy requirements.
88
Additional Information of INTL FCStone Financial Related to Customer Segregated and Secured Funds
Pursuant to the requirements of the Commodity Exchange Act, funds deposited by customers of INTL FCStone Financial relating to futures and options on futures positions in regulated commodities must be carried in separate accounts which are designated as segregated customers’ accounts. Certain amounts in the accompanying table reflect reclassifications and eliminations required for regulatory filing.
Funds deposited by customers and other assets, which have been segregated as belonging to the commodity customers as of September 30, 2015 and 2014, are as follows:
(in millions) | September 30, 2015 | September 30, 2014 | |||||
Cash, at banks - segregated | $ | 126.9 | $ | 314.0 | |||
Securities representing investments of customers' funds, at banks | 492.5 | — | |||||
Securities held for customers in lieu of cash, at banks | 0.9 | 0.5 | |||||
Deposits with and receivables from: | |||||||
Exchange-clearing organizations, including securities, net of omnibus eliminations | 1,237.8 | 1,476.5 | |||||
Securities held for customers in lieu of cash | 22.1 | 14.8 | |||||
Total customer-segregated funds | 1,880.2 | 1,805.8 | |||||
Amount required to be segregated | 1,830.9 | 1,769.3 | |||||
Excess funds in segregation | $ | 49.3 | $ | 36.5 | |||
Funds deposited by customers and other assets, which are held in separate accounts for customers trading foreign futures and foreign options customers, as of September 30, 2015 and 2014 are as follows:
(in millions) | September 30, 2015 | September 30, 2014 | |||||
Cash - secured | $ | 64.7 | $ | 46.8 | |||
Securities | — | — | |||||
Equities with registered futures commission merchants | 2.6 | 11.9 | |||||
Amounts held by clearing organizations of foreign boards of trade | — | — | |||||
Amounts held by members of foreign boards of trade | 18.3 | 14.5 | |||||
Total customer-secured funds | 85.6 | 73.2 | |||||
Amount required to be secured | 65.2 | 53.3 | |||||
Excess secured funds | $ | 20.4 | $ | 19.9 | |||
Note 13 – Commodity and Other Repurchase Agreements and Collateralized Transactions
The Company’s outstanding notes receivable in connection with the sale/repurchase agreements, whereby the customers sell certain commodity inventory and agree to repurchase the commodity inventory at a future date at either a fixed or floating rate, as of September 30, 2015 and 2014 was $26.7 million and $20.6 million, respectively.
The obligations outstanding related to commodities sold under repurchase agreements that are recorded in ‘lenders under loans’ as of September 30, 2015 and 2014 were $10.0 million and $7.5 million, respectively.
The Company enters into securities purchased under agreements to resell and payables under repurchase agreements primarily to finance financial instruments, acquire securities to cover short positions or to acquire securities for settlement. These agreements are recorded at their contractual amounts plus accrued interest. The related interest is recorded in the consolidated income statement as interest income or interest expense, as applicable. In connection with these agreements and transactions, it is the policy of the Company to receive or pledge cash or securities to adequately collateralize such agreements and transactions in accordance with general industry guidelines and practices. The value of the collateral is valued daily and the Company may require counterparties to deposit additional collateral or return collateral pledged, when appropriate. The carrying amounts of these agreements and transactions approximate fair value due to their short-term nature and the level of collateralization.
The Company pledges financial instruments owned to collateralize repurchase agreements. At September 30, 2015, on a settlement date basis, financial instruments owned of $170.7 million were pledged as collateral under repurchase agreements.
89
The counterparty has the right to repledge the collateral in connection with these transactions. These financial instruments owned have been pledged as collateral and have been parenthetically disclosed on the consolidated balance sheet.
In addition, as of September 30, 2015, the Company pledged settlement date securities owned of $843.5 million and securities received under reverse repurchase agreements of $84.3 million to cover collateral for tri-party repurchase agreements. For these securities, the counterparty does not have the right to sell or repledge the collateral.
At September 30, 2015, the Company has accepted collateral that it is permitted by contract or custom to sell or repledge. This collateral consists primarily of securities received in reverse repurchase agreements. The fair value of such collateral at September 30, 2015, was $396.6 million of which $315.3 million was used to cover securities sold short which are recorded in financial instruments sold, not yet purchased on the consolidated balance sheet. In the normal course of business, this collateral is used by the Company to cover financial instruments sold, not yet purchased and to obtain financing in the form of repurchase agreements. At September 30, 2015, substantially all of the above collateral had been delivered against financial instruments sold, not yet purchased or repledged by the Company to obtain financing.
Note 14 – Share-Based Compensation
Share-based compensation expense is included in ‘compensation and benefits’ in the consolidated income statements and totaled $3.6 million, $4.3 million and $9.3 million for the fiscal years ended September 30, 2015, 2014, and 2013, respectively.
Stock Option Plans
The Company sponsors a stock option plan for its directors, officers, employees and consultants. The 2013 Stock Option Plan, which was approved by the Company’s Board of Directors and shareholders, authorizes the Company to issue stock options covering up to 1.0 million shares of the Company’s common stock. As of September 30, 2015, there were 0.8 million shares authorized for future grant under this plan. Awards that expire or are canceled generally become available for issuance again under the plan. The Company settles stock option exercises with newly issued shares of common stock.
Fair value is estimated at the grant date based on a Black-Scholes-Merton option-pricing model using the following weighted-average assumptions:
Year Ended September 30, | ||||||||
2015 | 2014 | 2013 | ||||||
Expected stock price volatility | 28 | % | 34 | % | 35 | % | ||
Expected dividend yield | — | % | — | % | — | % | ||
Risk free interest rate | 0.66 | % | 0.80 | % | 0.37 | % | ||
Average expected life (in years) | 3.22 | 2.88 | 2.88 | |||||
Expected stock price volatility rates are primarily based on the historical volatility. The Company has not paid dividends in the past and does not currently expect to do so in the future. Risk free interest rates are based on the U.S. Treasury yield curve in effect at the time of grant for periods corresponding with the expected life of the option or award. The average expected life represents the estimated period of time that options or awards granted are expected to be outstanding, based on the Company’s historical share option exercise experience for similar option grants. The weighted average fair value of options issued during fiscal years ended September 30, 2015, 2014, and 2013 was $4.31, $4.48 and $4.21, respectively.
The following is a summary of stock option activity for the year ended September 30, 2015:
Shares Available for Grant | Number of Options Outstanding | Weighted Average Exercise Price | Weighted Average Grant Date Fair Value | Weighted Average Remaining Term (in years) | Aggregate Intrinsic Value ($ millions) | ||||||||||||||
Balances at September 30, 2014 | 913,500 | 1,578,056 | $ | 25.38 | $ | 11.58 | 4.16 | $ | 1.9 | ||||||||||
Granted | (91,000 | ) | 91,000 | $ | 20.54 | $ | 4.31 | ||||||||||||
Exercised | (316,048 | ) | $ | 11.87 | $ | 6.42 | |||||||||||||
Forfeited | — | (9,665 | ) | $ | 19.35 | $ | 4.83 | ||||||||||||
Expired | — | (45,359 | ) | $ | 27.92 | $ | 12.08 | ||||||||||||
Balances at September 30, 2015 | 822,500 | 1,297,984 | $ | 28.28 | $ | 12.37 | 4.24 | $ | 1.8 | ||||||||||
Exercisable at September 30, 2015 | 355,350 | $ | 37.93 | $ | 13.55 | 1.29 | $ | 0.9 | |||||||||||
90
The total compensation cost not yet recognized for non-vested awards of $6.5 million as of September 30, 2015 has a weighted-average period of 4.36 years over which the compensation expense is expected to be recognized. The total intrinsic value of options exercised during fiscal years 2015, 2014 and 2013 was $3.6 million, $1.8 million and $2.0 million, respectively.
The options outstanding as of September 30, 2015 broken down by exercise price are as follows:
Exercise Price | Number of Options Outstanding | Weighted Average Exercise Price | Weighted Average Remaining Term (in Years) | ||||||||||||
$ | — | - | $ | 5.00 | — | n/a | n/a | ||||||||
$ | 5.00 | - | $ | 10.00 | — | n/a | n/a | ||||||||
$ | 10.00 | - | $ | 15.00 | — | n/a | n/a | ||||||||
$ | 15.00 | - | $ | 20.00 | 220,525 | $ | 18.57 | 1.32 | |||||||
$ | 20.00 | - | $ | 25.00 | 168,000 | $ | 21.97 | 2.77 | |||||||
$ | 25.00 | - | $ | 30.00 | 720,000 | $ | 25.91 | 6.22 | |||||||
$ | 30.00 | - | $ | 35.00 | — | n/a | n/a | ||||||||
$ | 35.00 | - | $ | 40.00 | — | n/a | n/a | ||||||||
$ | 40.00 | - | $ | 45.00 | — | n/a | n/a | ||||||||
$ | 45.00 | - | $ | 50.00 | — | n/a | n/a | ||||||||
$ | 50.00 | - | $ | 55.00 | 189,459 | $ | 54.23 | 1.41 | |||||||
1,297,984 | $ | 28.28 | 4.24 | ||||||||||||
Restricted Stock Plan
The Company sponsors a restricted stock plan for its directors, officers and employees. The Company’s 2012 restricted stock plan, which was approved by the Company’s Board of Directors and shareholders, authorizes up to 1.5 million shares to be issued. As of September 30, 2015, 1.0 million shares were authorized for future grant under the restricted stock plan. Awards that expire or are canceled generally become available for issuance again under the plan. The Company utilizes newly issued shares of common stock to make restricted stock grants.
The following is a summary of restricted stock activity through September 30, 2015:
Shares Available for Grant | Number of Shares Outstanding | Weighted Average Grant Date Fair Value | Weighted Average Remaining Term (in years) | Aggregate Intrinsic Value ($ millions) | |||||||||||
Balances at September 30, 2014 | 1,096,325 | 229,851 | $ | 20.03 | 1.79 | $ | 4.0 | ||||||||
Granted | (126,148 | ) | 126,148 | $ | 21.16 | ||||||||||
Vested | (121,214 | ) | $ | 21.16 | |||||||||||
Forfeited | 4,742 | (4,742 | ) | $ | 18.24 | ||||||||||
Balances at September 30, 2015 | 974,919 | 230,043 | $ | 20.10 | 2.17 | $ | 5.7 | ||||||||
The total compensation cost not yet recognized of $3.2 million as of September 30, 2015 has a weighted-average period of 2.17 years over which the compensation expense is expected to be recognized. Compensation expense is amortized on a straight-line basis over the vesting period. Restricted stock grants are included in the Company’s total issued and outstanding common shares.
The Company and an executive of a wholly owned subsidiary mutually agreed to the executive’s retirement from employment as of July 1, 2013. As a result of the executive’s retirement from employment, the Company recorded compensation cost, related to the individual’s restricted stock, of $2.6 million during the fiscal year ended September 30, 2013.
91
Note 15 – Retirement Plans
Defined Benefit Retirement Plans
The Company has a qualified and a nonqualified noncontributory retirement plan, which are defined benefit plans that cover certain employees. The plans are closed to new employees and frozen with respect to all future benefit accruals, therefore no additional benefits accrue for active participants under the plans.
The following table presents changes in, and components of, the Company’s net liability for retirement costs as of and for the years ended September 30, 2015, 2014, and 2013, based on measurement dates of September 30, 2015, 2014, and 2013, respectively:
(in millions) | September 30, 2015 | September 30, 2014 | September 30, 2013 | ||||||||
Changes in benefit obligation: | |||||||||||
Benefit obligation, beginning of year | $ | 38.2 | $ | 37.5 | $ | 42.8 | |||||
Interest cost | 1.5 | 1.7 | 1.5 | ||||||||
Actuarial loss | 0.6 | 2.3 | (2.6 | ) | |||||||
Benefits paid | (3.2 | ) | (3.3 | ) | (4.2 | ) | |||||
Benefit obligation, end of year | 37.1 | 38.2 | 37.5 | ||||||||
Changes in plan assets: | |||||||||||
Fair value, beginning of year | 31.2 | 28.9 | 26.5 | ||||||||
Actual return | — | 2.9 | 3.7 | ||||||||
Employer contribution | 2.2 | 2.7 | 2.9 | ||||||||
Benefits paid | (3.2 | ) | (3.3 | ) | (4.2 | ) | |||||
Fair value, end of year | 30.2 | 31.2 | 28.9 | ||||||||
Funded status | $ | (6.9 | ) | $ | (7.0 | ) | $ | (8.6 | ) | ||
The Company is required to recognize the funded status of its defined benefit pension plans measured as the difference between plan assets at fair value and the projected benefit obligation on the consolidated balance sheets as of September 30, 2015 and 2014, and to recognize changes in the funded status, that arise during the periods but are not recognized as components of net periodic pension cost, within accumulated other comprehensive loss, net of tax. Amounts recognized in the consolidated balance sheets consist of $0.5 million and $0.7 million included in ‘other assets’ as of September 30, 2015 and 2014, respectively, and $7.4 million and $7.7 million included in ‘accounts payable and other accrued liabilities’ as of September 30, 2015 and 2014, respectively.
Accumulated other comprehensive loss, net of tax, includes amounts for actuarial losses in the amount of $4.8 million and $3.6 million as of September 30, 2015 and 2014, respectively. The estimated net loss for the defined benefit pension plans that will be amortized from accumulated other comprehensive loss into net periodic pension cost during fiscal 2016 is $0.4 million.
The following table displays the Company’s defined benefit plans that have accumulated benefit obligations and projected benefit obligations in excess of the fair value of plans assets (underfunded ABO) as of September 30, 2015 and 2014:
(in millions) | September 30, 2015 | September 30, 2014 | |||||
Accumulated benefit obligations | $ | 37.1 | $ | 38.2 | |||
Projected benefit obligations | $ | 37.1 | $ | 38.2 | |||
Plan assets | $ | 30.2 | $ | 31.2 | |||
The defined benefit obligations were based upon annual measurement dates of September 30, 2015 and 2014. The following weighted-average assumptions were used to determine benefit obligations in the accompanying consolidated balance sheets as of September 30, 2015 and 2014:
September 30, 2015 | September 30, 2014 | ||
Weighted average assumptions: | |||
Discount rate | 4.25% | 4.15% | |
Expected return on assets | 5.94% | 6.00% | |
92
The following weighted-average assumptions were used to determine net periodic pension cost for the years ended September 30, 2015, 2014, and 2013:
Year Ended September 30, | |||||
2015 | 2014 | 2013 | |||
Weighted average assumptions: | |||||
Discount rate | 4.15% | 4.60% | 3.80% | ||
Expected return on assets | 6.00% | 7.00% | 7.00% | ||
To account for the defined benefit pension plans in accordance with the guidance in the Compensation – Retirement Benefits Topic of the ASC the Company makes two main determinations at the end of each fiscal year. These determinations are reviewed annually and updated as necessary, but nevertheless, are subjective and may vary from actual results.
First, the Company must determine the actuarial assumption for the discount rate used to reflect the time value of money in the calculation of the projected benefit obligations for the end of the current fiscal year and to determine the net periodic pension cost for the subsequent fiscal year. The objective of the discount rate assumption is to reflect the interest rate at which pension benefits could be effectively settled. In making this determination, the Company considers the timing and amount of benefits that would be available under the plans. The discount rates as of September 30, 2015, 2014, and 2013 were based on a model portfolio of high-quality fixed-income debt instruments with durations that are consistent with the expected cash flows of the benefit obligations.
Second, the Company must determine the expected long-term rate of return on assets assumption that is used to determine the expected return on plan assets component of the net periodic pension cost for the subsequent period. The expected long-term rate of return on asset assumption was determined, with the assistance of the Company’s investment consultants, based on a variety of factors. These factors include, but are not limited to, the plan’s asset allocations, a review of historical capital market performance, historical plan performance, current market factors such as inflation and interest rates, and a forecast of expected future asset returns. The Company reviews this long-term assumption on an annual basis.
As a result of the defined benefit plans having a frozen status, no additional benefits will be accrued for active participants under the plan, and accordingly no assumption will be made for the rate of increase in compensation levels in the future.
The components of net periodic pension cost recognized in the consolidated income statements for the years ended September 30, 2015, 2014, and 2013 were as follows:
Year Ended September 30, | |||||||||||
(in millions) | 2015 | 2014 | 2013 | ||||||||
Interest cost | $ | 1.5 | $ | 1.7 | $ | 1.5 | |||||
Less expected return on assets | (1.8 | ) | (2.0 | ) | (1.8 | ) | |||||
Net amortization and deferral | 0.3 | 0.2 | 0.8 | ||||||||
Net periodic pension cost | $ | — | $ | (0.1 | ) | $ | 0.5 | ||||
Other changes in plan assets and benefit obligations recognized in other comprehensive income for the years ended September 30, 2015 and 2014 were as follows:
Year Ended September 30, | |||||||
(in millions) | 2015 | 2014 | |||||
Net (gain) loss | $ | 2.4 | $ | 1.4 | |||
Amortization of loss | (0.3 | ) | (0.2 | ) | |||
Total recognized in other comprehensive income | 2.1 | 1.2 | |||||
Total recognized in net periodic benefit cost and other comprehensive income | $ | 2.1 | $ | 1.1 | |||
Plan Assets
The following table sets forth the actual asset allocation as of September 30, 2015 and 2014, and the target asset allocation for the Company’s plan assets:
September 30, 2015 | September 30, 2014 | Target Asset Allocation | |||
Equity securities | 33% | 34% | 35% | ||
Debt securities | 67% | 66% | 65% | ||
Total | 100% | 100% | |||
93
The long-term goal for equity exposure and for fixed income exposure is presented above. The exact allocation at any point in time is at the discretion of the investment manager, but should recognize the need to satisfy both the volatility and the rate of return objectives for equity exposure and satisfy the objective of preserving capital for the fixed income exposure.
The investment philosophy of the Company’s pension plans reflect that over the long-term, the risk of owning equities has been and should continue to be rewarded with a greater return than that available from fixed income investments. The primary objective is for the plan to achieve a rate of return sufficient to fully fund the pension obligation without assuming undue risk.
Investments in the Company’s pension plans include debt and equity securities. The fair value of plan assets is based upon the fair value of the underlying investments, which include cash equivalents, common stock, U.S. government securities and federal agency obligations, municipal and corporate bonds, and equity funds. Cash equivalents consist of short-term money market funds that are stated at cost, which approximates fair value. The shares of common stock, U.S. government securities and federal agency obligations, municipal and corporate bonds are stated at estimated fair value based upon quoted market prices, if available, or dealer quotes. The equity funds are investment vehicles valued using the net asset value (“NAV”) provided by the administrator of the fund. The NAV is based on the underlying assets owned by the fund, minus its liabilities, and then divided by the number of shares outstanding.
The methods described above may produce a fair value calculation that may not be indicative of net realizable value or reflective of future fair values. Furthermore, while the Company believes the valuation methods are appropriate and consistent with other market participants, the use of different methodologies or assumptions to determine the fair value of certain financial instruments could result in a different fair value measurement at the reporting date.
Equity securities did not include any INTL FCStone Inc. common stock as of September 30, 2015 and 2014, respectively.
The following tables summarize the Company’s pension assets, excluding cash held in the plan, by major category of plan assets measured at fair value on a recurring basis (at least annually) as of September 30, 2015 and 2014. For additional information and a detailed description of each level within the fair value hierarchy, see Note 3.
September 30, 2015 | |||||||||||||||
(in millions) | Level 1 | Level 2 | Level 3 | Total | |||||||||||
Assets: | |||||||||||||||
Cash equivalents | $ | — | $ | 0.6 | $ | — | $ | 0.6 | |||||||
Fixed income: | |||||||||||||||
Government and agencies | — | — | — | — | |||||||||||
Collective funds: | |||||||||||||||
Fixed income | — | 19.5 | — | 19.5 | |||||||||||
Equities | — | 9.5 | — | 9.5 | |||||||||||
Real estate | — | 0.6 | — | 0.6 | |||||||||||
Total | $ | — | $ | 30.2 | $ | — | $ | 30.2 | |||||||
September 30, 2014 | |||||||||||||||
(in millions) | Level 1 | Level 2 | Level 3 | Total | |||||||||||
Assets: | |||||||||||||||
Cash equivalents | $ | — | $ | 1.0 | $ | — | $ | 1.0 | |||||||
Fixed income: | |||||||||||||||
Government and agencies | — | — | — | — | |||||||||||
Collective funds: | |||||||||||||||
Fixed income | — | 19.6 | — | 19.6 | |||||||||||
Equities | — | 10.0 | — | 10.0 | |||||||||||
Real estate | — | 0.6 | — | 0.6 | |||||||||||
Total | $ | — | $ | 31.2 | $ | — | $ | 31.2 | |||||||
Cash equivalents are mostly comprised of short-term money market instruments and the valuation is based on inputs derived from observable market data of related assets.
Fixed Income: These securities primarily include debt issued by the U.S. Department of Treasury and securities issued or backed by U.S. government sponsored entities and municipal bonds. These investments are valued utilizing a market approach that includes various valuation techniques and sources such as, broker quotes in active and non-active markets, benchmark
94
yields and securities, reported trades, issuer spreads, and/or other applicable reference data and are generally classified within Level 2.
Collective Funds: These collective investment funds are unregistered investment vehicles that invest in portfolios of stock, bonds, or other securities. The fair value of these investments is based on the NAV of the units held in the respective funds. As no redemption restrictions or other features are noted that require adjustment to NAV. These funds are classified as Level 2 investments.
The Company expects to contribute $2.1 million to the pension plans during fiscal 2016, which represents the minimum funding requirement. However, the Company is currently determining what voluntary pension plan contributions, if any, will be made in fiscal 2016.
The following benefit payments, which reflect expected future service, are expected to be paid:
(in millions) | |||
Year ending September 30, | |||
2016 | $ | 3.2 | |
2017 | 2.9 | ||
2018 | 2.0 | ||
2019 | 1.9 | ||
2020 | 1.9 | ||
2021 - 2025 | 9.4 | ||
$ | 21.3 | ||
Defined Contribution Retirement Plans
U.K. based employees of INTL FCStone are eligible to participate in a defined contribution pension plan. The Company contributes double the employee’s contribution up to 10% of total base salary for this plan. For this plan, employees are 100% vested in both the employee and employer contributions at all times.
The Company offers participation in the INTL FCStone Inc. 401(k) Plan (“401(k) Plan”), a defined contribution plan providing retirement benefits, to all domestic employees who have reached 21 years of age, and provided four months of service to the Company. Employees may contribute from 1% to 80% of their annual compensation to the 401(k) Plan, limited to a maximum annual amount as set periodically by the Internal Revenue Service. The Company makes matching contributions to the 401(k) Plan in an amount equal to 62.5% of each participant’s eligible elective deferral contribution to the 401(k) Plan, up to 8% of employee compensation. Matching contributions vest, by participant, based on the following years of service schedule: less than two years – none, after two years – 33%, after three years – 66%, and after four years – 100%.
For fiscal years ended September 30, 2015, 2014, and 2013, the Company’s contribution to these defined contribution plans were $5.1 million, $4.1 million and $4.0 million, respectively.
Note 16 – Other Expenses
Other expenses for the years ended September 30, 2015, 2014, and 2013 are comprised of the following:
Year Ended September 30, | |||||||||||
(in millions) | 2015 | 2014 | 2013 | ||||||||
Contingent consideration, net(1) | 1.8 | (2.0 | ) | 3.0 | |||||||
Insurance | 1.7 | 1.6 | 1.7 | ||||||||
Advertising, meetings and conferences | 2.7 | 3.1 | 2.3 | ||||||||
Non-trading hardware and software maintenance and software licensing | 4.7 | 3.8 | 2.8 | ||||||||
Office supplies and printing | 1.2 | 1.1 | 1.2 | ||||||||
Other clearing related expenses | 1.1 | 1.2 | 1.6 | ||||||||
Other non-income taxes | 3.7 | 3.9 | 3.8 | ||||||||
Other | 6.6 | 5.7 | 6.7 | ||||||||
Total other expenses | $ | 23.5 | $ | 18.4 | $ | 23.1 | |||||
(1) Contingent consideration includes remeasurement of contingent liabilities related to business combinations accounted for in accordance with the provisions of the Business Combinations Topic of the ASC (see Note 3).
95
Note 17 – Income Taxes
Income tax expense (benefit) for the years ended September 30, 2015, 2014, and 2013 was allocated as follows:
Year Ended September 30, | |||||||||||
(in millions) | 2015 | 2014 | 2013 | ||||||||
Income tax expense attributable to income from continuing operations | $ | 22.4 | $ | 6.4 | $ | 2.6 | |||||
Income tax (benefit) expense attributable to loss from discontinued operations | — | (0.2 | ) | 0.7 | |||||||
Taxes allocated to stockholders’ equity, related to unrealized gains (losses) on available-for-sale securities | (0.4 | ) | 0.1 | (1.6 | ) | ||||||
Taxes allocated to stockholders’ equity, related to pension liabilities | (0.8 | ) | (0.5 | ) | 1.8 | ||||||
Taxes allocated to additional paid-in capital, related to share-based compensation | (0.5 | ) | 0.1 | — | |||||||
Total income tax expense | $ | 20.7 | $ | 5.9 | $ | 3.5 | |||||
The components of the provision for income taxes attributable to income from continuing operations were as follows:
Year Ended September 30, | |||||||||||
(in millions) | 2015 | 2014 | 2013 | ||||||||
Current taxes: | |||||||||||
U.S. federal | $ | 0.8 | $ | 0.5 | $ | (1.7 | ) | ||||
U.S. State and local | 1.2 | — | (1.4 | ) | |||||||
International | 15.4 | 11.6 | 13.4 | ||||||||
Total current taxes | 17.4 | 12.1 | 10.3 | ||||||||
Deferred taxes | 5.0 | (5.7 | ) | (7.7 | ) | ||||||
Income tax expense | $ | 22.4 | $ | 6.4 | $ | 2.6 | |||||
U.S. and international components of (loss) income from continuing operations, before income taxes, was as follows:
Year Ended September 30, | |||||||||||
(in millions) | 2015 | 2014 | 2013 | ||||||||
U.S. | $ | 14.5 | $ | (13.0 | ) | $ | (23.3 | ) | |||
International | 63.7 | 39.0 | 44.5 | ||||||||
Income from continuing operations, before tax | $ | 78.2 | $ | 26.0 | $ | 21.2 | |||||
Items accounting for the difference between income taxes computed at the federal statutory rate and the provision for income taxes were as follows:
Year Ended September 30, | ||||||||
2015 | 2014 | 2013 | ||||||
Federal statutory rate effect of: | 35.0 | % | 35.0 | % | 35.0 | % | ||
U.S. State and local income taxes | 1.8 | % | — | % | 0.7 | % | ||
Foreign earnings taxed at lower rates | (10.1 | )% | (14.7 | )% | (21.6 | )% | ||
Change in foreign valuation allowance | (0.1 | )% | 1.9 | % | (0.2 | )% | ||
Change in state valuation allowance | 0.6 | % | (0.2 | )% | (8.1 | )% | ||
Tax impact of U.S. State and local rate change | — | % | — | % | (2.6 | )% | ||
Uncertain tax positions | — | % | (0.5 | )% | (0.3 | )% | ||
U.S. permanent items | 0.5 | % | 1.9 | % | 3.9 | % | ||
Foreign permanent items | 1.1 | % | 7.0 | % | 4.6 | % | ||
Other reconciling items | (0.1 | )% | (5.7 | )% | 1.7 | % | ||
Effective rate | 28.7 | % | 24.7 | % | 13.1 | % | ||
96
The components of deferred income tax assets and liabilities were as follows:
(in millions) | September 30, 2015 | September 30, 2014 | |||||
Deferred tax assets: | |||||||
Share-based compensation | $ | 3.2 | $ | 2.8 | |||
Pension liability | 2.7 | 2.7 | |||||
Deferred compensation | 2.3 | 2.1 | |||||
Foreign net operating loss carryforwards | 2.3 | 2.3 | |||||
U.S. State and local net operating loss carryforwards | 4.3 | 5.1 | |||||
U.S. federal net operating loss carryforwards | 8.6 | 14.4 | |||||
Intangible assets | 4.6 | 5.3 | |||||
Capital loss carryforwards | 0.2 | 0.6 | |||||
Bad debt reserve | 2.4 | 0.8 | |||||
Tax Credit Carryforwards | 1.0 | 0.5 | |||||
Other compensation | 1.9 | 1.9 | |||||
Other | 1.3 | 1.5 | |||||
Total gross deferred tax assets | 34.8 | 40.0 | |||||
Less valuation allowance | (3.2 | ) | (2.8 | ) | |||
Deferred tax assets | 31.6 | 37.2 | |||||
Deferred income tax liabilities: | |||||||
Unrealized gain on securities | 1.0 | 1.3 | |||||
Prepaid expenses | 1.1 | 1.2 | |||||
Fixed assets | 1.3 | 2.7 | |||||
Deferred income tax liabilities | 3.4 | 5.2 | |||||
Deferred income taxes, net | $ | 28.2 | $ | 32.0 | |||
Deferred income tax balances reflect the effects of temporary differences between the carrying amounts of assets and liabilities and their tax bases and are stated at enacted tax rates expected to be in effect when taxes are actually paid or recovered.
As of September 30, 2015 and 2014, the Company has net operating loss carryforwards for U.S. federal, state, local, and foreign income tax purposes of $12.0 million and $19.0 million, net of valuation allowances, respectively, which are available to offset future taxable income in these jurisdictions. The U.S. federal net operating loss carryforward of $8.6 million begins to expire after September 2033. The state and local net operating loss carryforwards of $3.4 million, net of valuation allowance, begin to expire after September 2020. The Company has an Alternative Minimum Tax credit carryforward of $0.9 million, which has an indefinite life.
The valuation allowance for deferred tax assets as of September 30, 2015 was $3.2 million. The net change in the total valuation allowance for the year ended September 30, 2015 was an increase of $0.4 million. The valuation allowances as of September 30, 2015 and 2014 were primarily related to U.S. state and local and foreign net operating loss carryforwards that, in the judgment of management, are not more likely than not to be realized. In assessing the realizability of deferred tax assets, management considers whether it is more likely than not that some or all of the deferred tax assets will not be realized.
The Company incurred U.S. federal, state, and local taxable income/(losses) for the years ended September 30, 2015, 2014, and 2013 of $17.7 million, $(18.4) million, and $(24.5) million, respectively. There are no significant differences between actual levels of past taxable income and the results of continuing operations, before income taxes in these jurisdictions. U.S. federal, state, and local taxable losses incurred during the year ended September 30, 2013 were attributable to a decrease in exchange-traded and OTC derivative transactional volumes and revenue caused by consecutive droughts in the U.S., as well as losses incurred in the physical base metals business. During 2013, the Company elected to pursue an exit of its physical base metals business through an orderly liquidation of open positions, which was completed during fiscal 2014. When evaluating if U.S. federal, state, and local deferred taxes are realizable, the Company considered deferred tax liabilities of $2.4 million that are scheduled to reverse from 2016 to 2019 and $1.0 million of deferred tax liabilities associated with unrealized gains in securities which the Company could sell, if necessary. Furthermore, the Company considered its ability to implement business and tax planning strategies that would allow the remaining U.S. federal, state, and local deferred tax assets, net of valuation allowances, to be realized within 10 years. Based on the tax planning strategies that can be implemented, management believes that it is
97
more likely than not that the Company will realize the tax benefit of the deferred tax assets, net of the existing valuation allowance, in the future.
The total amount of undistributed earnings in the Company’s foreign subsidiaries, for income tax purposes, was $227.2 million and $175.1 million as of September 30, 2015 and 2014, respectively. It is the Company’s current intention to reinvest undistributed earnings of its foreign subsidiaries in the foreign jurisdictions, resulting in the indefinite postponement of the remittance of those earnings. Accordingly, no provision has been made for foreign withholding taxes or U.S. federal income taxes which may become payable if undistributed earnings of foreign subsidiaries were paid as dividends to the Company.
The Company recognizes the tax benefit from an uncertain tax position only if it is more likely than not that the tax position will be sustained on examination by the taxing authority, based upon the technical merits of the position. The tax benefit recognized in the consolidated financial statements from such a position is measured based on the largest benefit that has a greater than 50% likelihood of being realized upon ultimate settlement.
A reconciliation of the beginning and ending amount of unrecognized tax benefits is as follows:
Year Ended September 30, | |||||||||||
(in millions) | 2015 | 2014 | 2013 | ||||||||
Balance, beginning of year | $ | — | $ | 0.1 | $ | 0.5 | |||||
Gross increases for tax positions related to current year | — | — | 0.1 | ||||||||
Gross increases for tax positions related to prior years | — | — | — | ||||||||
Gross decreases for tax positions of prior years | — | (0.1 | ) | (0.2 | ) | ||||||
Settlements | — | — | (0.2 | ) | |||||||
Lapse of statute of limitations | — | — | (0.1 | ) | |||||||
Balance, end of year | $ | — | $ | — | $ | 0.1 | |||||
The Company has a minimal balance of uncertain tax benefits as of September 30, 2015, that, if recognized, would affect the effective tax rate. While it is expected that the amount of unrecognized tax benefits will change in the next twelve months, the Company does not expect this change to have a material impact on the results of operations or the financial position of the Company.
Accrued interest and penalties are included in the related tax liability line in the consolidated balance sheets. The Company had no accrued interest, net of federal benefit, and penalties included in the consolidated balance sheets as of September 30, 2015 and 2014.
The Company recognizes accrued interest and penalties related to income taxes as a component of income tax expense. The Company had no amount of interest, net of federal benefit, and penalties recognized as a component of income tax expense during the year ended September 30, 2015. During the years ended September 30, 2014 and 2013, the amount of interest, net of federal benefit, and penalties recognized as a component of income tax expense was $0.0 million and $(0.2) million, respectively.
The Company and its subsidiaries file income tax returns with the U.S. federal jurisdiction and various U.S. state and local and foreign jurisdictions. The Company has open tax years ranging from September 30, 2008 through September 30, 2015 with U.S. federal and state and local taxing authorities. In the U.K., the Company has open tax years ending September 30, 2014 to September 30, 2015. In Brazil, the Company has open tax years ranging from December 31, 2010 through December 31, 2014. In Argentina, the Company has open tax years ranging from September 30, 2008 to September 30, 2015. The Company’s U.S. net operating loss carryback claim is being reviewed by the Joint Committee of Taxation. The Company expects to receive a full refund. The Company settled their state examination in 2015 with no material adjustments.
Note 18 – Acquisitions and Disposals
Acquisitions in Fiscal 2015
The Company’s consolidated financial statements include the operating results of the acquired businesses from the dates of acquisition. The total amount of goodwill and intangible assets, in connection with the current year acquisition, that is expected to be deductible for tax purposes is $1.6 million as of September 30, 2015.
98
G.X. Clarke & Co.
Effective January 1, 2015, the Company acquired all of the partnership interests of G.X. Clarke & Co., an SEC registered institutional dealer in fixed income securities. G.X. Clarke is based in New Jersey, transacts in U.S. Treasury, U.S. government agency and agency mortgage-backed securities, and is a FINRA member with an institutional client base consisting of asset managers, commercial bank trust and investment departments, broker-dealers, and insurance companies. The purchase price payable by the Company is equal to G.X. Clarke's net tangible book value at closing of approximately $25.9 million plus a premium of $1.5 million, and up to an additional $1.5 million over the next three years, subject to the achievement of certain profitability thresholds. In conjunction with the acquisition, the name of G.X. Clarke was changed to INTL FCStone Partners L.P.
The acquisition agreement includes the purchase of certain tangible assets and assumption of certain liabilities. For the acquisition, management made an initial fair value estimate of the assets acquired and liabilities assumed as of January 1, 2015. The Company believes that due to the short-term nature of many of the tangible assets acquired and liabilities assumed, that their carrying values, as included in the historical financial statements of G.X. Clarke, approximate their fair values. The Company finalized its purchase accounting estimates with the assistance of a third-party valuation expert. The portion of the purchase price representing the initial premium of $1.5 million and the contingent consideration of $0.1 million has been assigned to the customer base and software programs/platforms intangible assets (see Note 9). The Company has assigned useful lives of 5 years for the customer base and software programs/platforms intangible assets.
As part of the net cash paid, the Company and G.X. Clarke established two escrow accounts totaling $10.0 million, related to an Adjustment Escrow and Indemnity Escrow. The Adjustment Escrow, of $5.0 million, related to potential purchase price adjustment obligations was released, during year ended September 30, 2015, upon determination of the final tangible book value of net assets of G.X. Clarke. The Indemnity Escrow, of $5.0 million, relates to potential claims made by the Company for indemnification in accordance with the terms of the acquisition agreement and is to be released immediately following the twenty-four month anniversary of the closing date of the acquisition. The remaining escrow balance is included in ‘other assets’ in the consolidated balance sheet.
In addition, as part of the net cash paid for the acquisition, the Company has deferred payment of $5.0 million, in accordance with the terms of the acquisition agreement. The deferred payment shall be equal to $5.0 million less the aggregate net loss, if any, incurred for the twelve full fiscal quarters commencing after the closing date. The deferred payment amount shall be due and payable shortly after the twelfth full fiscal quarter commencing after the closing date. The deferred payment is included in ‘accounts payable and other accrued liabilities’ in the consolidated balance sheet.
As discussed above, the terms of the acquisition agreement include a contingent payment of an additional purchase price of up to $1.5 million, based on the performance of the acquired business. The contingent consideration, which in no event shall exceed $1.5 million, is expected to be paid in two payments. The first payment is expected to occur after the first four full fiscal quarters commencing after the closing date. This payment is estimated to be $0.5 million, if the acquired business generates at least $5.0 million in after-tax net income over the first four full fiscal quarters after the closing date. The second and final payment is expected to occur after the twelfth full fiscal quarter commencing after the closing date. This payment is estimated to be $1.0 million, if the acquired business has generated accumulated after-tax net income of greater than $30.0 million over the twelve full fiscal quarters commencing after the closing date.
Effective July 1, 2015, the Company merged three of its regulated U.S. subsidiaries, including INTL FCStone Partners L.P., into INTL FCStone Securities, and the surviving entity was renamed INTL FCStone Financial, and is dually registered as a broker-dealer and a futures commission merchant.
Per ASC 805-10-50-2 and S-X Rule 10-01(b)(4) pro forma results of operations for revenues, net income and net income per share are to be presented for the current year, up to the end of the current quarter and for the comparable period of the preceding year, as though the companies had been combined at the beginning of the period being reported on.
The following unaudited pro forma information presents a summary of the consolidated results of operations for the Company as if the acquisition had occurred on October 1, 2013. The unaudited pro forma consolidated results of operations are based on the Company’s historical financial statements and those of G.X. Clarke and do not necessarily indicate the results of operations that would have resulted had the acquisition actually been completed at the beginning of the applicable period presented. The pro forma results reflect the business combination accounting effects from the acquisition including adjusting for non-recurring interest expense on subordinated debt incurred by G.X. Clarke, acquisition related expenses incurred by the Company and G.X. Clarke, and income taxes of G.X. Clarke, which was treated as a partnership for U.S. federal income tax purposes prior to the acquisition.
99
The unaudited pro forma consolidated results are not indicative of the results of operations in future periods.
Proforma Results of Operations: | Year Ended September 30, 2015 | Year Ended September 30, 2014 | |||||||||||||||||||
(in millions, except per share amounts) | INTL FCStone Inc.(1) | G.X. Clarke(2) | Combined | INTL FCStone Inc. | G.X. Clarke | Combined | |||||||||||||||
Operating revenues | $ | 624.3 | 8.7 | $ | 633.0 | $ | 490.9 | 41.9 | $ | 532.8 | |||||||||||
Net income | $ | 55.7 | 0.7 | $ | 56.4 | $ | 19.3 | 5.1 | $ | 24.4 | |||||||||||
Basic earnings per share | $ | 2.94 | 0.04 | $ | 2.98 | $ | 1.01 | 0.27 | $ | 1.28 | |||||||||||
Diluted earnings per share | $ | 2.87 | 0.04 | $ | 2.91 | $ | 0.98 | 0.27 | $ | 1.25 | |||||||||||
(1) Includes the amounts of the acquired business from January 1, 2015. The amounts of revenues and earnings of the acquired business since the acquisition date included in the consolidated income statement were $31.4 million and $4.3 million, respectively.
(2) Consists of the amounts for G.X. Clarke for the three months ended December 31, 2014.
Acquisition in Fiscal 2014
The Company’s consolidated financial statements include the operating results of the acquired businesses from the dates of acquisition. The total amount of goodwill and intangible assets, in connection with the fiscal 2014 acquisition, that is deductible for tax purposes is $0.3 million as of September 30, 2015.
Forward Insight Commodities LLC
In an acquisition agreement dated April 2, 2014, the Company’s wholly owned subsidiary, FCStone Group, Inc. (“FCG”), agreed to acquire all of the outstanding member interests of Forward Insight Commodities, LLC (“FIC”). FIC was a brokerage firm focused on the structuring and execution of transactions in the energy derivative space.
The consideration paid for the acquisition consisted of contingent payments based on the pre-tax earnings of the business for the twelve month period following the acquisition and was estimated to be $0.5 million as of the acquisition date. The purchase price for the acquisition was not material to the consolidated financial statements. The intangible assets recognized in this transaction of $0.5 million were assigned to the Clearing and Execution Services segment and were amortized over a 12 month useful life.
Acquisitions in Fiscal 2013
The Company’s consolidated financial statements include the operating results of the acquired businesses from the dates of acquisition. The total amount of goodwill and intangible assets, in connection with these acquisitions, that is expected to be deductible for tax purposes is $4.7 million as of September 30, 2015.
Tradewire
In December 2012, the Company acquired certain institutional accounts from Tradewire Securities, LLC (“Tradewire Securities”), a Miami-based securities broker-dealer servicing customers throughout Latin America and a wholly owned subsidiary of Tradewire Group Ltd. These accounts were transferred to INTL FCStone Inc.’s broker-dealer subsidiary, INTL FCStone Securities. As part of the transaction, the Company hired more than 20 professional staff from Tradewire Securities’ securities broker-dealer business based in Miami, Florida. These professionals provide global brokerage services to a wide range of customers, including hedge funds, pension funds, broker-dealers and banks located in Latin America, the Caribbean, North America and Europe.
The consideration to be paid for the acquisition of institutional accounts from Tradewire Securities consists of three annual contingent payments and a final contingent payment and the original estimated present value was estimated to be $5.6 million as of the acquisition date. The purchase price for the acquisition is not expected to be material to the consolidated financial statements. The present value of the estimated total purchase price, including contingent consideration, is $4.4 million (see Note 11). The Company obtained a third-party valuation of the intangible assets and contingent liabilities, and allocated the purchase costs among identified intangible assets with determinable useful lives and goodwill. The goodwill and intangible asset recognized in this transaction of $2.8 million and $2.8 million, respectively, were assigned to the Securities segment. The intangible asset is being amortized over a 10 year useful life.
100
Disposals in Fiscal 2013
Gletir Agente De Valores S.A.
On February 28, 2013, the Company, through its subsidiaries INTL Netherlands B.V. and Gainvest Asset Management Ltda, entered into an agreement to sell all of its ownership interest in another subsidiary, Gletir Agente De Valores S.A. (“Gletir Agente”), to Gletir Financial Corp (the “Purchaser”). The Company sold the capital stock of Gletir Agente for $0.8 million. Gletir Agente had net assets of $0.6 million, which included $0.1 million of AOCI related to foreign currency translation, included in the consolidated balance sheet of the Company, at the time of the sale. The gain resulting from the sale price less the carrying amount of the net assets and the gain from the AOCI balance were recorded as components of other income on the consolidated income statement for the fiscal year ended ended September 30, 2013.
Note 19 – Accumulated Other Comprehensive Income (Loss)
Comprehensive income consists of net income and other gains and losses affecting stockholders’ equity that, under U.S. GAAP, are excluded from net income. Other comprehensive income (loss) includes net actuarial losses from defined benefit pension plans, unrealized gains on available-for-sale securities, and gains and losses on foreign currency translations.
The following table summarizes the changes in accumulated other comprehensive income (loss) for the year ended September 30, 2015.
(in millions) | Foreign Currency Translation Adjustment | Pension Benefits Adjustment | Unrealized Gain or Loss on Available-for-Sale Securities | Accumulated Other Comprehensive Loss | ||||||||||||
Balances as of September 30, 2014 | $ | (8.7 | ) | $ | (3.5 | ) | $ | 0.6 | $ | (11.6 | ) | |||||
Other comprehensive income (loss), net of tax before reclassifications | (4.0 | ) | (1.5 | ) | 2.7 | (2.8 | ) | |||||||||
Amounts reclassified from AOCI, net of tax | — | 0.2 | (3.3 | ) | (3.1 | ) | ||||||||||
Other comprehensive income (loss), net of tax | (4.0 | ) | (1.3 | ) | (0.6 | ) | (5.9 | ) | ||||||||
Balances as of September 30, 2015 | $ | (12.7 | ) | $ | (4.8 | ) | $ | — | $ | (17.5 | ) | |||||
In connection with the internal merger of wholly owned U.S. subsidiaries (see note 18), the Company transferred its remaining available-for-sale of securities to the trading category on July 1, 2015. The transfer resulted in $3.3 million, net of tax of $2.0 million, of unrealized gains not previously recognized in earnings recorded on the consolidated income statement for the year ended September 30, 2015.
Note 20 – Discontinued Operations
Exit of Physical Base Metals Business
During fiscal 2013, the Company began an exit of its physical base metals business through the sale and orderly liquidation of then-current open positions. The exit of the physical base metals business was substantially completed by the end of fiscal 2013, including the termination of the physical base metals trading team and certain operational support personnel. The remaining open contract positions were fulfilled during fiscal 2014. Under existing accounting guidance, before the implementation of ASU 2014-08, the Company reclassified the physical base metals activities in the financial statements as discontinued operations for all periods presented. The Company continues to operate the portion of its base metals business related to non-physical assets, conducted primarily through the London Metals Exchange.
Summarized below are the components of the Company’s (loss) income from discontinued operations for the years ended September 30, 2015, 2014, and 2013:
Year Ended September 30, | |||||||||||
(in millions) | 2015 | 2014 | 2013 | ||||||||
Total revenues from discontinued operations | $ | — | $ | 40.9 | $ | 1,275.0 | |||||
Total cost of sales of physical commodities from discontinued operations | — | 40.2 | 1,264.7 | ||||||||
Operating revenues | $ | — | $ | 0.7 | $ | 10.3 | |||||
(Loss) income from discontinued operations before income taxes | $ | — | $ | (0.5 | ) | $ | 1.4 | ||||
Income tax benefit (expense) | — | 0.2 | (0.7 | ) | |||||||
(Loss) income from discontinued operations, net of tax | $ | — | $ | (0.3 | ) | $ | 0.7 | ||||
101
Note 21 – Quarterly Financial Information (Unaudited)
The Company has set forth certain quarterly unaudited financial data for the past two years in the tables below:
For the 2015 Fiscal Quarter Ended | |||||||||||||||
(in millions, except per share amounts) | September 30 | June 30 | March 31 | December 31 | |||||||||||
Total revenues | $ | 2,628.4 | $ | 3,995.1 | $ | 14,442.0 | $ | 13,627.7 | |||||||
Cost of sales of physical commodities | 2,449.7 | 3,843.5 | 14,285.5 | 13,490.2 | |||||||||||
Operating revenues | 178.7 | 151.6 | 156.5 | 137.5 | |||||||||||
Transaction-based clearing expenses | 31.3 | 30.2 | 31.8 | 29.4 | |||||||||||
Introducing broker commissions | 15.1 | 13.1 | 12.3 | 12.2 | |||||||||||
Interest expense | 5.0 | 4.9 | 4.5 | 2.7 | |||||||||||
Net operating revenues | 127.3 | 103.4 | 107.9 | 93.2 | |||||||||||
Compensation and other expenses | 98.1 | 86.2 | 89.8 | 79.6 | |||||||||||
Income from continuing operations, before tax | 29.2 | 17.2 | 18.1 | 13.6 | |||||||||||
Income tax expense | 8.1 | 5.0 | 5.1 | 4.2 | |||||||||||
Net income | $ | 21.1 | $ | 12.2 | $ | 13.0 | $ | 9.4 | |||||||
Net basic earnings per share | $ | 1.12 | $ | 0.64 | $ | 0.68 | $ | 0.50 | |||||||
Net diluted earnings per share | $ | 1.09 | $ | 0.62 | $ | 0.67 | $ | 0.49 | |||||||
For the 2014 Fiscal Quarter Ended | |||||||||||||||
(in millions, except per share amounts) | September 30 | June 30 | March 31 | December 31 | |||||||||||
Total revenues | $ | 10,655.7 | $ | 7,005.1 | $ | 8,452.9 | $ | 7,908.7 | |||||||
Cost of sales of physical commodities | 10,525.1 | 6,886.9 | 8,323.7 | 7,795.8 | |||||||||||
Operating revenues | 130.6 | 118.2 | 129.2 | 112.9 | |||||||||||
Transaction-based clearing expenses | 27.5 | 28.1 | 27.7 | 25.2 | |||||||||||
Introducing broker commissions | 13.9 | 11.6 | 12.8 | 11.6 | |||||||||||
Interest expense | 2.5 | 2.5 | 2.8 | 2.7 | |||||||||||
Net operating revenues | 86.7 | 76.0 | 85.9 | 73.4 | |||||||||||
Compensation and other expenses | 78.9 | 72.0 | 75.6 | 69.5 | |||||||||||
(Loss) income from continuing operations, before tax | 7.8 | 4.0 | 10.3 | 3.9 | |||||||||||
Income tax (benefit) expense | 2.0 | 0.3 | 2.6 | 1.5 | |||||||||||
Income from continuing operations | 5.8 | 3.7 | 7.7 | 2.4 | |||||||||||
(Loss) income from discontinued operations, net of tax | — | (0.2 | ) | (0.2 | ) | 0.1 | |||||||||
Net income | $ | 5.8 | $ | 3.5 | $ | 7.5 | $ | 2.5 | |||||||
Net basic earnings per share | $ | 0.30 | $ | 0.19 | $ | 0.39 | $ | 0.13 | |||||||
Net diluted earnings per share | $ | 0.29 | $ | 0.18 | $ | 0.39 | $ | 0.12 | |||||||
As discussed further in note 22, during fiscal year 2015, the Company transitioned the portion of its precious metals business conducted through its unregulated domestic subsidiary, INTL Commodities Inc., to its United Kingdom based broker-dealer subsidiary, INTL FCStone Ltd. Prior to the transfer, INTL Commodities Inc.’s precious metals sales and costs of sales were recorded on a gross basis in accordance with the Revenue Recognition Topic of the ASC. Subsequent to the transfer, INTL FCStone Ltd.’s precious metals sales and cost of sales are presented on a net basis and included as a component of ‘trading gains, net’ on the consolidated income statements, in accordance with U.S GAAP accounting requirements for broker-dealers. Precious metals sales and cost of sales for subsidiaries that are not broker-dealers continue to be recorded on a gross basis.
Note 22 – Segment and Geographic Information
The Company reports its operating segments based on services provided to customers. The Company’s business activities are managed as operating segments and organized into reportable segments as follows:
• | Commercial Hedging (includes components Financial Agricultural (Ag’s) & Energy and LME metals) |
• | Global Payments |
102
• | Securities (includes components Equity market-making, Debt Trading, Investment Banking, and Asset Management) |
• | Physical Commodities (includes components Precious metals and Physical Ag’s & Energy) |
• | Clearing and Execution Services (includes components Clearing and Execution Services and FX Prime Brokerage) |
Commercial Hedging
The Company serves its commercial clients through its team of risk management consultants, providing a high-value-added service that we believe differentiates it from its competitors and maximizes the opportunity to retain clients. The Company’s risk management consulting services are designed to quantify and monitor commercial entities’ exposure to commodity and financial risk. Upon assessing this exposure the Company develops a plan to control and hedge these risks with post-trade reporting against specific client objectives. Clients are assisted in the execution of their hedging strategies through a wide range of products from listed exchange-traded futures and options, to basic OTC instruments that offer greater flexibility, to structured OTC products designed for customized solutions.
The Company’s services span virtually all traded commodity markets, with the largest concentrations in agricultural and energy commodities (consisting primarily of grains, energy and renewable fuels, coffee, sugar, cotton, and food service) and base metals. The Company’s base metals business includes a position as a Category One ring dealing member of the LME, providing execution, clearing and advisory services in exchange-traded futures and OTC products. The Company also provides execution of foreign currency forwards and options as well as a wide range of structured product solutions to commercial clients who are seeking cost-effective hedging strategies. Generally, clients direct their own trading activity and the Company’s risk management consultants do not have discretionary authority to transact trades on behalf of clients.
Global Payments
The Company provides global payment solutions to banks and commercial businesses as well as charities and non-governmental organizations and government organizations. The Company offers payments services in over 130 countries, which it believes is more than any other payments solution provider, and provides competitive and transparent pricing. Through its technology platform, full-service electronic execution capability and commitment to customer service, the Company believes it is able to provide simple and fast execution, ensuring delivery of funds in any of these countries quickly through its global network of correspondent banks. In this business, the Company primarily acts as a principal in buying and selling foreign currencies on a spot basis. The Company derives revenue from the difference between the purchase and sale prices.
The Company believes its clients value the Company’s ability to provide exchange rates that are significantly more competitive than those offered by large international banks, a competitive advantage that stems from our years of foreign exchange expertise focused on smaller, less liquid currencies. Additionally, as a member of SWIFT (Society for Worldwide Interbank Financial Telecommunication), the Company is able to offer its services to large money center and global banks seeking more competitive international payments services.
Securities
The Company provides value-added solutions that facilitate cross-border trading. The Company believes its clients value the Company’s ability to manage complex transactions, including foreign exchange, utilizing its local understanding of market convention, liquidity and settlement protocols around the world. The Company’s clients include U.S.-based regional and national broker-dealers and institutions investing or executing customer transactions in international markets and foreign institutions seeking access to the U.S. securities markets. The Company is one of the leading market makers in foreign securities, including unlisted ADRs, GDRs and foreign ordinary shares. The Company makes markets in over 1,600 ADRs, GDRs and foreign ordinary shares , of which over 1,300 trade in the OTC market. In addition, it will, on request, make prices in more than 10,000 unlisted foreign securities. The Company is a broker-dealer in Argentina where we are active in providing institutional executions in the local capital markets.
Following the acquisition of G.X. Clarke, the Company acts as an institutional dealer in fixed income securities, including U.S. Treasury, U.S. government agency and agency mortgage-backed securities to a client base including asset managers, commercial bank trust and investment departments, broker-dealers and insurance companies.
The Company provides a full range of corporate finance advisory services to its middle market clients, including capital market solutions and a wide array of advisory services across a broad spectrum of industries. The Company’s advisory services span mergers and acquisitions, liability management, restructuring opinions and valuations. The Company also originates, structures and places a wide array of debt instruments in the international and domestic capital markets. These instruments include complex asset-backed securities (primarily in Argentina), unsecured bond and loan issues, negotiable notes and other trade-related debt instruments used in cross-border trade finance. On occasion, the Company may invest its own capital in debt instruments before selling them. The Company also actively trades in a variety of international debt instruments and operates an asset management business in which it earns fees, commissions and other revenues for management of third party assets and
103
investment gains or losses on its investments in funds and proprietary accounts managed either by its investment managers or by independent investment managers.
Physical Commodities
This segment consists of the Company’s physical precious metals trading and physical agricultural and energy commodity businesses. In precious metals, the Company provides a full range of trading and hedging capabilities, including OTC products, to select producers, consumers, and investors. In the Company’s trading activities, it acts as a principal, committing its own capital to buy and sell precious metals on a spot and forward basis.
The Company’s physical agricultural and energy commodity business provides financing to commercial commodity-related companies against physical inventories, including grain, lumber, meats, energy products and renewable fuels. The Company uses sale and repurchase agreements to purchase commodities evidenced by warehouse receipts, subject to a simultaneous agreement to sell such commodities back to the original seller at a later date. These transactions are accounted for as product financing arrangements, and accordingly no commodity inventory, purchases or sales are recorded. Additionally, the Company engages as a principal in physical purchase and sale transactions related to inputs to the renewable fuels and feed ingredient industries.
On April 10, 2015 (the “transfer date”), the Company transitioned the portion of its precious metals business conducted through its unregulated domestic subsidiary, INTL Commodities Inc., to its United Kingdom based broker-dealer subsidiary, INTL FCStone Ltd. INTL FCStone Ltd. is regulated by the Financial Conduct Authority (“FCA”), the regulator of the financial services industry in the United Kingdom. Subsequent to the transfer, precious metals inventory held by INTL FCStone Ltd. is measured at fair value, with changes in fair value included as a component of ‘trading gains, net’ on the consolidated income statement, in accordance with U.S. GAAP accounting requirements for broker-dealers. Precious metals inventory held by subsidiaries that are not broker-dealers continues to be valued at the lower of cost or market value.
Prior to the transfer, INTL Commodities Inc.’s precious metals sales and costs of sales were recorded on a gross basis in accordance with the Revenue Recognition Topic of the ASC. Subsequent to the transfer, INTL FCStone Ltd.’s precious metals sales and cost of sales are presented on a net basis and included as a component of ‘trading gains, net’ on the consolidated income statements, in accordance with U.S GAAP accounting requirements for broker-dealers. Precious metals sales and cost of sales for subsidiaries that are not broker-dealers continue to be recorded on a gross basis.
The Company records its physical agricultural and energy commodities revenues on a gross basis. Operating revenues and losses from its commodities derivatives activities are included in ‘trading gains, net’ in the consolidated income statements. Inventory for the physical agricultural and energy commodities business is valued at the lower of cost or fair value under the provisions of the Inventory Topic of the ASC.
The Company generally mitigates the price risk associated with commodities held in inventory through the use of derivatives. The Company does not elect hedge accounting under U.S. GAAP in accounting for this price risk mitigation.
Clearing and Execution Services (CES)
The Company seeks to provide competitive and efficient clearing and execution of exchange-traded futures and options for the institutional and professional trader market segments. Through its platform, customer orders are accepted and directed to the appropriate exchange for execution. The Company then facilitates the clearing of clients’ transactions. Clearing involves the matching of clients’ trades with the exchange, the collection and management of client margin deposits to support the transactions, and the accounting and reporting of the transactions to customers. The Company seeks to leverage its capabilities and capacity by offering facilities management or outsourcing solutions to other FCMs.
In addition, the Company provides prime brokerage foreign exchange services to financial institutions and professional traders. The Company provides its customers with the full range of OTC products, including 24 hour execution of spot, forwards and options as well as non-deliverable forwards in both liquid and exotic currencies. The Company also operates a proprietary foreign exchange desk which arbitrages the exchange-traded foreign exchange markets with the cash markets.
********
The total revenues reported combine gross revenues for the physical commodities business and net revenues for all other businesses. In order to reflect the way that the Company’s management views the results, the tables below also reflect the segment contribution to ‘operating revenues’, which is shown on the face of the consolidated income statements and which is calculated by deducting physical commodities cost of sales from total revenues.
Segment data includes the profitability measure of net contribution by segment. Net contribution is one of the key measures used by management to assess the performance of each segment and for decisions regarding the allocation of the Company’s resources. Net contribution is calculated as revenue less direct cost of sales, transaction-based clearing expenses, variable compensation, introducing broker commissions, and interest expense. Variable compensation paid to risk management
104
consultants/traders generally represents a fixed percentage of an amount equal to revenues generated, and in some cases, revenues produced less transaction-based clearing charges, base salaries and an overhead allocation.
Segment data also includes segment income which is calculated as net contribution less non-variable direct expenses of the segment. These non-variable direct expenses include trader base compensation and benefits, operational employee compensation and benefits, communication and data services, business development, professional fees, bad debts and other direct expenses.
Inter-segment revenues, charges, receivables and payables are eliminated upon consolidation, except revenues and costs related to foreign currency transactions undertaken on an arm’s length basis by the foreign exchange trading business for the securities business. The foreign exchange trading business competes for this business as it does for any other business. If its rates are not competitive, the securities businesses buy or sell their foreign currency through other market counterparties.
On a recurring basis, the Company sweeps excess cash from certain operating segments to a centralized corporate treasury function in exchange for an intercompany receivable asset. The intercompany receivable asset is eliminated during consolidation, and therefore this practice may impact reported total assets between segments.
105
Information concerning operations in these segments of business is shown in accordance with the Segment Reporting Topic of the ASC as follows:
Year Ended September 30, | |||||||||||
(in millions) | 2015 | 2014 | 2013 | ||||||||
Total revenues: | |||||||||||
Commercial Hedging | $ | 262.4 | $ | 224.0 | $ | 202.0 | |||||
Global Payments | 77.1 | 55.4 | 40.9 | ||||||||
Securities | 129.8 | 80.3 | 70.0 | ||||||||
Physical Commodities | 34,092.0 | 33,552.1 | 42,052.0 | ||||||||
Clearing and Execution Services | 123.4 | 113.7 | 121.3 | ||||||||
Corporate unallocated | 8.5 | (3.1 | ) | 7.2 | |||||||
Total | $ | 34,693.2 | $ | 34,022.4 | $ | 42,493.4 | |||||
Operating revenues (loss): | |||||||||||
Commercial Hedging | $ | 262.4 | $ | 224.0 | $ | 202.0 | |||||
Global Payments | 77.1 | 55.4 | 40.9 | ||||||||
Securities | 129.8 | 80.3 | 70.0 | ||||||||
Physical Commodities | 23.1 | 20.6 | 26.8 | ||||||||
Clearing and Execution Services | 123.4 | 113.7 | 121.3 | ||||||||
Corporate unallocated | 8.5 | (3.1 | ) | 7.2 | |||||||
Total | $ | 624.3 | $ | 490.9 | $ | 468.2 | |||||
Net operating revenues (loss): | |||||||||||
Commercial Hedging | $ | 214.7 | $ | 180.5 | $ | 163.0 | |||||
Global Payments | 68.5 | 48.2 | 36.7 | ||||||||
Securities | 88.6 | 54.6 | 48.0 | ||||||||
Physical Commodities | 21.2 | 17.9 | 23.4 | ||||||||
Clearing and Execution Services | 38.3 | 29.7 | 34.1 | ||||||||
Corporate unallocated | 0.5 | (8.9 | ) | 4.5 | |||||||
Total | $ | 431.8 | $ | 322.0 | $ | 309.7 | |||||
Net contribution: | |||||||||||
(Revenues less cost of sales, transaction-based clearing expenses, variable bonus compensation, introducing broker commissions and interest expense): | |||||||||||
Commercial Hedging | $ | 151.7 | $ | 132.6 | $ | 119.7 | |||||
Global Payments | 54.5 | 37.6 | 28.0 | ||||||||
Securities | 67.4 | 40.9 | 37.6 | ||||||||
Physical Commodities | 16.9 | 14.1 | 17.5 | ||||||||
Clearing and Execution Services | 30.1 | 24.0 | 25.9 | ||||||||
Total | $ | 320.6 | $ | 249.2 | $ | 228.7 | |||||
Segment income: | |||||||||||
(Net contribution less non-variable direct segment costs): | |||||||||||
Commercial Hedging | $ | 85.6 | $ | 67.3 | $ | 57.1 | |||||
Global Payments | 43.3 | 28.3 | 20.5 | ||||||||
Securities | 40.5 | 21.0 | 19.5 | ||||||||
Physical Commodities | 5.8 | 5.9 | 10.0 | ||||||||
Clearing and Execution Services | 12.9 | 6.3 | 5.9 | ||||||||
Total | $ | 188.1 | $ | 128.8 | $ | 113.0 | |||||
Reconciliation of segment income to income from continuing operations, before tax: | |||||||||||
Segment income | $ | 188.1 | $ | 128.8 | $ | 113.0 | |||||
Costs not allocated to operating segments | 110.0 | 102.8 | 91.8 | ||||||||
Income from continuing operations, before tax | $ | 78.1 | $ | 26.0 | $ | 21.2 | |||||
106
(in millions) | As of September 30, 2015 | As of September 30, 2014 | As of September 30, 2013 | ||||||||
Total assets: | |||||||||||
Commercial Hedging | $ | 1,548.1 | $ | 1,400.9 | $ | 1,005.1 | |||||
Global Payments | 207.3 | 51.9 | 57.2 | ||||||||
Securities | 1,861.0 | 235.5 | 204.2 | ||||||||
Physical Commodities | 190.9 | 116.8 | 132.5 | ||||||||
Clearing and Execution Services | 1,163.8 | 1,136.2 | 1,333.3 | ||||||||
Corporate unallocated | 98.9 | 98.4 | 115.7 | ||||||||
Total | $ | 5,070.0 | $ | 3,039.7 | $ | 2,848.0 | |||||
Information regarding revenues and operating revenues for the years ended September 30, 2015, 2014, and 2013, and information regarding long-lived assets (defined as property, equipment, leasehold improvements and software) as of September 30, 2015, 2014, and 2013 in geographic areas were as follows:
Year Ended September 30, | |||||||||||
(in millions) | 2015 | 2014 | 2013 | ||||||||
Total revenues: | |||||||||||
United States | $ | 25,959.0 | $ | 19,055.3 | $ | 27,788.0 | |||||
Europe | 121.2 | 86.0 | 65.6 | ||||||||
South America | 49.0 | 53.2 | 51.3 | ||||||||
Asia | 8,560.0 | 14,822.4 | 14,581.2 | ||||||||
Other | 4.0 | 5.5 | 7.3 | ||||||||
Total | $ | 34,693.2 | $ | 34,022.4 | $ | 42,493.4 | |||||
Operating revenues: | |||||||||||
United States | $ | 424.3 | $ | 330.4 | $ | 323.9 | |||||
Europe | 125.0 | 86.0 | 65.6 | ||||||||
South America | 49.0 | 53.2 | 51.3 | ||||||||
Asia | 21.9 | 15.8 | 20.1 | ||||||||
Other | 4.1 | 5.5 | 7.3 | ||||||||
Total | $ | 624.3 | $ | 490.9 | $ | 468.2 | |||||
(in millions) | As of September 30, 2015 | As of September 30, 2014 | As of September 30, 2013 | ||||||||
Long-lived assets, as defined: | |||||||||||
United States | $ | 13.8 | $ | 8.5 | $ | 9.1 | |||||
Europe | 4.0 | 5.0 | 5.4 | ||||||||
South America | 1.7 | 2.0 | 2.4 | ||||||||
Asia | 0.2 | 0.3 | 0.5 | ||||||||
Other | — | 0.1 | 0.1 | ||||||||
Total | $ | 19.7 | $ | 15.9 | $ | 17.5 | |||||
107
Schedule I
INTL FCStone Inc.
Condensed Balance Sheets
Parent Company Only
(in millions) | September 30, 2015 | September 30, 2014 | |||||
ASSETS | |||||||
Cash and cash equivalents | $ | 2.5 | $ | 3.0 | |||
Receivable from subsidiaries, net | 0.4 | — | |||||
Notes receivable, net | 46.4 | 40.0 | |||||
Income taxes receivable | 24.3 | 12.9 | |||||
Investment in subsidiaries(1) | 286.0 | 237.7 | |||||
Financial instruments owned, at fair value | 3.0 | — | |||||
Deferred income taxes, net | 12.0 | 16.6 | |||||
Property and equipment, net | 9.2 | 3.6 | |||||
Goodwill and intangible assets, net | — | — | |||||
Other assets | 13.1 | 4.9 | |||||
Total assets | $ | 396.9 | $ | 318.7 | |||
LIABILITIES AND EQUITY | |||||||
Liabilities: | |||||||
Accounts payable and other accrued liabilities | $ | 29.3 | $ | 8.8 | |||
Payable to customers | 30.7 | 25.8 | |||||
Payable to lenders under loans | 31.6 | 15.0 | |||||
Payable to subsidiaries, net | 123.7 | 61.7 | |||||
Senior unsecured notes | 45.5 | 45.5 | |||||
Financial instruments sold, not yet purchased, at fair value | — | — | |||||
Total liabilities | 260.8 | 156.8 | |||||
Equity: | |||||||
INTL FCStone Inc. (Parent Company Only) stockholders’ equity: | |||||||
Preferred stock, $0.01 par value. Authorized 1,000,000 shares; no shares issued or outstanding | — | — | |||||
Common stock, $0.01 par value. Authorized 30,000,000 shares; 20,184,556 issued and 18,812,803 outstanding at September 30, 2015 and 19,826,635 issued and 18,883,662 outstanding at September 30, 2014 | 0.2 | 0.2 | |||||
Common stock in treasury, at cost - 1,371,753 shares at September 30, 2015 and 942,973 shares at September 30, 2014 | (26.8 | ) | (17.5 | ) | |||
Additional paid-in capital | 240.8 | 229.6 | |||||
Retained earnings(1) | (78.1 | ) | (50.4 | ) | |||
Total INTL FCStone Inc. (Parent Company Only) stockholders’ equity | 136.1 | 161.9 | |||||
Total liabilities and equity | $ | 396.9 | $ | 318.7 | |||
(1) Within the Condensed Balance Sheets and Condensed Statements of Operations of INTL FCStone Inc. - Parent Company Only, the Company has accounted for its investment in wholly owned subsidiaries using the cost method of accounting. Under this method, the Company’s share of the earnings or losses of such subsidiaries are not included in the Condensed Balance Sheet or Condensed Statements of Operations. If the accounting for its investment in wholly owned subsidiaries were presented under the equity method of accounting, investment in subsidiaries and retained earnings would each increase by $278.5 million as of September 30, 2015, respectively, and $195.1 million, as of September 30, 2014, respectively.
108
Schedule I
INTL FCStone Inc.
Condensed Statements of Operations
Parent Company Only
Year Ended September 30, | |||||||||||
(in millions) | 2015 | 2014 | 2013 | ||||||||
Revenues: | |||||||||||
Management fees from affiliates | $ | 26.6 | $ | 9.5 | $ | 9.2 | |||||
Trading gains, net | 3.2 | — | — | ||||||||
Consulting fees | 2.1 | 1.6 | 1.6 | ||||||||
Interest income | 4.6 | 4.3 | 3.6 | ||||||||
Dividend income from subsidiaries(2) | 6.0 | — | — | ||||||||
42.5 | 15.4 | 14.4 | |||||||||
Interest expense | 12.7 | 10.6 | 7.1 | ||||||||
Net revenues | 29.8 | 4.8 | 7.3 | ||||||||
Non-interest expenses: | |||||||||||
Compensation and benefits | 43.5 | 29.8 | 30.5 | ||||||||
Clearing and related expenses | 1.2 | 0.3 | 0.5 | ||||||||
Introducing broker commissions | 0.5 | 0.3 | 0.5 | ||||||||
Communication and data services | 5.7 | 1.3 | 0.9 | ||||||||
Occupancy and equipment rental | 2.1 | 2.0 | 1.4 | ||||||||
Professional fees | 4.6 | 5.0 | 2.3 | ||||||||
Travel and business development | 1.4 | 1.1 | 1.2 | ||||||||
Depreciation and amortization | 1.8 | 1.8 | 1.5 | ||||||||
Bad debts and impairments | 1.6 | 0.1 | — | ||||||||
Management services fees to affiliates | 4.3 | 2.9 | 2.7 | ||||||||
Other | 10.2 | 3.5 | 3.6 | ||||||||
Total non-interest expenses | 76.9 | 48.1 | 45.1 | ||||||||
Loss from continuing operations, before tax | (47.1 | ) | (43.3 | ) | (37.8 | ) | |||||
Income tax benefit | 19.4 | 17.1 | 13.2 | ||||||||
Net loss | $ | (27.7 | ) | $ | (26.2 | ) | $ | (24.6 | ) | ||
(2) Within the Condensed Balance Sheets and Condensed Statements of Operations of INTL FCStone Inc. - Parent Company Only, the Company has accounted for its investment in wholly owned subsidiaries using the cost method of accounting. Under this method, the Company’s share of the earnings or losses of such subsidiaries are not included in the Condensed Balance Sheet or Condensed Statements of Operations. If the accounting for its investment in wholly owned subsidiaries were presented under the equity method of accounting, revenues would include income from investment in subsidiaries of $83.4 million, $45.5 million, and $43.9 million, for the years ended September 30, 2015, 2014, and 2013, respectively.
Certain amounts previously reported have been reclassified to conform to the current period presentation.
109
Schedule I
INTL FCStone Inc.
Condensed Statements of Cash Flows
Parent Company Only
Year Ended September 30, | |||||||||||
(in millions) | 2015 | 2014 | 2013 | ||||||||
Cash flows from operating activities: | |||||||||||
Net loss | $ | (27.7 | ) | $ | (26.2 | ) | $ | (24.6 | ) | ||
Adjustments to reconcile net loss to net cash (used in) provided by operating activities: | |||||||||||
Depreciation and amortization | 1.8 | 1.8 | 1.5 | ||||||||
Provision for impairments | 1.6 | 0.1 | — | ||||||||
Deferred income taxes | 4.6 | (9.6 | ) | (6.1 | ) | ||||||
Amortization of debt issuance costs and debt discount | 0.8 | 0.8 | 0.5 | ||||||||
Amortization of share-based compensation expense | 3.6 | 4.3 | 9.3 | ||||||||
Changes in operating assets and liabilities: | |||||||||||
Due to/from subsidiaries | 33.2 | 84.6 | (2.8 | ) | |||||||
Notes receivable, net | (7.8 | ) | (12.8 | ) | (17.1 | ) | |||||
Income taxes receivable | (11.4 | ) | 4.6 | (3.2 | ) | ||||||
Financial instruments owned, at fair value | (3.0 | ) | — | 1.5 | |||||||
Other assets | (3.9 | ) | (1.1 | ) | 1.7 | ||||||
Accounts payable and other accrued liabilities | 12.6 | (1.1 | ) | 1.4 | |||||||
Payable to customers | 4.9 | 7.1 | 18.0 | ||||||||
Financial instruments sold, not yet purchased, at fair value | — | (0.6 | ) | (24.7 | ) | ||||||
Net cash (used in) provided by operating activities | 9.3 | 51.9 | (44.6 | ) | |||||||
Cash flows from investing activities: | |||||||||||
Capital contribution in affiliates | (22.4 | ) | (0.5 | ) | (11.5 | ) | |||||
Capital withdrawals from affiliates | 7.8 | — | — | ||||||||
Purchase of property and equipment | (7.8 | ) | (1.8 | ) | (0.8 | ) | |||||
Net cash used in investing activities | (22.4 | ) | (2.3 | ) | (12.3 | ) | |||||
Cash flows from financing activities: | |||||||||||
Payable to lenders under loans | 13.0 | (40.0 | ) | 7.0 | |||||||
Proceeds from note payable | 4.0 | — | — | ||||||||
Payments of notes payable | (0.4 | ) | — | — | |||||||
Proceeds from issuance of senior unsecured notes | — | — | 45.5 | ||||||||
Payments related to earn-outs on acquisitions | (2.2 | ) | (1.1 | ) | — | ||||||
Share repurchase | (4.7 | ) | (9.7 | ) | (4.0 | ) | |||||
Debt issuance costs | (0.1 | ) | (0.2 | ) | (3.2 | ) | |||||
Exercise of stock options | 2.5 | 1.4 | 1.5 | ||||||||
Income tax benefit on stock options and awards | 0.5 | (0.1 | ) | 0.1 | |||||||
Net cash provided by (used in) financing activities | 12.6 | (49.7 | ) | 46.9 | |||||||
Net (decrease) increase in cash and cash equivalents | (0.5 | ) | (0.1 | ) | (10.0 | ) | |||||
Cash and cash equivalents at beginning of period | 3.0 | 3.1 | 13.1 | ||||||||
Cash and cash equivalents at end of period | $ | 2.5 | $ | 3.0 | $ | 3.1 | |||||
Supplemental disclosure of cash flow information: | |||||||||||
Cash paid for interest | $ | 11.9 | $ | 6.9 | $ | 3.0 | |||||
Income taxes (received) paid, net of cash refunds | $ | (12.9 | ) | $ | (5.3 | ) | $ | (1.6 | ) | ||
Supplemental disclosure of non-cash investing and financing activities: | |||||||||||
Additional consideration payable related to acquisitions | $ | 1.9 | $ | (3.0 | ) | $ | 5.6 | ||||
110
Item 9. Changes in and Disagreements with Accountants on Accounting and Financial Disclosure
None.
Item 9A. Controls and Procedures
(a) | Evaluation of Disclosure Controls and Procedures |
In connection with the filing of this Form 10-K, our management, including the principal executive officer and principal financial officer, evaluated the effectiveness of the design and operation of our disclosure controls and procedures (as such term is defined in Rules 13a-15(e) and 15d-15(e) under the Securities Exchange Act of 1934, as amended (the “Exchange Act”)) as of September 30, 2015. We seek to design our disclosure controls and procedures to provide reasonable assurance that the reports we file or submit under the Exchange Act contain the required information and that we submit these reports within the time periods specified in SEC rules and forms. We also seek to design these controls and procedures to ensure that we accumulate and communicate correct information to our management, including our principal executive and principal financial officers, as appropriate, to allow timely decisions regarding required disclosure.
Based on the evaluation, our principal executive officer and principal financial officer have concluded that our disclosure controls and procedures were effective as of September 30, 2015.
(b) | Management’s Report on Internal Control Over Financial Reporting |
Our management is responsible for establishing and maintaining adequate internal control over financial reporting, as such term is defined in Exchange Act Rule 13a-15(f). Our internal control over financial reporting is a process designed to provide reasonable assurance regarding the reliability of financial reporting and the preparation of financial statements for external purposes in accordance with U.S. generally accepted accounting principles (“GAAP”). Our internal control over financial reporting includes those policies and procedures that: (i) pertain to the maintenance of records that in reasonable detail accurately and fairly reflect the transactions and dispositions of the assets of the Company; (ii) provide reasonable assurance that transactions are recorded as necessary to permit preparation of financial statements in accordance with GAAP, and that receipts and expenditures of the Company are being made only in accordance with authorizations of management and directors of the Company; and (iii) provide reasonable assurance regarding prevention or timely detection of unauthorized acquisition, use or disposition of the Company’s assets that could have a material effect on the financial statements.
There are limitations inherent in any internal control, such as the possibility of human error and the circumvention or overriding of controls. A control system, no matter how well conceived and operated, can provide only reasonable, not absolute, assurance that the objectives of the control system are met, and may not prevent or detect misstatements. As conditions change over time, so too may the effectiveness of internal controls. A material weakness is a deficiency, or a combination of deficiencies, in internal control over financial reporting such that there is a reasonable possibility that a material misstatement of our annual or interim financial statements will not be prevented or detected on a timely basis.
Management (with the participation of our principal executive officer and principal financial officer) evaluated the Company’s internal control over financial reporting as of September 30, 2015, based on the framework in Internal Control - Integrated Framework (2013) issued by the Committee of Sponsoring Organizations (COSO) of the Treadway Commission.
Management’s assessment of the effectiveness of the Company’s internal control over financial reporting as of September 30, 2015 excluded G.X. Clarke & Co., acquired with effect from January 1, 2015.
Based on its assessment, management has concluded that our internal control over financial reporting was effective as of September 30, 2015.
KPMG LLP, an independent registered public accounting firm, audited the effectiveness of our internal control over financial reporting as of September 30, 2015, and KPMG LLP issued a report on the effectiveness of the Company’s internal control over financial reporting as of September 30, 2015, which is included in Item 8 “Consolidated Financial Statements and Supplementary Data” of this Annual Report on Form 10-K.
(c) | Changes in Internal Control Over Financial Reporting |
There were no changes in our internal controls over financial reporting that occurred during the quarter ended September 30, 2015 that materially affected, or are reasonably likely to materially affect, our internal control over financial reporting.
Item 9B. Other Information
None.
111
PART III
Item 10. Directors, Executive Officers and Corporate Governance
We will include a list of our executive officers and biographical and other information about them and our directors in the definitive Proxy Statement for our 2016 Annual Meeting of Stockholders to be held on February 25, 2016. We will file the proxy within 120 days of the end of our fiscal year ended September 30, 2015 (the “2016 Proxy Statement”). The 2016 Proxy Statement is incorporated herein by reference. Information about our Audit Committee may be found in the Proxy Statement. That information is incorporated herein by reference.
We adopted a code of ethics that applies to the directors, officers and employees of the Company and each of its subsidiaries. The code of ethics is publicly available on our Website at www.intlfcstone.com/ethics.aspx. If we make any substantive amendments to the code of ethics or grant any waiver, including any implicit waiver, from a provision of the code to our Chief Executive Officer, Chief Financial Officer, or Chief Accounting Officer, we will disclose the nature of the amendment or waiver on that website or in a report on Form 8-K.
Item 11. Executive Compensation
We will include information relating to our executive officer and director compensation and the compensation committee of our board of directors in the 2016 Proxy Statement and is incorporated herein by reference.
Item 12. Security Ownership of Certain Beneficial Owners and Management and Related Stockholder Matters
We will include information relating to security ownership of certain beneficial owners of our common stock and information relating to the security ownership of our management in the 2016 Proxy Statement and is incorporated herein by reference.
The following table provides information generally as of September 30, 2015, the last day of fiscal 2015, regarding securities to be issued on exercise of stock options, and securities remaining available for issuance under our equity compensation plans that were in effect during fiscal 2015.
Plan Category | Number of securities to be issued upon exercise of outstanding options, warrants and rights | Weighted average exercise price of outstanding options, warrants and rights | Number of securities remaining available for future issuance under equity compensation plans | ||||||
Equity compensation plans approved by stockholders | 1,297,984 | $ | 28.28 | 822,500 | |||||
Equity compensation plans not approved by stockholders | — | — | — | ||||||
Total | 1,297,984 | $ | 28.28 | 822,500 | |||||
Item 13. Certain Relationships and Related Transactions, and Director Independence
We will include information regarding certain relationships and related transactions and director independence in the 2016 Proxy Statement and is incorporated herein by reference.
Item 14. Principal Accountant Fees and Services
Information regarding principal accountant fees and services will be included in the 2016 Proxy Statement and is incorporated herein by reference.
PART IV
Item 15. Exhibits
3.1 | Amended and Restated Certificate of Incorporation (incorporated by reference from the Company’s Form 8-K filed with the SEC on October 9, 2009). | |
3.2 | Amended and Restated By-laws (incorporated by reference from the Company’s Quarterly Report on Form 10-Q filed with the SEC on August 14, 2007). | |
4.1 | International Assets Holding Corporation 2003 Stock Option Plan (incorporated by reference from the Company’s Proxy Statement on Schedule 14A filed on January 14, 2003). | |
4.2 | Amendment to International Assets Holding Corporation 2003 Stock Option Plan (incorporated by reference from the Company’s Proxy Statement on Form 14A filed with the SEC on February 11, 2004). | |
4.3 | Amendment to International Assets Holding Corporation 2003 Stock Option Plan (incorporated by reference from the Company’s Proxy Statement on Form 14A filed with the SEC on January 23, 2006). | |
112
4.4 | FCStone Group, Inc. 2006 Equity Incentive Plan (incorporated by reference from the Registration Statement on Form S-8 filed by FCStone Group, Inc. with the SEC on June 12, 2006). | |
4.5 | INTL FCStone Inc. 2013 Stock Option Plan (incorporated by reference from the Company’s Proxy Statement on Schedule 14A filed on January 11, 2013). | |
10.1 | Employment Agreement, dated October 22, 2002, by and between the Company and Sean O’Connor (incorporated by reference from the Company’s Form 8-K filed with the SEC on October 24, 2002). | |
10.2 | Employment Agreement, dated October 22, 2002, by and between the Company and Scott Branch (incorporated by reference from the Company’s Form 8-K filed with the SEC on October 24, 2002). | |
10.3 | Registration Rights Agreement, dated October 22, 2002, by and between the Company, and Sean O’Connor (incorporated by reference from the Company’s Form 8-K filed with the SEC on October 24, 2002). | |
10.4 | First Amendment to Registration Rights Agreement, dated December 6, 2002, by and between the Company and Sean O’Connor (incorporated by reference from the Company’s Form 8-K filed with the SEC on December 10, 2002). | |
10.5 | Registration Rights Agreement, dated October 22, 2002, by and between the Company and Scott Branch (incorporated by reference from the Company’s Form 8-K filed with the SEC on October 24, 2002). | |
10.6 | First Amendment to Registration Rights Agreement, dated December 6, 2002, by and between the Company and Scott Branch (incorporated by reference from the Company’s Form 8-K filed with the SEC on December 10, 2002). | |
10.7 | Registration Rights Agreement, dated October 22, 2002, by and between the Company and John Radziwill (incorporated by reference from the Company’s Form 8-K filed with the SEC on October 24, 2002). | |
10.8 | First Amendment to Registration Rights Agreement, dated December 6, 2002, by and between the Company and John Radziwill (incorporated by reference from the Company’s Form 8-K filed with the SEC on December 10, 2002). | |
10.9 | Employment Agreement, effective December 1, 2004, by and between the Company and Brian T. Sephton (incorporated by reference from the Company’s Form 8-K, as filed with the SEC on November 24, 2004). | |
10.10 | International Assets Holding Corporation form of Registration Rights Agreement (incorporated by reference from the Company’s Form 8-K filed with the SEC on September 15, 2006). | |
10.11 | 2012 Restricted Stock Plan (incorporated by reference from the Company’s Proxy Statement on Form 14A filed with the SEC on January 13, 2012). | |
10.12 | 2012 Executive Compensation Plan (incorporated by reference from the Company’s Proxy Statement on Form 14A filed with the SEC on January 13, 2012). | |
10.13 | Farmers Commodities Corporation Supplemental Nonqualified Pension Plan (incorporated by reference from Amendment No. 2 to the Registration Statement on Form S-4 filed by FCStone Group, Inc. with the SEC on December 9, 2004) | |
10.14 | Form of Director Indemnification Agreement (incorporated by reference from Amendment No. 3 to the Registration Statement on Form S-4 filed by FCStone Group, Inc. with the SEC on December 30, 2004) | |
10.15 | Amended and Restated Credit Agreement, made as of June 21, 2010, by and between FCStone, LLC, as borrower, FCStone Group, Inc., as a guarantor, International Assets Holding Corporation, as a guarantor, Bank of Montreal, as administrative agent, BMO Capital Markets, as Sole Lead Arranger, and the lenders party thereto (incorporated by reference from the Company’s Current Report on Form 8-K filed with the SEC on June 24, 2010). | |
10.16 | Seventh Amendment to Amended and Restated Credit Agreement, made as of March 30, 2015, by and between FCStone, LLC, as Borrower, FCStone Group, Inc., as Guarantor, INTL FCStone Inc., as Guarantor, Bank of Montreal, as Administrative Agent, and BMO Harris Financing, Inc., as a lender party thereto (incorporated by reference from the Company’s Current Report on Form 8-K filed with the SEC on April 2, 2015). | |
10.17 | Eighth Amendment to Amended and Restated Credit Agreement entered into as of June 30, 2015 with Bank of Montreal, as Administrative Agent, and BMO Harris Financing, Inc., as a lender party thereto (incorporated by reference from the Company’s Current Report on Form 8-K filed with the SEC on July 7, 2015). | |
10.18 | Credit Agreement, made as of August 10, 2012, by and between FCStone Merchant Services, LLC, as Borrower, INTL FCStone Inc., as Guarantor, Bank of Montreal, as Administrative Agent and a Lender, BMO Capital Markets, as Sole Lead Arranger and Sole Book Runner, and the lenders party thereto (incorporated by reference from the Company’s Current Report on Form 8-K filed with the SEC on August 14, 2012). | |
10.19 | Seventh Amendment to Credit Agreement, made as of April 21, 2015, by and between FCStone Merchant Services, LLC, as Borrower, INTL FCStone Inc., as Guarantor, Bank of Montreal, Chicago Branch, as Administrative Agent and a Lender, and the lenders party thereto (incorporated by reference from the Company’s Current Report on Form 8-K filed with the SEC on April 24, 2015). | |
113
10.20 | Credit Agreement made as of September 20, 2013 by and between INTL FCStone Inc. as Borrower, the Subsidiaries of INTL FCStone Inc. identified therein, as guarantors, Bank of America, N.A., as Administrative Agent, Swing Line Lender and L/C Issuer, Bank of America Merrill Lynch and Capital One, N.A., as Joint Lead Arrangers and Joint Book Managers, Bank Hapoalim B.M., BMO Harris Bank N.A. and The Korea Development Bank, New York Branch, as additional Lenders, and with the lenders from time to time parties thereto (incorporated by reference from the Company’s Current Report on Form 8-K filed with the SEC on September 24, 2013). | |
10.21 | First Amendment to Credit Agreement, made as of April 18, 2014, by and between INTL FCStone Inc., as Borrower, the Subsidiaries of INTL FCStone Inc. identified therein, as Guarantors, with Bank of America, N.A., as Administrative Agent, Swing Line Lender and L/C Issuer, Bank of America Merrill Lynch and Capital One, N.A., as Joint Lead Arrangers and Joint Book Managers, Bank Hapoalim B.M., BMO Harris Bank N.A. and The Korea Development Bank, New York Branch, as additional Lenders (incorporated by reference from the Company’s Current Report on Form 8-K filed with the SEC on April 22, 2014). | |
10.22 | Second Amendment to Credit Agreement entered into as of May 12, 2015 with Bank of America, N.A., as Administrative Agent, Lender, L/C Issuer and Swing Line Lender, Capital One, N.A., Bank Hapoalim B.M., BMO Harris Bank N.A. and The Korea Development Bank, New York Branch, as additional Lenders, and with the lenders from time to time parties thereto (incorporated by reference from the Company’s Current Report on Form 8-K filed with the SEC on May 18, 2015). | |
10.23 | Credit Agreement, made as of November 15, 2013, by and between INTL FCStone Ltd., as Borrower, INTL FCStone Inc., as Guarantor, Bank of America, N.A., as Administrative Agent and a Lender, Merrill Lynch, Pierce, Fenner & Smith Incorporated, as Sole Lead Arranger and Sole Book Manager, and with the lenders party thereto (incorporated by reference from the Company’s Current Report on Form 8-K filed with the SEC on November 20, 2013). | |
10.24 | First Amendment to Credit Agreement, made as of November 10, 2014, by and between INTL FCStone Ltd., as Borrower, INTL FCStone Inc., as Guarantor, Bank of America, N.A., as Administrative Agent and a Lender, and with the lenders party thereto (incorporated by reference from the Company’s Current Report on Form 8-K filed with the SEC on November 13, 2014). | |
10.25 | Second Amendment to Credit Agreement, made as of November 5, 2015, by and between INTL FCStone Ltd., as Borrower, INTL FCStone Inc., as Guarantor, Bank of America, N.A., as Administrative Agent and a Lender, and with the lenders party thereto (incorporated by reference from the Company’s Current Report on Form 8-K filed with the SEC on November 10, 2015). | |
10.26 | Loan Authorization Agreement entered into as of May 5, 2015, by and between FCStone, LLC, as Borrower, and BMO Harris Bank N.A., as Bank (incorporated by reference from the Company’s Current Report on Form 8-K filed with the SEC on May 8, 2015). | |
10.27 | Reaffirmation and Assumption entered into as of June 30, 2015 with BMO Harris Bank N.A. (incorporated by reference from the Company’s Current Report on Form 8-K filed with the SEC on July 7, 2015). | |
10.28 | Assignment, Assumption and Amendment Agreement entered into as of July 1, 2015 with JPMorgan Chase Bank (incorporated by reference from the Company’s Current Report on Form 8-K filed with the SEC on July 7, 2015). | |
14 | International Assets Holding Corporation Code of Ethics (incorporated by reference from the Company’s Form 10-KSB filed with the SEC on December 29, 2003). | |
21 | List of the Company’s subsidiaries. * | |
23.1 | Consent of KPMG LLP * | |
31.1 | Certification of Chief Executive Officer, pursuant to Rule 13a—14(a). * | |
31.2 | Certification of Chief Financial Officer, pursuant to Rule 13a—14(a). * | |
32.1 | Certification of Chief Executive Officer, pursuant to 18 U.S.C. Section 1350, as adopted pursuant to Section 906 of the Sarbanes-Oxley Act of 2002. * | |
32.2 | Certification of Chief Financial Officer, pursuant to 18 U.S.C. Section 1350, as adopted pursuant to Section 906 of the Sarbanes-Oxley Act of 2002. * | |
* | Filed as part of this report. | |
Schedules and Exhibits Excluded
All schedules and exhibits not included are not applicable, not required or would contain information which is included in the Consolidated Financial Statements, Summary of Significant Accounting Policies, or the Notes to the Consolidated Financial Statements.
114
Signatures
Pursuant to the requirements of Section 13 or 15(d) of the Securities Exchange Act of 1934, the registrant has duly caused this report to be signed on its behalf by the undersigned, thereunto duly authorized.
INTL FCStone Inc. | ||||
/s/ SEAN M. O’CONNOR | ||||
Sean M. O’Connor | ||||
Chief Executive Officer | ||||
Dated: | December 9, 2015 | |||
Pursuant to the requirements of the Securities Exchange Act of 1934, this report has been signed below by the following persons on behalf of the registrant and in the capacities and on the dates indicated.
Signature | Title | Date | ||
/s/ JOHN RADZIWILL | Director and Chairman of the Board | December 9, 2015 | ||
John Radziwill | ||||
/s/ SEAN M. O’CONNOR | Director, President and Chief Executive Officer | December 9, 2015 | ||
Sean M. O’Connor | (Principal Executive Officer) | |||
/s/ SCOTT J. BRANCH | Director | December 9, 2015 | ||
Scott J. Branch | ||||
/s/ PAUL G. ANDERSON | Director | December 9, 2015 | ||
Paul G. Anderson | ||||
/s/ EDWARD J. GRZYBOWSKI | Director | December 9, 2015 | ||
Edward J. Grzybowski | ||||
/s/ JOHN M. FOWLER | Director | December 9, 2015 | ||
John M. Fowler | ||||
/s/ BRUCE KREHBIEL | Director | December 9, 2015 | ||
Bruce Krehbiel | ||||
/s/ DARYL HENZE | Director | December 9, 2015 | ||
Daryl Henze | ||||
/s/ ERIC PARTHEMORE | Director | December 9, 2015 | ||
Eric Parthemore | ||||
/s/ WILLIAM J. DUNAWAY | Chief Financial Officer | December 9, 2015 | ||
William J. Dunaway | (Principal Financial and Accounting Officer) | |||
115