Attached files
| file | filename |
|---|---|
| EX-32.2 - EXHIBIT 32.2 - SIGMA DESIGNS INC | ex32-2.htm |
| EX-31.1 - EXHIBIT 31.1 - SIGMA DESIGNS INC | ex31-1.htm |
| EX-32.1 - EXHIBIT 32.1 - SIGMA DESIGNS INC | ex32-1.htm |
| EX-21.1 - EXHIBIT 21.1 - SIGMA DESIGNS INC | ex21-1.htm |
| EX-23.1 - EXHIBIT 23.1 - SIGMA DESIGNS INC | ex23-1.htm |
| EX-31.2 - EXHIBIT 31.2 - SIGMA DESIGNS INC | ex31-2.htm |
UNITED STATES
SECURITIES AND EXCHANGE COMMISSION
Washington, D.C. 20549
FORM 10-K
(Mark One)
|
|
☒ |
Annual Report pursuant to Section 13 or 15(d) of the Securities Exchange Act of 1934 |
For the fiscal year ended: January 30, 2016
OR
|
|
☐ |
Transition Report pursuant to Section 13 or 15(d) of the Securities Exchange Act of 1934 |
|
|
|
For the transition period from to |
Commission File Number 001-32207
SIGMA DESIGNS, INC.
(Exact name of Registrant as specified in its charter)
|
California |
94-2848099 |
|
(State or other jurisdiction of incorporation or organization) |
(I.R.S. Employer Identification Number) |
|
|
|
|
47467 Fremont Boulevard Fremont, California |
94538 |
|
(Address of principal executive offices) |
(Zip code) |
Registrant’s telephone number, including area code: (510) 897-0200
Securities registered pursuant to Section 12(b) of the Act:
|
Title of each class |
|
Name of each exchange on which registered |
|
Common Stock, no par value |
|
The NASDAQ Stock Market LLC |
Securities registered pursuant to Section 12(g) of the Act: None
Indicate by check mark if the registrant is a well-known seasoned issuer, as defined in Rule 405 of the Securities Act. Yes ☐ No ☒
Indicate by check mark if the registrant is not required to file reports pursuant to Section 13 or Section 15(d) of the Act. Yes ☐ No ☒
Indicate by check mark whether the registrant (1) has filed all reports required to be filed by Section 13 or 15(d) of the Securities Exchange Act of 1934 during the preceding 12 months (or for such shorter period that the registrant was required to file such reports), and (2) has been subject to such filing requirements for the past 90 days. Yes ☒ No ☐
Indicate by check mark whether the registrant has submitted electronically and posted on its corporate Web site, if any, every Interactive Data File required to be submitted and posted pursuant to Rule 405 of Regulation S-T (§232.405 of this chapter) during the preceding 12 months (or for such shorter period that the registrant was required to submit and post such files). Yes ☒ No ☐
Indicate by check mark if disclosure of delinquent filers pursuant to Item 405 of Regulation S-K is not contained herein, and will not be contained, to the best of registrant’s knowledge, in definitive proxy or information statements incorporated by reference in Part III of this Form 10-K or any amendment to this Form 10-K. ☒
Indicate by check mark whether the registrant is a large accelerated filer, an accelerated filer, a non-accelerated filer or a smaller reporting company. See definition of “large accelerated filer,” “accelerated filer” and “smaller reporting company” in Rule 12b-2 of the Exchange Act. (Check one):
Large accelerated filer ☐ Accelerated filer ☒ Non-accelerated filer ☐ Smaller reporting company ☐
Indicate by check mark whether the registrant is a shell company (as defined in Rule 12b-2 of the Act). Yes ☐ No ☒
The aggregate market value of the registrant’s common stock, no par value, held by non-affiliates of the registrant on August 1, 2015, the last business day of the registrant’s most recently completed second fiscal quarter, was approximately $358,819,318 based on the closing sale price of $10.37 per share on that date. Shares of common stock held by each executive officer, director and shareholder known by the registrant to own 10% or more of the registrant’s outstanding common stock based on Schedule 13G or 13D filings and other information known to the registrant, have been excluded because such persons may be deemed to be affiliates. This determination of affiliate status is not necessarily a conclusive determination for other purposes.
There were 36,912,945 shares of the registrant’s common stock outstanding on March 23, 2016.
DOCUMENTS INCORPORATED BY REFERENCE
Part III incorporates by reference information from the registrant’s proxy statement or as an amendment to this Form 10-K to be filed with the Securities and Exchange Commission within 120 days after the close of the fiscal year covered by this report on Form 10-K.
Sigma Designs, Inc.
2016 ANNUAL REPORT ON FORM 10-K
TABLE OF CONTENTS
|
|
|
Page No |
|
|
| |
|
PART I |
| |
|
Item 1. |
Business |
3 |
|
Item 1A. |
Risk Factors |
14 |
|
Item 1B. |
Unresolved Staff Comments |
29 |
|
Item 2. |
Properties |
29 |
|
Item 3. |
Legal Proceedings |
29 |
|
Item 4. |
Mine Safety Disclosures |
30 |
|
|
| |
|
PART II |
| |
|
Item 5. |
Market for the Registrant’s Common Equity, Related Shareholder Matters and Issuer Purchases of Equity Securities |
30 |
|
Item 6. |
Selected Consolidated Financial Data |
32 |
|
Item 7. |
Management’s Discussion and Analysis of Financial Condition and Results of Operations |
33 |
|
Item 7A. |
Quantitative and Qualitative Disclosures About Market Risk |
53 |
|
Item 8. |
Financial Statements and Supplementary Data |
54 |
|
Item 9. |
Changes in and Disagreements with Accountants on Accounting and Financial Disclosure |
95 |
|
Item 9A. |
Controls and Procedures |
95 |
|
Item 9B. |
Other Matters |
96 |
|
|
| |
|
PART III |
| |
|
Item 10. |
Directors, Executive Officers of the Registrant and Corporate Governance |
96 |
|
Item 11. |
Executive Compensation |
96 |
|
Item 12. |
Security Ownership of Certain Beneficial Owners and Management and Related Shareholder Matters |
96 |
|
Item 13. |
Certain Relationships and Related Transactions and Director Independence |
96 |
|
Item 14. |
Principal Accounting Fees and Services |
96 |
|
|
| |
|
PART IV |
| |
|
Item 15. |
Exhibits and Financial Statement Schedules |
97 |
|
|
| |
|
Signatures |
98 | |
FORWARD-LOOKING INFORMATION
This Annual Report on Form 10-K for the year ended January 30, 2016 contains forward-looking statements within the meaning of Private Securities Litigation Reform Act of 1995, including statements regarding our future results of operations and financial position, business strategy and our objectives for future operations. The words “may,” “predict,” “potential,” “will,” “should,” “could,” “expect,” “anticipate,” “believe,” “estimate,” “intend,” “continue” and other similar expressions are intended to identify forward-looking statements. Specifically, these forward-looking statements include, but are not limited to, statements regarding:
|
|
• |
anticipated trends and challenges in our business and the markets in which we operate; |
|
|
• |
our expectations regarding our expenses and international sales; |
|
|
• |
plans for future products and services and for enhancements of existing products and services; |
|
|
• |
our research and development; |
|
|
• |
our belief that a portion of our products will be one of the preferred solutions for telecommunication and multi-service operators in the future; |
|
|
• |
our anticipated cash needs and our estimates regarding our capital requirements and our needs for additional financing; |
|
|
• |
our anticipated growth strategies; |
|
|
• |
our intellectual property; |
|
|
• |
our ability to attract customers; and |
|
|
• |
sources of new revenue. |
These forward-looking statements represent our current views with respect to future events, including estimates and assumptions only as of the date of this Form 10-K. As new risks emerge from time to time, it is not possible for our management to predict all risks, nor can we assess the impact of all factors on our business or the extent to which any factor, or combination of factors, may cause actual results to differ materially from those contained in any forward-looking statements we may make. We do not intend, and undertake no obligation, to update any of our forward-looking statements after the date of this report to reflect actual results or future events or circumstances that occur after the statement is made. Given these risks and uncertainties, readers are cautioned not to place undue reliance on any such forward-looking statements.
Throughout this report, we refer to Sigma Designs, Inc., together with its subsidiaries, as “we,” “us,” “our,” or “Sigma,” unless the context indicates otherwise.
PART I
|
ITEM 1. |
BUSINESS |
Overview
We are a global integrated semiconductor solutions provider offering intelligent media platforms for use in the home entertainment and home control markets. Our goal is to ensure that our solutions serve as the foundation for some of the world’s leading consumer products, including televisions, set-top boxes, media connectivity and home control devices. Our business generates revenue primarily by delivery of relevant, cost-effective semiconductors that are targeted toward end-product manufacturers, Original Equipment Manufacturers, or OEMs, and Original Design Manufacturers, or ODMs. We also derive a portion of our revenue from other products and services, including technology licenses, software development kits, engineering support services for hardware and software, engineering development for customization of chipsets and other accessories.
We sell our products into four primary or target markets: (i) Smart TV, (ii) Media Connectivity, (iii) Set-Top Box and (iv) Internet of Things (“IoT”) Devices. Smart TV products consist of a range of platforms that are based on highly integrated chips, embedded software and hardware reference designs. Media Connectivity products consist of wired home networking controller chipsets that are designed to provide connectivity solutions between various home entertainment products and incoming video streams. Set-top Box products consist of connected media processors and players delivering IP streaming video, including hybrid versions of these products. IoT Devices consist of our wireless Z-Wave chipsets and modules.
Historically, we disclosed information encompassing product groupings by target markets with certain naming conventions, consisting of Digital Television (“DTV”), Set-top Box, Home Networking, Home Control, and License and other. We resolved to change the naming conventions of some of our target markets, commensurate with changes taking effect in our industry as a whole. We renamed our “DTV” target market to “Smart TV,” “Home Networking” to “Media Connectivity,” and “Home Control” to “IoT Devices.” These changes did not affect the products or related services categorization, or previously reported amounts related to the aforementioned historical target markets.
Products
Media Processor
Our media processor product line consists of a range of functionally similar platforms that are based on highly integrated chips, embedded software, and hardware reference designs. These highly integrated chips typically include all the functions required to create a complete system solution with only the addition of memory. The integrated functions include application processing (CPU), graphics processing (GPU), media processing (audio and video decoding/encoding), display processing, security management, memory control, and peripheral interfaces. Our embedded software suite provides an operating environment and coordinates the real-time processing of digital video and audio content, is readily customizable by our customers and is interoperable with multiple standard operating systems. Our reference system designs provide a hardware implementation of the circuit board, access to our embedded software suite, and can include prototypes for customer evaluation and use. We believe our products deliver industry-leading performance in video decoding, picture quality, and software breadth, and this value proposition is why manufacturers select our products.
Our chipsets are generally configured for a specific market, either smart television (Smart TV) or set-top box (STB), the latter of which includes related products, such as connected media players. The primary difference between these devices that target different markets is the interfaces they support. Chips created for the Smart TV market obtain inputs from high definition multimedia interface (HDMI) and analog video and provide outputs to flat panel interfaces. Chipsets created for the Set-top Box market obtain inputs from Ethernet and other broadcast interfaces and provide output to HDMI and analog video. Core components are therefore shared across these products while their configured hardware/software platforms and support are offered separately.
Media Connectivity Controllers
Our Media Connectivity product line consists of wired home networking controller chipsets that are designed to provide connectivity solutions between various home entertainment products and incoming video streams. We believe these connectivity solutions provide consumers additional connectivity choices with increased flexibility and reliability and allow system integrators and service providers an opportunity to reduce the time and cost of home networking installations. Our Media Connectivity solutions are based on the HomePNA (HPNA), HomePlug AV (HPAV), and G.hn standards. HPNA is a standard used for transferring internet protocol, or IP, content across coaxial cables and phone lines whereas HPAV is used for transferring IP content across power lines. G.hn is the next generation International Telecommunications Union (ITU) standard ratified in 2011 to create a unified global standard across coaxial cables, phone lines, and power lines. Products based on these technologies enable service providers, such as telecommunication carriers, cable operators and satellite providers, to deliver high definition television services (HDTV) and other media-rich applications throughout the home. Our HomePNA chipsets comply with the ITU G.9954 standard to support distribution of multimedia content throughout the home, while our HomePlug AV chipsets provide connectivity over existing powerline wiring, supporting AES encryption, high QoS and remote management and diagnostic capabilities. Our G.hn chipset is compliant with ITU G.9960/61 which supports connectivity over any type of existing wires inside the home. We designed the G.hn chipset to employ MIMO technology to deliver higher throughput with extended coverage even in presence of high noise conditions. To date, we have not generated significant revenue from our products based on HPAV or G.hn technologies.
Internet of Things (“IoT”) Devices
Our IoT Devices product line consists of our wireless Z-Wave chips and modules. Our Z-Wave chips and modules are incorporated into devices that enable consumers to enjoy advanced home control and automation functionality, such as home security, environmental and energy control and monitoring, within both new and existing homes. Devices that incorporate our wireless chips and modules operate on the Z-Wave mesh networking protocol. Our Z-Wave wireless chips utilize a low-bitrate, low-power, low-cost RF communication technology that provides an interoperable platform for home automation security and monitoring solutions. We derive most of our revenue within our IoT Devices product line by selling a module, which includes a Z-Wave chip plus additional circuitry and components that provide our customers with a ready-to-use solution. Our Z-Wave chips and the Z-Wave protocol they use to communicate commands have been built into an ecosystem of over 1,000 certified interoperable products, consisting primarily of intelligent appliances for use within the home.
In the fourth quarter of fiscal 2016, we acquired Bretelon, Inc. (“Bretelon”), an advanced form of mobile IoT technology company. The associated technology and current product development related to this acquisition are expected to expand our IoT market opportunities beyond our Z-Wave product line with the introduction of ultra-low power, GPS capable LTE modems that are meant to be incorporated into various applications and end products. We believe this technology is very versatile and has the ability to be powered by inexpensive coin cell batteries or other power supply methods, such as from an external DC input and rechargeable batteries.
License Arrangements and Other Products
From time to time, we derive revenue from the license of our internally developed intellectual property. We also offer certain legacy products that are sold into prosumer and other industrial applications. We also derive revenue from the sale of products including software development kits, engineering support services for hardware and software, engineering development for customization of chipsets and other accessories. These products account for a minor portion of our total revenue.
Target Markets
Smart TV Market
The Smart TV market (previously referred to as our DTV market) consists of all products that are sold into digital televisions. We believe Smart TV products complement our existing Set-top Box products, which will provide substantial research and development leverage and improved operating scale to augment our ability to develop innovative solutions for the anticipated convergence of IP-video delivery across any device within the connected home. Furthermore, our early entry into the emerging ultra-high definition (“UHD,” “Ultra-HD” or “4K”) television market has provided a differential opportunity for us to penetrate key customers for high-end products, which will eventually become mainstream over time. We serve this market with our media processor chips and dedicated post-processing products.
Set-top Box Market
The Set-top Box target market consists of all Set-top Box products delivering IP streaming video, including hybrid versions of these products. We serve this market primarily with our media processor products.
Media Connectivity Market
The Media Connectivity market consists of communication devices that use a standard protocol to connect equipment inside the home and stream IP-based video and audio, VoIP, or data through wired or wireless connectivity. We serve the Media Connectivity market with our wired home networking controllers that are designed to provide the most reliable connectivity solutions between various home entertainment products and incoming video streams.
Internet of Things (“IoT”) Devices Market
The IoT Devices market consists of our interconnected Z-Wave enabled gateways, appliances and devices that provide monitoring and control capabilities for the management of any consumer ecosystem. Our IoT Devices product line consists of our wireless Z-Wave chips, modules and Z-Wave mesh networking protocol.
We expect our acquisition of Bretelon will allow us to expand our overall IoT offering. This acquisition expands our total addressable market to include products with outdoor applications, which are an ideal complement to our Z-Wave product line that covers indoor applications. We intend to take advantage of the synergy between these two product lines to service smart city and commercial opportunities that make outdoor use of the Z-Wave mesh network and mobile IoT connectivity.
License and Other Markets
The license and other markets includes other products and services, including technology licenses, software development kits, engineering support services for hardware and software, engineering development for customization of chipsets and other accessories.
Characteristics of Our Business
We do not enter into long-term commitment contracts with our customers and generate substantially all of our net revenue based on customer purchase orders. However, our failure to accurately forecast demand can lead to product shortages that can impede production by our customers and may harm our relationship with these customers or lead to excess inventory, which could negatively impact our gross margins in a particular period. During fiscal 2016, 2015 and 2014, we recorded provisions for excess inventory of $3.2 million, $4.3 million and $0.8 million, respectively, primarily as a result of the end of life of certain products.
Our Smart TV market is based on the annual cycle of product launches that is typical of the consumer market. Major new consumer products are designed during the spring, produced during the summer and launched in the fall to take advantage of the holiday selling season. As such, our Smart TV market is subject to seasonality of semiconductor sales into customers who manufacture products for the consumer electronics market. We expect our Smart TV market to experience seasonality typical of the consumer electronics markets, wherein the holiday selling season commands the highest sell-through of consumer electronic end-products, making the third quarter typically the strongest selling season for components such as our chipsets. Therefore, we expect to experience lower sales in our first and fourth fiscal quarters and higher sales in our second and/or third fiscal quarters as a result of this seasonality of demand. As a result, our operating results may vary significantly from quarter to quarter.
For our Set-top Box market, we forecast demand for our products based not only on our assessment of the requirements of our direct customers, but also on the anticipated requirements of the telecommunications carriers that our direct customers serve. We work with both our direct customers and these carriers to address the market demands and the necessary specifications for our technologies. Our business is substantially dependent upon being designed into set-top boxes and we must spend a considerable amount of resources to compete for these design wins. If we do obtain these design wins, it is often the case that our end customer and direct customer will continue to incorporate our chips solutions for that generation of set-top boxes. However, if we are not designed into a particular generation of set-top boxes for our large target end customers, we stand to lose that portion of our market for the entire deployment time, which is typically two to three years.
Our IoT Devices and Media Connectivity markets are characterized by the popularity of competing standards within the United States, Asia, and the European markets recognized by the ITU and other governing bodies. The value of our IoT Devices market lies in the recognition of Z-Wave as the North American market leader for home automation and energy management within the security industry. The primary differentiation between Z-Wave and other competing standards in the IoT Devices market is the requirement that all Z-Wave devices conform to a strict application level of device-to-device communication and operability, which allows all Z-Wave devices to be interoperable. This interoperability requirement does not exist with any other competing technologies in the IoT Devices market. We expect our IoT Devices market to grow in direct proportion to the adoption of the Z-Wave standard by a number of service integrators and service providers.
All of our target markets are also characterized by intense price competition. The semiconductor industry is highly competitive and, as a result, we expect our average selling prices to decline over time. On occasion, we have reduced our prices for individual customer volume orders as part of our strategy to obtain a competitive position in our markets. The willingness of customers to design our chipsets into their products depends to a significant extent upon our ability to sell our products at competitive prices. If we are unable to reduce our costs sufficiently to offset any declines in product selling prices or are unable to introduce more advanced products with higher gross margins in a timely manner, we could see declines in our market share or gross margins. We expect our gross margins will vary from period to period due to changes in our average selling prices and average costs, volume order discounts, mix of product sales, amount of development revenue and provisions for inventory excess and obsolescence.
Industry Background
The growth of the internet, proliferation of over-the-top content, advances in communications infrastructure, digital video and audio compression technologies, home networking technologies and improvements in television displays have resulted in significant consumer demand for the end products sold in the markets that we primarily target.
The Smart TV market is driven by the advent of digital video and Internet streaming services, which supplement traditional delivery mechanisms such as over the air broadcasts, cable, satellite, DVDs and Blu-ray. The recent transition of premium televisions to ultra-high definition, also known as Ultra-HD, is a primary example of this shift. Ultra-HD is comprised of two general signal standards known as “4K” and “8K,” which are currently driving the Smart TV market. A 4K signal is comprised of 3840 pixels by 2160 lines and has four times more pixels than the older Full-High Definition or Full-HD, which consists of only 1920 pixels by 1080 lines. While new television sets capable of displaying 4K content have entered the market, widespread availability of 4K content has not been achieved. Generally, consumer multimedia entertainment applications are increasingly requiring video and audio data to be processed, transmitted, stored and displayed in an efficient and secure manner while simultaneously maintaining high resolution, multi-channel audio/video functionality and providing the end-user a variety of interactive options. In order to provide this increased functionality in a cost-effective manner, manufacturers of consumer electronics demand semiconductors that integrate more features on a single chip as well as reduce their costs, time-to-market and power consumption. A challenge to manufacturers of digital media processors is to balance the integration of more functionality with lower costs and shorter development cycles.
The Internet Protocol television, or IPTV, portion of the Set-top Box market is primarily driven by video service providers, such as telecommunication service providers, who utilize video servers and set-top boxes to deliver television services based on streaming video over broadband connections using IP streaming. IPTV has become an important consumer multimedia application as it allows telecommunications carriers to deliver advanced video services to consumers using existing telecommunications infrastructure. These carriers are actively pursuing the deployment of IPTV because it enables them to offer attractive video, voice and data, or triple play, services and increase their revenue per subscriber. A challenge faced in delivering high-quality video content to end users across existing copper-based telecommunications infrastructure is the limited data carrying capacity of the existing wiring. This challenge can be addressed by advanced video compression technologies along with advanced high-speed communication technologies, which together can overcome the capacity limitation to allow the delivery of high definition video service throughout the home. IPTV set-top boxes currently use one of three platforms based on software developed previously by Microsoft and now provided by Ericsson or various Android or Linux providers, each of which offers certain advantages and disadvantages.
In the Media Connectivity market, devices are involved in routing digital entertainment streams to ensure that television service and other shared media resources are accessible throughout the home. Currently, home video networking uses both wired and wireless connections to distribute entertainment streams under one of the many networking standards that exist. Although wireless networking products, operating through Wi-Fi networks is the most widely accepted industry standard for use in home video distribution, wired connectivity remains a competitive option in select segments of the market.
IoT Devices products enable remote control and monitoring of a wide variety of home appliances, such as thermostats, lighting and door locks. Much of the early adoption for home control and energy management products has been driven by installations of new security systems for the consumer home. However, the recent deployment of IoT Devices products by an increasing number of larger system integrators and service providers has perpetuated the growing popularity of this market within the consumer goods industry. Low frequency, low power solutions can offer consumers cost efficient ways to monitor and conserve energy usage, protect homes from theft and damage and improve the convenience of performing certain household activities. Z-Wave’s device-interoperability allows service and security providers to deploy solutions with Z-Wave, secure in the knowledge that their solutions will operate with products from name brand vendors sold at retail and online. This allows service providers to focus on their core technology, with the services that they provide, and not the making or sourcing of the devices.
Our Strengths
We have developed or acquired core technologies, expertise and capabilities that we believe are necessary to provide a comprehensive chipset solution or platform that includes media processing, communications, automation and control. We believe we have the following key strengths:
|
|
• |
Differentiable value with our Smart TV technology. We provide our customers with industry-leading technology for a comprehensive Smart TV solution and a rich portfolio of IP. Our set of core technologies provides us an opportunity to be a leading vendor of Smart TV solutions. Our experience in IPTV and software development creates a unique combination of application delivery while providing industry leading picture quality including state-of-the-art 4K Ultra-HD video processing, frame rate conversion and market leading demodulator technology. |
|
|
• |
Strong Position within IPTV Market. We are one of the first media processing semiconductor providers to work extensively with IPTV set-top box manufacturers, including Ericsson’s Mediaroom ecosystem, as well as telecommunications carriers to design solutions that address their specific feature and performance requirements. Additionally, we deliver some of the leading IPTV connectivity solutions for set-top boxes and residential gateways. Through these experiences, we have gained valuable insight into the challenges of our customers and carriers and have gained visibility into their product development plans. As a result, we believe we are able to provide our customers with a stable and reliable source of field-proven solutions. |
|
|
• |
Highly Integrated Chipsets Leveraged Across Multiple Consumer Applications. We have developed a proprietary chipset architecture that allows us to integrate high-performance digital video and audio decoding, graphics processing, security management and home audio/video networking and advanced image processing. Our chipsets can replace a number of single function semiconductors, which can significantly improve performance, lower power consumption and reduce total system cost to our customers. Furthermore, all of these functions can be performed synchronously at high processing speeds. Our ability to integrate these multiple functions into a single, high-speed semiconductor allows us to address many different consumer multimedia entertainment applications with the same hardware platform. |
|
|
• |
Differentiated Software Development Capabilities. As a result of over 15 years of experience in delivering video and audio solutions, we have developed expertise in real-time software that synchronizes and controls the playback of video and audio from a variety of sources. This software translates the complex silicon architecture of our chipsets into a much simpler application programming interface. Using this interface, our customers are able to design their products under industry standard operating systems, enabling them to customize our solutions and reduce their time to market. The majority of our engineering personnel are dedicated to software development. |
|
|
• |
Multi-Standard Functionality. We design our chipsets to support multiple industry standards that are used across most consumer entertainment applications. For example, there are over a dozen different video and audio standards used in current consumer applications, including video standards such as HEVC, H.264, MPEG-4, MPEG-2, MPEG-1 and WMV9, and audio standards such as Dolby, DTS and MP3. Beyond this, there are a range of digital rights management security standards such as AES, RSA and MSDRM. Additionally, there are three primary operating systems, Android, Linux and Microsoft Windows CE, each of which has its own middleware standards. The ability of our chipsets to support a multitude of standards allows us to deliver increased product functionality to our customers. |
|
|
• |
Breadth and Depth of Relationships within the Set-top Box Industry and Service Providers. In order to provide a complete system-level solution for the IPTV market, we have developed strong relationships with industry leaders that form the ecosystem required to deliver an end-to-end solution, from content creation to content display. The IPTV ecosystem consists of providers of middleware, encoders and security solutions. For middleware, server software must be successfully integrated into our products to provide effective system solutions for the service providers. For security solutions, there are also a range of providers, including Microsoft and Nagra. Our strong position in the IPTV market has enabled us to develop and maintain relationships with these providers and offer solutions that are interoperable with their products. |
|
|
• |
Z-Wave Standardization, Interoperability and Ecosystem. Our Z-Wave technology provides system integrators access to over 1,000 products complying with the Z-Wave standard and with guaranteed interoperability which we believe creates an attractive ecosystem. This makes our Z-Wave technology unique in the IoT Devices market, and a prime candidate to be selected by new service providers entering this emerging space. Because the International Telecommunication Union, or ITU, has developed a new sub 1GHz narrow band wireless standard which is largely based on Z-Wave technology and defines backwards compatibility to the Z-Wave standard, and because of the large ecosystem of products based on the Z-Wave standard, we believe our Z-Wave products will be one of the preferred solutions for telecommunication and multi-service operators in the future. |
Our Strategy
Our objective is to be the leading provider of chipsets used to deliver entertainment, automation and control throughout the home. To achieve this objective, we expect to continue to pursue the following strategies:
|
|
• |
Increase Penetration in Smart TV market. Through our acquisition of Trident’s DTV business, we have obtained a position in the digital television market, specifically targeting the new generation of Smart TVs that will feature 4K Ultra-HD video. We are currently fostering a number of key industry partnerships that have allowed us to increase our market presence. These industry partnerships have positioned us to further develop our technology into a leading solution in the Ultra-HD video market. Currently, our chipsets incorporate both hardware and software elements that enable Smart TV features and content access, while also managing all of the routine television functions. We believe our product line is differentiated by the hardware technologies such as frame-rate-conversion as well as sophisticated software such as Internet connectivity and web portal access. |
|
|
• |
Re-grow our Leadership Position in the IP Streaming Set-top Box Market. We have achieved a significant share in the IPTV Set-top Box market by providing our customers with highly integrated digital media processor chipsets. In addition, our solutions work effectively across different platforms and standards in this market. In order to regain our leadership position, we intend to provide the most compelling integrated digital media processing solutions to our customers and support multiple standards in this end market in order to increase our market share through both carrier deployed set-top boxes and retail-based digital media adapters. |
|
|
• |
Enhance our Software Advantage. We believe our software provides a suite of capabilities that offer differentiated advantages from our competitors. Our software is integrated and embedded into our customers’ products during their product design stage. As a result, once we are designed into our customers’ product, we believe it is difficult for our competitors to displace us. We intend to leverage our software development capabilities and continue to invest significant resources in developing additional expertise in the area of high-performance software development, over-the-top video delivery software, and customer support. |
|
|
• |
Solidify our position in the G.hn Market. We have developed unified broadband home networking technology under the G.hn standard. We plan to use this technology to further expand our position in the Media Connectivity market. This market is fragmented into multiple standards, and we believe G.hn provides a way of unifying the demand in this market under a single standard encompassing all wired transmission media (coaxial cable, phone line and power line) in the home. |
|
|
• |
Expand our position in home monitoring, automation and control. We have developed a strong position in the home monitoring, automation and control market and intend to expand this position with our Z-Wave technology to encompass security, energy management, and other services. This expansion will be largely achieved through the addition of service offerings from existing service providers, such as AT&T, ADT, Vivint, and others. As the market develops, we believe these providers expect to leverage additional value-added features from remote access capabilities. |
|
|
• |
Leverage Existing Relationships. We have developed relationships within standards and platform-defining entities like Google and Microsoft, which enable us to win new customers effectively. We also have strong customer relationships with many set-top box and connected media player designers and consumer device manufacturers. We also work closely with telecommunications carriers to understand their needs in advance of our customer’s product development cycle. We intend to leverage our existing position with our partners and customers to identify and secure new market opportunities. |
Customers and Strategic Relationships
We sell our products principally to designers and manufacturers (OEMs and ODMs) as well as to distributors who, in turn, sell to manufacturers. Typically, when we sell to distributors, they have already received an order for our products directly from a manufacturer. Sales to our customers are typically made on a purchase order basis. We have also established strategic relationships with telecommunications carriers that provide wired and wireless communications services to consumers and businesses. More recently, we have established strategic partnerships with large producers of consumer electronics that increase our market presence and exposure in the television market.
Our success within the Smart TV market depends on our ability to achieve design wins and successfully integrate our chipsets into certain consumer electronics products. Specifically, our business depends on the demand for our chipsets from large producers of consumer electronics within the television market, who are often not direct customers but deploy products that incorporate our chipsets. Demand for our chipsets is determined by the number of design wins we are able to achieve within these producers’ suites of product offerings. Even though we often do not sell our products directly to these large producers, they have a significant impact on the demand for our chipsets.
Our business also depends on demand for our chipsets from companies, such as large telecommunication carriers, who are not our direct customers but deploy IPTV set-boxes that incorporate our chipsets. Large carriers often use multiple set-top box providers, who in turn sometimes use multiple contract manufacturers to purchase our chipsets and manufacture set-top boxes. Even though we do not sell our products directly to these companies that ultimately deploy set-top boxes to consumers, they have a significant impact on the demand for our chipsets.
For fiscal 2016, Sunjet Components Corps accounted for 16% of our net revenue and, during fiscal 2015, Benchmark Electronics accounted for 13% of our net revenue. No customer accounted for more than 10% of our net revenue in fiscal 2014.
A substantial portion of our product shipments are to customers outside of North America. In fiscal 2016, 2015 and 2014, net revenues from our customers outside of North America accounted for 81%, 89%, and 86% of our net revenue, respectively. Revenue from our customers in Asia accounted for 76%, 81% and 73% of our net revenue in fiscal 2016, 2015 and 2014, respectively. Revenue from our customers in Asia decreased as a percentage of total net revenues primarily due to the increase in net revenues in North America from our Smart TV product lines.
Sales and Marketing
Our sales and marketing strategy is to achieve design wins with technology leaders by providing quality, state of the art products through superior sales. We sell our products worldwide through multiple channels, including our direct sales force, manufacturer representatives and independent distributors strategically located in many countries around the world. Members of our direct sales force are based in the United States, Denmark, Israel, Taiwan, South Korea and Japan. Our sales are also supported by representatives, resellers and distributors in other key countries such as Brazil, China, and India.
Our sales cycle typically ranges from nine to eighteen months, but may last longer, and depends on a number of factors including the technical capabilities of the customer, the customer’s need for customization of our chipsets and the customer’s evaluation and qualification process. In many cases, we must also qualify our products with our technology partners and in some cases with an end customer, such as a service provider. This qualification process can extend our sales cycle beyond its typical duration. We generally plan the fabrication of our products based on customer forecasts. In some instances, customer forecasts are driven by seasonality, where our customers plan product launches around the holiday season.
For our larger volume designer and manufacturer customers, purchase orders for our products are generally non-cancelable between four and twelve weeks before our scheduled delivery dates and not subject to rescheduling within four weeks of scheduled delivery dates.
Competition
The semiconductor industry in general, and the consumer electronics market specifically, are highly competitive and are characterized by rapid technological change, evolving standards, decreasing average selling prices per unit, and short product life cycles. We believe that the principal factors on which we compete include time-to-market for new product introductions, product performance, customer interface and support, industry standards compatibility, software functionality, image quality, price, and product support.
We compete with a number of major domestic and international suppliers of chipset solutions and related applications, including the following, among others: Broadcom Corporation, Mediatek, RealTek and ST Microelectronics for our Smart TV and Set-top Box products; Broadcom (through their acquisition of Gigle), Marvell Technology Group, Ltd. (through their acquisition of DS2) and Qualcomm (through their acquisition of Atheros) for our Media Connectivity products; and Texas Instruments, Freescale and Silicon Lab through their Zigbee-based chips for our IoT Device products.
The semiconductor industry underwent multiple consolidations led by some key competitors in the industry. These consolidations arose in the face of rising costs of production and design creating pressures for market participants to leverage combined resources. One such acquisition affecting the Set-top Box market was Technicolor’s acquisition of Cisco’s set-top box and related home broadband equipment business. Technicolor and Cisco also entered into a strategic partnership that allows both companies to develop and deliver next generation video and broadband technologies, with cooperation on IoT solutions and services which could potentially create added pressures on us within our IOT Devices market. Broadcom was acquired by Avago, the result of which created the world’s sixth largest chip manufacturer. In the event Broadcom and Avago realize synergies and operation efficiencies as a result of the acquisition, it will create additional dimensions to their competitive presence in the Set-top Box market.
Many of the aforementioned companies have higher profiles, larger financial resources and greater marketing resources than we do and may develop a competitive product that may inhibit the wide acceptance of our products, which is becoming increasingly more evident with the consolidation activity occurring in recent periods. Additionally, we believe that other manufacturers may be developing products that will compete directly with our products in the near future. As a result, we are continuously in the process of developing new products with the intent to improve customer appeal, address new technologies, and provide competitive advantages, where possible.
Research and Development
We focus our research and development efforts primarily on three areas: video/audio decoder technologies and secure media processing for the Smart TV market, Media Connectivity and IoT devices. In building new solutions, our strategy is to build fully integrated chipset solutions. To achieve and maintain technology leadership, we intend to continue to make advancements in the areas of video and audio compression and decompression as well as wired and wireless connectivity. We expect these advancements will include maintaining compatibility with emerging standards and multiple platforms, and making improvements to our current chip architecture to improve memory size and increase energy efficiency.
We have invested, and expect that we will continue to invest, substantial resources in research and development of performance enhancements, cost reductions and additional features for future generations of our solutions to remain competitive in our industry. During fiscal 2016, 2015 and 2014 our research and development expenses were $68.8 million, $67.5 million and $73.2 million, respectively. We expect incremental research and development expenses during fiscal 2017 related to our acquisition of Bretelon ranging from $2.0 million to $4.0 million.
We have assembled a qualified team of experienced engineers and technologists. As of January 30, 2016, we had 516 research and development employees. These personnel conduct all of our product development along with the assistance of a number of independent contractors and consultants.
Intellectual Property
Our success and future revenue growth depend, in part, on our ability to protect our intellectual property. We rely primarily on patent, copyright, trademark and trade secret laws as well as agreements with customers, suppliers and employees to protect our proprietary technologies and processes.
As of January 30, 2016, we held 134 issued patents and we had 32 patent applications pending for our technology. The expiration dates of these patents are within the next one to twenty years. We cannot assure that more patents will be issued or that such patents, even if issued, or our existing patents, will provide adequate protection for our competitive position. Additionally, because we have participated and continue to participate in developing various industry standards, we may be required to license some of our patents to others, including competitors, who develop products based on those standards.
We generally enter into confidentiality agreements with our employees and strategic partners, and typically control access to and distribution of product documentation and other proprietary information. Despite these precautions, it is possible that competitors or other unauthorized third parties may obtain, copy, use or disclose our technologies and processes, develop similar technology independently, or design around our patents. As such, any rights granted under our patents may not provide us with meaningful protection.
Manufacturing
We are a fabless semiconductor company and we do not own or operate a fabrication, packaging or testing facility. We depend on third-party vendors to manufacture, package and test our products. By outsourcing manufacturing, we are able to avoid the costs associated with owning and operating our own manufacturing facility. This allows us to focus our efforts on the design and marketing of our products.
Semiconductor fabrication
We rely on Taiwan Semiconductor Manufacturing Company, or TSMC, and, to a lesser extent, Grace Semiconductors and Global Foundries to fulfill the majority of our semiconductor fabrication needs, including chipset manufacturing. We believe that our fabless manufacturing approach provides us with the benefits of superior manufacturing capability as well as flexibility to move the manufacturing, assembly and testing of our products to those vendors that offer the best capability at an attractive price. Nevertheless, because we do not have a formal, long-term pricing agreement with our third-party manufacturers, our costs and services are subject to sudden price fluctuations based on the cyclical demand for semiconductors. In addition, we may be unable to secure sufficient capacity at our third-party manufacturers’ facilities, which could harm our ability to ship products to our customers in a timely manner and negatively impact our financial results in a particular period.
Assembly and test
Once our wafers have been manufactured, they are shipped from TSMC and our other third-party foundries to independent assembly and test facilities where they are sorted, packaged and tested. Generally, we store our sorted die in our die bank and only package the products for sale when we book an order. We outsource all packaging and testing of our products to independent third-party assembly and test facilities, primarily to Advanced Semiconductor Engineering, Inc., or ASE, in Taiwan. Our products are designed to use low-cost, standard packages and to be tested with widely available test equipment.
Quality assurance
We are committed to maintaining the highest level of quality in our products. We have designed and implemented a quality management system that provides the framework for continual improvement of products, processes and customer service to ensure customer satisfaction. We also rely on in-depth simulation studies, design review and verification during our design phase, bench testing to perform design validation, product reliability qualification to verify the product’s quality and manufacturing testing when the products are in production. To ensure consistent product quality, reliability and yield, together with our manufacturing logistics partners, we closely monitor the production cycle by regularly reviewing manufacturing process data from each wafer foundry and assembly subcontractor. We are ISO 9001 certified as are our key manufacturing partners, ASE and TSMC.
Environmental Laws
Our products and certain aspects of our operations are regulated under various environmental laws in the U.S., Europe and other parts of the world. These environmental laws are broad in scope and regulate numerous activities including the discharge of pollutants into the air and water, the management and disposal of hazardous substances and wastes, the cleanup of contaminated sites, the content of our products and the recycling and treatment and disposal of our products. Certain of these laws also pertain to tracking and labeling potentially harmful substances that have been incorporated into our products. These product labeling laws require us to know whether certain substances are present in our products, and to what degree. Environmental laws may limit the use of certain substances in our products, or may require us to provide product safety information to our customers if certain substances are present in our products in sufficient quantities. Additionally, we may be required to recycle certain of our products when they become waste. Compliance with environmental laws and regulations across multiple jurisdictions is complex and we regularly review known and pending laws and regulations to ensure we are compliant. We did not incur any material expenditures in fiscal 2016 in relation to any environmental matters.
Backlog
Our backlog, which primarily comprises cancellable purchase orders from our customers, at January 30, 2016, was approximately $23.7 million, compared with backlog of approximately $57.0 million at January 31, 2015. As our sales are made primarily through purchase orders from the delivery of products, the amount of backlog at any date depends upon various factors, including the timing of the receipt of orders, fluctuations in orders for existing product lines and the introduction of any new product lines. Accordingly, we believe that the amount of our backlog at any date is not a reliable measure of our future revenue.
Employees
As of January 30, 2016, we had 717 full-time employees worldwide, including 516 in research and development, 102 in sales and marketing, 74 in general and administration and 25 in operations and quality assurance.
During fiscal 2015 and 2014, we executed a restructuring plan which included targeted reductions in labor costs through headcount reduction and other related actions. We reduced our workforce over several geographic regions by 29 employees and 67 employees in fiscal 2015 and 2014, respectively, resulting in restructuring charges of $1.1 million and $1.7 million in fiscal 2015 and 2014, respectively.
Our future success will depend, in part, on our ability to continue to attract, retain and motivate highly qualified technical, marketing, engineering and management personnel who are in great demand. While we have works councils or employee representatives in certain countries, our employees are not represented by any collective bargaining unit and we have never experienced a work stoppage. We believe that our employee relations are satisfactory.
Corporate Information
We were incorporated in California in January 1982. Our principal offices are located at 47467 Fremont Boulevard, Fremont, California 94538, and our telephone number at that location is (510) 897-0200. Our website is located at www.sigmadesigns.com; however, the information in, or that can be accessed through, our website is not part of this report. Our annual reports on Form 10-K, quarterly reports on Form 10-Q, current reports on Form 8-K and amendments to such reports are available, free of charge, through the “Investor Overview” section of our website as soon as reasonably practicable after we electronically file such material with, or furnish it to, the Securities and Exchange Commission, or SEC. Additionally, copies of materials filed by us with the SEC may be accessed at the SEC’s Public Reference Room at 100 F Street, N.E., Washington, D.C. 20549 or at www.sec.gov. For information about the SEC’s Public Reference Room, contact 1-800-SEC-0330 or send an electronic message to the SEC at publicinfo@sec.gov.
|
ITEM 1A. |
RISK FACTORS |
Before deciding to purchase, hold or sell our common stock, you should carefully consider the risks described below in addition to the other information contained in this Report and in our other filings with the SEC, including subsequent reports on Forms 10-Q and 8-K. If any of the following risks actually occurs, our business, financial condition and results of operations could be harmed. In that case, the trading price of our common stock could decline and you might lose all or part of your investment in our common stock. The risks and uncertainties described below are not the only ones we face. You should also refer to other information set forth in this Form 10-K, including our consolidated financial statements and the related notes. Additional risks and uncertainties not presently known to us or that we currently deem immaterial may also impair our business operations.
Risks Related to Our Business and Our Industry
If we do not successfully anticipate market needs and develop products and product enhancements in a timely manner that meet those needs, or if those products do not gain market acceptance, we may not be able to compete effectively and our ability to generate revenue will suffer.
We may not be able to accurately anticipate future market needs or be able to develop new products or product enhancements to meet such needs or to meet them in a timely manner. Our ability to develop and deliver new products successfully will depend on various factors, including our ability to:
|
|
• |
accurately predict market requirements and evolving industry standards; |
|
|
• |
accurately design new chipset products; |
|
|
• |
timely complete and introduce new product designs; |
|
|
• |
timely qualify and obtain industry interoperability certification of our products and the equipment into which our products will be incorporated; |
|
|
• |
ensure that our subcontractors have sufficient foundry, assembly and test capacity and packaging materials and achieve acceptable manufacturing yields; |
|
|
• |
shift our products to smaller geometry process technologies to achieve lower cost and higher levels of design integration; and |
|
|
• |
gain market acceptance of our products and our customers’ products. |
If we fail to anticipate market requirements or to develop new products or product enhancements to meet those needs in a cost-effective and timely manner, it could substantially decrease market acceptance and sales of our present and future products and we may be unable to attract new customers or retain our existing customers, which would significantly harm our business and financial results.
Even if we are able to anticipate, develop and commercially introduce new products and enhancements, our new products or enhancements may not achieve widespread market acceptance. Any failure of our products to achieve market acceptance could adversely affect our business and financial results.
If demand for our chipsets declines or does not grow, or if growth of the consumer electronics market does not continue, we will be unable to increase or sustain our net revenue.
We expect our chipsets to account for a substantial majority of our net revenue for the foreseeable future. For fiscal 2016, sales of our chipsets represented a substantial amount of our net revenue. Even if the consumer electronic markets that we target continue to expand, manufacturers of consumer products in these markets may not choose to utilize our chipsets in their products. The markets for our products are characterized by frequent introduction of new technologies, short product life cycles and significant price competition. If we or our customers are unable to manage product transitions in a timely and cost effective manner, our net revenue would suffer. In addition, frequent technological changes and introduction of next generation products may result in inventory obsolescence which would increase our cost of revenue and adversely affect our operating performance. If demand for our chipsets declines or fails to grow or we are unable to develop new products to meet our customers’ demand, our net revenue could be harmed.
Our industry is highly competitive and we may not be able to compete effectively, which would harm our market share and cause our revenue to decline.
The markets in which we operate are extremely competitive and are characterized by rapid technological change, continuously evolving customer requirements and declining average selling prices. We may not be able to compete successfully against current or potential competitors. Most of our products compete with large semiconductor providers that have substantial experience and expertise in video, audio and multimedia technology and in selling to consumer equipment providers. Many of these companies have substantially greater engineering, marketing and financial resources than we have. As a result, our competitors may be able to respond better to new or emerging technologies or standards and to changes in customer requirements. Further, some of our competitors are in a better financial and marketing position from which to influence industry acceptance of a particular industry standard or competing technology than we are. Our competitors may also be able to devote greater resources to the development, promotion and sale of products, and may be able to deliver competitive products at a lower price. We also may face competition from newly established competitors, suppliers of products based on new or emerging technologies and customers who choose to develop their own chipsets. Additionally, some of our competitors operate their own fabrication facilities or may have stronger manufacturing partner relationships than we have. We expect our current customers, particularly in the Set-top Box market, to seek additional suppliers of chipsets for inclusion in their products, which will increase competition and could reduce our market share. If we do not compete successfully, our market share and net revenue could continue to decline.
Our restructuring efforts may not be effective, might have unintended consequences, and could negatively impact our business.
In fiscal 2013, fiscal 2014 and fiscal 2015, we launched and implemented restructuring plans to significantly reduce our operating expenses. Despite our efforts to structure our business to operate in a cost-effective manner, some cost reduction measures could have unexpected negative consequences, such as attrition among employees and a slowdown of development projects. While our restructuring efforts are intended to reduce our costs, we cannot be certain that all restructuring efforts will be successful, or that we will not be required to implement additional restructuring activities in the future. If we are unable to recognize the anticipated benefit from our restructuring plan, our results of operations would be harmed.
If we fail to achieve initial design wins for our products, we may be unable to recoup our investments in our products and revenue could decline.
We expend considerable resources in order to achieve design wins for our products, especially our new products and product enhancements, without any assurance that a customer will select our product. Once a customer designs a semiconductor into a product, it is likely to continue to use the same semiconductor or enhanced versions of that semiconductor from the same supplier across a number of similar and successor products for a lengthy period of time due to the significant costs and risks associated with qualifying a new supplier and potentially redesigning the product to incorporate a different semiconductor. As a result, if we fail to achieve an initial design win in a customer’s qualification process, we may lose the opportunity for significant sales to that customer for a number of its products and for a lengthy period of time, or we would only be able to sell our products to these customers as a second source, which usually means we would only be able to sell a limited amount of product to them. Also, even if we achieve new design wins with customers, these manufacturers may not purchase our products in sufficient volumes to recoup our development costs, and they can choose at any time to stop using our products, for example, if their own products are not commercially successful. This may cause us to be unable to recoup our investments in the development of our products and cause our revenue to decline.
We depend on a limited number of customers and any reduction, delay or cancellation of an order from these customers or the loss of any of these customers could cause our revenue to decline.
Our dependence on a limited number of customers means that the loss of a major customer or any reduction in orders by a major customer could materially reduce our net revenue and adversely affect our results of operations. We expect that sales to relatively few customers will continue to account for a significant percentage of our net revenue for the foreseeable future. We have no firm, long-term volume commitments from any of our major customers and we generally accept purchase commitments from our customers based upon their purchase orders. Customer purchase orders may be cancelled and order volume levels can be changed, cancelled or delayed with limited or no penalties. We have experienced fluctuations in order levels from period to period and expect that we will continue to experience such fluctuations and may experience cancellations in the future. We may not be able to replace the cancelled, delayed or reduced purchase orders with new orders. Any difficulty in the collection of receivables from key customers could also harm our business. Our customers in the Smart TV market typically are large-scale engagements as a result of the lengthy qualification process to a manufacturer’s TV platforms; and as a result, the loss of any Smart TV customer or failure to achieve a design win with a particular Smart TV target customer could have a materially adverse impact on our business and results of operations.
For fiscal 2016, Sunjet Components Corps accounted for 16% of our net revenue and, during fiscal 2015, Benchmark Electronics accounted for 13% of our net revenue. No customer accounted for more than 10% of our net revenue in fiscal 2014.
Our business also depends on demand for our chipsets from companies, such as large telecommunication carriers, who are not our direct customers but deploy IPTV set-top boxes that incorporate our chipsets. Large carriers often use multiple set-top box providers, who in turn sometimes use multiple contract manufacturers to purchase our chipsets and manufacture set-top boxes. Even though we do not sell our products directly to these companies that ultimately deploy set-top boxes to consumers, these companies have a significant impact on the demand for our chipsets. For example, a significant number of our chipsets are incorporated in set-top boxes and gateways deployed by AT&T. In the past, companies that deploy set-top boxes incorporating our chipsets have had significant fluctuations in demand, which has resulted in a decline in our business from our direct customers, such as OEMs and contract manufacturers. We may experience increased competition as companies that deploy set-top boxes incorporating our chipsets seek additional or alternate sources of supply of chipsets for inclusion in their products. Any decrease in the demand from the companies that deploy IPTV set-top boxes incorporating our chipsets, and in particular AT&T, could have a material and adverse effect on our net revenue and results of operations.
Our business depends on the demand for our chipsets from these large producers of consumer electronics within the television market, who are often not direct customers but deploy their televisions that incorporate our chipsets. Demand for our chipsets is determined by the number of design wins we are able to achieve within these producers’ suites of product offerings. Even though we often do not sell our products directly to these large producers, they have a significant impact on the demand for our chipsets. For example, a significant number of our chipsets are incorporated in televisions deployed by VIZIO and Roku. These companies that deploy televisions incorporating our chipsets may have significant fluctuations in demand, which could result in a decline in our business from our direct customers, such as OEMs and contract manufacturers. We may experience increased competition as companies that deploy televisions incorporating our chipsets seek additional or alternate sources of supply of chipsets for inclusion in their products. Any decrease in the demand from the companies that deploy televisions incorporating our chipsets, and in particular VIZIO and Roku, could have a material and adverse effect on our net revenue and results of operations.
Our inability to manage transitions to new solutions and products in an effective manner could reduce the demand for our solutions and products and the profitability of our operations.
Continuing improvements in technology result in frequently updated solutions and new product introductions, short product life cycles, and improvements in product performance characteristics. If we cannot manage the transition to new solutions offerings and their respective products and services in an effective manner, customer demand for our solutions and products could diminish and our profitability could suffer. We are increasingly sourcing new products and transitioning existing products through our contract manufacturers and manufacturing outsourcing relationships in order to generate cost efficiencies, deliver products faster and better serve our customers. The success of product transitions depends on a number of factors that include the availability of sufficient quantities of components at attractive costs and our ability to sell and manage inventory of older generation products. In addition, product transitions present execution challenges and risks, including the risk that new or upgraded products may have quality issues or other defects.
We base orders for inventory on our forecasts of our customers’ demand and if our forecasts are inaccurate, our financial condition and liquidity will suffer.
We place orders with our suppliers based on our forecasts of our customers’ demand. Our forecasts are based on multiple assumptions, each of which may introduce errors into our estimates. When the demand for our customers’ products increases significantly, we may not be able to meet demand on a timely basis and we may need to expend a significant amount of effort and time working with our customers to allocate a limited supply and maintain positive customer relations. If we underestimate customer demand, we may forego revenue opportunities, lose market share and damage our customer relationships. Conversely, if we overestimate customer demand, we may allocate resources to manufacturing products that we may not be able to sell when we expect to or at all. If one or more of our customers should experience insolvency or illiquidity and fail to obtain sufficient financing to enable it to sustain operations, this could affect the collectability of a portion of our accounts receivable, as well as the salability of any inventory we hold which is specific to that customer. While we seek to maintain adequate reserves for such risks, there can be no assurance that such reserves will always be adequate. For example, during fiscal 2016, 2015 and 2014, we recorded a provision for excess inventory of $3.2 million, $4.3 million and $0.8 million, respectively. When we have excess or obsolete inventory, the value of our inventory declines, which increases our cost of revenue and reduces our liquidity.
We have engaged, and may in the future engage in acquisitions of other businesses and technologies which could divert our attention and prove difficult to integrate with our existing business and technology.
We continue to consider investments in and acquisitions of other businesses, technologies or products as part of our efforts to improve our market position, broaden our technological capabilities and expand our product offerings. For example, in November 2015, in connection with our acquisition of Bretelon, Inc., we added significant research and development operations and hired approximately 7 new employees. In May 2012, we completed the acquisition of certain assets used in the digital TV business of Trident Microsystems, where we hired approximately 320 new employees. In March 2011, we completed the acquisition of certain assets from a large computer manufacturer and in November 2009, we completed the acquisition of CopperGate Communications Ltd., an Israeli company, which added substantial operations, including 141 employees. We also completed the acquisition of Zensys Holdings Corporation in December 2008, the acquisition of certain assets of the VXP Group from Gennum Corporation in February 2008 and the acquisition of Blue7 Communications in February 2006. In the future, we may not be able to acquire or successfully identify companies, products or technologies that would enhance our business. Once we identify a strategic opportunity, the process to consummate a transaction could divert our attention from the operation of our business causing our financial results to decline.
Acquisitions have and may require large one-time charges and can result in increased debt or contingent liabilities, adverse tax consequences, additional stock-based compensation expense, and the recording and subsequent amortization of amounts related to certain purchased intangible assets, any of which items could negatively impact our results of operations. We have and may also record goodwill in connection with an acquisition and incur goodwill impairment charges in the future. For example, in fiscal 2012, we recorded a goodwill impairment charge of $45.1 million, which represented a full write-off of all goodwill associated with our acquisitions prior to the acquisition of Bretelon, which had a materially adverse impact on our results of operations. In addition, in order to complete acquisitions, we may issue equity securities and incur debt, which would result in dilution to our existing shareholders and could negatively impact profitability.
We may encounter challenges in integrating acquired businesses. Integrating acquired businesses involves a number of risks, including:
|
|
• |
potential disruption of our ongoing business and the diversion of management resources from other business concerns; |
|
|
• |
unexpected costs or incurring unknown liabilities; |
|
• |
managing a larger combined company; |
|
|
• |
difficulties relating to integrating the operations and personnel of the acquired businesses; |
|
• |
consolidating corporate and administrative infrastructures and eliminating duplicative operations; |
|
|
• |
adverse effects on the existing customer relationships of acquired companies; and |
|
|
• |
adverse effects associated with entering into markets and acquiring technologies in areas in which we have little experience. |
Many of these factors will be outside of our control and any one of them could result in increased costs, decreases in the amount of expected revenue and diversion of management’s time and energy, which could materially impact our business, financial condition and results of operations.
The timing of our customer orders and product shipments can adversely affect our operating results and stock price.
Our net revenue and operating results depend upon the volume and timing of customer orders received during a given period and the percentage of each order that we are able to ship and recognize as net revenue during each period. Customers may change their cycle of product orders from us, which would affect the timing of our product shipments. Any failure or delay in the closing of orders expected to occur within a quarterly period, particularly from significant customers, would adversely affect our operating results. Further, to the extent we receive orders late in any given quarter, we may not be able to ship products to fill those orders during the same period in which we received the corresponding order which could have an adverse impact on our operating results for that period.
We have faced and may, in the future, face intellectual property claims that could be costly to defend and result in our loss of significant rights.
The semiconductor industry is characterized by frequent litigation regarding patent and intellectual property rights. We believe that it may be necessary, from time to time, to initiate litigation against one or more third parties to preserve our intellectual property rights. From time to time, we have received, and may receive in the future, notices that claim we have infringed upon, misappropriated or misused other parties' proprietary rights. We have also been subject to claims based on our alleged failure to comply with license terms. Any of the foregoing events or claims could result in litigation. For example, in fiscal 2013, we were named in a lawsuit alleging certain of our products infringe the patents held by another party. In addition, we intervened in a patent infringement lawsuit based upon now expired patents that was previously brought by U.S. Ethernet Innovations, LLC, or USEI, against AT&T Mobility, Inc., or AT&T, regarding the allegedly infringing AT&T product that contains our chipset. USEI has asserted counter-claims against us in this action. We have settled this matter, but only after incurring legal and other costs. From time to time, we have been subject to audits of our compliance with license agreements. As a result of these audits, we have been required to make additional payments to our licensing partners. In February 2014, we were sued by a third-party licensor who claimed we breached our license agreement with them. Any litigation or additional audits of our licensing compliance could result in significant expense to us and divert the efforts of our technical and management personnel. In the event of an adverse result in any such litigation or arbitration or additional payments from any licensing audits, we could be required to pay substantial damages, cease the manufacture, use and sale of certain products or expend significant resources to develop non-infringing technology or to obtain licenses to the technology that is the subject of the litigation or audit, and we may not be successful in such development or in obtaining such licenses on acceptable terms, if at all. In addition, patent disputes in the electronics industry have often been settled through cross-licensing arrangements. Although we have a portfolio of applicable issued patents, we may not be able to settle an alleged patent infringement claim through a cross-licensing arrangement.
To remain competitive, we need to continue to transition our chipsets to increasingly smaller sizes while maintaining or increasing functionality, and our failure to do so may harm our business.
We periodically evaluate the benefits, on a product-by-product basis, of migrating to more advanced technology to reduce the size of our chipsets. The smaller chipset size reduces our production and packaging costs, which enables us to be competitive in our pricing. We also continually strive to increase the functionality of our chipsets, which is essential to competing effectively in our target markets. The transition to smaller geometries while maintaining or increasing functionality requires us to work with our contractors to modify the manufacturing processes, which results in the redesign of existing products. This effort requires considerable development investment and a risk of reduced yields as a new process is brought to acceptable levels of operating and quality efficiency. In the past, we have experienced difficulties in shifting to smaller geometry process technologies or new manufacturing processes, which resulted in reduced manufacturing yields, delays in product deliveries and increased expenses. We may face similar difficulties, delays and expenses as we continue to transition our products to smaller geometry processes, all of which could harm our relationships with our customers, and our failure to do so would impact our ability to provide competitive prices to our customers, which would have a negative impact on our sales.
The average selling prices of semiconductor products have historically decreased rapidly and will likely do so in the future, which could harm our revenue and gross margins.
The semiconductor industry, in general, and the consumer electronics markets that we target, specifically, are characterized by intense price competition, frequent introductions of new products and short product life cycles, which can result in rapid price erosion in the average selling prices for semiconductor products. A decline in the average selling prices of our products could harm our revenue and gross margins. The willingness of customers to design our chipsets into their products depends to a significant extent upon our ability to sell our products at competitive prices. In the past, we have reduced our prices to meet customer requirements or to maintain a competitive advantage. Reductions in our average selling prices to one customer could impact our average selling prices to all customers. If we are unable to reduce our costs sufficiently to offset declines in product selling prices or are unable to introduce more advanced products with higher margins in a timely manner, we could experience declines in our net revenue and gross margins.
We have added a number of new directors to our board of directors over the past several years, which may lead to changes in the execution of our business strategies and objectives.
Four of our five directors have served on our board of directors for a relatively short period of time. We appointed two new directors in fiscal 2015. Because of these additions, our current board of directors has not worked together as a group for an extended period of time. This turnover in our board of directors may lead to changes in the execution of our business strategies and objectives as these new directors analyze our business and contribute to the formulation of our business strategies and objectives.
We rely upon patents, trademarks, copyrights and trade secrets to protect our proprietary rights and if these rights are not sufficiently protected, it could harm our ability to compete and to generate revenue.
Our ability to compete may be affected by our ability to protect our proprietary information. As of January 30, 2016, we held 151 patents worldwide and these patents will expire within the next one to twenty years. These patents cover the core technology underlying our products. We have filed certain patent applications and are in the process of preparing others. We cannot assure you that any additional patents for which we have applied will be issued or that any issued patents will provide meaningful protection of our product innovations. Like other semiconductor companies, we rely primarily on trade secrets and technological know-how in the conduct of our business. We use measures such as confidentiality agreements and protected servers to safeguard our intellectual property. However, these methods of protecting our intellectual property may not be sufficient.
The complexity of our products could result in unforeseen delays or expenses and in undetected defects, which could damage our reputation with current or prospective customers, adversely affect the market acceptance of new products and result in warranty claims.
Highly complex products, such as those that we offer, frequently contain defects, particularly when they are first introduced or as new versions are released. Our chipsets contain highly sophisticated silicon technology and complex software. In the past we have experienced, and may in the future experience, defects in our products, both with our chipsets and the related software products we offer. If any of our products contain defects or have reliability, quality or compatibility problems, our reputation may be damaged and our customers may be reluctant to buy our products, which could harm our ability to retain existing customers and attract new customers. In addition, these defects could interrupt or delay sales or shipment of our products to our customers. Manufacturing defects may not be detected by the testing process performed by our subcontractors. If defects are discovered after we have shipped our products, it could result in unanticipated costs, order cancellations or deferrals and product returns or recalls, harm to our reputation and a decline in our net revenue, income from operations and gross margins.
In addition, our agreements with some customers contain warranty provisions which provide the customer with a right to damages if a defect is traced to our products or if we cannot correct errors in our product reported during the warranty period. However, any contractual limitations to our liability may be unenforceable in a particular jurisdiction. We do not have insurance coverage for any warranty or product liability claims and a successful claim could require us to pay substantial damages. A successful warranty or product liability claim against us, or a requirement that we participate in a product recall, could have adverse effects on our business results.
If our third-party manufacturers do not achieve satisfactory yields or quality, our relationships with our customers and our reputation will be harmed, which in turn would harm our operating results and financial performance.
The fabrication of semiconductors is a complex and technically demanding process. Minor deviations in the manufacturing process can cause substantial decreases in yields and, in some cases, cause production to be stopped or suspended. Although we work closely with our third-party manufacturers to minimize the likelihood of reduced manufacturing yields, their facilities have from time to time experienced lower than anticipated manufacturing yields that have resulted in our inability to meet our customer demand. It is not uncommon for yields in semiconductor fabrication facilities to decrease in times of high demand, in addition to reduced yields that may result from normal wafer lot loss due to workmanship or operational problems at these facilities. When these events occur, especially simultaneously, as happens from time to time, we may be unable to supply our customers’ demand. Many of these problems are difficult to detect at an early stage of the manufacturing process and may be time consuming and expensive to correct. Poor yields from the wafer foundries or defects, integration issues or other performance problems in our products could cause us significant customer relations and business reputation problems or force us to sell our products at lower gross margins and therefore harm our financial results.
Recent regulations related to conflict-free minerals may force us to incur additional expenses which could harm our financial results and decrease our cash balance.
In August 2012, under the Dodd-Frank Wall Street Reform and Consumer Protection Act of 2010 (“Dodd-Frank”), the SEC adopted new requirements for companies that use certain minerals and derivative metals (referred to as “conflict minerals,” regardless of their actual country of origin) in their products. These requirements require companies to investigate, disclose and report whether or not such metals originated from the Democratic Republic of Congo or adjoining countries. We have incurred additional expenses in our efforts to comply with these recent regulations; such expenses may become more significant in the future, which could harm our financial results and decrease our cash balance. In July 2013, the U.S. Court of Appeals for the District of Columbia rejected a challenge to the conflict minerals rules that had been brought in October 2012 by the National Association of Manufacturers and the U.S. Chamber of Commerce. In January 2013, the SEC conflict minerals disclosure rules became effective, requiring companies to make their first conflict minerals disclosures on or before May 31, 2014 for the 2013 calendar year. In response to this regulation, we evaluate our use of minerals and derivative metals on an annual basis, the most recent of which was filed with the SEC on the specialized disclosure report on Form SD on June 1, 2015 concluding that our supply chain is conflict free undeterminable. We believe we are in full compliance with the disclosure requirements as stated within the aforementioned regulation.
In the semiconductor industry, these minerals are most commonly found in gold and other metals. As there may be only a limited number of suppliers offering “conflict free” metals, we cannot be sure that our contract manufacturers and other suppliers will be able to obtain necessary metals in sufficient quantities or at competitive prices. Also, since our supply chain is complex and some suppliers will not share their confidential supplier information, we may face challenges with our customers and suppliers if we are unable to sufficiently verify that the metals used in our products are “conflict free.” Some customers may choose to disqualify us as a supplier and we may have to write off inventory in the event that it becomes unsalable as a result of these regulations.
If the growth of demand in the consumer electronics market does not continue, our ability to increase our revenue could suffer.
Our business is highly dependent on developing sectors of the consumer electronics market, including the Smart TV, Media Connectivity, Set-top Box, and IoT Devices markets. The consumer electronics market is highly competitive and is characterized by, among other things, frequent introductions of new products and short product life cycles. The consumer electronics market may also be negatively impacted by a slowdown in overall consumer spending. The worldwide economies, generally, and consumer spending, specifically, have exhibited significant volatility, which has negatively impacted our target markets from time to time. If our target markets do not grow as rapidly or to the extent we anticipate, our business could suffer. We expect the majority of our revenue for the foreseeable future to come from the sale of our chipsets for use in emerging consumer applications. Our ability to sustain and increase revenue is in large part dependent on the continued growth of these rapidly evolving market sectors, whose future is largely uncertain. Many factors could impede or interfere with the expansion of these consumer market sectors, including consumer demand in these sectors, general economic conditions, and other competing consumer electronic products, delays in the deployment of telecommunications video services and insufficient interest in new technology innovations. In addition, if market acceptance of the consumer products that utilize our products does not occur as expected, our business could be harmed.
Due to the cyclical nature of the semiconductor industry, our operating results may fluctuate significantly, which could adversely affect the market price of our common stock.
The semiconductor industry is highly cyclical and subject to rapid change and evolving industry standards and, from time to time, has experienced significant downturns. These downturns are characterized by decreases in product demand, excess customer inventory and accelerated erosion of prices. These factors have caused, and could cause, substantial fluctuations in our net revenue and in our operating results. Any downturns in the semiconductor industry may be severe and prolonged, and any failure of this industry to fully recover from downturns could harm our business. The semiconductor industry also periodically experiences increased demand and production capacity constraints, which may affect our ability to ship products. Accordingly, our operating results have varied and may vary significantly as a result of the general conditions in the semiconductor industry, which could cause our stock price to decline.
Our ability to raise capital in the future may be limited and our failure to raise capital when needed could prevent us from executing our growth strategy.
We believe that our existing cash and cash equivalents, and short-term and long-term marketable securities will be sufficient to meet our anticipated cash needs for at least the next twelve months. The timing and amount of our working capital and capital expenditure requirements may vary significantly depending on numerous factors, including:
|
|
● |
market acceptance of our products; |
|
|
● |
the need to adapt to changing technologies and technical requirements; |
|
|
● |
the existence of opportunities for expansion; and |
|
|
● |
access to and availability of sufficient management, technical, marketing and financial personnel. |
If our capital resources are insufficient to satisfy our liquidity requirements, we may seek to sell additional equity securities or debt securities or obtain debt financing. In fiscal 2016, we generated $0.8 million in cash from our operating activities. During the fourth quarter of fiscal 2016, we made cash payments aggregating $19.3 million, net of $0.1 million of cash acquired, related to the acquisition of the Mobile IoT business, Bretelon. In fiscal 2015, we generated $15.7 million in cash from our operating activities. In fiscal 2014, we generated $21.4 million in cash from our operating activities. During the fourth quarter of fiscal 2014, we repurchased approximately 0.5 million shares of our common stock at a weighted average price of $4.83 for a total value of $2.3 million. The stock repurchase was pursuant to our Board of Directors authorization in fiscal 2014. In fiscal 2013, we used $14.6 million of our cash in our operating activities. During the second quarter of fiscal 2013, we made cash payments aggregating $38.2 million related to the acquisition of certain assets of the DTV business of Trident Microsystems. The amount of cash we used for these acquisitions and common stock repurchases could limit our ability to execute our business plans and require us to raise additional capital in the future in order to fund any further repurchases or for other purposes. The sale of additional equity securities or convertible debt securities would result in additional dilution to our shareholders. Additional debt would result in increased expenses and could result in covenants that would restrict our operations. We have not made arrangements to obtain additional financing and there is no assurance that financing, if required, will be available in amounts or on terms acceptable to us, if at all.
Changes in our effective tax rate or tax liability may have an adverse effect on our results of operations.
As a global company, we are subject to taxation in the Netherlands, Hong Kong, Israel, Singapore, the United States and various other countries and states. Significant judgment is required to determine and estimate worldwide tax liabilities. Any significant change in our future effective tax rates could adversely impact our consolidated financial position, results of operations and cash flows. Our future effective tax rates may be adversely affected by a number of factors including:
|
|
● |
changes in tax laws in the countries in which we operate or the interpretation of such tax laws; |
|
|
● |
changes in the valuation of our deferred tax assets and liabilities, including the effect of foreign exchange rate fluctuations relative to the US Dollar; |
|
|
● |
increases in expenses not deductible for tax purposes, including write-offs of acquired developed technology and impairment of goodwill in connection with acquisitions; |
|
|
● |
changes in stock-based compensation expense; |
|
|
● |
changes in generally accepted accounting principles; and |
|
|
● |
our ability to use our tax attributes such as research and development tax credits and net operating losses of acquired companies to the fullest extent. |
We anticipate that a portion of our consolidated pre-tax income will continue to be subject to foreign tax at relatively lower tax rates when compared to the United States’ federal statutory tax rate. Our future effective income tax rates could be adversely affected if tax authorities challenge our international tax structure, if the relative mix of United States and international income or losses changes for any reason. Accordingly, there can be no assurance that our income tax rate will be less than the United States’ federal statutory rate.
We have a history of fluctuating operating results, including net losses in fiscal 2014 and 2015 and we may not be able to return to profitability in the future, which may cause the market price of our common stock to decline.
We have a history of fluctuating operating results. We reported net income of $9.1 million in fiscal 2011, a net loss of $168.0 million in fiscal 2012, a net loss of $101.8 million in fiscal 2013, a net loss of $11.0 million in fiscal 2014, a net loss of $21.7 million in fiscal 2015 and net income of $0.2 million in fiscal 2016. While we achieved profitability during fiscal 2016, it was due to a one-time event and may not be sustainable in future periods. We recorded a one-time gain during fiscal 2016 resulting from amounts awarded from arbitration associated with the previous sale of a development project of approximately $7.6 million, without which, we would have reported a net loss. To return to operational profitability, we will need to successfully develop new products and product enhancements and sustain higher revenue while controlling our cost and expense levels. In recent years, we made significant investments in our product development efforts and have expended substantial funds to enhance our sales and marketing efforts and otherwise operate our business. However, we may not realize the benefits of these investments. We may incur operating losses in future quarterly periods or fiscal years, which in turn could cause the price of our common stock to decline.
Our sales cycle can be lengthy, which could result in uncertainty and delays in generating net revenue.
Because our products are based on constantly evolving technologies, we have experienced a lengthy sales cycle for some of our chipsets, particularly those designed for set-top box applications in the IPTV media processor market and those designed for the Smart TV market. After we have qualified a product with a customer, the customer will usually test and evaluate our product with its service provider prior to the customer completing the design of its own equipment that will incorporate our product. Our customers and the telecommunications carriers our customers serve may need from three months to more than a year to test evaluate and adopt our product and an additional three to more than nine months to begin volume production of equipment that incorporates our product. Our complete sales cycle typically ranges from nine to eighteen months, but could be longer. As a result, we may experience a significant delay between the time we increase expenditures for research and development, sales and marketing efforts and inventory and the time we generate net revenue, if any, from these expenditures. In addition, because we do not have long-term commitments from our customers, we must repeat our sales process on a continual basis even for current customers looking to purchase a new product. As a result, our business could be harmed if a customer reduces or delays its orders, chooses not to release products incorporating our chipsets or elects not to purchase a new product or product enhancements from us.
The complexity of our international operations may increase our operating expenses and disrupt our business.
We transact business and have operations worldwide. For example, we derive a substantial portion of our net revenue from our customers outside of North America and we plan to continue expanding our business in international markets in the future. For fiscal 2016, we derived 81% of our revenue from customers outside of North America. We also have significant international operations, including research and development facilities in Shanghai, Vietnam, Singapore, Germany, Israel, France and The Netherlands; sales and research and development facilities in Taiwan, Israel and Denmark; sales and sales support facilities in South Korea, Japan, Shenzhen and Hong Kong, and a distribution facility in Singapore.
As a result of our international business, we are affected by economic, regulatory and political conditions in foreign countries, including the imposition of government controls, changes or limitations in trade protection laws, unfavorable changes in tax treaties or laws, varying statutory equity requirements, difficulties in collecting receivables and enforcing contracts, natural disasters, labor unrest, earnings expatriation restrictions, misappropriation of intellectual property, changes in import/export regulations, tariffs and freight rates, economic instability, public health crises, acts of terrorism and continued unrest in many regions and other factors, which could have a material impact on our international revenue and operations. For example, we may experience reduced intellectual property protection in some countries.
Our results of operations could also be adversely affected by exchange rate fluctuations, which could increase the sales price in local currencies of our products in international markets. Overseas sales and purchases to date have been denominated in U.S. dollars. We do not hedge such exposures. See “Foreign currency exchange rate sensitivity” under Part II Item 7A “Quantitative and Qualitative Disclosures about Market Risk” in this Form 10-K. Moreover, local laws and customs in many countries differ significantly from those in the United States. We also face challenges in staffing and managing our global operations. If we are unable to manage the complexity of our global operations successfully, our financial performance and operating results could suffer.
Currency exchange rate fluctuations could result in lower revenues, higher costs and decreased margins and earnings.
Large portions of our products are sold outside of the United States and are denominated in U.S. Dollars. As a result, sales may weaken if the U.S. Dollar strengthens against foreign currencies, effectively increasing the cost of our products for our international customers. Our international expenses are derived from operations in foreign currencies, and these expenses could be affected by currency fluctuations, including amounts recorded in foreign currencies and translated into U.S. Dollars for consolidated financial reporting, which increases our exposure to fluctuations in foreign currency exchange rates relative to the U.S. Dollar. Currency exchange rate fluctuations could also disrupt the business of our overseas ODM/OEM customers by making their purchases of materials more expensive and more difficult to finance. Foreign currency fluctuations could have an adverse effect on our results of operations and financial condition.
A volatile global economy could negatively affect our business, results of operations and financial condition.
Uncertainty in global economic conditions poses a risk to the overall economy as consumers and businesses may defer purchases in response to tighter credit and negative financial news, which could negatively affect demand for our products and other related matters. Consequently, demand for our products could be different from our expectations due to factors including:
|
|
● |
changes in business and economic conditions, including conditions in the credit market that could negatively affect consumer confidence; |
|
|
● |
customer acceptance of our products and those of our competitors; |
|
|
● |
changes in customer order patterns including order cancellations; and |
|
|
● |
reductions in the level of inventory our customers are willing to hold. |
Because many of our products are incorporated into customer devices, a general slowdown in the economy or in consumer confidence could have a significant negative impact on the demand for the products that incorporate our products, which in turn would have a negative impact on our results of operations. There could also be a number of secondary effects from the current uncertainty in global economic conditions, such as insolvency of suppliers resulting in product delays, an inability of our customers to obtain credit to finance purchases of our products or a desire of our customers to delay payment to us for the purchase of our products. The effects, including those mentioned above, of the current global economic environment could negatively impact our business, results of operations and financial condition.
We rely on a limited number of third-party manufacturers for the fabrication, assembly and testing of our chipsets and the failure of any of these third-party manufacturers to deliver products or otherwise perform as requested could damage our relationships with our customers, decrease our sales and limit our growth.
We are a fabless semiconductor company and thus we do not own or operate a fabrication or manufacturing facility. We depend on independent manufacturers, each of whom is a third-party manufacturer for numerous companies, to manufacture, assemble and test our products. We currently rely on Taiwan Semiconductor Manufacturing Corporation, or TSMC, and, to a lesser extent, Grace Semiconductors, or Grace, and Global Foundries, or Global, to produce a majority of all of our chipsets. We rely on Advanced Semiconductor Engineering, Inc., or ASE, to assemble, package and test substantially all of our products. These third-party manufacturers may allocate capacity to the production of other companies’ products while reducing product deliveries or the provision of services to us on short notice or they may increase the prices of the products and services they provide to us with little or no notice. In particular, other clients that are larger and better financed than we are or that have long-term agreements with ASE, TSMC, Grace or Global may cause any or all of them to reallocate capacity to those clients, decreasing the capacity available to us.
If we fail to effectively manage our relationships with the third-party manufacturers, if we are unable to secure sufficient capacity at our third-party manufacturers’ facilities or if any of them should experience delays, disruptions or technical or quality control problems in our manufacturing operations or if we had to change or add additional third-party manufacturers or contract manufacturing sites, our ability to ship products to our customers could be delayed, our relationships with our customers would suffer and our market share and operating results would suffer. If our third-party manufacturers’ pricing for the products and services they provide increases and we are unable to pass along such increases to our customers, our operating results would be adversely affected. Also, the addition of manufacturing locations or additional third-party subcontractors would increase the complexity of our supply chain management. Moreover, all of our product manufacturing, assembly and packaging is performed in Asian countries and is therefore subject to risks associated with doing business in these countries such as quarantines or closures of manufacturing facilities due to the outbreak of viruses such as swine flu, SARS, avian flu or any similar outbreaks. Each of these factors could harm our business and financial results.
In the event we seek or are required to use a new manufacturer to fabricate or to assemble and test all or a portion of our chipset products, we may not be able to bring new manufacturers on-line rapidly enough, which could damage our relationships with our customers, decrease our sales and limit our growth.
We use a single wafer foundry to manufacture a substantial majority of our products and to a lesser extent two other foundries. We use a single source to assemble and test substantially all of our products. This exposes us to a substantial risk of delay, increased costs and customer dissatisfaction in the event our third-party manufacturers are unable to provide us with our chipset requirements. Particularly during times when semiconductor capacity is limited, we may seek to, and in the event that our current foundry were to stop producing wafers for us altogether, we would be required to, qualify one or more additional wafer foundries to meet our requirements, which would be time consuming and costly. In order to bring any new foundries on-line, our customers and we would need to qualify their facilities, which process could take as long as several months. Once qualified, each new foundry would then require an additional number of months to actually begin producing chipsets to meet our needs, by which time our perceived need for additional capacity may have passed, or the opportunities we previously identified may have been lost to our competitors. Similarly, qualifying a new provider of assembly, packaging and testing services would be a lengthy and costly process and, in both cases, they could prove to be less reliable than our existing manufacturers, which could result in increased costs and expenses as well as delays in deliveries of our products to our customers.
We may not be able to effectively manage our growth or develop our financial and managerial control and reporting systems, and we may need to incur significant expenditures to address the additional operational and control requirements of our growth, either of which could harm our business and operating results.
To continue to grow, we must continue to expand and improve our operational, engineering, accounting and financial systems, procedures, controls and other internal management systems. This may require substantial managerial and financial resources and our efforts in this regard may not be successful. Our current systems, procedures and controls may not be adequate to support our future operations. We are currently in the process of integrating research and development operations from our most recent acquisition, Bretelon. Our integration efforts could be costly and time consuming. If we fail to adequately manage our growth or to improve and develop our operational, financial and management information systems or fail to effectively motivate or manage our current and future employees, the quality of our products and the management of our operations could suffer, which could adversely affect our operating results.
Our ability to develop, market and sell products could be harmed if we are unable to retain or hire key personnel.
Our future success depends upon our ability to recruit and retain the services of key executive, engineering, finance and accounting, sales, marketing and support personnel. Our Chief Executive Officer has served in that role for us for over thirty years and the loss of his services could have a negative impact on our operations. The supply of highly qualified individuals, in particular engineers in very specialized technical areas, or sales people specializing in the semiconductor industry, is limited and competition for such individuals is intense. As part of our restructuring efforts in fiscal 2013, 2014, and 2015 we terminated a significant number of employees and also imposed work furloughs. Our remaining employees, many of whom are highly qualified engineers, may be discomforted by these actions and seek alternative employment opportunities. None of our officers or key employees is bound by an employment agreement for any specific term. The loss of the services of any of our key employees, the inability to attract or retain key personnel in the future or delays in hiring required personnel to fill existing vacancies, particularly engineers and sales personnel, and the complexity and time involved in hiring and training new employees, could delay the development and introduction of new products, and negatively impact our ability to market, sell or support our products.
Litigation due to stock price volatility or other factors could cause us to incur substantial costs and divert our attention and resources.
Securities class action litigation has often been brought against a company following periods of volatility in the market price of its securities. Companies in the semiconductor industry, such as ours, and other technology industries are particularly vulnerable to this kind of litigation due to the high volatility of their stock prices. While we are not aware of any such contemplated class action litigation against us, we may in the future be a party to such securities litigation. Any future lawsuits to which we may become a party will likely be expensive and time consuming to investigate, defend and resolve. Such costs, which include investigation and defense, the diversion of our attention and resources and any losses resulting from these claims, could significantly increase our expenses and adversely affect our profitability and cash flow.
Our business is subject to seasonality, which may cause our revenue to fluctuate.
Our business is subject to seasonality as a result of our target markets, particularly the Smart TV market, which historically has peaked in the third quarter. We sell a number of our semiconductor products to our customers who manufacture products for the consumer electronics market. Our customers who manufacture products for the consumer electronics market typically experience seasonality in the sales of their products which in turn may affect the timing and volume of orders for our chipsets. We expect to experience lower sales in our first and/or fourth fiscal quarters and higher sales in our second and/or third fiscal quarters as a result of the seasonality of demand associated with the consumer electronics markets. For example, we expect that our Smart TV market may experience seasonality typical of the consumer electronics markets, resulting in slower Smart TV sales in the first and fourth quarter of each calendar year and strongest Smart TV sales in the third calendar quarter. As a result of the potential seasonality in our business, our operating results may vary significantly from quarter to quarter.
Regional instability in Israel may adversely affect business conditions and may disrupt our operations and negatively affect our revenues and profitability.
As a result of our acquisition of CopperGate in November 2009, we have engineering facilities, administrative and sales support operations and, as of January 30, 2016, we had 54 employees located in Israel. Accordingly, political, economic and military conditions in Israel may directly affect our business. Since the establishment of the State of Israel in 1948, a number of armed conflicts have taken place between Israel and its Arab neighbors, as well as incidents of civil unrest. In addition, in the past, Israel and companies doing business with Israel has been the subject of economic boycotts. Although Israel has entered into various agreements with Egypt, Jordan and the Palestinian Authority, Israel has been and is subject to civil unrest and terrorist activity, with varying levels of severity since September 2000. Recently, there has been an increase in civil unrest and political instability in the Middle East, including the recent escalation of conflict in Syria and between armed forces of the Israeli and the Palestinian Authority. Business stoppages for affected areas were and may be necessary. Any future armed conflicts, civil unrest or political instability in the region may negatively affect business conditions and adversely affect our results of operations.
In addition, our business insurance does not cover losses that may occur as a result of events associated with the security situation in the Middle East. Although the Israeli government currently covers the reinstatement value of direct damages that are caused by terrorist attacks or acts of war, we cannot assure you that this government coverage will be maintained. Any losses or damages incurred by us could have a material adverse effect on our business and financial results.
Regional instability in Vietnam may adversely affect business conditions and may disrupt our operations and negatively affect our revenue and profitability.
We have a research and development facility and, as of January 30, 2016, we had 89 employees located in Vietnam. Accordingly, political conditions in Vietnam may directly affect our business. The bilateral relations between China and Vietnam have been and continue to be turbulent. For example, in May 2014, China dispatched an oil rig to a contested area of the South China Sea which is claimed by both China and Vietnam. As a response, violent protests erupted in Vietnam resulting in collateral damage to factories and infrastructure. Consequently, business stoppages for affected businesses and/or areas may be necessary. Any future protests due to political conflicts in the region may negatively affect business conditions and adversely affect our results of operations.
In addition, our business insurance does not cover losses that may occur as a result of events associated with the security situation brought on due to political instability in Vietnam. Although the Vietnamese government is proactively taking steps to protect against potential damages to factories and infrastructure and curtail business stoppages, there can be no assurance of their success. Any losses or damages incurred by us could have a material adverse effect on our business and financial results.
The income tax benefits in Israel to which we are currently entitled from our approved enterprise program may be reduced or eliminated by the Israeli government in the future and also require us to satisfy specified conditions. If they are reduced or if we fail to satisfy these conditions, we may be required to pay increased taxes and would likely be denied these benefits in the future.
The Investment Center of the Ministry of Industry, Trade and Labor has granted “approved and/or beneficiary enterprise” status to certain product development programs at our facility in Tel Aviv. Sigma Designs Israel’s taxable income from the approved and beneficiary enterprise program was exempt from tax for a period of two years commencing calendar year 2008 and 2009, respectively, and commencing calendar year 2014 and will be subject to a reduced tax rate for an additional eight years thereafter, depending on the percentage of Sigma Designs Israel’s share capital held by non-Israelis. The Israeli government may reduce, or eliminate in the future, tax benefits available to approved enterprise programs. Our approved and beneficiary programs and the resulting tax benefits may not continue in the future at their current levels or at any level. The termination or reduction of these tax benefits would likely increase our tax liability. Additionally, the benefits available to an approved and beneficiary enterprise program are dependent upon the fulfillment of conditions stipulated under applicable law and in the certificate of approval. If we fail to comply with these conditions, in whole or in part, we may be required to pay additional taxes for the period in which we benefited from the tax exemption or reduced tax rates and would likely be denied these benefits in the future. In either case, the amount by which our taxes would increase will depend on the difference between the then applicable tax rate for non-approved enterprises and the rate of tax, if any, that we would otherwise pay as an approved enterprise, and the amount of any taxable income that we may earn in the future. The current maximum enterprise tax rate in Israel is 26.5%.
Failure to maintain effective internal control over financial reporting may cause us to delay filing our periodic reports with the SEC, affect our NASDAQ listing and adversely affect our stock price.
The SEC, as directed by Section 404 of the Sarbanes-Oxley Act of 2002, adopted rules requiring public companies to include a report of management on internal control over financial reporting in their annual reports on Form 10-K. Our management is responsible for maintaining internal control over financial reporting designed to provide reasonable assurance regarding the reliability of financial reporting and the preparation of consolidated financial statements for external purposes in accordance with GAAP. Our management assessed the effectiveness of our internal control over financial reporting as of January 30, 2016 and concluded that our internal control over financial reporting was effective. However, during the second quarter of fiscal 2013, we acquired certain assets used in the DTV business of Trident Microsystems. As a result of completing the accounting procedures related to this acquisition, we were unable to timely file our quarterly report on Form 10-Q for the quarterly period in which we completed this acquisition. In fiscal 2014 and 2013, we also experienced significant turnover in our finance and accounting personnel, including the resignation of our former chief financial officer on March 4, 2013. All of these changes placed a strain on our internal control over financial reporting, and we must continue to apply significant resources in order to maintain effective internal controls. Although we routinely review our internal control over financial reporting in order to ensure compliance with the Section 404 requirements, a failure to maintain adequate internal controls over financial reporting could result in an adverse reaction in the financial marketplace due to a loss of investor confidence in the reliability of our financial statements, which ultimately could negatively impact our stock price.
Our headquarters, certain of our other facilities, and some of our suppliers and third-party manufacturers are located in active earthquake zones. Earthquakes, tsunamis, floods or other types of natural disasters affecting our suppliers, our manufacturers or us could cause resource shortages and production delays, which would disrupt and harm our business, results of operations and financial condition.
We are headquartered in the San Francisco Bay Area, have research and development and sales offices in Japan and outsource most of our manufacturing to Taiwan. Each of these areas is an active earthquake zone, and certain of our suppliers and third-party manufacturers conduct operations in the same regions or in other locations that are susceptible to natural disasters. The occurrence of a natural disaster, such as an earthquake, tsunami or flood, or localized extended outages of critical utilities or transportation systems, or any critical resource shortages, affecting us, our suppliers or our third-party manufacturers could cause a significant interruption in our production, business, damage or destroy our facilities or those of our suppliers and cause us to incur significant costs or result in limitations on the availability of our raw materials, any of which could harm our business, financial condition and results of operations.
We rely significantly on information technology to operate our business and any failure, inadequacy, breach, interruption or security failure of that technology or any misappropriation of any data could harm our reputation or our ability to effectively operate our business.
We rely on our information technology systems and networks, including the Internet and third-party hosted services (“information technology systems”), for product design, production, forecasting, ordering, manufacturing, transportation, and sales, as well as for processing financial information for external and internal reporting purposes. The failure of these systems to operate effectively, problems with transitioning to upgraded or replacement systems, or a breach in security of these systems could cause delays in product fulfillment and reduced efficiency of our operations, could require significant resources to remediate the problem, and may have an adverse effect on our reputation, results of operations and financial condition.
We also use information technology systems to process financial information and results of operations for internal reporting purposes and to comply with regulatory financial reporting, legal and tax requirements. In the event our information technology systems suffer severe damage, disruption or shutdown and our business continuity plans do not effectively resolve the issues in a timely manner, we could experience delays in reporting our financial results, which could result in damage to our reputation and could cause our stock price to decline.
In addition, any breach of our network by data thieves or hackers may result in the loss of valuable business data, our customers’ or employees’ personal information or a disruption of our business, which could give rise to unwanted media attention, damage our customer relationships and reputation and result in lost sales, fines or lawsuits. In addition, we must comply with increasingly complex regulatory standards enacted to protect this business and personal data. An inability to maintain compliance with these regulatory standards could subject us to legal risks.
Risks Related to Our Common Stock
Our operating results are subject to significant fluctuations due to many factors and any of these factors could adversely affect our stock price.
Our operating results have fluctuated in the past and may continue to fluctuate in the future due to a number of factors, including:
|
|
• |
failure to reduce our expenses sufficiently to achieve profitability at current revenue levels; |
|
|
• |
the loss of one or more significant customers; |
|
|
• |
changes in our pricing models and product sales mix; |
|
|
• |
unexpected reductions in unit sales and average selling prices, particularly if they occur precipitously; |
|
|
• |
new product introductions by us and our competitors; |
|
|
• |
the level of acceptance of our products by our customers and acceptance of our customers’ products by their end user customers; |
|
|
• |
an interrupted or inadequate supply of semiconductor chips or other materials included in our products; |
|
|
• |
availability of third-party manufacturing capacity for production of certain products; |
|
|
• |
shifts in demand for the technology embodied in our products and those of our competitors; |
|
|
• |
the timing of, and potential unexpected delays in, our customer orders and product shipments; |
|
|
• |
the impairment and associated write-down of strategic investments that we may make from time-to-time; |
|
|
• |
write-downs of accounts receivable; |
|
|
• |
inventory obsolescence; |
|
|
• |
a significant increase in our effective tax rate in any particular period as a result of the exhaustion, disallowance or accelerated recognition of our net operating loss carry-forwards or otherwise; |
|
|
• |
technical problems in the development, production ramp up and manufacturing of products, which could cause shipping delays; |
|
|
• |
the impact of potential economic instability in the United States and Asia-Pacific region, including the continued effects of the recent worldwide economic slowdown; |
|
|
• |
expenses related to implementing and maintaining a new enterprise resource management system and other information technologies; and |
|
|
• |
expenses related to our compliance efforts with Section 404 of the Sarbanes-Oxley Act of 2002. |
In addition, the market prices of securities of semiconductor and other technology companies have been and continue to remain volatile. This volatility has significantly affected the market prices of securities of many technology companies for reasons frequently unrelated to the operating performance of the specific companies. Accordingly, you may not be able to resell your shares of common stock at or above the price you paid.
Our stock price has demonstrated volatility and continued volatility in the stock market or our operating performance may cause further fluctuations or decline in our stock price.
The market for our common stock has been subject to significant volatility which is expected to continue. For example, during the fiscal year ended January 30, 2016, the closing sale price per share of our common stock on the NASDAQ Global Market ranged from a high of $12.50 on June 18, 2015 to a low of $5.70 on January 20, 2016. This volatility may or may not be related or proportionate to our operating performance. Our operating performance as well as general economic and market conditions, could cause the market price of our common stock to decline.
If securities or industry analysts do not publish research or reports about our business or if they issue an adverse opinion regarding our stock, our stock price and trading volume could decline.
The trading market for our common stock is influenced by the research and reports that industry or securities analysts publish about our business or us. If one or more of the analysts who cover us issue an adverse opinion regarding our stock, our stock price would likely decline. If one or more of these analysts cease coverage of our company or fail to regularly publish reports on us, we could lose visibility in the financial markets which in turn could cause our stock price or trading volume to decline.
Provisions in our organizational documents and California law could delay or prevent a change in control of Sigma that our shareholders may consider favorable.
Our articles of incorporation and bylaws contain provisions that could limit the price that investors might be willing to pay in the future for shares of our common stock. Our Board of Directors can authorize the issuance of preferred stock that can be created and issued by our Board of Directors without prior shareholder approval, commonly referred to as "blank check" preferred stock, with rights senior to those of our common stock. The rights of the holders of our common stock will be subject to, and may be adversely affected by, the rights of the holders of any preferred stock that we may issue in the future. The issuance of preferred stock could have the effect of delaying, deterring or preventing a change in control and could adversely affect the voting power of your shares. In addition, provisions of California law could make it more difficult for a third party to acquire a majority of our outstanding voting stock by discouraging a hostile bid or delaying or deterring a merger, acquisition or tender offer in which our shareholders could receive a premium for their shares or a proxy contest for control of Sigma or other changes in our management.
|
ITEM 1B. |
UNRESOLVED STAFF COMMENTS |
None.
|
ITEM 2. |
PROPERTIES |
We currently lease an approximately 43,000 square foot facility in Fremont, California that is used as our corporate headquarters. The lease on this facility carries a term of 81 calendar months commencing on January 1, 2015, for which payments began in October 2015. We also lease an approximately 24,000 square foot facility in Tel-Aviv, Israel that is used for our Israel operations. We have the right to renew the lease for the Israel facility until December 31, 2016. We also lease facilities for sales and sales support in South Korea, Japan, Shenzhen, Hong Kong and a distribution facility in Singapore. Additionally, we lease facilities for research and development in Shanghai, Vietnam, Singapore, Germany, France and The Netherlands, and facilities for sales and research and development in Taiwan and Denmark.
|
ITEM 3. |
LEGAL PROCEEDINGS |
From time to time, we are involved in claims and legal proceedings that arise in the ordinary course of business. We expect that the number and significance of these matters will increase as our business expands. In particular, we could face an increasing number of patent and other intellectual property claims as the number of products and competitors in our industry grows. Any claims or proceedings against us, whether meritorious or not, could be time consuming, result in costly litigation, require significant amounts of management time, result in the diversion of significant operational resources or cause us to enter into royalty or licensing agreements which, if required, may not be available on terms favorable to us. If an unfavorable outcome were to occur against us, there exists the possibility of a material adverse impact on our financial position and results of operations for the period in which the unfavorable outcome occurs and, potentially, in future periods. As of January 30, 2016, we were not aware of any claims against us, asserted or otherwise.
|
ITEM 4. |
MINE SAFETY DISCLOSURES |
None.
PART II
|
ITEM 5. |
MARKET FOR THE REGISTRANT’S COMMON EQUITY, RELATED SHAREHOLDER MATTERS AND ISSUER PURCHASES OF EQUITY SECURITIES |
Our common stock trades on The NASDAQ Global Select under the trading symbol “SIGM.” The following table sets forth the high and low sales prices per share of our common stock for each quarter in the last two fiscal years.
|
|
|
Fiscal 2016 |
|
|
Fiscal 2015 |
| ||||||||||
|
|
|
High |
|
|
Low |
|
|
High |
|
|
Low |
| ||||
|
|
|
|
|
|
|
|
|
|
|
|
|
|
|
|
|
|
|
First fiscal quarter |
|
$ |
8.42 |
|
|
$ |
6.32 |
|
|
$ |
5.23 |
|
|
$ |
3.66 |
|
|
Second fiscal quarter |
|
|
12.50 |
|
|
|
7.63 |
|
|
|
4.85 |
|
|
|
3.30 |
|
|
Third fiscal quarter |
|
|
10.88 |
|
|
|
6.38 |
|
|
|
5.44 |
|
|
|
3.70 |
|
|
Fourth fiscal quarter |
|
|
10.17 |
|
|
|
5.70 |
|
|
|
7.40 |
|
|
|
4.05 |
|
As of March 15, 2016, we had approximately 122 shareholders of record of our common stock.
We have never paid cash dividends on our common stock and we currently do not plan to pay cash dividends to our common shareholders in the foreseeable future.
For information about securities authorized for issuance under our equity compensation plans, please refer to Item 12 of Part III of this Form 10-K and Note 13 to our consolidated financial statements included in Item 8 of this report.
Purchases of Equity Securities by Issuer
The following table sets forth a summary of our stock repurchases under our share repurchase program for fiscal 2014, 2015 and 2016:
|
Number of |
Average |
Number of |
Approximate |
|||||||||||||
|
Beginning balance available under the share repurchase program as of December 11, 2013(1) |
— | $ | — | — | $ | 20,000 | ||||||||||
|
Shares repurchased: |
||||||||||||||||
|
Fiscal 2014 |
466,831 | $ | 4.83 | 466,831 | 2,257 | |||||||||||
|
Fiscal 2015 |
— | $ | — | — | ||||||||||||
|
Fiscal 2016 |
— | $ | — | — | — | |||||||||||
|
Ending balance available under the share repurchase program as of January 30, 2016 |
$ | 17,743 | ||||||||||||||
|
(1) |
On December 11, 2013, we announced a share repurchase program to repurchase up to $20.0 million in value of our outstanding shares of common stock through December 31, 2014. |
Stock Performance Graph
The following graph shows the value of a $100 cash investment on the last business day of fiscal year 2011 in (i) our common stock, (ii) the NASDAQ Composite Index, and (iii) the NASDAQ Electronic Components Index. All values assume reinvestments of all dividends, if any and are calculated as of the last day of each of our fiscal years. Note that historic stock price performance shown on the graph below is not necessarily indicative of future stock price performance.
|
|
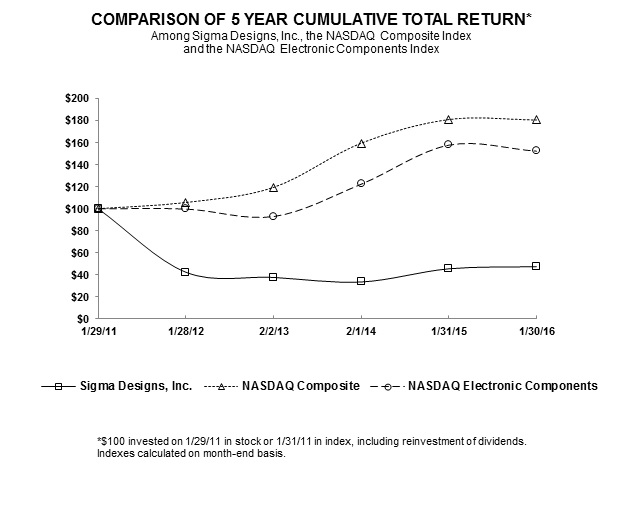
|
ITEM 6. |
SELECTED CONSOLIDATED FINANCIAL DATA |
The following selected consolidated financial data (presented in thousands, except per share amounts) should be read in conjunction with our consolidated financial statements, the notes related thereto, and Management’s Discussion and Analysis of Financial Condition and Results of Operations. The consolidated statements of operations data for the years ended January 30, 2016, January 31, 2015, and February 1, 2014, and the consolidated balance sheets data as of January 30, 2016, and January 31, 2015 have been derived from and should be read in conjunction with our audited consolidated financial statements and the notes thereto included elsewhere in this Annual Report on Form 10-K. The consolidated statements of operations data for the years ended February 2, 2013 and January 28, 2012 and the consolidated balance sheets data as of February 1, 2014, February 2, 2013, and January 28, 2012 are derived from audited consolidated financial statements which are not included herein.
|
Fiscal Years Ended |
||||||||||||||||||||
|
January 30, 2016 |
January 31, 2015 |
February 1, 2014 |
February 2, 2013 |
January 28, 2012 |
||||||||||||||||
|
Consolidated Statements of Operations Data: |
||||||||||||||||||||
|
Net revenue |
$ | 227,250 | $ | 188,313 | $ | 199,193 | $ | 216,613 | $ | 182,617 | ||||||||||
|
Loss from operations |
(1,155 |
) |
(17,877 |
) |
(9,572 |
) |
(83,346 |
) |
(175,715 |
) | ||||||||||
|
Net income (loss) |
158 | (21,701 |
) |
(11,049 |
) |
(101,768 |
) |
(168,045 |
) | |||||||||||
|
Basic net income (loss) per share |
0.00 | (0.63 |
) |
(0.32 |
) |
(3.06 |
) |
(5.25 |
) | |||||||||||
|
Diluted net income (loss) per share |
$ | 0.00 | $ | (0.63 |
) |
$ | (0.32 |
) |
$ | (3.06 |
) |
$ | (5.25 |
) | ||||||
|
January 30, 2016 |
January 31, 2015 |
February 1, 2014 |
February 2, 2013 |
January 28, 2012 |
||||||||||||||||
|
Consolidated Balance Sheets Data: |
||||||||||||||||||||
|
Working capital |
$ | 92,478 | $ | 98,326 | $ | 91,870 | $ | 96,628 | $ | 110,950 | ||||||||||
|
Total assets |
$ | 216,669 | $ | 205,333 | $ | 215,775 | $ | 220,831 | $ | 297,224 | ||||||||||
|
Total shareholders' equity |
$ | 152,805 | $ | 143,290 | $ | 158,391 | $ | 162,018 | $ | 248,475 | ||||||||||
The following table presents details of the total stock-based compensation expense, excluding tender offer payments associated with the adjustments to measurement dates for option grants, that is included in the consolidated statements of operations data above:
|
Fiscal Years Ended |
||||||||||||||||||||
|
January 30, 2016 |
January 31, 2015 |
February 1, 2014 |
February 2, 2013 |
January 28, 2012 |
||||||||||||||||
|
Stock-based Compensation Expense: |
||||||||||||||||||||
|
Cost of revenue |
$ | 227 | $ | 190 | $ | 267 | $ | 487 | $ | 478 | ||||||||||
|
Research and development |
3,241 | 3,147 | 3,381 | 5,740 | 6,277 | |||||||||||||||
|
Selling and marketing |
1,151 | 979 | 1,275 | 1,811 | 2,137 | |||||||||||||||
|
General and administrative |
1,940 | 1,963 | 1,891 | 2,557 | 3,133 | |||||||||||||||
| $ | 6,559 | $ | 6,279 | $ | 6,814 | $ | 10,595 | $ | 12,025 | |||||||||||
|
ITEM 7. |
MANAGEMENT’S DISCUSSION AND ANALYSIS OF FINANCIAL CONDITION AND RESULTS OF OPERATIONS |
You should read the following discussion in conjunction with our consolidated financial statements and related notes in this Form 10-K. Except for historical information, the following discussion contains forward-looking statements within the meaning of Section 27A of the Securities Exchange Act of 1933 and Section 21E of the Securities Exchange Act of 1934. In some cases, you can identify forward-looking statements by terms such as "may," "might," "will," "objective," "intend," "should," "could," "can," "would," "expect," "believe," "estimate," "predict," "potential," "plan," or the negative of these terms, and similar expressions intended to identify forward-looking statements. These forward-looking statements, include, but are not limited to: statements about our capital resources and needs, including the adequacy of our current cash reserves; the expectation that our revenue from the IoT Devices market will likely increase in the foreseeable future; anticipated deployments and design wins in the Set-top Box market, if any; anticipated seasonality associated with our Smart TV market; anticipated deployment and design wins in the Media Connectivity market, if any; any expectations related to the integration of or impact on our product offerings as a result of our acquisition of Bretelon; and our expectations that our gross margin will vary from period to period. These forward-looking statements involve risks and uncertainties. Our actual results may differ significantly from those projected in the forward-looking statements. Factors that might cause future results to differ materially from those discussed in the forward-looking statements include, but are not limited to, those discussed under Part I, Item 1A “Risk Factors” in this Form 10-K as well as other information found in the documents we file from time to time with the Securities and Exchange Commission. Also, these forward-looking statements represent our estimates and assumptions only as of the date of this Form 10-K. Unless required by U.S. federal securities laws, we do not intend to update any of these forward-looking statements to reflect circumstances or events that occur after the statement is made.
Overview
We are a global integrated semiconductor solutions provider offering intelligent media platforms for use in the home entertainment and home control markets. Our goal is to ensure that our chipsets serve as the foundation for some of the world’s leading consumer products, including televisions, set-top boxes, media connectivity and home control products. Our business generates revenue primarily by delivery of relevant, cost-effective semiconductors that are targeted toward end-product manufacturers, Original Equipment Manufacturers, or OEMs, and Original Design Manufacturers, or ODMs. We also derive a portion of our revenue from other products and services, including technology licenses, software development kits, engineering support services for hardware and software, engineering development for customization of chipsets and other accessories.
Our chipset products and target markets
We consider all of our semiconductor products to be chipsets because each of our products is comprised of multiple semiconductors. We believe our chipsets enable our customers to efficiently bring consumer multimedia devices to market. We design our highly integrated products to significantly improve performance, lower power consumption and reduce cost.
We sell our products into four primary or target markets: (i) Smart TV, (ii) Media Connectivity, (iii) Set-top Box and (iv) Internet of Things (“IoT”) Devices. Smart TV products consist of a range of platforms that are based on highly integrated chips, embedded software, and hardware reference designs. Media Connectivity products consist of wired home networking controller chipsets that are designed to provide connectivity solutions between various home entertainment products and incoming video streams. Set-top Box products consist of connected media processors and players delivering IP streaming video, including hybrid versions of these products. IoT Devices consist of our wireless Z-Wave chipsets and modules.
We are organized as, and operate in, one reportable segment. Historically, we disclosed information encompassing product groupings by target markets with certain naming conventions, consisting of Digital Television (“DTV”), Set-top Box, Home Networking, Home Control, and License and other. We resolved to change the naming conventions of some of our target markets, commensurate with changes taking effect in our industry as a whole. We renamed our “DTV” target market to “Smart TV,” “Home Networking” to “Media Connectivity,” and “Home Control” to “IoT Devices.” These changes did not affect the products or related services categorization, or previously reported amounts related to the aforementioned historical target markets.
Smart TV Market
The Smart TV market (previously referred to as our DTV market) consists of all products that are sold into digital televisions as well as other adjacent markets using chipset products that are designed for video post-processing. We believe Smart TV products complement our existing Set-top Box products, which will provide substantial research and development leverage and improved operating scale to augment our ability to develop innovative solutions for the anticipated convergence of IP-video delivery across any device within the connected home. Furthermore, our early entry into the emerging ultra-high definition (“UHD,” “Ultra-HD” or “4K”) television market has provided a differential opportunity for us to penetrate key customers for high-end products, which will eventually become mainstream over time. We serve this market with our media processor chips and dedicated post-processing products.
Set-top Box Market
The Set-top Box target market consists of all Set-top Box products delivering IP streaming video, including hybrid versions of these products. We serve this market primarily with our media processor products.
Media Connectivity Market
The Media Connectivity market consists of communication devices that use a standard protocol to connect equipment inside the home and stream IP-based video and audio, VoIP, or data through wired or wireless connectivity. We serve the Media Connectivity market with our wired home networking controllers that are designed to provide the most reliable connectivity solutions between various home entertainment products and incoming video streams.
Internet of Things (“IoT”) Devices Market
The IoT Devices market consists of all interconnected Z-Wave enabled gateways, appliances and devices that provide monitoring and control capabilities for the management of any consumer ecosystem. Our IoT Devices product line consists of our wireless Z-Wave chips, modules and Z-Wave mesh networking protocol.
We expect our acquisition of Bretelon will allow us to expand our overall IoT footprint. This acquisition expands our total addressable market to include products with outdoor applications, which are an ideal complement to our Z-Wave product line that covers indoor applications. We intend to take advantage of the synergy between these two product lines to service smart city and commercial opportunities that make outdoor use of the Z-Wave mesh network and mobile IoT connectivity.
License and Other Markets
The license and other markets includes other products and services, including technology licenses, software development kits, engineering support services for hardware and software, engineering development for customization of chipsets and other accessories.
Critical accounting policies and estimates
Management’s discussion and analysis of financial condition and results of operations are based on our consolidated financial statements, which have been prepared in accordance with United States generally accepted accounting principles, or GAAP. The preparation of consolidated financial statements and related disclosures requires us to make judgments that affect the reported amounts and disclosures of the assets and liabilities at the date of the consolidated financial statements and also revenue and expenses during the period reported. By their nature, these estimates and judgments are subject to an inherent degree of uncertainty. The primary areas that require significant estimates and judgments by management include, but are not limited to, revenue recognition, allowances for doubtful accounts, sales returns, warranty obligations, inventory valuation, stock-based compensation expense, purchased intangible asset valuations, strategic investments, deferred income tax asset valuation allowances, uncertain tax positions, tax contingencies, restructuring costs, litigation and other loss contingencies. Management bases its estimates and judgments on historical experience, market trends and other factors that are believed to be reasonable under the circumstances. These estimates form the basis for judgments about the carrying value of assets and liabilities that are not readily apparent from other sources. Actual results may differ from what we anticipate and different assumptions or estimates about the future could change our reported results. We believe the critical accounting policies as disclosed in Note 1, “Organization and summary of significant accounting policies,” of the Notes to consolidated financial statements of this Form 10-K included in Item 8 of this report, reflect the more significant judgments and estimates used in preparation of our consolidated financial statements.
Restructuring charges: During fiscal 2015 and 2014, we implemented restructuring plans to reorganize our operations and reduce our workforce and related operating expenses. Our restructuring charges include primarily payments to employees for severance, asset impairment charges, termination fees associated with leases and other contracts and other costs related to the closure of facilities. Accruals are recorded when management has approved a plan to restructure operations and a liability has been incurred. The restructuring accruals are based upon management estimates at the time they are recorded. These estimates can change depending upon changes in facts and circumstances subsequent to the date the original liability was recorded. During fiscal 2015 and 2014, we recorded restructuring charges of $1.1 million and $2.3 million, respectively.
Short and long-term marketable securities: Short-term marketable securities represent highly liquid investments with a remaining maturity date at the end of each reporting period of greater than 90 days but less than one year and are stated at fair value. Long-term marketable securities represent securities with contractual maturities greater than one year from the date of acquisition. We classify our marketable securities as available-for-sale because the sale of such securities may be required prior to maturity. Management determines the appropriate classification of its investments at the time of purchase and reevaluates the designations at each balance sheet date.
The difference between amortized cost (cost adjusted for amortization of premiums and accretion of discounts, which is recognized as an adjustment to interest income) and fair value, representing unrealized holding gains or losses, are recorded separately as a component of accumulated other comprehensive income within shareholders’ equity. Any gains and losses on the sale of marketable securities are determined based on the specific identification method.
We monitor all of our marketable securities for impairment and if these securities are reported to have a decline in fair value, we use significant judgment to identify events or circumstances that would likely have a significant adverse effect on the future value of each investment including: (i) the nature of the investment; (ii) the cause and duration of any impairment; (iii) the financial condition and future prospects of the issuer; (iv) for securities with a reported decline in fair value, our ability to hold the security for a period of time sufficient to allow for any anticipated recovery of fair value; (v) the extent to which fair value may differ from cost; and (vi) a comparison of the income generated by the securities compared to alternative investments. We recognize an impairment charge if a decline in the fair value of our marketable securities is judged to be other-than-temporary. No such impairment charges were recorded in fiscal 2016, 2015 or 2014.
Accounts receivable and allowances: We defer recognition of revenue and the related receivable when we cannot estimate whether collectability is reasonably assured at the time products and services are delivered to our customers. We also provide allowances for bad debt and sales returns. In establishing the allowance for bad debt, in cases where we are aware of circumstances that may impair a specific customer’s ability to meet its financial obligations subsequent to the original sale, we will record an allowance against amounts due, and thereby reduce the net recognized receivable to the amount we reasonably believe will be collected. For all other customers, we recognize allowances for doubtful accounts based on the length of time the receivables are past due, industry and geographic concentrations, the current business environment and our historical experience.
In establishing the allowance for sales returns, we make estimates of potential future returns of products for which revenue has been recognized in the current period, including analyzing historical returns, current economic trends and changes in customer demand and acceptance of our products. Our allowance for sales returns, discounts and bad debt was $2.0 million and $1.5 million at January 30, 2016 and January 31, 2015, respectively. If the financial condition of our customers were to deteriorate, resulting in an impairment of their ability to make payments, or future product returns increased, additional allowances may be required.
Inventory: Inventory consists of wafers and other purchased materials, work in process and finished goods and is stated at the lower of standard cost, which approximates actual cost on a first-in, first-out basis, or market value. We evaluate our ending inventory for excess quantities and obsolescence on a quarterly basis. This evaluation includes analysis of historical and estimated future unit sales by product as well as product purchase commitments that are not cancelable. We develop our demand forecasts based, in part, on discussions with our customers about their forecasted supply needs. However, our customers generally only provide us with firm purchase commitments for the month and quarter and not our entire forecasted period. Additionally, our sales and marketing personnel provide estimates of future sales to prospective customers based on actual and expected design wins. A provision is recorded for inventory in excess of estimated future demand.
We write-off inventory that is obsolete. Obsolescence is determined from several factors, including competitiveness of product offerings, market conditions and product life cycles. Provisions for excess and obsolete inventory are charged to cost of revenue. At the time of the loss recognition, a new, lower-cost basis for that inventory is established and subsequent changes in facts and circumstances do not result in the restoration or increase in that newly established cost basis. If this lower-cost inventory is subsequently sold, we will realize higher gross margins for those products.
Inventory write-downs inherently involve assumptions and judgments as to amount of future sales and selling prices. As a result of our inventory valuation reviews, we charged provisions for excess and obsolete inventory of approximately $3.2 million, $4.3 million and $0.8 million to cost of revenue for fiscal 2016, 2015 and 2014, respectively. We have sold through $0.9 million, $0.6 million and $1.0 million of inventory that we had previously recorded as excess and obsolete in fiscal 2016, 2015 and 2014, respectively. Although we believe that the assumptions we use in estimating inventory write-downs are reasonable, significant future changes in these assumptions could produce a significantly different result. There can be no assurances that future events and changing market conditions will not result in significant inventory write-downs.
Warranty: Our products typically carry a one-year limited warranty that products will be free from defects in materials and workmanship. Warranty cost is estimated at the time revenue is recognized, based on historical activity and additionally for any specific known product warranty issues. Accrued warranty cost includes hardware repair and/or replacement and software support costs and is included in accrued liabilities on the consolidated balance sheets. Although we engage in extensive product quality programs and processes, our warranty obligation has been and may in the future be affected by product failure rates, product recalls, repair or replacement costs and additional development costs incurred in correcting any product failure. Should actual costs differ from our initial estimates, we record the difference in the period they are identified. Actual claims are charged against the warranty reserve.
Software, equipment and leasehold improvements: Software, equipment and leasehold improvements are stated at cost. Depreciation and amortization for software, equipment and leasehold improvements is computed using the straight-line method based on the useful lives of the assets (one to five years) or the remaining lease term if shorter. Any allowance for leasehold improvements received from the landlord for improvements to our facilities is amortized using the straight-line method over the lesser of the remaining lease term or the useful life of the leasehold improvements. Repairs and maintenance costs are expensed as incurred.
Business combinations: The purchase accounting method applied to business combinations requires us to allocate the purchase price of acquired companies to the identifiable tangible and intangible assets acquired and liabilities assumed, based on their estimated fair values. Such valuations require us to make significant estimates and assumptions, especially with respect to intangible assets. The significant purchased intangible assets recorded by us include developed technology, customer relationships, purchased IP, non-compete agreements and trademarks. Critical estimates and assumptions used in valuing these assets include but are not limited to: future expected cash flows from acquired products, customer relationships and acquired developed technologies and patents; assumptions regarding brand awareness and market position, and assumptions about the period of time the brand will continue to be used in our product portfolio; and assumptions about discount rates. The estimated fair values are based upon assumptions that we believe to be reasonable but which are inherently uncertain and unpredictable and, as a result, actual results may differ from estimates.
Intangible and other long-lived assets: The amounts and useful lives assigned to intangible and other long-lived assets acquired, other than goodwill, impact the amount and timing of future amortization. Intangible assets include those acquired through business combinations and intellectual property that we purchase for incorporation into our product designs. We begin amortizing such intellectual property at the time that we begin shipment of the associated products into which it is incorporated. We amortize the intellectual property over the estimated useful life of the associated products, generally two to three years.
Goodwill is recorded as the difference, if any, between the aggregate consideration paid for an acquisition and the fair value of the net tangible and intangible assets acquired. Other intangible assets primarily represent purchased developed technology, customer relationships, purchased IP, non-compete agreements and trademarks. We currently amortize our intangible assets with definitive lives over periods ranging from three to ten years using a method that reflects the pattern in which the economic benefits of the intangible assets are consumed or otherwise used or, if that pattern cannot be reliably determined, using a straight-line amortization method.
Impairment of goodwill and other long-lived assets: We test long-lived assets, including purchased intangible assets, for impairment whenever events or changes in circumstances, such as a change in technology, indicate that the carrying value of these assets may not be recoverable. If indicators of impairment exist, we determine whether the carrying value of an asset or asset group is recoverable, based on comparisons to undiscounted expected future cash flows that the assets are expected to generate. If an asset is not recoverable, we record an impairment loss equal to the amount by which the carrying value of the asset exceeds its fair value. We primarily use the income valuation approach to determine the fair value of our long-lived assets and purchased intangible assets.
We evaluate goodwill on an annual basis as of the last day of our fiscal year or whenever events or changes in circumstances indicate the carrying value may not be recoverable. We first assess qualitative factors to determine whether it is more likely than not that the fair value of a reporting unit is less than its carrying amount. If we conclude that it is more likely than not that the fair value of a reporting unit is less than its carrying amount, we conduct a two-step quantitative goodwill impairment test. The first step requires identifying the reporting units and comparing the fair value of each reporting unit to its net book value, including goodwill. We have identified that we operate one reporting unit and the fair value of our operating unit is determined to be equal to our market capitalization as determined through quoted market prices, adjusted for a reasonable control premium. We estimate the control premium based on a review of acquisitions of comparable semiconductor companies that were completed during the last four years. If the carrying amount of a reporting unit exceeds the reporting unit’s fair value, we perform the second step of the goodwill impairment test. The second step of the goodwill impairment test involves comparing the implied fair value of the affected reporting unit’s goodwill with the carrying value of that goodwill. The amount by which the carrying value of the goodwill exceeds its implied fair value, if any, is recognized as an impairment loss.
Determining the fair value of a reporting unit is judgmental in nature and involves the use of significant estimates and assumptions. These estimates and assumptions include forecasts of revenue and operating margins used to calculate projected future cash flows, risk-adjusted discount rates, future economic and market conditions and a determination of appropriate market comparables. We base our fair value estimates on assumptions we believe to be reasonable at that time, however, actual future results may differ from those estimates. Future competitive, market and economic conditions could negatively impact key assumptions including our market capitalization, actual control premiums or the carrying value of our net assets, which could require us to realize an additional impairment.
Long-term investments: Investments in private equity securities of less than 20% owned companies are accounted for using the cost method unless we can exercise significant influence or the investee is economically dependent upon us, in which case the equity method is used. We evaluate our long-term investments for impairment annually or whenever events or changes in circumstances indicate that the carrying value of these assets may not be recoverable.
Revenue recognition: We derive our revenue primarily from product sales which comprised approximately 99%, 97% and 91% of total net revenue during fiscal 2016, 2015 and 2014, respectively. Our products, which we refer to as chipsets, consist of highly integrated semiconductors and embedded software that enables real-time processing of digital video and audio content; and in the case of our IoT Devices, establishes a mesh network protocol that provides an interoperable platform for automation and monitoring solutions, all of which we refer to as embedded software. We do not deliver software as a separate product in connection with product sales. We recognize revenue for product sales when persuasive evidence of an arrangement exists, delivery has occurred, the fee is fixed or determinable and collectability is reasonably assured. These criteria are usually met at the time of product shipment. We record reductions of revenue for estimated product returns and pricing adjustments, such as rebates, in the same period that the related revenue is recorded. The amount of these reductions is based on historical sales returns, analysis of credit memo data, specific criteria included in the agreements, and other factors known at the time. We accrue 100% of potential returns at the time of sale when there is not sufficient historical sales data and recognize revenue when the right of return expires. We also accrue 100% of potential rebates at the time of sale and do not apply a breakage factor. We reverse the accrual for unclaimed rebate amounts as specific rebate programs contractually end and when we believe unclaimed rebates are no longer subject to payment and will not be paid. See Note 6, “Supplemental financial information,” of the Notes to consolidated financial statements of this Form 10-K included in Item 8 of this report for a summary of our rebate activity.
On occasion, we derive revenue from the license of our internally developed intellectual property (“IP”). IP licensing agreements that we enter into generally provide licensees the right to incorporate our IP components in their products with terms and conditions that vary by licensee. Our license fee arrangements generally include multiple deliverables and we are required to determine whether there is more than one unit of accounting. To the extent that the deliverables are separable into multiple units of accounting, we allocate the total fee on such arrangements to the individual units of accounting using management’s best estimate of selling price ("ESP"), if third party evidence ("TPE") or vendor specific objective evidence ("VSOE") does not exist. We defer revenue recognition for consideration that is contingent upon future performance or other contractual terms.
Our process for determining our ESP for deliverables without VSOE or TPE considers multiple factors that may vary depending upon the unique facts and circumstances related to each deliverable. The key factors that we consider in developing the ESPs include the nature and complexity of the licensed technologies, our cost to provide the deliverables, the availability of substitute technologies in the marketplace and our historical pricing practices. We then recognize revenue for each unit of accounting depending on the nature of the deliverable(s) comprising the unit of accounting in accordance with the revenue recognition criteria mentioned above. Fees under these agreements generally include (a) license fees relating to our IP, (b) engineering services, and (c) support services. Historically, each of these elements has standalone value and therefore each are treated as separate units of accounting. Any future licensing arrangements will be analyzed based on the specific facts and circumstances which may be different than our historical licensing arrangements.
For deliverables related to licenses of our technology that involve significant engineering services, we recognize revenue in accordance with the provisions of the proportional performance method or “milestone.” We determine costs associated with engineering services using actual labor dollars incurred and estimate other direct or incremental costs allocated based on the percentage of time the engineer(s) spent on the project. These costs are deferred until revenue recognition criteria have been met, at which time they are reclassified as cost of revenue.
Licensing revenue deliverables are generally recognized using the milestone method. Under the milestone method, we recognize revenue that is contingent upon the achievement of a substantive milestone in its entirety in the period in which the milestone is achieved. To be considered substantive, the consideration earned by achieving the milestone should be (a) commensurate with either (i) the vendor’s performance to achieve the milestone or (ii) to the enhancement of the value of the item delivered as a result of a specific outcome resulting from the vendor’s performance to achieve the milestone (b) the consideration should relate solely to past performance, and (c) the consideration should be reasonable relative to all deliverables and payment terms in the arrangement. Other milestones that do not fall under the definition of a milestone under the milestone method are recognized under the authoritative guidance concerning revenue recognition.
We derive a portion of our revenues in the form of fees from members of a wholly-owned entity dedicated to the marketing, development and proliferation of the Z-Wave brand. Membership fees vary based on level and are generally billed on an annual basis with no obligation to renew. Revenue from membership dues is recognized in the month earned. Membership dues received in advance are included in deferred revenues and recognized as revenue ratably over the appropriate period, which is generally twelve months or less. The monthly dues are generally structured to cover the administrative costs and membership services. Membership revenue was approximately $1.9 million, $0.9 million and zero during fiscal 2016, 2015 and 2014, respectively.
We defer revenue when payments are received from customers in advance of revenue recognition. Deferred revenue at both January 30, 2016 and January 31, 2015 was $0.4 million, and is included in accrued liabilities in the accompanying consolidated balance sheets.
Income taxes: Income taxes are accounted for under an asset and liability approach. Deferred income taxes reflect the net tax effects of any temporary differences between the carrying amounts of assets and liabilities for financial reporting purposes and the amounts reported for income tax purposes, and any operating losses and tax credit carry-forwards. Deferred tax liabilities are recognized for future taxable amounts and deferred tax assets are recognized for future deductions, net of any valuation allowance, to reduce deferred tax assets to amounts that are considered more likely than not to be realized.
The impact of an uncertain income tax position on the income tax return must be recognized as the largest amount that is more-likely-than-not to be sustained upon audit by the relevant taxing authority. An uncertain income tax position will not be recognized if it has less than a 50% likelihood of being sustained.
Stock-based compensation: We have in effect stock incentive plans under which incentive stock options, restricted stock units, restricted stock awards and non-qualified stock options have been granted to employees and non-employee members of the Board of Directors. We also have an employee stock purchase plan for all eligible employees. We measure and recognize compensation expense for all stock-based payment awards made to employees and non-employees based on the closing fair market value of the Company’s common stock on the date of grant. Stock option awards are measured using the Black-Scholes option pricing model. The value of the portion of the award that is ultimately expected to vest is recognized as expense on a ratable basis over the requisite service period for time-based awards and on a graded basis for performance-based awards in our consolidated statements of operations. We estimate forfeitures, based on historical experience, at the time of grant and revise our estimates, if necessary, in subsequent periods if actual forfeitures differ from those estimates. We recognize a benefit from share-based compensation in the Consolidated Statements of Shareholders’ Equity if an excess tax benefit is realized. Further information regarding stock-based compensation can be found in Note 13, “Equity incentive plans and employee benefits,” of the Notes to consolidated financial statements of this Form 10-K included in Item 8 of this report.
Results of operations
The following table is derived from our consolidated statements of operations and sets forth our historical operating results as a percentage of net revenue for each of the fiscal years indicated (in thousands, except percentages):
|
Fiscal Years Ended |
||||||||||||||||||||||||
|
January 30, 2016 |
% of Net Revenue |
January 31, 2015 |
% of Net Revenue |
February 1, 2014 |
% of Net Revenue |
|||||||||||||||||||
|
Net revenue |
$ | 227,250 | 100 | % | $ | 188,313 | 100 | % | $ | 199,193 | 100 | % | ||||||||||||
|
Cost of revenue |
114,090 | 50 | % | 92,967 | 49 | % | 91,052 | 46 | % | |||||||||||||||
|
Gross profit |
113,160 | 50 | % | 95,346 | 51 | % | 108,141 | 54 | % | |||||||||||||||
|
Operating expenses |
||||||||||||||||||||||||
|
Research and development |
68,784 | 30 | % | 67,482 | 36 | % | 73,162 | 37 | % | |||||||||||||||
|
Sales and marketing |
22,877 | 10 | % | 22,290 | 12 | % | 21,637 | 11 | % | |||||||||||||||
|
General and administrative |
20,862 | 9 | % | 19,641 | 10 | % | 19,640 | 10 | % | |||||||||||||||
|
Restructuring costs |
9 | - | 999 | 1 | % | 2,261 | 1 | % | ||||||||||||||||
|
Impairment of IP, mask sets and design tools |
1,783 | 1 | % | 2,811 | 1 | % | 1,013 | - | ||||||||||||||||
|
Total operating expenses |
114,315 | 50 | % | 113,223 | 60 | % | 117,713 | 59 | % | |||||||||||||||
|
Loss from operations |
(1,155 |
) |
- | (17,877 |
) |
(9 |
%) |
(9,572 |
) |
(5 |
%) | |||||||||||||
|
Gain on sale of development project |
7,551 | 3 | % | - | - | 1,079 | 1 | % | ||||||||||||||||
|
Gain on sale, net of impairment, of privately-held investments, net |
159 | - | (602 |
) |
(1 |
%) |
(433 |
) |
- | |||||||||||||||
|
Interest and other income, net |
794 | - | 1,771 | 1 | % | 827 | - | |||||||||||||||||
|
Income (loss) before income taxes |
7,349 | 3 | % | (16,708 |
) |
(9 |
%) |
(8,099 |
) |
(4 |
%) | |||||||||||||
|
Provision for income taxes |
7,191 | 3 | % | 4,993 | 3 | % | 2,950 | 2 | % | |||||||||||||||
|
Net income (loss) |
$ | 158 | - | $ | (21,701 |
) |
(12 |
%) |
$ | (11,049 |
) |
(6 |
%) | |||||||||||
Net revenue
Our net revenue for fiscal 2016 increased $38.9 million, or 21%, compared to fiscal 2015. The increase was primarily due to a $53.9 million increase within the Smart TV market and an increase in the IoT Devices market of $15.5 million, partially offset by a decrease in sales into the Media Connectivity market of $22.4 million, a decrease of $3.6 million in the Set-top Box market and decreases from revenue related to the licensing of our technology to third parties contributing to the decline of sales into the license and other markets of $4.6 million. Sales of our chipsets remained largely consistent compared to fiscal 2015 and accounted for approximately 99%, 97% and 91% of our net revenue for fiscal 2016, 2015 and 2014, respectively.
Our net revenue for fiscal 2015 decreased $10.9 million, or 5%, compared to fiscal 2014. The decrease was primarily due to a decline in our license and other revenue of $11.3 million, or 65%, resulting from the completion of our obligations under our licensing arrangements during the second quarter of fiscal 2015.
Net revenue by target market
We sell our products into four primary target markets, which are the Smart TV market, Media Connectivity market, Set-top Box market, and the Internet of Things, or “IoT,” Devices market. From time to time, we also receive license revenue from the licensing of our technology to various third parties, which is included in license and other markets. We are organized as, and operate in, one reportable segment. Historically, we disclosed information encompassing product groupings by target markets with certain naming conventions, consisting of Digital Television (“DTV”), Set-top Box, Home Networking, Home Control, and License and other. We resolved to change the naming conventions of some of our target markets, commensurate with changes taking effect in our industry as a whole. We renamed our “DTV” target market to “Smart TV,” “Home Networking” to “Media Connectivity,” and “Home Control” to “IoT Devices.” These changes did not affect the products or related services categorization, or previously reported amounts related to the aforementioned historical target markets.
The following table sets forth our net revenue by target market and the percentage of net revenue represented by our product sales to each of those markets (in thousands, except percentages):
|
Fiscal Year Ended |
||||||||||||||||||||||||
|
January 30, 2016 |
% of Net Revenue |
January 31, 2015 |
% of Net Revenue |
February 1, 2014 |
% of Net Revenue |
|||||||||||||||||||
|
Smart TV |
$ | 102,870 | 45 |
% |
$ | 48,929 | 26 |
% |
$ | 49,600 | 25 |
% | ||||||||||||
|
Media Connectivity |
54,952 | 24 |
% |
77,305 | 41 |
% |
72,927 | 37 |
% | |||||||||||||||
|
IoT Devices |
46,982 | 21 |
% |
31,437 | 17 |
% |
20,704 | 10 |
% | |||||||||||||||
|
Set-top Box |
20,829 | 9 |
% |
24,458 | 13 |
% |
38,483 | 19 |
% | |||||||||||||||
|
License and other |
1,617 | 1 |
% |
6,184 | 3 |
% |
17,479 | 9 |
% | |||||||||||||||
|
Net revenue |
$ | 227,250 | 100 |
% |
$ | 188,313 | 100 |
% |
$ | 199,193 | 100 |
% | ||||||||||||
Smart TV: Net revenue for our Smart TV market in fiscal 2016 increased by $53.9 million, or 110%, compared to fiscal 2015. We experienced an increase of 154% in average selling price, or ASP, partially offset by a decrease of 17% in units shipped. The increase in ASP is primarily the result of continued penetration by our new product offerings in the market, which have higher ASPs for chipsets used in ultra-high definition, also known as Ultra-HD televisions. The Smart TV market transition, and consequently, anticipated demand of Ultra-HD is bolstering the demand for our new generation products. The volume decline in our Smart TV market resulted primarily from the continued decline of demand for our older legacy products, many of which are now approaching end-of-life. Our Smart TV revenue was derived mainly from our Asian and North American regions. We typically experience seasonality in net revenue with our strongest Smart TV sales in the third calendar quarter and declining Smart TV sales in the first and fourth quarter of each calendar year. We expect our net revenue from the Smart TV market to continue to be a significant percentage of net revenue but expect seasonal fluctuations in future periods as we continue to develop and introduce new products for this market.
Net revenue from the Smart TV market in fiscal 2015 remained largely the same, decreasing only $0.7 million, or 1%, compared to fiscal 2014. We had a decline of 28% in units shipped in the Smart TV market, partially offset by an increase of 37% in average selling price, or ASP. The decline in our Smart TV market resulted primarily from the continued erosion of demand for our older legacy products, many of which are now approaching end-of-life. This decline was partially offset by recent adoptions of our newer product offerings having higher ASPs.
Media Connectivity: Net revenue for our Media Connectivity market in fiscal 2016 decreased $22.4 million, or 29%, compared to fiscal 2015 primarily due to a decrease of 23% in ASP, compounded by a decline of 7% in units shipped. The decrease in units shipped and ASP was primarily the result of reduced demand due to the continued expansion of wireless technologies in the market impacting our existing product offerings. Our Media Connectivity revenue was derived mainly from our Asian and North American regions. We expect our revenue from the Media Connectivity market to fluctuate in future periods with varying levels of sustainability primarily as a result of telecommunications provider’s pending transitions to next generation technologies. Our success in this market will depend primarily on how quickly the market transitions from our current HPNA solutions, which enjoy a significant share of the market, to next generation technologies. We have developed wired connectivity solutions based on G.hn technology. To date, we have not derived meaningful revenue from our G.hn solutions, which compete against other wired solutions as well as emerging wireless solutions. If our revenue from our HPNA solutions continues to decline and we are not able to gain market acceptance of our G.hn solutions, the overall revenue in our Media Connectivity market will likely decline. Fluctuations in revenue are primarily based on changes in inventory levels at contract manufacturers who manufacture equipment incorporating our products for deployment by telecommunication providers.
Net revenue for our Media Connectivity market in fiscal 2015 increased $4.4 million, or 6%, compared to fiscal 2014 primarily due to a 9% increase in units shipped, partially offset by a 3% decrease in ASP. The decrease in ASP was primarily the result of more competitive pricing arrangements due to the introduction of wireless technologies in the market impacting our existing product offerings.
IoT Devices: Net revenue for our IoT Devices market in fiscal 2016 increased $15.5 million, or 49%, compared to fiscal 2015. The increase was primarily the result of increased demand in the IoT Devices market, evidenced by increases of 86% in unit shipments primarily to the Asian and North American regions as customers in security and protection services, telecommunication services and E-retailers continue to adopt our home automation solutions. These increases were partially offset by a decline in ASP of 20% due to fluctuations in terms negotiated with service providers. We have compelling products for our IoT Devices market and we continue to target large operators who are introducing home control and automation products primarily in the aforementioned regions. We expect our acquisition of Bretelon to bolster our existing product offerings in the near future by expanding the total addressable market to include products with outdoor applications, which are an ideal complement to our Z-Wave product line that covers indoor applications. We expect our revenue from the IoT Devices market to continue to increase in the foreseeable future.
Net revenue for our IoT Devices market in fiscal 2015 increased $10.7 million, or 52%, compared to fiscal 2014, which was primarily the result of increased demand in the IoT Devices market, evidenced by an increase of 59% in unit shipped primarily to the Asian, North American and European regions. These increases were partially offset by a decline in ASP of 5% due to higher volume pricing provided to service providers.
Set-top Box: Net revenue for our Set-top Box market in fiscal 2016 decreased $3.6 million, or 15%, compared to fiscal 2015 primarily due to decreased demand in the Set-top Box market, evidenced by a decrease of 20% in unit shipments primarily to the Asian region due to IPTV service providers’ pending transition to new generations of set-top box products. ASP increased 7% in comparison to fiscal 2015 primarily due to the constricted availability of some of our maturing product lines in the market, which bolstered their prices. IPTV service providers deploy set-top boxes for many years and take long periods of time to evaluate potential new platforms, which results in long cycles between design wins and actual revenue. As such, the overall decline in revenue is a result of design losses that took place over three years ago. We expect our revenue from the Set-top Box market to fluctuate and continue to decline in future periods as this revenue is dependent on IPTV service deployments by telecommunication service providers, adoption of newer and future generations of our ARM-based products, changes in inventory levels at the contract manufacturers that supply them and competitive market pressures.
Net revenue for our Set-top Box market in fiscal 2015 decreased $14.0 million, or 36%, compared to fiscal 2014 primarily due to our operator customers’ pending transitions from our MIPS-based products to the newer generation ARM-based products, resulting in a decline of 22% in units shipped and a 19% decrease in ASP on legacy products some operators continued to use.
License and Other: Our license and other revenue consists primarily of technology license revenue and revenue from other ancillary markets. Net revenue for fiscal 2016 decreased $4.6 million, or 74%, compared to fiscal 2015. Net revenue for fiscal 2015 decreased $11.3 million, or 65%, compared to fiscal 2014. In both cases, the license revenue was attributable to two license agreements pursuant to which we licensed our technology to third parties for which we were able to recognize revenue. Our obligations under the aforementioned license arrangements were completed during the second quarter of fiscal 2015 contributing to the decline. We expect license revenue to fluctuate in future periods.
Net revenue by geographic region
The following table sets forth net revenue for each geographic region based on the ship-to location of customers (in thousands, except percentages):
|
Fiscal Years Ended |
||||||||||||||||||||||||
|
January 30, 2016 |
% of Net Revenue |
January 31, 2015 |
% of Net Revenue |
February 1, 2014 |
% of Net Revenue |
|||||||||||||||||||
|
Asia |
$ | 172,773 | 76 |
% |
$ | 152,571 | 81 |
% |
$ | 144,483 | 73 |
% | ||||||||||||
|
North America |
42,335 | 19 |
% |
20,746 | 11 |
% |
28,795 | 14 |
% | |||||||||||||||
|
Europe |
10,292 | 4 |
% |
12,012 | 6 |
% |
22,262 | 11 |
% | |||||||||||||||
|
Other Regions |
1,850 | 1 |
% |
2,984 | 2 |
% |
3,653 | 2 |
% | |||||||||||||||
|
Net revenue |
$ | 227,250 | 100 |
% |
$ | 188,313 | 100 |
% |
$ | 199,193 | 100 |
% | ||||||||||||
Asia: Our net revenue increased $20.2 million, or 13%, for fiscal 2016 compared to fiscal 2015. The increase was largely attributable to the increasing deployments of new generation products by our customers within the Smart TV market. In Asia, we also experienced increases in the IoT Devices market due to increasing demand of home control products by an increasing number of operators leveraging these technologies in their service offerings to end users. These increases were partially offset by a decrease in the Media Connectivity market resulting from decreased demand from telecommunication providers. Net revenue from the Asia region as a percentage of our total net revenue during fiscal 2016 decreased five percentage points, compared to fiscal 2015. This decrease was primarily due to the significant increase in revenue in North America. China (including Hong Kong), Taiwan and Thailand represented 54%, 29% and 8%, respectively, of the total net revenue generated from Asia in fiscal 2016.
Our net revenue increased $8.1 million, or 6%, for fiscal 2015 compared to fiscal 2014. The increase was partially attributable to the deployment of newer generation products by our operators’ customers within the Smart TV market. Asia also experienced increases in the Media Connectivity and IoT Devices markets due to increased demand from telecommunication providers and increasing demand of home control products by an increasing number of operators leveraging these technologies in their service offerings to end users. These increases were partially offset by a decline in the Set-top Box market due to decreasing demand for legacy products. Net revenue from the Asia region as a percentage of our total net revenue during fiscal 2015 increased eight percentage points, compared to fiscal 2014. This increase was primarily due to the significant reduction in revenue in Europe and North America. China, (including Hong Kong), Thailand and Taiwan represented 46%, 27% and 16%, respectively, of the total net revenue generated from Asia in fiscal 2015.
North America: Our net revenue from North America increased $21.6 million, or 104%, for fiscal 2016 compared to fiscal 2015. This increase was primarily attributable to the increasing deployments of newer generation products by our operators’ customers within the Smart TV market and increases in the IoT Devices market due to increasing demand of home control and automation products by an increasing number of operators leveraging these technologies in their service offerings to end users. These increases were partially offset by lower revenue recorded in the license and other revenue market. The obligations under license agreements with two main customers in the North American region were completed during the second quarter of fiscal 2015. Net revenue from North America as a percentage of our total net revenue during fiscal 2016 increased eight percentage points compared to fiscal 2015 primarily due to the aforementioned increasing IoT Devices market base and increased deployments of products within the Smart TV market.
Our net revenue from North America decreased $8.0 million, or 28%, for fiscal 2015 compared to fiscal 2014. Net revenue from North America as a percentage of our total net revenue during fiscal 2015 decreased three percentage points, compared to fiscal 2014. These decreases were primarily due to lower revenue recorded in the license and other revenue market. The obligations under license agreements with two main customers in the North American region were completed during the second quarter of fiscal 2015.
Europe: Our net revenue from Europe decreased $1.7 million, or 14%, for fiscal 2016 compared to fiscal 2015. Net revenue from Europe as a percentage of our total net revenue for fiscal 2016 decreased two percentage points compared to fiscal 2015. These decreases were primarily the result of a decrease in shipments to our Smart TV market, primarily in Germany, as we continue to experience a shift away from legacy products with no corresponding adoption of newer generation Smart TV products within this region.
Our net revenue from Europe decreased $10.3 million, or 46%, for fiscal 2015 compared to fiscal 2014. Net revenue from Europe as a percentage of our total net revenue for fiscal 2015 decreased five percentage points, compared to fiscal 2014. These decreases were primarily the result of a decrease in shipments to our Smart TV market, primarily in Hungary, as we continue to experience a shift away from legacy products with no corresponding adoption of newer generation Smart TV products within this region.
Other regions: Our net revenue from other regions decreased $1.1 million, or 38%, for fiscal 2016 compared to fiscal 2015; and decreased $0.7 million, or 18% compared to fiscal 2014. The decreases were primarily the result of a decrease in demand for our products in the Media Connectivity market in Brazil.
Major customers
The following table sets forth the major direct customers that accounted for 10% or more of our net revenue:
|
|
|
Fiscal Years Ended |
| |||||||||
|
|
|
January 30, 2016 |
|
|
January 31, 2015 |
|
|
February 1, 2014 |
| |||
|
|
|
|
|
|
|
|
|
|
|
|
|
|
|
Sunjet Components Corps |
16 |
% |
* |
* |
||||||||
|
Benchmark Electronics |
|
|
* |
|
|
|
13 |
% |
|
|
* |
|
*Accounted for less than 10% of our net revenue.
Net revenue from each of Sunjet Components Corps and Benchmark Electronics was primarily generated through the Smart TV and Media Connectivity markets.
Gross profit and gross margin
The following table sets forth gross profit and gross margin (in thousands, except percentages):
|
For Fiscal Years Ended |
||||||||||||||||||||
|
January 30, 2016 |
% Change |
January 31, 2015 |
% Change |
February 1, 2014 |
||||||||||||||||
|
Gross profit |
$ | 113,160 | 19 |
% |
$ | 95,346 | (12 |
%) |
$ | 108,141 | ||||||||||
|
Gross margin % |
49.8 |
% |
50.6 |
% |
54.3 |
% | ||||||||||||||
Gross profit increased $17.8 million, or 19%, for fiscal 2016 compared to fiscal 2015. The increase was primarily due to higher gross profit per unit within the Smart TV market resulting from continued penetration of our new product offerings with a related impact of $31.8 million and increases in sales volumes within the IoT Devices market with a related impact of $14.5 million. Gross profit was negatively impacted by ASP declines and a decrease in sales volumes within the Media Connectivity market with related impacts of $16.7 million and $3.2 million, respectively. We also experienced $4.9 million of lower sales in license technology, which has very little cost of revenue. The combined effect of these items was a negative impact to our gross margin of 0.8 percentage points for fiscal 2016. During fiscal 2016, we benefitted from the sale of $0.9 million of inventory that had been previously written-down.
Although ASP declined across some of our target markets, we continued our significant efforts to reduce the average cost per unit, or ACU, across our markets. The decrease in ACU was primarily due to cost reduction efforts through activities targeting fixed costs. Our fixed costs include items such as depreciation and amortization and compensation costs for operations.
Our future gross margin could be impacted by our product mix and could be adversely affected by further growth in sales of products that have lower gross margins. Our gross margin may also be impacted by the geographic mix of our revenue and may be adversely affected by increased sales discounts, rebates, royalties, and product pricing attributable to competitive factors. Additionally, our manufacturing-related costs may be negatively impacted by constraints in our supply chain, which in turn could negatively affect gross margin. If any of the preceding factors that in the past have negatively impacted our gross margin arises in the future, our gross margin could decline.
Gross profit decreased $12.8 million, or 12%, for fiscal 2015 compared to fiscal 2014. Gross profit in fiscal 2015 was negatively impacted by lower sales in licensed technologies, which has very little cost of revenue, a decline in sales volume and lower ASPs within the Set-top Box market, with associated impacts of $10.2 million, $4.4 million and $5.6 million, respectively. These decreases were partially offset by increases in sales volumes within the IoT Devices market with a related impact of $6.2 million and favorable shifts in the product mix of other markets. The combined effect of these items was a negative impact to our gross margin of 3.7 percentage points for fiscal 2015. During fiscal 2015, we benefitted from the sale of $0.6 million of inventory that had been previously written-down.
Operating expenses
The following table sets forth operating expenses and operating expenses as a percent of net revenue (in thousands, except percentages):
|
Fiscal Years Ended |
||||||||||||||||||||||||
|
January 30, 2016 |
% of Net Revenue |
January 31, 2015 |
% of Net Revenue |
February 1, 2014 |
% of Net Revenue |
|||||||||||||||||||
|
Research and development |
$ | 68,784 | 30 | % | $ | 67,482 | 36 |
% |
$ | 73,162 | 37 |
% | ||||||||||||
|
Sales and marketing |
22,877 | 10 | % | 22,290 | 12 |
% |
21,637 | 11 |
% | |||||||||||||||
|
General and administrative |
20,862 | 9 | % | 19,641 | 10 |
% |
19,640 | 10 |
% | |||||||||||||||
|
Restructuring costs |
9 | - | 999 | 1 |
% |
2,261 | 1 |
% | ||||||||||||||||
|
Impairment of IP, mask sets and design tools |
1,783 | 1 | % | 2,811 | 1 |
% |
1,013 | 0 |
% | |||||||||||||||
|
Total operating expenses |
$ | 114,315 | 50 |
% |
$ | 113,223 | 60 |
% |
$ | 117,713 | 59 |
% | ||||||||||||
Research and development expense
Research and development expense consists of compensation and benefits costs including variable compensation expense, development and design costs such as mask, prototyping, testing and subcontracting costs, depreciation of our equipment costs, amortization of our engineering design tools and third-party licensed technology, stock-based compensation expense, and other expenses such as costs for facilities and travel. During certain periods, research and development expense may fluctuate relative to product development phases and project timing. The following table sets forth our research and development expense and the related change (in thousands, except percentages):
|
For Fiscal Years Ended |
Fiscal 2016 vs 2015 |
Fiscal 2015 vs 2014 |
||||||||||||||||||||||||||
|
January 30, 2016 |
January 31, 2015 |
February 1, 2014 |
$ Change |
% Change |
$ Change |
% Change |
||||||||||||||||||||||
|
Research and development expense |
$ | 68,784 | $ | 67,482 | $ | 73,162 | $ | 1,302 | 2 |
% |
$ | (5,680 |
) |
(8 |
%) | |||||||||||||
Research and development expense increased $1.3 million, or 2%, in fiscal 2016 compared to fiscal 2015. The increase was primarily due to increases of $1.2 million in compensation and benefits. We also hired additional employees during the latter half of fiscal 2016 to contribute to the development of emerging technologies within the Smart TV market contributing to an average annual increased base of employees of approximately 3.9%. We had 516 employees in research and development at the end of fiscal 2016 compared to 489 employees at the end of fiscal 2015.
Research and development expense decreased $5.7 million, or 8%, in fiscal 2015 compared to fiscal 2014. The decrease was primarily due to reductions of $6.1 million in compensation and benefits and $1.1 million in support and other variable expenses, partially offset by a $1.5 million increase in amortization and depreciation expense. The reduction in our research and development expense resulted from our restructuring efforts principally through reduction in force. We hired additional employees during fiscal 2015 to contribute to the development of emerging technologies within the Smart TV market which partially offset the reductions experienced as part of our restructuring efforts. We had 489 employees in research and development at the end of fiscal 2015 compared to 497 employees at the end of fiscal 2014.
Sales and marketing expense
Sales and marketing expense consists primarily of compensation and benefits costs, including commissions to our direct sales force, stock-based compensation expense, trade shows, travel and entertainment expenses and external commissions. Our sales and marketing expense is summarized as follows (in thousands, except percentages):
|
For Fiscal Years Ended |
Fiscal 2016 vs 2015 |
Fiscal 2015 vs 2014 |
||||||||||||||||||||||||||
|
January 30, 2016 |
January 31, 2015 |
February 1, 2014 |
$ Change |
% Change |
$ Change |
% Change |
||||||||||||||||||||||
|
Sales and marketing expense |
$ | 22,877 | $ | 22,290 | $ | 21,637 | $ | 587 | 3 |
% |
$ | 653 | 3 |
% | ||||||||||||||
Sales and marketing expense increased $0.6 million, or 3%, in fiscal 2016 compared to fiscal 2015 primarily due to increases of $0.9 million in marketing programs and tradeshow costs, partially offset by a reduction of compensation and benefits and other miscellaneous costs. We had 102 employees in sales and marketing at the end of both fiscal 2016 and fiscal 2015.
Sales and marketing expense increased $0.7 million, or 3%, in fiscal 2015 compared to fiscal 2014 primarily due to increases of $0.8 million in marketing programs and $0.7 million in travel and other variable costs. These expenses were partially offset by a reduction of $0.9 million in compensation and benefits resulting from our reduction in force and our restructuring efforts. We had 102 employees in sales and marketing at the end of fiscal 2015 compared to 112 employees at the end of fiscal 2014.
General and administrative expense
General and administrative expense consists primarily of compensation and benefits costs, stock-based compensation expense, legal, accounting and other professional fees and facilities expenses. Our general and administrative expense is summarized as follows (in thousands, except percentages):
|
For Fiscal Years Ended |
Fiscal 2016 vs 2015 |
Fiscal 2015 vs 2014 |
||||||||||||||||||||||||||
|
January 30, 2016 |
January 31, 2015 |
February 1, 2014 |
$ Change |
% Change |
$ Change |
% Change |
||||||||||||||||||||||
|
General and administrative expense |
$ | 20,862 | $ | 19,641 | $ | 19,640 | $ | 1,221 | 6 |
% |
$ | 1 | - | |||||||||||||||
General and administrative expense increased $1.2 million, or 6%, in fiscal 2016 compared to fiscal 2015. The increase was primarily due to higher professional fees of $1.0 million, associated with legal, audit and tax activities and other outside services. We also experienced an increase in expense related to compensation and benefits of $0.4 million despite the number of employees remaining largely flat. These increases were primarily the result of one-time incentive compensation activities. These increases were partially offset by decreases in depreciation and amortization expenditures. We had 74 employees in general and administrative at the end of fiscal 2016 compared to 73 employees at the end of fiscal 2015.
General and administrative expense remained flat in fiscal 2015 compared to fiscal 2014. We had a decline of $0.3 million in compensation and benefits attributable to general and administrative personnel, primarily offset by increases of $0.3 million in shareholders-related activities and audit and tax fees. We had 73 employees in general and administrative at the end of fiscal 2015 compared to 75 employees at the end of fiscal 2014.
Restructuring costs
In fiscal 2013, as a result of significant expansion in our infrastructure and operational activities in connection with purchases and acquisitions that took place between fiscal years 2008 and 2013, and in response to certain redundancies, underperforming operations and delays in programs and product releases, we implemented a restructuring program to realign our global operating expenses with our new business conditions, and to improve efficiency, competitiveness and profitability. In fiscal 2013, we reduced our workforce by approximately 114 employees, implemented plans to scale down our reliance on contractors and consultants, impaired the unamortized value of certain software intellectual property licenses, which we no longer intend to use, initiated the closure of our facilities in Canada, Hong Kong and Japan and reduced our discretionary spending across all operational areas. Costs relating to facilities closure or lease commitment are recognized when the facility has been exited. Termination costs are recognized when the costs are deemed both probable and estimable and notification to impacted employees has occurred.
In fiscal 2014, as part of our continuing efforts to reduce expenses, we incurred restructuring charges of approximately $2.3 million, of which $1.7 million was related to workforce reductions of 67 employees across several geographic regions and $0.6 million was related to early termination of lease agreements for locations in Canada and southern California. Of the total restructuring charges recorded in fiscal 2014, less than $0.1 million was reflected in cost of revenue and $2.3 million was reflected in operating expenses.
In fiscal 2015, continuing our efforts to reduce expenses, we incurred restructuring charges of approximately $1.1 million, all of which was related to workforce reductions of 29 employees across several geographic regions, the majority of which were in our operations in Israel. Of the total restructuring charges recorded in fiscal 2015, approximately $0.1 million was reflected in cost of revenue and $1.0 million was reflected in operating expenses.
In fiscal 2016, we incurred restructuring charges of less than $0.1 million, substantially all of which was related to facility exit cost adjustments, which was reflected in operating expenses. The restructuring expenses incurred during fiscal 2016 were a continuation of activities that were initiated in the prior fiscal years. However, no new restructuring activities were undertaken in association with the aforementioned restructuring program initiated in fiscal 2013.
Expenses recognized for restructuring activities impacting our operating expenses are included in “Restructuring costs” in the consolidated statements of operations. We estimate that these restructuring measures have reduced ongoing headcount expenses in research and development, sales and marketing and general and administrative by approximately $21.0 million to $22.5 million annually and other additional operational expenses by $0.8 million to $1.0 million annually. Our restructuring measures could negatively impact our revenue and results of operations in the future as a result of less employees developing future products and working to sell our products.
A combined summary of the recent activity of the restructuring plans initiated by us is as follows (in thousands):
|
Workforce Reduction |
Asset Impairment |
Facility Exit Costs |
Total |
Cumulative Restructuring Costs |
||||||||||||||||
|
Liability, February 2, 2013 |
$ | 1,014 | $ | - | $ | 8 | $ | 1,022 | $ | 3,264 | ||||||||||
|
Charges in fiscal 2014 |
1,696 | - | 610 | 2,306 | 2,306 | |||||||||||||||
|
Cash payments |
(2,347 |
) |
- | (616 |
) |
(2,963 |
) |
|||||||||||||
|
Liability, February 1, 2014 |
363 | - | 2 | 365 | 5,570 | |||||||||||||||
|
Charges in fiscal 2015 |
1,083 | - | (20 |
) |
1,063 | 1,063 | ||||||||||||||
|
Cash payments |
(1,382 |
) |
- | 8 | (1,374 |
) |
- | |||||||||||||
|
Non-cash items |
38 | - | 10 | 48 | - | |||||||||||||||
|
Liability, January 31, 2015 |
102 | - | - | 102 | 6,633 | |||||||||||||||
|
Charges in fiscal 2016 |
3 | - | 6 | 9 | 9 | |||||||||||||||
|
Cash payments |
(3 |
) |
- | (7 |
) |
(10 |
) |
- | ||||||||||||
|
Non-cash items |
- | 1 | 1 | - | ||||||||||||||||
|
Liability, January 30, 2016 |
$ | 102 | $ | - | $ | - | $ | 102 | $ | 6,642 | ||||||||||
Impairment of long-lived assets
We test long-lived assets, including our purchased intangible assets, for impairment whenever events or changes in circumstances, such as a change in technology, indicate that the carrying value of these assets may not be recoverable. If indicators of impairment exist, we determine whether the carrying value of an asset or asset group is recoverable, based on comparisons to undiscounted expected future cash flows that the assets are expected to generate. If an asset is not recoverable, we record an impairment loss equal to the amount by which the carrying value of the asset exceeds its fair value. We primarily use the income valuation approach to determine the fair value of our long-lived assets and purchased intangible assets. We also periodically review our current assets for other-than-temporary declines in fair-value based on the specific identification method and write-down the carrying value when an other-than temporary decline has occurred.
Our business requires investment in purchased intellectual properties, mask sets and design tools that are technologically advanced but can quickly become significantly underutilized or rendered obsolete by rapid changes in demand in the semiconductor industry. We periodically review our purchased intellectual properties, mask sets and design tools for possible impairment or whenever events or changes in circumstances indicate that their carrying amounts may not be recoverable. The results of this review indicated certain purchased IP licenses incorporated into discontinued products primarily related to the Media Connectivity market were impaired; as a result, we recorded impairment charges for purchased IP of $0.4 million. In addition, we recorded impairment charges associated with discontinued products for mask sets primarily related to the Media Connectivity market of $1.3 million and design tools less than of $0.1 million, all of which was recorded in operating expenses in the accompanying consolidated statement of operations. We recorded a total impairment of $1.7 million related to these discontinued products in operating expenses in fiscal 2016.
During fiscal 2015, we identified that certain purchased IP licenses incorporated into discontinued products primarily related to Set-top Box products were impaired; as a result, we recorded an impairment charge for purchased IP of $0.7 million. In addition, we recorded an impairment charge for mask sets and design tools associated with such discontinued products of $1.8 million and $0.3 million, respectively. We recorded a total impairment of $2.8 million related to these discontinued products in operating expenses in fiscal 2015.
During fiscal 2014, we continued to restructure our operations to further align our operating expenses with our business, industry and revenue outlook. In connection with our continued restructuring plan, we performed an impairment review of our intangible assets by comparing undiscounted expected future cash flows with the carrying values of the underlying assets. The results of this review indicated certain purchased IP licenses incorporated into discontinued products were impaired; as a result, we recorded an impairment charge for purchased IP of $0.3 million. In addition, we recorded an impairment charge for certain software, equipment and leasehold improvements associated with such discontinued products of $0.6 million. We recorded a total impairment of $1.0 million related to products in development in operating expenses in fiscal 2014.
The following table presents the amortization of intangible assets in the accompanying consolidated statements of operations (in thousands):
|
Fiscal Years Ended |
||||||||||||
|
January 30, 2016 |
January 31, 2015 |
February 1, 2014 |
||||||||||
|
Cost of revenue |
$ | 7,586 | $ | 7,922 | $ | 9,105 | ||||||
|
Operating expenses |
1,722 | 1,418 | 1,542 | |||||||||
|
Total intangible amortization expense |
$ | 9,308 | $ | 9,340 | $ | 10,647 | ||||||
Intangible assets subject to amortization were as follows as of January 30, 2016 (in thousands, except for years):
|
January 30, 2016 |
||||||||||||||||||||
|
Gross Value |
Impairment |
Accumulated Amortization and Effect of Currency Translation |
Net Value |
Weighted Average Remaining Amortization Period (Years) |
||||||||||||||||
|
Acquired intangible assets: |
||||||||||||||||||||
|
Developed technology |
$ | 85,427 | $ | (24,614 |
) |
$ | (48,824 |
) |
$ | 11,989 | 6.5 | |||||||||
|
Customer relationships |
54,505 | (30,486 |
) |
(19,557 |
) |
4,462 | 5.7 | |||||||||||||
|
Trademarks and other |
4,078 | - | (3,739 |
) |
339 | 2.9 | ||||||||||||||
|
Purchased IP - amortizing |
32,838 | (5,516 |
) |
(18,696 |
) |
8,626 | 2.9 | |||||||||||||
|
Total amortizing |
176,848 | (60,616 |
) |
(90,816 |
) |
25,416 | 5.1 | |||||||||||||
|
Purchased IP - not yet deployed |
15,774 | (4,140 |
) |
- | 11,634 | |||||||||||||||
|
Total intangibles |
$ | 192,622 | $ | (64,756 |
) |
$ | (90,816 |
) |
$ | 37,050 | ||||||||||
Stock-based compensation expense
The following table sets forth stock-based compensation expense that is included in each functional line item in the consolidated statements of operations (in thousands):
|
Fiscal Years Ended |
||||||||||||
|
January 30, 2016 |
January 31, 2015 |
February 1, 2014 |
||||||||||
|
Cost of revenue |
$ | 227 | $ | 190 | $ | 267 | ||||||
|
Research and development |
3,241 | 3,147 | 3,381 | |||||||||
|
Sales and marketing |
1,151 | 979 | 1,275 | |||||||||
|
General and administrative |
1,940 | 1,963 | 1,891 | |||||||||
|
Total stock-based compensation |
$ | 6,559 | $ | 6,279 | $ | 6,814 | ||||||
The expensing of employee stock-based payment awards will continue to have an adverse impact on our results of operations. As of January 30, 2016, the unrecorded stock-based compensation balance related to stock options and restricted stock units outstanding excluding estimated forfeitures was $0.8 million and $7.0 million, respectively, which will be recognized over an estimated weighted average amortization period of 2.0 years. The amortization period is based on the expected vesting term of the awards. The increase in stock-based compensation expense for fiscal 2016 compared to fiscal 2015 was primarily due to the appreciation of our stock price, partially offset by a larger number of restricted stock units that vested or forfeited during the year. Future stock-based compensation expense and unearned stock-based compensation will increase to the extent that we grant additional equity awards to employees or assume unvested equity awards in connection with any acquisitions.
Sale of development project
On March 8, 2013, we entered into an Asset Purchase Agreement with a third party (the “Buyer”) to sell certain development projects (intellectual property) and long-lived assets (the “Connectivity Assets”) related to the connectivity technology over coaxial cable market, including the transfer of 21 employees (the “Connectivity Employees”) to the Buyer. The aggregate carrying amount of the Connectivity Assets ultimately transferred was approximately $0.6 million and were classified as assets held for sale in prepaid expenses and other current assets in the consolidated balance sheet at February 2, 2013. We received an initial payment of $2.0 million in cash at the closing of the transaction and a payroll expense reimbursement payment of $0.6 million (as described more fully below). Under the terms of the Asset Purchase Agreement, if certain technical milestones were met by September 30, 2013 as a result of further development of the transferred technology by the Buyer, we were to be paid an additional $5.0 million in cash.
In April 2013, upon receiving the closing consideration of $2.0 million, we recorded a gain of $1.1 million, net of the carrying value of the Connectivity Assets and fees for legal and bank services of approximately $0.4 million. The gain is included in “Gain on sale of development project” in the consolidated statements of operations for fiscal 2014. Additionally, in April 2013, in connection with the Asset Purchase Agreement, the Buyer reimbursed us for payroll expenses related to the employees transferred to the Buyer for the period from February 1, 2013 through the actual payroll transfer, totaling $0.6 million. As the contingent consideration was uncertain at the time of the initial sale, we did not recognize the contingent payment.
The Buyer advised us that it did not believe the milestones had been met by the deadline of September 30, 2013. On May 19, 2014, the parties amended the Asset Purchase Agreement to require the use of Judicial Arbitration and Mediations Services (“JAMS”) for arbitration to settle the dispute between the parties. We pursued our rights to the milestone consideration payment through the alternative dispute resolution provisions set forth in the amendment. On September 5, 2014, the Buyer filed counterclaims in response to our claims arising from the Asset Purchase Agreement. Arbitration regarding this dispute took place on June 1, 2015. In August 2015, we prevailed on all of the claims we asserted against the Buyer, and all of the Buyer’s counterclaims against us were denied. We were awarded $5.0 million plus reimbursement of reasonable legal and other associated costs and interest. We have recovered $2.6 million in legal costs, interest and other associated expenses to date from the Buyer, for a total recovery of $7.6 million, which was recorded as other income in our consolidated statements of operations in its entirety.
Acquisition of Bretelon, Inc.
On November 4, 2015, we completed the acquisition of Bretelon, Inc. (“Bretelon”), which is engaged in developing an advanced form of mobile IoT technology (“Acquisition”). In accordance with the related Agreement and Plan of Merger (the “Merger Agreement”), all of the outstanding equity interests of Bretelon were exchanged for aggregate consideration of approximately $19.4 million in cash subject to certain adjustments (the “Merger Consideration”), which was funded with a combination of cash on hand and the incurrence and subsequent payment of certain liabilities. We retained a portion of the consideration following the closing for the satisfaction of indemnification claims made within a specified period of time. The Acquisition was consummated on November 12, 2015. Certain members of our board of directors held an interest in Bretelon prior to the consummation of the Acquisition. For further discussion, refer to Note 16, “Related parties” of the Notes to consolidated financial statements of this Form 10-K included in Item 8 of this report.
Our acquisition of Bretelon during the fourth quarter was a major step forward in expanding our overall IoT footprint. This Acquisition expands our total addressable market to include outdoor applications, which are an ideal complement to our Z-Wave product line that currently covers indoor applications. Mobile IoT is a strong growth market with an expanding range of applications for both consumer and commercial consumption. Additionally, we intend to take advantage of the synergy between these two product lines to service smart city and commercial opportunities that make outdoor use of the Z-Wave mesh network and mobile IoT connectivity. For further discussion, refer to Note 7, “Business combinations” of the Notes to consolidated financial statements of this Form 10-K included in Item 8 of this report.
Impairment of investment
In fiscal 2016, we recorded approximately $0.4 million; and in both fiscal 2015 and fiscal 2014, $0.6 million in other-than temporary impairment charges from our privately-held investments.
Interest and other income, net
The following table sets forth our net interest and other income and related percentage change (in thousands, except percentages):
|
For Fiscal Years Ended |
Fiscal 2016 vs 2015 |
Fiscal 2015 vs 2014 |
||||||||||||||||||||||||||
|
January 30, 2016 |
January 31, 2015 |
February 1, 2014 |
$ Change |
% Change |
$ Change |
% Change |
||||||||||||||||||||||
|
Interest and other income, net |
$ | 794 | $ | 1,771 | $ | 827 | $ | (977 |
) |
(55 |
%) |
$ | 944 | 114 |
% | |||||||||||||
Interest and other income primarily consist of interest income from marketable securities, income from refundable research and development credits, gains or losses on foreign exchange transactions, gains or losses on sales of marketable securities, gains or losses on currency hedging activities and gains or losses on disposals of software, equipment and leasehold improvements. The decrease in interest and other income of $1.0 million, or 55%, in fiscal 2016 compared to fiscal 2015 was primarily due to $0.8 million of unfavorable foreign currency fluctuations due to the weakening of the US Dollar over other currencies in which we operate.
The increase in interest and other income of $0.9 million, or 114%, in fiscal 2015 compared to fiscal 2014 was primarily due to $0.8 million of favorable foreign currency fluctuations due to the strengthening of the US Dollar over other currencies in countries in which we operate and a $0.4 million hedging loss in fiscal 2014 relating to foreign exchange contracts against the Israeli shekel with no corresponding loss in fiscal 2015, partially offset by $0.3 million of lower interest income resulting from a lower average marketable security balances during fiscal 2015.
Provision for income taxes
We recorded an income tax provision of $7.2 million, $5.0 million and $3.0 million in fiscal 2016, 2015 and 2014, respectively. The fiscal 2016, 2015 and 2014 effective tax rates were approximately 98%, 30%, and 36%, respectively. Our fiscal 2016 effective tax rate differs from the federal statutory rate of 35% primarily due to changes in US valuation allowances, uncertain tax positions, nondeductible compensation, acquisition related adjustments and foreign operations. Our fiscal 2015 effective tax rate differs from the federal statutory rate of 35% primarily due to the tax impact of R&D tax credits, tax audit settlements, nondeductible compensation, and foreign operations as most of our net losses were in a foreign tax jurisdiction with a zero tax rate where no tax benefit could be realized. Our fiscal 2014 effective tax rate differs from the federal statutory rate of 35% primarily because most of our net losses were in a foreign tax jurisdiction with a zero tax rate where no tax benefit could be realized.
Liquidity and capital resources
The following table sets forth the cash and cash equivalents and short-term marketable securities as of January 30, 2016 and January 31, 2015 (in thousands):
|
January 30, 2016 |
January 31, 2015 |
|||||||
|
Cash and cash equivalents |
$ | 63,790 | $ | 83,502 | ||||
|
Short-term marketable securities |
4,805 | 6,347 | ||||||
| $ | 68,595 | $ | 89,849 | |||||
We believe our existing balances of cash, cash equivalents and marketable securities will be sufficient to satisfy our working capital needs, capital asset purchases, outstanding commitments and other liquidity requirements associated with existing operations over the next 12 months.
As of January 30, 2016, our principal sources of liquidity consisted of cash and cash equivalents and short-term marketable securities of $68.6 million, which represents approximately $1.87 per share of outstanding common stock as compared to $2.54 per share at January 31, 2015. Working capital as of January 30, 2016 was $92.5 million. Total cash and cash equivalents and short-term marketable securities decreased by $21.3 million during fiscal 2016 primarily due to changes in operating assets and liabilities of $27.7 million, net cash paid in connection with our acquisition of Bretelon of $19.3 million and purchases of tangible and intangible assets of $6.9 million and $7.2 million, respectively, partially offset by $28.5 million of net income after adjusting for non-cash items, proceeds from our sale of a development project and privately-held investment of $7.6 million and $0.5 million, respectively, and cash provided by financing activities of $3.6 million. We expect cash flow to fluctuate in future periods with varying levels of sustainability.
As of January 30, 2016, we held $3.5 million of long-term marketable securities. Although these marketable securities have maturities of greater than one year, we hold them as available-for-sale and may access these funds prior to their contractual maturities.
The following table sets forth the primary net cash inflows and outflows for fiscal 2016, 2015 and 2014 (in thousands):
|
Fiscal Years Ended |
||||||||||||
|
January 30, 2016 |
January 31, 2015 |
February 1, 2014 |
||||||||||
|
Net cash (used in) provided by: |
||||||||||||
|
Operating activities |
$ | 782 | $ | 15,676 | $ | 21,434 | ||||||
|
Investing activities |
(23,713 |
) |
1,795 | (9,140 |
) | |||||||
|
Financing activities |
3,562 | 2,083 | 1,047 | |||||||||
|
Effect of foreign exchange rate changes on cash and cash equivalents |
(343 |
) |
(378 |
) |
(233 |
) | ||||||
|
Net (decrease) increase in cash and cash equivalents |
$ | (19,712 |
) |
$ | 19,176 | $ | 13,108 | |||||
Cash flows from operating activities
Net cash provided by operating activities of $0.8 million for fiscal 2016 was primarily due to $28.5 million of net income after non-cash adjustments of $28.4 million, primarily offset by $27.7 million of changes in operating assets and liabilities. Cash used in accounts receivable of $4.4 million was primarily related to increased revenue and timing of collections. Cash used for inventory of $9.4 million resulted from the purchases of media processor wafers in anticipation of expected demand primarily within the Smart TV and IoT Devices markets. Cash used in accrued liabilities, compensation and related benefits of $5.3 million was primarily the result of timing of payments and payments on previously reserved rebates. Cash used in other non-current assets of $4.9 million was primarily the result of commitments for purchases of IP for use in future product offerings. Cash used in other prepaid expenses and other current assets of $4.9 million was also a result of IP purchase commitments and prepayments for income taxes.
Net cash provided by operating activities of $0.8 million for fiscal 2016 represents a $14.9 million decrease from the cash provided by operating activities during fiscal 2015. The change was largely attributable to changes in operating assets and liabilities of $27.7 million, partially offset by the increase in net income of $12.8 million after adjusting for non-cash items. We experienced an increase in cash used for inventory, accounts payable and accounts receivable of $5.1 million, $3.3 million and $4.5 million, respectively. Cash used for prepaid expenses and other current assets, other non-current assets, and accrued liabilities, compensation and related benefits increased $3.6 million, $8.0 million and $12.0 million, respectively. These decreases were partially offset by increased cash provided by income taxes payable of $2.9 million and other long-term liabilities of $5.9 million.
We experienced higher media processor wafer purchases resulting in an increase in inventory in anticipation of seasonal customer demand and expanding opportunities in our target markets. The change in accounts receivable from fiscal 2015 was primarily the result of increased revenue as well as the timing of product shipments and collections. Cash used in accrued liabilities, compensation and related benefits was primarily the result of timing of payments and higher rebates payments. Cash used in other non-current assets was primarily the result of larger commitments for purchases of IP for use in future product offerings. Increases in cash used in accounts payable were primarily the result of timing of payments and the assumption and subsequent payments of liabilities from our acquisition of Bretelon in the fourth quarter of fiscal 2016. The change in income taxes payable is a result of similar tax payment activity in comparison to fiscal 2015 resulting in nominal changes in recorded balances. The change in other long-term liabilities from fiscal 2015 primarily resulted from larger commitments for purchases of IP for use in future product offerings. The increase in cash used in prepaid expenses and other current assets was primarily the result of increases in tax prepayments.
Net cash provided by operating activities of $15.7 million for fiscal 2015 represents a $5.8 million decrease from the cash provided by operating activities during fiscal 2014. The change was largely attributable to the decrease in net income of $5.8 million after adjusting for non-cash items primarily due to decreases in revenue and changes in deferred income taxes. Cash used for inventory, prepaids and other current assets, and other long-term liabilities increased $8.1 million, $5.2 million, and $12.4 million, respectively, from fiscal 2014. These decreases were partially offset by increased cash provided by accounts receivable of $6.0 million, accrued liabilities, compensation and related benefits of $14.5 million and income taxes payable of $5.1 million. The change in accounts receivable in fiscal 2015 from fiscal 2014 was primarily the result of the timing of product shipments and collections. The change in accrued liabilities, compensation and related benefits was primarily due to timing of payments and increased rebate reserves. The change in income taxes payable is a result of lower tax reserves in fiscal 2015. Fiscal 2015 experienced higher media processor wafer purchases resulting in an increase in inventory. The change in other long-term liabilities primarily resulted from payments of previously accrued design tools and license fees. The change in prepaids and other current assets primarily resulted from a deposit we hold with one of our suppliers coming due within the next fiscal year, and consequently was reclassified from long-term to short-term.
Cash flows from our operating activities will continue to fluctuate based upon our ability to grow net revenues while reducing our costs and managing the timing of payments to us from customers and to vendors from us, the timing of inventory purchases and subsequent manufacture and sale of our products.
Cash flows from investing activities
Net cash used in investing activities was $23.7 million for fiscal 2016, which was primarily due to our acquisition of Bretelon in the fourth quarter of fiscal 2016 for a total cash consideration of $19.3 million. For further discussion on our acquisition of Bretelon, refer to Note 7, “Business combinations” of the Notes to consolidated financial statements of this Form 10-K included in Item 8 of this report. We received proceeds from our sale of a development project and privately-held investment of $7.6 million and $0.5 million, respectively, partially offsetting the aforementioned acquisition related consideration. Other financing related activity was due to net sales of marketable securities, purchases of IP, and purchases of software, equipment and leasehold improvements of $2.1 million, $7.2 million and $6.9 million, respectively. Purchases of intangible and tangible property were primarily to support the development and advancement of emerging technologies within our target markets.
Net cash used in investing activities of $23.7 million for fiscal 2016 represents a $25.5 million decrease from the amount of cash provided by investing activities from fiscal 2015. The decrease was primarily due to our acquisition of Bretelon in the fourth quarter of fiscal 2016 for a total cash consideration of $19.3 million. We received proceeds from the sale and maturities of marketable securities of $24.7 million during fiscal 2016 as compared to $15.6 million of sales or maturities during fiscal 2015. Conversely, we experienced an increase in purchases of similar securities of $22.6 million during fiscal 2016 as compared to $3.1 million during fiscal 2015. Our proceeds from our sale of a development project and privately-held investment of $7.6 million and $0.5 million, respectively, partially offset the decrease from cash provided in fiscal 2015.
Net cash provided by investing activities was $1.8 million for fiscal 2015, which was primarily due to net sales and maturities of marketable securities of $12.5 million, partially offset by purchases of IP of $3.6 million and tangible and other intangible assets of $8.7 million, primarily to support the development and advancement of emerging technologies within our target markets. Other sources of cash provided by investing activities included $0.2 million from repayment of a note receivable and $1.4 million of releases in restricted cash.
Net cash provided by investing activities of $1.8 million for fiscal 2015 represents a $10.9 million increase from the amount of cash used in investing activities in fiscal 2014. The increase was primarily due to an increase from net proceeds from the sale and maturities of marketable securities of $4.4 million and decreased purchases of tangible and intangible property and equipment made in comparison to fiscal 2014 resulting in a net increase of $9.5 million. Releases of restricted cash of $1.4 million during fiscal 2015 as a result of our halting hedging activities contributed to the overall increase. These favorable changes were partially offset by net proceeds received during fiscal 2014 from the sale of a development project and an investment, net of transaction fees in the amount of $2.0 million and $2.1 million, respectively, with no corresponding amount in fiscal 2015.
Cash flows from financing activities
Net cash provided by financing activities was $3.6 million for fiscal 2016, which was due to the net proceeds from the exercise of employee stock options and employee stock purchases. The increase of $1.5 million from fiscal 2015 was primarily the result of higher exercise activity related to stock options in the current year.
Net cash provided by financing activities was $2.1 million for fiscal 2015, which primarily was due to the net proceeds from exercises of employee stock options and employee stock purchases of $2.3 million, partially offset by $0.2 million of excess tax expense from stock-based compensation. Cash provided by financing activities of $2.1 million for fiscal 2015 represents a $1.0 million increase from the amount of cash provided by financing activities in fiscal 2014 primarily due to the changes in the excess tax benefit from stock-based compensation and the repurchase of common stock in fiscal 2014 with no corresponding purchase in fiscal 2015.
As of January 30, 2016, $59.6 million of the $72.1 million of our cash, cash equivalents and marketable securities was held by our foreign subsidiaries. If these funds are needed for our operations in the U.S., we would be required to accrue and pay U.S. taxes to repatriate these funds. However, our intent is to permanently reinvest these funds outside of the U.S. and our current plans do not demonstrate a need to repatriate them to fund our U.S. operations. We are not aware of any trends, demands or uncertainties as a result of this policy that are reasonably likely to have a material effect on our business, as a whole or that may be relevant to our financial flexibility.
Our marketable securities primarily include corporate bonds, fixed income mutual funds and money market funds. We monitor all of our marketable securities for impairment and if these securities are reported to have had a decline in fair value, we may need to use significant judgment to identify events or circumstances that would likely have a significant adverse effect on the future value of each investment including: (i) the nature of the investment; (ii) the cause and duration of any impairment; (iii) the financial condition and near term prospects of the issuer; (iv) for securities with a reported decline in fair value, our ability to hold the security for a period of time sufficient to allow for any anticipated recovery of fair value; (v) the extent to which fair value may differ from cost; and (vi) a comparison of the income generated by the securities compared to alternative investments. We would recognize an impairment charge if a decline in the fair value of our marketable securities is judged to be other-than-temporary.
Off-Balance Sheet Arrangements
As of January 30, 2016, we did not have any relationships with unconsolidated entities or financial partnerships, such as entities often referred to as structured finance or special purpose entities, which would have been established for the purpose of facilitating off-balance sheet arrangements or other contractually narrow or limited purposes.
Contractual obligations and commitments
We generally do not have guaranteed price or quantity commitments from any of our suppliers. Additionally, we generally acquire products for sale to our customers based on purchase orders received as well as forecasts from such customers. Purchase orders with delivery dates greater than twelve weeks are typically cancelable without penalty to our customers. We currently place non-cancelable orders to purchase semiconductor wafers, other materials and finished goods from our suppliers on an eight to twelve week lead-time basis. For further discussion, refer to Note 11, “Commitments and contingencies” of the Notes to consolidated financial statements of this Form 10-K included in Item 8 of this report.
The following table sets forth the amounts of payments due under specified contractual obligations, excluding liabilities related to uncertain tax positions as we are unable to reasonably estimate the ultimate amount or time of settlement as of January 30, 2016. (in thousands):
|
Payments due by Period |
||||||||||||||||||||
|
Fiscal 2017 |
Fiscal 2018 - 2019 |
Fiscal 2020 - 2021 |
Thereafter |
Total |
||||||||||||||||
|
Operating leases |
$ | 3,943 | $ | 2,966 | $ | 1,348 | $ | 467 | $ | 8,724 | ||||||||||
|
Third-party licensed IP |
7,070 | 1,620 | 1,500 | - | 10,190 | |||||||||||||||
|
Design tools |
3,367 | - | - | - | 3,367 | |||||||||||||||
|
Non-cancelable purchase obligations |
18,300 | - | - | - | 18,300 | |||||||||||||||
|
Total contractual obligations |
$ | 32,680 | $ | 4,586 | $ | 2,848 | $ | 467 | $ | 40,581 | ||||||||||
Privately-held investments
We have investments in privately-held companies, which we review annually to determine if they should be accounted for as variable interest entities. For the year ended January 30, 2016, we evaluated our investments in these privately-held companies and concluded that we are not the primary beneficiary of any variable interest from investment entities. As a result, we account for these investments on a cost basis and do not consolidate the activity of these investee entities. Certain events can require a reassessment of our investments in privately-held companies to determine if they meet the criteria for variable interest entities and to determine which stakeholders in such entities will be the primary beneficiary. In the event of a reassessment, we may be required to make additional disclosures or consolidate these entities in future periods.
Recent accounting pronouncements
See “Recent accounting pronouncements,” under Note 1, “Organization and summary of significant accounting policies” of the Notes to consolidated financial statements of this Form 10-K included in Item 8 of this report.
|
ITEM 7A. |
QUANTITATIVE AND QUALITATIVE DISCLOSURES ABOUT MARKET RISK |
The following discussion about our market risk disclosures involves forward-looking statements. Actual results could differ materially from those projected in the forward-looking statements. We face exposure to market risk from adverse movements in interest rates and foreign currency exchange rates, which could impact our operations and financial condition. In the past, to mitigate some of the foreign currency exchange rate risk, we utilized derivative financial instruments to hedge certain foreign currency exposures. However, we discontinued this practice in fiscal 2015 as we determined the balance sheet exposure to be relatively low based on the factors described below.
Interest rate sensitivity: As of January 30, 2016 and January 31, 2015, we held approximately $72.1 million and $94.1 million, respectively, of cash, cash equivalents and short-term and long-term marketable securities. If short-term interest rates were to decrease 10%, the decreased interest income associated with these cash, cash equivalents and marketable securities would not have a significant impact on our net income (loss) and cash flows.
Foreign currency exchange rate sensitivity: We transact our revenue in U.S. dollars. The U.S. dollar is our reporting currency. The U.S. dollar is our functional currency except for our subsidiaries in China, Denmark, Japan, Taiwan, Korea, Vietnam, France, Germany, and the Netherlands where the Chinese Yuan, Danish krone, Japanese yen, Taiwanese dollar, Korean won, Vietnamese dong and the Euro are the functional currencies, respectively. Additionally, significant portions of our Israel subsidiary’s expenses are payroll related and are denominated in Israeli shekels. This foreign currency exposure gives rise to market risk associated with exchange rate movements of the U.S. dollar against the Israeli shekel. To the extent the U.S. dollar weakens against the Israeli shekel, our Israeli subsidiary will experience a negative impact on its results of operations.
As of January 30, 2016 and January 31, 2015, we did not have any foreign exchange forward contracts to hedge certain balance sheet exposures and inter-company balances against future movements in foreign exchange rates. In the past, we did hedge portions of our forecasted expenses that were denominated in the Israeli shekel with foreign exchange forward contracts for our Israeli operation. However, we have not recently entered into any foreign exchange contracts as we determined the balance sheet exposure to be relatively low primarily due to expenses from this location becoming more centralized through integration efforts and operational efficiency initiatives.
We maintain certain cash balances denominated in the Chinese Yuan, Danish krone, Euro, Japanese yen, Hong Kong dollar, Israeli shekel, Singapore dollar, Taiwanese dollar, Korean won and Vietnamese dong. If foreign exchange rates were to weaken against the U.S. dollar immediately and uniformly by 10% from the exchange rates at January 30, 2016 and January 31, 2015, the fair value of these foreign currency amounts would decline and we would record a charge of approximately $0.6 million and $0.8 million, respectively.
|
ITEM 8. |
FINANCIAL STATEMENTS AND SUPPLEMENTARY DATA |
INDEX TO CONSOLIDATED FINANCIAL STATEMENTS
|
|
Page |
|
Report of Independent Registered Public Accounting Firm |
55 |
|
Consolidated Balance Sheets at January 30, 2016 and January 31, 2015 |
56 |
|
Consolidated Statements of Operations for the Years Ended January 30, 2016, January 31, 2015 and February 1, 2014 |
57 |
|
Consolidated Statements of Comprehensive Loss for the Years Ended January 30, 2016, January 31, 2015 and February 1, 2014 |
57 |
|
Consolidated Statements of Shareholders’ Equity for the Years Ended January 30, 2016, January 31, 2015 and February 1, 2014 |
58 |
|
Consolidated Statements of Cash Flows for the Years Ended January 30, 2016, January 31, 2015 and February 1, 2014 |
59 |
|
Notes to Consolidated Financial Statements |
60 |
REPORT OF INDEPENDENT REGISTERED PUBLIC ACCOUNTING FIRM
To the Board of Directors and Shareholders
Sigma Designs, Inc.
Fremont, CA
We have audited the accompanying consolidated balance sheets of Sigma Designs, Inc. and subsidiaries (the “Company”) as of January 30, 2016 and January 31, 2015, and the related consolidated statements of operations, comprehensive loss, shareholders’ equity, and cash flows for each of the fiscal years in the three-year period ended January 30, 2016. We also have audited the Company’s internal control over financial reporting as of January 30, 2016, based on criteria established in Internal Control - Integrated Framework (2013) issued by the Committee of Sponsoring Organizations of the Treadway Commission (COSO). Our audits also included the financial statement schedule listed in the Index at Part IV, Item 15. The Company's management is responsible for these consolidated financial statements and schedule, for maintaining effective internal control over financial reporting, and for its assessment of the effectiveness of internal control over financial reporting, included in the accompanying Management’s Report on Internal Control over Financial Reporting, appearing under Item 9A. Our responsibility is to express an opinion on these consolidated financial statements and schedule and an opinion on the Company’s internal control over financial reporting based on our audits.
We conducted our audits in accordance with the standards of the Public Company Accounting Oversight Board (United States). Those standards require that we plan and perform the audits to obtain reasonable assurance about whether the financial statements are free of material misstatement and whether effective internal control over financial reporting was maintained in all material respects. Our audits of the financial statements included examining, on a test basis, evidence supporting the amounts and disclosures in the financial statements, assessing the accounting principles used and significant estimates made by management, and evaluating the overall financial statement presentation. Our audit of internal control over financial reporting included obtaining an understanding of internal control over financial reporting, assessing the risk that a material weakness exists, and testing and evaluating the design and operating effectiveness of internal control based on the assessed risk. Our audits also included performing such other procedures as we considered necessary in the circumstances. We believe that our audits provide a reasonable basis for our opinions.
A company’s internal control over financial reporting is a process designed to provide reasonable assurance regarding the reliability of financial reporting and the preparation of financial statements for external purposes in accordance with generally accepted accounting principles. A company’s internal control over financial reporting includes those policies and procedures that (1) pertain to the maintenance of records that, in reasonable detail, accurately and fairly reflect the transactions and dispositions of the assets of the company; (2) provide reasonable assurance that transactions are recorded as necessary to permit preparation of financial statements in accordance with generally accepted accounting principles, and that receipts and expenditures of the company are being made only in accordance with authorizations of management and directors of the company; and (3) provide reasonable assurance regarding prevention or timely detection of unauthorized acquisition, use, or disposition of the company’s assets that could have a material effect on the financial statements.
Because of its inherent limitations, internal control over financial reporting may not prevent or detect misstatements. Also, projections of any evaluation of effectiveness to future periods are subject to the risk that controls may become inadequate because of changes in conditions, or that the degree of compliance with the policies or procedures may deteriorate.
In our opinion, the consolidated financial statements referred to above present fairly, in all material respects, the financial position of the Company as of January 30, 2016 and January 31, 2015, and the results of its operations and its cash flows for each of the fiscal years in the three-year period ended January 30, 2016 in conformity with accounting principles generally accepted in the United States of America. Also, in our opinion, the related financial statement schedule for each of the fiscal years in the three-year period ended January 30, 2016, when considered in relation to the consolidated financial statements as a whole, presents fairly in all material respects the information set forth therein. Also, in our opinion, the Company maintained, in all material respects, effective internal control over financial reporting as of January 30, 2016, based on criteria established in Internal Control - Integrated Framework (2013) issued by the Committee of Sponsoring Organizations of the Treadway Commission (COSO).
/s/ ARMANINO LLP
San Jose, California
April 1, 2016
SIGMA DESIGNS, INC.
CONSOLIDATED BALANCE SHEETS
(In thousands, except share data)
|
January 30, 2016 |
January 31, 2015 |
|||||||
|
ASSETS |
||||||||
|
Current assets |
||||||||
|
Cash and cash equivalents |
$ | 63,790 | $ | 83,502 | ||||
|
Short-term marketable securities |
4,805 | 6,347 | ||||||
|
Restricted cash |
900 | 400 | ||||||
|
Accounts receivable, net of allowances of $2,002 as of January 30, 2016 and $1,502 as of January 31, 2015 |
30,362 | 26,415 | ||||||
|
Inventory |
26,709 | 20,445 | ||||||
|
Deferred tax assets |
- | 3,319 | ||||||
|
Prepaid expenses and other current assets |
14,085 | 8,805 | ||||||
|
Total current assets |
140,651 | 149,233 | ||||||
|
Long-term marketable securities |
3,527 | 4,249 | ||||||
|
Software, equipment and leasehold improvements, net |
14,086 | 21,594 | ||||||
|
Intangible assets, net |
37,050 | 24,642 | ||||||
| Goodwill | 11,068 | - | ||||||
|
Deferred tax assets, net of current portion |
911 | 687 | ||||||
|
Long-term investments |
2,884 | 3,267 | ||||||
|
Other non-current assets |
6,492 | 1,661 | ||||||
|
Total assets |
$ | 216,669 | $ | 205,333 | ||||
|
LIABILITIES AND SHAREHOLDERS' EQUITY |
||||||||
|
Current liabilities |
||||||||
|
Accounts payable |
$ | 26,181 | $ | 21,207 | ||||
|
Accrued compensation and related benefits |
7,360 | 6,806 | ||||||
|
Accrued liabilities |
14,632 | 22,894 | ||||||
|
Total current liabilities |
48,173 | 50,907 | ||||||
|
Income taxes payable |
11,351 | 7,573 | ||||||
|
Long-term deferred tax liabilities |
317 | 741 | ||||||
|
Other long-term liabilities |
4,023 | 2,822 | ||||||
|
Total liabilities |
63,864 | 62,043 | ||||||
|
Commitments and contingencies (Note 11) |
||||||||
|
Shareholders’ equity |
||||||||
|
Preferred stock; no par value, 2,000,000 shares authorized; none issued and outstanding |
- | - | ||||||
|
Common stock and additional paid-in capital; no par value; 100,000,000 shares authorized; 41,424,377 issued and 36,748,628 outstanding as of January 30, 2016 and 39,973,689 issued and 35,314,546 outstanding as of January 31, 2015 |
503,809 | 493,550 | ||||||
|
Treasury stock, at cost, 4,675,749 shares as of January 30, 2016 and 4,659,143 shares as of January 31, 2015 |
(88,336 |
) |
(88,198 |
) | ||||
|
Accumulated other comprehensive loss |
(1,875 |
) |
(1,111 |
) | ||||
|
Accumulated deficit |
(260,793 |
) |
(260,951 |
) | ||||
|
Total shareholders’ equity |
152,805 | 143,290 | ||||||
|
Total liabilities and shareholders’ equity |
$ | 216,669 | $ | 205,333 | ||||
See the accompanying Notes to Consolidated Financial Statements
SIGMA DESIGNS, INC.
CONSOLIDATED STATEMENTS OF OPERATIONS
(In thousands, except per share data)
|
Fiscal Years Ended |
||||||||||||
|
January 30, 2016 |
January 31, 2015 |
February 1, 2014 |
||||||||||
|
Net revenue |
$ | 227,250 | $ | 188,313 | $ | 199,193 | ||||||
|
Cost of revenue |
114,090 | 92,967 | 91,052 | |||||||||
|
Gross profit |
113,160 | 95,346 | 108,141 | |||||||||
|
Operating expenses |
||||||||||||
|
Research and development |
68,784 | 67,482 | 73,162 | |||||||||
|
Sales and marketing |
22,877 | 22,290 | 21,637 | |||||||||
|
General and administrative |
20,862 | 19,641 | 19,640 | |||||||||
|
Restructuring costs |
9 | 999 | 2,261 | |||||||||
|
Impairment of IP, mask sets and design tools |
1,783 | 2,811 | 1,013 | |||||||||
|
Total operating expenses |
114,315 | 113,223 | 117,713 | |||||||||
|
Loss from operations |
(1,155 |
) |
(17,877 |
) |
(9,572 |
) | ||||||
|
Gain on sale of development project |
7,551 | - | 1,079 | |||||||||
|
Gain on sale of privately-held investments, net of impairment |
159 | (602 |
) |
(433 |
) | |||||||
|
Interest and other income, net |
794 | 1,771 | 827 | |||||||||
|
Income (loss) before income taxes |
7,349 | (16,708 |
) |
(8,099 |
) | |||||||
|
Provision for income taxes |
7,191 | 4,993 | 2,950 | |||||||||
|
Net income (loss) |
$ | 158 | $ | (21,701 |
) |
$ | (11,049 |
) | ||||
|
Net income (loss) per common share: |
||||||||||||
|
Basic |
$ | 0.00 | $ | (0.63 |
) |
$ | (0.32 |
) | ||||
|
Diluted |
$ | 0.00 | $ | (0.63 |
) |
$ | (0.32 |
) | ||||
|
Shares used in computing net income (loss) per share: |
||||||||||||
|
Basic |
35,890 | 34,693 | 34,206 | |||||||||
|
Diluted |
36,669 | 34,693 | 34,206 | |||||||||
SIGMA DESIGNS, INC.
CONSOLIDATED STATEMENTS OF COMPREHENSIVE LOSS
(In thousands)
|
Fiscal Years Ended |
||||||||||||
|
January 30, 2016 |
January 31, 2015 |
February 1, 2014 |
||||||||||
|
Net income (loss) |
$ | 158 | $ | (21,701 |
) |
$ | (11,049 |
) | ||||
|
Other comprehensive loss: |
||||||||||||
|
Currency translation adjustments, net of $0 tax in 2016, 2015 and 2014 |
(583 |
) |
(1,586 |
) |
(187 |
) | ||||||
|
Unrealized losses on marketable securities, net of $0 tax in 2016, 2015 and 2014 |
(181 |
) |
(176 |
) |
(252 |
) | ||||||
|
Other comprehensive loss |
(764 |
) |
(1,762 |
) |
(439 |
) | ||||||
|
Comprehensive loss |
$ | (606 |
) |
$ | (23,463 |
) |
$ | (11,488 |
) | |||
See the accompanying Notes to Consolidated Financial Statements
SIGMA DESIGNS, INC.
CONSOLIDATED STATEMENTS OF SHAREHOLDERS’ EQUITY
(In thousands, except shares)
|
Common Stock |
Treasury Stock |
Accumulated Other Comprehensive Income (Loss) |
||||||||||||||||||||||||||||||
|
Shares |
Amount |
Shares |
Amount |
Unrealized Gain (Loss) |
Accumulated Translation Adjustment |
Accumulated Deficit |
Total Shareholders’ Equity |
|||||||||||||||||||||||||
|
Balance, February 2, 2013 |
38,234,357 | $ | 475,070 | (4,192,312 |
) |
$ | (85,941 |
) |
$ | 401 | $ | 689 | $ | (228,201 |
) |
$ | 162,018 | |||||||||||||||
|
Unrealized loss on marketable securities |
- | - | - | - | (252 |
) |
- | - | (252 |
) | ||||||||||||||||||||||
|
Currency translation adjustments |
- | - | - | - | - | (187 |
) |
- | (187 |
) | ||||||||||||||||||||||
|
Stock-based compensation expense |
- | 6,814 | - | - | - | - | - | 6,814 | ||||||||||||||||||||||||
|
Tax effect related to share awards |
- | 682 | - | - | - | - | - | 682 | ||||||||||||||||||||||||
|
Net proceeds from common stock issued under share plans |
849,604 | 2,622 | - | - | - | - | - | 2,622 | ||||||||||||||||||||||||
|
Repurchase of common stock |
- | - | (466,831 |
) |
(2,257 |
) |
- | - | - | (2,257 |
) | |||||||||||||||||||||
|
Net loss |
- | - | - | - | - | - | (11,049 |
) |
(11,049 |
) | ||||||||||||||||||||||
|
Balance, February 1, 2014 |
39,083,961 | 485,188 | (4,659,143 |
) |
(88,198 |
) |
149 | 502 | (239,250 |
) |
158,391 | |||||||||||||||||||||
|
Unrealized loss on marketable securities |
- | - | - | - | (176 |
) |
- | - | (176 |
) | ||||||||||||||||||||||
|
Currency translation adjustments |
- | - | - | - | - | (1,586 |
) |
- | (1,586 |
) | ||||||||||||||||||||||
|
Stock-based compensation expense |
- | 6,279 | - | - | - | - | - | 6,279 | ||||||||||||||||||||||||
|
Tax effect related to share awards |
- | (231 |
) |
- | - | - | - | - | (231 |
) | ||||||||||||||||||||||
|
Net proceeds from common stock issued under share plans |
889,728 | 2,314 | - | - | - | - | - | 2,314 | ||||||||||||||||||||||||
|
Net loss |
- | - | - | - | - | - | (21,701 |
) |
(21,701 |
) | ||||||||||||||||||||||
|
Balance, January 31, 2015 |
39,973,689 | 493,550 | (4,659,143 |
) |
(88,198 |
) |
(27 |
) |
(1,084 |
) |
(260,951 |
) |
143,290 | |||||||||||||||||||
|
Unrealized loss on marketable securities |
- | - | - | - | (181 |
) |
- | - | (181 |
) | ||||||||||||||||||||||
|
Currency translation adjustments |
- | - | - | - | - | (583 |
) |
- | (583 |
) | ||||||||||||||||||||||
|
Stock-based compensation expense |
- | 6,559 | - | - | - | - | - | 6,559 | ||||||||||||||||||||||||
|
Tax effect related to share awards |
- | (81 |
) |
(16,606 |
) |
(138 |
) |
- | - | - | (219 |
) | ||||||||||||||||||||
|
Net proceeds from common stock issued under share plans |
1,450,688 | 3,781 | - | - | - | - | - | 3,781 | ||||||||||||||||||||||||
|
Net income |
- | - | - | - | - | - | 158 | 158 | ||||||||||||||||||||||||
|
Balance, January 30, 2016 |
41,424,377 | $ | 503,809 | (4,675,749 |
) |
$ | (88,336 |
) |
$ | (208 |
) |
$ | (1,667 |
) |
$ | (260,793 |
) |
$ | 152,805 | |||||||||||||
See the accompanying Notes to Consolidated Financial Statements
SIGMA DESIGNS, INC.
CONSOLIDATED STATEMENTS OF CASH FLOWS
(In thousands)
|
Fiscal Years Ended |
||||||||||||
|
January 30, 2016 |
January 31, 2015 |
February 1, 2014 |
||||||||||
|
Cash flows from operating activities |
||||||||||||
|
Net income (loss) |
$ | 158 | $ | (21,701 |
) |
$ | (11,049 |
) | ||||
|
Adjustments to reconcile net income (loss) to net cash provided by (used in) operating activities: |
||||||||||||
|
Depreciation and amortization |
21,972 | 21,708 | 20,154 | |||||||||
|
Stock-based compensation |
6,559 | 6,279 | 6,814 | |||||||||
|
Provision for excess and obsolete inventory |
3,157 | 4,267 | 758 | |||||||||
|
Provision for sales returns, discounts, and doubtful accounts |
500 | 1,202 | 6 | |||||||||
|
Deferred income taxes |
2,355 | 342 | 4,129 | |||||||||
|
(Loss) gain on disposal of software, equipment and leasehold improvements |
(279 |
) |
328 | 21 | ||||||||
|
Gain on sale of development project |
(7,551 |
) |
- | (1,079 |
) | |||||||
|
Gain on sale of privately-held investment |
(518 |
) |
- | (137 |
) | |||||||
|
Tax effect related to share awards |
(81 |
) |
(231 |
) |
682 | |||||||
|
Excess tax expense from stock-based compensation |
81 | 231 | (682 |
) | ||||||||
|
Impairment of intangibles, IP, mask sets, and design tools |
1,783 | 2,811 | 1,425 | |||||||||
|
Impairment of privately-held investments |
382 | 602 | 570 | |||||||||
|
Other non-cash activities |
2 | (89 |
) |
(30 |
) | |||||||
|
Changes in operating assets and liabilities: |
||||||||||||
|
Accounts receivable |
(4,447 |
) |
30 | (6,006 |
) | |||||||
|
Inventory |
(9,420 |
) |
(4,310 |
) |
3,767 | |||||||
|
Prepaid expenses and other current assets |
(4,851 |
) |
(1,288 |
) |
3,932 | |||||||
|
Other non-current assets |
(4,868 |
) |
3,124 | (133 |
) | |||||||
|
Accounts payable |
392 | 3,672 | 6,698 | |||||||||
|
Accrued liabilities, compensation and related benefits |
(5,294 |
) |
6,750 | (7,739 |
) | |||||||
|
Income taxes payable |
757 | (2,134 |
) |
(7,197 |
) | |||||||
|
Other long-term liabilities |
(7 |
) |
(5,917 |
) |
6,530 | |||||||
|
Net cash provided by (used in) operating activities |
782 | 15,676 | (21,434 |
) | ||||||||
|
Cash flows from investing activities |
||||||||||||
|
Restricted cash |
(500 |
) |
1,375 | - | ||||||||
|
Purchases of marketable securities |
(22,622 |
) |
(3,079 |
) |
(17,771 |
) | ||||||
|
Sales and maturities of marketable securities |
24,705 | 15,603 | 25,930 | |||||||||
|
Purchases of software, equipment and leasehold improvements |
(6,862 |
) |
(8,722 |
) |
(16,989 |
) | ||||||
|
Purchases of IP |
(7,193 |
) |
(3,612 |
) |
(4,868 |
) | ||||||
|
Proceeds from sale of development project, net of transaction fees |
7,551 | - | 1,971 | |||||||||
|
Proceeds from sale of privately-held investment |
518 | - | 2,137 | |||||||||
|
Net cash paid in connection with acquisition |
(19,310 |
) |
- | - | ||||||||
|
Repayment of note receivable |
- | 230 | 450 | |||||||||
|
Net cash (used in) provided by investing activities |
(23,713 |
) |
1,795 | (9,140 |
) | |||||||
|
Cash flows from financing activities |
||||||||||||
|
Net proceeds from exercise of employee stock options and stock purchase rights |
3,781 | 2,314 | 2,622 | |||||||||
|
Excess tax (expense) benefit from stock-based compensation |
(81 |
) |
(231 |
) |
682 | |||||||
|
Net share settlement and/or repurchase of common stock |
(138 |
) |
- | (2,257 |
) | |||||||
|
Net cash provided by financing activities |
3,562 | 2,083 | 1,047 | |||||||||
|
Effect of foreign exchange rate changes on cash and cash equivalents |
(343 |
) |
(378 |
) |
(233 |
) | ||||||
|
Net (decrease) increase in cash and cash equivalents |
(19,712 |
) |
19,176 | 13,108 | ||||||||
|
Cash and cash equivalents, beginning of period |
83,502 | 64,326 | 51,218 | |||||||||
|
Cash and cash equivalents, end of period |
$ | 63,790 | $ | 83,502 | $ | 64,326 | ||||||
|
Supplemental disclosure of cash flow information: |
||||||||||||
|
Cash paid for income taxes |
$ | 7,004 | $ | 6,085 | $ | 6,093 | ||||||
See the accompanying Notes to Consolidated Financial Statements
SIGMA DESIGNS, INC.
NOTES TO CONSOLIDATED FINANCIAL STATEMENTS
|
|
|
1. |
Organization and summary of significant accounting policies |
Organization and nature of operations: Sigma Designs, Inc. (referred to collectively in these consolidated financial statements as “Sigma,” “we,” “our,” “the Company” and “us”) is a provider of intelligent media platforms for use in the home entertainment and control markets. We focus on integrated semiconductor solutions that serve as the foundation for some of the world’s leading consumer products, including televisions, set-top boxes, and consumer electronics sold in the IoT Devices and Media Connectivity markets. A majority of our primary products are semiconductors that are targeted toward end-product manufacturers, Original Equipment Manufacturers, or OEMs, and Original Design Manufacturers, or ODMs. We sell our products into four primary target markets which are the Smart TV, Set-top Box, Media Connectivity and IoT Devices markets. We derive a portion of our revenue from licensing and other markets, including licenses, software development kits, engineering support services for hardware and software, engineering development for customization of chipsets and other accessories.
Basis of presentation: The consolidated financial statements include the accounts of Sigma Designs, Inc. and its wholly-owned subsidiaries. All significant intercompany balances and transactions have been eliminated. In November 2015, we completed our acquisition of Bretelon, Inc. (referred to as “Bretelon”). The consolidated financial statements include the results of operations of Bretelon commencing as of the acquisition date. See Note 7 for further discussion.
Accounting period: We follow a 52 or 53-week fiscal reporting calendar ending on the Saturday closest to January 31 each year. Our most recent fiscal year, fiscal 2016, ended on January 30, 2016, included 52 weeks. The fiscal years 2015 and 2014, ended January 31, 2015 and February 1, 2014 each included 52 weeks. Our next fiscal year, ending on January 28, 2017, will include 52 weeks.
Restructuring charges: During fiscal 2015 and 2014, we implemented restructuring plans to reorganize our operations and reduce our workforce and related operating expenses. Our restructuring charges include primarily payments to employees for severance, asset impairment charges, termination fees associated with leases and other contracts and other costs related to the closure of facilities. Accruals are recorded when management has approved a plan to restructure operations and a liability has been incurred. The restructuring accruals are based upon management estimates at the time they are recorded. These estimates can change depending upon changes in facts and circumstances subsequent to the date the original liability was recorded. During fiscal 2015 and 2014, we recorded restructuring charges of $1.1 million and $2.3 million, respectively.
Use of estimates in the preparation of financial statements: The financial statements have been prepared in accordance with accounting principles generally accepted in the United States of America (“U.S. GAAP”). The preparation of the consolidated financial statements requires us to make estimates and assumptions that affect the reported amounts of assets and liabilities, disclosures of contingent liabilities at the date of the financial statements, and the reported amounts of revenue and expenses during the reporting period. The primary areas that require significant estimates and judgments by management include, but are not limited to, revenue recognition, allowances for doubtful accounts, sales returns, warranty obligations, inventory valuation, stock-based compensation expense, goodwill, purchased intangible asset valuations, strategic investments, deferred income tax asset valuation allowances, uncertain tax positions, tax contingencies, restructuring costs, litigation and other loss contingencies. Our estimates and related judgments and assumptions are continually evaluated based on historical experience and various other factors that we believe to be reasonable under the circumstances, however, actual results could differ from those estimates, and such differences may be material to our consolidated financial statements.
SIGMA DESIGNS, INC.
NOTES TO CONSOLIDATED FINANCIAL STATEMENTS (Continued)
Fair value of financial instruments: We measure and disclose certain financial assets and liabilities at fair value defined as the exchange price that would be received for an asset or paid to transfer a liability (an exit price) in the principal or most advantageous market for the asset or liability in an orderly transaction between market participants on the measurement date. ASC Topic 820 also establishes a fair value hierarchy which requires an entity to maximize the use of observable inputs and minimize the use of unobservable inputs when measuring fair value. The standard describes three levels of inputs that may be used to measure fair value:
Level 1 – Quoted prices in active markets for identical assets or liabilities
Level 2 – Observable inputs other than Level 1 prices such as quoted prices for similar assets or liabilities; quoted prices in markets that are not active; or other inputs that are observable or can be corroborated by observable market data for substantially the full term of the assets or liabilities.
Level 3 – Unobservable inputs that are supported by little or no market activity and that are significant to the fair value of the assets or liabilities.
For certain of our assets and liabilities, including cash and cash equivalents, accounts receivable, accounts payable and other current liabilities, the carrying amounts approximate their fair value due to the relatively short maturity of these items. Marketable securities consist of available-for-sale securities that are reported at fair value with the related unrealized gains and losses included in accumulated other comprehensive income (loss), a component of shareholders’ equity. The fair value of cash equivalents and certain marketable securities is determined based on “Level 1” inputs, which consist of quoted prices in active markets for identical assets.
In accordance with the fair value accounting requirements, companies may choose to measure eligible financial instruments and certain other items at fair value. We have not elected the fair value option for any eligible financial instruments.
Derivative financial instruments: We are exposed to certain foreign currency risk. Prior to fiscal 2015, we used foreign exchange contracts to hedge certain existing and anticipated foreign currency denominated transactions in the normal course of business and may do so in the future. We account for our financial derivatives as either assets or liabilities and carry them at fair value. We do not use derivative financial instruments for speculative or trading purposes, nor do we hold or issue leveraged derivative financial instruments. Unrealized gains and losses arising from the effective portion of foreign exchange contracts that are designated as cash flow hedging instruments are recorded in accumulated other comprehensive income (loss) and are subsequently reclassified into earnings in the same period or periods during which the underlying transactions affect earnings. Gains and losses on the derivative representing either hedge ineffectiveness or hedge components excluded from the assessment of effectiveness are recognized in current earnings. Gains and losses arising from changes in the fair values of foreign exchange contracts that are not designated as hedging instruments are recognized in current earnings.
Cash and cash equivalents: All highly liquid investments with maturities of 90 days or less at the date of purchase are classified as cash equivalents.
Short and long-term marketable securities: Short-term marketable securities represent highly liquid investments with a remaining maturity date at the end of each reporting period of greater than 90 days but less than one year and are stated at fair value. Long-term marketable securities represent securities with contractual maturities greater than one year from the date of acquisition. We classify our marketable securities as available-for-sale because the sale of such securities may be required prior to maturity. Management determines the appropriate classification of its investments at the time of purchase and reevaluates the designations at each balance sheet date.
The difference between amortized cost (cost adjusted for amortization of premiums and accretion of discounts, which is recognized as an adjustment to interest income) and fair value, representing unrealized holding gains or losses, are recorded separately as a component of accumulated other comprehensive income (loss) within shareholders’ equity. Any gains and losses on the sale of marketable securities are determined based on the specific identification method.
We monitor all of our marketable securities for impairment and if these securities are reported to have a decline in fair value, we use significant judgment to identify events or circumstances that would likely have a significant adverse effect on the future value of each investment including: (i) the nature of the investment; (ii) the cause and duration of any impairment; (iii) the financial condition and future prospects of the issuer; (iv) for securities with a reported decline in fair value, our ability to hold the security for a period of time sufficient to allow for any anticipated recovery of fair value; (v) the extent to which fair value may differ from cost; and (vi) a comparison of the income generated by the securities compared to alternative investments. We recognize an impairment charge if a decline in the fair value of our marketable securities is judged to be other-than-temporary. No such impairment charges were recorded in fiscal 2016, 2015 or 2014.
SIGMA DESIGNS, INC.
NOTES TO CONSOLIDATED FINANCIAL STATEMENTS (Continued)
Accounts receivable and allowances: We defer recognition of revenue and the related receivable when we cannot estimate whether collectability is reasonably assured at the time products and services are delivered to our customers. We also provide allowances for bad debt and sales returns. In establishing the allowance for bad debt, in cases where we are aware of circumstances that may impair a specific customer’s ability to meet its financial obligations subsequent to the original sale, we will record an allowance against amounts due, and thereby reduce the net recognized receivable to the amount we reasonably believe will be collected. For all other customers, we recognize allowances for doubtful accounts based on the length of time the receivables are past due, industry and geographic concentrations, the current business environment and our historical experience.
In establishing the allowance for sales returns, we make estimates of potential future returns of products for which revenue has been recognized in the current period, including analyzing historical returns, current economic trends and changes in customer demand and acceptance of our products. Our allowance for sales returns, discounts and bad debt was $2.0 million and $1.5 million at January 30, 2016 and January 31, 2015, respectively. If the financial condition of our customers were to deteriorate, resulting in an impairment of their ability to make payments, or future product returns increased, additional allowances may be required.
Inventory: Inventory consists of wafers and other purchased materials, work in process and finished goods and is stated at the lower of standard cost, which approximates actual cost on a first-in, first-out basis, or market value. We evaluate our ending inventory for excess quantities and obsolescence on a quarterly basis. This evaluation includes analysis of historical and estimated future unit sales by product as well as product purchase commitments that are not cancelable. We develop our demand forecasts based, in part, on discussions with our customers about their forecasted supply needs. However, our customers generally only provide us with firm purchase commitments for the month and quarter and not our entire forecasted period. Additionally, our sales and marketing personnel provide estimates of future sales to prospective customers based on actual and expected design wins. A provision is recorded for inventory in excess of estimated future demand.
We write-off inventory that is obsolete. Obsolescence is determined from several factors, including competitiveness of product offerings, market conditions and product life cycles. Provisions for excess and obsolete inventory are charged to cost of revenue. At the time of the loss recognition, a new, lower-cost basis for that inventory is established and subsequent changes in facts and circumstances do not result in the restoration or increase in that newly established cost basis. If this lower-cost inventory is subsequently sold, we will realize higher gross margins for those products.
Inventory write-downs inherently involve assumptions and judgments as to amount of future sales and selling prices. As a result of our inventory valuation reviews, we charged provisions for excess and obsolete inventory of approximately $3.2 million, $4.3 million and $0.8 million to cost of revenue for fiscal 2016, 2015 and 2014, respectively. We have sold through $0.9 million, $0.6 million and $1.0 million of inventory that we had previously recorded as excess and obsolete in fiscal 2016, 2015 and 2014, respectively. Although we believe that the assumptions we use in estimating inventory write-downs are reasonable, significant future changes in these assumptions could produce a significantly different result. There can be no assurances that future events and changing market conditions will not result in significant inventory write-downs.
Warranty: Our products typically carry a one-year limited warranty that products will be free from defects in materials and workmanship. Warranty cost is estimated at the time revenue is recognized, based on historical activity and additionally for any specific known product warranty issues. Accrued warranty cost includes hardware repair and/or replacement and software support costs and is included in accrued liabilities on the consolidated balance sheets. Although we engage in extensive product quality programs and processes, our warranty obligation has been and may in the future be affected by product failure rates, product recalls, repair or replacement costs and additional development costs incurred in correcting any product failure. Should actual costs differ from our initial estimates, we record the difference in the period they are identified. Actual claims are charged against the warranty reserve.
Software, equipment and leasehold improvements: Software, equipment and leasehold improvements are stated at cost. Depreciation and amortization for software, equipment and leasehold improvements is computed using the straight-line method based on the useful lives of the assets (one to five years) or the remaining lease term if shorter. Any allowance for leasehold improvements received from the landlord for improvements to our facilities is amortized using the straight-line method over the lesser of the remaining lease term or the useful life of the leasehold improvements. Repairs and maintenance costs are expensed as incurred.
SIGMA DESIGNS, INC.
NOTES TO CONSOLIDATED FINANCIAL STATEMENTS (Continued)
Business combinations: The purchase accounting method applied to business combinations requires us to allocate the purchase price of acquired companies to the identifiable tangible and intangible assets acquired and liabilities assumed, based on their estimated fair values. Such valuations require us to make significant estimates and assumptions, especially with respect to intangible assets. The significant purchased intangible assets recorded by us include developed technology, customer relationships, purchased IP, non-compete agreements and trademarks. Critical estimates and assumptions used in valuing these assets include but are not limited to: future expected cash flows from acquired products, customer relationships and acquired developed technologies and patents; assumptions regarding brand awareness and market position, and assumptions about the period of time the brand will continue to be used in our product portfolio; and assumptions about discount rates. The estimated fair values are based upon assumptions that we believe to be reasonable but which are inherently uncertain and unpredictable and, as a result, actual results may differ from estimates.
Intangible and other long-lived assets: The amounts and useful lives assigned to intangible and other long-lived assets acquired, other than goodwill, impact the amount and timing of future amortization. Intangible assets include those acquired through business combinations and intellectual property that we purchase for incorporation into our product designs. We begin amortizing such intellectual property at the time that we begin shipment of the associated products into which it is incorporated. We amortize the intellectual property over the estimated useful life of the associated products, generally two to three years.
Goodwill is recorded as the difference, if any, between the aggregate consideration paid for an acquisition and the fair value of the net tangible and intangible assets acquired. Other intangible assets primarily represent purchased developed technology, customer relationships, purchased IP, non-compete agreements and trademarks. We currently amortize our intangible assets with definitive lives over periods ranging from three to ten years using a method that reflects the pattern in which the economic benefits of the intangible assets are consumed or otherwise used or, if that pattern cannot be reliably determined, using a straight-line amortization method.
Impairment of goodwill and other long-lived assets: We test long-lived assets, including purchased intangible assets, for impairment whenever events or changes in circumstances, such as a change in technology, indicate that the carrying value of these assets may not be recoverable. If indicators of impairment exist, we determine whether the carrying value of an asset or asset group is recoverable, based on comparisons to undiscounted expected future cash flows that the assets are expected to generate. If an asset is not recoverable, we record an impairment loss equal to the amount by which the carrying value of the asset exceeds its fair value. We primarily use the income valuation approach to determine the fair value of our long-lived assets and purchased intangible assets.
We evaluate goodwill on an annual basis as of the last day of our fiscal year or whenever events or changes in circumstances indicate the carrying value may not be recoverable. We first assess qualitative factors to determine whether it is more likely than not that the fair value of a reporting unit is less than its carrying amount. If we conclude that it is more likely than not that the fair value of a reporting unit is less than its carrying amount, we conduct a two-step quantitative goodwill impairment test. The first step requires identifying the reporting units and comparing the fair value of each reporting unit to its net book value, including goodwill. We have identified that we operate one reporting unit and the fair value of our operating unit is determined to be equal to our market capitalization as determined through quoted market prices, adjusted for a reasonable control premium. We estimate the control premium based on a review of acquisitions of comparable semiconductor companies that were completed during the last four years. If the carrying amount of a reporting unit exceeds the reporting unit’s fair value, we perform the second step of the goodwill impairment test. The second step of the goodwill impairment test involves comparing the implied fair value of the affected reporting unit’s goodwill with the carrying value of that goodwill. The amount by which the carrying value of the goodwill exceeds its implied fair value, if any, is recognized as an impairment loss.
Determining the fair value of a reporting unit is judgmental in nature and involves the use of significant estimates and assumptions. These estimates and assumptions include forecasts of revenue and operating margins used to calculate projected future cash flows, risk-adjusted discount rates, future economic and market conditions and a determination of appropriate market comparables. We base our fair value estimates on assumptions we believe to be reasonable at that time, however, actual future results may differ from those estimates. Future competitive, market and economic conditions could negatively impact key assumptions including our market capitalization, actual control premiums or the carrying value of our net assets, which could require us to realize an additional impairment.
SIGMA DESIGNS, INC.
NOTES TO CONSOLIDATED FINANCIAL STATEMENTS (Continued)
Long-term investments: Investments in private equity securities of less than 20% owned companies are accounted for using the cost method unless we can exercise significant influence or the investee is economically dependent upon us, in which case the equity method is used. We evaluate our long-term investments for impairment annually or whenever events or changes in circumstances indicate that the carrying value of these assets may not be recoverable.
Revenue recognition: We derive our revenue primarily from product sales which comprised approximately 99%, 97% and 91% of total net revenue during fiscal 2016, 2015 and 2014, respectively. Our products, which we refer to as chipsets, consist of highly integrated semiconductors and embedded software that enables real-time processing of digital video and audio content; and in the case of our IoT Devices, establishes a mesh network protocol that provides an interoperable platform for automation and monitoring solutions, all of which we refer to as embedded software. We do not deliver software as a separate product in connection with product sales. We recognize revenue for product sales when persuasive evidence of an arrangement exists, delivery has occurred, the fee is fixed or determinable and collectability is reasonably assured. These criteria are usually met at the time of product shipment. We record reductions of revenue for estimated product returns and pricing adjustments, such as rebates, in the same period that the related revenue is recorded. The amount of these reductions is based on historical sales returns, analysis of credit memo data, specific criteria included in the agreements, and other factors known at the time. We accrue 100% of potential returns at the time of sale when there is not sufficient historical sales data and recognize revenue when the right of return expires. We also accrue 100% of potential rebates at the time of sale and do not apply a breakage factor. We reverse the accrual for unclaimed rebate amounts as specific rebate programs contractually end and when we believe unclaimed rebates are no longer subject to payment and will not be paid. See Note 6 for a summary of our rebate activity.
On occasion, we derive revenue from the license of our internally developed intellectual property (“IP”). IP licensing agreements that we enter into generally provide licensees the right to incorporate our IP components in their products with terms and conditions that vary by licensee. Our license fee arrangements generally include multiple deliverables and we are required to determine whether there is more than one unit of accounting. To the extent that the deliverables are separable into multiple units of accounting, we allocate the total fee on such arrangements to the individual units of accounting using management’s best estimate of selling price ("ESP"), if third party evidence ("TPE") or vendor specific objective evidence ("VSOE") does not exist. We defer revenue recognition for consideration that is contingent upon future performance or other contractual terms.
Our process for determining our ESP for deliverables without VSOE or TPE considers multiple factors that may vary depending upon the unique facts and circumstances related to each deliverable. The key factors that we consider in developing the ESPs include the nature and complexity of the licensed technologies, our cost to provide the deliverables, the availability of substitute technologies in the marketplace and our historical pricing practices. We then recognize revenue for each unit of accounting depending on the nature of the deliverable(s) comprising the unit of accounting in accordance with the revenue recognition criteria mentioned above. Fees under these agreements generally include (a) license fees relating to our IP, (b) engineering services, and (c) support services. Historically, each of these elements has standalone value and therefore each are treated as separate units of accounting. Any future licensing arrangements will be analyzed based on the specific facts and circumstances which may be different than our historical licensing arrangements.
For deliverables related to licenses of our technology that involve significant engineering services, we recognize revenue in accordance with the provisions of the proportional performance method or “milestone.” We determine costs associated with engineering services using actual labor dollars incurred and estimate other direct or incremental costs allocated based on the percentage of time the engineer(s) spent on the project. These costs are deferred until revenue recognition criteria have been met, at which time they are reclassified as cost of revenue.
Licensing revenue deliverables are generally recognized using the milestone method. Under the milestone method, we recognize revenue that is contingent upon the achievement of a substantive milestone in its entirety in the period in which the milestone is achieved. To be considered substantive, the consideration earned by achieving the milestone should be (a) commensurate with either (i) the vendor’s performance to achieve the milestone or (ii) to the enhancement of the value of the item delivered as a result of a specific outcome resulting from the vendor’s performance to achieve the milestone (b) the consideration should relate solely to past performance, and (c) the consideration should be reasonable relative to all deliverables and payment terms in the arrangement. Other milestones that do not fall under the definition of a milestone under the milestone method are recognized under the authoritative guidance concerning revenue recognition. Licensing revenue was zero, $4.8 million and $15.4 million during fiscal 2016, 2015 and 2014, respectively.
SIGMA DESIGNS, INC.
NOTES TO CONSOLIDATED FINANCIAL STATEMENTS (Continued)
We derive a portion of our revenues in the form of fees from members of a wholly-owned entity dedicated to the marketing, development and proliferation of the Z-Wave brand. Membership fees vary based on level and are generally billed on an annual basis with no obligation to renew. Revenue from membership dues is recognized in the month earned. Membership dues received in advance are included in deferred revenues and recognized as revenue ratably over the appropriate period, which is generally twelve months or less. The monthly dues are generally structured to cover the administrative costs and membership services. Membership revenue was approximately $1.9 million, $0.9 million and zero during fiscal 2016, 2015 and 2014, respectively.
We defer revenue when payments are received from customers in advance of revenue recognition. Deferred revenue at both January 30, 2016 and January 31, 2015 was $0.4 million, and is included in accrued liabilities in the accompanying consolidated balance sheets.
Cost of revenue: Cost of revenue is comprised of the cost of our media processors and chipset solutions, which consists of the cost of purchasing finished silicon wafers manufactured by independent foundries, costs associated with our purchase of assembly, test and quality assurance services and packaging materials, as well as royalties paid to vendors for use of their technology. Also included in cost of revenue is the amortization of purchased IP, manufacturing overhead, including costs of personnel and equipment associated with manufacturing support, product warranty costs, provisions for excess and obsolete inventory, and stock-based compensation expense for personnel engaged in manufacturing support.
Foreign currency: The functional currency of our foreign subsidiaries is either the U.S. dollar or the local currency of each country. Monetary assets and liabilities denominated in foreign currencies are remeasured at exchange rates in effect at the end of each period, and non-monetary assets, such as inventory, property, plant and equipment, and liabilities are recorded at historical rates. Gains and losses from these remeasurements as well as other transaction gains and losses are included in interest and other income, net, in the consolidated statements of operations. Our subsidiaries that utilize foreign currency as their functional currency translate such currency into U.S. dollars using (i) the exchange rate on the balance sheet dates for assets and liabilities, and (ii) the average exchange rates prevailing during the period for revenues and expenses. Any translation adjustments resulting from this process are shown separately as a component of accumulated other comprehensive income (loss) within shareholders’ equity in the consolidated balance sheets. Foreign currency transaction gains and losses resulted in net losses of approximately $0.2 million, $1.0 million and $0.2 million in fiscal 2016, 2015 and 2014, respectively.
Concentration of credit risk: Financial instruments which potentially subject us to concentrations of credit risk consist primarily of cash and cash equivalents, short-term and long-term marketable securities, restricted cash, long-term investments and accounts receivable. Our cash, cash equivalents, short-term and long-term marketable securities and restricted cash are on deposit with major financial institutions, as specified in our investment policy guidelines. Such deposits may be in excess of insured limits. We believe that the financial institutions that hold our cash, cash equivalents, short-term and long-term marketable securities and restricted cash are financially sound and, accordingly, minimal credit risk exists with respect to these balances. We have not experienced any investment losses due to institutional failure or bankruptcy.
Sales to our recurring and new customers are generally made on open account, a prepaid or letter of credit basis. We perform ongoing credit evaluations of our customers and generally do not require collateral for sales on credit. We review our accounts receivable balances to determine if any receivables will potentially be uncollectible and include any amounts that are determined to be uncollectible in our allowance for doubtful accounts.
Provisions: In determining loss contingencies, we consider the likelihood of a loss of an asset or the incurrence of a liability as well as the ability to reasonably estimate the amount of such loss or liability. An estimated loss from a loss contingency is accrued and charged to expense when the information available indicates that it is probable that an asset has been impaired or a liability has been incurred, and when the amount of the loss can be reasonably estimated.
SIGMA DESIGNS, INC.
NOTES TO CONSOLIDATED FINANCIAL STATEMENTS (Continued)
Income taxes: Income taxes are accounted for under an asset and liability approach. Deferred income taxes reflect the net tax effects of any temporary differences between the carrying amounts of assets and liabilities for financial reporting purposes and the amounts reported for income tax purposes, and any operating losses and tax credit carry-forwards. Deferred tax liabilities are recognized for future taxable amounts and deferred tax assets are recognized for future deductions, net of any valuation allowance, to reduce deferred tax assets to amounts that are considered more likely than not to be realized.
The impact of an uncertain income tax position on the income tax return must be recognized as the largest amount that is more-likely-than-not to be sustained upon audit by the relevant taxing authority. An uncertain income tax position will not be recognized if it has less than a 50% likelihood of being sustained.
Stock-based compensation: We have in effect stock incentive plans under which incentive stock options, restricted stock units, restricted stock awards and non-qualified stock options have been granted to employees and non-employee members of the Board of Directors. We also have an employee stock purchase plan for all eligible employees. We measure and recognize compensation expense for all stock-based payment awards made to employees and non-employees based on the closing fair market value of the Company’s common stock on the date of grant. Stock option awards are measured using the Black-Scholes option pricing model. The value of the portion of the award that is ultimately expected to vest is recognized as expense on a ratable basis over the requisite service period for time-based awards and on a graded basis for performance-based awards in our consolidated statements of operations. We estimate forfeitures, based on historical experience, at the time of grant and revise our estimates, if necessary, in subsequent periods if actual forfeitures differ from those estimates. We recognize a benefit from share-based compensation in the Consolidated Statements of Shareholders’ Equity if an excess tax benefit is realized. Further information regarding stock-based compensation can be found in Note 13, “Equity incentive plans and employee benefits.”
Research and development costs: Costs incurred in the research and development of our products are expensed as incurred.
Advertising costs: Advertising costs are expensed as incurred and are included as an element of sales and marketing expense in the accompanying consolidated statements of operations. Advertising expenses incurred were $0.2 million, $0.1 million and less than $0.1 million in fiscal 2016, 2015 and 2014, respectively.
Comprehensive income (loss): Comprehensive income (loss) consists of net income (loss) and other comprehensive income (loss). Other comprehensive income (loss) includes certain changes in equity that are excluded from results of operations; specifically, foreign currency translation adjustments and unrealized gains or losses on marketable securities.
Recent accounting pronouncements: Recent accounting pronouncements expected to impact our operations that are not yet effective are summarized as follows:
In March 2016, the Financial Accounting Standards Board (“FASB”) issued Accounting Standards Update No. 2016-08, Revenue from Contracts with Customers: Principal versus Agent Considerations (“ASU 2016-08”). The amendments are intended to improve the operability and understandability of the implementation guidance on principal versus agent considerations. The effective date for this ASU is the same as the effective date for ASU 2014-09, Revenue from Contracts with Customers. We are currently evaluating the impact that this standard update will have on our consolidated financial statements.
In February 2016, the FASB issued Accounting Standards Update No. 2016-02, Leases (Topic 842) (“ASU 2016-02”), which requires lessees to recognize all leases, including operating leases, on the balance sheet as a lease asset or lease liability, unless the lease is a short-term lease. ASU 2016-02 also requires additional disclosures regarding leasing arrangements. ASU 2016-02 is effective for interim periods and fiscal years beginning after December 15, 2018, and early application is permitted. We are currently evaluating the impact that this standard update will have on our consolidated financial statements.
SIGMA DESIGNS, INC.
NOTES TO CONSOLIDATED FINANCIAL STATEMENTS (Continued)
In January 2016, the FASB issued Accounting Standards Update No. 2016-1, Recognition and Measurement of Financial Assets and Financial Liabilities (Topic 825) (“ASU 2016-1”). The amendments in this Update supersede the guidance to classify equity securities with readily determinable fair values into different categories (that is, trading or available-for-sale) and require equity securities (including other ownership interests, such as partnerships, unincorporated joint ventures, and limited liability companies) to be measured at fair value with changes in the fair value recognized through net income. The amendments allow equity investments that do not have readily determinable fair values to be remeasured at fair value either upon the occurrence of an observable price change or upon identification of an impairment. The amendments also require enhanced disclosures about those investments. The amendments improve financial reporting by providing relevant information about an entity’s equity investments and reducing the number of items that are recognized in other comprehensive income. This guidance is effective for annual reporting beginning after December 15, 2017, including interim periods within the year of adoption, and calls for prospective application, with early application permitted. Accordingly, the standard is effective for us beginning in the first quarter of fiscal 2019. The adoption of this guidance is not expected to have a material impact on our consolidated financial statements.
In September 2015, the FASB issued Accounting Standards Update No. 2015-16, Business Combinations (Topic 805): Simplifying the Accounting for Measurement-Period Adjustments (“ASU 2015-16”), which eliminates the requirement to retrospectively account for changes to provisional amounts initially recorded in a business acquisition opening balance sheet. Under this guidance, acquirers must recognize measurement-period adjustments in the period in which they determine the amounts, including the effect on earnings of any amounts they would have recorded in previous periods if the accounting had been completed at the acquisition date. This guidance is effective for fiscal years beginning after December 15, 2015, including interim periods within fiscal years. Accordingly, the standard is effective for us beginning in the first quarter of fiscal 2016. The adoption of this standard is not expected to have a material impact on our consolidated financial statements.
In July 2015, the FASB issued Accounting Standards Update No. 2015-11, Simplifying the Measurement of Inventory (“ASU 2015-11”), which changes guidance for subsequent measurement of inventory within the scope of the Update from the lower of cost or market to the lower of cost and net realizable value. ASU 2015-11 is effective for us beginning in the first quarter of fiscal 2018 with early adoption permitted. The adoption of this standard is not expected to have a material impact on our consolidated financial statements.
In August 2014, the FASB issued Accounting Standards Update No. 2014-15, Disclosure of Uncertainties about an Entity’s Ability to Continue as a Going Concern (“ASU 2014-15”), to provide guidance on management’s responsibility in evaluating whether there is substantial doubt about a company’s ability to continue as a going concern and to provide related footnote disclosures. ASU 2014-15 is effective for us beginning in the first quarter of fiscal 2018 with early adoption permitted. The adoption of this standard is not expected to have a material impact on our consolidated financial statements.
In May 2014, the FASB issued Accounting Standards Update No. 2014-09, Revenue from Contracts with Customers (Topic 606) (“ASU 2014-09”), which amends the existing accounting standards for revenue recognition. ASU 2014-09 is based on principles that govern the recognition of revenue at an amount an entity expects to be entitled when products are transferred to customers. The original effective date for ASU 2014-09 would have required us to adopt this standard beginning in our first quarter of 2018. In July 2015, the FASB voted to amend ASU 2014-09 by approving a one-year deferral of the effective date as well as providing the option to early adopt the standard on the original effective date. Accordingly, we may adopt the standard in either our first quarter of 2018 or 2019. The new revenue standard may be applied retrospectively to each prior period presented or retrospectively with the cumulative effect recognized as of the date of adoption. We are currently evaluating the timing of its adoption and the impact of adopting the new revenue standard on our consolidated financial statements.
Accounting standards that were recently adopted are summarized as follows:
In November 2015, the FASB issued Accounting Standards Update No. 2015-17, Balance Sheet Classification of Deferred Taxes (“ASU 2015-17”), which simplifies the presentation of deferred income taxes by eliminating the need for entities to separate deferred income tax liabilities and assets into current and noncurrent amounts in a classified statement of financial position. ASU 2015-17 is effective for companies beginning after December 15, 2016, with early application permitted as of the beginning of an interim or annual reporting period. We adopted this new standard on a prospective basis for the fiscal year ended January 30, 2016, thus resulting in the reclassification of current deferred tax assets to noncurrent on the accompanying consolidated balance sheet. The prior reporting period was not retrospectively adjusted. The adoption of this standard had no impact on our consolidated results of net income (loss) or comprehensive income (loss).
SIGMA DESIGNS, INC.
NOTES TO CONSOLIDATED FINANCIAL STATEMENTS (Continued)
|
2. |
Cash, cash equivalents and marketable securities |
As of January 30, 2016 and January 31, 2015, we had $0.9 million and $0.4 million, respectively, of restricted cash. As of January 31, 2015, restricted cash related to an office-space operating lease and other transactions and as of January 30, 2016, this amount also included an escrow withholding in association with our acquisition of Bretelon, which is not included in the amounts below. Cash, cash equivalents and marketable securities consist of the following (in thousands):
|
|
|
January 30, 2016 |
|
|
January 31, 2015 |
| ||||||||||||||||||
|
|
|
Book Value |
|
|
Net Unrealized Gains (Losses) |
|
|
Fair Value |
|
|
Book Value |
|
|
Net Unrealized Gains (Losses) |
|
|
Fair Value |
| ||||||
|
|
|
|
|
|
|
|
|
|
|
|
|
|
|
|
|
|
|
|
|
|
|
|
|
|
|
Corporate bonds |
|
$ |
7,052 |
|
|
$ |
(7 |
) |
|
$ |
7,045 |
|
|
$ |
9,130 |
|
|
$ |
153 |
|
|
$ |
9,283 |
|
|
Fixed income mutual funds |
|
|
1,255 |
|
|
|
32 |
|
|
|
1,287 |
|
|
|
1,324 |
|
|
|
(11 |
) |
|
|
1,313 |
|
|
Money market funds |
|
|
88 |
|
|
|
- |
|
|
|
88 |
|
|
|
7,650 |
|
|
|
- |
|
|
|
7,650 |
|
|
Total cash equivalents and marketable securities |
|
$ |
8,395 |
|
|
$ |
25 |
|
|
|
8,420 |
|
|
$ |
18,104 |
|
|
$ |
142 |
|
|
|
18,246 |
|
|
|
|
|
|
|
|
|
|
|
|
|
|
|
|
|
|
|
|
|
|
|
|
|
|
|
|
Cash on hand held in the United States |
|
|
|
|
|
|
|
|
|
|
4,141 |
|
|
|
|
|
|
|
|
|
|
|
12,042 |
|
|
Cash on hand held overseas |
|
|
|
|
|
|
|
|
|
|
59,561 |
|
|
|
|
|
|
|
|
|
|
|
63,810 |
|
|
Total cash on hand |
|
|
|
|
|
|
|
|
|
|
63,702 |
|
|
|
|
|
|
|
|
|
|
|
75,852 |
|
|
Total cash, cash equivalents and marketable securities |
|
|
|
|
|
|
$ |
72,122 |
|
|
|
|
|
|
|
|
|
|
$ |
94,098 |
| |||
|
|
|
|
|
|
|
|
|
|
|
|
|
|
|
|
|
|
|
|
|
|
|
|
|
|
|
Reported as: |
|
|
|
|
|
|
|
|
|
|
|
|
|
|
|
|
|
|
|
|
|
|
|
|
|
Cash and cash equivalents |
|
|
|
|
|
|
|
|
|
$ |
63,790 |
|
|
|
|
|
|
|
|
|
|
$ |
83,502 |
|
|
Short-term marketable securities |
|
|
|
|
|
|
|
|
|
|
4,805 |
|
|
|
|
|
|
|
|
|
|
|
6,347 |
|
|
Long-term marketable securities |
|
|
|
|
|
|
|
|
|
|
3,527 |
|
|
|
|
|
|
|
|
|
|
|
4,249 |
|
|
|
|
|
|
|
|
|
|
|
|
$ |
72,122 |
|
|
|
|
|
|
|
|
|
|
$ |
94,098 |
|
The amortized cost and estimated fair value of cash equivalents and marketable securities, by contractual maturity, are as follows (in thousands):
|
January 30, 2016 |
January 31, 2015 |
|||||||||||||||
|
Book Value |
Fair Value |
Book Value |
Fair Value |
|||||||||||||
|
Due in one year or less |
$ | 4,863 | $ | 4,893 | $ | 13,995 | $ | 13,997 | ||||||||
|
Due in greater than one year |
3,532 | 3,527 | 4,109 | 4,249 | ||||||||||||
|
Total |
$ | 8,395 | $ | 8,420 | $ | 18,104 | $ | 18,246 | ||||||||
SIGMA DESIGNS, INC.
NOTES TO CONSOLIDATED FINANCIAL STATEMENTS (Continued)
|
3. |
Fair values of assets and liabilities |
Fair value is defined as, “the price that would be received to sell an asset or paid to transfer a liability in an orderly transaction between market participants at the measurement date (exit price).” The accounting standards establish a consistent framework for measuring fair value and disclosure requirements about fair value measurements and among other things, require us to maximize the use of observable inputs and minimize the use of unobservable inputs when measuring fair value.
Fair value hierarchy
The accounting standards discuss valuation techniques, such as the market approach (comparable market prices), the income approach (present value of future income or cash flow), and the cost approach (cost to replace the service capacity of an asset or replacement cost). The standards utilize a fair value hierarchy that prioritizes the inputs to valuation techniques used to measure fair value into three broad levels. The following is a brief description of those three levels:
|
|
● |
Level 1 - Valuation is based upon quoted prices for identical instruments traded in active markets. |
|
|
● |
Level 2 - Valuation is based upon quoted prices for similar instruments in active markets, quoted prices for identical or similar instruments in markets that are not active, and model-based valuation techniques for which all significant assumptions are observable in the market. |
|
|
● |
Level 3 - Valuation is generated from model-based techniques that use significant assumptions not observable in the market. These unobservable assumptions reflect our estimate of assumptions that market participants would use in pricing the asset or liability. Valuation techniques include the use of option pricing models, discounted cash flow models, and similar techniques. |
Determination of fair value
Our cash equivalents and marketable securities are classified within Level 1 of the fair value hierarchy because they are valued using quoted market prices, broker or dealer quotations or alternative pricing sources with reasonable levels of price transparency. The types of marketable securities valued based on quoted market prices in active markets include most U.S. government and agency securities, sovereign government obligations, money market securities and certain corporate obligations with high credit ratings and an ongoing trading market.
The tables below present the balances of our assets and liabilities measured at fair value on a recurring basis (in thousands):
|
January 30, 2016 |
||||||||||||||||
|
Fair Value |
Quoted Prices in Active Markets for Identical Assets (Level 1) |
Significant Observable Inputs (Level 2) |
Significant Unobservable Inputs (Level 3) |
|||||||||||||
|
Corporate bonds |
$ | 7,045 | $ | 7,045 | $ | - | $ | - | ||||||||
|
Fixed income mutual funds |
1,287 | 1,287 | - | - | ||||||||||||
|
Money market funds |
88 | 88 | - | - | ||||||||||||
|
Total cash equivalents and marketable securities |
8,420 | 8,420 | - | - | ||||||||||||
|
Restricted cash |
900 | 900 | - | - | ||||||||||||
|
Total assets measured at fair value |
$ | 9,320 | $ | 9,320 | $ | - | $ | - | ||||||||
SIGMA DESIGNS, INC.
NOTES TO CONSOLIDATED FINANCIAL STATEMENTS (Continued)
|
January 31, 2015 |
||||||||||||||||
|
Fair Value |
Quoted Prices in Active Markets for Identical Assets (Level 1) |
Significant Observable Inputs (Level 2) |
Significant Unobservable Inputs (Level 3) |
|||||||||||||
|
Corporate bonds |
$ | 9,283 | $ | 9,283 | $ | - | $ | - | ||||||||
|
Money market funds |
7,650 | 7,650 | - | - | ||||||||||||
|
Fixed income mutual funds |
1,313 | 1,313 | - | - | ||||||||||||
|
Total cash equivalents and marketable securities |
18,246 | 18,246 | - | - | ||||||||||||
|
Restricted cash |
400 | 400 | - | - | ||||||||||||
|
Total assets measured at fair value |
$ | 18,646 | $ | 18,646 | $ | - | $ | - | ||||||||
Assets measured and recorded at fair value on a non-recurring basis
Our non-marketable preferred stock investments in privately-held venture capital funded technology companies are recorded at cost and are adjusted to fair value only in the event that they become other-than-temporarily impaired. As of January 30, 2016, we held equity investments in three privately-held venture capital funded technology companies and an equity investment in one joint venture, with an aggregate carrying value of $2.9 million. During fiscal 2016, 2015 and 2014, we recorded impairment charges of $0.4 million, $0.6 million and $0.6 million, respectively, in connection with our privately-held investments as we concluded the impairment to be other-than-temporary. We did not identify any other events or changes in circumstances that may have had a significant adverse effect on the fair value of these investments as of January 30, 2016. Each of these equity investments in privately-held companies constituted less than a 20% ownership position. Furthermore, we do not believe that we have the ability to exert significant influence over any of these companies.
|
4. |
Derivative financial instruments |
Foreign exchange contracts are recognized either as assets or as liabilities on the balance sheet at fair value at the end of each reporting period.
We have used foreign currency derivatives such as forward and option contracts as hedges against certain anticipated transactions denominated in Israeli shekels, or NIS. We do not assess derivative contracts for hedge effectiveness and thus such contracts do not qualify for hedge accounting. Therefore, we recognize all gains and losses from changes in the fair value of these derivate contracts immediately into earnings. Changes in fair value of the derivatives are recorded as interest and other income (expense), net.
As of January 30, 2016 and January 31, 2015, we had no foreign exchange contracts. In fiscal 2016, 2015 and 2014, we recognized zero, a loss of less than $0.1 million and a loss of $0.4 million, respectively, in interest and other income, net as a result of foreign exchange contracts.
SIGMA DESIGNS, INC.
NOTES TO CONSOLIDATED FINANCIAL STATEMENTS (Continued)
|
5. |
Investments in privately-held companies |
The following table sets forth the value of investments in and notes receivable from privately-held companies (in thousands):
|
January 30, 2016 |
January 31, 2015 |
|||||||
|
Investments |
||||||||
|
Issuer A |
$ | 2,000 | $ | 2,000 | ||||
|
Issuer B |
750 | 1,000 | ||||||
|
Issuer C |
- | 129 | ||||||
|
Issuer D |
134 | 138 | ||||||
|
Total investments |
$ | 2,884 | $ | 3,267 | ||||
During fiscal 2009, we purchased shares of preferred stock in a privately-held venture capital funded technology company (“Issuer A”) at a total investment cost of $1.0 million. In the fourth quarter of fiscal 2010, we purchased additional shares of preferred stock in Issuer A at a cost of $1.0 million. In November 2010, we loaned $1.0 million to Issuer A and received a secured promissory note. During the second quarter of fiscal 2015, the note receivable from Issuer A was fully repaid.
In the third quarter of fiscal 2011, we purchased shares of preferred stock in a privately-held technology company (“Issuer B”) at a total investment cost of $1.0 million. In the fourth quarter of fiscal 2016, we recorded impairment charges of $0.3 million on this investment as we concluded the impairment to be other-than-temporary.
In the fourth quarter of fiscal 2011, we purchased shares of preferred stock in a privately-held technology company (“Issuer C”) at a total investment cost of $1.0 million. In the fourth quarter of fiscal 2014, the second quarter of fiscal 2015 and the second quarter of fiscal 2016, we recorded impairment charges of $0.3 million, $0.6 million and $0.1 million, respectively, on this investment as we concluded the impairment to be other-than-temporary, effectively nullifying any value from this investment as of January 30, 2016.
In the third quarter of fiscal 2012, we made an investment of $0.1 million in a privately-held joint venture (“Issuer D”).
We made the above-described investments because we viewed the issuer as either having strategic technology or a business that would complement our technological capabilities or help create an opportunity for us to sell our chipset solutions. We analyze each investment quarterly for evidence of impairment.
Our President and Chief Executive Officer is a member of the Board of Directors of both Issuer A and Issuer B. In the case of Issuer B, the investment transaction was negotiated without the personal involvement of the executive officer who had a personal interest in the transaction.
SIGMA DESIGNS, INC.
NOTES TO CONSOLIDATED FINANCIAL STATEMENTS (Continued)
|
|
|
6. |
Supplemental financial information |
Inventory consists of the following (in thousands):
|
January 30, 2016 |
January 31, 2015 |
|||||||
|
Wafers and other purchased materials |
$ | 15,440 | $ | 8,420 | ||||
|
Work-in-process |
2,885 | 3,045 | ||||||
|
Finished goods |
8,384 | 8,980 | ||||||
|
Total inventory |
$ | 26,709 | $ | 20,445 | ||||
Prepaid expenses and other current assets consist of the following (in thousands):
|
January 30, 2016 |
January 31, 2015 |
|||||||
|
Prepayments for inventory |
$ | 3,725 | $ | 1,670 | ||||
|
Prepayments for taxes |
3,357 | 147 | ||||||
|
Deposits |
3,200 | 3,124 | ||||||
|
Prepayments for royalties |
741 | 659 | ||||||
|
Other current assets |
3,062 | 3,205 | ||||||
|
Total prepaid expenses and other current assets |
$ | 14,085 | $ | 8,805 | ||||
Software, equipment and leasehold improvements consist of the following (in thousands):
|
|
Estimated Useful Lives (years) |
|
January 30, 2016 |
|
|
January 31, 2015 |
| |||||
|
|
|
|
|
|
|
|
|
|
|
|
| |
|
Software |
|
2 |
|
|
$ |
40,411 |
|
|
$ |
41,069 |
| |
|
Equipment |
1 |
- |
5 |
|
|
22,218 |
|
|
|
22,168 |
| |
|
Office equipment and furniture |
|
2 |
|
|
|
7,705 |
|
|
|
8,693 |
| |
|
Leasehold improvements |
1 |
- |
6 |
|
|
2,089 |
|
|
|
2,874 |
| |
|
Total |
|
|
|
|
|
72,423 |
|
|
|
74,804 |
| |
|
Less: Accumulated depreciation and amortization |
|
|
|
|
|
(58,337 |
) |
|
|
(53,210 |
) | |
|
Total software, equipment and leasehold improvements, net |
|
|
|
|
$ |
14,086 |
|
|
$ |
21,594 |
| |
Software, equipment and leasehold improvement depreciation and amortization expense for fiscal 2016, 2015 and 2014 was $12.6 million, $12.4 million and $9.6 million, respectively.
We recorded impairment charges of $1.4 million, $2.1 million and $0.6 million during fiscal years 2016, 2015, and 2014, respectively, related to mask sets and design tools associated with discontinued products which were recorded in operating expenses in the accompanying consolidated statement of operations.
SIGMA DESIGNS, INC.
NOTES TO CONSOLIDATED FINANCIAL STATEMENTS (Continued)
Accrued liabilities consist of the following (in thousands):
|
January 30, 2016 |
January 31, 2015 |
|||||||
|
License fees |
$ | 5,181 | $ | 4,286 | ||||
|
Rebates |
2,864 | 9,599 | ||||||
|
Income taxes payable, current portion |
2,305 | 5,326 | ||||||
|
Royalties |
1,469 | 880 | ||||||
|
Warranties |
959 | 864 | ||||||
|
Deferred revenue |
407 | 372 | ||||||
|
Other accrued liabilities |
1,447 | 1,567 | ||||||
|
Total accrued liabilities |
$ | 14,632 | $ | 22,894 | ||||
The following table summarizes activity related to accrued rebates (in thousands):
|
Fiscal Years Ended |
||||||||||||
|
January 30, 2016 |
January 31, 2015 |
February 1, 2014 |
||||||||||
|
Beginning balance |
$ | 9,599 | $ | 3,587 | $ | 1,475 | ||||||
|
Charged as a reduction of revenue |
11,724 | 17,845 | 9,133 | |||||||||
|
Reversal of unclaimed rebates |
(1,028 |
) |
- | (80 |
) | |||||||
|
Payments |
(17,431 |
) |
(11,833 |
) |
(6,941 |
) | ||||||
|
Ending balance |
$ | 2,864 | $ | 9,599 | $ | 3,587 | ||||||
Other long-term liabilities consist of the following (in thousands):
|
January 30, 2016 |
January 31, 2015 |
|||||||
|
License fees |
$ | 3,000 | $ | 1,809 | ||||
|
Deferred rent obligations |
964 | 79 | ||||||
|
Design tool |
- | 890 | ||||||
|
Other long-term liabilities |
59 | 44 | ||||||
|
Total other long-term liabilities |
$ | 4,023 | $ | 2,822 | ||||
|
|
|
7. |
Business combinations |
On November 4, 2015, we completed the acquisition of Bretelon, Inc. (“Bretelon”), which is engaged in developing an advanced form of mobile IoT technology (“Acquisition”). In accordance with the related Agreement and Plan of Merger (the “Merger Agreement”), all of the outstanding equity interests of Bretelon were exchanged for aggregate consideration of approximately $19.4 million in cash subject to certain adjustments (the “Merger Consideration”), which was funded with a combination of cash on hand and the assumption and subsequent payment of certain liabilities. We retained a portion of the consideration following the closing for the satisfaction of indemnification claims made within a specified period of time. The Acquisition was consummated on November 12, 2015.
We believe that our acquisition of Bretelon assists us in expanding our overall IoT offering. This Acquisition should expand our total addressable market to include outdoor applications, which we believe will complement to our Z-Wave product line which currently covers indoor applications. Additionally, we intend to take advantage of the synergy between these two product lines to service smart city and commercial opportunities that make outdoor use of the Z-Wave mesh network and mobile IoT connectivity.
SIGMA DESIGNS, INC.
NOTES TO CONSOLIDATED FINANCIAL STATEMENTS (Continued)
Certain members of our board of directors held an interest in Bretelon prior to the consummation of the Acquisition. For further discussion, refer to Note 16, “Related parties” to the accompanying consolidated financial statements.
Prior to the consummation of the Acquisition, we loaned approximately $2.7 million of cash to Bretelon in exchange for a number of interest-bearing promissory notes (the “Notes”). These Notes with principal amounts of $1.5 million, $1.0 million and $0.2 million were issued on August 28, 2015, September 14, 2015, and October 5, 2015, respectively; all of which bore interest at three percent per annum. Upon consummation of the Acquisition, the Notes along with accrued interest were deducted from the aggregate consideration.
The operations of Bretelon are included in our consolidated financial statements from the date of Acquisition, which during fiscal 2016, contributed approximately $1.8 million of incremental research and development costs in the accompanying consolidated statement of operations. As of January 30, 2016, we had recorded cumulative transaction costs of approximately $0.3 million related to the Acquisition in general and administrative expense in the accompanying consolidated statements of operations.
We recognized the Bretelon assets acquired and liabilities assumed based upon the fair value of such assets and liabilities measured as of the date of the Acquisition. The aggregate purchase price for Bretelon has been allocated to the tangible and identifiable intangible assets acquired and liabilities assumed based on their estimated fair values at the date of Acquisition. The excess of the purchase price over the fair value of the acquired net assets represents cost and revenue synergies specific to the Company, as well as non-capitalizable intangible assets, such as the employee workforce acquired, and is allocated to goodwill, none of which is expected to be tax deductible.
The following allocation of purchase price in the transaction is preliminary and subject to change upon finalizing our allocation analysis (in thousands, except years):
|
|
|
Amount |
|
|
|||||
|
Cash consideration |
|
$ |
15,730 |
|
|
||||
|
Liabilities assumed |
|
|
3,691 |
|
|
||||
|
Total consideration |
|
$ |
19,421 |
|
|
||||
|
|
|
|
|
|
|
||||
|
Purchased tangible assets and liabilities: |
|||||||||
|
Cash |
|
$ |
150 |
|
|
||||
|
Prepaid third party support |
|
158 |
|
|
|||||
|
Other assets |
|
17 |
|
|
|||||
|
Accounts payable |
|
(4,176 |
) |
|
|||||
|
Deferred tax liability, net |
|
(290 |
) |
||||||
|
Accrued liabilities |
|
(106 |
) |
|
|||||
|
Net tangible liabilities assumed |
|
$ |
(4,247 |
) |
|||||
|
|
Estimated Useful Life (years) |
||||||||
|
Purchased identifiable intangible assets: |
|
|
|
|
|
||||
|
Developed hardware technology |
|
|
7,000 |
|
7 |
- | 10 | ||
|
Developed software technology |
|
|
1,800 |
|
3 |
- | 5 | ||
|
Customer relationships |
|
|
3,800 |
|
5 |
- | 7 | ||
|
Goodwill |
|
|
11,068 |
|
— | ||||
|
Total consideration issued in the acquisition |
|
$ |
19,421 |
|
|
||||
SIGMA DESIGNS, INC.
NOTES TO CONSOLIDATED FINANCIAL STATEMENTS (Continued)
The following unaudited pro forma consolidated results of operations give effect to the acquisition of Bretelon as if it had occurred as of the beginning of the fiscal period presented. The unaudited pro forma consolidated results of operations are provided for informational purposes only and do not purport to represent actual consolidated results of operations had the acquisition occurred on the date assumed, nor are these financial statements necessarily indicative of future consolidated results of operations. We expect to incur costs and realize benefits associated with integrating the operations of the Bretelon business. The results of operations of the Bretelon business have been included in the consolidated results of operations from November 4, 2015 inception to date. The unaudited pro forma consolidated results of operations do not reflect the cost of any integration activities or any benefits that may result from operating efficiencies or revenue synergies. The pro forma consolidated results of operations for fiscal 2016 include non-recurring adjustments of $0.3 million of direct acquisition costs (in thousands, except per share data).
|
Fiscal Years Ended |
||||||||
|
January 30, 2016 |
January 31, 2015 |
|||||||
|
Net revenue |
$ | 228,613 | $ | 192,063 | ||||
|
Net loss |
$ | (5,089 |
) |
$ | (22,131 |
) | ||
|
Basic and diluted net loss per share |
$ | (0.14 |
) |
$ | (0.64 |
) | ||
|
|
|
8. |
Intangible assets |
The table below presents the balances of our intangible assets (in thousands):
|
January 30, 2016 |
January 31, 2015 |
|||||||
|
Acquired intangible assets |
$ | 88,910 | $ | 76,310 | ||||
|
Purchased IP |
38,956 | 30,032 | ||||||
|
Total |
127,866 | 106,342 | ||||||
|
Accumulated amortization |
(90,816 |
) |
(81,700 |
) | ||||
|
Intangible assets, net |
$ | 37,050 | $ | 24,642 | ||||
Acquired intangible assets represent intangible assets acquired through business combinations. Purchased intellectual property (“Purchased IP”) represents intangible assets acquired through direct purchases of licensed technology from vendors, which is incorporated into our products.
Purchased IP not yet deployed relates to Purchased IP from third parties for our products that are currently in development. We begin amortizing such intellectual property upon the earlier of the beginning of the term of the license agreement, as appropriate, or at the time we begin shipment of the associated products into which such intellectual property is incorporated.
Impairment of intangible assets
We test long-lived assets, including purchased intangible assets, for impairment whenever events or changes in circumstances, such as a change in technology, indicate that the carrying value of these assets may not be recoverable.
During fiscal 2016, we continued to streamline our operations to further align our operating expenses with our business, industry and revenue outlook. In connection with our continued efforts, we performed impairment reviews of our intangible assets by comparing undiscounted expected future cash flows with the carrying values of the underlying assets. The review during fiscal 2016 indicated that certain purchased IP licenses incorporated into discontinued products primarily related to the Media Connectivity market were impaired; as a result, we recorded impairment charges for purchased IP of $0.4 million which was recorded in operating expenses in the accompanying consolidated statement of operations.
The review during fiscal 2015 and 2014 indicated certain purchased IP licenses incorporated into discontinued products primarily related to the Set-top Box market were impaired; as a result, we recorded impairment charges for purchased IP of $0.7 million and $0.3 million, respectively, which was recorded in operating expenses in the accompanying consolidated statement of operations.
SIGMA DESIGNS, INC.
NOTES TO CONSOLIDATED FINANCIAL STATEMENTS (Continued)
Intangible assets, subject to amortization, were as follows (in thousands, except for years):
|
|
|
January 30, 2016 |
| |||||||||||||||||
|
|
|
Gross Value |
|
|
Impairment |
|
|
Accumulated Amortization and Effect of Currency Translation |
|
|
Net Value |
|
|
Weighted Average Remaining Amortization Period (Years) |
| |||||
|
Acquired intangible assets: |
|
|
|
|
|
|
|
|
|
|
|
|
|
|
|
|
|
|
|
|
|
Developed technology |
|
$ |
85,427 |
|
|
$ |
(24,614 |
) |
|
$ |
(48,824 |
) |
|
$ |
11,989 |
|
|
|
6.5 |
|
|
Customer relationships |
|
|
54,505 |
|
|
|
(30,486 |
) |
|
|
(19,557 |
) |
|
|
4,462 |
|
|
|
5.7 |
|
|
Trademarks and other |
|
|
4,078 |
|
|
|
- |
|
|
|
(3,739 |
) |
|
|
339 |
|
|
|
2.9 |
|
|
Purchased IP - amortizing |
|
|
32,838 |
|
|
|
(5,516 |
) |
|
|
(18,696 |
) |
|
|
8,626 |
|
|
|
2.9 |
|
|
Total amortizing |
|
|
176,848 |
|
|
|
(60,616 |
) |
|
|
(90,816 |
) |
|
|
25,416 |
|
|
|
5.1 |
|
|
Purchased IP - not yet deployed |
|
|
15,774 |
|
|
|
(4,140 |
) |
|
|
- |
|
|
|
11,634 |
|
|
|
|
|
|
Total intangibles |
|
$ |
192,622 |
|
|
$ |
(64,756 |
) |
|
$ |
(90,816 |
) |
|
$ |
37,050 |
|
|
|
|
|
|
|
|
January 31, 2015 |
| |||||||||||||||||
|
|
|
Gross Value |
|
|
Impairment |
|
|
Accumulated Amortization and Effect of Currency Translation |
|
|
Net Value |
|
|
Weighted Average Remaining Amortization Period (Years) |
| |||||
|
Acquired intangible assets: |
|
|
|
|
|
|
|
|
|
|
|
|
|
|
|
|
|
|
|
|
|
Developed technology |
|
$ |
76,628 |
|
|
$ |
(24,614 |
) |
|
$ |
(44,604 |
) |
|
$ |
7,410 |
|
|
|
2.0 |
|
|
Customer relationships |
|
|
50,704 |
|
|
|
(30,486 |
) |
|
|
(18,313 |
) |
|
|
1,905 |
|
|
|
1.7 |
|
|
Trademarks and other |
|
|
4,078 |
|
|
|
- |
|
|
|
(3,621 |
) |
|
|
457 |
|
|
|
3.9 |
|
|
Purchased IP - amortizing |
|
|
23,398 |
|
|
|
(5,516 |
) |
|
|
(15,162 |
) |
|
|
2,720 |
|
|
|
1.0 |
|
|
Total amortizing |
|
|
154,808 |
|
|
|
(60,616 |
) |
|
|
(81,700 |
) |
|
|
12,492 |
|
|
|
1.8 |
|
|
Purchased IP - not yet deployed |
|
|
15,877 |
|
|
|
(3,727 |
) |
|
|
- |
|
|
|
12,150 |
|
|
|
|
|
|
Total intangibles |
|
$ |
170,685 |
|
|
$ |
(64,343 |
) |
|
$ |
(81,700 |
) |
|
$ |
24,642 |
|
|
|
|
|
The following table presents the amortization of intangible assets in the accompanying consolidated statements of operations (in thousands):
|
Fiscal Years Ended |
||||||||||||
|
January 30, 2016 |
January 31, 2015 |
February 1, 2014 |
||||||||||
|
Cost of revenue |
$ | 7,586 | $ | 7,922 | $ | 9,105 | ||||||
|
Operating expenses |
1,722 | 1,418 | 1,542 | |||||||||
|
Total intangible amortization expense |
$ | 9,308 | $ | 9,340 | $ | 10,647 | ||||||
SIGMA DESIGNS, INC.
NOTES TO CONSOLIDATED FINANCIAL STATEMENTS (Continued)
As of January 30, 2016, we expect the amortization expense in future periods to be as follows (in thousands):
|
Fiscal years |
Purchased IP-Amortizing |
Developed Technology |
Customer Relationships |
Trademarks and other |
Total |
|||||||||||||||
|
2017 |
$ | 3,617 | $ | 4,017 | $ | 1,340 | $ | 118 | $ | 9,092 | ||||||||||
|
2018 |
2,513 | 1,555 | 543 | 118 | 4,729 | |||||||||||||||
|
2019 |
1,610 | 1,060 | 543 | 103 | 3,316 | |||||||||||||||
|
2020 |
823 | 1,060 | 543 | 0 | 2,426 | |||||||||||||||
|
2021 |
63 | 970 | 543 | 0 | 1,576 | |||||||||||||||
|
Thereafter |
0 | 3,327 | 950 | 0 | 4,277 | |||||||||||||||
|
Total |
$ | 8,626 | $ | 11,989 | $ | 4,462 | $ | 339 | $ | 25,416 | ||||||||||
|
9. |
Restructuring costs |
In fiscal 2013, as a result of significant expansion in our infrastructure and operational activities in connection with purchases and acquisitions that took place between fiscal years 2008 and 2013, and in response to certain redundancies, underperforming operations and delays in programs and product releases, we implemented a restructuring program to realign our global operating expenses with our new business conditions, and to improve efficiency, competitiveness and profitability. In fiscal 2013, we reduced our workforce by approximately 114 employees, implemented plans to scale down our reliance on contractors and consultants, impaired the unamortized value of certain software intellectual property licenses, which we no longer intend to use, initiated the closure of our facilities in Canada, Hong Kong and Japan and reduced our discretionary spending across all operational areas. Costs relating to facilities closure or lease commitment are recognized when the facility has been exited. Termination costs are recognized when the costs are deemed both probable and estimable and notification to impacted employees has occurred.
In fiscal 2014, as part of our continuing efforts to reduce expenses, we incurred restructuring charges of approximately $2.3 million, of which $1.7 million was related to workforce reductions of 67 employees across several geographic regions and $0.6 million was related to early termination of lease agreements for locations in Canada and southern California. Of the total restructuring charges recorded in fiscal 2014, less than $0.1 million was reflected in cost of revenue and $2.3 million was reflected in operating expenses.
In fiscal 2015, continuing our efforts to reduce expenses, we incurred restructuring charges of approximately $1.1 million, all of which was related to workforce reductions of 29 employees across several geographic regions, the majority of which were in our operations in Israel. Of the total restructuring charges recorded in fiscal 2015, approximately $0.1 million was reflected in cost of revenue and $1.0 million was reflected in operating expenses.
In fiscal 2016, we incurred restructuring charges of less than $0.1 million, substantially all of which was related to facility exit cost adjustments, which was reflected in operating expenses. The restructuring expenses incurred during fiscal 2016 were a continuation of activities that were initiated in the prior fiscal years. However, no new restructuring activities were undertaken in association with the aforementioned restructuring program initiated in fiscal 2013.
Expenses recognized for restructuring activities impacting our operating expenses are included in “Restructuring costs” in the consolidated statements of operations. Our restructuring measures could negatively impact our revenue and results of operations in the future as a result of less employees developing future products and working to sell our products.
SIGMA DESIGNS, INC.
NOTES TO CONSOLIDATED FINANCIAL STATEMENTS (Continued)
A combined summary of the recent activity of the restructuring plans initiated by us is as follows (in thousands):
|
Workforce Reduction |
Asset Impairment |
Facility Exit Costs |
Total |
Cumulative Restructuring Costs |
||||||||||||||||
|
Liability, February 2, 2013 |
$ | 1,014 | $ | - | $ | 8 | $ | 1,022 | $ | 3,264 | ||||||||||
|
Charges in fiscal 2014 |
1,696 | - | 610 | 2,306 | 2,306 | |||||||||||||||
|
Cash payments |
(2,347 |
) |
- | (616 |
) |
(2,963 |
) |
|||||||||||||
|
Liability, February 1, 2014 |
363 | - | 2 | 365 | 5,570 | |||||||||||||||
|
Charges in fiscal 2015 |
1,083 | - | (20 |
) |
1,063 | 1,063 | ||||||||||||||
|
Cash payments |
(1,382 |
) |
- | 8 | (1,374 |
) |
- | |||||||||||||
|
Non-cash items |
38 | - | 10 | 48 | - | |||||||||||||||
|
Liability, January 31, 2015 |
102 | - | - | 102 | 6,633 | |||||||||||||||
|
Charges in fiscal 2016 |
3 | - | 6 | 9 | 9 | |||||||||||||||
|
Cash payments |
(3 |
) |
- | (7 |
) |
(10 |
) |
- | ||||||||||||
|
Non-cash items |
- | 1 | 1 | - | ||||||||||||||||
|
Liability, January 30, 2016 |
$ | 102 | $ | - | $ | - | $ | 102 | $ | 6,642 | ||||||||||
|
|
|
10. |
Sale of development project |
On March 8, 2013, we entered into an Asset Purchase Agreement with a third party (the “Buyer”) to sell certain development projects (intellectual property) and long-lived assets (the “Connectivity Assets”) related to the connectivity technology over coaxial cable market, including the transfer of 21 employees (the “Connectivity Employees”) to the Buyer. The aggregate carrying amount of the Connectivity Assets ultimately transferred was approximately $0.6 million and were classified as assets held for sale in prepaid expenses and other current assets in the consolidated balance sheet at February 2, 2013. We received an initial payment of $2.0 million in cash at the closing of the transaction and a payroll expense reimbursement payment of $0.6 million (as described more fully below). Under the terms of the Asset Purchase Agreement, if certain technical milestones were met by September 30, 2013 as a result of further development of the transferred technology by the Buyer, we were to be paid an additional $5.0 million in cash.
In April 2013, upon receiving the closing consideration of $2.0 million, we recorded a gain of $1.1 million, net of the carrying value of the Connectivity Assets and fees for legal and bank services of approximately $0.4 million. The gain is included in “Gain on sale of development project” in the consolidated statements of operations for fiscal 2014. Additionally, in April 2013, in connection with the Asset Purchase Agreement, the Buyer reimbursed us for payroll expenses related to the employees transferred to the Buyer for the period from February 1, 2013 through the actual payroll transfer, totaling $0.6 million. As the contingent consideration was uncertain at the time of the initial sale, we did not recognize the contingent payment.
The Buyer advised us that it did not believe the milestones had been met by the deadline of September 30, 2013. On May 19, 2014, the parties amended the Asset Purchase Agreement to require the use of Judicial Arbitration and Mediations Services (“JAMS”) for arbitration to settle the dispute between the parties. We pursued our rights to the milestone consideration payment through the alternative dispute resolution provisions set forth in the amendment. On September 5, 2014, the Buyer filed counterclaims in response to our claims arising from the Asset Purchase Agreement. Arbitration regarding this dispute took place on June 1, 2015. In August 2015, we prevailed on all of the claims we asserted against the Buyer, and all of the Buyer’s counterclaims against us were denied. We were awarded $5.0 million plus reimbursement of reasonable legal and other associated costs and interest. We have recovered $2.6 million in legal costs, interest and other associated expenses to date from the Buyer, for a total recovery of $7.6 million, which was recorded as other income in our consolidated statements of operations in its entirety.
SIGMA DESIGNS, INC.
NOTES TO CONSOLIDATED FINANCIAL STATEMENTS (Continued)
|
11. |
Commitments and contingencies |
Commitments
Operating Leases
Our primary facility in Fremont, California is leased under a non-cancelable lease. The lease carries a term of 81 calendar months commencing on January 1, 2015 for which payments began in October 2015.
We also lease facilities in San Diego, Shanghai, Shenzhen, Hong Kong, Taiwan, Vietnam, South Korea, Japan, Singapore, Israel, Germany, France, Denmark and The Netherlands and have vehicles under non-cancelable leases.
Future minimum annual payments under operating leases are as follows (in thousands):
|
Fiscal Years |
Operating Leases |
|||
|
2017 |
$ | 3,943 | ||
|
2018 |
1,927 | |||
|
2019 |
1,039 | |||
|
2020 |
666 | |||
|
2021 |
682 | |||
|
Thereafter |
467 | |||
|
Total minimum lease payments |
$ | 8,724 | ||
Rent expense, recorded on a straight-line basis, was $4.0 million, $4.4 million and $4.8 million for fiscal 2016, 2015 and 2014, respectively.
Purchase commitments
We place non-cancelable orders to purchase semiconductor products from our suppliers on an eight to twelve week lead-time basis. As of January 30, 2016, the total amount of outstanding non-cancelable purchase orders was approximately $18.3 million.
Third-party licensed technology
In October 2015, we entered into an agreement with a vendor to purchase $6.1 million of licensed technology for integration into future iterations of our products. Payments under this agreement are being made on an annual basis from December 2015 through December 2018. As of January 30, 2016, remaining payments under this agreement totaled $4.5 million. In addition to this agreement, we have entered into other purchase arrangements for certain licensed technology; remaining payments under these agreements totaled $5.7 million as of January 30, 2016. Payments under these arrangements are being made through fiscal 2018. We have fully accrued these amounts as of January 30, 2016.
SIGMA DESIGNS, INC.
NOTES TO CONSOLIDATED FINANCIAL STATEMENTS (Continued)
Design tools
We entered into an agreement with a vendor to purchase $12.9 million of design tools. Payments under this agreement are being made on a quarterly basis from June 2013 through March 2016. As of January 30, 2016, remaining payments under this agreement totaled $1.4 million. In addition to this agreement, we have entered into other purchase arrangements for certain design tools; remaining payments under these agreements totaled $2.0 million as of January 30, 2016. Payments under these arrangements are being made through fiscal 2017. We have fully accrued these amounts as of January 30, 2016.
Royalties
We pay royalties for the right to sell certain products under various license agreements. During fiscal 2016, 2015 and 2014, we recorded gross royalty expense of $4.2 million, $2.5 million and $1.9 million, respectively, in cost of revenue in the consolidated statements of operations.
Our wholly-owned subsidiary, Sigma Designs Israel SDI Ltd. (formerly Coppergate Communications, Ltd.), participated in programs sponsored by the Office of the Chief Scientist of Israel's Ministry of Industry, Trade and Labor, or the OCS, for the support of research and development activities that we conducted in Israel. Through January 30, 2016, we had obtained grants from the OCS aggregating to $5.2 million of our research and development projects in Israel. We completed the most recent of these projects in 2013. We are obligated to pay royalties to the OCS, amounting up to 4.5% of the sales of certain products up to an amount equal to the grants received, plus LIBOR-based interest. As of January 30, 2016, our remaining potential obligation under these programs was approximately $1.1 million.
Contingencies
Product Warranty
In general, we sell products with up to a one-year limited warranty that our products will be free from defects in materials and workmanship. Warranty cost is estimated at the time revenue is recognized based on historical activity, and additionally, for any specific known product warranty issues. Accrued warranty cost includes hardware repair and/or replacement and is included in accrued liabilities in the accompanying consolidated balance sheets.
Details of the change in accrued warranty for fiscal 2016, 2015 and 2014 are as follows (in thousands):
|
Fiscal Years |
Balance Beginning of Period |
Additions |
Deductions |
Balance End of Period |
||||||||||||
|
2014 |
$ | 1,447 | $ | 39 | $ | (866 |
) |
$ | 620 | |||||||
|
2015 |
$ | 620 | $ | 763 | $ | (519 |
) |
$ | 864 | |||||||
|
2016 |
$ | 864 | $ | 828 | $ | (733 |
) |
$ | 959 | |||||||
Litigation
From time to time, we are involved in claims and legal proceedings that arise in the ordinary course of business. We expect that the number and significance of these matters will increase as our business expands. In particular, we could face an increasing number of patent and other intellectual property claims as the number of products and competitors in our industry grows. Any claims or proceedings against us, whether meritorious or not, could be time consuming, result in costly litigation, require significant amounts of management time, result in the diversion of significant operational resources or cause us to enter into royalty or licensing agreements which, if required, may not be available on terms favorable to us. If an unfavorable outcome were to occur against us, there exists the possibility of a material adverse impact on our financial position and results of operations for the period in which the unfavorable outcome occurs and, potentially, in future periods. As of January 30, 2016, we were not aware of any claims against us, asserted or otherwise.
Indemnifications
In certain limited circumstances, we have agreed and may agree in the future to indemnify certain customers against patent infringement claims from third parties related to our intellectual property. In these limited circumstances, the terms and conditions of sale generally limit the scope of the available remedies to a variety of industry-standard methods including, but not limited to, a right to control the defense or settlement of any claim, procure the right for continued usage, and a right to replace or modify the infringing products to make them non-infringing. To date, we have not incurred or accrued any significant costs related to any claims under such indemnification provisions.
Our articles of incorporation and bylaws require that we indemnify our officers and directors against expenses, judgments, fines, settlements and other amounts actually and reasonably incurred in connection with any proceedings arising out of their services to us. In addition, we have entered into separate indemnification agreements with each of our directors and executive officers, which provide for indemnification of these individuals under similar circumstances and under additional circumstances. The indemnification obligations are more fully described in our charter documents and the form of indemnification agreement filed with our SEC reports. We purchase insurance to cover claims or a portion of the claims made against our directors and officers. Since a maximum obligation is not explicitly stated in our charter documents or in our indemnification agreements and will depend on the facts and circumstances that arise out of any future claims, if any, the overall maximum amount of the obligations cannot be reasonably estimated.
SIGMA DESIGNS, INC.
NOTES TO CONSOLIDATED FINANCIAL STATEMENTS (Continued)
Third-party licensed technology
We license technologies from various third parties and incorporate that technology into our products. Some of these licenses require us to pay royalties and others require us to report sales activities so that royalties may be collected from our customers. From time to time, we are audited by licensors of these technologies for compliance with the terms of these licenses. In the first quarter of fiscal 2015, we settled an audit through binding arbitration relating to a license agreement used in our Set-top Box business for $0.2 million, $0.1 million of which was included in our consolidated statement of operations for the fiscal year ended January 31, 2015. During the second quarter of fiscal 2015, we were notified by one of our licensors of their intent to audit for compliance with the terms of the license. As of January 30, 2016, the audit process has been completed for which the licensor concluded no further payments are required.
We could be required to make additional payments as a result of pending or future compliance audits. For license agreements where we have royalty obligations, we charge any settlement payments that we make in connection with audits to cost of revenue. For license agreements where we simply have reporting obligations, we treat any settlement payments as penalties and charge the amounts to operating expenses in sales and marketing. We believe we are substantially in compliance with the terms of our licensing arrangements.
|
|
|
12. |
Earnings per share |
Basic net income (loss) per share is computed by dividing net income (loss) by the weighted-average number of common shares outstanding for the fiscal period. Diluted net loss per share is the same as basic net loss per share as the inclusion of potentially issuable shares is anti-dilutive. Diluted net income per share is computed by adjusting outstanding shares, assuming any dilutive effects of stock incentive awards calculated using the treasury stock method. Under the treasury stock method, an increase in the fair market value of our common stock results in a greater dilutive effect from outstanding stock options, restricted stock units and stock purchase rights. Additionally, the exercise of employee stock options and stock purchase rights and the vesting of restricted stock units results in a further dilutive effect on net income per share.
The following table sets forth the basic and diluted net income (loss) per share computed for fiscal 2016, 2015 and 2014 (in thousands, except per share amounts):
|
Fiscal Years Ended |
||||||||||||
|
January 30, 2016 |
January 31, 2015 |
February 1, 2014 |
||||||||||
|
Numerator: |
||||||||||||
|
Net income (loss), as reported |
$ | 158 | $ | (21,701 |
) |
$ | (11,049 |
) | ||||
|
Denominator: |
||||||||||||
|
Weighted-average common shares outstanding- basic |
35,890 | 34,693 | 34,206 | |||||||||
|
Dilutive effect of employee stock plans |
779 | - | - | |||||||||
|
Weighted-average common shares outstanding- diluted |
36,669 | 34,693 | 34,206 | |||||||||
|
Net income (loss) per share - basic |
$ | 0.00 | $ | (0.63 |
) |
$ | (0.32 |
) | ||||
|
Net income (loss) per share - diluted |
$ | 0.00 | $ | (0.63 |
) |
$ | (0.32 |
) | ||||
The weighted-average number of shares outstanding used in the computation of basic and diluted net income (loss) per share does not include the effect of the following potential outstanding shares of common stock. The effects of these potentially outstanding shares were not included in the calculation of basic and diluted net income (loss) per share because the effect would have been anti-dilutive (in thousands):
|
Fiscal Years Ended |
||||||||||||
|
January 30, 2016 |
January 31, 2015 |
February 1, 2014 |
||||||||||
|
Stock options |
2,367 | 3,908 | 4,345 | |||||||||
|
Restricted stock units and awards |
232 | 166 | 249 | |||||||||
SIGMA DESIGNS, INC.
NOTES TO CONSOLIDATED FINANCIAL STATEMENTS (Continued)
|
|
|
13. |
Equity incentive plans and employee benefits |
Equity incentive plans
We have adopted equity incentive plans that provide for the grant of stock awards to employees, directors and consultants that are designed to encourage and reward their long-term contributions to us and provide an incentive for them to remain with us. These plans are also intended to align our employees’ interest with the creation of long-term shareholder value. On July 10, 2015, the Board of Directors of the Company approved, subject to shareholder approval, the Company’s 2015 Stock Incentive Plan (the “2015 Plan”), which was approved by the Company’s shareholders at the 2015 annual meeting of shareholders held on August 20, 2015. The 2015 Plan is the successor to and continuation of the Company’s 2001 Stock Plan (the “2001 Plan”), and the Amended and Restated 2009 Stock Incentive Plan (the “2009 Plan” and together with the 2001 Plan, the “Prior Plans”).
Our 2015 Plan provides for the grant of stock options, restricted stock, restricted stock units, and other stock-related and performance awards that may be settled in cash, stock or other property. The total number of shares of the Company’s common stock reserved for issuance under the 2015 Plan consists of 3,000,000 shares plus the number of shares subject to stock awards outstanding under the Prior Plans that terminate prior to exercise and would otherwise be returned to the share reserves under the Prior Plans up to a maximum of 5,000,000 shares.
As of January 30, 2016, there were 2,828,852 shares available for future grants under the 2015 Plan. Additionally, up to 3,732,316 shares of common stock subject to stock awards outstanding under the Prior Plans may become available for issuance under the 2015 Plan. As of September 23, 2009 and August 20, 2015, the 2001 Plan and the 2009 Plan were closed for future grants, respectively; however, these plans will continue to govern all outstanding awards that we originally granted from each plan.
The majority of restricted stock units and restricted stock awards that vested during fiscal 2016, 2015 and 2014 were net-share settled such that the Company withheld shares with value equivalent to the employees’ minimum statutory obligation for the applicable income and other employment taxes, and remitted the cash to the appropriate taxing authorities. The total shares withheld were approximately 42,654, 34,356 and 19,458 during fiscal 2016, 2015 and 2014, respectively, and were based on the value of the RSUs on their respective vesting dates as determined by our closing stock price. Total payments for the employees’ tax obligations to taxing authorities were $1.5 million, $0.3 million and $0.3 million during fiscal 2016, 2015 and 2014, respectively, and are reflected as a financing activity within the Consolidated Statements of Cash Flows.
Stock Options
The total stock option activities and balances of our stock option plans are summarized as follows:
|
|
|
Number of Options Outstanding |
|
|
Weighted Average Exercise Price per Share |
|
|
Weighted Average Remaining Contractual Term (Years) |
|
|
Aggregate Intrinsic Value |
| ||||
|
|
|
|
|
|
|
|
|
|
|
|
|
|
|
|
|
|
|
As of February 2, 2013 |
|
|
5,055,787 |
|
|
$ |
12.50 |
|
|
|
4.9 |
|
|
|
|
|
|
Granted (Weighted average fair value of $2.36) |
|
|
690,423 |
|
|
|
5.39 |
|
|
|
|
|
|
|
|
|
|
Cancelled |
|
|
(1,631,375 |
) |
|
|
12.78 |
|
|
|
|
|
|
|
|
|
|
Exercised |
|
|
(20,214 |
) |
|
|
2.64 |
|
|
|
|
|
|
|
|
|
|
As of February 1, 2014 |
|
|
4,094,621 |
|
|
|
11.24 |
|
|
|
4.8 |
|
|
|
|
|
|
Granted (Weighted average fair value of $1.80) |
|
|
467,400 |
|
|
|
4.54 |
|
|
|
|
|
|
|
|
|
|
Cancelled |
|
|
(734,702 |
) |
|
|
9.52 |
|
|
|
|
|
|
|
|
|
|
Exercised |
|
|
(59,261 |
) |
|
|
4.59 |
|
|
|
|
|
|
|
|
|
|
As of January 31, 2015 |
|
|
3,768,058 |
|
|
|
10.86 |
|
|
|
4.9 |
|
|
|
|
|
|
Granted (Weighted average fair value of $3.64) |
|
|
104,200 |
|
|
|
8.74 |
|
|
|
|
|
|
|
|
|
|
Cancelled |
|
|
(415,146 |
) |
|
|
10.39 |
|
|
|
|
|
|
|
|
|
|
Exercised |
|
|
(523,441 |
) |
|
|
6.83 |
|
|
|
|
|
|
|
|
|
|
As of January 30, 2016 |
|
|
2,933,671 |
|
|
$ |
11.57 |
|
|
|
4.2 |
|
|
$ |
1,070,695 |
|
|
|
|
|
|
|
|
|
|
|
|
|
|
|
|
|
|
|
|
Ending vested and expected to vest |
|
|
2,920,123 |
|
|
$ |
11.59 |
|
|
|
4.2 |
|
|
$ |
1,064,216 |
|
|
Ending exercisable |
|
|
2,606,276 |
|
|
$ |
12.22 |
|
|
|
3.7 |
|
|
$ |
794,136 |
|
SIGMA DESIGNS, INC.
NOTES TO CONSOLIDATED FINANCIAL STATEMENTS (Continued)
The aggregate intrinsic value, as of January 30, 2016, in the table above represents the total pretax intrinsic value, based on our closing stock price of $6.63 on that date which would have been received by the option holders had all options holders exercised their options as of that date. The aggregate exercise date intrinsic value of options that were exercised under our stock plans during fiscal 2016, 2015 and 2014 were $1.6 million, $0.1 million and less than $0.1 million, respectively, determined as of the exercise date. The total fair value of options which vested during fiscal 2016, 2015 and 2014 was $1.3 million, $2.1 million and $4.1 million, respectively.
The options outstanding and currently exercisable as of January 30, 2016 were in the following exercise price ranges:
|
Options Outstanding and Exercisable |
| ||||||||||||||||||||||
|
Range of Exercise Prices |
|
|
Number Outstanding as of 1/30/16 |
|
|
Weighted Average Remaining Contractual Term |
|
|
Weighted Average Exercise Price |
|
|
Number Exercisable as of 1/30/16 |
|
|
Weighted Average Exercise Price |
| |||||||
|
$0.92 |
- |
$4.59 |
|
|
|
338,016 |
|
|
|
7.66 |
|
|
$ |
4.43 |
|
|
|
284,515 |
|
|
$ |
4.44 |
|
|
$4.63 |
- |
$6.49 |
|
|
|
393,858 |
|
|
|
7.59 |
|
|
5.80 |
|
|
|
215,959 |
|
|
5.84 |
| ||
|
$6.55 |
- |
$10.51 |
|
|
|
198,985 |
|
|
|
6.55 |
|
|
8.46 |
|
|
|
106,125 |
|
|
8.22 |
| ||
|
$10.59 |
- |
$10.59 |
|
|
|
344,200 |
|
|
|
3.99 |
|
|
10.59 |
|
|
|
344,200 |
|
|
10.59 |
| ||
|
$10.87 |
- |
$10.87 |
|
|
|
325,600 |
|
|
|
2.76 |
|
|
10.87 |
|
|
|
325,600 |
|
|
10.87 |
| ||
|
$11.06 |
- |
$11.06 |
|
|
|
355,730 |
|
|
|
0.57 |
|
|
11.06 |
|
|
|
355,730 |
|
|
11.06 |
| ||
|
$11.07 |
- |
$11.09 |
|
|
|
359,234 |
|
|
|
3.40 |
|
|
11.08 |
|
|
|
359,234 |
|
|
11.08 |
| ||
|
$11.47 |
- |
$15.25 |
|
|
|
382,448 |
|
|
|
3.06 |
|
|
13.33 |
|
|
|
379,313 |
|
|
13.34 |
| ||
|
$15.64 |
- |
$41.58 |
|
|
|
187,600 |
|
|
|
2.12 |
|
|
32.45 |
|
|
|
187,600 |
|
|
32.45 |
| ||
|
$45.83 |
- |
$45.83 |
|
|
|
48,000 |
|
|
|
1.76 |
|
|
45.83 |
|
|
|
48,000 |
|
|
45.83 |
| ||
|
|
|
|
|
|
|
2,933,671 |
|
|
|
4.17 |
|
|
$ |
11.57 |
|
|
|
2,606,276 |
|
|
$ |
12.22 |
|
As of January 30, 2016, the unrecorded stock-based compensation balance related to stock options outstanding excluding estimated forfeitures was $0.8 million and will be ratably recognized over an estimated weighted average amortization period of 2.0 years. The amortization period is based on the expected remaining vesting term of the options.
Restricted Stock Awards
Restricted Stock Awards, or RSAs, may be granted under our 2015 Plan and will reduce shares available to grant under the plan by one share for every one share of restricted stock granted. Historically, RSAs were granted under our 2009 Plan and consisted of time-based restricted shares, which shares were subject to forfeiture until vested if length of service requirements had not been met. These RSAs had a contractual term of ten years and generally vested over one to five years according to the terms specified in the individual grants. The following table sets forth the shares of restricted stock awards outstanding as of January 30, 2016:
|
|
|
Restricted Stock Awards |
|
|
Weighted Average Grant Date Fair Value per Award |
|
|
Aggregate Intrinsic Value |
| |||
|
|
|
|
|
|
|
|
|
|
|
|
|
|
|
As of February 2, 2013 |
|
|
163,311 |
|
|
$ |
8.71 |
|
|
$ |
860,649 |
|
|
Cancelled/forfeited |
(13,175 |
) |
9.50 |
| ||||||||
|
Vested |
|
|
(61,758 |
) |
|
|
8.49 |
|
|
|
|
|
|
As of February 1, 2014 |
|
|
88,378 |
|
|
|
8.75 |
|
|
|
414,493 |
|
|
Vested |
|
|
(44,189 |
) |
|
|
8.75 |
|
|
|
|
|
|
As of January 31, 2015 |
|
|
44,189 |
|
|
|
8.75 |
|
|
|
281,042 |
|
|
Vested |
|
|
(44,189 |
) |
|
|
8.75 |
|
|
|
|
|
|
As of January 30, 2016 |
|
|
- |
|
|
$ |
- |
|
|
$ |
- |
|
The aggregate intrinsic value, as of January 30, 2016, in the table above represents the total pretax intrinsic value, based on our closing stock price on that date which would have been received by the RSA holders had all RSU holders vested as of that date. As of January 30, 2016, there was no unrecognized stock-based compensation balance related to RSAs as all previously outstanding RSAs have vested.
SIGMA DESIGNS, INC.
NOTES TO CONSOLIDATED FINANCIAL STATEMENTS (Continued)
Restricted Stock Units
We value restricted stock units, or RSUs, using the quoted market price of the underlying stock on the date of grant. RSUs are granted under our 2015 Plan and have a contractual term of ten years and generally vest over four years, based on continued employment, and are settled upon vesting in shares of the Company’s common stock on a one-for-one basis. Each share issued with respect to RSUs granted under the 2015 Plan reduces the number of shares available for grant under the plan by one share. RSUs cancelled and shares withheld to satisfy tax withholding obligations increase the number of shares available for grant under the 2015 Plan utilizing a factor of one times the number of RSUs cancelled or shares withheld. All awards generally provide for accelerated vesting upon a change in control or normal or early retirement (as defined in the applicable stock incentive plan).
During the fourth quarter of fiscal 2016, the Company granted 299,971 performance-based RSUs to certain employees, the vesting of which is contingent upon the achievement of certain performance criteria, namely future sales targets attributable to certain types of products. These RSUs have a multi-year performance period and are expected to vest over a two year period commencing upon the achievement of the respective performance criteria.
Stock-compensation expense will be recognized over the requisite service period based on management’s best estimate of the probability of the performance criteria being satisfied using the most currently available projections of future sales performance, adjusted at each balance sheet date. Changes in the subjective and probability-based assumptions can materially affect the estimate of fair value of stock-based compensation and consequently, the related amount recognized in our consolidated statements of operations. As of January 30, 2016, the performance criterion has not been met for any of the performance-based RSUs outstanding. We recognized no compensation expense related to these performance-based RSUs during fiscal 2016.
The following table sets forth the shares of RSUs outstanding as of January 30, 2016:
|
|
|
Restricted Stock Units |
|
|
Weighted Average Grant Date Fair Value per Unit |
|
|
Aggregate Intrinsic Value |
| |||
|
|
|
|
|
|
|
|
|
|
|
|
|
|
|
As of February 2, 2013 |
|
|
632,262 |
|
|
$ |
6.28 |
|
|
$ |
3,332,021 |
|
|
Granted |
|
|
213,886 |
|
|
|
4.99 |
|
|
|
|
|
|
Vested |
|
|
(210,720 |
) |
|
|
6.11 |
|
|
|
|
|
|
Cancelled/forfeited |
|
|
(166,921 |
) |
|
|
6.26 |
|
|
|
|
|
|
As of February 1, 2014 |
|
|
468,507 |
|
|
|
5.78 |
|
|
|
2,197,298 |
|
|
Granted |
|
|
1,157,127 |
|
|
|
4.91 |
|
|
|
|
|
|
Vested |
|
|
(257,315 |
) |
|
|
6.22 |
|
|
|
|
|
|
Cancelled/forfeited |
|
|
(54,404 |
) |
|
|
6.09 |
|
|
|
|
|
|
As of January 31, 2015 |
|
|
1,313,915 |
|
|
|
4.91 |
|
|
|
8,356,499 |
|
|
Granted |
|
|
1,165,832 |
|
|
|
8.74 |
|
|
|
|
|
|
Vested |
|
|
(861,259 |
) |
|
|
5.52 |
|
|
|
|
|
|
Cancelled/forfeited |
|
|
(215,876 |
) |
|
|
7.37 |
|
|
|
|
|
|
As of January 30, 2016 |
|
|
1,402,612 |
|
|
$ |
7.53 |
|
|
$ |
9,299,318 |
|
The total fair value of RSUs which vested during fiscal 2016, 2015 and 2014 was $4.8 million, $1.6 million and $1.3 million, respectively. The aggregate intrinsic value, as of January 30, 2016, in the table above represents the total pretax intrinsic value, based on our closing stock price of $6.63 on that date which would have been received by the RSU holders had all RSU holders vested as of that date. As of January 30, 2016, the unrecognized stock-based compensation balance related to RSUs outstanding excluding estimated forfeitures was $7.0 million and will be ratably recognized over an estimated weighted average amortization period of 2.0 years.
SIGMA DESIGNS, INC.
NOTES TO CONSOLIDATED FINANCIAL STATEMENTS (Continued)
Employee stock purchase plan
On July 10, 2015, the Board of Directors of the Company approved, subject to shareholder approval, the Company’s 2015 Employee Stock Purchase Plan (the “2015 ESPP”), which was approved by the Company’s shareholders at the 2015 annual meeting of shareholders held on August 20, 2015. The 2015 ESPP has replaced the Company’s 2010 Employee Stock Purchase Plan (the “2010 ESPP”), which was terminated. There are 3,500,000 shares of common stock reserved for issuance under the 2015 ESPP. The 2015 ESPP is implemented by offerings of rights to eligible employees. Each offering will be in such form and will contain such terms and conditions as our Board or a committee thereof will deem appropriate, subject to compliance with applicable regulations. The provisions of separate offerings need not be identical. Under the terms of the offerings that have commenced to date under the 2015 ESPP, eligible employees may authorize payroll deductions of up to 15% of their regular base salaries limited to $25,000 during any calendar year, to purchase common stock at 85% of the fair market value of our common stock at the beginning or end of the six-month offering period, whichever is lower. The maximum number of shares that can be purchased in any single offering period is limited under the terms of the offering. These terms will automatically apply to future offerings under the 2015 ESPP unless modified by the Board or a committee thereof.
During fiscal 2016, 2015 and 2014, 92,122, 626,966 and 618,670 shares of our common stock were purchased at an average price of $5.37, $3.89 and $4.16 per share, respectively. As of January 30, 3016, we had 3,407,878 available for issuance of the 3,500,000 shares of common stock reserved under the 2015 ESPP. Prior to the 2015 ESPP approval, the active plan governing employee purchases during fiscal 2016 was the 2010 ESPP. However, no purchases were made under the aforementioned plan due to circumstances that arose during fiscal 2015 resulting in the issuance of 315,810 shares in excess of the 2,500,000 shares previously reserved under the 2010 ESPP, details of which are described below.
During the first quarter of fiscal 2016, we discovered that we inadvertently sold shares of our common stock to our employees during fiscal 2015 in excess of the shares of common stock authorized to be issued under our 2010 Purchase Plan. As a result, we may have failed to comply with the registration or qualification requirements of the federal securities law. Certain purchasers of the shares that were issued in excess of the shares authorized under our 2010 ESPP may have the right to rescind their purchases from us for an amount equal to the purchase price paid for shares, plus interest from the date of purchase. These shares were treated as issued and outstanding for financial reporting purposes as of the original date of issuance. We intend to make a registered rescission offer in fiscal 2017 to eligible participants who purchased shares during the impacted offering periods in fiscal 2015.
As of February 1, 2016, there were approximately 61,716 shares issued to participants in the 2010 ESPP during the impacted offering periods that continued to be held by the original purchasers of such shares which may be subject to the rescission rights referenced above. All of these shares were originally purchased for $3.89 per share. If holders of all these shares seek to rescind their purchases, we could be required to make aggregate payments of up to approximately $0.4 million based on initial estimates, which does not include statutory interest. However, the actual impact to our cash position may be lower depending on the number of holders who accept the rescission offer and tender their shares. Pursuant to the authoritative accounting guidance, the shares are considered mandatorily redeemable as the redemption may be outside of our control. We reclassified the aforementioned amount out of additional-paid-in-capital into accrued compensation and related benefits during fiscal 2015. We continue to carry the resulting liability on the accompanying consolidated balance sheets as of January 30, 2016 and January 31, 2015 and will continue to do so until such rescission rights have expired subsequent to the aforementioned offering in fiscal 2017. We have not classified the shares themselves outside of permanent equity as these shares are legally outstanding with all rights and privileges therein. We also may be subject to civil and other penalties by regulatory authorities as a result of the failure to register these shares with the Securities and Exchange Commission. We do not believe that the failure to register the shares or the planned rescission offer will have a material impact on our consolidated financial statements.
We are also in the process of settling the potential tax consequences on behalf of our employees for issuing shares in excess of the number of shares reserved under our 2010 ESPP with relevant tax authorities. We may incur additional costs associated with any potential tax consequences and have included $0.4 million of expense associated with these additional costs which were recorded in accrued compensation and related benefits during fiscal 2015. We continue to carry the resulting liability on the accompanying consolidated balance sheets as of January 30, 2016 and January 31, 2015 and will continue to do so until such settlement has been reached with the aforementioned authorities.
SIGMA DESIGNS, INC.
NOTES TO CONSOLIDATED FINANCIAL STATEMENTS (Continued)
Valuation of stock-based compensation
The fair value of RSA and RSU awards is based on the quoted market price of the underlying stock at the date of grant. The fair value of stock option and employee stock purchase plan right awards is estimated at the grant date using the Black-Scholes option pricing model. The determination of fair value of stock option and employee stock purchase plan right awards on the date of grant using an option-pricing model is affected by our stock price as well as assumptions regarding a number of highly complex and subjective variables. These variables include, but are not limited to, our expected stock price volatility over the term of the awards and actual employee stock option exercise behavior.
The fair value of each stock option and employee stock purchase plan right was estimated on the date of grant using the Black-Scholes option pricing model with the following weighted-average assumptions:
|
Fiscal Years Ended |
||||||||||||
|
Stock options |
January 30, 2016 |
January 31, 2015 |
February 1, 2014 |
|||||||||
|
Expected volatility |
44.84 |
% |
42.72 |
% |
46.91 |
% | ||||||
|
Risk-free interest rate |
1.60 |
% |
1.63 |
% |
1.44 |
% | ||||||
|
Expected term (in years) |
5.19 | 5.11 | 5.18 | |||||||||
|
Dividend yield |
0 |
% |
0 |
% |
0 |
% | ||||||
|
Weighted average fair value at grant date |
$ | 3.64 | $ | 1.80 | $ | 2.36 | ||||||
|
Fiscal Years Ended |
||||||||||||
|
Employee stock purchase plan |
January 30, 2016 |
January 31, 2015 |
February 1, 2014 |
|||||||||
|
Expected volatility |
77.90 |
% |
50.05 |
% |
38.92 |
% | ||||||
|
Risk-free interest rate |
0.44 |
% |
0.08 |
% |
0.10 |
% | ||||||
|
Expected term (in years) |
0.46 | 0.50 | 0.50 | |||||||||
|
Dividend yield |
0 |
% |
0 |
% |
0 |
% | ||||||
|
Weighted average fair value at grant date |
$ | 2.24 | $ | 1.67 | $ | 1.27 | ||||||
The computation of the expected volatility assumptions used in the Black-Scholes calculations for new stock option and employee stock purchase plan right awards is based on the historical volatility of our stock price, measured over a period equal to the expected term of the grants or purchase rights. The risk-free interest rate is based on the yield available on U.S. Treasury Strips with an equivalent remaining term. The expected term of stock options represents the weighted-average period that the stock options are expected to remain outstanding and was determined based on historical experience of similar awards, giving consideration to the contractual terms of the stock-based payment awards and vesting schedules. The expected term of employee stock purchase rights is the period of time remaining in the current offering period. The dividend yield assumption is based on our history of not paying dividends and assumption that we will not pay dividends in the future. Stock-based compensation expense related to purchases of common stock under the 2015 ESPP and 2010 ESPP for fiscal 2016, 2015 and 2014 was $0.2 million, $0.8 million and $0.7 million, respectively.
The following table sets forth the total stock-based compensation expense that is included in each functional line item in the consolidated statements of operations (in thousands):
|
Fiscal Years Ended |
||||||||||||
|
January 30, 2016 |
January 31, 2015 |
February 1, 2014 |
||||||||||
|
Cost of revenue |
$ | 227 | $ | 190 | $ | 267 | ||||||
|
Research and development |
3,241 | 3,147 | 3,381 | |||||||||
|
Sales and marketing |
1,151 | 979 | 1,275 | |||||||||
|
General and administrative |
1,940 | 1,963 | 1,891 | |||||||||
|
Total stock-based compensation |
$ | 6,559 | $ | 6,279 | $ | 6,814 | ||||||
SIGMA DESIGNS, INC.
NOTES TO CONSOLIDATED FINANCIAL STATEMENTS (Continued)
Shares reserved for future issuance
We had the following shares of common stock reserved for future issuance upon exercise or issuance of equity instruments at January 30, 2016:
|
Shares Reserved |
||||
|
Authorized for future grants under stock incentive plans |
6,236,730 | |||
|
Stock options outstanding |
2,933,671 | |||
|
Restricted stock units outstanding |
1,402,612 | |||
|
Shares reserved for future issuance |
10,573,013 | |||
401(k) tax deferred savings plan
We maintain a 401(k) tax deferred savings plan for the benefit of qualified employees who are U.S. based. Under the 401(k) tax deferred savings plan, U.S. based employees may elect to reduce their current annual taxable compensation up to the statutorily prescribed limit, which is $18,000 in calendar year 2015. Employees age 50 or over may elect to contribute an additional $6,000. We made matching contributions to the 401(k) tax deferred savings plan during fiscal 2016 of $0.3 million and made no matching contributions in either 2015 or 2014.
Endowment insurance pension plan
Related to our acquisition of our DTV business in May 2012, we added operations in Shanghai, China. It is required by the “Procedures of Shanghai Municipality on Endowment Insurance for Town Employees” to provide pension insurance for Shanghai employees. This mandatory plan is managed by the local authority. Under the current plan, the employee will contribute 8.0% of the annual base to the plan and the employer will match 21% of the annual base. For calendar year 2015, the annual base is capped at RMB 16,353 per employee. During fiscal 2016, 2015 and 2014, we made matching contributions of $2.3 million, $2.1 million and $2.1 million, respectively.
Retirement pension plans
We maintain a Retirement Pension Plan for the benefit of qualified employees who are based in Denmark. Under the Retirement Pension Plan, Denmark based employees may elect to reduce their annual taxable compensation up to their annual salary. We have a discretionary matching contribution program whereby we contribute 4.5% of our employee’s annual salary. We made matching contributions to this plan of $0.2 million per year during fiscal 2016, 2015 and 2014.
We contribute to a government managed labor pension fund for the benefit of qualified employees who are based in Taiwan. Under this plan, Taiwan based employees may elect to reduce their current annual taxable compensation up to 6% of their annual salary and we are required to match 6% of their annual salary up to the statutorily prescribed annual salary limitation of NTD 150,000 per employee. We made matching contributions to this plan of $0.1 million per year during fiscal 2016, 2015 and 2014.
Related to our acquisition of our DTV business in May 2012, we added operations in Waalre, The Netherlands. We maintain a retirement pension plan for the benefit of qualified employees who are employed by Sigma Designs Netherlands. Under the current plan, employees contribute 1.7% of their annual pensionable salary to the plan and we match 22% of their annual pensionable salary. During fiscal 2016, 2015 and 2014, we made matching contributions of $0.3 million, $0.3 million and $0.4 million to this plan, respectively.
Related to our acquisition of our DTV business in May 2012, we added operations in Freiburg, Germany. We maintain a retirement pension plan for the benefit of qualified employees who are employed by Sigma Designs Germany. Under the current plan, we have a discretionary matching contribution program whereby we contribute 4% of our employees’ annual salary. We made matching contributions to this plan of less than $0.1 million per year during fiscal 2016, 2015 and 2014.
SIGMA DESIGNS, INC.
NOTES TO CONSOLIDATED FINANCIAL STATEMENTS (Continued)
Severance plan
We maintain a severance plan for several Israeli employees pursuant to Israel's Severance Pay Law based on the most recent salary of the employees multiplied by the number of years of employment. Upon termination of employment, employees are entitled to one month salary for each year of employment or a portion thereof. As of January 30, 2016, we have an accrued severance liability of $0.7 million offset by $0.6 million of severance employee funds. We made contributions of approximately $0.1 million per year related to this obligation during fiscal 2016, 2015 and 2014.
Employee termination benefits
Termination benefits are payable when an employee is involuntarily terminated, or whenever an employee accepts voluntary termination in exchange for termination benefits. For the accounting treatment and timing recognition of involuntarily termination benefits, we distinguish between one-time termination benefit arrangements and ongoing termination benefit arrangements. A one-time termination benefit arrangement is established by a termination plan and applies to a specified termination event. One-time involuntary termination benefits are recognized as a liability when the termination plan meets certain criteria and has been communicated to employees. If employees are required to render future service in order to receive these one-time termination benefits, the liability is recognized ratably over the future service period. Termination benefits other than one-time termination benefits are termination benefits for which the communication criterion is not met but that are committed to by management, or termination obligations that are not specifically determined in a new and single plan. These termination benefits include all legal, contractual and past practice termination obligations to be paid to employees in case of involuntary termination. These termination benefits are accrued for when commitment creates a present obligation to our employees for the benefits expected to be paid, when it is probable that employees will be entitled to the benefits and the amount can be reasonably estimated. As discussed in Note 9, during fiscal 2015 and 2014, we adopted restructuring plans resulting in employee termination costs of $1.1 million and $1.7 million, respectively, which were recorded in restructuring costs in the accompanying consolidated statements of operations. There were no employee related restructuring costs during fiscal 2016 as restructuring efforts under the plan initiated in fiscal 2013 had substantially been completed as of January 31, 2015.
|
|
|
14. |
Income taxes |
Income (loss) before income taxes consists of the following (in thousands):
|
Fiscal Years Ended |
||||||||||||
|
January 30, 2016 |
January 31, 2015 |
February 1, 2014 |
||||||||||
|
United States |
$ | (23,129 | ) | $ | 1,641 | $ | 6,694 | |||||
|
International |
30,478 |
|
(18,349 |
) |
(14,793 |
) | ||||||
|
Total |
$ | 7,349 | $ | (16,708 |
) |
$ | (8,099 |
) | ||||
The federal, state and foreign income tax provision (benefit) is summarized as follows (in thousands):
|
Fiscal Years Ended |
||||||||||||
|
January 30, 2016 |
January 31, 2015 |
February 1, 2014 |
||||||||||
|
Current |
||||||||||||
|
Federal |
$ | (150 |
) |
$ | (586 |
) |
$ | 1,116 | ||||
|
State |
45 | 73 | 18 | |||||||||
|
Foreign |
4,915 | 5,164 | (2,324 |
) | ||||||||
|
Total current |
4,810 | 4,651 | (1,190 |
) | ||||||||
|
Deferred: |
||||||||||||
|
Federal |
(290 |
) |
- | 2,762 | ||||||||
|
Foreign |
2,671 | 342 | 1,378 | |||||||||
|
Total deferred |
2,381 | 342 | 4,140 | |||||||||
|
Provision for income taxes |
$ | 7,191 | $ | 4,993 | $ | 2,950 | ||||||
SIGMA DESIGNS, INC.
NOTES TO CONSOLIDATED FINANCIAL STATEMENTS (Continued)
The tax effects of significant items comprising our deferred tax assets and liabilities are as follows (in thousands):
|
January 30, 2016 |
January 31, 2015 |
|||||||
|
Deferred tax assets: |
||||||||
|
Net operating loss |
$ | 7,593 | $ | 4,146 | ||||
|
Investment impairment |
1,131 | 1,602 | ||||||
|
Allowance, reserve and other |
4,039 | 5,652 | ||||||
|
Depreciation |
419 | 1,040 | ||||||
|
Tax credits |
12,194 | 9,396 | ||||||
|
Stock-based compensation |
8,420 | 7,738 | ||||||
|
Total gross deferred tax assets |
33,796 | 29,574 | ||||||
|
Valuation allowance |
(31,529 |
) |
(25,909 |
) | ||||
|
Total deferred tax assets |
2,267 | 3,665 | ||||||
|
Deferred tax liabilities: |
||||||||
|
Unrealized foreign exchange loss |
(60 |
) |
(501 |
) | ||||
|
Acquired intangibles and other |
(1,613 |
) |
101 | |||||
|
Net deferred tax assets |
$ | 594 | $ | 3,265 | ||||
We must regularly assess the likelihood that future taxable income levels will be sufficient to ultimately realize the tax benefits of our deferred tax assets. During the third quarter of fiscal 2013, we concluded it was necessary to establish a valuation allowance for certain deferred tax assets (“DTA”) related to Federal taxes in the United States. Due to the history of losses in the United States, it was determined that it is more likely than not that certain Federal DTAs would not be recognized. As of January 30, 2016, we continue to maintain a full valuation allowance against our US Federal and California deferred tax assets and a partial valuation allowance against foreign net operating losses. However, as a result of our continued efforts to reduce expenses and improve efficiency, competitiveness and profitability, it is possible that our net deferred tax assets will become realizable and a valuation allowance may no longer be needed. The valuation allowance increased by approximately $5.6 million in fiscal 2016.
As of January 30, 2016, net operating loss carry forwards amounted to approximately $29.0 million and $25.6 million for federal and California tax purposes, respectively, which will begin to expire in fiscal 2019 through 2036. Of the total net operating loss carryover, the tax effect of $13.2 million federal and $3.4 million state losses will be recorded to additional paid-in capital when utilized in the future. We also had federal and state research credit carryovers of $19.2 million and $19.6 million, respectively. Federal research credits will start expiring from fiscal 2019. The state research credit has no expiration. Of the total research credit carryover, the tax effect of $12.0 million federal and $2.3 million state credits will be recorded to additional paid-in capital when utilized in the future. We also have $16.1 million of foreign operating loss carry forwards.
Net operating losses and tax credit carry forwards as of January 30, 2016 are as follows (in thousands):
|
|
|
Amount |
|
|
Range of Expiration Years |
| |||
|
|
|
|
|
|
|
| |||
|
Net operating losses, federal |
|
$ |
29,010 |
|
|
Through 2035 |
| ||
|
Net operating losses, state |
|
|
25,594 |
|
|
Through 2036 |
| ||
|
Net operating losses, foreign |
|
|
16,115 |
|
|
Indefinite |
| ||
|
Tax credits, federal |
|
|
21,348 |
|
|
Through 2036 |
| ||
|
Tax credits, state |
|
$ |
19,576 |
|
|
Indefinite |
| ||
Current federal and California tax laws include substantial restrictions on the utilization of net operating losses and tax credits in the event of an “ownership change” of a corporation. Accordingly, our ability to utilize net operating loss and tax credit carryforwards may be limited as a result of such ownership changes. Such a limitation could result in the expiration of carryforwards before they are utilized.
SIGMA DESIGNS, INC.
NOTES TO CONSOLIDATED FINANCIAL STATEMENTS (Continued)
The effective tax rate of our provision for income taxes differs from the federal statutory rate as follows (in thousands):
|
Fiscal Years Ended |
||||||||||||
|
January 30, 2016 |
January 31, 2015 |
February 1, 2014 |
||||||||||
|
Computed at federal statutory rate of 35% |
$ | 2,572 | $ | (5,848 |
) |
$ | (2,835 |
) | ||||
|
State taxes provision, net of federal benefit |
29 | 47 | 12 | |||||||||
|
Uncertain tax positions |
3,778 | (347 |
) |
253 | ||||||||
|
Difference between statutory rate and foreign effective tax rate |
(1,474 |
) |
12,252 | 5,316 | ||||||||
|
Stock-based compensation expense |
(17 |
) |
819 | 2,769 | ||||||||
|
Change in federal valuation allowance |
4,098 | (835 |
) |
(1,933 |
) | |||||||
|
Tax credits |
(1,708 |
) |
(1,563 |
) |
(561 |
) | ||||||
|
Other |
(87 |
) |
468 | (71 |
) | |||||||
|
Total |
$ | 7,191 | $ | 4,993 | $ | 2,950 | ||||||
Included in the balance of unrecognized tax benefits as of January 30, 2016 are $11.0 million of tax benefits that, if recognized, would reduce our effective tax rate. The remaining amount would be offset by the reversal of related deferred tax assets on which a valuation allowance is placed. A reconciliation of the beginning and ending amount of unrecognized tax benefits is as follows (in thousands):
|
Fiscal Years Ended |
||||||||||||
|
January 30, 2016 |
January 31, 2015 |
February 1, 2014 |
||||||||||
|
Beginning balance |
$ | 15,504 | $ | 17,439 | $ | 26,743 | ||||||
|
Additions based on tax positions related to the current year |
5,449 | 1,373 | 2,772 | |||||||||
|
Additions for tax positions of prior years |
1,527 | 718 | 575 | |||||||||
|
Reductions for tax positions of prior year |
- | (61 |
) |
(7,139 |
) | |||||||
|
Settlements |
- | - | (5,175 |
) | ||||||||
|
Lapse of status of limitation |
(308 |
) |
(3,965 |
) |
(337 |
) | ||||||
|
Ending balance |
$ | 22,172 | $ | 15,504 | $ | 17,439 | ||||||
We have adopted the accounting policy that interest and penalties recognized are classified as part of our income taxes. In fiscal 2016, we increased our accrual of such interest and penalties expense by $0.1 million, whereas we reduced our accrual by $0.1 million in fiscal 2015. As of January 30, 2016 and January 31, 2015, the balance of such accrued interest and penalties was $0.3 million and $0.2 million, respectively. We believe that it is reasonably possible that a decrease of up to $1.6 million in unrecognized tax benefits related to U.S. and foreign exposures may be necessary within the coming year.
Our operations are subject to income and transaction taxes in the United States and in multiple foreign jurisdictions. Significant estimates and judgments are required in determining our worldwide provision for income taxes. Some of these estimates are based on interpretations of existing tax laws or regulations. The ultimate amount of tax liability may be uncertain as a result.
During fiscal 2014, we reduced our unrecognized tax benefits by $9.3 million, primarily related to settlements with the Israeli and Singaporean authorities. Our Israel subsidiary and the Israeli Tax Authorities settled all outstanding items related to fiscal years 2009 through 2012. As a result of the settlement, we recognized a net tax benefit to the provision for income tax of $4.3 million.
In February 2013, our Denmark subsidiary reached an audit agreement with the Danish Taxing Authorities to reduce our net operating losses in Denmark by DKK 75 million. The disallowed net operating losses were subject to a valuation allowance in the past and the audit adjustment did not result in a financial charge. With regards to our Singapore subsidiary, we have reached an agreement with the Singapore authorities that our incentives would not extend beyond February 29, 2012, but that we will be able to retain the benefits previously realized. As a result of the agreement, we recognized a net tax benefit to the provision for income tax of $1.1 million.
SIGMA DESIGNS, INC.
NOTES TO CONSOLIDATED FINANCIAL STATEMENTS (Continued)
Our tax filings for the fiscal years from 1991 to 2015 remain open in various taxing jurisdictions. We do not anticipate that our unrecognized tax benefit will change significantly in the coming fiscal year.
U.S. income taxes and foreign withholding taxes associated with the repatriation of earnings of foreign subsidiaries were not provided for on a cumulative total of $67.4 million of undistributed earnings of certain foreign subsidiaries as of the end of fiscal 2016. The Company intends to reinvest these earnings indefinitely in its foreign subsidiaries. If these earnings were distributed to the United States in the form of dividends or otherwise, the Company would be subject to additional U.S. income taxes (subject to an adjustment for foreign tax credits) and foreign withholding taxes. Determination of the amount of unrecognized deferred income tax liability related to these earnings is not practicable.
Our acquired Israeli subsidiary, Sigma Designs Israel S.D.I. (formerly known as CopperGate Communications Ltd.), was granted “Approved Enterprise” status under the Law for the Encouragement of Capital Investments, 1959 (the “Law”) in 2005, which became effective in fiscal 2008, and elected 2009 (which became effective in fiscal 2014), and 2011 as election years of the “Benefited Enterprise” under the Law. Sigma Designs Israel’s taxable income allocated to each enterprise is tax-exempt for a period of two years commencing with the year it first earns taxable income, and subject to corporate taxes at the reduced rate for an additional period of five to eight years. The period of tax benefits, as detailed above, is limited to the earlier of 12 years from the “operational year” of the “Benefited Enterprise” or 14 years from the year the grant of “Approved Enterprise” status. The impact of this tax holiday was to increase net income by approximately $4.1 million or $0.11 per diluted share in fiscal 2016, $6.1 million or $0.18 per diluted share in fiscal 2015, and $3.1 million or $0.09 per diluted share in fiscal 2014.
|
|
|
15. |
Segment and geographical information |
Operating segments are defined as components of an enterprise for which separate financial information is available and evaluated regularly by the chief operating decision-maker in deciding how to allocate resources and in assessing performance. We are organized as, and operate in, one reportable segment. Our operating segment consists of our geographically based entities in the United States, Israel and Singapore. Our chief operating decision-maker reviews consolidated financial information, accompanied by information about revenue by product group, target market and geographic region. We do not assess the performance of our geographic regions on other measures of income, expense or net income.
Our net revenue is derived principally from the sales of integrated semiconductor solutions, which we sell across all of our target markets. Smart TV products consist of a range of platforms that are based on highly integrated chips, embedded software, and hardware reference designs. Media Connectivity products consist of wired home networking controller chipsets that are designed to provide connectivity solutions between various home entertainment products and incoming video streams. Set-top Box products consist of connected media processors and players delivering IP streaming video, including hybrid versions of these products. IoT Devices consist of our wireless Z-Wave chipsets and modules.
Our License and other markets includes revenue derived from the licensing of our technology to third parties and other sources. Revenue derived from our licensing activities comprises the majority of this category. Revenue derived from other sources includes software development kits, engineering support services for hardware and software, and engineering development for customization of chipsets and other accessories; that revenue is not significant as it represented 0.7% of our total net revenue in both fiscal 2016 and 2015 and 0.9% for fiscal 2014.
Historically, we disclosed information encompassing product groupings by target markets with certain naming conventions, consisting of Digital Television (“DTV”), Set-top Box, Home Networking, Home Control, and License and other. We resolved to change the naming conventions of some of our target markets, commensurate with changes taking effect in our industry as a whole. We renamed our “DTV” target market to “Smart TV,” “Home Networking” to “Media Connectivity,” and “Home Control” to “IoT Devices.” These changes did not affect the products or related services categorization, or previously reported amounts related to the aforementioned historical target markets.
SIGMA DESIGNS, INC.
NOTES TO CONSOLIDATED FINANCIAL STATEMENTS (Continued)
The following tables set forth net revenue attributable to each target market (in thousands):
|
Fiscal Years Ended |
||||||||||||
|
January 30, 2016 |
January 31, 2015 |
February 1, 2014 |
||||||||||
|
Smart TV |
$ | 102,870 | $ | 48,929 | $ | 49,600 | ||||||
|
Media Connectivity |
54,952 | 77,305 | 72,927 | |||||||||
|
IoT Devices |
46,982 | 31,437 | 20,704 | |||||||||
|
Set-top Box |
20,829 | 24,458 | 38,483 | |||||||||
|
License and other |
1,617 | 6,184 | 17,479 | |||||||||
|
Net revenue |
$ | 227,250 | $ | 188,313 | $ | 199,193 | ||||||
The following table sets forth net revenue for each geographic region based on the ship-to location of customers (in thousands):
|
Fiscal Years Ended |
||||||||||||
|
January 30, 2016 |
January 31, 2015 |
February 1, 2014 |
||||||||||
|
Asia |
$ | 172,773 | $ | 152,571 | $ | 144,483 | ||||||
|
North America |
42,335 | 20,746 | 28,795 | |||||||||
|
Europe |
10,292 | 12,012 | 22,262 | |||||||||
|
Other Regions |
1,850 | 2,984 | 3,653 | |||||||||
|
Net revenue |
$ | 227,250 | $ | 188,313 | $ | 199,193 | ||||||
The following table sets forth net revenue to each significant country based on the ship-to location of customers (in thousands):
|
Years Ended |
||||||||||||
|
January 30, 2016 |
January 31, 2015 |
February 1, 2014 |
||||||||||
|
China, including Hong Kong |
$ | 93,560 | $ | 70,513 | $ | 95,009 | ||||||
|
Taiwan |
50,301 | 24,346 | 12,479 | |||||||||
|
United States |
41,781 | 20,587 | 27,875 | |||||||||
|
Thailand |
13,532 | 40,703 | 24,490 | |||||||||
|
Hungary |
595 | 363 | 12,531 | |||||||||
|
Rest of the world |
27,481 | 31,801 | 26,809 | |||||||||
|
Net revenue |
$ | 227,250 | $ | 188,313 | $ | 199,193 | ||||||
Our long-lived assets consist primarily of our software, equipment, and leasehold improvements.
The following table sets forth our long-lived assets by geographic region based on the location of the asset (in thousands):
|
Fiscal Years Ended |
||||||||
|
January 30, 2016 |
January 31, 2015 |
|||||||
|
United States |
$ | 5,885 | $ | 7,889 | ||||
|
Singapore |
5,388 | 10,499 | ||||||
|
All other countries |
2,813 | 3,206 | ||||||
|
Total long-lived assets |
$ | 14,086 | $ | 21,594 | ||||
SIGMA DESIGNS, INC.
NOTES TO CONSOLIDATED FINANCIAL STATEMENTS (Continued)
The following table sets forth the major direct customers that accounted for 10% or more of our net revenue:
|
|
|
Fiscal Years Ended |
| |||||||||
|
|
|
January 30, 2016 |
|
|
January 31, 2015 |
|
|
February 1, 2014 |
| |||
|
|
|
|
|
|
|
|
|
|
|
|
|
|
|
Sunjet Components Corps |
16 |
% |
* |
* |
||||||||
|
Benchmark Electronics |
|
|
* |
|
|
|
13 |
% |
|
|
* |
|
*Accounted for less than 10% of our net revenue.
Net revenue from Sunjet Components Corps and Benchmark Electronics was primarily generated through the Smart TV and Media Connectivity markets, respectively.
|
|
|
16. |
Related parties |
On November 4, 2015, we entered into an Agreement and Plan of Merger (the “Merger Agreement”) to acquire (the “Merger”) Bretelon, Inc., a Delaware corporation (“Bretelon”). As consideration for the Merger, we paid approximately $21,675,000 in cash, subject to certain adjustments (the “Merger Consideration”). We retained a portion of the Merger Consideration following the closing for the satisfaction of indemnification claims we may make within a specified period of time.
Certain members of our board of directors held an interest in Bretelon. Martin Manniche, a director on our board of directors, also served on the board of directors of Bretelon and held a fully vested option to purchase 700,000 shares of Bretelon common stock (the “Option”). At the consummation of the Merger, the Option was converted into a right to receive cash proceeds from the Merger Consideration equal to the difference between the price per share paid for each share of Bretelon common stock in the Merger and the exercise price of the Option, or an aggregate of approximately $215,000. Manniche Holdings ApS (“Manniche Holdings”) also held 10,175,437 shares of Bretelon common stock, or 23.9% of the outstanding shares of Bretelon capital stock on a fully diluted basis. Manniche Holdings also held a convertible promissory note (the “Note”) in the amount of $700,000 and a warrant to purchase shares of Bretelon common stock (the “Warrant”), which as of the consummation of the Merger, represented a right to buy 136,036 shares of Bretelon common stock. Mr. Manniche held an indirect economic interest in the securities held by Manniche Holdings. As of the time of the execution of the Merger Agreement, Manniche Holdings had been transferred to AMC Holdings. A member of Mr. Manniche’s immediate family is deemed to be a beneficial owner of AMC Holdings. At the closing, the securities held by Manniche Holdings resulted in payments of $3,710,000 for the shares of common stock, $720,000 for the Note (which included accrued interest) and $9,000 for the Warrant. Another entity beneficially owned by a member of Mr. Manniche’s immediate family held an additional 2,017,543 shares of Bretelon common stock, or 4.7% of the outstanding shares of Bretelon capital stock on a fully diluted basis, for which proceeds of $735,000 were paid at the closing of the Merger.
Our President, Chief Executive Officer and a member of our board of directors, Thinh Tran, beneficially owned 1,710,526 shares of Bretelon common stock, or 4.0% of the outstanding shares of Bretelon capital stock on a fully diluted basis. Pursuant to the terms of the Merger Agreement, Mr. Tran divested his shares of Bretelon common stock prior to the consummation of the Merger by transferring such shares at original cost to us at an aggregate of approximately $97,500. We received the benefit of the proceeds of approximately $623,000 that would otherwise be allocated to these shares held by Mr. Tran in the Merger; which proceeds served to reduce the amount of Merger Consideration that we paid.
SIGMA DESIGNS, INC.
NOTES TO CONSOLIDATED FINANCIAL STATEMENTS (Continued)
In light of the interests of certain members of our board of directors in this transaction, our board of directors established a special committee of the board (the “Special Committee”) consisting of independent directors who had no interest or prior dealings with Bretelon. The members of the Special Committee were Tor Braham, J. Michael Dodson and Pete Thompson. These directors also comprise the Audit Committee of our board of directors, which committee is also charged with reviewing related-party transactions. The primary duties of the Special Committee were to evaluate the strategic opportunity with Bretelon, to review the principal terms of any proposed transaction with Bretelon and to make a final recommendation to our board of directors on whether to approve any definitive agreement with Bretelon. Mr. Manniche did not participate in the deliberations of the Special Committee. The Special Committee unanimously approved the Merger and the Merger Agreement and recommended to the full Board that it approve the Merger and the Merger Agreement. In so doing, the Special Committee was aware of the interests of Mr. Tran and Mr. Manniche in the transaction, which interests had been fully disclosed at the outset of our consideration of a potential transaction with Bretelon. Upon recommendation of the Special Committee, our board of directors approved the Merger and the Merger Agreement, with Mr. Tran abstaining from the vote and Mr. Manniche not in attendance at our board’s meeting in which the Merger and the Merger Agreement were approved.
The foregoing description of the Merger Agreement is qualified in its entirety by reference to the full text of the Merger Agreement, a copy of which is attached as Exhibit 2.1 to Form 8-K filed on November 10, 2015 and is incorporated herein by reference. The Merger Agreement has been filed with the Securities and Exchange Commission to provide investors with information regarding its terms. It is not intended to provide any other factual information about the parties. In particular, the assertions embodied in the representations and warranties contained in the Merger Agreement are qualified by information in confidential Disclosure Schedules provided by Bretelon in connection with the signing of the Merger Agreement. The confidential Disclosure Schedules contain information that modifies, qualifies and creates exceptions to the representations and warranties set forth in the Merger Agreement. Moreover, certain representations and warranties in the Merger Agreement were used for the purpose of allocating risk between the parties rather than establishing matters as facts. Accordingly, you should not rely on the representations and warranties in the Merger Agreement as characterizations of the actual state of facts about the parties.
|
17. |
Quarterly financial information (unaudited) |
The following table presents unaudited quarterly financial information for each of our most recent eight fiscal quarters (in thousands, except per share amounts):
|
Fiscal Quarters Ended |
||||||||||||||||||||||||||||||||
|
January 30, 2016 |
October 31, 2015 |
August 1, 2015 |
May 2, 2015 |
January 31, 2015 |
November 1, 2014 |
August 2, 2014 |
May 3, 2014 |
|||||||||||||||||||||||||
|
Net revenue |
$ | 51,450 | $ | 61,581 | $ | 58,307 | $ | 55,912 | $ | 54,846 | $ | 53,784 | $ | 42,810 | $ | 36,873 | ||||||||||||||||
|
Gross profit |
24,501 | 30,787 | 28,524 | 29,348 | 26,720 | 26,512 | 21,889 | 20,225 | ||||||||||||||||||||||||
|
(Loss) income from operations |
(5,237 |
) |
1,464 | 1,208 | 1,410 | (2,343 |
) |
(1,296 |
) |
(5,795 |
) |
(8,443 |
) | |||||||||||||||||||
|
Net (loss) income |
(6,191 |
) |
6,435 | 296 | (382 |
) |
(3,610 |
) |
(557 |
) |
(7,620 |
) |
(9,914 |
) | ||||||||||||||||||
|
Basic net (loss) income per share |
$ | (0.17 |
) |
$ | 0.18 | $ | 0.01 | $ | (0.01 |
) |
$ | (0.10 |
) |
$ | (0.02 |
) |
$ | (0.22 |
) |
$ | (0.29 |
) | ||||||||||
|
Diluted net (loss) income per share |
$ | (0.17 |
) |
$ | 0.17 | $ | 0.01 | $ | (0.01 |
) |
$ | (0.10 |
) |
$ | (0.02 |
) |
$ | (0.22 |
) |
$ | (0.29 |
) | ||||||||||
|
ITEM 9. |
CHANGES IN AND DISAGREEMENTS WITH ACCOUNTANTS ON ACCOUNTING AND FINANCIAL DISCLOSURE |
None.
|
ITEM 9A. |
CONTROLS AND PROCEDURES |
Evaluation of Disclosure Controls and Procedures
We are committed to maintaining disclosure controls and procedures designed to ensure that information required to be disclosed in our periodic reports filed under the Exchange Act is recorded, processed, summarized and reported within the time periods specified in the SEC’s rules and forms, and that such information is accumulated and communicated to our management, including our Chief Executive Officer and Chief Financial Officer, as appropriate, to allow for timely decisions regarding required disclosure. In designing and evaluating our disclosure controls and procedures, we recognize that any controls and procedures, no matter how well designed and operated, can provide only reasonable assurance of achieving the desired control objectives, and we necessarily are required to apply our judgment in evaluating the cost-benefit relationship of possible controls and procedures and implementing controls and procedures.
As of January 30, 2016, the end of the period covered by this Annual Report on Form 10-K, we have, with the participation of our Chief Executive Officer and Chief Financial Officer evaluated the effectiveness of the design and effectiveness of our disclosure controls and procedures, as such terms are defined in Rule 13a-15(e) and Rule 15d-15(e) under the Securities and Exchange Act of 1934, as amended (the “Exchange Act”). Based on this evaluation, we have concluded that our disclosure controls and procedures were effective as of January 30, 2016.
Management’s Report on Internal Control over Financial Reporting
We are responsible for establishing and maintaining adequate internal control over financial reporting (as such term is defined in Rules 13a-15(f) and 15d-15(f) under the Exchange Act). Our internal control over financial reporting is a process designed to provide reasonable assurance regarding the reliability of financial reporting and the preparation of financial statements for external purposes in accordance with generally accepted accounting principles in the United States. All internal control systems, no matter how well designed, have inherent limitations. Therefore, even those systems determined to be effective can provide only reasonable assurance with respect to financial statement preparation and presentation and may not prevent or detect misstatements. Projections of any evaluation of effectiveness of internal control over financial reporting to future periods are subject to the risk that controls may become inadequate because of changes in conditions, or that the degree of compliance with the policies or procedures may deteriorate.
We, including our Chief Executive Officer and Chief Financial Officer, assessed the effectiveness of our internal control over financial reporting as of January 30, 2016. In making this assessment, we used the criteria set forth in Internal Control-Integrated Framework (2013) issued by the Committee of Sponsoring Organizations of the Treadway Commission (COSO). Based on this assessment, we concluded that our internal control over financial reporting was effective as of January 30, 2016.
Armanino LLP, the independent registered public accounting firm that audited our consolidated financial statements included in this Annual Report on Form 10-K, has also assessed the effectiveness of internal control over financial reporting as of January 30, 2016. Their attestation report is included herein under Part II, Item 8.
Changes in Internal Control over Financial Reporting
During the fourth quarter ended January 30, 2016, there were no changes in our internal control over financial reporting (as such term is defined in Rules 13a-15(f) and 15d-15(f) under the Exchange Act) that have materially affected, or are reasonably likely to materially affect, our internal control over financial reporting.
In May 2013, the Committee of Sponsoring Organizations of the Treadway Commission (“COSO”) issued an update on internal control, 2013 Internal Control – Integrated Framework. This update provides changes from the pre-established guidance within the 1992 internal control framework primarily encompassing the following: (i) codification of principles that support the five components of internal control, (ii) clarification of the role of objective-setting in internal control, (iii) enhanced focus on technology and related control structures, (iv) enhanced information on governance conceptual frameworks, (v) expansion of the reporting categories of objectives, (vi) enhanced anti-fraud expectations and (vii) increased focus on non-financial reporting objectives. We adopted the 2013 Internal Control – Integrated Framework during fiscal 2015 in conducting our assessment of internal control over financial reporting. The adoption of said framework did not materially impact our internal control over financial reporting or the aforementioned conclusions regarding its effectiveness.
|
ITEM 9B. |
OTHER MATTERS |
None.
PART III
|
ITEM 10. |
DIRECTORS, EXECUTIVE OFFICERS OF THE REGISTRANT AND CORPORATE GOVERNANCE |
The information required by this item is incorporated by reference from the information in the sections captioned “Election of Directors-Nominees,” “Section 16(a) Beneficial Ownership Reporting Compliance,” “Election of Directors-Code of Ethics,” and “Election of Directors-Committees of the Board,” which will appear in the 2016 Proxy Statement we will deliver to our shareholders in connection with our Annual Meeting of Shareholders or in an amendment to this Form 10-K to be filed with the Securities and Exchange Commission within 120 days after the close of the fiscal year covered by this report on Form 10-K. Certain information required by this item concerning executive officers is set forth in Part I of this Report under the caption “Executive Officers and Key Employees” and is incorporated herein by reference.
|
ITEM 11. |
EXECUTIVE COMPENSATION |
The information required by this item is incorporated by reference from the information in the sections captioned “Executive Compensation,” and “Election of Directors-Fiscal 2016 Director Compensation,” which will appear in the 2016 Proxy Statement we will deliver to our shareholders in connection with our Annual Meeting of Shareholders or in an amendment to this Form 10-K to be filed with the Securities and Exchange within 120 days after the close of the fiscal year covered by this report on Form 10-K.
|
ITEM 12. |
SECURITY OWNERSHIP OF CERTAIN BENEFICIAL OWNERS AND MANAGEMENT AND RELATED SHAREHOLDER MATTERS |
The information required by this item is incorporated by reference from the sections captioned “Security Ownership of Certain Beneficial Owners and Management,” and “Equity Compensation Plan Information,” which will appear in the 2016 Proxy Statement we will deliver to our shareholders in connection with our Annual Meeting of Shareholders or in an amendment to this Form 10-K to be filed with the Securities and Exchange Commission within 120 days after the close of the fiscal year covered by this report on Form 10-K.
|
ITEM 13. |
CERTAIN RELATIONSHIPS AND RELATED TRANSACTIONS AND DIRECTOR INDEPENDENCE |
The information required by this item is incorporated by reference from the sections captioned “Election of Directors-Certain Relationships and Related Transactions,” and “Election of Directors-Corporate Governance and Other Matters,” which will appear in the 2016 Proxy Statement we will deliver to our shareholders in connection with our Annual Meeting of Shareholders or in an amendment to this Form 10-K to be filed with the Securities and Exchange Commission within 120 days after the close of the fiscal year covered by this report on Form 10-K.
|
ITEM 14. |
PRINCIPAL ACCOUNTING FEES AND SERVICES |
The information required by this item is incorporated by reference from the sections captioned “Report of the Audit Committee” and “Ratification of Selection of Independent Auditors,” which will appear in the 2016 Proxy Statement we will deliver to our shareholders in connection with our Annual Meeting of Shareholders or in an amendment to this Form 10-K to be filed with the Securities and Exchange Commission within 120 days after the close of the fiscal year covered by this report on Form 10-K.
PART IV
|
ITEM 15. |
EXHIBITS AND FINANCIAL STATEMENT SCHEDULES |
(a) The following documents are filed as part of this Annual Report on Form 10-K:
|
|
1. |
Consolidated Financial Statements |
|
Financial Statements |
|
Page |
|
Report of Independent Registered Public Accounting Firm |
|
55 |
|
Consolidated Balance Sheets at January 30, 2016 and January 31, 2015 |
|
56 |
|
Consolidated Statements of Operations for the Years Ended January 30, 2016, January 31, 2015 and February 1, 2014 |
|
57 |
|
Consolidated Statements of Comprehensive Income Loss for the Years Ended January 30, 2016, January 31, 2015 and February 1, 2014 |
|
57 |
|
Consolidated Statements of Shareholders’ Equity for the Years Ended January 30, 2016, January 31, 2015 and February 1, 2014 |
|
58 |
|
Consolidated Statements of Cash Flows for the Years Ended January 30, 2016, January 31, 2015 and February 1, 2014 |
|
59 |
|
Notes to Consolidated Financial Statements |
|
60 |
|
|
2. |
Consolidated Financial Statements Schedules |
|
Schedule II—Valuation and Qualifying Accounts and Reserves |
|
99 |
All other schedules have been omitted as they are not required, not applicable or the required information is otherwise included.
(b) Exhibits:
The exhibits listed on the accompanying index to exhibits immediately following the financial statement schedules are incorporated by reference into this Annual Report on Form 10-K.
SIGNATURES
Pursuant to the requirements of Section 13 or 15(d) of the Securities Act of 1934, the Registrant has duly caused this report to be signed on its behalf by the undersigned, thereunto duly authorized, in the city of Fremont, State of California, on the 1st day of April, 2016.
|
|
SIGMA DESIGNS, INC. |
| |
|
|
|
|
|
|
|
|
|
|
|
|
By: |
/s/ Thinh Q. Tran |
|
|
|
|
Thinh Q. Tran |
|
|
|
|
|
|
|
|
|
President and Chief Executive Officer |
|
POWER OF ATTORNEY
KNOW ALL PERSONS BY THESE PRESENTS, that each person whose signature appears below constitutes and appoints Thinh Q. Tran and Elias N. Nader, and each of them, jointly and severally, his true and lawful attorneys-in-fact, each with full power of substitution and resubstitution, for him in any and all capacities, to sign any or all amendments to this Annual Report on Form 10-K, with all exhibits thereto and other documents in connection therewith, with the Securities and Exchange Commission, granting unto said attorneys-in-fact and agents, and each of them, full power and authority to do and perform each and every act and thing requisite and necessary to be done in connection therewith, as fully to all intents and purposes as he or she might or could do if personally present, hereby ratifying and confirming all that each said attorney-in-fact and agent, or his or her substitute or substitutes or any of them, may lawfully do or cause to be done by virtue hereof.
PURSUANT TO THE REQUIREMENTS OF THE SECURITIES ACT OF 1934, THIS ANNUAL REPORT ON FORM 10-K HAS BEEN SIGNED BY THE FOLLOWING PERSONS ON BEHALF OF THE OF THE REGISTRANT AND IN THE CAPACITIES AND ON THE DATES INDICATED:
|
Signature |
|
Title |
|
Date | ||||
|
|
|
|
|
| ||||
|
/s/ Thinh Q. Tran |
|
President, Chief Executive Officer and Director |
|
April 1, 2016 | ||||
|
Thinh Q. Tran |
|
(Principal Executive Officer) |
|
| ||||
|
|
|
|
|
| ||||
|
/s/ Elias N. Nader |
|
Chief Financial Officer and Secretary |
|
April 1, 2016 | ||||
|
Elias N. Nader |
|
(Principal Financial and Accounting Officer) |
|
| ||||
|
|
|
|
|
| ||||
|
/s/ Tor Braham |
Director |
|
April 1, 2016 | |||||
|
Tor Braham |
|
|
|
| ||||
|
/s/ J. Michael Dodson |
|
Lead Independent Director |
|
April 1, 2016 | ||||
|
J. Michael Dodson |
|
|
|
| ||||
|
|
|
|
|
| ||||
|
/s/ Martin Manniche |
|
Director |
|
April 1, 2016 | ||||
|
Martin Manniche |
|
|
|
| ||||
|
|
|
|
|
| ||||
|
/s/ Pete Thompson |
|
Director |
|
April 1, 2016 | ||||
|
Pete Thompson |
|
|
|
| ||||
SCHEDULE II—VALUATION AND QUALIFYING ACCOUNTS AND RESERVES
|
Classification |
Balance Beginning of Period |
Additions: Provision for (Recovery of) |
Deductions: (Write-offs) Recoveries of |
Balance End of Period |
||||||||||||
|
(in thousands) |
||||||||||||||||
| Allowance for returns, doubtful accounts and discounts: | ||||||||||||||||
|
Fiscal Years |
||||||||||||||||
|
2014 |
$ | 295 | 98 | (93 |
) |
300 | ||||||||||
|
2015 |
300 | $ | 1,257 | $ | (55 |
) |
$ | 1,502 | ||||||||
|
2016 |
$ | 1,502 | $ | 692 | $ | (192 |
) |
$ | 2,002 | |||||||
INDEX TO EXHIBITS
|
Exhibit Number |
|
Description |
|
Filed Herewith or Incorporated Herein by Reference to |
|
3.1 |
|
Second Restated Articles of Incorporation. |
|
Incorporated by reference to exhibit filed with the Registration Statement on Form S-1 (No. 33-17789) filed October 8, 1987, Amendment No. 1 thereto filed June 9, 1988 and Amendment No. 2 thereto filed June 14, 1988, which Registration Statement became effective June 14, 1988. |
|
|
|
|
|
|
|
3.2 |
|
Certificate of Amendment to the Second Restated Articles of Incorporation dated June 22, 2001. |
|
Incorporated by reference to exhibit 3.1 filed with the Registration Statement on Form S-8 (No. 333-64234) filed on June 29, 2001. |
|
|
|
|
|
|
|
3.3 |
|
Amended and Restated Bylaws of Sigma. |
|
Incorporated by reference to exhibit 3.1 filed with the Current Report on Form 8-K on August 3, 2012. |
|
|
|
|
|
|
|
3.4 |
|
Certificate of Determination of Preferences of Series A Preferred Stock dated June 13, 1997. |
|
Incorporated by reference to exhibit 3.3 filed with the Registrant’s Form S-1 filed on September 14, 2007. |
|
|
|
|
|
|
|
3.5 |
|
Certificate of Determination of Preferences of Series B Preferred Stock dated January 30, 1998. |
|
Incorporated by reference to exhibit 3.4 filed with the Registrant’s Form S-1 filed on September 14, 2007. |
|
|
|
|
|
|
|
3.6 |
|
Certificate of Determination of Preferences of Series C Preferred Stock dated January 20, 1999. |
|
Incorporated by reference to exhibit 3.5 filed with the Registrant’s Form S-1 filed on September 14, 2007. |
|
|
|
|
|
|
|
3.7 |
|
Certificate of Amendment to the Second Restated Articles of Incorporation dated January 28, 2008. |
|
Incorporated by reference to exhibit 3.7 filed with the Annual Report on Form 10-K filed on April 2, 2008. |
|
|
|
|
|
|
|
3.8 |
|
Amendment to By-Laws dated August 20, 2015. |
|
Incorporated by reference to exhibit 3.1 filed with the Current Report on Form 8-K on July 16, 2015. |
|
10.3* |
|
2001 Employee Stock Option Plan. |
|
Incorporated by reference to exhibit 4.1 filed with the Registration Statement on Form S-8 (333-64234) filed on June 29, 2001. |
|
10.4 |
|
Lease Agreement dated December 27, 2014 by and between Sigma Designs, Inc. and PLDSPE LLC. |
|
Incorporated by reference to exhibit 10.1 filed with the Current Report on Form 8-K filed on December 31, 2014. |
|
10.5 |
|
Industrial Lease by and between AMB Property, L.P. and Sigma dated February 22, 2007. |
|
Incorporated by reference to exhibit 10.15 filed with the Annual Report on Form 10-K for the fiscal year ended February 3, 2007. |
|
|
|
|
|
|
|
10. |
First Amendment to Lease Agreement entered into as of October 8, 2012 by and between Prologis, L.P. and Sigma Designs, Inc. |
Incorporated by reference to exhibit 10.1 filed with the Current Report on Form 8-K filed on October 12, 2012. | ||
|
10.7* |
|
Sigma Designs 2010 Employee Stock Purchase Plan. |
|
Incorporated by reference to exhibit 10.1 filed with the Current Report on Form 8-K filed on July 13, 2011. |
|
|
|
|
|
|
|
10.8* |
|
Amended and Restated 2009 Stock Incentive Plan and forms of agreements thereto. |
|
Incorporated by reference to exhibit 10.1 filed with the Current Report on Form 8-K filed on July 14, 2011. |
|
10.9* |
|
CopperGate Communications Ltd. 2003 Share Option Plan. |
|
Incorporated by reference to exhibit 99.1 filed with the Registration Statement on Form S-8 filed on November 16, 2009. |
|
|
|
|
|
|
|
10.11 |
|
Form of Director and Officer Indemnification Agreement. |
|
Incorporated by reference to exhibit 10.2 filed with the Current Report on Form 8-K filed on August 3, 2012. |
|
10.12* |
|
Sigma Designs 2015 Employee Stock Purchase Plan. |
|
Incorporated by reference to exhibit 10.1 filed with the Current Report on Form 8-K on August 24, 2015. |
|
10.13* |
|
Sigma Designs 2015 Stock Incentive Plan. |
|
Incorporated by reference to exhibit 10.2 filed with the Current Report on Form 8-K on August 24, 2015. |
|
10.14* |
|
Form of Executive Severance Agreement. |
|
Incorporated by reference to exhibit 10.1 filed with the Current Report on Form 8-K on July 16, 2015. |
|
2.1 |
|
Agreement and Plan of Merger dated November 4, 2015 by and between Sigma Designs, Inc., a California corporation, Torrey Acquisition Corp., a Delaware corporation and wholly owned subsidiary of Sigma Designs, Inc., Bretelon, Inc., a Delaware corporation, and Fortis Advisory, LLC, a Delaware limited liability corporation, as Stockholder Representative. |
|
Incorporated by reference to exhibit 2.1 filed with the Current Report on Form 8-K on November10, 2015. |
|
21.1 |
|
Subsidiaries of the Registrant. |
|
Filed herewith. |
|
|
|
|
|
|
|
23.1 |
|
Consent of Independent Registered Public Accounting Firm (Armanino LLP). |
|
Filed herewith. |
|
|
|
|
|
|
|
24.1 |
|
Power of Attorney (contained in the signature page to this Annual Report on Form 10-K). |
|
Filed herewith. |
|
|
|
|
|
|
|
31.1 |
|
Certification of the President and Chief Executive Officer pursuant to Securities Exchange Act Rules 13a-14(a) and 15d-14(a). |
|
Filed herewith. |
|
|
|
|
|
|
|
31.2 |
|
Certification of the Chief Financial Officer and Secretary pursuant to Securities Exchange Act Rules 13a-14(a) and 15d-14(a). |
|
Filed herewith. |
|
|
|
|
|
|
|
32.1** |
|
Certificate of Chief Executive Officer pursuant to 18 U.S.C. Section 1350, as adopted pursuant to Section 906 of the Sarbanes-Oxley Act of 2002. |
|
Filed herewith. |
|
|
|
|
|
|
|
32.2** |
|
Certificate of Chief Financial Officer pursuant to 18 U.S.C. Section 1350, as adopted pursuant to Section 906 of the Sarbanes-Oxley Act of 2002. |
|
Filed herewith. |
|
|
|
|
|
|
|
101.INS |
|
XBRL Instance. |
|
|
|
|
|
|
|
|
|
101.SCH |
|
XBRL Taxonomy Extension Schema. |
|
|
|
|
|
|
|
|
|
101.CAL |
|
XBRLTaxonomy Extension Calculation. |
|
|
|
|
|
|
|
|
|
101.DEF |
|
XBRL Taxonomy Extension Definition. |
|
|
|
|
|
|
|
|
|
101.LAB |
|
XBRL Taxonomy Extension Labels. |
|
|
|
|
|
|
|
|
|
101.PRE |
|
XBRL Taxonomy Extension Presentation. |
|
|
|
* |
Indicates management contract or compensatory plan or arrangement. |
|
** |
In accordance with Item 601(b)(32)(ii) of Regulation S-K and SEC Release No. 34-47986, the certifications furnished in Exhibits 32.1 and 32.2 hereto are deemed to accompany this Form 10-K and will not be deemed “filed” for purposes of Section 18 of the Exchange Act. |
101