Attached files
| file | filename |
|---|---|
| EX-21.1 - EXHIBIT 21.1 - SIGMA DESIGNS INC | ex21-1.htm |
| EX-32.2 - EXHIBIT 32.2 - SIGMA DESIGNS INC | ex32-2.htm |
| EX-31.1 - EXHIBIT 31.1 - SIGMA DESIGNS INC | ex31-1.htm |
| EX-31.2 - EXHIBIT 31.2 - SIGMA DESIGNS INC | ex31-2.htm |
| EX-32.1 - EXHIBIT 32.1 - SIGMA DESIGNS INC | ex32-1.htm |
| EX-23.1 - EXHIBIT 23.1 - SIGMA DESIGNS INC | ex23-1.htm |
UNITED STATES
SECURITIES AND EXCHANGE COMMISSION
Washington, D.C. 20549
FORM 10-K
(Mark One)
x Annual Report pursuant to Section 13 or 15(d) of the Securities Exchange Act of 1934
For the fiscal year ended: January 30, 2010
OR
¨ Transition Report pursuant to Section 13 or 15(d) of the Securities Exchange Act of 1934
For the transition period from to .
Commission File Number 001-32207
SIGMA DESIGNS, INC.
(Exact name of Registrant as specified in its charter)
|
California
|
94-2848099
|
|
(State or other jurisdiction of incorporation or organization)
|
(I.R.S. Employer Identification Number)
|
|
1778 McCarthy Boulevard Milpitas, California
|
95035
|
|
(Address of principal executive offices)
|
(Zip code)
|
Registrant’s telephone number, including area code: (408) 262-9003
Securities registered pursuant to Section 12(b) of the Act:
|
Title of each class
|
Name of each exchange on which registered
|
|
|
Common Stock, no par value
|
The NASDAQ Stock Market LLC
|
Securities registered pursuant to Section 12(g) of the Act: None
Indicate by check mark if the registrant is a well-known seasoned issuer, as defined in Rule 405 of the Securities Act.
Yes ¨ No x
Indicate by check mark if the registrant is not required to file reports pursuant to Section 13 or Section 15(d) of the Act.
Yes ¨ No x
Indicate by check mark whether the registrant (1) has filed all reports required to be filed by Section 13 or 15(d) of the Securities Exchange Act of 1934 during the preceding 12 months (or for such shorter period that the registrant was required to file such reports), and (2) has been subject to such filing requirements for the past 90 days. Yes x No ¨
Indicate by check mark whether the registrant has submitted electronically and posted on its corporate Web site, if any, every Interactive Data File required to be submitted and posted pursuant to Rule 405 of Regulation S-T during the preceding 12 months (or for such shorter period that the registrant was required to submit and post such files). Yes ¨ No ¨
Indicate by check mark if disclosure of delinquent filers pursuant to item 405 of Regulation S-K is not contained herein, and will not be contained, to the best of registrant’s knowledge, in definitive proxy or information statements incorporated by reference in Part III of this Form 10-K or any amendment to this Form 10-K. x
Indicate by check mark whether the registrant is a large accelerated filer, an accelerated filer, a non-accelerated filer or a smaller reporting company. See definition of “large accelerated filer”, "accelerated filer" and "smaller reporting company” in Rule 12b-2 of the Exchange Act. (Check one):
Large accelerated filer ¨ Accelerated filer x Non-accelerated filer ¨ Smaller reporting company ¨
Indicate by check mark whether the registrant is a shell company (as defined in Rule 12b-2 of the Act).
Yes ¨ No x
The aggregate market value of the registrant’s common stock, no par value, held by non-affiliates of the registrant on July 31, 2009, the last business day of the registrant’s most recently completed second fiscal quarter, was approximately $433,037,000 based on the closing sale price of $16.18 per share on that date. Shares of common stock held by each executive officer, director and shareholders known by the registrant to own 10% or more of the registrant’s outstanding common stock based on Schedule 13G or 13D filings and other information known to the registrant, have been excluded because such persons may be deemed to be affiliates. This determination of affiliate status is not necessarily a conclusive determination for other purposes.
There were 30,991,009 shares of the Registrant’s Common Stock outstanding on March 5, 2010.
DOCUMENTS INCORPORATED BY REFERENCE
Part III incorporates by reference information from the registrant’s proxy statement to be filed with the Securities and Exchange Commission in connection with the solicitation of proxies for the Registrant’s 2010 Annual Meeting of Shareholders to be filed on or before May 28, 2010.
Sigma Designs, Inc.
2010 ANNUAL REPORT ON FORM 10-K
TABLE OF CONTENTS
|
Page No
|
||
|
PART I
|
||
|
Item 1.
|
Business
|
5
|
|
Item 1A.
|
Risk Factors
|
16
|
|
Item 1B.
|
Unresolved Staff Comments
|
28
|
|
Item 2.
|
Properties
|
28
|
|
Item 3.
|
Legal Proceedings
|
29
|
|
Item 4.
|
(Reserved and Removed)
|
29
|
|
PART II
|
||
|
Item 5.
|
Market for the Registrant’s Common Equity, Related Shareholder Matters and Issuer Purchases of Equity Securities
|
30
|
|
Item 6.
|
Selected Consolidated Financial Data
|
31
|
|
Item 7.
|
Management’s Discussion and Analysis of Financial Condition and Results of Operations
|
32
|
|
Item 7A.
|
Quantitative and Qualitative Disclosures About Market Risk
|
48
|
|
Item 8.
|
Financial Statements and Supplementary Data
|
50
|
|
Item 9.
|
Changes in and Disagreements with Accountants on Accounting and Financial Disclosure
|
80
|
|
Item 9A.
|
Controls and Procedures
|
80
|
|
Item 9B.
|
Other Matters
|
81
|
|
PART III
|
||
|
Item 10.
|
Directors, Executive Officers of the Registrant and Corporate Governance
|
82
|
|
Item 11.
|
Executive Compensation
|
82
|
|
Item 12.
|
Security Ownership of Certain Beneficial Owners and Management and Related Shareholder Matters
|
82
|
|
Item 13.
|
Certain Relationships and Related Transactions and Director Independence
|
82
|
|
Item 14.
|
Principal Accounting Fees and Services
|
82
|
|
PART IV
|
||
|
Item 15.
|
Exhibits and Financial Statement Schedules
|
83
|
|
Signatures
|
84
|
|
3
FORWARD-LOOKING INFORMATION
Throughout this report, we refer to Sigma Designs, Inc., together with its subsidiaries, as “we,” “us,” “our” or “Sigma.”
This Form 10-K for the year ended January 30, 2010 contains forward-looking statements that involve risks and uncertainties. The forward-looking statements are contained principally in the sections entitled "Risk Factors," "Management's Discussion and Analysis of Financial Condition and Results of Operations" and "Business.” These statements involve known and unknown risks, uncertainties and other factors which may cause our actual results, performance or achievements to be materially different from any future results, performances or achievements expressed or implied by the forward-looking statements. Forward-looking statements include, but are not limited to, statements about:
|
|
•
|
anticipated trends and challenges in our business and the markets in which we operate;
|
|
|
•
|
our expectations regarding our expenses and international sales;
|
|
|
•
|
plans for future products and services and for enhancements of existing products and services;
|
|
|
•
|
our plans relating to the CopperGate Communications Ltd. products and technology that we recently acquired;
|
|
|
•
|
our research and development;
|
|
|
•
|
our ability to attract and retain employees;
|
|
|
•
|
our anticipated cash needs and our estimates regarding our capital requirements and our needs for additional financing;
|
|
|
•
|
our anticipated growth strategies;
|
|
|
•
|
our intellectual property;
|
|
|
•
|
our ability to attract customers; and
|
|
|
•
|
sources of new revenue.
|
In some cases, you can identify forward-looking statements by terms such as "may," "might," "will," "objective," "intend," "should," "could," "can," "would," "expect," "believe," "estimate," "predict," "potential," "plan," or the negative of these terms, and similar expressions intended to identify forward-looking statements. These statements reflect our current views with respect to future events and are based on assumptions and subject to risks and uncertainties. Given these uncertainties, you should not place undue reliance on these forward-looking statements. We discuss many of these risks in this Form 10-K in greater detail under the heading "Risk Factors.” Also, these forward-looking statements represent our estimates and assumptions only as of the date of this Form 10-K. Unless required by U.S. federal securities laws, we do not intend to update any of these forward-looking statements to reflect circumstances or events that occur after the statement is made.
You should read this Form 10-K and the documents that we reference in this Form 10-K completely and with the understanding that our actual future results may be materially different from what we expect. We qualify all of our forward-looking statements by these cautionary statements.
4
PART I
ITEM 1. BUSINESS
Overview
We are a leading fabless provider of highly integrated system-on-chip, or SoC, solutions that are used to deliver multimedia entertainment throughout the home. We currently offer four separate product lines: media processors, home networking solutions, video image processors and home automation solutions. Each of these product lines also contributes to increasing our ability to integrate more functionality into our SoC offerings.
Products
Our media processor product line represents a family of SoC solutions that combine our semiconductors and software and are a critical component of multiple consumer applications that process digital video and audio content, including internet protocol television, or IPTV, connected media players and portable media players. Our media processors provide high definition digital video decoding for multiple compression standards, graphics acceleration, audio decoding and display control. Our software provides control of media processing and system security management. Together, our media processor semiconductors and software form a complete SoC solution that we believe provides our customers with a foundation to quickly develop feature-rich consumer entertainment products.
On November 10, 2009, we acquired CopperGate Communications Ltd., or CopperGate. CopperGate is a leading provider of home networking technology consisting of silicon-based modem solutions enabling distribution of media-rich digital content over all three types of wires in the home: coax, phone and power. CopperGate solutions are deployed by service providers such as AT&T enabling the delivery within the home of high definition TV, or HDTV, voice over internet protocol, or VoIP and fast internet services. With the CopperGate acquisition, we are now a leading supplier of home entertainment and broadband access semiconductors with over 30 service providers globally in deployment. Our HomePNA technology is one of the most broadly deployed solutions for IPTV among service providers.
Our home networking product line consists of our wired networking solutions based on HomePNA and HomePlug AV standards, and wireless connectivity solutions based on Ultra-wideband, or UWB technology. HomePNA and HomePlug AV are the leading standards and technologies used for transferring internet protocol content across coax cables, phone lines and power lines. Our wired connectivity product-line, sold under the CopperGate brand, enables internet protocol, or IP communication across phone lines, coax cables and power lines in order to enable service providers such as telecommunication carriers, cable operators and satellite providers to deliver IPTV solutions and other media-rich applications such as HDTV, VoIP and fast internet throughout the home. Our wireless UWB product line, sold under the CoAir and Windeo brands, provides a high bandwidth radio frequency, or RF, communication solution based on the WiMedia standard to enable connectivity of high definition video and audio signals primarily for convenience of interconnecting TVs, PCs and other consumer electronic products.
Our video image processor product line, sold under the VXP brand, consists of standalone high performance semiconductors that provide studio-quality video output for professional and prosumer applications. These applications include audio video receivers, broadcast studios, digital cinema, digital signage, front-projection home theatre televisions, HDTV, medical imaging and video conferencing systems. Our VXP product line targets the prosumer and industrial audio/video markets while the technology, integrated into our SoCs, provides a substantial feature enhancement for mainstream consumer applications.
Our home automation product line consists of wireless transceiver devices along with a mesh networking protocol sold under the Z-Wave brand name. Our Z-Wave products utilize a low-bitrate, low-power, low-cost RF communication technology that provides an interoperable or connected home security, monitoring and automation solution, or SMA.
Target Markets
Our primary target markets are IPTV, connected home technologies, connected media player as well as prosumer and industrial audio/video. The IPTV market consists of consumer and commercial products that distribute and receive streaming video using internet protocol. The connected home technologies market is served by our home networking and home automation product lines. Our home networking products are used in IPTV set-top boxes as well as residential gateways, optical network terminals, multi-dwelling unit, or MDU masters and network adapters. Our home automation products are used in a wide variety of home control products such as thermostats, light switches and door locks. Our UWB products target high definition audio/video, or HDAV, speaker and home networking solutions over coax and wireless. The connected media player market consists primarily of digital media adapters, portable media devices and Blu-ray DVD players that perform playback of digital media stored on optical or hard disk formats. The prosumer and industrial audio/video market consists of studio quality audio/video receivers and monitors, digital projectors and medical video monitors. We also sell products into other markets such as the HDTV, PC-based add-in and connectivity markets. We derive minor net revenue from sales of our products into these other markets.
5
We target the connected home technologies market with our CopperGate, Z-Wave and UWB products. To date, we have not generated significant revenue from our UWB products.
We believe we are the leading provider of digital media processor SoCs as well as home network chipsets for set-top boxes in the IPTV market in terms of units shipped. Our products are used by leading IPTV set-top box providers, such as Cisco Systems/Scientific-Atlanta, Motorola, Netgem and UTStarcom. IPTV set-top boxes incorporating our chipsets are deployed by telecommunications carriers globally including carriers in Asia, Europe and North America such as AT&T, Deutsche Telekom and Freebox. We work with these carriers and set-top box providers as well as with systems software providers, such as Microsoft, to design solutions that address the carriers' specific requirements for features and performance.
Our media processor products are also used by consumer electronics providers, such as Netgear, Sharp, Sony and Western Digital, in applications such as digital media adaptors, or DMAs, Blu-ray DVD players, HDTVs and other connected media player devices. Our CopperGate products are used by leading IPTV set-top box and residential gateway providers, such as 2Wire, Cisco Systems/Scientific-Atlanta and Motorola. These solutions are deployed by telecommunications carriers globally, but primarily in North America, such as AT&T, Telus and Bell Aliant. Our VXP video image processor products are one of the leading solutions for studio-quality video image processing and are used by leading industry participants such as Polycom, Sony, Harris and Panasonic. Our Z-Wave home automation products are used by leading industry participants such as Danfoss, Ingersoll-Rand (Schlage), Leviton and Trane.
We have been providing video and audio semiconductor solutions for over 15 years. We began volume shipments in January 2006 of our SMP8630 series, our fourth generation SoC solution serving the IPTV, connected media player and HDTV markets and began initial shipments of our next generation SMP8650 series in January 2009.
Industry Background
The growth of the internet, proliferation of rich multimedia content, advances in communications infrastructure, digital video and audio compression technologies, home networking technologies, and improvements in television displays have resulted in significant demand for the applications that we primarily target, which are IPTV, connected home technologies, connected media player, prosumer and industrial audio/video and HDTVs.
The IPTV market consists of service providers, primarily telecommunication service providers, who utilize video servers and set-top box clients to deliver television services based on streaming video using IP. IPTV has emerged as an important consumer multimedia application as it allows telecommunications carriers to deliver advanced video services to consumers using existing telecommunications infrastructure. These carriers are actively pursuing the deployment of IPTV because it enables them to offer attractive video, voice and data, or triple play, services and increase their revenue per subscriber. The key challenge faced in delivering high-quality video content to end users across existing copper-based telecommunications infrastructure is limited by the data carrying capacity of the wiring. This challenge is addressed by advanced video compression technologies along with advanced high speed communication technologies, which together overcome the capacity limitation to allow the delivering of high definition video service throughout the home. Currently, IPTV set-top boxes use one of two platforms based on software developed by either Microsoft or various Linux providers, each of which offers certain advantages and disadvantages.
The connected home market consists of a range of set-top boxes, residential gateways, optical network terminals, MDU masters and network adapters. These devices are all involved in routing digital entertainment streams to ensure that television service and other shared media resources are accessible throughout the home. Currently, the vast majority of home networking uses wired connections to distribute entertainment streams under one of the many standards that exist. As consumers begin to demand more from their viewing experience, we believe the ability to deliver these technologies within the home will be critical to a successful solution. Home automation products address remote control of a wide variety of home appliances, such as thermostats, lighting and door locks. The home control and automation market continues to experience increasing consumer awareness and adoption, although current worldwide penetration rates remain low. Much of the early adoption for this technology has come from usage in new home construction. We believe potential deployment by an increasing number of larger system integrators and service providers in the future could drive a cycle of broader adoption. The functionality provided by the low frequency, low power solutions in this market can offer consumers cost efficient ways to monitor and conserve energy usage, protect homes from theft and damage and improve the convenience of performing certain household activities.
The connected media player market consists of DMAs, Blu-ray players and portable players. We believe the demand for DMAs is continuing to gradually increase as these products are becoming easier for consumers to use and increased bandwidth within homes facilitates movie downloading. The increased demand for Blu-ray DVD players is driven primarily by the superior video and audio quality they provide relative to standard definition DVD players, the increasing availability of high definition prerecorded content, the proliferation of HDTVs enabling display of this content and the steadily declining prices of the Blu-ray DVD players and the HDTVs themselves. Portable players remain popular in selected foreign markets, but have yet to gain popularity in the U.S.
6
The prosumer and industrial audio/video market consists of studio quality audio/video receivers and monitors, digital projectors and medical video monitors. We believe demand for improved video image processing continues to increase from both industrial customers and consumers focused on high-end products, or prosumers. These industrial and prosumer customers are increasingly expecting high-definition images, DVD content that looks like high-definition, and high quality online images. As a result, we believe standalone and integrated video image processors are likely to be incorporated into an increasing number of video-centric products over time.
The proliferation of HDTVs is being driven by consumer demand for higher quality video, increasing availability of higher definition content, improved television displays, declining prices and various mandates to shift from analog to digital broadcast worldwide. This is creating an opportunity for SoC suppliers to provide technology that enables consumers to enjoy multi-format content on their HDTVs, including content from internet, stored video sources and Blu-ray players.
The consumer multimedia entertainment applications that we target increasingly require video and audio data to be processed, transmitted, stored and displayed in an efficient and secure manner while simultaneously maintaining high resolution, multi-channel video and audio and providing the end-user a variety of interactive options. In order to provide this increased functionality in a cost-effective manner, manufacturers of consumer electronics demand semiconductors that integrate more features on a single chip as well as reduce their costs, time-to-market and power consumption. We believe the challenge to manufacturers of digital media processor SoCs is to balance the integration of more functionality with lower costs and shorter development cycles.
Our Solutions
We provide SoC solutions that consist of highly integrated semiconductors and a rich suite of software that enables real-time processing of digital video and audio content, which we refer to as real-time software. Our real-time software is readily customizable by our customers and is interoperable with multiple standard operating systems. As a result, we believe our SoC solutions enable consumer multimedia devices to be quickly brought to market. We believe IPTV set-top box and connected media player designers and consumer device manufacturers select our SoC solutions because of the compelling nature of their performance and ease of integration. Our highly integrated products have replaced a number of single function semiconductors with a multi-function SoC, which significantly improves performance and lowers power consumption and cost.
We believe our SoCs have been able to deliver industry-leading performance in video decoding, graphics acceleration and audio decoding, which allows our customers to offer consumers a high-quality viewing experience. We surround this media processing functionality with a robust security management solution, an on-chip CPU, a high-speed memory interface and complementary system peripherals. Our VXP line of video image processors complements this core capability with studio-quality video. Currently, our VXP devices can be used by our customers either as standalone products or in combination with products that we sell into our other target markets, such as our SoCs for IPTV, connected media players and HDTV. We plan to integrate our VXP technology into future versions of our other SoCs designed primarily for other target markets. This SoC architecture with memory components establishes a complete hardware development platform for our target applications. We also offer a suite of real-time software that reduces the complexity of our SoC architecture and enables our customers to quickly design consumer multimedia devices. Our software includes an industry standard operating system, embedded software tools and development kits that enable our customers to easily port their software to run on our processors.
Our connected home products are designed to provide connectivity solutions between various home entertainment products and incoming video/audio streams. We believe these connectivity solutions give consumers additional connection choices with greater flexibility and allow system integrators and service providers an opportunity to reduce their time and cost of home networking installations. Our Z-Wave products are designed to offer consumers advanced automation and control functionality, such as energy management, security and environmental monitoring, within new and existing homes.
Our Strengths
We have internally developed the core technologies, expertise and capabilities necessary to provide a complete SoC solution that includes media processing and communications. We believe we have the following strengths:
7
|
|
•
|
Strong Position within IPTV and Connected Media Player Markets. We believe we are the leading provider of digital media processor SoCs for set-top boxes in the IPTV market in terms of units shipped and a high quality provider of such SoCs in the connected media player market. We have built this position, in part, by being one of the first media processing semiconductor providers to work extensively with IPTV set-top box manufacturers as well as telecommunications carriers to design solutions that address their specific feature and performance requirements. Additionally, through our CopperGate acquisition, we have added a team that delivers the leading IPTV connectivity solution for set-top boxes and residential gateways. Through this process, we have gained valuable insight into the challenges of our customers and carriers and have gained visibility into their product development plans. As a result, we believe we are able to provide our customers with a stable and reliable source of field-proven solutions that our competitors cannot easily replicate.
|
|
|
•
|
Highly Integrated SoC Leveraged Across Multiple Consumer Applications. We have developed a proprietary SoC architecture that allows us to integrate high-performance digital video and audio decoding, graphics processing, security management and now, home audio/video networking. Our SoCs can replace a number of single function semiconductors, which significantly improves performance and lowers power consumption and cost to our customers. Furthermore, all of these functions can be performed synchronously at high processing speeds, typically beyond 400 Megahertz. Our ability to integrate these multiple functions into a single, high-speed semiconductor allows us to address many different consumer multimedia entertainment applications with the same hardware platform.
|
|
|
•
|
Differentiated Software Development Capabilities. As a result of our over 15 years of experience in delivering video and audio solutions, we have developed expertise in real-time software that synchronizes and controls the playback of video and audio from a variety of sources. This software translates the complex silicon architecture of our SoCs into a much simpler application programming interface. Using this interface, our customers are able to program under industry standard operating systems, enabling them to easily customize our solutions and reduce their time to market. The majority of our engineering personnel are dedicated to software development.
|
|
|
•
|
Multi-Standard Functionality. Our SoC solutions are designed to support multiple industry standards that are used in the consumer applications we target. For example, there are over a dozen different video and audio standards used in current consumer applications, including video standards such as H.264, MPEG-4, MPEG-2, MPEG-1 and WMV9, and audio standards such as Dolby, DTS and MP3. Beyond this, there are a range of digital rights management security standards such as AES, RSA and MSDRM. Additionally, there are two primary operating systems, Microsoft Windows CE and Linux, each of which has its own middleware standards. We support all of these standards.
|
|
|
|
|
•
|
Breadth and Depth of Relationships within the set-top box industry and IPTV Ecosystem. In order to provide a complete system-level solution for the IPTV market, we have developed strong relationships with industry leaders that form the ecosystem required to deliver an end-to-end solution, from content creation to content display. The IPTV ecosystem consists of providers of middleware, encoders and security solutions. For middleware and server software, interoperability with products provided by Alcatel and Microsoft, among others, is required. For encoders, providers such as Harmonic, Tandberg and Modulus Video (now part of Motorola) must design products that operate compatibly with digital media processors such as ours. For security solutions, there are also a range of providers, including Microsoft, Nagra and NDS. Our strong position in the IPTV market has enabled us to develop and maintain relationships with these providers and offer solutions that are interoperable with their products.
|
Our Strategy
Our objective is to be the leading provider of SoC solutions used to deliver entertainment and control throughout the home. To achieve this objective, we expect to continue to pursue the following strategies:
|
|
•
|
Extend our Leadership Position in the IPTV Market. We have achieved a significant share in the IPTV market by providing our customers with highly integrated digital media processor SoCs as well as high bandwidth network devices that provide the home connectivity. In addition, our solutions work effectively across different platforms and standards in this market. Furthermore, we intend to target some of the largest cable multiple system operators as a part of their anticipated technology transition to tru2way and IPTV delivery. Tru2way is a trademark of CableLabs, which is used to describe the delivery of interactive digital cable services over the cable video network. We intend to provide the most compelling integrated digital media processing solutions to our customers and support multiple standards in this end market in order to maintain our high market share in the IPTV market as well as extend our product strengths into the next generation of set-top boxes for the cable industry.
|
|
|
•
|
Enhance our Software Development Advantage. We believe our software provides a suite of capabilities that are not currently available from our competitors. Our software is integrated and embedded into our customers' products during their product design stage. As a result, once we are designed into our customers' product, we believe it is difficult for our competitors to displace us. We intend to leverage our software development capabilities and continue to invest significant resources in recruiting and developing additional expertise in the area of high-performance software development.
|
8
|
|
•
|
Increase Penetration in Connected Media Players. We have successfully developed a strong position in the digital media adapter market as well as other related consumer products. Our SoC solutions incorporate both hardware and software elements that enable access of internet content and interoperability with a wide range of software environments such as Adobe Flash, Google Android, Netflix and many others. We believe our software, which fully supports the various standards and technologies required to provide internet connectivity and networking functionality, differentiates us from our competitors. We intend to leverage our semiconductor and software expertise to develop additional SoC solutions targeted specifically towards this growing range of applications.
|
|
|
•
|
Expand into Complementary Technologies and Products. We will continue to evaluate opportunities to expand, whether through acquisition or internal development, into technologies and products that are complementary to the applications we currently target. In November 2009, we acquired CopperGate, a privately held company in Israel that develops silicon-based modem solutions enabling distribution of media-rich digital content over phone lines, coax cables and power lines inside the home. In December 2008, we acquired Zensys Holdings Corporation, a privately held company that developed the Z-Wave brand of RF devices that have demonstrated significant penetration into the home control market. We believe that the Z-Wave home control products will enable us to offer another layer to our value proposition to telecommunications and cable operators, thus helping us to differentiate our complete solution as competition in the marketplace increases. In February 2008, we acquired certain assets of the VXP Group from Gennum Corporation. We intend to leverage the VXP image processing technology and skilled VXP design team to expand into the professional video market and add broadcast studio quality capability to our product offerings for high-volume consumer applications in set-top boxes for IPTV, connected media players and HDTVs. In 2006, we acquired Blue7, a developer of advanced UWB technologies, in order to extend our product offerings into wireless solutions for the home entertainment environment. We believe that the combination of wireless communication technologies with our existing media processing SoC solutions will enable us to increase the value we deliver to our customers.
|
|
|
•
|
Leverage Existing Partner and Customer Relationships. We have developed partnerships with standards and platform defining entities like Microsoft which enable us to win new customers effectively. We also have strong customer relationships with many IPTV set-top box and connected media player designers and consumer device manufacturers. We also work closely with telecommunications carriers to understand their needs in advance of our customer’s product development cycle. We intend to leverage our existing position with our partners and customers to identify and secure new market opportunities.
|
Our Products
We offer SoCs along with software, that enable solutions for consumer entertainment products. We believe our line of digital media processor SoCs features industry leading performance and video/audio quality. We complement our media processor SoCs with a suite of real-time software that enables synchronous processing of video, audio and graphics streams for a wide range of applications. These SoCs are enhanced by the addition of various connectivity solutions including HomePNA, HomePlug AV, Z-Wave and others. Our software is currently available under Microsoft WinCE and Linux operating systems with support for applications such as IP video streaming, video-on-demand, Blu-Ray and DVD navigation, personal-video-recording, multi-window video and terrestrial broadcast reception. In addition, we provide reference platforms designed around our silicon and software as a convenient basis for customer development.
The following table sets forth the key performance features of, and target applications for, selected SoCs in our suite of products:
9
|
Product Series
|
Key Performance Features
|
Target Applications
|
|
SMP8650
High performance, fully integrated SoC - our second generation secure digital media processor aimed at the IPTV and set-top box market.
|
•
|
High-definition multi-stream video decoding of MPEG-4.10 (H.264), SMPTE 421M (VC-1), WMV9, MPEG-4.2 and MPEG-2
|
• IPTV set-top boxes
• Cable set-top boxes
• Digital media adapters
|
||
| • |
Secure media processing with a wide variety of Digital Rights Management, or DRM and Conditional Access, or CA
|
||||
|
•
|
Programmable audio decoding with support for all audio formats
|
||||
|
•
|
High performance 2D graphics acceleration with alpha blending and scaling, and 3D graphics on some versions
|
||||
|
•
|
Display output control including de-interlacing, HDMI and NTSC/PAL
|
||||
|
•
|
Increased CPU performance (500 MHz) along with expanded system connectivity interfaces (Ethernet, USB, SATA, IR, IIC)
|
||||
|
SMP8640
High performance, fully integrated SoC - our second generation secure digital media processor aimed at the Blu-ray and set-top box market.
|
•
|
High-definition multi-stream video decoding of MPEG-4.10 (H.264), SMPTE 421M (VC-1), WMV9, MPEG-4.2 and MPEG-2
|
• IPTV set-top boxes
• Cable set-top boxes
• Blu-ray players/recorders
|
||
|
•
|
Secure media processing with a wide variety of Digital Rights Management, or DRM and Conditional Access, or CA
|
||||
|
•
|
Programmable audio decoding with support for all audio formats
|
||||
|
•
|
High performance 2D graphics acceleration with alpha blending and scaling
|
||||
|
•
|
Display output control including de-interlacing, HDMI and NTSC/PAL
|
||||
|
•
|
Increased CPU performance (667 MHz) along with expanded system connectivity interfaces (Ethernet, USB, SATA, IR, IIC, SD Card)
|
||||
|
SMP8630
High definition, fully integrated, secure digital media processor SoC - our leading product for IPTV and Blu-ray player markets.
|
•
|
High-definition multi-stream video decoding of MPEG-4.10 (H.264), SMPTE 421M (VC-1), WMV9, MPEG-4.2 and MPEG-2
|
• IPTV set-top boxes
• Blu-ray players/recorders
• HDTV
|
||
|
•
|
Secure media processing with a wide variety of Digital Rights Management, or DRM and Conditional Access, or CA
|
||||
|
•
|
Programmable audio decoding with support for all audio formats
|
||||
|
•
|
High performance 2D graphics acceleration with alpha blending and scaling
|
||||
|
•
|
Display output control including de-interlacing, HDMI and NTSC/PAL
|
||||
|
•
|
Integrated high performance CPU (333 MHz) and system connectivity interfaces (Ethernet, USB, IDE, IR, IIC)
|
10
|
EM8620L
High definition digital media processor SoC - our mid-range product for multi-format applications.
|
•
|
High-definition decoding of MPEG-4.10 (H.264), SMPTE 421M (VC-1), WMV9, MPEG-4.2 and MPEG-2
|
• IPTV set-top boxes
• Digital media adapters
• HDTV
|
||
| • |
Selected DRM decryption support
|
||||
|
•
|
Programmable audio decoding with support for all formats
|
||||
|
•
|
2D graphics acceleration with alpha-blending and scaling
|
||||
|
•
|
Display output control including de-interlacing and NTSC/PAL
|
||||
|
•
|
Integrated CPU, Ethernet, and IDE
|
||||
|
CoAir®
UWB dual chip solution - for A/V streaming over ethernet and coax cable, currently in customer sampling phase.
|
•
|
Based on the WiMedia® Alliance Multi-band OFDM (MBOA) PHY v1.1 and MAC v1.0 Specifications and is comprised of two devices: CoAir® RF IC (BW110) and CoAir® Baseband IC (BW401)
|
• IPTV set-top boxes
• Cable and satellite set-top boxes
• Digital media adapters
• PCs and peripherals
|
||
|
•
|
Enables adding high-speed wireless, Ethernet, and coax access to the next generation of consumer electronics products
|
||||
|
Windeo®
UWB dual chip solution - for high bandwidth wireless AV streaming applications.
|
•
|
Based on the WiMedia® Alliance Multi-band OFDM (MBOA) PHY v1.1 and MAC v1.0 Specifications and is comprised of two devices: Windeo® RF IC (BW102) and Windeo® Baseband IC (BW201)
|
• IPTV set-top boxes
• Blu-ray players/recorders
• HDTV
• Digital media adapters
|
||
|
•
|
Enables adding high-speed wireless access to the next generation of consumer electronics products
|
||||
|
GF9450
VXP® Studio broadcast quality 12 bit or 10 bit dual input and single or dual output image processor aimed at high end and professional markets.
|
•
|
Provides VXP® Visual Excellence image processing for up to 2k x 2k dual images with full processing on both image inputs and full picture in picture capability and for up to 4k x 2k single images
|
• High end HDTVs
• Home Theatre
• AV Receivers
• Broadcast
• Video Conferencing
• Medical Monitors
• Digital Cinema
|
||
| • | High quality motion and speed adaptive de-interlacing for progressive displays | ||||
|
•
|
Advanced film mode detection and compensation
|
||||
|
•
|
Adaptive 2D and 3D noise reduction
|
||||
|
•
|
Compression artifact reduction for both mosquito noise and block artifacts
|
||||
|
•
|
Adaptive detail enhancement with separate texture enhancement and control
|
||||
|
•
|
Adaptive contrast enhancement
|
||||
|
•
|
Frame rate conversion with full support for GENLOCK and frame-lock operation
|
||||
|
•
|
Comprehensive video and graphics standards support with automatic detection and adaptation
|
11
|
ZW0301
Z-Wave single-chip
Wireless controller
|
•
|
Enables adding Z-Wave® control and status capabilities to RF remote controls, set-top boxes, CE products, and home automation, home security monitoring and home energy management products.
|
• RF remote control
• Home automation
• Home security
• Home monitoring
• Home energy management
|
||
|
•
|
Wireless mesh technology eliminates RF dead spots in the home | ||||
|
•
|
Low power consumption for long battery life
|
||||
|
•
|
Seamless interoperability between multiple vendors and applications
|
||||
|
•
|
Integration of home, entertainment, security and energy management control
|
|
CG2110
Based on the HomePlug AV standard for demanding video, audio, data, and voice applications over the power line media.
|
•
•
|
Compliant with HomePlug® AV Version 1.1
Environmentally-friendly technology integrates innovative features for reduced energy consumption
|
• Ethernet Bridges
• Broadband and Media Gateways
• Ethernet Bridges
|
||
|
•
|
PHY rate up to 200 Mbps, Up to 80 Mbps effective throughput | ||||
|
•
|
128-bit AES encryption with key management | ||||
|
•
|
Enhanced Quality of Service (QoS) with programmable classification filters | ||||
|
•
|
Remote management and diagnostics for faster installation
|
||||
|
CG3010, CG3110 and CG3210
Based on the ITU G.9954 standard
(HomePNA 3.1 specification), the CG3x family is the ideal solution for multimedia whole-home networking products; enabling “triple play” service distribution of IPTV, VoIP and high-speed internet data over existing phone wires and coax cables.
|
•
•
•
|
PHY layer rate up to 320 Mbps over standard coax cables, 160 Mbps over standard phone wires
Up to 210 Mbps effective throughput (payload)
Guaranteed and prioritized QoS
|
• IPTV set-top boxes
• Broadband and Media Gateways
• Ethernet Bridges
• MDU access systems
|
||
|
•
|
Multi-band operation
|
||||
|
•
|
Complies with ITU G.9954, HomePNA 3.1
|
||||
|
•
|
Same product supports both Master and End-Point applications
|
||||
|
•
|
Support for remote and local management and diagnostics
|
||||
|
•
|
Low power consumption
|
Our SoCs accounted for 99%, 99% and 98% of our net revenue for fiscal 2010, 2009 and 2008, respectively.
The CG2110, CG3010, CG3110, CG3210 and other home networking devices were added to our product suite as a result of the CopperGate acquisition completed in November 2009. The VXP9450 and Z-Wave product series were added to our product suite as a result of the VXP and Zensys acquisitions completed in February 2008 and December 2008, respectively.
Complementing our semiconductor platforms, the following software elements perform the essential control and processing functions that are common to most consumer entertainment devices:
12
|
|
•
|
Multimedia Library: This software forms the basis of the on-chip media processing control of our SoCs and is essential to the operation of our SoCs. We provide this software in the form of a large suite of interactive library functions that together create the real-time control center for all video, graphics and audio activities. It performs the following primary functions: video decoding, graphics acceleration, display output, audio decoding, transport demultiplexing and sample playback applications.
|
|
|
•
|
Security Management: This software is designed to protect the application that incorporates our SoC and the digital content processed through the application from external attack. It includes the following features: an XOS operating system that boots the system, controls the separate secure CPU, and provides a secure programming environment and X-task (security function) source code samples and tools to build customized security procedures, as well as sample keys and certificates.
|
|
|
•
|
Porting Adaptations: This software is ported to one of our SoCs from a customer's general operating system (including Linux, WinCE and Android) and represents the customer's development environment. It includes the following elements: operating system kernel, peripheral hardware drivers, such as Ethernet, USB and IDE, and a bootloader that contains system initialization and related utilities.
|
These software elements, used with our hardware reference design boards, are packaged into the following application specific development kits for each of our target markets:
|
|
•
|
MicrosoftTV set-top box kit;
|
|
|
•
|
Linux-based IPTV set-top box kit;
|
|
|
•
|
Connected media player kit;
|
|
|
•
|
Digital media adapter kit;
|
|
|
•
|
Blu-ray player;
|
|
|
•
|
Microsoft WinCE general development kit; and
|
|
|
•
|
Portable media device kit.
|
As legacy products, we also offer a series of PC-based solutions, under the NetStream and REALmagic Xcard brand names, that are sold into the commercial streaming and PC add-in markets, respectively.
Customers
We sell our products principally to designers and manufacturers and to distributors who, in turn, sell to manufacturers. Typically, when we sell to distributors, they have already received an order for our products directly from a manufacturer. Our sales to our customers are typically accomplished on a purchase order basis.
For fiscal 2010, Motorola and Gemtek accounted for 21% and 12%, respectively, of our net revenue. For fiscal 2009, Cisco Systems and Motorola accounted for 22% and 21%, respectively, of our net revenue. For fiscal 2008, Motorola, Uniquest and Macnica accounted for 23%, 19% and 12%, respectively, of our net revenue.
A substantial portion of our product shipments are to customers outside of North America. In fiscal 2010, 2009 and 2008, billings to customers outside of North America accounted for 97%, 94% and 95% of our net revenue, respectively. Revenue from our customers in Asia accounted for 78%, 56% and 69% of our net revenue in fiscal 2010, 2009 and 2008, respectively.
Sales and Marketing
We sell our products worldwide through multiple channels, including our direct sales force, manufacturer representatives and independent distributors strategically located in many countries around the world. Members of our direct sales force are based in the United States, Denmark, Hong Kong, Israel, Taiwan and Singapore. Our sales are also supported by representatives, resellers and distributors in other key markets such as China, Japan and Korea.
Our sales cycle typically ranges from nine to eighteen months, but may last longer, and depends on a number of factors including the technical capabilities of the customer, the customer's need for customization of our SoCs and the customer's evaluation and qualification process. We generally plan the fabrication of our products based on customer forecasts.
For our larger volume designer and manufacturer customers, purchase orders for our products are generally non-cancelable between four and twelve weeks before our scheduled delivery dates and not subject to rescheduling within four weeks of scheduled delivery dates.
13
Competition
The market for digital media processors and network controller devices is highly competitive and is characterized by rapid technological change, evolving standards and decreasing average selling prices per unit. We believe that the principal factors on which we compete include time-to-market for new product introductions, product performance, industry standards compatibility, software functionality, price, and marketing and distribution resources.
We believe our primary competitors include Broadcom Corporation, Conexant Systems, Mediatek, NEC, NXP Semiconductors, Panasonic, RealTek and ST Microelectronics for our media processors; Atheros and Gigle for our HomePNA and HomePlug AV products; Zigbee for our Z-Wave products; and IDT and Marvell Technology Group for our VXP products. Many of these companies have higher profiles, larger financial resources and greater marketing resources than we do and may develop a competitive product that may inhibit the wide acceptance of our products. We believe that other manufacturers are developing products that will compete directly with our products in the near future.
Research and Development
We focus our development efforts primarily on three areas: video/audio decoder technologies, secure media processing and fully integrated SoC solutions. To achieve and maintain technology leadership, we intend to continue to make advancements in the areas of video and audio compression and decompression as well as wired and wireless connectivity. We expect these advancements will include maintaining compatibility with emerging standards and multiple platforms, and making improvements to the current architecture.
We have invested, and expect that we will continue to invest, substantial resources to research and development of performance enhancements, cost reductions and additional features for future generations of Motion Picture Expert Group, or MPEG, and other multimedia technologies. During fiscal 2010, 2009 and 2008, our research and development expenses were $52.6 million, $43.6 million and $31.4 million, respectively.
We have assembled a large team of experienced engineers and technologists. As of January 30, 2010, we had 336 research and development employees. These personnel conduct all of our product development along with the assistance of a number of independent contractors and consultants.
Intellectual Property
Our success and future revenue growth depend, in part, on our ability to protect our intellectual property. We rely primarily on patent, copyright, trademark and trade secret laws as well as agreements with customers, suppliers and employees to protect our proprietary technologies and processes.
As of January 30, 2010, we held 84 issued patents and we had 71 patent applications pending for our technology. The expiration dates of these patents are within the next four to nineteen years. We cannot assure you that more patents will be issued or that such patents, even if issued, or our existing patents, will provide adequate protection for our competitive position. Although we intend to protect our rights vigorously, we cannot assure you that these measures will be successful.
Manufacturing
We are a fabless semiconductor company and we do not own or operate a fabrication, packaging or testing facility. We depend on third-party vendors to manufacture, package and test our products. By outsourcing manufacturing, we are able to avoid the costs associated with owning and operating our own manufacturing facility. This allows us to focus our efforts on the design and marketing of our products.
Semiconductor fabrication
We rely on Taiwan Semiconductor Manufacturing Company, or TSMC, to fulfill substantially all of our semiconductor manufacturing needs, including SoC manufacturing. We believe that our fabless manufacturing approach provides us with the benefits of superior manufacturing capability as well as flexibility to move the manufacturing, assembly and testing of our products to those vendors that offer the best capability at an attractive price. Nevertheless, because we do not have a formal, long-term pricing agreement with our third-party manufacturers, our costs and services are subject to sudden price fluctuations based on the cyclical demand for semiconductors.
Assembly and test
Once our products have been manufactured, we have them packaged and tested. Our products are shipped from TSMC and our other third-party foundries to sort, assembly and test facilities where they are assembled into finished semiconductor packages and tested. We outsource all packaging and testing of our products to third-party assembly and test facilities, primarily to Advanced Semiconductor Engineering, Inc., or ASE, in Taiwan. Our products are designed to use low-cost, standard packages and to be tested with widely available test equipment.
14
Quality assurance
We are committed to maintaining the highest level of quality in our products. We have designed and implemented a quality management system that provides the framework for continual improvement of products, processes and customer service to ensure customer satisfaction. We also rely on in-depth simulation studies, design review and verification during our design phase, bench testing to perform design validation, product reliability qualification to verify the product’s quality and manufacturing testing when the products are in production. To ensure consistent product quality, reliability and yield, together with our manufacturing logistics partners, we closely monitor the production cycle by reviewing manufacturing process data from each wafer foundry and assembly subcontractor. Both TSMC and ASE have been awarded ISO 9000 certificates.
Backlog
The amount of backlog at any date depends upon various factors, including the timing of the receipt of orders, fluctuations in orders of existing product lines and the introduction of any new lines. Accordingly, we believe that the amount of our backlog at any date is not a useful measure of our future sales.
Employees
As of January 30, 2010, we had 499 full-time employees worldwide, including 336 in research and development, 84 in sales and marketing, 54 in general and administration and 25 in operations and quality assurance.
Our future success will depend, in part, on our ability to continue to attract, retain and motivate highly qualified technical, marketing, engineering and management personnel who are in great demand. Our employees are not represented by any collective bargaining unit and we have never experienced a work stoppage. We believe that our employee relations are satisfactory.
Corporate Information
We were incorporated in California in January 1982. Our principal offices are located at 1778 McCarthy Boulevard, Milpitas, California 95035, and our telephone number at that location is (408) 262-9003. Our website is located at www.sigmadesigns.com; however, the information in, or that can be accessed through, our website is not part of this report. Our annual reports on Form 10-K, quarterly reports on Form 10-Q, current reports on Form 8-K and amendments to such reports are available, free of charge, through the “Investor Overview” section of our website as soon as reasonably practicable after we electronically file such material with, or furnish it to, the Securities and Exchange Commission, or SEC. Additionally, copies of materials filed by us with the SEC may be accessed at the SEC’s Public Reference Room at 100 F Street, N.E., Washington, D.C. 20549 or at www.sec.gov. For information about the SEC’s Public Reference Room, contact 1-800-SEC-0330 or send an electronic message to SEC at publicinfo@sec.gov.
Executive Officers of the Registrant
The following table sets forth certain information concerning our executive officers as of March 5, 2010:
|
Name
|
Age
|
Position
|
|
Thinh Q. Tran
|
56
|
Chairman of the Board, President and Chief Executive Officer
|
|
Thomas E. Gay III
|
61
|
Chief Financial Officer and Secretary
|
|
David Lynch
|
54
|
Senior Vice President of Sales and Marketing
|
|
Jacques Martinella
|
54
|
Vice President of Engineering
|
|
Kenneth Lowe
|
54
|
Vice President of Strategic Marketing
|
Mr. Tran, one of our founders, has served as our President and Chief Executive Officer and as Chairman of our Board of Directors since February 1982. Prior to joining us, Mr. Tran was employed by Amdahl Corporation and Trilogy Systems Corporation, both of which were involved in the IBM-compatible mainframe computer market.
Mr. Gay has served as our Chief Financial Officer and Secretary since June 2007. From May 1998 to May 2007, Mr. Gay served as the Vice President of Finance and Administration and Chief Financial Officer of Catalyst Semiconductor, Inc., a memory and analog/mixed-signal semiconductor company. Prior to joining Catalyst Semiconductor, Inc., Mr. Gay held positions at Wireless Access, Inc., a communications device manufacturing company, where he was Controller, and Sanmina Corporation, a contract manufacturer, where he was the Corporate Controller.
15
Mr. Lynch has served as our Senior Vice President of Sales and Marketing since September 2008, after joining us as Vice President and General Manager of our VXP Division in February 2008. Prior to this, Mr. Lynch worked at Gennum Corporation, a semiconductor company, as Senior Vice President and General Manager of Image Processing from August 2007 to February 2008, Senior Vice President and General Manager of the Video Products Division from February 2004 to August 2007 with the additional role of Chief Technology Officer added in January 2007, VP and General Manager of Video Products Division from June 2000 to February 2004 and Vice President of Research and Development from April 1994 to June 2000. From 1978 to 1994, Mr. Lynch worked for the semiconductor design group in Bell Northern Research in a variety of senior engineering management and staff positions.
Mr. Martinella has served as our Vice President of Engineering since December 1995. Prior to his current position, Mr. Martinella served as our Director of VLSI Engineering beginning in May 1994 when he joined us. From June 1990 to April 1994, Mr. Martinella served in engineering and management positions at Weitek, a microchip manufacturer. In addition, Mr. Martinella was an engineer at National Semiconductor, a semiconductor manufacturer, from June 1982 to June 1990.
Mr. Lowe has served as our Vice President of Strategic Marketing since December 2000. He joined us in May 2000 as our Vice President of Marketing. From August 1998 to May 2000, Mr. Lowe served as the Director of Multimedia Marketing for Cadence Design Systems, a design automation software company. From 1996 to 1998, Mr. Lowe served as the Vice President of Marketing for Chrontel, Inc., a digital video semiconductor company. Prior to 1996, Mr. Lowe held various marketing management positions at Sierra Semiconductor, Dataquest, Personal CAD Systems, Performix and Gould-Biomation. In the late 1980's, Mr. Lowe served as our Product Marketing Director.
There are no family relationships among any of our directors and executive officers.
ITEM 1A. RISK FACTORS
If any of the following risks actually occurs, our business, financial condition and results of operations could be harmed. In that case, the trading price of our common stock could decline and you might lose all or part of your investment in our common stock. The risks and uncertainties described below are not the only ones we face. You should also refer to the other information set forth in this Form 10-K, including our consolidated financial statements and the related notes. Additional risks and uncertainties not presently known to us or that we currently deem immaterial may also impair our business operations.
Risks Related to Our Business and Our Industry
If we do not successfully anticipate market needs and develop products and product enhancements in a timely manner that meet those needs, or if those products do not gain market acceptance, we may not be able to compete effectively and our ability to generate revenue will suffer.
We may not be able to accurately anticipate future market needs or be able to develop new products or product enhancements to meet such needs or to meet them in a timely manner. Our ability to develop and deliver new products successfully will depend on various factors, including our ability to:
|
|
•
|
accurately predict market requirements and evolving industry standards;
|
|
|
•
|
accurately design new SoC products;
|
|
|
•
|
timely complete and introduce new product designs;
|
|
|
•
|
timely qualify and obtain industry interoperability certification of our products and the equipment into which our products will be incorporated;
|
|
|
•
|
ensure that our subcontractors have sufficient foundry, assembly and test capacity and packaging materials and achieve acceptable manufacturing yields;
|
|
|
•
|
shift our products to smaller geometry process technologies to achieve lower cost and higher levels of design integration; and
|
|
|
•
|
gain market acceptance of our products and our customers' products.
|
16
If we fail to anticipate market requirements or to develop new products or product enhancements to meet those needs in a cost-effective and timely manner, it could substantially decrease market acceptance and sales of our present and future products and we may be unable to attract new customers or retain our existing customers, which would significantly harm our business and financial results.
Even if we are able to anticipate, develop and commercially introduce new products and enhancements, our new products or enhancements may not achieve widespread market acceptance. Any failure of our products to achieve market acceptance could adversely affect our business and financial results.
Our industry is highly competitive and we may not be able to compete effectively, which would harm our market share and cause our revenue to decline.
The markets in which we operate are extremely competitive and are characterized by rapid technological change, continuously evolving customer requirements and declining average selling prices. We may not be able to compete successfully against current or potential competitors. Most of our products compete with large semiconductor providers that have substantial experience and expertise in video, audio and multimedia technology and in selling to consumer equipment providers. Many of these companies have substantially greater engineering, marketing and financial resources than we have. As a result, our competitors may be able to respond better to new or emerging technologies or standards and to changes in customer requirements. Further, some of our competitors are in a better financial and marketing position from which to influence industry acceptance of a particular industry standard or competing technology than we are. Our competitors may also be able to devote greater resources to the development, promotion and sale of products, and may be able to deliver competitive products at a lower price. We also may face competition from newly established competitors, suppliers of products based on new or emerging technologies and customers who choose to develop their own SoCs. Additionally, some of our competitors operate their own fabrication facilities or may have stronger manufacturing partner relationships than we have. We expect our current customers, particularly in the IPTV and connected media player markets, to seek additional suppliers of SoCs for inclusion in their products, which will increase competition and could reduce our market share. If we do not compete successfully, our market share and net revenue could decline.
If we fail to achieve initial design wins for our products, we may be unable to recoup our investments in our products and revenue could decline.
We expend considerable resources in order to achieve design wins for our products, especially our new products and product enhancements, without any assurance that a customer will select our product. Once a customer designs a semiconductor into a product, it is likely to continue to use the same semiconductor or enhanced versions of that semiconductor from the same supplier across a number of similar and successor products for a lengthy period of time due to the significant costs and risks associated with qualifying a new supplier and potentially redesigning the product to incorporate a different semiconductor. As a result, if we fail to achieve an initial design win in a customer's qualification process, we may lose the opportunity for significant sales to that customer for a number of its products and for a lengthy period of time, or we would only be able to sell our products to these customers as a second source, which usually means we would only be able to sell a limited amount of product to them. Also, even if we achieve new design wins with customers, these manufacturers may not purchase our products in sufficient volumes to recoup our development costs, and they can choose at any time to stop using our products, for example, if their own products are not commercially successful. This may cause us to be unable to recoup our investments in the development of our products and cause our revenue to decline.
To remain competitive, we need to continue to transition our SoCs to increasingly smaller sizes while maintaining or increasing functionality, and our failure to do so may harm our business.
We periodically evaluate the benefits, on a product-by-product basis, of migrating to more advanced technology to reduce the size of our SoCs. The smaller SoC size reduces our production and packaging costs, which enables us to be competitive in our pricing. We also continually strive to increase the functionality of our SoCs, which is essential to competing effectively in our target markets. The transition to smaller geometries while maintaining or increasing functionality requires us to work with our contractors to modify the manufacturing processes for our products and to redesign some products. This effort requires considerable development investment and a risk of reduced yields as a new process is brought to acceptable levels of operating and quality efficiency. In the past, we have experienced some difficulties in shifting to smaller geometry process technologies or new manufacturing processes, which resulted in reduced manufacturing yields, delays in product deliveries and increased expenses. We may face similar difficulties, delays and expenses as we continue to transition our products to smaller geometry processes, all of which could harm our relationships with our customers, and our failure to do so would impact our ability to provide competitive prices to our customers, which would have a negative impact on our sales.
We base orders for inventory on our forecasts of our customers' demand and if our forecasts are inaccurate, our financial condition and liquidity would suffer.
17
We place orders with our suppliers based on our forecasts of our customers' demand. Our forecasts are based on multiple assumptions, each of which may introduce errors into our estimates. When the demand for our customers' products increases significantly, we may not be able to meet demand on a timely basis and we may need to expend a significant amount of time working with our customers to allocate a limited supply and maintain positive customer relations. If we underestimate customer demand, we may forego revenue opportunities, lose market share and damage our customer relationships. Conversely, if we overestimate customer demand, we may allocate resources to manufacturing products that we may not be able to sell when we expect to or at all. As a result, we would have excess or obsolete inventory, resulting in a decline in the value of our inventory, which would increase our cost of revenue and create a drain on our liquidity.
We depend on a limited number of customers and any reduction, delay or cancellation of an order from these customers or the loss of any of these customers could cause our revenue to decline.
Our dependence on a limited number of customers means that the loss of a major customer or any reduction in orders by a major customer could materially reduce our net revenue and adversely affect our results of operations. We expect that sales to relatively few customers will continue to account for a significant percentage of our net revenue for the foreseeable future. We have no firm, long-term volume commitments from any of our major customers and we generally accept purchase commitments from our customers based upon their purchase orders. Customer purchase orders may be cancelled and order volume levels can be changed, cancelled or delayed with limited or no penalties. We have experienced fluctuations in order levels from period to period and expect that we will continue to experience such fluctuations and may experience cancellations in the future. We may not be able to replace the cancelled, delayed or reduced purchase orders with new orders. Any difficulty in the collection of receivables from key customers could also harm our business.
For fiscal 2010, Motorola and Gemtek accounted for 21% and 12%, respectively, of our net revenue. For fiscal 2009, Cisco Systems and Motorola accounted for 22% and 21%, respectively, of our net revenue.
Our business also depends on demand for our SoC solutions from companies, such as large telecommunication carriers, who are not our direct customers but deploy IPTV set-boxes that incorporate our SoC solutions. These companies use multiple set-top box providers, who in turn sometimes use multiple contract manufacturers to purchase our SoCs and manufacture set-top boxes. Even though we do not sell our products directly to these companies that ultimately deploy set-top boxes to consumers, these companies have a significant impact on the demand for our SoC solutions. For example, a significant number of our SoCs are incorporated into set-top boxes deployed by AT&T. This significant concentration on AT&T set-top boxes was increased by our recent acquisition of CopperGate. A significant percentage of the SoC solutions sold by CopperGate are also used in set-top boxes as well as gateways deployed by AT&T. In the past, companies that deploy set-top boxes incorporating our SoC solution have had significant fluctuations in demand which has resulted in a decline in our business from our direct customers, such as original equipment manufacturers and contract manufacturers. Any decrease in the demand from the companies that deploy IPTV set-top boxes incorporating our SoC solutions, and in particular AT&T, could have a material and adverse effect on our net revenue and results of operation.
If demand for our SoCs declines or does not grow, we will be unable to increase or sustain our net revenue.
We expect our SoCs to account for a substantial majority of our net revenue for the foreseeable future. For fiscal 2010, sales of our SoCs represented 99% of our net revenue. Even if the consumer electronic markets that we target continue to expand, manufacturers of consumer products in these markets may not choose to utilize our SoCs in their products. The markets for our products are characterized by frequent introduction of new technologies, short product life cycles and significant price competition. If we or our customers are unable to manage product transitions in a timely and cost effective manner, our net revenue would suffer. In addition, frequent technological changes and introduction of next generation products may result in inventory obsolescence which would increase our cost of revenue and adversely affect our operating performance. If demand for our SoCs declines or fails to grow or we are unable to develop new products to meet our customers' demand, our net revenue could be harmed.
The timing of our customer orders and product shipments can adversely affect our operating results and stock price.
Our net revenue and operating results depend upon the volume and timing of customer orders received during a given period and the percentage of each order that we are able to ship and recognize as net revenue during each period. Customers may change their cycle of product orders from us, which would affect the timing of our product shipments. For example, we experienced declines in orders from certain significant customers in the first two quarters of fiscal 2009 compared to the third and fourth quarters of fiscal 2008. Any failure or delay in the closing of orders expected to occur within a quarterly period, particularly from significant customers, would adversely affect our operating results. Further, to the extent we receive orders late in any given quarter, we may not be able to ship products to fill those orders during the same period in which we received the corresponding order which could have an adverse impact on our operating results for that period.
18
We may face intellectual property claims that could be costly to defend and result in our loss of significant rights.
The semiconductor industry is characterized by frequent litigation regarding patent and intellectual property rights. We believe that it may be necessary, from time to time, to initiate litigation against one or more third parties to preserve our intellectual property rights. From time to time, we have received, and may receive in the future, notices that claim we have infringed upon, misappropriated or misused other parties' proprietary rights. Any of the foregoing events or claims could result in litigation. Any such litigation could result in significant expense to us and divert the efforts of our technical and management personnel. In the event of an adverse result in any such litigation, we could be required to pay substantial damages, cease the manufacture, use and sale of certain products or expend significant resources to develop non-infringing technology or to obtain licenses to the technology that is the subject of the litigation, and we may not be successful in such development or in obtaining such licenses on acceptable terms, if at all. In addition, patent disputes in the electronics industry have often been settled through cross-licensing arrangements. Because we do not yet have a large portfolio of issued patents, we may not be able to settle an alleged patent infringement claim through a cross-licensing arrangement.
We may not be able to realize all of the anticipated benefits of our acquisition of CopperGate if we fail to integrate CopperGate successfully, which could reduce our profitability.
Our ability to realize the anticipated benefits of our acquisition of CopperGate will depend, in part, on our ability to integrate the business of CopperGate successfully and efficiently with our business. The combination of two independent companies is a complex, costly and time-consuming process. The integration process may disrupt the business of either or both of the companies and, if implemented ineffectively, preclude realization of the full benefits expected by us. If we are not successful in this integration, our financial results could be adversely impacted. We will be required to dedicate significant time and effort to this integration process, which could divert their attention from other business concerns. In addition, the overall integration of the two companies may result in unanticipated problems, expenses, liabilities, competitive responses, loss of customer and other relationships, a loss of key employees and diversion of our attention and may cause our stock price to decline. The difficulties of combining the operations of the two companies include, among others:
|
|
•
|
challenges associated with minimizing the diversion of our attention from ongoing business concerns;
|
|
|
•
|
addressing differences in the business cultures;
|
|
|
•
|
coordinating geographically separate organizations which may be subject to additional complications resulting from being geographically distant from our other operations;
|
|
|
•
|
coordinating and combining international operations relationships and facilities and eliminating duplicative operations;
|
|
|
•
|
retaining key employees and maintaining employee moral;
|
|
|
•
|
unanticipated changes in general business or market conditions that might interfere with our ability to carry out all of our integration plans;
|
|
|
•
|
unanticipated issues in integrating information, communications and other systems; and
|
|
|
•
|
preserving important strategic and customer relationships.
|
In addition, even if CopperGate’s operations are integrated successfully with ours, we may not realize the full potential benefits of the transaction, including the leveraging of manufacturing know-how and combined wafer sourcing, further SoC integration and combined research and development that are expected. Such benefits may not be achieved within the anticipated time frame, or at all.
The complexity of our products could result in unforeseen delays or expenses and in undetected defects, which could damage our reputation with current or prospective customers, adversely affect the market acceptance of new products and result in warranty claims.
Highly complex products, such as those that we offer, frequently contain defects, particularly when they are first introduced or as new versions are released. Our SoCs contain highly sophisticated silicon technology and complex software. In the past we have experienced, and may in the future experience, defects in our products, both with our SoCs and the related software products we offer. If any of our products contain defects or have reliability, quality or compatibility problems, our reputation may be damaged and our customers may be reluctant to buy our products, which could harm our ability to retain existing customers and attract new customers. In addition, these defects could interrupt or delay sales or shipment of our products to our customers. Manufacturing defects may not be detected by the testing process performed by our subcontractors. If defects are discovered after we have shipped our products, it could result in unanticipated costs, order cancellations or deferrals and product recalls, harm to our reputation and a decline in our net revenue, income from operations and gross margins.
19
In addition, our agreements with some customers contain warranty provisions, which provide the customer with a right to damages if a defect is traced to our products or if we cannot correct errors in our product reported during the warranty period. However, any contractual limitations to our liability may be unenforceable in a particular jurisdiction. We do not have insurance coverage for any warranty or product liability claims and a successful claim could require us to pay substantial damages. A successful warranty or product liability claim against us, or a requirement that we participate in a product recall, could have adverse effects on our business results.
If our third-party manufacturers do not achieve satisfactory yields or quality, our relationships with our customers and our reputation will be harmed, which in turn would harm our operating results and financial performance.
The fabrication of semiconductors is a complex and technically demanding process. Minor deviations in the manufacturing process can cause substantial decreases in yields and, in some cases, cause production to be stopped or suspended. Although we work closely with our third-party manufacturers to minimize the likelihood of reduced manufacturing yields, their facilities have from time to time experienced lower than anticipated manufacturing yields that have resulted in our inability to meet our customer demand. It is not uncommon for yields in semiconductor fabrication facilities to decrease in times of high demand, in addition to reduced yields that may result from normal wafer lot loss due to workmanship or operational problems at these facilities. When these events occur, especially simultaneously, as happens from time to time, we may be unable to supply our customers' demand. Many of these problems are difficult to detect at an early stage of the manufacturing process and may be time consuming and expensive to correct. Poor yields from the wafer foundries or defects, integration issues or other performance problems in our products could cause us significant customer relations and business reputation problems or force us to sell our products at lower gross margins and therefore harm our financial results.
The average selling prices of semiconductor products have historically decreased rapidly and will likely do so in the future, which could harm our revenue and gross margins.
The semiconductor industry, in general, and the consumer electronics markets that we target, specifically, are characterized by intense price competition, frequent introductions of new products and short product life cycles, which can result in rapid price erosion in the average selling prices for semiconductor products. A decline in the average selling prices of our products could harm our revenue and gross margins. The willingness of customers to design our SoCs into their products depends to a significant extent upon our ability to sell our products at competitive prices. In the past, we have reduced our prices to meet customer requirements or to maintain a competitive advantage. Reductions in our average selling prices to one customer could impact our average selling prices to all customers. If we are unable to reduce our costs sufficiently to offset declines in product prices or are unable to introduce more advanced products with higher margins in a timely manner, we could experience declines in our net revenue and gross margins.
We rely upon patents, trademarks, copyrights and trade secrets to protect our proprietary rights and if these rights are not sufficiently protected, it could harm our ability to compete and to generate revenue.
Our ability to compete may be affected by our ability to protect our proprietary information. As of January 30, 2010, we held 84 patents and these patents will expire within the next four to nineteen years. These patents cover the technology underlying our products. We have filed certain patent applications and are in the process of preparing others. We cannot assure you that any additional patents for which we have applied will be issued or that any issued patents will provide meaningful protection of our product innovations. Like other semiconductor companies, we rely primarily on trade secrets and technological know-how in the conduct of our business. We use measures such as confidentiality agreements to protect our intellectual property. However, these methods of protecting our intellectual property may not be sufficient.
If the growth of demand in the consumer electronics market does not continue, our ability to increase our revenue could suffer.
Our business is highly dependent on developing sectors of the consumer electronics market, including IPTV, connected media player, prosumer and industrial audio/video and connected home technologies. The consumer electronics market is highly competitive and is characterized by, among other things, frequent introductions of new products and short product life cycles. The consumer electronics market may also be negatively impacted by a slowdown in overall consumer spending. The worldwide economy, generally, and consumer spending, specifically, has significantly declined, which has negatively impacted our target markets. If our target markets do not grow as rapidly or to the extent we anticipate, our business could suffer. We expect the majority of our revenue for the foreseeable future to come from the sale of our SoC solutions for use in emerging consumer applications. Our ability to sustain and increase revenue is in large part dependent on the continued growth of these rapidly evolving market sectors, whose future is largely uncertain. Many factors could impede or interfere with the expansion of these consumer market sectors, including consumer demand in these sectors, general economic conditions, other competing consumer electronic products, delays in the deployment of telecommunications video services and insufficient interest in new technology innovations. In addition, if market acceptance of the consumer products that utilize our products does not occur as expected, our business could be harmed.
20
We have a history of fluctuating operating results, including a net loss in fiscal 2006 and we may not be able to sustain or increase profitability in the future, which may cause the market price of our common stock to decline.
We have a history of fluctuating operating results. We reported net income of $70.2 million in fiscal 2008, net income of $26.4 million in fiscal 2009 and net income of $2.5 million in fiscal 2010. To sustain or increase profitability, we will need to successfully develop new products and product enhancements and sustain higher revenue while controlling our cost and expense levels. In recent years, we made significant investments in our product development efforts and have expended substantial funds to enhance our sales and marketing efforts and otherwise operate our business. However, we may not realize the benefits of these investments. Although we were profitable in fiscal 2010, we may not continue to be profitable. For example, our net income decreased from $26.4 million in fiscal 2009 to $2.5 million in fiscal 2010. We may incur operating losses in future quarterly periods or fiscal years, which in turn could cause the price of our common stock to decline.
We have engaged, and may in the future engage in acquisitions of other businesses and technologies which could divert our attention and prove difficult to integrate with our existing business and technology.
We continue to consider investments in and acquisitions of other businesses, technologies or products, to improve our market position, broaden our technological capabilities and expand our product offerings. For example, in November 2009, we completed the acquisition of CopperGate Communications Ltd., an Israeli company. As a result, we added substantial operations, including 124 employees located in Israel and an additional 17 employees located outside of Israel. We also completed the acquisition of Zensys Holdings Corporation in December 2008, the acquisition of certain assets and 44 new employees of the VXP Group from Gennum Corporation in February 2008 and the acquisition of Blue7 Communications in February 2006. In the future, we may not be able to acquire or successfully identify companies, products or technologies that would enhance our business. Once we identify a strategic opportunity, the process to consummate a transaction could divert our attention from the operation of our business causing our financial results to decline.
Acquisitions may require large one-time charges and can result in increased debt or contingent liabilities, adverse tax consequences, additional stock-based compensation expense, and the recording and subsequent amortization of amounts related to certain purchased intangible assets, any of which items could negatively impact our results of operations. We may also record goodwill in connection with an acquisition and incur goodwill impairment charges in the future. In addition, in order to complete acquisitions, we may issue equity securities and incur debt, which would result in dilution to our existing shareholders and could negatively impact profitability.
We may experience difficulties in integrating acquired businesses. Integrating acquired businesses involves a number of risks, including:
|
|
•
|
potential disruption of our ongoing business and the diversion of management resources from other business concerns;
|
|
|
•
|
unexpected costs or incurring unknown liabilities;
|
|
|
•
|
difficulties relating to integrating the operations and personnel of the acquired businesses;
|
|
|
•
|
adverse effects on the existing customer relationships of acquired companies; and
|
|
|
•
|
adverse effects associated with entering into markets and acquiring technologies in areas in which we have little experience.
|
If we are unable to successfully integrate the businesses we acquire, our operating results could be harmed.
21
The recent global economic downturn could negatively affect our business, results of operations and financial condition.
Current uncertainty in global economic conditions pose a risk to the overall economy as consumers and businesses may defer purchases in response to tighter credit and negative financial news, which could negatively affect demand for our products and other related matters. Consequently, demand for our products could be different from our expectations due to factors including:
|
|
•
|
changes in business and economic conditions, including conditions in the credit market that could affect consumer confidence;
|
|
|
•
|
customer acceptance of our products and those of our competitors;
|
|
|
•
|
changes in customer order patterns including order cancellations; and
|
|
|
•
|
changes in the level of inventory our customers are willing to hold.
|
There could also be a number of secondary effects from the current uncertainty in global economic conditions, such as insolvency of suppliers resulting in product delays, an inability of our customers to obtain credit to finance purchases of our products or a desire of our customers to delay payment to us for the purchase of our products. The effects, including those mentioned above, of the current global economic environment could negatively impact our business, results of operations and financial condition.
Due to the cyclical nature of the semiconductor industry, our operating results may fluctuate significantly, which could adversely affect the market price of our common stock.
The semiconductor industry is highly cyclical and subject to rapid change and evolving industry standards and, from time to time, has experienced significant downturns. These downturns are characterized by decreases in product demand, excess customer inventories and accelerated erosion of prices. These factors have caused, and could cause, substantial fluctuations in our net revenue and in our operating results. Any downturns in the semiconductor industry may be severe and prolonged, and any failure of this industry to fully recover from downturns could harm our business. The semiconductor industry also periodically experiences increased demand and production capacity constraints, which may affect our ability to ship products. Accordingly, our operating results have varied and may vary significantly as a result of the general conditions in the semiconductor industry, which could cause our stock price to decline.
The complexity of our international operations may increase our operating expenses and disrupt our business.
We transact business and have operations worldwide. For example, we derive a substantial portion of our net revenue from our customers outside of North America and we plan to continue expanding our business in international markets in the future. For fiscal 2010, we derived 97% of our revenue from customers outside of North America. We also have significant international operations, including a significant operation in Singapore, research and development facilities in France, Canada, Denmark and Japan and a sales and distribution facility in Hong Kong. In November 2009, we completed the acquisition of CopperGate Communications Ltd., and as a result, added substantial operations in Israel. As a result of our international business, we are affected by economic, regulatory and political conditions in foreign countries, including the imposition of government controls, changes or limitations in trade protection laws, unfavorable changes in tax treaties or laws, varying statutory equity requirement, difficulties in collecting receivables and enforcing contracts, natural disasters, labor unrest, earnings expatriation restrictions, misappropriation of intellectual property, changes in import/export regulations, tariffs and freight rates, economic instability, public health crises, acts of terrorism and continued unrest in many regions and other factors, which could have a material impact on our international revenue and operations. In particular, in some countries we may experience reduced intellectual property protection. Our results of operations could also be adversely affected by exchange rate fluctuations, which could increase the sales price in local currencies of our products in international markets. Overseas sales and purchases to date have been denominated in U.S. dollars. Although we engage in some hedging of our foreign currency exposures, we do not hedge all such exposures and our hedging arrangements may not always be effective. See “Foreign currency exchange rate sensitivity” under Part II Item 7A“Quantitative and Qualitative Disclosures about Market Risk” in this Form 10-K. Moreover, local laws and customs in many countries differ significantly from those in the United States. We also face challenges in staffing and managing our global operations. If we are unable to manage the complexity of our global operations successfully, our financial performance and operating results could suffer.
Our sales cycle can be lengthy, which could result in uncertainty and delays in generating net revenue.
22
Because our products are based on constantly evolving technologies, we have experienced a lengthy sales cycle for some of our SoCs, particularly those designed for set-top box applications in the IPTV market. After we have qualified a product with a customer, the customer will usually test and evaluate our product with its service provider prior to the customer completing the design of its own equipment that will incorporate our product. Our customers and the telecommunications carriers our customers serve may need from three to more than nine months to test, evaluate and adopt our product and an additional three to more than nine months to begin volume production of equipment that incorporates our product. Our complete sales cycle typically ranges from nine to eighteen months, but could be longer. As a result, we may experience a significant delay between the time we increase expenditures for research and development, sales and marketing efforts and inventory and the time we generate net revenue, if any, from these expenditures. In addition, because we do not have long-term commitments from our customers, we must repeat our sales process on a continual basis even for current customers looking to purchase a new product. As a result, our business could be harmed if a customer reduces or delays its orders, chooses not to release products incorporating our SoCs or elects not to purchase a new product or product enhancements from us.
We rely on a limited number of independent third-party manufacturers for the fabrication, assembly and testing of our SoCs and the failure of any of these third-party manufacturers to deliver products or otherwise perform as requested could damage our relationships with our customers, decrease our sales and limit our growth.
We are a fabless semiconductor company and thus we do not own or operate a fabrication or manufacturing facility. We depend on independent manufacturers, each of whom is a third-party manufacturer for numerous companies, to manufacture, assemble and test our products. We currently rely on Taiwan Semiconductor Manufacturing Corporation, and Faraday Technology Company, or Faraday, to produce substantially all of our SoCs. We rely on Advanced Semiconductor Engineering, Inc., to assemble, package and test substantially all of our products. These third-party manufacturers may allocate capacity to the production of other companies' products while reducing product deliveries or the provision of services to us on short notice or they may increase the prices of the products and services they provide to us with little or no notice. In particular, other clients that are larger and better financed than we are or that have long-term agreements with TSMC or ASE may cause either or both of them to reallocate capacity to those clients, decreasing the capacity available to us.
If we fail to effectively manage our relationships with the third-party manufacturers, if we are unable to secure sufficient capacity at our third-party manufacturers' facilities or if any of them should experience delays, disruptions or technical or quality control problems in our manufacturing operations or if we had to change or add additional third-party manufacturers or contract manufacturing sites, our ability to ship products to our customers could be delayed, our relationships with our customers would suffer and our market share and operating results would suffer. If our third-party manufacturers' pricing for the products and services they provide increases and we are unable to pass along such increases to our customers, our operating results would be adversely affected. Also, the addition of manufacturing locations or additional third-party subcontractors would increase the complexity of our supply chain management. Moreover, all of our product manufacturing, assembly and packaging is performed in Asian countries and is therefore subject to risks associated with doing business in these countries such as quarantines or closures of manufacturing facilities due to the outbreak of viruses such as swine flu, SARS, avian flu or any similar outbreaks. Each of these factors could harm our business and financial results.
We may not be able to effectively manage our growth or develop our financial and managerial control and reporting systems, and we may need to incur significant expenditures to address the additional operational and control requirements of our growth, either of which could harm our business and operating results.
To continue to grow, we must continue to expand and improve our operational, engineering, accounting and financial systems, procedures, controls and other internal management systems. This may require substantial managerial and financial resources and our efforts in this regard may not be successful. Our current systems, procedures and controls may not be adequate to support our future operations. For example, we implemented a new enterprise resource management system in 2008. We must integrate the operations of CopperGate into our enterprise resource management system, which could be costly and time consuming. If we fail to adequately manage our growth or to improve and develop our operational, financial and management information systems or fail to effectively motivate or manage our current and future employees, the quality of our products and the management of our operations could suffer, which could adversely affect our operating results.
Our ability to develop, market and sell products could be harmed if we are unable to retain or hire key personnel.
Our future success depends upon our ability to recruit and retain the services of key executive, engineering, finance and accounting, sales, marketing and support personnel. The supply of highly qualified individuals, in particular engineers in very specialized technical areas, or sales people specializing in the semiconductor industry, is limited and competition for such individuals is intense. None of our officers or key employees is bound by an employment agreement for any specific term. The loss of the services of any of our key employees, the inability to attract or retain key personnel in the future or delays in hiring required personnel, particularly engineers and sales people, and the complexity and time involved in hiring and training new employees, could delay the development and introduction of new products, and negatively impact our ability to market, sell or support our products.
23
If the recent worsening of credit market conditions continues or increases, it could have a material adverse impact on our investment portfolio.
Recent U.S. sub-prime mortgage defaults have had a significant impact across various sectors of the financial markets, causing global credit and liquidity related difficulties. Beginning mid 2007, global short-term funding markets have experienced credit issues, leading to liquidity issues and failed auctions in the auction rate securities, or ARS market. If the global credit market continues to be weak or deteriorates further, the liquidity of our investment portfolio may be impacted and we could determine that some of our investments are impaired. This could materially adversely impact our results of operations and financial condition.
Included in our marketable securities portfolio at January 30, 2010 were nine ARS that we purchased for their par value, $43.0 million, and during fiscal 2010, the issuers of two of these ARS redeemed limited portions at par value in the amount of $2.2 million from us. As a result, as of January 30, 2010, we held nine ARS with an adjusted cost and par value of $40.8 million. Subsequent to February 2008, all auctions involving the ARS in our investment portfolio have failed due to insufficient bids from buyers. If these auctions continue to fail and the credit ratings of these investments deteriorate, the fair value of these ARS may decline and we may incur impairment charges in connection with these securities which would negatively affect our reported earnings, cash flow and financial condition. Although our cash management advisor, UBS, has indicated that, absent other solutions to the limited market for our ARS, it will redeem all these securities at par value upon our request after June 2010, there is a risk that their intention may not be achieved for reasons outside our control.
Litigation due to stock price volatility or other factors could cause us to incur substantial costs and divert our attention and resources.
In the past, securities class action litigation has often been brought against a company following periods of volatility in the market price of its securities. Companies such as ours in the semiconductor industry and other technology industries are particularly vulnerable to this kind of litigation due to the high volatility of their stock prices. While we are not aware of any such contemplated class action litigation against us, we may in the future be the target of securities litigation. Any future lawsuits to which we may become a party will likely be expensive and time consuming to investigate, defend and resolve. Such costs, which include investigation and defense, the diversion of our attention and resources and any losses resulting from these claims, could significantly increase our expenses and adversely affect our profitability and cash flow.
Our business may become subject to seasonality, which may cause our revenue to fluctuate.
Our business may become subject to seasonality as a result of our target markets. We sell a significant number of our semiconductor products into the consumer electronics market. Our customers who manufacture products for the consumer market typically experience seasonality in the sales of their products which in turn may affect the timing and volume of orders for our SoCs. Although we have not experienced seasonality to date in sales of our products due to the overall growth in demand for our semiconductor products, we may, in the future, experience lower sales in our first fiscal quarter and higher sales in our second fiscal quarter as a result of the seasonality of demand associated with the consumer electronics markets into which we sell our products. As a result, our operating results may vary significantly from quarter to quarter.
In the event we seek or are required to use a new manufacturer to fabricate or to assemble and test all or a portion of our SoC products, we may not be able to bring new manufacturers on-line rapidly enough, which could damage our relationships with our customers, decrease our sales and limit our growth.
We use a single wafer foundry to manufacture substantially all of our products and a single source to assemble and test substantially all of our products, which exposes us to a substantial risk of delay, increased costs and customer dissatisfaction in the event our third-party manufacturers are unable to provide us with our SoC requirements. Particularly during times when semiconductor capacity is limited, we may seek to, and in the event that our current foundry were to stop producing wafers for us altogether, we would be required to, qualify one or more additional wafer foundries to meet our requirements, which would be time consuming and costly. In order to bring any new foundries on-line, we and our customers would need to qualify their facilities which process could take as long as several months. Once qualified, each new foundry would then require an additional number of months to actually begin producing SoCs to meet our needs, by which time our perceived need for additional capacity may have passed, or the opportunities we previously identified may have been lost to our competitors. Similarly, qualifying a new provider of assembly, packaging and testing services would be a lengthy and costly process and, in both cases, they could prove to be less reliable than our existing manufacturers, which could result in increased costs and expenses as well as delays in deliveries of our products to our customers.
24
Our ability to raise capital in the future may be limited and our failure to raise capital when needed could prevent us from executing our growth strategy.
We believe that our existing cash and cash equivalents, and short-term and long-term marketable securities will be sufficient to meet our anticipated cash needs for at least the next 12 months. The timing and amount of our working capital and capital expenditure requirements may vary significantly depending on numerous factors, including:
|
|
•
|
market acceptance of our products;
|
|
|
•
|
the need to adapt to changing technologies and technical requirements;
|
|
|
•
|
the existence of opportunities for expansion; and
|
|
|
•
|
access to and availability of sufficient management, technical, marketing and financial personnel.
|
If our capital resources are insufficient to satisfy our liquidity requirements, we may seek to sell additional equity securities or debt securities or obtain debt financing. During fiscal 2009, we used an aggregate of $85.9 million to purchase 4.2 million shares of our common stock. In November 2009, we used approximately $116.0 million in cash (which includes approximately $28 million of CopperGate cash) in connection with our acquisition of CopperGate. The amount of cash we used for these repurchases and the acquisition of CopperGate could limit our ability to execute our business plans and require us to raise additional capital in the future in order to fund any further repurchases or for other purposes. The sale of additional equity securities or convertible debt securities would result in additional dilution to our shareholders. Additional debt would result in increased expenses and could result in covenants that would restrict our operations. We have not made arrangements to obtain additional financing and there is no assurance that financing, if required, will be available in amounts or on terms acceptable to us, if at all.
Regional instability in Israel may adversely affect business conditions and may disrupt our operations and negatively affect our revenues and profitability.
As a result of our acquisition of CopperGate, we have engineering facilities, corporate and sales support operations and, as of November 10, 2009, we had 124 employees located in Israel. Accordingly, political, economic and military conditions in Israel may directly affect our business. Since the establishment of the State of Israel in 1948, a number of armed conflicts have taken place between Israel and its Arab neighbors, as well as incidents of civil unrest. In addition, Israel and companies doing business with Israel have, in the past, been the subject of an economic boycott. Although Israel has entered into various agreements with Egypt, Jordan and the Palestinian Authority, Israel has been and is subject to civil unrest and terrorist activity, with varying levels of severity since September 2000. Any future armed conflicts or political instability in the region may negatively affect business conditions and adversely affect our results of operations.
In addition, our business insurance does not cover losses that may occur as a result of events associated with the security situation in the Middle East. Although the Israeli government currently covers the reinstatement value of direct damages that are caused by terrorist attacks or acts of war, we cannot assure you that this government coverage will be maintained. Any losses or damages incurred by us could have a material adverse effect on our business and financial results.
Changes in our effective tax rate or tax liability may have an adverse effect on our results of operations.
As a global company, we are subject to taxation in Israel, Singapore, the United States and various other countries and states. Significant judgment is required to determine and estimate worldwide tax liabilities. Any significant change in our future effective tax rates could adversely impact our consolidated financial position, results of operations and cash flows. Our future effective tax rates may be adversely affected by a number of factors including:
|
|
•
|
changes in tax laws in the countries in which we operate or the interpretation of such tax laws;
|
|
|
•
|
changes in the valuation of our deferred tax assets;
|
|
|
•
|
increases in expenses not deductible for tax purposes, including write-offs of acquired in-process research and development and impairment of goodwill in connection with acquisitions;
|
|
|
•
|
changes in share-based compensation expense;
|
|
|
•
|
changes in generally accepted accounting principles; and
|
|
|
•
|
our ability to use our tax attributes such as research and development tax credits and net operating losses of acquired companies to the fullest extent.
|
25
During the first quarter of fiscal 2010, the California Budget Act of 2008 was signed into law which revised certain provisions of the California State Tax Code, including the option to elect an alternative method to attribute taxable income to California for tax years beginning on or after January 1, 2011. We now expect that in years 2011 and beyond, our income subject to tax in California will be lower than under prior tax law and that our California deferred tax assets are therefore less likely to be realized. As a result, we recorded a $3.6 million charge in the first quarter of fiscal 2010 to reduce our previously recognized California deferred tax assets.
During fiscal 2009, we established a foreign operating subsidiary in Singapore. We anticipate that a portion of our consolidated pre-tax income will be subject to foreign tax at relatively lower tax rates when compared to the United States federal statutory tax rate and, as a consequence, our effective income tax rate is expected to be lower than the United States federal statutory rate. Our future effective income tax rates could be adversely affected if tax authorities challenge our international tax structure or if the relative mix of United States and international income changes for any reason. Accordingly, there can be no assurance that our income tax rate will be less than the United States federal statutory rate.
The income tax benefits in Israel to which we are currently entitled from our approved enterprise program may be reduced or eliminated by the Israeli government in the future and also require us to satisfy specified conditions. If they are reduced or if we fail to satisfy these conditions, we may be required to pay increased taxes and would likely be denied these benefits in the future.
The Investment Center of the Ministry of Industry, Trade and Labor has granted “approved enterprise” status to certain product development programs at our facility in Tel Aviv. Our taxable income from these approved enterprise programs is exempt from tax for a period of two years and will be subject to a reduced tax for an additional eight years thereafter, depending on the percentage of our share capital held by non-Israelis. The Israeli government may reduce, or eliminate in the future, tax benefits available to approved enterprise programs. Our approved program and the resulting tax benefits may not continue in the future at their current levels or at any level. The termination or reduction of these tax benefits would likely increase our tax liability. Additionally, the benefits available to an approved enterprise program are dependent upon the fulfillment of conditions stipulated under applicable law and in the certificate of approval. If we fail to comply with these conditions, in whole or in part, or fail to get approval in whole or in part, we may be required to pay additional taxes for the period in which we benefited from the tax exemption or reduced tax rates and would likely be denied these benefits in the future. In either case, the amount by which our taxes would increase will depend on the difference between the then applicable tax rate for non-approved enterprises and the rate of tax, if any, that we would otherwise pay as an approved enterprise, and the amount of any taxable income that we may earn in the future. The current maximum enterprise tax rate in Israel is 26%.
We reported material weaknesses in our controls over financial reporting in fiscal 2005 through 2007. If we are unable to maintain effective internal control over financial reporting, our ability to report our financial results on a timely and accurate basis may be adversely affected, which in turn could cause the market price of our common stock to decline.
As of January 30, 2010, we, including our principal executive officer and principal financial officer, assessed the effectiveness of our internal control over financial reporting. Based on this assessment, we determined that our internal control over financial reporting was effective as of January 30, 2010. However, prior to fiscal 2008, we had ongoing material weaknesses in our internal control over financial reporting since fiscal 2005, the first year in which we were required to evaluate our internal control over financial reporting under Section 404 of the Sarbanes-Oxley Act of 2002. Further, in September 2006, we announced that our historical financial statements should no longer be relied upon as a result of our preliminary determination of an internal review relating to our practices in administering stock option grants. We continued to have material weaknesses in our internal control over financial reporting, which resulted from ineffective internal controls over financial reporting for the year ended February 2, 2007.
As we add significant operations in locations other than our headquarters, our controls must be effectively extended to those locations which involves additional attention from us and expense to implement proper controls and monitor their effectiveness. For example, we added significant operations in Israel as a result of our acquisition of CopperGate in November 2009. We must integrate CopperGate’s operations and its substantial number of employees into our operations and transition their enterprise systems into our existing systems. We plan to utilize the one-year phase-in period for operations of a material acquisition under applicable internal control over financial reporting regulations. Until we have fully integrated CopperGate into our internal control over financial reporting, we may identify material weaknesses relating to CopperGate’s controls that existed at the time of the acquisition and we may not be able effectively integrate CopperGate’s internal control into our internal control framework, either of which could cause us to identify material weaknesses in our internal control over financial reporting in future periods.
26
Effective controls are necessary for us to provide reliable financial reports and effectively prevent fraud. If we cannot provide reliable financial reports or prevent fraud, our operating results could be harmed and the market price of our common stock could decline. We cannot be certain that we will be able to maintain adequate controls over our financial processes and reporting in the future. If we identify any material weaknesses in the future, our ability to report our financial results on a timely and accurate basis may be adversely affected. In addition, if we cannot maintain effective internal control over financial reporting and disclosure controls and procedures, investors may lose confidence in our reported financial information which could cause the market price of our common stock to decline.
The review of our historical stock option granting practices and the restatement of our prior financial statements may result in additional litigation, regulatory proceedings and government enforcement actions, which could harm our business, financial condition, results of operations and cash flows.
Our historical stock option granting practices and the related restatement of our historical financial statements, which we completed in connection with the audit of our financial statements for fiscal 2007, exposed us to greater risks associated with litigation, regulatory proceedings and government enforcement actions. For more information regarding our recent litigation and related inquiries, please see the section entitled "Legal Proceedings" under Part I, Item 3. We have provided the results of our internal review and investigation of our stock option practices to the SEC, and in that regard we have responded to informal requests for documents and additional information. While we do not believe that the SEC inquiry is still active, we intend to continue to cooperate with the SEC and any other governmental agency that may become involved in this matter. We cannot give any assurance regarding the outcomes from regulatory proceedings or government enforcement actions relating to our past stock option practices. These matters could be time consuming, expensive and may distract us from the conduct of our business. Furthermore, if we are subject to adverse findings in regulatory proceedings or government enforcement actions, we could be required to pay damages or penalties or have other remedies imposed, which could harm our business, financial condition, results of operations and cash flows.
Risks Related to Our Common Stock
Our operating results are subject to significant fluctuations due to many factors and any of these factors could adversely affect our stock price.
Our operating results have fluctuated in the past and may continue to fluctuate in the future due to a number of factors, including:
|
|
•
|
new product introductions by us and our competitors;
|
|
|
•
|
changes in our pricing models and product sales mix;
|
|
|
•
|
unexpected reductions in unit sales and average selling prices, particularly if they occur precipitously;
|
|
|
•
|
expenses related to our compliance efforts with Section 404 of the Sarbanes-Oxley Act of 2002;
|
|
|
•
|
expenses related to implementing and maintaining a new enterprise resource management system and other information technologies;
|
|
|
•
|
the level of acceptance of our products by our customers and acceptance of our customers' products by their end user customers;
|
|
|
•
|
shifts in demand for the technology embodied in our products and those of our competitors;
|
|
|
•
|
the loss of one or more significant customers;
|
|
|
•
|
the timing of, and potential unexpected delays in, our customer orders and product shipments;
|
|
|
•
|
inventory obsolescence;
|
|
|
•
|
write-downs of accounts receivable;
|
|
|
•
|
a significant increase in our effective tax rate in any particular period as a result of the exhaustion, disallowance or accelerated recognition of our net operating loss carryforwards or otherwise;
|
|
|
•
|
an interrupted or inadequate supply of semiconductor chips or other materials included in our products;
|
27
|
|
•
|
technical problems in the development, production ramp up and manufacturing of products, which could cause shipping delays;
|
|
|
•
|
availability of third-party manufacturing capacity for production of certain products; and
|
|
|
•
|
the impact of potential economic instability in the United States and Asia-Pacific region, including the continued effects of the recent worldwide economic slowdown.
|
In addition, the market prices of securities of semiconductor and other technology companies have been volatile. This volatility has significantly affected the market prices of securities of many technology companies for reasons frequently unrelated to the operating performance of the specific companies.
Accordingly, you may not be able to resell your shares of common stock at or above the price you paid. In the past, we and other companies that have experienced volatility in the market price of their securities have been, and in the future we may be, the subject of securities class action litigation.
Our stock price has demonstrated volatility and continued volatility in the stock market may cause further fluctuations or decline in our stock price.
The market for our common stock has been subject to significant volatility which is expected to continue. For example, the high and low selling prices per share of our common stock on the NASDAQ Global Market ranged from a high of $17.63 on June 22, 2009 to a low of $9.59 on February 3, 2009 during fiscal 2010. During fiscal 2009, the high and low selling prices per share of our common stock on the NASDAQ Global Market ranged from a high of $49.62 on February 4, 2008 to a low of $6.93 on November 21, 2008. This volatility is often unrelated or disproportionate to our operating performance. These fluctuations, as well as general economic and market conditions, could cause the market price of our common stock to decline.
If securities or industry analysts do not publish research or reports about our business, or if they issue an adverse opinion regarding our stock, our stock price and trading volume could decline.
The trading market for our common stock is influenced by the research and reports that industry or securities analysts publish about us or our business. If one or more of the analysts who cover us issue an adverse opinion regarding our stock, our stock price would likely decline. If one or more of these analysts cease coverage of Sigma or fail to regularly publish reports on us, we could lose visibility in the financial markets which in turn could cause our stock price or trading volume to decline.
Provisions in our organizational documents, our shareholders rights agreement and California law could delay or prevent a change in control of Sigma that our shareholders may consider favorable.
Our articles of incorporation and bylaws contain provisions that could limit the price that investors might be willing to pay in the future for shares of our common stock. Our Board of Directors can authorize the issuance of preferred stock that can be created and issued by our Board of Directors without prior shareholder approval, commonly referred to as "blank check" preferred stock, with rights senior to those of our common stock. The rights of the holders of our common stock will be subject to, and may be adversely affected by, the rights of the holders of any preferred stock that we may issue in the future. The issuance of preferred stock could have the effect of delaying, deterring or preventing a change in control and could adversely affect the voting power of your shares. In addition, our Board of Directors has adopted a shareholder rights plan that provides each share of our common stock with an associated right to purchase from us one one-thousandth share of Series D participating preferred stock at a purchase price of $58.00 in cash, subject to adjustment in the manner set forth in the rights agreement. The rights have anti-takeover effects in that they would cause substantial dilution to a person or group that attempts to acquire a significant interest in Sigma on terms not approved by our Board of Directors. In addition, provisions of California law could make it more difficult for a third party to acquire a majority of our outstanding voting stock by discouraging a hostile bid or delaying or deterring a merger, acquisition or tender offer in which our shareholders could receive a premium for their shares or a proxy contest for control of Sigma or other changes in our management.
|
ITEM 1B.
|
UNRESOLVED STAFF COMMENTS
|
None.
|
ITEM 2.
|
PROPERTIES
|
We currently lease an approximately 66,000 square foot facility in Milpitas, California that is used as our headquarters. The lease on this facility commenced on June 30, 2007 and will expire in September 2012. We also lease an approximately 26,000 square foot facility in Tel-Aviv, Israel that is used for our Israel operation. The lease for the Israel facility will expire on December 31, 2010. We also lease facilities for sales offices in Singapore, Taiwan and Newark, California and a warehouse and sales office in Hong Kong. Additionally, we lease facilities for research and development in Canada, Denmark, France, Japan and San Diego, California.
28
|
ITEM 3.
|
LEGAL PROCEEDINGS
|
From time to time, we are involved in claims and legal proceedings that arise in the ordinary course of business. We expect that the number and significance of these matters will increase as our business expands. In particular, we could face an increasing number of patent and other intellectual property claims as the number of products and competitors in our industry grows. Any claims or proceedings against us, whether meritorious or not, could be time consuming, result in costly litigation, require significant amounts of our time, result in the diversion of significant operational resources, or require us to enter into royalty or licensing agreements which, if required, may not be available on terms favorable to us or at all. Were an unfavorable outcome to occur against us, there exists the possibility of a material adverse impact on our financial position and results of operations for the period in which the unfavorable outcome occurs, and potentially in future periods.
|
ITEM 4.
|
(Reserved and Removed)
|
29
PART II
|
ITEM 5.
|
MARKET FOR THE REGISTRANT’S COMMON EQUITY, RELATED SHAREHOLDER MATTERS AND ISSUER PURCHASES OF EQUITY SECURITIES
|
Our common stock trades on The NASDAQ Global Select under the trading symbol “SIGM.” The following table sets forth the high and low sales prices per share of our common stock for each quarter in the last two fiscal years.
|
Fiscal 2010
|
Fiscal 2009
|
|||||||||||||||
|
High
|
Low
|
High
|
Low
|
|||||||||||||
|
First fiscal quarter
|
$
|
15.88
|
$
|
9.59
|
$
|
49.62
|
$
|
15.31
|
||||||||
|
Second fiscal quarter
|
17.63
|
12.63
|
26.10
|
13.57
|
||||||||||||
|
Third fiscal quarter
|
17.45
|
11.95
|
20.60
|
8.81
|
||||||||||||
|
Fourth fiscal quarter
|
12.61
|
9.95
|
11.85
|
6.93
|
||||||||||||
As of March 5, 2010, we had approximately 191 shareholders of record of our common stock.
We have never paid cash dividends on our common stock and we do not plan to pay cash dividends to our common shareholders in the foreseeable future.
For information about securities authorized for issuance under our equity compensation plans, please refer to Item 12 of Part III of this Form 10-K and Note 16 to our consolidated financial statements.
The following graph show the value of a $100 cash investment on the last business day of fiscal year 2005 in (i) our Common Stock, (ii) the NASDAQ Composite Index, and (iii) the NASDAQ Electronic Components Index. All values assume reinvestments of all dividends, if any and are calculated as of the last day of each of our fiscal years. Note that historic stock price performance shown on the graph below is not necessarily indicative of future stock price performance.
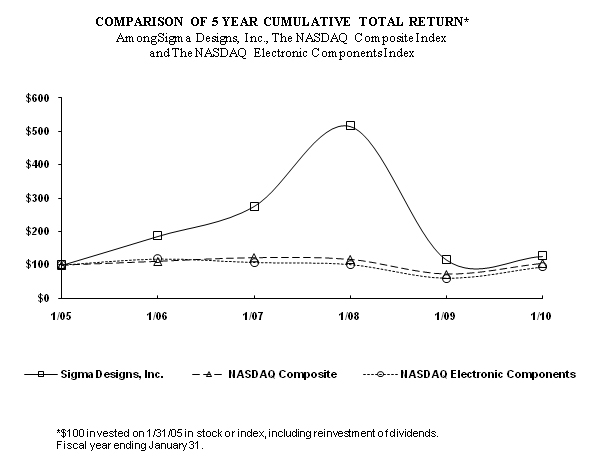
30
|
Cumulative Total Returns
|
||||||||||||||||||||||||
|
January 2005
|
January 2006
|
January 2007
|
January 2008
|
January 2009
|
January 2010
|
|||||||||||||||||||
|
Sigma Designs, Inc.
|
$
|
100.00
|
$
|
186.76
|
$
|
276.37
|
$
|
516.21
|
$
|
116.67
|
$
|
126.83
|
||||||||||||
|
NASDAQ Composite Index
|
100.00
|
111.69
|
122.94
|
117.70
|
72.63
|
105.78
|
||||||||||||||||||
|
NASDAQ Electronic
Components Index
|
100.00
|
118.30
|
107.74
|
101.56
|
60.10
|
94.28
|
||||||||||||||||||
ITEM 6. SELECTED CONSOLIDATED FINANCIAL DATA
The following selected consolidated financial data should be read in conjunction with our consolidated financial statements, the notes related thereto, and Management’s Discussion and Analysis of Financial Condition and Results of Operations. The consolidated statements of operations data for the years ended January 30, 2010, January 31, 2009 and February 2, 2008, and the consolidated balance sheets data as of January 30, 2010 and January 31, 2009 have been derived from and should be read in conjunction with our audited consolidated financial statements and the notes thereto included elsewhere in this Annual Report on Form 10-K. The consolidated statements of operations data for the years ended February 3, 2007 and January 28, 2006 and the consolidated balance sheets data as of February 2, 2008, February 3, 2007 and January 28, 2006 are derived from consolidated financial statements which are not included herein.
|
Fiscal Years Ended
|
||||||||||||||||||||
|
(In thousands, except per share data)
|
January 30,
|
January 31,
|
February 2,
|
February 3,
|
January 28,
|
|||||||||||||||
|
2010
|
2009
|
2008
|
2007
|
2006
|
||||||||||||||||
|
Consolidated Statements of Operations Data:
|
||||||||||||||||||||
|
Net revenue
|
$
|
206,083
|
$
|
209,160
|
$
|
221,206
|
$
|
91,218
|
$
|
33,320
|
||||||||||
|
Income (loss) from operations
|
3,201
|
25,619
|
57,301
|
5,857
|
(4,569
|
)
|
||||||||||||||
|
Net income (loss)
|
2,455
|
26,423
|
70,209
|
6,244
|
(1,561
|
)
|
||||||||||||||
|
Basic net income (loss) per share
|
0.09
|
0.98
|
2.73
|
0.28
|
(0.07
|
)
|
||||||||||||||
|
Diluted net income (loss) per share
|
0.09
|
0.95
|
2.46
|
0.24
|
(0.07
|
)
|
||||||||||||||
|
(In thousands)
|
January 30,
|
January 31,
|
February 2,
|
February 3,
|
January 28,
|
|||||||||||||||
|
2010
|
2009
|
2008
|
2007
|
2006
|
||||||||||||||||
|
Consolidated Balance Sheets Data:
|
||||||||||||||||||||
|
Working capital
|
$
|
165,990
|
$
|
175,329
|
$
|
263,178
|
$
|
38,784
|
$
|
27,826
|
||||||||||
|
Total assets
|
423,897
|
330,947
|
379,466
|
76,084
|
40,357
|
|||||||||||||||
|
Total shareholders' equity
|
368,822
|
305,250
|
345,592
|
52,972
|
30,677
|
|||||||||||||||
The following table presents details of the total share-based compensation expense, excluding tender offer payments associated with the adjustments to measurement dates for option grants, that is included in each functional line item in the consolidated statements of operations data above (in thousands):
|
Fiscal Years Ended
|
||||||||||||||||||||
|
January 30,
|
January 31,
|
February 2,
|
February 3,
|
January 28,
|
||||||||||||||||
|
2010
|
2009
|
2008
|
2007
|
2006
|
||||||||||||||||
|
Supplemental Data on Share-based Compensation
|
||||||||||||||||||||
|
Expense:
|
||||||||||||||||||||
|
Cost of revenue
|
$
|
358
|
$
|
359
|
$
|
559
|
$
|
380
|
$
|
84
|
||||||||||
|
Research and development
|
5,334
|
5,294
|
3,577
|
2,815
|
650
|
|||||||||||||||
|
Selling and marketing
|
1,861
|
2,115
|
1,005
|
825
|
353
|
|||||||||||||||
|
General and administrative
|
1,240
|
4,905
|
2,068
|
1,246
|
495
|
|||||||||||||||
|
$
|
8,793
|
$
|
12,673
|
$
|
7,209
|
$
|
5,266
|
$
|
1,582
|
|||||||||||
31
|
ITEM 7.
|
MANAGEMENT’S DISCUSSION AND ANALYSIS OF FINANCIAL CONDITION AND RESULTS OF OPERATIONS
|
You should read the following discussion in conjunction with our consolidated financial statements and related notes. Except for historical information, the following discussion contains forward-looking statements within the meaning of Section 27A of the Securities Exchange Act of 1933 and Section 21E of the Securities Exchange Act of 1934.
Overview
We are a leading fabless provider of highly integrated SoC solutions that are used to deliver multimedia entertainment throughout the home. We currently offer four separate product lines: media processors, home networking solutions, video image processors and home automation solutions. Each of these product lines also contributes to our fully integrated SoC offerings. We sell our products into four primary markets, which are the IPTV market, the connected home technologies market, the connected media player market and the prosumer and industrial audio/video market. We also sell our products, to a lesser extent, into several other markets, such as the HDTV and PC-based add-in markets, which we refer to collectively as our other market.
Our primary target markets are IPTV, connected home technologies, connected media player, and prosumer and industrial audio/video. The IPTV set-top box market consists of consumer and commercial products that distribute and receive streaming video using IP. The connected home technologies market is served by our home networking and home automation product lines. Our home networking products are used in IPTV set-top boxes as well as residential gateways, optical network terminals, multi-dwelling unit masters and network adapters. Our home automation products are used in a wide variety of home control products such as thermostats, light switches and door locks. Our UWB products target HDAV, speaker and home networking solutions over coax and wireless. The connected media player market consists primarily of digital media adapters, portable media devices and Blu-ray DVD players that perform playback of digital media stored in optical or hard disk formats. The prosumer and industrial audio/video market consists of studio quality audio/video receivers and monitors, digital projectors and medical video monitors. We also sell products into other markets such as the HDTV, PC-based add-in and connectivity markets. We derive minor net revenue from sales of our products into these other markets.
We target the connected home technologies market with our CopperGate, Z-Wave and UWB products. To date, we have not generated significant revenue from our UWB products.
We believe we are the leading provider of digital media processor SoCs as well as home network chipsets for set-top boxes in the IPTV market in terms of units shipped. Our products are used by leading IPTV set-top box providers, such as Cisco Systems/Scientific-Atlanta, Motorola, Netgem and UTStarcom. IPTV set-top boxes incorporating our chipsets are deployed by telecommunications carriers globally including carriers in Asia, Europe and North America such as AT&T, Deutsche Telekom and Freebox. We work with these carriers and set-top box providers as well as with systems software providers, such as Microsoft, to design solutions that address the carriers' specific requirements regarding features and performance.
Our media processor SoCs are also used by consumer electronics providers, such as Netgear, Sharp, Sony and Western Digital in applications such as DMAs, Blu-ray DVD players, HDTVs and other connected media player devices. Our CopperGate products are used by leading IPTV set-top box and residential gateway providers, such as 2Wire, Cisco Systems/Scientific-Atlanta and Motorola. These solutions are deployed by telecommunications carriers globally, but primarily in North America, such as AT&T, Telus and Bell Aliant. Our VXP video image processor products are one of the leading solutions for studio-quality video image processing and are used by leading industry participants such as Polycom, Sony, Harris and Panasonic. Our Z-Wave home automation products are used by leading industry participants such as Danfoss, Ingersoll-Rand (Schlage), Leviton and Trane.
For both fiscal 2010 and 2009, we derived 99%, of our net revenue from our SoC solutions. Our SoC solutions consist of highly integrated semiconductors and software that process digital video and audio content. Our net revenue from sales of our SoC solutions decreased $2.5 million, or 1%, in fiscal 2010 compared to fiscal 2009. This decrease in our SoCs sales in fiscal 2010 was in part attributable to the overall slowdown in the IPTV market as a result of macroeconomic conditions, partially offset by the acquisition of CopperGate.
We do not enter into long-term commitment contracts with our customers and receive substantially all of our net revenue based on purchase orders. We forecast demand for our products based not only on our assessment of the requirements of our direct customers, but also on the anticipated requirements of the telecommunications carriers that our customers serve. We work with both our direct customers and these carriers to address the market demands and the necessary specifications for our technologies. However, our failure to accurately forecast demand can lead to product shortages that can impede production by our customers and harm our relationship with these customers or lead to excess inventory, which could negatively impact our gross margins in a particular period.
32
Many of our target markets are characterized by intense price competition. In addition, the semiconductor industry is highly competitive and, as a result, we expect our average selling prices to decline over time. However, on occasion, we have reduced our prices for individual customer volume orders as part of our strategy to obtain a competitive position in our target markets. The willingness of customers to design our SoCs into their products depends to a significant extent upon our ability to sell our products at competitive prices. If we are unable to reduce our costs sufficiently to offset any declines in product selling prices or are unable to introduce more advanced products with higher margins in a timely manner, we could see declines in our market share or gross margins. We expect our gross margins will vary from period to period due to changes in our average selling prices, volume order discounts, mix of product sales, our costs, the extent of development fees and provisions for inventory obsolescence.
Critical Accounting Policies and Estimates
The preparation of financial statements and related disclosures in conformity with accounting principles generally accepted in the United States, or US GAAP requires us to make judgments, assumptions and estimates that affect the amounts reported in the consolidated financial statements and accompanying notes. Note 1 of the notes to consolidated financial statements describes the significant accounting policies and methods used in the preparation of the consolidated financial statements. We consider the accounting policies described below to be our critical accounting policies. These critical accounting policies are impacted significantly by judgments, assumptions and estimates used in the preparation of the consolidated financial statements and actual results could differ materially from the amounts reported based on these policies.
Revenue recognition: We derive our revenue primarily from three principal sources: product sales and, to a lesser extent, product development contracts and service contracts. We generally recognize revenue for product sales and service contracts in accordance with Financial Accounting Standards Board, or FASB, Accounting Standard Codification, or ASC 605, Revenue Recognition (formerly Staff Accounting Bulletin, or SAB No. 104, Revenue Recognition), under which revenue is recognized when persuasive evidence of an arrangement exists, delivery has occurred or service has been rendered, the fee is fixed or determinable and collectability is reasonably assured.
Revenue from product sales to OEMs, distributors and end users are generally recognized upon shipment, as shipping terms are predominantly FOB shipping point, except that revenue is deferred when we cannot reasonably estimate the amount of returns or where collectability is not assured. In those situations, revenue is recognized when collection subsequently becomes probable and returns are estimable. Allowances for sales returns, discounts and warranty costs are recorded at the time that the associated revenue is recognized.
Business Combinations: We are required to allocate the purchase price of acquired companies to the tangible and intangible assets acquired and liabilities assumed, as well as in-process research and development, or IPR&D, based on their estimated fair values. Such valuations require us to make significant estimates and assumptions, especially with respect to intangible assets. The significant purchased intangible assets recorded by us include customer relationships, developed technology, IPR&D and trademarks.
Critical estimates in valuing intangible assets include but are not limited to: future expected cash flows from acquired products, customer relationships and acquired developed technologies and patents; expected costs to develop IPR&D into commercially viable products and estimating cash flows from projects when completed; brand awareness and market position, as well as assumptions about the period of time the brand will continue to be used in our product portfolio; and discount rates. The estimated fair values are based upon assumptions that we believe to be reasonable, but which are inherently uncertain and unpredictable and, as a result, actual results may differ from estimates.
Valuation of Goodwill and Intangible Assets: We review goodwill and intangible assets with indefinite lives for impairment annually and whenever events or changes in circumstances indicate the carrying value of goodwill may not be recoverable in accordance with ASC 350, Intangibles—Goodwill and Other (formerly SFAS 142, Goodwill and Other Intangible Assets). Purchased intangible assets with finite useful lives are amortized using the straight-line method over their estimated useful lives and are reviewed for impairment under ASC 360, Property, Plant, and Equipment (formerly SFAS 144, Accounting for the Impairment of Disposal of Long-Lived Assets). Determining the fair value of a reporting unit is judgmental in nature and involves the use of significant estimates and assumptions. These estimates and assumptions include revenue growth rates and forecasted operating margins used to calculate projected future cash flows, risk-adjusted discount rates, future economic and market conditions and determination of appropriate market comparables. We base our fair value estimates on assumptions we believe to be reasonable. Actual future results may differ from those estimates.
Income taxes: Income taxes are accounted for under an asset and liability approach in accordance with ASC 740, Income Taxes (formerly Statement of Financial Accounting Standard, or SFAS No. 109, Accounting for Income Taxes). Deferred income taxes reflect the net tax effects of any temporary differences between the carrying amounts of assets and liabilities for financial reporting purposes and the amounts used for income tax purposes, and any operating losses and tax credit carryforwards. Deferred tax liabilities are recognized for future taxable amounts and deferred tax assets are recognized for future deductions, net of any valuation allowance, to reduce deferred tax assets to amounts that are considered more likely than not to be realized.
33
Under ASC 740, Income Taxes (formerly FASB Interpretation No. 48, or FIN48, Accounting for Uncertainty in Income Tax), the impact of an uncertain income tax position on the income tax return must be recognized as the largest amount that is more-likely-than-not to be sustained upon audit by the relevant taxing authority. An uncertain income tax position will not be recognized if it has less than a 50% likelihood of being sustained. Additionally, ASC 740 provides guidance on de-recognition, classification, interest and penalties, accounting in interim periods, disclosure and transition.
Valuation of inventories: Inventories are stated at the lower of standard cost, which approximates actual cost on a first-in, first-out basis or market value. We evaluate our ending inventories for excess quantities and obsolescence on a quarterly basis. This evaluation includes analysis of historical and forecasted sales levels by product. A provision is recorded for inventories on hand in excess of forecasted demand. In addition, we will write off inventories that are considered obsolete. Obsolescence is determined from several factors, including competitiveness of product offerings, market conditions and product life cycles. Increases to the allowance for excess and obsolete inventory are charged to cost of revenue. At the point of the loss recognition, a new, lower-cost basis for that inventory is established and subsequent changes in facts and circumstances do not result in the restoration or increase in that newly established cost basis. If this lower-costed inventory is subsequently sold, the related allowance is matched to the movement of related product inventory, resulting in lower costs and higher gross margins for those products.
Share-based compensation: In accordance with ASC 718, Compensation—Stock Compensation (formerly SFAS No. 123(R), Share-Based Payment), we determine the fair value of share-based payment awards on the date of grant utilizing an option-pricing model, which is impacted by our common stock price as well as a change in assumptions regarding a number of highly complex and subjective variables. These variables include, but are not limited to, our expected common stock price volatility over the term of the option awards, as well as the projected employee option exercise behaviors (expected period between stock option vesting date and stock option exercise date). Option-pricing models have been developed for use in estimating the value of traded options that have no vesting or hedging restrictions and are fully transferable. Because employee stock options have certain characteristics that are significantly different from traded options, and changes in the subjective assumptions can materially affect the estimated fair value, in our opinion, the existing Black-Scholes option-pricing model may not provide an accurate measure of the fair value of employee stock options. Although the fair value of employee stock options is determined in accordance with ASC 718 using an option-pricing model, that value may not be indicative of the fair value observed in a willing buyer/willing seller market transaction. ASC 718 requires forfeitures to be estimated at the time of grant and revised, if necessary, in subsequent periods if actual forfeitures differ from those estimates.
Valuation of marketable securities: Our marketable securities include ARS, corporate bonds and US agency notes. We classify our marketable securities as available-for-sale and report them at fair value with the related unrealized gains and losses included in accumulated other comprehensive income. We monitor all our marketable securities for impairment and if these securities are reported to have a decline in fair value, use significant judgment to identify events or circumstances that would likely have a significant adverse effect on the future value of each investment including: (i) the nature of the investment; (ii) the cause and duration of any impairment; (iii) the financial condition and future prospects of the issuer; (iv) for securities with a reported decline in fair value, our ability to hold the security for a period of time sufficient to allow for any anticipated recovery of fair value; (v) the extent to which fair value may differ from cost; and (vi) a comparison of the income generated by the securities compared to alternative investments. We recognize an impairment charge if a decline in the fair value of our marketable securities is judged to be other-than-temporary.
At January 30, 2010, we held nine auction rate securities with an adjusted cost and par value of $40.8 million. Auction rate securities are bought and sold in the marketplace through a bidding process sometimes referred to as a “Dutch auction.” Historically, the fair value of our ARS has been determined by the frequent auction periods, generally every 28 days, which provided liquidity at par value for these investments. However, subsequent to February 2008, all auctions involving such securities held by us have failed. The result of a failed auction is that these ARS continue to pay interest in accordance with their terms at each respective auction date; however, liquidity of the securities will continue to be limited until there is a successful auction, the issuer redeems the securities, the securities mature or until such time as other markets for these ARS develop. We cannot be certain regarding the amount of time it will take for an auction market or other markets to develop for these securities. In October 2008, our cash investment advisor, UBS, acknowledged our acceptance of its proposal of a comprehensive settlement agreement, in which all the ARS currently in our portfolio could be redeemed at par value. The offer to redeem will be at our option during a two year period beginning in June 2010. The offer also gives UBS the discretion to buy any or all of these securities from us at par value at any time. Additionally, the proposed solution by UBS to the lack of liquidity of our ARS included a commitment effective October 2008 through June 2010 to loan an amount up to 75% of the par value of the ARS. The interest charged on such loan would be equal to the proportional amount of interest being paid by the issuers of the ARS borrowed against. At January 30, 2010, UBS provided an estimated value for the nine ARS of approximately $35.8 million, which reflects an unrealized loss of $5.0 million from our original purchase price. We have not adopted UBS’ estimated value of our ARS for the reasons described below.
34
We have reviewed the prospectuses for each of the nine ARS in our investment portfolio as of January 30, 2010 and determined that the unprecedented disruption in the auction process and resulting pattern of interest payments was in accordance with their established rules of operation under these circumstances. The default mechanism called for in the operating rules of these instruments is designed to adjust their interest payments to a limit based on the income generated by their underlying student loans. The most significant consequences of this mechanism are the preservation of their AAA credit rating while adjusting to a continuing stream of interest payments to the security holders at a rate correlating to contemporary credit market rates.
As a result of this review, we reached the conclusion that the securities do have a strong underlying principle value and that any potential adjustment in their carrying value would be based upon our ability to endure their lack of liquidity, the degree of certainty of continuing interest payments and the rate of return on these securities. Given that we expect considerable liquidity from our other assets, foresee continuing positive cash flow and have accepted our investment advisor’s offer to purchase all of our ARS at par value in June 2010, we do not consider the remaining possible liquidity risk and UBS default risk to be significant enough to justify a reduction in the carrying value. The remaining valuation factor that we considered was the rate of return evidenced by the interest received. We used a discounted cash flow calculation that reached a valuation that was similar to other of our recent investments with comparably high credit ratings.
As a result of this judgment process and in accordance with the various accounting pronouncements in this area, we reached the conclusion that the carrying value of our ARS has not been impaired and that we have no expectation of any material adverse impact on our future results of operations, liquidity, or capital resources associated with holding these securities.
At January 30, 2010, all of our ARS are classified as short-term marketable securities and as Level 3 assets in accordance with ASC 820, Fair Value Measurements and Disclosures (formerly SFAS No. 157, Fair Value Measurements), as their valuation requires substantial judgment and estimation of factors that are not currently observable in the market due to the lack of trading in the securities. If different assumptions were used for the various inputs to the valuation approach including, but not limited to, assumptions involving the estimated lives of the ARS, the estimated cash flows over those estimated lives, and the estimated discount rates, applied to those cash flows, the estimated fair value of these investments could be significantly lower than the fair value we determined as of January 30, 2010.
Litigation and settlement costs: From time to time, we are involved in disputes, litigation and other legal proceedings. We defend these matters aggressively. However, there are many uncertainties associated with any litigation, and we cannot assure you that these actions or other third party claims against us will be resolved without costly litigation and/or substantial settlement charges. If any of these events were to happen, our business, financial condition, results of operations and cash flows could be materially and adversely affected. We record a charge equal to at least the minimum estimated liability for litigation costs or loss contingency only when both of the following conditions are met: (i) information available prior to issuance of the financial statements indicates that it is probable that an asset had been impaired or a liability had been incurred at the date of the financial statements and (ii) the range of loss can be reasonably estimated. However, the actual liability in any such litigation may be materially different from our estimates, which could result in the need to record additional expense.
Accounts receivable: We defer recognition of revenue and the related receivable when we cannot estimate whether collectability is reasonably assured at the time products and services are delivered to our customer. We also provide allowances for bad debt and sales returns. In establishing our allowance for bad debt we review the customer's payment history and information regarding their credit worthiness. In establishing our allowance for sales returns, we make estimates of potential future returns of products for which revenue has been recognized in the current period, including analyzing historical returns, current economic trends and changes in customer demand and acceptance of our products. In fiscal 2010, 2009 and 2008, we recorded provisions for sales returns, discounts and bad debt in the total amounts of $0.5 million, $0.9 million and $0.6 million, respectively. If the financial condition of our customers were to deteriorate, resulting in an impairment of their ability to make payments, or future product returns increased, additional allowances may be required.
35
Results of Operations
The following table is derived from our consolidated statements of operations and sets forth our historical operating results as a percentage of net revenue for each of the fiscal years indicated (in thousands, except percentages):
|
Years Ended
|
||||||||||||||||||||||||
|
January 30,
|
% of
|
January 31,
|
% of
|
February 2,
|
% of
|
|||||||||||||||||||
|
2010
|
Net revenue
|
2009
|
Net revenue
|
2008
|
Net revenue
|
|||||||||||||||||||
|
Net revenue
|
$
|
206,083
|
100%
|
$
|
209,160
|
100%
|
$
|
221,206
|
100%
|
|||||||||||||||
|
Cost of revenue
|
114,381
|
56%
|
108,606
|
52%
|
108,408
|
49%
|
||||||||||||||||||
|
Gross profit
|
91,702
|
44%
|
100,554
|
48%
|
112,798
|
51%
|
||||||||||||||||||
|
Operating expenses:
|
||||||||||||||||||||||||
|
Research and development
|
52,644
|
25%
|
43,558
|
21%
|
31,384
|
14%
|
||||||||||||||||||
|
Sales and marketing
|
17,617
|
9%
|
12,101
|
6%
|
10,226
|
5%
|
||||||||||||||||||
|
General and administrative
|
18,240
|
9%
|
17,705
|
8%
|
13,887
|
6%
|
||||||||||||||||||
|
Acquired in-process research and development
|
—
|
—
|
1,571
|
1%
|
—
|
—
|
||||||||||||||||||
|
Total operating expenses
|
88,501
|
43%
|
74,935
|
36%
|
55,497
|
25%
|
||||||||||||||||||
|
Income from operations
|
3,201
|
1%
|
25,619
|
12%
|
57,301
|
26%
|
||||||||||||||||||
|
Interest income and other income, net
|
1,906
|
1%
|
5,698
|
3%
|
5,782
|
3%
|
||||||||||||||||||
|
Income before income taxes
|
5,107
|
2%
|
31,317
|
15%
|
63,083
|
29%
|
||||||||||||||||||
|
Provision for (benefit from) income taxes
|
2,652
|
1%
|
4,894
|
2%
|
(7,126
|
)
|
(3%)
|
|||||||||||||||||
|
Net income
|
$
|
2,455
|
1%
|
$
|
26,423
|
13%
|
$
|
70,209
|
32%
|
|||||||||||||||
Net revenue
Our net revenue for fiscal 2010 decreased $3.1 million, or 1%, compared to fiscal 2009. This decrease in revenue for fiscal 2010 was primarily due to a 19% decline in the average selling price of our SoCs which was partially offset by a 21% increase in SoC units shipped. The decline in average selling prices, or ASPs was primarily the result of shipments to our larger customers, who achieved cumulative volume pricing discounts on purchases of our products as well as shipments of our CopperGate and Z-Wave products, which we added to our product line in the fiscal fourth quarters of 2010 and 2009, respectively, and which have lower ASPs than our media processor and VXP products. The increase in SoC units shipped was primarily due to higher units shipped for our connected home technologies products as a result of our CopperGate and Zensys acquisitions and, to a lesser extent, our connected media player products.
Our net revenue for fiscal 2009 decreased approximately $12.0 million, or 5%, compared to fiscal 2008. This decrease in revenue for fiscal 2009 was primarily due to an approximate 10% decline in average selling prices of our SoCs which was partially offset by an increase in SoC units shipped. The decline in average selling prices was primarily the result of certain customers achieving cumulative volume sales targets during the year on purchases of our mature SMP8630 series SoC products. This decline in average selling prices was not offset by the increase in SoC units shipped during fiscal 2009 compared to fiscal 2008 due to a reduction in inventory levels in our customers supply chains.
36
Net revenue by target market
We sell our products into four primary target markets, which are the IPTV market, the connected media player market, the prosumer and industrial audio/video market and the connected home technologies market. We also sell our products, to a lesser extent, into several other markets, such as the HDTV and PC-based add-in markets, which we refer to collectively as our other market. We expect net revenue from sales into the connected home technologies market to increase in absolute dollars and as a percentage of total net revenue in future periods as we begin to sell new products acquired in connection with the acquisition of CopperGate into this target market. The following table sets forth our net revenue by target market and the percentage of net revenue represented by our product sales to each target market (in thousands, except percentages):
|
Years Ended
|
||||||||||||||||||||||||
|
January 30,
|
% of
|
January 31,
|
% of
|
February 2,
|
% of
|
|||||||||||||||||||
|
2010
|
Net revenue
|
2009
|
Net revenue
|
2008
|
Net revenue
|
|||||||||||||||||||
|
IPTV
|
$
|
134,856
|
65%
|
$
|
164,334
|
79%
|
$
|
164,143
|
74%
|
|||||||||||||||
|
Connected media players
|
44,636
|
22%
|
30,069
|
14%
|
49,127
|
22%
|
||||||||||||||||||
|
Prosumer and industrial audio/video
|
7,221
|
4%
|
8,099
|
4%
|
—
|
—
|
||||||||||||||||||
|
Connected home technologies
|
18,512
|
9%
|
876
|
*
|
—
|
—
|
||||||||||||||||||
|
Other
|
858
|
*
|
5,782
|
3%
|
7,936
|
4%
|
||||||||||||||||||
|
Net revenue
|
$
|
206,083
|
100%
|
$
|
209,160
|
100%
|
$
|
221,206
|
100%
|
|||||||||||||||
* The percentage of net revenue is less than one percent.
IPTV: For fiscal 2010, net revenue from sales of our SoC solutions, primarily our SMP8630 SoC series, into the IPTV market decreased $29.5 million, or 18%, from fiscal 2009. This decline was attributable to certain factors affecting the IPTV demand including weakness in our IPTV market that we have experienced since the beginning of the second half of fiscal 2009 as a result of the general economic downturn and the impact of declining average selling prices due to certain customers achieving cumulative volume pricing discounts on purchases of our products. Our revenue from the IPTV market as a percentage of our total net revenue decreased by 14% for fiscal 2010 compared to fiscal 2009 as a result of these factors and also due to the increase in net revenue for our connected media player and connected home technologies markets.
For fiscal 2009, net revenue from sales of our SoC solutions, primarily our SMP8630 SoC series, into the IPTV market increased $0.2 million, or 0.1%, from fiscal 2008. The relatively flat growth in 2009 was attributable to an overall slowdown in the IPTV market in the second half of fiscal 2009 as a result of the economic downturn and adjustments to inventory levels at our customers and throughout the supply chain. Our revenue from the IPTV market increased by 5% as a percentage of our total revenue for fiscal 2009 as compared to fiscal 2008, primarily due to the decrease in SoCs shipped to our customers in the connected media player market during the same period. We expect our revenue from the IPTV market to fluctuate in future periods as this revenue is based on IPTV service deployments by telecommunication service providers, changes in inventory levels at the contract manufacturers that supply them and competitive market pressures.
Connected media player: For fiscal 2010, net revenue from sales of our products to the connected media players market increased $14.6 million, or 48%, from fiscal 2009. The increase was primarily attributable to increased unit sales of our SoCs to customers who incorporate our SoCs into digital media adapters. For the same reason, our revenue from the connected media players market as a percentage of our total net revenue for fiscal 2010 increased 8% compared to fiscal 2009.
For fiscal 2009, net revenue from sales of our products to the connected media player market decreased $19.1 million, or 39%, from fiscal 2008. This decrease was primarily attributable to a reduction in sales to customers who incorporate our SoCs into Blu-ray players as a result of increased competition. For the same reason, our percentage of net revenue from sales into the connected media player market decreased 8% as a percentage of our total revenue during the same period.
Prosumer and industrial audio/video: For fiscal 2010, net revenue from sales of our products into the prosumer and industrial audio/video market decreased $0.9 million, or 11%, from fiscal 2009. The decline was attributable to an overall slowdown in the prosumer and industrial audio/video market as a result of the global economic downturn. Our revenue from sales into the prosumer and industrial audio/video market as a percentage of total net revenue was unchanged for fiscal 2010 compared to fiscal 2009. For fiscal 2009, net revenue from sales of our products into the prosumer and industrial audio/video market was $8.1 million. We entered into this market through our acquisition of the VXP Group in February 2008.
37
Connected home technologies: Prior to the second quarter of fiscal 2010, we referred to our connected home technologies target market as our wireless market. We believe the connected home technologies market that we currently address with our CopperGate, UWB and Z-Wave product lines more accurately describes our target market. For fiscal 2010, net revenue from sales of our products into our connected home technologies market increased $17.6 million compared to fiscal 2009. This increase was the result of our acquisition of CopperGate in November 2009 and Zensys Holdings Corporation in December 2008. For the same reason, our percentage of net revenue from sales into the connected home technologies market increased to 9% as a percentage of our total net revenue.
For fiscal 2009, net revenue from sales of our products into the connected home technologies market increased by $0.9 million, or 100%, from fiscal 2008. This increase was the result of our entry into the connected home technologies market through our acquisition of Zensys Holdings Corporation in December 2008. We expect our net revenue from this market to increase in both absolute dollars and as a percentage of net revenue as we expand sales of our Z-Wave product line and add sales from our CopperGate product line.
Other: Our other markets consist of HDTV, PC add-in boards, development kits, development contracts, services and other ancillary markets. For fiscal 2010, net revenue from this market decreased $4.9 million, or 85%, compared to fiscal 2009. The decrease was primarily due to lower engineering development fees for customization of our SoCs and a decline in sales of our SoCs to customers who incorporate our products into HDTVs. For fiscal 2009, other revenue decreased by $2.2 million primarily attributable to a decline in sales of our SoCs to customers who incorporate our product in the HDTV market as a result of increased competition.
Net revenue by product group
Our primary product group consists of our SoC solutions. To a lesser extent we derive net revenue from other products and services. The following table sets forth net revenue in each of our product groups and the percentage of net revenue represented by each product group (in thousands, except percentages):
|
Years Ended
|
||||||||||||||||||||||||
|
January 30,
|
% of Net
|
January 31,
|
% of Net
|
February 2,
|
% of Net
|
|||||||||||||||||||
|
2010
|
revenue
|
2009
|
revenue
|
2008
|
revenue
|
|||||||||||||||||||
|
SoCs
|
$
|
204,613
|
99%
|
$
|
207,096
|
99%
|
$
|
216,703
|
98%
|
|||||||||||||||
|
Other
|
1,470
|
1%
|
2,064
|
1%
|
4,503
|
2%
|
||||||||||||||||||
|
Net revenue
|
$
|
206,083
|
100%
|
$
|
209,160
|
100%
|
$
|
221,206
|
100%
|
|||||||||||||||
SoCs: Our SoCs are targeted toward manufacturers and large volume designer and manufacturer customers building products for our IPTV, connected media player, prosumer and industrial audio/video and connected home technologies consumer electronic markets. The decrease of $2.5 million, or 1%, in net revenue from SoCs for fiscal 2010 compared to fiscal 2009 was due primarily to a 19% decline in average selling price of our SoCs which was partially offset by a 21% increase in SoC units shipped. The decline in average selling prices was primarily the result of shipments to our larger customers, who achieved cumulative volume pricing discounts on purchases of our products as well as sales of our CopperGate and Z-Wave products which we added to our product line in the fiscal fourth quarters of 2010 and 2009, respectively, which have lower average selling prices than our media processor products. The increase in SoC units shipped was primarily due to higher units volume shipped for our connected home technologies products as a result of our CopperGate and Zensys acquisitions and, to a lesser extent, our connected media player products.
The decrease of $9.6 million, or 4%, in net revenue from SoCs in fiscal 2009 compared to fiscal 2008 was due primarily to an approximate 10% decline in average selling prices of our SoCs which was partially offset by an increase of SoC units shipped. The decline in average selling prices was primarily the result of certain customers achieving cumulative volume sales targets during the year on purchases of our mature SoC products. This decline in average selling prices was not offset by the increase in SoC units shipped during fiscal 2009 compared to fiscal 2008 primarily due to a reduction in inventory levels in our customers supply chains.
Other: We derive revenue from other products and services, including engineering support services for hardware and software, engineering development for customization of SoCs and other accessories. The decrease in our net revenue from other products of $0.6 million, or 29%, for fiscal 2010 compared to fiscal 2009 was primarily due to a reduction in nonrecurring engineering fees. The decrease of $2.4 million, or 54%, in our net revenue from other products in fiscal 2009 from fiscal 2008 was due to a reduction in engineering development and service fees and sales of development kits. We anticipate our net revenue from board products will be relatively flat or decrease in future periods due to our strategic decision to focus on our SoC solutions.
38
Net revenue by geographic region
The following table sets forth our net revenue by geographic region and the percentage of net revenue represented by each geographic region based on the invoicing location of each customer (in thousands, except percentages):
|
Years Ended
|
||||||||||||||||||||||||
|
January 30,
|
% of
|
January 31,
|
% of
|
February 2,
|
% of
|
|||||||||||||||||||
|
2010
|
Net revenue
|
2009
|
Net revenue
|
2008
|
Net revenue
|
|||||||||||||||||||
|
Asia
|
$
|
161,081
|
78%
|
$
|
116,583
|
56%
|
$
|
153,146
|
69%
|
|||||||||||||||
|
Europe
|
38,118
|
19%
|
80,067
|
38%
|
56,782
|
26%
|
||||||||||||||||||
|
North America
|
6,856
|
3%
|
12,464
|
6%
|
11,173
|
5%
|
||||||||||||||||||
|
Other regions
|
28
|
*
|
46
|
*
|
105
|
*
|
||||||||||||||||||
|
Net revenue
|
$
|
206,083
|
100%
|
$
|
209,160
|
100%
|
$
|
221,206
|
100%
|
|||||||||||||||
* The percentage of net revenue is less than one percent.
Asia: Our net revenue in absolute dollars from Asia increased $44.5 million, or 38%, in fiscal 2010 compared to fiscal 2009. Our net revenue from Asia increased 22% as a percentage of our total net revenue for fiscal 2010 compared to fiscal 2009. The increase in net revenue from Asia in both absolute dollars and as a percentage of our total net revenue was primarily attributable to an increase in revenue from customers in Taiwan and China which was primarily attributable to a significant customer shifting its production orders from a contract manufacturer located in Europe to contract manufacturers in those countries. In addition, net revenue from Taiwan increased due to a customer ramping production of their DMA product. This increase in both absolute dollars and as a percentage of our total net revenue was partially offset by a decline in the average selling prices of our SoCs.
Our net revenue in absolute dollars from Asia decreased $36.6 million, or 24%, in fiscal 2009 as compared to fiscal 2008. The decrease in net revenue from Asia in both absolute dollars and as a percentage of our net revenue was primarily attributable to the decline in revenues from customers in Japan and Korea due to unit volume decline in Blu-ray DVD players and in Singapore due to a reduction in inventory levels in our customers in the supply chain related to IPTV during fiscal 2009.
The following table sets forth the percentage of net revenue from countries in the Asia region that accounted for over 10% of net revenue:
|
Years Ended
|
||||||||||||
|
January 30,
|
January 31,
|
February 2,
|
||||||||||
|
2010
|
2009
|
2008
|
||||||||||
|
Taiwan
|
26%
|
10%
|
*
|
|||||||||
|
China
|
21%
|
12%
|
*
|
|||||||||
|
Singapore
|
18%
|
21%
|
24%
|
|||||||||
|
Korea
|
*
|
*
|
19%
|
|||||||||
|
Japan
|
*
|
*
|
12%
|
|||||||||
* Net revenue from this country was less than 10% of our net revenue.
Europe: Our net revenue in absolute dollars from Europe for fiscal 2010 decreased $41.9 million, or 52%, compared to fiscal 2009. Our net revenue from Europe decreased 19% as a percentage of our total net revenue for fiscal 2010 compared to fiscal 2009. The decrease in our net revenue from Europe in both absolute dollars and as a percentage of our total net revenue was primarily attributable to an IPTV customer who incorporates our products into their finished goods moving their production orders to contract manufacturers located in Asia starting in the third quarter of fiscal 2009 and also due to IPTV customers whose demand declined due to continued weakness in the IPTV market that we have experienced since the beginning of the second half of fiscal 2009 as a result of the general economic downturn and the impact of declining average selling prices due to certain customers achieving cumulative volume pricing discounts on purchases of our products.
Our net revenue in absolute dollars from Europe for fiscal 2009 increased $23.3 million, or 41%, as compared to fiscal 2008. The increase in our net revenue from Europe in both absolute dollars and as a percentage of our net revenue was primarily attributable to major deployments by our European customers in France using our SoCs in their IPTV set-top boxes.
Our net revenue from Europe in any given period fluctuates depending on whether our customers place their orders locally or through their overseas manufacturers who incorporate our SoCs into their final products.
The following table sets forth the percentage of net revenue from countries in the Europe region that accounted for 10% or more of net revenue:
39
|
Years Ended
|
||||||||||||
|
January 30,
|
January 31,
|
February 2,
|
||||||||||
|
2010
|
2009
|
2008
|
||||||||||
|
France
|
15%
|
15%
|
14%
|
|||||||||
|
Netherlands
|
*
|
12%
|
*
|
|||||||||
* Net revenue from this country was less than 10% of our net revenue.
North America: Our net revenue in absolute dollars from North America decreased $5.6 million, or 45%, for fiscal 2010 compared to fiscal 2009. Net revenue from North America decreased 3% as a percentage of total net revenue for fiscal 2010 compared to fiscal 2009. The decrease in our net revenue from North America in both absolute dollars and as a percentage of our net revenue was primarily attributable to customers who incorporate our products into their finished goods placing their orders through contract manufacturers located outside of North America. Our net revenue in absolute dollars from North America increased $1.3 million, or 12%, for fiscal 2009 compared to fiscal 2008. Our net revenue from North America increased 1% as a percentage of our total net revenue for fiscal 2009 compared to fiscal 2008. The increase in our net revenue from North America in absolute dollars and as a percentage of our net revenue in fiscal 2009 was primarily attributable to increased demand for our SoC solutions for the prosumer and industrial audio/video markets as a result of our acquisition of the VXP product line in February 2008. However, the overall trend has been for companies located in North America who incorporate our products into their finished products to move their production orders to large designers and manufacturers located in the Asia region.
Our revenue from North America in any given period fluctuates depending on whether our customers place their orders locally or through overseas manufacturers who incorporate our products into their final products.
In fiscal 2010, our net revenue generated outside North America was 97% of our net revenue compared to 94% in fiscal 2009 and 95% in fiscal 2008. We expect that net revenue outside of North America will continue to account for a significant portion of our net revenue.
Major Customers
The following table sets forth the major customers that accounted for over 10% of net revenue:
|
Years Ended
|
||||||||||||
|
January 30,
|
January 31,
|
February 2,
|
||||||||||
|
Customer
|
2010
|
2009
|
2008
|
|||||||||
|
Motorola
|
21%
|
21%
|
23%
|
|||||||||
|
Gemtek
|
12%
|
*
|
*
|
|||||||||
|
Cisco Systems **
|
*
|
22%
|
*
|
|||||||||
|
Uniquest Corp.
|
*
|
*
|
19%
|
|||||||||
|
Macnica, Inc.
|
*
|
*
|
12%
|
|||||||||
* Net revenue from customer was less than 10% of our net revenue.
** Starting in the third quarter of fiscal 2009, Cisco Systems, Inc. began processing its orders with us through multiple third-party contract manufacturers.
Gross Profit and Gross Margin
The following table sets forth gross profit and gross margin (in thousands):
|
Years Ended
|
||||||||||||||||||||
|
January 30,
|
%
|
January 31,
|
%
|
February 2,
|
||||||||||||||||
|
2010
|
change
|
2009
|
change
|
2008
|
||||||||||||||||
|
Gross profit
|
$
|
91,702
|
-9%
|
100,554
|
-11%
|
$
|
112,798
|
|||||||||||||
|
Gross margin
|
44%
|
48%
|
51%
|
|||||||||||||||||
The $8.9 million decrease in gross profit, or 4 percentage point decrease in gross margin, for fiscal 2010 compared to fiscal 2009, was due primarily to a 19% decline in our average selling prices per SoC which was partially offset by a 15% decline in our average costs per SoC unit. The decline in average selling prices was primarily the result of certain customers achieving cumulative volume pricing discounts on purchases of our products and the addition of products with lower ASPs in our Z-Wave and CopperGate product lines. The decline in our average cost per SoC unit was primarily due to overall cost reductions from our suppliers as well as improved yields on our highest volume products. The decline in our average cost was partially offset by operations overhead increasing by $2.8 million, or 50%, for fiscal 2010 compared to fiscal 2009. This increase was primarily due to a $2.3 million increase in amortization of acquired intangibles and $0.4 million increase in compensation and benefits costs due to our acquisitions of CopperGate and Zensys in November 2009 and December 2008, respectively. Additionally, our gross margin in fiscal 2010 was lower compared to fiscal 2009 due to an increase of $3.2 million in connection with mark-up on inventories purchased through our acquisitions of CopperGate and Zensys.
40
The $12.2 million decrease in gross profit, or 3 percentage point decrease in gross margin for fiscal 2009 compared to fiscal 2008, was due primarily to the 5% decrease in revenues as well as a 10% decline in our average selling prices per SoC unit which was only partially offset by a 2% decline in our average costs per SoC unit. Our average cost per unit did not decline as fast as our average selling prices due to a buildup of more expensive wafers in our die bank in the second quarter of fiscal 2009 that was not consumed as demand decreased due to a reduction in inventory levels in our customer’s supply chain. Additionally, we experienced an aggregate increase of $1.5 million in amortization of acquired intangibles due to the VXP and Zensys acquisitions that were completed in fiscal 2009, a $1.4 million increase in write downs for excess and slow moving inventory and a $1.3 million increase in goldwire costs for material used in our SMP8630 series SoC assembly process.
Provisions for excess and obsolete inventory included in cost of revenue were $0.3 million in fiscal 2010, $2.1 million in fiscal 2009 and $0.7 million in 2008.
Operating Expenses
The following table sets forth operating expenses and percent changes in operating expenses (in thousands, except percentages):
|
Years Ended
|
||||||||||||||||||||
|
January 30,
|
%
|
January 31,
|
%
|
February 2,
|
||||||||||||||||
|
2010
|
change
|
2009
|
change
|
2008
|
||||||||||||||||
|
Research and development expenses
|
$
|
52,644
|
21%
|
$
|
43,558
|
39%
|
$
|
31,384
|
||||||||||||
|
Sales and marketing expenses
|
17,617
|
46%
|
12,101
|
18%
|
10,226
|
|||||||||||||||
|
General and administrative expenses
|
18,240
|
3%
|
17,705
|
27%
|
13,887
|
|||||||||||||||
|
Acquired in-process research and development
|
—
|
(100%)
|
1,571
|
100%
|
—
|
|||||||||||||||
|
Total operating expenses
|
$
|
88,501
|
18%
|
$
|
74,935
|
35%
|
$
|
55,497
|
||||||||||||
Research and development expense: Research and development expense consists primarily of compensation and benefit costs in connection with our employees engaged in research, design and development activities, including share-based compensation expense, development and design costs which consist primarily of costs related to engineering design tools, mask and prototyping costs, testing and subcontracting costs, and costs for facilities, equipment and other items.
The following table sets forth details of research and development expense for fiscal 2010, 2009 and 2008 (in thousands, except percentages):
|
Years Ended
|
||||||||||||||||||||
|
January 30,
|
%
|
January 31,
|
%
|
February 2,
|
||||||||||||||||
|
2010
|
change
|
2009
|
change
|
2008
|
||||||||||||||||
|
Compensation and benefits
|
$
|
31,600
|
29%
|
$
|
24,403
|
52%
|
$
|
16,039
|
||||||||||||
|
Share-based compensation
|
5,334
|
1%
|
5,294
|
48%
|
3,577
|
|||||||||||||||
|
Depreciation and amortization
|
5,429
|
22%
|
4,462
|
27%
|
3,502
|
|||||||||||||||
|
Development and design costs
|
6,533
|
6%
|
6,153
|
(9%)
|
6,773
|
|||||||||||||||
|
Other
|
3,748
|
15%
|
3,246
|
117%
|
1,493
|
|||||||||||||||
|
Total research and development expenses
|
$
|
52,644
|
$
|
43,558
|
$
|
31,384
|
||||||||||||||
Research and development expense increased by $9.1 million, or 21%, in fiscal 2010 compared to fiscal 2009. This increase is primarily attributable to an increase of $7.2 million in compensation and benefit expense due to increases in headcount including personnel added from our acquisition of CopperGate in November 2009 and Zensys in December 2008. The increase in research and development expenses is also attributable to an increase of $1.0 million in depreciation and amortization due to higher amortization of design tool software and an increase of $0.4 million of design costs supporting new product development. Rent and facilities costs increased $0.5 million primarily as a result of additional facilities in Israel.
41
Research and development expense increased by $12.2 million, or 39%, in fiscal 2009 compared to fiscal 2008. This increase is primarily attributable to an increase of $8.4 million in compensation and benefit expense due to an increase in headcount and salaries, an increase of $1.7 million in share-based compensation expense due to an increase in headcount, an increase of $1.0 million in depreciation and amortization due to purchases of equipment and design tool software, an increase of $0.8 million in rent and facilities costs as a result of new facilities in France and Canada, an increase of $0.6 million in travel and tradeshow costs to provide engineering support to marketing efforts, and an increase of $0.3 million in recruiting fees in support of hiring additional personnel, which was partially offset by a $0.6 million decrease in development and design costs due to lower software support and maintenance. We anticipate research and development expense will continue to increase in absolute dollars.
Sales and marketing expense: Sales and marketing expense consists primarily of compensation and benefit costs, including commissions to our direct sales force, and share-based compensation expense, trade shows, travel and entertainment expenses and external commissions.
The following table sets forth details of sales and marketing expense for fiscal 2010, 2009 and 2008 (in thousands, except percentages):
|
Years Ended
|
||||||||||||||||||||
|
January 30,
|
%
|
January 31,
|
%
|
February 2,
|
||||||||||||||||
|
2010
|
change
|
2009
|
change
|
2008
|
||||||||||||||||
|
Compensation and benefits
|
$
|
8,163
|
40%
|
$
|
5,820
|
5%
|
$
|
5,561
|
||||||||||||
|
Share-based compensation
|
1,861
|
(12%)
|
2,115
|
110%
|
1,005
|
|||||||||||||||
|
Trade shows, travel and entertainment
|
1,808
|
97%
|
918
|
19%
|
770
|
|||||||||||||||
|
External commissions
|
1,536
|
28%
|
1,202
|
4%
|
1,154
|
|||||||||||||||
|
Other
|
4,249
|
108%
|
2,046
|
18%
|
1,736
|
|||||||||||||||
|
Total sales and marketing expenses
|
$
|
17,617
|
$
|
12,101
|
$
|
10,226
|
||||||||||||||
Sales and marketing expense increased by $5.5 million, or 46%, in fiscal 2010 compared to fiscal 2009. This increase is primarily attributable to an increase of $2.3 million in compensation and benefit expenses which was primarily due to an overall increase in headcount including personnel added through our acquisition of CopperGate in November 2009 and Zensys in December 2008, an increase of $0.9 million in tradeshow, travel and entertainment costs to promote our added product lines, an increase of $0.3 million in commissions paid to an external sales representative, a $1.9 million increase in amortization of acquired intangibles as a result of the CopperGate acquisition and a $0.2 million increase in rent and facilities costs as a result of new facilities in Israel, which was partially offset by a $0.2 million decrease in share-based compensation due to a charge in the third quarter of fiscal 2009 for the acceleration of an option that occurred during that period.
Sales and marketing expense increased by $1.9 million, or 18%, in fiscal 2009 compared to fiscal 2008. This increase is primarily attributable to an increase of $0.3 million in compensation and benefit expenses which was primarily due to higher headcount from acquisitions of VXP and Zensys, an increase of $1.1 million in share-based compensation expense which was primarily due to $0.7 million in acceleration of vesting of certain option grants and new grants for new hires, an increase of $0.1 million in tradeshow costs to promote our products and a $0.2 million increase in amortization of acquired intangibles as result of the VXP and Zensys acquisitions. We anticipate that our sales and marketing expense will continue to increase in absolute dollars.
General and administrative expense: General and administrative expense consists primarily of compensation and benefit costs, including share-based compensation expense, legal, accounting and other professional fees and facilities expenses.
The following table sets forth details of general and administrative expense for fiscal 2010, 2009 and 2008 (in thousands, except percentages):
|
Years Ended
|
||||||||||||||||||||
|
January 30,
|
%
|
January 31,
|
%
|
February 2,
|
||||||||||||||||
|
2010
|
change
|
2009
|
change
|
2008
|
||||||||||||||||
|
Compensation and benefits
|
$
|
5,209
|
26%
|
$
|
4,134
|
20%
|
$
|
3,433
|
||||||||||||
|
Share-based compensation
|
1,240
|
(75%)
|
4,905
|
137%
|
2,068
|
|||||||||||||||
|
Legal and accounting fees
|
5,145
|
9%
|
4,715
|
(21%)
|
5,948
|
|||||||||||||||
|
Outside service fees
|
3,832
|
99%
|
1,921
|
93%
|
995
|
|||||||||||||||
|
Other
|
2,814
|
39%
|
2,030
|
41%
|
1,443
|
|||||||||||||||
|
Total general and administrative expenses
|
$
|
18,240
|
$
|
17,705
|
$
|
13,887
|
||||||||||||||
42
General and administrative expense in fiscal 2010 increased $0.5 million, or 3%, compared to fiscal 2009. This increase is primarily attributable to a $1.1 million increase in compensation and benefits due to an overall increase in headcount including personnel added through our acquisition of CopperGate in November 2009 and Zensys in December 2008, an increase of $0.4 million in legal and accounting fees primarily due to legal fees related to the acquisition of CopperGate, an increase of $1.9 million of outside service fees primarily due to consulting fees related to the acquisition of CopperGate and a $0.8 million increase primarily in rent and facilities costs and depreciation as a result of new facilities in Israel, partially offset by a $3.7 million decrease in share-based compensation expense primarily due to a charge of $2.4 million during the first quarter of fiscal 2009 for an option granted and fully vested during that period and a $1.1 million reduction due to an option cancellation recorded in the first quarter of fiscal 2010.
General and administrative expense in fiscal 2009 increased $3.8 million, or 27%, compared to fiscal 2008. This increase is primarily attributable to an increase of $2.8 million in share-based compensation expense, an increase of $0.7 million in compensation and benefit expenses primarily as result of increased headcount due to the establishment of operations in Singapore and the acquisitions of VXP and Zensys, an increase of $0.9 million in outside service fees primarily due to our management information system implementation, an increase of $0.9 million in audit and tax fees primarily due to implementation costs of our international tax strategy, an increase of $0.5 million in insurance costs and an increase of $0.2 million in travel, entertainment and other expenses. These increases were partially offset by a decrease of $2.1 million in legal fees, which was higher in fiscal 2008 primarily due to the review of our historical stock option granting practices. We expect our general and administrative expense will continue to increase in absolute dollars.
Acquired in-process research and development: Acquired in-process research and development, or IPR&D, totaled $1.6 million in fiscal 2009 as a result of the VXP Group acquisition completed in February 2008. The amount of the purchase price allocated to IPR&D was determined through established valuation techniques used in the high technology industry and was expensed upon acquisition as it was determined that the underlying projects had not reached technological feasibility and no alternative future use existed.
Share-based compensation expense: The following table sets forth the total share-based compensation expense, excluding tender offer payments associated with the adjustments to measurement dates for option grants, that is included in each functional line item in the consolidated statements of operations (in thousands):
|
Fiscal Years Ended
|
||||||||||||
|
January 30,
|
January 31,
|
February 2,
|
||||||||||
|
2010
|
2009
|
2008
|
||||||||||
|
Supplemental Data on Share-based Compensation Expense:
|
||||||||||||
|
Cost of revenue
|
$
|
358
|
$
|
359
|
$
|
559
|
||||||
|
Research and development
|
5,334
|
5,294
|
3,577
|
|||||||||
|
Selling and marketing
|
1,861
|
2,115
|
1,005
|
|||||||||
|
General and administrative
|
1,240
|
4,905
|
2,068
|
|||||||||
|
$
|
8,793
|
$
|
12,673
|
$
|
7,209
|
|||||||
Accounting for employee stock option grants will continue to have an adverse impact on our results of operations. The amount of unearned share-based compensation currently estimated to be expensed in the period fiscal 2011 through 2014 related to unvested share-based payment awards at January 30, 2010 is $33.8 million. The weighted average period over which the unearned share-based compensation is expected to be recognized is approximately 3.6 years. The decrease in share-based compensation expense for fiscal 2010 compared to fiscal 2009 is primarily due to the charge of $2.4 million during the first quarter of fiscal 2009 for an option granted and fully vested during that period and a $1.1 million reduction due to a specific option cancellation recorded in the first quarter of fiscal 2010. Future share-based compensation expense and unearned share-based compensation will increase to the extent that we grant additional equity awards to employees or assume unvested equity awards in connection with any acquisitions.
Amortization of intangible assets
Amortization expense of $4.6 million, $2.3 million and $0.8 million for acquired developed technology for fiscal 2010, 2009 and 2008, respectively, is classified as cost of sales in our consolidated statements of operations. Amortization expense of $19,000, $0.5 million and $0.5 million for acquired noncompete agreements for fiscal 2010, 2009 and 2008, respectively, is classified as research and development expense. Amortization expense of $2.1 million and $0.1 million for acquired trademarks and customer relationships for fiscal 2010 and 2009 is classified as sales and marketing expense. No amortization expense was classified as sales and marketing expense for fiscal 2008. At January 30, 2010, the unamortized balance from purchased intangible assets was $125.6 million which will be amortized in future periods based on their respective remaining estimated useful lives. If we purchase additional intangible assets in the future, our cost of revenue or other operating expenses will increase by the amortization of those assets.
43
Acquired intangible assets, subject to amortization, were as follows as of January 30, 2010 (in thousands, except for years):
|
Gross Value
|
Accumulated Amortization
|
Net Value
|
Weighted average remaining amortization period (years)
|
||||||||||
|
Developed technology
|
$
|
72,513
|
$
|
8,414
|
$
|
64,099
|
6.7
|
||||||
|
Trademarks
|
2,677
|
389
|
2,288
|
5.3
|
|||||||||
|
Noncompete agreements
|
1,400
|
1,400
|
—
|
—
|
|||||||||
|
Customer relationships
|
50,423
|
1,942
|
48,481
|
7.0
|
|||||||||
|
$
|
127,013
|
$
|
12,145
|
$
|
114,868
|
6.8
|
|||||||
|
In-process research and development
|
10,700
|
—
|
10,700
|
||||||||||
|
$
|
137,713
|
$
|
12,145
|
$
|
125,568
|
||||||||
We acquired IPR&D of $10.7 million in our acquisition of CopperGate. The fair value of the IPR&D was determined through estimates and valuation techniques based on the terms and details of the acquisition. The amounts allocated to IPR&D will not begin to be expensed until completion of the related project, as it was determined that the underlying project had not reached technological feasibility at the date of acquisition. The IPR&D project represents our next generation HomePNA product with backward compatibility to our current HomePNA and HomePlug AV products and provides increased data rates, ease of use and quality of service, or QoS. Upon completion of development, the acquired IPR&D will be amortized over its useful life.
Interest and other income, net
The following table sets forth our net interest and other income and related percentage change over the previous fiscal year for fiscal 2010, 2009 and 2008 (in thousands, except percentages):
|
Years Ended
|
||||||||||||||||||||
|
January 30,
|
%
|
January 31,
|
%
|
February 2,
|
||||||||||||||||
|
20010
|
change
|
2009
|
change
|
2008
|
||||||||||||||||
|
Interest and other income, net
|
$
|
1,906
|
-67%
|
$
|
5,698
|
-1%
|
$
|
5,782
|
||||||||||||
Our other income and expense primarily consisted of interest income from marketable securities, income from refundable research and development credits, gain or loss on foreign exchange transactions, gain or loss on sales of marketable securities and interest expense. The decrease of $3.8 million, or 67%, in fiscal 2010 compared to fiscal 2009 was due primarily to a $45.9 million decrease in our cash, cash equivalents and marketable securities and a decrease in interest rates earned on our marketable securities portfolio. Our foreign exchange exposure, primarily in the Canadian dollar, Danish krone, Israeli shekel and Euro, has increased compared to fiscal 2009 as a result of our further expansion into international locations and significant volatility of the U.S. dollar in relation to those currencies. The decrease of $0.1 million, or 1%, in fiscal 2009 as compared to fiscal 2008 was due primarily to a decrease in our average interest rate achieved on our total cash, cash equivalents and marketable securities which was partially offset by an increase in our average cash, cash equivalents and marketable securities balances in fiscal 2009 compared to fiscal 2008.
Provision for (Benefit from) income taxes
We recorded a provision for income taxes of $2.7 million and $4.9 million in fiscal 2010 and 2009, respectively and a benefit from income taxes of $7.1 million in fiscal 2008. The fiscal 2010, 2009 and 2008 effective tax rate was approximately 52%, 16% and (11)%, respectively. Our fiscal 2010 effective tax rate differs from the federal statutory rate of 35% primarily due to our international operations strategy, which resulted in a foreign tax differential benefit and the offsetting effect of writing off the California deferred tax assets due to our assessment that it is not more likely than not to be realized in the future. Our fiscal 2009 effective tax rate differs from the federal statutory rate of 35% primarily due to our international operations strategy, which resulted in a foreign tax differential benefit. Our fiscal 2008 effective tax rate differs from the federal statutory rate of 35% primarily due to our use of net operating losses and the release of the valuation allowance, which provided an aggregate tax benefit of $33.7 million.
44
Liquidity and Capital Resources
The following table sets forth the cash and cash equivalents and short-term marketable securities (in thousands):
|
January 30,
|
January 31,
|
|||||||
|
2010
|
2009
|
|||||||
|
Cash and cash equivalents
|
$
|
81,947
|
$
|
90,845
|
||||
|
Short-term marketable securities
|
51,176
|
28,862
|
||||||
|
$
|
133,123
|
$
|
119,707
|
|||||
As of January 30, 2010, our principal sources of liquidity consisted of cash and cash equivalents and short-term marketable securities of $133.1 million, which represents an increase of $13.4 million from $119.7 million at January 31, 2009. The increase in cash and cash equivalents and short-term marketable securities was primarily the result of $51.9 million of cash generated from our operating activities, reclassification of $40.8 million of our auction rate securities, or ARS, from long-term to short-term marketable securities, $17.3 million of net sales and maturities of marketable securities, $2.8 million in net proceeds from the sale of our common stock through our stock option plans and employee stock purchase plan and $2.2 million of redemptions of ARSs. These inflows of cash, cash equivalents and short-term marketable securities were partially offset by $89.1 million used for the acquisition of CopperGate in November 2009, $3.0 million invested in a convertible note of a privately-held technology company, purchases of $7.5 million for software, equipment and leasehold improvements, $1.5 million for purchases of long-term investments in privately held technology companies and a $0.5 million increase in restricted cash. In October 2008, we accepted an offer from our cash investment advisor, UBS, of a comprehensive settlement agreement, in which all the ARS currently held in our UBS portfolio could be redeemed at par value. The offer to redeem will be at our option during a two year period beginning in June 2010. As a result of this offer, we expect to sell all of our auction rate securities to UBS within six months from January 30, 2010. Accordingly, we have classified our auction rate securities as short-term marketable securities.
Our primary net cash inflows and outflows for each fiscal year were as follows (in thousands):
|
Years Ended
|
||||||||||||
|
January 30,
|
January 31,
|
February 2,
|
||||||||||
|
2010
|
2009
|
2008
|
||||||||||
|
Net cash provided by (used in):
|
||||||||||||
|
Operating activities
|
$
|
51,931
|
$
|
42,831
|
$
|
40,235
|
||||||
|
Investing activities
|
(64,557
|
)
|
(46,794
|
)
|
(100,149
|
)
|
||||||
|
Financing activities
|
3,420
|
(78,900
|
)
|
209,384
|
||||||||
|
Effect of foreign exchange rate changes on cash and cash equivalents
|
308
|
(381
|
)
|
206
|
||||||||
|
Net increase (decrease) in cash and cash equivalents
|
$
|
(8,898
|
)
|
$
|
(83,244
|
)
|
$
|
149,676
|
||||
Cash flows from operating activities
Net cash provided by operating activities of $51.9 million for fiscal 2010 was primarily due to net income of $2.5 million, non-cash expenses of $21.9 million, a $27.1 million decrease in inventories, a $1.2 million decrease in prepaid expenses and other assets and a $3.0 million increase in accounts payable. These amounts were partially offset by a $3.2 million increase in accounts receivable and a $0.6 million decrease in accrued and other liabilities. Non-cash expenses included in net income in fiscal 2010 consisted primarily of $13.2 million in depreciation and amortization and $8.8 million in share-based compensation expense.
The decrease in inventories was the result of successful efforts to reduce the level of our die bank and a significant increase in demand in the fourth fiscal quarter of 2010 which resulted in an increase in our annualized rate of inventory turns to 4.2 for fiscal 2010 compared to 3.5 for fiscal 2009. The increase in accounts payable was primarily due to the timing of payment for inventories. The increase in accounts receivable was primarily the result of increased billings due to increased product shipments during the fourth quarter of fiscal 2010 compared to the fourth quarter of fiscal 2009. Our annual average days sales outstanding improved to 44 days at January 30, 2010 compared to 57 days at January 31, 2009, primarily due to timing of shipments and customer mix.
Net cash provided by operating activities was $42.8 million for fiscal 2009. The cash provided by our operating activities for fiscal 2009 was primarily due to net income of $26.4 million, non-cash operating expenses of $24.9 million, a $10.1 million decrease in accounts receivable, a $4.6 million increase in other long-term liabilities and a $0.4 million decrease in other assets. These increases were partially offset by an $18.0 million decrease in accounts payable and accrued liabilities and a $5.5 million increase in inventories. The decrease in accounts payable and accrued liabilities was due primarily to lower inventory purchases and the timing of payments for tax liabilities and software licenses during the fourth quarter of fiscal 2009 compared to the fourth quarter of fiscal 2008. The decrease in accounts receivable was primarily due to lower product revenues in the fourth quarter of fiscal 2009 compared to the fourth quarter of fiscal 2008. The increase in inventories resulted from an increase in our die bank level at the end of the fiscal 2009 compared to the end of fiscal 2008. At the end of fiscal 2008, our die bank level was low relative to the sales volume we were experiencing at that time due to rapidly increasing demand during fiscal 2008. At the end of fiscal 2009 our die bank was somewhat elevated relative to our sales volume due to a strategic build up of certain wafers for some of our key customers. The increase in other long-term liabilities is primarily due to higher deferred tax obligations which resulted in increased long-term income taxes payable and deferred tax liabilities. Non-cash charges included share-based compensation of $12.7 million, depreciation and amortization of $7.2 million, provision for sales returns, discounts and doubtful accounts of $0.9 million, provisions for excess and obsolete inventory of $2.1 million and acquired in-process research and development of $1.6 million in fiscal 2009.
45
Net cash provided by operating activities was $40.2 million for fiscal 2008. The cash provided by our operating activities for fiscal 2008 was primarily due to net income of $70.2 million, non-cash expenses of $4.2 million and a $10.4 million increase in accounts payable and other accrued liabilities. These amounts were partially offset by a $29.6 million increase in accounts receivable, a $10.9 million increase in inventories and a $4.5 million increase in prepaid expenses and other assets. The increases in accounts receivable and inventories in 2008 were the result of the increase in our sales in the IPTV, high definition DVD and other media players, and HDTV markets. Non-cash charges included share-based compensation of $7.2 million in fiscal 2008 offset by a reduction of deferred income taxes of $12.7 million.
Cash flows from our operating activities will continue to fluctuate based upon our ability to grow net revenues while managing the timing of payments to us from customers and to vendors from us, the timing of inventory purchases and subsequent manufacture and sale of our products.
Cash flow from investing activities
Net cash used in investing activities was $64.6 million for fiscal 2010 which was primarily due to net cash paid of $89.1 million in connection with the acquisition of CopperGate, purchases of software, equipment and leasehold improvements of $7.5 million, an investment of $3.0 million in a convertible note receivable of a privately-held technology company, $1.5 million of private equity investments and $0.5 million of cash restricted for our foreign exchange hedging transactions. These usages of cash in investing activities were partially offset by net sales and maturities of marketable securities of $37.0 million.
Net cash used in our investing activities was $46.8 million for fiscal 2009, which was primarily due to net cash paid of $28.5 million in connection with the acquisitions of VXP and Zensys, purchases of software, equipment and leasehold improvements of $15.7 million and purchases of private equity investments for $3.0 million, partially offset by net sales and maturities of marketable securities and long-term investment of $0.4 million.
Net cash used in our investing activities was $100.1 million for fiscal 2008, primarily due to net purchases of marketable securities of $92.6 million and purchases of software, equipment and leasehold improvements of $7.6 million.
Cash flow from financing activities
Net cash provided by financing activities was $3.4 million in fiscal 2010 which was due to $2.8 million of proceeds from exercises of employee stock options and employee stock purchases and $0.6 million of excess tax benefit from share-based compensation.
Net cash used in financing activities was $78.9 million in fiscal 2009, which was the result of $85.9 million for the repurchase of 4.2 million shares of our common stock, partially offset by $4.6 million of proceeds from the exercise of employee stock options and stock purchase rights and $2.4 million of excess tax benefit from share-based compensation.
Net cash provided by financing activities was $209.4 million in fiscal 2008, which primarily consisted of $198.9 million of net proceeds from our follow-on offering and $10.5 million of proceeds from the exercise of employee stock options.
Prior to fiscal 2007, our primary sources of funds were proceeds from the sale of our common stock. In certain periods, cash generated from operations has been a source of funds. While we generated cash from operations for fiscal 2010, 2009 and 2008, it is possible that our operations will consume cash in future periods. Based on our currently anticipated cash needs, we believe that our current reserve of cash, cash equivalents and short-term marketable securities will be sufficient to meet our anticipated working capital requirements, obligations, capital expenditures, strategic investments and other cash needs for at least the next twelve months. However, it is possible that we may need to raise additional funds to finance our activities during or beyond the next 12 months and our future capital requirements may vary significantly from those currently planned. Our cash, cash equivalent and marketable security balances will continue to fluctuate based upon our ability to grow revenue, the timing of payments to us from customers and to vendors from us and the timing of inventory purchases and subsequent manufacture and sale of our products.
46
At January 30, 2010, we held nine ARS, with an adjusted cost and par value of $40.8 million, which are all classified as short-term marketable securities. Our marketable securities consist primarily of auction rate securities, corporate bonds and US agency notes. We monitor all our marketable securities for impairment and if these securities are reported to have had a decline in fair value, we use significant judgment to identify events or circumstances that would likely have a significant adverse effect on the future value of each investment including: (i) the nature of the investment; (ii) the cause and duration of any impairment; (iii) the financial condition and near term prospects of the issuer; (iv) for securities with a reported decline in fair value, our ability to hold the security for a period of time sufficient to allow for any anticipated recovery of fair value; (v) the extent to which fair value may differ from cost; and (vi) a comparison of the income generated by the securities compared to alternative investments. We would recognize an impairment charge if a decline in the fair value of our marketable securities is judged to be other-than-temporary.
Auction rate securities are bought and sold in the marketplace through a bidding process sometimes referred to as a “Dutch auction.” Historically, the fair value of our ARS has been determined by the frequent auction periods, generally every 28 days, which provided liquidity at par value for these investments. However, subsequent to February 2008, all auctions involving such securities held by us have failed. The result of a failed auction is that these ARS will continue to pay interest in accordance with their terms at each respective auction date; however, liquidity of the securities will continue to be limited until there is a successful auction, the issuer redeems the securities, the securities mature or until such time as other markets for these ARS develop. We cannot be certain regarding the amount of time it will take for an auction market or other markets to develop for these securities. In October 2008, our cash investment advisor, UBS, acknowledged our acceptance of its proposal of a comprehensive settlement agreement, in which all the ARS currently in our portfolio could be redeemed at par value. The offer to redeem will be at our option during a two year period beginning in June 2010. The offer also gives UBS the discretion to buy any or all of these securities from us at par value at any time. Additionally, the proposed solution by UBS to the lack of liquidity of our ARS included a commitment effective October 2008 through June 2010 to loan an amount up to 75% of the par value of the ARS. The interest charged on such loan would be equal to the proportional amount of interest being paid by the issuers of the ARS borrowed against. At January 30, 2010, UBS provided an estimated value for the nine ARS of approximately $35.8 million, which reflects an unrealized loss of $5.0 million from our adjusted cost. We have not adopted UBS’ estimated value of our ARS for the reasons described below.
We have reviewed the prospectuses for each of the nine ARS in our investment portfolio as of January 30, 2010 and determined that the unprecedented disruption in the auction process and resulting pattern of interest payments was in accordance with their established rules of operation under these circumstances. The default mechanism called for in the operating rules of these instruments is designed to adjust their interest payments to a limit based on the income generated by their underlying student loans. The most significant consequences of this mechanism are the preservation of their AAA credit rating while adjusting to a continuing stream of interest payments to the security holders at a rate correlating to contemporary credit market rates.
As a result of this review, we reached the conclusion that the securities do have a strong underlying principle value and that any potential adjustment in their carrying value would be based upon our ability to endure their lack of liquidity, the degree of certainty of continuing interest payments and the rate of return on these securities. Given that we expect considerable liquidity from our other assets, foresee continuing positive cash flow and have accepted our investment advisor’s offer to purchase all of our ARS at par value in June 2010, we do not consider the remaining possible liquidity risk and UBS default risk to be significant enough to justify a reduction in their carrying value. The remaining valuation factor that we considered was the rate of return evidenced by the interest received. We used a discounted cash flow calculation that reached a valuation that was similar to other of our recent investments with comparably high credit ratings.
As a result of this judgment process and in accordance with the various accounting pronouncements in this area, we reached the conclusion that the carrying value of our ARS has not been impaired and that we have no expectation of any material adverse impact on our future results of operations, liquidity, or capital resources associated with holding these securities.
Contractual Obligations and Commitments
We generally do not have guaranteed price or quantity commitments from any of our suppliers. Additionally, we generally acquire products for sale to our customers based on purchase orders received as well as forecasts from such customers. Purchase orders with delivery dates greater than twelve weeks are typically cancelable without penalty to our customers. We currently place non-cancelable orders to purchase semiconductor wafers, other materials and finished goods from our suppliers on an eight to twelve week lead-time basis.
47
The following table sets forth the amounts of payments due under specified contractual obligations as of January 30, 2010 (in thousands):
|
Payments Due by Period
|
||||||||||||||||||||
|
Contractual Obligations
|
Fiscal 2011
|
Fiscal 2012 - 2013
|
Fiscal 2014 - 2015
|
Fiscal 2016 and thereafter
|
Total
|
|||||||||||||||
|
Operating leases
|
$
|
3,087
|
$
|
3,965
|
$
|
1,469
|
$
|
2,060
|
$
|
10,581
|
||||||||||
|
Non-cancelable purchase orders
|
23,331
|
—
|
—
|
—
|
23,331
|
|||||||||||||||
|
$
|
26,418
|
$
|
3,965
|
$
|
1,469
|
$
|
2,060
|
$
|
33,912
|
|||||||||||
Recent Accounting Pronouncements
See Note 1, “Recent Accounting Pronouncements,” of the Notes to consolidated financial statements of this Form 10-K included in Item 8 of this report.
ITEM 7A. QUANTITATIVE AND QUALITATIVE DISCLOSURES ABOUT MARKET RISK
The following discussion about our market risk disclosures involves forward-looking statements. Actual results could differ materially from those projected in the forward-looking statements. We face exposure to market risk from adverse movements in interest rates and foreign currency exchange rates, which could impact our operations and financial condition. To mitigate some of the foreign currency exchange rate risk, we utilize derivative financial instruments to hedge certain foreign currency exposures. We do not use derivative financial instruments for speculative or trading purposes.
Interest rate sensitivity: At January 30, 2010 and January 31, 2009, we held approximately $146.4 million and $192.2 million, respectively, of cash, cash equivalents and short term and long term marketable securities. If short-term interest rates were to decrease 10%, the decreased interest income associated with these cash, cash equivalents and marketable securities would not have a significant impact on our net income and cash flows.
At January 30, 2010, we held nine ARS, with an adjusted cost and par value of $40.8 million, which are all classified as short-term marketable securities. Historically, the fair value of our ARS has been determined by the frequent auction periods, generally 28 days, which provided liquidity at par value for these investments. However, subsequent to February 2008, all auctions involving such securities held by us have failed. The result of a failed auction is that these ARS will continue to pay interest in accordance with their terms at each respective auction date; however, liquidity of the securities will continue to be limited until there is a successful auction, the issuer redeems the securities, the securities mature or until such time as other markets for these ARS develop. We cannot be certain regarding the amount of time it will take for an auction market or other markets to develop for these securities.
We reviewed the prospectuses for each of the nine ARS in our investment portfolio as of January 30, 2010 and determined that the unprecedented disruption in the auction process and resulting pattern of interest payments was in accordance with their established rules of operation under these circumstances. The default mechanism called for in the operating rules of these instruments is designed to adjust their interest payments to a limit based on the income generated by their underlying student loans. The most significant consequences of this mechanism are the preservation of their AAA credit rating while adjusting to a continuing stream of interest payments to the security holders at a rate correlating to contemporary credit market rates.
As a result of this review, we reached the conclusion that the securities do have a strong underlying principle value and that any potential adjustment in their carrying value would be based upon our ability to endure their lack of liquidity, the degree of certainty of continuing interest payments and the rate of return on these securities. Given that we expect considerable liquidity from our other assets, foresee continuing positive cash flow and have accepted our investment advisor’s offer to purchase all of our ARS at par value in June 2010, we do not consider the remaining window of possible lack of liquidity to be of sufficient risk to justify a reduction in their carrying value. The remaining valuation factor that we considered was the rate of return evidenced by the interest received. We used a discounted cash flow calculation that reached a valuation that was similar to other of our recent investments with comparably high credit ratings.
As a result of this judgment process and in accordance with the various accounting pronouncements in this area, we reached the conclusion that the carrying value of our ARS has not been impaired and that we have no expectation of any material adverse impact on our future results of operations, liquidity, or capital resources associated with holding these securities.
Foreign currency exchange rate sensitivity: We derive our revenue in U.S. dollar. The U.S. dollar is our functional and reporting currency except for our subsidiaries in Canada, Denmark, France and Japan where the Canadian dollar, Danish krone, Euro and Japanese Yen are the primary financial currencies, respectively. A significant portion of our Israel subsidiary payroll related expenses, consisting principally of salaries and related personnel expenses are denominated in Israeli shekels. This foreign currency exposure gives rise to market risk associated with exchange rate movements of the U.S. dollar against the Israeli shekel. To the extent the U.S. dollar weakens against the Israeli shekel, our Israel subsidiary will experience a negative impact on its results of operations.
48
As of January 30, 2010, we had not entered into foreign exchange forward contracts to hedge certain balance sheet exposures and inter-company balances against future movements in foreign exchange rates. However, for our Israel operation, we do hedge portions of our forecasted expenses that are denominated in the Israeli shekel with foreign exchange forward contracts. As of January 30, 2010, we had foreign exchange forward and option contracts with notional amounts of $2.7 million and $1.8 million, respectively, in place to hedge certain forecasted Israeli shekels denominated operating expenses of our Israel operation. These contracts are designated as cash flow hedges pursuant to ASC 815, Derivatives and Hedging. These hedges of cash flow exposures will only mitigate a portion of our foreign exchange exposure. We will remain exposed to the currency risk of our cash flow exposures.
We maintain certain cash balances denominated in the Hong Kong dollar, Canadian dollar, Euro, Danish krone, Singapore dollar and Israeli shekel. If foreign exchange rates were to weaken against the U.S. dollar immediately and uniformly by 10% from the exchange rate at January 30, 2010, the fair value of these foreign currency amounts would decline by $0.5 million.
49
ITEM 8. FINANCIAL STATEMENTS AND SUPPLEMENTARY DATA
INDEX TO CONSOLIDATED FINANCIAL STATEMENTS
|
Page
|
|
|
Report of Independent Registered Public Accounting Firm
|
51
|
|
Consolidated Balance Sheets
|
52
|
|
Consolidated Statements of Operations
|
53
|
|
Consolidated Statements of Shareholders’ Equity and Comprehensive Income
|
54
|
|
Consolidated Statements of Cash Flows
|
55
|
|
Notes to Consolidated Financial Statements
|
56
|
50
REPORT OF INDEPENDENT REGISTERED PUBLIC ACCOUNTING FIRM
The Board of Directors and Shareholders
Sigma Designs, Inc.
Milpitas, CA
We have audited the accompanying consolidated balance sheets of Sigma Designs, Inc. and subsidiaries (“the Company”) as of January 30, 2010 and January 31, 2009, and the related consolidated statements of operations, shareholders’ equity and comprehensive income, and cash flows for each of the fiscal years in the three-year period ended January 30, 2010. We have also audited the Company’s internal control over financial reporting as of January 30, 2010, based on criteria established in Internal Control – Integrated Framework issued by the Committee of Sponsoring Organizations of the Treadway Commission (COSO). Our audits also included the financial statement schedule listed in the Index at Part IV, Item 15. The Company's management is responsible for these financial statements and schedule, for maintaining effective internal control over financial reporting, and for its assessment of the effectiveness of internal control over financial reporting, included in the accompanying Management Report on Internal Control over Financial Reporting, appearing under Item 9A. Our responsibility is to express an opinion on these financial statements and schedule and an opinion on the Company's internal control over financial reporting based on our audits.
We conducted our audits in accordance with the standards of the Public Company Accounting Oversight Board (United States). Those standards require that we plan and perform the audits to obtain reasonable assurance about whether the financial statements are free of material misstatement and whether effective internal control over financial reporting was maintained in all material respects. Our audits of the financial statements included examining, on a test basis, evidence supporting the amounts and disclosures in the financial statements, assessing the accounting principles used and significant estimates made by management, and evaluating the overall financial statement presentation. Our audit of internal control over financial reporting included obtaining an understanding of internal control over financial reporting, assessing the risk that a material weakness exists, and testing and evaluating the design and operating effectiveness of internal control based on the assessed risk. Our audits also included performing such other procedures as we considered necessary in the circumstances. We believe that our audits provide a reasonable basis for our opinions.
A company’s internal control over financial reporting is a process designed to provide reasonable assurance regarding the reliability of financial reporting and the preparation of financial statements for external purposes in accordance with generally accepted accounting principles. A company’s internal control over financial reporting includes those policies and procedures that (1) pertain to the maintenance of records that, in reasonable detail, accurately and fairly reflect the transactions and dispositions of the assets of the company; (2) provide reasonable assurance that transactions are recorded as necessary to permit preparation of financial statements in accordance with generally accepted accounting principles, and that receipts and expenditures of the company are being made only in accordance with authorizations of management and directors of the company; and (3) provide reasonable assurance regarding prevention or timely detection of unauthorized acquisition, use, or disposition of the company’s assets that could have a material effect on the financial statements.
Because of its inherent limitations, internal control over financial reporting may not prevent or detect misstatements. Also, projections of any evaluation of effectiveness to future periods are subject to the risk that controls may become inadequate because of changes in conditions, or that the degree of compliance with the policies or procedures may deteriorate.
In our opinion, the consolidated financial statements referred to above present fairly, in all material respects, the financial position of the Company as of January 30, 2010 and January 31, 2009, and the results of its operations and its cash flows for each of the years in the three-year period ended January 30, 2010 in conformity with accounting principles generally accepted in the United States of America. Also, in our opinion, the related financial statement schedule for each of the years in the three-year period ended January 30, 2010, when considered in relation to the consolidated financial statements as a whole, presents fairly in all material respects the information set forth therein. Also, in our opinion, the Company maintained, in all material respects, effective internal control over financial reporting as of January 30, 2010, based on criteria established in Internal Control – Integrated Framework issued by the Committee of Sponsoring Organizations of the Treadway Commission (COSO).
/s/ ARMANINO McKENNA LLP
San Ramon, California
April 1, 2010
51
SIGMA DESIGNS, INC.
CONSOLIDATED BALANCE SHEETS
(In thousands, except share amounts)
|
January 30,
|
January 31,
|
|||||||
|
2010
|
2009
|
|||||||
|
Assets
|
||||||||
|
Current assets:
|
||||||||
|
Cash and cash equivalents
|
$
|
81,947
|
$
|
90,845
|
||||
|
Short-term marketable securities
|
51,176
|
28,862
|
||||||
|
Restricted cash
|
1,500
|
—
|
||||||
|
Accounts receivable, net of allowances of $346 in 2010 and $534 in 2009
|
36,127
|
30,719
|
||||||
|
Inventories
|
18,187
|
36,058
|
||||||
|
Deferred tax assets
|
2,235
|
1,417
|
||||||
|
Prepaid expenses and other current assets
|
8,925
|
5,909
|
||||||
|
Total current assets
|
200,097
|
193,810
|
||||||
|
Long-term marketable securities
|
13,257
|
72,523
|
||||||
|
Software, equipment and leasehold improvements, net
|
23,810
|
21,124
|
||||||
|
Goodwill
|
44,910
|
9,928
|
||||||
|
Intangible assets, net
|
125,568
|
17,520
|
||||||
|
Deferred tax assets, net of current portion
|
11,575
|
12,824
|
||||||
|
Long-term investments
|
4,000
|
3,000
|
||||||
|
Other non-current assets
|
680
|
218
|
||||||
|
Total assets
|
$
|
423,897
|
$
|
330,947
|
||||
|
Liabilities and Shareholders' Equity
|
||||||||
|
Current liabilities:
|
||||||||
|
Accounts payable
|
$
|
10,943
|
$
|
5,655
|
||||
|
Accrued liabilities
|
23,164
|
12,826
|
||||||
|
Total current liabilities
|
34,107
|
18,481
|
||||||
|
Other long-term liabilities
|
12,528
|
5,801
|
||||||
|
Long-term deferred tax liabilities
|
8,440
|
1,415
|
||||||
|
Total liabilities
|
55,075
|
25,697
|
||||||
|
Commitments and contingencies (Note 14)
|
||||||||
|
Shareholders' equity:
|
||||||||
|
Preferred stock - no par value, 2,000,000 shares authorized; no shares issued or outstanding
|
—
|
—
|
||||||
|
Common stock and additional paid-in capital; no par value; 100,000,000 shares
authorized; 35,047,234 issued and 30,854,922 outstanding at January 30, 2010
|
||||||||
|
and 30,756,848 issued and 26,564,536 outstanding at January 31, 2009
|
421,109
|
360,908
|
||||||
|
Treasury stock, at cost, 4,192,312 shares at January 30, 2010 and January 31, 2009
|
(85,941)
|
(85,941)
|
||||||
|
Accumulated other comprehensive income
|
1,189
|
273
|
||||||
|
Retained earnings
|
32,465
|
30,010
|
||||||
|
Total shareholders' equity
|
368,822
|
305,250
|
||||||
|
Total liabilities and shareholders' equity
|
$
|
423,897
|
$
|
330,947
|
||||
See the accompanying Notes to Consolidated Financial Statements
52
SIGMA DESIGNS, INC.
CONSOLIDATED STATEMENTS OF OPERATIONS
(In thousands, except per share amounts)
|
Years Ended
|
||||||||||||
|
January 30,
|
January 31,
|
February 2,
|
||||||||||
|
2010
|
2009
|
2008
|
||||||||||
|
Net revenue
|
$
|
206,083
|
$
|
209,160
|
$
|
221,206
|
||||||
|
Cost of revenue
|
114,381
|
108,606
|
108,408
|
|||||||||
|
Gross profit
|
91,702
|
100,554
|
112,798
|
|||||||||
|
Operating expenses:
|
||||||||||||
|
Research and development
|
52,644
|
43,558
|
31,384
|
|||||||||
|
Sales and marketing
|
17,617
|
12,101
|
10,226
|
|||||||||
|
General and administrative
|
18,240
|
17,705
|
13,887
|
|||||||||
|
Acquired in-process research and development
|
—
|
1,571
|
—
|
|||||||||
|
Total operating expenses
|
88,501
|
74,935
|
55,497
|
|||||||||
|
Income from operations
|
3,201
|
25,619
|
57,301
|
|||||||||
|
Interest and other income, net
|
1,906
|
5,698
|
5,782
|
|||||||||
|
Income before income taxes
|
5,107
|
31,317
|
63,083
|
|||||||||
|
Provision for (benefit from) income taxes
|
2,652
|
4,894
|
(7,126)
|
|||||||||
|
Net income
|
$
|
2,455
|
$
|
26,423
|
$
|
70,209
|
||||||
|
Net income per share:
|
||||||||||||
|
Basic
|
$
|
0.09
|
$
|
0.98
|
$
|
2.73
|
||||||
|
Diluted
|
$
|
0.09
|
$
|
0.95
|
$
|
2.46
|
||||||
|
Shares used in computing net income per share:
|
||||||||||||
|
Basic
|
27,597
|
26,892
|
25,683
|
|||||||||
|
Diluted
|
28,235
|
27,705
|
28,550
|
|||||||||
See the accompanying Notes to Consolidated Financial Statements
53
SIGMA DESIGNS, INC.
CONSOLIDATED STATEMENTS OF SHAREHOLDERS’ EQUITY
AND COMPREHENSIVE INCOME
(In thousands, except shares)
|
Accumulated Other
|
||||||||||||||||||||||||||||||||||||||||
|
Common Stock
|
Treasury Stock
|
Comprehensive Income
|
Retained
|
|||||||||||||||||||||||||||||||||||||
|
Shareholder
|
Unrealized
|
Accumulated
|
Earnings
|
Total
|
Total
|
|||||||||||||||||||||||||||||||||||
|
Notes
|
Gain
|
Translation
|
(Accumulated
|
Shareholders'
|
Comprehensive
|
|||||||||||||||||||||||||||||||||||
|
Shares
|
Amount
|
Shares
|
Amount
|
Receivable
|
(Loss)
|
Adjustment
|
Deficit)
|
Equity
|
Income
|
|||||||||||||||||||||||||||||||
|
Balance, February 3, 2007
|
22,903,930
|
$
|
119,301
|
—
|
$
|
—
|
$
|
(58
|
)
|
$
|
16
|
$
|
335
|
$
|
(66,622
|
)
|
$
|
52,972
|
||||||||||||||||||||||
|
Net income
|
—
|
—
|
—
|
—
|
—
|
—
|
—
|
70,209
|
70,209
|
$
|
70,209
|
|||||||||||||||||||||||||||||
|
Unrealized gains on marketable securities
|
—
|
—
|
—
|
—
|
—
|
254
|
—
|
—
|
254
|
254
|
||||||||||||||||||||||||||||||
|
Currency translation adjustment
|
—
|
—
|
—
|
—
|
—
|
—
|
206
|
—
|
206
|
206
|
||||||||||||||||||||||||||||||
|
Total comprehensive income
|
70,669
|
|||||||||||||||||||||||||||||||||||||||
|
Shareholder receivable written off
|
—
|
—
|
—
|
—
|
29
|
—
|
—
|
—
|
29
|
|||||||||||||||||||||||||||||||
|
Repayment of shareholder note receivable
|
—
|
—
|
—
|
—
|
29
|
—
|
—
|
—
|
29
|
|||||||||||||||||||||||||||||||
|
Share-based compensation expense
|
—
|
6,777
|
—
|
—
|
—
|
—
|
—
|
—
|
6,777
|
|||||||||||||||||||||||||||||||
|
Non-employee share-based compensation
|
—
|
432
|
—
|
—
|
—
|
—
|
—
|
—
|
432
|
|||||||||||||||||||||||||||||||
|
Tax benefit from stock options
|
—
|
5,266
|
—
|
—
|
—
|
—
|
—
|
—
|
5,266
|
|||||||||||||||||||||||||||||||
|
Net proceeds from common stock issued under share plans
|
2,527,130
|
10,524
|
—
|
—
|
—
|
—
|
—
|
—
|
10,524
|
|||||||||||||||||||||||||||||||
|
Net proceeds from common stock issued in follow-on offering, net of offering costs
|
4,600,000
|
198,894
|
—
|
—
|
—
|
—
|
—
|
—
|
198,894
|
|||||||||||||||||||||||||||||||
|
Balance, February 2, 2008
|
30,031,060
|
341,194
|
—
|
—
|
—
|
270
|
541
|
3,587
|
345,592
|
|||||||||||||||||||||||||||||||
|
Net income
|
—
|
—
|
—
|
—
|
—
|
—
|
—
|
26,423
|
26,423
|
26,423
|
||||||||||||||||||||||||||||||
|
Unrealized loss on marketable securities
|
—
|
—
|
—
|
—
|
—
|
(157
|
)
|
—
|
—
|
(157
|
)
|
(157)
|
||||||||||||||||||||||||||||
|
Currency translation adjustment
|
—
|
—
|
—
|
—
|
—
|
—
|
(381
|
)
|
—
|
(381
|
)
|
(381)
|
||||||||||||||||||||||||||||
|
Total comprehensive income
|
25,885
|
|||||||||||||||||||||||||||||||||||||||
|
Share-based compensation expense
|
—
|
12,617
|
—
|
—
|
—
|
—
|
—
|
—
|
12,617
|
|||||||||||||||||||||||||||||||
|
Non-employee share-based compensation
|
—
|
56
|
—
|
—
|
—
|
—
|
—
|
—
|
56
|
|||||||||||||||||||||||||||||||
|
Tax benefit from stock options
|
—
|
2,440
|
—
|
—
|
—
|
—
|
—
|
—
|
2,440
|
|||||||||||||||||||||||||||||||
|
Net proceeds from common stock issued under share plans
|
725,788
|
4,601
|
—
|
—
|
—
|
—
|
—
|
—
|
4,601
|
|||||||||||||||||||||||||||||||
|
Repurchase of common stock
|
—
|
—
|
(4,192,312
|
)
|
(85,941
|
)
|
—
|
—
|
—
|
—
|
(85,941
|
)
|
||||||||||||||||||||||||||||
|
Balance, January 31, 2009
|
30,756,848
|
360,908
|
(4,192,312
|
)
|
(85,941
|
)
|
—
|
113
|
160
|
30,010
|
305,250
|
|||||||||||||||||||||||||||||
|
Net income
|
—
|
—
|
—
|
—
|
—
|
—
|
—
|
2,455
|
2,455
|
2,455
|
||||||||||||||||||||||||||||||
|
Unrealized gain on marketable securities
|
—
|
—
|
—
|
—
|
—
|
93
|
—
|
—
|
93
|
93
|
||||||||||||||||||||||||||||||
|
Currency translation adjustment
|
—
|
—
|
—
|
—
|
—
|
—
|
823
|
—
|
823
|
823
|
||||||||||||||||||||||||||||||
|
Total comprehensive income
|
$
|
3,371
|
||||||||||||||||||||||||||||||||||||||
|
Issuance of common stock for CopperGate acquisition
|
3,931,352
|
48,513
|
—
|
—
|
—
|
—
|
—
|
—
|
48,513
|
|||||||||||||||||||||||||||||||
|
Share-based compensation expense
|
—
|
8,758
|
—
|
—
|
—
|
—
|
—
|
—
|
8,758
|
|||||||||||||||||||||||||||||||
|
Non-employee share-based compensation
|
—
|
35
|
—
|
—
|
—
|
—
|
—
|
—
|
35
|
|||||||||||||||||||||||||||||||
|
Tax benefit from stock options
|
—
|
88
|
—
|
—
|
—
|
—
|
—
|
—
|
88
|
|||||||||||||||||||||||||||||||
|
Net proceeds from common stock issued under share plans
|
359,034
|
2,807
|
—
|
—
|
—
|
—
|
—
|
—
|
2,807
|
|||||||||||||||||||||||||||||||
|
Balance, January 30, 2010
|
35,047,234
|
$
|
421,109
|
(4,192,312
|
)
|
$
|
(85,941
|
)
|
$
|
—
|
$
|
206
|
$
|
983
|
$
|
32,465
|
$
|
368,822
|
||||||||||||||||||||||
See the accompanying Notes to Consolidated Financial Statements
54
SIGMA DESIGNS, INC.
CONSOLIDATED STATEMENTS OF CASH FLOWS
(In thousands)
|
Years Ended
|
||||||||||||
|
January 30,
|
January 31,
|
February 2,
|
||||||||||
|
2010
|
2009
|
2008
|
||||||||||
|
Cash flows from operating activities:
|
||||||||||||
|
Net income
|
$
|
2,455
|
$
|
26,423
|
$
|
70,209
|
||||||
|
Adjustments to reconcile net income to net cash provided by operating activities:
|
||||||||||||
|
Depreciation and amortization
|
13,169
|
7,214
|
3,375
|
|||||||||
|
Acquired in-process research and development
|
—
|
1,571
|
—
|
|||||||||
|
Share-based compensation
|
8,793
|
12,673
|
7,209
|
|||||||||
|
Shareholder note receivable written off
|
—
|
—
|
29
|
|||||||||
|
Provision for excess and obsolete inventory
|
259
|
2,055
|
669
|
|||||||||
|
Provision for sales returns, discounts and doubtful accounts
|
485
|
948
|
619
|
|||||||||
|
Deferred income taxes
|
(64)
|
610
|
(12,668)
|
|||||||||
|
Losses on disposal of software, equipment and leasehold improvements
|
212
|
2
|
12
|
|||||||||
|
Gains on sale of long-term investments
|
—
|
(39)
|
(31)
|
|||||||||
|
Tax benefit from employee stock option plan
|
88
|
2,440
|
5,266
|
|||||||||
|
Excess tax benefit from share-based compensation
|
(613)
|
(2,440)
|
(179)
|
|||||||||
|
Accretion of contributed leasehold improvements
|
(171)
|
(150)
|
(130)
|
|||||||||
|
Goodwill adjustment
|
(217)
|
—
|
—
|
|||||||||
|
Changes in operating assets and liabilities:
|
||||||||||||
|
Accounts receivable
|
(3,183)
|
10,079
|
(29,593)
|
|||||||||
|
Inventories
|
27,129
|
(5,513)
|
(10,949)
|
|||||||||
|
Prepaid expenses and other current assets
|
1,549
|
(108)
|
(4,194)
|
|||||||||
|
Other non-current assets
|
(373)
|
443
|
(284)
|
|||||||||
|
Accounts payable
|
2,978
|
(13,535)
|
4,762
|
|||||||||
|
Accrued liabilities
|
(1,596)
|
(4,421)
|
5,624
|
|||||||||
|
Other long-term liabilities
|
1,031
|
4,579
|
489
|
|||||||||
|
Net cash provided by operating activities
|
51,931
|
42,831
|
40,235
|
|||||||||
|
Cash flows from investing activities:
|
||||||||||||
|
Restricted cash
|
(500)
|
—
|
—
|
|||||||||
|
Purchase of marketable securities
|
(55,305)
|
(108,318)
|
(194,254)
|
|||||||||
|
Sales and maturities of marketable securities
|
92,351
|
108,421
|
101,656
|
|||||||||
|
Purchases of software, equipment and leasehold improvements
|
(7,469)
|
(15,691)
|
(7,582)
|
|||||||||
|
Net cash paid in connection with acquisitions
|
(89,110)
|
(28,508)
|
—
|
|||||||||
|
Purchase of long-term investments
|
(1,524)
|
(3,000)
|
—
|
|||||||||
|
Recovery of long-term investment loss
|
—
|
—
|
31
|
|||||||||
|
Net proceeds from liquidation of long-term investment
|
—
|
302
|
—
|
|||||||||
|
Purchase of convertible note receivable
|
(3,000)
|
—
|
—
|
|||||||||
|
Net cash used in investing activities
|
(64,557)
|
(46,794)
|
(100,149)
|
|||||||||
|
Cash flows from financing activities:
|
||||||||||||
|
Repurchase of common stock
|
—
|
(85,941)
|
—
|
|||||||||
|
Repayment of bank borrowings
|
—
|
—
|
(242)
|
|||||||||
|
Net proceeds from exercise of employee stock options and stock purchase rights
|
2,807
|
4,601
|
10,524
|
|||||||||
|
Excess tax benefit on share-based compensation
|
613
|
2,440
|
179
|
|||||||||
|
Repayment of shareholder note receivable
|
—
|
—
|
29
|
|||||||||
|
Proceeds from issuance of common stock, net of offering costs
|
—
|
—
|
198,894
|
|||||||||
|
Net cash provided by (used in) financing activities
|
3,420
|
(78,900)
|
209,384
|
|||||||||
|
Effect of foreign exchange rate changes on cash and cash equivalents
|
308
|
(381)
|
206
|
|||||||||
|
Increase (decrease) in cash and cash equivalents
|
(8,898)
|
(83,244)
|
149,676
|
|||||||||
|
Cash and cash equivalents at beginning of period
|
90,845
|
174,089
|
24,413
|
|||||||||
|
Cash and cash equivalents at end of period
|
$
|
81,947
|
$
|
90,845
|
$
|
174,089
|
||||||
|
Supplemental disclosure of cash flow information:
|
||||||||||||
|
Cash paid for interest
|
$
|
77
|
$
|
—
|
$
|
10
|
||||||
|
Cash paid for income taxes
|
$
|
619
|
$
|
200
|
$
|
388
|
||||||
|
Issuance of common stock in connection with acquisition
|
$
|
48,513
|
$
|
—
|
$
|
—
|
||||||
See the accompanying Notes to Consolidated Financial Statements
55
SIGMA DESIGNS, INC.
NOTES TO CONSOLIDATED FINANCIAL STATEMENTS
|
1.
|
Organization and summary of significant accounting policies
|
Organization and nature of operations: Sigma Designs, Inc. (referred to collectively in these consolidated financial statements as “Sigma,” “we,” “our” and “us”) specializes in integrated system-on-chip, or SoC solutions for the internet protocol television, or IPTV, connected media player, prosumer and industrial audio/video, connected home technologies and other markets. We sell our products to manufacturers, designers and to a lesser extent, to distributors who, in turn, sell to manufacturers.
Basis of presentation: The consolidated financial statements include Sigma Designs, Inc. and its wholly-owned subsidiaries. All intercompany balances and transactions are eliminated upon consolidation.
Accounting period: We follow a 52 or 53 week fiscal reporting calendar ending on the Saturday closest to January 31 each year. Our most recent fiscal year ended on January 30, 2010 and included 52 weeks. The fiscal years ended January 31, 2009 and February 2, 2008 included 52 weeks. Our next fiscal year, ending on January 29, 2011, will include 52 weeks.
Use of estimates: The preparation of financial statements in conformity with accounting principles generally accepted in the United States of America, or US GAAP requires us to make estimates and assumptions that affect the amounts reported in the financial statements and accompanying notes. On an ongoing basis, we evaluate our estimates, including, but not limited to, those related to income taxes, warranty obligations, litigation and settlement costs, the collectability of accounts receivable, the valuation of inventory on a lower of cost or market basis, the valuation of share-based compensation, expected future cash flows and useful lives of investments, goodwill, intangible assets and other long-lived assets. We base our estimates on historical experience and on other assumptions that we believe are reasonable under the circumstances. These estimates form the basis for making judgments about the carrying values of assets and liabilities when those values are not readily apparent from other sources. Actual results may differ materially from our estimates.
Fair value of financial instruments: For certain of our financial instruments, including cash and cash equivalents, accounts receivable, accounts payable and other current liabilities, the carrying amounts approximate their fair value due to the relatively short maturity of these items. Marketable securities consist of available-for-sale securities that are reported at fair value with the related unrealized gains and losses included in accumulated other comprehensive income, a component of shareholders’ equity. Pursuant to Accounting Standards Codification, or ASC 820, Fair Value Measurements and Disclosures (formerly Statement of Financial Accounting Standard, or SFAS 157, Fair Value Measurements), the fair value of cash equivalents and certain marketable securities is determined based on “Level 1” inputs, which consist of quoted prices in active markets for identical assets. We hold nine auction rate securities, or ARS and the fair value of ARS is determined based on “Level 3” inputs, which is valued through a discounted cash flow using significant assumptions as to the expected future interest income from those securities which is not observable in the market.
Derivative financial instruments: We account for our financial derivatives as either assets or liabilities and carry them at fair value. Changes in the fair value of derivatives that do not qualify or are not effective as hedges are recognized in earnings. We do not use derivative financial instruments for speculative or trading purposes, nor do we hold or issue leveraged derivative financial instruments.
We use foreign exchange contracts to hedge certain existing and anticipated foreign currency denominated transactions. Unrealized gains and losses arising from the effective portion of foreign exchange contracts that are designated as cash flow hedging instruments are recorded in accumulated other comprehensive income and are subsequently reclassified into earnings in the same period or periods during which the underlying transactions affect earnings. Gains and losses on the derivative representing either hedge ineffectiveness or hedge components excluded from the assessment of effectiveness are recognized in current earnings. Gains and losses arising from changes in the fair values of foreign exchange contracts that are not designated as hedging instruments are recognized in current earnings.
We formally document relationships between hedging instruments and associated hedged items. This documentation includes: identification of the specific foreign currency asset, liability, or forecasted transaction being hedged; the nature of the risk being hedged; the hedge objective; and, the method of assessing hedge effectiveness. Hedge effectiveness is formally assessed, both at hedge inception and on an ongoing basis, to determine whether the derivatives used in hedging transactions are highly effective in offsetting changes in foreign currency denominated assets, liabilities and anticipated cash flows of hedged items.
Cash and cash equivalents: We consider all highly liquid debt instruments purchased with a remaining maturity of 90 days or less to be cash equivalents.
56
Short and long-term marketable securities: Short-term marketable securities represent highly liquid debt instruments with a remaining maturity date at acquisition date of greater than 90 days but less than one year and are stated at fair value. Long-term marketable securities represent securities with contractual maturities greater than one year from the date of acquisition. Our marketable securities are classified as available-for-sale because the sale of such securities may be required prior to maturity. The differences between amortized cost (cost adjusted for amortization of premiums and accretion of discounts, which are recognized as adjustments to interest income) and fair value, representing unrealized holding gains or losses, are recorded separately as a component of accumulated other comprehensive income within shareholders’ equity. Any gains and losses on the sale of marketable securities are determined on a specific identification basis.
Accounts receivable: We defer recognition of revenue and the related receivable when we cannot estimate whether collectability is reasonably assured at the time products and services are delivered to our customer. We also provide allowances for bad debt and sales returns. In establishing the allowance for bad debt, we review the customer’s payment history and information regarding their credit worthiness. In establishing the allowance for sales returns, we make estimates of potential future returns of products for which revenue has been recognized in the current period, including analyzing historical returns, current economic trends and changes in customer demand and acceptance of our products. In fiscal 2010, 2009 and 2008, we recorded provisions for sales returns, discounts and bad debt in the total amounts of $0.5 million, $0.9 million and $0.6 million, respectively. If the financial condition of our customers were to deteriorate, resulting in an impairment of their ability to make payments, or future product returns increased, additional allowances may be required.
Inventories: Inventories are stated at the lower of standard cost (approximating a first-in, first-out basis) or market value. We evaluate our ending inventories for excess quantities and obsolescence on a quarterly basis. This evaluation includes analysis of historical and forecasted sales levels by product. A provision is recorded for inventories on hand in excess of forecasted demand. In addition, we write off inventories that are considered obsolete. Obsolescence is determined from several factors, including competitiveness of product offerings, market conditions and product life cycles. Increases to the allowance for excess and obsolete inventory are charged to cost of revenue. At the point of the loss recognition, a new, lower-cost basis for that inventory is established, and subsequent changes in facts and circumstances do not result in the restoration or increase in that newly established cost basis. If this lower-costed inventory is subsequently sold, the related allowance is matched to the movement of related product inventory, resulting in lower costs and higher gross margins for those products.
As a result of this inventory valuation review, we charged approximately $0.3 million, $2.1 million and $0.7 million to cost of revenue for fiscal 2010, 2009 and 2008, respectively.
Software, equipment and leasehold improvements: Software, equipment and leasehold improvements are stated at cost. Depreciation and amortization are computed using the straight-line method based on the useful lives of the assets (one to five years) or the lease term if shorter. The allowance for leasehold improvements received from the landlord for improvements to our current facility is amortized using the straight-line method over the lesser of the remaining lease term or the useful life of the leasehold improvements. Repairs and maintenance costs are expensed as incurred.
Long-term investments: Investments in private equity securities of less than 20% owned companies are accounted for using the cost method unless we can exercise significant influence or the investee is economically dependent upon us, in which case the equity method is used. We evaluate our long-term investments for impairment annually according to ASC 320, Investments – Debt and Equity Securities (formerly, Financial Accounting Standards Board, or FASB Staff Position, or FSP FAS115-1, The Meaning of Other-Than-Temporary Impairment and Its Application to Certain Investments). ASC 320 provides guidance for evaluating whether an investment is other-than-temporarily impaired and requires certain disclosures with respect to these investments. The guidance also includes accounting considerations subsequent to the recognition of an other-than-temporary impairment and requirements for disclosures about unrealized losses that have not been recognized as other-than-temporary impairments.
Goodwill and intangible assets: Goodwill is recorded as the difference, if any, between the aggregate consideration paid for an acquisition and the fair value of the net tangible and intangible assets acquired. The amounts and useful lives assigned to intangible assets acquired, other than goodwill, impact the amount and timing of future amortization.
We review goodwill and intangible assets with indefinite lives annually for impairment and whenever events or changes in circumstances indicate the carrying value may not be recoverable in accordance with ASC 350, Intangibles – Goodwill and Others. An impairment charge is recorded if the carrying value exceeds the assets’ fair value. Purchased intangible assets with finite useful lives are amortized using the straight-line method over their estimated useful lives and are reviewed for impairment under ASC 360, Property, Plant and Equipment. Determining the fair value of a reporting unit is judgmental in nature and involves the use of significant estimates and assumptions. These estimates and assumptions include revenue growth rates and forecasted operating margins used to calculate projected future cash flows, risk-adjusted discount rates, future economic and market conditions and determination of appropriate market comparables. We base our fair value estimates on assumptions we believe to be reasonable. Actual future results may differ from those estimates.
57
Revenue recognition: We derive our revenue from three sources: product sales, and, to a lesser extent, product development contracts and service contracts. We recognize revenue for product sales and service contracts in accordance with ASC 605, Revenue Recognition (formerly Staff Accounting Bulletin, or SAB No. 104, Revenue Recognition), under which revenue is recognized when persuasive evidence of an arrangement exists, delivery has occurred or service has been rendered, the fee is fixed or determinable and collectability is reasonably assured.
Revenue from product sales to original equipment manufacturers, or OEM, distributors and end users is generally recognized upon shipment, as shipping terms are predominantly FOB shipping point, except that revenue is deferred when we cannot reasonably estimate the amount of returns or where collectability is not assured. In those situations, revenue is recognized when collection subsequently becomes probable and returns are estimable. Allowances for sales returns, discounts and warranty costs are recorded at the time that the associated revenue is recognized.
Foreign currency: The functional currency of our foreign subsidiaries is either the U.S. dollar or the local currency of each country. Where the local currency is the functional currency, gains and losses from the translation of the financial statements of the foreign subsidiaries are included in shareholders’ equity. Transaction gains and losses, which are included in interest and other income, net, in the accompanying consolidated statements of operations were net losses of approximately $0.6 million, $34,000 and $0.1 million for fiscal 2010, 2009 and 2008, respectively.
Concentration of credit risk: Financial instruments which potentially subject us to concentrations of credit risk consist primarily of cash and cash equivalents, short-term and long-term marketable securities, restricted cash, long-term investments and accounts receivable. Our cash, cash equivalents, short-term and long-term marketable securities and restricted cash are on deposit with major financial institutions. Such deposits may be in excess of insured limits. We believe that the financial institutions that hold our cash are financially sound and, accordingly, minimal credit risk exists with respect to these balances. We have not experienced any investment losses due to institutional failure or bankruptcy. We perform ongoing credit evaluations of our customers and generally do not require collateral for sales on credit. We review our accounts receivable balances to determine if any receivables will potentially be uncollectible and include any amounts that are determined to be uncollectible in our allowance for doubtful accounts.
Income taxes: Income taxes are accounted for under an asset and liability approach in accordance with ASC 740, Income Taxes (formerly SFAS No. 109, Accounting for Income Taxes). Deferred income taxes reflect the net tax effects of any temporary differences between the carrying amounts of assets and liabilities for financial reporting purposes and the amounts reported for income tax purposes, and any operating losses and tax credit carryforwards. Deferred tax liabilities are recognized for future taxable amounts and deferred tax assets are recognized for future deductions, net of any valuation allowance, to reduce deferred tax assets to amounts that are considered more likely than not to be realized.
Under ASC 740, Income Taxes (formerly FASB Interpretation No. 48, or FIN48, Accounting for Uncertainty in Income Tax), the impact of an uncertain income tax position on the income tax return must be recognized as the largest amount that is more-likely-than-not to be sustained upon audit by the relevant taxing authority. An uncertain income tax position will not be recognized if it has less than a 50% likelihood of being sustained. Additionally, ASC 740 provides guidance on de-recognition, classification, interest and penalties, accounting in interim periods, disclosure and transition. The total amount of unrecognized tax benefits as of January 30, 2010 was $18.8 million.
Share-based compensation: We apply ASC 718, Compensation—Stock Compensation (formerly SFAS No. 123(R), Share-Based Payment), to measure and recognize compensation expense for all share-based payment awards made to employees and directors based on estimated fair values. ASC 718 requires companies to estimate the fair value of share-based payment awards on the date of grant using an option-pricing model. The value of the portion of the award that is ultimately expected to vest is recognized as expense over the requisite service period in our consolidated statements of operations. ASC 718 requires forfeitures to be estimated at the time of grant and revised, if necessary, in subsequent periods if actual forfeitures differ from those estimates.
58
The effect of recording employee share-based compensation expense on the consolidated statements of operations for fiscal 2010, 2009 and 2008 was as follows (in thousands):
|
Years Ended
|
||||||||||||
|
January 30, 2010
|
January 31, 2009
|
February 2, 2008
|
||||||||||
|
Share-based compensation expense by type of award:
|
||||||||||||
|
Stock options
|
$
|
7,998
|
$
|
11,954
|
$
|
6,358
|
||||||
|
Employee stock purchase plan
|
760
|
663
|
419
|
|||||||||
|
Total share-based compensation expense
|
8,758
|
12,617
|
6,777
|
|||||||||
Long-lived assets: We account for long-lived assets, including purchased intangible assets, in accordance with ASC 360. Long-lived assets are evaluated for impairment whenever events or changes in circumstances, such as a change in technology, indicate that the carrying amount of an asset may not be recoverable. An impairment loss would be recognized when the sum of the undiscounted future net cash flows expected to result from the use of the asset and its eventual disposal is less than its carrying amount.
Research and development costs: Costs incurred in the research and development of our products are expensed as incurred. Costs associated with the development of computer software are expensed prior to the establishment of technological feasibility and capitalized in certain cases thereafter until the product is available for general release to customers.
Comprehensive income: Comprehensive income consists of net income and other comprehensive income (loss). Other comprehensive income (loss) includes certain changes in equity that are excluded from results of operations. Specifically, foreign currency translation adjustments and unrealized gains or losses on marketable securities are included in accumulated other comprehensive income (loss) in the accompanying consolidated balance sheets.
Recent accounting pronouncements: During the third quarter of fiscal year 2010, we adopted Accounting Standards Codification, or ASC, issued by the FASB. This standard established only two levels of GAAP, authoritative and nonauthoritative. The ASC became the source of authoritative, nongovernmental GAAP, except for rules and interpretive releases of the SEC, which are sources of authoritative GAAP for SEC registrants. All other non-grandfathered, non-SEC accounting literature not included in the ASC became nonauthoritative. This standard was effective for financial statements for interim or annual reporting periods ending after September 15, 2009. We began to use the new guidelines and numbering system prescribed by the ASC when referring to GAAP in the third quarter of fiscal year 2010. As the ASC was not intended to change or alter existing GAAP, it did not have any impact on our consolidated financial statements.
In September 2009, the FASB reached a consensus on Accounting Standards Update, or ASU 2009-13, Revenue Recognition (Topic 605) – Multiple-Deliverable Revenue Arrangements, or ASU 2009-13 and ASU 2009-14, Software (Topic 985) – Certain Revenue Arrangements That Include Software Elements, or ASU 2009-14. ASU 2009-13 modifies the requirements that must be met for an entity to recognize revenue from the sale of a delivered item that is part of a multiple-element arrangement when other items have not yet been delivered. ASU 2009-13 eliminates the requirement that all undelivered elements must have either: i) vendor-specific objective evidence, or VSOE or ii) third-party evidence, or TPE, before an entity can recognize the portion of an overall arrangement consideration that is attributable to items that already have been delivered. In the absence of VSOE or TPE of the standalone selling price for one or more delivered or undelivered elements in a multiple-element arrangement, entities will be required to estimate the selling prices of those elements. Overall arrangement consideration will be allocated to each element (both delivered and undelivered items) based on their relative selling prices, regardless of whether those selling prices are evidenced by VSOE or TPE or are based on the entity’s estimated selling price. The residual method of allocating arrangement consideration has been eliminated. ASU 2009-14 modifies the software revenue recognition guidance to exclude from its scope tangible products that contain both software and non-software components that function together to deliver a product’s essential functionality. These new updates are effective for revenue arrangements entered into or materially modified in fiscal years beginning on or after June 15, 2010. Early adoption is permitted. We are currently evaluating the impact that the adoption of these ASUs will have on our consolidated financial statements.
In January 2010, the FASB issued ASU 2010-06, Fair Value Measurements and Disclosures (Topic 820): Improving Disclosures about Fair Value Measurements. This ASU provides amendments that clarify existing disclosures on levels of disaggregation, inputs and valuation techniques to improve transparency in financial reporting. ASU 2010-06 also requires new disclosures on transfers in and out of Level 1 and Level 2, and activity in Level 3 fair value measurements. This amendment is effective for interim and annual reporting periods beginning after December 15, 2009 except for the disclosures about purchases, sales, issuance and settlements in the roll-forward of activity in Level 3 fair value measurements. Those disclosures are effective for fiscal years beginning after December 15, 2010 and for interim periods within those fiscal years. We are currently evaluating the impact that the adoption of this ASU will have on our consolidated financial statements.
59
|
2.
|
Share repurchase program
|
On February 27, 2008, we announced that our Board of Directors had approved a share repurchase program that authorized us to repurchase up to 2.0 million shares of our common stock. On March 18, 2008, we announced that our Board of Directors had approved an increase of 3.0 million additional shares to the program, resulting in a total amount authorized to be repurchased under the share repurchase program of 5.0 million shares. The share repurchase program had a one-year term, and thus, terminated on March 17, 2009. We purchased a cumulative total of approximately 4.2 million shares of our common stock pursuant to the repurchase program for an aggregate purchase price of $85.9 million at an average price of $20.50 per share in fiscal 2009. We did not repurchase any shares under this program in fiscal 2010 before the program was terminated on March 17, 2009.
60
|
3.
|
Cash, cash equivalents and marketable securities
|
Cash, cash equivalents and marketable securities consist of the following (in thousands):
|
January 30, 2010
|
January 31, 2009
|
|||||||||||||||||||||||
|
Book
|
Net unrealized
|
Fair
|
Book
|
Net unrealized
|
Fair
|
|||||||||||||||||||
|
Value
|
Gain
|
Value
|
Value
|
Gain
|
Value
|
|||||||||||||||||||
|
Money market funds
|
$
|
32,911
|
$
|
—
|
$
|
32,911
|
$
|
59,213
|
$
|
—
|
$
|
59,213
|
||||||||||||
|
Auction rate securities
|
40,750
|
—
|
40,750
|
43,000
|
—
|
43,000
|
||||||||||||||||||
|
Corporate bonds
|
17,143
|
195
|
17,338
|
26,529
|
52
|
26,581
|
||||||||||||||||||
|
US agency discount notes
|
4,500
|
5
|
4,505
|
16,015
|
28
|
16,043
|
||||||||||||||||||
|
Municipal bonds and notes
|
1,834
|
6
|
1,840
|
15,728
|
33
|
15,761
|
||||||||||||||||||
|
Total cash equivalents and marketable securities
|
$
|
97,138
|
$
|
206
|
$
|
97,344
|
$
|
160,485
|
$
|
113
|
$
|
160,598
|
||||||||||||
|
Cash on hand held in the United States
|
18,328
|
1,650
|
||||||||||||||||||||||
|
Cash on hand held overseas
|
30,708
|
29,982
|
||||||||||||||||||||||
|
Total cash on hand
|
49,036
|
31,632
|
||||||||||||||||||||||
|
Total cash, cash equivalents and marketable securities
|
$
|
146,380
|
$
|
192,230
|
||||||||||||||||||||
|
Reported as:
|
||||||||||||||||||||||||
|
Cash and cash equivalents
|
$
|
81,947
|
$
|
90,845
|
||||||||||||||||||||
|
Short-term marketable securities
|
51,176
|
28,862
|
||||||||||||||||||||||
|
Long-term marketable securities
|
13,257
|
72,523
|
||||||||||||||||||||||
|
$
|
146,380
|
$
|
192,230
|
|||||||||||||||||||||
The amortized cost and estimated fair value of cash equivalents and marketable securities, by contractual maturity, are shown below (in thousands). Actual maturities may differ from contractual maturities.
|
January 30, 2010
|
January 31, 2009
|
|||||||||||||||
|
Book
|
Fair
|
Book
|
Fair
|
|||||||||||||
|
(In thousands)
|
Value
|
Value
|
Value
|
Value
|
||||||||||||
|
Due in 1 year or less
|
$
|
83,967
|
$
|
84,087
|
$
|
88,046
|
$
|
88,075
|
||||||||
|
Due in greater than 1 year
|
13,171
|
13,257
|
72,439
|
72,523
|
||||||||||||
|
Total
|
$
|
97,138
|
$
|
97,344
|
$
|
160,485
|
$
|
160,598
|
||||||||
Our marketable securities include primarily auction rate securities, or ARS, corporate bonds and US agency notes. We classify our marketable securities as available-for-sale and report them at fair market value with the related unrealized gains and losses included in accumulated other comprehensive income. We monitor all of our marketable securities for impairment and if these securities are reported to have had a decline in fair value, use significant judgment to identify events or circumstances that would likely have a significant adverse effect on the future value of each investment including: (i) the nature of the investment; (ii) the cause and duration of any impairment; (iii) the financial condition and near term prospects of the issuer; (iv) for securities with a reported decline in fair value, our ability to hold the security for a period of time sufficient to allow for any anticipated recovery of fair value; (v) the extent to which fair value may differ from cost; and (vi) a comparison of the income generated by the securities compared to alternative investments. We would recognize an impairment charge if a decline in the fair value of its marketable securities is judged to be other-than-temporary.
At January 30, 2010, we held nine auction rate securities with an adjusted cost and par value of $40.8 million, which is net of $2.2 million of redemption by the issuers at par value during fiscal 2010. Auction rate securities are bought and sold in the marketplace through a bidding process sometimes referred to as a “Dutch auction.” Historically, the fair value of our ARS has been determined by the frequent auction periods, generally every 7 to 28 days, which provided liquidity at par value for these investments. However, subsequent to February 2008, all auctions involving such securities held by us have failed. The result of a failed auction is that these ARS will continue to pay interest in accordance with their terms at each respective auction date; however, liquidity of the securities will continue to be limited until there is a successful auction, the issuer redeems the securities, the securities mature or until such time as other markets for these ARS develop. We cannot be certain regarding the amount of time it will take for an auction market or other markets to develop for these securities. In October 2008, our cash investment advisor, UBS, acknowledged our acceptance of its proposal of a comprehensive settlement agreement, in which all the ARS currently in our portfolio could be redeemed at par value. The offer to redeem will be at our option during a two year period beginning in June 2010. The offer also gives UBS the discretion to buy any or all of these securities from us at par value at any time. Additionally, the proposed solution by UBS to the lack of liquidity of our ARS included a commitment effective October 2008 through June 2010 to loan an amount up to 75% of the par value of the ARS. The interest charged on such loan would be equal to the proportional amount of interest being paid by the issuers of the ARS borrowed against. At January 30, 2010, UBS provided an estimated value for the nine ARS of approximately $35.8 million, which reflects an unrealized loss of $5.0 million from our original cost. We have not adopted UBS’ estimated value of our ARS for the reasons described below.
61
We have reviewed the prospectuses for each of the nine ARS in our investment portfolio as of January 30, 2010 and determined that the unprecedented disruption in the auction process and resulting pattern of interest payments was in accordance with their established rules of operation under these circumstances. The default mechanism called for in the operating rules of these instruments is designed to adjust their interest payments to a limit based on the income generated by their underlying student loans. The most significant consequences of this mechanism are the preservation of their AAA credit rating while adjusting to a continuing stream of interest payments to the security holders at a rate correlating to contemporary credit market rates.
As a result of this review, we reached the conclusion that the securities do have a strong underlying principle value and that any potential adjustment in their carrying value would be based upon our ability to endure their lack of liquidity, the degree of certainty of continuing interest payments and the rate of return on these securities. Given that we expect considerable liquidity from our other assets, foresee continuing positive cash flow and have accepted our investment advisor’s offer to purchase all of our ARS at par value in June 2010, we do not consider the remaining possible liquidity risk and UBS’ default risk to be significant enough to justify a reduction in the carrying value. The remaining valuation factor that we considered was the rate of return evidenced by the interest received. We used a discounted cash flow calculation that reached a valuation that was similar to other of our recent investments with comparably high credit ratings.
As a result of this judgment process and in accordance with the various accounting pronouncements in this area, we reached the conclusion that the $40.8 million carrying value of our nine ARS has not been impaired and that we have no expectation of any material adverse impact on our future results of operations, liquidity or capital resources associated with holding these securities.
|
4.
|
Fair values of assets and liabilities
|
On February 3, 2008, we adopted ASC 820. The standard defines fair value as “the price that would be received to sell an asset or paid to transfer a liability in an orderly transaction between market participants at the measurement date (exit price).” The standard establishes a consistent framework for measuring fair value and expands disclosure requirements about fair value measurements. ASC 820, among other things, requires us to maximize the use of observable inputs and minimize the use of unobservable inputs when measuring fair value.
Fair Value Hierarchy
ASC 820 discusses valuation techniques, such as the market approach (comparable market prices), the income approach (present value of future income or cash flow), and the cost approach (cost to replace the service capacity of an asset or replacement cost). The statement utilizes a fair value hierarchy that prioritizes the inputs to valuation techniques used to measure fair value into three broad levels. The following is a brief description of those three levels:
Level 1 – Valuation is based upon quoted prices for identical instruments traded in active markets.
Level 2 – Valuation is based upon quoted prices for similar instruments in active markets, quoted prices for identical or similar instruments in markets that are not active, and model-based valuation techniques for which all significant assumptions are observable in the market.
Level 3 – Valuation is generated from model-based techniques that use significant assumptions not observable in the market. These unobservable assumptions reflect our estimates of assumptions that market participants would use in pricing the asset or liability. Valuation techniques include use of option pricing models, discounted cash flows models and similar techniques.
Determination of Fair Value
Our cash equivalents and marketable securities, with the exception of our ARS are classified within Level 1 of the fair value hierarchy because they are valued using quoted market prices, broker or dealer quotations or alternative pricing sources with reasonable levels of price transparency. The types of marketable securities valued based on quoted market prices in active markets include most U.S. government and agency securities, sovereign government obligations, money market securities and certain corporate obligations with high credit ratings and an ongoing trading market.
62
Our ARS holdings are classified within Level 3. We have valued the ARS through a discounted cash flow model which requires making a significant assumption as to the expectation of UBS’s offer to redeem all of the ARS at par value in June 2010 and future interest income from those securities which is not observable in the market. During fiscal 2010 and 2009, we recorded no impairment loss relating to the value of ARS and recorded no realized gains or losses for these ARS. In August 2009, we purchased a convertible note receivable from a privately-held venture capital funded technology company with a face value which is equal to its cost of $3.0 million, is convertible into the issuer’s preferred stock under certain circumstances and bears interest at a rate of 9% per annum with a maturity date of November 30, 2009. At January 30, 2010 the convertible note receivable was valued at $3.1 million equaling its cost plus accrued interest. This convertible note receivable is classified within Level 3. We have valued our convertible note receivable at cost, plus accrued interest, as the inputs are unobservable to the fair value measurements.
Our derivative instruments are classified as Level 2 because they are valued using quoted prices and other observable data of similar instruments in active markets.
The estimated acquisition contingent consideration of our CopperGate acquisition was based on the probability that certain milestones will be met and the payments will be made on the targeted dates outlined in the acquisition agreement. In developing these estimates, we considered the revenue projections and historical results of CopperGate. This fair value measurement is based on significant inputs not observed in the market and thus represents a Level 3 measurement as defined by ASC 820. Level 3 instruments are valued based on unobservable inputs that are supported by little or no market activity and reflect our assumptions in measuring fair value.
The tables below present the balances of our assets and liabilities measured at fair value on a recurring basis as of January 30, 2010 and January 31, 2009 (in thousands):
|
As of January 30, 2010
|
||||||||||||||||
|
Quoted Prices In Active Markets for Identical Assets
|
Significant Observable Inputs
|
Significant Unobservable Inputs
|
||||||||||||||
|
Fair Value
|
(Level 1)
|
(Level 2)
|
(Level 3)
|
|||||||||||||
|
Money market funds
|
$
|
32,911
|
$
|
32,911
|
$
|
—
|
$
|
—
|
||||||||
|
Auction rate securities
|
40,750
|
—
|
—
|
40,750
|
||||||||||||
|
Corporate bonds
|
17,338
|
17,338
|
—
|
—
|
||||||||||||
|
US agency discount notes
|
4,505
|
4,505
|
—
|
—
|
||||||||||||
|
Municipal bonds and notes
|
1,840
|
1,840
|
—
|
—
|
||||||||||||
|
Total cash equivalent and marketable securities
|
97,344
|
56,594
|
—
|
40,750
|
||||||||||||
|
Restricted cash
|
1,500
|
1,500
|
—
|
—
|
||||||||||||
|
Convertible note receivable
|
3,135
|
—
|
—
|
3,135
|
||||||||||||
|
Derivative instruments
|
156
|
—
|
156
|
—
|
||||||||||||
|
Total assets measured at fair value
|
$
|
102,135
|
$
|
58,094
|
$
|
156
|
$
|
43,885
|
||||||||
|
Accrued contingent payment for CopperGate acquisition
|
$
|
3,249
|
—
|
—
|
$
|
3,249
|
||||||||||
|
As of January 31, 2009
|
||||||||||||||||
|
Quoted Prices In Active Markets for Identical Assets
|
Significant Observable Inputs
|
Significant Unobservable Inputs
|
||||||||||||||
|
Fair Value
|
(Level 1)
|
(Level 2)
|
(Level 3)
|
|||||||||||||
|
Money market funds
|
$
|
59,213
|
$
|
59,213
|
$
|
—
|
$
|
—
|
||||||||
|
Auction rate securities
|
43,000
|
—
|
—
|
43,000
|
||||||||||||
|
Corporate bonds
|
26,581
|
26,581
|
—
|
—
|
||||||||||||
|
US agency discount notes
|
16,043
|
16,043
|
—
|
—
|
||||||||||||
|
Municipal bonds and notes
|
15,761
|
15,761
|
—
|
—
|
||||||||||||
|
Total assets measured at fair value
|
$
|
160,598
|
$
|
117,598
|
$
|
—
|
$
|
43,000
|
||||||||
63
The table below presents a summary of the changes in Level 3 assets measured at fair value on a recurring basis (in thousands):
|
Fair Value Measurements Using Significant Unobservable Inputs (Level 3)
|
||||
|
Beginning balance at February 1, 2009
|
$ | 43,000 | ||
|
Total realized gains or losses included in net income
|
— | |||
|
Total unrealized gain and translation adjustments included in other comprehensive income
|
— | |||
|
Purchases, sales and settlements, net
|
885 | |||
|
Ending balance at January 30, 2010
|
$ | 43,885 | ||
The following table represents a reconciliation of the change in the fair value measurement of the contingent liability for the year ended January 30, 2010:
|
January 30, 2010
|
||||
|
Beginning balance
|
$
|
—
|
||
|
Acquisition date fair value measurement
|
4,900
|
|||
|
Payment made
|
(1,651)
|
|||
|
Ending balance
|
$
|
3,249
|
||
|
5.
|
Derivative financial instruments
|
Effective November 10, 2009, we adopted ASC 815, Derivatives and Hedging (formerly SFAS No. 161, Disclosures about Derivative Instruments and Hedging Activities). The initial adoption of ASC 815 had no financial impact on our consolidated financial statements and only required additional financial statement disclosures. We applied the requirements of this standard on a prospective basis. Accordingly, disclosures related to interim periods prior to the date of adoption have not been presented.
Foreign exchange contracts are recognized either as assets or liabilities on the balance sheet at fair value at the end of each reporting period.
Cash flow hedges
We have used and from time to time in the future may use foreign currency derivatives such as forward and option contracts as hedges against anticipated transactions denominated in foreign currencies. We enter into these contracts to protect ourselves against the risk that the eventual net cash flows will be adversely affected by changes in foreign exchange rates.
For derivative instruments that are designated and qualify as a cash flow hedge under ASC 815, the effective portion of the gain or loss on the derivative is reported as a component of accumulated other comprehensive income and reclassified into earnings in the same period or periods during which the hedged transaction affects earnings. Gains and losses on the derivative representing either hedge ineffectiveness or hedge components excluded from the assessment of effectiveness are recognized in current earnings.
As of January 30, 2010, we had foreign exchange contracts to sell up to approximately $4.5 million for a total amount of approximately NIS 17.0 million, that would mature on or before January 29, 2011. In fiscal 2010, we recognized profit of $41,000 as a result of derivative instruments.
The following table presents the fair value of our outstanding derivative instruments as of January 30, 2010 (in thousands):
| Balance Sheet Location |
Fair Value
|
||||
|
Derivative Assets
|
|||||
|
Foreign exchange contracts designated as cash flow hedges
|
Prepaid expenses and other current assets
|
$ | 156 | ||
64
The effects of derivative instruments designated as cash flow hedges on income and accumulated other comprehensive income are summarized below (in thousands):
| Gains recognized
in accumulated other comprehensive income on
derivatives
(Effective Portion)
|
Gains reclassified from
accumulated other comprehensive income into earnings
|
Losses recognized in earnings on
Derivatives
(Ineffective Portion)
|
||||||||||||
|
Amount
|
Amount
|
Location
|
Amount |
Location
|
||||||||||
|
Derivatives designated as cash flow hedges:
|
||||||||||||||
|
Foreign exchange contracts
|
$ | 82 | $ | 114 |
Operating expenses and cost of revenue
|
$ | (73 | ) |
Interest and other income, net
|
|||||
|
6.
|
Restricted cash
|
We have $1.5 million of restricted cash related to a deposit pledged to a financial institution with regard to our foreign exchange hedging transactions and office operating lease.
|
7.
|
Investments in privately held companies
|
During fiscal 2009, we purchased shares of preferred stock in two privately-held venture capital funded technology companies at a cost of $3.0 million. In the fourth quarter of fiscal 2010, we purchased additional shares of preferred stock in one of these issuers at a cost of $1.0 million. Additionally, in August 2009, we purchased a convertible note from one of these issuers with a face value which is equal to its cost of $3.0 million, is convertible into the issuer’s preferred stock under certain circumstances and bears interest at a rate of 9% per annum, and became callable after November 30, 2009. At January 30, 2010, the convertible note was valued at $3.1 million equaling its cost plus accrued interest and the equity investments were valued at their cost totaling $4.0 million. This convertible note receivable is recorded in prepaid expenses and other current assets. All of our equity investments in privately-held companies are recorded in long-term investments. Three of our four directors hold equity interests in the issuer of the convertible note receivable and one of these directors is also a director of the issuer. In the aggregate, these equity and debt interests do not rise to the level of a material or a controlling interest in the issuer. Our board of directors appointed our director who has no interest in the issuer to evaluate each investment in this issuer and recommend appropriate action to the board of directors. All investment transactions with this issuer were approved and recommended by this independent director and made as the result of a negotiation process.
|
8.
|
Inventories
|
Inventories consist of the following (in thousands):
|
January 30,
|
January 31,
|
|||||||
|
2010
|
2009
|
|||||||
|
Wafers and other purchased materials
|
$
|
8,045
|
$
|
22,325
|
||||
|
Work-in-process
|
2,720
|
2,869
|
||||||
|
Finished goods
|
7,422
|
10,864
|
||||||
|
Total
|
$
|
18,187
|
$
|
36,058
|
||||
65
|
9.
|
Software, equipment and leasehold improvements
|
Software, equipment and leasehold improvements consist of the following (in thousands):
|
January 30,
|
January 31,
|
|||||||
|
2010
|
2009
|
|||||||
|
Software
|
$
|
26,937
|
$
|
17,831
|
||||
|
Equipment
|
5,084
|
6,191
|
||||||
|
Office equipment and furniture
|
6,334
|
4,531
|
||||||
|
Leasehold improvements
|
2,957
|
2,241
|
||||||
|
Total
|
$
|
41,312
|
$
|
30,794
|
||||
|
Accumulated depreciation and amortization
|
(17,502)
|
(9,670)
|
||||||
|
Total
|
$
|
23,810
|
$
|
21,124
|
||||
Software, equipment and leasehold improvement depreciation and amortization expense for fiscal 2010, 2009 and 2008 was $6.4 million, $4.2 million and $2.2 million, respectively.
|
10.
|
Acquisitions
|
Fiscal 2010 Acquisition
On November 10, 2009, we acquired all of the issued and outstanding share capital, including vested stock options, of CopperGate Communications Ltd., or CopperGate pursuant to an Acquisition Agreement dated October 12, 2009, as amended by the First Amendment to Acquisition Agreement dated November 10, 2009 (the “Agreement”). Under the terms of the Agreement, we paid approximately $116.0 million in cash of which approximately $11.6 million will be held in escrow for a period of 18 months and issued an aggregate of 3,931,352 shares of our common stock, of which 393,138 shares will be held in escrow for a period of 18 months from the closing date. At the closing, we also assumed all unvested CopperGate options and, as a result, issued unvested options to purchase an aggregate of 574,881 shares of our common stock, which options will vest over time. Under the terms of the Agreement, we also agreed to pay up to an aggregate of $5.0 million in cash to specified CopperGate employees provided that certain milestones are achieved over a specified period of time. CopperGate is a provider of silicon-based modem solutions enabling distribution of media-rich digital content over all three types of wires in the home: coax, phone and power. CopperGate solutions are deployed by service providers enabling the delivery of HDTV, VoIP and fast internet services. CopperGate is headquartered in Tel Aviv, Israel with offices in the U.S. and Taiwan.
In connection with the CopperGate acquisition, we obtained a valuation of the net assets acquired in order to allocate the purchase price in accordance with ASC 805, Business Combinations. In accordance with ASC 805, the total purchase price was allocated to CopperGate net tangible and intangible assets based upon fair values as of November 10, 2009. The excess purchase price over the value of the net tangible and identifiable intangible assets was recorded as goodwill. The purchase price in the transaction was allocated as follows (in thousands except years):
|
Estimated
|
|||||
|
Amount
|
Useful Life
|
||||
|
Cash consideration
|
$
|
115,956
|
|||
|
Common stock issued
|
48,513
|
||||
|
Contingent consideration
|
4,900
|
||||
|
Total consideration
|
$
|
169,369
|
|||
|
Net tangible assets
|
$
|
19,804
|
|||
|
Identifiable intangible assets:
|
|||||
|
Developed technology
|
53,600
|
7 years
|
|||
|
Customer relationships
|
49,300
|
7 years
|
|||
|
Trademarks
|
1,200
|
2 years
|
|||
|
In-process research and development
|
10,700
|
N/A
|
|||
|
Goodwill
|
34,765
|
||||
|
Total consideration
|
$
|
169,369
|
|||
In accordance with ASC 805, a liability was recognized for the estimated acquisition date fair value of the acquisition-related contingent consideration based on the probability of the achievement of the revenue and product milestones. Any change in the fair value of the acquisition-related contingent consideration subsequent to the closing date, including changes from events after the closing date, will be recognized in earnings in the period the estimated fair value changes. A change in the fair value of the acquisition-related contingent consideration could have a material impact on our consolidated financial statements in the period of the change in estimate.
66
The estimated contingent consideration was based on the probability that these milestones will be met and the payments will be made on the targeted dates outlined in the acquisition agreement. In developing these estimates, we considered the revenue projections and historical results of CopperGate. This fair value measurement is based on significant inputs not observed in the market and thus represents a Level 3 measurement as defined by ASC 820. Level 3 instruments are valued based on unobservable inputs that are supported by little or no market activity and reflect our assumptions in measuring fair value.
The fair value of the common stock issued was determined based on the closing market price of our common shares on the acquisition date.
As a result of the acquisition, we recorded $43.2 million of tangible assets consisting of $26.8 million of cash and cash equivalents and marketable securities, $1.0 million of restricted cash, $2.6 million of account receivables, $9.3 million of inventories, $1.1 million of property and equipment and $2.4 million of other assets. We recorded $23.4 million of liabilities, consisting of $2.3 million of accounts payables, $6.9 million of accrued liabilities and $14.2 million of tax liabilities.
The amounts of revenue and net loss of CopperGate included in our consolidated statement of operations from the acquisition date to the period ended January 30, 2010 are as follows (in thousands):
|
January 30, 2010
|
||||
|
Revenue
|
$
|
15,067
|
||
|
Net loss
|
(5,567)
|
|||
The following table presents the unaudited pro forma results as though the CopperGate acquisition described above occurred at the beginning of the periods indicated. Such historical results include acquisition-related costs totaling $3.7 million recorded in fiscal 2010. The pro forma information presented does not purport to be indicative of the results that would have been achieved had the acquisition been made as of those dates nor of the results which may occur in the future (in thousands except per share data).
|
January 30, 2010
(Unaudited)
|
January 31, 2009
(Unaudited)
|
|||||||
|
Revenue
|
$
|
252,491
|
$
|
272,676
|
||||
|
Net income
|
2,442
|
34,770
|
||||||
|
Net income per share – basic
|
0.09
|
1.29
|
||||||
|
Net income per share – diluted
|
0.09
|
1.26
|
||||||
Fiscal 2009 Acquisitions
On December 19, 2008, we acquired Zensys Holdings Corporation, or Zensys, a wireless start-up company for $13.2 million in cash including transaction costs. Zensys Holdings Corporation, based in Fremont, California, is a developer of single-chip RF solutions called Z-Wave®. As part of the acquisition, twenty eight employees joined us. Zensys has a research and development office in Denmark.
In connection with the Zensys acquisition, we obtained a valuation of the net assets acquired in order to allocate the purchase price in accordance with SFAS No. 141, Business Combinations, or SFAS 141. In accordance with SFAS 141, the total purchase price was allocated to Zensys’ net tangible and intangible assets based upon fair values as of December 19, 2008. The excess purchase price over the value of the net tangible and identifiable intangible assets was recorded as goodwill. The purchase price in the transaction was allocated as follows (in thousands except years):
|
Estimated
|
|||||
|
Amount
|
Useful Life
|
||||
|
Cash consideration
|
$
|
13,017
|
|||
|
Transaction costs
|
213
|
||||
|
Total consideration
|
$
|
13,230
|
|||
|
Net tangible assets
|
$
|
4,266
|
|||
|
Identifiable intangible assets:
|
|||||
|
Developed technology
|
5,110
|
9 years
|
|||
|
Trademarks
|
1,180
|
10 years
|
|||
|
Goodwill
|
2,674
|
||||
|
Total consideration
|
$
|
13,230
|
|||
67
On February 8, 2008, we acquired certain assets and assumed certain liability obligations of the VXP Image Processing business, or VXP, which specializes in video processing technology, from Gennum Corporation for $18.6 million in cash including transaction costs. Forty-four employees joined us as part of the acquisition.
In connection with the VXP acquisition, we obtained a valuation of the net assets acquired in order to allocate the purchase price in accordance with SFAS 141. In accordance with SFAS 141, the total purchase price was allocated to VXP’s net tangible and intangible assets based upon fair values as of February 8, 2008. The excess purchase price over the value of the net tangible and identifiable intangible assets was recorded as goodwill. Approximately $0.1 million of the goodwill is deductible for tax purposes. The purchase price in the transaction was allocated as follows (in thousands except years):
|
Estimated
|
||||||||
|
Amount
|
Useful Life
|
|||||||
|
Cash consideration
|
$
|
18,200
|
||||||
|
Transaction costs
|
376
|
|||||||
|
Total consideration
|
$
|
18,576
|
||||||
|
Net tangible assets
|
$
|
4,555
|
||||||
|
Identifiable intangible assets:
|
||||||||
|
Developed technology
|
8,504
|
2 to 7 years
|
||||||
|
In process research and development
|
1,571
|
N/A
|
||||||
|
Customer relationships
|
1,123
|
7 years
|
||||||
|
Trademarks
|
298
|
5 years
|
||||||
|
Software license
|
291
|
8 years
|
||||||
|
Goodwill
|
2,234
|
|||||||
|
Total consideration
|
$
|
18,576
|
||||||
|
11.
|
Goodwill and intangible assets
|
Goodwill
The beginning goodwill balance of approximately $5.0 million was attributable to the fiscal 2007 Blue7 acquisition. The following table summarizes the activity related to the carrying value of our goodwill during fiscal 2010 and 2009 (in thousands):
|
January 30, 2010
|
January 31, 2009
|
|||||||
|
Beginning balance
|
$
|
9,928
|
$
|
5,020
|
||||
|
Zensys acquisition
|
-
|
2,674
|
||||||
|
VXP acquisition
|
-
|
2,234
|
||||||
|
CopperGate acquisition
|
34,765
|
-
|
||||||
|
Other adjustments
|
217
|
-
|
||||||
|
Ending balance
|
$
|
44,910
|
$
|
9,928
|
||||
68
Intangible assets
Acquired intangible assets, subject to amortization, were as follows as of January 30, 2010 and January 31, 2009 (in thousands, except for years):
|
As of January 30, 2010
|
|||||||||||||
|
Gross Value
|
Accumulated Amortization
|
Net Value
|
Weighted average remaining amortization period (years)
|
||||||||||
|
Developed technology
|
$
|
72,513
|
$
|
8,414
|
$
|
64,099
|
6.7
|
||||||
|
Trademarks
|
2,677
|
389
|
2,288
|
5.3
|
|||||||||
|
Noncompete agreements
|
1,400
|
1,400
|
—
|
—
|
|||||||||
|
Customer relationships
|
50,423
|
1,942
|
48,481
|
7.0
|
|||||||||
|
127,013
|
12,145
|
114,868
|
6.8
|
||||||||||
|
In-process research and development
|
10,700
|
—
|
10,700
|
||||||||||
|
$
|
137,713
|
$
|
12,145
|
$
|
125,568
|
||||||||
|
As of January 31, 2009
|
|||||||||||||
|
Gross Value
|
Accumulated Amortization
|
Net Value
|
Weighted average remaining amortization period (years)
|
||||||||||
|
Developed technology
|
$
|
18,914
|
$
|
3,788
|
$
|
15,126
|
6.3
|
||||||
|
Trademarks
|
1,478
|
69
|
1,409
|
9.0
|
|||||||||
|
Noncompete agreements
|
1,400
|
1,381
|
19
|
*
|
|||||||||
|
Customer relationships
|
1,123
|
157
|
966
|
6.3
|
|||||||||
|
22,915
|
5,395
|
17,520
|
6.5
|
||||||||||
* Less than 1 month of amortization period.
We acquired in-process research and development, or IPR&D of $10.7 million in our acquisition of CopperGate. The fair value of the IPR&D was determined through estimates and valuation techniques based on the terms and details of the acquisition. The amounts allocated to IPR&D will not begin to be expensed until completion of the related project, as it was determined that the underlying project had not reached technological feasibility at the date of acquisition. The IPR&D project represents our next generation HomePNA product with backward compatibility to our current HomePNA and HomePlug AV products and providing increased data rates, ease of use and quality of service (QoS). Upon completion of development, the acquired IPR&D will be amortized over its useful life.
Amortization expense related to acquired intangible assets was $6.8 million, $3.0 million and $1.2 million for fiscal 2010, 2009 and 2008, respectively. As of January 30, 2010, we expect the amortization expense in future periods to be as shown below (in thousands):
|
Developed
|
Customer
|
|||||||||||||||
|
Fiscal year
|
Technology
|
Relationships
|
Trademarks
|
Total
|
||||||||||||
|
2011
|
$
|
10,350
|
$
|
7,203
|
$
|
778
|
$
|
18,331
|
||||||||
|
2012
|
10,346
|
7,203
|
639
|
18,188
|
||||||||||||
|
2013
|
10,346
|
7,203
|
178
|
17,727
|
||||||||||||
|
2014
|
9,621
|
7,203
|
119
|
16,943
|
||||||||||||
|
2015
|
8,257
|
7,203
|
118
|
15,578
|
||||||||||||
|
Thereafter
|
15,179
|
12,466
|
456
|
28,101
|
||||||||||||
|
$
|
64,099
|
$
|
48,481
|
$
|
2,288
|
$
|
114,868
|
|||||||||
|
12.
|
Accrued liabilities
|
Accrued liabilities consist of the following (in thousands):
69
|
January 30,
|
January 31,
|
|||||||
|
2010
|
2009
|
|||||||
|
Accrued salaries, commissions and benefits
|
$
|
6,522
|
$
|
3,584
|
||||
|
Accrued rebates
|
3,324
|
3,230
|
||||||
|
Accrued contingent payment for CopperGate acquisition
|
3,249
|
—
|
||||||
|
Accrued license fees
|
2,473
|
1,193
|
||||||
|
Accrued royalties
|
1,701
|
473
|
||||||
|
Income taxes payable
|
1,206
|
248
|
||||||
|
Accrued payroll taxes
|
1,191
|
840
|
||||||
|
Accrued warranty
|
1,100
|
1,330
|
||||||
|
Customer deposits
|
684
|
1,033
|
||||||
|
Deferred revenues
|
61
|
251
|
||||||
|
Other accrued liabilities
|
1,653
|
644
|
||||||
|
Total
|
$
|
23,164
|
$
|
12,826
|
||||
|
13.
|
Product warranty
|
In general, we sell products with a one-year limited warranty that our products will be free from defects in materials and workmanship. Warranty cost is estimated at the time revenue is recognized, based on historical activity and additionally for any specific known product warranty issues. Accrued warranty cost includes hardware repair and/or replacement and software support costs and is included in accrued liabilities on the consolidated balance sheets.
Details of the change in accrued warranty for fiscal 2010, 2009 and 2008 are as follows (in thousands):
|
Balance
|
Balance
|
|||||||||||||||
|
Fiscal years
|
Beginning of Period
|
Additions
|
Deductions
|
End of Period
|
||||||||||||
|
2008
|
$
|
556
|
$
|
1,828
|
$
|
(820)
|
$
|
1,564
|
||||||||
|
2009
|
$
|
1,564
|
$
|
1,293
|
$
|
(1,527)
|
$
|
1,330
|
||||||||
|
2010
|
$
|
1,330
|
$
|
477
|
$
|
(707)
|
$
|
1,100
|
||||||||
|
14.
|
Commitments and contingencies
|
Commitments
Leases
Our primary facility in Milpitas, California is leased under a non-cancelable lease which expires in September 2012. We also lease facilities in Canada, Denmark, France, Hong Kong, Israel, Japan, Singapore and Taiwan, and vehicles in Israel under non-cancelable leases. Future minimum annual payments under operating leases are as follows (in thousands):
|
Operating
|
||||
|
Fiscal years
|
Leases
|
|||
|
2011
|
$
|
3,087
|
||
|
2012
|
2,326
|
|||
|
2013
|
1,639
|
|||
|
2014
|
731
|
|||
|
2015
|
738
|
|||
|
Thereafter
|
2,060
|
|||
|
Total minimum lease payments
|
$
|
10,581
|
||
Rent expense, recorded on a straight line basis, was $2.0 million, $1.5 million and $1.1 million for fiscal 2010, 2009 and 2008, respectively.
Purchase commitments
We currently place non-cancelable orders to purchase semiconductor products from our suppliers on an eight to twelve week lead-time basis. As of January 30, 2010, the total amount of outstanding non-cancelable purchase orders was approximately $23.3 million.
Indemnifications
Our standard terms and conditions of sale include a patent infringement indemnification provision for claims from third parties related to our intellectual property. The terms and conditions of sale generally limit the scope of the available remedies to a variety of industry-standard methods including, but not limited to, a right to control the defense or settlement of any claim, procure the right for continued usage, and a right to replace or modify the infringing products to make them non-infringing. Such indemnification provisions are accounted for in accordance with ASC 450, Contingencies (formerly SFAS No. 5, Accounting for Contingencies). To date, we have not incurred or accrued any costs related to any claims under such indemnification provisions.
70
Royalties
We pay royalties for the right to sell certain products under various license agreements. During fiscal 2010, 2009 and 2008, we recorded royalty expense of $2.9 million, $2.0 million and $2.3 million, respectively, which was recorded to cost of revenue.
We participated in programs sponsored by the Office of the Chief Scientist of Israel's Ministry of Industry, Trade and Labor, or the OCS for the support of research and development activities. Through January 30, 2010, we had obtained grants from the OCS aggregating to $4.8 million for certain of our research and development projects. We are obligated to pay royalties to the OCS, amounting to 3.5% to 4.5% of the sales of certain products up to an amount equal to 120% of the grants received. As of January 30, 2010, we have a contingent payments obligation of $0.1 million under these programs.
Contingencies
Litigation
Certain current and former directors and officers of Sigma were named as defendants in several shareholder derivative actions filed in the United States District Court for the Northern District of California, which were consolidated under the caption In re Sigma Designs, Inc. Derivative Litigation (the “Federal Action”) and in a substantially similar shareholder derivative action filed in the Superior Court for Santa Clara County, California captioned Korsinsky v. Tran, et al. (the “State Action”).
Plaintiffs in the Federal and State Actions alleged that the individual defendants breached their fiduciary duties to us in connection with the alleged backdating of stock option grants during the period from 1994 through 2005 and that certain defendants were unjustly enriched. Plaintiffs in the Federal Action asserted derivative claims against the individual defendants based on alleged violations of Sections 10(b), 14(a) and 20(a) of the Securities Exchange Act of 1934, and Rules 10b-5 and 14a-9 promulgated thereunder. They also alleged that the individual defendants aided and abetted one another’s alleged breaches of fiduciary duty and violated California Corporations Code section 25402 and brought claims for an accounting and rescission. In the State Action, plaintiffs also alleged that the individual defendants wasted corporate assets. Both Actions sought to recover unspecified money damages, disgorgement of profits and benefits and equitable relief. The Federal Action also sought treble damages, rescission of certain defendants’ option contracts, imposition of a constructive trust over executory option contracts and attorney’s fees. We were named as a nominal defendant in both the Federal and State Actions; thus, no recovery against us was sought.
On May 28, 2008, the parties to both the Federal Action and the State Action executed a definitive settlement agreement which, when approved, resulted in the dismissal of both the Federal Action and the State Action. On September 15, 2008, the Court entered an Order and Final Judgment approving the settlement and dismissing the Federal Action with prejudice. Pursuant to the settlement agreement, after the Order and Final Judgment approving the settlement was entered in the Federal Action, Plaintiff requested that the State Action be dismissed with prejudice. The Court granted this request on September 22, 2008. All amounts due under the settlement were accrued as of February 2, 2008 and paid during the third quarter of fiscal 2009.
In January 2007, we also filed a motion to dismiss or stay the State Action in favor of the earlier filed Federal Action. The defendant directors and officers joined in that motion. Pursuant to a joint stipulation, the Court ordered that the State Action be stayed in favor of the earlier-filed Federal Action. Thereafter, as stated above, the parties to the Federal Action reached an agreement to settle that action. On May 28, 2008, the parties to both the Federal Action and the State Action executed a definitive settlement agreement. Pursuant to the settlement agreement, after the Order and Final Judgment approving the settlement was entered in the Federal Action, Plaintiff requested that the State Action be dismissed with prejudice. The Court granted this request on September 22, 2008. All amounts due under the settlement were accrued as of February 2, 2008 and paid during the third quarter of fiscal 2009.
We have previously disclosed in press releases that the Securities and Exchange Commission, or SEC has initiated an informal inquiry into our stock option granting practices. The SEC requested that we voluntarily produce documents relating to, among other things, our stock option practices. We responded to the SEC’s requests in July and August of 2006 and has received no further requests since that time. While we have no reason to believe that the SEC inquiry is still active, we intend to continue cooperating with the SEC should we receive any additional requests.
71
|
15.
|
Net income per share
|
Basic net income per share for the periods presented is computed by dividing net income by the weighted average number of common shares outstanding (excluding shares subject to repurchase). Diluted net income per share is computed by including shares subject to repurchase as well as dilutive options.
The following table sets forth the basic and diluted net income per share computed for fiscal 2010, 2009 and 2008 (in thousands, except per share amounts):
|
Years Ended
|
||||||||||||
|
January 30,
|
January 31,
|
February 2,
|
||||||||||
|
2010
|
2009
|
2008
|
||||||||||
|
Numerator:
|
||||||||||||
|
Net income, as reported
|
$
|
2,455
|
$
|
26,423
|
$
|
70,209
|
||||||
|
Denominator:
|
||||||||||||
|
Weighted average common shares outstanding – basic
|
27,597
|
26,892
|
25,683
|
|||||||||
|
Effect of dilutive securities:
|
||||||||||||
|
Stock options
|
638
|
813
|
2,867
|
|||||||||
|
Shares used in computation – diluted
|
28,235
|
27,705
|
28,550
|
|||||||||
|
Net income per share:
|
||||||||||||
|
Basic
|
$
|
0.09
|
$
|
0.98
|
$
|
2.73
|
||||||
|
Diluted
|
$
|
0.09
|
$
|
0.95
|
$
|
2.46
|
||||||
A summary of the excluded potentially dilutive securities as of the end of each fiscal year is as follows (in thousands):
|
Years Ended
|
||||||||||||
|
January 30,
|
January 31,
|
February 2,
|
||||||||||
|
2010
|
2009
|
2008
|
||||||||||
|
Stock options excluded because exercise price in excess of average stock price
|
2,986
|
2,079
|
362
|
|||||||||
|
16.
|
Equity incentive plans and employee benefits
|
Stock option plans
We have adopted equity incentive plans that provide for the grant of stock option awards to employees, directors and consultants which are designed to encourage and reward their long-term contributions to us and provide an incentive for them to remain with us. These plans also align our employees’ interest with the creation of long-term shareholder value. As of January 30, 2010, we have three stock option plans: the 2003 Director Stock Option Plan (the “2003 Director Plan”), the 2001 Stock Plan (the “2001 Plan”) and the 2009 Stock Incentive Plan (the “2009 Incentive Plan”). The 2009 Incentive Plan was approved by our shareholders in July 2009 along with the approval of a one-time stock option exchange program.
The exchange program began on August 24, 2009 and concluded on September 22, 2009. Under the exchange program, eligible employees were permitted to exchange outstanding stock options granted under our 2001 Plan prior to June 2008 with exercise prices equal to or greater than $20.25 per share for a lesser number of stock options that were granted following the expiration of the exchange program at a ratio of 1 share in the replacement option for every 1.5 shares exchanged from eligible options. Our directors and executive officers were not eligible to participate in the option exchange program. As a result, on September 22, 2009, pursuant to the terms of the exchange program, we accepted for exchange and cancelled options to purchase an aggregate of 663,737 shares of our common stock under the 2001 Plan. On September 23, 2009, we issued replacement options to purchase an aggregate of 442,550 shares of our common stock in exchange for the options tendered under our 2001 Plan. These replacement options have a strike price of $15.25 with a 5 year vesting schedule and 8-year term, each commencing on September 23, 2009.
Our 2009 Incentive Plan provides for the grant of stock options, restricted stock, restricted stock units, other stock-related awards and performance awards that may be settled in cash, stock or other property. In July 2009, 2,900,000 shares of common stock were reserved for issuance under the 2009 Incentive Plan. In addition, up to 1,000,000 shares of common stock that were subject to stock awards outstanding under the 2001 Plan but terminated prior to exercise and would otherwise be returned to the share reserves under our 2001 Plan will become available for issuance under the 2009 Incentive Plan.
72
As of January 30, 2010, 1,427,619 shares were available for future grants under the 2009 Incentive Plan. As of September 23, 2009, the 2001 Plan and the 2003 Director Plan were closed for future grants, however, these plans will continue to govern all outstanding options that we originally granted from each plan.
The total stock option activities and balances of our stock option plans are summarized as follows:
|
Weighted Average
|
Aggregate
|
|||||||||||||||
|
Number of
|
Weighted Average
|
Remaining
|
Intrinsic
|
|||||||||||||
|
Shares
|
Exercise Price
|
Contractual Term
|
Value
|
|||||||||||||
|
Outstanding
|
Per Share
|
(Years)
|
(in thousands)
|
|||||||||||||
|
Balance, February 3, 2007
|
5,466,362
|
$
|
5.92
|
|||||||||||||
|
Granted (Weighted average fair value of $29.23)
|
1,204,900
|
45.44
|
||||||||||||||
|
Cancelled
|
(249,177
|
)
|
20.47
|
|||||||||||||
|
Exercised
|
(2,480,266
|
)
|
3.82
|
|||||||||||||
|
Balance, February 2, 2008
|
3,941,819
|
$
|
16.78
|
|||||||||||||
|
Granted (Weighted average fair value of $10.08)
|
1,290,960
|
15.52
|
||||||||||||||
|
Cancelled
|
(203,030
|
)
|
25.01
|
|||||||||||||
|
Exercised
|
(571,992
|
)
|
5.50
|
|||||||||||||
|
Balance, January 31, 2009
|
4,457,757
|
$
|
17.50
|
$
|
7.46
|
$
|
5,478,617
|
|||||||||
|
Granted (Weighted average fair value of $6.54)
|
2,322,931
|
11.15
|
||||||||||||||
|
Cancelled
|
(883,657
|
)
|
38.88
|
|||||||||||||
|
Exercised
|
(151,236
|
)
|
6.39
|
|||||||||||||
|
Balance, January 30, 2010
|
5,745,795
|
$
|
11.96
|
$
|
7.35
|
$
|
9,100,620
|
|||||||||
|
Ending Vested and Expected to Vest
|
5,456,165
|
$
|
11.95
|
$
|
7.27
|
$
|
8,928,287
|
|||||||||
|
Ending Exercisable
|
2,309,861
|
$
|
11.58
|
$
|
5.55
|
$
|
6,092,376
|
|||||||||
The aggregate intrinsic value in the table above represents the total pretax intrinsic value, based on our closing stock price of $11.11 as of January 30, 2010, which would have been received by the option holders had all options holders exercised their options as of that date. The aggregate exercise date intrinsic value of options that were exercised during fiscal 2010, 2009 and 2008 equaled $1.3 million, $12.5 million and $85.9 million, respectively. The total fair value of options, which vested during fiscal 2010, 2009 and 2008 equaled $6.8 million, $14.0 million and $5.2 million, respectively. At January 30, 2010, 2,524,479 shares were available under these plans for future grants.
The options outstanding and currently excisable at January 30, 2010 were in the following exercise price ranges:
|
Options Outstanding
|
Options Exercisable
|
|||||||||||||||||||||||
|
Range of Exercise Prices
|
Number of Shares Outstanding at January 30, 2010
|
Weighted Average Remaining Life (Years)
|
Weighted
Average
Exercise Price Per Share
|
Number of Shares Exercisable at January 30, 2010
|
Weighted Average Exercise Price Per Share
|
|||||||||||||||||||
| $0.92 | $ | 3.50 | 629,115 | 3.71 | $ | 2.08 | 485,146 | $ | 2.42 | |||||||||||||||
| $3.78 | $ | 8.53 | 589,792 | 5.70 | $ | 6.96 | 429,058 | $ | 7.20 | |||||||||||||||
| $8.85 | $ | 9.89 | 263,903 | 6.95 | $ | 9.59 | 94,455 | $ | 9.67 | |||||||||||||||
| $10.59 | $ | 10.59 | 678,500 | 9.99 | $ | 10.59 | — | $ | — | |||||||||||||||
| $10.87 | $ | 10.87 | 790,100 | 8.76 | $ | 10.87 | 184,981 | $ | 10.87 | |||||||||||||||
| $11.06 | $ | 11.09 | 788,232 | 7.37 | $ | 11.07 | 389,122 | $ | 11.06 | |||||||||||||||
| $11.40 | $ | 12.21 | 632,758 | 7.10 | $ | 11.76 | 300,390 | $ | 11.47 | |||||||||||||||
| $12.27 | $ | 15.25 | 613,698 | 7.78 | $ | 14.65 | 41,528 | $ | 13.28 | |||||||||||||||
| $15.32 | $ | 31.57 | 600,697 | 7.79 | $ | 21.58 | 259,617 | $ | 22.86 | |||||||||||||||
| $41.58 | $ | 45.83 | 159,000 | 7.93 | $ | 43.16 | 125,564 | $ | 42.45 | |||||||||||||||
| $0.92 | $ | 45.83 | 5,745,795 | 7.35 | $ | 11.96 | 2,309,861 | $ | 11.58 | |||||||||||||||
As of January 30, 2010, the unrecorded share-based compensation balance related to stock options outstanding excluding estimated forfeitures was $33.8 million and will be recognized over an estimated weighted average amortization period of 3.6 years. The amortization period is based on the expected vesting term of the options.
73
Employee stock purchase plan
During fiscal 2002, we adopted the 2001 Employee Stock Purchase Plan (the “2001 Purchase Plan”) and reserved 100,000 shares of our common stock for issuance under the plan, with an automatic annual increase on the first day of our fiscal year equal to the lesser of (i) 500,000 shares, (ii) 2% of our outstanding common stock on such date, or (iii) a lesser number of shares as determined by the Board of Directors. Under this plan, eligible employees may authorize payroll deductions of up to 10% of their regular base salaries to purchase common stock at 85% of the fair market value at the beginning or end of each six-month offering period, whichever is lower. During fiscal 2010, 2009 and 2008, 207,798, 153,796 and 46,864 shares of our common stock were purchased at an average price of $8.86, $9.48 and $22.28 per share, respectively. As of January 30, 2010, we had reserved a total of 1.1 million shares of common stock for issuance under this plan of which $0.9 million had been granted. Effective February 1, 2009, an additional 300,000 shares were available for issuance under the 2001 Purchase Plan pursuant to the automatic annual increase provision in the Plan.
Valuation of share-based compensation
The fair value of share-based compensation awards is estimated at the grant date using the Black-Scholes option valuation model. The determination of fair value of share-based compensation awards on the date of grant using an option-pricing model is affected by our stock price as well as assumptions regarding a number of highly complex and subjective variables. These variables include, but are not limited to, our expected stock price volatility over the term of the awards and actual employee stock option exercise behavior.
We estimate the fair value of stock options using a Black-Scholes valuation model, consistent with the provisions of ASC 718. The weighted-average estimated values of employee stock options granted during fiscal 2010, 2009 and 2008 were $6.54, $10.08 and $29.23 per share, respectively. The weighted-average estimated fair value of employee stock purchase plan shares issued during fiscal 2010, 2009 and 2008 were $3.91, $4.69 and $11.52, per share, respectively. The fair value of each option granted and employee stock purchase plan share issued was estimated on the date of grant using the Black-Scholes option pricing model with the following weighted-average assumptions:
|
Years Ended
|
||||||||||||
|
January 30,
|
January 31,
|
February 2,
|
||||||||||
|
Stock options
|
2010
|
2009
|
2008
|
|||||||||
|
Expected volatility
|
59.53% | 68.11% | 68.39% | |||||||||
|
Risk-free interest rate
|
2.62% | 2.46% | 3.79% | |||||||||
|
Expected term (in years)
|
5.91 | 5.95 | 6.04 | |||||||||
|
Dividend yield
|
None
|
None
|
None
|
|||||||||
|
Years Ended
|
||||||||||||
|
January 30,
|
January 31,
|
February 2,
|
||||||||||
|
Employee stock purchase plan
|
2010 | 2009 | 2008 | |||||||||
|
Expected volatility
|
52.92% | 89.90% | 60.10% | |||||||||
|
Risk-free interest rate
|
0.23% | 1.05% | 4.44% | |||||||||
|
Expected term (in years)
|
0.50 | 0.50 | 0.50 | |||||||||
|
Dividend yield
|
None
|
None
|
None
|
|||||||||
The computation of the expected volatility assumptions used in the Black-Scholes calculations for new grants and purchase rights is based on the historical volatility of our stock price, measured over a period equal to the expected term of the grants or purchase rights. The risk-free interest rate is based on the yield available on U.S. Treasury Strips with an equivalent remaining term. The expected term life of employee stock options represents the weighted-average period that the stock options are expected to remain outstanding and was determined based on historical experience of similar awards, giving consideration to the contractual terms of the share-based awards and vesting schedules. The expected term of purchase rights is the period of time remaining in the current offering period. The dividend yield assumption is based on our history of not paying dividends and assumption of not paying dividends in the future.
Non-employee related share-based compensation expenses
In accordance with the provisions of ASC 718 and ASC 505, Equity, we recorded share-based compensation expense for options issued to non-employees based on the fair value of the options as estimated on the measurement date which is typically the grant date, using the Black-Scholes option pricing model. The Black-Scholes option pricing model for fiscal 2010 includes the following weighted average assumptions; expected stock price volatility of 60%, weighted average contractual term of 6.07 years, dividend yield of zero percent and risk-free interest rates of 2.73%. Total non-employee share-based compensation recorded during fiscal 2010, 2009 and 2008 was $35,000, $56,000 and $432,000, respectively.
74
401(k) tax deferred savings plan
We maintain a 401(k) tax deferred savings plan for the benefit of qualified employees who are U.S. based. Under the 401(k) tax deferred savings plan, U.S. based employees may elect to reduce their current annual taxable compensation up to the statutorily prescribed limit, which was $16,500 in calendar year 2009. Employees age 50 or over may elect to contribute an additional $5,500. In January 2008, we implemented a matching contribution program whereby we match employee contributions made by each employee at a rate of $0.25 per $1.00 contributed. The matching contributions to the 401(k) Plan totaled $0.6 million, $0.5 million and $46,000 for fiscal 2010, 2009 and 2008, respectively.
Group registered retirement savings plan
We maintain a Group Registered Retirement Savings Plan, or GRRSP for the benefit of qualified employees who are based in Canada. Under the Registered Retirement Savings Plan, or RRSP, Canadian based employees may elect to reduce their annual taxable compensation up to the statutorily prescribed limit which was $21,000 Canadian in calendar year 2009. In April 2008, we implemented a matching contribution program under the GRRSP whereby we match employee contributions made by each employee up to 2.5% of their annual salary. The matching contributions to the GRRSP totaled $86,000 and $69,000 for fiscal 2010 and 2009, respectively.
Retirement pension plan
We maintain a Retirement Pension Plan for the benefit of qualified employees who are based in Denmark. Under the Retirement Pension Plan, Denmark based employees may elect to reduce their annual taxable compensation up to their annual salary. In December 2008, we implemented a contribution program whereby we will contribute 3.0% of its employee’s annual salary and may elect to terminate future contributions at our option at any time. Our matching contribution to the Retirement Pension Plan totaled $54,000 and $11,000 for fiscal 2010 and 2009, respectively.
Severance plan
We maintain a severance plan for Israeli employees pursuant to Israel's Severance Pay Law based on the most recent salary of the employees multiplied by the number of years of employment. Employees are entitled to one month salary for each year of employment or a portion thereof. As of January 30, 2010, we have an accrued severance liability of $1.3 million.
|
17.
|
Income taxes
|
Income (loss) before provision for income taxes consisted of the following (in thousands):
|
Years Ended
|
||||||||||||
|
January 30,
|
January 31,
|
February 2,
|
||||||||||
|
2010
|
2009
|
2008
|
||||||||||
|
United States
|
$
|
(3,682)
|
$
|
9,380
|
$
|
61,953
|
||||||
|
International
|
8,789
|
21,937
|
1,130
|
|||||||||
|
Total
|
$
|
5,107
|
$
|
31,317
|
$
|
63,083
|
||||||
The federal, state and foreign income tax provision (benefit) is summarized as follows (in thousands):
|
Years Ended
|
||||||||||||
|
January 30,
|
January 31,
|
February 2,
|
||||||||||
|
2010
|
2009
|
2008
|
||||||||||
|
Current
|
||||||||||||
|
Federal
|
$
|
1,967
|
$
|
3,441
|
$
|
5,410
|
||||||
|
State
|
274
|
478
|
34
|
|||||||||
|
Foreign
|
82
|
365
|
58
|
|||||||||
|
Total current
|
$
|
2,323
|
$
|
4,284
|
$
|
5,502
|
||||||
|
Deferred
|
||||||||||||
|
Federal
|
(3,372)
|
966
|
(9,195)
|
|||||||||
|
State
|
3,781
|
(356)
|
(3,427)
|
|||||||||
|
Foreign
|
(80)
|
—
|
(6)
|
|||||||||
|
Total deferred
|
329
|
610
|
(12,628)
|
|||||||||
|
Total provision (benefit)
|
$
|
2,652
|
$
|
4,894
|
$
|
(7,126)
|
||||||
75
The tax effects of significant items comprising our deferred tax assets and liabilities are as follows (in thousands):
|
Years Ended
|
||||||||
|
January 30,
|
January 31,
|
|||||||
|
2010
|
2009
|
|||||||
|
Deferred tax assets:
|
||||||||
|
Net operating losses carryforwards
|
$
|
8,578
|
$
|
11,165
|
||||
|
Allowance, reserve and other
|
3,281
|
1,729
|
||||||
|
Depreciation
|
392
|
371
|
||||||
|
Tax credits
|
7,946
|
4,623
|
||||||
|
Share-based compensation
|
7,612
|
6,073
|
||||||
|
Total gross deferred tax assets
|
27,809
|
23,961
|
||||||
|
Valuation allowance
|
(13,295)
|
(8,429)
|
||||||
|
Total net deferred tax assets
|
14,514
|
15,532
|
||||||
|
Deferred tax liabilities:
|
||||||||
|
Acquired intangibles
|
(9,144)
|
(2,706)
|
||||||
|
Total net deferred tax assets
|
$
|
5,370
|
$
|
12,826
|
||||
ASC 740 requires that the tax benefit of net operating losses, temporary differences and credit carryforwards be recorded as an asset to the extent that we assess that realization is “more likely than not.” Deferred income taxes result principally from differences in the recognition of certain assets and liabilities for tax and financial reporting purposes and the tax effect of tax loss carryforwards. As of January 30, 2010, net operating loss carryforwards amounted to approximately $61.7 million and $12.4 million for federal and California tax purpose, which will begin to expire in 2010 through 2029. We also had federal and state research credit carryovers of $11.3 million and $8.9 million respectively. If not utilized, the federal credits begin to expire in 2014. The state research credit has no expiration. Of the total net operating loss carryover, $53.2 million federal and $8.0 million state losses will be recorded as a paid-in capital when utilized in the future. We also have $33.2 million foreign operating loss carryforwards through the acquisition of a foreign operation. The valuation allowance increased by $4.9 million in fiscal 2010 due to our assessment that the California deferred tax assets carryforward is not more likely than not to be realized, net of the utilization of some deferred tax assets that were previously reserved. The valuation allowance increased by $8.4 million in fiscal 2009 due to our assessment that the foreign net operating loss carryforward is not more likely than not to be realized.
Net operating losses and tax credit carryforwards as of January 30, 2010 are as follows (in thousands):
|
Expiration
|
|||||
|
Amount
|
Years
|
||||
|
Net operating losses, federal
|
$
|
61,687
|
Thru 2029
|
||
|
Net operating losses, state
|
12,432
|
Thru 2018
|
|||
|
Net operating losses, foreign
|
33,200
|
Indefinite
|
|||
|
Tax credits, federal
|
11,290
|
Thru 2030
|
|||
|
Tax credits, state
|
8,983
|
Indefinite
|
|||
Current federal and California tax laws include substantial restrictions on the utilization of net operating losses and tax credits in the event of an “ownership change” of a corporation. Accordingly, our ability to utilize net operating loss and tax credit carryforwards may be limited as a result of such ownership changes. Such a limitation could result in the expiration of carryforwards before they are utilized.
76
The effective tax rate of our provision (benefit) for income taxes differs from the federal statutory rate as follows (in thousands):
|
Years Ended
|
||||||||||||
|
January 30,
|
January 31,
|
February 2,
|
||||||||||
|
2010
|
2009
|
2008
|
||||||||||
|
Computed at federal statutory rate of 35%
|
$
|
1,787
|
$
|
10,961
|
$
|
22,091
|
||||||
|
State taxes provision (benefit), net of federal benefit
|
178
|
(72)
|
(3,405)
|
|||||||||
|
Difference between statutory rate and foreign effective tax rate
|
(1,615)
|
(5,810)
|
(287)
|
|||||||||
|
Expenses not deductible for tax purposes
|
44
|
30
|
673
|
|||||||||
|
Share based compensation expense
|
561
|
617
|
637
|
|||||||||
|
Change in valuation allowance
|
3,781
|
—
|
(25,031)
|
|||||||||
|
Tax credits
|
(1,735)
|
(876)
|
(1,804)
|
|||||||||
|
Other
|
(349)
|
44
|
—
|
|||||||||
|
Total
|
$
|
2,652
|
$
|
4,894
|
$
|
(7,126)
|
||||||
Included in the balance of unrecognized tax benefits at January 30, 2010 are $16.3 million of tax benefits that, if recognized, would reduce our effective tax rate. The remaining amount would be offset by the reversal of related deferred tax assets on which a valuation allowance is placed. During the twelve months ended January 30, 2010, we added $8.0 million of unrecognized tax benefits, $5.8 million of which related to the recent acquisition and had no effective tax rate impact. A reconciliation of the beginning and ending amount of unrecognized tax benefits is as follows (in thousands):
|
Years Ended
|
||||||||
|
January 30,
|
January 31,
|
|||||||
|
2010
|
2009
|
|||||||
|
Beginning Balance
|
$
|
10,949
|
$
|
4,229
|
||||
|
Additions based on tax positions related to the current year
|
8,035
|
6,220
|
||||||
|
Additions for tax positions of prior years
|
109
|
576
|
||||||
|
Reductions for tax positions of prior year
|
(252)
|
(76)
|
||||||
|
Ending Balance
|
18,841
|
10,949
|
||||||
We have adopted the accounting policy that interest and penalty recognized in accordance with ASC 740 are classified as part of our income taxes. In fiscal 2010, we recorded $50,000 of such interest and penalty expense and as of January 30, 2010, the balance of such accrued interest and penalty was $0.2 million.
Our operations are subject to income and transaction taxes in the United States and in multiple foreign jurisdictions. Significant estimates and judgments are required in determining our worldwide provision for income taxes. Some of these estimates are based on interpretations of existing tax laws or regulations. The ultimate amount of tax liability may be uncertain as a result.
In May 2007, the IRS began an employment tax audit for calendar years 2004 and 2005. We requested that calendar year 2006 also be included in this audit cycle, and the IRS agreed. We paid the amounts due to the IRS pursuant to that settlement in fiscal 2009. We have also reported these IRS adjustments to the California Employment Development Department and reached a settlement of the corresponding state tax and interest adjustments. We paid the State tax amounts due under the settlement in fiscal 2010. We do not expect that any further tax amounts will be due under either settlement.
Our tax filings for the fiscal years from 1995 to 2009 remain open in various taxing jurisdictions. We do not anticipate that our unrecognized tax benefit would change significantly in the coming 12 month period.
At January 30, 2010, undistributed earnings of our foreign operations totaling $41.5 million were considered to be permanently reinvested. No deferred tax liability has been recognized for the remittance of such earnings to the U.S. since it is our intention to utilize those earnings in the foreign operations. Generally, such earnings become subject to U.S. tax upon the remittance of dividends and under certain other circumstances. It is not practicable to estimate the amount of deferred tax liability on such undistributed earnings.
We benefit from tax incentives granted by local tax authorities in certain foreign jurisdictions. The Economic Development Board of Singapore granted development and expansion incentives to our wholly-owned subsidiary in Singapore in 2008 for a period of four years ending March 1, 2012 contingent on meeting specified requirements. The Singapore subsidiary can qualify for additional six years development and expansion incentives if additional requirements are met. The impact of this tax holiday was to increase net income by approximately $7 million or $0.25 per diluted share in fiscal 2010 and $6.5 million or $0.23 per diluted share, in fiscal 2009.
77
Our newly acquired Israeli subsidiary CopperGate Communications Ltd. was granted Approved Enterprise status under the Law for the Encouragement of Capital Investments, 1959 in October 2004. CopperGate’s income is tax-exempt for a period of two years commencing with the year it first earns taxable income, and subject to corporate taxes at the reduced rate for an additional period of five years. The impact of this tax holiday was to increase net income by approximately $1.1 million or $0.04 per diluted share, in fiscal 2010.
|
18.
|
Related party transactions
|
During June 2005, we loaned $0.5 million to Blue7, a California corporation, in which we had invested $1.0 million for an approximate 17% ownership interest. One of our board members had invested $0.1 million for a 2% ownership interest during fiscal 2005. In November 2005 and January 2006, we loaned an additional $0.3 million and $0.2 million, respectively, to Blue7. During fiscal 2007, the total loan balance of $0.9 million was forgiven and accounted for as part of the Blue7 acquisition cost. Also, related to the Blue7 acquisition in fiscal 2007, 2,645 shares of stock options were granted to a Blue7 consultant who was one of our board members. During fiscal 2008, 1,984 of these shares were exercised and the remaining 661 shares were cancelled.
During the fourth quarter of fiscal 2009, we liquidated our investment in Envivio, Inc., in which we had invested capital of $0.3 million for an ownership fraction of less than 1% ownership interest. In addition, three of our board members have liquidated their investments in this same firm, which had aggregated to an ownership fraction of less than 1% ownership interest. Our Chairman and Chief Executive Officer, Thinh Tran, resigned as a member of Envivio’s Board of Directors.
|
19.
|
Segment and geographical information
|
ASC 280, Segment Reporting (formerly SFAS No. 131, Disclosures about Segments of an Enterprise and Related Information), provides annual and interim reporting standards for an enterprise’s business segments and related disclosures about its products, services, geographical areas and major customers.
Operating segments are defined as components of an enterprise for which separate financial information is available and evaluated regularly by the chief operating decision-maker in deciding how to allocate resources and in assessing performance. We are organized as, and operate in, one reportable segment. Our operating segment consists of our geographically based entities in the United States, Hong Kong, Israel and Singapore. Our chief operating decision-maker reviews consolidated financial information, accompanied by information about revenue by product group, target market and geographic region. We do not assess the performance of our geographic regions on other measures of income or expense, such as depreciation and amortization or net income.
The following table sets forth net revenue attributed to each product group (in thousands):
|
Years Ended
|
||||||||||||
|
January 30,
|
January 31,
|
February 2,
|
||||||||||
|
2010
|
2009
|
2008
|
||||||||||
|
SoCs
|
$
|
204,613
|
$
|
207,096
|
$
|
216,703
|
||||||
|
Other
|
1,470
|
2,064
|
4,503
|
|||||||||
|
Net revenue
|
$
|
206,083
|
$
|
209,160
|
$
|
221,206
|
||||||
The following table sets forth net revenue attributable to each target market (in thousands):
|
Years Ended
|
||||||||||||
|
January 30,
|
January 31,
|
February 2,
|
||||||||||
|
2010
|
2009
|
2008
|
||||||||||
|
IPTV
|
$
|
134,856
|
$
|
164,334
|
$
|
164,143
|
||||||
|
Connected media players
|
44,636
|
30,069
|
49,127
|
|||||||||
|
Prosumer and industrial audio/video
|
7,221
|
8,099
|
—
|
|||||||||
|
Connected home technologies
|
18,512
|
876
|
—
|
|||||||||
|
Other
|
858
|
5,782
|
7,936
|
|||||||||
|
Net revenue
|
$
|
206,083
|
$
|
209,160
|
$
|
221,206
|
||||||
78
The following table sets forth net revenue to each geographic region based on the invoiced location of customer (in thousands):
|
Years Ended
|
||||||||||||
|
January 30,
|
January 31,
|
February 2,
|
||||||||||
|
2010
|
2009
|
2008
|
||||||||||
|
Asia
|
$
|
161,081
|
$
|
116,583
|
$
|
153,146
|
||||||
|
Europe
|
38,118
|
80,067
|
56,782
|
|||||||||
|
North America
|
6,856
|
12,464
|
11,173
|
|||||||||
|
Other regions
|
28
|
46
|
105
|
|||||||||
|
Net revenue
|
$
|
206,083
|
$
|
209,160
|
$
|
221,206
|
||||||
The following table sets forth net revenue to each significant country based on the invoiced location of customer (in thousands):
|
Years Ended
|
||||||||||||
|
January 30,
|
January 31,
|
February 2,
|
||||||||||
|
2010
|
2009
|
2008
|
||||||||||
|
Taiwan
|
$
|
52,724
|
$
|
21,736
|
$
|
10,863
|
||||||
|
China
|
44,276
|
24,583
|
16,597
|
|||||||||
|
Singapore
|
38,071
|
43,450
|
52,529
|
|||||||||
|
France
|
30,274
|
31,004
|
31,448
|
|||||||||
|
Korea
|
9,632
|
10,437
|
42,941
|
|||||||||
|
United States
|
6,270
|
10,620
|
11,163
|
|||||||||
|
Japan
|
1,940
|
11,030
|
26,754
|
|||||||||
|
Netherlands
|
194
|
24,819
|
4,389
|
|||||||||
|
Rest of the world
|
22,702
|
31,481
|
24,522
|
|||||||||
|
Net revenue
|
$
|
206,083
|
$
|
209,160
|
$
|
221,206
|
||||||
The following table set forth long-lived assets, which consist primarily of software, equipment and leasehold improvements and other non-current assets, by geographic regions based on the location of the asset (in thousands):
|
Years Ended
|
||||||||||||
|
January 30,
|
January 31,
|
February 2,
|
||||||||||
|
2010
|
2009
|
2008
|
||||||||||
|
United States
|
$
|
17,971
|
$
|
18,487
|
$
|
8,827
|
||||||
|
All other countries
|
6,519
|
2,855
|
618
|
|||||||||
|
Total long-lived assets
|
$
|
24,490
|
$
|
21,342
|
$
|
9,445
|
||||||
The following tables set forth customers accounting for 10% or more of our net revenue (in thousands):
|
Years Ended
|
||||||||||||
|
January 30,
|
January 31,
|
February 2,
|
||||||||||
|
2010
|
2009
|
2008
|
||||||||||
|
Motorola
|
21%
|
21%
|
23%
|
|||||||||
|
Gemtek
|
12%
|
*
|
*
|
|||||||||
|
Cisco Systems **
|
*
|
22%
|
*
|
|||||||||
|
Uniquest Corp.
|
*
|
*
|
19%
|
|||||||||
|
Macnica, Inc.
|
*
|
*
|
12%
|
|||||||||
* Net revenue from customer was less than 10% of net revenue.
** Starting in the third quarter of fiscal 2009, Cisco Systems, Inc. began processing its orders with us through multiple third-party contract manufacturers.
No domestic customers accounted for more than 10% of total accounts receivable at January 30, 2010 and January 31, 2009. Three international customers accounted for 24%, 24% and 11% of total accounts receivable at January 30, 2010. Four international customers accounted for 28%, 20%, 10% and 10% of total accounts receivable at January 31, 2009.
|
20.
|
Quarterly financial information (unaudited)
|
The following table presents unaudited quarterly financial information for each of our most recent eight fiscal quarters (in thousands, except per share amounts):
79
|
Quarters Ended
|
||||||||||||||||||||||||||||||||
|
January 30,
|
October 31,
|
August, 1,
|
May 2,
|
January 31,
|
November 1,
|
August, 2,
|
May 3,
|
|||||||||||||||||||||||||
|
2010
|
2009
|
2009
|
2009
|
2009
|
2008
|
2008
|
2008
|
|||||||||||||||||||||||||
|
Net revenue
|
$
|
68,093
|
$
|
35,464
|
$
|
51,283
|
$
|
51,243
|
$
|
47,306
|
$
|
46,760
|
$
|
58,212
|
$
|
56,882
|
||||||||||||||||
|
Gross profit
|
27,997
|
16,068
|
23,250
|
24,387
|
21,354
|
21,659
|
29,521
|
28,020
|
||||||||||||||||||||||||
|
Income (loss) from operations
|
(3,142)
|
(4,614)
|
4,429
|
6,528
|
2,819
|
3,589
|
12,727
|
6,484
|
||||||||||||||||||||||||
|
Net income (loss)
|
(2,790)
|
(2,298)
|
4,800
|
2,743
|
6,579
|
3,671
|
9,591
|
6,582
|
||||||||||||||||||||||||
|
Net income (loss) per share:
|
||||||||||||||||||||||||||||||||
|
Basic
|
$
|
(0.09)
|
$
|
(0.09)
|
$
|
0.18
|
$
|
0.10
|
$
|
0.25
|
$
|
0.14
|
$
|
0.36
|
$
|
0.23
|
||||||||||||||||
|
Diluted
|
$
|
(0.09)
|
$
|
(0.09)
|
$
|
0.18
|
$
|
0.10
|
$
|
0.24
|
$
|
0.14
|
$
|
0.35
|
$
|
0.22
|
||||||||||||||||
|
ITEM 9.
|
CHANGES IN AND DISAGREEMENTS WITH ACCOUNTANTS ON ACCOUNTING AND FINANCIAL DISCLOSURE
|
None
|
ITEM 9A.
|
CONTROLS AND PROCEDURES
|
Evaluation of Disclosure Controls and Procedures
We are committed to maintaining disclosure controls and procedures designed to ensure that information required to be disclosed in our periodic reports filed under the Exchange Act, is recorded, processed, summarized and reported within the time periods specified in the SEC’s rules and forms, and that such information is accumulated and communicated to our management, including our Chief Executive Officer and Chief Financial Officer, as appropriate, to allow for timely decisions regarding required disclosure. In designing and evaluating our disclosure controls and procedures, we recognize that any controls and procedures, no matter how well designed and operated, can provide only reasonable assurance of achieving the desired control objectives, and we necessarily are required to apply our judgment in evaluating the cost-benefit relationship of possible controls and procedures and implementing controls and procedures.
As of January 30, 2010, the end of the period covered by this Annual Report on Form 10-K, we have, with the participation of our Chief Executive Officer and our Chief Financial Officer, evaluated the effectiveness of the design and effectiveness of our disclosure controls and procedures, as such terms are defined in Rule 13a-15(e) and Rule 15d-15(e) under the Securities and Exchange Act of 1934 as amended (the “Exchange Act”). Based on this evaluation, we have concluded that our disclosure controls and procedures were effective as of January 30, 2010.
Management’s Report on Internal Control over Financial Reporting
We are responsible for establishing and maintaining adequate internal control over financial reporting as defined in Rules 13a-15(f) and 15d-15(f) under the Exchange Act. Our internal control over financial reporting is a process designed to provide reasonable assurance regarding the reliability of financial reporting and the preparation of financial statements for external purposes in accordance with generally accepted accounting principles in the United States. All internal control systems, no matter how well designed, have inherent limitations. Therefore, even those systems determined to be effective can provide only reasonable assurance with respect to financial statement preparation and presentation and may not prevent or detect misstatements. Projections of any evaluation of effectiveness of internal control over financial reporting to future periods are subject to the risk that controls may become inadequate because of changes in conditions, or that the degree of compliance with the policies or procedures may deteriorate.
We, including our Chief Executive Officer and Chief Financial Officer, assessed the effectiveness of our internal control over financial reporting as of January 30, 2010. In making this assessment, we used the criteria set forth in Internal Control-Integrated Framework issued by the Committee of Sponsoring Organizations of the Treadway Commission (COSO). Based on this assessment, we concluded that our internal control over financial reporting was effective as of January 30, 2010.
We have excluded CopperGate from our assessment of internal control over financial reporting as of January 30, 2010 because it was acquired by us during our fourth quarter of fiscal 2010. CopperGate’s total assets and revenues represent 9.1% and 7.3%, respectively, of the related consolidated financial statement amounts as of and for the year ended January 30, 2010.
Armanino McKenna LLP, the independent registered public accounting firm that audited our consolidated financial statements included in this Annual Report on Form 10-K, has also assessed the effectiveness of internal control over financial reporting as of January 30, 2010. Armanino McKenna LLP has issued an attestation report with an unqualified opinion. This attestation report is included herein under Part II, Item 8.
80
Changes in Internal Control over Financial Reporting
During the fourth quarter ended January 30, 2010, there were no changes in our internal control over financial reporting (as defined in Rule 13(a) – 15(f) under the Exchange Act) that have materially affected, or are reasonably likely to materially affect, our internal control over financial reporting.
|
ITEM 9B.
|
OTHER MATTERS
|
None.
81
PART III
|
ITEM 10.
|
DIRECTORS, EXECUTIVE OFFICERS OF THE REGISTRANT AND CORPORATE GOVERNANCE
|
You will find this information in the sections captioned “Compensation Discussion and Analysis,” “Report of the Compensation Committee,” “Executive Compensation,” and “Director Compensation,” which will appear in the 2010 Proxy Statement we will deliver to our shareholders in connection with our Annual Meeting of Shareholders to be held on July 9, 2010. We are incorporating the information contained in those sections by reference.
|
ITEM 11.
|
EXECUTIVE COMPENSATION
|
You will find this information in the sections captioned “Compensation Discussion and Analysis,” “Report of the Compensation Committee,” “Executive Compensation,” and “Director Compensation,” which will appear in the 2010 Proxy Statement we will deliver to our shareholders in connection with our Annual Meeting of Shareholders to be held on July 9, 2010. We are incorporating the information contained in those sections by reference.
|
ITEM 12.
|
SECURITY OWNERSHIP OF CERTAIN BENEFICIAL OWNERS AND MANAGEMENT AND RELATED SHAREHOLDER MATTERS
|
You will find this information in the section captioned “Security Ownership of Certain Beneficial Owners and Management,” and “Equity Compensation Plan Information,” which will appear in the 2010 Proxy Statement we will deliver to our shareholders in connection with our Annual Meeting of Shareholders to be held on July 9, 2010. We are incorporating the information contained in those sections by reference.
|
ITEM 13.
|
CERTAIN RELATIONSHIPS AND RELATED TRANSACTIONS AND DIRECTOR INDEPENDENCE
|
You will find this information in the sections captioned “Certain Relationships and Related Transactions,” and “Corporate Governance and Other Matters,” which will appear in the 2010 Proxy Statement we will deliver to our shareholders in connection with our Annual Meeting of Shareholders to be held on July 9, 2010. We are incorporating the information contained in those sections by reference.
|
ITEM 14.
|
PRINCIPAL ACCOUNTING FEES AND SERVICES
|
You will find this information in the sections captioned “Report of the Audit Committee” and Proposal for Ratification of Selection of Independent Auditors,” which will appear in the 2010 Proxy Statement we will deliver to our shareholders in connection with our Annual Meeting of Shareholders to be held on July 9, 2010. We are incorporating the information contained in those sections by reference.
82
PART IV
|
ITEM 15.
|
EXHIBITS AND FINANCIAL STATEMENT SCHEDULES
|
(a) The following documents are filed as part of this Annual Report on Form 10-K:
|
|
1.
|
Consolidated Financial Statements
|
|
Financial Statements
|
Page
|
||
|
Report of Independent Registered Public Accounting Firm
|
51
|
||
|
Consolidated Balance Sheets
|
52
|
||
|
Consolidated Statements of Operations
|
53
|
||
|
Consolidated Statements of Shareholders’ Equity and Comprehensive Income
|
54
|
||
|
Consolidated Statements of Cash Flows
|
55
|
||
|
Notes to Consolidated Financial Statements
|
56
|
|
|
2.
|
Consolidated Financial Statements Schedules
|
|
Schedule II—Valuation and Qualifying Accounts and Reserves
|
85
|
All other schedules have been omitted as they are not required, not applicable or the required information is otherwise included.
(b) Exhibits
The exhibits listed on the accompanying index to exhibits immediately following the financial statement schedules are incorporated by reference into this Annual Report on Form 10-K.
83
SIGNATURES
Pursuant to the requirements of Section 13 or 15(d) of the Securities Act of 1934, the Registrant has duly caused this report to be signed on its behalf by the undersigned, thereunto duly authorized, in the city of Milpitas, State of California, on the 1st day of April 2010.
|
SIGMA DESIGNS, INC.
|
|||
|
By:
|
/s/ Thinh Q. Tran
|
||
|
Thinh Q. Tran
|
|||
|
Chairman of the Board,
|
|||
|
President and Chief Executive Officer
|
|||
POWER OF ATTORNEY
KNOW ALL PERSONS BY THESE PRESENTS, that each person whose signature appears below constitutes and appoints Thinh Q. Tran and Thomas E. Gay III, and each of them, jointly and severally, his true and lawful attorneys-in-fact, each with full power of substitution and resubstitution, for him in any and all capacities, to sign any or all amendments to this Annual Report on Form 10-K, with all exhibits thereto and other documents in connection therewith, with the Securities and Exchange Commission, granting unto said attorneys-in-fact and agents, and each of them, full power and authority to do and perform each and every act and thing requisite and necessary to be done in connection therewith, as fully to all intents and purposes as he or she might or could do if personally present, hereby ratifying and confirming all that each said attorney-in-fact and agent, or his or her substitute or substitutes or any of them, may lawfully do or cause to be done by virtue hereof.
PURSUANT TO THE REQUIREMENTS OF THE SECURITIES ACT OF 1934, THIS ANNUAL REPORT ON FORM 10-K HAS BEEN SIGNED BY THE FOLLOWING PERSONS ON BEHALF OF THE OF THE REGISTRANT AND IN THE CAPACITIES AND ON THE DATES INDICATED:
|
Signature
|
Title
|
Date
|
||
|
/s/ Thinh Q. Tran
Thinh Q. Tran
|
Chairman of the Board, President, and Chief
Executive Officer (Principal Executive Officer)
|
April 1, 2010
|
||
|
/s/ Thomas E. Gay III
Thomas E. Gay III
|
Chief Financial Officer and Secretary
(Principal Financial and Accounting Officer)
|
April 1, 2010
|
||
|
/s/ William J. Almon
William J. Almon
|
Director
|
April 1, 2010
|
||
|
/s/ Julien Nguyen
Julien Nguyen |
Director
|
April 1, 2010
|
||
|
/s/ Lung C. Tsai
Lung C. Tsai
|
Director
|
April 1, 2010
|
84
SCHEDULE II—VALUATION AND QUALIFYING ACCOUNTS AND RESERVES
|
Additions:
|
||||||||||||||||
|
Balance at
|
Charged to
|
Balance at
|
||||||||||||||
|
Beginning of
|
Costs and
|
End of
|
||||||||||||||
|
Classification
|
Year
|
Expenses
|
Deductions:
|
Year
|
||||||||||||
|
Allowance for returns, doubtful accounts and discounts:
|
(in thousands)
|
|||||||||||||||
|
Fiscal year
|
||||||||||||||||
|
2010
|
$
|
534
|
$
|
485
|
$
|
673
|
$
|
346
|
||||||||
|
2009
|
252
|
948
|
666
|
534
|
||||||||||||
|
2008
|
601
|
619
|
968
|
252
|
||||||||||||
85
INDEX TO EXHIBITS
|
Exhibit
Number
|
Description
|
Filed Herewith or Incorporated Herein by Reference to
|
|
2.1
|
Acquisition Agreement, dated as of October 12, 2009, by and among Sigma, CopperGate Communications Ltd., Carmel V.C. 2 Ltd. and Tamir Fishman Ventures Management II Ltd., as the Holder Representatives, and the Selling Shareholders.
|
Incorporated by reference to exhibit 2.1 filed with the Current Report on Form 8-K filed on October 14, 2009.
|
||
|
3.1
|
Second Restated Articles of Incorporation.
|
Incorporated by reference to exhibit filed with the Registration Statement on Form S-1 (No. 33-17789) filed October 8, 1987, Amendment No. 1 thereto filed June 9, 1988 and Amendment No. 2 thereto filed June 14, 1988, which Registration Statement became effective June 14, 1988.
|
||
|
3.2
|
Certificate of Amendment to the Second Restated Articles of Incorporation dated June 22, 2001.
|
Incorporated by reference to exhibit 3.1 filed with the Registration Statement on Form S-8 (No. 333-64234) filed on June 29, 2001.
|
||
|
3.3
|
Bylaws of Sigma, as amended.
|
Incorporated by reference to exhibit 3.6 filed with the Annual Report on Form 10-K for the fiscal year ended February 1, 2003.
|
||
|
3.4
|
Certificate of Determination of Preferences of Series A Preferred Stock dated June 13, 1997.
|
Incorporated by reference to exhibit 3.3 filed with the Registrant’s Form S-1 filed on September 14, 2007.
|
||
|
3.5
|
Certificate of Determination of Preferences of Series B Preferred Stock dated January 30, 1998.
|
Incorporated by reference to exhibit 3.4 filed with the Registrant’s Form S-1 filed on September 14, 2007.
|
||
|
3.6
|
Certificate of Determination of Preferences of Series C Preferred Stock dated January 20, 1999.
|
Incorporated by reference to exhibit 3.5 filed with the Registrant’s Form S-1 filed on September 14, 2007.
|
||
|
3.7
|
Certificate of Determination of Rights, Preferences and Privileges of Series D Participating Preferred Stock dated June 4, 2004.
|
Incorporated by reference to exhibit 3.6 filed with the Registrant’s Form S-1 filed on September 14, 2007.
|
||
|
3.8
|
Certificate of Amendment to the Second Restated Articles of Incorporation dated January 28, 2008.
|
Incorporated by reference to exhibit 3.7 filed with the Annual Report on Form 10-K filed on April 2, 2008.
|
||
|
4.1
|
Preferred Stock Rights Agreement, dated as of June 7, 2004, between Sigma and Mellon Investor Services LLC, as Rights Agent, including the Certificate of Designation, the form of Rights Certificate and the Summary of Rights attached thereto as Exhibit A, B and C, respectively.
|
Incorporated by reference to exhibit 4.1 filed with the Current Report on Form 8-K filed on June 8, 2004.
|
||
|
10.1*
|
Amended and Restated 1994 Stock Plan and form of Stock Option Agreement.
|
Incorporated by reference to exhibit 4.1 filed with the Registration Statement on Form S-8 (No. 333-86875) filed on September 10, 1999.
|
||
|
10.2*
|
1994 Director Stock Option Plan and form of Director Option Agreement.
|
Incorporated by reference to exhibit filed with the Registration Statement on Form S-3 (No. 33-74308) filed on January 28, 1994, Amendment No. 1 thereto filed February 24, 1994, Amendment No. 2 thereto filed March 3, 1994, Amendment No. 3 thereto filed March 4, 1994 and Amendment No. 4 thereto filed March 8, 1994.
|
86
|
10.3*
|
2001 Employee Stock Option Plan.
|
Incorporated by reference to exhibit 4.1 filed with the Registration Statement on Form S-8 (333-64234) filed on June 29, 2001.
|
||
|
10.4*
|
2001 Employee Stock Purchase Plan and Form of Subscription Agreement.
|
Incorporated by reference to exhibit 4.2 filed with the Registration Statement on Form S-8 (333-64234) filed on June 29, 2001.
|
|
10.5
|
Industrial Lease by and between AMB Property, L.P. and Sigma dated February 22, 2007.
|
Incorporated by reference to exhibit 10.15 filed with the Annual Report on Form 10-K for the fiscal year ended February 3, 2007.
|
||
|
10.6*
|
2003 Director Stock Option Plan.
|
Incorporated by reference to exhibit 99.1 filed with the Form S-8 filed on July 11, 2003.
|
||
|
10.7
|
Form of Voting and Support Agreement.
|
Incorporated by reference to exhibit 10.1 filed with the Current Report on Form 8-K filed on October 14, 2009.
|
||
|
21.1
|
Subsidiaries of the Registrant.
|
Filed herewith.
|
||
|
23.1
|
Consent of Independent Registered Public Accounting Firm (Armanino McKenna LLP)
|
Filed herewith
|
||
|
24.1
|
Power of Attorney (contained in the signature page to this Annual Report on Form 10-K).
|
Filed herewith
|
||
|
31.1
|
Certification of the President and Chief Executive Officer pursuant to Securities Exchange Act Rules 13a-14(a) and 15d-14(a).
|
Filed herewith
|
||
|
31.2
|
Certification of the Chief Financial Officer and Secretary pursuant to Securities Exchange Act Rules 13a-14(a) and 15d-14(a).
|
Filed herewith
|
||
|
32.1
|
Certificate of Chief Executive Officer pursuant to 18 U.S.C. Section 1350, as adopted pursuant to Section 906 of the Sarbanes-Oxley Act of 2002.
|
Filed herewith
|
||
|
32.2
|
Certificate of Chief Financial Officer pursuant to 18 U.S.C. Section 1350, as adopted pursuant to Section 906 of the Sarbanes-Oxley Act of 2002.
|
Filed herewith
|
|
*
|
Indicates management contract or compensatory plan or arrangement.
|