Attached files
| file | filename |
|---|---|
| 8-K - 8-K - RAIT Financial Trust | ras-8k_20160225.htm |
| EX-99.1 - EX-99.1 - RAIT Financial Trust | ras-ex991_25.htm |
Exhibit 99.2


Fourth Quarter 2015
Supplemental Information

TABLE OF CONTENTS
|
Company Information
|
3 |
|
Forward-Looking Statements
|
5 |
|
Earnings Release Text
|
6 |
|
Financial Highlights
|
10 |
|
Balance Sheets |
|
|
Consolidated by quarter |
11 |
|
Consolidating, by segment
|
12 |
|
Statements of Operations, FFO & CORE FFO |
|
|
Consolidated |
13 |
|
Consolidated – Trailing 5 Quarters |
15 |
|
Consolidating, by segment
|
17 |
|
Fee and Other Income
|
19 |
|
EBITDA and Coverage Ratios
|
20 |
|
Portfolio Data: |
|
|
Lending |
22 |
|
Real Estate Summary |
24 |
|
Real Estate Properties, Changes in the portfolio |
26 |
|
Real Estate Properties at December 31, 2015
|
27 |
|
Debt Overview
|
29 |
|
Definitions |
31 |
2

RAIT Financial Trust
December 31, 2015
Company Information:
RAIT Financial Trust is an internally-managed real estate investment trust that provides debt financing options to owners of commercial real estate and invests directly into commercial real estate properties located throughout the United States. In addition, RAIT is an asset and property manager of real estate-related assets.
|
Corporate Headquarters |
2929 Arch Street 17th Floor, Cira Centre Philadelphia, Pa 19104 215.243.9000 |
|
Trading Symbol |
NYSE: “RAS” |
|
Investor Relations Contact |
Andres Viroslav 2929 Arch Street 17th Floor, Cira Centre Philadelphia, Pa 19104 215.243.9000 |
3
Common and Preferred Stock Information:
|
|
|
For the Three-Months Ended |
|
|||||||||||||||||
|
|
|
December 31, 2015 |
|
|
September 30, 2015 |
|
|
June 30, 2015 |
|
|
March 31, 2015 |
|
|
December 31, 2014 |
|
|||||
|
Common: |
|
|
|
|
|
|
|
|
|
|
|
|
|
|
|
|
|
|
|
|
|
Share Price, period end |
|
$ |
2.70 |
|
|
$ |
4.96 |
|
|
$ |
6.11 |
|
|
$ |
6.86 |
|
|
$ |
7.67 |
|
|
Share Price, high |
|
$ |
5.45 |
|
|
$ |
6.24 |
|
|
$ |
7.08 |
|
|
$ |
7.85 |
|
|
$ |
7.94 |
|
|
Share Price, low |
|
$ |
2.25 |
|
|
$ |
4.77 |
|
|
$ |
6.04 |
|
|
$ |
6.62 |
|
|
$ |
6.86 |
|
|
Dividends declared |
|
$ |
0.09 |
|
|
$ |
0.18 |
|
|
$ |
0.18 |
|
|
$ |
0.18 |
|
|
$ |
0.18 |
|
|
Dividend yield, period end |
|
|
13.3 |
% |
|
|
14.5 |
% |
|
|
11.8 |
% |
|
|
10.5 |
% |
|
|
9.4 |
% |
|
Common shares outstanding |
|
|
91,586,767 |
|
|
|
90,898,034 |
|
|
|
82,895,723 |
|
|
|
82,885,444 |
|
|
|
82,506,606 |
|
|
Weighted Average common shares, basic |
|
|
90,642,318 |
|
|
|
87,110,958 |
|
|
|
82,150,475 |
|
|
|
82,081,024 |
|
|
|
81,970,075 |
|
|
Weighted Average common shares, diluted |
|
|
90,842,752 |
|
|
|
87,110,958 |
|
|
|
89,268,462 |
|
|
|
82,081,024 |
|
|
|
81,970,075 |
|
|
Preferred: |
|
|
|
|
|
|
|
|
|
|
|
|
|
|
|
|
|
|
|
|
|
Series A |
|
|
|
|
|
|
|
|
|
|
|
|
|
|
|
|
|
|
|
|
|
Shares outstanding |
|
|
5,306,084 |
|
|
|
5,306,084 |
|
|
|
5,303,591 |
|
|
|
4,775,569 |
|
|
|
4,775,569 |
|
|
Share price, period end |
|
$ |
18.15 |
|
|
$ |
18.19 |
|
|
22.34 |
|
|
23.35 |
|
|
23.32 |
|
|||
|
Par, per share |
|
$ |
25.00 |
|
|
$ |
25.00 |
|
|
$ |
25.00 |
|
|
$ |
25.00 |
|
|
$ |
25.00 |
|
|
Dividend |
|
$ |
0.484375 |
|
|
$ |
0.484375 |
|
|
$ |
0.484375 |
|
|
$ |
0.484375 |
|
|
$ |
0.484375 |
|
|
Yield |
|
|
10.7 |
% |
|
|
10.7 |
% |
|
|
8.7 |
% |
|
|
8.3 |
% |
|
|
8.3 |
% |
|
Series B |
|
|
|
|
|
|
|
|
|
|
|
|
|
|
|
|
|
|
|
|
|
Shares outstanding |
|
|
2,340,969 |
|
|
|
2,340,969 |
|
|
|
2,325,626 |
|
|
|
2,288,465 |
|
|
|
2,288,465 |
|
|
Share price, period end |
|
$ |
18.98 |
|
|
$ |
19.06 |
|
|
$ |
22.92 |
|
|
$ |
24.50 |
|
|
$ |
24.90 |
|
|
Par, per share |
|
$ |
25.00 |
|
|
$ |
25.00 |
|
|
$ |
25.00 |
|
|
$ |
25.00 |
|
|
$ |
25.00 |
|
|
Dividend |
|
$ |
0.5234375 |
|
|
$ |
0.5234375 |
|
|
$ |
0.5234375 |
|
|
$ |
0.5234375 |
|
|
$ |
0.5234375 |
|
|
Yield |
|
|
11.0 |
% |
|
|
11.0 |
% |
|
|
9.1 |
% |
|
|
8.5 |
% |
|
|
8.4 |
% |
|
Series C |
|
|
|
|
|
|
|
|
|
|
|
|
|
|
|
|
|
|
|
|
|
Shares outstanding |
|
|
1,640,425 |
|
|
|
1,640,425 |
|
|
|
1,640,100 |
|
|
|
1,640,100 |
|
|
|
1,640,100 |
|
|
Share price, period end |
|
$ |
19.70 |
|
|
$ |
20.14 |
|
|
$ |
24.15 |
|
|
$ |
24.84 |
|
|
$ |
25.06 |
|
|
Par, per share |
|
$ |
25.00 |
|
|
$ |
25.00 |
|
|
$ |
25.00 |
|
|
$ |
25.00 |
|
|
$ |
25.00 |
|
|
Dividend |
|
$ |
0.5546875 |
|
|
$ |
0.5546875 |
|
|
$ |
0.5546875 |
|
|
$ |
0.5546875 |
|
|
$ |
0.5546875 |
|
|
Yield |
|
|
11.3 |
% |
|
|
11.0 |
% |
|
|
9.2 |
% |
|
|
8.9 |
% |
|
|
8.9 |
% |
|
Series D (not publicly traded) |
|
|
|
|
|
|
|
|
|
|
|
|
|
|
|
|
|
|
|
|
|
Shares outstanding |
|
|
4,000,000 |
|
|
|
4,000,000 |
|
|
|
4,000,000 |
|
|
|
4,000,000 |
|
|
|
4,000,000 |
|
|
Par, per share |
|
$ |
25.00 |
|
|
$ |
25.00 |
|
|
$ |
25.00 |
|
|
$ |
25.00 |
|
|
$ |
25.00 |
|
|
Coupon |
|
|
8.50 |
% |
|
|
7.50 |
% |
|
|
7.50 |
% |
|
|
7.50 |
% |
|
|
7.50 |
% |
4
This press release may contain certain forward-looking statements within the meaning of Section 27A of the Securities Act of 1933, as amended, and Section 21E of the Securities Exchange Act of 1934, as amended. Such forward-looking statements can generally be identified by our use of forward-looking terminology such as “guidance,” "may," “plan”, "will," "should," "expect," "intend," "anticipate," "estimate," "believe," “seek,” “opportunities” or other similar words or terms. Because such statements include risks, uncertainties and contingencies, actual results may differ materially from the expectations, intentions, beliefs, plans or predictions of the future expressed or implied by such forward-looking statements. These risks, uncertainties and contingencies include, but are not limited to: overall conditions in commercial real estate and the economy generally; whether the timing and amount of investments, repayments, any capital raised and our use of leverage will vary from those underlying our assumptions; changes in the expected yield of our investments; changes in financial markets and interest rates, or to the business or financial condition of RAIT or its business; whether RAIT will be able to originate loans in the amounts and generating the returns assumed; the availability of financing and capital, including through the capital and securitization markets; whether RAIT will be able to complete sales of RAIT owned properties, whether identified for sale or under contract, in the amounts and generating the gains assumed; and those disclosed in RAIT’s filings with the Securities and Exchange Commission. RAIT undertakes no obligation to update these forward-looking statements to reflect events or circumstances after the date hereof or to reflect the occurrence of unanticipated events, except as may be required by law.
5
RAIT Financial Trust Announces Fourth Quarter and Fiscal 2015 Financial Results
PHILADELPHIA, PA — February 25, 2016 — RAIT Financial Trust (“RAIT”) (NYSE: RAS) today announced fourth quarter and fiscal 2015 financial results. All per share results are reported on a diluted basis.
Highlights
|
|
- |
Cash Available for Distribution (“CAD”) per share of $0.28 for the quarter ended December 31, 2015 and $1.11 for the year ended December 31, 2015. CAD per share, without real estate gains, of $0.19 for the quarter ended December 31, 2015 and $0.78 for the year ended December 31, 2015. |
|
|
- |
Earnings per share of $0.02 for the quarter ended December 31, 2015 and $0.08 for the year ended December 31, 2015. |
|
|
- |
Investments in mortgages and loans, at cost, increased 16.5% to $1.62 billion at December 31, 2015 from $1.39 billion at December 31, 2014. |
|
|
- |
RAIT originated $321.8 million of loans during the quarter ended December 31, 2015 and $996.9 million of loans for the year ended December 31, 2015. |
|
|
- |
RAIT paid a fourth quarter dividend of $0.09 per common share on January 29, 2016. |
Scott Schaeffer, RAIT’s Chairman and CEO, said, “Our platform generated just under $1 billion of loan originations in 2015 including more than $600 million of bridge loans. We completed two floating-rate securitizations and sold $425 million of fixed-rate conduit loans during the year. We continue to execute on our capital recycling strategy through property sales given the volatile state of the capital and securitization markets.”
Commercial Real Estate (“CRE”) Business
|
|
- |
RAIT originated $321.8 million of loans during the quarter ended December 31, 2015 consisting of $71.9 million of fixed-rate conduit loans and $249.9 million of floating-rate bridge loans. RAIT originated $996.9 million of loans during the year ended December 31, 2015 consisting of $384.1 million of fixed-rate conduit loans, $607.8 million of floating-rate bridge loans and a $5.0 million mezzanine loan. |
|
|
- |
RAIT sold $85.4 million of conduit loans during the quarter ended December 31, 2015 which generated fee income of $1.1 million. RAIT sold $425.0 million of conduit loans during the year ended December 31, 2015 which generated fee income of $7.2 million. |
|
|
- |
In December, RAIT closed its fifth non-recourse, floating-rate CMBS transaction totaling $347.4 million collateralized by floating rate commercial real estate first lien mortgage loans and pari passu participation interests in such mortgage loans. The transaction involved the sale by a RAIT subsidiary of investment grade notes totaling approximately $263.6 million with a weighted average cost of LIBOR plus 2.62%. RAIT affiliates retained certain investment grade notes and all of the below investment grade and un-rated subordinated interests totaling approximately $83.8 million. |
|
|
- |
CRE loan repayments were $121.6 million for the quarter ended December 31, 2015 and $291.2 million during the year ended December 31, 2015 |
6
CRE Property Portfolio & Property Sales
|
|
- |
As of December 31, 2015, RAIT’s investments in real estate were $2.5 billion which includes $1.4 billion of multi-family properties owned by Independence Realty Trust, Inc. (“IRT”) (NYSE MKT: IRT). IRT is externally advised by RAIT and is a consolidated RAIT entity. IRT is a REIT focused on owning multifamily properties. At December 31, 2015, RAIT owned 15.5% of IRT’s outstanding common stock. |
|
|
- |
During the quarter ended December 31, 2015, RAIT sold three properties, consisting of two apartment communities and an office property, for $52.9 million and generated net proceeds of approximately $8.4 million after costs and full repayment of the underlying debt. IRT sold one apartment community for $33.6 million and generated net proceeds of approximately $14.2 million after costs and full repayment of the underlying debt. During the year ended December 31, 2015, RAIT sold eight properties, six apartment communities and one office property, and one parcel of land for $141.4 million and generated net proceeds of approximately $27.5 million after costs and full repayment of the underlying debt. |
|
|
- |
During the three-months ended December 31, 2015, RAIT converted two loans secured by ten industrial properties and by one office property, respectively, into ownership of those properties. Those properties had an aggregate carrying value of $73.1 million. |
|
|
- |
RAIT reported a $0.9 million asset impairment for the quarter ended December 31, 2015 on an office property in Denver, Colorado and a parcel of land in Daytona Beach, FL. Both of these properties are currently under contract to be sold. |
|
|
- |
On September 17, 2015, IRT completed the acquisition of Trade Street Residential, Inc. adding nineteen high-quality properties with 4,989 units to its portfolio. RAIT expects the acquisition to benefit RAIT through RAIT’s ownership of IRT common stock and increased fees paid to RAIT by IRT. |
Asset & Property Management
|
|
- |
Total assets under management increased 33.3% to $6.0 billion at December 31, 2015 from $4.5 billion at December 31, 2014. |
|
|
- |
RAIT’s property management companies managed 19,639 apartment units and 22.8 million square feet of office and retail space at December 31, 2015. |
|
|
- |
RAIT generated $9.3 million in asset and property management fees and incentive fees through its external management of IRT during the year ended December 31, 2015. |
|
|
- |
RAIT generated $12.8 million of property management and leasing fees primarily through its retail property manager subsidiary and through services provided by its multi-family property manager subsidiary to unaffiliated properties during the year ended December 31, 2015. |
Dividends
|
|
- |
On December 7, 2015, RAIT’s Board of Trustees (the “Board”) declared a fourth quarter 2015 cash dividend on RAIT’s common shares of $0.09 per common share. The dividend was paid on January 29, 2016 to holders of record on January 8, 2016. |
|
|
- |
On November 4, 2015, the Board declared a fourth quarter 2015 cash dividend of $0.484375 per share on RAIT’s 7.75% Series A Cumulative Redeemable Preferred Shares, $0.5234375 per share on RAIT’s 8.375% Series B Cumulative Redeemable Preferred Shares and $0.5546875 per share on RAIT’s 8.875% Series C Cumulative Redeemable Preferred Shares. The dividends were paid on December 31, 2015 to holders of record on December 1, 2015. |
7
RAIT estimates that its 2016 full year CAD per diluted share will be in a range of $0.85-$0.95 per common share. 2016 full year CAD guidance includes $0.35 per share of gains on property sales. A reconciliation of RAIT's projected net income (loss) allocable to common shares to its projected CAD, a non-GAAP financial measure, is included below. The assumptions underlying this estimate are also included below.
|
|
2016 Annualized Projected CAD(1) |
|||||
|
Net income (loss) allocable to common shares |
|
$22,792 |
- |
$31,892 |
|
|
|
Adjustments: |
|
|
|
|
|
|
|
Gains on property sales |
(5,766) |
- |
(5,766) |
|
||
|
Depreciation, amortization expense and other items |
60,324 |
- |
60,324 |
|
||
|
CAD |
|
$77,350 |
- |
$86,450 |
|
|
|
CAD per share |
|
$0.85 |
- |
$0.95 |
|
|
|
CAD per share, without real estate gains |
|
$0.50 |
- |
$0.60 |
|
|
|
|
(1) |
Constitutes forward-looking information. Actual full 2016 CAD could vary significantly from the projections presented. CAD may fluctuate based upon a variety of factors, including those described in “Forward Looking Statements” below. Our estimate is based on the following key operating assumptions during 2016: |
|
|
- |
Gross loan originations of $200 million to $500 million. |
|
|
- |
No CMBS gain on sale profits. |
|
|
- |
RAIT property sale gains of $32 million. |
|
|
- |
Loan repayments totaling $200 million. |
|
|
- |
No capital issuances in 2016. |
Selected Financial Information
See Schedule I to this Release for selected financial information for RAIT.
Non-GAAP Financial Measures and Definitions
RAIT discloses the following non-GAAP financial measures in this release: funds from operations (“FFO”), CAD and net operating income (“NOI”). A reconciliation of RAIT’s reported net income (loss) allocable to common shares to its FFO and CAD is included as Schedule IV to this release. A reconciliation of RAIT’s NOI to its reported net income (loss) is included as Schedule V to this release. See Schedule VI to this release for management’s respective definitions and rationales for the usefulness of each of these non-GAAP financial measures and other definitions used in this release.
Supplemental Information
RAIT produces supplemental information that includes details regarding the performance of the portfolio, financial information, non-GAAP financial measures and other useful information for investors. The supplemental also contains deconsolidating financial information. The supplemental information is available via the Company's website, www.rait.com, through the "Investor Relations" section.
Conference Call
All interested parties can listen to the live conference call webcast at 9:00 AM ET on Thursday, February 25, 2016 from the home page of the RAIT Financial Trust website at www.rait.com or by dialing 877.787.4169, access code 38442508. For those who are not available to listen to the live call, the replay will be available shortly following the live call on RAIT’s website and telephonically until Thursday, March 3, 2016, by dialing 855.859.2056, access code 38442508.
About RAIT Financial Trust
RAIT Financial Trust is an internally-managed real estate investment trust that provides debt financing options to owners of commercial real estate and invests directly into commercial real estate properties located throughout the United States. In addition,
8
RAIT is an asset and property manager of real estate-related assets. For more information, please visit www.rait.com or call Investor Relations at 215.243.9000.
Forward-Looking Statements
This press release may contain certain forward-looking statements within the meaning of Section 27A of the Securities Act of 1933, as amended, and Section 21E of the Securities Exchange Act of 1934, as amended. Such forward-looking statements can generally be identified by our use of forward-looking terminology such as “guidance,” "may," “plan”, "will," "should," "expect," "intend," "anticipate," "estimate," "believe," “seek,” “opportunities” or other similar words or terms. Because such statements include risks, uncertainties and contingencies, actual results may differ materially from the expectations, intentions, beliefs, plans or predictions of the future expressed or implied by such forward-looking statements. These risks, uncertainties and contingencies include, but are not limited to: overall conditions in commercial real estate and the economy generally; whether the timing and amount of investments, repayments, any capital raised and our use of leverage will vary from those underlying our assumptions; changes in the expected yield of our investments; changes in financial markets and interest rates, or to the business or financial condition of RAIT or its business; whether RAIT will be able to originate loans in the amounts and generating the returns assumed; the availability of financing and capital, including through the capital and securitization markets; whether RAIT will be able to complete sales of RAIT owned properties, whether identified for sale or under contract, in the amounts and generating the gains assumed; and those disclosed in RAIT’s filings with the Securities and Exchange Commission. RAIT undertakes no obligation to update these forward-looking statements to reflect events or circumstances after the date hereof or to reflect the occurrence of unanticipated events, except as may be required by law.
RAIT Financial Trust Contact
Andres Viroslav
215-243-9000
aviroslav@rait.com
9
|
($'s in 000's) |
|
For the Three-Months Ended |
|
|||||||||||||||||
|
|
|
December 31, 2015 |
|
|
September 30, 2015 |
|
|
June 30, 2015 |
|
|
March 31, 2015 |
|
|
December 31, 2014 |
|
|||||
|
OPERATING DATA: |
|
|
|
|
|
|
|
|
|
|
|
|
|
|
|
|
|
|
|
|
|
Lending: |
|
|
|
|
|
|
|
|
|
|
|
|
|
|
|
|
|
|
|
|
|
Investments in loans |
|
$ |
1,623,583 |
|
|
$ |
1,588,097 |
|
|
$ |
1,506,542 |
|
|
$ |
1,504,456 |
|
|
$ |
1,392,436 |
|
|
Gross loan production |
|
$ |
321,837 |
|
|
$ |
237,674 |
|
|
$ |
218,613 |
|
|
$ |
218,770 |
|
|
$ |
255,335 |
|
|
CMBS gain on sales (included in fee income) |
|
$ |
1,135 |
|
|
$ |
434 |
|
|
$ |
3,681 |
|
|
$ |
1,996 |
|
|
$ |
2,986 |
|
|
CMBS loans sold |
|
$ |
85,430 |
|
|
$ |
116,251 |
|
|
$ |
130,401 |
|
|
$ |
92,897 |
|
|
$ |
170,679 |
|
|
Average CMBS Gain on Sale (points) |
|
|
1.3 |
|
|
|
0.4 |
|
|
|
2.8 |
|
|
|
2.1 |
|
|
|
1.7 |
|
|
|
|
|
|
|
|
|
|
|
|
|
|
|
|
|
|
|
|
|
|
|
|
Real estate portfolio: |
|
|
|
|
|
|
|
|
|
|
|
|
|
|
|
|
|
|
|
|
|
Gross real estate investments (a) |
|
$ |
2,517,645 |
|
|
$ |
2,448,331 |
|
|
$ |
1,783,888 |
|
|
$ |
1,833,978 |
|
|
$ |
1,840,451 |
|
|
Property income (a) |
|
$ |
69,464 |
|
|
$ |
55,459 |
|
|
$ |
55,534 |
|
|
$ |
53,274 |
|
|
$ |
46,096 |
|
|
Operating expenses (a) |
|
$ |
31,476 |
|
|
$ |
25,832 |
|
|
$ |
26,416 |
|
|
$ |
25,277 |
|
|
$ |
22,948 |
|
|
Net operating income (a) |
|
$ |
37,988 |
|
|
$ |
29,627 |
|
|
$ |
29,118 |
|
|
$ |
27,997 |
|
|
$ |
23,148 |
|
|
NOI margin (a) |
|
|
54.7 |
% |
|
|
53.4 |
% |
|
|
52.4 |
% |
|
|
52.6 |
% |
|
|
50.2 |
% |
|
|
|
|
|
|
|
|
|
|
|
|
|
|
|
|
|
|
|
|
|
|
|
EARNINGS & DIVIDENDS: |
|
|
|
|
|
|
|
|
|
|
|
|
|
|
|
|
|
|
|
|
|
Earnings per Share -- diluted |
|
$ |
0.02 |
|
|
$ |
(0.07 |
) |
|
$ |
0.22 |
|
|
$ |
(0.09 |
) |
|
$ |
(3.11 |
) |
|
FFO per share |
|
$ |
(0.08 |
) |
|
$ |
(0.05 |
) |
|
$ |
0.15 |
|
|
$ |
0.05 |
|
|
$ |
(2.97 |
) |
|
CAD per share |
|
$ |
0.28 |
|
|
$ |
0.27 |
|
|
$ |
0.37 |
|
|
$ |
0.19 |
|
|
$ |
0.26 |
|
|
CAD per share, without real estate gains |
|
$ |
0.19 |
|
|
$ |
0.20 |
|
|
$ |
0.21 |
|
|
$ |
0.18 |
|
|
$ |
0.26 |
|
|
Dividends per share |
|
$ |
0.09 |
|
|
$ |
0.18 |
|
|
$ |
0.18 |
|
|
$ |
0.18 |
|
|
$ |
0.18 |
|
|
CAD payout ratio |
|
|
31.8 |
% |
|
|
66.0 |
% |
|
|
48.8 |
% |
|
|
96.7 |
% |
|
|
70.4 |
% |
|
|
|
|
|
|
|
|
|
|
|
|
|
|
|
|
|
|
|
|
|
|
|
CAPITALIZATION AND COVERAGE RATIOS: |
|
|
|
|
|
|
|
|
|
|
|
|
|
|
|
|
|
|
|
|
|
Debt: |
|
|
|
|
|
|
|
|
|
|
|
|
|
|
|
|
|
|
|
|
|
Recourse |
|
$ |
494,697 |
|
|
$ |
586,952 |
|
|
$ |
497,430 |
|
|
$ |
579,258 |
|
|
$ |
509,701 |
|
|
Non-recourse |
|
|
2,864,753 |
|
|
|
2,613,029 |
|
|
|
2,164,098 |
|
|
|
2,107,499 |
|
|
|
2,105,965 |
|
|
Total debt |
|
|
3,359,450 |
|
|
|
3,199,981 |
|
|
|
2,661,528 |
|
|
|
2,686,757 |
|
|
|
2,615,666 |
|
|
Preferred shares (par) |
|
|
332,187 |
|
|
|
332,187 |
|
|
|
331,733 |
|
|
|
317,603 |
|
|
|
317,603 |
|
|
Common shares (market capitalization) |
|
|
247,284 |
|
|
|
450,854 |
|
|
|
506,493 |
|
|
|
568,594 |
|
|
|
632,826 |
|
|
Noncontrolling interests, at carrying value |
|
|
340,213 |
|
|
|
346,063 |
|
|
|
204,034 |
|
|
|
208,894 |
|
|
|
214,297 |
|
|
Total market capitalization |
|
$ |
4,279,134 |
|
|
$ |
4,329,085 |
|
|
$ |
3,703,788 |
|
|
$ |
3,781,848 |
|
|
$ |
3,780,392 |
|
|
|
|
|
|
|
|
|
|
|
|
|
|
|
|
|
|
|
|
|
|
|
|
Total Liabilities/Total Gross Assets |
|
|
77.9 |
% |
|
|
77.2 |
% |
|
|
77.5 |
% |
|
|
78.0 |
% |
|
|
77.3 |
% |
|
Total Liabilities + Preferred/Total Gross Assets |
|
|
85.0 |
% |
|
|
84.6 |
% |
|
|
86.4 |
% |
|
|
86.5 |
% |
|
|
85.9 |
% |
|
|
|
|
|
|
|
|
|
|
|
|
|
|
|
|
|
|
|
|
|
|
|
Interest Coverage |
|
|
1.94 |
x |
|
|
1.81 |
x |
|
|
2.12 |
x |
|
|
1.93 |
x |
|
|
2.20 |
x |
|
Interest + Preferred Coverage |
|
|
1.55 |
x |
|
|
1.42 |
x |
|
|
1.63 |
x |
|
|
1.50 |
x |
|
|
1.70 |
x |
|
|
|
|
|
|
|
|
|
|
|
|
|
|
|
|
|
|
|
|
|
|
|
OTHER KEY BENCHMARKS: |
|
|
|
|
|
|
|
|
|
|
|
|
|
|
|
|
|
|
|
|
|
Total Assets Under Management (AUM) |
|
$ |
6,026,341 |
|
|
$ |
5,820,702 |
|
|
$ |
4,764,259 |
|
|
$ |
4,607,413 |
|
|
$ |
4,485,525 |
|
|
Total Gross Assets |
|
$ |
4,645,622 |
|
|
$ |
4,475,217 |
|
|
$ |
3,754,148 |
|
|
$ |
3,741,103 |
|
|
$ |
3,681,955 |
|
|
|
(a) |
Includes Independence Realty Trust. |
10
CONSOLIDATED, by quarter
|
($'s in 000's) |
|
As of |
|
|
|||||||||||||||||
|
|
|
December 31, 2015 |
|
|
September 30, 2015 |
|
|
June 30, 2015 |
|
|
March 31, 2015 |
|
|
December 31, 2014 |
|
|
|||||
|
Assets |
|
|
|
|
|
|
|
|
|
|
|
|
|
|
|
|
|
|
|
|
|
|
Investments in loans: |
|
|
|
|
|
|
|
|
|
|
|
|
|
|
|
|
|
|
|
|
|
|
Investment in loans |
|
$ |
1,623,583 |
|
|
$ |
1,588,097 |
|
|
$ |
1,506,542 |
|
|
$ |
1,504,456 |
|
|
$ |
1,392,436 |
|
|
|
Allowance for loan losses |
|
|
(17,097 |
) |
|
|
(14,646 |
) |
|
|
(12,796 |
) |
|
|
(10,797 |
) |
|
|
(9,218 |
) |
|
|
Investments in loans, net |
|
|
1,606,486 |
|
|
|
1,573,451 |
|
|
|
1,493,746 |
|
|
|
1,493,659 |
|
|
|
1,383,218 |
|
|
|
Investments in real estate: |
|
|
|
|
|
|
|
|
|
|
|
|
|
|
|
|
|
|
|
|
|
|
Investments in real estate at cost |
|
|
2,517,645 |
|
|
|
2,448,331 |
|
|
|
1,783,888 |
|
|
|
1,833,978 |
|
|
|
1,840,451 |
|
|
|
Accumulated depreciation |
|
|
(198,326 |
) |
|
|
(188,581 |
) |
|
|
(178,572 |
) |
|
|
(175,319 |
) |
|
|
(168,480 |
) |
|
|
Investments in real estate, net |
|
|
2,319,319 |
|
|
|
2,259,750 |
|
|
|
1,605,316 |
|
|
|
1,658,659 |
|
|
|
1,671,971 |
|
|
|
Investments in securities, at fair value |
|
|
— |
|
|
|
— |
|
|
|
— |
|
|
|
— |
|
|
|
31,412 |
|
|
|
Cash and cash equivalents |
|
|
125,886 |
|
|
|
92,652 |
|
|
|
104,772 |
|
|
|
92,657 |
|
|
|
121,726 |
|
|
|
Restricted cash |
|
|
213,012 |
|
|
|
159,200 |
|
|
|
179,878 |
|
|
|
126,850 |
|
|
|
124,220 |
|
|
|
Accrued interest receivable |
|
|
47,343 |
|
|
|
56,249 |
|
|
|
56,844 |
|
|
|
53,586 |
|
|
|
51,640 |
|
|
|
Other assets |
|
|
71,207 |
|
|
|
76,222 |
|
|
|
77,708 |
|
|
|
84,629 |
|
|
|
72,023 |
|
|
|
Deferred costs, net |
|
|
31,368 |
|
|
|
29,806 |
|
|
|
25,117 |
|
|
|
25,034 |
|
|
|
27,802 |
|
|
|
Intangible assets, net |
|
|
32,675 |
|
|
|
39,306 |
|
|
|
32,195 |
|
|
|
30,710 |
|
|
|
29,463 |
|
|
|
Total assets |
|
$ |
4,447,296 |
|
|
$ |
4,286,636 |
|
|
$ |
3,575,576 |
|
|
$ |
3,565,784 |
|
|
$ |
3,513,475 |
|
|
|
|
|
|
|
|
|
|
|
|
|
|
|
|
|
|
|
|
|
|
|
|
|
|
Liabilities and Equity |
|
|
|
|
|
|
|
|
|
|
|
|
|
|
|
|
|
|
|
|
|
|
Indebtedness: |
|
|
|
|
|
|
|
|
|
|
|
|
|
|
|
|
|
|
|
|
|
|
Indebtedness: |
|
|
|
|
|
|
|
|
|
|
|
|
|
|
|
|
|
|
|
|
|
|
Recourse |
|
$ |
494,697 |
|
|
$ |
586,952 |
|
|
$ |
497,430 |
|
|
$ |
579,258 |
|
|
$ |
509,701 |
|
|
|
Nonrecourse |
|
|
2,864,753 |
|
|
|
2,613,029 |
|
|
|
2,164,098 |
|
|
|
2,107,499 |
|
|
|
2,105,965 |
|
|
|
Indebtedness, total |
|
|
3,359,450 |
|
|
|
3,199,981 |
|
|
|
2,661,528 |
|
|
|
2,686,757 |
|
|
|
2,615,666 |
|
|
|
Accrued interest payable |
|
|
9,834 |
|
|
|
13,748 |
|
|
|
11,042 |
|
|
|
12,889 |
|
|
|
10,269 |
|
|
|
Accounts payable and accrued expenses |
|
|
39,672 |
|
|
|
42,219 |
|
|
|
52,728 |
|
|
|
48,489 |
|
|
|
54,962 |
|
|
|
Derivative liabilities |
|
|
4,727 |
|
|
|
8,960 |
|
|
|
12,154 |
|
|
|
17,767 |
|
|
|
20,695 |
|
|
|
Borrowers escrows, dividends payable and other liabilities |
|
|
203,477 |
|
|
|
188,797 |
|
|
|
172,621 |
|
|
|
152,757 |
|
|
|
144,733 |
|
|
|
Total liabilities |
|
|
3,617,160 |
|
|
|
3,453,705 |
|
|
|
2,910,073 |
|
|
|
2,918,659 |
|
|
|
2,846,325 |
|
|
|
Series D preferred stock |
|
|
85,395 |
|
|
|
83,787 |
|
|
|
82,513 |
|
|
|
80,871 |
|
|
|
79,308 |
|
|
|
Equity |
|
|
|
|
|
|
|
|
|
|
|
|
|
|
|
|
|
|
|
|
|
|
Equity: |
|
|
|
|
|
|
|
|
|
|
|
|
|
|
|
|
|
|
|
|
|
|
Preferred shares: |
|
|
|
|
|
|
|
|
|
|
|
|
|
|
|
|
|
|
|
|
|
|
Shareholders' Equity: |
|
|
|
|
|
|
|
|
|
|
|
|
|
|
|
|
|
|
|
|
|
|
7.75% Series A Preferred shares |
|
|
53 |
|
|
|
53 |
|
|
|
53 |
|
|
|
48 |
|
|
|
48 |
|
|
|
8.375% Series B Preferred shares |
|
|
23 |
|
|
|
23 |
|
|
|
23 |
|
|
|
23 |
|
|
|
23 |
|
|
|
8.875% Series C Preferred shares |
|
|
17 |
|
|
|
17 |
|
|
|
17 |
|
|
|
17 |
|
|
|
17 |
|
|
|
Common shares, $0.01 par value per share |
|
|
2,748 |
|
|
|
2,727 |
|
|
|
2,487 |
|
|
|
2,484 |
|
|
|
2,473 |
|
|
|
Additional paid in capital |
|
|
2,087,137 |
|
|
|
2,082,695 |
|
|
|
2,039,594 |
|
|
|
2,026,347 |
|
|
|
2,025,683 |
|
|
|
Accumulated other comprehensive income (loss) |
|
|
(4,699 |
) |
|
|
(8,022 |
) |
|
|
(11,605 |
) |
|
|
(15,778 |
) |
|
|
(20,788 |
) |
|
|
Retained earnings (deficit) |
|
|
(1,680,751 |
) |
|
|
(1,674,412 |
) |
|
|
(1,651,613 |
) |
|
|
(1,655,781 |
) |
|
|
(1,633,911 |
) |
|
|
Total shareholders' equity |
|
|
404,528 |
|
|
|
403,081 |
|
|
|
378,956 |
|
|
|
357,360 |
|
|
|
373,545 |
|
|
|
Noncontrolling Interests |
|
|
340,213 |
|
|
|
346,063 |
|
|
|
204,034 |
|
|
|
208,894 |
|
|
|
214,297 |
|
|
|
Total equity |
|
|
744,741 |
|
|
|
749,144 |
|
|
|
582,990 |
|
|
|
566,254 |
|
|
|
587,842 |
|
|
|
Total liabilities and equity |
|
$ |
4,447,296 |
|
|
$ |
4,286,636 |
|
|
$ |
3,575,576 |
|
|
$ |
3,565,784 |
|
|
$ |
3,513,475 |
|
|
11
CONSOLIDATING – AS OF DECEMBER 31, 2015
|
($'s in 000's) |
|
As of December 31, 2015 |
|
|||||||||||||
|
|
|
RAIT |
|
|
IRT |
|
|
Corporate / Eliminations |
|
|
Consolidated |
|
||||
|
Assets |
|
|
|
|
|
|
|
|
|
|
|
|
|
|
|
|
|
Investments in loans: |
|
|
|
|
|
|
|
|
|
|
|
|
|
|
|
|
|
Investment in loans |
|
$ |
1,661,658 |
|
|
$ |
- |
|
|
$ |
(38,075 |
) |
|
$ |
1,623,583 |
|
|
Allowance for loan losses |
|
|
(17,097 |
) |
|
|
- |
|
|
|
- |
|
|
|
(17,097 |
) |
|
Investments in loans, net |
|
|
1,644,561 |
|
|
|
- |
|
|
|
(38,075 |
) |
|
|
1,606,486 |
|
|
Investments in real estate: |
|
|
|
|
|
|
|
|
|
|
|
|
|
|
|
|
|
Investments in real estate at cost |
|
|
1,145,630 |
|
|
|
1,372,015 |
|
|
|
- |
|
|
|
2,517,645 |
|
|
Accumulated depreciation |
|
|
(158,688 |
) |
|
|
(39,638 |
) |
|
|
- |
|
|
|
(198,326 |
) |
|
Investments in real estate, net |
|
|
986,942 |
|
|
|
1,332,377 |
|
|
|
- |
|
|
|
2,319,319 |
|
|
Investment in IRT |
|
|
53,947 |
|
|
|
- |
|
|
|
(53,947 |
) |
|
|
- |
|
|
Cash and cash equivalents |
|
|
87,585 |
|
|
|
38,301 |
|
|
|
- |
|
|
|
125,886 |
|
|
Restricted cash |
|
|
207,599 |
|
|
|
5,413 |
|
|
|
- |
|
|
|
213,012 |
|
|
Accrued interest receivable |
|
|
47,343 |
|
|
|
- |
|
|
|
- |
|
|
|
47,343 |
|
|
Other assets |
|
|
68,281 |
|
|
|
3,362 |
|
|
|
(436 |
) |
|
|
71,207 |
|
|
Deferred costs, net |
|
|
22,142 |
|
|
|
9,226 |
|
|
|
- |
|
|
|
31,368 |
|
|
Intangible assets, net |
|
|
28,940 |
|
|
|
3,735 |
|
|
|
- |
|
|
|
32,675 |
|
|
Total assets |
|
$ |
3,147,340 |
|
|
$ |
1,392,414 |
|
|
$ |
(92,458 |
) |
|
$ |
4,447,296 |
|
|
|
|
|
|
|
|
|
|
|
|
|
|
|
|
|
|
|
|
Liabilities and Equity |
|
|
|
|
|
|
|
|
|
|
|
|
|
|
|
|
|
Indebtedness: |
|
|
|
|
|
|
|
|
|
|
|
|
|
|
|
|
|
Recourse |
|
$ |
494,697 |
|
|
$ |
391,500 |
|
|
$ |
(391,500 |
) |
|
$ |
494,697 |
|
|
Nonrecourse |
|
|
1,926,991 |
|
|
|
584,337 |
|
|
|
353,425 |
|
|
|
2,864,753 |
|
|
Indebtedness, total |
|
|
2,421,688 |
|
|
|
975,837 |
|
|
|
(38,075 |
) |
|
|
3,359,450 |
|
|
Accrued interest payable |
|
|
8,595 |
|
|
|
1,239 |
|
|
|
- |
|
|
|
9,834 |
|
|
Accounts payable and accrued expenses |
|
|
20,368 |
|
|
|
19,304 |
|
|
|
- |
|
|
|
39,672 |
|
|
Derivative liabilities |
|
|
4,727 |
|
|
|
- |
|
|
|
- |
|
|
|
4,727 |
|
|
Borrowers escrows, dividends payable and other liabilities |
|
|
197,909 |
|
|
|
6,004 |
|
|
|
(436 |
) |
|
|
203,477 |
|
|
Total liabilities |
|
|
2,653,287 |
|
|
|
1,002,384 |
|
|
|
(38,511 |
) |
|
|
3,617,160 |
|
|
Series D preferred stock |
|
|
85,395 |
|
|
|
- |
|
|
|
- |
|
|
|
85,395 |
|
|
Equity: |
|
|
|
|
|
|
|
|
|
|
|
|
|
|
|
|
|
Shareholders' Equity: |
|
|
|
|
|
|
|
|
|
|
|
|
|
|
|
|
|
7.75% Series A Preferred shares |
|
|
53 |
|
|
|
- |
|
|
|
- |
|
|
|
53 |
|
|
8.375% Series B Preferred shares |
|
|
23 |
|
|
|
- |
|
|
|
- |
|
|
|
23 |
|
|
8.875% Series C Preferred shares |
|
|
17 |
|
|
|
- |
|
|
|
- |
|
|
|
17 |
|
|
Common shares, $0.01 par value per share |
|
|
2,748 |
|
|
|
471 |
|
|
|
(471 |
) |
|
|
2,748 |
|
|
Additional paid in capital |
|
|
2,087,137 |
|
|
|
378,187 |
|
|
|
(378,187 |
) |
|
|
2,087,137 |
|
|
Accumulated other comprehensive income (loss) |
|
|
(4,691 |
) |
|
|
(8 |
) |
|
|
- |
|
|
|
(4,699 |
) |
|
Retained earnings (deficit) |
|
|
(1,680,751 |
) |
|
|
(14,500 |
) |
|
|
14,500 |
|
|
|
(1,680,751 |
) |
|
Total shareholders' equity |
|
|
404,536 |
|
|
|
364,150 |
|
|
|
(364,158 |
) |
|
|
404,528 |
|
|
Noncontrolling Interests |
|
|
4,122 |
|
|
|
25,880 |
|
|
|
310,211 |
|
|
|
340,213 |
|
|
Total equity |
|
|
408,658 |
|
|
|
390,030 |
|
|
|
(53,947 |
) |
|
|
744,741 |
|
|
Total liabilities and equity |
|
$ |
3,147,340 |
|
|
$ |
1,392,414 |
|
|
$ |
(92,458 |
) |
|
$ |
4,447,296 |
|
12
STATEMENTS OF OPERATIONS, FFO & CAD
CONSOLIDATED – THREE MONTHS AND YEAR ENDED DECEMBER 31, 2015
|
($'s in 000's, except per share amounts) |
|
Three-Months Ended December 31 |
|
|
Year Ended December 31 |
|
||||||||||
|
|
|
2015 |
|
|
2014 |
|
|
2015 |
|
|
2014 |
|
||||
|
Revenue: |
|
|
|
|
|
|
|
|
|
|
|
|
|
|
|
|
|
Net interest margin |
|
|
|
|
|
|
|
|
|
|
|
|
|
|
|
|
|
Investment interest income |
|
$ |
26,609 |
|
|
$ |
30,537 |
|
|
$ |
98,432 |
|
|
$ |
133,419 |
|
|
Investment interest expense |
|
|
(6,733 |
) |
|
|
(7,968 |
) |
|
|
(29,250 |
) |
|
|
(30,310 |
) |
|
Net interest margin |
|
|
19,876 |
|
|
|
22,569 |
|
|
|
69,182 |
|
|
|
103,109 |
|
|
Property income |
|
|
69,464 |
|
|
|
46,096 |
|
|
|
233,731 |
|
|
|
162,281 |
|
|
Fee and other income |
|
|
5,004 |
|
|
|
5,167 |
|
|
|
21,069 |
|
|
|
24,280 |
|
|
Total revenue |
|
|
94,344 |
|
|
|
73,832 |
|
|
|
323,982 |
|
|
|
289,670 |
|
|
|
|
|
|
|
|
|
|
|
|
|
|
|
|
|
|
|
|
Expenses: |
|
|
|
|
|
|
|
|
|
|
|
|
|
|
|
|
|
Interest expense |
|
|
25,408 |
|
|
|
16,635 |
|
|
|
84,338 |
|
|
|
55,391 |
|
|
Real estate operating expenses |
|
|
31,476 |
|
|
|
22,948 |
|
|
|
109,001 |
|
|
|
81,584 |
|
|
Compensation expenses |
|
|
8,416 |
|
|
|
5,050 |
|
|
|
28,229 |
|
|
|
28,168 |
|
|
General and administrative expenses |
|
|
5,825 |
|
|
|
4,414 |
|
|
|
20,779 |
|
|
|
17,653 |
|
|
Acquisition and integration expenses |
|
|
1,684 |
|
|
|
950 |
|
|
|
16,527 |
|
|
|
2,358 |
|
|
Provision for loan losses |
|
|
2,450 |
|
|
|
2,000 |
|
|
|
8,300 |
|
|
|
5,500 |
|
|
Depreciation and amortization expense |
|
|
22,583 |
|
|
|
18,065 |
|
|
|
73,868 |
|
|
|
56,784 |
|
|
Total expenses |
|
|
97,842 |
|
|
|
70,062 |
|
|
|
341,042 |
|
|
|
247,438 |
|
|
Operating Income |
|
|
(3,498 |
) |
|
|
3,770 |
|
|
|
(17,060 |
) |
|
|
42,232 |
|
|
Other income (expense) |
|
|
7 |
|
|
|
51 |
|
|
|
(1,009 |
) |
|
|
(21,398 |
) |
|
Gains (loss) on assets |
|
|
19,094 |
|
|
|
(20 |
) |
|
|
43,805 |
|
|
|
(5,370 |
) |
|
Asset impairment |
|
|
(929 |
) |
|
|
— |
|
|
|
(8,179 |
) |
|
|
— |
|
|
TSRE financing extinguishment and employee separation expenses |
|
|
— |
|
|
|
— |
|
|
|
(27,508 |
) |
|
|
— |
|
|
Gains (losses) on IRT merger with TSRE |
|
|
592 |
|
|
|
— |
|
|
|
64,604 |
|
|
|
— |
|
|
Gains (loss) on deconsolidation of VIEs |
|
|
— |
|
|
|
(215,804 |
) |
|
|
— |
|
|
|
(215,804 |
) |
|
Gain (loss) on sale of collateral management contracts |
|
|
— |
|
|
|
4,549 |
|
|
|
— |
|
|
|
4,549 |
|
|
Gain (loss) on debt extinguishment |
|
|
— |
|
|
|
— |
|
|
|
— |
|
|
|
2,421 |
|
|
Change in fair value of financial instruments |
|
|
(1,828 |
) |
|
|
(39,319 |
) |
|
|
11,638 |
|
|
|
(98,752 |
) |
|
Income (loss) before taxes |
|
|
13,438 |
|
|
|
(246,773 |
) |
|
|
66,291 |
|
|
|
(292,122 |
) |
|
Income tax benefit (provision) |
|
|
(1,478 |
) |
|
|
(307 |
) |
|
|
(2,798 |
) |
|
|
2,147 |
|
|
Net income (loss) |
|
|
11,960 |
|
|
|
(247,080 |
) |
|
|
63,493 |
|
|
|
(289,975 |
) |
|
Income allocated to preferred shares |
|
|
(8,447 |
) |
|
|
(8,365 |
) |
|
|
(32,830 |
) |
|
|
(28,993 |
) |
|
(Income) loss allocated to noncontrolling interests |
|
|
(1,682 |
) |
|
|
444 |
|
|
|
(23,505 |
) |
|
|
464 |
|
|
Net income (loss) available to common shares |
|
$ |
1,831 |
|
|
$ |
(255,001 |
) |
|
$ |
7,158 |
|
|
$ |
(318,504 |
) |
|
EPS - BASIC |
|
$ |
0.02 |
|
|
$ |
(3.11 |
) |
|
$ |
0.08 |
|
|
$ |
(3.92 |
) |
|
EPS - DILUTED |
|
$ |
0.02 |
|
|
$ |
(3.11 |
) |
|
$ |
0.08 |
|
|
$ |
(3.92 |
) |
|
Weighted-average shares outstanding - Basic |
|
|
90,642,318 |
|
|
|
81,970,075 |
|
|
|
85,524,073 |
|
|
|
81,328,129 |
|
|
Weighted-average shares outstanding - Diluted |
|
|
90,842,752 |
|
|
|
81,970,075 |
|
|
|
86,457,871 |
|
|
|
81,328,129 |
|
|
|
|
|
|
|
|
|
|
|
|
|
|
|
|
|
|
|
|
FUNDS FROM OPERATIONS (FFO): |
|
|
|
|
|
|
|
|
|
|
|
|
|
|
|
|
|
Net Income (loss) available to common shares |
|
$ |
1,831 |
|
|
$ |
(255,001 |
) |
|
$ |
7,158 |
|
|
$ |
(318,504 |
) |
|
Add-Back (Deduct): |
|
|
|
|
|
|
|
|
|
|
|
|
|
|
|
|
|
Depreciation |
|
|
10,022 |
|
|
|
11,370 |
|
|
|
41,096 |
|
|
|
38,620 |
|
|
(Gains) Losses on the sale of real estate |
|
|
(18,803 |
) |
|
|
— |
|
|
|
(43,514 |
) |
|
|
319 |
|
|
FFO |
|
$ |
(6,950 |
) |
|
$ |
(243,631 |
) |
|
$ |
4,740 |
|
|
$ |
(279,565 |
) |
|
FFO per share--basic |
|
$ |
(0.08 |
) |
|
$ |
(2.97 |
) |
|
$ |
0.06 |
|
|
$ |
(3.44 |
) |
|
Weighted-average shares outstanding |
|
|
90,642,318 |
|
|
|
81,970,075 |
|
|
|
85,524,073 |
|
|
|
81,328,129 |
|
|
|
|
|
|
|
|
|
|
|
|
|
|
|
|
|
|
|
13
|
|
|
|
|
|
|
|
|
|
|
|
|
|
|
|
|
|
|
Net Income (loss) available to common shares |
|
$ |
1,831 |
|
|
$ |
(255,001 |
) |
|
$ |
7,158 |
|
|
$ |
(318,504 |
) |
|
Add-Back (Deduct): |
|
|
|
|
|
|
|
|
|
|
|
|
|
|
|
|
|
Depreciation and amortization expense |
|
|
22,583 |
|
|
|
18,065 |
|
|
|
73,868 |
|
|
|
56,784 |
|
|
Change in fair value of financial instruments |
|
|
1,828 |
|
|
|
39,319 |
|
|
|
(11,638 |
) |
|
|
98,752 |
|
|
(Gains) losses on assets |
|
|
(7,803 |
) |
|
|
20 |
|
|
|
(12,204 |
) |
|
|
5,370 |
|
|
TSRE financing extinguishment and employee separation expenses |
|
|
— |
|
|
|
— |
|
|
|
27,508 |
|
|
|
— |
|
|
Gains (losses) on IRT merger with TSRE |
|
|
(592 |
) |
|
|
— |
|
|
|
(64,604 |
) |
|
|
— |
|
|
(Gains) losses on deconsolidation of VIEs |
|
|
— |
|
|
|
215,804 |
|
|
|
— |
|
|
|
215,804 |
|
|
(Gains) losses on debt extinguishment |
|
|
— |
|
|
|
— |
|
|
|
— |
|
|
|
(2,421 |
) |
|
Taberna VIII and Taberna IX securitizations, net effect |
|
|
— |
|
|
|
(5,868 |
) |
|
|
— |
|
|
|
(26,931 |
) |
|
Straight-line rental adjustments |
|
|
148 |
|
|
|
1,440 |
|
|
|
95 |
|
|
|
1,111 |
|
|
Equity based compensation |
|
|
913 |
|
|
|
630 |
|
|
|
4,466 |
|
|
|
4,407 |
|
|
Acquisition and integration expenses |
|
|
1,684 |
|
|
|
950 |
|
|
|
16,527 |
|
|
|
2,358 |
|
|
Origination fees and other deferred items |
|
|
10,768 |
|
|
|
5,554 |
|
|
|
35,659 |
|
|
|
19,596 |
|
|
Provision for losses |
|
|
2,450 |
|
|
|
2,000 |
|
|
|
8,300 |
|
|
|
5,500 |
|
|
Asset impairment |
|
|
929 |
|
|
|
— |
|
|
|
8,179 |
|
|
|
— |
|
|
Noncontrolling interest effect of certain adjustments |
|
|
(9,055 |
) |
|
|
(1,951 |
) |
|
|
1,750 |
|
|
|
(4,302 |
) |
|
CAD |
|
$ |
25,684 |
|
|
$ |
20,962 |
|
|
$ |
95,064 |
|
|
$ |
57,524 |
|
|
CAD per share |
|
$ |
0.28 |
|
|
$ |
0.26 |
|
|
$ |
1.11 |
|
|
$ |
0.71 |
|
|
CAD per share, without real estate gains |
|
$ |
0.19 |
|
|
$ |
0.26 |
|
|
$ |
0.78 |
|
|
$ |
0.71 |
|
|
Weighted-average shares outstanding |
|
|
90,642,318 |
|
|
|
81,970,075 |
|
|
|
85,524,073 |
|
|
|
81,328,129 |
|
14
STATEMENT OF OPERATIONS, FFO & CAD
CONSOLIDATED – by quarter
|
($'s in 000's, except per share amounts) |
|
For the Three-Months Ended |
|
|||||||||||||||||
|
|
|
December 31, 2015 |
|
|
September 30, 2015 |
|
|
June 30, 2015 |
|
|
March 31, 2015 |
|
|
December 31, 2014 |
|
|||||
|
Revenue: |
|
|
|
|
|
|
|
|
|
|
|
|
|
|
|
|
|
|
|
|
|
Net interest margin |
|
|
|
|
|
|
|
|
|
|
|
|
|
|
|
|
|
|
|
|
|
Investment interest income |
|
$ |
26,609 |
|
|
$ |
24,468 |
|
|
$ |
24,107 |
|
|
$ |
23,248 |
|
|
$ |
30,537 |
|
|
Investment interest expense |
|
|
(6,733 |
) |
|
|
(8,021 |
) |
|
|
(7,582 |
) |
|
|
(6,914 |
) |
|
|
(7,968 |
) |
|
Net interest margin |
|
|
19,876 |
|
|
|
16,447 |
|
|
|
16,525 |
|
|
|
16,334 |
|
|
|
22,569 |
|
|
Property income |
|
|
69,464 |
|
|
|
55,459 |
|
|
|
55,534 |
|
|
|
53,274 |
|
|
|
46,096 |
|
|
Fee and other income |
|
|
5,004 |
|
|
|
3,056 |
|
|
|
7,415 |
|
|
|
5,594 |
|
|
|
5,167 |
|
|
Total revenue |
|
|
94,344 |
|
|
|
74,962 |
|
|
|
79,474 |
|
|
|
75,202 |
|
|
|
73,832 |
|
|
Expenses: |
|
|
|
|
|
|
|
|
|
|
|
|
|
|
|
|
|
|
|
|
|
Interest expense |
|
|
25,408 |
|
|
|
19,574 |
|
|
|
19,673 |
|
|
|
19,683 |
|
|
|
16,635 |
|
|
Real estate operating expenses |
|
|
31,476 |
|
|
|
25,832 |
|
|
|
26,416 |
|
|
|
25,277 |
|
|
|
22,948 |
|
|
Compensation expenses |
|
|
8,416 |
|
|
|
7,137 |
|
|
|
6,568 |
|
|
|
6,108 |
|
|
|
5,050 |
|
|
General and administrative expenses |
|
|
5,825 |
|
|
|
4,489 |
|
|
|
5,065 |
|
|
|
5,400 |
|
|
|
4,414 |
|
|
Acquisition and integration expenses |
|
|
1,684 |
|
|
|
12,901 |
|
|
|
985 |
|
|
|
957 |
|
|
|
950 |
|
|
Provision for loan losses |
|
|
2,450 |
|
|
|
1,850 |
|
|
|
2,000 |
|
|
|
2,000 |
|
|
|
2,000 |
|
|
Depreciation and amortization expense |
|
|
22,583 |
|
|
|
15,254 |
|
|
|
17,007 |
|
|
|
19,024 |
|
|
|
18,065 |
|
|
Total expenses |
|
|
97,842 |
|
|
|
87,037 |
|
|
|
77,714 |
|
|
|
78,449 |
|
|
|
70,062 |
|
|
Operating Income |
|
|
(3,498 |
) |
|
|
(12,075 |
) |
|
|
1,760 |
|
|
|
(3,247 |
) |
|
|
3,770 |
|
|
Other income (expense) |
|
|
7 |
|
|
|
(380 |
) |
|
|
(241 |
) |
|
|
(395 |
) |
|
|
51 |
|
|
Gains (loss) on assets |
|
|
19,094 |
|
|
|
7,430 |
|
|
|
17,281 |
|
|
|
— |
|
|
|
(20 |
) |
|
Asset impairment |
|
|
(929 |
) |
|
|
(7,250 |
) |
|
|
— |
|
|
|
— |
|
|
|
— |
|
|
TSRE financing extinguishment and employee separation expenses |
|
|
— |
|
|
|
(27,508 |
) |
|
|
— |
|
|
|
— |
|
|
|
— |
|
|
Gains (losses) on IRT merger with TSRE |
|
|
592 |
|
|
|
64,012 |
|
|
|
— |
|
|
|
— |
|
|
|
— |
|
|
Gain (loss) on deconsolidation of VIEs |
|
|
— |
|
|
|
— |
|
|
|
— |
|
|
|
— |
|
|
|
(215,804 |
) |
|
Net gain from collateral management sale |
|
|
— |
|
|
|
— |
|
|
|
— |
|
|
|
— |
|
|
|
4,549 |
|
|
Change in fair value of financial instruments |
|
|
(1,828 |
) |
|
|
620 |
|
|
|
8,356 |
|
|
|
4,490 |
|
|
|
(39,319 |
) |
|
Income (loss) before taxes |
|
|
13,438 |
|
|
|
24,849 |
|
|
|
27,156 |
|
|
|
848 |
|
|
|
(246,773 |
) |
|
Income tax benefit (provision) |
|
|
(1,478 |
) |
|
|
(23 |
) |
|
|
(715 |
) |
|
|
(582 |
) |
|
|
(307 |
) |
|
Net income (loss) |
|
|
11,960 |
|
|
|
24,826 |
|
|
|
26,441 |
|
|
|
266 |
|
|
|
(247,080 |
) |
|
Income allocated to preferred shares |
|
|
(8,447 |
) |
|
|
(8,303 |
) |
|
|
(8,221 |
) |
|
|
(7,859 |
) |
|
|
(8,365 |
) |
|
(Income) loss allocated to noncontrolling interests |
|
|
(1,682 |
) |
|
|
(23,055 |
) |
|
|
736 |
|
|
|
496 |
|
|
|
444 |
|
|
Net income (loss) available to common shares |
|
$ |
1,831 |
|
|
$ |
(6,532 |
) |
|
$ |
18,956 |
|
|
$ |
(7,097 |
) |
|
$ |
(255,001 |
) |
|
EPS - BASIC |
|
$ |
0.02 |
|
|
$ |
(0.07 |
) |
|
$ |
0.23 |
|
|
$ |
(0.09 |
) |
|
$ |
(3.11 |
) |
|
EPS - DILUTED |
|
$ |
0.02 |
|
|
$ |
(0.07 |
) |
|
$ |
0.22 |
|
|
$ |
(0.09 |
) |
|
$ |
(3.11 |
) |
|
Weighted-average shares outstanding - Basic |
|
|
90,642,318 |
|
|
|
87,110,958 |
|
|
|
82,150,475 |
|
|
|
82,081,024 |
|
|
|
81,970,075 |
|
|
Weighted-average shares outstanding - Diluted |
|
|
90,842,752 |
|
|
|
87,110,958 |
|
|
|
89,268,462 |
|
|
|
82,081,024 |
|
|
|
81,970,075 |
|
|
|
|
|
|
|
|
|
|
|
|
|
|
|
|
|
|
|
|
|
|
|
|
Funds From Operations (FFO): |
|
|
|
|
|
|
|
|
|
|
|
|
|
|
|
|
|
|
|
|
|
Net Income (loss) available to common shares |
|
|
1,831 |
|
|
$ |
(6,532 |
) |
|
$ |
18,956 |
|
|
$ |
(7,097 |
) |
|
$ |
(255,001 |
) |
|
Add-Back (Deduct): |
|
|
|
|
|
|
|
|
|
|
|
|
|
|
|
|
|
|
|
|
|
Depreciation |
|
|
10,022 |
|
|
|
9,621 |
|
|
|
10,248 |
|
|
|
11,205 |
|
|
|
11,370 |
|
|
(Gains) Losses on the sale of real estate |
|
|
(18,803 |
) |
|
|
(7,430 |
) |
|
|
(17,281 |
) |
|
|
— |
|
|
|
— |
|
|
FFO |
|
$ |
(6,950 |
) |
|
$ |
(4,341 |
) |
|
$ |
11,923 |
|
|
$ |
4,108 |
|
|
$ |
(243,631 |
) |
|
FFO per share |
|
$ |
(0.08 |
) |
|
$ |
(0.05 |
) |
|
$ |
0.15 |
|
|
$ |
0.05 |
|
|
$ |
(2.97 |
) |
|
Weighted average shares |
|
|
90,642,318 |
|
|
|
87,110,958 |
|
|
|
82,150,475 |
|
|
|
82,081,024 |
|
|
|
81,970,075 |
|
|
|
|
|
|
|
|
|
|
|
|
|
|
|
|
|
|
|
|
|
|
|
15
|
|
|
|
|
|
|
|
|
|
|
|
|
|
|
|
|
|
|
|
|
|
|
Net Income (loss) available to common shares |
|
$ |
1,831 |
|
|
$ |
(6,532 |
) |
|
$ |
18,956 |
|
|
$ |
(7,097 |
) |
|
$ |
(255,001 |
) |
|
Add-Back (Deduct): |
|
|
|
|
|
|
|
|
|
|
|
|
|
|
|
|
|
|
|
|
|
Depreciation and amortization expense |
|
|
22,583 |
|
|
|
15,254 |
|
|
|
17,007 |
|
|
|
19,024 |
|
|
|
18,065 |
|
|
Change in fair value of financial instruments |
|
|
1,828 |
|
|
|
(620 |
) |
|
|
(8,356 |
) |
|
|
(4,490 |
) |
|
|
39,319 |
|
|
(Gains) losses on assets |
|
|
(7,803 |
) |
|
|
(1,030 |
) |
|
|
(4,196 |
) |
|
|
825 |
|
|
|
20 |
|
|
TSRE financing extinguishment and employee separation expenses |
|
|
— |
|
|
|
27,508 |
|
|
|
— |
|
|
|
— |
|
|
|
— |
|
|
Gains (losses) on IRT merger with TSRE |
|
|
(592 |
) |
|
|
(64,012 |
) |
|
|
— |
|
|
|
— |
|
|
|
— |
|
|
(Gains) losses on deconsolidation of VIEs |
|
|
— |
|
|
|
— |
|
|
|
— |
|
|
|
— |
|
|
|
215,804 |
|
|
Taberna VIII and Taberna IX securitizations, net effect |
|
|
— |
|
|
|
— |
|
|
|
— |
|
|
|
— |
|
|
|
(5,868 |
) |
|
Straight-line rental adjustments |
|
|
148 |
|
|
|
(78 |
) |
|
|
23 |
|
|
|
2 |
|
|
|
1,440 |
|
|
Equity based compensation |
|
|
913 |
|
|
|
1,158 |
|
|
|
1,046 |
|
|
|
1,348 |
|
|
|
630 |
|
|
Acquisition and integration expenses |
|
|
1,684 |
|
|
|
12,901 |
|
|
|
985 |
|
|
|
957 |
|
|
|
950 |
|
|
Origination fees and other deferred items |
|
|
10,768 |
|
|
|
10,198 |
|
|
|
7,268 |
|
|
|
7,426 |
|
|
|
5,554 |
|
|
Provision for losses |
|
|
2,450 |
|
|
|
1,850 |
|
|
|
2,000 |
|
|
|
2,000 |
|
|
|
2,000 |
|
|
Asset impairment |
|
|
929 |
|
|
|
7,250 |
|
|
|
— |
|
|
|
— |
|
|
|
— |
|
|
Noncontrolling interest effect of certain adjustments |
|
|
(9,055 |
) |
|
|
19,939 |
|
|
|
(4,421 |
) |
|
|
(4,713 |
) |
|
|
(1,951 |
) |
|
CAD |
|
$ |
25,684 |
|
|
$ |
23,786 |
|
|
$ |
30,312 |
|
|
$ |
15,282 |
|
|
$ |
20,962 |
|
|
CAD per share |
|
$ |
0.28 |
|
|
$ |
0.27 |
|
|
$ |
0.37 |
|
|
$ |
0.19 |
|
|
$ |
0.26 |
|
|
CAD per share, without real estate gains |
|
|
0.19 |
|
|
|
0.20 |
|
|
|
0.21 |
|
|
|
0.18 |
|
|
|
0.26 |
|
|
Weighted average shares |
|
|
90,642,318 |
|
|
|
87,110,958 |
|
|
|
82,150,475 |
|
|
|
82,081,024 |
|
|
|
81,970,075 |
|
16
STATEMENT OF OPERATIONS, FFO and CAD
CONSOLIDATING – FOR THE YEAR ENDED DECEMBER 31, 2015
|
($'s in 000's, except per share amounts) |
|
For the Twelve-Month Period Ended December 31, 2015 |
|
|||||||||||||
|
|
|
RAIT |
|
|
IRT |
|
|
Corporate / Eliminations |
|
|
Consolidated |
|
||||
|
Revenue: |
|
|
|
|
|
|
|
|
|
|
|
|
|
|
|
|
|
Net interest margin |
|
|
|
|
|
|
|
|
|
|
|
|
|
|
|
|
|
Investment interest income |
|
$ |
99,397 |
|
|
$ |
- |
|
|
$ |
(965 |
) |
|
$ |
98,432 |
|
|
Investment interest expense |
|
|
(29,250 |
) |
|
|
- |
|
|
|
- |
|
|
|
(29,250 |
) |
|
Net interest margin |
|
|
70,147 |
|
|
|
- |
|
|
|
(965 |
) |
|
|
69,182 |
|
|
Property income |
|
|
124,155 |
|
|
|
109,576 |
|
|
|
- |
|
|
|
233,731 |
|
|
Fee and other income |
|
|
41,874 |
|
|
|
- |
|
|
|
(20,805 |
) |
|
|
21,069 |
|
|
Total revenue |
|
|
236,176 |
|
|
|
109,576 |
|
|
|
(21,770 |
) |
|
|
323,982 |
|
|
|
|
|
|
|
|
|
|
|
|
|
|
|
|
|
|
|
|
Expenses: |
|
|
|
|
|
|
|
|
|
|
|
|
|
|
|
|
|
Interest expense |
|
|
61,750 |
|
|
|
23,553 |
|
|
|
(965 |
) |
|
|
84,338 |
|
|
Real estate operating expenses |
|
|
62,721 |
|
|
|
49,955 |
|
|
|
(3,675 |
) |
|
|
109,001 |
|
|
Compensation expenses |
|
|
39,251 |
|
|
|
495 |
|
|
|
(11,517 |
) |
|
|
28,229 |
|
|
General and administrative expenses |
|
|
19,097 |
|
|
|
7,295 |
|
|
|
(5,613 |
) |
|
|
20,779 |
|
|
Acquisition and integration expenses |
|
|
2,972 |
|
|
|
13,555 |
|
|
|
- |
|
|
|
16,527 |
|
|
Provision for loan losses |
|
|
8,300 |
|
|
|
- |
|
|
|
- |
|
|
|
8,300 |
|
|
Depreciation and amortization expense |
|
|
45,774 |
|
|
|
28,094 |
|
|
|
- |
|
|
|
73,868 |
|
|
Total expenses |
|
|
239,865 |
|
|
|
122,947 |
|
|
|
(21,770 |
) |
|
|
341,042 |
|
|
|
|
|
|
|
|
|
|
|
|
|
|
|
|
|
|
|
|
Operating Income |
|
|
(3,689 |
) |
|
|
(13,371 |
) |
|
|
- |
|
|
|
(17,060 |
) |
|
Other income (expense) |
|
|
4,206 |
|
|
|
19 |
|
|
|
(5,234 |
) |
|
|
(1,009 |
) |
|
Gains (loss) on assets |
|
|
37,393 |
|
|
|
6,412 |
|
|
|
- |
|
|
|
43,805 |
|
|
Asset impairment |
|
|
(8,179 |
) |
|
|
- |
|
|
|
- |
|
|
|
(8,179 |
) |
|
TSRE financing extinguishment and employee separation |
|
|
|
|
|
|
(27,508 |
) |
|
|
|
|
|
|
(27,508 |
) |
|
Gain (loss) on IRT merger with TSRE |
|
|
- |
|
|
|
64,604 |
|
|
|
|
|
|
|
64,604 |
|
|
Gain (loss) on debt extinguishment |
|
|
- |
|
|
|
- |
|
|
|
- |
|
|
|
- |
|
|
Change in fair value of financial instruments |
|
|
11,638 |
|
|
|
- |
|
|
|
- |
|
|
|
11,638 |
|
|
Income (loss) before taxes |
|
|
41,369 |
|
|
|
30,156 |
|
|
|
(5,234 |
) |
|
|
66,291 |
|
|
Income tax benefit (provision) |
|
|
(2,798 |
) |
|
|
- |
|
|
|
- |
|
|
|
(2,798 |
) |
|
Net income (loss) |
|
|
38,571 |
|
|
|
30,156 |
|
|
|
(5,234 |
) |
|
|
63,493 |
|
|
Income allocated to preferred shares |
|
|
(32,830 |
) |
|
|
- |
|
|
|
- |
|
|
|
(32,830 |
) |
|
(Income) loss allocated to noncontrolling interests |
|
|
2,233 |
|
|
|
(1,914 |
) |
|
|
(23,824 |
) |
|
|
(23,505 |
) |
|
Net income (loss) available to common shares |
|
$ |
7,974 |
|
|
$ |
28,242 |
|
|
$ |
(29,058 |
) |
|
$ |
7,158 |
|
|
|
|
|
|
|
|
|
|
|
|
|
|
|
|
|
|
|
|
EPS - BASIC |
|
$ |
0.09 |
|
|
$ |
0.33 |
|
|
$ |
(0.34 |
) |
|
$ |
0.08 |
|
|
EPS - DILUTED |
|
$ |
0.09 |
|
|
$ |
0.33 |
|
|
$ |
(0.34 |
) |
|
$ |
0.08 |
|
|
Weighted-average shares outstanding - Basic |
|
|
85,524,073 |
|
|
|
85,524,073 |
|
|
|
85,524,073 |
|
|
|
85,524,073 |
|
|
Weighted-average shares outstanding - Diluted |
|
|
86,457,871 |
|
|
|
86,457,871 |
|
|
|
86,457,871 |
|
|
|
86,457,871 |
|
|
|
|
|
|
|
|
|
|
|
|
|
|
|
|
|
|
|
|
Funds From Operations (FFO): |
|
|
|
|
|
|
|
|
|
|
|
|
|
|
|
|
|
Net Income (loss) available to common shares |
|
$ |
7,974 |
|
|
$ |
28,242 |
|
|
$ |
(29,058 |
) |
|
$ |
7,158 |
|
|
Add-Back (Deduct): |
|
|
|
|
|
|
|
|
|
|
|
|
|
|
|
|
|
Depreciation |
|
|
36,951 |
|
|
|
20,888 |
|
|
|
(16,743 |
) |
|
|
41,096 |
|
|
(Gains) Losses on the sale of real estate |
|
|
(37,102 |
) |
|
|
(6,412 |
) |
|
|
- |
|
|
|
(43,514 |
) |
|
FFO |
|
$ |
7,823 |
|
|
$ |
42,718 |
|
|
$ |
(45,801 |
) |
|
$ |
4,740 |
|
|
FFO per share--basic |
|
$ |
0.09 |
|
|
$ |
0.50 |
|
|
$ |
(0.54 |
) |
|
$ |
0.06 |
|
|
Weighted-average shares outstanding |
|
|
85,524,073 |
|
|
|
85,524,073 |
|
|
|
85,524,073 |
|
|
|
85,524,073 |
|
|
|
|
|
|
|
|
|
|
|
|
|
|
|
|
|
|
|
17
|
|
|
|
|
|
|
|
|
|
|
|
|
|
|
|
|
|
|
Net Income (loss) available to common shares |
|
$ |
7,974 |
|
|
$ |
28,242 |
|
|
$ |
(29,058 |
) |
|
$ |
7,158 |
|
|
Add-Back (Deduct): |
|
|
|
|
|
|
|
|
|
|
|
|
|
|
|
|
|
Depreciation and amortization expense |
|
|
45,774 |
|
|
|
28,094 |
|
|
|
- |
|
|
|
73,868 |
|
|
Change in fair value of financial instruments |
|
|
(11,638 |
) |
|
|
- |
|
|
|
- |
|
|
|
(11,638 |
) |
|
(Gains) losses on assets |
|
|
(9,590 |
) |
|
|
(2,614 |
) |
|
|
- |
|
|
|
(12,204 |
) |
|
TSRE financing extinguishment and employee separation |
|
|
- |
|
|
|
27,508 |
|
|
|
- |
|
|
|
27,508 |
|
|
(Gains) loss on IRT merger with TSRE |
|
|
- |
|
|
|
(64,604 |
) |
|
|
- |
|
|
|
(64,604 |
) |
|
Straight-line rental adjustments |
|
|
95 |
|
|
|
- |
|
|
|
- |
|
|
|
95 |
|
|
Equity based compensation |
|
|
3,971 |
|
|
|
495 |
|
|
|
- |
|
|
|
4,466 |
|
|
Acquisition and integration expenses |
|
|
2,972 |
|
|
|
13,555 |
|
|
|
|
|
|
|
16,527 |
|
|
Origination fees and other deferred items |
|
|
35,402 |
|
|
|
258 |
|
|
|
- |
|
|
|
35,660 |
|
|
Provision for losses |
|
|
8,300 |
|
|
|
- |
|
|
|
- |
|
|
|
8,300 |
|
|
Asset impairment |
|
|
8,179 |
|
|
|
- |
|
|
|
- |
|
|
|
8,179 |
|
|
Noncontrolling interest effect of certain adjustments |
|
|
3,788 |
|
|
|
- |
|
|
|
(2,039 |
) |
|
|
1,749 |
|
|
CAD |
|
$ |
95,227 |
|
|
$ |
30,934 |
|
|
$ |
(31,097 |
) |
|
$ |
95,064 |
|
|
CAD per share |
|
$ |
1.11 |
|
|
$ |
0.36 |
|
|
$ |
(0.36 |
) |
|
$ |
1.11 |
|
18
TRAILING 5 QUARTERS AND YEARS ENDED DECEMBER 31, 2015 AND 2014
|
($'s in 000's) |
|
Three Months Ended |
|
|
|
|
Year Ended December 31 |
|
||||||||||||||||||||||
|
|
|
December 31, 2015 |
|
|
September 30, 2015 |
|
|
June 30, 2015 |
|
|
March 31, 2015 |
|
|
December 31, 2014 |
|
|
|
|
2015 |
|
|
2014 |
|
|||||||
|
|
|
|
|
|
|
|
|
|
|
|
|
|
|
|
|
|
|
|
|
|
|
|
|
|
|
|
|
|
|
|
|
CMBS Gain on sale |
|
$ |
1,135 |
|
|
$ |
434 |
|
|
$ |
3,681 |
|
|
$ |
1,996 |
|
|
$ |
2,986 |
|
|
|
|
$ |
7,246 |
|
|
$ |
9,526 |
|
|
Property management & leasing fees |
|
|
3,513 |
|
|
|
2,287 |
|
|
|
2,636 |
|
|
|
3,436 |
|
|
|
1,803 |
|
|
|
|
|
11,872 |
|
|
|
11,630 |
|
|
Property reimbursement income |
|
|
274 |
|
|
|
277 |
|
|
|
224 |
|
|
|
199 |
|
|
|
280 |
|
|
|
|
|
974 |
|
|
|
1,404 |
|
|
Collateral management fees |
|
|
- |
|
|
|
- |
|
|
|
- |
|
|
|
- |
|
|
|
48 |
|
|
|
|
|
- |
|
|
|
991 |
|
|
Other income |
|
|
82 |
|
|
|
58 |
|
|
|
874 |
|
|
|
(37 |
) |
|
|
50 |
|
|
|
|
|
977 |
|
|
|
729 |
|
|
|
|
|
|
|
|
|
|
|
|
|
|
|
|
|
|
|
|
|
|
|
|
|
|
|
|
|
|
|
|
|
|
Fee and other income, as reported |
|
|
5,004 |
|
|
|
3,056 |
|
|
|
7,415 |
|
|
|
5,594 |
|
|
|
5,167 |
|
|
|
|
|
21,069 |
|
|
|
24,280 |
|
|
Add: Items eliminated in consolidation: |
|
|
|
|
|
|
|
|
|
|
|
|
|
|
|
|
|
|
|
|
|
|
|
|
|
|
|
|
|
|
|
IRT Property management fees (a) |
|
|
1,294 |
|
|
|
861 |
|
|
|
764 |
|
|
|
755 |
|
|
|
556 |
|
|
|
|
|
3,674 |
|
|
|
1,759 |
|
|
IRT advisory fees (a) |
|
|
1,882 |
|
|
|
1,259 |
|
|
|
1,260 |
|
|
|
1,212 |
|
|
|
644 |
|
|
|
|
|
5,613 |
|
|
|
1,736 |
|
|
Total fee and other income |
|
$ |
8,180 |
|
|
$ |
5,176 |
|
|
$ |
9,439 |
|
|
$ |
7,561 |
|
|
$ |
6,367 |
|
|
|
|
$ |
30,356 |
|
|
$ |
27,775 |
|
|
(a) |
Represent fees paid by IRT to RAIT affiliates for services rendered. Fees are eliminated in the consolidation of IRT. As of December 31, 2015, RAIT owns 15.5% of the outstanding common shares of IRT. Excludes property management fees from RAIT owned properties. |
19
ADJUSTED EBITDA AND COVERAGE RATIOS
|
($'s in 000's) |
|
Three Months Ended |
|
|
Year Ended December 31 |
|
||||||||||||||||||||||
|
|
|
December 31, 2015 |
|
|
September 30, 2015 |
|
|
June 30, 2015 |
|
|
March 31, 2015 |
|
|
December 31, 2014 |
|
|
2015 |
|
|
2014 |
|
|||||||
|
|
|
|
|
|
|
|
|
|
|
|
|
|
|
|
|
|
|
|
|
|
|
|||||||
|
ADJUSTED EBITDA: |
|
|
|
|
|
|
|
|
|
|
|
|
|
|
|
|
|
|
|
|
|
|
|
|
|
|
|
|
|
Net income |
|
$ |
11,960 |
|
|
$ |
24,826 |
|
|
$ |
26,441 |
|
|
$ |
266 |
|
|
$ |
(247,080 |
) |
|
$ |
63,493 |
|
|
$ |
(289,975 |
) |
|
Add (deduct): |
|
|
|
|
|
|
|
|
|
|
|
|
|
|
|
|
|
|
|
|
|
|
|
|
|
|
|
|
|
Investment interest expense |
|
|
6,733 |
|
|
|
8,021 |
|
|
|
7,582 |
|
|
|
6,914 |
|
|
|
7,968 |
|
|
|
29,250 |
|
|
|
30,310 |
|
|
Interest expense |
|
|
25,408 |
|
|
|
19,574 |
|
|
|
19,673 |
|
|
|
19,683 |
|
|
|
16,635 |
|
|
|
84,338 |
|
|
|
55,391 |
|
|
Acquisition and integration expenses |
|
|
1,684 |
|
|
|
12,901 |
|
|
|
985 |
|
|
|
957 |
|
|
|
950 |
|
|
|
16,527 |
|
|
|
2,358 |
|
|
Depreciation and amortization |
|
|
22,583 |
|
|
|
15,254 |
|
|
|
17,007 |
|
|
|
19,024 |
|
|
|
18,065 |
|
|
|
73,868 |
|
|
|
56,784 |
|
|
(Gains) Losses on assets |
|
|
(19,094 |
) |
|
|
(7,430 |
) |
|
|
(17,281 |
) |
|
|
- |
|
|
|
20 |
|
|
|
(43,805 |
) |
|
|
5,370 |
|
|
Asset impairment |
|
|
929 |
|
|
|
7,250 |
|
|
|
- |
|
|
|
- |
|
|
|
- |
|
|
|
8,179 |
|
|
|
- |
|
|
TSRE financing extinguishment and employee separation expenses |
|
|
- |
|
|
|
27,508 |
|
|
|
- |
|
|
|
- |
|
|
|
- |
|
|
|
27,508 |
|
|
|
- |
|
|
(Gain) on IRT merger with TSRE |
|
|
(592 |
) |
|
|
(64,012 |
) |
|
|
- |
|
|
|
- |
|
|
|
- |
|
|
|
(64,604 |
) |
|
|
- |
|
|
Loss on deconsolidation of VIEs |
|
|
- |
|
|
|
- |
|
|
|
- |
|
|
|
- |
|
|
|
215,804 |
|
|
|
- |
|
|
|
215,804 |
|
|
Net gain from collateral management sale |
|
|
- |
|
|
|
- |
|
|
|
- |
|
|
|
- |
|
|
|
(4,549 |
) |
|
|
- |
|
|
|
(4,549 |
) |
|
(Gain) on debt extinguishment |
|
|
- |
|
|
|
- |
|
|
|
- |
|
|
|
- |
|
|
|
- |
|
|
|
- |
|
|
|
(2,421 |
) |
|
Change in fair value of financial instruments |
|
|
1,828 |
|
|
|
(620 |
) |
|
|
(8,356 |
) |
|
|
(4,490 |
) |
|
|
39,319 |
|
|
|
(11,638 |
) |
|
|
98,752 |
|
|
Income tax (benefit) provision |
|
|
1,478 |
|
|
|
23 |
|
|
|
715 |
|
|
|
582 |
|
|
|
307 |
|
|
|
2,798 |
|
|
|
(2,147 |
) |
|
|
|
|
|
|
|
|
|
|
|
|
|
|
|
|
|
|
|
|
|
|
|
|
|
|
|
|
|
|
|
Adjusted EBITDA |
|
$ |
52,917 |
|
|
$ |
43,295 |
|
|
$ |
46,766 |
|
|
$ |
42,936 |
|
|
$ |
47,439 |
|
|
$ |
185,914 |
|
|
$ |
165,677 |
|
|
|
|
|
|
|
|
|
|
|
|
|
|
|
|
|
|
|
|
|
|
|
|
|
|
|
|
|
|
|
20
|
|
|
|
|
|
|
|
|
|
|
|
|
|
|
|
|
|
|
|
|
|
|
|
|
|
|
|
|
|
|
Investment interest expense |
|
$ |
6,733 |
|
|
$ |
8,021 |
|
|
$ |
7,582 |
|
|
$ |
6,914 |
|
|
$ |
7,968 |
|
|
$ |
29,250 |
|
|
$ |
30,310 |
|
|
Interest expense |
|
|
25,408 |
|
|
|
19,574 |
|
|
|
19,673 |
|
|
|
19,683 |
|
|
|
16,635 |
|
|
|
84,338 |
|
|
|
55,391 |
|
|
Total Interest Expense |
|
|
32,141 |
|
|
|
27,595 |
|
|
|
27,255 |
|
|
|
26,597 |
|
|
|
24,603 |
|
|
|
113,588 |
|
|
|
85,701 |
|
|
Less: Amortization of deferred financing costs and debt discounts |
|
|
(4,840 |
) |
|
|
(3,645 |
) |
|
|
(5,159 |
) |
|
|
(4,299 |
) |
|
|
(3,058 |
) |
|
|
(17,943 |
) |
|
|
(10,786 |
) |
|
Interest Cost |
|
$ |
27,301 |
|
|
$ |
23,950 |
|
|
$ |
22,096 |
|
|
$ |
22,298 |
|
|
$ |
21,545 |
|
|
$ |
95,645 |
|
|
$ |
74,915 |
|
|
|
|
|
|
|
|
|
|
|
|
|
|
|
|
|
|
|
|
|
|
|
|
|
|
|
|
|
|
|
|
PREFERRED COST: |
|
|
|
|
|
|
|
|
|
|
|
|
|
|
|
|
|
|
|
|
|
|
|
|
|
|
|
|
|
Net income allocated to preferred shares |
|
$ |
8,447 |
|
|
$ |
8,303 |
|
|
$ |
8,221 |
|
|
$ |
7,859 |
|
|
$ |
8,365 |
|
|
$ |
32,830 |
|
|
$ |
28,993 |
|
|
Less: preferred share discount amortization |
|
|
(1,608 |
) |
|
|
(1,725 |
) |
|
|
(1,642 |
) |
|
|
(1,563 |
) |
|
|
(2,061 |
) |
|
|
(6,538 |
) |
|
|
(5,452 |
) |
|
Preferred cost |
|
$ |
6,839 |
|
|
$ |
6,578 |
|
|
$ |
6,579 |
|
|
$ |
6,296 |
|
|
$ |
6,304 |
|
|
$ |
26,292 |
|
|
$ |
23,541 |
|
|
|
|
|
|
|
|
|
|
|
|
|
|
|
|
|
|
|
|
|
|
|
|
|
|
|
|
|
|
|
|
INTEREST COVERAGE: |
|
|
1.94 |
x |
|
|
1.81 |
x |
|
|
2.12 |
x |
|
|
1.93 |
x |
|
|
2.20 |
x |
|
|
1.94 |
x |
|
|
2.21 |
x |
|
INTEREST + PREFERRED COVERAGE: |
|
|
1.55 |
x |
|
|
1.42 |
x |
|
|
1.63 |
x |
|
|
1.50 |
x |
|
|
1.70 |
x |
|
|
1.52 |
x |
|
|
1.68 |
x |
21
|
Loan Portfolio Data, as of December 31, 2015 |
||||||||||||||||||||||||||||||
|
($'s in 000's) |
|
|
|
|
|
|
|
|
|
|
|
|
|
|
|
|
|
|
|
|
|
|
|
|
|
|
|
|
|
|
|
Loan Type |
|
Unpaid Principal Balance |
|
|
Weighted Average Coupon |
|
|
Remaining Life, Years (weighted average) |
|
|
# of Loans |
|
|
|
|
|
||||||||||||||
|
Bridge loans |
|
$ |
1,378,089 |
|
|
|
5.6 |
% |
|
|
3.0 |
|
|
|
118 |
|
|
|
|
|||||||||||
|
Conduit loans |
|
|
49,239 |
|
|
|
4.8 |
% |
|
|
9.0 |
|
|
|
6 |
|
|
|
|
|||||||||||
|
Mezzanine loans |
|
|
169,556 |
|
|
|
10.0 |
% |
|
|
3.0 |
|
|
|
57 |
|
|
|
|
|||||||||||
|
Preferred equity investments |
|
|
30,237 |
|
|
|
6.9 |
% |
|
|
6.0 |
|
|
|
7 |
|
|
|
|
|||||||||||
|
|
|
|
|
|
|
|
|
|
|
|
|
|
|
|
|
|
|
|
|
|||||||||||
|
Total |
|
|
1,627,121 |
|
|
|
6.1 |
% |
|
|
3.2 |
|
|
|
188 |
|
|
|
|
|||||||||||
|
Unamortized discounts, fees and costs |
|
|
(3,537 |
) |
|
|
|
|
|
|
|
|
|
|
|
|
|
|
|
|||||||||||
|
Aggregate carrying amount |
|
$ |
1,623,583 |
|
|
|
|
|
|
|
|
|
|
|
|
|
|
|
|
|||||||||||
|
|
|
|
|
|
|
|
|
|
|
|
|
|
|
|
|
|
|
|
|
|
|
|
|
|
|
|
|
|
|
|
|
|
|
|
|
|
|
|
|
|
|
|
|
|
|
|
|
|
|
|
|
|
|
|
|
|
|
|
|
|
|
|
|
Loan Portfolio Data Trends |
|
|||||||||||||||||||||||||||||
|
($'s on 000's) |
|
|
|
|
|
|
|
|
|
|
|
|
|
|
|
|
|
|
|
|
|
|
|
|
|
|
|
|
|
|
|
|
|
For the Three Months Ended |
|
|
|
|
For the Year Ended Dccember 31 |
|
||||||||||||||||||||||
|
|
|
December 31, 2015 |
|
|
September 30, 2015 |
|
|
June 30, 2015 |
|
|
March 31, 2015 |
|
|
December 31, 2014 |
|
|
|
|
2015 |
|
|
2014 |
|
|||||||
|
Bridge First Mortgage loans: |
|
|
|
|
|
|
|
|
|
|
|
|
|
|
|
|
|
|
|
|
|
|
|
|
|
|
|
|
|
|
|
Origination volume |
|
$ |
249,937 |
|
|
$ |
172,478 |
|
|
$ |
95,325 |
|
|
$ |
90,100 |
|
|
$ |
114,500 |
|
|
|
|
$ |
607,840 |
|
|
$ |
504,962 |
|
|
# of loans originated |
|
|
16 |
|
|
|
17 |
|
|
|
10 |
|
|
|
9 |
|
|
|
12 |
|
|
|
|
|
52 |
|
|
|
48 |
|
|
Unpaid principal balance (period end) |
|
$ |
1,378,089 |
|
|
$ |
1,305,086 |
|
|
$ |
1,168,106 |
|
|
$ |
1,128,392 |
|
|
$ |
1,054,365 |
|
|
|
|
$ |
1,378,089 |
|
|
$ |
1,054,365 |
|
|
Weighted average coupon (period end) |
|
|
5.6 |
% |
|
|
5.4 |
% |
|
|
5.7 |
% |
|
|
6.1 |
% |
|
|
6.3 |
% |
|
|
|
|
5.6 |
% |
|
|
6.3 |
% |
|
|
|
|
|
|
|
|
|
|
|
|
|
|
|
|
|
|
|
|
|
|
|
|
|
|
|
|
|
|
|
|
|
Conduit First Mortgage loans (for sale): |
|
|
|
|
|
|
|
|
|
|
|
|
|
|
|
|
|
|
|
|
|
|
|
|
|
|
|
|
|
|
|
Origination volume |
|
$ |
71,900 |
|
|
$ |
65,196 |
|
|
$ |
118,288 |
|
|
$ |
128,670 |
|
|
$ |
139,935 |
|
|
|
|
$ |
384,054 |
|
|
$ |
459,245 |
|
|
# of loans originated |
|
|
12 |
|
|
|
8 |
|
|
|
14 |
|
|
|
8 |
|
|
|
17 |
|
|
|
|
|
42 |
|
|
|
53 |
|
|
Loans sold to securitization |
|
$ |
85,430 |
|
|
$ |
116,251 |
|
|
$ |
130,401 |
|
|
$ |
92,897 |
|
|
$ |
170,679 |
|
|
|
|
$ |
424,979 |
|
|
$ |
409,667 |
|
|
Securitization profits |
|
|
1,135 |
|
|
|
434 |
|
|
|
3,681 |
|
|
|
1,996 |
|
|
|
2,986 |
|
|
|
|
|
7,246 |
|
|
|
9,526 |
|
|
Securitization profit % |
|
|
1.3 |
% |
|
|
0.4 |
% |
|
|
2.8 |
% |
|
|
2.1 |
% |
|
|
1.7 |
% |
|
|
|
|
1.7 |
% |
|
|
2.3 |
% |
|
Unpaid principal balance (period end) |
|
$ |
49,239 |
|
|
$ |
62,986 |
|
|
$ |
114,048 |
|
|
$ |
129,550 |
|
|
$ |
93,925 |
|
|
|
|
$ |
49,239 |
|
|
$ |
93,925 |
|
|
Weighted average coupon (period end) |
|
|
4.8 |
% |
|
|
4.8 |
% |
|
|
4.3 |
% |
|
|
4.3 |
% |
|
|
4.6 |
% |
|
|
|
|
4.8 |
% |
|
|
4.6 |
% |
|
|
|
|
|
|
|
|
|
|
|
|
|
|
|
|
|
|
|
|
|
|
|
|
|
|
|
|
|
|
|
|
|
Mezzanine and Preferred Equity Investments: |
|
|
|
|
|
|
|
|
|
|
|
|
|
|
|
|
|
|
|
|
|
|
|
|
|
|
|
|
|
|
|
Origination volume |
|
$ |
— |
|
|
$ |
— |
|
|
$ |
5,000 |
|
|
$ |
— |
|
|
$ |
900 |
|
|
|
|
$ |
5,000 |
|
|
$ |
19,550 |
|
|
Unpaid principal balance (period end) |
|
|
199,793 |
|
|
|
236,608 |
|
|
|
242,005 |
|
|
|
261,027 |
|
|
|
260,964 |
|
|
|
|
$ |
199,793 |
|
|
$ |
260,964 |
|
|
Weighted average coupon (period end) |
|
|
9.5 |
% |
|
|
9.1 |
% |
|
|
9.4 |
% |
|
|
9.4 |
% |
|
|
9.4 |
% |
|
|
|
|
9.5 |
% |
|
|
9.4 |
% |
|
|
|
|
|
|
|
|
|
|
|
|
|
|
|
|
|
|
|
|
|
|
|
|
|
|
|
|
|
|
|
|
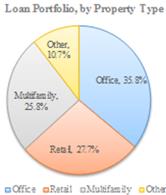
22
|
|
|
|
|
|
|
|
|
|
|
|
|
|
|
|
|
|
|
|
|
|
|
|
|
|
|
|
|
|
|
|
|
Bridge loans |
|
$ |
15,645 |
|
|
$ |
15,645 |
|
|
$ |
— |
|
|
$ |
— |
|
|
$ |
— |
|
|
|
|
$ |
15,645 |
|
|
$ |
— |
|
|
Mezzanine and preferred equity |
|
|
20,292 |
|
|
|
24,851 |
|
|
|
24,851 |
|
|
|
24,851 |
|
|
|
25,281 |
|
|
|
|
|
20,292 |
|
|
|
25,281 |
|
|
Total non-accrual loans |
|
$ |
35,937 |
|
|
$ |
40,496 |
|
|
$ |
24,851 |
|
|
$ |
24,851 |
|
|
$ |
25,281 |
|
|
|
|
$ |
35,937 |
|
|
$ |
25,281 |
|
|
|
|
|
|
|
|
|
|
|
|
|
|
|
|
|
|
|
|
|
|
|
|
|
|
|
|
|
|
|
|
|
|
Credit status: |
|
|
|
|
|
|
|
|
|
|
|
|
|
|
|
|
|
|
|
|
|
|
|
|
|
|
|
|
|
|
|
Satisfactory |
|
$ |
1,494,884 |
|
|
$ |
1,538,388 |
|
|
$ |
1,433,092 |
|
|
$ |
1,438,279 |
|
|
$ |
1,328,134 |
|
|
|
|
$ |
1,494,884 |
|
|
$ |
1,328,134 |
|
|
Watchlist -- expecting full recovery |
|
|
77,800 |
|
|
|
18,296 |
|
|
|
47,716 |
|
|
|
55,839 |
|
|
|
67,839 |
|
|
|
|
|
77,800 |
|
|
|
67,839 |
|
|
Watchlist -- with reserves (Impaired Loans) |
|
|
54,437 |
|
|
|
47,996 |
|
|
|
43,351 |
|
|
|
24,851 |
|
|
|
13,281 |
|
|
|
|
|
54,437 |
|
|
|
13,281 |
|
|
Total |
|
$ |
1,627,121 |
|
|
$ |
1,604,680 |
|
|
$ |
1,524,159 |
|
|
$ |
1,518,969 |
|
|
$ |
1,409,254 |
|
|
|
|
$ |
1,627,121 |
|
|
$ |
1,409,254 |
|
|
|
|
|
|
|
|
|
|
|
|
|
|
|
|
|
|
|
|
|
|
|
|
|
|
|
|
|
|
|
|
|
|
Loan loss reserves: |
|
|
|
|
|
|
|
|
|
|
|
|
|
|
|
|
|
|
|
|
|
|
|
|
|
|
|
|
|
|
|
Beginning balance |
|
$ |
14,647 |
|
|
$ |
12,797 |
|
|
$ |
10,797 |
|
|
$ |
9,218 |
|
|
$ |
15,662 |
|
|
|
|
$ |
9,218 |
|
|
$ |
22,955 |
|
|
Provision |
|
|
2,450 |
|
|
|
1,850 |
|
|
|
2,000 |
|
|
|
2,000 |
|
|
|
2,000 |
|
|
|
|
|
8,300 |
|
|
|
5,500 |
|
|
Charge-offs, net of recoveries |
|
|
- |
|
|
|
— |
|
|
|
— |
|
|
|
(421 |
) |
|
|
(8,444 |
) |
|
|
|
|
(421 |
) |
|
|
(19,237 |
) |
|
Ending balance |
|
$ |
17,097 |
|
|
$ |
14,647 |
|
|
$ |
12,797 |
|
|
$ |
10,797 |
|
|
$ |
9,218 |
|
|
|
|
$ |
17,097 |
|
|
$ |
9,218 |
|
|
|
|
|
|
|
|
|
|
|
|
|
|
|
|
|
|
|
|
|
|
|
|
|
|
|
|
|
|
|
|
|
|
Statistics as a % of Total Loans (period end): |
|
|
|
|
|
|
|
|
|
|
|
|
|
|
|
|
|
|
|
|
|
|
|
|
|
|
|
|
|
|
|
Non-accrual loans |
|
|
2.2 |
% |
|
|
2.5 |
% |
|
|
1.6 |
% |
|
|
1.6 |
% |
|
|
1.8 |
% |
|
|
|
|
2.2 |
% |
|
|
1.8 |
% |
|
Watchlist -- expecting full recovery |
|
|
4.8 |
% |
|
|
1.1 |
% |
|
|
3.1 |
% |
|
|
3.7 |
% |
|
|
4.8 |
% |
|
|
|
|
4.8 |
% |
|
|
4.8 |
% |
|
Watchlist -- with reserves (Impaired Loans) |
|
|
3.3 |
% |
|
|
3.0 |
% |
|
|
2.8 |
% |
|
|
1.6 |
% |
|
|
0.9 |
% |
|
|
|
|
3.3 |
% |
|
|
0.9 |
% |
|
Loan loss reserves |
|
|
1.1 |
% |
|
|
0.9 |
% |
|
|
0.8 |
% |
|
|
0.7 |
% |
|
|
0.7 |
% |
|
|
|
|
1.1 |
% |
|
|
0.7 |
% |
23
|
Real Estate Portfolio Summary, as of December 31, 2015 |
||||||||||||||||||||||||||||||
|
($'s in 000's) |
|
|
|
|
|
|
|
|
|
|
|
|
|
|
|
|
|
|
|
|
|
|
|
|
|
|
|
|
|
|
|
Property Type |
|
Gross Cost |
|
|
# of Properties |
|
|
Units / Square Feet / Acres |
|
|
Weighted Average Occupancy |
|
|
Weighted Average Rental Rate |
|
|
|
|
|
|
|
|
|
|
|
|||||
|
RAIT: |
|
|
|
|
|
|
|
|
|
|
|
|
|
|
|
|
|
|
|
|
|
|
|
|
|
|
|
|
|
|
|
Multifamily |
|
$ |
470,689 |
|
|
|
22 |
|
|
|
5,311 |
|
|
|
92.8 |
% |
|
$ |
841 |
|
|
per unit, per month |
|
|||||||
|
Office |
|
|
333,362 |
|
|
|
14 |
|
|
|
2,264,264 |
|
|
|
78.5 |
% |
|
$ |
19.90 |
|
|
per square foot, per year |
|
|||||||
|
Retail |
|
|
122,347 |
|
|
|
5 |
|
|
|
1,378,171 |
|
|
|
68.6 |
% |
|
$ |
15.23 |
|
|
per square foot, per year |
|
|||||||
|
Industrial |
|
|
94,936 |
|
|
|
10 |
|
|
|
1,615,473 |
|
|
|
82.0 |
% |
|
$ |
3.71 |
|
|
per square foot, per year |
|
|||||||
|
Redevelopment |
|
|
73,847 |
|
|
|
2 |
|
|
|
1,206,514 |
|
|
|
|
|
|
|
|
|
|
|
|
|
|
|
|
|
|
|
|
Land |
|
|
50,449 |
|
|
|
8 |
|
|
|
14.2 |
|
|
|
|
|
|
|
|
|
|
|
|
|
|
|
|
|
|
|
|
Total RAIT Owned |
|
|
1,145,630 |
|
|
|
61 |
|
|
|
|
|
|
|
|
|
|
|
|
|
|
|
|
|
|
|
|
|
|
|
|
Independence Realty Trust (IRT) Multifamily |
|
|
1,372,015 |
|
|
|
49 |
|
|
|
13,724 |
|
|
|
93.0 |
% |
|
$ |
951 |
|
|
per unit, per month |
|
|||||||
|
|
|
|
|
|
|
|
|
|
|
|
|
|
|
|
|
|
|
|
|
|
|
|
|
|
|
|
|
|
|
|
|
Total |
|
|
2,517,645 |
|
|
|
110 |
|
|
|
|
|
|
|
|
|
|
|
|
|
|
|
|
|
|
|
|
|
|
|
|
Accumulated depreciation |
|
|
(198,326 |
) |
|
|
|
|
|
|
|
|
|
|
|
|
|
|
|
|
|
|
|
|
|
|
|
|
|
|
|
Carrying Amount |
|
$ |
2,319,319 |
|
|
|
|
|
|
|
|
|
|
|
|
|
|
|
|
|
|
|
|
|
|
|
|
|
|
|
|
|
|
|
|
|
|
|
|
|
|
|
|
|
|
|
|
|
|
|
|
|
|
|
|
|
|
|
|
|
|
|
|
|
|
|
|
|
|
|
|
|
|
|
|
|
|
|
|
|
|
|
|
|
|
|
|
|
|
|
|
|
|
|
|
Real Estate Same Store Property Trends |
|
For the Three Months Ended |
|
|
|
|
For the Year Ended Dccember 31 |
|
||||||||||||||||||||||
|
($'s in 000's) |
|
December 31, 2015 |
|
|
September 30, 2015 |
|
|
June 30, 2015 |
|
|
March 31, 2015 |
|
|
December 31, 2014 |
|
|
|
|
2015 |
|
|
2014 |
|
|||||||
|
RAIT Multifamily Portfolio: |
|
|
|
|
|
|
|
|
|
|
|
|
|
|
|
|
|
|
|
|
|
|
|
|
|
|
|
|
|
|
|
# of Properties |
|
|
22 |
|
|
|
22 |
|
|
|
22 |
|
|
|
22 |
|
|
|
22 |
|
|
|
|
|
21 |
|
|
|
21 |
|
|
# of Units |
|
|
5,311 |
|
|
|
5,311 |
|
|
|
5,311 |
|
|
|
5,311 |
|
|
|
5,311 |
|
|
|
|
|
4,941 |
|
|
|
4,941 |
|
|
Property income |
|
$ |
13,016 |
|
|
$ |
13,056 |
|
|
$ |
12,813 |
|
|
$ |
12,520 |
|
|
$ |
12,307 |
|
|
|
|
$ |
46,378 |
|
|
$ |
43,787 |
|
|
Operating expenses |
|
|
6,390 |
|
|
|
6,393 |
|
|
|
6,410 |
|
|
|
6,370 |
|
|
|
6,350 |
|
|
|
|
|
23,135 |
|
|
|
22,732 |
|
|
Net operating income |
|
|
6,626 |
|
|
|
6,663 |
|
|
|
6,403 |
|
|
|
6,150 |
|
|
|
5,957 |
|
|
|
|
|
23,242 |
|
|
|
21,055 |
|
|
NOI margin |
|
|
50.9 |
% |
|
|
51.0 |
% |
|
|
50.0 |
% |
|
|
49.1 |
% |
|
|
48.4 |
% |
|
|
|
|
50.1 |
% |
|
|
48.1 |
% |
|
Occupancy |
|
|
92.8 |
% |
|
|
93.7 |
% |
|
|
93.7 |
% |
|
|
93.2 |
% |
|
|
92.5 |
% |
|
|
|
|
93.5 |
% |
|
|
92.5 |
% |
|
Effective monthly rental rate, per unit |
|
$ |
833 |
|
|
$ |
824 |
|
|
$ |
809 |
|
|
$ |
797 |
|
|
$ |
791 |
|
|
|
|
$ |
789 |
|
|
$ |
759 |
|
|
|
|
|
|
|
|
|
|
|
|
|
|
|
|
|
|
|
|
|
|
|
|
|
|
|
|
|
|
|
|
|
|
RAIT Office Portfolio: |
|
|
|
|
|
|
|
|
|
|
|
|
|
|
|
|
|
|
|
|
|
|
|
|
|
|
|
|
|
|
|
# of Properties |
|
|
15 |
|
|
|
15 |
|
|
|
15 |
|
|
|
15 |
|
|
|
15 |
|
|
|
|
|
12 |
|
|
|
12 |
|
|
Square feet |
|
|
2,264,264 |
|
|
|
2,263,429 |
|
|
|
2,263,429 |
|
|
|
2,263,429 |
|
|
|
2,263,429 |
|
|
|
|
|
1,988,361 |
|
|
|
1,988,361 |
|
|
Property income |
|
$ |
8,880 |
|
|
$ |
9,305 |
|
|
$ |
8,965 |
|
|
$ |
8,608 |
|
|
$ |
8,443 |
|
|
|
|
$ |
30,891 |
|
|
$ |
28,550 |
|
|
Operating expenses |
|
|
4,106 |
|
|
|
4,003 |
|
|
|
3,862 |
|
|
|
3,992 |
|
|
|
3,770 |
|
|
|
|
|
13,987 |
|
|
|
13,955 |
|
|
Net operating income |
|
|
4,774 |
|
|
|
5,302 |
|
|
|
5,103 |
|
|
|
4,616 |
|
|
|
4,673 |
|
|
|
|
|
16,904 |
|
|
|
14,595 |
|
|
NOI margin |
|
|
53.8 |
% |
|
|
57.0 |
% |
|
|
56.9 |
% |
|
|
53.6 |
% |
|
|
55.3 |
% |
|
|
|
|
55 |
% |
|
|
51 |
% |
|
Occupancy |
|
|
78.3 |
% |
|
|
78.0 |
% |
|
|
76.8 |
% |
|
|
75.0 |
% |
|
|
75.3 |
% |
|
|
|
|
77.6 |
% |
|
|
75.2 |
% |
|
Effective annual rental rate, per square foot |
|
$ |
19.34 |
|
|
$ |
19.62 |
|
|
$ |
19.75 |
|
|
$ |
19.46 |
|
|
$ |
19.29 |
|
|
|
|
$ |
18.94 |
|
|
$ |
18.69 |
|
|
|
|
|
|
|
|
|
|
|
|
|
|
|
|
|
|
|
|
|
|
|
|
|
|
|
|
|
|
|
|
|
|
RAIT Retail Portfolio: |
|
|
|
|
|
|
|
|
|
|
|
|
|
|
|
|
|
|
|
|
|
|
|
|
|
|
|
|
|
|
24
|
|
|
5 |
|
|
|
5 |
|
|
|
5 |
|
|
|
5 |
|
|
|
5 |
|
|
|
|
|
3 |
|
|
|
3 |
|
|
|
Square feet |
|
|
1,378,171 |
|
|
|
1,378,171 |
|
|
|
1,378,171 |
|
|
|
1,378,171 |
|
|
|
1,356,487 |
|
|
|
|
|
986,427 |
|
|
|
986,427 |
|
|
Property income |
|
$ |
3,580 |
|
|
$ |
3,469 |
|
|
$ |
4,118 |
|
|
$ |
3,313 |
|
|
$ |
3,444 |
|
|
|
|
$ |
8,357 |
|
|
$ |
7,999 |
|
|
Operating expenses |
|
|
1,987 |
|
|
|
2,124 |
|
|
|
2,806 |
|
|
|
1,490 |
|
|
|
2,010 |
|
|
|
|
|
6,699 |
|
|
|
6,654 |
|
|
Net operating income |
|
|
1,593 |
|
|
|
1,344 |
|
|
|
1,312 |
|
|
|
1,823 |
|
|
|
1,434 |
|
|
|
|
|
1,658 |
|
|
|
1,345 |
|
|
NOI margin |
|
|
44.5 |
% |
|
|
38.8 |
% |
|
|
31.9 |
% |
|
|
55.0 |
% |
|
|
41.6 |
% |
|
|
|
|
19.8 |
% |
|
|
16.8 |
% |
|
Occupancy |
|
|
68.6 |
% |
|
|
69.0 |
% |
|
|
69.6 |
% |
|
|
70.6 |
% |
|
|
70.8 |
% |
|
|
|
|
58.2 |
% |
|
|
60.7 |
% |
|
Effective annual rental rate, per square foot |
|
$ |
15.23 |
|
|
$ |
14.71 |
|
|
$ |
15.98 |
|
|
$ |
14.03 |
|
|
$ |
14.34 |
|
|
|
|
$ |
14.63 |
|
|
$ |
13.73 |
|
|
|
|
|
|
|
|
|
|
|
|
|
|
|
|
|
|
|
|
|
|
|
|
|
|
|
|
|
|
|
|
|
|
RAIT Industrial Portfolio: |
|
|
|
|
|
|
|
|
|
|
|
|
|
|
|
|
|
|
|
|
|
|
|
|
|
|
|
|
|
|
|
No same store properties |
|
|
— |
|
|
|
— |
|
|
|
— |
|
|
|
— |
|
|
|
— |
|
|
|
|
|
— |
|
|
|
— |
|
|
|
|
|
|
|
|
|
|
|
|
|
|
|
|
|
|
|
|
|
|
|
|
|
|
|
|
|
|
|
|
|
|
Independence Realty Trust Multifamily Portfolio: |
|
|
|
|
|
|
|
|
|
|
|
|
|
|
|
|
|
|
|
|
|
|
|
|
|
|
|
|
|
|
|
# of Properties |
|
|
21 |
|
|
|
21 |
|
|
|
21 |
|
|
|
21 |
|
|
|
21 |
|
|
|
|
|
9 |
|
|
|
9 |
|
|
# of Units |
|
|
6,150 |
|
|
|
6,150 |
|
|
|
6,150 |
|
|
|
6,150 |
|
|
|
6,150 |
|
|
|
|
|
2,470 |
|
|
|
2,470 |
|
|
Property income |
|
$ |
14,886 |
|
|
$ |
14,859 |
|
|
$ |
14,681 |
|
|
$ |
14,351 |
|
|
$ |
14,150 |
|
|
|
|
$ |
23,880 |
|
|
$ |
22,560 |
|
|
Operating expenses |
|
|
7,143 |
|
|
|
7,369 |
|
|
|
7,050 |
|
|
|
6,808 |
|
|
|
6,855 |
|
|
|
|
|
11,972 |
|
|
|
11,478 |
|
|
Net operating income |
|
|
7,743 |
|
|
|
7,490 |
|
|
|
7,631 |
|
|
|
7,543 |
|
|
|
7,295 |
|
|
|
|
|
11,908 |
|
|
|
11,082 |
|
|
Occupancy |
|
|
92.9 |
% |
|
|
93.5 |
% |
|
|
93.2 |
% |
|
|
93.0 |
% |
|
|
92.5 |
% |
|
|
|
|
94.0 |
% |
|
|
94.1 |
% |
|
Effective monthly rental rate, per unit |
|
$ |
823 |
|
|
$ |
814 |
|
|
$ |
808 |
|
|
$ |
794 |
|
|
$ |
790 |
|
|
|
|
$ |
809 |
|
|
$ |
767 |
|
|
|
|
|
|
|
|
|
|
|
|
|
|
|
|
|
|
|
|
|
|
|
|
|
|
|
|
|
|
|
|
|
|
Total Same Store Revenue |
|
$ |
40,362 |
|
|
$ |
40,689 |
|
|
$ |
40,577 |
|
|
$ |
38,792 |
|
|
$ |
38,345 |
|
|
|
|
$ |
109,506 |
|
|
$ |
102,896 |
|
|
Total Same Store Operating expenses |
|
|
19,626 |
|
|
|
19,890 |
|
|
|
20,128 |
|
|
|
18,660 |
|
|
|
18,986 |
|
|
|
|
|
55,794 |
|
|
|
54,820 |
|
|
Total Same Store Net operating income (a) |
|
$ |
20,736 |
|
|
$ |
20,799 |
|
|
$ |
20,449 |
|
|
$ |
20,132 |
|
|
$ |
19,359 |
|
|
|
|
$ |
53,712 |
|
|
$ |
48,077 |
|
|
NOI Increase (qtr to qtr / year to year) |
|
|
7.1 |
% |
|
|
|
|
|
|
|
|
|
|
|
|
|
|
|
|
|
|
|
|
11.7 |
% |
|
|
|
|
|
|
(a) |
See definition and reconciliation to net income in the definitions section. |
25
REAL ESTATE PROPERTIES, CHANGES IN THE PORTFOLIO – Q4 2015:
|
($'s in 000's) |
|
City & State |
|
Square Feet / Units |
|
|
Month Acquired / Sold |
|
Transaction |
|
Value |
|
|
||
|
ADDITIONS: |
|
|
|
|
|
|
|
|
|
|
|
|
|
|
|
|
Industrial Portfolio: |
|
|
|
|
|
|
|
|
|
|
|
|
|
|
|
|
Adams Aircraft |
|
Englewood, CO |
|
|
48,490 |
|
|
Oct 2015 |
|
Loan conversion |
|
$ |
4,472 |
|
|
|
South Midco |
|
Wichita, KS |
|
|
73,740 |
|
|
Oct 2015 |
|
Loan conversion |
|
|
4,404 |
|
|
|
East Glendale |
|
Sparks, NV |
|
|
31,976 |
|
|
Oct 2015 |
|
Loan conversion |
|
|
1,788 |
|
|
|
Perry Avenue |
|
Attleboro, MA |
|
|
456,000 |
|
|
Oct 2015 |
|
Loan conversion |
|
|
30,656 |
|
|
|
Interstate Drive |
|
West Springfield, MA |
|
|
143,025 |
|
|
Oct 2015 |
|
Loan conversion |
|
|
5,862 |
|
|
|
Hunt Valley Circle |
|
New Kensington, PA |
|
|
198,000 |
|
|
Oct 2015 |
|
Loan conversion |
|
|
10,611 |
|
|
|
Kirby Circle |
|
Palm Bay, FL |
|
|
231,313 |
|
|
Oct 2015 |
|
Loan conversion |
|
|
19,648 |
|
|
|
Rex Boulevard |
|
Auburn Hills, MI |
|
|
151,200 |
|
|
Oct 2015 |
|
Loan conversion |
|
|
7,868 |
|
|
|
Square Drive |
|
Marysville, OH |
|
|
130,044 |
|
|
Oct 2015 |
|
Loan conversion |
|
|
4,931 |
|
|
|
Fondorf Drive |
|
Columbus, OH |
|
|
151,685 |
|
|
Oct 2015 |
|
Loan conversion |
|
|
5,960 |
|
|
|
Total Industrial |
|
|
|
|
1,615,473 |
|
|
|
|
|
|
|
96,200 |
|
|
|
|
|
|
|
|
|
|
|
|
|
|
|
|
|
|
|
|
Office Portfolio: |
|
|
|
|
|
|
|
|
|
|
|
|
|
|
|
|
Erieview Tower and Parking |
|
Cleveland, OH |
|
|
769,795 |
|
|
Dec 2015 |
|
Loan conversion |
|
|
63,014 |
|
|
|
|
|
|
|
|
|
|
|
|
|
|
|
|
|
|
|
|
Total Additions |
|
|
|
|
|
|
|
|
|
|
|
$ |
159,214 |
|
|
|
|
|
|
|
|
|
|
|
|
|
|
|
|
|
|
|
|
SALES: |
|
|
|
|
|
|
|
|
|
|
|
|
|
|
|
|
Multifamily: |
|
|
|
|
|
|
|
|
|
|
|
|
|
|
|
|
Vista Lago Apartments |
|
Miami, FL |
|
|
135 |
|
|
Dec 2015 |
|
Sale |
|
$ |
17,675 |
|
|
|
Balcones Apartments |
|
Austin, TX |
|
|
312 |
|
|
Dec 2015 |
|
Sale |
|
|
30,000 |
|
|
|
Centrepointe Apartments (IRT) |
|
Tucson, AZ |
|
|
320 |
|
|
Dec 2015 |
|
Sale |
|
|
33,600 |
|
|
|
|
|
|
|
|
|
|
|
|
|
|
|
|
|
|
|
|
Total Multifamily |
|
|
|
|
767 |
|
|
|
|
|
|
$ |
81,275 |
|
|
|
|
|
|
|
|
|
|
|
|
|
|
|
|
|
|
|
|
Office: |
|
|
|
|
|
|
|
|
|
|
|
|
|
|
|
|
Long Beach Promenade |
|
Long Beach, CA |
|
|
27,173 |
|
|
Dec 2015 |
|
Sale |
|
$ |
5,200 |
|
|
|
Atria East |
|
Garden City, NY |
|
|
208,201 |
|
|
Nov 2015 |
|
Sale |
|
|
200 |
|
(a) |
|
|
|
|
|
|
|
|
|
|
|
|
|
|
|
|
|
|
Total Office |
|
|
|
|
235,374 |
|
|
|
|
|
|
$ |
5,400 |
|
|
|
|
|
|
|
|
|
|
|
|
|
|
|
|
|
|
|
|
Total Sales: |
|
|
|
|
|
|
|
|
|
|
|
$ |
86,675 |
|
|
|
(a) |
Atria East was impaired at September 30, 2015. RAIT sold the asset to the senior lender for nominal consideration. |
26
REAL ESTATE PROPERTIES, AS OF DECEMBER 31, 2015
|
($'s in 000's) |
|
|
|
|
|
|
|
|
|
|
|
|
|
INVESTMENTS IN REAL ESTATE |
|
|
|
|
|
|
|
|
|
|||||||||||||||||
|
Property Name |
|
Location |
|
Units/ Square Feet/ Acres |
|
|
Year of Acquisition |
|
Description |
|
Status |
|
Initial Cost |
|
|
Capex -- Life to Date |
|
|
Gross Cost |
|
|
Accumulated Depreciation |
|
|
Net Book Value |
|
|
Occupancy (Period End) |
|
|
Rental Rate (a) |
|
||||||||
|
RAIT MULTIFAMILY PORTFOLIO: |
|
|
|
|
|
|
|
|
|
|
|
|
|
|
|
|
|
|
|
|
|
|
|
|
|
|
|
|
|
|
|
|
|
|
|
|
|
|
|
|
|
Mandalay Bay |
|
Austin, TX |
|
|
300 |
|
|
2008 |
|
Multi-Family |
|
Hold |
|
$ |
27,310 |
|
|
$ |
760 |
|
|
$ |
28,070 |
|
|
$ |
(6,122 |
) |
|
$ |
21,948 |
|
|
|
95.1 |
% |
|
$ |
992 |
|
|
Oyster Point |
|
Newport News, VA |
|
|
278 |
|
|
2008 |
|
Multi-Family |
|
Hold |
|
|
19,835 |
|
|
|
907 |
|
|
|
20,742 |
|
|
|
(4,544 |
) |
|
|
16,198 |
|
|
|
89.7 |
% |
|
|
669 |
|
|
Tuscany Bay |
|
Orlando, FL |
|
|
396 |
|
|
2008 |
|
Multi-Family |
|
Hold |
|
|
35,620 |
|
|
|
1,465 |
|
|
|
37,085 |
|
|
|
(8,098 |
) |
|
|
28,987 |
|
|
|
94.5 |
% |
|
|
788 |
|
|
Tierra Bella |
|
Las Vegas, NV |
|
|
98 |
|
|
2009 |
|
Multi-Family |
|
Hold |
|
|
10,921 |
|
|
|
153 |
|
|
|
11,074 |
|
|
|
(2,046 |
) |
|
|
9,028 |
|
|
|
91.6 |
% |
|
|
898 |
|
|
Regency Meadows |
|
Las Vegas, NV |
|
|
120 |
|
|
2009 |
|
Multi-Family |
|
Hold |
|
|
9,374 |
|
|
|
440 |
|
|
|
9,814 |
|
|
|
(1,919 |
) |
|
|
7,895 |
|
|
|
92.4 |
% |
|
|
602 |
|
|
Ashford Place |
|
Tampa, FL |
|
|
369 |
|
|
2009 |
|
Multi-Family |
|
Hold |
|
|
21,365 |
|
|
|
4,668 |
|
|
|
26,033 |
|
|
|
(5,631 |
) |
|
|
20,402 |
|
|
|
88.7 |
% |
|
|
817 |
|
|
Desert Wind |
|
Phoenix, AZ |
|
|
216 |
|
|
2009 |
|
Multi-Family |
|
Marketing for Sale |
|
|
12,600 |
|
|
|
530 |
|
|
|
13,130 |
|
|
|
(2,419 |
) |
|
|
10,711 |
|
|
|
92.3 |
% |
|
|
519 |
|
|
Eagle Ridge |
|
Colton, CA |
|
|
144 |
|
|
2009 |
|
Multi-Family |
|
Hold |
|
|
15,990 |
|
|
|
650 |
|
|
|
16,640 |
|
|
|
(3,162 |
) |
|
|
13,478 |
|
|
|
96.9 |
% |
|
|
948 |
|
|
Emerald Bay |
|
Las Vegas, NV |
|
|
337 |
|
|
2009 |
|
Multi-Family |
|
Hold |
|
|
32,500 |
|
|
|
1,149 |
|
|
|
33,649 |
|
|
|
(6,215 |
) |
|
|
27,434 |
|
|
|
94.4 |
% |
|
|
977 |
|
|
Grand Terrace |
|
Colton, CA |
|
|
208 |
|
|
2009 |
|
Multi-Family |
|
Hold |
|
|
23,096 |
|
|
|
740 |
|
|
|
23,836 |
|
|
|
(4,398 |
) |
|
|
19,438 |
|
|
|
91.2 |
% |
|
|
654 |
|
|
Las Vistas |
|
Phoenix, AZ |
|
|
200 |
|
|
2009 |
|
Multi-Family |
|
Marketing for Sale |
|
|
12,200 |
|
|
|
824 |
|
|
|
13,024 |
|
|
|
(2,477 |
) |
|
|
10,547 |
|
|
|
91.5 |
% |
|
|
559 |
|
|
Penny Lane |
|
Mesa, AZ |
|
|
136 |
|
|
2009 |
|
Multi-Family |
|
Marketing for Sale |
|
|
7,700 |
|
|
|
570 |
|
|
|
8,270 |
|
|
|
(1,610 |
) |
|
|
6,660 |
|
|
|
92.9 |
% |
|
|
712 |
|
|
Sandal Ridge |
|
Mesa, AZ |
|
|
196 |
|
|
2009 |
|
Multi-Family |
|
Marketing for Sale |
|
|
9,900 |
|
|
|
948 |
|
|
|
10,848 |
|
|
|
(2,164 |
) |
|
|
8,684 |
|
|
|
93.9 |
% |
|
|
577 |
|
|
Ventura |
|
Gainesville, FL |
|
|
208 |
|
|
2010 |
|
Multi-Family |
|
Marketing for Sale |
|
|
9,563 |
|
|
|
742 |
|
|
|
10,305 |
|
|
|
(1,904 |
) |
|
|
8,401 |
|
|
|
93.5 |
% |
|
|
546 |
|
|
Lexington |
|
Jackson, MS |
|
|
220 |
|
|
2010 |
|
Multi-Family |
|
Hold |
|
|
15,840 |
|
|
|
797 |
|
|
|
16,637 |
|
|
|
(2,793 |
) |
|
|
13,844 |
|
|
|
95.6 |
% |
|
|
858 |
|
|
Trails at Northpointe |
|
Jackson, MS |
|
|
144 |
|
|
2010 |
|
Multi-Family |
|
Hold |
|
|
6,768 |
|
|
|
890 |
|
|
|
7,658 |
|
|
|
(1,439 |
) |
|
|
6,219 |
|
|
|
91.4 |
% |
|
|
676 |
|
|
Silversmith |
|
Jacksonville, FL |
|
|
140 |
|
|
2010 |
|
Multi-Family |
|
Hold |
|
|
5,239 |
|
|
|
795 |
|
|
|
6,034 |
|
|
|
(1,268 |
) |
|
|
4,766 |
|
|
|
90.5 |
% |
|
|
673 |
|
|
Ellington Apartments |
|
Miami Gardens, FL |
|
|
343 |
|
|
2011 |
|
Multi-Family |
|
Hold |
|
|
27,306 |
|
|
|
3,784 |
|
|
|
31,090 |
|
|
|
(3,994 |
) |
|
|
27,096 |
|
|
|
95.0 |
% |
|
|
1,059 |
|
|
Augusta Apartments |
|
Las Vegas, NV |
|
|
272 |
|
|
2011 |
|
Multi-Family |
|
Hold |
|
|
30,900 |
|
|
|
529 |
|
|
|
31,429 |
|
|
|
(3,908 |
) |
|
|
27,521 |
|
|
|
94.9 |
% |
|
|
893 |
|
|
South Terrace |
|
Durham, NC |
|
|
328 |
|
|
2013 |
|
Multi-Family |
|
Hold |
|
|
36,644 |
|
|
|
1,062 |
|
|
|
37,706 |
|
|
|
(2,884 |
) |
|
|
34,822 |
|
|
|
94.0 |
% |
|
|
978 |
|
|
River Park West |
|
Houston, TX |
|
|
288 |
|
|
2013 |
|
Multi-Family |
|
Hold |
|
|
29,572 |
|
|
|
263 |
|
|
|
29,835 |
|
|
|
(1,966 |
) |
|
|
27,869 |
|
|
|
93.5 |
% |
|
|
1,113 |
|
|
Coles Crossing |
|
Cypress, TX |
|
|
370 |
|
|
2014 |
|
Multi-Family |
|
Hold |
|
|
47,235 |
|
|
|
545 |
|
|
|
47,780 |
|
|
|
(2,588 |
) |
|
|
45,192 |
|
|
|
88.6 |
% |
|
|
1,169 |
|
|
|
|
|
|
|
|
|
|
|
|
|
|
|
|
|
|
|
|
|
|
|
|
|
|
|
|
|
|
|
|
|
|
|
|
|
|
|
|
|
|
|
|
Subtotal -- Multifamily |
|
|
|
|
5,311 |
|
|
|
|
|
|
|
|
$ |
447,478 |
|
|
$ |
23,211 |
|
|
$ |
470,689 |
|
|
$ |
(73,549 |
) |
|
$ |
397,140 |
|
|
|
92.8 |
% |
|
$ |
841 |
|
|
|
|
|
|
|
|
|
|
|
|
|
|
|
|
|
|
|
|
|
|
|
|
|
|
|
|
|
|
|
|
|
|
|
|
|
|
|
|
|
|
|
|
RAIT OFFICE PORTFOLIO: |
|
|
|
|
|
|
|
|
|
|
|
|
|
|
|
|
|
|
|
|
|
|
|
|
|
|
|
|
|
|
|
|
|
|
|
|
|
|
|
|
|
Reuss |
|
Milwaukee, WI |
|
|
578,104 |
|
|
2004 |
|
Office |
|
Hold |
|
$ |
42,861 |
|
|
$ |
20,312 |
|
|
$ |
63,173 |
|
|
$ |
(21,232 |
) |
|
$ |
41,941 |
|
|
|
58.0 |
% |
|
$ |
18.48 |
|
|
McDowell |
|
Scottsdale, AZ |
|
|
255,573 |
|
|
2007 |
|
Office |
|
Hold |
|
|
65,389 |
|
|
|
8,415 |
|
|
|
73,804 |
|
|
|
(15,801 |
) |
|
|
58,003 |
|
|
|
96.4 |
% |
|
|
23.02 |
|
|
Executive Center |
|
Milwaukee, WI |
|
|
102,017 |
|
|
2009 |
|
Office |
|
Hold |
|
|
7,855 |
|
|
|
3,816 |
|
|
|
11,671 |
|
|
|
(2,560 |
) |
|
|
9,111 |
|
|
|
97.1 |
% |
|
|
18.37 |
|
|
Mineral Business Center |
|
Denver, CO |
|
|
117,461 |
|
|
2009 |
|
Office |
|
Marketing for Sale |
|
|
8,959 |
|
|
|
793 |
|
|
|
9,752 |
|
|
|
(1,837 |
) |
|
|
7,915 |
|
|
|
58.2 |
% |
|
|
21.45 |
|
|
1501 Yamato Road |
|
Boca Raton, FL |
|
|
171,489 |
|
|
2009 |
|
Office |
|
Hold |
|
|
41,000 |
|
|
|
5,503 |
|
|
|
46,503 |
|
|
|
(8,780 |
) |
|
|
37,723 |
|
|
|
100.0 |
% |
|
|
19.84 |
|
|
Executive Mews - Willow Grove |
|
Willow Grove, PA |
|
|
86,554 |
|
|
2010 |
|
Office |
|
Hold |
|
|
11,400 |
|
|
|
1,159 |
|
|
|
12,559 |
|
|
|
(2,210 |
) |
|
|
10,349 |
|
|
|
76.9 |
% |
|
|
23.15 |
|
|
Executive Mews - Cherry Hill |
|
Cherry Hill, NJ |
|
|
112,146 |
|
|
2010 |
|
Office |
|
Hold |
|
|
9,900 |
|
|
|
2,299 |
|
|
|
12,199 |
|
|
|
(2,599 |
) |
|
|
9,600 |
|
|
|
93.3 |
% |
|
|
19.06 |
|
|
Tiffany Square |
|
Colorado Springs, CO |
|
|
184,219 |
|
|
2010 |
|
Office |
|
Hold |
|
|
12,996 |
|
|
|
2,994 |
|
|
|
15,990 |
|
|
|
(2,835 |
) |
|
|
13,155 |
|
|
|
74.6 |
% |
|
|
15.41 |
|
|
Four Resource Square |
|
Charlotte, NC |
|
|
151,916 |
|
|
2011 |
|
Office |
|
Hold |
|
|
20,300 |
|
|
|
836 |
|
|
|
21,136 |
|
|
|
(2,941 |
) |
|
|
18,195 |
|
|
|
94.0 |
% |
|
|
16.30 |
|
|
UBS Tower |
|
St. Paul, MN |
|
|
228,882 |
|
|
2012 |
|
Office |
|
Hold |
|
|
11,586 |
|
|
|
7,740 |
|
|
|
19,326 |
|
|
|
(3,483 |
) |
|
|
15,843 |
|
|
|
86.1 |
% |
|
|
17.70 |
|
|
Rutherford |
|
Woodlawn, MD |
|
|
86,641 |
|
|
2014 |
|
Office |
|
Hold |
|
|
9,942 |
|
|
|
1,451 |
|
|
|
11,393 |
|
|
|
(1,103 |
) |
|
|
10,290 |
|
|
|
77.8 |
% |
|
|
20.02 |
|
|
Union Medical |
|
Colorado Springs, CO |
|
|
151,299 |
|
|
2014 |
|
Office |
|
Hold |
|
|
25,881 |
|
|
|
2,904 |
|
|
|
28,785 |
|
|
|
(1,850 |
) |
|
|
26,935 |
|
|
|
76.3 |
% |
|
|
26.76 |
|
|
100 East Lancaster Avenue |
|
Downingtown, PA |
|
|
37,963 |
|
|
2014 |
|
Office |
|
Hold |
|
|
6,859 |
|
|
|
212 |
|
|
|
7,071 |
|
|
|
(243 |
) |
|
|
6,828 |
|
|
|
66.8 |
% |
|
|
37.17 |
|
|
|
|
|
|
|
|
|
|
|
|
|
|
|
|
|
|
|
|
|
|
|
|
|
|
|
|
|
|
|
|
|
|
|
|
|
|
|
|
|
|
|
|
Subtotal -- Office |
|
|
|
|
2,264,264 |
|
|
|
|
|
|
|
|
$ |
274,928 |
|
|
$ |
58,434 |
|
|
$ |
333,362 |
|
|
$ |
(67,474 |
) |
|
$ |
265,888 |
|
|
|
78.5 |
% |
|
$ |
19.90 |
|
|
|
|
|
|
|
|
|
|
|
|
|
|
|
|
|
|
|
|
|
|
|
|
|
|
|
|
|
|
|
|
|
|
|
|
|
|
|
|
|
|
|
|
RAIT INDUSTRIAL PORTFOLIO: |
|
|
|
|
|
|
|
|
|
|
|
|
|
|
|
|
|
|
|
|
|
|
|
|
|
|
|
|
|
|
|
|
|
|
|
|
|
|
|
|
|
Adams Aircraft |
|
Englewood, CO |
|
|
48,490 |
|
|
2015 |
|
Industrial |
|
Hold |
|
$ |
4,472 |
|
|
$ |
— |
|
|
$ |
4,472 |
|
|
$ |
(27 |
) |
|
$ |
4,445 |
|
|
|
0.0 |
% |
|
$ |
— |
|
|
South Midco |
|
Witchita, KS |
|
|
73,740 |
|
|
2015 |
|
Industrial |
|
Hold |
|
|
4,129 |
|
|
|
5 |
|
|
|
4,134 |
|
|
|
(29 |
) |
|
|
4,105 |
|
|
|
100.0 |
% |
|
|
6.37 |
|
|
East Glendale |
|
Sparks, NV |
|
|
31,976 |
|
|
2015 |
|
Industrial |
|
Hold |
|
|
1,467 |
|
|
|
3 |
|
|
|
1,470 |
|
|
|
(7 |
) |
|
|
1,463 |
|
|
|
100.0 |
% |
|
|
4.50 |
|
|
Perry Avenue |
|
Attleboro, MA |
|
|
456,000 |
|
|
2015 |
|
Industrial |
|
Hold |
|
|
30,774 |
|
|
|
24 |
|
|
|
30,798 |
|
|
|
(38 |
) |
|
|
30,760 |
|
|
|
100.0 |
% |
|
|
4.47 |
|
|
Interstate Drive |
|
West Springfield, MA |
|
|
143,025 |
|
|
2015 |
|
Industrial |
|
Hold |
|
|
5,273 |
|
|
|
10 |
|
|
|
5,283 |
|
|
|
(51 |
) |
|
|
5,232 |
|
|
|
100.0 |
% |
|
|
4.29 |
|
|
Hunt Valley Circle |
|
New Kensington, PA |
|
|
198,000 |
|
|
2015 |
|
Industrial |
|
Hold |
|
|
10,329 |
|
|
|
5 |
|
|
|
10,334 |
|
|
|
(41 |
) |
|
|
10,293 |
|
|
|
100.0 |
% |
|
|
4.73 |
|
|
Kirby Circle |
|
Palm Bay, FL |
|
|
231,313 |
|
|
2015 |
|
Industrial |
|
Hold |
|
|
19,649 |
|
|
|
— |
|
|
|
19,649 |
|
|
|
(45 |
) |
|
|
19,604 |
|
|
|
0.0 |
% |
|
|
- |
|
|
Rex Boulevard |
|
Auburn Hills, MI |
|
|
151,200 |
|
|
2015 |
|
Industrial |
|
Hold |
|
|
7,703 |
|
|
|
211 |
|
|
|
7,914 |
|
|
|
(68 |
) |
|
|
7,846 |
|
|
|
100.0 |
% |
|
|
5.09 |
|
|
Square Drive |
|
Marysville, OH |
|
|
130,044 |
|
|
2015 |
|
Industrial |
|
Hold |
|
|
4,886 |
|
|
|
37 |
|
|
|
4,923 |
|
|
|
(23 |
) |
|
|
4,900 |
|
|
|
100.0 |
% |
|
|
3.96 |
|
|
Fondorf Drive |
|
Columbus, OH |
|
|
151,685 |
|
|
2015 |
|
Industrial |
|
Hold |
|
|
5,924 |
|
|
|
35 |
|
|
|
5,959 |
|
|
|
(30 |
) |
|
|
5,929 |
|
|
|
93.1 |
% |
|
|
3.40 |
|
|
|
|
|
|
|
|
|
|
|
|
|
|
|
|
|
|
|
|
|
|
|
|
|
|
|
|
|
|
|
|
|
|
|
|
|
|
|
|
|
|
|
|
Subtotal -- Industrial |
|
|
|
|
1,615,473 |
|
|
|
|
|
|
|
|
$ |
94,606 |
|
|
$ |
330 |
|
|
$ |
94,936 |
|
|
$ |
(359 |
) |
|
$ |
94,577 |
|
|
|
82.0 |
% |
|
$ |
3.71 |
|
|
|
|
|
|
|
|
|
|
|
|
|
|
|
|
|
|
|
|
|
|
|
|
|
|
|
|
|
|
|
|
|
|
|
|
|
|
|
|
|
|
|
27
|
|
|
|
|
|
|
|
|
|
|
|
|
|
|
|
|
|
|
|
|
|
|
|
|
|
|
|
|
|
|
|
|
|
|
|
|
|
|
|
|
|
|
Sharpstown Mall |
|
Houston, TX |
|
|
637,646 |
|
|
2009 |
|
Retail |
|
Hold |
|
$ |
33,685 |
|
|
$ |
9,172 |
|
|
$ |
42,857 |
|
|
$ |
(8,748 |
) |
|
$ |
34,109 |
|
|
|
44.8 |
% |
|
$ |
16.84 |
|
|
South Plaza |
|
Nashville, TN |
|
|
284,697 |
|
|
2011 |
|
Retail |
|
Hold |
|
|
22,400 |
|
|
|
933 |
|
|
|
23,333 |
|
|
|
(2,940 |
) |
|
|
20,393 |
|
|
|
82.7 |
% |
|
|
9.39 |
|
|
May’s Crossing |
|
Round Rock, TX |
|
|
64,084 |
|
|
2012 |
|
Retail |
|
Hold |
|
|
8,177 |
|
|
|
248 |
|
|
|
8,425 |
|
|
|
(924 |
) |
|
|
7,501 |
|
|
|
63.1 |
% |
|
|
11.44 |
|
|
Oakland Square |
|
Troy, MI |
|
|
220,226 |
|
|
2014 |
|
Retail |
|
Hold |
|
|
21,867 |
|
|
|
477 |
|
|
|
22,344 |
|
|
|
(797 |
) |
|
|
21,547 |
|
|
|
100.0 |
% |
|
|
13.35 |
|
|
Oakland Plaza |
|
Troy, MI |
|
|
171,518 |
|
|
2014 |
|
Retail |
|
Hold |
|
|
24,734 |
|
|
|
654 |
|
|
|
25,388 |
|
|
|
(914 |
) |
|
|
24,474 |
|
|
|
95.6 |
% |
|
|
22.78 |
|
|
|
|
|
|
|
|
|
|
|
|
|
|
|
|
|
|
|
|
|
|
|
|
|
|
|
|
|
|
|
|
|
|
|
|
|
|
|
|
|
|
|
|
Subtotal -- Retail |
|
|
|
|
1,378,171 |
|
|
|
|
|
|
|
|
$ |
110,863 |
|
|
$ |
11,484 |
|
|
$ |
122,347 |
|
|
$ |
(14,323 |
) |
|
$ |
108,024 |
|
|
|
68.6 |
% |
|
$ |
15.23 |
|
|
|
|
|
|
|
|
|
|
|
|
|
|
|
|
|
|
|
|
|
|
|
|
|
|
|
|
|
|
|
|
|
|
|
|
|
|
|
|
|
|
|
|
RAIT REDEVELOPMENT PORTFOLIO: |
|
|
|
|
|
|
|
|
|
|
|
|
|
|
|
|
|
|
|
|
|
|
|
|
|
|
|
|
|
|
|
|
|
|
|
|
|
|
|
|
|
Inlet Square Mall |
|
Myrtle Beach, SC |
|
|
436,719 |
|
|
2009 |
|
Retail |
|
Redevelopment |
|
$ |
2,500 |
|
|
$ |
9,484 |
|
|
$ |
11,984 |
|
|
$ |
(2,983 |
) |
|
$ |
9,001 |
|
|
|
48.0 |
% |
|
|
|
|
|
Erieview Tower |
|
Cleveland, OH |
|
|
769,795 |
|
|
2015 |
|
Office |
|
Redevelopment |
|
|
61,863 |
|
|
|
— |
|
|
|
61,863 |
|
|
|
— |
|
|
|
61,863 |
|
|
|
47.1 |
% |
|
|
|
|
|
|
|
|
|
|
|
|
|
|
|
|
|
|
|
|
|
|
|
|
|
|
|
|
|
|
|
|
|
|
|
|
|
|
|
|
|
|
|
|
|
|
|
Subtotal -- Retail |
|
|
|
|
1,206,514 |
|
|
|
|
|
|
|
|
$ |
64,363 |
|
|
$ |
9,484 |
|
|
$ |
73,847 |
|
|
$ |
(2,983 |
) |
|
$ |
70,864 |
|
|
|
47.4 |
% |
|
|
|
|
|
|
|
|
|
|
|
|
|
|
|
|
|
|
|
|
|
|
|
|
|
|
|
|
|
|
|
|
|
|
|
|
|
|
|
|
|
|
|
|
|
|
|
RAIT LAND PORTFOLIO: |
|
|
|
|
|
|
|
|
|
|
|
|
|
|
|
|
|
|
|
|
|
|
|
|
|
|
|
|
|
|
|
|
|
|
|
|
|
|
|
|
|
Willow Grove |
|
Willow Grove, PA |
|
|
0.5 |
|
|
2001 |
|
Land |
|
Hold |
|
$ |
307 |
|
|
$ |
— |
|
|
$ |
307 |
|
|
$ |
— |
|
|
$ |
307 |
|
|
|
|
|
|
|
|
|
|
Cherry Hill |
|
Cherry Hill, NJ |
|
|
0.5 |
|
|
2001 |
|
Land |
|
Hold |
|
|
307 |
|
|
|
— |
|
|
|
307 |
|
|
|
— |
|
|
|
307 |
|
|
|
|
|
|
|
|
|
|
Corey Landings |
|
St. Pete Beach, FL |
|
|
5.3 |
|
|
2009 |
|
Land |
|
Hold |
|
|
21,595 |
|
|
|
5,024 |
|
|
|
26,619 |
|
|
|
— |
|
|
|
26,619 |
|
|
|
|
|
|
|
|
|
|
Treasure Island Resort |
|
Daytona Beach, FL |
|
|
2.5 |
|
|
2011 |
|
Land |
|
Hold |
|
|
6,230 |
|
|
|
1,334 |
|
|
|
7,564 |
|
|
|
— |
|
|
|
7,564 |
|
|
|
|
|
|
|
|
|
|
Sunny Shores Resort |
|
Daytona Beach, FL |
|
|
1.0 |
|
|
2011 |
|
Land |
|
Hold |
|
|
3,379 |
|
|
|
43 |
|
|
|
3,422 |
|
|
|
— |
|
|
|
3,422 |
|
|
|
|
|
|
|
|
|
|
MGS Gift Shop |
|
Daytona Beach, FL |
|
|
1.0 |
|
|
2011 |
|
Land |
|
Hold |
|
|
409 |
|
|
|
16 |
|
|
|
425 |
|
|
|
— |
|
|
|
425 |
|
|
|
|
|
|
|
|
|
|
Saxony Inn |
|
Daytona Beach, FL |
|
|
0.5 |
|
|
2011 |
|
Land |
|
Marketing for sale |
|
|
1,465 |
|
|
|
5 |
|
|
|
1,470 |
|
|
|
— |
|
|
|
1,470 |
|
|
|
|
|
|
|
|
|
|
Beachcomber Beach Resort |
|
Daytona Beach, FL |
|
|
2.9 |
|
|
2011 |
|
Land |
|
Hold |
|
|
10,300 |
|
|
|
35 |
|
|
|
10,335 |
|
|
|
— |
|
|
|
10,335 |
|
|
|
|
|
|
|
|
|
|
|
|
|
|
|
|
|
|
|
|
|
|
|
|
|
|
|
|
|
|
|
|
|
|
|
|
|
|
|
|
|
|
|
|
|
|
|
|
|
|
|
|
Subtotal -- Land |
|
|
|
|
14.2 |
|
|
|
|
|
|
|
|
$ |
43,992 |
|
|
$ |
6,457 |
|
|
$ |
50,449 |
|
|
$ |
— |
|
|
$ |
50,449 |
|
|
|
|
|
|
|
|
|
|
|
|
|
|
|
|
|
|
|
|
|
|
|
|
|
|
|
|
|
|
|
|
|
|
|
|
|
|
|
|
|
|
|
|
|
|
|
|
|
|
|
|
TOTAL RAIT |
|
|
|
|
|
|
|
|
|
|
|
|
|
$ |
1,036,230 |
|
|
$ |
109,400 |
|
|
$ |
1,145,630 |
|
|
$ |
(158,688 |
) |
|
$ |
986,942 |
|
|
|
|
|
|
|
|
|
|
|
|
|
|
|
|
|
|
|
|
|
|
|
|
|
|
|
|
|
|
|
|
|
|
|
|
|
|
|
|
|
|
|
|
|
|
|
|
|
|
|
|
INDEPENDENCE REALTY TRUST PORTFOLIO (b) |
|
|
|
|
13,724 |
|
|
Various |
|
Multifamily |
|
Various |
|
$ |
1,359,038 |
|
|
$ |
12,977 |
|
|
$ |
1,372,015 |
|
|
$ |
(39,638 |
) |
|
$ |
1,332,373 |
|
|
|
93.0 |
% |
|
$ |
951 |
|
|
|
|
|
|
|
|
|
|
|
|
|
|
|
|
|
|
|
|
|
|
|
|
|
|
|
|
|
|
|
|
|
|
|
|
|
|
|
|
|
|
|
|
CONSOLIDATED REAL ESTATE PORTFOLIO |
|
|
|
|
|
|
|
|
|
|
|
|
|
$ |
2,395,268 |
|
|
$ |
122,377 |
|
|
$ |
2,517,645 |
|
|
$ |
(198,326 |
) |
|
$ |
2,319,315 |
|
|
|
|
|
|
|
|
|
|
|
|
|
|
|
|
|
|
|
|
|
|
|
|
|
|
|
|
|
|
|
|
|
|
|
|
|
|
|
|
|
|
|
|
|
|
|
|
|
|
|
|
(a) |
Multifamily rental rate data is per unit, per month. Office, Industrial and Retail are per square foot, per year. |
|
(b) |
RAIT consolidates Independence Realty Trust (IRT) as of December 31, 2015. Please refer to IRT's separate earnings release and supplemental package at www.irtreit.com for 2015. |
28
As of December 31, 2015
|
($'S in 000's) |
|
Unpaid Principal |
|
|
Carrying Amount |
|
|
Rate |
|
|
|
|
Weighted Average Maturity (in years) |
|
|
||||
|
RAIT DEBT: |
|
|
|
|
|
|
|
|
|
|
|
|
|
|
|
|
|
|
|
|
Recourse debt |
|
|
|
|
|
|
|
|
|
|
|
|
|
|
|
|
|
|
|
|
7% convertible senior notes |
|
$ |
30,048 |
|
|
$ |
29,887 |
|
|
|
7.0 |
% |
|
|
|
|
0.3 |
|
(a) |
|
4% convertible senior notes |
|
|
141,750 |
|
|
|
137,084 |
|
|
|
4.0 |
% |
|
|
|
|
2.8 |
|
(b) |
|
7.625% senior notes |
|
|
60,000 |
|
|
|
60,000 |
|
|
|
7.6 |
% |
|
|
|
|
8.3 |
|
|
|
7.125% senior notes |
|
|
71,905 |
|
|
|
71,905 |
|
|
|
7.1 |
% |
|
|
|
|
3.7 |
|
|
|
Senior secured notes |
|
|
70,000 |
|
|
|
63,150 |
|
|
|
7.0 |
% |
|
|
|
|
2.3 |
|
|
|
Lending warehouse facilities |
|
|
|
|
|
|
|
|
|
|
|
|
|
|
|
|
|
|
|
|
Conduit loans |
|
|
36,922 |
|
|
|
36,922 |
|
|
|
2.9 |
% |
|
|
|
|
0.8 |
|
|
|
Floating rate loans |
|
|
60,145 |
|
|
|
60,145 |
|
|
|
2.0 |
% |
|
|
|
|
1.4 |
|
|
|
Total |
|
|
97,067 |
|
|
|
97,067 |
|
|
|
2.3 |
% |
|
|
|
|
1.2 |
|
|
|
Junior subordinated notes, at fair value |
|
|
18,671 |
|
|
|
10,504 |
|
|
|
4.3 |
% |
|
|
|
|
19.3 |
|
|
|
Junior subordinated notes, at amortized cost |
|
|
25,100 |
|
|
|
25,100 |
|
|
|
2.7 |
% |
|
|
|
|
21.3 |
|
|
|
Total Recourse Debt |
|
|
514,541 |
|
|
|
494,697 |
|
|
|
5.1 |
% |
|
|
|
|
4.5 |
|
|
|
Non-Recourse debt |
|
|
|
|
|
|
|
|
|
|
|
|
|
|
|
|
|
|
|
|
Securitization notes payable: |
|
|
|
|
|
|
|
|
|
|
|
|
|
|
|
|
|
|
|
|
CRE CDO I |
|
|
554,205 |
|
|
|
546,935 |
|
|
|
0.8 |
% |
|
|
|
|
30.9 |
|
|
|
CRE CDO II |
|
|
396,776 |
|
|
|
393,153 |
|
|
|
1.0 |
% |
|
|
|
|
29.5 |
|
|
|
FL2 |
|
|
129,544 |
|
|
|
129,402 |
|
|
|
1.8 |
% |
|
|
|
|
15.4 |
|
|
|
FL3 |
|
|
146,192 |
|
|
|
146,192 |
|
|
|
2.0 |
% |
|
|
|
|
16.0 |
|
|
|
FL4 |
|
|
177,894 |
|
|
|
177,894 |
|
|
|
2.0 |
% |
|
|
|
|
16.0 |
|
|
|
FL5 |
|
|
263,625 |
|
|
|
263,625 |
|
|
|
3.4 |
% |
|
|
|
|
16.0 |
|
|
|
Total securitization notes payable |
|
|
1,668,236 |
|
|
|
1,657,201 |
|
|
|
1.6 |
% |
|
|
|
|
24.1 |
|
|
|
Loans payable on real estate |
|
|
269,790 |
|
|
|
269,790 |
|
|
|
5.6 |
% |
|
|
|
|
3.2 |
|
|
|
Total Non-recourse debt |
|
|
1,938,026 |
|
|
|
1,926,991 |
|
|
|
2.1 |
% |
|
|
|
|
21.2 |
|
|
|
|
|
|
|
|
|
|
|
|
|
|
|
|
|
|
|
|
|
|
|
|
Total RAIT Debt |
|
|
2,452,567 |
|
|
|
2,421,688 |
|
|
|
2.7 |
% |
|
|
|
|
17.7 |
|
|
|
|
|
|
|
|
|
|
|
|
|
|
|
|
|
|
|
|
|
|
|
|
Independence Realty Trust Debt |
|
|
|
|
|
|
|
|
|
|
|
|
|
|
|
|
|
|
|
|
KeyBank Credit Facility |
|
|
271,500 |
|
|
|
271,500 |
|
|
|
2.9 |
% |
|
|
|
|
2.7 |
|
|
|
KeyBank Interim Term Loan |
|
|
120,000 |
|
|
|
120,000 |
|
|
|
5.4 |
% |
|
|
|
|
0.7 |
|
|
|
Mortgages |
|
|
545,956 |
|
|
|
546,262 |
|
|
|
4.0 |
% |
|
# |
|
|
6.9 |
|
|
|
Total IRT Debt |
|
|
937,456 |
|
|
|
937,762 |
|
|
|
3.9 |
% |
|
|
|
|
4.9 |
|
|
|
|
|
|
|
|
|
|
|
|
|
|
|
|
|
|
|
|
|
|
|
|
Total Debt |
|
$ |
3,390,023 |
|
|
$ |
3,359,450 |
|
|
|
3.1 |
% |
|
|
|
|
14.2 |
|
|
29
|
|
|
|
|
|
|
|
|
|
|
|
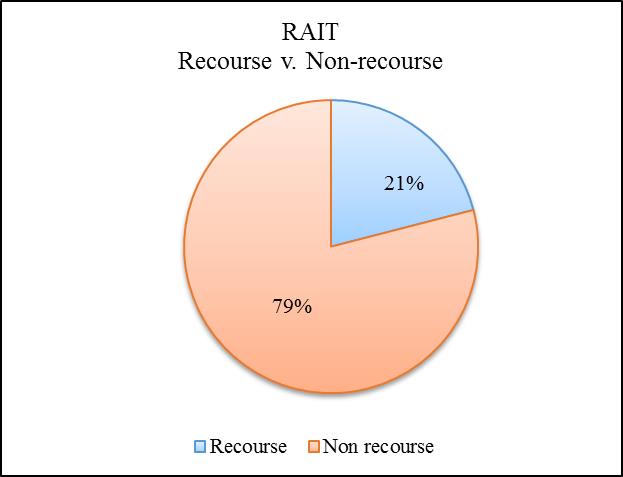
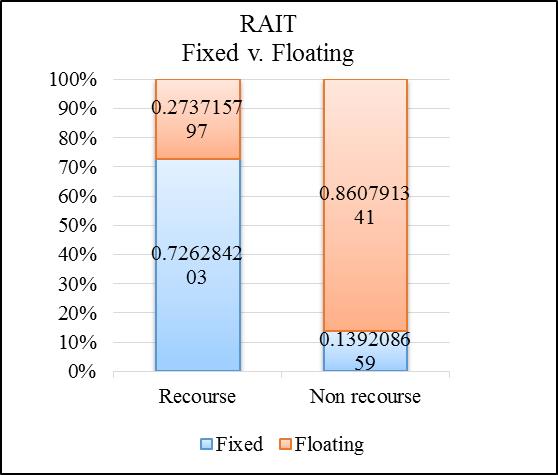
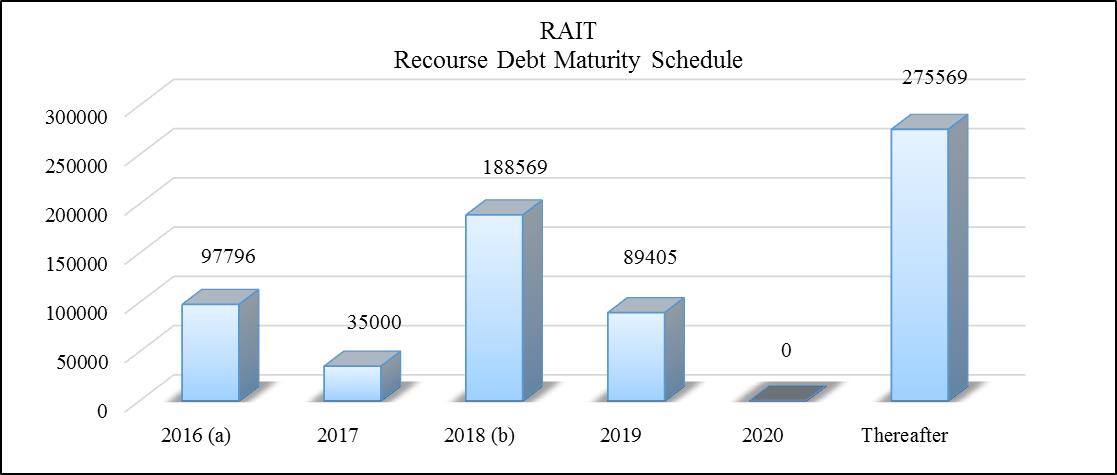
|
(a) |
Includes the Put option in April 2016 on the 7% convertible notes with an unpaid principal balance of $30,048 at December 31, 2015. |
|
(b) |
Includes the Put option in October 2018 on the 4% convertible notes with an unpaid principal balance of $141,750 at December 31, 2015. |
30
Adjusted EBITDA
Adjusted Earnings before Interest, Taxes, Depreciation and Amortization, is a non-GAAP financial measure. We calculate Adjusted EBITDA as Net Income, before the effects of investment interest expense, interest expense, acquisition and integration expenses, depreciation and amortization, (gains) losses on assets, asset impairments, TSRE financing extinguishment and employee separation expenses, (gain) on IRT merger with TSRE, loss on deconsolidation of VIEs, net gain on collateral management sale, gain on debt extinguishments, change in fair value of financial instruments and income tax (benefit) provision. We believe Adjusted EBITDA provides useful information to investors to ascertain our interest coverage and interest plus preferred dividends coverage ratios.
Assets Under Management
Assets under management, or AUM, is an operating measure representing the total assets that we own or are managing for third parties. While not all AUM generates fee income, it is an important operating measure to gauge our asset growth, volume of originations, size and scale of our operations and our performance. AUM includes our total investment portfolio, assets associated with unconsolidated securitizations for which we derive asset management fees and real estate properties we manage on behalf of third parties.
Cash Available for Distribution
Cash available for distribution, or CAD, is a non-GAAP financial measure. We believe that CAD provides investors and management with a meaningful indicator of operating performance. Management also uses CAD, among other measures, to evaluate profitability and our board of trustees considers CAD in determining our quarterly cash distributions. We also believe that CAD is useful because it adjusts for a variety of noncash items (such as depreciation and amortization, equity-based compensation, realized non-cash gain (loss) on assets, provision for loan losses and non-cash interest income and expense items). Furthermore, CAD removes the effect of our previous consolidation of the legacy securitizations, T8 and T9, which we deconsolidated as part of our exit of the Taberna business in December 2014.
We calculate CAD by subtracting from or adding to net income (loss) attributable to common shareholders the following items: depreciation and amortization items including depreciation and amortization, straight-line rental income or expense, amortization of in place leases, amortization of deferred financing costs, amortization of discount on financings and equity-based compensation; changes in the fair value of our financial instruments; realized non-cash gain (loss) on assets and other; provision for loan losses; impairment on depreciable property; acquisition gains or losses and transaction costs; certain fee income eliminated in consolidation that is attributable to third parties; and one-time events pursuant to changes in U.S. GAAP and certain other non-routine items.
CAD should not be considered as an alternative to net income (loss) or cash generated from operating activities, determined in accordance with U.S. GAAP, as an indicator of operating performance. For example, CAD does not adjust for the accrual of income and expenses that may not be received or paid in cash during the associated periods. Please refer to our consolidated financial statements prepared in accordance with U.S. GAAP in Part I, Item 1. In addition, our methodology for calculating CAD may differ from the methodologies used by other comparable companies, including other REITs, when calculating the same or similar supplemental financial measures and may not be comparable with these companies.
Funds from Operations
We believe that funds from operations, or FFO, which is a non-GAAP measure, is an additional appropriate measure of the operating performance of a REIT. We compute FFO in accordance with the standards established by the National Association of Real Estate Investment Trusts, or NAREIT, as net income or loss allocated to common shares (computed in accordance with GAAP), excluding real estate-related depreciation and amortization expense, gains or losses on sales of real estate and the cumulative effect of changes in accounting principles. Our management utilizes FFO as a measure of our operating performance. FFO is not an equivalent to net income or cash generated from operating activities determined in accordance with U.S. GAAP. Furthermore, FFO does not represent amounts available for management’s discretionary use because of needed capital replacement or expansion, debt service obligations or other commitments or uncertainties. FFO should not be considered as an alternative to net income as an indicator of our operating performance or as an alternative to cash flow from operating activities as a measure of our liquidity.
Interest Coverage
Interest coverage is computed as Adjusted EBITDA divided by interest costs (excluding amortization of deferred financing costs and debt discounts)
31
Interest + Preferred coverage is computed as Adjusted EBITDA divided by the sum of interest costs (excluding amortization of deferred financing costs and debt discounts) and preferred costs (excluding amortization of preferred share discounts).
Net Operating Income
Net Operating Income (“NOI”), a non-GAAP measure, is a useful measure of the operating performance of its real estate portfolio. NOI is defined as total property revenue less total property operating expenses, excluding depreciation and amortization and interest expense. Other REITs may use different methodologies for calculating NOI, and accordingly, our NOI may not be comparable to other REITs. We believe that this measure provides an operating perspective not immediately apparent from GAAP operating income or net income. We use NOI to evaluate our real estate portfolio performance on a same store and non-same store basis because NOI measures the core operations of property performance by excluding corporate level expenses and other items not related to property operating performance and captures trends in rental rates and property operating expenses.
Same Store Properties and Same Store Portfolio
Same Store is defined as properties which were owned and operational for the entire periods presented, including each comparative period. Properties included in the redevelopment portfolio are not part of the same store properties. A reconciliation of our same store net operating income to net income is as follows for each of the periods presented below:
|
($'s in 000's) |
|
For the Three Months Ended |
|
|
|
|
For the Year Ended December 31 |
|
||||||||||||||||||||||
|
|
|
December 31, 2015 |
|
|
September 30, 2015 |
|
|
June 30, 2015 |
|
|
March 31, 2015 |
|
|
December 31, 2014 |
|
|
|
|
2015 |
|
|
2014 |
|
|||||||
|
Same store property net operating income |
|
$ |
20,736 |
|
|
$ |
20,799 |
|
|
$ |
20,449 |
|
|
$ |
20,132 |
|
|
$ |
19,359 |
|
|
|
|
$ |
53,712 |
|
|
$ |
48,077 |
|
|
Non same store property net operating income |
|
|
17,252 |
|
|
|
8,828 |
|
|
|
8,669 |
|
|
|
7,865 |
|
|
|
3,789 |
|
|
|
|
|
71,018 |
|
|
|
32,620 |
|
|
Net interest margin |
|
|
19,876 |
|
|
|
16,447 |
|
|
|
16,525 |
|
|
|
16,334 |
|
|
|
22,569 |
|
|
|
|
|
69,182 |
|
|
|
103,109 |
|
|
Fee and other income |
|
|
5,004 |
|
|
|
3,056 |
|
|
|
7,415 |
|
|
|
5,594 |
|
|
|
5,167 |
|
|
|
|
|
21,069 |
|
|
|
24,280 |
|
|
Interest expense |
|
|
(25,408 |
) |
|
|
(19,574 |
) |
|
|
(19,673 |
) |
|
|
(19,683 |
) |
|
|
(16,635 |
) |
|
|
|
|
(84,338 |
) |
|
|
(55,391 |
) |
|
Compensation expenses |
|
|
(8,416 |
) |
|
|
(7,137 |
) |
|
|
(6,568 |
) |
|
|
(6,108 |
) |
|
|
(5,050 |
) |
|
|
|
|
(28,229 |
) |
|
|
(28,168 |
) |
|
General and administrative expenses |
|
|
(5,825 |
) |
|
|
(4,489 |
) |
|
|
(5,065 |
) |
|
|
(5,400 |
) |
|
|
(4,414 |
) |
|
|
|
|
(20,779 |
) |
|
|
(17,653 |
) |
|
Acquisition and integration expenses |
|
|
(1,684 |
) |
|
|
(12,901 |
) |
|
|
(985 |
) |
|
|
(957 |
) |
|
|
(950 |
) |
|
|
|
|
(16,527 |
) |
|
|
(2,358 |
) |
|
Provision for loan losses |
|
|
(2,450 |
) |
|
|
(1,850 |
) |
|
|
(2,000 |
) |
|
|
(2,000 |
) |
|
|
(2,000 |
) |
|
|
|
|
(8,300 |
) |
|
|
(5,500 |
) |
|
Depreciation and amortization expense |
|
|
(22,583 |
) |
|
|
(15,254 |
) |
|
|
(17,007 |
) |
|
|
(19,024 |
) |
|
|
(18,065 |
) |
|
|
|
|
(73,868 |
) |
|
|
(56,784 |
) |
|
Other income (expense) |
|
|
7 |
|
|
|
(380 |
) |
|
|
(241 |
) |
|
|
(395 |
) |
|
|
51 |
|
|
|
|
|
(1,009 |
) |
|
|
(21,398 |
) |
|
Gains (loss) on assets |
|
|
19,094 |
|
|
|
7,430 |
|
|
|
17,281 |
|
|
|
- |
|
|
|
(20 |
) |
|
|
|
|
43,805 |
|
|
|
(5,370 |
) |
|
Asset impairment |
|
|
(929 |
) |
|
|
(7,250 |
) |
|
|
- |
|
|
|
- |
|
|
|
- |
|
|
|
|
|
(8,179 |
) |
|
|
- |
|
|
TSRE financing extinguishment and employee separation expenses |
|
|
- |
|
|
|
(27,508 |
) |
|
|
- |
|
|
|
- |
|
|
|
- |
|
|
|
|
|
(27,508 |
) |
|
|
- |
|
|
Gains (losses) on IRT merger with TSRE |
|
|
592 |
|
|
|
64,012 |
|
|
|
- |
|
|
|
- |
|
|
|
- |
|
|
|
|
|
64,604 |
|
|
|
- |
|
|
Gains (loss) on deconsolidation of VIEs |
|
|
- |
|
|
|
- |
|
|
|
- |
|
|
|
- |
|
|
|
(215,804 |
) |
|
|
|
|
- |
|
|
|
(215,804 |
) |
|
Gain (loss) on sale of collateral management contracts |
|
|
- |
|
|
|
- |
|
|
|
- |
|
|
|
- |
|
|
|
4,549 |
|
|
|
|
|
- |
|
|
|
4,549 |
|
|
Gain (loss) on debt extinguishment |
|
|
- |
|
|
|
- |
|
|
|
- |
|
|
|
- |
|
|
|
- |
|
|
|
|
|
- |
|
|
|
2,421 |
|
|
Change in fair value of financial instruments |
|
|
(1,828 |
) |
|
|
620 |
|
|
|
8,356 |
|
|
|
4,490 |
|
|
|
(39,319 |
) |
|
|
|
|
11,638 |
|
|
|
(98,752 |
) |
|
Income tax benefit (provision) |
|
|
(1,478 |
) |
|
|
(23 |
) |
|
|
(715 |
) |
|
|
(582 |
) |
|
|
(307 |
) |
|
|
|
|
(2,798 |
) |
|
|
2,147 |
|
|
Net Income (Loss) |
|
$ |
11,960 |
|
|
$ |
24,826 |
|
|
$ |
26,441 |
|
|
$ |
266 |
|
|
$ |
(247,080 |
) |
|
|
|
$ |
63,493 |
|
|
$ |
(289,975 |
) |
32