Attached files
| file | filename |
|---|---|
| 8-K - MIDWAY GOLD CORP. - 8-K - Midway Gold Corp | midway8k09092014.htm |
NI 43-101 TECHNICAL REPORT ON RESOURCES
sPRING VALLEY Project
Pershing County, Nevada
PREPARED FOR

Report Date: September 9, 2014
Effective Date: August 1, 2014
Prepared by
William J. Crowl, R.G., MMSA QP
Zachary J. Black, SME-RM
Deepak Malhotra, PhD, SME-RM

Midway Gold Corp. Spring Valley Project | Certificate of Authors NI 43-101 Technical Report on Resources |
William J. Crowl
Vice President, Mining
Gustavson Associates, LLC
274 Union Boulevard, Suite 450
Lakewood, Colorado 80228
Telephone: 720-407-4062 Facsimile: 720-407-4067
Email: wcrowl@gustavson.com
CERTIFICATE of AUTHOR
I, William J. Crowl do hereby certify that:
| 1. | I am currently employed as Vice President, Mining by Gustavson Associates, LLC at: |
274 Union Boulevard
Suite 450
Lakewood, Colorado 80228
- I am a graduate of the University of Southern California with a Bachelor of Arts in Earth Science (1968), and an MSc in Economic Geology from the University of Arizona in 1979, and have practiced my profession continuously since 1973.
- I am a registered Professional Geologist in the State of Oregon (G573) and am a registered member of the Mining and Metallurgical Society of America (01412QP)..
- I have worked as a geologist for a total of 40 years since my graduation from university; as a graduate student, as an employee of a major mining company, a major engineering company, and as a consulting geologist.
- I have read the definition of “qualified person” set out in National Instrument 43-101 (“NI 43-101”) and certify that by reason of my education, affiliation with a professional association (as defined in NI 43-101) and past relevant work experience, I fulfill the requirements to be a “qualified person” for the purposes of NI 43-101.
- I am responsible for the preparation of the technical report titled “NI 43-101 Technical Report on Resources, Spring Valley Project” dated September 9, 2014 with an effective date of August 1, 2014 (the “Technical Report”), with specific responsibility for Sections 1-8, and 15-19 and overall corporate responsibility for the general content and organization of the report. Mr. Crowl visited the site on October 24, 2013 for one day
- I have had prior involvement with the property that is the subject of this Technical Report. I was responsible for the preparation of the report titled “NI 43-101 Technical Report on the Spring Valley Project, Pershing County, Nevada,” dated May 24, 2011, with specific responsibility for Sections 9, 10 and 11 and overall corporate responsibility for the general content and organization of the report.
September 9, 2014 | i |
|

Midway Gold Corp. Spring Valley Project | Certificate of Authors NI 43-101 Technical Report on Resources |
In addition, I was responsible for the preparation of the technical report titled “Updated NI 43-101 Technical Report on the Spring Valley Project” dated November 29, 2012, with specific responsibility for Sections 9, 10 and 11 and overall corporate responsibility for the general content and organization of the report.
- I am independent of the issuer applying all of the tests in Section 1.5 of National Instrument 43-101.
- I have read National Instrument 43-101 and Form 43-101, and the Technical Report has been prepared in compliance with that instrument and form.
| 10. | I consent to the filing of the Technical Report with any stock exchange and other regulatory authority and any publication by them for regulatory purposes, including electronic publication in the public company files on their websites accessible by the public, of the Technical Report. |
| 11. | As of the date of this certificate, to the best of my knowledge, information and belief, the Technical Report contains all scientific and technical information that is required to be disclosed to make the Technical Report not misleading. |
Dated this 9th day of September, 2014.
| /s/ William J. Crowl | ||
| Signature of Qualified Person | ||
William J. Crowl |
||
| Signature of Qualified Person | ||
September 9, 2014 | ii |
|
Midway Gold Corp. Spring Valley Project | Certificate of Authors NI 43-101 Technical Report on Resources |
Zachary J. Black
Associate Resource Geologist
Gustavson Associates, LLC
274 Union Boulevard, Suite 450
Lakewood, Colorado 80228
Telephone: 720-407-4062 Facsimile: 720-407-4067
Email: zblack@gustavson.com
CERTIFICATE of AUTHOR
I, Zachary J. Black do hereby certify that:
- I am currently employed as Associate Resource Geologist with Gustavson Associates, LLC at:
274 Union Boulevard
Suite 450
Lakewood, Colorado 80228
- I am a graduate of the University of Nevada Reno with a Bachelor of Science in Geological Engineering, and have practiced my profession continuously since 2005.
- I am a registered member of the Society of Mining Metallurgy and Exploration (No. 4156858RM).
| 4. | I have worked as a Geological Engineer/Resource Estimation Geologist for a total of seven years since my graduation from university; as an employee of a major mining company, a major engineering company, and as a consulting engineer. I have estimated numerous mineral resources containing gold and have seven years of precious and base metals experience. |
- I have read the definition of “qualified person” set out in National Instrument 43-101 (“NI 43-101”) and certify that by reason of my education, affiliation with a professional association (as defined in NI 43-101) and past relevant work experience, I fulfill the requirements to be a “qualified person” for the purposes of NI 43-101.
- I am responsible for the preparation of the technical report titled “NI 43-101 Technical Report on Resources, Spring Valley Project” dated September 9, 2014 with an effective date of August 1, 2014 (the “Technical Report”), with specific responsibility for Sections 9-12 and 14. Mr. Black visited the site on October 21 and 22, 2010 and October 24, 2013 for one day.
- I have had prior involvement with the property that is the subject of this Technical Report. I prepared the resource estimate in the report titled “NI 43-101 Technical Report on the Spring Valley Project, Pershing County, Nevada,” dated May 24, 2011. In addition, I prepared the resource estimate in the report titled “Updated NI 43-101 Technical Report on the Spring Valley Project” dated November 29, 2012.
- I am independent of the issuer applying all of the tests in Section 1.5 of National Instrument 43-101.
September 9, 2014 | iii |
|
Midway Gold Corp. Spring Valley Project | Certificate of Authors NI 43-101 Technical Report on Resources |
| 9. | I have read National Instrument 43-101 and Form 43-101, and the Technical Report has been prepared in compliance with that instrument and form. |
| 10. | I consent to the filing of the Technical Report with any stock exchange and other regulatory authority and any publication by them for regulatory purposes, including electronic publication in the public company files on their websites accessible by the public, of the Technical Report. |
| 11. | As of the date of this certificate, to the best of my knowledge, information and belief, the Technical Report contains all scientific and technical information that is required to be disclosed to make the Technical Report not misleading. |
Dated this 9th day of September, 2014.
/s/ Zachary J. Black |
||
| Signature of Qualified Person | ||
Zachary J. Black |
||
| Signature of Qualified Person | ||
September 9, 2014 | iv |
|
Midway Gold Corp. Spring Valley Project | Certificate of Authors NI 43-101 Technical Report on Resources |
Deepak Malhotra, PhD,
Member SME-RM, CIMM
Resource Development, Inc.
11475 West I-70 Frontage Road North
Wheat Ridge, Colorado 80033
Telephone: (303) 422-1176 Facsimile: (303) 424-8580
Email: dmalhotra@aol.com
CERTIFICATE of AUTHOR
I, Deepak Malhotra do hereby certify that:
- I am currently employed as President by Resource Development, Inc. at:
11475 West I-70 Frontage Road North
Wheat Ridge, Colorado 80033
| 2. | I am a graduate of Colorado School of Mines with a M.Sc. degree in Metallurgical Engineering (1974), and PhD in Mineral Economics (1978). |
| 3. | I am a registered member of the Society of Mining, Metallurgy and Exploration, Inc. (SME), member No. 2006420RM. |
| 4. | I have worked as a Metallurgist/Mineral Economist for a total of 40 years since my graduation from university; as an employee of several mining companies, an engineering company, a mine development and mine construction company, an exploration company, and as a consulting engineer.. |
| 5. | I have read the definition of “qualified person” set out in National Instrument 43-101 (“NI 43-101”) and certify that by reason of my education, affiliation with a professional association (as defined in NI 43-101) and past relevant work experience, I fulfill the requirements to be a “qualified person” for the purposes of NI 43-101. |
| 6. | I am responsible for the preparation of the technical report titled “NI 43-101 Technical Report on Resources, Spring Valley Project” dated September 9, 2014 with an effective date of August 1, 2014 (the “Technical Report”), with specific responsibility for Section 13. I have not visited the Spring Valley Mine Site. |
| 7. | I have had prior involvement with the property that is the subject of this Technical Report. I was responsible for the preparation of the report titled “NI 43-101 Technical |
September 9, 2014 | v |
|
Midway Gold Corp. Spring Valley Project | Certificate of Authors NI 43-101 Technical Report on Resources |
Report on the Spring Valley Project, Pershing County, Nevada,” dated May 24, 2011, with specific responsibility for Section 18.
| 8. | In addition, I was responsible for the preparation of the technical report titled “Updated NI 43-101 Technical Report on the Spring Valley Project” dated November 29, 2012, with specific responsibility for Section 18. |
| 9. | I am independent of the issuer applying all of the tests in Section 1.5 of National Instrument 43-101. |
| 10. | I have read National Instrument 43-101 and Form 43-101, and the Technical Report has been prepared in compliance with that instrument and form. |
| 11. | I consent to the filing of the Technical Report with any stock exchange and other regulatory authority and any publication by them for regulatory purposes, including electronic publication in the public company files on their websites accessible by the public, of the Technical Report. |
| 12. | As of the date of this certificate, to the best of my knowledge, information and belief, the Technical Report contains all scientific and technical information that is required to be disclosed to make the Technical Report not misleading. |
Dated this 9th day of September, 2014.
/s/ Deepak Malhotra |
||
| Signature of Qualified Person | ||
Deepak Malhotra
Signature
of Qualified Person
September 9, 2014 | vi |
|
Midway Gold Corp. Spring Valley Project | Certificate of Authors NI 43-101 Technical Report on Resources |
TABLE OF CONTENTS
Section Title Page No.
| 1. SUMMARY | 1 |
| 1.1 Introduction | 1 |
| 1.2 Geology and Mineralization | 1 |
| 1.3 Drilling and Exploration Status | 2 |
| 1.4 Environmental and Permitting | 2 |
| 1.4.1 Environmental Liabilities | 2 |
| 1.4.2 Permits | 3 |
| 1.5 Operational Permits and Jurisdictions | 3 |
| 1.6 Infrastructure | 3 |
| 1.7 Mineral Processing and Metallurgical Testing | 4 |
| 1.8 Mineral Resources | 4 |
| 1.9 Interpretations and Conclusions | 6 |
| 1.9.1 Environmental | 6 |
| 1.9.2 Geology and Deposit Type | 6 |
| 1.9.3 Exploration, Drilling, and Analytical | 6 |
| 1.9.4 Quality Assurance/Quality Control | 6 |
| 1.9.5 Mineral Processing and Metallurgical Testing | 6 |
| 1.9.6 Data Verification | 7 |
| 1.9.7 Resource | 7 |
| 1.10 Recommendations | 7 |
| 1.10.1 Scoping Study | 7 |
| 1.10.2 Geologic Model | 7 |
| 1.10.3 Metallurgical Study | 8 |
| 1.10.4 Geotechnical and Hydrogeological Study | 8 |
| 1.10.5 Environmental Permitting | 8 |
| 1.10.6 Exploration Program | 8 |
| 1.10.7 Budget | 9 |
| 2. INTRODUCTION AND TERMS OF REFERENCE | 10 |
| 2.1.1 Details of Inspection | 10 |
| 2.1.2 Sources of Information | 11 |
| 2.2 Effective Date | 11 |
| 2.3 Units of Measure | 11 |
| 3. RELIANCE ON OTHER EXPERTS | 14 |
| 4. PROPERTY DESCRIPTION AND LOCATION | 14 |
| 4.1 Property Location | 14 |
| 4.2 Agreements and Royalties | 15 |
| 4.2.1 Barrick Agreement | 15 |
| 4.2.2 Agreements | 15 |
| 4.3 Environmental Liabilities | 16 |
September 9, 2014 | i |
|
Midway Gold Corp. Spring Valley Project | Certificate of Authors NI 43-101 Technical Report on Resources |
| 4.4 Permits | 17 |
| 5. ACCESSIBILITY, CLIMATE, LOCAL RESOURCES, INFRASTRUCTURE AND PHYSIOGRAPHY | 19 |
| 5.1 Accessibility | 19 |
| 5.2 Climate | 20 |
| 5.3 Local Resources and Infrastructure | 20 |
| 5.4 Physiography | 20 |
| 5.5 Water Rights | 21 |
| 6. HISTORY | 21 |
| 7. GEOLOGICAL SETTING AND MINERALIZATION | 22 |
| 7.1 Regional Geologic Setting | 22 |
| 7.2 Local Geologic Setting | 24 |
| 7.3 Lithologic Units | 26 |
| 7.3.1 Quaternary Alluvium (Qal) | 26 |
| 7.3.2 Limerick Greenstone: | 26 |
| 7.3.3 Rochester Rhyolite | 26 |
| 7.3.4 Upper Rhyolite | 27 |
| 7.3.5 Siltstone | 27 |
| 7.3.6 WT Rhyolite | 27 |
| 7.3.7 Breccia/Conglomerate | 28 |
| 7.3.8 Intrusive rocks | 28 |
| 7.4 Mineralization Style | 32 |
| 7.5 Alteration | 32 |
| 7.6 Geometry of Mineralization | 34 |
| 8. DEPOSIT TYPES | 35 |
| 9. EXPLORATION | 35 |
| 9.1 Pre-MGC Exploration | 36 |
| 9.2 MGC Exploration | 36 |
| 9.2.1 Surface Geochemistry | 36 |
| 9.2.2 Rock Samples | 36 |
| 9.2.3 Geological Mapping | 36 |
| 9.2.4 Geophysical Surveys | 36 |
| 9.3 Barrick Exploration | 37 |
| 9.4 Exploration Targets | 37 |
| 10. DRILLING | 37 |
| 10.1 Type and Extent | 37 |
| 10.2 Drilling Procedures and Conditions | 40 |
| 10.2.1 Reverse Circulation Drilling | 40 |
| 10.2.1 Diamond Core Drilling | 40 |
| 10.2.2 Drill Collar and Downhole Surveys | 41 |
| 10.3 Drilling Interpretations and Results | 41 |
September 9, 2014 | ii |
|
Midway Gold Corp. Spring Valley Project | Certificate of Authors NI 43-101 Technical Report on Resources |
| 11. SAMPLE PREPARATION, ANALYSES, AND SECURITY | 42 |
| 11.1 Sampling Method and Approach | 42 |
| 11.2 Midway Sampling Preparation, Analyses, and Security | 42 |
| 11.2.1 Sample Chain of Custody | 42 |
| 11.2.2 Diamond Drilling Core Sampling | 43 |
| 11.2.3 Sampling of Reverse Circulation Cuttings | 43 |
| 11.2.4 Sample Preparation and Assay Procedures | 44 |
| 11.2.5 Standards, Duplicates, and Blanks | 46 |
| 11.3 Barrick Sampling Preparation, Analyses, and Security | 52 |
| 11.3.1 Sample Chain of Custody | 52 |
| 11.3.2 Diamond Drilling Core Sampling | 52 |
| 11.3.3 Sampling of Reverse Circulation Cuttings | 53 |
| 11.3.4 Sample Preparation and Assay Procedures | 53 |
| 11.3.5 Standards, Duplicates and Blanks | 54 |
| 11.3.6 Check Assay Programs | 59 |
| 11.3.7 Twin Hole Comparisons | 59 |
| 11.3.8 Exploration drilling 2014 | 60 |
| 11.4 Data Entry Validation Controls | 60 |
| 11.5 Opinion on Adequacy | 61 |
| 12. DATA VERIFICATION | 61 |
| 12.1 Validation of Database | 63 |
| 12.1.1 Received Data | 63 |
| 12.1.2 Mechanical Audit | 63 |
| 12.1.3 Overlaps | 64 |
| 12.1.4 Gaps, Non-numeric Assay Values, and Negative numbers | 65 |
| 12.1.5 Survey Data | 66 |
| 12.1.6 Table Depth Consistency | 66 |
| 12.1.7 Assay Certificates | 66 |
| 13. MINERAL PROCESSING AND METALLURGICAL TESTING | 66 |
| 13.1 Mineral Processing and Metallurgical Testing | 66 |
| 13.2 Column Leach Tests | 67 |
| 13.3 Bottle Roll Tests | 67 |
| 13.4 Gravity Tests | 67 |
| 13.5 Bond Mill Work Index | 68 |
| 13.6 Historical Test Work | 68 |
| 13.7 Summary & Recommendations | 69 |
| 14. MINERAL RESOURCE ESTIMATE | 69 |
| 14.1 Block Model Physical Limits | 69 |
| 14.2 Data Used for the Grade Estimation | 70 |
| 14.3 Data | 70 |
| 14.4 Geologic Model | 70 |
| 14.5 Exploratory Data Analysis | 73 |
September 9, 2014 | iii |
|
Midway Gold Corp. Spring Valley Project | Certificate of Authors NI 43-101 Technical Report on Resources |
| 14.6 Compositing | 80 |
| 14.7 Capping | 81 |
| 14.8 Grade Shell Generation | 83 |
| 14.9 Variography | 84 |
| 14.10 Estimation Methodology | 90 |
| 14.11 Mineral Resource Classification | 90 |
| 14.12 Density | 91 |
| 14.13 Model Validation | 91 |
| 14.13.1 Statistical Model Comparison | 91 |
| 14.14 Swath Plots | 94 |
| 14.15 Mineral Resources | 96 |
| 14.16 Pit-constrained Mineral Resource | 97 |
| 15. ADJACENT PROPERTIES | 98 |
| 15.1 Coeur Rochester | 98 |
| 15.2 Lincoln Hill Property | 98 |
| 15.3 Moonlight Project | 98 |
| 16. OTHER RELEVANT DATA AND INFORMATION | 99 |
| 17. INTERPRETATION AND CONCLUSIONS | 99 |
| 17.1 Environmental | 99 |
| 17.2 Geology and Deposit Type | 99 |
| 17.3 Exploration, Drilling, and Analytical | 99 |
| 17.4 Quality Assurance/Quality Control | 99 |
| 17.5 Mineral Processing and Metallurgical Testing | 100 |
| 17.6 Data Verification | 100 |
| 17.7 Resource | 100 |
| 18. RECOMMENDATIONS | 100 |
| 18.1 Geologic Model | 101 |
| 18.2 Metallurgical Study | 101 |
| 18.3 Geotechnical and Hydrogeological Study | 101 |
| 18.4 Exploration Program | 101 |
| 18.5 Budget | 102 |
| 19. REFERENCES | 104 |
September 9, 2014 | iv |
|
Midway Gold Corp. Spring Valley Project | Certificate of Authors NI 43-101 Technical Report on Resources |
LIST OF FIGURES
Figure Page
| Figure 7-1 Geology of the Humboldt Range | 23 |
| Figure 7-2 Bedrock Geology Map of the Spring Valley Project | 25 |
| Figure 7-3 Conceptual Cross Section of Lithologies (Modified from Chadwick, 2012) | 30 |
| Figure 7-4 Coarse Gold from SV08-435 Drilled in the Big Leap Zone | 33 |
| Figure 7-5 Coarse Gold from SV08-410 at 310’ | 34 |
| Figure 7-6 Coarse Gold from SV08-436 Drilled at the South End of the Big Leap | 34 |
| Figure 10-1 Spring Valley Project Area Drill Hole Location Map | 39 |
| Figure 11-1 2006 – 2007 Blank Results | 47 |
| Figure 11-2 2006 – 2007 Standard MEG055 Results | 48 |
| Figure 11-3 2006 – 2007 Standard MEG160 Results | 48 |
| Figure 11-4 2006 – 2007 Standard MEG200 Results | 49 |
| Figure 11-5 2007 Standard MEG067 Results | 49 |
| Figure 11-6 2007 Standard MEG045 Results | 50 |
| Figure 11-7 2007 – 2008 Standard OREAS102 Results | 51 |
| Figure 11-8 2007 – 2008 Standard OREAS342 Results | 51 |
| Figure 11-9 Barrick 2011 Blank Results | 55 |
| Figure 11-10 Barrick 2011 Standard OxC72 Results | 56 |
| Figure 11-11 Barrick 2011 Standard OxG83 Results | 56 |
| Figure 11-12 Barrick 2011 Standard OxJ68 Results | 57 |
| Figure 11-13 Barrick 2011 Standard SE29 Results | 57 |
| Figure 11-14 Barrick 2011 Standard SE44 Results | 58 |
| Figure 11-15 Barrick 2011 Standard SG40 Results | 58 |
| Figure 11-16 Barrick 2011 Standard Si42 Results | 59 |
| Figure 14-1 Fault and Estimation Domain Plan View | 72 |
| Figure 14-2 Oblique View of Filtered Gold Values (Au≥0.002 oz/t) Limerick Trend Encircled | 74 |
| Figure 14-3 Gold (oz/t) Cumulative Frequency Plots by Lithology | 76 |
| Figure 14-4 Gold (oz/t) Box Plots by Lithology | 77 |
| Figure 14-5 Histogram of Samples within 5 Intervals (~25 ft) of a ≥ 0.022 oz/t Assay Interval | 79 |
| Figure 14-6 Samples above Cutoff within Range of Vein (>0.022 oz/t) Assay Interval | 80 |
| Figure 14-7 Composite Study | 81 |
| Figure 14-8 CFP Analysis by Domain | 82 |
| Figure 14-9 Grade Boundary | 83 |
| Figure 14-10 Example Variograms, 2100-2300 domain | 85 |
| Figure 14-11 Example Variograms, 3100-3300 domain | 86 |
| Figure 14-12 Example Variograms, 3100-3300 domains | 87 |
| Figure 14-13 Example Variograms, 4000-5000 domains | 88 |
| Figure 14-14 Example Variograms, 4000-5000 domains | 89 |
| Figure 14-15 Model Comparison Cumulative Frequency Plot (OK red, ID blue, NN Black) | 94 |
| Figure 14-16 Elevation Swath Model | 95 |
September 9, 2014 | v |
|
Midway Gold Corp. Spring Valley Project | Certificate of Authors NI 43-101 Technical Report on Resources |
LIST OF TABLES
Table Page
| Table 1-1 Mineral Resource Statement for the Spring Valley Project | 5 |
| Table 1-2 Proposed Budget | 9 |
| Table 4-1 Summary of Spring Valley Property Agreements | 16 |
| Table 4-2 Agency Permits and Authorizations* | 18 |
| Table 10-1 Summary of Drilling Campaigns in the Spring Valley Resource Area | 38 |
| Table 12-1 Mechanical Audit Errors | 64 |
| Table 12-2 Database Overlap Summary | 65 |
| Table 12-3 Interval Import Summary | 65 |
| Table 12-4 Certificate Validation Errors | 66 |
| Table 13-1 Composites | 67 |
| Table 14-1 Lithologic Groups | 75 |
| Table 14-2 Spring Valley Project Sample Assay Gold Descriptive Statistics (oz/t) | 75 |
| Table 14-3 Descriptive Statistics ≥0.002 oz/t Au by Lithology | 76 |
| Table 14-4 Capped Value by Domain | 81 |
| Table 14-5 Capped 10-foot Composite Statistics ≥0.001 oz/t | 83 |
| Table 14-6 Domain Variogram Parameters | 89 |
| Table 14-7 Estimation Parameters | 90 |
| Table 14-8 Rock Type Density Summary | 91 |
| Table 14-9 Descriptive Statistics for Domains 2100-2300 (Limb) | 91 |
| Table 14-10 Descriptive Statistics for Domains 3100-3300 (Main) | 93 |
| Table 14-11 Descriptive Statistics for Domains 4000 and 5000 (West 1 and West 2) | 93 |
| Table 14-12 Mineral Resource Statement for the Spring Valley Project, | 97 |
| Table 14-13 Pit-Constrained Resource for selected Whittle Shells. | 97 |
| Table 18-1 Proposed Budget | 103 |
LIST OF Appendices
| Claims List Exhibit | 106 |
September 9, 2014 | vi |
|
Midway Gold Corp. Spring Valley Project | Certificate of Authors NI 43-101 Technical Report on Resources |
| 1. | SUMMARY |
| 1.1 | Introduction |
Gustavson Associates, LLC (“Gustavson”) was retained by Midway Gold Corp. (“Midway”) to update the National Instrument 43-101 (“NI 43-101”) Technical Report on Resources, Spring Valley Project (the “Project” or the “Spring Valley Project”) in Pershing County, Nevada, dated May 24, 2011 prepared by Gustavson. This report presents the results of the mineral resource estimate based on all available technical data and information as of August 1, 2014.
This report is prepared to fulfill Midway’s disclosure requirements to the Toronto Stock Exchange. It should be noted that this report is independent of and distict from any parallel resource estimates or scoping studies being carried out by the Spring Valley Venture, or by Barrick as operator.
This report has been prepared in accordance with the Canadian Securities Administrators (“CSA”) NI 43-101 and in compliance with the disclosure and reporting requirements set forth in Companion Policy 43-101CP and Form 43-101F1 (June 2011). Resources have been classified in accordance with standards as defined by the Canadian Institute of Mining, Metallurgy and Petroleum (“CIM”) “CIM Definition Standards - For Mineral Resources and Mineral Reserves”, prepared by the CIM Standing Committee on Reserve Definitions and adopted by CIM Council on December 17, 2010.
| 1.2 | Geology and Mineralization |
The Spring Valley property is located in the Humboldt Range, a north-south oriented, up-thrown fault block (horst) bounded on the west by the Humboldt River valley and on the east by Buena Vista Valley. Quaternary alluvial deposits fill the intermontane basins and alluvial valleys.
The bedrock geology of the Humboldt range within 20 miles of the Spring Valley property consists of Triassic shales and carbonate rocks, a thick sequence of Permo-Triassic intermediate to felsic volcanic rocks, and a north-south trending belt of Tertiary volcanic rocks. Triassic leucogranite and Cretaceous granodiorite locally intrude the Permo-Triassic volcanic package.
The known Spring Valley mineral system is beneath an intermontane basin filled with post-mineral Quaternary alluvial deposits, thereby masking the bedrock geology immediately overlying or containing the mineralization. At the scale of the Spring Valley property position, the bedrock units are distributed in blocks aligned approximately north-south. The bedrock geology is dominated by the Limerick Formation in the western one-third of the property, the Rochester Formation in the central and eastern half of the property, and the Natchez Pass Limestone in the extreme northeast corner of the property. At this scale, the geology is segmented by a number of faults: a relatively older north to northeast trending set including the West Spring Valley, Limerick and Black Ridge Faults; and, northwest trending, steeply dipping cross faults with oblique or lateral offsets that displace the older north to northeast trending faults. The West Spring Valley fault is interpreted as a steeply east dipping normal fault, whereas the Black Ridge and Limerick faults are interpreted as moderate to high angle normal faults with westerly dips. The Limerick fault may be listric in character, with flattening dip at depth. East-west and northeasterly faults are also mapped, but are not part of the predominant fabric on the property.
September 9, 2014 | 1 |
|
Midway Gold Corp. Spring Valley Project | Certificate of Authors NI 43-101 Technical Report on Resources |
| 1.3 | Drilling and Exploration Status |
Exploration work carried out by Midway and Barrick Gold Exploration Inc., a wholly owned subsidiary of Barrick Gold Corporation (“Barrick”) on the Spring Valley property has been and continues to be dominated by drilling. Midway and Barrick have also conducted extensive geological mapping and surface geochemical sampling campaigns in the surrounding hills and have conducted limited geophysical surveys in the basin to guide drilling. Early exploration work by previous operators included small-scale surface geochemical and geophysical surveys and drilling.
The Spring Valley resource area has been drilled with a total of 672 holes totaling 603,731 feet, including 531 Reverse Circulation (RC) drill holes totaling 428,500 feet and 141 diamond core holes totaling 173,011 feet.
| 1.4 | Environmental and Permitting |
| 1.4.1 | Environmental Liabilities |
Environmental liabilities at the property are limited to the construction of drill pads and roads, drilling, closure and reclamation of the currently permitted drilling program. This program is bonded with NDEP and the BLM. As work plans detailing the work, and reclamation cost estimates utilizing the states Standardized Reclamation Cost Estimator (SRCE), or equivalent, are required, the bond is considered adequate for the liability. Other potential environmental liabilities include the inadvertent impact of an unidentified cultural site or the allowance of invasion by a weedy species. The potential for impacting a cultural site or allowing the invasion of weedy species is considered low given the requirements for cultural surveys and the BLM’s Standard Operating Procedures (SOPs), which include general protection procedures to preclude weedy invasion. The potential for impacts to rangeland, impacts due to a hazardous or solid waste release, impact to water resources or impacts to a wetland is considered extremely low given the permitting requirements, SOPs, and Barrick’s operating practices.
September 9, 2014 | 2 |
|
Midway Gold Corp. Spring Valley Project | Certificate of Authors NI 43-101 Technical Report on Resources |
| 1.4.2 | Permits |
According to the NDOM, all mining operations in Nevada are required to have:
| · | Legitimate mining claims registered with the BLM, or ownership or control of mineral rights on private land; |
| · | An approved Plan of Operation from the BLM, the U.S. Forest Service or the Nevada Division of Environmental Protection, (NDEP); and |
| · | Necessary state permits. |
| 1.5 | Operational Permits and Jurisdictions |
Midway and Barrick exploration activities are permitted under a Plan of Operations (PoO) approved by the BLM in July 2007, and Reclamation Permit No. 0258 approved by the NDEP in December 2006. All of the permits and approvals, and the bonds, were transferred to Barrick in 2009. A new or amended PoO will be required if disturbances beyond the currently approved 75 acres are necessary.
| 1.6 | Infrastructure |
The Spring Valley property is accessed by Nevada State Route (SR) 50 (also known as Lovelock-Unionville Road), which extends eastward from US Interstate 80 at exit 119. SR 50 also serves as the main access to the Rochester Mine until a turnoff at Spring Valley Pass. Once in Spring Valley, access to the various parts of the Property is by dirt road. Alternatively, access is possible from the Buena Vista Valley to the east through Spring Valley Canyon on SR 50.
The nearest town to the Property is Lovelock, Nevada, which is situated along US Interstate 80 and hosts a population of 1,895 (Census 2012 data). The nearest city is Reno, Nevada, approximately 120 miles to the southwest, which hosts a population of 231,027 (Census 2012 data).
Power lines cross the property and ground water is abundant as evidenced by artesian wells in the main area of drilling. There is an adequate workforce in the surrounding region and the town of Lovelock. Northern Nevada is home to many gold mining operations with all associated support and supplies.
September 9, 2014 | 3 |
|
Midway Gold Corp. Spring Valley Project | Certificate of Authors NI 43-101 Technical Report on Resources |
| 1.7 | Mineral Processing and Metallurgical Testing |
Barrick contracted with McClelland labs in Sparks, Nevada to complete a detailed metallurgical testing program on thirteen drill core composites from Spring Valley. The composite samples representing four rock types and three oxidation states were tested by column leaching, bottle roll and gravity methods. The composites were from a total of 355 split diamond drill core intervals, each interval representing approximately five feet. Grades of the composite samples ranged from 0.21 grams per tonne (gpt) to 5.07 gpt (0.006 oz/t to 0.148 oz/t); nine of the samples had grades less than 1.03 gpt (0.030 oz/t). The reported gold grades were determined by metallic screen fire assays. Column leach tests simulating heap leach conditions were conducted over 260 days, and yielded gold recoveries from 46% to 98% for all materials tested.
In December 2005, samples from eight drill holes were submitted for metallurgical testing at McClelland Laboratories Inc. in Sparks, Nevada by Midway. Select samples were combined to produce 19 composites for Gravity Recoverable Gold (GRG) testing. The composite samples were sequentially milled to progressively finer sizes, the resulting material (or gravity tailings after the first grind size) was processed using a laboratory Nelson Concentrator. The resulting concentrate and tailings were then assayed to determine gravity recovery of gold versus grind size. Testing in this way provides an estimate of the maximum recoverable gold values by gravity concentration. Recoveries for nine composites with head grades greater than 0.030 oz/st gold were between 67.5% and 96.5%.
The test samples described above are considered representative of the mineralization of the deposit as a whole. As of the date of this report, there are no processing factors that could have a significant effect on potential extraction.
| 1.8 | Mineral Resources |
Zachary J. Black, SME-RM, an associate Resource Geologist with Gustavson is responsible for the estimation of the mineral resource herein. Mr. Black is a qualified person as defined by NI 43-101 and is independent of Midway and of Barrick. Gustavson estimated the mineral resource for the Spring Valley Project from drill-hole data, using controls from the main rock types and implicit grade shells with an Ordinary Kriging (“OK”) algorithm.
Gustavson received the exploration drill hole database on September 20, 2013. Drill hole data, including collar coordinates, down hole surveys, sample assay intervals, and geologic logs, were provided in a secure Microsoft Access database and as CSV files. The database is managed by Barrick under the Exploration, Development, and Joint Operating Agreement. A small number of additional drillholes have been completed by Barrick since the database was closed, but the results have not yet been received by Midway or by Gustavson. Gustavson does not expect that a few additional infill drillholes will materially impact the resource estimation.
September 9, 2014 | 4 |
|
Midway Gold Corp. Spring Valley Project | Certificate of Authors NI 43-101 Technical Report on Resources |
The present database has been updated to include the remaining 2010, 2011, 2012, and the available 2013 drill holes, which were completed since the previous mineral resource estimate. The drill hole database contains gold assay analytical information for 112,858 sample intervals from core, RC, and mud rotary drilling methods.
A visual evaluation of the assay and geologic data in cross-section and plan view, in conjunction with the proximity analysis, reveals that while it is difficult to substantiate lithologic or alteration based domaining, there exists a significant spatial correlation between the higher grade samples and disseminated mineralization. It is Gustavson’s opinion that the statistical analyses justify the use of a grade boundary at +0.003 oz/t, as a proxy for the mineralized alteration selvages and vein zones, and domaining the resource within this grade boundary is both reasonable and appropriate.
The mineral resource estimate for the Spring Valley Project is summarized in Table 1-1. This mineral resource estimate includes all drill data available to Midway and Gustavson as of the effective date of this report, and has been independently estimated by Gustavson. Mineral resources are not mineral reserves and may be materially affected by economic, environmental, permitting, legal, socio-economic, marketing, political, or other factors. In Table 1-1, mineral resources are reported above a +0.006 oz/t Au cut-off, assuming the three year trailing average gold price of US$1,537 per ounce. This cut-off reflects the potential economic, marketing, and other issues relevant to an open pit mining scenario based on a carbon recovery process following cyanide heap leaching. Gustavson cautions that economic viability can only be demonstrated through prefeasibility or feasibility studies.
Table 1-1 Mineral Resource Statement for the Spring Valley Project
Pershing County, Nevada, Gustavson Associates, LLC, August 1, 2014
| Measured | Indicated | Measured + Indicated | Inferred | |||||||||
| Cutoff | Tons | Gold | Tons | Gold | Tons | Gold | Tons | Gold | ||||
| oz/t | (x1000) | oz/t | t. oz. (x1000) | (x1000) | oz/t | t. oz. (x1000) | (x1000) | oz/t | t. oz. (x1000) | (x1000) | oz/t | t. oz. (x1000) |
| 0.008 | 60,100 | 0.023 | 1,410 | 116,400 | 0.021 | 2,400 | 176,600 | 0.022 | 3,810 | 46,400 | 0.019 | 880 |
| 0.006 | 75,300 | 0.020 | 1,510 | 147,300 | 0.018 | 2,610 | 222,600 | 0.019 | 4,120 | 62,100 | 0.016 | 990 |
| *0.004 | 91,500 | 0.017 | 1,590 | 179,100 | 0.016 | 2,780 | 270,600 | 0.016 | 4,370 | 78,400 | 0.014 | 1,070 |
Note * based on discussion of cutoff presented above, material below 0.006 oz/t is not considered resource for the purposes of this report. 0.004 oz/t cutoff is presented for informational purposes and for consistency with prior reports. Note: Values may not sum due to rounding.
September 9, 2014 | 5 |
|
Midway Gold Corp. Spring Valley Project | Certificate of Authors NI 43-101 Technical Report on Resources |
| 1.9 | Interpretations and Conclusions |
| 1.9.1 | Environmental |
There are no known environmental liabilities on the Spring Valley project.
| 1.9.2 | Geology and Deposit Type |
The Spring Valley deposit is hosted within structurally prepared zones within a porphyry intrusion and overlying felsic volcanic rocks. Overall deposit geometry suggests that primary mineralizing fluid flow is related to steeply dipping, N20E to N30E- trending, deep-seated faults. Mineral emplacement is localized within structural preparation along these faults, as well as on contact horizons, deformation structures, and within permissive host rocks within a local graben /basin. The mineralization is associated with relatively thin, crystalline quartz veins that have large alteration selvages. In areas of dense quartz veining, the alteration selvages coalesce into regions of pervasively altered and veined rock.
| 1.9.3 | Exploration, Drilling, and Analytical |
The property has been explored using a variety of techniques including mapping, geophysical surveys, and geochemical sampling. The Spring Valley resource area has been drilled with a total of 672 holes totaling 603,731 feet, including 531 Reverse Circulation (RC) drill holes totaling 428,500 feet and 141 diamond core holes totaling 173,011 feet.
All drill intervals were first assayed by a 30 gram fire assay and mineralized intervals have been systematically re-assayed using MSFA. Where available, the MSFA numbers were utilized in the resource estimate. The project data is stored in a secure database. Assay and geology data have been checked for accuracy for all programs prior to 2009, and spot checked in the Barrick programs from 2009 through 2013.
Gustavson is of the opinion that exploration activities, drilling, and analytical procedures are being conducted in manner that meets or exceeds industry best practice.
| 1.9.4 | Quality Assurance/Quality Control |
Gustavson has reviewed the QA/QC assay programs and believes the programs provide adequate confidence in the data. Sample standard failures and the samples associated with erroneous blank samples have been reanalyzed prior to the completion of this Report and the results are comparable to the original assay.
| 1.9.5 | Mineral Processing and Metallurgical Testing |
The Spring Valley project mineralized material is potentially amenable to both gravity and heap leach recovery methods.
September 9, 2014 | 6 |
|
Midway Gold Corp. Spring Valley Project | Certificate of Authors NI 43-101 Technical Report on Resources |
The test samples described in the Mineral Processing and Metallurgical testing item of this Technical Report are representative of the mineralization of the deposit as a whole. As of the date of this report, there are no processing factors that could have a significant effect on potential extraction.
| 1.9.6 | Data Verification |
Gustavson received original assay certificates in pdf and comma delimited format for all samples included in the current drill hole database. A random manual check of 1,210 samples within the database against the original certificate revealed 3 total errors. The results of the analysis indicate that the data imported into the database matches the certificates 99.7% of the time with a confidence interval of ± 0.56% at a 95% confidence level. Gustavson considers the database adequate for estimation of mineral resource estimation purposes.
| 1.9.7 | Resource |
Within the main portion of the deposit, drill density is within 150 foot spacing, which is adequate to describe measured and indicated resources, given the variogram and the relative continuity of the resource estimate. However, some areas of the deposit are still in need of infill holes. Closer spaced drilling in these areas will be required to further upgrade the resource classification. Additionally there are areas of the project which are open to expansion of extents of mineralization.
| 1.10 | Recommendations |
Gustavson recommends the following program to advance the Spring Valley Project towards eventual development.
| 1.10.1 | Scoping Study |
Gustavson recommends that Midway complete a scoping study (PEA) on the project to evaluate proposed mining and processing methodologies, and economics associated with the implementation of various crushing, grinding, heap leach, and gravity recovery circuit combinations. The PEA should be completed to 43-101 standards and designed to support Midway’s reporting requirements as an independent issuer.
| 1.10.2 | Geologic Model |
Gustavson understands that Barrick is undertaking systematic relogging of the drilling including trace element analysis in an effort to refine the geologic and alteration model for the deposit. Gustavson recommends that Midway maintain a level of engagement in the relogging parameters and process in order to facilitate information transfer and share interpretive insights. The results of this logging should be considered in any resource updates moving forward.
September 9, 2014 | 7 |
|
Midway Gold Corp. Spring Valley Project | Certificate of Authors NI 43-101 Technical Report on Resources |
| 1.10.3 | Metallurgical Study |
Existing metallurgical studies have established that gold at Spring Valley is amenable to cyanidation and to gravity separation. Gustavson recommends that additional metallurgical studies be completed to evaluate the mix of mineral processing methods best suited for the mineralization at Spring Valley. The evaluation should include the study of conventional cyanidation at different crush sizes, as well as the impact of gravity concentration at different steps in the process stream. Testwork should include samples of mineralization of various alteration and oxidation types.
| 1.10.4 | Geotechnical and Hydrogeological Study |
Gustavson recommends that the existing Golder pit slope analysis and geotechnical studies be reviewed to identify critical geotechnical areas and to define a geotechnical exploration program to support final design parameters. The Golder geotechnical studies should form the basis for mine design for the proposed PEA. Additionally, Gustavson recommends that the preliminary hydrogeological studies be reviewed to determine critical path to support project water needs, secure remaining required water rights, and address potential pit dewatering concerns. This information should be included in the support of a proposed PEA.
| 1.10.5 | Environmental Permitting |
Gustavson recommends that continued work towards meeting the requirements of the State of Nevada to permit a mine on public land should include in the short term:
- Finalize Class III Cultural Survey report;
- Endangered Species Act (ESA) and other biological requirements; and
- Ongoing collection and evaluation of environmental baseline data.
- Installation and monitoring of groundwater monitoring as recommended for hydrologic models and baseline studies.
| 1.10.6 | Exploration Program |
Continued exploration diamond core drilling should be targeted in three areas within and adjacent to the immediate mineral resource area:
- Infill and step out drilling at the furthest south extent of drilling near the flanks of Gold Mountain.
- Exploration drilling along the Wabash fault that bisects the main Spring Valley resource. Extensions of this fault to both the east and west of the main resource have the potential to host mineralization that has not yet been tested. Placer gold is common along the trace of the fault to the SE.
- Infill and step out drilling targeting the lower Felsic Porphyry unit at depth in the main resource area, to the northern extents of the project and along the eastern Limerick fault.
- Limited infill drilling, primarily in those areas where substantial in-pit inferred mineralization has been identified, or in areas of high potential for pit expansion.
September 9, 2014 | 8 |
|
Midway Gold Corp. Spring Valley Project | Certificate of Authors NI 43-101 Technical Report on Resources |
| 1.10.7 | Budget |
Under the terms of the Joint Venture Agreement, Barrick has assumed the responsibility for the exploration and development activities. The Spring Valley Joint Venture has a project development budget which includes most of the recommendations listed above. The SVV project is operated by Barrick, with 75% of the costs borne by Barrick, and the remainder by Midway Gold.
Table 1-2 presents the 2014-2015 development and exploration budgets for the Spring Valley Venture, as well as budget line items for Midway based on the recommendations described above.
Table 1-2 Proposed Budget
| Midway Studies & Reports | Costs (US$) |
| Metallurgical Studies | 120,000 |
| Geotechnical Review | 30,000 |
| Hydrogeologic Review | 30,000 |
| Scoping Study (PEA) | 150,000 |
| Midway Reporting Subtotal | $330,000 |
| Spring Valley Venture PreFeasibility Study | |
| Hydrology Studies & Test Wells | 2,125,000 |
| Geochemistry, including ARD | 982,000 |
| Geotechnical | 500,000 |
| Metallurgy | 1,070,000 |
| Mine Planning and Site Design | 700,000 |
| Permit Development | 150,000 |
| Archaeological, Community & Related | 285,000 |
| Environmental Studies | 875,000 |
| Land & Water Rights | 3,100,000 |
| Condemnation Drilling | 500,000 |
| Subtotal | $ 10,287,000 |
| Midway Share at 25% | $ 2,571,750 |
| Spring Valley Venture Exploration | |
| Exploration Program 2014 - 2015 | 12,000,000 |
| Subtotal | $ 12,000,000 |
| Midway Share at 25% | $ 3,000,000 |
| Total Budget (Midway Share) | |
| Total Budget | $5,901,750 |
September 9, 2014 | 9 |
|
Midway Gold Corp. Spring Valley Project | Certificate of Authors NI 43-101 Technical Report on Resources |
| 2. | INTRODUCTION AND TERMS OF REFERENCE |
Gustavson Associates, LLC (Gustavson) was commissioned by Midway Gold Corp. (Midway) to prepare an update to the Mineral Resources and resulting Technical Report on Resources for the Spring Valley Project (or the Project) site in Pershing County, Nevada. The purpose of this report is to present the findings of the resource estimation in accordance with Canadian National Instrument 43-101 Standards of Disclosure for Mineral Projects (NI 43-101), NI 43-101 Form F1, and Canadian Institute of Mining, Metallurgy and Petroleum (CIM) “Best Practices and Reporting Guidelines.” This Technical Report is part of an ongoing effort by Midway to develop the Spring Valley Project.
This report is prepared to fulfill Midway’s disclosure requirements to the Toronto Stock Exchange. It should be noted that this report is independent of and distict from any parallel resource estimates or scoping studies being carried out by the Spring Valley Venture, or by Barrick as operator.
Items 15 through 22 of Form 43-101F1 (Mineral Reserve Estimates, Mining Methods, Recovery Methods, Project Infrastructure, Market Studies and Contracts, Environmental Studies, Permitting and Social or Community Impact, Capital and Operating Costs, and Economic Analysis, respectively) are not required for a Technical Report on Resources and are not included in this report.
| 2.1 | Qualifications of Consultants |
The Qualified Persons (QP’s) responsible for this report are:
- William J. Crowl, R.G., QP MMSA, Vice President, Mining, Gustavson is a QP as defined by NI 43-101 and is responsible for Sections 1-8, and 15-19.
| · | Zachary J. Black, SME-RM, Associate Resource Geologist, Gustavson is a QP as defined by NI 43-101 and is responsible for Sections 9-12 and 14. |
- Deepak Malhotra, PhD., SME-RM, President, RDi is a QP as defined by NI 43-101 and is responsible for Section 13.
| 2.1.1 | Details of Inspection |
Gustavson Associates representatives William J. Crowl and Zachary J. Black visited the Spring Valley Project on October 24, 2013. While on site, Mr. Crowl and Mr. Black conducted general geologic field reconnaissance and discussed in detail core drilling operations, sampling, and transportation with Barrick and Midway personnel. Mr. Crowl visited the Spring Valley project again on June 18th, 2014 and directly observed drilling and sampling practices at the project site. For the 2014 drill program, core splitting and sampling are being carried out at Barrick’s Turquoise Ridge Facility. Accordingly, Mr. Crowl visited Turquoise Ridge on June 17th 2014 to directly observe the splitting and sampling procedures being employed for the 2014 Spring Valley drill program.
September 9, 2014 | 10 |
|
Midway Gold Corp. Spring Valley Project | Certificate of Authors NI 43-101 Technical Report on Resources |
| 2.1.2 | Sources of Information |
The information, opinions, conclusions, and estimates presented in this report are based on the following:
- Information and technical data provided by Midway;
- Observations made by Qualified Persons on site;
- Review and assessment of previous investigations;
- Assumptions, conditions, and qualifications as set forth in the report; and
- Review and assessment of data, reports, and conclusions from other consulting organizations and previous property owners.
Gustavson sourced information from referenced documents as cited in the text and those summarized in Section 19, References, of this report.
| 2.2 | Effective Date |
This report was completed based upon information available at the effective date of this report, August 1, 2014.
| 2.3 | Units of Measure |
Unless stated otherwise, all measurements reported here are in imperial units, tons are short tons, and currencies are expressed in constant US dollars. Precious metal content is reported in troy ounces per short ton (oz/t).
September 9, 2014 | 11 |
|
Midway Gold Corp. Spring Valley Project | Certificate of Authors NI 43-101 Technical Report on Resources |
Common Units
| Above mean sea level | amsl |
| Cubic foot | feet3 |
| Cubic inch | in3 |
| Cubic yard | yd3 |
| Day | d |
| Degree | ° |
| Degrees Fahrenheit | °F |
| Foot | feet |
| Gallon | gal |
| Gallons per minute (US) | gpm |
| Grams per tonne | g/t |
| Greater than | > |
| Hectare | ha |
| Hour | h |
| Inch | " |
| Kilo (thousand) | k |
| Less than | < |
| Micrometre (micron) | µm |
| Milligram | mg |
| Ounces per ton | oz/t |
| Parts per billion | ppb |
| Parts per million | ppm |
| Percent | % |
| Pound(s) | lb |
| Short ton (2,000 lb) | st |
| Short ton (US) | t |
| Specific gravity | SG |
| Square foot | feet2 |
| Square inch | in2 |
| Yard | yd |
September 9, 2014 | 12 |
|
Midway Gold Corp. Spring Valley Project | Certificate of Authors NI 43-101 Technical Report on Resources |
Metric Conversion Factors (divided by)
| Short tons to tonnes | 1.10231 |
| Pounds to tonnes | 2204.62 |
| Ounces (Troy) to tonnes | 32,150 |
| Ounces (Troy) to kilograms | 32.150 |
| Ounces (Troy) to grams | 0.03215 |
| Ounces (Troy)/short ton to grams/tonne | 0.02917 |
| Acres to hectares | 2.47105 |
| Miles to kilometres | 0.62137 |
| Feet to metres | 3.28084 |
|
| |
Abbreviations
| American Society for Testing and Materials | ASTM |
| Absolute Relative Difference | ARD |
| Atomic Absorption Spectrometry | AAS |
| Bureau of Land Management | BLM |
| Canadian Institute of Mining and Metallurgy | CIM |
| Diamond Drill | DD |
| Global Positioning System | GPS |
| Internal Rate of Return | IRR |
| Metallic Screen Fire Assay | MSFA |
| National Instrument 43-101 | NI 43-101 |
| Nearest Neighbour | NN |
| Net Smelter Royalty | NSR |
| Net Present Value | NPV |
| Probability Assigned Constrained Krigging | PACK |
| Reverse Circulation | RC/RCV |
| Rock Quality Designation | RQD |
| Selective Mining Unit | SMU |
| Universal Transverse Mercator | UTM |
| |
September 9, 2014 | 13 |
|
Midway Gold Corp. Spring Valley Project | Certificate of Authors NI 43-101 Technical Report on Resources |
| 3. | RELIANCE ON OTHER EXPERTS |
During preparation of this report, Gustavson fully relied upon information provided by Midway regarding property ownership, mineral tenure, permitting, and environmental liabilities as described in Items 4 and 5 of this report.
Midway relies upon the accuracy and completeness of data provided by Barrick pursuant to the Exploration, Development, and Joint Operating Agreement dated March 9, 2009.
Based on the review conducted in 2011 and the further efforts documented in this report, Gustavson considers that the data provided by Barrick is sufficient for the purposes of a resource estimate.
| 4. | PROPERTY DESCRIPTION AND LOCATION |
| 4.1 | Property Location |
The Spring Valley property is located in Pershing County, Nevada 20 miles northeast of Lovelock within the Spring Valley Mining District. It is situated three miles north of the Rochester silver-gold mine in the Humboldt Range. The Spring Valley deposit lays 100% within the Spring Valley area of interest and is within the control of Midway and Barrick’s joint venture (the “Spring Valley Venture”). The Participants directly control approximately 10,140 gross acres on 642 contiguous unpatented lode and placer mining claims plus 1,550 gross acres of fee land.
The Property is located on the USGS Lovelock 1:100,000 scale topographic map and the USGS Rochester and Fitting 1:24,000 scale, 7.5 minute series quadrangle maps. It is centered at latitude 40° 20’ North and longitude 118° 08’ West. The principal area of known mineralization on the Spring Valley property is located within the southern half of Sections 34 and 35, Township 29 North, Range 34 East (T29N, R34E) Mount Diablo Base and Meridian (MDBM). Mineralization also occurs at the Limerick target in Section 4, Township 28 North, Range 34 East (T28N, R34E) MDBM; at the Golden Gate target in Section 8, T28N, R34E; and at the American Canyon target in Section 14, T28N, R34E.
Unpatented mining claims are kept active through payment of a maintenance fee due on 31 August of each year. A complete list of claims is presented in Appendix A.
September 9, 2014 | 14 |
|
Midway Gold Corp. Spring Valley Project | Certificate of Authors NI 43-101 Technical Report on Resources |
| 4.2 | Agreements and Royalties |
| 4.2.1 | Barrick Agreement |
On March 9, 2009, Midway and Barrick Gold Exploration Inc., a wholly owned subsidiary of Barrick Gold Corporation (“Barrick”), signed an agreement for the exploration, development, and eventual joint operating activities at the project. On Nov 15, 2013, Barrick completed the $38 million expenditure required to earn a 70% interest at Spring Valley. As of Feb 24, 2014, the companies completed formation of the joint venture (the “Spring Valley Venture”) with Barrick holding a 70% interest and Midway holding a 30% interest.
On July 9, 2014, Midway elected to have Barrick carry Midway to a production decision and arrange financing for Midway’s share of mine construction expenses. The carrying and financing costs plus interest are to be recouped by Barrick from 90% of Midway’s share of production once production has been established. Accordingly, upon completion of construction of the mine, Barrick will earn an additional 5% (75% total interest.)
| 4.2.2 | Agreements |
The property agreements for the Spring Valley project are summarized in the table below. The table documents the nature of title, obligations to retain the property, royalties, payments, and expiration dates of the agreements. Claims are unpatented mining claims on land administered by the Bureau of Land Management.
September 9, 2014 | 15 |
|
Midway Gold Corp. Spring Valley Project | Certificate of Authors NI 43-101 Technical Report on Resources |
Table 4-1 Summary of Spring Valley Property Agreements
| Ownership | Agreement Date | Expiry | Owner (source) | Claims | Gold Royalty | Approximate Acreage* | Payments |
| Optioned | 10/30/2006 | 10/30/2016 (may be extended ) | Chabino | 2 | 3% NSR | 42 | $6,000/yr |
| Optioned | 6/10/2007 | 6/10/2017 purchase complete | G. Duffy | 2 | - | 42 | $12,000/yr plus periodic option payments |
| Optioned | 4/25/2006 | 4/25/2016 (may be extended) | L. Duffy | 12 | 3% NSR | 248 | $36,000/yr |
| Optioned | 7/17/2006 | 7/17/2016 (may be extended) | Rowe and Stoeberl | 46 | 3% NSR | 951 | $20,000/yr |
| Owned | 9/10/2003 | - | Midway Gold (Echo Bay) | 28 | 2% NSR | 579 | - |
| Owned | 1/25/2006 | - | Midway Gold (Coeur) | 98 | 3% NSR | 2087 | - |
| Owned | 7/3/2003, amended 8/15/2003 | - | Midway Gold (Schmidt) | 44 | 2-7% NSR | 909 | - |
| Owned | - | - | Midway Gold | 410 | - | 8452 | - |
| Owned | 5/5/2006 | - | Midway Gold (Seymork) | Fee | 3% NSR | 320/770 | - |
| Owned | 9/7/2005 | - | Midway Gold (NLRC) | Fee | - | 544/0 | - |
| Owned | 8/29/2006 | - | Midway Gold (Sentman) | Fee | - | 40/10 | - |
| Leased | 12/2/2010 | 12/2/2016 (may be extended) | Barrick Agreement with Third Party | Fee | 3% NSR | 0/544 | $300,000/yr |
|
0/76
0/120 | |||||||
| Owned | 10/01/2010 | Barrick Agreement with Third Party | Fee | - | 76/0 | - | |
| *Surface/Mineral |
| 4.3 | Environmental Liabilities |
Environmental liabilities at the property are limited to the construction of drill pads and roads, drilling, closure and reclamation of the currently permitted drilling program. This program is bonded with NDEP and the BLM. As work plans detailing the work, and reclamation cost estimates utilizing the states Standardized Reclamation Cost Estimator (SRCE), or equivalent, are required, the bond is considered adequate for the liability. Other potential environmental liabilities include the inadvertent impact of an unidentified cultural site or the allowance of invasion by a weedy species. The potential for impacting a cultural site or allowing the invasion of weedy species is considered low given the requirements for cultural surveys and the BLM’s Standard Operating Procedures (SOPs), which include general protection procedures to preclude weedy invasion. The potential for impacts to rangeland, impacts due to a hazardous or solid waste release, impact to water resources or impacts to a wetland is considered extremely low given the permitting requirements, SOPs, and Barrick’s operating practices.
September 9, 2014 | 16 |
|
Midway Gold Corp. Spring Valley Project | Certificate of Authors NI 43-101 Technical Report on Resources |
| 4.4 | Permits |
According to the NDOM, all mining operations in Nevada are required to have:
| · | Legitimate mining claims registered with the BLM, or ownership or control of mineral rights on private land; |
| · | An approved Plan of Operation from the BLM, the U.S. Forest Service or the Nevada Division of Environmental Protection, (NDEP); and |
| · | Necessary state permits. |
Spring Valley Venture exploration activities are permitted under a Plan of Operations (POO) approved by the BLM in July 2007, and Reclamation Permit No. 0258 approved by the NDEP in December 2006. All of permits and approvals, and the bonds, were transferred to Barrick in 2009. A new or amended POO will be required if disturbances beyond the currently approved 75 acres are necessary.
The latest NDEP/BLM Annual site inspection was conducted July 8th, 2014. No issues were reported by the agencies.
Water for exploration drilling is supplied by two water wells drilled under a temporary grant of water rights from the Nevada Division of Water Resources. The current 180 Day permit is in effect as of April 17th, 2014.
Table
4-2 provides a general summary of permits required by Federal State and Local government entities for mining or milling operations
in the state of Nevada.
September 9, 2014 | 17 |
|
Midway Gold Corp. Spring Valley Project | Certificate of Authors NI 43-101 Technical Report on Resources |
Table 4-2 Agency Permits and Authorizations*
| Permit/Authorization | Agency |
| Federal | |
| Activities in Wetlands and/or Waters of the U.S. | U.S. Army Corps of Engineers |
| Amended Exploration Plan of Operations | BLM |
| Endangered Species Act Compliance | U.S. Fish and Wildlife Service |
| Mine Plan of Operations | BLM |
| Notice of Commencement of Operation | Northern Nevada Mine Safety & Health Administration |
| Purchase, Transport, or Storage of Explosives | Bureau of Alcohol, Tobacco and Firearms, for Northern Nevada |
| Right of Way for Electrical Transmission on BLM-Administered Land | BLM |
| Road Access (R/W) on BLM Administered Land | BLM |
| Use of BLM-Administered Land | BLM |
| State | |
| Air Quality Operating Permit | Nevada Division of Environmental Protection, Bureau of Air Quality |
| Annual Status and Production Report | Nevada Division of Minerals |
| Approval to Operate a Solid Waste System | Nevada Division of Environmental Protection, Bureau of Waste Management |
| Department of Transportation | Nevada Department of Transportation |
| Fire and Line Safety | Nevada State Fire Marshall |
| Ground Water Permit | Nevada Division of Environmental Protection, Bureau of Water Pollution Control |
| Hazardous Materials Permit | Nevada State Fire Marshal Division, Hazardous Materials Section |
| Historic Preservation | Nevada Historic Preservation Office |
| Mine Registry Forms | Nevada Division of Minerals |
| Industrial Artificial Pond Permit | Nevada Division of Wildlife |
| Mineral Exploration Hole Plugging | Nevada Division of Water Resources |
| Mining Reclamation Permit | Nevada Division of Environmental Protection – Bureau of Mining Regulation and Reclamation, Reclamation Branch |
| Notification of Opening & Closing Mines | Nevada State Mine Inspector |
| Permit to Appropriate the Public Waters | Nevada Division of Water Resources |
| Permit for Occupancy (Encroachment Permit) | Nevada Department of Transportation |
| Permit for Sanitation Facilities | Nevada State Health Division Bureau of Health Protection Services |
| Protection of Wildlife | Nevada Division of Wildlife |
| Stormwater General Permit | Nevada Division of Environmental Protection, Bureau of Water Pollution Control |
| Surface Disturbance Permit | Nevada Division of Environmental Protection – Bureau of Air Pollution Control |
| Water Pollution Control Permit | Nevada Division of Environmental Protection – Bureau of Mining, Regulation and Reclamation, Regulation Branch |
| Local** | |
| Building Permit | |
| General Plan | |
| Special Use Permit |
* Permits listed are general in nature; all items listed are not necessarily specific to Midway or Barrick.
** Local permits presented are general in nature.
September 9, 2014 | 18 |
|
Midway Gold Corp. Spring Valley Project | Certificate of Authors NI 43-101 Technical Report on Resources |
Barrick continues to move forward with conducting environmental studies on the project property. Gustavson knows of no other significant factors or risks that may affect access, title, or the ability to perform work on the Spring Valley property.
| 5. | ACCESSIBILITY, CLIMATE, LOCAL RESOURCES, INFRASTRUCTURE AND PHYSIOGRAPHY |
| 5.1 | Accessibility |
The Spring Valley property is accessed by Nevada State Route (SR) 50 (also known as Lovelock-Unionville Road), which extends eastward from US Interstate 80 at exit 119. SR 50 also serves as the main access to the Rochester Mine until a turnoff at Spring Valley Pass. Once in Spring Valley, access to the various parts of the Property is by dirt road. Alternatively, access is possible from the Buena Vista Valley to the east through Spring Valley Canyon on SR 50.
The nearest town to the Property is Lovelock, Nevada, which is situated along US Interstate 80 and hosts a population of 1,895 (Census 2012 data). The nearest city is Reno, Nevada, approximately 120 miles to the southwest, which hosts a population of 231,027 (Census 2012 data).
September 9, 2014 | 19 |
|
Midway Gold Corp. Spring Valley Project | Certificate of Authors NI 43-101 Technical Report on Resources |
| 5.2 | Climate |
The climate in the Spring Valley area is typical for northwestern Nevada. Average monthly high temperatures range from 82 to 94° F in the summer and 42° to 55° F in the winter. Yearly rainfall averages approximately 6 inches with nearly uniform distribution from October through June. July, August, and September are typically hot and dry months; December, January, and February receive the bulk of the snowfall (Desert Research Institute, 2010).
Exploration and operations are possible year round, although snow levels in winter and wet conditions in late autumn and in spring can make travel on dirt and gravel roads difficult.
| 5.3 | Local Resources and Infrastructure |
Power lines cross the property and ground water is abundant as evidenced by artesian wells in the main area of drilling. There is year-round road access directly to the project via Nevada state highway 50. The interstate (I80) runs approximately 10 miles west of the property. There is an adequate workforce in the surrounding region and the town of Lovelock. Northern Nevada is home to many gold mining operations with all associated support and supplies.
Coeur Mining’s Rochester operation is situated on adjacent claims to the south of the Spring Valley Project and has the necessary infrastructure to support their operation on site. Electrical power is supplied to the site by a public utility company (NV Energy) via a 69KV overhead transmission line.
Emergency services, including law enforcement, are located approximately 25 miles from the site in Lovelock. Regulatory and other off-site services are located throughout the county and region and are typical of standard United States agencies.The Spring Valley Venture controls sufficient surface rights within Spring Valley and the lower Buena Vista basin to support an open pit operation and the associated waste rock disposal and heap leach facility.
| 5.4 | Physiography |
Spring Valley is a large (approximately two square miles) intermontane basin in the central part of the Humboldt Range. The valley floor slopes gently to the east and ephemeral streams on its surface drain into Spring Valley Canyon at its eastern margin. Elevation at the Property ranges from 5,120 to 6,040 feet above mean sea level and the topographic relief can be characterized as gentle to moderate.
Vegetation is typical of the Basin and Range physiographic province. The Property is covered by sagebrush, grass, and various other desert shrubs.
September 9, 2014 | 20 |
|
Midway Gold Corp. Spring Valley Project | Certificate of Authors NI 43-101 Technical Report on Resources |
| 5.5 | Water Rights |
Proposed mining operations at Spring Valley will require significant water rights for dust reduction, exploration drilling, process water, as well as potable water for domestic use and site facilities. The Spring Valley Venture has identified properties within the Buena Vista Valley with sufficient water rights to support mine operations and is in the process of securing such rights. Regulatory approval will be required to modify the water rights for use by the mine.
| 6. | HISTORY |
Gold, silver, lead, mercury, copper, antimony, and sericite-pyrophyllite have been produced from the Spring Valley Mining District since its discovery in 1868 (Tingley, 1992). Placer gold was discovered in 1875 and was worked extensively during the period 1880-1890 (Johnson, 1977). The placers are said to have been the most productive in Nevada: placer production from Spring Valley and American Canyons were estimated at $10 million (Ransome, 1909). The gravel deposits were up to 100 feet in depth or more and the gold recovered from them was generally coarse, though fine-grained gold was present and likely more abundant (Johnson, 1977).
The Wabash lead-silver mine, located on the eastern margin of the Property, was worked during the period of 1935 to 1938. Production recorded for 1938 was 170 tons of ore containing 1 oz gold, 6,774 oz silver, 651 lb copper, and 9,514 lb lead (Johnson, 1977). Mineralization at the Wabash mine consists of argentiferous galena and sphalerite in the matrix of intensely brecciated rocks in a fault zone.
Modern exploration at Spring Valley began in 1996 by Kennecott. Four reverse circulation (RC) holes, totaling 2,220 feet, were drilled across the basin in an effort to discover the source of the placer gold in Spring Valley Canyon. Hole KSV-2 intersected 40 feet grading 0.023 oz/t gold at the southeast edge of what is now known as the Pond Zone.
Echo Bay acquired the property in 2000 and drilled ESV-2, intersecting 145 feet grading 0.075 oz/t gold. Subsequent drilling by Echo Bay focused on step-out drilling from ESV-2, coring the mineralized zone and drilling exploration targets to the northwest. During the 2001-2002 drill campaign, Echo Bay completed 19 RC holes totaling 10,940 feet and 2 diamond drill (DDH) holes totaling 1,653 feet.
There were no historic mineral resources estimated for the Spring Valley project prior to Midway’s acquisition of the property.
September 9, 2014 | 21 |
|
Midway Gold Corp. Spring Valley Project | Certificate of Authors NI 43-101 Technical Report on Resources |
| 7. | GEOLOGICAL SETTING AND MINERALIZATION |
| 7.1 | Regional Geologic Setting |
The Spring Valley property is located in the Humboldt Range, a north-south oriented, up-thrown fault block (horst) bounded on the west by the Humboldt River valley and on the east by Buena Vista Valley. Quaternary alluvial deposits fill the intermontane basins and alluvial valleys.
The bedrock geology of the Humboldt range within 20 miles of the Spring Valley property consists of Triassic shales and carbonate rocks, a thick sequence of Permo-Triassic intermediate to felsic volcanic rocks, and a north-south trending belt of Tertiary volcanic rocks (Figure 7-1). Triassic leucogranite and Cretaceous granodiorite locally intrude the Permo-Triassic volcanic package.
The oldest rocks exposed in the central Humboldt Range are a series of Permo-Triassic volcanic and metavolcanic rocks, named the Koipato Group, that include, from oldest to youngest, the Limerick Greenstone, the Rochester Rhyolite, the Weaver Rhyolite, and their intrusive equivalents (rhyolite porphyry and leucogranite). The Koipato Group is interpreted as representing bimodal volcanism in a back-arc setting that was subsequently accreted onto the continental margin (LeLacheur et al., 2009). Contacts of the Koipato Group with the Triassic Natchez Pass and Prida Limestones to the north, west and on the eastern flank of the range are all fault contacts. Cretaceous granodiorite locally intruded the Permo-Triassic units. Quaternary alluvial and colluvial deposits unconformably overlie the older bedrock units. North-south, north-northwest, and north-northeast normal faults are the dominant structural features in the region.
The Humboldt Range in the region surrounding the Spring Valley project is well-mineralized. Styles of mineralization in the central Humboldt Range include base and precious metal vein and vein-stockwork mineralization and Tertiary sediment-hosted gold deposits. Examples of vein/vein stockwork systems include Spring Valley, Rochester, Nevada Packard, the Unionville district and the Dun Glen district. Examples of Tertiary sediment-hosted gold mineralization in the region include Florida Canyon, Relief Canyon, Standard, and Willard.
September 9, 2014 | 22 |
|
Midway Gold Corp. Spring Valley Project | Certificate of Authors NI 43-101 Technical Report on Resources |

Figure 7-1 Geology of the Humboldt Range
September 9, 2014 | 23 |
|
Midway Gold Corp. Spring Valley Project | Certificate of Authors NI 43-101 Technical Report on Resources |
| 7.2 | Local Geologic Setting |
The known Spring Valley mineral system is beneath an intermontane basin filled with post-mineral Quaternary alluvial deposits, thereby masking the bedrock geology immediately overlying or containing the mineralization. At the scale of the Spring Valley property position, the bedrock units are distributed in blocks aligned approximately north-south. The bedrock geology is dominated by the Limerick Formation in the western one-third of the property, the Rochester Formation in the central and eastern half of the property, and the Natchez Pass Limestone in the extreme northeast corner of the property (Figure 7-2). At this scale, the geology is segmented by a number of faults: a relatively older north to northeast trending set including the West Spring Valley, Limerick and Black Ridge Faults; and, northwest trending, steeply dipping cross faults with oblique or lateral offsets that displace the older north to northeast trending faults. The West Spring Valley fault is interpreted as a steeply east dipping normal fault, whereas the Black Ridge and Limerick faults are interpreted as moderate to high angle normal faults with westerly dips. The Limerick fault may be listric in character, with flattening dip at depth. East-west and northeasterly faults are also mapped, but are not part of the predominant fabric on the property.
The bedrock geology beneath the Quaternary alluvial cover has been interpreted and compiled by Midway and other workers based on drill hole information. The surficial and subsurface bedrock geology within the Spring Valley intermontane basin is described below as modified from Stiles (2008), LeLacheur et al. (2009), Neal (2004), and Neal & LeLacheur (2010).
The Spring Valley basin is completely covered by between 50 and 375 feet of Quaternary alluvium, consisting mainly of valley fill gravels and mud flow deposits (Figure 7-2). Bedrock geology beneath the alluvium features northeast trending felsic volcanic and volcaniclastic rocks intruded by a feldspar porphyry intrusion at depth (Figure 7-2). The rhyolitic vent complex is interpreted as coeval with development of the Rochester and/or Weaver Rhyolites, and is thereby believed to be Triassic in age.
Structures in the alluvium covered area are interpreted primarily from logging of drill core and chips and, to a lesser degree, from geophysical surveys, mapping and projection of faults observed in the hills surrounding the basin. Faults within the area covered by alluvium are difficult to document, and are inferred from offsets in geologic units and/or trends of mineralized/altered zones and gold grade distributions. Many faults appear to have complex, long-lived histories, and may have developed prior to or at the time of emplacement of the Spring Valley rhyolitic vent complex, with reactivations during accretion of the Koipato Group, and Basin and Range development. Many structures thereby appear syn- to late-mineral relative to alteration, mineralization and intrusion. The lack of detail regarding the timing and location of significant structures impacts the modeling of the associated gold mineralization, making determination of modeling domains difficult. Gustavson recommends a better understanding of the structural geology and its impact on the distribution of mineralization, alteration and rock types be developed.
September 9, 2014 | 24 |
|
Midway Gold Corp. Spring Valley Project | Certificate of Authors NI 43-101 Technical Report on Resources |

Figure 7-2 Bedrock Geology Map of the Spring Valley Project
September 9, 2014 | 25 |
|
Midway Gold Corp. Spring Valley Project | Certificate of Authors NI 43-101 Technical Report on Resources |
| 7.3 | Lithologic Units |
Lithologies recognized under the alluvium covered area at the Spring Valley prospect are shown in conceptual cross section in Figure 7-3, and are listed below.
| 7.3.1 | Quaternary Alluvium (Qal) |
Alluvial gravels with coarse angular clasts of local lithologies cover much of the intermontane basin. Gold mineralization, possibly placer deposits, has been identified in places at the base of this unit but this mineralization is not included in the mineral resource estimate.
| 7.3.2 | Limerick Greenstone: |
The Limerick Greenstone is comprised of a thick pile of intermediate to mafic flows and interbedded volcaniclastic sediments. The base of the sequence is not exposed on the project. Felsic sills and dikes intrude the greenstone. Small felsic flow domes of the Rochester Rhyolite are present in the upper part of the Limerick sequence.
At Spring Valley, the Limerick Greenstone can be divided into an upper greywacke, andesite flows, and intrusive gabbro. The upper greywacke is a fine- to coarse-grained, gray-green, chlorite-altered sandstone and mudstone. It has local cross bedding and variable thicknesses of fining-upward sequences that are common to submarine turbidite deposits. Thin interbeds of boulder-to-cobble conglomerate become increasingly common toward the top of the unit.
Underlying the greywacke is dark gray to black, fine-grained, conchoidally fractured andesite. This andesite has local phenocrysts of hornblende or plagioclase. Lithophysae are locally common. A dark green, fine grained mafic intrusive or gabbro is observed within the andesitic sequence. These sills or dikes contain fine crystals of hornblende and/or pyroxene and, less commonly, plagioclase. No large bodies of this unit have been identified to date.
All of the greenstone rocks have a weak metamorphic overprint of gray sericite, gray-green chlorite, and minor green epidote. The green coloration is caused by a strong chlorite content that may have formed as a regional propylitic alteration. Foliation is poorly developed on the east side of Spring Valley. A more pronounced phyllitic foliation is observed on the west side of the valley. Veins and local replacement pods of calcite are common and may be related to mineralization. Quartz-carbonate-chlorite veining is common. The chlorite in the veins appears to be psuedomorphs after tourmaline. These veins do not usually carry gold.
| 7.3.3 | Rochester Rhyolite |
The Rochester Rhyolite is comprised of massive and flow banded rhyolite flows, flow domes, tuffs, tuffaceous sediments, and a coarse, volcanic-derived breccia interpreted to be part of a diatreme vent or eruption apron. All of these rocks have a high K-feldspar content. Felsic dikes and sills which are found throughout the Rochester are thought to be intrusive equivalents to the volcanic flows.
September 9, 2014 | 26 |
|
Midway Gold Corp. Spring Valley Project | Certificate of Authors NI 43-101 Technical Report on Resources |
Lithologies identified from drilling within the Rochester at Spring Valley include:
| 7.3.4 | Upper Rhyolite |
The upper rhyolite is a dark brown to orange, massive rhyolite. Small plagioclase phenocrysts, larger K-feldspar phenocrysts and, rarely, small quartz phenocrysts are in a matrix of microcrystalline quartz and K-feldspar. Thin interbeds of tuffaceous sandstones or conglomerate are common. K-feldspar spherulites (up to 3 cm across), lithic fragments (up to 1-2 cm across), and more rarely, flow-banding are locally present within the unit. Perlitic cracks in the matrix were observed in thin section. In outcrop, this unit is locally bleached, or moderately sericitized, and weathers to a burnt brown color. The top of the unit has been removed by erosion, but in the area drilled the remaining unit is between 250 and 300 feet thick.
| 7.3.5 | Siltstone |
Directly beneath the upper rhyolite is 50 to 150 feet of white to gray-brown thinly bedded siltstone or fine sandstone. It is locally cross-bedded and has local graded bedding. Distribution of the siltstone in drill holes suggests it was deposited in a shallow lake or sea that formed between flow events. The unit contains abundant fine grained, disseminated tourmaline needles.
| 7.3.6 | WT Rhyolite |
The WT rhyolite is a dark gray, dark purple or dark-brown banded rhyolite that is a distinctive marker horizon in parts of the project. The unit is characterized by distinctive irregular and discontinuous flow banding that is often contorted. The flow banding forms from layers of darker gray microcrystalline quartz and K-feldspar alternating with lighter gray layers of mostly microcrystalline K-feldspar
The planar orientation of the flow banding where measured in outcrop or seen in oriented core commonly strikes 170°-190° with a near vertical dip. This is nearly perpendicular to the bedding orientation. In portions of the project area, the upper part of this unit is a massive, gray, lithic rhyolite with barely visible flow banding. Near mineralized areas, the flow banding is very pronounced where it is exaggerated by hydrothermal alteration.
September 9, 2014 | 27 |
|
Midway Gold Corp. Spring Valley Project | Certificate of Authors NI 43-101 Technical Report on Resources |
| 7.3.7 | Breccia/Conglomerate |
Underlying the WT Rhyolite is a breccia with large rounded to subangular clasts in a matrix of smaller rock fragments. It is largely clast-supported, and poorly sorted. Clasts include fragments of silicified limestone and a variety of intrusive and extrusive igneous rocks not seen elsewhere in Spring Valley, as well as local units. In one area, the breccia cuts upward through the WT rhyolite and part of the siltstone. Fragments of these rock types were observed deeper in the breccia. This feature was interpreted as a diatreme and was the focus of drilling in the early stages of the project. Adjacent to the pipe, breccia is conformably overlain by the WT rhyolite and is interpreted to be an eruption apron. The base of the breccia has been obliterated by intrusion of feldspar porphyry.
| 7.3.8 | Intrusive rocks |
The Rochester Rhyolite and Limerick Greenstone were intruded by a shallow, hypabyssal intrusion that underlies the volcanic rocks throughout most of Spring Valley. The intrusion has distinct feldspar phenocrysts in a fine-grained matrix and has been designated as the feldspar porphyry (FP). The top of the intrusion is very irregular and includes apophyses that form sills and dikes that extend into faults, and along contacts of the Limerick and Rochester rocks. The eastern margin of the intrusion formed a west-dipping dike along the Limerick fault between the Limerick Greenstone and Rochester Rhyolite. This dike is strongly mineralized.
Hand samples of the feldspar porphyry intrusion are dark brown or gray, with medium-grained, white feldspar phenocrysts in an aphanitic matrix. Fine-grained, black biotite phenocrysts are also usually present. The feldspar porphyry has not been dated isotopically, but textures and composition are similar to the Rochester Rhyolite. Other workers (Wallace, 1969) have mapped similar rocks in surface outcrop as being coeval with the Rochester Rhyolite.
West of Spring Valley a swarm of quartz feldspar porphyry sills cut the Limerick Greenstone. The sills have feldspar phenocrysts in a greenish aphanitic groundmass and locally contain fine grained quartz phenocrysts. Many of the sills have sericitic alteration and fine grained disseminated limonite after pyrite cubes. The sills consistently host sheeted quartz and quartz-tourmaline veins, some with anomalous gold values. These sills are similar in character to the dike on the eastern margin of the deposit area that grades into the feldspar porphyry in zones of strong alteration and gold mineralization.
Intrusive bodies of biotite-feldspar porphyry and plagioclase porphyry are found north and east of Spring Valley. These are thought to be related to the feldspar porphyry or Rochester Rhyolite, but are not mineralized nor well studied.
September 9, 2014 | 28 |
|
Midway Gold Corp. Spring Valley Project | Certificate of Authors NI 43-101 Technical Report on Resources |
Several small intrusive bodies east of the resource area are believed to be late-Cretaceous to Tertiary in age. Small exposures of hornblende diorite, monzonite, and granodiorite are surrounded by hornfelsed volcanic rocks. The hornblende diorite is a fine-grained porphyritic intrusion. The amphiboles are relatively unaltered and surrounded by a thin rim of ragged biotite. The amphiboles are intergrown with plagioclase and pyroxene phenocrysts in a fine-grained groundmass of plagioclase microlites and K-feldspar, with accessory magnetite. The magnetic signature of the hornblende diorite suggests that it could be over 800 meters across in the subsurface. Hornblende diorite with strong yellow-green sericite alteration of the hornblende has been observed adjacent to feldspar porphyry in deep drill samples on the east side of the gold occurrence.
September 9, 2014 | 29 |
|
Midway Gold Corp. Spring Valley Project | Certificate of Authors NI 43-101 Technical Report on Resources |
Spring Valley host rocks |
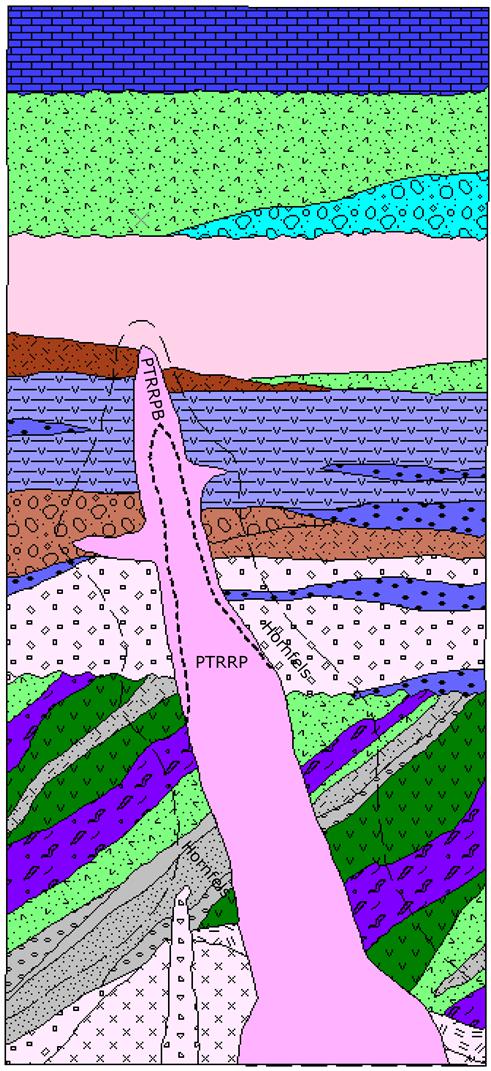
Figure 7-3 Conceptual Cross Section of Lithologies (Modified from Chadwick, 2012)
September 9, 2014 | 30 |
|
Midway Gold Corp. Spring Valley Project | Certificate of Authors NI 43-101 Technical Report on Resources |

Figure 7-3 (Continued), Legend (Modified from Chadwick, 2012)
September 9, 2014 | 31 |
|
Midway Gold Corp. Spring Valley Project | Certificate of Authors NI 43-101 Technical Report on Resources |
| 7.4 | Mineralization Style |
Quartz veining, alteration, and gold mineralization at Spring Valley are irregularly distributed throughout the favorable host rock area. Large intervals of dense quartz veining and pervasive alteration are interspersed with unmineralized and less strongly altered country rock.
Gold has been observed in quartz veins and in adjacent alteration selvages as disseminated free gold. Free gold is likely deposited on fracture surfaces as well. Relatively coarse gold (30 to 90 microns) is common and can be observed as free gold liberated by drilling (Figures 7-4 to 7-6). Most quartz veinlets are in the ½ inch to 4 inch size range with associated alteration selvages of a few feet to tens of feet wide, varying to areas of dense quartz veining with pervasive alteration.
The quartz veins are translucent, intergrown, coarse quartz crystals with few if any open spaces or fissures. In combination with the relatively much larger alteration selvages, the character of these veins suggests a mesothermal or plutonic origin. Epithermal-style veins have not been observed at Spring Valley.
Quartz veins commonly contain pyrite (2-10%), less commonly galena and traces of sphalerite, magnetite and visible gold. From a limited amount of trace element data collected from drill samples, there are low levels (a few tens of parts per million above background) of anomalous lead, zinc, and arsenic associated with the gold mineralization.
| 7.5 | Alteration |
There are several distinct types of alteration at Spring Valley, as listed below:
| 1) | Pervasive to fracture controlled quartz-sericite and quartz-sericite-pyrite alteration; |
| 2) | Strong pervasive to fracture controlled argillic alteration; |
3) Very strong clay and clay filled breccia formation;
| 4) | Pervasive to fracture controlled iron-carbonate alteration; |
| 5) | Pervasive to fracture-controlled hematite-quartz alteration. |
Gold zones are most pronounced in the quartz-sericite-pyrite zones and in the pervasive argillic zones, although gold is found in every alteration type.
Other types of alteration include quartz-tourmaline, and potassic. Tourmaline occurs as disseminated crystals in sediments and the diatreme breccia and as quartz-tourmaline veins. While gold is found in some quartz-tourmaline veins, tourmaline generally is not correlated with the gold. Locally, the introduction or remobilization of potassium is seen by fresh overgrowths on feldspar or fine secondary biotite. This potassic alteration style may be much more extensive than currently understood due to the high potassium content of the Rochester Rhyolite which may mask the introduction of new potassium as an alteration product.
September 9, 2014 | 32 |
|
Midway Gold Corp. Spring Valley Project | Certificate of Authors NI 43-101 Technical Report on Resources |
Carbonate alteration of the Limerick Formation greenstone rocks was observed locally adjacent to the Limerick fault. No direct correlation of carbonate alteration with gold mineralization was noted.

Figure 7-4 Coarse Gold from SV08-435 Drilled in the Big Leap Zone

Figure 7-5 Coarse Gold from SV08-410 at 310’
September 9, 2014 | 33 |
|
Midway Gold Corp. Spring Valley Project | Certificate of Authors NI 43-101 Technical Report on Resources |

Figure 7-6 Coarse Gold from SV08-436 Drilled at the South End of the Big Leap
| 7.6 | Geometry of Mineralization |
The gold mineralization forms an irregularly-shaped cap encompassing at least the upper portions of the feldspar porphyry and significant volumes of the overlying or adjacent lithologies. The feldspar porphyry contact is very irregular. It was emplaced into a series of faults and irregular contacts, and may have been displaced by later fault movements. Overall the mineralization trends N20E to N30E and has the appearance of plunging 5-10 degrees to the north, though some of this plunge may be due to later fault-block subsidence.
September 9, 2014 | 34 |
|
Midway Gold Corp. Spring Valley Project | Certificate of Authors NI 43-101 Technical Report on Resources |
Mineralization has been intercepted in drilling over a strike length of 7,500 feet and is open in both strike directions. Mineralization averages about 2,300 feet wide. The shallowest mineralization is found at the top of bedrock beneath 50 feet of alluvium. Deep core drilling has intersected gold mineralization as deep as 1,500 feet below the surface.
Quartz vein strike and dip directions recorded from oriented drill core show several distinct orientations. The most prominent orientation strikes N74E, dipping 60 degrees south. This principle vein orientation is oblique to the overall trend of the gold mineralization at Spring Valley.
| 8. | DEPOSIT TYPES |
The Spring Valley deposit is hosted within a porphyry intrusion and overlying felsic volcanic rocks. Gold mineralization was controlled by steeply dipping, N20E to N30E- trending, deep-seated faults, as well as at contacts, deformation structures, and in permissive host rocks within a local graben. The mineralization is associated with relatively thin, crystalline quartz veins that have large alteration selvages. In areas of dense quartz veining, the alteration selvages coalesce into regions of pervasively altered and veined rock.
There are characteristics of the deposit which are similar to porphyry-hosted systems, but there are significant differences. There are also characteristics similar to orogenic type gold deposits, possibly related to accretion of the Koipato group. (Neal & LeLachleur, 2010). It is possible that there are multiple fluid phases influencing gold deposition in the system. Additional work is needed to better define the source of mineralizing fluids and to refine the deposit model.
Gold has been detected in gravels immediately above the bedrock-alluvium contact, indicating that placer gold deposits exist at and above the paleo-bedrock surface. Gustavson has not included an evaluation of the alluvium hosted deposits in this report.
| 9. | EXPLORATION |
Exploration work carried out by MGC and Barrick on the Spring Valley property has been and continues to be dominated by drilling. MGC and Barrick have conducted extensive geological mapping and surface geochemical sampling campaigns in the surrounding hills and have conducted limited geophysical surveys in the basin to guide drilling. Early exploration work by previous operators included small-scale surface geochemical, geophysical surveys and drilling.
September 9, 2014 | 35 |
|
Midway Gold Corp. Spring Valley Project | Certificate of Authors NI 43-101 Technical Report on Resources |
| 9.1 | Pre-MGC Exploration |
The Spring Valley property was explored by previous operators from 1996 to 2002. A summary of exploration drilling by Kennecott and Echo Bay at Spring Valley is provided in the drilling summary, Item 11. In addition to drilling, Echo Bay used geophysics, surface mapping, and rock chip sampling to explore the property and define drill targets.
| 9.2 | MGC Exploration |
MGC has been active in all phases of exploration work on the Spring Valley property since acquiring the project in 2003, and prior to consummating the exploration agreement with option to joint venture with Barrick Gold Exploration Inc. in early 2009. Surface geochemistry, geologic mapping, and geophysical surveys have all helped to identify drill targets both proximal to the Spring Valley discovery and in new exploration targets spread over the property.
| 9.2.1 | Surface Geochemistry |
Rock and soil sampling were carried out largely on the margins of the Spring Valley discovery area. An extensive program of over 5,000 soil samples was completed over the property in 2006 and 2007. Soils were sieved to the -10+80 mesh size fraction and assayed at ALS Chemex for gold by standard fire assay methods on a 30g subsample and an additional 50 elements by aqua regia digestion of a 0.5 gram subsample and ICP finish.
| 9.2.2 | Rock Samples |
Rock chip samples were taken during reconnaissance geological traverses, prospect mapping and target delineation. Between 2003 and 2009, MGC collected a total of 1540 rock samples. Rock chip samples were crushed to 70% passing 2mm with a nominal 250 gram split pulverized to 85% passing 75μm, and assayed by the same procedures as the soil samples.
| 9.2.3 | Geological Mapping |
Geological mapping was completed by MGC geologists and consultants covering six square miles surrounding the Spring Valley prospect area. Detailed mapping of selected exploration target areas has also been carried out. Mapping helped clarify the property geological setting, identified structural trends helpful in targeting drilling, and identified prospective areas for follow-up exploration work.
| 9.2.4 | Geophysical Surveys |
Geophysical surveys have included a CSAMT survey in 2003, and ground based gravity and magnetic surveys. J.L. Wright Geophysics of Spring Creek, Nevada, interpreted the results.
September 9, 2014 | 36 |
|
Midway Gold Corp. Spring Valley Project | Certificate of Authors NI 43-101 Technical Report on Resources |
Several anomalous features were interpreted to represent silicified bodies at depth (Wright, 2004).
The results of the geophysics, geologic mapping and geochemical surveys have helped to identify additional exploration targets on the property peripheral to the Spring Valley resource..
| 9.3 | Barrick Exploration |
Barrick has conducted additional exploration programs at Spring Valley from 2009 to 2013. This has included additional geologic mapping, collecting additional rock chip and soil samples as well as drilling.
| 9.4 | Exploration Targets |
Exploration at Spring Valley has been directed at identifying areas for resource expansion and new resource discovery. Numerous exploration targets outside of the resource area have been identified based on the results of soil and rock sampling, analysis of geophysical data, and improved geological mapping. Many of these targets remain untested by drilling and an expansion of the current permit boundary is needed to test them.
Examples of exploration targets include:
| · | Mineralized zones in the resource that can be projected to the north and northeast |
| · | Cross structures cutting the resource area, such as the Wabash fault, that can be projected to the East along creeks mined for placer gold |
| · | Soil and rock chip gold anomalies on Gold Mountain, south of the resource |
| · | Soil and rock chip gold anomalies along the Fitting fault |
| · | Buried intrusive rocks east of the resource |
| 10. | DRILLING |
| 10.1 | Type and Extent |
This section provides a synopsis of all drilling conducted on the Spring Valley resource area. The Spring Valley resource area has been drilled with a total of 672 holes totaling 603,731 feet, including 531 Reverse Circulation (RC) drill holes totaling 428,500 feet and 141 diamond core holes totaling 173,011 feet (see Table 10-1).
September 9, 2014 | 37 |
|
Midway Gold Corp. Spring Valley Project | Certificate of Authors NI 43-101 Technical Report on Resources |
Table 10-1 Summary of Drilling Campaigns in the Spring Valley Resource Area
| Years | Company | Total Drill Holes | Total Drill Footage | Core Holes | Core Footage** | RC Holes | RC Footage |
| 1996 | Kennecott | 4 | 2,220 | --- | --- | 4 | 2,220 |
| 2001/2002 | Echo Bay | 21 | 12,593 | 2 | 1,653 | 19 | 10,940 |
| 2003/2004 | Midway* | 30 | 23,679 | 2 | 1,769 | 28 | 21,910 |
| 2004 | Midway | 18 | 4,695 | --- | --- | 18 | 4,695 |
| 2005 | Midway | 100 | 51,249 | 21 | 10,088 | 79 | 41,160 |
| 2006 | Midway | 70 | 60,206 | 7 | 10,376 | 63 | 49,830 |
| 2007 | Midway | 142 | 102,356 | 9 | 12,521 | 133 | 89,835 |
| 2008 | Midway | 63 | 61,945 | 5 | 8,034 | 58 | 52,460 |
| 2008 | Barrick | 2 | 2,725 | 2 | 2,725 | --- | --- |
| 2009 | Barrick | 32 | 39,842 | 8 | 9,722 | 24 | 27,395 |
| 2010 | Barrick | 38 | 54,901 | 23 | 35,501 | 15 | 19,400 |
| 2011 | Barrick | 44 | 60,501 | 12 | 16,925 | 32 | 43,575 |
| 2012 | Barrick | 58 | 57,140 | 23 | 26,255 | 35 | 34,285 |
| 2013 | Barrick | 50 | 68,148 | 27 | 37,442 | 23 | 33,015 |
| TOTALS | 672 | 603,731 | 140 | 173,011 | 531 | 428,500 | |
Note: Core footage includes RC pre-collar footage
* Managed by Global Geologic Services on Midway’s behalf
** Diamond core drill hole totals are inclusive of pre-collar drilling length
Figure 10-1 shows the distribution of drilling in the Spring Valley resource area. Mineralization defined in the Spring Valley resource area remains open along the N20E-S20W trend to the north, south and at depth.
September 9, 2014 | 38 |
|
Midway Gold Corp. Spring Valley Project | Certificate of Authors NI 43-101 Technical Report on Resources |

Figure 10-1 Spring Valley Project Area Drill Hole Location Map
September 9, 2014 | 39 |
|
Midway Gold Corp. Spring Valley Project | Certificate of Authors NI 43-101 Technical Report on Resources |
| 10.2 | Drilling Procedures and Conditions |
The following information about Midway drilling is extracted from LeLacheur et al. (2009).
Drilling conditions at Spring Valley are optimal. Sites were constructed by digging a sump and, if necessary, by leveling a pad for the drill. Only rarely was more significant construction required for drill sites. Almost all holes were collared in valley fill alluvium with the water table generally between 20 to 30 feet below the surface. Water was present in nearly all holes and increased in amount with depth. Bedrock was between 50 feet and 500 feet below the surface, but was generally between 200 and 300 feet deep. The zones of highly fractured rock increased with clay and brecciated zones encountered near structures. Drilling at Spring Valley was conducted predominantly (~80%) using RC methods.
| 10.2.1 | Reverse Circulation Drilling |
RC drilling conducted by Midway was carried out using tricone bits, first to get through clay layers in the alluvium, then to enhance drill penetration below the water table. RC holes were drilled with 5 3/8 inch to 5 5/8 inch bits. The holes were generally cased only in the top 20 feet.
The majority of Barrick RC holes in areas with alluvial cover were drilled by mud rotary to the alluvium-bedrock interface. Thereafter, RC drilling was carried out using tricone bits. The only exceptions to this approach were for holes sited on bedrock exposures, where a down-hole hammer would be employed until significant water was encountered. RC holes were drilled with 53/8 inch to 55/8 inch bits.
| 10.2.1 | Diamond Core Drilling |
Midway diamond core holes were pre-collared with an RC drill to the alluvium-bedrock contact. The hole was then cased to the bedrock. Core holes have largely been drilled with HQ (2½ inch) size core, though three holes were drilled with PQ (33/8 inch) size core in 2006. All 2008 core was oriented to enable the collection of structural data. Core recovery has in general been good, but core loss increased when the rock was highly fractured and brecciated. In 2008, modifications to the use of drilling muds resulted in significant improvements in recovery, especially in the highly fractured and brecciated zones.
Barrick diamond drill holes were drilled by mud rotary to the alluvium-bedrock interface, and were cased to the bedrock. Thereafter, RC drilling using a tricone bit was continued if the expected mineralized zone was at greater depth. Otherwise, the diamond drill core tail was initiated at the bedrock interface. Core holes have largely been drilled with HQ (2½ inch) size core, with reduction to NQ (17/8 inch) core as necessary.
September 9, 2014 | 40 |
|
Midway Gold Corp. Spring Valley Project | Certificate of Authors NI 43-101 Technical Report on Resources |
| 10.2.2 | Drill Collar and Downhole Surveys |
Collar locations from the 2006-2008 drill campaigns were surveyed by TNT Exploration (TNT) of Reno, Nevada using a survey quality GPS. Collar locations from the 2004-2005 drill campaign originally surveyed by hand-held GPS were also surveyed by TNT in 2006. Most pre-2004 collar locations (84%) were located by a surveyor while the remainder were surveyed by hand-held GPS (16%). Collar locations for all of the Barrick (2009-2013) drilling campaigns were surveyed by a professional land surveyor, using a survey quality GPS.
Significant down-hole deviation has been observed in drilling at Spring Valley. Of holes drilled prior to 2004, only Echo Bay drill holes ESV-14 to ESV-19 and core holes SVC-1 and SVC-2 were surveyed down-hole. Other Echo Bay holes were not surveyed. Between 2004 and 2006, holes deeper than 500 feet were generally surveyed down the hole. In 2008, all but two completed holes were surveyed down-hole. International Directional Services (IDS) of Elko, Nevada and Major Directional Services of Salt Lake City, Utah were contracted to do the down-hole surveys. All Barrick RC and diamond drill holes were down-hole surveyed by IDS using a gyroscopic survey instrument.
| 10.3 | Drilling Interpretations and Results |
Drilling at the Spring Valley project has occurred over an area approximately 10,500 feet in a N20E-S20W direction and up to 3,000 feet wide. The drilling has defined a gold resource 7,500 feet in strike length by 2,300 feet wide. Additional exploration and step-out targets remain untested.
The Spring Valley gold resource has a strong NNE linear trend. That trend can be projected to the NE into an area of NNE trending faults with soil gold anomalies. This structural setting is similar to the main resource area and represents a significant target for expansion of the resource. Drill testing to the north has been limited by the boundary of the drill permit.
Barrick drilling to the south of the resource identified several smaller pods of gold mineralization. The largest of these is at the furthest south extent of drilling near the flanks of Gold Mountain. Drill testing to the south has also been limited by the boundary of the drill permit. This southern mineralization remains open with no drilling further south.
The Wabash fault is a NW-SE trending fault that bisects the main Spring Valley resource. Extensions of this fault to both the east and west of the main resource have the potential to host mineralization that has not yet been tested. Placer gold is common along the trace of the fault to the SE. This target has not been tested to date.
September 9, 2014 | 41 |
|
Midway Gold Corp. Spring Valley Project | Certificate of Authors NI 43-101 Technical Report on Resources |
A lower Felsic Porphyry unit is mineralized at depth in the main resource area. Additional infill drilling is needed throughout the deposit to better define this deeper part of the resource. On the east side of the deposit, the host rock can be followed from depth back to the surface. There is potential for the lower Felsic Porphyry to be found close to the surface in areas not yet drilled.
| 11. | SAMPLE PREPARATION, ANALYSES, AND SECURITY |
| 11.1 | Sampling Method and Approach |
The Spring Valley gold system contains appreciable free gold, at all gold grades of mineralization. This has been discussed and analyzed in previous technical reports (Ristorcelli, 2003; Griffith and Ristorcelli, 2004; Wakefield and Seibel, 2006; Wakefield and Kuhl, 2008; LeLacheur et al., 2009; and Crowl, Hulse, Baker, Lane and Malhotra, 2011.
Midway and Barrick have established the practice of first assaying all samples with a 30 gram fire assay and then all mineralized intervals were systematically re-assayed using Metallic Screen Fire Assay (MSFA). Where available, the MSFA numbers were utilized in the resource estimate. Appropriate QA/QC procedures were followed. The project data is stored in a secure database. Assay and geology data have been checked for accuracy for all programs prior to 2009, and spot checked in the Barrick programs from 2009 through the 3rd quarter of 2013.
Sampling consultants F. Pitard in 2004 and Dr. Dominque François-Bongarçon in 2007, recommended analyzing very large samples to address the nugget effect in sampling. Midway investigated the possibility of analyzing very large samples with ALS Chemex, a commercial laboratory. The recommended sample size was too large for their sample preparation equipment so each sample would have had to be sub-divided up to 5 times, with each subsample assayed separately. Potential for significant errors was considered to be high. As a result, these recommendations were not implemented.
| 11.2 | Midway Sampling Preparation, Analyses, and Security |
The following information about Midway sampling is extracted from Wakefiled and Kuhl (2008) and LeLacheur et al. (2009).
| 11.2.1 | Sample Chain of Custody |
At the end of every drill shift, reverse circulation drill samples were taken from the project site by Midway geologists and transported to a facility in Lovelock, Nevada where the samples were stored behind locked gates. Core drill samples were stored at the same facility in separate bins. Periodically the samples were picked-up by ALS Chemex Labs and were transported to their Winnemucca facility for assay preparation. ALS Chemex is an ISO 9001:2000 and ISO 17025:2000 registered assay laboratory. For check assays, coarse duplicates were also delivered to the Inspectorate American lab in Reno, Nevada for preparation and assay. Inspectorate is an ISO 9001:2000 registered assay laboratory. No Midway personnel were utilized in sample preparation or assaying.
September 9, 2014 | 42 |
|
Midway Gold Corp. Spring Valley Project | Certificate of Authors NI 43-101 Technical Report on Resources |
| 11.2.2 | Diamond Drilling Core Sampling |
Core was recovered using a split tube assembly. Core was oriented and marked during the drilling using a Reflex® ACT electronic orientation tool. Recovered core is placed in cardboard core boxes at the drill site with the core run footage marked on wood blocks and the drill hole name and drill interval marked on the outside of the box. At least once per day, a geologist retrieved the full core boxes and transported them to the Lovelock facility. The core was photographed, logged, and sampled. The orientation of veins, fractures, and faults, as well as lithology, alteration, and geotechnical information was recorded during logging.
Core was sampled in intervals up to five feet while honoring geologic contacts where appropriate. The preferred sample interval was five feet and this was also the specified maximum sample length. Geologic contacts or features were used as sample boundaries wherever possible. The core was split with a saw if the rock was competent or the core was broken with a splitter if it was fractured or friable. The sample was bagged in large micro-pore bags marked with the sample number and stored at the logging facility until transport to the assay lab. Typically, ½ of the core sample was submitted for assay analysis and the remaining ½ stored for reference and other testing.
| 11.2.3 | Sampling of Reverse Circulation Cuttings |
Reverse Circulation (RC) drilling at Spring Valley was performed wet as the water table is typically 20 to 30 feet below the surface. Water flow tests were conducted at least once a drill shift or more often when water flow was high or changed drastically. Water flow varied but was typically 40 gallons per minute and has been measured as high as 150 gallons per minute, with the higher flows generally found at the bottom of the hole. RC drilling was generally performed with a tricone bit to improve penetration rate and quality of returns in the presence of ground water.
Cutting samples were collected every 5 feet by a designated and trained sampler. Cuttings from each 5-foot sample interval were passed through a cyclone and into a rotary splitter with 16 openings. The number of splitter openings was adjusted to maintain a roughly constant sample size of 15 kg. The number of openings was recorded in the drill log. This number, together with the dry weight for the interval at the assay laboratory, allowed an estimation of RC drilling recovery. Drill samples were collected at five-foot intervals and the RC drill rods were 20 feet long. A representative split from the discharge material was placed into a plastic RC chip tray for geological logging. The chip tray was marked with the drill hole name and down-hole interval.
September 9, 2014 | 43 |
|
Midway Gold Corp. Spring Valley Project | Certificate of Authors NI 43-101 Technical Report on Resources |
RC samples were collected in a five gallon bucket lined with large micro-pore bags marked with the sample number. The five gallon bucket was placed inside a wide, low profile tub designed to catch any fine grained cuttings in the overflow water. At the conclusion of a sample interval, the water in the bucket and tub was decanted, the overflow material in the tub was washed into the sample bag in the bucket and the bag was sealed. A nominal sample weight of 15 kg was taken to aid in getting an accurate assay in a coarse gold environment. In 2008, RC samples averaged 13.29 kg.
RC samples were laid out on the ground at the drill site, allowed to drain, and brought back to the Lovelock facility at the end of each drill shift by Midway Resources personnel. In Lovelock, samples were stored in secure bins until picked up and transported to Winnemucca by the commercial laboratory for preparation and assaying.
| 11.2.4 | Sample Preparation and Assay Procedures |
2003
Gold assays for the 2003 drilling campaign were performed by BSI Inspectorate of Reno, Nevada using a standard FA with a two assay ton sub-sample size and with the final concentration determined by AAS. Assays returning greater than 2.0 g/t (0.088 oz/t) gold were re-assayed by fire assay with a gravimetric finish. Metallic screen gold fire assays were performed on most mineralized intervals by ALS Chemex of Reno, Nevada.
ALS Chemex performed metallic screen fire assays using a 100 micron screen (150 mesh) on one kilogram sub-samples of re-split coarse reject. The assay of the coarse (+150 mesh) material was weight averaged with two assays of the fine (-150 mesh) material.
2004-2005
Several labs assayed drill hole samples from the 2004-2005 drilling campaign. American Assay Laboratories (AAL) were used to assay holes SV04-52 to SV04-66, Inspectorate were used to assay holes SV05-67c to SV05-79, and ALS Chemex to assay holes SV05-80 to SV05-166. Coarse rejects of select samples were resubmitted to AAL and Inspectorate for metallic screen assay. All three of these laboratories are located in Reno, Nevada. AAL is an ISO 17025 registered laboratory.
Sample preparation at AAL and Inspectorate consisted of crushing the entire sample to pass a 10 mesh screen, riffle splitting to generate a 250 gram sub-sample, and pulverizing this subsample to pass a 150 mesh screen. ALS crushed the entire sample to 70% passing a 2 mm (10 mesh) screen, riffle split to generate a one kilogram sub sample, and pulverized this subsample to 85% passing a 75 μm (200 mesh) screen.
September 9, 2014 | 44 |
|
Midway Gold Corp. Spring Valley Project | Certificate of Authors NI 43-101 Technical Report on Resources |
Mineralized intervals were selected based upon visual examination of the cuttings or core by the logging geologist and assayed by metallic screen fire assay using a 150 mesh screen on one kilogram sub-samples. All three labs used the same procedure where the assay of the coarse (+150 mesh) material is weight averaged with two assays of the fine (-150 mesh) material. The remaining intervals were assayed for gold by standard fire assay on 30 gram subsamples with the final concentration read by AAS. Samples reporting greater than 10 g/t (0.292 oz/t) were re-assayed by fire assay and gravimetric finish.
2006-2007
In 2006 and 2007, ALS Chemex was the primary assay laboratory. ALS Chemex is an ISO 9001:2000 and ISO 17025:2000 registered assay laboratory. Midway prepared a sample assay protocol for use with the 2007 drill program that describes the sample preparation, assay, and QA/QC procedures to be used for RC and core drill samples
Sample preparation and assay procedures remained the same as those used at the end of 2005, except that all samples were submitted for 30 gram fire assay, and those assaying greater than 0.2 g/t (0.006 oz/t) were re-assayed by one kg metallic screen fire assay. Intervals with a high concentration of quartz veining or groupings of assays by fire assay greater than 0.1 g/t (0.003 oz/t) were also frequently re-assayed by one kg metallic screen fire assay.
ALS crushed the entire sample to 70% passing a 2 mm (10 mesh) screen, riffle split this material to generate a nominal 250 gram sub-sample, and pulverized this sub sample to 85% passing a 75 μm (200 mesh) screen. All samples were assayed for gold by standard fire assay on 30 gram sub-samples with the final concentration read by AAS. Samples reporting greater than 10 g/t (0.292 oz/t) were re-assayed by fire assay and gravimetric finish. Samples reporting greater than 0.2 g/t (0.006 oz/t) gold by standard fire assay were re-assayed by metallic screen fire assay. Metallic screen fire assays were performed on one kilogram subsamples using a 150 mesh screen. The assay of the coarse (+150 mesh) material is weight averaged with two assays of the fine (-150 mesh) material to produce a final gold assay.
2008
ALS Chemex was the primary assay laboratory. Sample preparation at ALS Chemex consisted of normal sample drying, then crushing the entire sample to pass a 10 mesh screen, riffle splitting to generate a 250 gram sub-sample, and pulverizing this sub sample to pass a 150 mesh screen. Pulps were then forwarded by ALS to their lab in Reno, NV where the assaying was performed.
September 9, 2014 | 45 |
|
Midway Gold Corp. Spring Valley Project | Certificate of Authors NI 43-101 Technical Report on Resources |
All samples were submitted for standard fire assay on 30 gram sub-samples with the final concentration read by AAS. Samples reporting greater than 10 g/t (0.292 oz/t) were re-assayed by fire assay and gravimetric finish. Mineralized zones assaying greater than 0.2 g/t (0.006 oz/t), and other intervals with high quartz vein concentration or other indicators of mineralization, were assayed by one kg metallic screen fire assay.
ALS Chemex performed metallic screen fire assays using a 100 micron screen (150 mesh) on one kilogram sub-samples of re-split coarse reject. The assay of the coarse (+150 mesh) material was weight averaged with two assays of the fine (-150 mesh) material. Assays were reported as a weighted average of the whole, and the weights and assays of the individual splits.
Assay work in 2008 included 12,366 samples by 30 gram fire assay and 4,143 samples by metallic screened fire assay.
| 11.2.5 | Standards, Duplicates, and Blanks |
2003
Midway employed a QA/QC program of Standard Reference Materials (SRMs) and field duplicates inserted in the project sample stream at a rate of approximately one control sample for every 20 project samples (no SRMs were submitted for holes SV-39 to SV-50).
The Inspectorate gold assays are acceptably accurate for purposes of mineral resource estimation.
2004-2005
Midway employed a QA/QC program that consisted of inserting Standard Reference Material (SRM) and coarse duplicates into the sample stream at the rate of 1 in 25 project samples. This program was consistent for the three laboratories employed. The same SRM was used as in the 2003 drilling campaign.
SRM results for the 2004-2005 drilling campaign were biased high. AAL assays are biased high by an average of 9%, Inspectorate assays were biased high by an average of 12%, and ALS assays were biased high by an average of 13%. The fact that all three laboratories obtained results biased high by similar amounts suggested that the SRM value was incorrect. Therefore it was found that the AAL, Inspectorate, and ALS gold assays are acceptably accurate for purposes of mineral resource estimation.
2006-2007
Midway employed a QA/QC program that consisted of inserting blanks, SRMs, and coarse duplicates into the sample stream at the rate of one in 25 project samples. Commercial SRMs from Minerals Exploration and Environment Geochemistry (MEG) of Reno, Nevada and Ore Research & Exploration (Ore Research) of Bayswater, North Australia were used to monitor gold assay accuracy. MEG assayed five splits of each SRM for gold at five separate assay laboratories and assigned the recommended value to the average of the resulting 25 assays. Ore Research assayed four splits of each SRM for gold at 16 separate assay laboratories and assigned the recommended value to the median value of the average values from each of the 16 participating laboratories. One SRM provided by MEG was found to be unreliable and was eliminated after limited use.
September 9, 2014 | 46 |
|
Midway Gold Corp. Spring Valley Project | Certificate of Authors NI 43-101 Technical Report on Resources |
Blank results (Figure 11-1) for gold by fire assay were found to be acceptable. A total of nine assays reported greater than 0.025 g/t gold (0.001oz/t, five times the lower detection limit) out of the total 428 blank samples assayed during this period. Only two of these were greater than 0.125 g/t (0.004 oz/t) gold.

Figure 11-1 2006 – 2007 Blank Results
An analysis of SRM results (Figures 11-2 through 11-6) by AMEC (2008) shows that the accuracy of ALS Chemex gold assays is acceptable. A total of 780 SRMs were included with project samples from the 2006-2007 drill campaign. Approximately 88% of assay results fall within ±10% of the recommended value for all SRMs assayed. No significant bias was observed in the SRM results. Assay results falling more than 10% from the recommended value were flagged and remediated directly with ALS Chemex.
September 9, 2014 | 47 |
|
Midway Gold Corp. Spring Valley Project | Certificate of Authors NI 43-101 Technical Report on Resources |

Figure 11-2 2006 – 2007 Standard MEG055 Results

Figure 11-3 2006 – 2007 Standard MEG160 Results
September 9, 2014 | 48 |
|
Midway Gold Corp. Spring Valley Project | Certificate of Authors NI 43-101 Technical Report on Resources |

Figure 11-4 2006 – 2007 Standard MEG200 Results

Figure 11-5 2007 Standard MEG067 Results
September 9, 2014 | 49 |
|
Midway Gold Corp. Spring Valley Project | Certificate of Authors NI 43-101 Technical Report on Resources |

Figure 11-6 2007 Standard MEG045 Results
Analysis of the results from the coarse duplicates found a higher than normal level of variance between assays, likely because of the amount of coarse gold in the samples. A total of 458 duplicates were assayed as part of the 2006-2007 drill campaign.
These gold assays are acceptably accurate for purposes of mineral resource estimation.
2008
Midway employed a QA/QC program that consisted of inserting blanks, SRMs and coarse duplicates into the sample stream at the rate of one in 25 project samples. Coarse duplicates were also delivered to the Inspectorate American lab in Reno, NV for preparation and assay.
Of the total of 247 blanks analyzed in 2008, there were 6 failures for a failure rate of 2.4%. Only 2 samples were above the 0.025 level and only a single value exceeded the 0.125 level. In the case of failures above a 0.025 level, the sampling protocol requires a rerun of the blanks and the surrounding assays. The results of the reruns found no significant error. There is no significant carry-over contamination affecting the 2008 assays.
Commercial SRMs from Ore Research (Figures 11-7 and 11-8) were used to monitor gold assay accuracy. Approximately 88% of assay results fell within ±10% of the recommended value for all SRMs assayed. A total of 325 SRM’s were inserted into the assay stream and a total of 34 failures were reported, 22 of which were deemed significant enough to require re-assay of a range of samples above and below the failure. In each case the re-runs were comparable to the initial assays. Two SRM’s were utilized: a “low-grade” value SRM at 1.02 g/t gold and a “high grade” SRM at a 3.63 g/t gold value. The low-grade SRM was biased low by 9%, but the high grade SRM demonstrated no bias.
September 9, 2014 | 50 |
|
Midway Gold Corp. Spring Valley Project | Certificate of Authors NI 43-101 Technical Report on Resources |

Figure 11-7 2007 – 2008 Standard OREAS102 Results
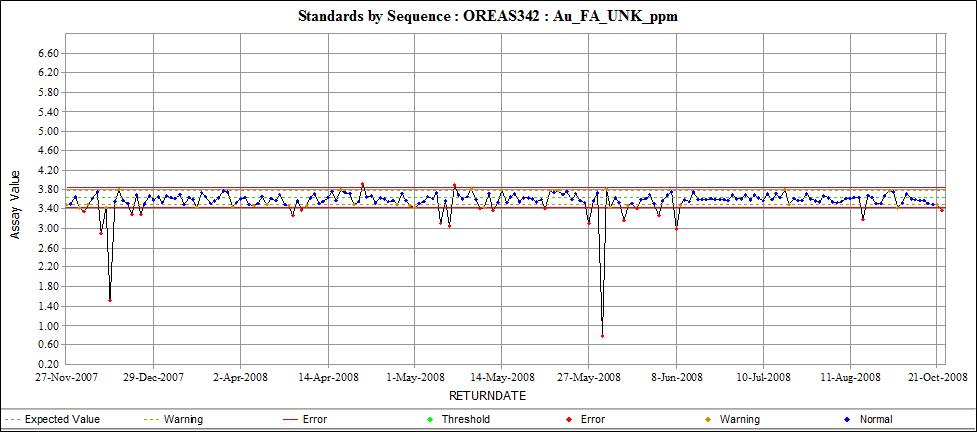
Figure 11-8 2007 – 2008 Standard OREAS342 Results
September 9, 2014 | 51 |
|
Midway Gold Corp. Spring Valley Project | Certificate of Authors NI 43-101 Technical Report on Resources |
A total of 146 duplicates were assayed as part of the 2008 drill program. Analysis of the results from the coarse duplicates found a higher than normal level of variance between assays, consistent with the presence of coarse gold in the system.
| 11.3 | Barrick Sampling Preparation, Analyses, and Security |
| 11.3.1 | Sample Chain of Custody |
RC samples are bagged, laid out on the ground at the drill site, allowed to drain, and are secured in sealed and locked bins at the drill site, until picked up and transported to Winnemucca by the commercial laboratory for sample preparation and assaying.
Core drill samples are transported from site and stored at the Lovelock facility in separate bins. Periodically the samples were picked-up by ALS Chemex Labs and were transported to their Winnemucca facility for assay preparation.
| 11.3.2 | Diamond Drilling Core Sampling |
In the Barrick drilling programs, HQ drill core is recovered using a split tube assembly. Core is oriented and marked during the drilling using a Reflex ACT electronic orientation tool. Recovered core is placed in cardboard core boxes at the drill site with the core run footage marked on wood blocks and the drill hole name and drill interval marked on the outside of the box. At least once per day, the full core boxes are retrieved and transported to the Lovelock facility. The core is photographed, logged and marked for sample intervals. The orientation of veins, fractures and faults is recorded in drill logs as well as lithology, alteration and geotechnical information.
Core is sampled in intervals of at least two feet, and up to eight feet while honoring geologic contacts where appropriate. The preferred sample interval was five feet. Geological contacts or features are used as sample boundaries wherever possible. Whole core is submitted as assay samples for each sample interval. The sample is bagged in large micro-pore bags marked with the sample number and securely stored at the logging facility until transported to the assay lab. Select two-foot sections of drill core are collected as representative of specific alteration, mineralization and/or lithologic types, and are separately submitted for multi-element analysis by ICP methods. Four to six inch pieces of core are marked and separately bagged for specific gravity measurement at Chemex. Skeleton core is created by selecting a representative two to four inch piece of core within every five-foot interval. The skeleton core is stored on-site at the Lovelock facility.
September 9, 2014 | 52 |
|
Midway Gold Corp. Spring Valley Project | Certificate of Authors NI 43-101 Technical Report on Resources |
| 11.3.3 | Sampling of Reverse Circulation Cuttings |
RC drilling at Spring Valley was performed wet as the water table is typically 20 to 30 feet below the surface. Water flow tests are conducted at least once a drill shift or more often when water flow was high or changed drastically. Water flow varies but is typically 40 gallons per minute and has been measured as high as 150 gallons per minute, with the higher flows generally found at the bottom of the hole.
Cutting samples are collected every 5 feet by a designated and trained sampler. Cuttings from each 5-foot sample interval are passed through a cyclone and into a rotary splitter with 16 openings. The number of splitter openings is adjusted to maintain a roughly constant sample size of 30 to 40 pounds. The number of openings is recorded in the drill log. This number, together with the dry weight for the interval at the assay laboratory, allows an estimation of RC drilling recovery. Drill samples are collected at five-foot intervals and the RC drill rods are 20 feet long. A representative split from the discharge material is placed into a plastic RC chip tray for geological logging. The chip tray is marked with the drill hole name and down-hole interval.
RC samples are collected in a five gallon bucket lined with large micro-pore bags marked with the sample number. The five gallon buckets are placed inside a wide, low-profile tub designed to catch any fine grained cuttings in the overflow water. At the conclusion of a sample interval, the water in the bucket and tub is decanted, and the overflow material in the tub is washed into the sample bag in the bucket and the bag is sealed. A nominal sample weight of 30 to 40 pounds is taken to aid in getting an accurate assay in a coarse gold environment.
RC samples are laid out on the ground at the drill site, allowed to drain, and are secured in sealed bins at the drill site, until picked up and transported to Winnemucca by the commercial laboratory for sample preparation and assaying.
| 11.3.4 | Sample Preparation and Assay Procedures |
ALS Chemex (ISO 9001:2000 and ISO 17025:2000 registered assay laboratory) was the primary assay laboratory. Sample preparation for both core and RC samples at ALS Chemex followed the flow sheet used by Midway beginning in 2007, until August 2009. The earlier process consisted of normal sample drying, then crushing the entire sample to pass a 10 mesh screen (>95% passing 10 mesh), rotary splitting to generate a 250 gram sub-sample, and pulverizing this sub-sample to pass a 200 mesh screen (>85% passing 200 mesh). Pulps were then forwarded by ALS to their lab in Reno, NV where the assaying was performed.
All samples were submitted for standard fire assay on 30 gram sub-samples with the final concentration read by AAS. Samples reporting greater than 10 g/t (0.292 oz/t) were re-assayed by fire assay and gravimetric finish. Mineralized zones assaying greater than 0.2 g/t (0.006 oz/t), and intervals with high quartz vein concentration or other indicators of mineralization, were also assayed by one kilogram metallic screen fire assay.
September 9, 2014 | 53 |
|
Midway Gold Corp. Spring Valley Project | Certificate of Authors NI 43-101 Technical Report on Resources |
ALS Chemex performed the metallic screen fire assays by generating a one kilogram pulp from a rotary split from the coarse reject, which was pulverized to 75 microns (>80% passing <75 microns). Material not passing a 150 mesh screen (+150 mesh) was weighed and assayed. Two 30 gram splits of fines (-150 mesh) were fire assayed for gold. Results were combined to calculate an assay for the sample. ALS Chemex reported a weighted average grade assay for the sample, as well as the weights and assays of the individual splits.
The sample preparation flow sheet was adjusted beginning August 2009 to generate a larger pulp. The crushed samples were split by rotary splitter to produce a 1,200 gram split which was then pulverized as in the previous scheme. The pulp was split into a 100 gram sample for analysis by fire assay with an AA finish. The remaining 1,100 gram master pulp was stored along with the coarse reject for future use. Upon review of the initial assay results, project geologists would submit a list of samples for metallic screen fire assay analysis to ALS Chemex. The master pulp was pulled from storage and split to generate a sample for the metallic screen fire assay procedure, identical to that outlined above.
| 11.3.5 | Standards, Duplicates and Blanks |
Barrick employs a QA/QC program that consists of inserting blanks, SRMs and coarse duplicates into the sample stream at the rate of approximately one in 25 project samples. Blanks were inserted as 1% of samples; SRMs – 2%; and duplicates – 1% of the total samples. ALS Chemex routinely runs lab duplicates on 3.5% of the samples in each batch. The QA/QC program is run internal to Barrick in its Elko office. Barrick reports a rigorous analysis of its evaluation of the results to Spring Valley project geologists on a monthly basis, indicating standard and duplicate failures and other issues. The analysis includes plots of SRM and blank results by batch number. The SRM results are compared to the certified value of the SRM, and to threshold values at two and three standard deviations. Results between two and three standard deviations from the accepted value are classified as warnings, and are resubmitted at the request of the onsite geologist. Samples exceeding three standard deviations are considered to have failed, and are immediately resubmitted.
Gustavson reviewed the monthly reports of Barrick and the 2011 QA/QC plots (Figures 11-9 through 11-16) and considers the QA/QC program of industry standards for treatment of the SRM and blank data to be adequate. An analysis of duplicate data was not available, and Gustavson did not compile this information.
September 9, 2014 | 54 |
|
Midway Gold Corp. Spring Valley Project | Certificate of Authors NI 43-101 Technical Report on Resources |

Figure 11-9 Barrick 2011 Blank Results
September 9, 2014 | 55 |
|
Midway Gold Corp. Spring Valley Project | Certificate of Authors NI 43-101 Technical Report on Resources |

Figure 11-10 Barrick 2011 Standard OxC72 Results

Figure 11-11 Barrick 2011 Standard OxG83 Results
September 9, 2014 | 56 |
|
Midway Gold Corp. Spring Valley Project | Certificate of Authors NI 43-101 Technical Report on Resources |

Figure 11-12 Barrick 2011 Standard OxJ68 Results

Figure 11-13 Barrick 2011 Standard SE29 Results
September 9, 2014 | 57 |
|
Midway Gold Corp. Spring Valley Project | Certificate of Authors NI 43-101 Technical Report on Resources |

Figure 11-14 Barrick 2011 Standard SE44 Results

Figure 11-15 Barrick 2011 Standard SG40 Results
September 9, 2014 | 58 |
|
Midway Gold Corp. Spring Valley Project | Certificate of Authors NI 43-101 Technical Report on Resources |

Figure 11-16 Barrick 2011 Standard Si42 Results
| 11.3.6 | Check Assay Programs |
During the 2009 – 2013 programs there were no check assay inter-laboratory programs reported by Barrick to Midway.
| 11.3.7 | Twin Hole Comparisons |
In 2009, Barrick twinned diamond drill core with reverse circulation holes at six drill sites at Spring Valley, and in 2010 completed two diamond drill holes as twins of reverse circulation holes completed in previous programs.
With the exception of the two core holes with single sample interval high grade intercepts, the average gold grade of the RC drilling is slightly higher than that of the comparable core samples. This relationship was also recognized by Midway (LeLacheur et al., 2009) in a twin hole program of two pairs of core-RC holes, and in a study using a nearest neighbor RC assay result in comparison with a core assay interval; however the difference is negligible considering the documented coarse gold sampling issues, and the relatively small data set. All drill hole data has been included in the database, and in the generation of gold resources reported in this document. Gustavson believes this treatment is acceptable and within limits of the available data; especially in light of the coarse gold sampling comments of Pitard (2004), suggesting the nugget effect on the project which results in an understatement of the gold grade, thereby creating a very conservative resource estimate.
September 9, 2014 | 59 |
|
Midway Gold Corp. Spring Valley Project | Certificate of Authors NI 43-101 Technical Report on Resources |
| 11.3.8 | Exploration drilling 2014 |
Barrick, as operator of the Spring Valley Venture, began the 2014 exploration drill program in mid-March 2014. The data from the 2014 drill program have not yet been made available to Midway, and are not included in this resource estimation. Gustavson does not anticipate that a small number of additional infill drillholes will have a material impact on the resource.
| 11.4 | Data Entry Validation Controls |
Geologic and geotechnical logs (for core only) were completed for each Midway drill hole. For RC drilling, the geologists logged from drill chips directly into Microsoft Excel® spreadsheets using a PDA-type hand-held computer at the RC drill rig. Drill core was cleaned, photographed, and then logged by Midway geologists who input the information directly into Microsoft Excel® spreadsheets. Structure and vein orientations were recorded from oriented core. Drill logs were printed and stored in binders by hole name together with related drill information. All collar and drill log information was imported into a Microsoft Access® drill hole database. The logging forms were entered into a secure Microsoft Access® database, and any changes to the database needed to be approved by the project manager. This database was stored on the main computer at the Lovelock Office, and backed up to the server in the corporate office. Access to the primary database was restricted to the Project Manager and Database Manager for security.
Barrick project personnel follow sample handling and logging protocols outlined in a written procedures document. For diamond drill core, a visual quick-log of lithology is prepared while loading core at the drill site or unloading core at the Lovelock facility. Once at the Lovelock facility, the core is washed and photographed, with photos downloaded to a database. Photos are inspected for clarity and lighting, and reshot if necessary. Geological and geotechnical logs are completed, with data captured electronically, for each drill hole, using a preapproved logging form. Geotechnical aspects logged include core recovery, RQD, fractures per foot, and estimated hardness. Geologic features logged include lithology, alteration, mineralization, structure and measurement of magnetic susceptibility (every three feet). Sample intervals are marked by the geologist based on logged geology, alteration, mineralization and/or structure.
For RC drilling, the geologists logged from drill chips electronically using a PDA-type hand-held computer at the RC drill rig.
Drill logs were printed and stored in binders by hole name together with related drill information. All collar and drill log information was imported into Barrick’s drill hole database. Access to the primary database was restricted to the Project Manager and Database Manager for security.
September 9, 2014 | 60 |
|
Midway Gold Corp. Spring Valley Project | Certificate of Authors NI 43-101 Technical Report on Resources |
| 11.5 | Opinion on Adequacy |
Gustavson concludes that the sample preparation, security and analytical procedures are correct and adequate for preparing this Technical Report. The sample methods and density are appropriate and the samples are of sufficient quality to comprise a representative, unbiased database.
| 12. | DATA VERIFICATION |
Midway relies upon the accuracy and completeness of data provided by Barrick pursuant to the Exploration, Development, and Joint Operating Agreement dated March 9, 2009, and the subsequent Spring Valley Venture Agreement.
Gustavson (W. Crowl), along with William Neal of Midway, visited the Spring Valley Project site on June 17, 2014 and the Core Splitting and sampling facility at Turquoise Ridge on June 18, 2014. (core splitting and sampling for the 2014 Spring Valley drill program is being performed at Barrick’s Turquoise Ridge facility due to availability of appropriate equipment and personnel.) Mr. Crowl observed drilling, drill sampling, and logging in progress at Spring Valley and observed core splitting and sampling procedures for the 2014 drill program at the Turquoise Ridge Facility. These observations do not have direct bearing on the sample database used for this resource estimation, but they serve as confirmation of Barrick’s exploration practices and procedures described later in this report.
Gustavson (W. Crowl and Z. Black) visited the Spring Valley project site and the Lovelock facility on October 24, 2013. As with Gustavson’s previous visit in 2011, there were no drilling activities in progress. In the company of William Neal of Midway and Bob Morrel, the Barrick District Manager, several geologic sites were visited and several hole collars were surveyed with hand-held GPS.
In the Lovelock office, Gustavson was provided a presentation of the current geologic understanding of the Spring Valley gold deposits. After the presentation, Gustavson toured the core storage and logging facilities. Barrick provided explanations of the current alteration and mineralization logging procedures and discussed the use of multi-element analyses in characterization of mineralization.
Gustavson (D. Baker) visited the Spring Valley project site and the Lovelock facility on February 24, 2011. There were no drilling activities in progress, and the project site was snow covered. Drill sites are typically reclaimed shortly after completion of drilling. These combined factors precluded on-site confirmation of the location of 2009 – 2010 drill holes.
September 9, 2014 | 61 |
|
Midway Gold Corp. Spring Valley Project | Certificate of Authors NI 43-101 Technical Report on Resources |
The visit to the Lovelock facility enabled discussions with Spring Valley project personnel regarding drilling methods, sample handling and security, core logging protocols, data management and QA/QC programs. Discussion regarding drilling methods, sample handling and security, and QA/QC programs is provided in the appropriate sections above. Gustavson regards methods and management employed in these areas as acceptable and meeting industry standards.
In the Lovelock office, Gustavson reviewed core handling protocols with project personnel. A core logging procedures document was provided and reviewed, and outlines the full breadth of the core handling process, from the drill rig through the entire logging process. The procedures incorporate the washing and photographing of core, the taking of magnetic susceptibility readings, geotechnical logging categories, geologic and structure logging categories, and the sample selection process, including sample intervals for assay, multi-element samples, skeleton core and samples for density measurement. All logging information is captured electronically, with hard copies printed and filed.
A sampling of assay certificates provided to Midway by Barrick was reviewed by Gustavson. Assay information on the certificates matched that captured in the project database. This is to be expected in that assay results are transmitted and captured electronically.
Based on the observations from the 2014, 2013 and 2011 site visits, Gustavson considers that the data provided by Barrick is sufficient for use in the estimation of mineral resources.
September 9, 2014 | 62 |
|
Midway Gold Corp. Spring Valley Project | Certificate of Authors NI 43-101 Technical Report on Resources |
| 12.1 | Validation of Database |
Gustavson conducted a thorough audit of the current Spring Valley exploration drill hole database. The following tasks were completed as part of the audit:
- Perform an mechanical audit of the database;
- Validate the assay values contained in the 2013 database with assay certificates from Midway; and
- Review the QA/QC protocol and summary results from Barrick.
| 12.1.1 | Received Data |
The exploration database used by Gustavson for the resource estimation incorporated all significant drillholes through the 2013 drill campaign, with the exception of 4 holes (SV13-653C, 659CA, 662C, and 672C) where assays were not available prior to the effective date of the report. Data from the missing holes is not expected to have a material impact on the resource estimation. Drill hole data, including collar coordinates, down hole surveys, sample assay intervals, and geologic logs, were provided in a secure Microsoft Access database and as CSV files (the database). The database is managed by Barrick under the Exploration, Development, and Joint Operating Agreement.
The present database has been updated to include the remaining 2010, 2011, 2012, and 2013 drill holes, which were available as of the effective date of the report. The drill hole database contains gold assay analytical information for 112,858 sample intervals from core, RC, and mud rotary drilling methods. All mud rotary drill samples were pre-collar samples taken within the alluvium and thus are not included in the resource estimation.
The Spring Valley Venture, managed by Barrick Exploraiton, initiated the 2014 drill program in March 2014.
Additionally, Gustavson was provided with QA/QC summaries, assay certificates (2009-2012), Vulcan block models, geologic solids and surfaces, topography, and spread sheets and reports detailing Barrick’s block model estimation process.
| 12.1.2 | Mechanical Audit |
A mechanical audit of 8 database tables was completed using Leapfrog Geo software (“Geo”). The database was checked for missing survey data, overlaps, gaps, total drill hole length inconsistencies, non-numeric assay values, and negative numbers. A total of 673 drill holes were imported into Leapfrog for validation. Table 12-1 shows the results of the mechanical audit and the subsequent corrections.
September 9, 2014 | 63 |
|
Midway Gold Corp. Spring Valley Project | Certificate of Authors NI 43-101 Technical Report on Resources |
Table 12-1 Mechanical Audit Errors
| Drill Hole | Validation Concern | Corrective Action |
| SV11-545X | No Collar Data | Removed from Estimation Database |
| SV12-586C | No Downhole Survey Data | Removed from Estimation Database |
| SV12-595X | No Downhole Survey Data | Removed from Estimation Database |
| SV13-659C | No Downhole Survey Data | Removed from Estimation Database |
| SV13-659CA | No Downhole Survey Data | Removed from Estimation Database |
| SV04-51 | No Assay Data | No Action Taken |
| SV05-120C | No Assay Data | No Action Taken |
| SV05-121C | No Assay Data | No Action Taken |
| SC13-632C | No Assay Data | No Action Taken |
| SV13-644C | No Assay Data | No Action Taken |
| SV13-656C | No Assay Data | No Action Taken |
| SV13-664C | No Assay Data | No Action Taken |
| SV13-666C | No Assay Data | No Action Taken |
| SV13-659C | No Geology Data | No Action Taken |
| SV13-659CA | No Geology Data | No Action Taken |
| SV13-659C | No Alteration Data | No Action Taken |
| SV13-659CA | No Alteration Data | No Action Taken |
| SV13-659C | No Redox Data | No Action Taken |
| SV13-659CA | No Redox Data | No Action Taken |
| SV13-659C | No RQD Data | No Action Taken |
| SV13-659CA | No RQD Data | No Action Taken |
(Note: 664C and 666C are geotech holes for which data is not yet available as of the effective date of the report.)
| 12.1.3 | Overlaps |
The assay file imported into Geo contained a significant number of overlapping intervals. All of the overlaps are attributed to composited intervals and multiple samples from the core holes being submitted for analysis. There are four core sample types recorded in the database;
| 1. | core (whole core samples) |
| 2. | core_chip (chip sampled core – primarily for metallurgical holes) |
| 3. | core_select (select hand samples of core) |
| 4. | core_split (split or saw core). |
Gustavson
resolved the majority of the overlaps by removing the core_chip samples and composite intervals from the data set. The core_select
and core_split intervals were reviewed wherever an overlap was identified. Table 12-2 summarizes the identified overlaps and the
correction made to the database by Gustavson.
September 9, 2014 | 64 |
|
Midway Gold Corp. Spring Valley Project | Certificate of Authors NI 43-101 Technical Report on Resources |
Table 12-2 Database Overlap Summary
| Hole ID | From | To | Sample Type | Correct From | Correct To |
| SV12-558C | 395 | 400 | RC | 395 | 397 |
| SV12-558C | 397 | 402 | Core | 397 | 402 |
| SV12584C | 495 | 500 | RC | 495 | 497 |
| SV12584C | 497 | 502 | Core | 497 | 502 |
| SV13-615C | 495 | 500 | RC | 495 | 497 |
| SV13-615C | 497 | 502 | Core | 497 | 502 |
| SV13-652C | 405 | 410 | RC | 405 | 407.5 |
| SV13-652C | 407.5 | 412 | Core | 407.5 | 412 |
| SV12-577C | 19 | 96.1 | core_select | removed no assay data | |
| SV12-582C | 5 | 96.1 | core_select | removed no assay data | |
Gustavson disregarded the core_select samples in drill holes SV12-577C and SV12-582C without analytical information thereby resolving all the overlapping intervals. The remaining overlaps in Table 12-2 were a result of overlapping intervals at the pre-collar point of the 4 drill holes. Each of the RC sample types was adjusted to match the core interval.
| 12.1.4 | Gaps, Non-numeric Assay Values, and Negative numbers |
The software reported 870 missing intervals. The majority of which are located at the collar of the drill hole or within the pre-collar drilling samples of the historic drill holes, e.g. ESV1.
All of the non-positive numbers (-99 or -9) represent non-sampled intervals and were omitted from the dataset. Assay values of zero (0.0) within the historic drill data are assumed to be below detection limit assays and are included as 0.0001 oz/t in the resource estimation. Table 12-3 below summarizes the number of intervals imported, the number of missing intervals, the number of non-positive values, the number of 0.0 assays, and the number of valid assays for each element.
Table 12-3 Interval Import Summary
| Element | Missing Interval | Non-Positive Values | Below Detection Limit | Assay Values |
| Au_Best_Value_OPT_dr | 870 | 2,132 | 1,579 | 109,147 |
September 9, 2014 | 65 |
|
Midway Gold Corp. Spring Valley Project | Certificate of Authors NI 43-101 Technical Report on Resources |
| 12.1.5 | Survey Data |
Drill hole SV12-607W has a duplicate downhole survey at the collar. Gustavson chose to use the more precise survey reported as it better matched the next survey down the hole. Two sets of drill holes were identified as potential twins or as possible wedges;
| · | SV05-75 and SV05-85C |
| · | SV09-457 and SV09-462C. |
| 12.1.6 | Table Depth Consistency |
The survey, assay, and the geology tables maximum sample depth was checked as compared to the maximum depth reported in the collar table for each drill hole. No intervals exceeded the reported drill hole depths.
| 12.1.7 | Assay Certificates |
Gustavson received original assay certificates in pdf and comma delimited format for all drillhole samples through 2012. A random manual check of 1,210 samples within the database (including 2013 data) against the original certificate revealed 3 total errors (Table 12-4). The results of the analysis indicate that the data imported into the database matches the certificates 99.7% of the time with a confidence interval of ± 0.56% at a 95% confidence level.
Table 12-4 Certificate Validation Errors
| Sample ID | Drill Hole | From | To | Certificate Au ppm | Database Au ppm | Sample Type | Database Certificate |
| 604019 | SV10-500C | 345 | 350 | 0.0025 | -99 | CONVENTIONL_MUD | |
| 614033 | SV10-509C | 1803.2 | 1808.4 | 0.009 | 1.31 | Au_Au-AA23_ALS_ppm | WN11022280 |
| 613940 | SV10-509C | 1832.6 | 1834.9 | 0.043 | 0.029 | Au_Au-AA23_ALS_ppm | WN11022280 |
| 13. | MINERAL PROCESSING AND METALLURGICAL TESTING |
| 13.1 | Mineral Processing and Metallurgical Testing |
Barrick contracted with McClelland labs in Sparks, Nevada to complete a detailed metallurgical testing program on thirteen drill core composites from Spring Valley. The composite samples representing four rock types and three oxidation states were tested by column leaching, bottle roll and gravity methods. The composites were from a total of 355 split diamond drill core intervals, each interval representing approximately five feet. Grades of the composite samples ranged from 0.21 grams per tonne (gpt) to 5.07 gpt (0.006 oz/t to 0.148 oz/t); nine of the samples had grades less than 1.03 gpt (0.030 oz/t). Because coarse gold is known to be present at Spring Valley, the reported gold grades were determined by metallic screen fire assays, see Table 13-1.
September 9, 2014 | 66 |
|
Midway Gold Corp. Spring Valley Project | Certificate of Authors NI 43-101 Technical Report on Resources |
Table 13-1 Composites
| Metallic Screen Assays | FP-OX A | FP-OX B | SD-OX | WT-OX A | WT-OX B | FP-TRANS A | FP-TRANS B | BX-RED A | BX-RED B | FP-RED A | FP-RED B | FP-RED C | WT-RED |
| Gold oz/t | 0.015 | 0.027 | 0.026 | 0.006 | 0.08 | 0.036 | 0.008 | 0.013 | 0.027 | 0.022 | 0.022 | 0.034 | 0.148 |
| 13.2 | Column Leach Tests |
Column leach tests simulating heap leach conditions were conducted over 260 days, and yielded gold recoveries from 46% to 98% at an average of 73% for all materials tested. Individual results for the oxide, transition and reduced ores averaged 77%, 80% and 68% respectively. Rocks tested by column leach methods were crushed to 80% passing one-half inch. Lime was mixed with the dry composite charges before the 4-inch diameter PVC columns were loaded. A cyanide solution of 2.0 lb/ton was applied to the columns at a rate of 0.003 gpm/ft2 of column cross sectional area.
| 13.3 | Bottle Roll Tests |
Bottle roll tests were conducted for 96 hours on thirteen samples ground to minus 1700, 300, 150, and 75 microns (10, 48, 100 and 200 mesh sizes); these recoveries were 62%, 91%, 94% and 95% respectively. All tests were conducted at 40% solids. Lime was added to adjust the pH of the pulps to between 10.5 and 11.0 before adding the cyanide. Sodium cyanide equivalent to 2.0 lb. per ton of solution was added to the alkaline pulps. Gold recoveries from the 10 mesh feeds ranged from 17.9% to 87.5%. Gold recoveries from the 48 mesh feeds ranged from 70.0% to 96.7%. Gold recoveries from the 100 mesh feeds ranged from 88.9% to 97.8%. Gold recoveries from the 200 mesh feeds ranged from 85.7% to 97.4%. Rate of recovery from the 10 mesh feed was moderate, but were fairly rapid for the other feed sizes.
After leaching, rinsing and draining, residues were removed from the columns and moisture samples taken immediately. The remaining leached residues were air dried and split to obtain a sample for a tail screen analysis. Tail screens were conducted to determine residual precious metal content and distribution.
| 13.4 | Gravity Tests |
A gravity recoverable gold test was conducted on each of the 13 Spring Valley composites to determine response of the sample to gravity concentration. The gravity test consists of sequentially milling and processing a sample using a laboratory Knelson concentrator. Three sequential liberation/gravity concentration steps were conducted. Grind sizes evaluated were minus 20 mesh, 80% minus 65 mesh, 80% minus 100 mesh and 80% minus 200 mesh. The minus 20 mesh feeds were each processed through the Knelson concentrator. The resulting gravity rougher concentrate was cleaned by hand panning to produce a cleaner concentrate and a cleaner tail. The resulting rougher tailings were dried, blended and split to obtain a sample for tail screen analysis. The remaining rougher tailings were milled to the next grind size, and the process was repeated. Similarly, the resulting gravity rougher tailings from the second step were milled to the final grind size, and the process was again repeated.
September 9, 2014 | 67 |
|
Midway Gold Corp. Spring Valley Project | Certificate of Authors NI 43-101 Technical Report on Resources |
All 13 of the Spring Valley composites were amenable to gravity treatment at the feed sizes evaluated. Total rougher gold recoveries ranged from 78% to 97% and averaged 86% across all materials tested.
| 13.5 | Bond Mill Work Index |
Four samples representing reduced and oxidized material were selected for Bond Mill Work Index (BWi) determinations. The tests were completed by Philips Enterprises LLC of Golden, Colorado. The BWi ranged from 16.31 to 21.67 kW-hr/st.
| 13.6 | Historical Test Work |
Echo Bay conducted 144-hour bottle roll tests on seven 20 to 25 foot composites of RC cuttings logged as being in the oxide zone at McClelland Laboratories Inc. in 2002. Gold extractions progressed slowly, with extraction effectively complete after 96 hours. Cyanide consumption was low and lime requirements were moderate. Gold extractions ranged from 75% to 95% on nominal - 10 mesh material.
Glamis Gold conducted 96 hour bottle roll tests on three sulphide composites and two oxide composites in 2005. Composites were from HQ diameter core and tests were completed on both coarse crushed (nominal 10 mesh) and finely pulverized (200 mesh) material. Cyanide gold extraction ranged from 44%-88% from 10 mesh material, while gold extraction averaged 91%-95% from 200 mesh material.
In December 2005, samples from eight drill holes were submitted for metallurgical testing at McClelland Laboratories Inc. in Sparks, Nevada by Midway. Select samples were combined to produce 19 composites for gravity recoverable gold GRG testing. The composite samples were sequentially milled to progressively finer sizes, the resulting material (or gravity tailings after the first grind size) was processed using a laboratory Nelson Concentrator. The resulting concentrate and tailings were then assayed to determine gravity recovery of gold versus grind size. Testing in this way provides an estimate of the maximum recoverable gold values by gravity concentration. Recoveries for nine composites with head grades greater than 0.030 oz/t gold were between 67.5% and 96.5% with an average of 87.9%.
September 9, 2014 | 68 |
|
Midway Gold Corp. Spring Valley Project | Certificate of Authors NI 43-101 Technical Report on Resources |
The test samples described above are considered representative of the mineralization of the deposit as a whole. As of the date of this report, there are no additional processing factors that could have a significant effect on potential extraction.
| 13.7 | Summary & Recommendations |
Scoping testwork has shown that the mineralization at Spring Valley is amenable to cyanidation, and also that a large percentage of mineralization may be recovered using gravity separation methods. Cyanide recoveries for Spring Valley are relatively slow, possibly due to the presence of coarse gold. It is recommended that the Spring Valley Venture undertake additional testwork to evaluate several processing options including all gravity, heap leach, and gravity with agitated leach.
| 14. | MINERAL RESOURCE ESTIMATE |
Zachary J. Black, SME-RM, an associate Resource Geologist with Gustavson is responsible for the estimation of the mineral resource herein. Mr. Black is a qualified person as defined by NI 43-101 and is independent of Midway and of Barrick. Gustavson estimated the mineral resource for the Spring Valley Project from drill-hole data, constrained by a single mineralized boundary with an Ordinary Kriging (“OK”) algorithm.
The Mineral Resources contained within this Technical Report have been classified under the categories of Measured, Indicated and Inferred in accordance with standards as defined by the Canadian Institute of Mining, Metallurgy and Petroleum (“CIM”) “CIM Definition Standards - For Mineral Resources and Mineral Reserves”, prepared by the CIM Standing Committee on Reserve Definitions and adopted by CIM Council on December 17, 2010. Classification of the resources reflects the relative confidence of the grade estimates.
| 14.1 | Block Model Physical Limits |
Gustavson created a three dimensional (“3D”) block model in CAE Mining’s Studio software. The block model was created with individual block dimensions of 20 x 20 x 20 ft (xyz). The model origin is located at 1,319,880 east, 14,643,940 north, and at an elevation of 3,200 ft above sea level (“asl”). The block model extends 8,040 ft (402 blocks) to the east, 12,560 ft (628 blocks) to the north, and vertically 3,120 ft (156 blocks) to an elevation of 6,320 ft asl. All of the block model coordinates are stored as UTM NAD27, Zone 11 survey feet with elevations based on North American Vertical Datum (“NAVD”). All property and minerals within the block model extents are owned or claimed by Midway. Each of the blocks was assigned attributes of gold, resource classification, rock density, lithology, and a grade domain classification.
September 9, 2014 | 69 |
|
Midway Gold Corp. Spring Valley Project | Certificate of Authors NI 43-101 Technical Report on Resources |
| 14.2 | Data Used for the Grade Estimation |
Gustavson used the exploration drillhole database as described in 12.1.1 for resource estimation. Drill hole data, including collar coordinates, down hole surveys, sample assay intervals, and geologic logs, were provided in a secure Microsoft Access database and as CSV files. The database is managed by Barrick under the Exploration, Development, and Joint Operating Agreement.
The present database has been updated to include the 2010, 2011, 2012, and available 2013 drill holes, which were completed since the previous mineral resource estimate. The drill hole database contains gold assay analytical information for 112,858 sample intervals from core, RC, and mud rotary drilling methods. All mud rotary drill samples were pre-collar samples taken within the alluvium and thus are not included in the resource estimation.
| 14.3 | Data |
In order to assess the influence of geologic characteristics on assay data the individual files representing lithology, alteration, trace element analytical data, and gold analytical data were combined into a single interval file. The resulting file contained 121,488 intervals. The increase in the number of sample intervals results from the geologic or trace element data being collected on different intervals than the gold analytical data. Merging the intervals can subdivide individual assay intervals where the geologic data are recorded with a different interval pattern. The 121,488 samples were collected in both bedrock (99,821) and alluvium (21,667). Gustavson did not estimate mineral resources within the alluvium and the assay samples representing the alluvium are not included in the discussions below.
Metallic Screen assays are used as the primary assay database, when available, as this methodology is considered to handle coarse gold grade variability at Spring Valley more effectively than other assay techniques. Where Metallic Screen assays are not available, 30g fire assay values are used. Samples below detection limit (bdl) are treated as having a grade of half the detection limit applicable during the sampling campaign. (Typically 0.0001 oz/t Au) There is a distortion in the grade curves at the very low end caused by these bdl sample values, but it is not material to the estimate.
| 14.4 | Geologic Model |
The geology of the resource area is characterized by a thick series of Permian/Triassic aged volcanic and meta-volcanic rocks, named the Koipato Group. The Kiopato Group is comprised of three members from oldest to youngest, the Limerick Greenstone, the Rochester Rhyolite, the Weaver Rhyolite. Mississippian to Triassic Leucogranite and rhyolite porphyry locally intruded the Permian/Triassic units. Quaternary alluvial and colluvial deposits overlie the bedrock units.
September 9, 2014 | 70 |
|
Midway Gold Corp. Spring Valley Project | Certificate of Authors NI 43-101 Technical Report on Resources |
The regional structural model is interpreted to have resulted from three stages of structural development of the Humboldt Range. The earliest was an east-west compressional event associated with the Nevadan Orogeny, resulting in regional folds and north-south faults and shear zones. The second stage marked a switch to extensional stresses which coincided with and controlled the mineralization along the north-south structures and through the associated dilatational zones. The north-south structures acted as conduits for fluids, which resulted in veins, stockworks, and disseminated mineralization along preferential flow paths. The final stage of structural development was an event related to Basin and Range tectonics which formed a graben block controlled by the Black Ridge fault system.
This structural model results in penetrative thrust faults overprinted by a complex structural system of high angle fracture sets.
Mineralization is hosted within complex structurally prepared fracture zones near the north-south faults and along the contacts between lithologic units. Mineralization is related to irregularly distributed quartz veining and alteration throughout the favorable intrusive rhyolite porphyry, and along the contacts with the greenstone and volcanoclastic units of the Rochester Member. Most quartz veins are in the ½-inch to 4-inch size range with associated alteration selvages of a few feet to tens of feet wide, varying to areas of dense quartz veining with pervasive alteration. Individual vein zones generally display limited lateral and vertical continuity; however, mineralized zones form broader corridors characterized by extensive lateral (along lithologic contacts) and depth continuity along the north-south trending faults. The project has been divided into five areas along the north-south trending structures and into three areas based on east-west structures (Figure 14-1). As structural offsets have continued through the Quaternary period there is offset represented in the mineralization trends. The orientation and sample statistics have been grouped within north-south structures. The resulting subdivided areas are the basis for the estimation domains.
September 9, 2014 | 71 |
|
Midway Gold Corp. Spring Valley Project | Certificate of Authors NI 43-101 Technical Report on Resources |
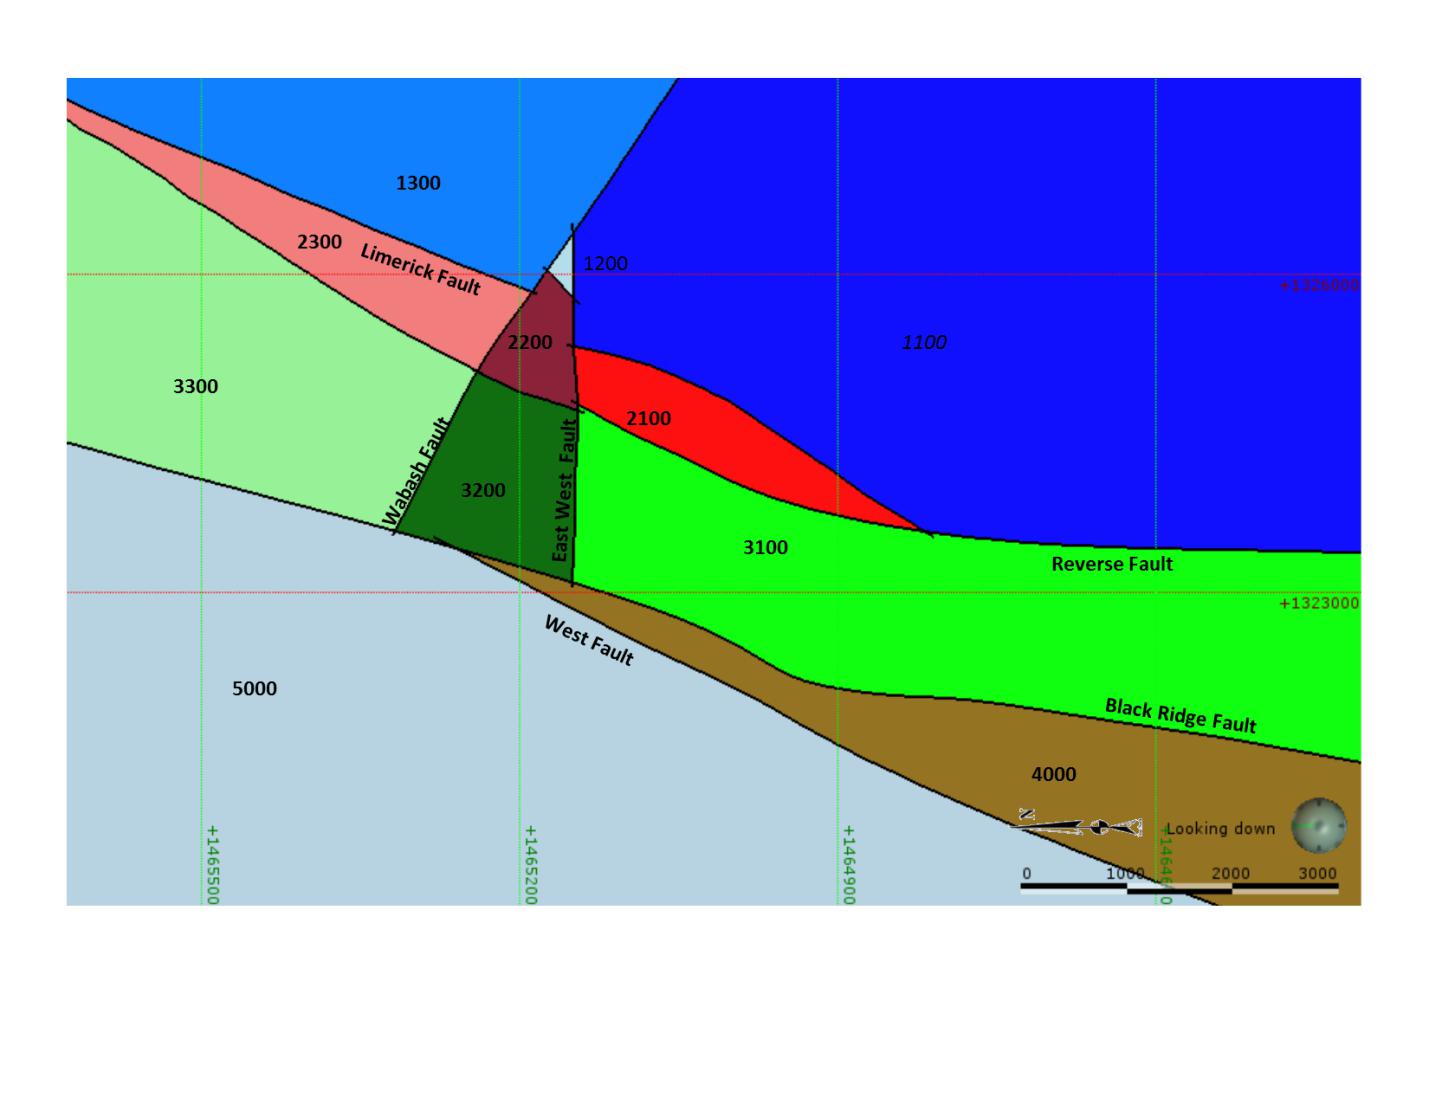
Figure 14-1 Fault and Estimation Domain Plan View
Domains 1100 – 1300 are the portion of Spring Valley to the east of the Limerick fault and represent an area of limited drilling with sporadic intervals of mineralization. This portion of the project is assumed to be unmineralized and has not been estimated.
Domains 2100 – 2300 are the portion of Spring Valley that represent the Limb domains. These domains are bound by the Reverse fault to the west and by the Limerick fault to the east and at depth. The mineralization in these domains strikes between N30E and N45E and dips approximately 30° to the west along the intrusive porphyry. Mineralization is found along lithologic contacts, the margins of the intrusive and near the low angle Limerick Fault.
Domains 3100 – 3300 comprise the Main domain and host the majority of mineralization. These domains are bound on east by the Reverse fault and on the west by the Black Ridge Fault. The mineralization within the Main domains resides near the two main structures, but is found in near tabular lenses related to contacts of the lithologic units and the margin of the intrusion.
September 9, 2014 | 72 |
|
Midway Gold Corp. Spring Valley Project | Certificate of Authors NI 43-101 Technical Report on Resources |
Domains 4000 and 5000 are to the west of the Black Ridge fault. The mineralization in these domains is primarily along lithologic contacts in close proximity the West and Black Ridge Faults.
| 14.5 | Exploratory Data Analysis |
Gustavson completed an Exploratory Data Analysis (EDA) on the gold analytical information contained in the Spring Valley exploration database. The purpose of an EDA is to summarize the main characteristics of the data provided using both statistical and visual methods. Gustavson utilized Leapfrog Geo (Geo) and ioGas Software to analyze the assay data.
The assay and geologic information was visually inspected in 3-dimensions, cross-sections, and plan views in Geo. As with many precious metal exploration projects much of the drillhole assay data collected is within non-mineralized zones. Metallic screen assays have a lower detection limit of 0.0015 oz/t and as such the exploratory data analysis was limited to assay values above 0.002 oz/t. Filtering the data assisted in defining zones of structural offset and differing directions of maximum continuity (Figure 14-2).
September 9, 2014 | 73 |
|
Midway Gold Corp. Spring Valley Project | Certificate of Authors NI 43-101 Technical Report on Resources |
![]()
Figure 14-2 Oblique View of Filtered Gold Values (Au≥.002 oz/t) Limerick Trend Encircled
September 9, 2014 | 74 |
|
Midway Gold Corp. Spring Valley Project | Certificate of Authors NI 43-101 Technical Report on Resources |
The individual lithologic codes in the provided database were grouped into 7 primary lithologic units (Table 14-1) based on Midway’s understanding of the Spring Valley geology. Descriptive statistics were calculated for the grouped lithologies.
Table 14-1 Lithologic Groups
| Grouped Lithology | Lithology Codes |
| Alluvium (Qal) | Qal |
| Breccia and Veins (BX_Vn) | BX, VN |
| Fault (FLT) | FLT,GG |
| Limerick (Lmk) | AFT,LG,LK,LKAN,LKGW |
| Rhyolite (Rhy) | RP,RY,RYLT,RYSP |
| Volcanoclastic Sediments (VCS) | BC,FEL,SD,WT |
| Feldspar Porphyry (Inf) | DI,FELN,FP,FPB,HP,IBX,MINT,MZ, BP |
The descriptive statistics presented in Table 14-2 support the visual inference that the statistical analysis of the mineralization can be restricted to the gold assay values ≥ 0.002 oz/t as represented by the total sample populations 75 percentile. The statistics indicate that there are subtle differences in the mineralization by lithology with the feldspar porphyry containing the higher average grades. The Limerick lithology is statistically lower grade with only 10-percent of the assays reporting ≥ 0.002 oz/t gold. The mineralized portions of the Limerick are assumed to be near the contact with the Rochester rhyolite or at structural contacts.
Table 14-2 Spring Valley Project Sample Assay Gold Descriptive Statistics (oz/t)
| Statistic | Total | Not Logged | Breccia and Veins | Faults | Feldspar Porphyry | Limerick | Rhyolite | Volcanoclastic Sediments |
| Number of Samples | 99,821 | 6,280 | 2,473 | 4,105 | 19,371 | 22,652 | 16,633 | 28,307 |
| Minimum (oz/t) | 0.0001 | 0.0001 | 0.0001 | 0.0001 | 0.0001 | 0.0001 | 0.0001 | 0.0001 |
| Maximum (oz/t) | 9.1001 | 1.8142 | 6.1834 | 0.7204 | 9.1001 | 5.3667 | 5.6438 | 2.4588 |
| Mean (oz/t) | 0.0065 | 0.0079 | 0.0112 | 0.0056 | 0.0105 | 0.0022 | 0.0056 | 0.0073 |
| Median (oz/t) | 0.0005 | 0.0004 | 0.0007 | 0.0007 | 0.0007 | 0.0001 | 0.0003 | 0.0007 |
| Variance (oz/t2) | 0.0050 | 0.0030 | 0.0167 | 0.0008 | 0.0145 | 0.0016 | 0.0034 | 0.0021 |
| Std. Dev. (oz/t) | 0.0705 | 0.0545 | 0.1292 | 0.0278 | 0.1205 | 0.0396 | 0.0580 | 0.0459 |
| Kurtosis | 8129.4 | 553.6 | 2108.8 | 298.8 | 4039.6 | 14879.2 | 5774.7 | 992.2 |
| Skewness | 77.3 | 21.3 | 44.4 | 15.1 | 59.0 | 112.4 | 65.9 | 26.1 |
| COV | 118.3 | 48.1 | 133.1 | 25.5 | 131.5 | 330.6 | 108.4 | 39.4 |
Descriptive statistics (Table 14-3), Cumulative Frequency Plots (CFP) (Figure 14-3), and Tukey box plots (Figure 14-4) were calculated for each lithology with a minimum gold value of ≥0.002 oz/t to compare the statistical populations to one another and to evaluate for any statistical outliers. The descriptive statistics restricted to ≥0.002 oz/t reduce the differences between lithologies with the Limerick still representing a slightly lower average grade. However, as the populations approach the upper percentiles of the CFP (Figure 14-3) they converge. This may indicate that a significant portion of the higher grade mineralization consists of stockwork veining or other structurally related mineralization within each of the lithologies. Statistical Tukey outliers are represented on both plots as open circle and triangle symbols.
September 9, 2014 | 75 |
|
Midway Gold Corp. Spring Valley Project | Certificate of Authors NI 43-101 Technical Report on Resources |
Table 14-3 Descriptive Statistics ≥0.002 oz/t Au by Lithology
| Statistic | Total | Not Logged | Breccia and Veins | Faults | Feldspar Porphyry | Limerick | Rhyolite | Volcanoclastic Sediments |
| Number of Samples | 25,250 | 1,673 | 899 | 1,092 | 7,156 | 2,224 | 3,748 | 8,458 |
| Minimum (oz/t) | 0.0020 | 0.0020 | 0.0020 | 0.0020 | 0.0020 | 0.0020 | 0.0020 | 0.0020 |
| Maximum (oz/t) | 9.1001 | 1.8142 | 6.1834 | 0.7204 | 9.1001 | 5.3667 | 5.6438 | 2.4588 |
| Mean (oz/t) | 0.0247 | 0.0285 | 0.0298 | 0.0200 | 0.0276 | 0.0193 | 0.0238 | 0.0234 |
| Median (oz/t) | 0.0071 | 0.0072 | 0.0090 | 0.0073 | 0.0087 | 0.0053 | 0.0071 | 0.0067 |
| Variance (oz/t2) | 0.0192 | 0.0106 | 0.0454 | 0.0026 | 0.0389 | 0.0157 | 0.0145 | 0.0067 |
| Std. Dev. (oz/t) | 0.1387 | 0.1028 | 0.2131 | 0.0512 | 0.1972 | 0.1252 | 0.1204 | 0.0818 |
| Kurtosis | 2129.1 | 153.1 | 776.6 | 86.1 | 1514.4 | 1503.0 | 1358.5 | 316.2 |
| Skewness | 39.8 | 11.3 | 27.0 | 8.2 | 36.2 | 35.9 | 32.2 | 14.9 |
| COV | 31.5 | 13.1 | 51.1 | 6.5 | 51.1 | 42.1 | 25.6 | 12.2 |

Figure 14-3 Gold (oz/t) Cumulative Frequency Plots by Lithology
September 9, 2014 | 76 |
|
Midway Gold Corp. Spring Valley Project | Certificate of Authors NI 43-101 Technical Report on Resources |
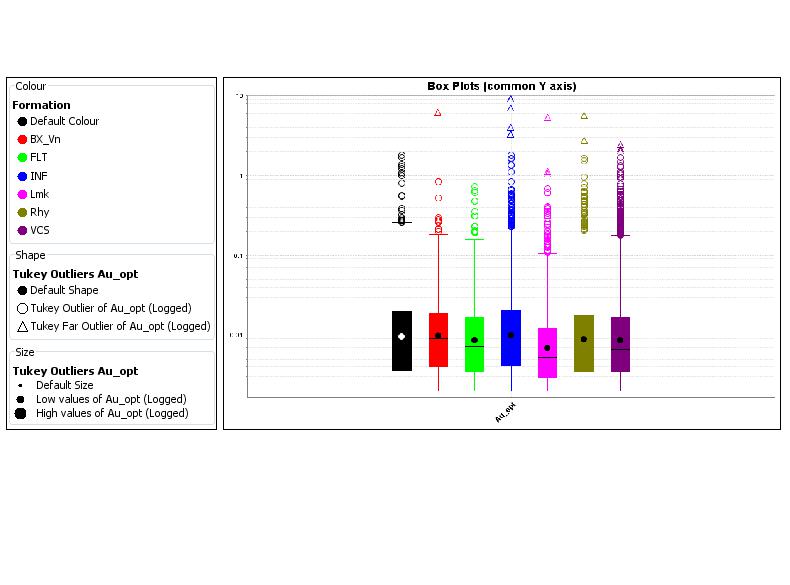
Figure 14-4 Gold (oz/t) Box Plots by Lithology
The high Coefficient of Variation (COV) within gold assays in each lithologic unit and the overall statistical similarities at the higher grade intervals between the individual lithologies suggests that lithology is not the primary controlling feature of the mineralization at Spring Valley; however, due to the difficulties in accurately defining the lithology from the drill hole samples a correlation between lithology an mineralization may be masked. Similar statistical results were encountered in Gustavson’s evaluation of gold correlation with alteration types.
Gold has been observed in quartz veins and adjacent alteration selvages as disseminated free gold. Free gold is likely deposited on fracture surfaces as well. Most quartz veinlets range from ½ inch to 4 inches in size, with associated alteration selvages from a few feet to tens of feet wide and variable areas of dense quartz veining with pervasive alteration.
It has been observed that gold is associated in certain areas of the system with zones of structural preparation as indicated by low RQD values and structural preparation observed in drill core. However, there is no observable correlation between RQD and gold grade, possibly because there are also areas of structural preparation, quartz veining, and gold mineralization which have healed and are no longer fractured, as well as areas of post-mineral faulting where there is low RQD but no mineralization.
Based on field and laboratory observations, mineralization at Spring Valley is postulated to be associated with RQD, specific alteration types, and lithology; however, statistical analyses do not necessarily support these hypotheses. The discrepancy between the postulated associations and the results of the statistical analysis may simply reflect the challenges of effectively logging complex geologic characteristics such as those present at Spring Valley.
September 9, 2014 | 77 |
|
Midway Gold Corp. Spring Valley Project | Certificate of Authors NI 43-101 Technical Report on Resources |
In an attempt to correlate the higher grades (in vein material) to the lower grade alteration selvages Gustavson conducted a proximity analysis. An indicator of 0.022 oz/t was selected to represent vein material (high grade) and statistics of data ≥0.002 oz/t, ≥0.004 oz/t, ≥0.006 oz/t, ≥0.008 oz/t, and ≥0.01 oz/t were tabulated for samples residing within 1, 2, 3, 4, and 5 intervals of in vein material. Table 14-5 summarizes the results of the study.
The proximity analysis identified that 61% of the mineralized (≥0.002 oz/t) material resides within approximately 25-ft of a higher grade (≥0.022 oz/t) interval. Additionally, the higher the minimum cutoff analyzed the stronger the correlation to the indicator (≥0.022 oz/t). The analysis is useful in separating the portion of data near the lower tail of the mineralized distribution that is not related to the higher grade zones. The histogram in Figure 14-5 displays the gold assay data within 5 intervals of a high grade sample and Figure 14-6 summarizes the results of the proximity analysis.
September 9, 2014 | 78 |
|
Midway Gold Corp. Spring Valley Project | Certificate of Authors NI 43-101 Technical Report on Resources |

Figure 14-5 Histogram of Samples within 5 Intervals (~25 ft) of a ≥ 0.022 oz/t Assay Interval
September 9, 2014 | 79 |
|
Midway Gold Corp. Spring Valley Project | Certificate of Authors NI 43-101 Technical Report on Resources |

Figure 14-6 Samples above Cutoff within Range of Vein (>0.022 oz/t) Assay Interval
Note that 84% of samples above 0.01 oz/t are within a 25-foot distance of vein intervals
Treating the vein material (>0.022 oz/t Au) to be representative of the mineralized structures, it is clear that the majority of mineralized material can be found in close proximity to these structures. This is consistent with patterns of mineralization observed in section and plan. A visual evaluation of the assay and geologic data in cross-section and plan view, in conjunction with the proximity analysis, reveals that while it is difficult to substantiate lithologic or alteration based domaining, there exists a significant spatial correlation between the higher grade samples and disseminated mineralization. It is Gustavson’s opinion that the statistical analyses justify the use of a grade boundary at +0.003 oz/t, as a proxy for the mineralized alteration selvages and vein zones, and domaining the resource within this grade boundary is both reasonable and appropriate.
| 14.6 | Compositing |
A composite study comparing the population variance and average grades was completed (Figure 14-7). A composite length of 10-foot down-hole was selected for estimation as it is larger in length than the longest sample intervals; long enough to provide a variance reduction (40%) relative to using raw assay data, and still short enough to allow the estimate to show local variability of grade consistent with the sample distribution of the deposit. The composite statistics are summarized on Figure 14-7.
September 9, 2014 | 80 |
|
Midway Gold Corp. Spring Valley Project | Certificate of Authors NI 43-101 Technical Report on Resources |

Figure 14-7 Composite Study
| 14.7 | Capping |
Grade capping is the practice for replacing statistical outliers with a maximum value from the assumed sampled distribution. This is done to better approximate the true mean of the sample population. The estimation of highly skewed grade distributions can be sensitive to the presence of even a few extreme values. Gustavson utilized a log scale cumulative Frequency Plot (“CFP”) of the composite data for gold ≥0.001 oz/t to identify the presence of statistical outliers (Figure 14-8). A cap was assigned for each domain as summarized in Table 14-4. The descriptive sample statistics are presented in Figure 14-8.
Table 14-4 Capped Value by Domain
| Domain | Description | Au Cap (oz/t) |
| 2100 - 2300 | Limb (Red) | 0.700 |
| 3100 -3300 | Main (Green) | 0.700 |
| 4000 | West 1 (Cyan) | 0.200 |
| 5000 | West 2 (Blue) | 0.030 |
September 9, 2014 | 81 |
|
Midway Gold Corp. Spring Valley Project | Certificate of Authors NI 43-101 Technical Report on Resources |

Figure 14-8 CFP Analysis by Domain
September 9, 2014 | 82 |
|
Midway Gold Corp. Spring Valley Project | Certificate of Authors NI 43-101 Technical Report on Resources |
| 14.8 | Grade Shell Generation |
Leapfrog Geo software was used to generate grade boundaries using a Radial Basis Function (“RBF”) in conjunction with a dual kriging algorithm. Leapfrog implicitly defined a lower grade boundaries for the Project at a 0.003 oz/t cut-off based on 10-foot composited intervals using a structural trend defined by geologic observations and split by the individual domain boundaries (Figure 14-9). The grade boundary has been used to constrain each of the estimation domains. The grade boundary was used to code blocks and the drill-hole assay composites residing within the individual grade boundary solid. The descriptive statistics are summarized in Table 14-5.

Figure 14-9 Grade Boundary
Table 14-5 Capped 10-foot Composite Statistics ≥0.001 oz/t
| Domain | Below | Inside | Minimum | Maximum | Mean | Variance | Std. Dev. | COV |
| 2100 | 401 | 1389 | 0.0010 | 0.645 | 0.0233 | 0.0035 | 0.0590 | 2.53 |
| 2200 | 215 | 871 | 0.0010 | 0.676 | 0.0276 | 0.0043 | 0.0655 | 2.37 |
| 2300 | 174 | 661 | 0.0010 | 0.500 | 0.0151 | 0.0014 | 0.0374 | 2.48 |
| 3100 | 1111 | 4075 | 0.0010 | 0.700 | 0.0165 | 0.0017 | 0.0409 | 2.48 |
| 3200 | 362 | 1328 | 0.0010 | 0.700 | 0.0194 | 0.0020 | 0.0451 | 2.33 |
| 3300 | 861 | 2667 | 0.0010 | 0.700 | 0.0198 | 0.0022 | 0.0463 | 2.34 |
| 4000 | 254 | 841 | 0.0010 | 0.200 | 0.0148 | 0.0007 | 0.0273 | 1.85 |
| 5000 | 114 | 276 | 0.0010 | 0.030 | 0.0090 | 0.0001 | 0.0088 | 0.98 |
September 9, 2014 | 83 |
|
Midway Gold Corp. Spring Valley Project | Certificate of Authors NI 43-101 Technical Report on Resources |
| 14.9 | Variography |
A variography analysis was completed to establish spatial variability of gold values in the deposit. Variography establishes the appropriate contribution that any specific composite should have when estimating a block volume value within a model. This is performed by comparing the orientation and distance used in the estimation to the variability of other samples of similar relative direction and distance.
Variograms were created for horizontal and vertical orientations in increments of 15° horizontally and 15° vertically. Search ellipsoid axis orientations were based on the results of the analysis. The sill and nugget values were taken from the omnidirectional and down-hole variograms, respectively. Table 14-6 summarizes the variogram parameters used for the analysis. The resultant variograms (Figures 14-10 through 14-12) were used to define the search ellipsoid responsible for the sample selection in the estimation of each block (Table 14-7).
The ellipse orientations are rotated dynamically to better represent changes in the strike and dip of the mineralization. A dynamic anisotropy was applied to both the search volume and to the variogram model. With this method, the orientation of the search ellipse and variogram model changes on a block by block basis to accommodate for local variations in the orientation of mineralization.
September 9, 2014 | 84 |
|
Midway Gold Corp. Spring Valley Project | Certificate of Authors NI 43-101 Technical Report on Resources |
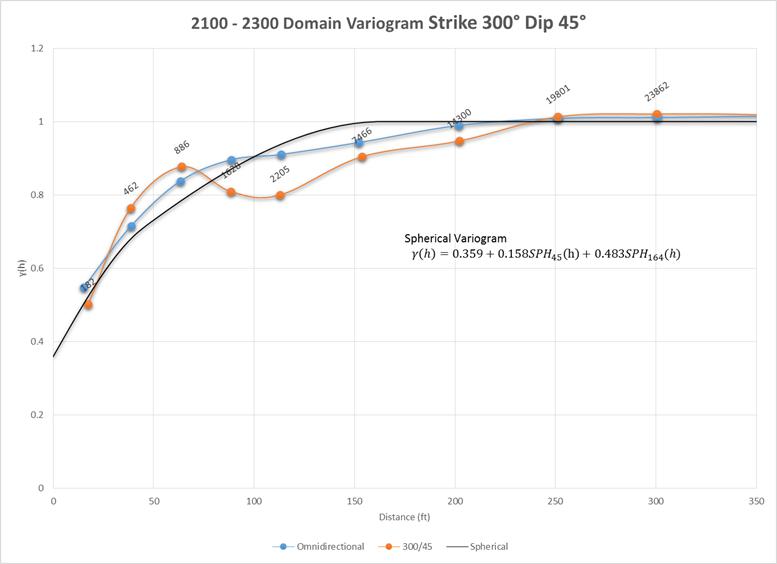

Figure 14-10 Example Variograms, 2100-2300 domain
September 9, 2014 | 85 |
|
Midway Gold Corp. Spring Valley Project | Certificate of Authors NI 43-101 Technical Report on Resources |


Figure 14-11 Example Variograms, 3100-3300 domain
September 9, 2014 | 86 |
|
Midway Gold Corp. Spring Valley Project | Certificate of Authors NI 43-101 Technical Report on Resources |


Figure 14-12 Example Variograms, 3100-3300 domains
September 9, 2014 | 87 |
|
Midway Gold Corp. Spring Valley Project | Certificate of Authors NI 43-101 Technical Report on Resources |

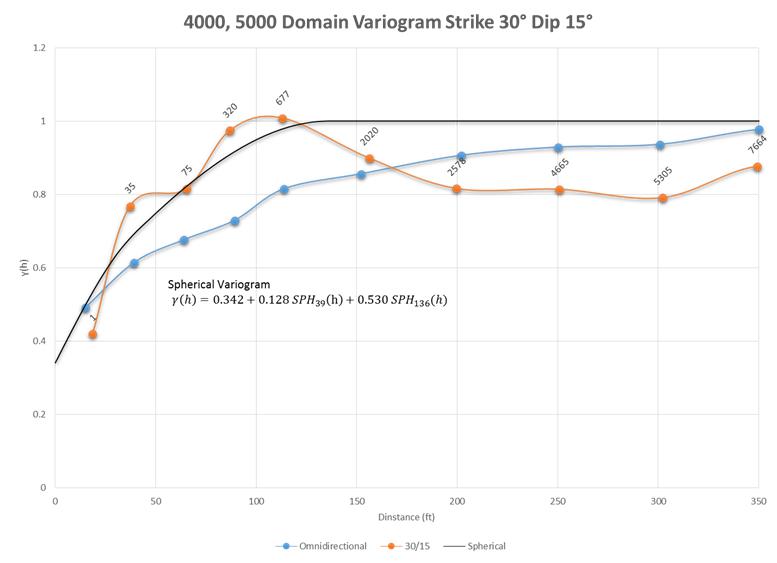
Figure 14-13 Example Variograms, 4000-5000 domains
September 9, 2014 | 88 |
|
Midway Gold Corp. Spring Valley Project | Certificate of Authors NI 43-101 Technical Report on Resources |

Figure 14-14 Example Variograms, 4000-5000 domains
Table 14-6 Domain Variogram Parameters
| 2100 - 2300 Domain Variogram Parameters | |||
| Nugget (C0) | C1 | C2 | |
| 0.359 | 0.158 | 0.483 | |
| Axis | Rotation | Range 1 | Range 2 |
| Z | -60 | 30 | 86 |
| Y' | 0 | 42 | 144 |
| X' | 45 | 45 | 164 |
| 3100 - 3300 Domain Variogram Parameters | |||
| Nugget (C0) | C1 | C2 | |
| 0.409 | 0.295 | 0.295 | |
| Axis | Rotation | Range 1 | Range 2 |
| Z | 30 | 33 | 253 |
| Y' | 0 | 58 | 157 |
| X' | 15 | 65 | 247 |
| 4000 - 5000 Domain Variogram Parameters | |||
| Nugget (C0) | C1 | C2 | |
| 0.342 | 0.128 | 0.530 | |
| Axis | Rotation | Range 1 | Range 2 |
| Z | -60 | 39 | 136 |
| Y' | -15 | 28 | 116 |
| X' | 180 | 26 | 299 |
September 9, 2014 | 89 |
|
Midway Gold Corp. Spring Valley Project | Certificate of Authors NI 43-101 Technical Report on Resources |
| 14.10 | Estimation Methodology |
Gold grades were estimated in each domain by using incremental search ellipses oriented in the direction of maximum geologic and geostatistical continuity to provide an estimation of the gold grade within every block inside the grade shells. The estimation of each block was based on a factor of the distance in an anisotropic direction as established by the second structure range (Table 14-6) and from the variogram model and geologic observations of anisotropy. The 2100-2300 domains were set at a 3:3:1 anisotropy. The 3100 – 3300, 4000, and 5000 domains were set to 2:2:1 anisotropy.
Ordinary Kriging (OK) was used to estimate grade for all domains. Grade estimation uses a maximum of 3 composites from an individual drillhole, with a minimum of 4 and a maximum of 8 composites total used for estimation. The minimum number of composites was selected to ensure that a minimum of two separate drillholes contribute data for estimation of grade at a block. The maximum number of composites was set relatively low to limit grade smoothing in the estimation, and to allow for a higher local variability of grade. Estimation parameters are presented in Table 14-7.
Table 14-7 Estimation Parameters
| Estimation Parameters | |||
| Zone | Grade Shells | ||
| No. of composites | 1st Pass | 2nd Pass | 3rd Pass |
| Min | 4 | 4 | 4 |
| Max | 8 | 8 | 8 |
| Max per Hole | 3 | 3 | 3 |
| Search Ellipsoid Distance | |||
| 2100-2300 | ½ (75x75x25) | 1 (150x150x50) | 2 (300x300x100) |
| 3100-3300 | ½ (125x125x62.5) | 1 (250x250x125) | 2 (500x500x250) |
| 4000,5000 | ½ (125x125x62.5) | 1 (250x250x125) | 2 (500x500x250) |
| 14.11 | Mineral Resource Classification |
The mineral resources were classified using the incremental search neighborhoods and a relationship between the distances to the closest composite used for the estimation of the block gold grade. Distance to closest composite is stored as anisotropic distance relative to the search volume. The Measured classification corresponds to blocks with 2 drillholes within ½ the range of the second variogram structure, while the Indicated classification corresponds to two drillholes within the range of the second variogram structure AND a single drillhole within 75% of the variogram range. Inferred material is limited to blocks within twice the variogram range of two drillholes for each domain.
September 9, 2014 | 90 |
|
Midway Gold Corp. Spring Valley Project | Certificate of Authors NI 43-101 Technical Report on Resources |
| 14.12 | Density |
Density measurements for each lithology were provided to Gustavson. Each modeled lithology was assigned a density based on Table 14-8.
Table 14-8 Rock Type Density Summary
| Grouped Lithology | Density (ton/ft3) |
| Alluvium (Qal) | 0.0787 |
| Rhyolite (Rhy) | 0.0794 |
| SD (SD) | 0.0787 |
| Welded Tuff (WT) | 0.0816 |
| Breccia Conglomerate (BC) | 0.0831 |
| Feldspar Porphyry (Inf) | 0.0820 |
| Limerick Greenstone (Lmk) | 0.0830 |
| 14.13 | Model Validation |
Gustavson validated the results of the OK method by comparison with various alternative estimation methodologies. The combined evidence from these validation methods validates the OK method estimation model results.
| 14.13.1 | Statistical Model Comparison |
ID2, and NN models were run to serve as comparison with the estimated results from the OK method. Descriptive statistics for the OK model along with those for the ID2 and NN, and 10-foot drill-hole composites for gold are shown in Tables 14-9 through 14-11.
Table 14-9 Descriptive Statistics for Domains 2100-2300 (Limb)
| Domain 2100 Au ≥0.001 oz/t | ||||||||
| Model | Below | Inside | Minimum | Maximum | Mean | variance | Std. Dev. | COV |
| CP10 | 401 | 1389 | 0.0010 | 0.645 | 0.0233 | 0.0035 | 0.0590 | 2.53 |
| OK | 530 | 33251 | 0.0010 | 0.276 | 0.0166 | 0.0004 | 0.0207 | 1.25 |
| ID | 656 | 33125 | 0.0010 | 0.299 | 0.0169 | 0.0005 | 0.0220 | 1.30 |
| NN | 8470 | 25311 | 0.0010 | 0.645 | 0.0210 | 0.0027 | 0.0523 | 2.49 |
| Domain 2200 Au ≥0.001 oz/t | ||||||||
| Model | Below | Inside | Minimum | Maximum | Mean | variance | Std. Dev. | COV |
| CP10 | 215 | 871 | 0.0010 | 0.676 | 0.0276 | 0.0043 | 0.0655 | 2.37 |
| OK | 510 | 29790 | 0.0010 | 0.295 | 0.0215 | 0.0007 | 0.0268 | 1.25 |
| ID | 631 | 29669 | 0.0010 | 0.320 | 0.0220 | 0.0009 | 0.0295 | 1.34 |
| NN | 7421 | 22879 | 0.0010 | 0.676 | 0.0287 | 0.0047 | 0.0683 | 2.38 |
September 9, 2014 | 91 |
|
Midway Gold Corp. Spring Valley Project | Certificate of Authors NI 43-101 Technical Report on Resources |
| Domain 2300 Au ≥0.001 oz/t | ||||||||
| Model | Below | Inside | Minimum | Maximum | Mean | variance | Std. Dev. | COV |
| CP10 | 174 | 661 | 0.0010 | 0.500 | 0.0151 | 0.0014 | 0.0374 | 2.48 |
| OK | 366 | 25995 | 0.0010 | 0.189 | 0.0126 | 0.0002 | 0.0151 | 1.20 |
| ID | 506 | 25855 | 0.0010 | 0.205 | 0.0133 | 0.0003 | 0.0173 | 1.30 |
| NN | 5717 | 20644 | 0.0010 | 0.500 | 0.0163 | 0.0019 | 0.0439 | 2.69 |
September 9, 2014 | 92 |
|
Midway Gold Corp. Spring Valley Project | Certificate of Authors NI 43-101 Technical Report on Resources |
Table 14-10 Descriptive Statistics for Domains 3100-3300 (Main)
| Domain 3100 Au ≥0.001 oz/t | ||||||||
| Model | Below | Inside | Minimum | Maximum | Mean | variance | Std. Dev. | COV |
| CP10 | 1111 | 4075 | 0.0010 | 0.700 | 0.0165 | 0.0017 | 0.0409 | 2.48 |
| OK | 1237 | 178015 | 0.0010 | 0.272 | 0.0129 | 0.0002 | 0.0143 | 1.10 |
| ID | 1600 | 177652 | 0.0010 | 0.294 | 0.0133 | 0.0002 | 0.0157 | 1.18 |
| NN | 38250 | 141002 | 0.0010 | 0.700 | 0.0160 | 0.0014 | 0.0373 | 2.34 |
| Domain 3200 Au ≥0.001 oz/t | ||||||||
| Model | Below | Inside | Minimum | Maximum | Mean | variance | Std. Dev. | COV |
| CP10 | 362 | 1328 | 0.0010 | 0.700 | 0.0194 | 0.0020 | 0.0451 | 2.33 |
| OK | 383 | 90502 | 0.0010 | 0.237 | 0.0149 | 0.0003 | 0.0159 | 1.06 |
| ID | 548 | 90337 | 0.0010 | 0.308 | 0.0158 | 0.0003 | 0.0184 | 1.16 |
| NN | 17719 | 73166 | 0.0010 | 0.700 | 0.0187 | 0.0020 | 0.0447 | 2.39 |
| Domain 3300 Au ≥0.001 oz/t | ||||||||
| Model | Below | Inside | Minimum | Maximum | Mean | variance | Std. Dev. | COV |
| CP10 | 861 | 2667 | 0.0010 | 0.700 | 0.0198 | 0.0022 | 0.0463 | 2.34 |
| OK | 346 | 156005 | 0.0010 | 0.302 | 0.0163 | 0.0004 | 0.0192 | 1.18 |
| ID | 477 | 155874 | 0.0010 | 0.414 | 0.0165 | 0.0004 | 0.0205 | 1.24 |
| NN | 30276 | 126075 | 0.0010 | 0.700 | 0.0195 | 0.0018 | 0.0425 | 2.18 |
Table 14-11 Descriptive Statistics for Domains 4000 and 5000 (West 1 and West 2)
| Domain 4000 Au ≥0.001 oz/t | ||||||||
| Model | Below | Inside | Minimum | Maximum | Mean | variance | Std. Dev. | COV |
| CP10 | 254 | 841 | 0.0010 | 0.200 | 0.0148 | 0.0007 | 0.0273 | 1.85 |
| OK | 1737 | 52032 | 0.0010 | 0.081 | 0.0116 | 0.0001 | 0.0101 | 0.88 |
| ID | 1664 | 52105 | 0.0010 | 0.107 | 0.0126 | 0.0002 | 0.0130 | 1.03 |
| NN | 15502 | 38267 | 0.0010 | 0.200 | 0.0172 | 0.0011 | 0.0334 | 1.94 |
| Domain 5000 Au ≥0.001 oz/t | ||||||||
| Model | Below | Inside | Minimum | Maximum | Mean | variance | Std. Dev. | COV |
| CP10 | 114 | 276 | 0.0010 | 0.030 | 0.0090 | 0.0001 | 0.0088 | 0.98 |
| OK | 561 | 24965 | 0.0010 | 0.026 | 0.0068 | 0.0000 | 0.0030 | 0.44 |
| ID | 843 | 24683 | 0.0010 | 0.029 | 0.0073 | 0.0000 | 0.0037 | 0.51 |
| NN | 8705 | 16821 | 0.0010 | 0.030 | 0.0092 | 0.0001 | 0.0092 | 1.00 |
The overall reduction of the maximum, standard deviation, and coefficient of variation within the OK and ID models represent an appropriate amount of smoothing to account for the point to block volume variance relationship (Figure 14-10). The kriging algorithm’s tendency is to provide more appropriate smoothing in densely drilled areas and to merge the mean of the estimation gradually as data becomes sparser. In this particular estimate there is a high density of data in higher grade portions of the resource as compared to the lower grade areas resulting in an overall reduction in the mean of the estimated blocks. The close relationship between the OK model and the ID model indicates that the OK model as estimated assumes a high degree of grade selectivity in the mining operation. Care will need to be taken at the reserve stage to ensure that the degree of selectivity in the model is appropriate to the mining technique envisioned. It may be necessary to apply dilution and ore loss factors to a reserve model based on this resource if relatively low selectivity (i.e. large scale open pit) mining techniques are employed.
September 9, 2014 | 93 |
|
Midway Gold Corp. Spring Valley Project | Certificate of Authors NI 43-101 Technical Report on Resources |

Figure 14-15 Model Comparison Cumulative Frequency Plot (OK red, ID blue, NN Black)
| 14.14 | Swath Plots |
Swath plots were generated to compare average gold grade in the estimated gold grade from OK method, the Barrick model and the validation model methods (ID3 and NN). The results from the
September 9, 2014 | 94 |
|
Midway Gold Corp. Spring Valley Project | Certificate of Authors NI 43-101 Technical Report on Resources |
OK model method, plus those for the validation ID2 and Barrick model methods are compared using the swath plot to the distribution derived from the NN model method (Figure 14-11).

Figure 14-16 Elevation Swath Model
On a local scale, the NN model method does not provide a reliable estimate of grade, but on a much larger scale, it represents an unbiased estimation of the grade distribution based on the total data set. Therefore, if the OK model is unbiased, the grade trends may show local fluctuations on a swath plot, but the overall trend should be similar to the distribution of grade from the NN. The Nearest Neighbor estimation represents declustered composite grades, which eliminates the impact of variable drill spacing. Overall, there is good correlation between the grade models.
September 9, 2014 | 95 |
|
Midway Gold Corp. Spring Valley Project | Certificate of Authors NI 43-101 Technical Report on Resources |
| 14.15 | Mineral Resources |
The mineral resource estimate for the Spring Valley Project is summarized in Table 14-12. This mineral resource estimate includes all of the available drill data through the effective date of this report and has been independently verified by Gustavson. Mineral resources are not mineral reserves and may be materially affected by economic, environmental, permitting, legal, socio-economic, marketing, political, or other factors.
Gustavson used a cutoff grade to test for reasonable prospects for economic extraction.
Baseline assumptions for cutoff grade are based on the formula:
| · | Cutoff Grade (oz/t) = Operating Cost (per t) / Metal Price (per oz) / Metal Recovery (%) |
| · | Gold price assumption of $1537 /oz is based on the trailing 3-year average gold price as of the effective date of this report. |
Basis of Assumptions Crush & Heap Leach Case:
| · | Operating Cost (Open Cut mining, Heap leach, Carbon Recovery): $7.00/ton (assuming 1.5:1 stripping ratio, $1.60/t mining cost, $3.30/t Heap Leach Process cost) |
| · | Gold Price: $1537 /oz |
| · | Gold Recovery (Crush and Heap Leach): 73% |
| · | Cutoff grade = $7.00 /ton / $1537/oz / 73% = 0.0062 oz/t |
Based on these assumptions, Gustavson considers that reporting resources at a 0.006 oz/t cutoff constitutes reasonable prospects for economic extraction based on an open pit mining scenario with carbon recovery following cyanide heap leaching. Mineral resources are reported in Table 14-12. Additional cutoff grades are included to allow for direct comparison with prior reporting. Gustavson cautions that economic viability can only be demonstrated through prefeasibility or feasibility studies.
September 9, 2014 | 96 |
|
Midway Gold Corp. Spring Valley Project | Certificate of Authors NI 43-101 Technical Report on Resources |
Table 14-12 Mineral Resource Statement for the Spring Valley Project,
Pershing County, Nevada, Gustavson Associates, LLC, April 30, 2014
| Measured | Indicated | Measured + Indicated | Inferred | |||||||||
| Cutoff | Tons | Gold | Tons | Gold | Tons | Gold | Tons | Gold | ||||
| oz/t | (x1000) | oz/t | t. oz. (x1000) | (x1000) | oz/t | t. oz. (x1000) | (x1000) | oz/t | t. oz. (x1000) | (x1000) | oz/t | t. oz. (x1000) |
| 0.008 | 60,100 | 0.023 | 1,410 | 116,400 | 0.021 | 2,400 | 176,600 | 0.022 | 3,810 | 46,400 | 0.019 | 880 |
| 0.006 | 75,300 | 0.020 | 1,510 | 147,300 | 0.018 | 2,610 | 222,600 | 0.019 | 4,120 | 62,100 | 0.016 | 990 |
| *0.004 | 91,500 | 0.017 | 1,590 | 179,100 | 0.016 | 2,780 | 270,600 | 0.016 | 4,370 | 78,400 | 0.014 | 1,070 |
Note * based on discussion of cutoff presented above, material below 0.006 oz/t is not considered resource for the purposes of this report. 0.004 oz/t cutoff is presented for informational purposes and for consistency with prior reports. Note: Values may not sum due to rounding.
| 14.16 | Pit-constrained Mineral Resource |
In order to assess on a preliminary basis the portion of the Spring Valley resource accessible by open pit mining methods, Lechs-Grossman pit shells were generated at several gold price thresholds using Whittle Four X analyser version 4.0. Resource contained within various pit shells is presented as Table 14-13. Gustavson cautions that pit-constrained resources are not reserves and that economic viability can only be demonstrated through prefeasibility or feasibility studies.
Table 14-13 Pit-Constrained Resource for selected Whittle Shells.
| Measured | Indicated | Measured + Indicated | Inferred | |||||||||
| Pit Shell | Tons | Gold | Tons | Gold | Tons | Gold | Tons | Gold | ||||
| $US | (x1000) | oz/t | t. oz. (x1000) | (x1000) | oz/t | t. oz. (x1000) | (x1000) | oz/t | t. oz. (x1000) | (x1000) | oz/t | t. oz. (x1000) |
| $1,100 | 41,500 | 0.029 | 1,200 | 69,700 | 0.024 | 1,640 | 111,200 | 0.026 | 2,840 | 19,000 | 0.022 | 370 |
| $1,300 | 50,000 | 0.028 | 1,410 | 79,600 | 0.023 | 1,860 | 129,600 | 0.025 | 3,270 | 21,600 | 0.021 | 460 |
| $1,500 | 54,500 | 0.027 | 1,490 | 88,100 | 0.023 | 2,030 | 142,600 | 0.025 | 3,510 | 22,900 | 0.022 | 490 |
| $1,700 | 61,700 | 0.025 | 1,550 | 91,600 | 0.023 | 2,120 | 153,200 | 0.024 | 3,660 | 23,300 | 0.022 | 500 |
Note: All in-pit resources are reported at a 0.006 oz/t cutoff. Individual values may not sum due to rounding.
September 9, 2014 | 97 |
|
Midway Gold Corp. Spring Valley Project | Certificate of Authors NI 43-101 Technical Report on Resources |
| 15. | ADJACENT PROPERTIES |
| 15.1 | Coeur Rochester |
The Rochester silver and gold project is located south of the Spring Valley project, 12 mi north of Lovelock, Nevada. Conventional open pit drill and blast truck and loader methods are used, which consist of mining from in-situ and stockpiled open pit sources using heap leach extraction methods.
According to the Coeur Mining NI 43-101 Technical Report dated November 6, 2013 Coeur's 100% owned Rochester mine has produced more than 134 million ounces of silver and 1.5 million ounces of gold from 1986 to August 2013. Rochester recovered 1.9 million silver ounces and 21,894 gold ounces year to date through August 31, 2013.
Effective September 16, 2013 proven and probable reserves totaled approximately 86 million silver ounces and 605,000 gold ounces, with additional measured and indicated resources of 69.3 million silver ounces and 560,000 gold ounces, and inferred resources were 26.2 million silver ounces and 105,000 gold ounces.
| 15.2 | Lincoln Hill Property |
The Lincoln Hill gold and silver project is located approximately 3mi northeast of the Spring Valley project near Lovelock, Nevada.
According to the Rye Patch Gold Corp. (Rye Patch) website, 2013, the 4.5mi2 project is 100% owned by Rye Patch. The project status is at exploration stage with reported resources.
Effective September 2012, current measured and indicated resources contain 9.6 million ounces of silver and 334,000 ounces of gold at a gold grade of 0.395 g/t. Inferred resources contain 6.2 million ounces of silver and 165,000 ounces of gold at a gold grade of 0.36 g/t.
| 15.3 | Moonlight Project |
The Moonlight gold and silver project is located north of the Spring Valley Project, northeast of Lovelock, Nevada. The project status is that of an exploration project.
According to the Terraco Gold Corp. (Terraco) website, 2013, the Moonlight Project is 100% owned by Terraco and comprises 13mi2. To date, Terraco has completed an aero-magnetic survey of the project area, collected and analyzed more than 400 rock samples, and drilled over 40 reverse-circulation drill holes ranging in depth from 400 to 800 feet, partially testing only a few of the target areas. There are no reported resources or reserves. The adjacent properties discussed above do not have shared resources and are not necessarily indicative of the resources of the Spring Valley Project.
September 9, 2014 | 98 |
|
Midway Gold Corp. Spring Valley Project | Certificate of Authors NI 43-101 Technical Report on Resources |
| 16. | OTHER RELEVANT DATA AND INFORMATION |
Gustavson knows of no additional relevant data or information that is not contained within this report.
| 17. | INTERPRETATION AND CONCLUSIONS |
| 17.1 | Environmental |
There are no known environmental liabilities on the Spring Valley project.
| 17.2 | Geology and Deposit Type |
The Spring Valley deposit is hosted within structurally prepared zones within a high-potassium porphyry intrusion and the overlying felsic volcanic rocks. Primary mineralizing fluid flow is related to steeply dipping, N20E to N30E- trending, deep-seated faults. Mineral emplacement is localized within structural preparation along these faults, as well as on contact horizons, deformation structures, and within permissive host rocks within the local graben /basin. The mineralization is associated with relatively thin, crystalline quartz veins that have large alteration selvages. In areas of dense quartz veining, the alteration selvages coalesce into regions of pervasively altered and veined rock.
| 17.3 | Exploration, Drilling, and Analytical |
The property has been explored using a variety of techniques including mapping, geophysical surveys, and geochemical sampling. The Spring Valley resource area has been drilled with a total of 672 holes totaling 603,731 feet, including 531 Reverse Circulation (RC) drill holes totaling 428,500 feet and 141 diamond core holes totaling 173,011 feet.
All drill intervals were first assayed by a 30 gram fire assay and mineralized intervals have been systematically re-assayed using MSFA. Where available, the MSFA numbers were utilized in the resource estimate. The project data is stored in a secure database. Assay and geology data have been checked for accuracy for all programs prior to 2009, and spot checked in the Barrick programs from 2009 through 2013.
Gustavson is of the opinion that exploration activities, drilling, and analytical procedures are being conducted in manner that meets or exceeds industry best practice.
| 17.4 | Quality Assurance/Quality Control |
Gustavson has reviewed the QA/QC assay programs and believes the programs provide adequate confidence in the data. Sample standard failures and the samples associated with erroneous blank samples have been reanalyzed prior to the completion of this Report and the results are comparable to the original assay.
September 9, 2014 | 99 |
|
Midway Gold Corp. Spring Valley Project | Certificate of Authors NI 43-101 Technical Report on Resources |
| 17.5 | Mineral Processing and Metallurgical Testing |
The Spring Valley project mineralized material is potentially amenable to both gravity and heap leach recovery methods.
The test samples described in the Mineral Processing and Metallurgical testing item of this Technical Report are representative of the mineralization of the deposit as a whole. As of the date of this report, there are no processing factors that could have a significant effect on potential extraction.
| 17.6 | Data Verification |
Gustavson received original assay certificates in pdf and comma delimited format for all samples included in the current drill hole database. A random manual check of 1,210 samples within the database against the original certificate revealed 3 total errors. The results of the analysis indicate that the data imported into the database matches the certificates 99.7% of the time with a confidence interval of ± 0.56% at a 95% confidence level. Gustavson considers the database adequate for estimation of mineral resource estimation purposes.
| 17.7 | Resource |
Within the main portion of the deposit, drill density is within 150 foot spacing, which is adequate to describe measured and indicated resources, given the variogram and the relative continuity of the resource estimate. However, some areas of the deposit are still in need of infill holes. Closer spaced drilling in these areas will be required to further upgrade the resource classification. Additionally there are areas of the project which are open to expansion of extents of mineralization.
| 18. | RECOMMENDATIONS |
Gustavson recommends the following program to advance the Spring Valley Project towards eventual development. Scoping Study
Gustavson recommends that Midway complete a scoping study (PEA)on the project to evaluate proposed mining and processing methodologies, and economics associated with the implementation of various crushing, grinding, heap leach, and gravity recovery circuit combinations. The PEA should be completed to 43-101 standards and designed to support Midway’s reporting requirements as an independent issuer.
September 9, 2014 | 100 |
|
Midway Gold Corp. Spring Valley Project | Certificate of Authors NI 43-101 Technical Report on Resources |
| 18.1 | Geologic Model |
Gustavson understands that Barrick is undertaking systematic relogging of the drilling including trace element analysis in an effort to refine the geologic and alteration model for the deposit. Gustavson recommends that Midway maintain a level of engagement in the relogging parameters and process in order to facilitate information transfer and share interpretive insights. The results of this logging should be considered in any resource updates moving forward.
| 18.2 | Metallurgical Study |
Existing metallurgical studies have established that gold at Spring Valley is amenable to cyanidation and to gravity separation. Gustavson recommends that additional metallurgical studies be completed to evaluate the mix of mineral processing methods best suited for the mineralization at Spring Valley. The evaluation should include the study of conventional cyanidation at different crush sizes, as well as the impact of gravity concentration at different steps in the process stream. Testwork should include samples of mineralization of various alteration and oxidation types.
| 18.3 | Geotechnical and Hydrogeological Study |
Gustavson recommends that the existing Golder pit slope analysis and geotechnical studies be reviewed to identify critical geotechnical areas and to define a geotechnical exploration program to support final design parameters. The Golder geotechnical studies should form the basis for mine design for the proposed PEA. Additionally, Gustavson recommends that the preliminary hydrogeological studies be reviewed to determine critical path to support project water needs, secure remaining required water rights, and address potential pit dewatering concerns. This information should be included in the support of a proposed PEA.Environmental Permitting
Gustavson recommends that continued work towards meeting the requirements of the State of Nevada to permit a mine on public land should include in the short term:
| · | Finalize Class III Cultural Survey report; |
| · | Endangered Species Act (ESA) and other biological requirements; and |
| · | Ongoing collection and evaluation of environmental baseline data. |
| · | Installation and monitoring of groundwater monitoring as recommended for hydrologic models and baseline studies. |
| 18.4 | Exploration Program |
Continued exploration diamond core drilling should be targeted in three areas within and adjacent to the immediate mineral resource area:
September 9, 2014 | 101 |
|
Midway Gold Corp. Spring Valley Project | Certificate of Authors NI 43-101 Technical Report on Resources |
| · | Infill and step out drilling at the furthest south extent of drilling near the flanks of Gold Mountain. |
| · | Exploration drilling along the Wabash fault that bisects the main Spring Valley resource. Extensions of this fault to both the east and west of the main resource have the potential to host mineralization that has not yet been tested. Placer gold is common along the trace of the fault to the SE. |
| · | Infill and step out drilling targeting the lower Felsic Porphyry unit at depth in the main resource area, to the northern extents of the project and along the eastern Limerick fault. |
| · | Limited infill drilling, primarily in those areas where substantial in-pit inferred mineralization has been identified, or in areas of high potential for pit expansion. |
| 18.5 | Budget |
Under the terms of the Joint Venture Agreement, Barrick has assumed the responsibility for the exploration and development activities. The Spring Valley Joint Venture has a project development budget which includes most of the recommendations listed above. The SVV project is operated by Barrick, with the costs shared by Barrick and Midway Gold, according to the terms of the Joint Venture Agreement.
Midway gold has exercised a carry option such that Barrick will carry Midway’s share of the development costs, to be recovered, along with accrued interest at prime +2%, from 90% of Midway’s share of future production. Under the terms of this carry option, Barrick shall earn an additional 5% interest (for a total of 75%) in the Spring Valley Venture upon completion of construction of the mine. Accordingly, Midway’s share of the PFS and exploration costs are estimated as 25% of the total cost
Table 18-1 presents the 2014-2015 development and exploration budgets for the Spring Valley Venture, as well as budget line items for Midway based on the recommendations described above.
September 9, 2014 | 102 |
|
Midway Gold Corp. Spring Valley Project | Certificate of Authors NI 43-101 Technical Report on Resources |
Table 18-1 Proposed Budget
| Midway Studies & Reports | Costs (US$) |
| Metallurgical Studies | 120,000 |
| Geotechnical Review | 30,000 |
| Hydrogeologic Review | 30,000 |
| Scoping Study (PEA) | 150,000 |
| Midway Reporting Subtotal | $330,000 |
| Spring Valley Venture PreFeasibility Study | |
| Hydrology Studies & Test Wells | 2,125,000 |
| Geochemistry, including ARD | 982,000 |
| Geotechnical | 500,000 |
| Metallurgy | 1,070,000 |
| Mine Planning and Site Design | 700,000 |
| Permit Development | 150,000 |
| Archaeological, Community & Related | 285,000 |
| Environmental Studies | 875,000 |
| Land & Water Rights | 3,100,000 |
| Condemnation Drilling | 500,000 |
| Subtotal | $ 10,287,000 |
| Midway Share at 25% | $ 2,571,750 |
| Spring Valley Venture Exploration | |
| Exploration Program 2014 - 2015 | 12,000,000 |
| Subtotal | $ 12,000,000 |
| Midway Share at 25% | $ 3,000,000 |
| Total Budget (Midway Share) | |
| Total Budget | $5,901,750 |
September 9, 2014 | 103 |
|
Midway Gold Corp. Spring Valley Project | Certificate of Authors NI 43-101 Technical Report on Resources |
| 19. | REFERENCES |
Ashleman, J.C. 2007. Geologic Map of the Central Part of the Spring Valley Project, Pershing County, Nevada. s.l.: Midway Gold Corp., 2007. Unpublished Consultants Report.
BLM. 2007. Midway Resources Inc. Spring Valley Exploration Project, Pershing County Nevada. s.l.: Winnemucca Field Office, Bureau of Land Management, 2007. Environmental Assessment NV-020-07-EA-02.
Coeur Mining. Rochester Mine, Lovelock Nevada, USA, Technical Report, November 6, 2013
Francois-Bongarcon, D. 2007. Spring Valley Sampling. s.l.: AMEC E&C Services, 2007. Report for Midway Gold Corp., September 2007.
Griffith, D. and Ristorcelli, S., 2004. Updated Summary Report on the Spring Valley Property, Pershing County Nevada. s.l.: Report Prepared for Midway Gold Corp. by Mine Development Associates, September 2004.
Johnson, M. 1977. Geology and Mineral Deposits of Pershing County, Nevada. s.l.: Nevada, 1977.
LeLacheur, E., Harris, D., Mosch, D., Edelen, J., McMillin, S., 2009, Spring Valley Project, Nevada, NI 43-101 Technical Report: Prepared by Midway Resources Inc. for Midway Gold Corp., March, 2009.
Neal, W. S. 2004. Geology and Mineralization of the Spring Valley Project. s.l.: Midway Gold Corp., 2004. Unpublished Company Report, August 2004.
Pitard, F.F. 2004. Review of Sampling Systems and Sampling Practices at the Spring Valley Exploration Project. s.l.: Francis Pitard Sampling Consultants, Broomfield, Colorado, 2004. Report Prepared for Global Geologic Services, March 2004.
Ristorcelli, S., 2003. Summary Report on the Spring Valley Property, Pershing County, Nevada. s.l.: Prepared for Midway Gold Corp. by Mine Development Associates Report August 2003.
ryepatchgold.com. 2014
Scott E. Wilson Consulting, Inc. Technical Report, Rye Patch Gold Corp., Lincoln Hill Property, Pershing County, Nevada, USA, September 17, 2012
September 9, 2014 | 104 |
|
Midway Gold Corp. Spring Valley Project | Certificate of Authors NI 43-101 Technical Report on Resources |
Stiles, C.A. 2008. Spring Valley Project 2007 Annual Exploration Progress Report. s.l.: Midway Gold Corp., 2008. Unpublished Company Report, January, 2008.
terracogold.com. 2013
TGC Holdings Ltd. NI 43-101 Technical Report on the Moonlight Project, Pershing County, Nevada, USA, December 15, 2010
Wakefield, T. and Kuhl, T., 2008. NI-43-101 Technical Report, Spring Valley Property, Pershing County Nevada. s.l.: Report Prepared for Midway Gold Corp. by AMEC E&C Services, March, 2008.
Wakefield, T. and Seibel, G., 2006. NI-43-101 Technical Report, Spring Valley Property, Pershing County Nevada. s.l.: Report Prepared for Midway Gold Corp. by AMEC E&C Services, June, 2006.
Wallace, R.E., Tatlock, D.B., Silberling, N.J., and Irwin, W.P. 1969. Geologic Map of the Unionville Quadrangle, Pershing County, Nevada. s.l.: United States Geological Survey, 1969. MAP GQ-820.
Watson, J., 2010, Spring Valley Project, 2009 Annual Report of Operations: Barrick/Midway Resources Inc., Unpublished Company Report, June, 2010.
Watson, J., 2011, Spring Valley Project, 2010 Annual Report of Operations: Barrick/Midway Resources Inc., Unpublished Company Report, January, 2001.
Wright, J .L. 2004. Spring Valley Property, CSMAT Survey, MapInfo Database. s.l.: J.L. Wright Geophysics, February 2004, 2004. Report for Midway Gold Corp.
—. 2006. Spring Valley Property Gravity Compilation. s.l.: J.L. Wright Geophysics, 2006. Report for Midway Gold Corp., May 2006.
—. 2005. Spring Valley Property Ground Magnetics and Gravity Surveys. s.l.: J.L. Wright Geophysics, 2005. Report for Midway Gold Corp., April 2005.
September 9, 2014 | 105 |
|
Midway Gold Corp. Spring Valley Project | Certificate of Authors NI 43-101 Technical Report on Resources |
Appendix A: Claims List Exhibit
| Serial Num | Claim Name | Book / Page Number | Location Date |
| NMC140862 | HMS #4 | 106/179 | 12/5/1979 |
| NMC140863 | HMS #5 | 106/180 | 12/5/1979 |
| NMC140864 | HMS #6 | 106/181 | 12/5/1979 |
| NMC140941 | HMS #84 | 106/258 | 1/24/1980 |
| NMC140942 | HMS #85 | 106/259 | 1/24/1980 |
| NMC140943 | HMS #86 | 106/260 | 1/25/1980 |
| NMC140944 | HMS #87 | 106/261 | 1/25/1980 |
| NMC349508 | SDB #1 | 173/127 | 9/5/1985 |
| NMC349509 | SDB #2 | 173/128 | 9/5/1985 |
| NMC349510 | SDB #3 | 173/129 | 9/5/1985 |
| NMC349511 | SDB #4 | 173/130 | 9/5/1985 |
| NMC349512 | SDB #5 | 173/131 | 9/6/1985 |
| NMC349513 | SDB #6 | 173/132 | 9/6/1985 |
| NMC349514 | SDB #7 | 173/133 | 9/6/1985 |
| NMC349515 | SDB #8 | 173/134 | 9/6/1985 |
| NMC364282 | IDA #12 | 177/124 | 3/11/1986 |
| NMC364283 | IDA #13 | 177/125 | 3/11/1986 |
| NMC364284 | IDA #14 | 177/126 | 3/11/1986 |
| NMC364285 | IDA #15 | 177/127 | 3/11/1986 |
| NMC364286 | IDA #16 | 177/128 | 3/11/1986 |
| NMC364287 | IDA #17 | 177/129 | 3/11/1986 |
| NMC364288 | IDA #18 | 177/130 | 3/11/1986 |
| NMC364289 | IDA #19 | 177/131 | 3/11/1986 |
| NMC364290 | IDA #20 | 177/132 | 3/11/1986 |
| NMC364291 | IDA #21 | 177/133 | 3/11/1986 |
| NMC364292 | IDA #22 | 177/134 | 3/11/1986 |
| NMC364293 | IDA #23 | 177/135 | 3/11/1986 |
| NMC364295 | IDA #25 | 177/137 | 3/11/1986 |
| NMC364363 | SHO #3 | 177/205 | 3/19/1986 |
| NMC364364 | SHO #4 | 177/206 | 3/18/1986 |
| NMC364365 | SHO #5 | 177/207 | 3/18/1986 |
| NMC364366 | SHO #6 | 177/208 | 3/20/1986 |
| NMC364367 | SHO #7 | 177/209 | 3/20/1986 |
| NMC364368 | SHO #8 | 177/210 | 3/20/1986 |
| NMC364369 | SHO #9 | 177/211 | 3/20/1986 |
| NMC364370 | SHO #10 | 177/212 | 3/20/1986 |
| NMC364371 | SHO #11 | 177/213 | 3/20/1986 |
September 9, 2014 | 106 |
|
Midway Gold Corp. Spring Valley Project | Certificate of Authors NI 43-101 Technical Report on Resources |
| Serial Num | Claim Name | Book / Page Number | Location Date |
| NMC364372 | SHO #12 | 177/214 | 3/20/1986 |
| NMC364373 | SHO #13 | 177/215 | 3/20/1986 |
| NMC364374 | SHO #14 | 177/216 | 3/20/1986 |
| NMC364375 | SHO #15 | 177/217 | 3/20/1986 |
| NMC364376 | SHO #16 | 177/218 | 3/20/1986 |
| NMC364377 | SHO #17 | 177/219 | 3/20/1986 |
| NMC364378 | SHO #18 | 177/220 | 3/20/1986 |
| NMC364379 | SHO #19 | 177/221 | 3/20/1986 |
| NMC364380 | SHO #20 | 177/222 | 3/20/1986 |
| NMC364384 | SHO #24 | 177/226 | 3/19/1986 |
| NMC364385 | SHO #25 | 177/227 | 3/19/1986 |
| NMC364386 | SHO #26 | 177/228 | 3/19/1986 |
| NMC364387 | SHO #27 | 177/229 | 3/19/1986 |
| NMC364388 | SHO #28 | 177/230 | 3/19/1986 |
| NMC364389 | SHO #29 | 177/231 | 3/19/1986 |
| NMC364390 | SHO #30 | 177/232 | 3/19/1986 |
| NMC364391 | SHO #31 | 177/233 | 3/19/1986 |
| NMC364392 | SHO #32 | 177/234 | 3/18/1986 |
| NMC364393 | SHO #33 | 177/235 | 3/19/1986 |
| NMC364394 | SHO #34 | 177/236 | 3/19/1986 |
| NMC364395 | SHO #35 | 177/237 | 3/19/1986 |
| NMC364396 | SHO #36 | 177/238 | 3/19/1986 |
| NMC364397 | SHO #37 | 177/239 | 3/19/1986 |
| NMC364398 | SHO #38 | 177/240 | 3/19/1986 |
| NMC364399 | SHO #39 | 177/241 | 3/19/1986 |
| NMC364400 | SHO #40 | 177/242 | 3/19/1986 |
| NMC364401 | SHO #41 | 177/243 | 3/19/1986 |
| NMC364402 | SHO #42 | 177/244 | 3/19/1986 |
| NMC364403 | SHO #43 | 177/245 | 3/19/1986 |
| NMC364404 | SHO #44 | 177/246 | 3/19/1986 |
| NMC364405 | SHO #45 | 177/247 | 3/19/1986 |
| NMC364406 | SHO #46 | 177/248 | 3/19/1986 |
| NMC364407 | SHO #47 | 177/249 | 3/19/1986 |
| NMC364408 | SHO #48 | 177/250 | 3/19/1986 |
| NMC364409 | SHO #49 | 177/251 | 3/19/1986 |
| NMC364410 | SHO #50 | 177/252 | 3/19/1986 |
| NMC364411 | SHO #51 | 177/253 | 3/19/1986 |
| NMC364412 | SHO #52 | 177/254 | 3/19/1986 |
September 9, 2014 | 107 |
|
Midway Gold Corp. Spring Valley Project | Certificate of Authors NI 43-101 Technical Report on Resources |
| Serial Num | Claim Name | Book / Page Number | Location Date |
| NMC364413 | SHO #53 | 177/255 | 3/19/1986 |
| NMC364414 | SHO #54 | 177/256 | 3/19/1986 |
| NMC364415 | SHO #55 | 177/257 | 3/19/1986 |
| NMC364416 | SHO #56 | 177/258 | 3/19/1986 |
| NMC364417 | SHO #57 | 177/259 | 3/19/1986 |
| NMC364418 | SHO #58 | 177/260 | 3/20/1986 |
| NMC364419 | SHO #59 | 177/261 | 3/20/1986 |
| NMC371072 | Porcupine #1 | 180/24 | 6/20/1986 |
| NMC371073 | Porcupine #2 | 180/25 | 6/20/1986 |
| NMC371074 | Porcupine #3 | 180/26 | 6/20/1986 |
| NMC371075 | Porcupine #4 | 180/27 | 6/20/1986 |
| NMC371076 | Porcupine #5 | 180/28 | 6/20/1986 |
| NMC371077 | Porcupine #6 | 180/29 | 6/20/1986 |
| NMC371078 | Porcupine #7 | 180/30 | 6/20/1986 |
| NMC371079 | Porcupine #8 | 180/31 | 6/20/1986 |
| NMC371080 | Porcupine #9 | 180/32 | 6/20/1986 |
| NMC371081 | Porcupine #10 | 180/33 | 6/20/1986 |
| NMC371082 | Porcupine #11 | 180/34 | 6/20/1986 |
| NMC39574 | Crown Hills #7 | 42/510 | 8/22/1972 |
| NMC39593 | Crown Hills #8 | 42/511 | 8/22/1972 |
| NMC39594 | Crown Hills #9 | 42/512 | 8/22/1972 |
| NMC39595 | Crown Hills #10 | 42/513 | 8/22/1972 |
| NMC662873 | Porcupine #28 | 267/567 | 8/27/1992 |
| NMC748203 | SV 8 | 304/446 | 6/5/1996 |
| NMC748205 | SV 10 | 304/448 | 6/5/1996 |
| NMC748207 | SV 12 | 304/450 | 6/5/1996 |
| NMC748209 | SV 14 | 304/452 | 6/5/1996 |
| NMC748211 | SV 16 | 304/454 | 6/5/1996 |
| NMC748213 | SV 18 | 304/456 | 6/5/1996 |
| NMC748215 | SV 20 | 304/458 | 6/5/1996 |
| NMC748222 | SV 27 | 304/465 | 6/5/1996 |
| NMC748224 | SV 29 | 304/467 | 6/5/1996 |
| NMC748225 | SV 30 | 304/468 | 6/5/1996 |
| NMC748226 | SV 31 | 304/469 | 6/5/1996 |
| NMC748227 | SV 32 | 304/470 | 6/5/1996 |
| NMC748228 | SV 33 | 304/471 | 6/5/1996 |
| NMC748229 | SV 34 | 304/472 | 6/5/1996 |
September 9, 2014 | 108 |
|
Midway Gold Corp. Spring Valley Project | Certificate of Authors NI 43-101 Technical Report on Resources |
| Serial Num | Claim Name | Book / Page Number | Location Date |
| NMC748230 | SV 35 | 304/473 | 6/5/1996 |
| NMC748231 | SV 36 | 304/474 | 6/5/1996 |
| NMC748232 | SV 37 | 304/475 | 6/5/1996 |
| NMC748233 | SV 38 | 304/476 | 6/5/1996 |
| NMC748234 | SV 39 | 304/477 | 6/5/1996 |
| NMC748235 | SV 40 | 304/478 | 6/5/1996 |
| NMC748236 | SV 41 | 304/479 | 6/5/1996 |
| NMC748237 | SV 42 | 304/480 | 6/5/1996 |
| NMC748238 | SV 43 | 304/481 | 6/5/1996 |
| NMC748239 | SV 44 | 304/482 | 6/5/1996 |
| NMC780754 | Freedom #2 | 325/50 | 11/3/1997 |
| NMC785920 | Freedom #1 | 325/522 | 11/3/1997 |
| NMC811224 | Duffy #1 | 348/308 | 1/4/2000 |
| NMC811225 | Duffy #2 | 348/309 | 1/4/2000 |
| NMC817628 | SV 1 | 352/678 | 6/21/2000 |
| NMC817629 | SV 2 | 352/679 | 6/21/2000 |
| NMC817630 | SV 3 | 352/680 | 6/21/2000 |
| NMC817631 | SV 4 | 352/681 | 6/21/2000 |
| NMC817632 | SV 5 | 352/682 | 6/21/2000 |
| NMC817633 | SV 6 | 352/683 | 6/21/2000 |
| NMC817634 | SV 7 | 352/684 | 6/21/2000 |
| NMC817635 | SV 9 | 352/685 | 6/21/2000 |
| NMC817636 | SV 11 | 352/686 | 6/21/2000 |
| NMC817637 | SV 13 | 352/687 | 6/21/2000 |
| NMC817638 | SV 15 | 352/688 | 6/21/2000 |
| NMC817639 | SV 17 | 352/689 | 6/21/2000 |
| NMC817640 | SV 19 | 352/690 | 6/21/2000 |
| NMC817641 | SV 21 | 352/691 | 6/21/2000 |
| NMC817642 | SV 22 | 352/692 | 6/21/2000 |
| NMC817643 | SV 23 | 352/693 | 6/21/2000 |
| NMC817644 | SV 24 | 352/694 | 6/21/2000 |
| NMC817645 | SV 25 | 352/695 | 6/21/2000 |
| NMC817646 | SV 26 | 352/699 | 6/21/2000 |
| NMC817647 | SV 28 | 352/697 | 6/21/2000 |
| NMC825454 | SV 51 | 362/325 | 10/4/2001 |
| NMC825455 | SV 52 | 362/326 | 10/4/2001 |
| NMC825456 | SV 53 | 362/327 | 10/4/2001 |
| NMC825457 | SV 54 | 362/328 | 10/4/2001 |
September 9, 2014 | 109 |
|
Midway Gold Corp. Spring Valley Project | Certificate of Authors NI 43-101 Technical Report on Resources |
| Serial Num | Claim Name | Book / Page Number | Location Date |
| NMC832254 | SV 60 | 369/571 | 8/10/2002 |
| NMC832255 | SV 61 | 369/572 | 8/10/2002 |
| NMC832256 | SV 62 | 369/573 | 8/10/2002 |
| NMC832257 | SV 63 | 369/574 | 8/10/2002 |
| NMC832258 | SV 64 | 369/575 | 8/10/2002 |
| NMC832259 | SV 65 | 369/576 | 8/10/2002 |
| NMC832260 | SV 66 | 369/577 | 8/10/2002 |
| NMC832261 | SV 67 | 369/578 | 8/10/2002 |
| NMC832262 | SV 68 | 369/579 | 8/10/2002 |
| NMC832263 | SV 69 | 369/580 | 8/10/2002 |
| NMC832264 | SV 70 | 369/581 | 8/10/2002 |
| NMC832265 | SV 71 | 369/582 | 8/10/2002 |
| NMC832266 | SV 72 | 369/583 | 8/13/2002 |
| NMC832267 | SV 73 | 369/584 | 8/13/2002 |
| NMC832268 | SV 74 | 369/585 | 8/13/2002 |
| NMC832269 | SV 75 | 369/586 | 8/13/2002 |
| NMC832270 | SV 76 | 369/587 | 8/9/2002 |
| NMC832271 | SV 77 | 369/588 | 8/9/2002 |
| NMC832272 | SV 78 | 369/589 | 8/9/2002 |
| NMC832273 | SV 79 | 369/590 | 8/9/2002 |
| NMC832274 | SV 80 | 369/591 | 8/30/2002 |
| NMC832275 | SV 81 | 369/592 | 8/30/2002 |
| NMC832276 | SV 82 | 369/593 | 8/30/2002 |
| NMC832277 | SV 83 | 369/594 | 8/30/2002 |
| NMC860702 | SV 45 | 380/569 | 11/9/2003 |
| NMC860703 | SV 46 | 380/570 | 11/9/2003 |
| NMC860704 | SV 47 | 380/571 | 11/9/2003 |
| NMC860705 | SV 48 | 380/572 | 11/9/2003 |
| NMC860706 | SV 49 | 380/573 | 11/9/2003 |
| NMC860707 | SV 50 | 380/574 | 11/9/2003 |
| NMC860708 | SV 51 | 380/575 | 11/9/2003 |
| NMC860709 | SV 52 | 380/576 | 11/9/2003 |
| NMC860710 | SV 53 | 380/577 | 11/9/2003 |
| NMC860711 | SV 54 | 380/578 | 11/9/2003 |
| NMC860712 | SV 55 | 380/579 | 11/9/2003 |
| NMC860713 | SV 56 | 380/580 | 11/9/2003 |
| NMC860714 | SV 57 | 380/581 | 11/9/2003 |
| NMC860715 | SV 58 | 380/582 | 11/9/2003 |
September 9, 2014 | 110 |
|
Midway Gold Corp. Spring Valley Project | Certificate of Authors NI 43-101 Technical Report on Resources |
| Serial Num | Claim Name | Book / Page Number | Location Date |
| NMC860716 | SV 59 | 380/583 | 11/9/2003 |
| NMC860717 | SV 60 | 380/584 | 11/9/2003 |
| NMC860718 | SV 61 | 380/585 | 11/9/2003 |
| NMC860719 | SV 62 | 380/586 | 11/9/2003 |
| NMC860720 | SV 63 | 380/587 | 11/9/2003 |
| NMC860721 | SV 64 | 380/588 | 11/9/2003 |
| NMC860722 | SV 65 | 380/589 | 11/9/2003 |
| NMC860723 | SV 66 | 380/590 | 11/9/2003 |
| NMC860724 | SV 67 | 380/591 | 11/9/2003 |
| NMC860725 | SV 68 | 380/592 | 11/9/2003 |
| NMC860726 | SV 69 | 380/593 | 11/9/2003 |
| NMC860727 | SV 70 | 380/594 | 11/9/2003 |
| NMC860728 | SV 71 | 380/595 | 11/9/2003 |
| NMC860729 | SV 72 | 380/596 | 11/9/2003 |
| NMC860730 | SV 73 | 380/597 | 11/9/2003 |
| NMC860731 | SV 74 | 380/598 | 11/9/2003 |
| NMC860732 | SV 75 | 380/599 | 11/9/2003 |
| NMC860733 | SV 76 | 380/600 | 11/9/2003 |
| NMC860734 | SV 77 | 380/601 | 11/9/2003 |
| NMC860735 | SV 78 | 380/602 | 11/9/2003 |
| NMC872357 | SV 84 | 384/488 | 5/12/2004 |
| NMC872358 | SV 85 | 384/489 | 5/12/2004 |
| NMC872359 | SV 86 | 384/490 | 5/12/2004 |
| NMC872360 | SV 87 | 384/491 | 5/12/2004 |
| NMC872361 | SV 88 | 384/492 | 5/12/2004 |
| NMC872362 | SV 89 | 384/493 | 5/12/2004 |
| NMC872363 | SV 90 | 384/494 | 5/12/2004 |
| NMC872364 | SV 91 | 384/495 | 5/12/2004 |
| NMC872365 | SV 92 | 384/496 | 5/12/2004 |
| NMC872366 | SV 93 | 384/497 | 5/12/2004 |
| NMC872367 | SV 94 | 384/498 | 5/12/2004 |
| NMC872368 | SV 95 | 384/499 | 5/12/2004 |
| NMC872369 | SV 96 | 384/500 | 5/12/2004 |
| NMC872370 | SV 97 | 384/501 | 5/12/2004 |
| NMC872371 | SV 98 | 384/502 | 5/12/2004 |
| NMC872372 | SV 99 | 384/503 | 5/12/2004 |
| NMC887449 | SV 100 | 390/17 | 10/19/2004 |
| NMC887450 | SV 101 | 390/18 | 10/18/2004 |
September 9, 2014 | 111 |
|
Midway Gold Corp. Spring Valley Project | Certificate of Authors NI 43-101 Technical Report on Resources |
| Serial Num | Claim Name | Book / Page Number | Location Date |
| NMC887451 | SV 102 | 390/19 | 10/18/2004 |
| NMC887452 | SV 103 | 390/20 | 10/18/2004 |
| NMC887453 | SV 104 | 390/21 | 10/18/2004 |
| NMC887454 | SV 105 | 390/22 | 10/18/2004 |
| NMC887455 | SV 106 | 390/23 | 10/18/2004 |
| NMC887456 | SV 107 | 390/24 | 10/18/2004 |
| NMC887457 | SV 108 | 390/25 | 10/18/2004 |
| NMC887458 | SV 109 | 390/26 | 10/18/2004 |
| NMC887459 | SV 110 | 390/27 | 10/18/2004 |
| NMC887460 | SV 111 | 390/28 | 10/18/2004 |
| NMC887461 | SV 112 | 390/29 | 10/18/2004 |
| NMC887462 | SV 113 | 390/30 | 10/18/2004 |
| NMC887463 | SV 114 | 390/31 | 10/18/2004 |
| NMC887464 | SV 115 | 390/32 | 10/18/2004 |
| NMC887465 | SV 116 | 390/33 | 10/18/2004 |
| NMC887466 | SV 117 | 390/34 | 10/18/2004 |
| NMC887467 | SV 118 | 390/35 | 10/18/2004 |
| NMC887468 | SV 119 | 390/36 | 10/18/2004 |
| NMC887469 | SV 120 | 390/37 | 10/18/2004 |
| NMC887470 | SV 121 | 390/38 | 10/19/2004 |
| NMC887471 | SV 122 | 390/39 | 10/19/2004 |
| NMC887472 | SV 123 | 390/40 | 10/19/2004 |
| NMC887473 | SV 124 | 390/41 | 10/19/2004 |
| NMC887474 | SV 125 | 390/42 | 10/19/2004 |
| NMC889143 | SV 126 | 390/437 | 11/10/2004 |
| NMC889144 | SV 127 | 390/438 | 11/10/2004 |
| NMC889145 | SV 128 | 390/439 | 11/15/2004 |
| NMC889146 | SV 129 | 390/440 | 11/15/2004 |
| NMC889147 | SV 130 | 390/441 | 11/15/2004 |
| NMC889148 | SV 131 | 390/442 | 11/15/2004 |
| NMC889149 | SV 132 | 390/443 | 11/15/2004 |
| NMC889150 | SV 133 | 390/444 | 11/15/2004 |
| NMC889151 | SV 134 | 390/445 | 11/15/2004 |
| NMC889152 | SV 135 | 390/446 | 11/15/2004 |
| NMC906917 | SVP 1 | 398/285 | 6/16/2005 |
| NMC906918 | SVP 2 | 398/286 | 6/16/2005 |
| NMC906919 | SVP 3 | 398/287 | 6/16/2005 |
| NMC906920 | SVP 4 | 398/288 | 6/16/2005 |
September 9, 2014 | 112 |
|
Midway Gold Corp. Spring Valley Project | Certificate of Authors NI 43-101 Technical Report on Resources |
| Serial Num | Claim Name | Book / Page Number | Location Date |
| NMC906921 | SVP 5 | 398/289 | 6/16/2005 |
| NMC906922 | SVP 6 | 398/290 | 6/16/2005 |
| NMC906923 | SVP 7 | 398/291 | 6/16/2005 |
| NMC906924 | SVP 8 | 398/292 | 6/16/2005 |
| NMC906925 | SVP 9 | 398/293 | 6/16/2005 |
| NMC906926 | SVP 10 | 398/294 | 6/16/2005 |
| NMC906927 | SVP 11 | 398/295 | 6/16/2005 |
| NMC906928 | SVP 12 | 398/296 | 6/16/2005 |
| NMC906929 | SVP 13 | 398/297 | 6/16/2005 |
| NMC906930 | SVP 14 | 398/298 | 6/16/2005 |
| NMC906931 | SVP 15 | 398/299 | 6/16/2005 |
| NMC906932 | SVP 16 | 398/300 | 6/16/2005 |
| NMC906933 | SVP 17 | 398/301 | 6/16/2005 |
| NMC906934 | SVP 18 | 398/302 | 6/16/2005 |
| NMC906935 | SVP 19 | 398/303 | 6/16/2005 |
| NMC906936 | SVP 20 | 398/304 | 6/16/2005 |
| NMC906937 | SVP 21 | 398/305 | 6/16/2005 |
| NMC906938 | SVP 22 | 398/306 | 6/16/2005 |
| NMC906939 | SVP 23 | 398/307 | 6/16/2005 |
| NMC906940 | SVP 24 | 398/308 | 6/16/2005 |
| NMC906941 | SVP 25 | 398/309 | 6/16/2005 |
| NMC906942 | SVP 26 | 398/310 | 6/16/2005 |
| NMC906943 | SVP 27 | 398/311 | 6/16/2005 |
| NMC906944 | SVP 28 | 398/312 | 6/16/2005 |
| NMC906945 | SVP 29 | 398/313 | 6/16/2005 |
| NMC906946 | SVP 30 | 398/314 | 6/16/2005 |
| NMC906947 | SVP 31 | 398/315 | 6/16/2005 |
| NMC906948 | SVP 32 | 398/316 | 6/16/2005 |
| NMC906949 | SVP 33 | 398/317 | 6/16/2005 |
| NMC906950 | SVP 34 | 398/318 | 6/16/2005 |
| NMC906951 | SVP 35 | 398/319 | 6/16/2005 |
| NMC906952 | SVP 36 | 398/320 | 6/16/2005 |
| NMC906953 | SVP 37 | 398/321 | 6/16/2005 |
| NMC906954 | SVP 38 | 398/322 | 6/16/2005 |
| NMC906955 | SVP 39 | 398/323 | 6/16/2005 |
| NMC906956 | SVP 40 | 398/324 | 6/16/2005 |
| NMC906957 | SV 136 | 398/281 | 6/9/2005 |
| NMC906958 | SV 137 | 398/282 | 6/9/2005 |
September 9, 2014 | 113 |
|
Midway Gold Corp. Spring Valley Project | Certificate of Authors NI 43-101 Technical Report on Resources |
| Serial Num | Claim Name | Book / Page Number | Location Date |
| NMC906959 | SV 138 | 398/283 | 6/9/2005 |
| NMC906960 | SV 139 | 398/284 | 6/9/2005 |
| NMC925039 | SV 146 | 407/352 | 2/11/2006 |
| NMC925040 | SV 147 | 407/353 | 2/11/2006 |
| NMC925041 | SV 148 | 407/354 | 2/11/2006 |
| NMC925042 | SV 149 | 407/355 | 2/11/2006 |
| NMC925043 | SV 150 | 407/356 | 2/11/2006 |
| NMC925044 | SV 151 | 407/357 | 2/11/2006 |
| NMC925045 | SV 152 | 407/358 | 2/11/2006 |
| NMC925046 | SV 153 | 407/359 | 2/11/2006 |
| NMC925047 | SV 154 | 407/360 | 2/11/2006 |
| NMC925048 | SV 155 | 407/361 | 2/9/2006 |
| NMC925049 | SV 156 | 407/362 | 2/9/2006 |
| NMC925050 | SV 157 | 407/363 | 2/9/2006 |
| NMC925051 | SV 158 | 407/364 | 2/9/2006 |
| NMC925052 | SV 159 | 407/365 | 2/9/2006 |
| NMC925053 | SV 160 | 407/366 | 2/9/2006 |
| NMC925054 | SV 161 | 407/367 | 2/9/2006 |
| NMC925055 | SV 162 | 407/368 | 2/9/2006 |
| NMC925056 | SV 163 | 407/369 | 2/9/2006 |
| NMC925057 | SV 164 | 407/370 | 2/9/2006 |
| NMC925058 | SV 165 | 407/371 | 2/9/2006 |
| NMC925059 | SV 166 | 407/372 | 2/9/2006 |
| NMC925060 | SV 167 | 407/373 | 2/9/2006 |
| NMC925061 | SV 168 | 407/374 | 2/9/2006 |
| NMC925062 | SV 169 | 407/375 | 2/9/2006 |
| NMC925063 | SV 170 | 407/376 | 2/9/2006 |
| NMC925064 | SV 171 | 407/377 | 2/9/2006 |
| NMC925065 | SV 172 | 407/378 | 2/9/2006 |
| NMC925066 | SV 173 | 407/379 | 2/9/2006 |
| NMC925067 | SV 174 | 407/380 | 2/9/2006 |
| NMC925068 | SV 175 | 407/381 | 2/9/2006 |
| NMC925069 | SV 176 | 407/382 | 2/9/2006 |
| NMC925071 | SV 178 | 407/384 | 2/9/2006 |
| NMC925073 | SV 180 | 407/386 | 2/9/2006 |
| NMC925075 | SV 182 | 407/388 | 2/9/2006 |
| NMC925077 | SV 184 | 407/390 | 2/9/2006 |
| NMC925078 | SV 185 | 407/391 | 2/11/2006 |
September 9, 2014 | 114 |
|
Midway Gold Corp. Spring Valley Project | Certificate of Authors NI 43-101 Technical Report on Resources |
| Serial Num | Claim Name | Book / Page Number | Location Date |
| NMC925079 | SV 186 | 407/392 | 2/11/2006 |
| NMC925080 | SV 187 | 407/393 | 2/10/2006 |
| NMC925081 | SV 188 | 407/394 | 2/10/2006 |
| NMC925082 | SV 189 | 407/395 | 2/10/2006 |
| NMC925083 | SV 190 | 407/396 | 2/10/2006 |
| NMC925084 | SV 191 | 407/397 | 2/10/2006 |
| NMC925085 | SV 192 | 407/398 | 2/10/2006 |
| NMC925086 | SV 193 | 407/399 | 2/10/2006 |
| NMC925087 | SV 194 | 407/400 | 2/10/2006 |
| NMC925088 | SV 195 | 407/401 | 2/10/2006 |
| NMC925089 | SV 196 | 407/402 | 2/10/2006 |
| NMC925090 | SV 197 | 407/403 | 2/10/2006 |
| NMC925091 | SV 198 | 407/404 | 2/10/2006 |
| NMC925092 | SV 199 | 407/405 | 2/10/2006 |
| NMC925093 | SV 200 | 407/406 | 2/10/2006 |
| NMC925094 | SV 201 | 407/407 | 2/10/2006 |
| NMC925095 | SV 202 | 407/408 | 2/10/2006 |
| NMC925096 | SV 203 | 407/409 | 2/10/2006 |
| NMC925097 | SV 204 | 407/410 | 2/10/2006 |
| NMC925098 | SV 205 | 407/411 | 2/10/2006 |
| NMC925099 | SV 206 | 407/412 | 2/10/2006 |
| NMC925100 | SV 207 | 407/413 | 2/10/2006 |
| NMC925101 | SV 208 | 407/414 | 2/10/2006 |
| NMC925102 | SV 209 | 407/415 | 2/10/2006 |
| NMC925103 | SV 210 | 407/416 | 2/10/2006 |
| NMC925104 | SV 211 | 407/417 | 2/10/2006 |
| NMC925105 | SV 212 | 407/418 | 2/11/2006 |
| NMC925106 | SV 213 | 407/419 | 2/11/2006 |
| NMC925108 | SV 215 | 407/421 | 2/11/2006 |
| NMC925109 | SV 216 | 407/422 | 2/17/2006 |
| NMC925110 | SV 217 | 407/423 | 2/17/2006 |
| NMC925111 | SV 218 | 407/424 | 2/17/2006 |
| NMC925112 | SV 219 | 407/425 | 2/17/2006 |
| NMC925113 | SV 220 | 407/426 | 2/17/2006 |
| NMC925114 | SV 221 | 407/427 | 2/12/2006 |
| NMC925115 | SV 222 | 407/428 | 2/12/2006 |
| NMC925116 | SV 223 | 407/429 | 2/12/2006 |
| NMC925117 | SV 224 | 407/430 | 2/12/2006 |
September 9, 2014 | 115 |
|
Midway Gold Corp. Spring Valley Project | Certificate of Authors NI 43-101 Technical Report on Resources |
| Serial Num | Claim Name | Book / Page Number | Location Date |
| NMC925118 | SV 225 | 407/431 | 2/12/2006 |
| NMC925119 | SV 226 | 407/432 | 2/12/2006 |
| NMC925120 | SV 227 | 407/433 | 2/12/2006 |
| NMC925121 | SV 228 | 407/434 | 2/12/2006 |
| NMC925122 | SV 229 | 407/435 | 2/12/2006 |
| NMC925123 | SV 230 | 407/436 | 2/12/2006 |
| NMC925124 | SV 231 | 407/437 | 2/12/2006 |
| NMC925125 | SV 232 | 407/438 | 2/12/2006 |
| NMC925126 | SV 233 | 407/439 | 2/12/2006 |
| NMC925127 | SV 234 | 407/440 | 2/12/2006 |
| NMC925128 | SV 235 | 407/441 | 2/12/2006 |
| NMC925129 | SV 236 | 407/442 | 2/12/2006 |
| NMC925130 | SV 237 | 407/443 | 2/12/2006 |
| NMC925131 | SV 238 | 407/444 | 2/12/2006 |
| NMC925132 | SV 239 | 407/445 | 2/12/2006 |
| NMC925133 | SV 240 | 407/446 | 2/12/2006 |
| NMC925134 | SV 241 | 407/447 | 2/12/2006 |
| NMC925135 | SV 242 | 407/448 | 2/12/2006 |
| NMC925136 | SV 243 | 407/449 | 2/12/2006 |
| NMC925137 | SV 244 | 407/450 | 2/12/2006 |
| NMC925138 | SV 245 | 407/451 | 2/13/2006 |
| NMC925139 | SV 246 | 407/452 | 2/13/2006 |
| NMC925140 | SV 247 | 407/453 | 2/13/2006 |
| NMC925141 | SV 248 | 407/454 | 2/13/2006 |
| NMC925142 | SV 249 | 407/455 | 2/13/2006 |
| NMC925143 | SV 250 | 407/456 | 2/13/2006 |
| NMC925144 | SV 251 | 407/457 | 2/13/2006 |
| NMC925145 | SV 252 | 407/458 | 2/13/2006 |
| NMC925146 | SV 253 | 407/459 | 2/12/2006 |
| NMC925147 | SV 254 | 407/460 | 2/12/2006 |
| NMC925148 | SV 255 | 407/461 | 2/12/2006 |
| NMC925149 | SV 256 | 407/462 | 2/17/2006 |
| NMC925150 | SV 257 | 407/463 | 2/17/2006 |
| NMC925151 | SV 258 | 407/464 | 2/17/2006 |
| NMC925152 | SV 259 | 407/465 | 2/17/2006 |
| NMC925153 | SV 260 | 407/466 | 2/17/2006 |
| NMC925154 | SV 261 | 407/467 | 2/17/2006 |
| NMC925156 | SV 277 | 407/469 | 2/14/2006 |
September 9, 2014 | 116 |
|
Midway Gold Corp. Spring Valley Project | Certificate of Authors NI 43-101 Technical Report on Resources |
| Serial Num | Claim Name | Book / Page Number | Location Date |
| NMC925157 | SV 278 | 407/470 | 2/14/2006 |
| NMC925158 | SV 285 | 407/471 | 2/14/2006 |
| NMC925159 | SV 286 | 407/472 | 2/14/2006 |
| NMC925160 | SV 287 | 407/473 | 2/14/2006 |
| NMC925161 | SV 288 | 407/474 | 2/14/2006 |
| NMC925162 | SV 289 | 407/475 | 2/14/2006 |
| NMC925163 | SV 290 | 407/476 | 2/14/2006 |
| NMC925164 | SV 291 | 407/477 | 4/12/2006 |
| NMC925165 | SV 292 | 407/478 | 4/12/2006 |
| NMC925166 | SV 293 | 407/479 | 2/15/2006 |
| NMC925167 | SV 294 | 407/480 | 2/15/2006 |
| NMC925168 | SV 295 | 407/481 | 2/15/2006 |
| NMC925169 | SV 296 | 407/482 | 2/15/2006 |
| NMC925170 | SV 297 | 407/483 | 2/15/2006 |
| NMC925171 | SV 298 | 407/484 | 2/15/2006 |
| NMC925172 | SV 299 | 407/485 | 2/15/2006 |
| NMC925173 | SV 300 | 407/486 | 2/15/2006 |
| NMC925174 | SV 301 | 407/487 | 2/15/2006 |
| NMC925175 | SV 302 | 407/488 | 2/15/2006 |
| NMC925176 | SV 303 | 407/489 | 2/15/2006 |
| NMC925177 | SV 304 | 407/490 | 2/15/2006 |
| NMC925178 | SV 305 | 407/491 | 2/15/2006 |
| NMC925179 | SV 306 | 407/492 | 2/15/2006 |
| NMC925180 | SV 307 | 407/493 | 2/15/2006 |
| NMC925181 | SV 308 | 407/494 | 2/15/2006 |
| NMC925182 | SV 309 | 407/495 | 2/15/2006 |
| NMC925183 | SV 310 | 407/496 | 2/15/2006 |
| NMC925184 | SV 311 | 407/497 | 2/15/2006 |
| NMC925185 | SV 312 | 407/498 | 2/15/2006 |
| NMC925186 | SV 313 | 407/499 | 2/15/2006 |
| NMC925187 | SV 314 | 407/500 | 2/15/2006 |
| NMC925188 | SV 315 | 407/501 | 2/17/2006 |
| NMC925189 | SV 316 | 407/502 | 2/17/2006 |
| NMC925190 | SV 317 | 407/503 | 2/17/2006 |
| NMC925191 | SV 318 | 407/504 | 2/17/2006 |
| NMC925192 | SV 319 | 407/505 | 2/14/2006 |
| NMC925193 | SV 320 | 407/506 | 2/15/2006 |
| NMC925194 | SV 321 | 407/507 | 2/15/2006 |
September 9, 2014 | 117 |
|
Midway Gold Corp. Spring Valley Project | Certificate of Authors NI 43-101 Technical Report on Resources |
| Serial Num | Claim Name | Book / Page Number | Location Date |
| NMC925195 | SV 322 | 407/508 | 2/15/2006 |
| NMC925196 | SV 323 | 407/509 | 4/6/2006 |
| NMC925197 | SV 324 | 407/510 | 2/15/2006 |
| NMC925198 | SV 325 | 407/511 | 2/15/2006 |
| NMC925199 | SV 326 | 407/512 | 2/15/2006 |
| NMC925200 | SV 327 | 407/513 | 2/15/2006 |
| NMC925201 | SV 328 | 407/514 | 2/15/2006 |
| NMC925202 | SV 329 | 407/514A | 2/15/2006 |
| NMC925203 | SV 330 | 407/515 | 2/15/2006 |
| NMC925204 | SV 331 | 407/516 | 2/15/2006 |
| NMC925205 | SV 332 | 407/517 | 2/15/2006 |
| NMC925206 | SV 333 | 407/518 | 2/15/2006 |
| NMC925207 | SV 334 | 407/519 | 2/15/2006 |
| NMC925208 | SV 335 | 407/520 | 2/15/2006 |
| NMC925209 | SV 336 | 407/521 | 2/15/2006 |
| NMC925210 | SV 337 | 407/522 | 2/15/2006 |
| NMC925211 | SV 338 | 407/523 | 2/15/2006 |
| NMC925212 | SV 339 | 407/524 | 2/15/2006 |
| NMC925213 | SV 340 | 407/525 | 2/15/2006 |
| NMC925214 | SV 341 | 407/526 | 2/15/2006 |
| NMC925215 | SV 342 | 407/527 | 2/15/2006 |
| NMC925216 | SV 343 | 407/528 | 2/15/2006 |
| NMC925217 | SV 344 | 407/529 | 2/15/2006 |
| NMC925218 | SV 345 | 407/530 | 2/15/2006 |
| NMC925219 | SV 346 | 407/531 | 2/15/2006 |
| NMC925220 | SV 347 | 407/532 | 2/15/2006 |
| NMC925221 | SV 348 | 407/533 | 2/15/2006 |
| NMC925222 | SV 349 | 407/534 | 2/15/2006 |
| NMC925223 | SV 350 | 407/535 | 2/15/2006 |
| NMC925224 | SV 351 | 407/536 | 2/15/2006 |
| NMC925225 | SV 352 | 407/537 | 2/15/2006 |
| NMC925226 | SV 353 | 407/538 | 2/15/2006 |
| NMC925227 | SV 354 | 407/539 | 2/15/2006 |
| NMC925228 | SV 355 | 407/540 | 4/13/2006 |
| NMC925229 | SV 356 | 407/541 | 4/14/2006 |
| NMC925230 | SV 357 | 407/542 | 2/13/2006 |
| NMC929379 | SV 266 | 409/624 | 5/15/2006 |
| NMC929380 | SV 267 | 409/625 | 5/15/2006 |
September 9, 2014 | 118 |
|
Midway Gold Corp. Spring Valley Project | Certificate of Authors NI 43-101 Technical Report on Resources |
| Serial Num | Claim Name | Book / Page Number | Location Date |
| NMC929381 | SV 268 | 409/626 | 4/14/2006 |
| NMC929382 | SV 269 | 409/627 | 4/14/2006 |
| NMC929383 | SV 270 | 409/628 | 4/14/2006 |
| NMC929384 | SV 271 | 409/629 | 4/14/2006 |
| NMC929385 | SV 272 | 409/630 | 4/14/2006 |
| NMC929386 | SV 273 | 409/631 | 4/14/2006 |
| NMC929387 | SV 274 | 409/632 | 4/14/2006 |
| NMC929388 | SV 275 | 409/633 | 4/14/2006 |
| NMC929389 | SV 276 | 409/634 | 4/14/2006 |
| NMC929394 | SV 283 | 409/639 | 4/12/2006 |
| NMC929395 | SV 284 | 409/640 | 4/12/2006 |
| NMC930781 | PS 1 | 410/362 | 4/20/2006 |
| NMC930782 | PS 2 | 410/363 | 4/20/2006 |
| NMC930783 | PS 3 | 410/364 | 4/20/2006 |
| NMC930784 | PS 4 | 410/365 | 4/20/2006 |
| NMC930785 | PS 5 | 410/366 | 4/20/2006 |
| NMC930786 | PS 6 | 410/367 | 4/20/2006 |
| NMC930787 | PS 7 | 410/368 | 4/20/2006 |
| NMC930788 | PS 8 | 410/369 | 4/20/2006 |
| NMC930789 | PS 9 | 410/370 | 4/20/2006 |
| NMC930790 | PS 10 | 410/371 | 4/20/2006 |
| NMC930791 | PS 11 | 410/372 | 4/20/2006 |
| NMC930792 | PS 12 | 410/373 | 4/20/2006 |
| NMC930793 | PS 13 | 410/374 | 4/20/2006 |
| NMC930794 | PS 14 | 410/375 | 4/20/2006 |
| NMC930795 | PS 15 | 410/376 | 4/20/2006 |
| NMC930796 | PS 16 | 410/377 | 4/20/2006 |
| NMC930797 | PS 17 | 410/378 | 4/20/2006 |
| NMC930798 | PS 18 | 410/379 | 4/20/2006 |
| NMC930799 | PS 19 | 410/380 | 4/20/2006 |
| NMC930800 | PS 20 | 410/381 | 4/20/2006 |
| NMC930801 | PS 21 | 410/382 | 4/20/2006 |
| NMC930802 | PS 22 | 410/383 | 4/20/2006 |
| NMC930808 | PS 28 | 410/389 | 4/20/2006 |
| NMC930809 | PS 29 | 410/390 | 4/20/2006 |
| NMC930810 | PS 30 | 410/391 | 4/20/2006 |
| NMC930811 | PS 31 | 410/392 | 4/20/2006 |
| NMC930812 | PS 32 | 410/393 | 4/20/2006 |
September 9, 2014 | 119 |
|
Midway Gold Corp. Spring Valley Project | Certificate of Authors NI 43-101 Technical Report on Resources |
| Serial Num | Claim Name | Book / Page Number | Location Date |
| NMC930814 | PS 34 | 410/395 | 5/17/2006 |
| NMC930815 | PS 35 | 410/396 | 5/17/2006 |
| NMC930816 | PS 36 | 410/397 | 5/17/2006 |
| NMC930817 | PS 37 | 410/398 | 5/17/2006 |
| NMC930818 | PS 38 | 410/399 | 5/17/2006 |
| NMC930819 | PS 39 | 410/400 | 5/17/2006 |
| NMC930820 | PS 40 | 410/401 | 5/17/2006 |
| NMC930823 | PS 43 | 410/404 | 4/20/2006 |
| NMC930824 | PS 44 | 410/405 | 4/20/2006 |
| NMC930825 | PS 45 | 410/406 | 4/20/2006 |
| NMC930826 | PS 46 | 410/407 | 4/20/2006 |
| NMC930827 | PS 47 | 410/408 | 4/20/2006 |
| NMC930828 | PS 48 | 410/409 | 4/20/2006 |
| NMC930838 | PS 58 | 410/419 | 4/20/2006 |
| NMC930839 | PS 59 | 410/420 | 4/20/2006 |
| NMC930840 | PS 60 | 410/421 | 4/20/2006 |
| NMC930841 | PS 61 | 410/422 | 4/20/2006 |
| NMC930842 | PS 62 | 410/423 | 4/20/2006 |
| NMC930843 | PS 63 | 410/424 | 4/20/2006 |
| NMC954162 | Dry 1 | 423/200 | 3/26/2007 |
| NMC954163 | Dry 2 | 423/201 | 3/26/2007 |
| NMC954164 | Dry 3 | 423/202 | 3/26/2007 |
| NMC954582 | SSV 142 | 423/203 | 3/29/2007 |
| NMC954583 | SSV 143 | 423/204 | 3/29/2007 |
| NMC954584 | SSV 144 | 423/205 | 3/29/2007 |
| NMC954585 | SSV 370 | 423/206 | 3/29/2007 |
| NMC954586 | SSV 371 | 423/207 | 3/29/2007 |
| NMC954587 | SSV 372 | 423/208 | 3/29/2007 |
| NMC954588 | SSV 373 | 423/209 | 3/29/2007 |
| NMC954589 | SSV 374 | 423/210 | 3/29/2007 |
| NMC954590 | SSV 375 | 423/211 | 3/29/2007 |
| NMC954591 | SSV 376 | 423/212 | 3/29/2007 |
| NMC954592 | SSV 377 | 423/213 | 3/29/2007 |
| NMC954593 | SSV 378 | 423/214 | 3/29/2007 |
| NMC954594 | SSV 379 | 423/215 | 3/29/2007 |
| NMC954595 | SSV 380 | 423/216 | 3/29/2007 |
| NMC954596 | SSV 381 | 423/217 | 3/29/2007 |
| NMC954597 | SSV 382 | 423/218 | 3/29/2007 |
September 9, 2014 | 120 |
|
Midway Gold Corp. Spring Valley Project | Certificate of Authors NI 43-101 Technical Report on Resources |
| Serial Num | Claim Name | Book / Page Number | Location Date |
| NMC954598 | SSV 383 | 423/219 | 3/29/2007 |
| NMC954599 | SSV 385 | 423/220 | 3/29/2007 |
| NMC954600 | SSV 386 | 423/221 | 3/29/2007 |
| NMC954601 | SSV 387 | 423/222 | 3/29/2007 |
| NMC954602 | SV 262 | 423/223 | 3/29/2007 |
| NMC965332 | Duffy #5 | 427/745 | 9/5/2007 |
| NMC965333 | Duffy #6 | 427/746 | 9/5/2007 |
| NMC965334 | Duffy #7 | 427/747 | 9/5/2007 |
| NMC965335 | Duffy #8 | 427/748 | 9/5/2007 |
| NMC977866 | SV 214 | 432/395 | 11/7/2007 |
| NMC987526 | SVR 1 | 435/587 | 3/26/2008 |
| NMC987527 | SVR 2 | 435/588 | 3/26/2008 |
| NMC987528 | SVR 3 | 435/589 | 3/26/2008 |
| NMC987529 | SVR 4 | 435/590 | 3/26/2008 |
| NMC987530 | SVR 5 | 435/591 | 3/26/2008 |
| NMC987531 | SVR 6 | 435/592 | 3/26/2008 |
| NMC987532 | SVR 7 | 435/593 | 3/26/2008 |
| NMC987533 | SVR 8 | 435/594 | 3/26/2008 |
| NMC987534 | SVR 9 | 435/595 | 3/26/2008 |
| NMC987535 | SVR 10 | 435/596 | 3/26/2008 |
| NMC987536 | SVR 11 | 435/597 | 3/26/2008 |
| NMC987537 | SVR 12 | 435/598 | 3/26/2008 |
| NMC987538 | SVR 13 | 435/599 | 3/26/2008 |
| NMC987539 | SVR 14 | 435/600 | 3/26/2008 |
| NMC987540 | SVR 15 | 435/601 | 3/26/2008 |
| NMC987541 | SVR 16 | 435/602 | 3/26/2008 |
| NMC1011089 | SVB 13 | 449/865 | 9/22/2009 |
| NMC1023658 | SVB 1 | 453/660 | 2/18/2010 |
| NMC1023659 | SVB 2 | 453/661 | 2/18/2010 |
| NMC1023660 | SVB 3 | 453/662 | 2/18/2010 |
| NMC1023661 | SVB 4 | 453/663 | 2/18/2010 |
| NMC1023662 | SVB 5 | 453/664 | 2/18/2010 |
| NMC1023663 | SVB 6 | 453/665 | 2/18/2010 |
| NMC1023664 | SVB 7 | 453/666 | 2/18/2010 |
| NMC1023665 | SVB 8 | 453/667 | 2/18/2010 |
| NMC1023666 | SVB 9 | 453/668 | 2/18/2010 |
| NMC1023667 | SVB 10 | 453/669 | 2/18/2010 |
| NMC1023668 | SVB 11 | 453/670 | 2/18/2010 |
September 9, 2014 | 121 |
|
Midway Gold Corp. Spring Valley Project | Certificate of Authors NI 43-101 Technical Report on Resources |
| Serial Num | Claim Name | Book / Page Number | Location Date |
| NMC1023669 | SVB 12 | 453/671 | 2/18/2010 |
| NMC1034792 | SHO 60 | 461/284 | 11/11/2010 |
| NMC1034793 | SHO 61 | 461/285 | 11/11/2010 |
| NMC1034794 | SHO 62 | 461/286 | 11/12/2010 |
| NMC1034795 | SHO 63 | 461/287 | 11/12/2010 |
| NMC1034796 | SHO 64 | 461/288 | 11/12/2010 |
| NMC1034797 | SHO 65 | 461/289 | 11/12/2010 |
| NMC1034798 | SHO 4A | 461/290 | 11/8/2010 |
| NMC1034799 | SHO 5A | 461/291 | 10/1/2010 |
| NMC1034800 | HMS 4A | 461/292 | 10/1/2010 |
| NMC1062740 | SVB 14 | 477/247 | 10/18/2011 |
| NMC1062741 | SVB 15 | 477/248 | 10/18/2011 |
| NMC1062742 | SVB 16 | 477/249 | 10/18/2011 |
| NMC1062743 | SVB 17 | 477/250 | 10/18/2011 |
| NMC1096898 | SVB 18 | 500/0753 | 9/13/2013 |
| NMC1096899 | SVB 19 | 500/0754 | 9/13/2013 |
| NMC1096900 | SVB 20 | 500/0755 | 9/29/2013 |
| NMC1096901 | SVB 21 | 500/0756 | 9/29/2013 |
| NMC1096902 | SVB 22 | 500/0757 | 9/14/2013 |
| NMC1096903 | SVB 23 | 500/0758 | 9/15/2013 |
| NMC1096904 | SVB 24 | 500/0759 | 9/15/2013 |
| NMC1096905 | SVB 25 | 500/0760 | 9/16/2013 |
| NMC1096906 | SVB 26 | 500/0761 | 9/16/2013 |
| NMC1096907 | SVB 27 | 500/0762 | 9/16/2013 |
| NMC1096908 | SVB 28 | 500/0763 | 9/17/2013 |
| NMC1096909 | SVB 29 | 500/0764 | 9/17/2013 |
| NMC1096910 | SVB 30 | 500/0765 | 9/17/2013 |
| NMC1096911 | SVB 31 | 500/0766 | 9/14/2013 |
| NMC1096912 | SVB 32 | 500/0767 | 9/28/2013 |
| NMC1096913 | SVB 33 | 500/0768 | 9/28/2013 |
| NMC1096914 | SVB 34 | 500/0769 | 9/18/2013 |
| NMC1096915 | SVB 35 | 500/0770 | 9/18/2013 |
| NMC1096916 | SVB 36 | 500/0771 | 9/29/2013 |
| NMC1096917 | SVB 37 | 500/0772 | 9/29/2013 |
| NMC1096918 | SVB 38 | 500/0753 | 9/30/2013 |
| NMC1096919 | SVB 39 | 500/0774 | 9/30/2013 |