Attached files
| file | filename |
|---|---|
| EX-31.2 - EX-31.2 - Midway Gold Corp | mdw-20140930ex3128b1fe8.htm |
| EX-95 - EX-95 - Midway Gold Corp | mdw-20140930xex95.htm |
| EX-31.1 - EX-31.1 - Midway Gold Corp | mdw-20140930ex311902ed4.htm |
| EX-32 - EX-32 - Midway Gold Corp | mdw-20140930xex32.htm |
| EXCEL - IDEA: XBRL DOCUMENT - Midway Gold Corp | Financial_Report.xls |
UNITED STATES SECURITIES
AND EXCHANGE COMMISSION
Washington, D.C. 20549
FORM 10-Q
|
QUARTERLY REPORT PURSUANT TO SECTION 13 OR 15(d) OF THE SECURITIES EXCHANGE ACT OF 1934 |
||
|
For the quarterly period ended September 30, 2014 |
||
|
OR |
||
|
TRANSITION REPORT PURSUANT TO SECTION 13 OR 15(d) OF THE SECURITIES EXCHANGE ACT OF 1934 |
||


For the transition period from to
Commission file number: 001-33894

MIDWAY GOLD CORP.
(Exact name of registrant as specified in its charter)
|
British Columbia |
98-0459178 |
|
|
(State of other jurisdiction of incorporation or organization) |
(I.R.S. Employer Identification No.) |
|
|
Suite 280 – 8310 South Valley Highway |
||
|
Englewood, Colorado |
80112 |
|
|
(Address of principal executive offices) |
(Zip Code) |
(720) 979-0900
(Registrant’s Telephone Number, including area code)
(Former name, former address and former fiscal year, if changed since last report)
Indicate by check mark whether the registrant (1) has filed all reports required to be filed by Section 13 or 15(d) of the Securities Exchange Act of 1934 during the preceding 12 months (or for such shorter period that the Registrant was required to file such reports), and (2) has been subject to the filing requirements for the past 90 days. ☒ Yes ☐ No
Indicate by check mark whether the registrant has submitted electronically and posted on its corporate Web site, if any, every Interactive Data File required to be submitted and posted pursuant to Rule 405 of Regulation S-T (§232.405 of this chapter) during the preceding 12 months (or for such shorter period that the registrant was required to submit and post such files). ☒ Yes ☐ No
Indicate by check mark whether the registrant is a large accelerated filer, an accelerated filer, a non-accelerated filer or a smaller reporting company. See the definitions of “large accelerated filer” and “accelerated filer” and “smaller reporting company” in Rule 12b-2 of the Exchange Act (Check one):
Large accelerated filer ☐ Accelerated filer ☒ Non-accelerated filer ☐ Smaller Reporting Company ☐
Indicate by check mark whether the Registrant is a shell company (as defined in Rule 12b-2 of the Exchange Act) ☐ Yes ☒ No
Number of Common Shares outstanding at November 3, 2014: 174,919,068
TABLE OF CONTENTS
|
PART I – FINANCIAL INFORMATION |
4 | |
|
Item 1. |
Financial Statements |
4 |
|
Item 2. |
Management's Discussion and Analysis of Financial Condition and Results of Operations |
26 |
|
Item 3. |
Quantitative and Qualitative Disclosures about Market Risk. |
40 |
|
Item 4. |
Controls and Procedures |
40 |
|
PART II - OTHER INFORMATION |
41 | |
|
Item 1. |
Legal Proceedings |
41 |
|
Item 1A. |
Risk Factors |
41 |
|
Item 2. |
Unregistered Sale of Equity Securities and Use of Proceeds. |
42 |
|
Item 3. |
Defaults Upon Senior Securities |
42 |
|
Item 4. |
Mine Safety Disclosures |
42 |
|
Item 5. |
Other Information |
42 |
|
Item 6. |
Exhibits |
43 |
|
SIGNATURES |
44 | |
2
EXPLANATORY NOTE
All amounts in this interim report on Form 10-Q are expressed in Canadian dollars, unless otherwise indicated.
3
PART I – FINANCIAL INFORMATION
MIDWAY GOLD CORP.
CONSOLIDATED INTERIM BALANCE SHEETS
(Expressed in Canadian dollars, except shares) (unaudited)
|
September 30, |
December 31, |
|||||
|
2014 |
2013 |
|||||
|
Assets |
||||||
|
Current Assets: |
||||||
|
Cash and Cash Equivalents |
$ |
22,978,965 |
$ |
51,363,302 | ||
|
Amounts Receivable |
44,411 | 102,897 | ||||
|
Inventories (Note 3) |
486,238 |
- |
||||
|
Prepaid Expenses and Other Current Assets (Note 4) |
2,274,519 | 431,023 | ||||
|
Total Current Assets |
25,784,133 | 51,897,222 | ||||
|
Long Term Assets: |
||||||
|
Reclamation Deposits (Note 7) |
4,193,952 | 1,595,400 | ||||
|
Property, Equipment and Mine Development (Note 5) |
63,766,278 | 16,750,950 | ||||
|
Mineral Properties (Note 6) |
57,762,195 | 53,200,288 | ||||
|
Other Long Term Assets (Note 4) |
4,248,069 | 405,162 | ||||
|
Total Assets |
$ |
155,754,627 |
$ |
123,849,022 | ||
|
Liabilities and Stockholders’ Equity |
||||||
|
Current Liabilities: |
||||||
|
Accounts Payable and Accrued Liabilities (Note 15) |
$ |
8,343,044 |
$ |
2,879,730 | ||
|
Preferred Share Dividends Payable |
1,591,537 | 1,515,845 | ||||
|
Other Short Term Liabilities |
963,270 | 1,440,926 | ||||
|
Total Current Liabilities |
10,897,851 | 5,836,501 | ||||
|
Long Term Liabilities: |
||||||
|
Derivative Liability (Note 11) |
- |
8,189,720 | ||||
|
Asset Retirement Obligations (Note 7) |
3,532,475 | 51,967 | ||||
|
Other Long Term Liabilities |
305,805 | 121,689 | ||||
|
Total Liabilities |
14,736,131 | 14,199,877 | ||||
|
Redeemable Preferred Shares (Note 11) |
||||||
|
Series A Preferred Shares - Unlimited, No Par Value; |
||||||
|
Issued and Outstanding – 37,837,838 (2014 and 2013); |
||||||
|
Redemption Price - US$1.85 per share |
50,738,937 | 47,482,972 | ||||
|
Stockholders’ Equity (Note 10): |
||||||
|
Common stock authorized – unlimited, no par value; Issued and outstanding – 173,761,914 and 130,915,872 at September 30, 2014 and December 31, 2013, respectively |
174,934,487 | 140,834,370 | ||||
|
Additional Paid In Capital |
3,210,029 | 3,195,325 | ||||
|
Accumulated Other Comprehensive Income (Loss) (Note 13) |
9,220,156 | 2,126,923 | ||||
|
Accumulated Deficit |
(97,085,113) | (83,990,445) | ||||
|
Total Stockholders' Equity |
90,279,559 | 62,166,173 | ||||
|
Total Liabilities and Stockholders' Equity |
$ |
155,754,627 |
$ |
123,849,022 | ||
Commitments (Notes 7 and 14)
Subsequent Events (Notes 8 and 11)
The accompanying notes are an integral part of these unaudited consolidated interim financial statements.
4
MIDWAY GOLD CORP.
CONSOLIDATED INTERIM STATEMENTS OF OPERATIONS
(Expressed in Canadian dollars, except share and per share amounts) (unaudited)
|
Three Months Ended September 30, 2014 |
Three Months Ended September 30, 2013 |
Nine Months Ended September 30, 2014 |
Nine Months Ended September 30, 2013 |
|||||||||
|
Depreciation and Accretion |
$ |
242,907 |
$ |
140,960 |
$ |
583,104 |
$ |
382,215 | ||||
|
Write-down of Inventories |
266,054 |
- |
266,054 |
- |
||||||||
|
Mineral Exploration Expenditures (Schedule) |
1,202,264 | 1,605,830 | 2,525,784 | 4,185,765 | ||||||||
|
General & Administrative: |
||||||||||||
|
Consulting |
183,872 | 68,053 | 242,239 | 370,743 | ||||||||
|
Interest and Bank Charges |
1,124 | 825 | 2,944 | 2,186 | ||||||||
|
Investor Relations |
15,875 | 11,003 | 70,719 | 22,360 | ||||||||
|
Legal, Audit and Accounting |
249,088 | 396,032 | 832,890 | 3,094,750 | ||||||||
|
Office and Administration |
696,268 | 300,772 | 2,094,335 | 931,433 | ||||||||
|
Salaries and Benefits |
1,574,158 | 1,163,197 | 4,665,241 | 3,801,241 | ||||||||
|
Transfer Agent and Filing Fees |
45,856 | 208,721 | 177,363 | 342,146 | ||||||||
|
Travel |
70,031 | 69,178 | 247,575 | 250,391 | ||||||||
|
Operating Loss |
4,547,497 | 3,964,571 | 11,708,248 | 13,383,230 | ||||||||
|
Other Income (Expense): |
||||||||||||
|
Foreign Exchange Gain (Loss) |
(25,462) | (1,259,322) | (29,731) | 2,262,994 | ||||||||
|
Gain on Change in Fair Value of Derivative Liabilities (Note 11) |
- |
988,443 |
- |
15,574,007 | ||||||||
|
Interest and Investment Income |
4,861 | 40,397 | 28,660 | 128,188 | ||||||||
|
Loss on Sale of Equipment |
- |
(2,681) |
- |
(2,681) | ||||||||
|
Investment Write Down |
- |
(43,125) |
- |
(43,125) | ||||||||
|
Other Income (Expense) |
(35,957) | (15,590) | (175,237) | (24,393) | ||||||||
| (56,558) | (291,878) | (176,308) | 17,894,990 | |||||||||
|
Net Loss (Income) Before Income Tax |
4,604,055 | 4,256,449 | 11,884,556 | (4,511,760) | ||||||||
|
Income Tax Recovery (Expense) |
(477,245) | 272,628 | (1,210,112) | 2,179,077 | ||||||||
|
Net Loss (Income) |
$ |
5,081,300 |
$ |
3,983,821 |
$ |
13,094,668 |
$ |
(6,690,837) | ||||
|
Preferred Share Cumulative Dividend (Note 11) |
1,591,536 | 1,478,516 | 4,627,716 | 4,367,633 | ||||||||
|
Accretion of Redeemable Preferred Shares (Note 11) |
1,143,144 | 949,370 | 3,255,965 | 2,697,943 | ||||||||
|
Net Loss Attributable to Common Shareholders |
$ |
7,815,980 |
$ |
6,411,707 |
$ |
20,978,349 |
$ |
374,739 | ||||
|
Net Loss Per Share (Note 9) |
||||||||||||
|
Basic: |
||||||||||||
|
Weighted Average Number of Shares Outstanding |
172,870,093 | 129,605,544 | 150,039,147 | 128,840,275 | ||||||||
|
Net Loss Per Share |
$ |
0.05 |
$ |
0.05 |
$ |
0.14 |
$ |
- |
||||
|
Diluted: |
||||||||||||
|
Weighted Average Number of Shares Outstanding |
172,870,093 | 129,605,544 | 150,039,147 | 166,678,113 | ||||||||
|
Net Loss Per Share |
$ |
0.05 |
$ |
0.05 |
$ |
0.14 |
$ |
0.04 | ||||
The accompanying notes are an integral part of these unaudited consolidated interim financial statements.
5
MIDWAY GOLD CORP.
Consolidated INTERIM StatementS of COMPREHENSIVE (Income) Loss
(Expressed in Canadian dollars) (unaudited)
|
Three Months Ended September 30, 2014 |
Three Months Ended September 30, 2013 |
Nine Months Ended September 30, 2014 |
Nine Months Ended September 30, 2013 |
|||||||||
|
Net Loss (Income) for the Period |
$ |
5,081,300 |
$ |
3,983,821 |
$ |
13,094,668 |
$ |
(6,690,837) | ||||
|
Other Comprehensive Loss (Income) |
||||||||||||
|
Unrealized Loss (Gain) on Investment |
- |
7,500 | 13,750 | |||||||||
|
Transfer of Realized Loss to Statement of Operations |
- |
(43,125) |
- |
(43,125) | ||||||||
|
Currency Translation Adjustment |
(6,791,616) | 1,180,729 | (7,093,233) | (677,747) | ||||||||
|
Other Comprehensive Loss (Income) |
(6,791,616) | 1,145,104 | (7,093,233) | (707,122) | ||||||||
|
Comprehensive Loss (Income) |
$ |
(1,710,316) |
$ |
5,128,925 |
$ |
6,001,435 |
$ |
(7,397,959) | ||||
The accompanying notes are an integral part of these unaudited consolidated interim financial statements.
6
MIDWAY GOLD CORP.
CONSOLIDATED INTERIM STATEMENTS OF CASH FLOWS
(Expressed in Canadian dollars) (unaudited)
|
Nine Months Ended September 30, 2014 |
Nine Months Ended September 30, 2013 |
||||
|
Cash Provided By (Used In): |
|||||
|
Operating Activities: |
|||||
|
Net Income (Loss) |
$ |
(13,094,668) |
$ |
6,690,837 | |
|
Items Not Involving Cash: |
|||||
|
Depreciation |
476,839 | 380,540 | |||
|
Accretion |
106,265 | 1,675 | |||
|
Stock-Based Compensation |
647,206 | 993,953 | |||
|
Unrealized Foreign Exchange Loss |
- |
64,711 | |||
|
Inventory Write Down |
266,054 |
- |
|||
|
Investment Write Down |
- |
43,125 | |||
|
Gain on Change in Fair Value of Derivative Liabilities |
- |
(15,574,007) | |||
|
Lease Abandonment and Amortization of Deferred Rent |
160,689 |
- |
|||
|
Deferred Income Tax Recovery |
- |
(3,237,223) | |||
|
Loss on Sale of Equipment |
- |
2,681 | |||
|
Change in Non-Cash Working Capital Items: |
|||||
|
Amounts Receivable |
133,984 | (42,002) | |||
|
Inventories |
(735,769) |
- |
|||
|
Prepaid Expenses and Other Current Assets |
(172,942) | (204,024) | |||
|
Accounts Payable and Accrued Liabilities |
(1,907,450) | 448,988 | |||
|
Other Short Term Liabilities |
(448,967) | 1,080,184 | |||
|
Total Operating Activities |
(14,568,759) | (9,350,562) | |||
|
Investing Activities: |
|||||
|
Mineral Property Acquisitions |
(715,403) | (1,482,858) | |||
|
Proceeds from Insurance |
1,638,150 | ||||
|
Additions to Property, Equipment and Mine Development |
(39,703,879) | (4,874,255) | |||
|
Reclamation Deposit |
(2,438,754) | 871,203 | |||
|
Total Investing Activities |
(41,219,886) | (5,485,910) | |||
|
Financing Activities: |
|||||
|
Common Stock Issued, Net of Issue Costs |
29,358,563 |
- |
|||
|
Preferred Share Dividends Paid |
(699,359) | (1,925,655) | |||
|
Deferred Financing Costs |
(3,700,236) | (52,515) | |||
|
Total Financing Activities |
24,958,968 | (1,978,170) | |||
|
Effect of Exchange Rate Changes On Cash: |
2,445,340 | 135,208 | |||
|
Decrease in Cash and Cash Equivalents |
(28,384,337) | (16,679,434) | |||
|
Cash and Cash Equivalents, Beginning of Period |
51,363,302 | 75,052,836 | |||
|
Cash and Cash Equivalents, End of Period |
$ |
22,978,965 |
$ |
58,373,402 | |
Supplemental Disclosures with Respect to Cash Flows (Note 16)
The accompanying notes are an integral part of these unaudited consolidated interim financial statements.
7
MIDWAY GOLD CORP.
CONSOLIDATED INTERIM STATEMENT OF STOCKHOLDERS’ EQUITY - CONTINUED
(Expressed in Canadian dollars) (unaudited)
|
Convertible Preferred Shares |
Stockholder’s Equity (Deficit) |
||||||||||||||||||||
|
Number of Preferred Shares |
Preferred Shares |
Number of Common Shares |
Common Stock |
Additional Paid-in Capital |
Accumulated Other Comprehensive Loss |
Accumulated Deficit |
Total Stockholders’ Equity |
||||||||||||||
|
Balance, December 31, 2012 |
37,837,838 |
$ |
44,261,122 | 128,451,298 |
$ |
138,304,344 |
$ |
11,418,155 |
$ |
(436,344) |
$ |
(92,896,376) |
$ |
56,389,779 | |||||||
|
Shares Issued: |
|||||||||||||||||||||
|
Exercise of Stock Options |
- |
- |
37,500 | 34,125 | (13,125) |
- |
- |
21,000 | |||||||||||||
|
Shares Issued For Dividends |
- |
- |
2,427,074 | 2,495,901 |
- |
- |
- |
2,495,901 | |||||||||||||
|
Share Issue Costs |
- |
(314) |
- |
- |
- |
- |
- |
- |
|||||||||||||
|
Stock-Based Compensation |
- |
- |
- |
- |
1,174,509 |
- |
- |
1,174,509 | |||||||||||||
|
Accretion of Cost of Redeemable Preferred Shares |
- |
3,500,736 |
- |
- |
(3,500,736) |
- |
- |
(3,500,736) | |||||||||||||
|
Preferred Shares Dividends Payable |
- |
(278,572) |
- |
- |
(5,883,478) |
- |
- |
(5,883,478) | |||||||||||||
|
Unrealized Loss on Investment |
- |
- |
- |
- |
- |
(13,750) |
- |
(13,750) | |||||||||||||
|
Write-off of Investment |
- |
- |
- |
- |
- |
43,125 | 43,125 | ||||||||||||||
|
Unrealized Foreign Exchange Gain |
- |
- |
- |
- |
- |
2,533,892 |
- |
2,533,892 | |||||||||||||
|
Net Income (Loss) |
- |
- |
- |
- |
- |
- |
8,905,931 | 8,905,931 | |||||||||||||
|
Balance, December 31, 2013 |
37,837,838 | 47,482,972 | 130,915,872 | 140,834,370 | 3,195,325 | 2,126,923 | (83,990,445) | 62,166,173 | |||||||||||||
|
Shares Issued: |
|||||||||||||||||||||
|
Public Offerings and Consent Fee |
- |
- |
36,949,243 | 27,853,910 |
- |
- |
- |
27,853,910 | |||||||||||||
|
Exercise of Stock Options |
- |
- |
1,967,500 | 2,393,542 | (938,541) |
- |
- |
1,455,001 | |||||||||||||
|
Shares Issued For Dividends |
- |
- |
3,929,299 | 3,852,665 |
- |
- |
- |
3,852,665 | |||||||||||||
|
Stock-Based Compensation |
- |
- |
- |
- |
647,206 |
- |
- |
647,206 | |||||||||||||
|
Accretion of Cost of Redeemable Preferred Shares |
- |
3,255,965 |
- |
- |
(3,255,965) |
- |
- |
(3,255,965) | |||||||||||||
|
Preferred Shares Dividends Payable |
- |
- |
- |
- |
(4,627,716) |
- |
- |
(4,627,716) | |||||||||||||
|
Reclassification of Derivative Liability |
- |
- |
- |
- |
8,189,720 |
- |
- |
8,189,720 | |||||||||||||
|
Unrealized Foreign Exchange Gain |
- |
- |
- |
- |
- |
7,093,233 |
- |
7,093,233 | |||||||||||||
|
Net Income (Loss) |
- |
- |
- |
- |
- |
- |
(13,094,668) | (13,094,668) | |||||||||||||
|
Balance, September 30, 2014 |
37,837,838 |
$ |
50,738,937 | 173,761,914 |
$ |
174,934,487 |
$ |
3,210,029 |
$ |
9,220,156 |
$ |
(97,085,113) |
$ |
90,279,559 | |||||||
The accompanying notes are an integral part of these unaudited consolidated interim financial statements.
8
MIDWAY GOLD CORP.
SCHEDULE OF MINERAL EXPLORATION EXPENDITURES
(Expressed in Canadian dollars) (unaudited)
|
Three Months Ended September 30, 2014 |
Three Months Ended September 30, 2013 |
Nine Months Ended September 30, 2014 |
Nine Months Ended September 30, 2013 |
|||||||||
|
Exploration costs incurred are summarized as follows: |
||||||||||||
|
Pan Project |
||||||||||||
|
Assays and Analysis |
$ |
33,252 |
$ |
1,358 |
$ |
33,252 |
$ |
1,358 | ||||
|
Engineering and Consulting |
1,462 | 31,427 | 1,462 | 65,781 | ||||||||
|
Environmental |
886 |
- |
886 | 32 | ||||||||
|
Field Office and Supplies |
1,098 | 126,622 | 2,814 | 208,812 | ||||||||
|
Legal and Accounting |
908 |
- |
908 | 6,076 | ||||||||
|
Property Maintenance and Taxes |
- |
- |
- |
1,200 | ||||||||
|
Reclamation Costs |
48 | (4,946) | 52 | 1,896 | ||||||||
|
Reproduction and Drafting |
- |
4,102 | 11 | 6,084 | ||||||||
|
Salaries and Labor |
47,959 | 378,504 | 50,472 | 999,378 | ||||||||
|
Travel, Transportation and Accommodation |
448 | 41,242 | 2,495 | 142,076 | ||||||||
| 86,061 | 578,309 | 92,352 | 1,432,693 | |||||||||
|
Gold Rock Project |
||||||||||||
|
Assays and Analysis |
- |
7,150 |
- |
124,361 | ||||||||
|
Drilling |
- |
- |
- |
413,109 | ||||||||
|
Engineering and Consulting |
96,956 | 33,036 | 138,292 | 181,366 | ||||||||
|
Environmental |
235,430 | 338,790 | 821,211 | 581,367 | ||||||||
|
Field Office and Supplies |
19,334 | 17,980 | 67,884 | 196,731 | ||||||||
|
Legal and Accounting |
15,349 | 114 | 19,665 | 16,111 | ||||||||
|
Property Maintenance and Taxes |
178,317 | 167,589 | 179,440 | 236,411 | ||||||||
|
Reclamation Costs |
355 | 84 | 562 | 6,600 | ||||||||
|
Reproduction and Drafting |
- |
704 | 2,174 | 2,381 | ||||||||
|
Salaries and Labor |
59,622 | 48,542 | 330,886 | 469,222 | ||||||||
|
Travel, Transportation and Accommodation |
2,543 | 15,280 | 18,886 | 66,935 | ||||||||
| 607,906 | 629,269 | 1,579,000 | 2,294,594 | |||||||||
|
Spring Valley Project |
||||||||||||
|
Engineering and Consulting |
11,924 |
- |
104,628 | (205) | ||||||||
|
Field Office and Supplies |
754 |
- |
15,017 | 160 | ||||||||
|
Legal and Accounting |
2,767 |
- |
21,215 | 3,627 | ||||||||
|
Property Maintenance and Taxes |
9,784 |
- |
9,784 |
- |
||||||||
|
Reclamation Costs |
18 |
- |
28 | 12 | ||||||||
|
Reproduction and Drafting |
- |
- |
1,536 | 4 | ||||||||
|
Salaries and Labor |
3,680 |
- |
54,257 | 1,195 | ||||||||
|
Travel, Transportation and Accommodation |
94 |
- |
8,191 | 121 | ||||||||
| 29,021 |
- |
214,656 | 4,914 | |||||||||
|
Tonopah Project |
||||||||||||
|
Engineering and Consulting |
- |
- |
- |
2,335 | ||||||||
|
Environmental |
- |
1,498 |
- |
2,271 | ||||||||
|
Field Office and Supplies |
2,398 | 931 | 3,390 | 1,166 | ||||||||
|
Legal and Accounting |
- |
- |
- |
30 | ||||||||
|
Property Maintenance and Taxes |
78,927 | 69,533 | 79,496 | 70,055 | ||||||||
|
Reclamation Costs |
56 | 10 | 58 | 281 | ||||||||
|
Reproduction and Drafting |
- |
- |
95 | 6 | ||||||||
|
Salaries and Labor |
10,284 | 6,074 | 23,087 | 7,575 | ||||||||
|
Travel, Transportation and Accommodation |
298 | 896 | 830 | 1,093 | ||||||||
| 91,963 | 78,942 | 106,956 | 84,812 | |||||||||
|
Sub-Total Balance Carried Forward |
$ |
814,951 |
$ |
1,286,520 |
$ |
1,992,964 |
$ |
3,817,013 | ||||
The accompanying notes are an integral part of these unaudited consolidated interim financial statements.
9
MIDWAY GOLD CORP.
SCHEDULE OF MINERAL EXPLORATION EXPENDITURES - CONTINUED
(Expressed in Canadian dollars) (unaudited)
|
Three Months Ended September 30, 2014 |
Three Months Ended September 30, 2013 |
Nine Months Ended September 30, 2014 |
Nine Months Ended September 30, 2013 |
|||||||||
|
Sub-Total Balance Brought Forward |
$ |
814,951 |
$ |
1,286,520 |
$ |
1,992,964 |
$ |
3,817,013 | ||||
|
Golden Eagle Project |
||||||||||||
|
Engineering and Consulting |
- |
- |
- |
3,212 | ||||||||
|
Field Office and Supplies |
17 | 6 | 1,193 | 500 | ||||||||
|
Legal and Accounting |
- |
- |
- |
66 | ||||||||
|
Property Maintenance and Taxes |
579 | 473 | 7,963 | 3,653 | ||||||||
|
Reproduction and Drafting |
- |
- |
134 | |||||||||
|
Salaries and Labor |
40 | 40 | 4,307 | 2,947 | ||||||||
|
Travel, Transportation and Accommodation |
2 | 6 | 687 | 240 | ||||||||
| 638 | 525 | 14,284 | 10,618 | |||||||||
|
Pinyon Project |
||||||||||||
|
Engineering and Consulting |
- |
- |
- |
273 | ||||||||
|
Field Office and Supplies |
2,258 | 907 | 2,566 | 4,384 | ||||||||
|
Legal and Accounting |
- |
- |
- |
480 | ||||||||
|
Property Maintenance and Taxes |
78,580 | 69,190 | 78,580 | 124,306 | ||||||||
|
Reclamation Costs |
53 | 10 | 53 | 36 | ||||||||
|
Reproduction and Drafting |
- |
- |
35 | 101 | ||||||||
|
Salaries and Labor |
5,376 | 5,920 | 8,428 | 26,968 | ||||||||
|
Travel, Transportation and Accommodation |
280 | 874 | 459 | 2,567 | ||||||||
| 86,547 | 76,901 | 90,121 | 159,115 | |||||||||
|
Property Investigations |
||||||||||||
|
Assays and Analysis |
- |
1,550 | 656 | 1,550 | ||||||||
|
Engineering and Consulting |
- |
258 | 29,226 | 11,229 | ||||||||
|
Field Office and Supplies |
7,831 |
- |
17,283 | 487 | ||||||||
|
Legal and Accounting |
- |
- |
- |
297 | ||||||||
|
Property Maintenance and Taxes |
272,501 | 240,076 | 273,629 | 185,012 | ||||||||
|
Reclamation Costs |
183 |
- |
193 |
- |
||||||||
|
Reproduction and Drafting |
- |
- |
982 |
- |
||||||||
|
Salaries and Labor |
18,642 |
- |
100,210 | 17 | ||||||||
|
Travel, Transportation and Accommodation |
971 |
- |
6,236 | 427 | ||||||||
| 300,128 | 241,884 | 428,415 | 199,019 | |||||||||
|
Total Mineral Exploration Expenditures |
$ |
1,202,264 |
$ |
1,605,830 |
$ |
2,525,784 |
$ |
4,185,765 | ||||
The accompanying notes are an integral part of these unaudited consolidated interim financial statements.
10
1. Nature and Continuance of Operations
Midway Gold Corp. (the “Company”) was incorporated on May 14, 1996 under the laws of the Province of British Columbia and its principal business activities are the acquisition, exploration and development of mineral properties.
The Company has not generated any revenues from operations. These unaudited consolidated interim financial statements have been prepared on a going concern basis which assumes the Company will be able to realize its assets and discharge its liabilities in the normal course of business in the foreseeable future. The Company has incurred operating losses for the three and nine months ended September 30, 2014 of $4,547,497 and $11,708,248, respectively. Further operating losses are anticipated in the development of its business. Since inception of May 14, 1996 to September 30, 2014 the Company’s accumulated deficit totals $97,085,113. The Company’s cash on hand and working capital at September 30, 2014 is $22,978,965 and $14,886,282, respectively. The Company also has established an aggregate U.S.$55,000,000 senior secured credit facility consisting of a U.S.$45,000,000 project financing facility and a U.S.$10,000,000 cost overrun facility to fund development and construction of the Pan Project (Note 8).
Recoverability of amounts capitalized for the Company’s mineral properties, other than the Pan and Spring Valley Projects, are dependent upon the Company’s ability to raise funds or generate profits to enable funds to be available to complete exploration on the mineral properties, identify economically recoverable reserves and develop the mineral properties into profitable projects, or the receipt of adequate proceeds from the sale of such projects.
Recoverability of amounts capitalized for the Pan Project is dependent on the Company’s ability to draw on the Company’s debt facility, successfully complete construction and operate it profitably, or the receipt of adequate proceeds from any sale of the project. The Spring Valley project is subject to a joint venture agreement with Barrick Gold Exploration Inc., who is responsible for carrying the Company to production by funding and arranging financing for the Company’s share of cost of operations and mine exploration, development and construction expenses. The Company is responsible for funding costs incurred subsequent to commercial production. Barrick is also responsible for arranging financing for the Company’s share of the cost of operations and mine exploration, development and construction expenses.
2. Significant Accounting Policies
The consolidated interim financial statements included herein have been prepared by the Company, without audit, in accordance with the rules and regulations of the United States Securities and Exchange Commission (“SEC”) pursuant to Rule 10-01 of Regulation S-X. Certain information and footnote disclosures normally included in financial statements prepared in accordance with accounting principles generally accepted in the United States of America (“U.S. GAAP”) have been condensed or omitted pursuant to such SEC rules and regulations, although the Company believes that the disclosures included are adequate to make the information presented not misleading. Certain reclassifications have been made to prior period financial statements to conform to the current period presentation.
In management’s opinion, the unaudited consolidated interim financial statements contained herein reflect all adjustments, consisting solely of normal recurring items, which are necessary for the fair presentation of our financial position, results of operations, and cash flows on a basis consistent with that of our prior audited consolidated financial statements, except as described below. The results of operations for interim periods may not be indicative of results to be expected for the full fiscal year. The Company’s 2013 Annual Report on Form 10-K includes a summary of significant accounting policies and should be read in conjunction with this Form 10-Q.
Inventories
As of September 30, 2014, inventories include ore on leach pads and materials and supplies. Ore on leach pad is carried at the lower of cost or net realizable value. Cost includes mining costs (ore and waste) including mine site overhead and depreciation and amortization. Net realizable value is computed using expected metal prices reduced for any further estimated processing, refining, and selling costs.
Materials and supplies are valued at the lower of weighted average cost or net realizable value. Cost includes applicable taxes and freight.
11
Foreign Currency Translation
Effective January 1, 2014, the functional currency of the Company’s Canadian operations changed from the Canadian dollar to the United States dollar (“U.S. dollar”) based upon significant changes in economic facts and circumstances, which included the receipt of the Record of Decision for the Pan Project in December 2013, the commencement of construction at the Pan Project in 2014, and recent and anticipated financings in U.S. dollars. These changes in economic facts and circumstances have resulted in the U.S. dollar being the currency of the primary economic environment in which the entity operates. The change in the functional currency of the Company’s Canadian operations has been applied prospectively with differences attributable to current-rate translation of non-monetary assets and liabilities at the date of change being reported through other comprehensive income. The reporting currency remains the Canadian dollar, and all amounts herein are expressed in Canadian dollars unless otherwise noted.
The financial statements of the Company’s operations are translated from their functional currency, the United States dollar, to the reporting currency, the Canadian dollar, using the current rate method. Assets and liabilities are translated using the current rate in effect at the balance sheet date and revenues and expenses are translated at the average rate for the period. Adjustments resulting from the translation, if any, are included in accumulated other comprehensive income (loss) in stockholders’ equity.
Recently Issued Accounting Pronouncements
In May 2014, the Financial Accounting Standards Board (“FASB”) issued Accounting Standards Update (“ASU”) 2014-09, “Revenue from Contracts with Customers (Topic 606)”. The amendments in ASU 2014-09 affects any entity that either enters into contracts with customers to transfer goods or services or enters into contracts for the transfer of nonfinancial assets unless those contracts are within the scope of other standards (e.g., insurance contracts or lease contracts). This ASU will supersede the revenue recognition requirements in Topic 605, Revenue Recognition, and most industry-specific guidance, and creates a Topic 606 Revenue from Contracts with Customers. The core principle of the guidance is that an entity should recognize revenue to depict the transfer of promised goods or services to customers in an amount that reflects the consideration to which the entity expects to be entitled in exchange for those goods or services. The amendments are effective for annual reporting periods beginning after December 15, 2016, including interim periods within that reporting period. Early application is not permitted. The Company does not currently have revenue contracts with customers, but it will begin assessing the impact of such contracts as appropriate.
Recently Adopted Accounting Pronouncements
In June 2014, the FASB issued ASU 2014-10, “Development Stage Entities (Topic 915)”. The amendments in ASU 2014-10 remove all incremental financial reporting requirements from U.S. GAAP for development stage entities, including the removal of Topic 915, Development Stage Entities, from the FASB Accounting Standards Codification. In addition, the ASU: (a) adds an example disclosure in Topic 275, Risks and Uncertainties, to illustrate one way that an entity that has not begun planned principal operations could provide information about the risks and uncertainties related to the company’s current activities; and (b) removes an exception provided to development stage entities in Topic 810, Consolidation, for determining whether an entity is a variable interest entity. As allowed by ASU 2014-10, the Company has early adopted ASU 2014-10 and impacts of its adoption have been reflected throughout the Company’s consolidated financial statements, with the significant effect being the elimination of disclosures of certain cumulative amounts incurred during the period from inception to the period end reporting date.
In July 2013, the FASB issued ASU No. 2013-11, Presentation of an Unrecognized Tax Benefit When a Net Operating Loss Carryforward, a Similar Tax Loss, or a Tax Credit Carryforward Exists. The guidance requires an entity to present an unrecognized tax benefit, or a portion of an unrecognized tax benefit, in the financial statements as a reduction to a deferred tax asset for a net operating loss carryforward, a similar tax loss or tax credit carryforward, unless such tax loss or credit carryforward is not available at the reporting date under the tax law of the applicable jurisdiction to settle any additional income taxes resulting from the disallowance of a tax position. In the event that the tax position is disallowed or the tax law of the applicable jurisdiction does not require the entity to use, and the entity does not intend to use, the deferred tax asset for such purpose, the unrecognized tax benefit shall be presented in the financial statements as a liability and shall not be combined with deferred tax assets. The guidance is effective for annual reporting periods beginning after December 15, 2013, and interim periods within those annual periods, and is to be applied prospectively. The adoption of this standard did not have a material impact on the Company’s consolidated financial statements.
12
In March 2013, the FASB issued ASU 2013-05, “Parent's Accounting for the Cumulative Translation Adjustment upon Derecognition of Certain Subsidiaries or Groups of Assets within a Foreign Entity or of an Investment in a Foreign Entity”, an amendment to FASB Accounting Standards Codification ("ASC") Topic 830, “Foreign Currency Matters” ("FASB ASC Topic 830"). The update clarifies that complete or substantially complete liquidation of a foreign entity is required to release the cumulative translation adjustment ("CTA") for transactions occurring within a foreign entity. However, transactions impacting investments in a foreign entity may result in a full or partial release of CTA even though complete or substantially complete liquidation of the foreign entity has not occurred. Furthermore, for transactions involving step acquisitions, the CTA associated with the previous equity-method investment will be fully released when control is obtained and consolidation occurs. This ASU is effective for fiscal years beginning after December 15, 2013. The adoption of this standard did not have a material impact on the Company’s consolidated financial statements.
In February 2013, the FASB issued ASU 2013-04, “Obligations Resulting From Joint and Several Liability Arrangements for Which the Total Amount of the Obligation is Fixed at the Reporting Date, an amendment to FASB ASC Topic 405, Liabilities” ("FASB ASC Topic 405"). The update requires an entity to measure obligations resulting from joint and several liability arrangements for which the total amount of the obligation is fixed as of the reporting date as the sum of the obligation the entity agreed to pay among its co-obligors and any additional amount the entity expects to pay on behalf of its co-obligors. This ASU is effective for annual and interim periods beginning after December 15, 2013 and is required to be applied retrospectively to all prior periods presented for those obligations that existed upon adoption of the ASU. The adoption of this standard did not have a material impact on the Company’s consolidated financial statements.
3. Inventories
The following table provides the components of inventories:
|
September 30, 2014 |
December 31, 2013 |
|||||
|
Materials and Supplies |
$ |
70,278 |
$ |
- |
||
|
Ore on Leach Pads |
415,960 |
- |
||||
|
$ |
486,238 |
$ |
- |
|||
The Company began placing ore on the leach pad during the three months ended September 30, 2014. The period-end market value of the Company’s production-related inventories is determined in part by using expected realizable gold prices and is highly sensitive to this input. The Company had a write-down of Ore on Leach Pads inventory of $266,054 during the three and nine months ended September 30, 2014. A decline in metal price levels and/or an increase in production costs per ounce of gold could result in, or contribute to, a future write-down of production-related inventories.
4. Prepaids and Other Assets
At September 30, 2014 and December 31, 2013, prepaids and other assets consisted of the following:
|
September 30, 2014 |
December 31, 2013 |
|||||
|
Prepaid Expenses and Other Current Assets |
||||||
|
Insurance Proceeds Receivable |
$ |
1,654,212 |
$ |
- |
||
|
Prepaid Expenses |
583,297 | 396,903 | ||||
|
Deposits |
37,010 | 34,120 | ||||
|
$ |
2,274,519 |
$ |
431,023 | |||
|
Other Long Term Assets |
||||||
|
Deferred Financing Costs |
$ |
4,138,031 |
$ |
299,902 | ||
|
Deposits |
110,038 | 105,260 | ||||
|
$ |
4,248,069 |
$ |
405,162 | |||
13
5. Property, Equipment and Mine Development
At September 30, 2014 and December 31, 2013, property, equipment and mine development consisted of the following:
|
September 30, |
December 31, |
|||||
|
2014 |
2013 |
|||||
|
Land |
$ |
617,047 |
$ |
585,974 | ||
|
Buildings and Leasehold Improvements |
802,059 | 761,670 | ||||
|
Computer Equipment and Software |
1,911,325 | 1,403,123 | ||||
|
Trucks and Autos |
445,404 | 422,975 | ||||
|
Office Equipment |
281,483 | 248,370 | ||||
|
Field Equipment |
1,033,910 | 287,447 | ||||
|
Mine Development |
60,727,734 | 14,511,873 | ||||
|
Subtotal |
65,818,962 | 18,221,432 | ||||
|
Accumulated Depreciation |
(2,052,684) | (1,470,482) | ||||
|
Totals |
$ |
63,766,278 |
$ |
16,750,950 | ||
Depreciation expense for the three and nine months ended September 30, 2014 was $181,519 and $476,839, respectively, compared to depreciation expense for the three and nine months ended September 30, 2013 of $140,323 and $380,540, respectively.
During the three months ended September 30, 2014 severe thunderstorms damaged portions of Mine Development assets at the Company’s Pan project resulting in a $3,334,212 write-down of Mine Development costs. Repairs of all damage has been completed as of September 30, 2014, with an estimated total cost of $3,853,001 to complete the repair work. Insurance proceeds of $1,638,150 were received during the three months ended September 30, 2014 and additional proceeds of $1,654,212 was receivable as of September 30, 2014 of which $1,125,900 was received subsequent to September 30, 2014 (Note 4). No net gain or loss resulted from the write down of the Mine Development costs and the recognition of insurance proceeds. Further proceeds that maybe received will be recognized upon final settlement of the insurance claim.
6. Mineral Properties
Details on the Company’s mineral properties are found in Note 7 to the audited consolidated financial statements for the year ended December 31, 2013.
|
September 30, |
December 31, |
|||||
|
Mineral Property |
2014 |
2013 |
||||
|
Pan |
$ |
37,990,656 |
$ |
35,831,787 | ||
|
Gold Rock |
2,315,823 | 1,885,212 | ||||
|
Spring Valley |
5,487,292 | 5,168,424 | ||||
|
Tonopah |
9,411,232 | 7,959,646 | ||||
|
Golden Eagle |
2,433,200 | 2,310,671 | ||||
|
Pinyon |
123,992 | 44,548 | ||||
|
Totals |
$ |
57,762,195 |
$ |
53,200,288 |
|
(a) |
Pan property, Nevada |
The Company acquired a mineral lease agreement for a 100% interest in certain of the Pan property claims which requires the Company to pay advance minimum royalties on an annual basis. The minimum advance royalties will be creditable against a sliding scale Net Smelter Returns (“NSR”) production royalty of between 2.5% and 4%. The Company must incur a minimum of U.S.$65,000 per year for work expenditures, including claim maintenance fees, during the term of the mining lease. On January 2, 2014, the Company paid advanced royalties of $245,768 (U.S.$231,072).
The Company also owns 100% of certain adjoining claims acquired by staking.
14
|
(b) |
Gold Rock property, Nevada |
Through a series of four royalty agreements and one assignment, the Company acquired claims that currently comprise the Gold Rock property. The royalty agreements are subject to sliding scale royalties on NSR ranging between 2% and 6% based upon gold price and advanced minimum royalty payments recoverable from commercial production. During the nine months ended September 30, 2014, the Company has paid $315,105 (U.S.$295,217) in advanced minimum royalty payments.
|
(c) |
Spring Valley property, Nevada |
The Company signed an exploration and option to joint venture agreement with Barrick Gold Exploration Inc. (“Barrick”), a wholly owned subsidiary of Barrick Gold Corporation, effective March 9, 2009, granting Barrick the exclusive right to explore, develop and earn an interest in the Spring Valley property. Barrick has completed the expenditure requirement of U.S.$38.0 million to earn a 70% interest in the Spring Valley property. The Company has elected to allow Barrick to earn an additional 5% interest (75% total) by carrying the Company to production and arranging financing for the Company’s share of the cost of operations and mine exploration, development and construction expenses. The cost that Barrick incurs from carrying the Company to production will be recouped by Barrick, plus interest, once commercial production has been established.
The Company exercised its option to enter into a joint venture with Barrick as of February 23, 2014. With the formation of the joint venture agreement with Barrick, initial capital accounts were established by terms of the joint venture agreement, and Barrick is the manager of the joint venture.
|
(d) |
Tonopah property, Nye County, Nevada |
Through a series of agreements, amendments and payments the Company acquired a 100% interest in the Tonopah property. The acquisition is subject to a sliding scale royalty on NSR between 2% and 7% from any commercial production, based on changes in gold prices and an advance minimum royalty, recoverable from commercial production, of U.S.$300,000 per year payable on each August 15th. The Company entered into an agreement allowing payment of only U.S.$50,000 of the U.S.$300,000 payment due on August 15, 2014. The remaining U.S.$250,000, along with the August 15, 2015 U.S.$300,000 payment, will be paid subsequent to economic completion of the Pan project (Note 8). The Company is contractually obligated for both payments and has accrued these unpaid amounts in accrued liabilities.
|
(e) |
Golden Eagle property, Washington |
The Company purchased a 75% interest in the Golden Eagle, Washington project from Kinross Gold USA Inc. (“Kinross”) in August 2008, at a cost of $1,537,950 (U.S.$1,500,000) and purchased a 25% interest in the Golden Eagle project from Hecla Limited at a cost of $500,200 (U.S.$483,333). Kinross retained a 2% NSR royalty and was granted a first right of refusal to toll mill ore from the Golden Eagle property at their Kettle River Mill.
|
(f) |
Pinyon property, Nevada |
The Company entered into an earn-in agreement with Aurion Resources (“Aurion”) in November 2012 for claims. The Company can earn up to a 70% interest in the Pinyon property. The Company can also earn an additional 5% (75% total) by arranging mine financing. As of September 30, 2014 the Company has a spent a total of $377,466.
7. Reclamation and Remediation
The Company is required to post bonds with the Bureau of Land Management (“BLM”) for reclamation of planned mineral exploration and development programs associated with the Company’s mineral properties located in the United States. For the Spring Valley property, Barrick is responsible for bonding for the surface disturbance created by the exploration and development programs in which they are funding.
At September 30, 2014 and December 31, 2013 the Company had purchased surety contracts for reclamation bonds covering the Company’s exploration projects in the amount of U.S.$846,491. The surety contracts were renewed in May 2014 and are in place through May of 2015, at which point the Company can elect to renew the surety contracts or deposit the full cash amount of the reclamation bonds with the BLM.
15
As a part of the permitting process for the Pan Project, the Company is required to have a reclamation bond of approximately U.S.$15,300,000 held with the BLM. The Company purchased a surety contract for the reclamation bond, which amount requires the Company to deposit U.S.$3,700,000 into an escrow account as security for abandonment and remediation obligations, which has been recorded in reclamation deposits on the Consolidated Balance Sheet. The surety contract names the Company and several of its subsidiaries as indemnitors to the surety agreement. The holder of the surety contract may require, at its sole discretion that the Company make additional deposits to the escrow account of up to the U.S.$15,300,000 reclamation bond amount. The Company is required to maintain the escrow account until all abandonment and remediation obligations have been completed to the satisfaction of the BLM. Over the life of the Pan Project, prior to the completion of all abandonment and remediation obligations, the Company has the right to request a refund of a portion or all of the Pan Project reclamation deposit. Granting of the request is at the surety contract holder’s sole discretion.
At September 30, 2014 and December 31, 2013, $3,542,236 and $61,236, respectively, were accrued for reclamation obligations relating to the Company’s properties. A reconciliation of the Company’s asset retirement obligations for the nine months ended September 30, 2014 is as follows:
|
Balance as of December 31, 2013 |
$ |
61,236 |
|
Additions, Changes in Estimates and Other |
3,372,424 | |
|
Liabilities Settled |
- |
|
|
Accretion of Liability |
108,576 | |
|
Balance as of September 30, 2014 |
$ |
3,542,236 |
|
Less: Current Asset Retirement Obligations |
9,761 | |
|
Long-Term Asset Retirement Obligations |
$ |
3,532,475 |
Additions, changes in estimates and other during the nine months ended September 30, 2014 were related to construction of the Pan mine, which began in January 2014. Construction on several areas of the Pan mine plan are completed or are nearing completion as of September 30, 2014. The Company estimates that of the reclamation obligations as of September 30, 2014, approximately 94% of its total reclamation expenditures will occur during the years 2028 – 2039.
The current portion of reclamation and remediation liabilities of $9,761 and $9,269 at September 30, 2014 and December 31, 2013, respectively, are included in Accounts Payable and Accrued Liabilities on the accompanying consolidated interim balance sheets.
8. Debt
On July 18, 2014, the Company entered into a U.S.$55 million three-year senior secured project finance facility (the “Loan Facility”) with Commonwealth Bank of Australia (“CBA”) which will be used to fund continued development and construction of the Pan Project. The Loan Facility is comprised of two tranches: a project finance facility of U.S.$45 million, plus a cost overrun facility of U.S.$10 million. Advances under the project finance facility will bear interest at LIBOR plus 3.75% until economic completion, as defined in the Loan Facility agreement, and LIBOR plus 3.50% thereafter. Advances under the cost overrun facility will bear interest at the project finance facility rate plus 2.00%.
The Loan Facility will be secured by substantially all of the assets of the borrower (MDW Pan LLP, a wholly-owned subsidiary of the Company, and the owner of the Pan Project and related assets) and all other entities of the consolidated group. Upon achieving economic completion and meeting certain other requirements, security will be limited to the assets of MDW Pan LLP and guarantees from the Company and an affiliate. Pursuant to the Loan Facility, the Company’s ability to receive distributions from MDW Pan LLP for corporate general and administrative expenses, and other non-Pan expenditures is contingent upon satisfying certain conditions precedent and achieving various economic completion tests relating to, but not limited to, mine production, recoveries, sales, costs and sustainability over a three-month period. Economic completion must be achieved by September 30, 2015.
The Company’s ability to draw on the Loan Facility is contingent upon customary conditions precedent, including, but not limited to, funding any expected cost overruns on the Pan Project and establishment of an un-margined hedging program through CBA. The Company satisfied the gold hedging requirements on October 7, 2014 by entering into commitments to deliver to CBA, at a flat forward price of $1,200 per ounce, 80,500 ounces of gold over a 23-month period commencing in May 2015.
As of September 30, 2014, the Company has not drawn against the Loan Facility. The Loan Facility was amended on October 3, 2014, which provided for quarterly loan repayment terms to begin in June 2015 through the maturity date of March 31, 2017.
16
9. Net Loss (Income) Per Share
Basic loss (income) per common share is computed using the weighted-average number of common shares outstanding during the period. Diluted loss (income) per common share is calculated using the weighted-average number of common shares outstanding for the period and includes the dilutive effect of preferred shares, stock options and warrants.
The two-class method is used to calculate basic and diluted loss (income) per common share since preferred shares are a participating security under ASC 260 Earnings Per Share. The two-class method is an earnings allocation formula that determines income per share for each class of common stock and participating security according to dividends declared (or accumulated) and participation rights in undistributed earnings. Under the two-class method, basic loss (income) per common share is computed by dividing net loss (income) attributable to common shareholders after allocation of income to participating securities by the weighted-average number of common shares outstanding during the year. Diluted loss (income) per common share is computed using the more dilutive of the two-class method or the if-converted method. In periods of net loss, no effect is given to participating securities since they do not contractually participate in the losses of the Company.
Basic and diluted (income) loss per share for the three and nine months ended September 30, 2014 and 2013 are calculated as follows:
|
Three Months Ended |
Nine Months Ended |
|||||||||||
|
September 30, |
September 30, |
|||||||||||
|
2014 |
2013 |
2014 |
2013 |
|||||||||
|
Basic Loss (Income) Per Share: |
||||||||||||
|
Numerator: |
||||||||||||
|
Net Loss (Income) Attributable to Common Shareholders |
$ |
7,815,980 |
$ |
6,411,707 |
$ |
20,978,349 |
$ |
374,739 | ||||
|
Denominator: |
||||||||||||
|
Weighted-Average Common Shares For Basic Loss (Income) Per Share |
172,870,093 | 129,605,544 | 150,039,147 | 128,840,275 | ||||||||
|
Basic Loss (Income) Per Share |
$ |
0.05 |
$ |
0.05 |
$ |
0.14 |
$ |
- |
||||
|
Diluted Loss Per Share: |
||||||||||||
|
Numerator: |
||||||||||||
|
Net (Income) Loss Attributable to Common Shareholders |
$ |
7,815,980 |
$ |
6,411,707 |
$ |
20,978,349 |
$ |
374,739 | ||||
|
Effect of Gain on Change in Fair Value of Derivative Preferred Liability |
- |
- |
- |
14,427,439 | ||||||||
|
Effect of Accretion of Redeemable Preferred Shares |
- |
- |
- |
(2,697,943) | ||||||||
|
Effect of Preferred Shares Dividend |
- |
- |
- |
(4,367,633) | ||||||||
|
Effect of Canadian Corporate Dividend Tax |
- |
- |
- |
(1,061,992) | ||||||||
|
Diluted Loss |
$ |
7,815,980 |
$ |
6,411,707 |
$ |
20,978,349 |
$ |
6,674,610 | ||||
|
Denominator: |
||||||||||||
|
Weighted-Average Common Shares for Basic (Income) Loss Per Share |
172,870,093 | 129,605,544 | 150,039,147 | 128,840,275 | ||||||||
|
Effect of Dilutive Securities: |
||||||||||||
|
Preferred Series A shares |
- |
- |
- |
37,837,838 | ||||||||
|
Stock Options |
- |
- |
- |
- |
||||||||
|
Dilutive Potential Common Shares |
- |
- |
- |
37,837,838 | ||||||||
|
Total Shares |
172,870,093 | 129,605,544 | 150,039,147 | 166,678,113 | ||||||||
|
Diluted Loss Per Share |
$ |
0.05 |
$ |
0.05 |
$ |
0.14 |
$ |
0.04 | ||||
For the three and nine months ended September 30, 2014, 37,837,838 preferred shares that could be converted to shares of common stock were not included in the computation of diluted loss per common share, as the effect of doing so would have been anti-dilutive.
For the three and nine months ended September 30, 2014 and 2013, the effects of the assumed exercise of stock options of 3,598,161 and 4,134,167 shares of common stock, respectively, were excluded from the calculation of diluted net income per share as the effect would be anti-dilutive.
17
10. Share Capital
(a) The Company is authorized to issue an unlimited number of common shares and preferred shares.
(b) Share issuances
|
(i) |
On January 2, 2014, the Company issued 1,485,728 common shares in the amount of $1,284,431 for the payment of the Q4 2013 quarterly dividend on the Series A Preferred Shares (Note 11). |
|
(ii) |
On April 1, 2014, the Company issued 1,121,046 common shares in the amount of $1,298,573 for the payment of the Q1 2014 quarterly dividend on the Series A Preferred Shares (Note 11). |
|
(iii) |
On June 6, 2014, the Company issued 30,121,000 common shares upon the close of a “bought deal” public offering for U.S.$0.83 per share (the “June 6, 2014 Offering”). Gross proceeds of the June 6, 2014 Offering were $27,340,470 (U.S.$25,000,430). The Company incurred $2,053,544 (U.S.$1,889,020) in share issuance costs. Additionally, the Company issued 3,434,474 common shares in the amount of $3,117,431 (U.S.$2,850,613) for payment of the Series A Preferred Shareholders’ consent to issue shares in the June 6, 2014 Offering. |
|
(iv) |
On June 17, 2014, the Company issued 3,012,100 common shares as an over-allotment to the June 6, 2014 Offering for U.S.$0.83 per share. Gross proceeds of the over-allotment were $2,713,047 (U.S.$2,500,043). The Company incurred $146,063 (U.S.$134,595) in issuance costs. Additionally, the Company issued 381,669 common shares in the amount of $343,775 (U.S.$316,785) for payment of the Series A Preferred Shareholders’ consent to issue shares for the over-allotment of the June 6, 2014 Offering. |
|
(v) |
On July 2, 2014, the Company issued 1,322,525 common shares in the amount of $1,269,661 for the payment of the Q2 2014 quarterly dividend on the Series A Preferred Shares (Note 11). |
|
(vi) |
During the nine months ended September 30, 2014, the Company issued 1,967,500 common shares pursuant to the exercise of employee stock options. Proceeds received on the options exercised totalled $1,455,001. |
(c) Stock options
On June 20, 2013, the Company adopted the 2013 Stock and Incentive Plan (the “2013 Plan”) after approval of the 2013 Plan by the Company’s Shareholders at the Annual General and Special Meeting. The 2013 Plan is designed to replace the 2008 Stock Option Plan (the “Plan”); however, all outstanding option grants as of June 20, 2013 remain under the 2008 Stock Option Plan. Upon adoption of the 2013 Plan, the 2008 Stock Option Plan ceased to be available for the granting of new stock options.
The 2013 Plan permits a fixed aggregate number of common shares to be issuable under all awards under the 2013 Plan of 16,628,914 (“Award Cap”), which was equivalent to 10% of the Company’s common shares plus Series A Preferred Shares as of April 18, 2013. The total number of common shares issuable to insiders at any time and issued to insiders of the Company within any one-year period pursuant to stock options granted under the 2013 Plan, together with any other security based compensation arrangements of the Company, may not exceed 10% of the issued and outstanding common shares and preferred shares. The number of common shares issuable for Awards made under the 2008 Stock Option Plan is deducted from the Award Cap. The Award Cap represents the maximum number of shares issuable under both plans.
The exercise price of a stock option granted under the 2013 Plan will be determined by the Compensation Committee at the time the option is granted, but the exercise price may not be less than 100% of the fair market value of the Company’s common shares on the date of grant of such option. The fair market value is the closing price of one common share on the trading day of the date of grant on the NYSE MKT. Stock options granted under the 2013 Plan are subject to the following restrictions: (i) a promissory note is not permitted as payment for a stock option; (ii) the maximum term for stock options is 10 years from the date of grant; and (iii) unless otherwise fixed, stock options expire three months after the person to which they have been granted is terminated (12 months if due to death) or when options expire during a trading restriction, expiry is extended to the third trading day after a period during which trading in the common shares was prohibited or restricted pursuant to the policies of the Company.
The fair value of each option award is estimated on the date of grant using the Black-Scholes option pricing model. The option pricing model requires the input of subjective assumptions which are based on several different criteria. Expected volatility is based on the historical price volatility of the Company’s common stock. Expected dividend yield is assumed to be nil, as the Company has not paid dividends since inception on common shares. Expected forfeitures are calculated based upon historical experience of options. The expected life is estimated based on historical experience for options granted. Risk free interest rates are based on U.S. government obligations with a term approximating the expected life of the option.
18
The stock-based compensation for options vesting during the three and nine months ended September 30, 2014 and 2013 is included in the consolidated statement of operations as follows:
|
Three Months Ended |
Nine Months Ended |
|||||||||||
|
September 30, |
September 30, |
|||||||||||
|
2014 |
2013 |
2014 |
2013 |
|||||||||
|
Salaries and Benefits |
$ |
217,736 |
$ |
184,360 |
$ |
564,601 |
$ |
787,979 | ||||
|
Mineral Exploration Expenditures |
1,653 | 40,420 | 28,204 | 142,381 | ||||||||
|
Mine Development |
3,561 |
- |
18,594 |
- |
||||||||
|
Consulting |
5,435 | 17,484 | 35,807 | 63,593 | ||||||||
|
Total |
$ |
228,385 |
$ |
242,264 |
$ |
647,206 |
$ |
993,953 | ||||
2008 Stock Option Plan – TSX Stock Exchange
The estimated unrecognized compensation cost from unvested options as of September 30, 2014 was approximately $61,169, which is expected to be recognized over the remaining vesting period of 0.44 years, and has a weighted average remaining contractual term of 3.45 years.
The weighted-average grant date fair value of unvested options is summarized below for the nine months ended September 30, 2014 and 2013.
|
September 30, 2014 |
September 30, 2013 |
|||||
|
Unvested Beginning of Year |
$ |
0.55 |
$ |
2.12 | ||
|
Granted |
- |
0.55 | ||||
|
Vested |
0.55 | 0.63 | ||||
|
Expired |
(1.19) | (1.01) | ||||
|
Unvested End of Period |
$ |
0.55 |
$ |
0.82 | ||
The following table summarizes activity for compensatory stock options during the nine months ended September 30, 2014:
|
Number of Shares |
Weighted Average Exercise Price |
Aggregate Intrinsic Value |
Number of Shares Exercisable |
|||||||
|
Outstanding, January 1, 2014 |
9,645,834 |
$ |
1.27 |
$ |
632,800 | 8,122,490 | ||||
|
Granted |
- |
- |
- |
748,336 | ||||||
|
Exercised |
(1,967,500) | 0.74 |
- |
(1,967,500) | ||||||
|
Expired |
(1,440,001) | 1.64 |
- |
(1,193,331) | ||||||
|
Outstanding, September 30, 2014 |
6,238,333 |
$ |
1.36 |
$ |
979,825 | 5,709,995 | ||||
The following table summarizes information about outstanding compensatory stock options as of September 30, 2014:
|
Options Outstanding |
Options Exercisable |
||||||||||||||
|
Exercise Prices |
Number of Shares |
Remaining Contractual Life (years) |
Weighted Average Exercise Price |
Number Exercisable |
Weighted Average Exercise Price |
Aggregate Intrinsic Value |
|||||||||
|
$0.58 - $1.00 |
2,159,167 | 0.9 |
$ |
0.73 | 2,159,167 |
$ |
0.73 |
$ |
957,292 | ||||||
|
$1.01 - $1.60 |
1,721,666 | 3.4 | 1.16 | 1,193,328 | 1.17 | 22,533 | |||||||||
|
$1.61 - $2.10 |
2,357,500 | 2.1 | 2.08 | 2,357,500 | 2.11 |
- |
|||||||||
| 6,238,333 | 2.1 |
$ |
1.36 | 5,709,995 |
$ |
1.38 |
$ |
979,825 | |||||||
19
2013 Stock Option Plan – NYSE MKT Stock Exchange
The estimated unrecognized compensation cost from unvested options as of September 30, 2014 was approximately U.S.$517,433, which is expected to be recognized over the remaining vesting period of 2.76 years, and has a weighted average remaining contractual term of 4.66 years.
The weighted-average U.S.$ grant date fair value of unvested options is summarized below for the nine months ended September 30, 2014 and 2013.
|
September 30, 2014 |
September 30, 2013 |
|||||
|
Unvested Beginning of Year |
$ |
0.41 |
$ |
- |
||
|
Granted |
0.44 | 0.44 | ||||
|
Vested |
0.47 |
- |
||||
|
Expired |
(0.56) |
- |
||||
|
Unvested End of Period |
$ |
0.42 |
$ |
0.44 | ||
The following table summarizes activity for compensatory stock options during the nine months ended September 30, 2014, values in U.S.$, except share amounts:
|
Number of Shares |
Weighted Average Exercise Price |
Aggregate Intrinsic Value |
Number of Shares Exercisable |
|||||||
|
Outstanding, January 1, 2014 |
399,000 |
$ |
0.87 |
$ |
- |
- |
||||
|
Granted |
1,756,005 | 1.07 |
- |
562,333 | ||||||
|
Exercised |
- |
- |
- |
- |
||||||
|
Expired |
(261,628) |
- |
- |
(250,000) | ||||||
|
Outstanding, September 30, 2014 |
1,893,377 |
$ |
0.96 |
$ |
38,210 | 312,333 | ||||
The following table summarizes information about outstanding compensatory stock options as of September 30, 2014, values in U.S.$, except share amounts:
|
Options Outstanding |
Options Exercisable |
||||||||||||||
|
Exercise Prices |
Number of Shares |
Remaining Contractual Life (years) |
Weighted Average Exercise Price |
Number Exercisable |
Weighted Average Exercise Price |
Aggregate Intrinsic Value |
|||||||||
|
$0.56 - $1.00 |
1,876,702 | 4.69 |
$ |
0.90 | 312,333 |
$ |
0.92 |
$ |
38,210 | ||||||
|
$1.01 - $1.60 |
16,675 | 4.31 | 1.03 |
- |
- |
- |
|||||||||
| 1,893,377 | 4.69 |
$ |
0.96 | 312,333 |
$ |
0.92 |
$ |
38,210 | |||||||
d) Share purchase warrants:
There were no outstanding warrants as of September 30, 2014.
As of December 31, 2013, there were 6,130,781 warrants outstanding with an exercise price of U.S.$1.85 per share and each warrant entitled the holder to purchase one additional common share until January 6, 2014. All warrants expired on January 6, 2014 unexercised. U.S. GAAP requires the value of share purchase warrants issued with an exercise price denominated in a currency other than the Company’s Canadian dollar functional currency to be considered as a liability and this liability is stated at fair value each reporting period. As of December 31, 2013, the fair value of the warrant liability was adjusted to zero based upon the stock price of $0.81 compared to the exercise price of $1.85 and only six days remaining on the warrants term. As of September 30, 2013, the fair value of the warrant liability was adjusted to $112,847. The gain of $476,790 and $1,053,534 related to the change in the fair value of the warrants has been reported in “Gain on change in fair value of derivative liabilities” within Other Income in the Consolidated Statement of Operations for the three and nine months ended September 30, 2013, respectively.
During the nine months ended September 30, 2014, the Company did not issue any warrants.
20
11. Redeemable Preferred Shares
In December 2012, the Company issued 37,837,838 Series A Preferred Shares at U.S.$1.85 per share for gross proceeds of $68,936,000 (U.S.$70,000,000) by way of a private placement. The Company incurred a total of $641,333 in share issuance costs, of which the Company proportionately allocated $229,753 to an embedded derivative liability and, the remaining share issuance costs of $411,580 were netted against the redeemable preferred shares on the Consolidated Balance Sheet. The Series A Preferred Shares are a participating security as defined under ASC 260, in that the security participates in dividends with common stock and has rights to earnings (additional-paid-in-capital in the absence of earnings) that otherwise would have been available to common shareholders. There is an eight percent (8%) annual dividend, compounding monthly, payable quarterly on the Series A Preferred Shares. At the Company’s option, it may pay the 8% dividend with common shares, net of withholding taxes, in-lieu of cash, based on the closing price of the Company’s common shares as quoted by the NYSE MKT on the trading day immediately prior to the payment date.
Details of dividends paid or declared to date are as follows:
|
Dividend |
Date Declared |
Record Date |
Dividend Per Share |
Total Dividend |
Payment Date |
Payment Type (1) |
||||||||
|
Preferred Series A Holders |
3/11/2013 |
3/25/2013 |
$ |
0.04 |
$ |
1,699,140 |
4/1/2013 |
Cash |
||||||
|
Preferred Series A Holders |
6/20/2013 |
6/24/2013 |
0.04 | 1,479,868 |
7/2/2013 |
1,166,930 Shares |
||||||||
|
Preferred Series A Holders |
9/17/2013 |
9/23/2013 |
0.04 | 1,467,197 |
10/1/2013 |
1,260,144 Shares |
||||||||
|
Preferred Series A Holders |
12/19/2013 |
12/23/2013 |
0.04 | 1,515,845 |
1/2/2014 |
1,485,728 Shares |
||||||||
|
Preferred Series A Holders |
3/25/2014 |
3/28/2014 |
0.04 | 1,536,547 |
4/1/2014 |
1,121,046 Shares |
||||||||
|
Preferred Series A Holders |
6/18/2014 |
6/27/2014 |
0.04 | 1,499,632 |
7/2/2014 |
1,322,525 Shares |
||||||||
|
Preferred Series A Holders |
9/19/2014 |
9/26/2014 |
0.04 | 1,591,537 |
10/1/2014 |
1,157,154 Shares |
||||||||
|
$ |
0.28 |
$ |
10,789,766 |
|
(1) |
Dividends denoted as paid in shares require the issuance of shares and the payment of withholding taxes in cash. |
Canadian tax legislation requires a corporate tax to be paid on all cash or in-kind dividends declared and paid by a Canadian entity on taxable preferred shares. The dividends declared since the offering in December 2012 have resulted in Canadian corporate “Part VI.1” tax of $2,712,925, $1,762,136 of which has been remitted as of September 30, 2014. The Company is entitled to a deduction for tax purposes equal to 3.5 times Part VI.1 taxes paid. Therefore, future Canadian corporate tax savings, if realized, should approximately offset the preferred dividend tax expense.
During the three and nine months ended September 30, 2014 the Company incurred $477,245 and $1,210,112 of Part VI.1 tax expense, respectively. During the three and nine months ended September 30, 2013 the Company incurred $309,801 and $1,061,992 of Part VI.1 tax expense, respectively.
The holders of each Series A Preferred Share are able to convert the shares into a common share on a one-for-one basis at any time. After December 13, 2013, the Company can pro-ratably force conversion of the shares into common shares on a one-for-one basis provided that the weighted average price of the common shares exceeds U.S.$3.70 on each trading day during 20 consecutive trading days immediately prior to both the delivery of an applicable mandatory conversion notice and the applicable mandatory conversion date. From December 13, 2017, the Company or each holder of Series A Preferred Shares has the right, exercisable by 30 days' notice in writing, to redeem or to require the Company to redeem at their issue price of U.S.$1.85 per share any portion of the Series A Preferred Shares plus accumulated unpaid dividends for cash.
If the outstanding Series A Preferred Shares had been converted as of September 30, 2014, 37,837,838 common shares would have been issued and the fair value of those common shares based upon the closing price on the NYSE MKT as of September 30, 2014 of U.S.$1.04 would have been U.S.$39,351,351. If the common share price was above U.S.$1.85, there would be no change to the number of common shares issued upon conversion.
Holders of the Series A Preferred Shares, have the right to nominate and elect, voting as a separate class, one (1) director to the Company’s Board. If the size of the Company’s Board is increased beyond seven (7) members, increases will occur in increments of two (2) and the “Preferred Governance Majority” will have the right to designate one (1) of the two additional director nominees for election or appointment as director. The Preferred Governance Majority has the right to fill any vacancy of the preferred shareholder director position.
21
Subject to shareholder approval, if the Company is unable to redeem any Series A Preferred Shares two (2) years after a demand for redemption, then, subject to a special separate resolution of the holders of common shares and provided it is permitted by the Company’s articles, as amended, the holder of Series A Preferred Shares are to be entitled to (i) as a single class, vote to elect a majority of our Board, and (ii) in the event that our articles do not permit a single class of our shareholders to elect a majority of our Board sell, as may be permitted by applicable law, on our behalf, our assets, in such holder’s discretion, that are sufficient to redeem any Series A Preferred Shares. The proposal of this special separate resolution of the holders of our common shares failed to pass during our 2013 and 2014 Annual General and Special meeting of shareholders. The Company is required to seek shareholder approval for the proposal of the special resolution at each annual and special meeting of shareholders until the special resolution is passed.
Upon liquidation, dissolution or winding-up, the holders of the Series A Preferred Shares are entitled to a liquidation preference equal to 125% of the initial issue price of U.S.$1.85 prior and in preference to any distribution to the holders of our common shares.
In addition, holders of the Series A Preferred Shares have consent rights over a variety of significant corporate and financing matters, including, but not limited to, the voluntary or involuntary liquidation, dissolution or winding-up of the affairs of the Company, the issuance of any common shares or common share equivalents for less than U.S.$1.85 per share or any amendment to the Company’s articles in a manner adverse to the holders of Series A Preferred Shares.
Of the 37,837,838 Series A Preferred Shares sold, EREF-MID II, LLC and HCP-MID, LLC purchased a combined 17,837,838 Series A Preferred Shares. Hale Fund Management, LLC, (“HFM”) is the manager of EREF-MID II, LLC. Hale Capital Partners, LP, (“HCP”) is the sole member of HCP-MID, LLC. Hale Fund Partners, LLC, (“HFP”) is the general partner of HCP. Hale Capital Management, LP, (“HCM”) is the manager of HCP. Hale Fund Management, LLC, (“HFM”), is the general partner of HCM and exercises voting and investment power over the Series A Preferred Shares held by HCP-MID, LLC. Mr. Martin Hale, a member of the Company’s board of directors, is the (i) CEO of HCP, (ii) the sole owner and managing member of HFP and (iii) the sole owner and CEO of HFM.
U.S. GAAP requires that embedded derivatives not closely related to the host contract be bifurcated from the host contract and accounted for at fair value. Because the convertible feature of the Series A Preferred Shares is denominated in the U.S. dollar, a foreign currency in respect to the functional currency of the parent of the Company as of December 13, 2012, the date of issuance of the Series A Preferred Shares and throughout fiscal year 2013, the Company bifurcated the Series A Preferred Shares and recorded an embedded derivative liability for the conversion feature. Effective January 1, 2014, the functional currency of the parent changed from the Canadian dollar to the U.S. dollar based upon significant changes in economic facts and circumstances. As a result of this change in functional currency to the U.S. dollar, the embedded derivative liability recorded as of December 31, 2013 of $8,189,720 was reclassified to additional paid in capital pursuant to ASC815 due to the conversion feature of the Series A Preferred Shares no longer being denominated in a foreign currency.
The balance of the Company’s redeemable preferred shares and changes in the carrying amount of the redeemable preferred shares are as follows:
|
Redeemable Preferred Shares |
|||
|
Balance as of December 31, 2012 |
$ |
44,261,122 | |
|
Accretion of Redeemable Preferred Shares |
3,500,736 | ||
|
Preferred Share Cumulative Dividend |
5,883,478 | ||
|
Declared Preferred Share Cumulative Dividend |
(6,162,050) | ||
|
Share Issuance Costs |
(314) | ||
|
Balance as of December 31, 2013 |
$ |
47,482,972 | |
|
Accretion of Redeemable Preferred Shares |
3,255,965 | ||
|
Preferred Share Cumulative Dividend |
4,627,716 | ||
|
Declared Preferred Share Cumulative Dividend |
(4,627,716) | ||
|
Balance as of September 30, 2014 |
$ |
50,738,937 | |
22
12. Fair Value Measurements
The Company utilizes valuation techniques that maximize the use of observable inputs and minimize the use of unobservable inputs to the extent possible. The Company determines fair value based on assumptions that a market participant would use in pricing an asset or liability in the principal or most advantageous market. When considering market participant assumptions in fair value measurements, the following fair value hierarchy distinguishes between observable and unobservable inputs, which are categorized in one of the following levels:
|
· |
Level 1 Inputs: Unadjusted quoted prices in active markets for identical assets or liabilities accessible to the reporting entity at the measurement date. |
|
· |
Level 2 Inputs: Other than quoted prices included in Level 1 inputs that are observable for the asset or liability, either directly or indirectly, for substantially the full term of the asset or liability. |
|
· |
Level 3 Inputs: Unobservable inputs for the asset or liability used to measure fair value to the extent that observable inputs are not available, thereby allowing for situations in which there is little, if any, market activity for the asset or liability at measurement date. |
Assets and liabilities are classified in their entirety based on the lowest level of input that is significant to the fair value measurement. Certain financial instruments, including cash and equivalents, amounts receivable, current assets, reclamation deposits, accounts payable, preferred share dividends payable and other short and long term liabilities, are carried at cost, which approximates fair value due to the short-term nature of these instruments.
The Company did not have any Level 1 financial assets or liabilities as of September 30, 2014 or December 31, 2013.
The Company’s Level 2 liability as of December 31, 2013 is an embedded derivative liability related to the convertible Series A Preferred Shares issued as part of a private offering closed on December 13, 2012 (Note 11). The Company engaged a third party valuation firm to determine the fair value of the derivative liability and the Company recorded the change in the fair value of the derivative liability through the Consolidated Statement of Operations. As a result of the change in functional currency of the Company’s parent from the Canadian dollar to the U.S. dollar, effective January 1, 2014, the embedded derivative liability related to the convertible Series A Preferred Shares was reclassified to additional paid in capital at that date, and no embedded derivative liability is recorded as of September 30, 2014.
The Company did not have any Level 3 financial assets or liabilities as of September 30, 2014 or December 31, 2013.
Financial instruments measured at fair value as at December 31, 2013 were as follows:
|
Financial Instrument |
Quoted Prices in Active Markets for Identical Assets |
Significant Other Observable Inputs |
Significant Unobservable Inputs |
Total at December 31, 2013 |
||||||||
|
Liabilities |
||||||||||||
|
Preferred Share Liability |
$ |
- |
$ |
(8,189,720) |
$ |
- |
$ |
(8,189,720) |
13. Accumulated Other Comprehensive Income
The components of AOCI as of September 30, 2014 were as follows:
|
Currency Translation Adjustment |
Total AOCI |
|||||
|
Balance as of December 31, 2013 |
$ |
(2,126,923) |
$ |
(2,126,923) | ||
|
Other Comprehensive Income Before Reclassifications |
(7,093,233) | (7,093,233) | ||||
|
Balance as of September 30, 2014 |
$ |
(9,220,156) |
$ |
(9,220,156) | ||
14. Commitments
The Company has obligations under operating leases for its corporate offices in Englewood, Colorado until 2020, field offices in Ely, Nevada until 2015 and office equipment until 2018. Future minimum lease payments for non-cancellable leases with initial lease terms in excess of one year are included in the table below.
23
The Company signed a Contract Mining Agreement with Ledcor CMI, Inc (“Ledcor”) on May 19, 2014 relating to mining activities at the Pan project. On July 21, 2014, the Company signed the notice to proceed with Ledcor, triggering the start of the 63 month term of the contract. Under the terms of the Contract Mining Agreement, Ledcor is to provide all required labor, material and equipment (excluding fuel) to complete all necessary drilling, blasting, loading, hauling and related activities for the mining of the Pan project. Payment by the Company to Ledcor is primarily based on unit prices for bank cubic yards and tons. The Contract Mining Agreement contains a lease related to mining equipment as well as other non-lease elements. The Contract Mining Agreement is an operating lease and accounted for as such. Expected future minimum payments, including both the future minimum lease payments and the other non-lease element payments for the Contract Mining Agreement over the initial 35 months of the agreement, consistent with the break fee term, are included in the table below. The expected future minimum payments are determined by rates within the Contract Mining Agreement and estimated tons moved and bank cubic yards for drilling and blasting.
The Company has signed unconditional purchase obligation agreements relating to the development of the Pan Project which as of September 30, 2014 committed the Company to $9,069,091 of non-cancellable capital expenditures payable during 2014. In addition, the Company has cancellable contract obligations related to consulting service agreements until 2016.
|
Fiscal Year |
|||||||||||||||
|
2014 |
2015 - 2016 |
2017 - 2018 |
Thereafter |
Total |
|||||||||||
|
Operating Lease Obligations |
$ |
7,736,336 |
$ |
74,629,038 |
$ |
19,312,595 |
$ |
393,419 |
$ |
102,071,388 | |||||
|
Contractual Obligations |
9,095,299 | 119,691 | 8,288 |
- |
9,223,278 | ||||||||||
|
Total |
$ |
16,831,635 |
$ |
74,748,729 |
$ |
19,320,883 |
$ |
393,419 |
$ |
111,294,666 | |||||
The Company is subject to litigation, claims and governmental and regulatory proceedings arising in the ordinary course of business. It is the opinion of the Company’s management that current claims and litigation involving the Company are not likely to have a material adverse effect on its consolidated financial position, cash flows or results of operations.
The Company is required to pay Ledcor a break fee if the contract is terminated during the first 35 months of the contract. The break fee began at U.S.$9,712,000 and declines to $nil over the 35 month period. As of September 30, 2014, the break fee was U.S.$9,303,000.
15. Related Party Transactions
On August 18, 2014, Dr. Roger Newell retired from the Company’s Board of Directors. In connection with Dr. Newell’s retirement, The Company and Dr. Newell entered into an advisory agreement (“Advisory Agreement”) dated August 18, 2014. Pursuant to the Advisory Agreement, for a period of one year from the effective date of the Advisory Agreement, Dr. Newell agreed to provide the Company with advisory services including, but not limited to, technical or commercial advice regarding mining properties and assistance at the request and direction of our management, provide general advice regarding prevailing commercial practices and industry trends and assist in special projects as may be reasonably assigned by our management. Pursuant to the Advisory Agreement, we agreed to compensate Dr. Newell U.S.$4,166.67 per month and shall reimburse Dr. Newell for reasonable and necessary registration fees, membership fees, travel, transportation and lodging expenses and other expenses up to a maximum amount of U.S.$20,000.00 per year. During the three and nine months ended September 30, 2014, the Company paid Dr. Newell $10,453 under the agreement.
On August 18, 2014, the Company approved Indemnification Agreements with each of the Company’s directors and officers. The Indemnification Agreements provide, among other things, that each of the Company’s directors and officers shall be indemnified to the fullest extent permitted by applicable law against all expenses, judgments, fines and amounts paid in settlement actually and reasonably incurred by each of the Company’s directors and officers in connection with any proceeding by reason of his or her relationship with the Company. In addition, the Indemnification Agreements provide for the advancement of expenses incurred by each of the Company’s directors and officers in connection with any proceeding covered by the Indemnification Agreements, subject to the conditions set forth therein and to the extent such advancement is not prohibited by law. The Indemnification Agreements also sets out the procedures for determining entitlement to indemnification, the requirements relating to notice and defense of claims for which indemnification is sought, the procedures for enforcement of indemnification rights and the limitations on and exclusions from indemnification, and the minimum levels of directors’ and officers’ liability insurance to be maintained by the Company.
For information on the related parties involved in the Series A Preferred transaction see Note 11.
24
On May 14, 2014, the Company obtained the consent of the Series A Preferred Shareholders with respect to the issuance of Common Shares in connection with the June 6, 2014 Offering. Pursuant to the rights granted to the Series A Preferred Shareholders, the Company agreed to seek the consent of the Preferred Governance Majority of the Series A Preferred Shareholders in the event the Company offers Common Shares at a price less than US$1.85 per Common Share. As consideration for obtaining the consent of the Series A Preferred Shareholders and to compensate the Series A Preferred Shareholders for the dilution that they will suffer as a result of the June 6, 2014 Offering and the over-allotment to the June 6, 2014 Offering, the Company agreed to issue 3,816,143 Common Shares to the Series A Preferred Shareholders (the “Fee Shares”) in an aggregate amount equal to $3,461,206 (U.S.$3,167,398 (the “Consent Fee”), at a deemed price equal to the June 6, 2014 Offering price of U.S.$0.83 per share. The Consent Fee was negotiated at arm’s length by the members of a special committee of the Company’s independent directors (the “Special Committee”). The Fee Shares were issued pro rata to the Series A Preferred Shareholders based on their percentage holdings of Series A Preferred Shares. The Special Committee, after considering the advice of its financial and legal advisors, unanimously recommended to the Company’s board of directors the payment of the Consent Fee and the issuance of the Fee Shares. Messrs. Martin Hale and Nathaniel Klein were not members of the Special Committee.
16. Supplemental Disclosure with Respect to Cash Flows
Supplemental cash flow information for the nine months ended September 30, 2014 and 2013 is as follows:
|
September 30, 2014 |
September 30, 2013 |
|||||
|
Preferred Share Cumulative Dividend, including Accrual |
$ |
4,627,716 |
$ |
4,367,633 | ||
|
Canadian Part VI.1 Taxes Paid |
1,762,136 |
- |
||||
|
Accretion of Redeemable Preferred Shares |
3,255,965 | 2,697,943 | ||||
|
Reclassification of Derivative Liability |
8,189,720 |
- |
||||
|
Common Share Issuance for Payment of Preferred Dividend |
3,852,665 | 1,253,352 | ||||
|
Common Share Issuance for Consent Fee to Preferred Shareholders |
3,461,206 |
- |
||||
|
Net Increase (Decrease) in Asset Retirement Obligations |
3,372,424 | 51,665 | ||||
|
Share Issuance Costs Included in Accounts Payable and Accrued Liabilities |
49,652 |
- |
||||
17. Retirement Savings Plan
The Company sponsors an employee-directed 401(k) savings plan (the “401(k) Plan”) for all eligible employees over the age of 18. Under the 401(k) Plan, employees may make voluntary contributions based upon a percentage of their pretax income.
The Company matches 50% of each employee’s contribution up to 6% of the employee’s pretax income. The Company’s cash contributions vest ratably over a three year service period. During the three and nine months ended September 30, 2014, the Company made matching cash contributions of $25,917 and $78,973, respectively, compared to $21,943 and $59,233 for three and nine months ended September 30, 2013, respectively.
18. Segment Disclosures
The Company considers itself to operate in a single segment, being mineral exploration and development, with all of the Company’s long-lived assets being located in the United States at September 30, 2014 and December 31, 2013.
25
Item 2. Management's Discussion and Analysis of Financial Condition and Results of Operations.
You should read the following discussion and analysis of our financial condition and results of operations together with our financial statements and related notes appearing elsewhere in this Quarterly Report on Form 10-Q. This discussion and analysis contains forward-looking statements that involve risks, uncertainties and assumptions. Our actual results may differ materially from those anticipated in these forward-looking statements as a result of many factors, including, but not limited to, those set forth under the heading “Risk Factors and Uncertainties” in our Annual Report on Form 10-K filed with the SEC on March 13, 2014, and elsewhere in this Quarterly Report on Form 10-Q.
This discussion and analysis should be read in conjunction with the accompanying unaudited interim consolidated financial statements and related notes. The discussion and analysis of the financial condition and results of operations are based upon the unaudited interim consolidated financial statements, which have been prepared in accordance with accounting principles generally accepted in the United States. The preparation of financial statements in conformity with accounting principles generally accepted in the United States requires us to make estimates and assumptions that affect the reported amounts of our assets and liabilities, disclosure of any contingent liabilities at the financial statement date and reported amounts of revenue and expenses during the reporting period. On an on-going basis we review our estimates and assumptions. The estimates were based on historical experience and other assumptions that we believe to be reasonable under the circumstances. Actual results are likely to differ from those estimates under different assumptions or conditions, but we do not believe such differences will materially affect our financial position or results of operations. Critical accounting policies, the policies we believe are most important to the presentation of our financial statements and require the most difficult, subjective and complex judgments are outlined below in “Critical Accounting Policies”.
Cautionary Note Regarding Forward-Looking Statements
In addition, certain statements made in this Quarterly Report on Form 10-Q may constitute “forward-looking statements”. These forward-looking statements involve known or unknown risks, uncertainties and other factors that may cause our actual results, performance, or achievements to be materially different from any future results, performance or achievements expressed or implied by the forward-looking statements. Except for historical information, the matters set forth herein, which are forward-looking statements, involve certain risks and uncertainties that could cause actual results to differ. Potential risks and uncertainties include, but are not limited to, unexpected changes in business and economic conditions; significant increases or decreases in gold prices; changes in interest and currency exchange rates; unanticipated grade changes; metallurgy, processing, access, availability of materials, equipment, supplies and water; determination of reserves; results of current and future exploration activities; results of pending and future feasibility studies; joint venture relationships; political or economic instability, either globally or in the countries in which we operate; local and community impacts and issues; timing of receipt of government approvals; accidents and labor disputes; environmental costs and risks; competitive factors, including competition for property acquisitions; and availability of external financing at reasonable rates or at all. Forward-looking statements can be identified by terminology such as “may,” “will,” “should,” “expects,” “intends,” “plans,” “anticipates,” “believes,” “estimates,” “predicts,” “potential,” “continues” or the negative of these terms or other comparable terminology, or which by their nature refer to future events. Although we believe that the expectations reflected in the forward-looking statements contained herein are reasonable, we cannot guarantee future results, levels of activity, performance or achievements. Forward-looking statements are made based on management’s beliefs, estimates, and opinions on the date the statements are made, and we undertake no obligation to update such forward-looking statements if these beliefs, estimates, and opinions should change, except as required by law.
Cautionary Note to U.S. Investors Regarding Reserve and Resource Estimates
The mineral estimates in this Quarterly Report on Form 10-Q have been prepared in accordance with the requirements of the securities laws in effect in Canada, which differ from the requirements of United States securities laws. The terms “mineral reserve”, “proven mineral reserve” and “probable mineral reserve” are Canadian mining terms as defined in accordance with Canadian National Instrument 43-101 – Standards of Disclosure for Mineral Projects (“NI 43-101”) and the Canadian Institute of Mining, Metallurgy and Petroleum (the “CIM”) - CIM Definition Standards on Mineral Resources and Mineral Reserves, adopted by the CIM Council, as amended.
These definitions differ from the definitions in United States Securities and Exchange Commission (“SEC”) Industry Guide 7 under the United States Securities Act of 1933, as amended. Under SEC Industry Guide 7 standards, a “final” or “bankable” feasibility study is required to report reserves, the three-year historical average price is used in any reserve or cash flow analysis to designate reserves and the primary environmental analysis or report must be filed with the appropriate governmental authority.
26
In addition, the terms “mineral resource”, “measured mineral resource”, “indicated mineral resource” and “inferred mineral resource” are defined in and required to be disclosed by NI 43-101; however, these terms are not defined terms under SEC Industry Guide 7 and are normally not permitted to be used in reports and registration statements filed with the SEC. Investors are cautioned not to assume that any part or all of mineral deposits in these categories will ever be converted into reserves. “Inferred mineral resources” have a great amount of uncertainty as to their existence, and great uncertainty as to their economic and legal feasibility. It cannot be assumed that all or any part of an inferred mineral resource will ever be upgraded to a higher category. Under Canadian rules, estimates of inferred mineral resources may not form the basis of feasibility or pre-feasibility studies, except in rare cases.
Investors are cautioned not to assume that all or any part of an inferred mineral resource exists or is economically or legally mineable. Disclosure of “contained ounces” in a resource is permitted disclosure under Canadian regulations; however, the SEC normally only permits issuers to report mineralization that does not constitute “reserves” by SEC Industry Guide 7 standards as in place tonnage and grade without reference to unit measures.
Accordingly, information contained in this Quarterly Report on Form 10-Q and the documents incorporated by reference herein contain descriptions of our mineral deposits that may not be comparable to similar information made public by U.S. companies subject to the reporting and disclosure requirements under the United States federal securities laws and the rules and regulations thereunder.
Historical results of operations and trends that may be inferred from the following discussion and analysis may not necessarily indicate future results from operations. In particular, the current state of the global securities markets may cause significant fluctuations in the price of the Company’s securities and render it difficult or impossible for the Company to raise funds which may be necessary to develop any of its present or future mineral properties.
Disclosure on Passive Foreign Investment Company
U.S. shareholders of our common shares should be aware that the Company believes it was classified as a PFIC during the taxable year ended December 31, 2013, and based on current business plans and financial projections, management believes there is a significant likelihood that the Company will be a PFIC during the current taxable year. If the Company is a PFIC for any year during a U.S. shareholder’s holding period, then such U.S. shareholder generally will be required to treat any gain realized upon a disposition of common shares, or any so-called “excess distribution” received on their common shares, as ordinary income, and to pay an interest charge on a portion of such gain or distributions, unless the shareholder makes a timely and effective “qualified electing fund” (“QEF Election”) or a “mark-to-market” election with respect to the common shares. A U.S. shareholder who makes a QEF Election generally must report on a current basis its share of the net capital gain and ordinary earnings for any year in which the Company is a PFIC, whether or not the Company distributes any amounts to its shareholders. However, U.S. shareholders should be aware that there can be no assurance that the Company will satisfy record keeping requirements that apply to a QEF Election, or that the Company will supply U.S. shareholders with information that such U.S. shareholders require to report under the QEF Election rules, in event that the Company is a PFIC and a U.S. shareholder wishes to make a QEF Election.
Thus, U.S. shareholders may not be able to make a QEF Election with respect to their common shares. A U.S. shareholder who makes the mark-to-market election generally must include as ordinary income each year the excess of the fair market value of the common shares over the taxpayer’s basis therein. Each U.S. shareholder should consult his or her own tax advisor regarding the U.S. federal, U.S. state and local, and foreign tax consequences of the PFIC rules and the acquisition, ownership, and disposition of Common Shares.
Overview
Company Overview
We are a development stage company engaged in the acquisition, exploration, and, development of gold and silver mineral properties in North America. Our mineral properties are currently located in Nevada and Washington. The Tonopah, Gold Rock and Golden Eagle gold properties are exploratory stage projects and have identified gold mineralization. The Spring Valley property has become subject to a joint venture agreement with Barrick Gold Exploration Inc. Our Pan Project is in the development stage and currently under construction, which is expected to allow us to transition from a development stage company to a gold production company, with targeted revenue in late 2014 or early 2015.
27
Recent Developments
Appointment of President and CEO
On August 5, 2014, Mr. Kenneth Brunk informed our Board of Directors (the “Board”) that he would be retiring as the Chairman of the Board and Chief Executive Officer. On October 14, 2014, the Company announced that William M. Zisch will be joining the Company as President and Chief Executive Officer. Mr. Zisch will succeed Kenneth Brunk and the effective date of Mr. Zisch’s appointment is expected to be no later than December 10, 2014, which represents Mr. Zisch’s first day of employment (the “Start Date”). Mr. Brunk will remain the Company’s President and Chief Executive Officer until the Start Date to insure a smooth transition.
Preferred Series A Dividend Declared and Paid
On September 19, 2014, the Board declared a dividend payment to the holders of Series A Preferred Shares with a record date of September 26, 2014, totaling $1,591,536 (U.S. $1,421,014), which was paid on October 1, 2014 in common shares, through the issuance of 1,157,154 common shares to the holders of the Series A Preferred Shares, and in cash, through the payment of applicable withholding taxes.
Mining Begins at Pan Gold Project
On September 15, 2014, we announced several construction and operational related milestones that have been achieved. Ledcor CMI, Inc. (“Ledcor”), our contract miner, mobilized to site on July 21, 2014 and has begun stacking ore on the leach pad.
Non-Executive Chairman Appointed
On August 19, 2014, we announced that the Board appointed Mr. Timothy Haddon as our new non-executive chairman on August 18, 2014, replacing Mr. Kenneth Brunk as the Board’s chairman. Mr. Haddon replaced Dr. Roger Newell on the Board, who retired after five years of service on our Board. Dr. Newell’s retirement was not the result of any disagreement with the Company.
Significant Upgrade in Resource at Spring Valley Project; Election of Carry Option
On August 12, 2014, we announced a substantial resource growth at our Spring Valley project based upon an updated mineral resource estimate to include 2011 – 2013 drill results. Independent consulting engineers determined that the drill results have led to a 102% increase to 4.37 million ounces in Measured & Indicated (“M&I”) resources, as well as a 20% increase in the M&I grade. In addition, we announced our decision to elect to become a 25% joint venture partner with Barrick, carrying us through to production free of any additional payments or capital outlays.
The technical report entitled “NI 43-101 Technical Report on Resource, Spring Valley Project,” was announced and filed on September 9, 2014.
Commonwealth Bank of Australia Debt Facilities
On July 18, 2014, our subsidiary MDW Pan LLP, as borrower entered into a credit agreement (the “Credit Agreement”) with Commonwealth Bank of Australia (“CBA”), as administrative agent, collateral agent and the initial lender for the purpose of establishing an aggregate U.S.$55 million senior secured credit facility consisting of, (i) a U.S.$45 million project finance facility (“Project Finance Facility”) and (ii) a U.S.$10 million cost overrun facility (the “Overrun Facility” together with the Project Finance Facility is collectively referred to herein as, the “Loan Facility”). The Loan Facility will be secured by substantially all of the assets of the borrower (MDW Pan LLP, a wholly-owned subsidiary of the Company, and the owner of the Pan Project and related assets) and all other entities of the consolidated group.
Our ability to draw on the Loan Facility and make future distributions are subject to conditions precedent as set forth in the Credit Agreement. In addition, we are required to maintain certain project and reserve accounts, which may affect our cash flow. There can be no assurances that the conditions precedent to draw on the Loan Facility will be met or that the reserve and distribution terms will not adversely affect our cash flows or results of operations.
28
Property Highlights for the Third Quarter of 2014:
|
· |
Pan Project – Ledcor, our contract miner, has begun production activities through stacking ore on the leach pad. Significant progress has been made on other construction milestones including the completion of the leach pad, completion of the pregnant solution pond, completion of haul roads to the leach pads and waste piles. |
|
§ |
The leach pad is complete and Ledcor has begun stacking ore onto the pad. |
|
§ |
Pregnant solution pond is complete and undergoing final integrity tests. |
|
§ |
Haul roads to leach pad and waste piles are complete. |
|
§ |
Installation of liner in the barren pond is completed. |
|
§ |
ADR plant concrete is complete, the plant and electrical equipment will be installed in October. |
|
§ |
ADR and refinery completion is forecast for mid-December. |
|
§ |
The two water wells for commercial production water are in and operating. |
|
§ |
Temporary fire protection systems are in place. |
|
§ |
Intra-plant roads are in place and operational. |
|
§ |
All equipment is either on site or awaiting release for shipment to site for installation. |
|
§ |
Access ramps are completed and ore faces are now open for mining and placement of mined ore to leach pad. |
|
§ |
The 69kv power line should be online and operational by the end of January or early February 2015. We are prepared for the use of temporary generator power prior to completion of the power line. |
|
§ |
Contracts for major consumables are in place and receipt of goods under the contracts has commenced |
|
§ |
Detailed start-up planning is well underway and operating training is on-going for key positions. |
|
· |
Spring Valley project – On February 24, 2014 we announced that formation of the joint venture at the Spring Valley project with Barrick was completed. Barrick holds a 70% interest in the joint venture, while we hold the remaining 30% interest. We have elected the carry option, which allows Barrick to earn an additional 5% (75% total) interest in the joint venture by carrying us through to production, at which point we would retain a 25% interest in the joint venture. |
On August 12, 2014, we announced a substantial resource increase at our Spring Valley project based upon an updated mineral resource estimate to include 2011 – 2013 drill results. Independent consulting engineers, Gustavson Associates, determined that the drill results have led to a 102% increase to 4.37 million ounces in Measured & Indicated (“M&I”) resources, as well as a 20% increase in the M&I grade.
Activities on our properties in the third quarter ended September 30, 2014, and up to the date of this Quarterly Report on Form 10-Q, are described in further detail below.
29
The map below shows the location of our properties located in Nevada, USA.
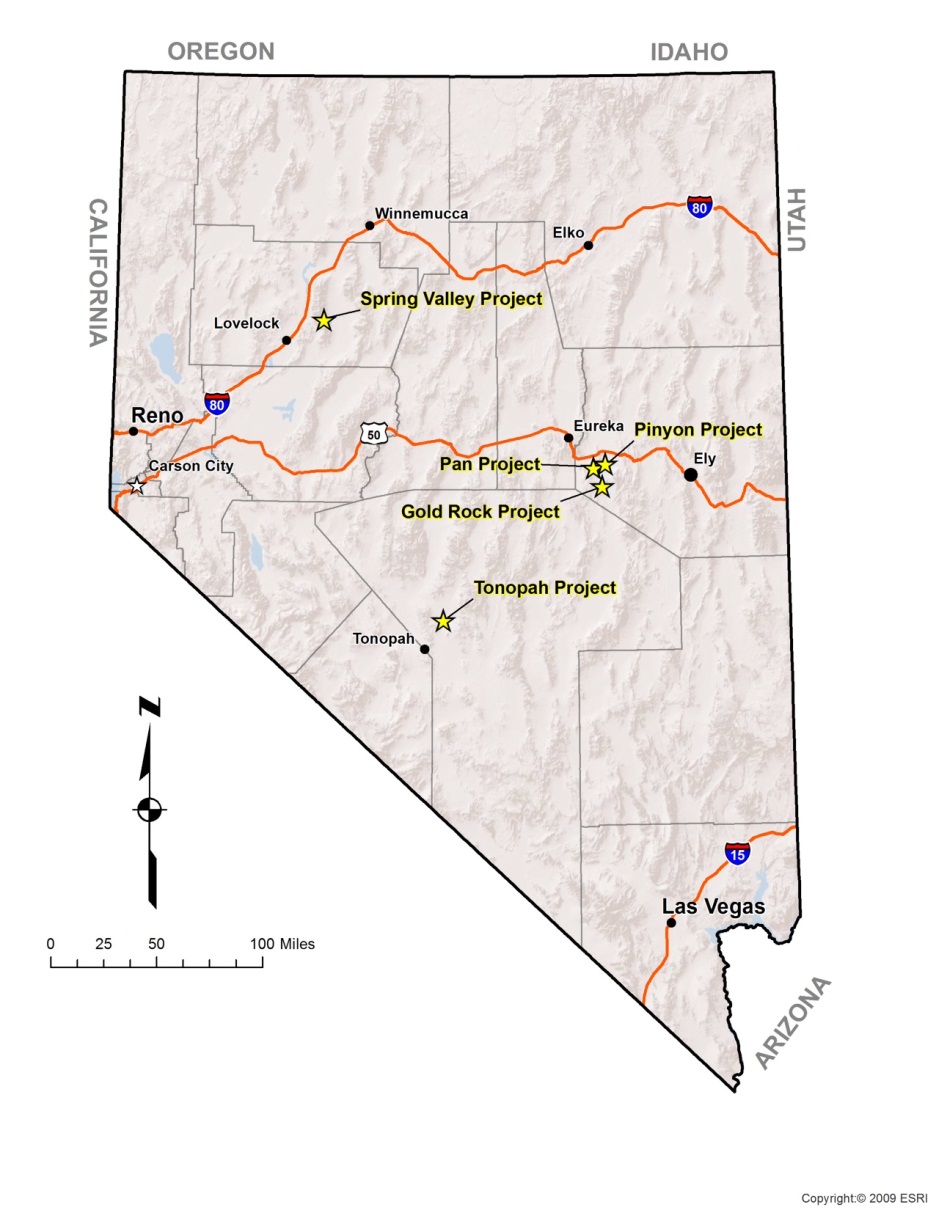
30
Pan Project, White Pine County, Nevada
The Pan property is located at the northern end of the Pancake mountain range in western White Pine County, Nevada, approximately 22 miles southeast of Eureka, Nevada, and 50 miles west of Ely, Nevada. Access is via a dirt road running south from US Highway 50. Eureka has a population of about 2,000. Water is readily available from wells on the property. Construction has begun on a power transmission line to extend power to the Pan Mine site.
Permitting
The National Environmental Policy Act (“NEPA”) permitting process was completed with a Record of Decision for the Final Environmental Impact Statement issued on December 20, 2013. We also received confirmation from the U.S. Army Corps of Engineers that no surface waters are present at the project that would fall under the jurisdiction of Sections 401 and 404 of the Federal Clean Water Act. We have received our Water Pollution Control Permit and our Air Quality Operating Permit to Construct the Pan mine. Construction began in January 2014. Jacobs Engineering is the engineering, procurement and construction management contractor for the project.
Mineral Reserves and Resources
Cautionary Note to U.S. Investors – In this Quarterly Report on Form 10-Q we use the terms “mineral resource”, “measured mineral resource”, “indicated mineral resource” and “inferred mineral resource”, which are geological and mining terms as defined in accordance with NI 43-101 under the guidelines adopted by CIM, as CIM Standards in Mineral Resources and Reserve Definition and Guidelines. U.S. investors in particular are advised to read carefully the definitions of these terms as well as the “Cautionary Note to U.S. Investors Regarding Reserve and Resource Estimates” above.
A resource estimate for the Pan Project was reported in October 2011 based on results from 2011 drilling. The Measured and indicated resource estimate exceeds one million ounces of gold as summarized in Table 1. The updated resource was prepared by Gustavson Associates, LLC (“Gustavson”).
Table 1: Mineral Resource Estimate, Pan Project, Nevada
|
Measured Resource |
||||||
|
Cutoff (gpt) |
Tonnes |
Grade (gpt) |
Gold ounces |
|||
|
0.27 |
27,352,000 |
0.59 |
520,000 |
|||
|
0.21 |
30,857,000 |
0.55 |
547,000 |
|||
|
0.14 |
36,920,000 |
0.49 |
579,000 |
|||
|
0.07 |
50,924,000 |
0.38 |
622,000 |
|||
|
Indicated Resource |
||||||
|
Cutoff (gpt) |
Tonnes |
Grade (gpt) |
Gold ounces |
|||
|
0.27 |
27,126,000 |
0.52 |
453,000 |
|||
|
0.21 |
32,652,000 |
0.47 |
495,000 |
|||
|
0.14 |
43,118,000 |
0.40 |
551,000 |
|||
|
0.07 |
73,925,000 |
0.27 |
645,000 |
|||
|
Measured Plus Indicated Resource |
||||||
|
Cutoff (gpt) |
Tonnes |
Grade (gpt) |
Gold ounces |
|||
|
0.27 |
54,478,000 |
0.56 |
974,000 |
|||
|
0.21 |
63,509,000 |
0.51 |
1,042,000 |
|||
|
0.14 |
80,037,000 |
0.44 |
1,130,000 |
|||
|
0.07 |
124,849,000 |
0.32 |
1,268,000 |
|||
|
Inferred Resource |
||||||
|
Cutoff (gpt) |
Tonnes |
Grade (gpt) |
Gold ounces |
|||
|
0.27 |
1,771,000 |
0.58 |
33,000 |
|||
|
0.21 |
2,229,000 |
0.51 |
37,000 |
|||
|
0.14 |
3,928,000 |
0.36 |
45,000 |
|||
|
0.07 |
9,693,000 |
0.20 |
63,000 |
|||
Note: The tonnage and total ounces of gold were determined from the statistical block model. Average grades were calculated from the tonnage and total ounces and then rounded to the significant digits shown. Calculations based on this table may differ due to the effect of rounding. See “Cautionary Note to U.S. Investors Regarding Reserve and Resource Estimates.”
31
A Feasibility Study was completed November 15, 2011 showing robust economics for the Pan Project. Mineral reserves were based upon a design pit that maximized revenue based on a $1,200 per ounce three-year trailing average price of gold. Cutoff grades of 0.21 gpt in the South pit and 0.27 gpt in the North & Central pits produced the project’s highest NPV. Reserve estimates are summarized in Table 2.
Table 2: Total Pan Mineral Reserves, November 2011
|
Pit |
Cutoff Grade |
Metric Tonnes |
Gold Grade |
Ounces Gold |
||||
|
Area |
(grams/tonne) |
(x 1000) |
(grams/tonne) |
(x 1000) |
||||
|
Proven |
||||||||
|
North & Central |
0.27 |
13,085 |
0.60 |
251 |
||||
|
South |
0.21 |
12,160 |
0.61 |
236 |
||||
|
All Pits |
25,245 |
0.60 |
487 |
|||||
|
Probable |
||||||||
|
North & Central |
0.27 |
10,994 |
0.50 |
178 |
||||
|
South |
0.21 |
12,073 |
0.51 |
199 |
||||
|
All Pits |
23,067 |
0.51 |
377 |
|||||
|
Proven and Probable |
||||||||
|
North & Central |
0.27 |
24,078 |
0.55 |
429 |
||||
|
South |
0.21 |
24,233 |
0.56 |
435 |
||||
|
All Pits |
48,311 |
0.56 |
864 |
|||||
Note: The tonnage and total ounces of gold were determined from the statistical block model. Average grades were calculated from the tonnage and total ounces and then rounded to the significant digits shown. Calculations based on this table may differ due to the effect of rounding.
The Feasibility Study was prepared to the standards of NI 43-101. The open pit mineral reserves and resources were completed by Gustavson, with Terre Lane and Donald E. Hulse acting as the qualified persons. An updated report “Updated NI 43-101 Technical Report, Feasibility Study for the Pan Project, White Pine County, Nevada” dated November 29, 2012 was filed to clarify responsibilities of the Qualified Persons. This updated report made no changes in the feasibility study numbers.
We believe there is no material difference between the mineral reserves as disclosed in our NI 43-101 Feasibility Study and those disclosable under SEC Industry Guide 7, and therefore no reconciliation is provided. The Pan Project has known reserves under SEC Industry Guide 7 guidelines; therefore, the project is considered to be in the development stage.
Mining and Production
The Pan gold deposit contains near-surface mineralization that can be extracted using open pit mining methods. Results from mineral extraction tests indicate that the ore can be processed by conventional heap leaching methods. Ore from the South Pan pit will be processed ROM, while ore from the North Pan pit will be crushed before being placed on the leach pad. Pregnant solutions will be treated in an adsorption/desorption recovery (ADR) plant.
We have engaged Ledcor to perform contract mining services at our Pan Mine site for an approximate five year term. This is a change from owner mining, which was the elected method as defined within the 2011 Feasibility Study. Current conditions within the industry have led to an attractive price environment for contract mining and further, contract mining allows us to substantially reduce our capital costs and financing requirements. Ledcor will provide all mining related services, manpower and equipment for the project. They will be responsible for drilling, blasting, loading and hauling ore to the leach pad for processing, which began during the three months ended September 30, 2014.
32
During the three months ended September 30, 2014 and 2013 we incurred exploration expenditures of $86,061 and $578,309, respectively, at the Pan Project. The expenditures for both periods were primarily for salaries and labor and field office and supplies costs.
During the nine months ended September 30, 2014 and 2013 we incurred exploration expenditures of $92,352 and $1,432,693, respectively, at the Pan Project. The expenditures were primarily for salaries and labor, travel, transportation and accommodations, assays and analysis and field office and supplies.
We currently have a limited scope of exploration activity at the Pan Project with the majority of costs being capitalized as part of the construction of the project.
During the three and nine months ended September 30, 2014, we capitalized into property, equipment and mine development $19,868,075 and $42,075,163, respectively, of Pan expenditures (excluding asset retirement obligations), primarily for the construction of the Project, but also ongoing costs for permitting, mitigation, engineering, site characterization, mine planning, and detailed design. For the comparable periods during 2013, we capitalized $2,523,412 and $4,455,746, respectively.
Gold Rock Project, White Pine County, Nevada
The Gold Rock property is located in the eastern Pancake Range in western White Pine County, Nevada. The property is eight miles southeast of our Pan Project. Access is via the Green Springs road from US Highway 50 approximately 65 miles from Ely, Nevada. Water for exploration purposes is available from wells in the region under temporary grant of water rights. It is anticipated that power will be available from the line being extended to serve the nearby Pan Project.
Gold Rock is scheduled to be our second operating gold mine. A gold resource has been defined on the project and numerous drill targets with potential for expanding that resource have been identified. Additional drilling is planned, but the Pan Project has priority for available funds in the near term.
An updated resource estimate was completed and filed on May 29, 2014, entitled “NI 41-101 Technical Report Updated Mineral Resource Estimate for Gold Rock Project.” The report, by Global Resource Engineering, shows a 65% increase in measured, indicated resources and a 62% increase in inferred resources.
A mining Plan of Operations submitted to the Bureau of Land Management (“BLM “) has been declared complete, beginning the Environmental Impact Statement (“EIS”) process. Scoping meetings are completed and we are currently evaluating the second Administrative Draft EIS and providing comments to the BLM. The Draft EIS should be published during the fourth quarter of 2014. The Notice of Availability has been sent to the Washington BLM office, and questions have been received by the Ely, NV BLM office for consideration.
During the three months ended September 30, 2014 and 2013 we incurred $607,906 and $629,269 respectively, of exploration expenditures at the Gold Rock project. The majority of these expenses for both periods are related to the ongoing permitting process of the project, represented as “Environmental” costs as well as related salaries and labor costs, in addition, we paid $178,317 of annual claim fees allowing us to maintain the claims we currently hold in the project.
During the nine months ended September 30, 2014 and 2013 we incurred $1,579,000 and $2,294,594, respectively, of exploration expenditures at the Gold Rock project. During the nine months ended September 30, 2014, these costs were primarily related to our permitting efforts, annual claims fees and salary and labor costs. During the nine months ended September 30, 2013, these costs were more widespread in our efforts at the Gold Rock project. We incurred $413,109 of drilling costs, as well as $124,361 of assay and analysis costs associated with those drill samples. Permitting was ongoing, but only represented $581,367 of the costs, compared to $821,211 during the nine months ended September 30, 2014. Annual claims fees and salaries and labor make up the majority of the remaining costs.
Spring Valley Project, Pershing County, Nevada
The Spring Valley property is located in the Spring Valley Mining District, Pershing County, Nevada, approximately 20 miles northeast of the town of Lovelock. The property is accessed via paved and dirt roads east of US Interstate 80. Water for exploration purposes is available from water wells drilled on the property under temporary grant of water rights. Power is accessible from existing power lines; however, capacity is unknown.
33
On February 24, 2014, we announced that formation of the joint venture for the Spring Valley project with Barrick was completed. Under the formation, Barrick holds a 70% interest in the joint venture, while we hold the remaining 30% interest. We have elected to allow Barrick to earn an additional 5% (75% total) by carrying us to production and arranging financing for our share of mine construction expenses. The cost that Barrick incurs from carrying us to commercial production will be recouped by Barrick, plus interest, once production has been established.
During the three months ended September 30, 2014, we incurred $29,021 of exploration expenditures (none in 2013) on the Spring Valley project, respectively. For the three months ended September 30, 2014, majority of the costs related to engineering and consulting, property maintenance and taxes and salaries and labor.
During the nine months ended September 30, 2014 and 2013, we incurred $214,656 and $4,914, respectively, of exploration expenditures on the Spring Valley project. For the nine months ended September 30, 2014, majority of the costs related to engineering and consulting and salaries and labor.
Tonopah Project, Nye County, Nevada
The Tonopah property is located in Nye County, Nevada, approximately 15 miles northeast of the town of Tonopah, 210 miles northwest of Las Vegas and 236 miles southeast of Reno, Nevada. The property is over the northeastern flank of the San Antonio Mountains and in the Ralston Valley. Water for exploration purposes is available from water wells for a fee from municipal sources. Power is accessible from existing power lines crossing the property; however, capacity is unknown and may be limited.
There was no new exploration activity on the property during the three or nine months ended September 30, 2014.
During the three months ended September 30, 2014 and 2013, we incurred $91,963 and $78,942 of expenditures on the Tonopah project, respectively. In both periods, the costs were driven by annual claim fees paid allowing us to maintain the claims we currently hold in the project.
During the nine months ended September 30, 2014 and 2013, we incurred $106,956 and $84,812, respectively, of expenditures on the Tonopah project. Similar to the three months ended September 30, 2014 and 2013, the costs were driven by annual claims fees paid.
Golden Eagle Project, Ferry County, Washington
The Golden Eagle property is located on private land in the Eureka (Republic) mining district in Ferry County, Washington. The property is two miles northwest of the town of Republic, Washington and is accessed by the Knob Hill county road.
There was no new exploration activity on the project during the three or nine months ended September 30, 2014.
During the three months ended September 30, 2014 and 2013, we incurred $638 and $525, respectively on the Golden Eagle project.
During the nine months ended September 30, 2014 and 2013, we incurred $14,284 and $10,618, respectively, of expenditures on the Golden Eagle project. Majority of the costs for both periods related to property maintenance and taxes and salaries and labor.
Pinyon Project, White Pine County, Nevada
Pinyon is a disseminated gold target near the Gold Rock and Pan projects. A portion of the claims were acquired in 2012 as part of an agreement with Aurion Resources allowing us to earn-in to a joint venture over a five year period. The Pinyon property is located in White Pine County, Nevada approximately 20 miles southeast of Eureka, Nevada. It is 10 miles north of the Gold Rock project and 6 miles east of the Pan Project. Access is by five miles of dirt road running south-southeast from US Highway 50, at a point about 17 miles southeast of Eureka, Nevada. Water is available from wells that service the Pan and Gold Rock projects. Power is expected to be available from the Pan or Gold Rock projects.
There was no new exploration activity on the project during the three or nine months ended September 30, 2014.
During the three months ended September 30, 2014 and 2013, we incurred $86,547 and $76,901, respectively, of expenditures on the Pinyon project. Costs in both periods were driven by annual claim fees paid allowing us to maintain the claims we currently hold in the project.
During the nine months ended September 30, 2014 and 2013, we incurred $90,121 and $159,115, respectively, of expenditures on the Pinyon project. Majority of the costs for both periods related to annual claims fees and salaries and labor.
34
Results of Operations
Three months ended September 30, 2014 compared to the three months ended September 30, 2013
The following table summarizes our results of operations for the three months ended September 30, 2014 compared to the three months ended September 30, 2013:
|
Three Months Ended |
|||||||||
|
September 30, |
|||||||||
|
2014 |
2013 |
Change |
|||||||
|
Depreciation and Accretion |
$ |
242,907 |
$ |
140,960 |
$ |
101,947 | |||
|
Write-down of Inventory |
266,054 |
- |
266,054 | ||||||
|
Mineral Exploration Expenditures |
1,202,264 | 1,605,830 | (403,566) | ||||||
|
General & Administrative |
|||||||||
|
Consulting |
183,872 | 68,053 | 115,819 | ||||||
|
Interest and Bank Charges |
1,124 | 825 | 299 | ||||||
|
Investor Relations |
15,875 | 11,003 | 4,872 | ||||||
|
Legal, Audit and Accounting |
249,088 | 396,032 | (146,944) | ||||||
|
Office and Administration |
696,268 | 300,772 | 395,496 | ||||||
|
Salaries and Benefits |
1,574,158 | 1,163,197 | 410,961 | ||||||
|
Transfer Agent and Filing Fees |
45,856 | 208,721 | (162,865) | ||||||
|
Travel |
70,031 | 69,178 | 853 | ||||||
|
Operating Loss |
4,547,497 | 3,964,571 | 582,926 | ||||||
|
Other Income (Expenses) |
(56,558) | (291,878) | 235,320 | ||||||
|
Income Tax Recovery (Expense) |
(477,245) | 272,628 | (749,873) | ||||||
|
Net (Income) Loss |
$ |
5,081,300 |
$ |
3,983,821 |
$ |
1,097,479 | |||
Significant differences between the periods are as follows:
Depreciation and Accretion expense during the three months ended September 30, 2014 was $242,907 compared to $140,960 during the three months ended September 30, 2013, an increase of $101,947, or 72%. This was primarily due to an increase in accretion expense resulting from the increased asset retirement obligation associated with the Pan project and a 54% increase in depreciable assets from the comparable period of 2013. For the three months ended September 30, 2014, accretion expense was $61,388 compared to $637 for the three months ended September 30, 2013.
Write-down of Inventory expense during the three months ended September 30, 2014 was $266,054. We began stacking ore on the leach pad during September 2014, placing 350 recoverable ounces on the leach pad. Using expected gold prices, reduced by further processing, shipping and royalty costs, we recognized the aforementioned inventory write-down.
Mineral Exploration expense for the three months ended September 30, 2014 decreased $403,566 from the comparable period of 2013. Details of the expenses in each period may be found in the schedule of mineral exploration expenses to the unaudited consolidated interim financial statements. Exploration levels are determined by the success of previous exploration programs on each project and cash available to fund additional programs.
As we are currently focused on bringing the Pan Project into production, the cash expenditures for exploration have been reduced in order to preserve capital for completion of the Pan Project. Additionally, effective January 1, 2014, as construction commenced on the Pan Project, administrative Pan related expenses are no longer allocated to exploration and as a result these costs have been recorded in Office and Administration and Salaries and Benefits as appropriate.
Legal, Audit and Accounting expense totaled $249,088 for the three months ended September 30, 2014, compared to $396,032 in the comparable period, a decrease of $146,944. The decrease in the three months ended September 30, 2014 is due to a sizeable decrease in legal fees during the three months ended September 30, 2014 compared to the comparable period of 2013 and fees paid to Fritz Schaudies as our Interim CFO during the three months ended September 30, 2013 that were not paid during the comparable period in 2014.
35
Office and Administration expense for the three months ended September 30, 2014 were $696,268 compared to $300,772 during the comparable period of 2013, an increase of $395,496. As noted above, the majority of this increase is due to the classification of Pan administrative expenses moving from Mineral Exploration expense to Office and Administration expense. Also contributing to the increase are increases in overhead costs including insurance, information systems and rent, in both our Englewood and Ely offices, due to our continued growth.
Salaries and Benefits expense for the three months ended September 30, 2014 and 2013 was $1,574,158 and $1,163,197, respectively. The increase of $410,961 is partially attributable to increased employee levels and associated benefit costs due to our continued growth. As discussed above, also contributing to the increase is the change in the classification of the Pan administrative expenses moving from mineral exploration to Salaries and Benefits.
Transfer Agent and Filing Fees expense decreased for the three months ended September 30, 2014 from $208,721 to $45,856. The decrease was primarily driven by a fee paid to the Toronto Stock Exchange during the three months ended September 30, 2013 when we graduated from being listed on the TSX Venture exchange to the TSX.
Other Income (Expense) for the three months ended September 30, 2014 was expense of $56,558 compared to expense of $291,878 during the comparable period of 2013, a net change of $253,320. As a result of the change in our parent Company’s functional currency from the Canadian dollar to the U.S. dollar effective January 1, 2014, there was no gain or loss recorded on the change in the fair value of derivative liability for the three months ended September 30, 2014. We recorded a gain of $988,443 related to change in the fair value of derivative liability for three months ended September 30, 2013. Additionally, as a result of this change in functional currency to the U.S. dollar, we recorded a foreign exchange loss of $25,462 during the three months ended September 30, 2014 compared to a foreign exchange loss of $1,259,322 for the corresponding period of 2013. Unrealized foreign exchange gains and losses are now primarily recorded within accumulated other comprehensive income on the Consolidated Balance Sheet.
Income Tax Recovery (Expense) for the three months ended September 30, 2014 was an expense of $477,245 compared to a recovery of $272,628 during the comparable period of 2013. The primary reason for the change when comparing the three months ended September 30, 2014 to the three months ended September 30, 2013 is due to an income tax recovery of $582,429 recorded during the September 30, 2013 related to a decrease of the deferred income tax liability that was associated with the acquisition of the Pan and Gold Rock projects. During the three months ended September 30, 2014 and 2013, we recorded income tax expense relating to the Canadian corporate Part VI.1 dividend tax resulting from our Series A Preferred Share dividends of $477,245 and $309,801, respectively.
Nine months ended September 30, 2014 compared to the nine months ended September 30, 2013
The following table summarizes our results of operations for the nine months ended September 30, 2014 compared to the nine months ended September 30, 2013:
|
Nine Months Ended |
|||||||||
|
September 30, |
|||||||||
|
2014 |
2013 |
Change |
|||||||
|
Depreciation and Accretion |
$ |
583,104 |
$ |
382,215 |
$ |
200,889 | |||
|
Write-down of Inventory |
266,054 |
- |
266,054 | ||||||
|
Mineral Exploration Expenditures |
2,525,784 | 4,185,765 | (1,659,981) | ||||||
|
General & Administrative |
|||||||||
|
Consulting |
242,239 | 370,743 | (128,504) | ||||||
|
Interest and Bank Charges |
2,944 | 2,186 | 758 | ||||||
|
Investor Relations |
70,719 | 22,360 | 48,359 | ||||||
|
Legal, Audit and Accounting |
832,890 | 3,094,750 | (2,261,860) | ||||||
|
Office and Administration |
2,094,335 | 931,433 | 1,162,902 | ||||||
|
Salaries and Benefits |
4,665,241 | 3,801,241 | 864,000 | ||||||
|
Transfer Agent and Filing Fees |
177,363 | 342,146 | (164,783) | ||||||
|
Travel |
247,575 | 250,391 | (2,816) | ||||||
|
Operating Loss |
11,708,248 | 13,383,230 | (1,674,982) | ||||||
|
Other Income (Expenses) |
(176,308) | 17,894,990 | (18,071,298) | ||||||
|
Income Tax Recovery (Expense) |
(1,210,112) | 2,179,077 | (3,389,189) | ||||||
|
Net (Income) Loss |
$ |
13,094,668 |
$ |
(6,690,837) |
$ |
19,785,505 | |||
36
Significant differences between the periods are as follows:
Depreciation and Accretion expense during the nine months ended September 30, 2014 was $583,104 compared to $382,215 during the nine months ended September 30, 2013, an increase of $200,889. This was primarily due an increase in accretion expense resulting from the increased asset retirement obligation associated with the Pan project and a 54% increase in depreciable assets from the comparable period of 2013. For the nine months ended September 30, 2014, accretion expense was $106,265 compared to $1,675 for the nine months ended September 30, 2013.
Write–down of Inventory expense during the nine months ended September 30, 2014 was $266,054. We began stacking ore on the leach pad during September 2014, placing 350 recoverable ounces on the leach pad. Using expected gold prices, reduced by further processing, shipping and royalty costs, we recognized the aforementioned inventory write-down.
Mineral Exploration expense for the nine months ended September 30, 2014 decreased $1,659,981, or 40% from the comparable period of 2013. Details of the expenses in each period may be found in the schedule of mineral exploration expenses to the unaudited consolidated interim financial statements. Exploration levels are determined by the success of previous exploration programs on each project and cash available to fund additional programs.
As we are currently focused on bringing the Pan Project into production, the cash expenditures for exploration have been reduced in order to preserve capital for completion of the Pan Project. Additionally, effective January 1, 2014, as construction commenced on the Pan Project, administrative Pan related expenses are no longer allocated to exploration and as a result these costs have been recorded in Office and Administration and Salaries and benefits as appropriate.
Legal, Audit and Accounting expense totaled $832,890 for the nine months ended September 30, 2014, compared to $3,094,750 in the comparable period, a decrease of $2,261,860. The primary reason for the decrease in the nine months ended September 30, 2014 is we incurred significant legal, tax advisory and accounting fees during the nine months ended September 30, 2013 surrounding the non-recurring restructuring of our subsidiaries. Additionally, in comparison to the nine months ended September 30, 2013, we incurred a decreased level of expenses related to the investigation of different financing options to meet capital demands as we bring the Pan Project into production.
Office and Administration expense for the nine months ended September 30, 2014 was $2,094,335 compared to $931,433 during the comparable period of 2013, an increase of $1,162,902. As noted above, the majority of this increase is due to the classification of Pan administrative expenses moving from Mineral Exploration expense to Office and Administration expense. Also contributing to the increase are increases in overhead costs including insurance, information systems and rent, in both our Englewood and Ely offices, due to our continued growth.
Salaries and Benefits expense for the nine months ended September 30, 2014 increased to $4,665,241 from $3,801,241 for the nine months ended September 30, 2013. As noted above, a significant portion of the $864,000 increase is due to the classification of Pan administrative expenses moving from Mineral Exploration expense to Salaries and Benefits expense. Increased employee levels and the related benefit costs also contributed to the increased expenses due to the Company’s continued growth. Additionally, we paid severances to certain former members of upper management as the result of a corporate overhead savings measure to preserve capital for the completion of the Pan Project.
Transfer Agent and Filing Fees expense decreased for the nine months ended September 30, 2014 from $342,146 to $177,363. The decrease was primarily driven by a fee paid to the Toronto Stock Exchange during the three months ended September 30, 2013 when we graduated from being listed on the TSX Venture exchange to the TSX.
Other Income (Expense) for the nine months ended September 30, 2014 was an expense of $176,308 compared to income of $17,894,990 during the comparable period of 2013, a net change of $18,071,298. As a result of the change in our parent Company’s functional currency from the Canadian dollar to the U.S. dollar effective January 1, 2014, there was no gain or loss recorded on the change in the fair value of derivative liability for the nine months ended September 30, 2014. The Company recorded a gain of $15,574,007 related to the change in the fair value of derivative liability for the nine months ended September 30, 2013. Additionally, as a result of this change in functional currency to the U.S. dollar, we recorded a foreign exchange loss of $29,731 during the nine months ended September 30, 2014 compared to a foreign exchange gain of $2,262,994 for the corresponding period of 2013. Unrealized foreign exchange gains and losses are now primarily recorded within accumulated other comprehensive income on the consolidated balance sheet.
37
Income Tax Recovery (Expense) for the nine months ended September 30, 2014 was an expense of $1,210,112 compared to a recovery of $2,179,077 during the comparable period of 2013. The primary reason for the change when comparing the nine months ended September 30, 2014 to the nine months ended September 30, 2013 is due to an income tax recovery of $3,237,223 recorded during the nine month period ended September 30, 2013. The recovery related to a decrease of the deferred income tax liability that was associated with the acquisition of the Pan and Gold Rock projects. During the nine months ended September 30, 2014 and 2013, we recorded expense relating to the Canadian corporate Part VI.1 dividend tax resulting from our Series A Preferred Share dividends of $1,210,112 and $1,061,992, respectively.
Liquidity and Capital Resources
As of September 30, 2014, we had working capital of $14,886,282, consisting of current assets of $25,784,133 and current liabilities of $10,897,851. This represents a decrease of $31,174,439 from the working capital balance of $46,060,721 as of December 31, 2013. Consistent with our plans, our working capital balance fluctuates as we use cash to fund our exploration, development, construction activities and other operating expenses.
We have not generated any revenues from operations. These unaudited consolidated interim financial statements have been prepared on a going concern basis which assumes we will be able to realize our assets and discharge our liabilities in the normal course of business in the foreseeable future. We have incurred operating losses for the nine month periods ended September 30, 2014 and 2013 of $11,708,248 and $13,383,230, respectively, and since our inception on May 14, 1996 to September 30, 2014 our losses have resulted in an accumulated deficit of $97,085,113; further losses are anticipated in the development of our business. Our cash on hand as of September 30, 2014 was $22,978,965. We have also established an aggregate U.S.$55,000,000 senior secured credit facility consisting of a U.S.$45,000,000 project financing facility and a U.S.$10,000,000 cost overrun facility to fund development and construction of the Pan Project.
Recoverability of amounts capitalized for our mineral properties, other than the Pan and Spring Valley Projects, are dependent upon our ability to raise funds or generate profits to enable funds to be available to complete exploration on the mineral properties, identify economically recoverable reserves and develop the mineral properties into profitable projects, or the receipt of adequate proceeds from the sale of such projects.
Recoverability of amounts capitalized for the Pan Project is dependent on our ability to complete development of the project and operate it profitability, or the receipt of adequate proceeds from any sale of the project. The Spring Valley Project is subject to a joint venture agreement with Barrick Gold Corporation, who is responsible for carrying our share of costs incurred to production and arranging financing for our share of the cost of operations and mine exploration, development and construction expenses. The cost that Barrick incurs from carrying us to production will be recouped by Barrick, plus interest, once production has been established.
Our most significant expenditures for the remainder of 2014 are expected to be costs associated with the development of our Pan Project and further exploration and permitting of our other properties. We also continue to incur operating expenses for salaries and benefits (exclusive of non-cash stock-based compensation), professional fees, community relations, investor relations, travel and other overhead expenses at our Colorado executive offices and Ely, Nevada locations.
Net cash used in operating activities was $14,568,759 during the nine months ended September 30, 2014 compared to $9,350,562 during the nine months ended September 30, 2013, an increase of $5,218,197. This increase is largely related to the timing and amount of payments for operating and exploration expenses out of accounts payable and accrued expenses.
Net cash used in investing activities for the nine months ended September 30, 2014 was $41,219,886 compared to $5,485,910 during the comparable period of 2013. Although most of our exploration and development stage expenditures are recorded as an expense rather than an investment, we capitalize the acquisition cost of land and mineral rights and certain equipment that has alternative future uses or significant salvage value, including furniture, and electronics, and the cost of these capitalized assets is reflected in our investing activities. We are also capitalizing Pan construction, permitting, engineering and other development activities. Cash used in investing activities during the nine months ended September 30, 2014 consisted primarily of construction costs on the Pan Project and property and equipment additions of $39,703,879 and $715,403 for the acquisition of mineral properties. An additional $2,438,754 was spent towards a reclamation deposit on the surety bond purchased for the reclamation and remediation obligations of our Pan Project. Further, during the three months ended September 30, 2014, the Pan mine site suffered flood damage from severe thunderstorms. As of September 30, 2014, the work to repair the damaged areas has been completed. We have received $1,638,150 (U.S.$1,500,000) of insurance proceeds towards these damages with the remaining amount to be received during the three months ended December 31, 2014.
Net cash provided by financing activities of $24,958,968 consisted of cash proceeds from equity offerings of $27,903,562 and cash proceeds of $1,455,001 from the exercise of stock options during the period. These cash proceeds were offset by preferred share dividend withholding tax payments of $699,359 and deferred financing costs paid of $3,700,236.
38
Contractual Obligations
A summary of our contractual obligations as of and subsequent to September 30, 2014 is provided in the following table:
|
Fiscal Year |
|||||||||||||||
|
2014 |
2015 - 2016 |
2017 - 2018 |
Thereafter |
Total |
|||||||||||
|
Pan Construction Commitments (1) |
$ |
9,069,091 |
$ |
- |
$ |
- |
$ |
- |
$ |
9,069,091 | |||||
|
Contract Mining Commitments (2) |
7,671,366 | 74,161,044 | 18,874,170 |
- |
100,706,580 | ||||||||||
|
Office and Office Equipment Leases (3) |
64,970 | 467,994 | 438,425 | 393,419 | 1,364,808 | ||||||||||
|
Financing Obligations (4) |
- |
70,000 | 5,600 |
- |
75,600 | ||||||||||
|
Consulting Arrangements (5) |
26,208 | 49,691 | 2,688 |
- |
78,587 | ||||||||||
|
Total |
$ |
16,831,635 |
$ |
74,748,729 |
$ |
19,320,883 |
$ |
393,419 |
$ |
111,294,666 | |||||
|
(1) |
We have entered into non-cancellable agreements for capital expenditures relating to the development and construction of the Pan Project payable during 2014. No agreements have been entered into which extend into 2015 or beyond. |
|
(2) |
We signed a Contract Mining Agreement with Ledcor on May 19, 2014 relating to mining activities at the Pan project. On July 21, 2014, we signed the notice to proceed with Ledcor, triggering the start of the 63 month term of the contract. We will be paying Ledcor operational costs in the normal course of business. These costs represent the future minimum payments for the Contract Mining Agreement over the initial 35 months of the agreement, consistent with the break fee term. The future minimum lease payments are determined by rates within the Contract Mining Agreement and estimated tons moved and bank cubic yards for drilling and blasting. |
|
(3) |
We have obligations under operating leases for our corporate offices in Englewood, Colorado until 2020, field offices in Ely, Nevada until 2015 and office equipment until 2018. |
|
(4) |
In connection with the U.S.$55 million Commonwealth Bank of Australia Project Finance Facility, there are certain agency fees payable over the course of the 36 month term. |
|
(5) |
We have consulting agreements which extend to 2018. |
Off-Balance Sheet Arrangements
There are no off balance sheet arrangements.
Inflation
We do not believe that inflation has had a significant impact on our consolidated results of operations or financial condition.
Environmental Compliance
Our current and future exploration and development activities, as well as our future mining and processing operations, are subject to various federal, state and local laws and regulations in the countries in which we conduct our activities. These laws and regulations govern the protection of the environment, prospecting, development, production, taxes, labor standards, occupational health, mine safety, toxic substances and other matters. We expect to be able to comply with those laws and do not believe that compliance will have a material adverse effect on our competitive position. We intend to obtain all licenses and permits required by all applicable regulatory agencies in connection with our mining operations and exploration activities. We intend to maintain standards of environmental compliance consistent with regulatory requirements.
We have an obligation to reclaim our properties after the surface has been disturbed by exploration, development and construction at the site. As of September 30, 2014, we have accrued $9,761 as a current liability included in Accounts Payable and Accrued Liabilities and $3,532,475 as a long-term liability, compared to $9,761 and $51,967 as current and long term liabilities, respectively, at December 31, 2013, related to reclamation and other closure requirements at our properties. The significant increase during the nine months ended September 30, 2014 is due to the commencement of construction at our Pan mine site, where construction on several of the mine site areas has begun or is nearing completion. We have put surety bonding into place in respect of this obligation. We have accrued as a liability the present value of our best estimate of the liabilities as of September 30, 2014; however, it is possible that our obligations may change in the near or long term depending on a number of factors.
39
Critical Accounting Estimates
Critical accounting estimates used in the preparation of the financial statements include our estimate of recoverable value on our property, equipment and mine development, the determination of site reclamation and rehabilitation obligations, the value assigned to stock-based compensation expense as well as the determination of the functional currency of the Company. These estimates involve considerable judgment and are, or could be, affected by significant factors that are out of our control.
Our impairment assessment of mineral properties and equipment is based on market conditions for minerals, underlying mineral resources associated with the assets and future costs that may be required for ultimate realization through mining operations or by sale. We are in an industry that is exposed to a number of risks and uncertainties, including exploration risk, development risk, commodity price risk, operating risk, ownership and political risk, funding and currency risk, as well as environmental risk. Bearing these risks in mind, we have assumed recent world commodity prices will be achievable. We have considered the mineral resource reports by independent engineers on the Pan, Gold Rock, Spring Valley, Tonopah and Golden Eagle projects in considering the recoverability of the carrying costs of the mineral properties. All of these assumptions are potentially subject to change and most are out of our control; however, changes to the assumptions are not determinable. Accordingly, there is always the potential for a material adjustment to the value assigned to mineral properties and equipment.
We have an obligation to reclaim our properties after the surface has been disturbed by exploration, development and construction methods at the site. As a result we have recorded a liability for the fair value of the reclamation costs we expect to incur. We estimate applicable inflation and credit-adjusted risk-free rates as well as expected reclamation time frames. To the extent that the estimated reclamation costs change, such changes will impact future reclamation expense recorded.
The factors affecting stock-based compensation include estimates of when stock options might be exercised, stock price volatility and expected forfeitures. The timing of which options are exercised is out of our control and will depend, among other things, upon a variety of factors including the market value of our shares and financial objectives of the holders of the options. We used historical data to determine volatility in accordance with Black-Scholes modeling; however, the future volatility is inherently uncertain and the model has its limitations. While these estimates can have a material impact on the stock-based compensation expense and hence results of operations, there is no impact on our financial condition.
The functional currency of the Company is a factor in determining the method used to translate the Company’s financial statements and significantly affects the reported results; therefore, the determination of the functional currency is a critical accounting policy. The functional currency is the currency of the primary economic environment in which the entity operates – the currency of the environment in which the entity primarily generates and expends cash. We evaluate the functional currency of our entities when they are established, and evaluate whether the functional currency has changed based on significant changes in economic indicators. Such indicators include cash flow, sales price, sales market, expenses, financing, and intra-entity transactions and arrangements. Based upon such factors, we must use judgment to determine the appropriate functional currency.
Item 3. Quantitative and Qualitative Disclosures about Market Risk.
On October 7, 2014, we entered into commitments to deliver to CBA 80,500 ounces of gold at a flat forward price of U.S.$1,200 per ounce. The delivery commitments cover a 23-month term commencing in May of 2015. Entering into the forward sales arrangements reduces our risk of exposure to volatility in gold prices.
Item 4. Controls and Procedures.
Disclosure Controls and Procedures
At the end of the period covered by this Quarterly Report on Form 10-Q for the quarter ended September 30, 2014, an evaluation was carried out under the supervision of and with the participation of our management, including the Chief Executive Officer (“CEO”) and Chief Financial Officer (“CFO”), of the effectiveness of the design and operation of our disclosure controls and procedures (as defined in Rule 13a-15(e) and Rule 15d-15(e) under the Securities Exchange Act of 1934, as amended (“Exchange Act”)). Based on that evaluation the CEO and the CFO have concluded that as of the end of the period covered by this Quarterly Report on Form 10-Q, our disclosure controls and procedures are effective in ensuring that: (i) information required to be disclosed by us in reports that we file or submit to the SEC under the Exchange Act are recorded, processed, summarized and reported within the time periods specified in applicable rules and forms and (ii) material information required to be disclosed in our reports filed under the Exchange Act is accumulated and communicated to our management, including our CEO and CFO, as appropriate, to allow for accurate and timely decisions regarding required disclosure.
40
Changes in Internal Control over Financial Reporting
During the period covered by this Quarterly Report on Form 10-Q, there were no changes to internal control over financial reporting that materially affected, or are reasonably likely to materially affect, our internal control over financial reporting.
On January 21, 2014, the Confederated Tribes of the Goshute Reservation (the “Goshute” or the “Tribe”) filed an Appeal and Petition for Stay of BLM’s Final Environmental Impact Statement and Record of Decision involving Approval of the Pan Mine Project Plan of Operations and Approval of Issuance of Right-of-Way Grant with the United States Department of Interior Office of Hearings and Appeals, Interior Board of Land Appeals (the “Administrative Proceeding”). Although the BLM provided notice to the Goshute early in the federal review process for the Draft EIS, the Tribe did not participate in the consultation process with BLM (though two other Tribal governments did) but instead filed comments on the Draft EIS. BLM responded to the Goshute comments in the Final EIS and the Tribe did not provide further comments on the Final EIS or the Record of Decision. The Interior Board of Land Appeals was required to grant or deny a petition for stay pending appeal no later than March 7, 2014. A decision for which a stay is not granted becomes effective immediately after the Appeals Board issues a denial or fails to act on the petition within 45 days. Accordingly, the petition was deemed denied on March 7, 2014 and the BLM’s decisions are effective. In response to the Petition, BLM noted that the Goshute “fails to describe with any specificity how the BLM violated” any applicable federal statutes and that the Goshute allegations are “wholly unsupported and insufficient to satisfy” their burden. On February 14, 2014, our motion to intervene was granted. The Goshute filed their Statement of Reasons in support of their appeal on February 21, 2014 and the Company filed its answer to Goshute’s Statement of Reasons on March 20, 2014 setting forth in detail why the Goshute appeal should be summarily dismissed and the BLM’s approvals affirmed. On April 17, 2014, BLM timely filed its Response to Goshute’s Statement of Reasons (“SOR”) explaining why the Goshute failed to meet their burden of establishing any error in BLM’s decision and, therefore, BLM’s decision should be affirmed.
After the Goshute’s Petition for Stay was deemed denied because the IBLA did not issue a stay within 45 days of the filing of the Goshute petition, on August 19, 2014, the IBLA documented its reasons for denying the Goshute’s Petition for Stay through a formal written order agreeing with the assessment of both BLM and Midway that while the Tribe asserted irreparable harm, it disclosed “no instances where BLM failed to identify, assess, and mitigate impacts to the environment.” The IBLA further found, based on preliminary review that the “FEIS thoroughly analyzes the likely environmental impacts” and that the request for stay must fail “given the suite of mitigating strategies identified by BLM and lack of a claim of specific harm by the Tribe.” The IBLA further found that (i) the Tribe failed to show a likelihood of success on the merits having failed to articulate specific error in the ROD or the FEIS; and, (ii) that the ROD and the FEIS are “well documented and reasonable” with nothing to persuade the IBLA that “either is materially in error” furnishing another basis for denying the stay. No further briefing is anticipated prior to the IBLA’s determination of the appeal on the merits.
We are not aware of any material pending or threatened litigation or of any proceedings known to be contemplated by governmental authorities which are, or would be, likely to have a material adverse effect upon us or our operations, taken as a whole. There are no material proceedings pursuant to which any of our directors, officers or affiliates or any owner of record or beneficial owner of more than 5% of our securities or any associate of any such director, officer or security holder is a party adverse to us or has a material interest adverse to us.
We cannot assure you that we will be able to draw down any amounts under the Loan Facility.
Our ability to borrow funds under the Loan Facility will be subject to additional conditions precedent, including, but not limited to, funding of any expected cost overruns on the Pan Project. To the extent that we are not able to satisfy these and other ongoing requirements, we may not be able to draw down any amounts or the full amount under the Loan Facility.
Our development operations at our Pan Project require substantial capital expenditures. The amounts we may be able to draw down under the Loan Facility, if any, may be insufficient to fund all of the planned development operations at our Pan Project.
Our development operations at our Pan Project require substantial capital expenditures. We make and expect to continue to make substantial capital expenditures in our business for the development of our other projects. To the extent we meet all of the conditions precedent to draw down the full amount under the Loan Facility, the amounts available to us under the Loan Facility may by insufficient to fund all of the planned development operations at our Pan Project.
41
Other than described above, there are no material changes from the risk factors previously disclosed in the Company’s Annual Report on Form 10-K for the period ended December 31, 2013, as filed on March 13, 2014 with the SEC.
Item 2. Unregistered Sale of Equity Securities and Use of Proceeds.
Subsequent to the period covered by this Quarterly Report on Form 10-Q, on October 1, 2014, we issued 1,157,154 common shares to holders of our Series A Preferred Shares, in lieu of making a cash dividend payment. The common shares were deemed “restricted securities” as defined in Rule 144(a)(3) of the United States Securities Act of 1933, as amended (the “Act”) and were issued pursuant to exemptions from registration available under Section 4(a)(2) and Section 3(a)(9) of the Act.
Item 3. Defaults Upon Senior Securities.
None.
Item 4. Mine Safety Disclosures.
We consider health, safety and environmental stewardship to be a core value for our Company and we strive for excellent performance. We have a mandatory safety and health program including employee training, risk management, workplace inspection, emergency response, accident investigation and program auditing. We consider this program to be essential at all levels to ensure that employees and the Company conduct themselves in an environment of exemplary health, safety and environmental governance.
The information concerning mine safety violations or other regulatory matters required by Section 1503(a) of the Dodd-Frank Wall Street Reform and Consumer Protection Act and Item 104 of Regulation S-K is included in Exhibit 95 to this Quarterly Report on Form 10-Q.
None.
42
Documents filed as part of this Quarterly Report on Form 10-Q or incorporated by reference:
|
Exhibit Number |
Description |
|
2.1 |
Amended and Restated Arrangement Agreement between Midway Gold Corp. and Pan-Nevada Gold Corporation, dated February 26, 2007, previously filed with the initial registration statement on Form S-1 filed with the Securities and Exchange Commission on August 6, 2007 and incorporated herein by reference. |
|
3.1 |
Notice of Articles, previously filed with the initial registration statement on Form S-1 filed with the Securities and Exchange Commission on August 6, 2007 and incorporated herein by reference. |
|
3.2 |
Articles, previously filed with the initial registration statement on Form S-1 filed with the Securities and Exchange Commission on August 6, 2007 and incorporated herein by reference. |
|
3.3 |
Articles and Notice of Alteration for Series A Rights, previously filed on Form 8-K with the Securities and Exchange Commission on November 26, 2012 and incorporated herein by reference. |
|
31.1* |
Certification of Chief Executive Officer pursuant to Rule 13a-15(f) of the Exchange Act. |
|
31.2* |
Certification of Chief Financial Officer pursuant to Rule 13a-15(f) of the Exchange Act. |
|
32* |
Certification of Chief Executive Officer and Chief Financial Officer pursuant to Rule 13a or 15(d) of the Exchange Act and 18 U.S.C. Section 1350, as adopted pursuant to Section 906 of the Sarbanes-Oxley Act of 2002. |
|
95* |
Information concerning mine safety violations or other regulators matters required by Section 1503(a) of the Dodd-Frank Wall Street Reform and Consumer Protection Act. |
|
101* |
Financial statements from the Quarterly Report on Form 10-Q of Midway Gold Corp. for the three and six months ended September 30, 2014, formatted in XBRL: (i) the Unaudited Consolidated Balance Sheets, (ii) the Unaudited Consolidated Statements of Operations, (iii) the Unaudited Consolidated Statements of Comprehensive (Income) Loss (iv) the Unaudited Consolidated Statements of Cash Flows, (v) the Unaudited Consolidated Statement of Stockholders’ Equity, and (vi) the Notes to the Unaudited Consolidated Interim Financial Statements. |
* filed herewith
43
Pursuant to requirements of the Securities Exchange Act of 1934, the Registrant has duly caused this report to be signed on its behalf by the undersigned thereunto duly authorized.
|
|
MIDWAY GOLD CORP. |
|
November 5, 2014 |
By: /s/ Kenneth A. Brunk Kenneth A. Brunk Chief Executive Officer, President and Director (Principal Executive Officer)
|
|
November 5, 2014 |
By: /s/ Bradley J. Blacketor Bradley J. Blacketor Chief Financial Officer (Principal Financial and Accounting Officer)
|
44