Attached files
| file | filename |
|---|---|
| EX-31.2 - EXHIBIT 31.2 - Midway Gold Corp | v239035_ex31-2.htm |
| EX-31.1 - EXHIBIT 31.1 - Midway Gold Corp | v239035_ex31-1.htm |
| EXCEL - IDEA: XBRL DOCUMENT - Midway Gold Corp | Financial_Report.xls |
| EX-32 - EXHIBIT 32 - Midway Gold Corp | v239035_ex32.htm |
UNITED STATES
SECURITIES AND EXCHANGE COMMISSION
Washington, D.C. 20549
FORM 10-Q
|
x
|
QUARTERLY REPORT PURSUANT TO SECTION 13 OR 15(d) OF THE SECURITIES EXCHANGE ACT OF 1934
|
|
|
For the quarterly period ended September 30, 2011
|
||
|
OR
|
||
|
o
|
TRANSITION REPORT PURSUANT TO SECTION 13 OR 15(d) OF THE SECURITIES EXCHANGE ACT OF 1934
|
|
For the transition period from to
Commission file number: 001-33894
MIDWAY GOLD CORP.
(Exact name of registrant as specified in its charter)
|
British Columbia
|
98-0459178
|
|
|
(State of other jurisdiction of incorporation or organization)
|
(I.R.S. Employer Identification No.)
|
|
|
8310 South Valley Highway – Suite 280
|
||
|
Englewood, Colorado
|
80112
|
|
|
(Address of principal executive offices)
|
(Zip Code)
|
(720) 979-0900
(Registrant’s Telephone Number, including area code)
(Former name, former address and former fiscal year, if changed since last report)
Indicate by check mark whether the registrant (1) has filed all reports required to be filed by Section 13 or 15(d) of the Securities Exchange Act of 1934 during the preceding 12 months (or for such shorter period that the Registrant was required to file such reports), and (2) has been subject to the filing requirements for the past 90 days. x Yes o No
Indicate by check mark whether the registrant has submitted electronically and posted on its corporate Web site, if any, every Interactive Data File required to be submitted and posted pursuant to Rule 405 of Regulation S-T (§232.405 of this chapter) during the preceding 12 months (or for such shorter period that the registrant was required to submit and post such files). xYes o No
Indicate by check mark whether the registrant is a large accelerated filer, an accelerated filer, a non-accelerated filer or a smaller reporting company. See the definitions of “large accelerated filer” and “accelerated filer” and “smaller reporting company” in Rule 12b-2 of the Exchange Act (Check one):
| Large accelerated filer o | Accelerated filer o | Non-accelerated filer o | Smaller Reporting Company x |
Indicate by check mark whether the Registrant is a shell company (as defined in Rule 12b-2 of the Exchange Act) o Yes x No
Number of Shares outstanding at November 3, 2011: 113,185,849
TABLE OF CONTENTS
|
PART I – FINANCIAL INFORMATION
|
1
|
|
|
Item 1.
|
Financial Statements.
|
1
|
|
Item 2.
|
Management’s Discussion and Analysis of Financial Condition and Results of Operations.
|
24
|
|
Item 3.
|
Quantitative and Qualitative Disclosures about Market Risk.
|
37
|
|
Item 4.
|
Controls and Procedures.
|
37
|
|
PART II - OTHER INFORMATION
|
38
|
|
|
Item 1.
|
Legal Proceedings.
|
38
|
|
Item 1A.
|
Risk Factors.
|
38
|
|
Item 2.
|
Unregistered Sale of Equity Securities and Use of Proceeds.
|
38
|
|
Item 3.
|
Defaults Upon Senior Securities.
|
38
|
|
Item 4.
|
Reserved
|
38
|
|
Item 5.
|
Other Matters
|
38
|
|
Item 6.
|
Exhibits.
|
39
|
|
SIGNATURES
|
40
|
|
EXPLANATORY NOTE
All references to “$” in this report mean the Canadian dollar. All references to “US$” refer to the U.S. dollar, and unless otherwise indicated all currency amounts in this report are stated in Canadian dollars.
PART I – FINANCIAL INFORMATION
Item 1. Financial Statements.
MIDWAY GOLD CORP.
(An exploration stage company)
CONSOLIDATED INTERIM BALANCE SHEETS
(Expressed in Canadian dollars)
|
September 30,
2011
|
December 31,
2010
|
|||||||
|
(unaudited)
|
||||||||
|
Assets
|
||||||||
|
Current assets:
|
||||||||
|
Cash and cash equivalents
|
$ | 13,991,808 | $ | 6,062,816 | ||||
|
Amounts receivable (note 7(b))
|
51,133 | 91,710 | ||||||
|
Prepaid expenses and other current assets
|
554,154 | 134,981 | ||||||
| 14,597,095 | 6,289,507 | |||||||
|
Investments (notes 4 and 5)
|
76,578 | 80,687 | ||||||
|
Reclamation deposit (note 8)
|
500,432 | 260,087 | ||||||
|
Property and equipment (note 6)
|
1,473,270 | 197,224 | ||||||
|
Mineral properties (note 7)
|
49,771,581 | 49,571,061 | ||||||
| $ | 66,418,956 | $ | 56,398,566 | |||||
|
Liabilities and stockholders’ equity
|
||||||||
|
Current liabilities:
|
||||||||
|
Accounts payable and accrued liabilities (note 13)
|
$ | 1,401,813 | $ | 711,091 | ||||
|
Warrant liability (notes 4 and 9)
|
- | 1,562,544 | ||||||
|
Future income tax liability
|
5,763,332 | 6,951,570 | ||||||
|
Stockholders’ equity (note 9):
|
||||||||
|
Common stock authorized – unlimited, no par value
|
||||||||
|
Issued – 113,133,017 (2010 – 96,439,496)
|
122,398,630 | 100,062,385 | ||||||
|
Additional paid in capital
|
8,199,584 | 9,192,426 | ||||||
|
Accumulated other comprehensive income
|
19,375 | 13,125 | ||||||
|
Deficit accumulated during exploration stage
|
(71,363,778 | ) | (62,094,575 | ) | ||||
| 59,253,811 | 47,173,361 | |||||||
| $ | 66,418,956 | $ | 56,398,566 | |||||
The accompanying notes are an integral part of these consolidated interim financial statements.
1
MIDWAY GOLD CORP.
(An exploration stage company)
CONSOLIDATED INTERIM STATEMENTS OF OPERATIONS
(Expressed in Canadian dollars) (unaudited)
|
Three months
ended
September 30,
2011 |
Three months
ended
September 30,
2010 |
Nine months
ended
September 30,
2011 |
Nine months
ended
September 30,
2010 |
Cumulative
period from inception
(May 14,1996) to September 30, 2011 |
||||||||||||||||
|
Expenses
|
||||||||||||||||||||
|
Consulting (note 13)
|
$ | 53,731 | $ | 26,277 | $ | 160,880 | $ | 71,277 | $ | 913,745 | ||||||||||
|
Depreciation
|
80,744 | 16,526 | 108,164 | 59,706 | 796,750 | |||||||||||||||
|
Gain on sale of subsidiary
|
- | - | - | - | (2,806,312 | ) | ||||||||||||||
|
Interest and bank charges
|
5,934 | 1,425 | 16,903 | 4,526 | 908,656 | |||||||||||||||
|
Investor relations
|
18,857 | 13,363 | 120,655 | 107,331 | 1,356,662 | |||||||||||||||
|
Legal, audit and accounting
|
279,134 | 50,032 | 459,910 | 155,582 | 3,072,352 | |||||||||||||||
|
Management fees
|
(3,066 | ) | (5,204 | ) | (8,748 | ) | (14,552 | ) | 207,840 | |||||||||||
|
Mineral exploration expenditures (Schedule)
|
2,785,005 | 1,981,694 | 7,319,020 | 2,416,344 | 54,799,958 | |||||||||||||||
|
Mineral property interests
written-off |
- | - | - | 119,980 | 4,391,734 | |||||||||||||||
|
Mineral property interests recovered
|
- | - | - | - | (60,120 | ) | ||||||||||||||
|
Office and administration
|
200,737 | 59,835 | 347,234 | 152,501 | 1,859,741 | |||||||||||||||
|
Salaries and benefits
|
724,721 | 257,980 | 1,972,660 | 1,362,969 | 11,286,724 | |||||||||||||||
|
Transfer agent and filing fees
|
96,855 | 21,017 | 207,347 | 97,056 | 806,659 | |||||||||||||||
|
Travel
|
52,984 | 33,715 | 167,316 | 133,007 | 1,147,051 | |||||||||||||||
|
Operating loss
|
4,295,636 | 2,456,660 | 10,871,341 | 4,665,727 | 78,681,440 | |||||||||||||||
|
Other income (expenses):
|
||||||||||||||||||||
|
Foreign exchange gain (loss)
|
213,369 | 275,928 | 321,450 | 179,480 | 1,307,443 | |||||||||||||||
|
Loss on change in fair value of warrant liability
|
- | - | (592,026 | ) | - | (1,235,700 | ) | |||||||||||||
|
Interest and investment income
|
9,725 | 5,562 | 18,850 | 7,882 | 872,175 | |||||||||||||||
|
Gain (loss) on disposal of property and equipment
|
491,386 | 59 | 491,386 | 59 | 485,483 | |||||||||||||||
|
Gain on sale of investments
(note 4) |
- | - | - | - | 44,077 | |||||||||||||||
|
Investment write down (note 4)
|
- | - | - | - | (130,000 | ) | ||||||||||||||
|
Unrealized gain (loss) on investments (note 5)
|
(11,893 | ) | - | (10,359 | ) | - | (595,142 | ) | ||||||||||||
|
Other income
|
(82,890 | ) | - | (83,163 | ) | 60 | 4,118 | |||||||||||||
| 619,697 | 281,549 | 146,138 | 187,481 | 752,454 | ||||||||||||||||
|
Net loss before income tax
|
3,675,939 | 2,175,111 | 10,725,203 | 4,478,246 | 77,928,986 | |||||||||||||||
|
Income tax recovery
|
422,000 | 648,000 | 1,456,000 | 747,000 | 6,565,208 | |||||||||||||||
|
Net loss
|
$ | 3,253,939 | $ | 1,527,111 | $ | 9,269,203 | $ | 3,731,246 | $ | 71,363,778 | ||||||||||
|
Basic and diluted net loss per share
|
$ | 0.03 | $ | 0.02 | $ | 0.09 | $ | 0.05 | ||||||||||||
|
Weighted average number of shares outstanding
|
111,671,380 | 80,769,442 | 104,858,345 | 82,591,782 | ||||||||||||||||
The accompanying notes are an integral part of these consolidated interim financial statements.
2
MIDWAY GOLD CORP.
(An exploration stage company)
CONSOLIDATED STATEMENT OF COMPREHENSIVE LOSS
(Expressed in Canadian dollars) (unaudited)
|
Three Months
ended
September 30,
2011 |
Three Months
ended
September 30,
2010 |
Nine Months
ended
September 30,
2011 |
Nine Months
ended
September 30,
2010 |
|||||||||||||
|
Net loss for the period before other comprehensive loss
|
$ | 3,253,939 | $ | 1,527,111 | $ | 9,269,203 | $ | 3,731,246 | ||||||||
|
Unrealized (gain) loss on investment (note 5)
|
12,500 | - | (6,250 | ) | - | |||||||||||
|
Comprehensive loss
|
$ | 3,266,439 | $ | 1,527,111 | $ | 9,262,953 | $ | 3,731,246 | ||||||||
The accompanying notes are an integral part of these consolidated interim financial statements.
3
MIDWAY GOLD CORP.
(An exploration stage company)
CONSOLIDATED INTERIM STATEMENTS OF CASH FLOWS
(Expressed in Canadian dollars) (unaudited)
|
Three months
ended
September 30,
2011 |
Three months
ended
September 30,
2010 |
Nine months
ended
September 30,
2011 |
Nine months
ended
September 30,
2010 |
Cumulative
period from
inception
(May 14,1996) to September 30, 2011 |
||||||||||||||||
|
Cash provided by (used in):
|
||||||||||||||||||||
|
Operating activities:
|
||||||||||||||||||||
|
Net loss
|
$ | (3,253,939 | ) | $ | (1,527,111 | ) | $ | (9,269,203 | ) | $ | (3,731,246 | ) | $ | (71,363,778 | ) | |||||
|
Items not involving cash:
|
||||||||||||||||||||
|
Depreciation
|
80,744 | 16,526 | 108,164 | 59,706 | 796,750 | |||||||||||||||
|
Stock-based compensation
|
87,313 | 60,328 | 826,792 | 679,538 | 7,801,524 | |||||||||||||||
|
Unrealized foreign exchange loss (gain)
|
641,745 | (272,890 | ) | 267,762 | (168,280 | ) | (1,061,248 | ) | ||||||||||||
|
Investment write down
|
- | - | - | - | 130,000 | |||||||||||||||
|
Unrealized (gain) loss on investment
|
11,893 | - | 10,359 | - | 595,142 | |||||||||||||||
|
Non-cash interest expense
|
- | - | - | - | 234,765 | |||||||||||||||
|
Loss on change in liability of warrants
|
- | - | 592,026 | - | 1,235,700 | |||||||||||||||
|
Future income tax recovery
|
(422,000 | ) | (648,000 | ) | (1,456,000 | ) | (747,000 | ) | (6,565,208 | ) | ||||||||||
|
Gain on sale of subsidiary
|
- | - | - | - | (2,806,312 | ) | ||||||||||||||
|
Loss (gain) on disposal of property and equipment
|
(491,386 | ) | (59 | ) | (491,386 | ) | (59 | ) | (485,483 | ) | ||||||||||
|
Gain on sale of investments
|
- | - | - | - | (44,077 | ) | ||||||||||||||
|
Mineral property interests written off
|
- | - | - | 119,980 | 4,391,734 | |||||||||||||||
|
Mineral property interest recovery
|
- | - | - | - | (60,120 | ) | ||||||||||||||
|
Change in non-cash working capital items:
|
||||||||||||||||||||
|
Amounts receivable
|
39,211 | (6,980 | ) | 40,577 | 10,803 | (32,846 | ) | |||||||||||||
|
Prepaid expenses
|
(9,049 | ) | (21,346 | ) | (369,639 | ) | (151,623 | ) | (524,662 | ) | ||||||||||
|
Accounts payable and accrued liabilities
|
58,418 | 71,108 | 690,722 | 78,834 | 1,496,818 | |||||||||||||||
| (3,257,050 | ) | (2,328,424 | ) | (9,049,826 | ) | (3,849,347 | ) | (66,261,301 | ) | |||||||||||
|
Investment activities:
|
||||||||||||||||||||
|
Proceeds on sale of subsidiary
|
- | - | - | - | 254,366 | |||||||||||||||
|
Proceeds on disposal of property and equipment
|
- | 3,321 | - | 3,321 | 22,820 | |||||||||||||||
|
Proceeds on disposal of mineral property
|
1,105,543 | - | 1,105,543 | - | 1,339,002 | |||||||||||||||
|
Proceeds on sale of investments
|
- | - | - | - | 321,852 | |||||||||||||||
|
Mineral property acquisitions
|
(345,613 | ) | - | (814,676 | ) | (398,689 | ) | (22,090,900 | ) | |||||||||||
|
Deferred acquisition costs
|
- | - | - | - | (23,316 | ) | ||||||||||||||
|
Purchase of property and equipment
|
(429,971 | ) | (137,470 | ) | (1,384,210 | ) | (163,735 | ) | (3,284,029 | ) | ||||||||||
|
Reclamation deposit
|
(231,997 | ) | 20,839 | (240,345 | ) | 10,044 | (915,815 | ) | ||||||||||||
| 97,962 | (113,310 | ) | (1,333,688 | ) | (549,059 | ) | (24,376,020 | ) | ||||||||||||
|
Financing activities:
|
||||||||||||||||||||
|
Advance from Red Emerald Ltd.
|
- | - | - | - | 12,010,075 | |||||||||||||||
|
Common stock issued, net of issue costs
|
1,891,942 | (66,811 | ) | 18,312,506 | 6,658,813 | 86,294,449 | ||||||||||||||
|
Promissory note
|
- | - | - | - | 2,000,000 | |||||||||||||||
|
Repayment of promissory note
|
- | - | - | - | (2,000,000 | ) | ||||||||||||||
|
Convertible debenture
|
- | - | - | - | 6,324,605 | |||||||||||||||
| 1,891,942 | (66,811 | ) | 18,312,506 | 6,658,813 | 104,629,129 | |||||||||||||||
|
Increase (decrease) in cash and cash equivalents
|
(1,267,146 | ) | (2,508,545 | ) | 7,928,992 | 2,260,407 | 13,991,808 | |||||||||||||
|
Cash and cash equivalents, beginning of period
|
15,258,954 | 6,509,274 | 6,062,816 | 1,740,322 | - | |||||||||||||||
|
Cash and cash equivalents, end of period
|
$ | 13,991,808 | $ | 4,000,729 | $ | 13,991,808 | $ | 4,000,729 | $ | 13,991,808 | ||||||||||
Supplementary information (note 12)
The accompanying notes are an integral part of these consolidated interim financial statements.
4
MIDWAY GOLD CORP.
(An exploration stage company)
CONSOLIDATED STATEMENT OF STOCKHOLDERS’ EQUITY
(Expressed in Canadian dollars) (unaudited)
|
Number of
shares
|
Common
stock
|
Additional
paid-in
capital
|
Accumulated
other
comprehensive
loss
|
Accumulated
deficit
during the
exploration
stage
|
Total
stockholders’
equity
|
|||||||||||||||||||
|
Balance, May 14, 1996 (date of inception)
|
- | $ | - | $ | - | $ | - | $ | - | $ | - | |||||||||||||
|
Shares issued:
|
||||||||||||||||||||||||
|
Private placements
|
700,000 | 168,722 | 168,722 | |||||||||||||||||||||
|
Net loss
|
- | - | - | - | (114,800 | ) | (114,800 | ) | ||||||||||||||||
|
Balance, December 31, 1996
|
700,000 | 168,722 | (114,800 | ) | 53,922 | |||||||||||||||||||
|
Shares issued:
|
||||||||||||||||||||||||
|
Initial public offering
|
2,025,000 | 590,570 | - | - | - | 590,570 | ||||||||||||||||||
|
Principal shares
|
750,000 | 7,500 | - | - | - | 7,500 | ||||||||||||||||||
|
Private placement
|
1,000,000 | 1,932,554 | 321,239 | - | - | 2,253,793 | ||||||||||||||||||
|
Exercise of share purchase warrants
|
1,000,000 | 2,803,205 | - | - | - | 2,803,205 | ||||||||||||||||||
|
Acquisition of mineral property interest
|
1,000,000 | 2,065,500 | - | - | - | 2,065,500 | ||||||||||||||||||
|
Finder’s fee
|
150,000 | 309,825 | - | - | - | 309,825 | ||||||||||||||||||
|
Net loss
|
- | - | - | - | (2,027,672 | ) | (2,027,672 | ) | ||||||||||||||||
|
Balance, December 31, 1997
|
6,625,000 | 7,877,876 | 321,239 | - | (2,142,472 | ) | 6,056,643 | |||||||||||||||||
|
Shares issued:
|
||||||||||||||||||||||||
|
Exercise of share purchase warrants
|
100,000 | 332,124 | (32,124 | ) | - | - | 300,000 | |||||||||||||||||
|
Acquisition of mineral property interest
|
200,000 | 246,000 | - | - | - | 246,000 | ||||||||||||||||||
|
Finder’s fee
|
150,000 | 224,250 | - | - | - | 224,250 | ||||||||||||||||||
|
Net loss
|
- | - | - | - | (1,943,674 | ) | (1,943,674 | ) | ||||||||||||||||
|
Balance, December 31, 1998
|
7,075,000 | 8,680,250 | 289,115 | - | (4,086,146 | ) | 4,883,219 | |||||||||||||||||
|
Consolidation of shares on a two for one basis
|
(3,537,500 | ) | - | - | - | - | - | |||||||||||||||||
|
Net loss
|
- | - | - | - | (2,378,063 | ) | (2,378,063 | ) | ||||||||||||||||
|
Balance, December 31, 1999
|
3,537,500 | 8,680,250 | 289,115 | - | (6,464,209 | ) | 2,505,156 | |||||||||||||||||
|
Net loss
|
- | - | - | - | (4,718,044 | ) | (4,718,044 | ) | ||||||||||||||||
|
Balance, December 31, 2000
|
3,537,500 | 8,680,250 | 289,115 | - | (11,182,253 | ) | (2,212,888 | ) | ||||||||||||||||
|
Net earnings
|
- | - | - | - | 2,427,256 | 2,427,256 | ||||||||||||||||||
|
Balance, December 31, 2001
|
3,537,500 | 8,680,250 | 289,115 | - | (8,754,997 | ) | 214,368 | |||||||||||||||||
|
Shares issued:
|
||||||||||||||||||||||||
|
Private placement
|
4,824,500 | 2,133,786 | 246,839 | - | - | 2,380,625 | ||||||||||||||||||
|
Exercise of share purchase warrants
|
4,028,000 | 1,007,000 | - | - | - | 1,007,000 | ||||||||||||||||||
|
Exercise of stock options
|
32,000 | 12,800 | - | - | - | 12,800 | ||||||||||||||||||
|
Financing shares issued
|
31,250 | 35,000 | - | - | - | 35,000 | ||||||||||||||||||
|
Acquisition of mineral property interest
|
4,500,000 | 3,600,000 | - | - | - | 3,600,000 | ||||||||||||||||||
|
Share issue costs
|
- | (544,260 | ) | - | - | - | (544,260 | ) | ||||||||||||||||
|
Stock-based compensation
|
- | - | 27,000 | - | - | 27,000 | ||||||||||||||||||
|
Net loss
|
- | - | - | - | (1,657,651 | ) | (1,657,651 | ) | ||||||||||||||||
|
Balance, December 31, 2002
|
16,953,250 | 14,924,576 | 562,954 | - | (10,412,648 | ) | 5,074,882 | |||||||||||||||||
|
Shares issued:
|
||||||||||||||||||||||||
|
Private placement
|
700,000 | 638,838 | 201,162 | - | - | 840,000 | ||||||||||||||||||
|
Exercise of share purchase warrants
|
294,500 | 73,625 | - | - | - | 73,625 | ||||||||||||||||||
|
Share issue costs
|
- | (19,932 | ) | - | - | - | (19,932 | ) | ||||||||||||||||
|
Stock-based compensation
|
- | - | 531,000 | - | - | 531,000 | ||||||||||||||||||
|
Net loss
|
- | - | - | - | (1,352,679 | ) | (1,352,679 | ) | ||||||||||||||||
|
Balance, December 31, 2003
|
17,947,750 | 15,617,107 | 1,295,116 | (11,765,327 | ) | 5,146,896 | ||||||||||||||||||
|
Shares issued:
|
||||||||||||||||||||||||
|
Private placement
|
2,234,400 | 2,122,269 | 175,407 | - | - | 2,297,676 | ||||||||||||||||||
|
Exercise of share purchase warrants
|
213,500 | 300,892 | (46,267 | ) | - | - | 254,625 | |||||||||||||||||
|
Exercise of stock options
|
250,000 | 157,000 | (27,000 | ) | - | - | 130,000 | |||||||||||||||||
|
Share issue costs
|
- | (183,512 | ) | - | - | - | (183,512 | ) | ||||||||||||||||
|
Stock-based compensation
|
- | - | 941,478 | - | - | 941,478 | ||||||||||||||||||
|
Net loss
|
- | - | - | - | (2,994,702 | ) | (2,994,702 | ) | ||||||||||||||||
|
Balance, December 31, 2004 carried forward
|
20,645,650 | 18,013,756 | 2,338,734 | - | (14,760,029 | ) | 5,592,461 | |||||||||||||||||
The accompanying notes are an integral part of these consolidated interim financial statements.
5
MIDWAY GOLD CORP.
(An exploration stage company)
CONSOLIDATED STATEMENT OF STOCKHOLDERS’ EQUITY - CONTINUED
(Expressed in Canadian dollars) (unaudited)
|
Number of
shares
|
Common
stock
|
Additional
paid-in
capital
|
Accumulated
other
comprehensive
loss
|
Accumulated
deficit
during the
exploration
stage
|
Total
stockholders’
equity
|
|||||||||||||||||||
|
Balance, December 31, 2004 brought forward
|
20,645,650 | $ | 18,013,756 | $ | 2,338,734 | $ | - | $ | (14,760,029 | ) | $ | 5,592,461 | ||||||||||||
|
Shares issued:
|
||||||||||||||||||||||||
|
Private placement
|
4,075,800 | 3,266,095 | 773,335 | - | - | 4,039,430 | ||||||||||||||||||
|
Exercise of stock options
|
165,500 | 124,364 | (31,964 | ) | - | - | 92,400 | |||||||||||||||||
|
Exercise of share purchase warrants
|
1,743,000 | 1,543,844 | (4,844 | ) | - | - | 1,539,000 | |||||||||||||||||
|
Share issue costs
|
- | - | - | - | - | - | ||||||||||||||||||
|
Stock-based compensation
|
- | (184,660 | ) | 488,075 | - | - | 303,415 | |||||||||||||||||
|
Net loss
|
- | - | - | - | (4,402,715 | ) | (4,402,715 | ) | ||||||||||||||||
|
Balance, December 31, 2005
|
26,629,950 | 22,763,399 | 3,563,336 | - | (19,162,744 | ) | 7,163,991 | |||||||||||||||||
|
Shares issued:
|
||||||||||||||||||||||||
|
Private placements
|
5,725,000 | 10,760,355 | 944,645 | - | - | 11,705,000 | ||||||||||||||||||
|
Exercise of stock options
|
306,000 | 325,530 | (111,330 | ) | - | - | 214,200 | |||||||||||||||||
|
Exercise of share purchase warrants
|
3,227,000 | 4,182,991 | (768,491 | ) | - | - | 3,414,500 | |||||||||||||||||
|
Acquisition of mineral property interest
|
40,000 | 88,000 | - | - | - | 88,000 | ||||||||||||||||||
|
Share issue costs
|
- | (248,512 | ) | - | - | - | (248,512 | ) | ||||||||||||||||
|
Stock-based compensation
|
- | - | 992,400 | - | - | 992,400 | ||||||||||||||||||
|
Net loss
|
- | - | - | - | (7,241,228 | ) | (7,241,228 | ) | ||||||||||||||||
|
Balance, December 31, 2006
|
35,927,950 | 37,871,763 | 4,620,560 | - | (26,403,972 | ) | 16,088,351 | |||||||||||||||||
|
Shares issued:
|
||||||||||||||||||||||||
|
Private placement
|
2,000,000 | 5,400,000 | - | - | - | 5,400,000 | ||||||||||||||||||
|
Pan-Nevada acquisition
|
7,764,109 | 25,000,431 | 2,028,074 | - | - | 27,028,505 | ||||||||||||||||||
|
Exercise of stock options
|
595,000 | 1,485,415 | (694,515 | ) | - | - | 790,900 | |||||||||||||||||
|
Exercise of share purchase warrants
|
3,395,605 | 10,777,930 | (2,081,407 | ) | - | - | 8,696,523 | |||||||||||||||||
|
Share issue costs
|
- | (28,000 | ) | - | - | - | (28,000 | ) | ||||||||||||||||
|
Stock-based compensation
|
- | - | 1,502,912 | - | - | 1,502,912 | ||||||||||||||||||
|
Unrealized loss on investments
|
- | - | - | (120,000 | ) | - | (120,000 | ) | ||||||||||||||||
|
Adjustment of future income tax liability to mineral properties
|
- | - | - | - | (389,955 | ) | (389,955 | ) | ||||||||||||||||
|
Net loss
|
- | - | - | - | (10,666,106 | ) | (10,666,106 | ) | ||||||||||||||||
|
Balance, December 31, 2007
|
49,682,664 | 80,507,539 | 5,375,624 | (120,000 | ) | (37,460,033 | ) | 48,303,130 | ||||||||||||||||
|
Shares issued:
|
||||||||||||||||||||||||
|
Private placement
|
14,521,500 | 6,174,441 | 956,509 | - | - | 7,130,950 | ||||||||||||||||||
|
Acquisition of mineral property interest
|
30,000 | 88,500 | - | - | - | 88,500 | ||||||||||||||||||
|
Exercise of stock options
|
479,000 | 1,186,462 | (453,212 | ) | - | - | 733,250 | |||||||||||||||||
|
Exercise of share purchase warrants
|
108,500 | 364,404 | (209,405 | ) | - | - | 154,999 | |||||||||||||||||
|
Share issue costs
|
- | (139,705 | ) | - | - | - | (139,705 | ) | ||||||||||||||||
|
Stock-based compensation
|
- | - | 501,028 | - | - | 501,028 | ||||||||||||||||||
|
Unrealized loss on investments
|
- | - | - | (502,225 | ) | - | (502,225 | ) | ||||||||||||||||
|
Investment write-down
|
- | - | - | 622,225 | - | 622,225 | ||||||||||||||||||
|
Net loss
|
- | - | - | - | (16,165,394 | ) | (16,165,394 | ) | ||||||||||||||||
|
Balance, December 31, 2008
|
64,821,664 | 88,181,641 | 6,170,544 | - | (53,625,427 | ) | 40,726,758 | |||||||||||||||||
|
Shares issued:
|
||||||||||||||||||||||||
|
Exercise of stock options
|
33,333 | 32,815 | (11,164 | ) | - | - | 21,651 | |||||||||||||||||
|
Exercise of share purchase warrants
|
12,500,000 | 4,456,509 | (956,509 | ) | - | - | 3,500,000 | |||||||||||||||||
|
Stock-based compensation
|
- | - | 1,152,238 | - | - | 1,152,238 | ||||||||||||||||||
|
Unrealized gain on investment
|
- | - | - | 53,850 | - | 53,850 | ||||||||||||||||||
|
Realized gain on sale of investments
|
- | - | - | (53,850 | ) | - | (53,850 | ) | ||||||||||||||||
|
Net loss
|
- | - | - | - | (2,642,176 | ) | (2,642,176 | ) | ||||||||||||||||
|
Balance, December 31, 2009, carried forward
|
77,354,997 | 92,670,965 | 6,355,109 | - | (56,267,603 | ) | 42,758,471 | |||||||||||||||||
The accompanying notes are an integral part of these consolidated interim financial statements.
6
MIDWAY GOLD CORP.
(An exploration stage company)
CONSOLIDATED STATEMENT OF STOCKHOLDERS’ EQUITY - CONTINUED
(Expressed in Canadian dollars) (unaudited)
|
Number of
shares
|
Common
stock
|
Additional
paid-in
capital
|
Accumulated
other
comprehensive
loss
|
Accumulated
deficit
during the
exploration
stage
|
Total
stockholders’
equity
|
|||||||||||||||||||
|
Balance, December 31, 2009, brought forward
|
77,354,997 | $ | 92,670,965 | $ | 6,355,109 | $ | - | $ | (56,267,603 | ) | $ | 42,758,471 | ||||||||||||
|
Shares issued:
|
||||||||||||||||||||||||
|
Private placement
|
1,333,333 | 514,365 | 285,635 | - | - | 800,000 | ||||||||||||||||||
|
Public offerings
|
17,738,666 | 8,294,058 | 1,504,996 | - | - | 9,799,054 | ||||||||||||||||||
|
Share issue costs
|
- | (1,431,027 | ) | 212,109 | - | - | (1,218,918 | ) | ||||||||||||||||
|
Exercise of share purchase warrants
|
12,500 | 14,024 | (4,024 | ) | - | - | 10,000 | |||||||||||||||||
|
Stock-based compensation
|
- | - | 838,601 | - | - | 838,601 | ||||||||||||||||||
|
Unrealized gain on investment
|
- | - | - | 13,125 | - | 13,125 | ||||||||||||||||||
|
Net loss
|
- | - | - | - | (5,826,972 | ) | (5,826,972 | ) | ||||||||||||||||
|
Balance, December 31, 2010
|
96,439,496 | 100,062,385 | 9,192,426 | 13,125 | (62,094,575 | ) | 47,173,361 | |||||||||||||||||
|
Shares issued:
|
||||||||||||||||||||||||
|
Exercise of share purchase warrants
|
8,558,524 | 10,793,238 | (1,564,183 | ) | - | - | 9,229,055 | |||||||||||||||||
|
Exercise of stock options
|
634,997 | 654,248 | (255,451 | ) | - | - | 398,797 | |||||||||||||||||
|
Bought deal offering
|
7,500,000 | 11,742,000 | - | - | - | 11,742,000 | ||||||||||||||||||
|
Share issue costs
|
- | (853,241 | ) | - | - | - | (853,241 | ) | ||||||||||||||||
|
Stock-based compensation
|
- | - | 826,792 | - | - | 826,792 | ||||||||||||||||||
|
Unrealized gain on investment
|
- | - | - | 6,250 | - | 6,250 | ||||||||||||||||||
|
Net loss
|
- | - | - | - | (9,269,203 | ) | (9,269,203 | ) | ||||||||||||||||
|
Balance, September 30, 2011
|
113,133,017 | $ | 122,398,630 | $ | 8,199,584 | $ | 19,375 | $ | (71,363,778 | ) | $ | 59,253,811 | ||||||||||||
The accompanying notes are an integral part of these consolidated interim financial statements.
7
MIDWAY GOLD CORP.
(An exploration stage company)
SCHEDULE OF MINERAL EXPLORATION EXPENDITURES
(Expressed in Canadian dollars) (unaudited)
|
Three months
ended
September 30,
2011 |
Three months
ended
September 30,
2010 |
Nine months
ended
September 30,
2011 |
Nine months
ended
September 30,
2010 |
Cumulative
period from
inception
(May 14,1996) to September 30, 2011 |
||||||||||||||||
|
Exploration costs incurred are
summarized as follows: |
||||||||||||||||||||
|
Midway project
|
||||||||||||||||||||
|
Assays and analysis
|
$ | 118,699 | $ | - | $ | 118,699 | $ | (12,412 | ) | $ | 434,742 | |||||||||
|
Communication
|
- | - | - | - | 9,513 | |||||||||||||||
|
Drilling
|
313,567 | - | 813,362 | 9,800 | 2,867,343 | |||||||||||||||
|
Engineering and consulting
|
82,549 | 3,346 | 238,068 | 45,682 | 4,387,509 | |||||||||||||||
|
Environmental
|
- | 1,663 | 2,440 | 7,226 | 236,138 | |||||||||||||||
|
Field office and supplies
|
13,006 | 1,335 | 25,157 | 9,102 | 261,165 | |||||||||||||||
|
Legal
|
8,085 | 15,465 | 14,516 | 16,844 | 162,603 | |||||||||||||||
|
Property maintenance and taxes
|
33,659 | 30,694 | 37,526 | 31,262 | 481,932 | |||||||||||||||
|
Reclamation costs
|
- | (252 | ) | 1,154 | 1,237 | 32,103 | ||||||||||||||
|
Reproduction and drafting
|
- | - | 2,602 | - | 23,405 | |||||||||||||||
|
Salaries and labor
|
85,617 | 367 | 176,397 | 31,628 | 795,294 | |||||||||||||||
|
Travel, transportation and accommodation
|
25,664 | 1,637 | 63,774 | 11,271 | 467,715 | |||||||||||||||
| 680,846 | 54,255 | 1,493,695 | 151,640 | 10,159,462 | ||||||||||||||||
|
Spring Valley project
|
||||||||||||||||||||
|
Assays and analysis
|
- | - | - | - | 3,329,900 | |||||||||||||||
|
Communication
|
- | - | - | - | 10,307 | |||||||||||||||
|
Drilling
|
- | - | - | - | 10,261,359 | |||||||||||||||
|
Engineering and consulting
|
(8,509 | ) | - | 188,938 | 1,307 | 2,630,217 | ||||||||||||||
|
Environmental
|
- | - | - | - | 300,445 | |||||||||||||||
|
Equipment rental
|
- | - | - | - | 64,651 | |||||||||||||||
|
Field office and supplies
|
228 | 257 | 255 | 442 | 549,246 | |||||||||||||||
|
Legal
|
19,400 | - | 56,148 | 1,181 | 420,928 | |||||||||||||||
|
Operator fee
|
- | - | - | - | 108,339 | |||||||||||||||
|
Property maintenance and taxes
|
- | 10,204 | (144 | ) | 10,204 | 487,921 | ||||||||||||||
|
Reclamation costs
|
- | - | 127 | 135 | 30,873 | |||||||||||||||
|
Reproduction and drafting
|
- | - | 324 | - | 30,048 | |||||||||||||||
|
Salaries and labor
|
2,618 | 4 | 18,201 | 14,624 | 1,259,487 | |||||||||||||||
|
Travel, transportation and accommodation
|
659 | 474 | 2,574 | 2,285 | 854,679 | |||||||||||||||
| 14,396 | 10,939 | 266,423 | 30,178 | 20,338,400 | ||||||||||||||||
|
Pan project
|
||||||||||||||||||||
|
Assays and analysis
|
16,388 | 37,402 | 218,627 | 37,402 | 889,132 | |||||||||||||||
|
Drilling
|
(72,739 | ) | 1,108,160 | 833,689 | 1,143,552 | 3,265,676 | ||||||||||||||
|
Engineering and consulting
|
594,209 | 228,020 | 1,486,774 | 388,893 | 2,590,899 | |||||||||||||||
|
Environmental
|
87,298 | 41,248 | 177,155 | 67,249 | 339,889 | |||||||||||||||
|
Field office and supplies
|
311,423 | 33,477 | 402,856 | 39,977 | 580,176 | |||||||||||||||
|
Legal
|
30,354 | 21,676 | 111,869 | 21,949 | 247,384 | |||||||||||||||
|
Property maintenance and taxes
|
76,913 | 95,619 | 390,677 | 96,233 | 843,474 | |||||||||||||||
|
Reclamation costs
|
(43,356 | ) | - | (15,221 | ) | - | 55,348 | |||||||||||||
|
Reproduction and drafting
|
60,972 | - | 66,290 | - | 72,028 | |||||||||||||||
|
Salaries and labor
|
182,182 | 153,165 | 550,047 | 184,402 | 1,686,510 | |||||||||||||||
|
Travel, transportation and accommodation
|
31,754 | 56,337 | 143,796 | 87,588 | 421,137 | |||||||||||||||
| 1,275,398 | 1,775,104 | 4,366,559 | 2,067,215 | 10,991,653 | ||||||||||||||||
|
Sub-total balance carried forward
|
$ | 1,970,640 | $ | 1,840,298 | $ | 6,126,677 | $ | 2,249,033 | $ | 41,489,515 | ||||||||||
The accompanying notes are an integral part of these consolidated interim financial statements.
8
MIDWAY GOLD CORP.
(An exploration stage company)
SCHEDULE OF MINERAL EXPLORATION EXPENDITURES - CONTINUED
(Expressed in Canadian dollars) (unaudited)
|
Three months
ended
September 30,
2011 |
Three months
ended
September 30,
2010 |
Nine months
ended
September 30,
2011 |
Nine months
ended
September 30,
2010 |
Cumulative
period from
inception
(May 14,1996) to September 30, 2011 |
||||||||||||||||
|
Sub-total balance brought forward
|
$ | 1,970,640 | $ | 1,840,298 | $ | 6,126,677 | $ | 2,249,033 | $ | 41,489,515 | ||||||||||
|
Burnt Canyon project
|
||||||||||||||||||||
|
Assays and analysis
|
- | - | - | - | 21,921 | |||||||||||||||
|
Engineering and consulting
|
3,433 | - | 3,433 | - | 28,169 | |||||||||||||||
|
Environmental
|
- | - | - | - | 462 | |||||||||||||||
|
Field office and supplies
|
36 | - | 101 | 17 | 1,796 | |||||||||||||||
|
Legal
|
- | - | 1,402 | - | 4,230 | |||||||||||||||
|
Property maintenance and taxes
|
13,596 | 13,383 | 13,596 | 13,383 | 63,820 | |||||||||||||||
|
Reproduction and drafting
|
- | - | - | - | 5,036 | |||||||||||||||
|
Salaries and labor
|
2,483 | - | 4,603 | - | 7,526 | |||||||||||||||
|
Travel, transportation and accommodation
|
1,564 | - | 2,426 | - | 6,568 | |||||||||||||||
| 21,112 | 13,383 | 25,561 | 13,400 | 139,528 | ||||||||||||||||
|
Thunder Mountain project
|
||||||||||||||||||||
|
Assays and analysis
|
- | - | - | - | 14,568 | |||||||||||||||
|
Drilling
|
- | - | - | - | 77,956 | |||||||||||||||
|
Engineering and consulting
|
- | - | - | - | 706 | |||||||||||||||
|
Environmental
|
- | - | - | - | 1,717 | |||||||||||||||
|
Field office and supplies
|
23 | - | 23 | - | 1,064 | |||||||||||||||
|
Property maintenance and taxes
|
- | 2,473 | 82 | 2,473 | 18,987 | |||||||||||||||
|
Reclamation costs
|
- | - | 5,365 | - | 4,787 | |||||||||||||||
|
Salaries and labor
|
57 | - | 620 | - | 2,667 | |||||||||||||||
|
Travel, transportation and accommodation
|
- | - | - | - | 55 | |||||||||||||||
|
|
80 | 2,473 | 6,090 | 2,473 | 122,507 | |||||||||||||||
|
Gold Rock project
|
||||||||||||||||||||
|
Assays and analysis
|
47,564 | 25,648 | 47,758 | 26,477 | 107,752 | |||||||||||||||
|
Drilling
|
531,339 | - | 552,719 | - | 659,620 | |||||||||||||||
|
Engineering and consulting
|
16,737 | 20,377 | 68,661 | 22,639 | 232,026 | |||||||||||||||
|
Environmental
|
- | - | 2,440 | 359 | 3,333 | |||||||||||||||
|
Field office and supplies
|
23,246 | 1,527 | 24,580 | 2,886 | 49,333 | |||||||||||||||
|
Legal
|
- | - | 9,157 | - | 21,604 | |||||||||||||||
|
Property maintenance and taxes
|
69,253 | 68,224 | 70,080 | 68,251 | 376,117 | |||||||||||||||
|
Reclamation costs
|
265 | 598 | 15,886 | 866 | 17,490 | |||||||||||||||
|
Reproduction and drafting
|
34,969 | - | 35,077 | - | 35,416 | |||||||||||||||
|
Salaries and labor
|
56,352 | - | 88,501 | 199 | 126,820 | |||||||||||||||
|
Travel, transportation and accommodation
|
9,913 | 6,658 | 11,632 | 11,069 | 44,510 | |||||||||||||||
| 789,638 | 123,032 | 926,491 | 132,746 | 1,674,021 | ||||||||||||||||
|
Golden Eagle project
|
||||||||||||||||||||
|
Assays and analysis
|
- | - | - | - | 21,690 | |||||||||||||||
|
Drilling
|
- | - | - | - | 3,638 | |||||||||||||||
|
Engineering and consulting
|
- | - | 205,417 | 7,426 | 380,982 | |||||||||||||||
|
Field office and supplies
|
39 | 20 | 39 | 59 | 2,224 | |||||||||||||||
|
Legal
|
- | - | 1,950 | - | 21,519 | |||||||||||||||
|
Property maintenance and taxes
|
475 | 436 | 4,743 | 4,850 | 16,370 | |||||||||||||||
|
Salaries and labor
|
551 | - | 7,760 | 319 | 8,141 | |||||||||||||||
|
Travel, transportation and accommodation
|
- | - | 5,343 | - | 20,121 | |||||||||||||||
|
|
1,065 | 456 | 225,252 | 12,654 | 474,685 | |||||||||||||||
|
Sub-total balance carried forward
|
$ | 2,782,535 | $ | 1,979,642 | $ | 7,310,071 | $ | 2,410,306 | $ | 43,900,256 | ||||||||||
The accompanying notes are an integral part of these consolidated interim financial statements.
9
MIDWAY GOLD CORP.
(An exploration stage company)
SCHEDULE OF MINERAL EXPLORATION EXPENDITURES - CONTINUED
(Expressed in Canadian dollars) (unaudited)
|
Three months
ended
September 30,
2011 |
Three months
ended
September 30,
2010 |
Nine months
ended
September 30,
2011 |
Nine months
ended
September 30,
2010 |
Cumulative
period from inception
(May 14,1996) to September 30, 2011
|
||||||||||||||||
|
Sub-total balance brought forward
|
$ | 2,782,535 | $ | 1,979,642 | $ | 7,310,071 | $ | 2,410,306 | $ | 43,900,256 | ||||||||||
|
Abandoned properties
|
||||||||||||||||||||
|
Acquisition costs and option payments
|
- | - | - | - | 40,340 | |||||||||||||||
|
Assays and analysis
|
- | - | - | - | 53,791 | |||||||||||||||
|
Communications
|
- | - | - | - | 119,734 | |||||||||||||||
|
Drilling
|
- | - | - | - | 848,921 | |||||||||||||||
|
Engineering and consulting
|
- | - | - | - | 3,272,236 | |||||||||||||||
|
Equipment rental
|
- | - | - | - | 348,377 | |||||||||||||||
|
Field office and supplies
|
- | - | - | - | 306,551 | |||||||||||||||
|
Foreign exchange gain
|
- | - | - | - | (38,134 | ) | ||||||||||||||
|
Freight
|
- | - | - | - | 234,956 | |||||||||||||||
|
Geological and geophysical
|
- | - | - | - | 63,481 | |||||||||||||||
|
Interest on convertible loans
|
- | - | - | - | 1,288,897 | |||||||||||||||
|
Legal and accounting
|
- | - | - | - | 462,534 | |||||||||||||||
|
Marketing
|
- | - | - | - | 91,917 | |||||||||||||||
|
Mining costs
|
- | - | - | - | 693,985 | |||||||||||||||
|
Processing and laboratory supplies
|
- | - | - | - | 941,335 | |||||||||||||||
|
Property maintenance and taxes
|
- | - | - | - | 447,610 | |||||||||||||||
|
Reclamation costs
|
- | - | 150 | - | 38,860 | |||||||||||||||
|
Recoveries
|
- | - | - | - | (40,000 | ) | ||||||||||||||
|
Reproduction and drafting
|
- | - | - | - | 1,179 | |||||||||||||||
|
Security
|
- | - | - | - | 350,584 | |||||||||||||||
|
Salaries and labor
|
- | - | - | - | 19,203 | |||||||||||||||
|
Travel, transportation and accommodation
|
- | - | - | - | 429,499 | |||||||||||||||
|
Utilities and water
|
- | - | - | - | 59,425 | |||||||||||||||
| - | - | 150 | - | 10,035,281 | ||||||||||||||||
|
Property investigations
|
||||||||||||||||||||
|
Assays and analysis
|
488 | - | 488 | 2,160 | 174,607 | |||||||||||||||
|
Drilling
|
- | - | - | - | 169,129 | |||||||||||||||
|
Engineering and consulting
|
- | 208 | - | 208 | 210,391 | |||||||||||||||
|
Environmental
|
- | - | - | - | 22,761 | |||||||||||||||
|
Field office and supplies
|
59 | 73 | (38 | ) | 602 | 19,994 | ||||||||||||||
|
Legal
|
- | 1,866 | - | 2,715 | 10,952 | |||||||||||||||
|
Property maintenance and taxes
|
- | - | - | - | 123,230 | |||||||||||||||
|
Reclamation costs
|
- | (95 | ) | - | 304 | 2,930 | ||||||||||||||
|
Reproduction and drafting
|
- | - | - | - | 4,942 | |||||||||||||||
|
Salaries and labor
|
1,923 | - | 7,630 | - | 11,304 | |||||||||||||||
|
Travel, transportation and accommodation
|
- | - | 719 | 49 | 114,181 | |||||||||||||||
| 2,470 | 2,052 | 8,799 | 6,038 | 864,421 | ||||||||||||||||
| $ | 2,785,005 | $ | 1,981,694 | $ | 7,319,020 | $ | 2,416,344 | $ | 54,799,958 | |||||||||||
The accompanying notes are an integral part of these consolidated interim financial statements.
10
|
1.
|
Nature and continuance of operations
|
Midway Gold Corp. (the “Company” or “Midway”) was incorporated on May 14, 1996 under the laws of the Province of British Columbia and its principal business activities are the acquisition, exploration and development of mineral properties.
The Company has not generated any revenues from operations. These consolidated financial statements have been prepared on a going concern basis which assumes the Company will be able to realize its assets and discharge its liabilities in the normal course of business in the foreseeable future. The Company has incurred losses for the three and nine months ended September 30, 2011 of $3,253,939 and $9,269,203, respectively, and since inception of May 14, 1996 to September 30, 2011 resulting in an accumulated deficit of $71,363,778; further losses are anticipated in the development of its business. Management believes that the Company’s cash on hand at September 30, 2011 is sufficient to finance exploration activities and operations through at least the next twelve months. Additionally, on April 21, 2011 the Company was issued a final receipt for a Short Form Prospectus by the Alberta, British Columbia and Ontario Securities Commissions and the Securities and Exchange Commission in the United States to offer up to US$60,000,000 of the Company’s common shares. On June 6, 2011 the company closed on US$12,000,000 of the US$60,000,000 in a bought deal public offering (note 9). The Company’s ability to continue on a going concern basis beyond the next twelve months depends on its ability to successfully raise additional financing for the substantial capital expenditures required to achieve planned principal operations. While the Company has been successful in the past in obtaining financing, there is no assurance that it will be able to obtain adequate financing in the future or that such financing will be on terms acceptable to the Company.
These financial statements do not reflect adjustments that would be necessary if the going concern assumption were not appropriate.
|
2.
|
Significant accounting policies and change in accounting policy
|
The interim consolidated financial statements included herein have been prepared by the Company, without audit, in accordance with the rules and regulations of the Securities and Exchange Commission (“SEC”) pursuant to Part 210 of Regulation S-X. Certain information and footnote disclosures normally included in financial statements prepared in accordance with accounting principles generally accepted in the United States of America (“US GAAP”) have been condensed or omitted pursuant to such SEC rules and regulations, although the Company believes that the disclosures included are adequate to make the information presented not misleading.
In management’s opinion, the unaudited consolidated financial statements contained herein reflect all adjustments, consisting solely of normal recurring items, which are necessary for the fair presentation of our financial position, results of operations, and cash flows on a basis consistent with that of our prior audited consolidated financial statements. However, the results of operations for interim periods may not be indicative of results to be expected for the full fiscal year. Therefore, these financial statements should be read in conjunction with the Company’s audited consolidated financial statements including the notes thereto for the year ended December 31, 2010 which may be found under the Company’s profile on SEDAR and EDGAR.
The accounting policies followed by the Company are set out in note 2 to the audited consolidated financial statements for the year ended December 31, 2010 and have been consistently followed in the preparation of these consolidated interim financial statements.
11
On April 16, 2010, the Financial Accounting Standards Board (“FASB”) issued Accounting Standards Update ASU 2010-13 Compensation – Stock Compensation (Topic 718: Effect of Denominating the Exercise Price of a Share-Based Payment Award in the Currency of the Market in which the Underlying Equity Security Trades. This ASU is effective for interim and annual reporting periods for fiscal years beginning on or after December 15, 2010. This ASU added to or amends sections of Accounting Codification Standards (“ACS”) Topic 718. These amendments and additions impact the accounting treatment as follows:
|
a)
|
A share-based payment award with an exercise price denominated in the currency of a market in which a substantial portion of the entity’s equity securities trades shall not be considered to contain a condition that is not a market, performance, or service condition and, therefore shall not be classified as a liability if it otherwise qualifies for equity classification.
|
|
b)
|
If an award is indexed to a factor in addition the entity’s share price. If that factor is not a market, performance, or service condition (e.g., indexed to the market price of a commodity such as gold), the award shall be classified as a liability.
|
Future accounting changes
Accounting Standards Update No. 2011-04: Fair value measurements update 2011-04
In May 2011, the FASB issued an update to the authoritative guidance related to fair value measurements as a result of the FASB and the IASB working together to develop common requirements for measuring fair value and for disclosing information about fair value measurements in accordance with U.S. generally accepted accounting principles (“GAAP”) and International Financial Reporting Standards (“IFRS”). The amendments will add new disclosures, with a particular focus on Level 3 measurements. The objective of these amendments is to improve the comparability of fair value measurements presented and disclosed in financial statements prepared in accordance with U.S. GAAP and IFRS. The amendments in this update are to be applied prospectively. The amendments are effective during interim and annual periods beginning after December 15, 2011. Early application is not permitted. The Company does not expect this guidance to have a material impact on its consolidated financial statements.
Accounting Standards Update No. 2011-05: Presentation of Comprehensive Income 2011-05
In June 2011, the Financial Accounting Standards Board (“FASB”) issued an update related to presentation of Comprehensive Income. ASU 2011-05 requires entities to report components of comprehensive income in either (1) a continuous statement of comprehensive income or (2) two separate but consecutive statements. Under the two-statement approach, the first statement would include components of net income, and the second statement would include components of other comprehensive income. This ASU does not change the items that must be reported in other comprehensive income. These provisions are effective for fiscal years beginning after December 15, 2011 and for interim periods within those fiscal years; however, early adoption is permitted. The provisions of ASU 2011-05, when adopted, are not expected to have a material impact on the Company’s consolidated financial statements.
|
3.
|
Net loss per share
|
Basic net loss per share is computed by dividing the net loss for the period attributable to common stockholders by the weighted average number of shares of common stock outstanding during the period. Diluted net loss per share takes into consideration shares of common stock outstanding (computed under basic loss per share) and potentially dilutive shares of common stock. Diluted net loss per share is not presented separately from basic net loss per share as the conversion of outstanding stock options and warrants into common shares would be anti-dilutive.
|
4.
|
Fair Value Measurements
|
ASC 820 establishes a fair value hierarchy which prioritizes the inputs used in measuring fair value into three broad levels as follows:
Level 1- Quoted prices in active markets for identical assets or liabilities.
Level 2- Inputs other than the quoted prices in active markets that are observable either directly or indirectly.
Level 3- Unobservable inputs based on the Company’s assumptions.
The Company’s Level 1 assets include common shares available for sale with no trading restrictions as determined using a market approach based upon unadjusted quoted prices for identical assets in an active market. Level 1 assets also include warrants that are considered derivatives and are marked to market each reporting period based upon unadjusted quoted prices for identical assets in active markets.
12
The Company’s Level 2 assets include common shares with trading restrictions that will be removed within one year of the financial period reporting date as determined using a market approach and based upon quoted prices for identical assets in an active market adjusted by a discount to market comparable to the discount allowed by the TSX Venture Exchange for private placements.
The Company’s Level 3 assets include warrants with trading restrictions that will be removed within one year of the financial reporting date as determined using the Black-Scholes valuation model and a discount to market comparable to the discount allowed by the TSX Venture Exchange for private placements.
The determination of fair value for financial reporting purposes at September 30, 2011 utilizing the applicable framework is as follows:
|
Financial Instrument
|
Quoted Prices in Active Markets for Identical Assets
|
Significant other observable inputs
|
Significant unobservable
inputs |
Total at September 30, 2011
|
||||||||||||
|
Available-for-sale securities
|
$ | 62,500 | $ | - | $ | - | $ | 62,500 | ||||||||
|
Derivatives
|
- | 14,078 | - | 14,078 | ||||||||||||
|
Total
|
$ | 62,500 | $ | 14,078 | $ | - | $ | 76,578 | ||||||||
Financial instruments measured at fair value as at December 31, 2010 were as follows:
|
Financial Instrument
|
Quoted Prices in Active Markets for Identical Assets
|
Significant other observable inputs
|
Significant unobservable inputs
|
Total at December 31, 2010
|
||||||||||||
|
Available-for-sale securities
|
$ | - | $ | 56,250 | $ | - | $ | 56,250 | ||||||||
|
Derivatives
|
- | - | 24,437 | 24,437 | ||||||||||||
|
Total
|
$ | - | $ | 56,250 | $ | 24,437 | $ | 80,687 | ||||||||
|
Warrant liability
|
$ | - | $ | 1,562,544 | $ | - | $ | 1,562,544 | ||||||||
The table below sets forth a summary of changes to the Company’s level 3 financial assets for the nine months ended September 30, 2011:
|
Available-for-sale securities
|
Derivatives
|
Total Assets
|
||||||||||
|
Balance at beginning of period
|
- | $ | 24,437 | $ | 24,437 | |||||||
|
Change in Fair Market Value
|
- | $ | (10,359 | ) | $ | (10,359 | ) | |||||
|
Reclassification to Level 2
|
- | $ | (14,078 | ) | $ | (14,078 | ) | |||||
|
Balance at end of period
|
- | $ | - | $ | - | |||||||
As consideration of certain area of interest obligations of NV Gold Corporation (“NVX”) that apply to the Roberts Gold project, the Company was issued 250,000 common shares of NVX and 250,000 common share purchase warrants (the “NVX Warrants”) on October 26, 2010. The NVX Warrants entitle the Company to purchase one common share of NVX at an exercise price of $0.40 until October 26, 2012. If the volume weighted average price of the common shares of NVX exceeds $0.60 for twenty consecutive trading days, NVX may notify the Company in writing that the NVX Warrants will expire 15 trading days from receipt of such notice unless exercised by the Company before such date. The common shares and the common shares issued pursuant to the exercise of any NVX Warrants were restricted from trading until February 27, 2011. Accordingly the NVX common shares were categorized as Level 2 in the fair value hierarchy (note 4) and a discount of 25% was applied to the quoted market value on the date of receipt and on December 31, 2010. Subsequent to February 27, 2011, the date trading restrictions were removed, the NVX common shares were reclassified to Level 1 and the 25% discount was not applied to the September 30, 2011 fair value.
13
The NVX Warrants are considered derivatives. At December 31, 2010 they were categorized as Level 3 and were fair valued using the Black-Scholes valuation model and a discount of 25% applied to their fair value on the date of receipt and on December 31, 2010. The following assumptions were used on the date of receipt: expected life of 2 years; volatility of 100%; no dividend yield; and a risk free interest rate of 1.42%. The NVX Warrants will be revalued each reporting period with gains or losses recorded in the Statement of Operations. The following assumptions were used on December 31, 2010: expected life of 1.8 years; volatility of 100%; no dividend yield; and a risk free interest rate of 1.66%. With the trading restriction expiration on February 27, 2011 the Warrants were reclassified from Level 3 to Level 2. The following Black-Scholes valuation assumptions were used on September 30, 2011: expected life of 1.07 years; volatility of 91%; no dividend yield; and a risk free interest rate of 0.91%.
|
September 30, 2011
|
||||||||||||||||
|
Number of shares or warrants
|
Cost
|
Accumulated unrealized gains (losses)
|
Fair Value
|
|||||||||||||
|
Available for sale – common shares
|
250,000 | $ | 43,125 | $ | 19,375 | $ | 62,500 | |||||||||
|
Warrants
|
250,000 | 16,995 | (2,917 | ) | 14,078 | |||||||||||
|
Total investments
|
$ | 60,120 | $ | 16,458 | $ | 76,578 | ||||||||||
During the nine month period ended September 30, 2011, the Company recorded a net unrealized gain on the common shares of NVX of $6,250 in accumulated other comprehensive income and a net unrealized loss on the NVX Warrants of $10,359 in the Statement of Operations for the difference in the fair value at September 30, 2011 as compared to December 31, 2010. During the three month period ended September 30, 2011, the Company recorded an unrealized loss on the common shares of NVX of $12,500 in accumulated other comprehensive income and an unrealized loss on the NVX Warrants of $11,893 in the Statement of Operations for the difference in the fair value at September 30, 2011 as compared to June 30, 2011.
14
|
6.
|
Equipment
|
At September 30, 2011 and December 31, 2010, property and equipment consisted of the following:
|
September 30, 2011
|
December 31, 2010
|
|||||||||||||||||||||||
|
Cost
|
Accumulated depreciation
|
Net book value
|
Cost
|
Accumulated depreciation
|
Net book value
|
|||||||||||||||||||
|
Computer equipment
|
$ | 256,453 | $ | 164,472 | $ | 91,981 | $ | 181,300 | $ | 153,095 | $ | 28,205 | ||||||||||||
|
Computer software
|
180,124 | 101,810 | 78,314 | 107,120 | 89,631 | 17,489 | ||||||||||||||||||
|
Leasehold improvements
|
35,190 | 2,229 | 32,961 | - | - | - | ||||||||||||||||||
|
Office equipment
|
126,587 | 45,623 | 80,964 | 79,049 | 30,859 | 48,190 | ||||||||||||||||||
|
Field equipment
|
88,356 | 48,959 | 39,397 | 68,953 | 44,679 | 24,274 | ||||||||||||||||||
|
Trucks
|
293,946 | 77,007 | 216,939 | 138,853 | 59,787 | 79,066 | ||||||||||||||||||
|
Land
|
536,854 | - | 536,854 | - | - | - | ||||||||||||||||||
|
Buildings
|
395,177 | 1,198 | 393,979 | - | - | - | ||||||||||||||||||
|
Construction in progress
|
1,881 | - | 1,881 | - | - | - | ||||||||||||||||||
| $ | 1,914,568 | $ | 441,298 | $ | 1,473,270 | $ | 575,275 | $ | 378,051 | $ | 197,224 | |||||||||||||
Depreciation expense for the three and nine months ended September 30, 2011 was $80,744 (September 30, 2010 $16,526) and $108,164 (September 30, 2010 $59,706), respectively. The Company evaluates the recoverability of property and equipment when events and circumstances indicate that such assets might be impaired.
15
|
7.
|
Mineral properties
|
Details on the Company’s mineral properties are found in note 7 to the audited consolidated financial statements for the year ended December 31, 2010.
|
December 31, 2010
|
Additions
|
Disposals
|
September 30, 2011
|
|||||||||||||
|
Midway
|
$ | 7,036,314 | $ | 294,240 | $ | - | $ | 7,330,554 | ||||||||
|
Spring Valley
|
5,664,517 | 44,294 | 609,788 | 5,099,023 | ||||||||||||
|
Pan
|
33,807,508 | 215,867 | - | 34,023,375 | ||||||||||||
|
Gold Rock
|
628,324 | 233,645 | - | 861,969 | ||||||||||||
|
Burnt Canyon
|
178,785 | 22,262 | - | 201,047 | ||||||||||||
|
Golden Eagle
|
2,255,613 | - | - | 2,255,613 | ||||||||||||
| $ | 49,571,061 | $ | 810,308 | $ | 609,788 | $ | 49,771,581 | |||||||||
|
|
(a)
|
Midway property, Nye County, Nevada
|
On July 1, 2009, and amended on October 14, 2009, the Company agreed with the Town of Tonopah (“Tonopah”) and Lumos & Associates (“Lumos”) to fund a study to identify the best alternatives which maximize the treatment and dewatering at a possible mine at the Midway Project for municipal use and/or re-injection, to minimize the need for redundant facilities and cover costs to benefit the Company and Tonopah. Tonopah contracted with Lumos to prepare a Preliminary Engineering Report to identify the best alternatives to which the Company agreed to fund up to US$105,120 of which the full amount has been paid or accrued by December 31, 2010 (December 31, 2009, $79,120 (US$74,294)).
|
(b)
|
Spring Valley property, Nevada
|
At September 30, 2011 the Company had an amounts receivable of $8,001 (US$7,634) (December 31, 2010 $62,769 (US$63,110)) for recoverable salaries and expenses, from Barrick Gold Exploration Inc. pursuant to the Spring Valley exploration option and joint venture agreement, which was subsequently paid.
Additionally, in the period ending September 30, 2011, the Company received a check in the amount of US$1,144,929, which the Company subsequently negotiated. The check was accompanied with a letter instructing the Company to apply the funds to the payment of certain specified obligations arising out of the May 5, 2006 agreement between Seymork Investments Limited (“Seymork”) and the Company, resulting in a disposal of $609,788. See Item I: Legal Proceedings in Part II below for more detail.
|
8.
|
Reclamation deposit
|
The Company is required to post bonds with the Bureau of Land Management (“BLM”) for reclamation of planned mineral exploration programs work associated with the Company’s mineral properties located in the United States. For the Company’s mineral properties that are being actively explored under partner funding arrangement agreements, the funding partners are responsible for bonding for the surface disturbance created by the exploration programs funded by each funding partner on those projects.
At September 30, 2011 the Company had posted a total of $500,432 (US$477,421) reclamation deposits compared to $260,087 (US$261,499) at December 31, 2010.
|
9.
|
Share capital
|
|
|
(a)
|
The Company is authorized to issue an unlimited number of common shares.
|
|
|
(b)
|
Share issuances
|
|
(i)
|
During 1996, the Company issued 420,000 common shares at $0.25 per share by way of a non-brokered private placement for proceeds of $98,722 net of issue costs. In addition the Company issued 280,000 flow-through common shares at $0.25 per share by way of a non-brokered private placement for proceeds of $70,000.
|
16
|
(ii)
|
During 1997, the Company completed an initial public offering of 2,000,000 common shares at $0.35 per share for proceeds of $590,570, net of issue costs. In connection with this offering, the Company’s agent received a selling commission of 10% or $0.035 per share and was issued 25,000 shares as a corporate finance fee.
|
|
(iii)
|
During 1997, the Company issued 1,000,000 units at $2.50 per unit by way of a private placement for proceeds of $2,253,793 net of issue costs. Each unit consisted of one common share and one non-transferable share purchase to purchase one additional common share at $3.00 per share until February 14, 1998. The proceeds of the financing of $2,500,000 were allocated $2,178,761 as to the common shares and $321,239 as to the warrants. During 1998 100,000 of the warrants were exercised and 900,000 expired. In connection with this private placement, the Company’s agent received a selling commission of 7.5% of the proceeds of the units sold or $0.1875 per unit and a corporate finance fee of $15,000.
|
|
(iv)
|
During 1997, the Company issued 750,000 common shares as performance shares for proceeds of $7,500 that were held in escrow in accordance with the rules of the regulatory authorities of British Columbia. The shares were released 25% in each of 1998, 1999, 2000 and 2001.
|
|
(v)
|
During 1997, pursuant to an equity participation agreement to acquire an interest in Gemstone Mining Inc. (“Gemstone”), a Utah Corporation that by agreement the creditors of Gemstone were issued 1,000,000 units of the Company on conversion of a debt of $2,065,500 (US$1,500,000). Each unit consisted of one common share and one non-transferable share purchase to purchase one additional common share at US$2.00 per share that was immediately exercised for proceeds of $2,803,205 (US$2,000,000). The first one-third tranche of a conditional finders’ fee was satisfied by the issue of 150,000 common shares in connection with the acquisition of Gemstone.
|
|
(vi)
|
During 1998, the Company issued 100,000 common shares pursuant to the exercise of share purchase warrants for proceeds of $300,000.
|
|
(vii)
|
During 1998, the Company issued 200,000 common shares in connection with the acquisition of Gemstone as well as the second tranche of finder’s fee in connection with that acquisition. The Company’s option to acquire Gemstone expired on January 31, 1998 and the remaining one-third tranche were not issued.
|
|
(viii)
|
During 1999, the Company consolidated its issued share capital on a two old for one new basis and changed its name from Neary Resources Corporation to Red Emerald Resource Corp.
|
|
(ix)
|
During 2002, the Company issued 3,500,000 units at $0.25 per unit for proceeds of $875,000 by way of a short form offering document under the policies of the TSX Venture Exchange. Each unit consists of one common share and one common share purchase warrant that entitled the holder to purchase one additional common share at $0.25 per share until October 19, 2002. The Company also issued 150,000 common shares as a finance fee in connection with this offering, and issued the agent 875,000 share purchase warrants exercisable at $0.25 per share until April 19, 2004. During 2002 the Company issued 1,134,500 special warrants at $1.25 per special warrant for proceeds of $1,418,125. Each Special Warrant automatically converted to a unit comprising one common share and one share purchase warrant that entitled the holder to purchase one additional common share at $1.55 per share until November 6, 2003. The proceeds of the financing of $1,418,125 were allocated on a relative fair value basis as $1,171,286 to common shares and $246,839 as to the warrants. During 2003 all of the warrants expired unexercised. In connection with the offering the Company paid the agent a 10% commission totaling $113,450, issued the agent 40,000 common shares as a finance fee in connection with this offering, and issued the agent 170,175 share purchase warrant exercisable at $1.55 per share until July 5, 2003.
|
17
|
(x)
|
During 2002, the Company issued 4,028,000 common shares pursuant to the exercise of share purchase warrants for proceeds of $1,007,000.
|
|
(xi)
|
During 2002, the Company issued 32,000 common shares pursuant to the exercise of stock options for proceeds of $12,800.
|
|
(xii)
|
During 2002, the Company issued 31,250 common shares as additional consideration to a director who loaned the Company $780,000 bearing interest at 12% per annum. The loan and interest was repaid prior to December 31, 2002.
|
|
(xiii)
|
During 2002, the Company acquired Rex Exploration Corp. (“Rex”) in exchange for 4,500,000 common shares of the Company.
|
|
(xiv)
|
During 2003, the Company issued 700,000 units at $1.20 per unit for proceeds of $840,000 by way of a non-brokered private placement. Each unit consisted of one common share and one share purchase warrant that entitled the holder to purchase one additional common share at $1.50 until May 25, 2004. The proceeds of the financing of $840,000 were allocated $638,838 as to common shares and $201,162 as to the warrants. During 2004 161,000 of the warrants were exercised and 539,000 expired. Share issue expenses were $19,932.
|
|
(xv)
|
During 2003, the Company issued 294,500 common shares pursuant to the exercise of share purchase warrants for proceeds of $73,625.
|
|
(xvi)
|
In January 2004, the Company issued 400,000 units at $2.00 per unit for proceeds of $800,000 by way of a private placement. Each unit consisted of one common share and one non-transferable share purchase warrant that entitled the holder to purchase one additional common share at $2.35 per share for a nine month period. The proceeds of the financing of $800,000 were allocated on a relative fair value basis as $624,593 to common shares and $175,407 as to the warrants. All of the warrants expired unexercised in 2004. The Company issued 40,000 common shares as a finder’s fee for this private placement.
|
|
(xvii)
|
In August 2004, the Company issued 1,020,000 units at $0.75 per unit for proceeds of $765,000 by way of a private placement. Each unit consisted of one common share and one non-transferable share purchase warrant that entitled the holder to purchase one additional common share at $0.80 per share until November 25, 2005. All of the warrants were subsequently exercised. The Company issued 55,650 common shares as a finder’s fee for this private placement.
|
|
(xviii)
|
In December 2004, the Company issued 700,000 units at $0.85 per unit for proceeds of $595,000 by way of a private placement. Each unit consisted of one common share and one non-transferable share purchase warrant that entitled the holder to purchase one additional common share at $1.00 per share until December 20, 2005. All of the warrants were subsequently exercised. The Company issued 18,750 common shares as a finder’s fee for this private placement.
|
|
(xix)
|
In February 2005, the Company issued 2,500,000 units at $0.85 per unit for proceeds of $2,125,000 by way of a private placement. Each unit consisted of one common share and one non-transferable share purchase warrant that entitled the holder to purchase one additional common share at $1.00 per share until February 16, 2006. The proceeds of the financing of $2,125,000 were allocated on a relative fair value basis as $1,598,457 to common shares and $526,543 as to warrants. There were 23,000 warrants exercised in fiscal year 2005 and the balance exercised in fiscal year 2006. The Company issued 75,800 common shares for $64,430 and paid $69,700 in cash as a finder’s fee and incurred $26,709 in additional issue costs for this private placement.
|
|
(xx)
|
In July 2005, the Company issued 1,000,000 units at $1.15 per unit for proceeds of $1,150,000 by way of a private placement. Each unit consisted of one common share and one-half non-transferable share purchase warrant that entitled the holder to purchase one additional common share at $1.15 per share until July 27, 2006. The proceeds of the financing of $1,150,000 were allocated on a relative fair value basis as $995,193 to common shares and $154,807 as to warrants. All of the warrants were exercised in fiscal year 2006. The Company incurred $15,560 in issue costs.
|
18
|
(xxi)
|
In August 2005, the Company issued 500,000 units at $1.40 per unit for proceeds of $700,000 by way of a private placement. Each unit consisted of one common share and one-half non-transferable share purchase warrant that entitled the holder to purchase one additional common share at $1.45 per share until November 22, 2006. The proceeds of the financing of $700,000 were allocated on a relative fair value basis as $608,015 to common shares and $91,985 as to warrants. All of the warrants were exercised in fiscal year 2006. The Company incurred $8,261 in issue costs.
|
|
(xxii)
|
In January 2006, the Company issued 40,000 common shares at a value of $88,000 pursuant to a purchase and sale agreement to purchase mining claims for the Spring Valley project.
|
|
(xxiii)
|
In May 2006, the Company issued 3,725,000 units at $1.80 per unit for proceeds of $6,705,000 by way of a private placement. Each unit consisted of one common share and one-half non-transferable share purchase warrant. Each whole warrant entitled the holder to purchase one additional common share at $2.70 per share until May 16, 2007. The proceeds of the financing of $6,705,000 were allocated on a relative fair value basis as $5,998,846 to common shares and $706,154 as to warrants. The Company incurred $65,216 in issue costs. By May 16, 2007 1,725,000 of the warrants were exercised and 137,500 expired unexercised.
|
|
(xxiv)
|
In November 2006, the Company issued 2,000,000 units at $2.50 per unit for proceeds of $5,000,000 by way of a private placement. Each unit consisted of one common share and one-half nontransferable share purchase warrant. Each whole warrant entitles the holder to purchase one additional common share at $3.00 per share until November 10, 2007. The proceeds of the financing of $2,000,000 were allocated on a relative fair value basis as $1,761,509 to common shares and $238,491 as to warrants. The Company paid $88,750 in finders’ fees and incurred $94,546 in issue costs for this private placement. By November 10, 2007 908,782 of the warrants were exercised and 91,218 expired unexercised.
|
|
(xxv)
|
On April 16, 2007, the Company issued 7,764,109 common shares at a value of $25,000,431, 308,000 stock options at a value of $608,020 and 870,323 share purchase warrants at a value of $1,420,054 in connection with the acquisition of Pan-Nevada Gold Corporation. By December 31, 2007, 154,000 of the stock options had been exercised and 761,823 share purchase warrants had been exercised. By December 31, 2008 the remaining 108,500 share purchase warrants were exercised and 84,000 stock options had been exercised. On October 11, 2008 the final 70,000 stock options expired unexercised.
|
|
(xxvi)
|
On August 24, 2007, the Company issued 2,000,000 common shares at $2.70 per common share for proceeds of $5,400,000 by way of a private placement. The Company incurred $28,000 in share issue costs.
|
|
(xxvii)
|
On March 31, 2008, the Company issued 30,000 common shares at a value of $88,500 pursuant to a lease assignment of mining claims for the Gold Rock project. The Company incurred $1,489 in share issue costs.
|
|
(xxviii)
|
On June 12, 2008, the Company issued 1,421,500 common shares at $2.00 per common share for proceeds of $2,843,000 by way of a private placement. The Company incurred $75,371 in share issue costs.
|
|
(xxix)
|
On August 1, 2008 the Company issued 600,000 common shares at US$2.50 per common share for proceeds of $1,537,950 (US$1,500,000) by way of a private placement with Kinross Gold USA Inc. The Company incurred $39,450 in share issue costs.
|
|
(xxx)
|
On November 12, 2008 the Company issued 12,500,000 units at $0.22 per unit for proceeds of $2,750,000 by way of a private placement. Each unit consisted of one common share and one share purchase warrant. Each warrant entitled the holder to purchase one additional common share at $0.28 per share until May 12, 2009. The proceeds of the financing of $2,750,000 were allocated on a relative fair value basis as $1,793,491 to common shares and $956,509 as to warrants. The Company incurred $23,395 in issue costs for this private placement. In the year ended December 31, 2009 all of the 12,500,000 warrants were exercised for proceeds of $3,500,000.
|
19
|
(xxxi)
|
In addition to the 84,000 stock options reported exercised in paragraph xxv, during 2008, the Company issued a further 395,000 common shares pursuant to the exercise of stock options for proceeds of $613,250.
|
|
(xxxii)
|
During 2009, the Company issued 33,333 common shares pursuant to the exercise of stock options for proceeds of $21,651.
|
|
(xxxiii)
|
On April 9, 2010, the Company issued 1,333,000 units at $0.60 per unit for proceeds of $800,000 by way of a private placement. Each unit consisted of one common share and one share purchase warrant. Each warrant entitles the holder to purchase one additional common share until October 9, 2011 at an exercise price as follows: $0.70 if exercised on or before October 9, 2010; $0.80 if exercised after October 9, 2010 but on or before April 9, 2011; and $0.90 if exercised after April 9, 2011 but on or before October 9, 2011. The proceeds of the financing of $800,000 were allocated on a relative fair value basis as $514,365 to common shares and $285,635 as to warrants. The Company incurred $95,529 in issue costs for this private placement.
|
|
(xxxiv)
|
On June 16, 2010, the Company issued 11,078,666 units at $0.60 per unit for proceeds of $6,647,199 by way of a brokered offering in Canada and a non-brokered offering in the United States. Each unit consisted of one common share and one-half share purchase warrant. Each whole warrant entitles the holder to purchase one additional common share until June 16, 2012 at an exercise price of $0.80. The proceeds of the financing of $6,647,199 were allocated on a relative fair value basis as $5,142,202 to common shares and $1,504,997 as to warrants. The Company issued 658,840 agent’s warrants which entitle the holder to purchase one common share until June 16, 2010 at an exercise price of $0.80. These warrants have been recorded at the estimated fair value at the issue date of $212,109. The fair value of warrants was determined using a risk free interest rate of 1.82%, an expected volatility of 131%, an expected life of 2 years, and zero dividends for a fair value per warrant of $0.32. In addition, the Company paid finders’ fees in the amount of $395,304 and incurred other cash share issue costs of $307,553.
|
|
(xxxv)
|
In September 2010, the Company issued 12,500 common shares pursuant to the exercise of share purchase warrants for proceeds of $10,000.
|
|
(xxxvi)
|
In November 2010, the Company closed a public offering and the Company issued 6,660,000 units at US$0.60 per unit, each unit comprising one common share and one half of one non-transferable common share purchase warrant. Each whole warrant entitles the holder to purchase one common share of the Company at a price of US$0.90 per share until November 12, 2012, subject to acceleration provisions. The proceeds of the financing of $4,070,725 were allocated first to the fair value of the warrants at $918,870 with the residual amount of $3,151,855 to common shares.
|
At December 31, 2010 the fair value of warrants was $1,562,544.
The Company incurred $176,288 in issue costs and paid $244,244 to the agent as commission for this public offering. On February 9, 2011, the Company gave notice to the Warrant holders that it accelerated the expiry date of the warrants to March 14, 2011 and by that date 2,650,000 warrants were exercised and 680,000 warrants expired unexercised.
|
(xxxvii)
|
In the nine month period ended September 30, 2011 the Company issued 8,558,524 common shares pursuant to the exercise of share purchase warrants. Of the 8,558,524 shares issued, 2,650,000 shares were issued pursuant to the exercise of the warrants which had an accelerated expiry date of March 14, 2011 and a fair value at December 31, 2010 of $1,562,544 as mentioned in xxxvi above. Proceeds received on the 8,558,524 common shares issued totalled $7,074,485.
|
20
Additionally, in the nine month period ended September 30, 2011, the Company issued 634,997 common shares pursuant to the exercise of employee stock options. Proceeds received on the options exercised totalled $398,797.
|
(xxxviii)
|
On June 6, 2011, the Company issued 7,500,000 common shares upon the close of a “bought deal” public offering for US$1.60 per share. Gross proceeds on the purchase were $11,742,000 (US$12,000,000). The Company paid the agent $587,100 (US$600,000) as a commission for this public offering.
|
Share issue costs incurred during the nine month period ended September 30, 2011 totalled $853,241, including $587,100 in commissions paid.
|
|
(c)
|
Stock options
|
The Company has an incentive share option plan (the “Plan”) that allows it to grant incentive stock options to its officers, directors, employees and consultants. The Plan was amended on May 12, 2008 to add an appendix called the 2008 Stock Incentive Plan for United States Resident Employees (the “U.S. Plan”) to supplement and be a part of the Plan. The purpose of the U.S. Plan is to enable the Company to grant Incentive Stock Options, as that term is used in Section 422 of the Internal Revenue Code of 1986, as amended from time to time, and any regulations promulgated thereunder to qualifying employees who are citizens or residents of the United States of America. This does not change the aggregate number of options that can be granted pursuant to the Plan.
The purpose of the Plan permits the Company’s directors to grant incentive stock options for the purchase of shares of the Company to persons in consideration for services. Stock options must be non-transferable and the aggregate number of shares that may be reserved for issuance pursuant to stock options may not exceed 10% of the issued shares of the Company at the time of granting and may not exceed 5% to any individual (maximum of 2% to any consultant). The exercise price of stock options is determined by the board of directors of the Company at the time of grant and may not be less than the closing price of the Company’s shares on the trading day immediately preceding the date on which the option is granted and publicly announced, less an applicable discount, and may not otherwise be less than $0.10 per share. Options have a maximum term of ten years and terminate 90 days following the termination of the optionee’s employment, except in the case of death or disability, in which case they terminate one year after the event.
The fair value of each option award is estimated on the date of grant using the Black-Scholes option pricing model. The option pricing model requires the input of subjective assumptions which are based on several different criteria. Expected volatility is based on the historical price volatility of the Company’s common stock. Expected dividend yield is assumed to be nil, as the Company has not paid dividends since inception. Based on historical experience, forfeitures and cancellations are not significant. The expected life is estimated in accordance with SEC Staff Accounting Bulletin No. 107, “Share-Based Payment” for “plain vanilla” options. Risk free interest rates are based on U.S. government obligations with a term approximating the expected life of the option.
The fair value of stock option grants is amortized over the respective vesting period. The Company recorded stock-based compensation expense, net of forfeitures, of $826,792 in the nine months ended September 30, 2011 (September 30, 2010 - $679,538) for options vesting in that period of which $692,258 (September 30, 2010 - $651,923) was included in salaries and benefits in the statement of operations, $96,499 (September 30, 2010 - $27,615) was included in salaries and labor in the schedule of mineral exploration expenditures and $38,036 (September 30, 2010 - $nil) was included in consulting in the statement of operations for non-employee stock-based compensation. The estimated unrecognized compensation cost from unvested options as of September 30, 2011 was approximately $211,930, which is expected to be recognized over the remaining vesting period of 2 years.
The weighted-average grant date fair value of options granted was $0.81 per option during the nine months ended September 30, 2011 and $0.42 for the comparable period in 2010. The weighted average grant date fair value of options vested was $0.66 per option during 2011 and $0.75 per option during 2010.
21
The following table summarizes activity for compensatory stock options during the nine months ended September 30, 2011:
|
Number of Shares
|
Weighted Average Exercise Price
|
Aggregate Intrinsic Value
|
Number of Shares Exercisable
|
||||||||||||||
|
Outstanding, January 1, 2011
|
6,460,000 | $ | 1.05 | $ | 652,367 | 5,341,667 | |||||||||||
|
Granted
|
1,115,000 | 1.10 | - | - | |||||||||||||
|
Exercised
|
(634,997 | ) | 0.63 | - | - | ||||||||||||
|
Cancelled
|
(665,001 | ) | $ | 2.33 | - | - | |||||||||||
|
Outstanding, September 30, 2011
|
6,275,002 | $ | 1.02 | $ | 6,320,650 | 5,630,000 | |||||||||||
The following table summarizes information about outstanding compensatory stock options as of September 30, 2011:
|
Options Outstanding
|
Options Exercisable
|
|||||||||||||||||||||||||
|
Exercise Prices
|
Number of Shares
|
Remaining Contractual Life (in years)
|
Weighted Average Exercise Price
|
Number Exercisable
|
Weighted Average Exercise Price
|
Aggregate Intrinsic Value
|
||||||||||||||||||||
| $0.95 - $2.34 | 1,018,334 | 4.4 | $ | 1.14 | 735,000 | $ | 1.02 | $ | 781,383 | |||||||||||||||||
| $0.58 - $0.71 | 2,336,668 | 3.7 | 0.61 | 1,775,000 | 0.61 | 2,615,667 | ||||||||||||||||||||
| $0.56 - $0.86 | 1,905,000 | 2.6 | 0.72 | 2,105,000 | 0.70 | 2,899,600 | ||||||||||||||||||||
| $2.00 - $3.36 | 1,015,000 | 1.6 | 2.42 | 1,015,000 | 2.42 | 24,000 | ||||||||||||||||||||
| 6,275,002 | $ | 1.02 | 5,630,000 | $ | 1.02 | $ | 6,320,650 | |||||||||||||||||||
|
|
d)
|
Share purchase warrants:
|
Total outstanding warrants at September 30, 2011 were 1,610,482. The exercise price on all warrants outstanding was $0.80 per share. The warrants are exercisable immediately upon issuance and expire two years from the date of issuance.
During the nine months ended September 30, 2011, the Company did not issue any warrants.
A summary of the Company’s stock purchase warrants as of September 30, 2011 is presented below:
|
Number of Warrants
|
Weighted Average Exercise Price
|
Remaining Contractual Life (in years)
|
||||||||||
|
Balance, December 31, 2010
|
10,849,006 | $ | 0.83 | 1.2 | ||||||||
|
Issued
|
- | - | - | |||||||||
|
Exercised
|
(8,558,524 | ) | 0.76 | - | ||||||||
|
Expired
|
(680,000 | ) | 0.90 | - | ||||||||
|
Balance, September 30, 2011
|
1,610,482 | $ | 0.80 | 0.6 | ||||||||
|
10.
|
Contingency
|
On January 27, 2011 the Company was delivered a summons that it is being sued in the state of Nevada by Redcor Drilling, Inc. (“Redcor”) for non-payment of the balance of a drilling invoice that is under dispute by the Company. Redcor is demanding the Company pay US$241,477.24 together with interest at the rate of 4% per annum from September 18, 2010. On March 10, 2011, the Company responded to the summons and intends to continue to protest payment of the amount demanded on the basis of non-performance of services. The Company has recorded the full amount as an accrued liability without accruing interest as the amount of the liability can be estimated and it is likely the Company may be required to pay some portion of the disputed amount.
22
Redcor placed a mechanic’s lien on a portion of the Pan project that the Company leases from Newark Valley Mining Corp. Subsequently, the Company posted a surety bond for the disputed amount, thereby releasing the mechanic’s lien.
|
11.
|
Commitments
|
The Company has obligations under operating leases for its corporate offices in Englewood, Colorado and Ely, Nevada and office equipment until 2014 as follows. Future minimum lease payments for non-cancellable leases with initial lease terms in excess of one year are included.
|
Fiscal Year
|
||||||||||||||||||||
|
2011
|
2012
|
2013
|
2014
|
Total
|
||||||||||||||||
|
Operating Leases
|
$ | 34,912 | 130,683 | 121,719 | 115,997 | $ | 403,311 | |||||||||||||
|
12.
|
Supplemental Cash Flow Information
|
|
Three months ended
September 30, |
Nine months ended
September 30, |
|||||||||||||||
|
2011
|
2010
|
2011
|
2010
|
|||||||||||||
|
Interest paid
|
$ | - | $ | - | $ | - | $ | - | ||||||||
|
Income taxes paid
|
- | - | - | - | ||||||||||||
|
Transfer of fair value of share purchase warrants exercised or expired from warrant liability (note 9) to share capital
|
- | - | $ | 2,154,570 | - | |||||||||||
|
13.
|
Related party transactions
|
For the three and nine month periods ending September 30, 2011, the Company paid consulting fees of $nil and $53,901, respectively (2010 - $22,500 and $45,000, respectively) to a company controlled by the former Chief Financial Officer of the Company for accounting and corporate compliance services. The Company’s former Chief Financial Officer resigned effective March 18, 2011, but, remained as Corporate Secretary until just prior to the Annual General Meeting on June 5, 2011.
Included in accounts payable and accrued liabilities at September 30, 2011 is $46,159 (December 31, 2010 - $12,944) payable to directors and officers.
These transactions are in the normal course of operations and are measured at the exchange amount, which is the amount of consideration established and agreed to by the related parties.
|
14.
|
Financial instruments
|
In all material respects, the carrying amounts for the Company’s cash and cash equivalents, amounts receivable, accounts payable and accrued liabilities approximate their fair values due to the short term nature of these instruments. Investments at September 30, 2011 and December 31, 2010 are recorded at fair value (note 5).
|
15.
|
Segment disclosures
|
The Company considers itself to operate in a single segment, being mineral exploration and development, with all of the Company’s long lived assets being located in the United States at September 30, 2011 and December 31, 2010.
23
Item 2. Management's Discussion and Analysis of Financial Condition and Results of Operations.
You should read the following discussion and analysis of our financial condition and results of operations together with our financial statements and related notes appearing elsewhere in this Quarterly Report filed on Form 10-Q. This discussion and analysis contains forward-looking statements that involve risks, uncertainties and assumptions. Our actual results may differ materially from those anticipated in these forward-looking statements as a result of many factors, including, but not limited to, those set forth under the heading “Risk Factors and Uncertainties” in our Form 10-K filed with the SEC on March 17, 2011, and elsewhere in this report.
This discussion and analysis should be read in conjunction with the accompanying unaudited interim consolidated financial statements and related notes. The discussion and analysis of the financial condition and results of operations are based upon the unaudited interim consolidated financial statements, which have been prepared in accordance with accounting principles generally accepted in the United States. The preparation of financial statements in conformity with accounting principles generally accepted in the United States of America requires Midway to make estimates and assumptions that affect the reported amounts of assets and liabilities, disclosure of any contingent liabilities at the financial statement date and reported amounts of revenue and expenses during the reporting period. On an on-going basis Midway reviews its estimates and assumptions. The estimates were based on historical experience and other assumptions that Midway believes to be reasonable under the circumstances. Actual results are likely to differ from those estimates under different assumptions or conditions, but Midway does not believe such differences will materially affect our financial position or results of operations. Critical accounting policies, the policies Midway believes are most important to the presentation of its financial statements and require the most difficult, subjective and complex judgments, are outlined below in “Critical Accounting Policies,” and have not changed significantly.
Cautionary Note Regarding Forward-Looking Statements
In addition, certain statements made in this report may constitute “forward-looking statements”. These forward-looking statements involve known or unknown risks, uncertainties and other factors that may cause the actual results, performance, or achievements of Midway to be materially different from any future results, performance or achievements expressed or implied by the forward-looking statements. Except for historical information, the matters set forth herein, which are forward-looking statements, involve certain risks and uncertainties that could cause actual results to differ. Potential risks and uncertainties include, but are not limited to, unexpected changes in business and economic conditions; significant increases or decreases in gold prices; changes in interest and currency exchange rates; unanticipated grade changes; metallurgy, processing, access, availability of materials, equipment, supplies and water; determination of reserves; results of current and future exploration activities; results of pending and future feasibility studies; joint venture relationships; political or economic instability, either globally or in the countries in which we operate; local and community impacts and issues; timing of receipt of government approvals; accidents and labor disputes; environmental costs and risks; competitive factors, including competition for property acquisitions; and availability of external financing at reasonable rates or at all. Forward-looking statements can be identified by terminology such as “may,” “will,” “should,” “expects,” “intends,” “plans,” “anticipates,” “believes,” “estimates,” “predicts,” “potential,” “continues” or the negative of these terms or other comparable terminology. Although Midway believes that the expectations reflected in the forward-looking statements contained herein are reasonable, it cannot guarantee future results, levels of activity, performance or achievements. Forward-looking statements are made based on management’s beliefs, estimates, and opinions on the date the statements are made, and Midway undertakes no obligation to update such forward-looking statements if these beliefs, estimates, and opinions should change, except as required by law.
Cautionary Note to U.S. Investors Regarding Reserve and Resource Estimates
The mineral estimates in this Form 10-Q have been prepared in accordance with the requirements of the securities laws in effect in Canada, which differ from the requirements of United States securities laws. The terms “mineral reserve”, “proven mineral reserve” and “probable mineral reserve” are Canadian mining terms as defined in accordance with Canadian National Instrument 43-101 – Standards of Disclosure for Mineral Projects (“NI 43-101”) and the Canadian Institute of Mining, Metallurgy and Petroleum (the “CIM”) - CIM Definition Standards on Mineral Resources and Mineral Reserves, adopted by the CIM Council, as amended. These definitions differ from the definitions in United States Securities and Exchange Commission (“SEC”) Industry Guide 7 under the United States Securities Act of 1933, as amended. Under SEC Industry Guide 7 standards, a “final” or “bankable” feasibility study is required to report reserves, the three-year historical average price is used in any reserve or cash flow analysis to designate reserves and the primary environmental analysis or report must be filed with the appropriate governmental authority.
24
In addition, the terms “mineral resource”, “measured mineral resource”, “indicated mineral resource” and “inferred mineral resource” are defined in and required to be disclosed by NI 43-101; however, these terms are not defined terms under SEC Industry Guide 7 and are normally not permitted to be used in reports and registration statements filed with the SEC. Investors are cautioned not to assume that any part or all of mineral deposits in these categories will ever be converted into reserves. “Inferred mineral resources” have a great amount of uncertainty as to their existence, and great uncertainty as to their economic and legal feasibility. It cannot be assumed that all or any part of an inferred mineral resource will ever be upgraded to a higher category. Under Canadian rules, estimates of inferred mineral resources may not form the basis of feasibility or pre-feasibility studies, except in rare cases.
Investors are cautioned not to assume that all or any part of an inferred mineral resource exists or is economically or legally mineable. Disclosure of “contained ounces” in a resource is permitted disclosure under Canadian regulations; however, the SEC normally only permits issuers to report mineralization that does not constitute “reserves” by SEC Industry Guide 7 standards as in place tonnage and grade without reference to unit measures.
Accordingly, information contained in this Quarterly Report on Form 10-Q and the documents incorporated by reference herein contain descriptions of our mineral deposits that may not be comparable to similar information made public by U.S. companies subject to the reporting and disclosure requirements under the United States federal securities laws and the rules and regulations thereunder.
Overview
Company Overview
Midway is an exploration stage company engaged in the acquisition, exploration, and, if warranted, development of gold and silver mineral properties in North America. Our mineral properties are located in Nevada and Washington. The Midway, Spring Valley, Pan, Gold Rock, and Golden Eagle gold properties are exploration stage projects with identified gold mineralization. The Thunder Mountain and Burnt Canyon projects are early stage gold and silver exploration projects.
Business Strategy and Development
The Company is currently working towards transitioning itself from an exploration company to a gold production company with plans to advance the Pan gold deposit located in White Pine County, Nevada to production by as early as 2013.
25
The map below shows the location of Midway’s properties located in Nevada, USA.
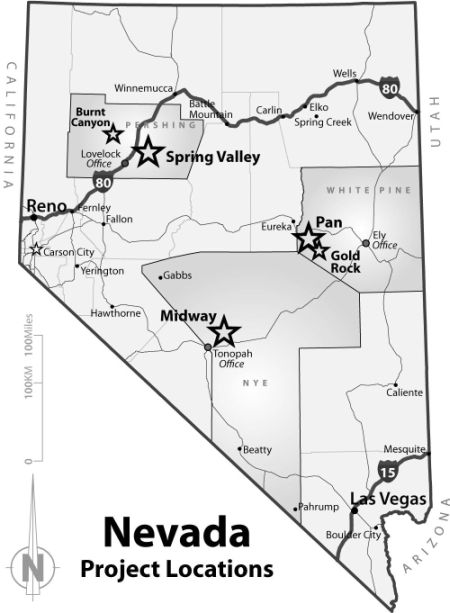
26
Highlights for the third quarter 2011 and up to November 11, 2011:
|
·
|
Spring Valley project - Assay results and drill hole information from first and second quarter 2011 drilling were reported.
|
|
·
|
Pan project - Positive drilling results were reported; expanded drilling permit received; updated resource estimate reported.
|
|
·
|
Midway project - Core drilling was completed with assays pending.
|
|
·
|
Gold Rock project – A validation drilling program was initiated to verify results from over 650 historic drill holes. Initial results are positive; verifying the grade, width, and location of historic results in those areas drilled to date.
|
Activities on Midway’s properties in the third quarter ended September 30, 2011 and up to November 11, 2011, the date of this Quarterly Report filed on Form 10-Q, are described in further detail below.
Spring Valley Project, Pershing County, Nevada
The Spring Valley property is located in the Spring Valley Mining District, Pershing County, Nevada, approximately 20 miles northeast of the town of Lovelock. Water for exploration purposes is available from water wells drilled on the property under temporary grant of water rights. Power is accessible from existing power lines, however capacity is unknown and may be limited.
Barrick conducted and funded exploration in 2010 on the Spring Valley project as part of its minimum expenditure requirement of US$5,000,000 in 2010. Barrick has the exclusive right to earn a 60% interest in the Spring Valley project by spending US$30,000,000 on the property over five years. Barrick may increase its interest by 10% (70% total) by spending an additional US$8,000,000 in the year immediately after vesting at 60%. At the Company’s election, Barrick may also earn an additional 5% (75% total) by carrying the Company to a production decision and arranging financing for the Company’s share of mine construction expenses with the carrying and financing costs plus interest to be recouped by Barrick once production has been established.
Barrick forwarded data from first and second quarter 2011 drilling. Barrick commenced its 2011 drilling program in early April with two reverse circulation (RC) rigs and one core rig operating. Drill results included holes that tested the northern extent of the known resource and initial reconnaissance drilling in widely spaced holes south of the known resource. Results reported indicate that the deposit remains open to the north and new gold assays extend the gold zone at least 1.7 kilometers to the southwest of the previously known resource area over a width of approximately 0.5 kilometers. Assays are pending for the majority of 2011 holes.
Barrick has informed Midway that the 2011 drill plan is focused on expanding the resource and evaluating property acquired near the end of 2010 south of the current resource area. In addition to drilling, cultural and biological surveys, hydrogeologic studies and trace element analyses are underway to support future permit applications.
Barrick has informed Midway that it intends to conduct and fund the minimum required program of US$7,000,000 in 2011 for a cumulative amount of US$16,000,000 by December 31, 2011.
The Company engaged an independent engineer, Gustavson Associates, LLC of Lakewood, Colorado (Gustavson) to review the drilling results and provide a new resource update that incorporated all Barrick drilling through May, 2011, resulting in the conversion of 2.16 million ounces of gold to the Measured and Indicated categories, consisting of 0.93 million ounces in the Measured category and 1.23 million ounces in the Indicated category at a cut-off grade of 0.14 grams per tonne (g/t). The new drilling also produced an additional Inferred resource of 1.97 million ounces of gold at the same cut-off grade. The Measured resource is contained within 59.0 million tonnes grading 0.49 g/t, the Indicated resource is contained within 85.8 million tonnes grading 0.45 g/t and the Inferred resource is contained within 103.9 million tonnes grading 0.59 g/t.
Measured and Indicated resources are estimated pursuant to Canadian industry standards. See “Cautionary Note to U.S. Investors Regarding Reserve and Resource Estimates” above. The Spring Valley project is without known reserves, as defined under SEC Guide 7, and the proposed program for the property is exploratory in nature.
27
Barrick is funding the majority of the ongoing costs of this project. In the nine months ended September 30, 2011, the Company incurred $266,423 primarily to fund engineering and legal costs incurred on the portion of the Seymork land that falls outside of the Barrick agreement area of interest.
Pan Project, White Pine County, Nevada
The Pan property is located at the northern end of the Pancake mountain range in western White Pine County, Nevada, approximately 22 miles southeast of Eureka, Nevada, and 50 miles west of Ely, Nevada. The Pan deposit is a Carlin-style, disseminated gold deposit, located along the Battle Mountain-Eureka Trend. In March 2011, we contracted a third party vendor to obtain permits to extend power lines to the property.
The Company received regulatory approval of an expanded drilling permit that increases the area available for drill roads and drill pads for additional exploration drilling and expedited condemnation drilling around proposed mine facilities and also includes a new access route to the project. An Environmental Assessment completed for the U.S. Bureau of Land Management (BLM) concluded that the permitted activities will have no significant environmental impact.
In October, 2011, the Company reported an updated resource estimate for the Pan project based on results from 2011 drilling received to date. The updated Measured and Indicated resource estimate exceeds one million ounces of gold. The 1.13 million ounces of gold are contained in 37 million tonnes of 0.49 grams per tonne (gpt) gold in the Measured category and 43 million tonnes of 0.40 gpt gold in the Indicated category using a 0.14 gpt gold cutoff grade. The updated resource was prepared by Gustavson. The mineral resources are summarized below.
|
Measured Resource*
|
||||||||||||||
|
Cutoff (gpt)
|
Tonnes
|
Grade (gpt)
|
Gold ounces
|
|||||||||||
| 0.27 | 27,352,000 | 0.59 | 520,000 | |||||||||||
| 0.21 | 30,857,000 | 0.55 | 547,000 | |||||||||||
| 0.14 | 36,920,000 | 0.49 | 579,000 | |||||||||||
| 0.07 | 50,924,000 | 0.38 | 622,000 | |||||||||||
|
Indicated Resource*
|
||||||||||||||
|
Cutoff (gpt)
|
Tonnes
|
Grade (gpt)
|
Gold ounces
|
|||||||||||
| 0.27 | 27,126,000 | 0.52 | 453,000 | |||||||||||
| 0.21 | 32,652,000 | 0.47 | 495,000 | |||||||||||
| 0.14 | 43,118,000 | 0.40 | 551,000 | |||||||||||
| 0.07 | 73,925,000 | 0.27 | 645,000 | |||||||||||
|
Measured Plus Indicated Resource*
|
||||||||||||||
|
Cutoff (gpt)
|
Tonnes
|
Grade (gpt)
|
Gold ounces
|
|||||||||||
| 0.27 | 54,478,000 | 0.56 | 974,000 | |||||||||||
| 0.21 | 63,509,000 | 0.51 | 1,042,000 | |||||||||||
| 0.14 | 80,037,000 | 0.44 | 1,130,000 | |||||||||||
| 0.07 | 124,849,000 | 0.32 | 1,268,000 | |||||||||||
28
|
Inferred Resource*
|
||||||||||||||
|
Cutoff (gpt)
|
Tonnes
|
Grade (gpt)
|
Gold ounces
|
|||||||||||
| 0.27 | 1,771,000 | 0.58 | 33,000 | |||||||||||
| 0.21 | 2,229,000 | 0.51 | 37,000 | |||||||||||
| 0.14 | 3,928,000 | 0.36 | 45,000 | |||||||||||
| 0.07 | 9,693,000 | 0.20 | 63,000 | |||||||||||
The Company completed a 7,200 meter reverse circulation (RC) drilling program in the second quarter, and reported drill intercepts from 28 RC drill holes, including drill hole PN11-09 which contained the longest and highest grade gold intercept yet encountered at the project. The 30 meter intercept of 3.15 grams per tonne (gpt) gold includes a zone of 13.7 meters of 5.79 gpt gold which also includes a 1.5 meter interval of 10.1 gpt gold. As expected, drilling to test for mineralization beneath proposed mine facility sites produced no significant results. The Pan deposit is still open to the North, the South and at depth and the 2011 drilling, including a 600 meter diamond core program to commence in the second half of 2011, is designed to expand the resource by following up on 2010 drilling that identified higher gold grades and a possible new gold zone.
In April, 2011, the Company reported the results of a Prefeasibility Study for the Pan project, prepared by Gustavson Associates, LLC. The Prefeasibility Study demonstrated positive economic results and technical favorability of the Pan project and included a new resource estimate. The Prefeasibility Study was prepared to the standards of National Instrument 43-101 and was filed on SEDAR on April 4, 2011. The Prefeasibility Study was prepared under the supervision of William J. Crowl, Vice President of Mining, Donald E. Hulse, Principal Mining Engineer, Terre A. Lane, Principal Mining Engineer and Donald J. Baker, Associate Principal Geologist of Gustavson, and Deepak Malhotra, President of Resource Development, Inc., each of whom are independent of the Company and are qualified persons.
Additional work is underway for a Feasibility Study scheduled for completion in 2011. Environmental studies are continuing in support of permitting including a plan of operations and reclamation plan to be submitted to management agencies.
The Company expensed $4,366,559 of costs at the Pan project in the nine months ended September 30, 2011 of which, 38% was the cost of engineering, environmental, geochemical and geological work for the prefeasibility study and advancing work toward the feasibility study, 19% on the ongoing drill program and the balance on advancing study and permitting activities.
Midway Project, Nye County, Nevada
The Midway property is located in Nye County, Nevada, approximately 15 miles northeast of the town of Tonopah, 210 miles northwest of Las Vegas and 236 miles southeast of Reno. The property is over the northeastern flank of the San Antonio Mountains and in the Ralston Valley. Water for exploration purposes is available from water wells drilled on the property under a temporary grant of water rights. Power is accessible from existing power lines crossing the property, however capacity is unknown and may be limited.
A core drilling program was conducted at Midway during the third quarter. A total of 13,000 feet was drilled in 26 holes to test areas of the Discovery, 121, Dauntless, and 63-77 areas. Assay results are pending.
In the second quarter, an initial resource estimate was completed on select veins of the Discovery and Dauntless zones that could possibly be developed using underground mining methods. Additional engineering studies are underway to support further underground mine analyses and to guide future work programs. A core drilling program is underway to provide additional geological information and to confirm past RC drill results.
29
In April, 2011 a NI 43-101 compliant resource estimate was completed by Gustavson Associates, LLC to evaluate a limited number of vein-like structures primarily in the Discovery Zone. Mineralization was modeled using Indicator Kriging to analyze zones of potential high grade mineralization. This indicator model was calibrated by comparison with veins modeled on cross sections, and appears to have identified higher grade areas with continuous gold mineralization that could possibly be mined by underground methods.
|
Midway Project Initial Inferred Underground Resource*
|
||||||||||||||
|
Cutoff Grade (oz/ton)
|
Short Tons (thousands)
|
Grade (oz/ton)
|
Ounces
|
|||||||||||
| 0.1000 | 114.0 | 0.3017 | 34,394 | |||||||||||
| 0.0750 | 127.0 | 0.2813 | 35,725 | |||||||||||
| 0.0500 | 130.0 | 0.2758 | 35,854 | |||||||||||
| 0.0200 | 131.0 | 0.2742 | 35,920 | |||||||||||
The resource was prepared to the standards of National Instrument 43-101 and was filed on SEDAR on April 1, 2011. The report was prepared under the supervision of William J. Crowl, Vice President of Mining, Donald E. Hulse, Principal Mining Engineer, Terre A. Lane, Principal Mining Engineer and Donald J. Baker, Associate Principal Geologist of Gustavson, each of whom are independent of the Company and are qualified persons.
The Company expensed $1,493,695 of costs at the Midway project in the nine months ended September 30, 2011 of which 54% was for drilling, 16% was the cost of engineering studies and the balance on work to support the discussions for the water rights.
Gold Rock Project, White Pine County, Nevada
The Gold Rock property is situated in the eastern Pancake Range in western White Pine County, Nevada. The property is 8 miles southeast of the Company’s Pan project. Access is via the Green Springs road from US Highway 50 approximately 65 miles from Ely, Nevada. Water for exploration purposes is available from wells in the region under temporary grant of water rights. It is anticipated that power will be available from the line being extended to serve the nearby Pan Project.
An initial drilling program designed to verify results reported from historic drill holes is underway. One reverse circulation drill rig and one core rig operated on the property during the third quarter. The planned program includes 18,000 feet of RC drilling and 3,400 feet of core drilling. Initial drill results reported by the Company included intercepts of 33.5 meters of 2.06 grams per tonne (gpt) gold, including 7.6 meters of 4.18 gpt gold, in drill hole GR11-05. Additional intercepts include 48.8 meters of 0.96 gpt gold in drill hole GR11-07, and 18.3 meters of 0.82 gpt gold in drill hole GR11-03. Initial results were positive; verifying the grade, width, and location of historic results in those areas drilled to date.
A technical report was completed in the first quarter of 2011 by Gustavson Associates, LLC to review geological and historical drill data prior to the planned 2011 drilling program. Historic drill results include 673 drill holes within and surrounding the Easy Junior open pit mine. Review of select drill data confirmed that assays in the database are consistent with original assay certificates. These drill results suggest there could be significant unmined gold mineralization along strike of Easy Junior that may represent a bulk tonnage epithermal gold target.
30
Gustavson reviewed a historic resource estimate that was completed in 1988 prior to mining by International Mining Consultants of Tucson, Arizona (“IMC”) (see table below). During operations, the mine reportedly produced
approximately 52,400 ounces of gold. A qualified person has not done sufficient work to classify the historical estimate as current mineral resources; Midway is not treating the historical estimate as a current mineral resource and the historical estimate should not be relied upon.
|
IMC geological reserve (1988 geologic inventory, no economic constraint)
|
||||||||||||||
|
Cutoff Grade (oz/ton)
|
Short Tons
|
Grade (oz/ton)
|
Ounces
|
|||||||||||
| 0.050 | 758,000 | 0.064 | 48,512 | |||||||||||
| 0.030 | 3,552,000 | 0.043 | 152,736 | |||||||||||
| 0.025 | 4,953,000 | 0.039 | 193,167 | |||||||||||
| 0.020 | 6,963,000 | 0.034 | 236,742 | |||||||||||
| 0.015 | 9,934,000 | 0.029 | 288,086 | |||||||||||
| 0.012 | 12,641,000 | 0.025 | 316,025 | |||||||||||
| 0.010 | 14,990,000 | 0.023 | 344,770 | |||||||||||
Gustavson’s evaluation confirms that Gold Rock contains a gold system that warrants additional exploration and evaluation. The mineralizing system is strong, with a known strike length of over 8,000 feet. The lithology, alteration, and mineralization are similar to other sediment hosted Carlin-type systems such as Alligator Ridge, Bald Mountain, Rain, and Midway’s Pan Project, 8 miles to the northwest. Only a portion of the system has been explored and mined, and drilling outside of the Easy Junior pit area is widely spaced and shallow. The Gold Rock system has structural controls that have not been explored at depth. Previous exploration has not closed off mineralization in any direction.
Gustavson’s evaluation was prepared to the standards of National Instrument 43-101 and was filed on SEDAR on March 30, 2011. The report was prepared under the supervision of William J. Crowl, Vice President of Mining, Donald E. Hulse, Principal Mining Engineer, Terre A. Lane, Principal Mining Engineer and Donald J. Baker, Associate Principal Geologist of Gustavson, each of whom are independent of the Company and are qualified persons.
The Company expensed $926,491 of costs at the Gold Rock project in the nine months ended September 30, 2011 of which 60% was for drilling and the balance related to the cost of engineering studies and geological programs.
Burnt Canyon Project, Pershing County, Nevada
Burnt Canyon is a volcanic hosted epithermal system with gold identified in numerous rock and soil samples. The project lies between high grade veins in the Seven Troughs district to the south and the Wildcat disseminated gold deposit to the north in Pershing County, Nevada.
The Company did not conduct any work on the Burnt Canyon project in the nine months ended September 30, 2011.
The Company expensed $25,561 of costs at the Burnt Canyon project in the nine months ended September 30, 2011 of which 53% was for property maintenance, and 13% related to the cost of engineering studies.
Thunder Mountain Project, Nye County, Nevada
Thunder Mountain is a gold and silver rich epithermal vein and disseminated gold system hosted in rhyolite tuffs and flow dome complexes located six miles southeast of the Midway project in Nye County, Nevada.
The Company conducted reclamation work on the Thunder Mountain project in the nine months ended September 30, 2011.
The Company expensed $6,090 expenditures at the Thunder Mountain project in the nine months ended September 30, 2011 $5,365 of which was for reclamation costs.
31
Golden Eagle Project, Ferry County, Washington
The Golden Eagle property is located on private land in the Eureka (Republic) mining district in Ferry County,
Washington. The property is two miles northwest of the town of Republic, Washington and is accessed by the Knob Hill county road.
Engineering studies are continuing, including evaluations of methods for processing sulfide mineralization and issues related to permitting.
The Company expensed $225,252 of expenditures at the Golden Eagle project in the nine months ended September 30, 2011 of which 91% was for engineering studies.
Results of operations
The net loss for the three months ended September 30, 2011 and 2010 was $3,253,939 and $1,527,111, respectively.
Significant differences between the three month periods ended September 30, 2011 and September 30, 2010 are as follows:
Expenses:
Depreciation totalled $80,744 (2010 - $16,526), an increase of $64,218 or 389% from the comparative period. This was primarily due to a substantial increase in depreciable assets.
Legal and accounting fees totalled $279,134 (2010 – $50,032), an increase of $229,102 or 458%. The increase for the period primarily relates to an entity restructuring analysis for tax planning purposes and a full internal control re-evaluation, restructuring, implementation and testing as required under the Sarbanes-Oxley Act.
Exploration expenses were $2,785,005 (2010 – $1,981,694), a $803,311 or 41% increase over the 2010 comparative period. The details of the expenses in each period may be found in the schedule of mineral exploration expenditures to the unaudited consolidated interim financial statements. Exploration levels are determined by the success of previous exploration programs on each project and cash available to fund additional programs. Exploration salaries and labor for the three months ended September 30, 2011 include the non-cash estimated fair value of stock-based compensation for stock options granted to technical employees in the amount of $20,420 (2010 - $8,623). Management fees earned for the Spring Valley project were $3,066 (2010 – $5,204).
Office and administration expenses in the current period were $200,737 (2010 - $59,835) an increase of $140,902 or 235% over the comparative period. This increase is the result of an increase in staff sizes at both our Englewood, Colorado and Ely, Nevada offices. In the comparative period in 2010 our corporate office was located in Helena, Montana.
Transfer agent and filing fees in the current period were $96,855 (2010 - $21,017) an increase of $75,838 over the comparative period. The costs for the period were primarily related to fees paid to the Nevada Bureau of Land Management.
Staff growth across all departments has resulted in an increase in salaries and benefits, including director’s fees, for the period. Salaries and benefits, including director’s fees, were $724,721 inclusive of $54,976 of non-cash stock-based compensation. In the comparative period $257,980 included $60,328 of non-cash employee stock-based compensation. Salaries and benefits, including director’s fees, exclusive of non-cash benefits were $669,745 for the three months ended September 30, 2011 (2010 - $197,652), an increase of $472,093 or 239% over the comparative period.
The gain on the sale of property and equipment in the current period was $491,386 (2010 – nil). The majority of the gain was the result of a check received in the amount of US$1,144,929, which the Company subsequently negotiated. The check was accompanied with a letter instructing the Company to apply the funds to the payment of certain specified obligations arising out of the May 5, 2006 agreement between Seymork Investments Limited (“Seymork”) and the Company, resulting in a gain for the period. See “Item I: Legal Proceedings in Part II” below for more detail.
32
Results of operations for the nine months ended September 30, 2011 compared to the nine months ended September 30, 2010
The net loss for the nine months ended September 30, 2011 was $9,269,203 (2010 – $3,731,246).
Significant differences between the nine month periods ended September 30, 2011 and September 30, 2010 are as follows:
Consulting totaled $160,880 (2010 - $71,277) an increase of $89,603 or 126% over the comparative period. Included in the variance is an increase for land and title as well as general consulting expenditures incurred. The Company has also engaged consultants to assist the Company on legislative/political issues related to mining in the state of Nevada and well as on environmental matters.
Depreciation totalled $108,164 (2010 - $59,706), an increase of $48,458 or 81% from the comparative period. This was primarily due to a substantial increase in depreciable assets.
Legal and accounting fees totalled $459,910 (2010 – $155,582), an increase of $304,328 or 196%. The increase for the period primarily relates to an entity restructuring analysis for tax planning purposes and a full internal control re-evaluation, restructuring, implementation and testing as required under the Sarbanes-Oxley Act.
Exploration expenses were $7,319,020 (2010 – $2,416,344). The details of the expenses in each period may be found in the schedule of mineral exploration expenditures to the unaudited consolidated interim financial statements. Exploration levels are determined by the success of previous exploration programs on each project and cash available to fund additional programs. Exploration salaries and labor include the non-cash estimated fair value of stock-based compensation for stock options granted to technical employees in the period of $96,499 (2010 - $27,615). Management fees earned from Barrick for the Spring Valley project were $8,748 (2010 - $14,552).
Office and administration expenses in the current period were $347,234 (2010 - $152,501) an increase of $194,733 or 128% over the comparative period. This increase is the result of an increase in staff sizes at both the Englewood, Colorado and Ely, Nevada locations. In the comparative period in 2010 the corporate office was located in Helena, Montana.
Staff growth across all departments has resulted in an increase in salaries and benefits, including director’s fees, for the period. Salaries and benefits, including director’s fees, were $1,972,660 inclusive of $826,792 of non-cash stock-based compensation for the nine months ending September 30, 2011. In the comparative period $1,362,969 included $679,538 of non-cash employee stock-based compensation. Salaries and benefits, including director’s fees, exclusive of non-cash benefits were $1,281,997 for the nine months ended September 30, 2011 (2010 - $683,431), an increase of $598,566 or 88% over the comparative period.
Transfer agent and filing fees in the current period were $207,347 (2010 - $97,056) an increase of $110,291 over the comparative period. The increase is the result of additional regulatory and filing fees as well as a large volume of warrant exercises in current period.
The foreign exchange gain in the current period was $321,450 compared to a gain in the comparative period of $179,480 of which $267,762 was an unrealized gain in the current period and a $168,280 unrealized loss in the 2010 comparative period. The unrealized foreign exchange relates to the translation of the US dollar denominated future income tax liability.
A loss on the change in fair value of warrant liability of $592,026 was recognized in the current period. There was no comparable amount for the nine month period ended September 30, 2010. These warrants were either exercised or they expired in the current period and there was no warrant liability at September 30, 2011.
33
The gain on the sale of property and equipment in the current period was $491,386 (2010 – $59). The majority of the gain was the result of a check received in the amount of US$1,144,929, which the Company subsequently negotiated. The check was accompanied with a letter instructing the Company to apply the funds to the payment of certain specified obligations arising out of the May 5, 2006 agreement between Seymork Investments Limited (“Seymork”) and the Company, resulting in a gain for the period. See “Item I: Legal Proceedings in Part II” below for more detail.
For the nine months ended September 30, 2011, the income tax recovery of $1,456,000 (2010 - $747,000), an increase of $709,000 or 95%, is an adjustment to the future income tax liability associated with the acquisition of the Pan-Nevada and Gold Rock projects.
Summary of Quarterly Results (Unaudited)
|
Sept 2011
|
June 2011
|
March 2011
|
Dec
2010
|
Sept 2010
|
June
2010
|
March
2010
|
Dec
2009
|
|||||||||||||||||||||||||
|
$(000s) except per share amounts
|
||||||||||||||||||||||||||||||||
|
Revenue from the sale of minerals
|
Nil
|
Nil
|
Nil
|
Nil
|
Nil
|
Nil
|
Nil
|
Nil
|
||||||||||||||||||||||||
|
Net loss
|
$ | 3,253 | $ | 3,301 | $ | 2,714 | $ | 2,096 | $ | 1,527 | $ | 1,812 | $ | 392 | $ | 68 | ||||||||||||||||
|
Net loss per share, basic and diluted
|
$ | 0.03 | $ | 0.03 | $ | 0.03 | $ | 0.02 | $ | 0.02 | $ | 0.02 | $ | 0.01 | $ | 0.00 | ||||||||||||||||
Notes and Factors Affecting Comparability of Quarters:
|
(1)
|
The Company is a mineral exploration company at the development stage and has no operating revenues. Exploration costs fluctuate between periods depending on results of each successive phase on each project and the Company’s ability to fund exploration and development activities.
|
|
(2)
|
Stock-based compensation costs are a non-cash expense and represent an estimate of the fair value of stock options granted. These expenses are often the largest item included in the Statement of Operations and they represent a significant source of variation in loss from quarter to quarter. Stock-based compensation is allocated between salaries and benefits and mineral exploration expenditures.
|
|
(3)
|
Costs for the June 30 quarter tend to be higher due to printing and mailing of shareholder material for the Company’s annual general meeting and costs of conducting this meeting.
|
|
(4)
|
Costs for the December 31 quarter also tend to be higher due to accruals for the annual audit. Administratively, management tends to critically review all exploration projects in detail at this time of year and makes decisions about which projects it wishes to continue and which projects it may abandon.
|
Financial Condition and Liquidity
The Company began the 2011 year with cash and cash equivalents of $6,062,816. During the nine months ended September 30, 2011, cash used on operations was $9,049,826, which included an increase in accounts payable of $690,722. Cash used for investing totaled $2,439,231, which included purchases of property and equipment of $1,384,210, offset by cash received for the disposal of mineral properties in the amount of $1,105,543. Cash generated by financing was $18,312,506 resulting from a public offering and warrant and stock option exercises to end at September 30, 2011 with cash and cash equivalents of $13,991,808.
The Company has not generated revenues from operations. The unaudited interim consolidated financial statements have been prepared on the basis that the Company is a going concern, which contemplates the realization of its assets and the settlement of its liabilities in the normal course of operations. The continuation of the Company as a going concern is dependent upon the continued financial support from its shareholders, the ability of the Company to obtain necessary equity financing to continue operations, confirmation of the Company’s interests in the underlying properties, the attainment of profitable operations and/or realizing proceeds from the sale of one or more of the properties. As at September 30, 2011, the Company had an accumulated deficit of $71,363,778 and working capital of $13,195,282 which management believes is sufficient to fund ordinary operations through at least the next twelve months, however the Company intends to raise additional equity funds as the opportunity presents itself.
There was a severe deterioration in global credit and equity markets in 2007 through 2009. This resulted in the need for government intervention in major banks, financial institutions and insurers and also resulted in greater volatility, increased credit losses and tighter credit conditions. These disruptions in the credit and financial markets have had a significant material adverse impact on a number of financial institutions and have limited access to capital and credit for many companies. While market conditions have generally improved through 2010 and into 2011, access to capital and credit remains limited compared to capital markets before the deterioration in 2007. Continued disruptions could, among other things, make it more difficult for us to obtain, or increase our cost of obtaining, capital and financing for our operations. Our access to additional capital and financing may not be available on terms acceptable to us or at all.
34
On April 21, 2011, the Alberta, British Columbia and Ontario Securities Commissions issued a final receipt for the Company’s Short Form Prospectus, which along with the Company’s S-3 Shelf Registration Statement under the Securities Act of 1933, as amended, declared effective by the SEC on February 14, 2011 (jointly the “2011 Prospectus”), allows the Company to offer and sell, from time to time over a twenty-five month period, up to US$60,000,000 of the Company’s common shares, without par value, with or without warrants to purchase common shares, or any combination thereof in one or more transactions under the 2011 Prospectus. The Company may also offer under the 2011 Prospectus any common shares issuable upon the exercise of warrants.
On June 6, 2011, the Company issued 7,500,000 common shares upon the close of a “bought deal” public offering at a purchase price of US$1.60 per share for gross proceeds to the Company of $11,742,000 (US$12,000,000).
On September 23, 2011, the Company announced that it had established an "At-the-Market" ("ATM") issuance program under which it may sell up to a maximum of 6,000,000 of its common shares. The ATM issuance program is available to the Company on an as needed basis. Subject to market conditions and funding requirements, the Company may, at its discretion, from time to time sell all, some, or none of the reserved shares during the term of the ATM program. Any common shares issued under the ATM program will be sold through ATM issuances in the United States. No ATM issuances will be made through the facilities of any Canadian exchange. Any ATM issuances will be made at market prices prevailing at the time of the sale and, as a result, prices may vary. As announced on October 6, 2011, the Company has no current intention of issuing new common shares under the ATM stock issuance program and will continue to monitor market conditions and its share price and to review all financing options including the ATM program and implement those that are appropriate for the prevailing market conditions.
As of the date of this Quarterly Report on Form 10-Q, there are 6,275,002 stock options outstanding at prices ranging from $0.56 to $3.36 and 1,610,482 share purchase warrants at $0.80. While it is probable that some of these options and share purchase warrants will be exercised, it is not possible to predict the timing or the amount of funds which might be received.
Off-balance sheet arrangements
There are no off balance sheet arrangements.
Inflation
We do not believe that inflation has had a significant impact on our consolidated results of operations or financial condition.
35
Environmental Compliance
Our current and future exploration and development activities, as well as our future mining and processing operations, are subject to various federal, state and local laws and regulations in the countries in which we conduct our activities. These laws and regulations govern the protection of the environment, prospecting, development, production, taxes, labor standards, occupational health, mine safety, toxic substances and other matters. We expect to be able to comply with those laws and do not believe that compliance will have a material adverse effect on our competitive position. We intend to obtain all licenses and permits required by all applicable regulatory agencies in connection with our mining operations and exploration activities. We intend to maintain standards of environmental compliance consistent with regulatory requirements.
Midway has an obligation to reclaim its properties after the surface has been disturbed by exploration methods at the site. As of September 30, 2011, we have accrued US$41,920 ($43,941 at September 30, 2011 compared to $41,445 at December 31, 2010) related to reclamation and other closure requirements at our properties. These liabilities are covered by a combination of surety bonds and restricted cash totaling $500,432 at September 30, 2011 (December 31, 2010 - $260,087). We have accrued as a current liability what management believes is the present value of our best estimate of the liabilities as of September 30, 2011; however, it is possible that our obligations may change in the near or long term depending on a number of factors.
Critical accounting policies
Critical accounting estimates used in the preparation of the financial statements include our estimate of recoverable value on our property, plant and equipment, site reclamation and rehabilitation as well as the value assigned to stock-based compensation expense. These estimates involve considerable judgment and are, or could be, affected by significant factors that are out of our control.
The factors affecting stock-based compensation include estimates of when stock options might be exercised and the stock price volatility. The timing for exercise of options is out of our control and will depend, among other things, upon a variety of factors including the market value of Midway shares and financial objectives of the holders of the options. We used historical data to determine volatility in accordance with Black-Scholes modeling, however the future volatility is inherently uncertain and the model has its limitations. While these estimates can have a material impact on the stock-based compensation expense and hence results of operations, there is no impact on our financial condition.
Midway’s recoverability evaluation of its mineral properties and equipment is based on market conditions for minerals, underlying mineral resources associated with the assets and future costs that may be required for ultimate realization through mining operations or by sale. Midway is in an industry that is exposed to a number of risks and uncertainties, including exploration risk, development risk, commodity price risk, operating risk, ownership and political risk, funding and currency risk, as well as environmental risk. Bearing these risks in mind, Midway has assumed recent world commodity prices will be achievable. We have considered the mineral resource reports by independent engineers on the Midway, Spring Valley, Pan and Golden Eagle projects in considering the recoverability of the carrying costs of the mineral properties. All of these assumptions are potentially subject to change and most are out of our control; however changes to the assumptions are not determinable. Accordingly, there is always the potential for a material adjustment to the value assigned to mineral properties and equipment.
Midway has an obligation to reclaim its properties after the surface has been disturbed by exploration methods at the site. As a result Midway has recorded a liability for the fair value of the reclamation costs it expects to incur. The Company estimated applicable inflation and credit-adjusted risk-free rates as well as expected reclamation time frames. To the extent that the estimated reclamation costs change, such changes will impact future reclamation expense recorded.
36
Related Party Transactions
The Company had the following related party transactions for the three months ended September 30, 2011 and 2010 respectively.
|
September 30, 2011
|
September 30, 2010
|
|||||||
|
Consulting services paid to a company owned by Doris Meyer, who, Until March 18, 2011, was Chief Financial Officer of the Company
|
$ | - | $ | 67,500 | ||||
Included in accounts payable and accrued liabilities at September 30, 2011 is $46,159 (December 31, 2010 - $12,944) payable to directors and officers.
These transactions are in the normal course of business and are measured at the exchange amount which is the consideration established and agreed to by the related parties.
Item 3. Quantitative and Qualitative Disclosures about Market Risk.
Not applicable.
Item 4. Controls and Procedures.
Disclosure Controls and Procedures
At the end of the period covered by this Quarterly Report on Form 10-Q for the three months ended September 30, 2011, an evaluation was carried out under the supervision of and with the participation of the Company's management, including the Chief Executive Officer ("CEO") and Chief Financial Officer ("CFO"), of the effectiveness of the design and operation of the Company's disclosure controls and procedures (as defined in Rule 13a-15(e) and Rule 15d-15(e) under the Exchange Act). Based on that evaluation the CEO and the CFO have concluded that as of the end of the period covered by this report, the Company's disclosure controls and procedures are effective in ensuring that: (i) information required to be disclosed by the Company in reports that it files or submits to the SEC under the Exchange Act is recorded, processed, summarized and reported within the time periods specified in applicable rules and forms and (ii) material information required to be disclosed in our reports filed under the Exchange Act is accumulated and communicated to our management, including our CEO and CFO, as appropriate, to allow for accurate and timely decisions regarding required disclosure.
Changes in Internal Control over Financial Reporting
During the period covered by this report, there were no changes to internal control over financial reporting that materially affected or are reasonably likely to materially affect our internal control over financial reporting.
37
PART II - OTHER INFORMATION
Item 1. Legal Proceedings.
On January 27, 2011, the Company was delivered a summons that it is being sued in the state of Nevada by Redcor Drilling, Inc. ("Redcor") for non-payment of the balance of a drilling invoice that is under dispute by the Company. Redcor is demanding the Company pay US$241,477.24 together with interest at the rate of 4% per annum from September 18, 2010. On March 10, 2011, the Company responded to the summons and intends to continue to protest payment of the amount demanded on the basis of non-performance of services. The Company has recorded the full amount as an accrued liability without accruing interest as the amount of the liability can be estimated and it is likely the Company may be required to pay some portion of the disputed amount.
Redcor placed a mechanic's lien on a portion of the Pan project that the Company leases from a third party. Subsequently, the Company posted a surety bond for the disputed amount which released the lien from the property. Discovery has recently been undertaken in the suit and is in an early state; no trial date has been set.
On June 10, 2011, the Company received a check in the amount of US$1,144,929, which the Company subsequently negotiated. The check was accompanied with a letter instructing the Company to apply the funds to the payment of certain specified obligations arising out of the May 5, 2006 agreement between Seymork Investments Limited (“Seymork”) and the Company.
On August, 23, 2011, the Company was served with a summons that it is being sued in the State of Nevada by Seymork and TGC Holdings Ltd. (“TGC”). Among other relief sought, the complaint seeks a court declaration that the foregoing sum delivered to the Company fully satisfies Seymork’s obligations arising from that May 5, 2006 agreement and two notes executed by Seymork and held by the Company. The complaint also seeks the extinguishment of three deeds of trust securing Seymork’s obligations pursuant to the May 5, 2006 agreement and notes held by the Company. The Company responded to the summons and complaint by answer, counterclaims and third party complaint claims denying the claims asserted by Seymork and TGC and seeking affirmative relief from Seymork and its principal and TGC and its parent.
Item 1A. Risk Factors.
There are no material changes from the risk factors previously disclosed in Midway’s Form 10-K filed on March 17, 2011 with the SEC.
Item 2. Unregistered Sale of Equity Securities and Use of Proceeds.
None.
Item 3. Defaults Upon Senior Securities.
None.
Item 4. Reserved
Item 5. Other Matters
Mine Safety and Health Administration Regulations
We consider health, safety and environmental stewardship to be a core value for the Corporation.
Pursuant to Section 1503(a) of the recently enacted Dodd-Frank Wall Street Reform and Consumer Protection Act (The “Dodd-Frank Act”), issuers that are operators, or that have a subsidiary that is an operator, of a coal or other mine in the United States are required to disclose in their periodic reports filed with the SEC information regarding specified health and safety violations, orders and citations, related assessments and legal actions, and mining-related fatalities under the regulation of the Federal Mine Safety and Health Administration (“MSHA”) under the Federal Mine Safety and Health Act of 1977 (the "Mine Act"). During the quarter ended September 30, 2011, our U.S. exploration properties were not subject to regulation by the MSHA under the Mine Act.
38
Item 6. Exhibits.
Documents filed as part of this Quarterly Report on Form 10-Q or incorporated by reference:
|
Exhibit Number
|
Description
|
|
|
3.1
|
Notice of Articles, previously filed with the initial registration statement on Form S-1 filed with the Securities and Exchange Commission on November 6, 2007 and incorporated herein by reference.
|
|
|
3.2
|
Articles, previously filed with the initial registration statement on Form S-1 filed with the Securities and Exchange Commission on November 6, 2007 and incorporated herein by reference.
|
|
|
10.1
|
Sales Agreement dated September 23, 2011, previously filed with the Company’s Current Report on Form 8-K filed with the Securities and Exchange Commission on September 26, 2011 and incorporated herein by reference.
|
|
|
31.1
|
Certification of Chief Executive Officer pursuant to Rule 13a-15(f) of the Exchange Act
|
|
|
31.2
|
Certification of Chief Financial Officer pursuant to Rule 13a-15(f) of the Exchange Act
|
|
|
32
|
Certification of Chief Executive Officer and Chief Financial Officer pursuant to Rule 13a or 15(d) of the Exchange Act and 18 U.S.C. Section 1350, as adopted pursuant to Section 906 of the Sarbanes-Oxley Act of 2002
|
|
|
101.INS
|
XBRL Instance Document
|
|
|
101.SCH
|
XBRL Taxonomy Extension – Schema
|
|
|
101.CAL
|
XBRL Taxonomy Extension – Calculations
|
|
|
101.DEF
|
XBRL Taxonomy Extension – Definitions
|
|
|
101.LAB
|
XBRL Taxonomy Extension – Labels
|
|
|
101.PRE
|
XBRL Taxonomy Extension – Presentation
|
39
SIGNATURES
Pursuant to requirements of the Securities Exchange Act of 1934, the Registrant has duly caused this report to be signed on its behalf by the undersigned thereunto duly authorized.
|
MIDWAY GOLD CORP.
|
|||
|
November 9, 2011
|
By:
|
/s/ Daniel E. Wolfus | |
|
Daniel E. Wolfus
|
|||
|
Chairman, Chief Executive Officer and Director
|
|||
|
(Principal Executive Officer)
|
|||
|
November 9, 2011
|
By:
|
/s/ Fritz K. Schaudies
|
|
|
Fritz K. Schaudies
|
|||
|
Chief Financial Officer
|
|||
|
(Principal Financial and Accounting Officer)
|
|||
40