Attached files
| file | filename |
|---|---|
| 8-K - 8-K - TCF FINANCIAL CORP | a14-18297_18k.htm |
Exhibit 99.1
|
|
TCF Financial Corporation 2014 Second Quarter Investor Presentation |
|
|
Cautionary Statements for Purposes of the Safe Harbor Provisions of the Securities Litigation Reform Act Any statements contained in this investor presentation regarding the outlook for the Company’s businesses and their respective markets, such as projections of future performance, guidance, statements of the Company’s plans and objectives, forecasts of market trends and other matters, are forward-looking statements based on the Company’s assumptions and beliefs. Such statements may be identified by such words or phrases as “will likely result,” “are expected to,” “will continue,” “outlook,” “will benefit,” “is anticipated,” “estimate,” “project,” “management believes” or similar expressions. These forward-looking statements are subject to certain risks and uncertainties that could cause actual results to differ materially from those discussed in such statements and no assurance can be given that the results in any forward-looking statement will be achieved. For these statements, TCF claims the protection of the safe harbor for forward-looking statements contained in the Private Securities Litigation Reform Act of 1995. Any forward-looking statement speaks only as of the date on which it is made, and we disclaim any obligation to subsequently revise any forward-looking statement to reflect events or circumstances after such date or to reflect the occurrence of anticipated or unanticipated events. Certain factors could cause the Company’s future results to differ materially from those expressed or implied in any forward-looking statements contained herein. These factors include the factors discussed in Part I, Item 1A of the Company’s Annual Report on Form 10-K for the year ended December 31, 2013, under the heading “Risk Factors,” the factors discussed below and any other cautionary statements, written or oral, which may be made or referred to in connection with any such forward-looking statements. Since it is not possible to foresee all such factors, these factors should not be considered as complete or exhaustive. Adverse Economic or Business Conditions; Competitive Conditions; Credit and Other Risks. Deterioration in general economic and banking industry conditions, including those arising from government shutdowns, defaults, anticipated defaults or rating agency downgrades of sovereign debt (including debt of the U.S.), or increases in unemployment in TCF’s primary banking markets; adverse economic, business and competitive developments such as shrinking interest margins, reduced demand for financial services and loan and lease products, deposit outflows, deposit account attrition or an inability to increase the number of deposit accounts; customers completing financial transactions without using a bank; adverse changes in credit quality and other risks posed by TCF’s loan, lease, investment and securities available for sale portfolios, including declines in commercial or residential real estate values, changes in the allowance for loan and lease losses dictated by new market conditions or regulatory requirements, or the inability of home equity line borrowers to make increased payments caused by increased interest rates or amortization of principal; deviations from estimates of prepayment rates and fluctuations in interest rates that result in decreases in value of assets such as interest-only strips that arise in connection with TCF’s loan sales activity; interest rate risks resulting from fluctuations in prevailing interest rates or other factors that result in a mismatch between yields earned on TCF’s interest-earning assets and the rates paid on its deposits and borrowings; foreign currency exchange risks; counterparty risk, including the risk of defaults by our counterparties or diminished availability of counterparties who satisfy our credit quality requirements; decreases in demand for the types of equipment that TCF leases or finances; the effect of any negative publicity. Legislative and Regulatory Requirements. New consumer protection and supervisory requirements and regulations, including those resulting from action by the Consumer Financial Protection Bureau and changes in the scope of Federal preemption of state laws that could be applied to national banks and their subsidiaries; the imposition of requirements that adversely impact TCF’s deposit, lending, loan collection and other business activities as a result of the Dodd-Frank Act, or other legislative or regulatory developments such as mortgage foreclosure moratorium laws, regulation of financial institution campus banking programs that could adversely affect the viability of these programs, use by municipalities of eminent domain on underwater mortgages, or imposition of underwriting or other limitations that impact the ability to use certain variable-rate products; changes affecting customer account charges and fee income, including changes to interchange rates; changes to bankruptcy laws which would result in the loss of all or part of TCF’s security interest due to collateral value declines; deficiencies in TCF’s compliance under the Bank Secrecy Act in past or future periods, which may result in (continued) |
|
|
Cautionary Statements for Purposes of the Safe Harbor Provisions of the Securities Litigation Reform Act (continued) regulatory enforcement action including monetary penalties; increased health care costs resulting from Federal health care reform legislation; regulatory criticism and resulting enforcement actions or other adverse consequences such as increased capital requirements, higher deposit insurance assessments or monetary damages or penalties; heightened regulatory practices, requirements or expectations, including, but not limited to, requirements related to the Bank Secrecy Act and anti-money laundering compliance activity. Earnings/Capital Risks and Constraints, Liquidity Risks. Limitations on TCF’s ability to pay dividends or to increase dividends because of financial performance deterioration, regulatory restrictions or limitations; increased deposit insurance premiums, special assessments or other costs related to adverse conditions in the banking industry, the economic impact on banks of the Dodd-Frank Act and other regulatory reform legislation; the impact of financial regulatory reform, including additional capital, leverage, liquidity and risk management requirements or changes in the composition of qualifying regulatory capital (including those resulting from U.S. implementation of Basel III requirements); adverse changes in securities markets directly or indirectly affecting TCF’s ability to sell assets or to fund its operations; diminished unsecured borrowing capacity resulting from TCF credit rating downgrades and unfavorable conditions in the credit markets that restrict or limit various funding sources; costs associated with new regulatory requirements or interpretive guidance relating to liquidity; regulatory actions or changes in customer opt-in preferences with respect to overdraft, which may have an adverse impact on TCF’s fee revenue; uncertainties relating to future retail deposit account changes, including limitations on TCF’s ability to predict customer behavior and the impact on TCF’s fee revenues. Branching Risk; Growth Risks. Adverse developments affecting TCF’s supermarket banking relationships or any of the supermarket chains in which TCF maintains supermarket branches; costs related to closing underperforming branches; slower than anticipated growth in existing or acquired businesses; inability to successfully execute on TCF’s growth strategy through acquisitions or cross-selling opportunities; failure to expand or diversify TCF’s balance sheet through programs or new opportunities; failure to successfully attract and retain new customers, including the failure to attract and retain manufacturers and dealers to expand the inventory finance business; failure to effectuate, and risks of claims related to, sales and securitizations of loans; risks related to new product additions and addition of distribution channels (or entry into new markets) for existing products. Technological and Operational Matters. Technological or operational difficulties, loss or theft of information, cyber-attacks and other security breaches, counterparty failures and the possibility that deposit account losses (fraudulent checks, etc.) may increase; failure to keep pace with technological change. Litigation Risks. Results of litigation, including class action litigation concerning TCF’s lending or deposit activities including account servicing processes or fees or charges, or employment practices; the effect of interchange rate litigation against the Federal Reserve on debit card interchange fees; and possible increases in indemnification obligations for certain litigation against Visa U.S.A. and potential reductions in card revenues resulting from such litigation or other litigation against Visa. Accounting, Audit, Tax and Insurance Matters. Changes in accounting standards or interpretations of existing standards; federal or state monetary, fiscal or tax policies, including adoption of state legislation that would increase state taxes; ineffective internal controls; adverse federal, state or foreign tax assessments or findings in tax audits; lack of or inadequate insurance coverage for claims against TCF; potential for claims and legal action related to TCF’s fiduciary responsibilities. |
|
|
$18.8 billion national bank holding company headquartered in Minnesota 41st largest publicly-traded U.S. based bank holding company by asset size1 380 bank branches in eight states Over 147,000 small business banking relationships: 78,000 checking accounts 69,000 lending relationships 85% of total assets are loans & leases Tangible common equity to tangible assets of 8.39%2 Tangible book value per common share of $9.352 Return on average tangible common equity of 12.72%3 At June 30, 2014 Well-Diversified Earning Asset Portfolio ($ millions) 1 Source: SNL Financial (3/31/14) 2 See “Reconciliation of GAAP to Non-GAAP Financial Measures – Tangible Common Equity and Tangible Book Value Per Common Share” slide 3 QTD annualized; see “Reconciliation of GAAP to Non-GAAP Financial Measures – Return on Average Tangible Common Equity” slide Leasing & Equipment Finance 21% Inventory Finance 11% Consumer Real Estate and Other 35% Commercial Lending 18% Auto Finance 9% Low Cost Deposit Base Savings 38% Money Market 8% CD’s 20% Checking 34% Securities & Other 6% ($ millions) A Diversified Asset Portfolio Funded by a Low-Cost Deposit Base |
|
|
As a % of average assets: Net interest income 4.34% 2.98% Non-interest income 2.21% 1.09% Revenue 6.55% 4.07% Pre-tax pre-provision profit4 1.96% 1.56% Return on average assets 1.09% .98% Net interest margin 4.66% 3.38% Yield on loans and leases 5.10% 4.51% Yield on securities 2.71% 2.59% Rate on deposits .23% .32% Average balances as a % of average assets: Loans and leases 86.3% 64.6% Deposits 78.0% 75.0% Borrowings 8.5% 12.5% Equity 10.7% 11.5% Tangible common equity as a % of tangible assets5: 8.39% 8.67% TCF YTD 2Q141 Peer Group1,2,3 1Q14 Average TCF has a higher margin because it has more loans and higher yielding loan and security portfolios than peers, along with lower rates on deposits TCF has more fee income, as a percentage of average assets, due to a large and diversified base of revenue sources 1 Annualized, on a tax equivalent basis 2 All U.S. publicly-traded banks and thrifts, excluding TCF, with total assets between $10 and $50 billion (source: SNL Financial LC; 3/31/2014) 3 Excluding non-recurring items for non-interest income, revenue and pre-tax pre-provision profit, see “Reconciliation of GAAP to Non-GAAP Financial Measures – Revenue Ratios” slide 4 Pre-tax pre-provision profit is calculated as total revenues less non-interest expense 5 See “Reconciliation of GAAP to Non-GAAP Financial Measures – Tangible Common Equity as a Percentage of Tangible Assets” slide Well-positioned in the Banking Industry |

|
|
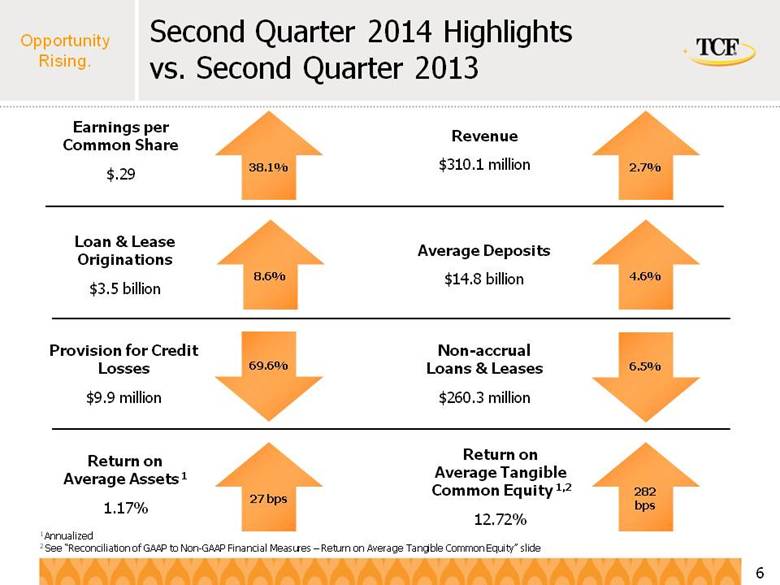
Second Quarter 2014 Highlights vs. Second Quarter 2013 38.1% Earnings per Common Share $.29 Revenue $310.1 million 2.7% 69.6% Non-accrual Loans & Leases $260.3 million 6.5% 8.6% Loan & Lease Originations $3.5 billion Average Deposits $14.8 billion 4.6% Provision for Credit Losses $9.9 million Return on Average Assets 1 1.17% 27 bps Return on Average Tangible Common Equity 1,2 12.72% 282 bps 1 Annualized 2 See “Reconciliation of GAAP to Non-GAAP Financial Measures – Return on Average Tangible Common Equity” slide |
|
|
Second Quarter 2014 Highlights – Revenue 1 ($ millions) 2Q14 revenue impacted by: Decreased volume of loan sales generating lower gains on sale Increased banking fee income due to seasonality Growth in servicing fee income 2Q14 net interest margin impacted by: Higher average balances in higher yielding businesses, offset by Competitive yield pressure Loan & Lease Yields1 2Q13 1Q14 2Q14 Consumer Real Estate 5.58 % 5.41 % 5.46 % Auto Finance 4.97 4.52 4.43 Commercial 4.76 4.63 4.57 Leasing & Equipment Finance 4.94 4.75 4.72 Inventory Finance 5.96 5.98 5.93 Total Loans and Leases 5.29 5.11 5.10 Peer Group2 Average 4.79 4.51 N.A. 1 Annualized 2 All U.S. publicly-traded banks and thrifts, excluding TCF, with total assets between $10 and $50 billion (source: SNL Financial LC; 3/31/2014) N.A. Not available Total Revenue Non-interest Income – 2Q14 $104 million |

|
|
Improving Credit Performance ($ millions) 60+ Day Delinquencies1 1 Excludes acquired portfolios and non-accrual loans 2 Annualized 3 Loans and leases that management has concerns regarding the ability of the borrowers to meet existing loan or lease terms and conditions, but may never become non-performing or result in a loss Classified Assets3 Non-Performing Assets ($ millions) Provision for Loan Losses ($ millions) |
|
|
Industry Net Charge-off (%) TCF’s average net charge-off percent since 2004 was 47 bps lower than FDIC-insured institutions with over $10 billion in total assets 2004-2014 Average FDIC Institutions: 1.27% TCF: .80% 1 Source: FDIC Quarterly Banking Profile; 2004-1Q14 2 Annualized 1 2 |

|
|
Foreclosed Real Estate and Other Credit Costs Actively Manage Expense Base Continued expense optimization expected to be achieved by: Asset growth across the businesses Branch consolidation completed during the first quarter of 2014 Reduction in foreclosed real estate and other credit costs as property values continue to increase and overall credit improves Total expense base supports growth in the serviced portfolio as well as total assets on the balance sheet ($ millions) Other (including FDIC Insurance Premiums, Deposit Premiums & Marketing, and Occupancy & Equipment) Compensation & Benefits % of Total Avg Assets & Serviced Portfolio1: 4.26% 4.38% 4.18% 4.21% 1 Annualized Total Avg Assets & Serviced Portfolio: $19,825 $19,945 $20,135 $20,799 $21,467 3.97% |
|
|
Annualized loan and lease growth of 12% during 2Q14 even with $460 million in loan sales Multiple business segments give TCF options to strategically invest capital in light of competitive environments Average total deposits, TCF’s primary funding source for asset growth, have increased for fifteen consecutive quarters Low-cost deposit base with an average rate of .23% for YTD 2Q14 Seasonal increase in customer transaction activity from first quarter Asset Growth Funded by Deposits ($ millions) 12/13 6/14 Change from 12/13 Cash and Investments $ 1,009 $ 967 (4.2) % Securities and Loans HFS 651 948 45.7 Consumer real estate and Other 6,366 6,048 (5.0) Commercial 3,148 3,093 (1.7) Leasing and equipment finance 3,429 3,526 2.8 Inventory finance 1,664 1,881 13.0 Auto finance 1,240 1,503 21.2 Total loans and leases 15,847 16,051 1.3 All other assets 873 872 (0.1) Total assets $ 18,380 $ 18,838 2.5 Checking $ 4,981 $ 5,121 2.8 Savings 6,194 5,686 (8.2) Money market 832 1,284 54.4 Certificates of deposit 2,426 2,955 21.8 Total deposits 14,433 15,046 4.2 Borrowings 1,488 1,230 (17.4) Other liabilities 494 490 (0.8) Equity 1,965 2,072 5.4 Total liabilities and equity $ 18,380 $ 18,838 2.5 |
|
|
Loan sales have been a core competency since 4Q11 Provide flexibility to the organization: Product and geographic concentration Capital and liquidity Additional revenue source Loan and Lease Sales ($ millions) 5% 10% 8% 4% 10% 5% 12% 9% Gains on Sales of Consumer Real Estate Loans: Gains on Sales of Auto Loans: $4.1 $8.1 $7.1 $7.3 $8.8 $7.4 $4.2 $5.3 $11.7 $8.1 |
|
|
Managed Portfolio ($ millions) Serviced portfolio includes primarily consumer real estate and auto loans sold with servicing rights retained by TCF Serviced portfolio contributes to revenue through servicing fees and gains on sales of loans Loan servicing income of $4.9 million in 2Q14 $459.9 million of loan sales in 2Q14 for a gain of $15.6 million Serviced Portfolio for Others $2.6 billion Portfolio Loans and Leases & Loans Held for Sale1 $16.5 billion 1 Includes operating leases |
|
|
Indirect auto finance company headquartered in Anaheim, CA Originates and services used and new retail auto loans acquired from franchised and independent dealers across the country Experienced management team Nearly 9,400 active dealer relationships Originating loans to consumers in all 50 states Loan sales of $220.2 million in 2Q14 resulting in gains of $7.4 million At June 30, 2014 1 Includes $25 million serviced portfolio for others 2 Annualized (Balances in $ millions) Total Originations: $460 $528 $534 $610 $708 Retail Businesses 55% fixed-rate, 45% variable-rate Yields2: 5.72% fixed-rate, 5.14% variable-rate Average FICO score of the retail lending operation: At origination – 731; updated 2Q14 – 729 Loan sales of $224.2 million in 2Q14 resulting in gains of $8.1 million Total HELOC balance of $2.2 billion with only 9.5% reaching maturity or draw period end prior to 2021 $1,792 $2,805 $2,343 $2,632 $2,051 |
|
|
Retail Businesses Other 20% 5.46% quarterly average yield1 Over 60-day delinquency rate of .40%2 Net charge-offs: 2012 2013 YTD 2Q141 2.65% 1.38% .78% 44% of loan balances originated since January 1, 2009, with 2Q14 net charge-offs of .07%1 Auto $1.5 billion (9% of total loans and leases) Consumer Real Estate $6.0 billion (38% of total loans and leases) 4.43% quarterly average yield1 Over 60-day delinquency rate of .14%2 Net charge-offs: 2012 2013 YTD 2Q141 .38% .52% .58% Sell lower FICO score loans, but retain servicing of loans sold 1 Annualized 2 Excludes non-accrual loans and acquired loans At June 30, 2014 |

|
|
(Balances in $ millions) 47% fixed-rate, 53% variable-rate CRE location mix: 90% located in TCF banking markets, 10% outside Continue to look for strategic expansion opportunities that fit TCF’s profile 1 Includes operating leases of $85.7 million at June 30, 2014 2 Source: The Monitor, 2013 Monitor Bank 50 3 Source: The Monitor, 2013 Monitor 100 15th largest bank-affiliated leasing company2 and 30th largest equipment finance/leasing company3 in the U.S. 398 employees Uninstalled backlog of $491.6 million Experienced management team Operates in the U.S. and Canada 236 employees 100% variable-rate receivables Wholesale Businesses At June 30, 2014 |
|
|
Wholesale Businesses Const. 12% Other 20% PowerSports 49% Leasing & Equipment Finance $3.5 billion (22% of total loans and leases) 4.57% quarterly average yield1 Over 60-day delinquency rate of .00%2 Net charge-offs: 2012 2013 YTD 2Q141 1.12% .80% .32% Working to maintain relationships with current customers, while selectively choosing loans based on price and risk Commercial Banking $3.1 billion (19% of total loans and leases) Inventory Finance $1.9 billion (12% of total loans and leases) 4.72% quarterly average yield1 Over 60-day delinquency rate of .08%2 Net charge-offs: 2012 2013 YTD 2Q141 .32% .10% .10% 2Q14 fee revenue of $23.4 million, 22.63% of total fees and other revenue 5.93% quarterly average yield1 Over 60-day delinquency rate of .01%2 Net charge-offs: 2012 2013 YTD 2Q141 .10% .04% .00% Credit risk spread across more than 9,500 active dealers 1 Annualized 2 Excludes non-accrual loans and acquired loans At June 30, 2014 |

|
|
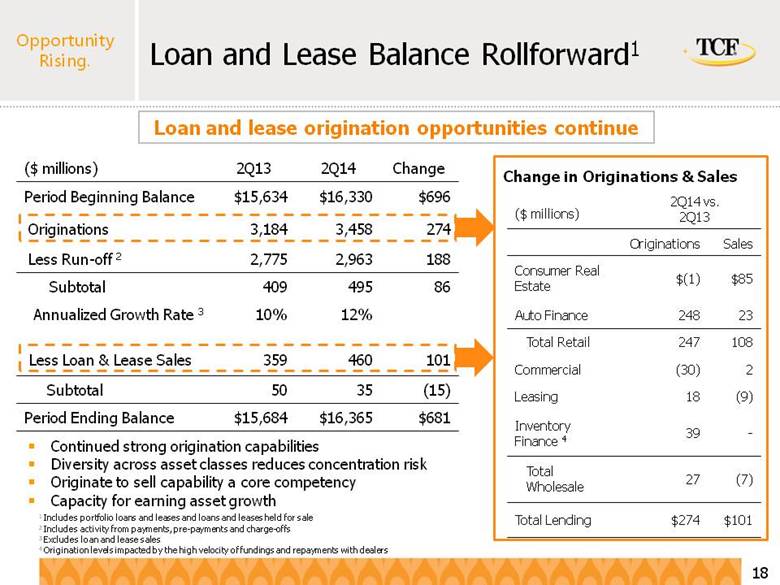
($ millions) 2Q13 2Q14 Change Period Beginning Balance $15,634 $16,330 $696 Originations 3,184 3,458 274 Less Run-off 2 2,775 2,963 188 Subtotal 409 495 86 Annualized Growth Rate 3 10% 12% Less Loan & Lease Sales 359 460 101 Subtotal 50 35 (15) Period Ending Balance $15,684 $16,365 $681 2Q14 vs. 2Q13 Originations Sales Consumer Real Estate $(1) $85 Auto Finance 248 23 Total Retail 247 108 Commercial (30) 2 Leasing 18 (9) Inventory Finance 4 39 - Total Wholesale 27 (7) Total Lending $274 $101 Change in Originations & Sales 1 Includes portfolio loans and leases and loans and leases held for sale 2 Includes activity from payments, pre-payments and charge-offs 3 Excludes loan and lease sales 4 Origination levels impacted by the high velocity of fundings and repayments with dealers Continued strong origination capabilities Diversity across asset classes reduces concentration risk Originate to sell capability a core competency Capacity for earning asset growth Loan and lease origination opportunities continue Loan and Lease Balance Rollforward1 ($ millions) |
|
|
Well-positioned for a Rising Interest Rate Environment Diversification of the loan and lease portfolio among the five businesses positions TCF to benefit in a rising rate environment 77% of assets are variable/adjustable rate or short/medium duration fixed rate Estimated weighted average life1: Auto portfolio: 25 months Auto Finance new originations: 27 months Leasing and Equipment Finance portfolio: 19 months Leasing and Equipment Finance new originations: 24 months 71% of deposits are low or no interest cost with an average balance of $10.4 billion and an average cost of 7 bps for the second quarter of 2014 1 Weighted average life represents how many months it will take to collect half of the outstanding principal |
|
|
1 See “Reconciliation of GAAP to Non-GAAP Financial Measures – Tangible Common Equity and Tangible Book Value Per Common Share” slide 2 See “Reconciliation of GAAP to Non-GAAP Financial Measures – Tier 1 Common Capital Ratio” slide Capital 2Q13 1Q14 2Q14 Tangible common equity1 7.67% 8.13% 8.39% Tier 1 common capital2 9.41% 9.59% 9.82% Tier 1 leverage capital 9.34% 9.84% 9.91% Tier 1 risk-based capital2 11.27% 11.37% 11.56% Total risk-based capital 13.53% 13.41% 13.59% Capital Ratios (TCF Financial Corporation) Capital ratios continue to improve as capital accumulates through earnings Common stock dividend of 5 cents per share declared on July 21, 2014 |
|
|
1 See “Reconciliation of GAAP to Non-GAAP Financial Measures – Tangible Common Equity and Tangible Book Value Per Common Share” slide 2 Annualized 3 Calculated as the change in year-to-date tier 1 common capital as a percentage of prior period tier 1 common capital 4 See “Reconciliation of GAAP to Non-GAAP Financial Measures – Return on Average Tangible Common Equity” slide Summary 2Q13 1Q14 2Q14 Tangible book value per common share1 $8.47 $9.06 $9.35 Year-over-year loan and lease growth rate 2.26% 3.86% 3.02% Capital accumulation rate2,3 8.60% 11.12% 12.17% Return on average assets2 .90% 1.00% 1.17% Return on average common equity2 8.39% 9.35% 10.99% Return on average tangible common equity2,4 9.90% 10.89% 12.72% Loan and lease growth due to unique loan and lease capabilities Capital accumulation rate supports loan origination capabilities Positive profitability trends over past several quarters |
|
|
Appendix |
|
|
Loan and Lease Diversification Business Unit Consumer Commercial Leasing and Equipment Finance Inventory Finance Auto Finance Type / Segment Consumer Real Estate Multi-family housing Retail services Office buildings Warehouse / Industrial buildings Specialty vehicles Manufacturing Medical Construction PowerSports Lawn & Garden Electronics & Appliances Primarily used autos Geography Local1 National Local1 National National Canada National Rate Fixed-rate Variable-rate Fixed-rate Variable/adjustable-rate Fixed-rate Variable-rate Fixed-rate Average Loan & Lease Size First Mortgages: $110,000 Junior Liens: $42,000 $1.9 million $71,000 $198,000 $18,000 Estimated Weighted Average Life2 70 months 33 months 19 months 4 months 25 months Collateral Real estate Real estate All assets Equipment Inventory Vehicle TCF maintains a well-diversified loan and lease portfolio 1 TCF’s branch footprint (MN, IL, MI, CO, WI, IN, AZ, SD) 2 As of June 30, 2014; weighted average life represents how many months it will take to pay half of the outstanding principal |

|
|
Loan and Lease Geographic Diversification Minnesota $ 2,092.3 $ 838.1 $ 97.9 $ 53.3 $ 29.0 $ 9.7 $ 3,120.3 Illinois 1,713.1 591.6 119.5 50.4 77.4 6.2 2,558.2 California 473.2 35.5 501.2 62.5 277.2 - 1,349.6 Michigan 593.2 495.9 143.3 56.9 29.2 2.6 1,321.1 Wisconsin 336.3 556.6 64.4 51.1 13.5 1.3 1,023.2 Colorado 432.5 163.4 58.3 18.8 30.9 3.9 707.8 Texas - 23.9 310.6 149.2 90.2 .1 574.0 Canada - - 1.5 475.2 - - 476.7 Florida 4.5 47.2 152.0 84.7 79.2 .1 367.7 New York 2.6 - 180.5 57.0 59.7 .1 299.9 Pennsylvania 15.7 - 147.0 57.4 59.7 - 279.8 Ohio 5.9 44.0 129.3 55.9 28.0 - 263.1 Arizona 59.3 38.6 77.1 14.0 49.7 .3 239.0 North Carolina .2 7.9 129.8 45.0 53.4 - 236.3 Other1 294.3 250.5 1,413.9 649.3 625.8 - 3,233.8 Total $6,023.1 $3,093.2 $ 3,526.3 $ 1,880.7 $ 1,502.9 $ 24.3 $ 16,050.5 ($ millions) At June 30, 2014 Consumer Real Estate Commercial Real Estate and Commercial Business Leasing and Equipment Finance Inventory Finance Auto Finance Other Total 1 Individual states with less than $225 million in total |
|
|
Commercial Lending – Risk Rating Trends The weighted average risk rating of the portfolio is improving as loans continue to be upgraded, fewer loans being downgraded and existing problem loans being worked out. Risk Rating Distribution Dec 31, 2012 Dec 31, 2013 June 30, 2014 Risk Rating Regulatory Classification Balance ($000) Pct Total Balance ($000) Pct Total Balance ($000) Pct Total Non-classified 1 Pass - 0.0% - 0.0% - 0.0% 2 Pass 136,550 4.0% 139,127 4.4% 114,856 3.7% 3 Pass 850,431 25.0% 85.1% 850,620 27.0% 92.1% 845,348 27.3% 94.9% 4 Pass 1,611,759 47.4% 1,552,586 49.4% 1,552,217 50.2% 5 Pass 296,765 8.7% 354,594 11.3% 424,306 13.7% 6 Special Mention 153,623 4.5% 53,016 1.7% 29,427 1.0% Classified 7 Substandard 352,538 10.4% 14.9% 196,403 6.2% 7.9% 125,235 4.1% 5.1% 8 Doubtful 735 0.0% 432 0.0% 450 0.0% Total 3,402,401 100% 3,146,778 100% 3,091,839 100% Wtd Avg Risk Rating 4.16 3.98 3.93 |
|
|
1 When evaluating capital adequacy and utilization, management considers financial measures such as Tangible Common Equity to Tangible Assets. These measures are non-GAAP financial measures and are viewed by management as useful indicators of capital levels available to withstand unexpected market or economic conditions, and also provide investors, regulators, and other users with information to be viewed in relation to other banking institutions. ($000s, except shares outstanding) Reconciliation of GAAP to Non-GAAP Financial Measures – Tangible Common Equity and Tangible Book Value Per Common Share1 June 30, 2013 March 31, 2014 June 30, 2014 Computation of tangible common equity to tangible assets Total equity $ 1,906,181 $ 2,021,825 $ 2,071,711 Less: Non-controlling interest in subsidiaries 16,662 21,284 16,805 Total TCF stockholders’ equity 1,889,519 2,000,541 2,054,906 Less: Preferred stock 263,240 263,240 263,240 Goodwill 225,640 225,640 225,640 Other intangibles 7,345 5,905 5,483 Tangible common equity $ 1,393,294 $ 1,505,756 $ 1,560,543 Total assets $ 18,399,607 $ 18,760,527 $ 18,837,777 Less: Goodwill 225,640 225,640 225,640 Other intangibles 7,345 5,905 5,483 Tangible assets $ 18,166,622 $ 18,528,982 $ 18,606,654 Tangible common equity to tangible assets 7.67% 8.13% 8.39% Common stock shares outstanding 164,411,103 166,127,670 166,881,460 Tangible book value per common share $8.47 $9.06 $9.35 |
|
|
1 When evaluating asset utilization, management considers measures related to revenue that adjust for certain operating items. These measures are non-GAAP financial measures and are viewed by management as useful indicators of TCF’s ability to generate returns to cover potential credit losses. 2 Annualized 3 All U.S. publicly-traded banks and thrifts, excluding TCF, with total assets between $10 and $50 billion (source: SNL Financial LC; 3/31/2014) Reconciliation of GAAP to Non-GAAP Financial Measures – Revenue Ratios1 ($000s) Peer Group Total Assets 1Q14 Avg2,3 % of Total Avg Assets Computation of non-interest income: Total non-interest income $ 227,068 1.10% Less: Non-recurring revenue 3,176 Non-interest income excluding non-recurring items $ 223,892 1.09% Computation of revenue: Total revenue $ 840,976 4.08% Less: Non-recurring revenue 3,176 Revenue excluding non-recurring items $ 837,800 4.07% Computation of non-interest expense: Total non-interest expense $ 522,216 Less: Non-recurring expense 6,448 Non-interest expense excluding non-recurring items $ 515,768 Computation of pre-tax pre-provision profit: Revenue $ 840,976 Less: Non-recurring revenue 3,176 Non-interest expense excluding non-recurring items 515,768 Pre-tax pre-provision profit excluding non-recurring items $ 322,032 1.56% Total Average Assets $ 20,587,012 |
|
|
1 When evaluating capital adequacy and utilization, management considers financial measures such as Tangible Common Equity to Tangible Assets. These measures are non-GAAP financial measures and are viewed by management as useful indicators of capital levels available to withstand unexpected market or economic conditions, and also provide investors, regulators, and other users with information to be viewed in relation to other banking institutions. 2 All U.S. publicly-traded banks and thrifts, excluding TCF, with total assets between $10 and $50 billion (source: SNL Financial LC; 3/31/2014) ($000s) Reconciliation of GAAP to Non-GAAP Financial Measures – Tangible Common Equity as a Percentage of Tangible Assets1 TCF Peer Group2 Avg. June 30, 2014 March 31, 2014 Computation of tangible common equity to tangible assets Total equity $ 2,071,711 $ 2,388,676 Less: Non-controlling interest in subsidiaries 16,805 34,981 Total stockholders’ equity 2,054,906 2,353,695 Less: Preferred stock 263,240 64,004 Total intangible assets 231,123 520,139 Tangible common equity $ 1,560,543 $ 1,769,552 Total assets $ 18,837,777 $ 20,920,002 Less: Total intangible assets 231,123 520,139 Tangible assets $ 18,606,654 $ 20,399,863 Tangible common equity to tangible assets 8.39% 8.67% |

|
|
1 When evaluating capital adequacy and utilization, management considers financial measures such as Return on Average Tangible Common Equity. This measure is a non-GAAP financial measure and is viewed by management as a useful indicator of capital levels available to withstand unexpected market or economic conditions, and also provide investors, regulators, and other users with information to be viewed in relation to other banking institutions. Reconciliation of GAAP to Non-GAAP Financial Measures – Return on Average Tangible Common Equity1 ($000s) QTD June 30, 2013 QTD March 31, 2014 QTD June 30, 2014 Computation of return on average tangible common equity: Net income available to common shareholders $ 34,057 $ 39,910 $ 48,278 Other intangibles amortization, net of tax 328 265 264 Adjusted net income available to common shareholders 34,385 40,175 48,542 Average balances: Total equity $ 1,906,437 $ 1,986,834 $ 2,041,925 Less: Non-controlling interest in subsidiaries 20,299 15,570 21,110 Total TCF Financial Corporation stockholders’ equity 1,886,138 1,971,264 2,020,815 Less: Preferred stock 263,240 263,240 263,240 Goodwill 225,640 225,640 225,640 Other intangibles 7,633 6,134 5,711 Tangible average common equity $ 1,389,625 $ 1,476,250 $ 1,526,224 Annualized return on average tangible common equity 9.90 % 10.89 % 12.72 % |
|
|
($000s) 1 When evaluating capital adequacy and utilization, management considers financial measures such as the Tier 1 Common Capital Ratio. These measures are non-GAAP financial measures and are viewed by management as useful indicators of capital levels available to withstand unexpected market or economic conditions, and also provide investors, regulators, and other users with information to be viewed in relation to other banking institutions. Reconciliation of GAAP to Non-GAAP Financial Measures – Tier 1 Common Capital Ratio1 June 30, 2013 March 31, 2014 June 30, 2014 Tier 1 risk-based capital ratio: Tier 1 capital $ 1,695,092 $ 1,814,561 $ 1,859,271 Total risk-weighted assets $ 15,038,256 $ 15,959,457 $ 16,085,019 Tier 1 risk-based capital ratio 11.27 % 11.37 % 11.56 % Computation of Tier 1 common capital ratio: Tier 1 capital $ 1,695,092 $ 1,814,561 $ 1,859,271 Less: Preferred stock 263,240 263,240 263,240 Qualifying non-controlling interest in subsidiaries 16,662 21,284 16,805 Tier 1 common capital 1,415,190 1,530,037 1,579,226 Tier 1 common capital ratio 9.41 % 9.59 % 9.82 % |