Attached files
| file | filename |
|---|---|
| 8-K - FORM 8-K - RAIT Financial Trust | d729540d8k.htm |
| Exhibit 99.1
|

Investor Presentation
May 2014
Cira Centre, 2929 Arch Street, 17th Floor, Philadelphia, PA 19104 | 215.243.9000 | rait.com
|
|
Forward Looking Statements, Non- GAAP Financial Measures & Securities Offering Disclaimers
This document and the related presentation may contain forward-looking statements within the meaning of the Private Securities Litigation Reform Act of 1995. These forward-looking statements include, but are not limited to, statements about RAIT Financial Trust’s (“RAIT”) plans, objectives, expectations and intentions with respect to future operations, projected dividends, projected cash available for distribution (“CAD”), projected net income and other statements that are not historical facts. Forward-looking statements are sometimes identified by the words “may”, “will”, “should”, “potential”, “predict”, “continue”, “project”, “guide”, or other similar words or expressions. These forward-looking statements are based upon the current beliefs and expectations of RAIT's management and are inherently subject to significant business, economic and competitive uncertainties and contingencies, many of which are difficult to predict and generally not within RAIT’s control. In addition, these forward-looking statements are subject to assumptions with respect to future business strategies and decisions that are subject to change. RAIT does not guarantee that the assumptions underlying such forward looking statements are free from errors. Actual results may differ materially from the anticipated results discussed in these forward-looking statements.
The following factors, among others, could cause actual results to differ materially from the anticipated results or other expectations expressed in the forward-looking statements: our future CAD, net income and our ability to realize the projections related thereto and the underlying assumptions and the risk factors and other disclosure contained in filings by RAIT with the Securities and Exchange Commission (“SEC”), including, without limitation, RAIT’s most recent annual and quarterly reports filed with SEC. RAIT’s SEC filings are available on RAIT’s website at www.rait.com.
You are cautioned not to place undue reliance on these forward-looking statements, which speak only as of the date of this presentation. All subsequent written and oral forward-looking statements attributable to RAIT or any person acting on its behalf are expressly qualified in their entirety by the cautionary statements contained or referred to in this document and the related presentation. Except to the extent required by applicable law or regulation, RAIT undertakes no obligation to update these forward-looking statements to reflect events or circumstances after the date of this presentation or to reflect the occurrence of unanticipated events.
This document and the related presentation may contain non-U.S. generally accepted accounting principles (“GAAP”) financial measures. A reconciliation of these non-GAAP financial measures to the most directly comparable GAAP financial measure is included in this document and/or RAIT’s most recent annual and quarterly reports.
This presentation is for informational purposes only and does not constitute an offer to sell or a solicitation of an offer to buy any securities of RAIT or Independence Realty Trust, Inc. (“IRT”) , a RAIT consolidated and managed multifamily equity REIT.
2
|
|
About RAIT
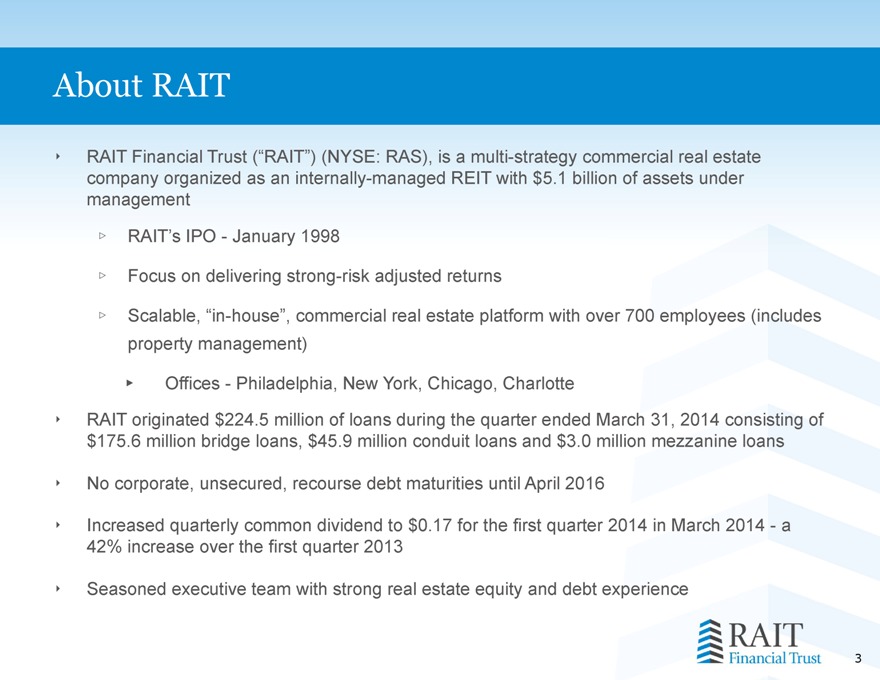
RAIT Financial Trust (“RAIT”) (NYSE: RAS), is a multi-strategy commercial real estate company organized as an internally-managed REIT with $5.1 billion of assets under management
RAIT’s IPO - January 1998
Focus on delivering strong-risk adjusted returns
Scalable, “in-house”, commercial real estate platform with over 700 employees (includes property management)
Offices - Philadelphia, New York, Chicago, Charlotte
RAIT originated $224.5 million of loans during the quarter ended March 31, 2014 consisting of $175.6 million bridge loans, $45.9 million conduit loans and $3.0 million mezzanine loans
No corporate, unsecured, recourse debt maturities until April 2016
Increased quarterly common dividend to $0.17 for the first quarter 2014 in March 2014 - a 42% increase over the first quarter 2013
Seasoned executive team with strong real estate equity and debt experience
3
|
|
Multi-Strategy Business Approach
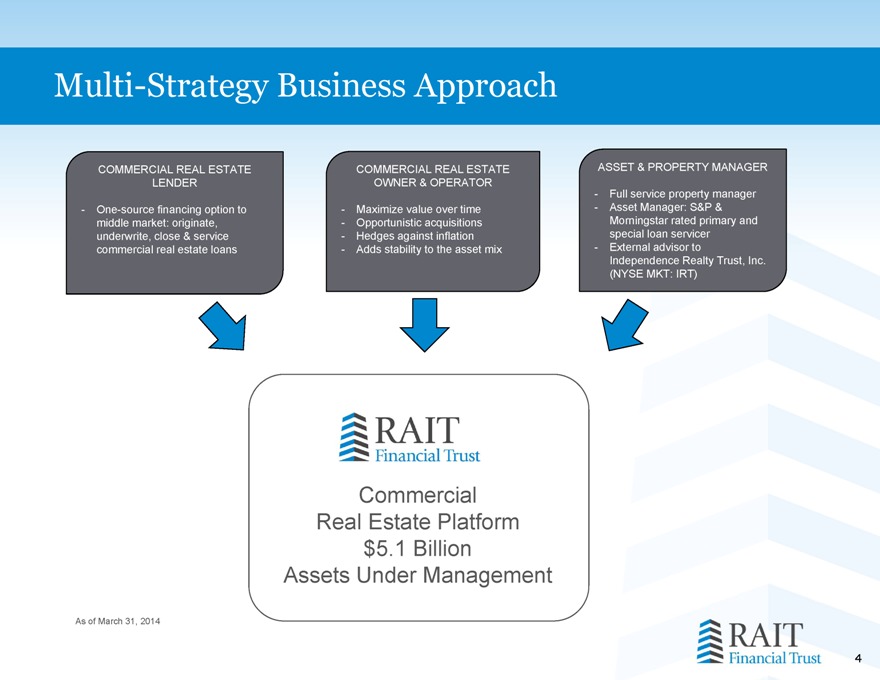
COMMERCIAL REAL ESTATE LENDER
- One-source financing option to middle market: originate, underwrite, close & service commercial real estate loans
COMMERCIAL REAL ESTATE OWNER & OPERATOR
- Maximize value over time
- Opportunistic acquisitions
- Hedges against inflation
- Adds stability to the asset mix
ASSET & PROPERTY MANAGER
- Full service property manager
- Asset Manager: S&P & Morningstar rated primary and special loan servicer
- External advisor to
Independence Realty Trust, Inc. (NYSE MKT: IRT)
Commercial Real Estate Platform
$5.1 Billion Assets Under Management
As of March 31, 2014
4
|
|
Commercial Real Estate Lender
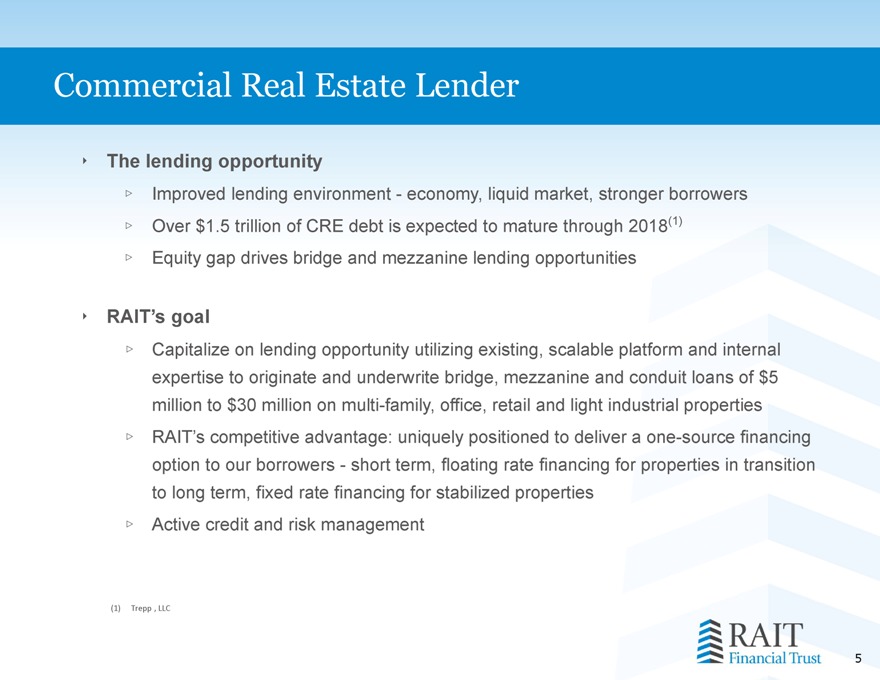
The lending opportunity
Improved lending environment - economy, liquid market, stronger borrowers
Over $1.5 trillion of CRE debt is expected to mature through 2018(1)
Equity gap drives bridge and mezzanine lending opportunities
RAIT’s goal
Capitalize on lending opportunity utilizing existing, scalable platform and internal expertise to originate and underwrite bridge, mezzanine and conduit loans of $5 million to $30 million on multi-family, office, retail and light industrial properties
RAIT’s competitive advantage: uniquely positioned to deliver a one-source financing option to our borrowers - short term, floating rate financing for properties in transition to long term, fixed rate financing for stabilized properties
Active credit and risk management
(1) Trepp , LLC
5
|
|
Commercial Real Estate Lender
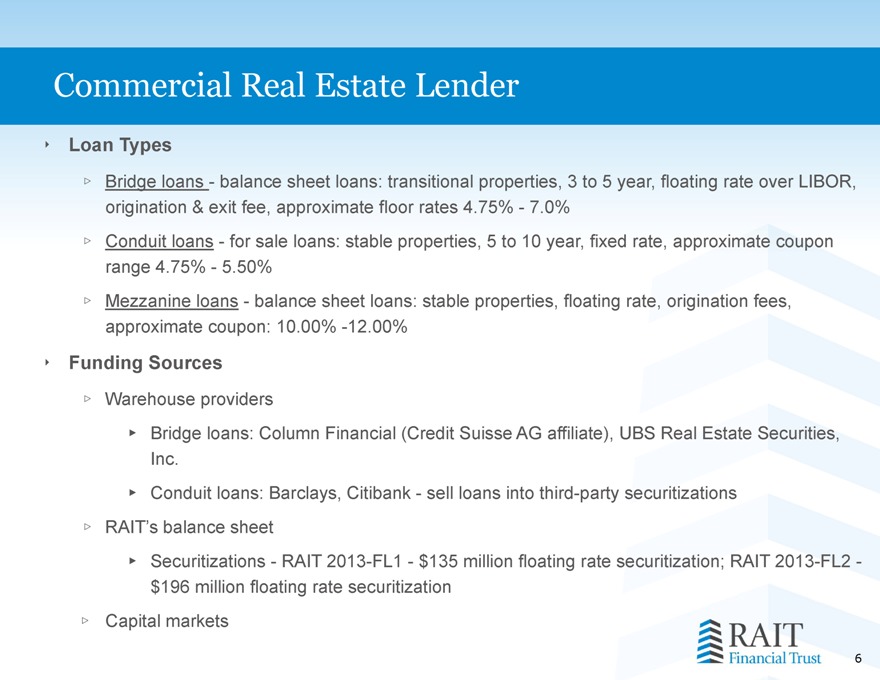
Loan Types
Bridge loans - balance sheet loans: transitional properties, 3 to 5 year, floating rate over LIBOR, origination & exit fee, approximate floor rates 4.75% - 7.0%
Conduit loans - for sale loans: stable properties, 5 to 10 year, fixed rate, approximate coupon range 4.75% - 5.50%
Mezzanine loans - balance sheet loans: stable properties, floating rate, origination fees, approximate coupon: 10.00% -12.00%
Funding Sources
Warehouse providers
Bridge loans: Column Financial (Credit Suisse AG affiliate), UBS Real Estate Securities, Inc.
Conduit loans: Barclays, Citibank - sell loans into third-party securitizations
RAIT’s balance sheet
Securitizations - RAIT 2013-FL1 - $135 million floating rate securitization; RAIT 2013-FL2 -$196 million floating rate securitization
Capital markets
6
|
|
Commercial Real Estate Lender
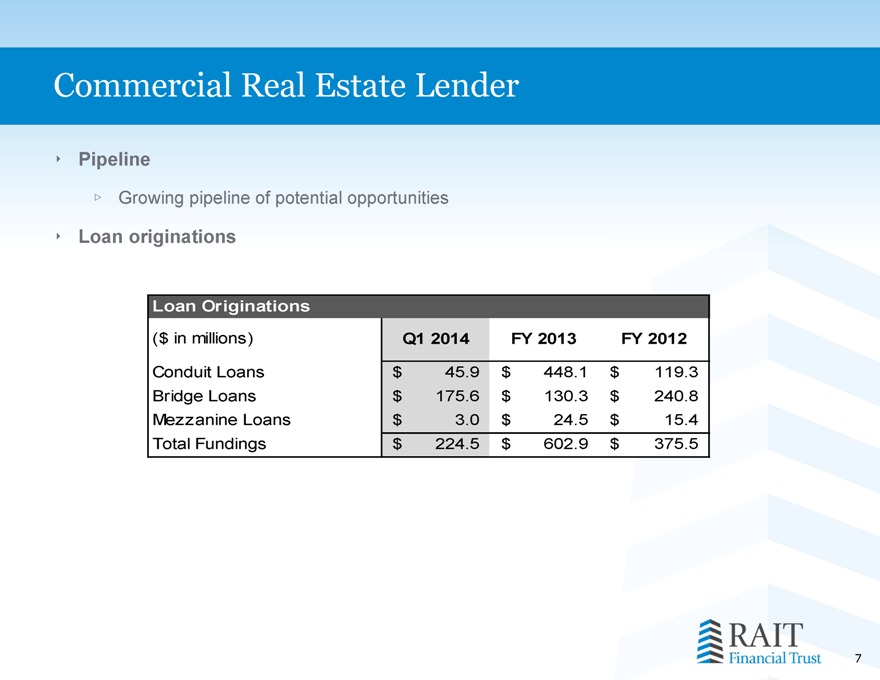
Pipeline
Growing pipeline of potential opportunities
Loan originations
Loan Originations
($ in millions) Q1 2014 FY 2013 FY 2012
Conduit Loans $ 45.9 $ 448.1 $ 119.3 Bridge Loans $ 175.6 $ 130.3 $ 240.8 Mezzanine Loans $ 3.0 $ 24.5 $ 15.4 Total Fundings $ 224.5 $ 602.9 $ 375.5
7
|
|
CRE Loan Portfolio Statistics
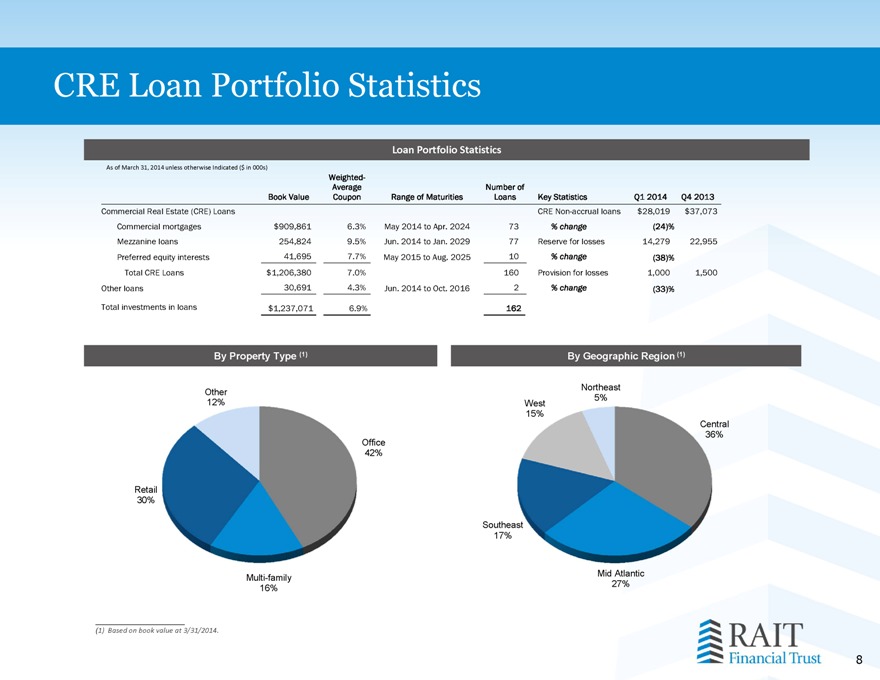
Loan Portfolio Statistics
As of March 31, 2014 unless otherwise Indicated ($ in 000s)
Weighted-
Average Number of
Book Value Coupon Range of Maturities Loans Key Statistics Q1 2014 Q4 2013 Commercial Real Estate (CRE) Loans CRE Non-accrual loans $28,019 $37,073 Commercial mortgages $909,861 6.3% May 2014 to Apr. 2024 73 % change (24)% Mezzanine loans 254,824 9.5% Jun. 2014 to Jan. 2029 77 Reserve for losses 14,279 22,955 Preferred equity interests 41,695 7.7% May 2015 to Aug. 2025 10 % change (38)% Total CRE Loans $1,206,380 7.0% 160 Provision for losses 1,000 1,500 Other loans 30,691 4.3% Jun. 2014 to Oct. 2016 2 % change (33)% Total investments in loans $1,237,071 6.9% 162
By Property Type (1)
Other 12%
Office 42%
Retail 30%
Multi-family 16%
By Geographic Region (1)
Northeast 5% West 15%
Central 36%
Southeast 17%
Mid Atlantic 27%
(1) Based on book value at 3/31/2014.
8
|
|
Commercial Real Estate Owner
Directly owned real estate portfolio
Strategy to maximize value over time through professional management, increasing occupancy and higher rental rates
Opportunistic acquisitions
Provides stability to asset mix and hedges against inflation
$1.3 billion of CRE properties at March 31, 20141
Portfolio is internally managed
Acquire well located apartment buildings in secondary markets via Independence Realty Trust, Inc. (“IRT”) (NYSE MKT: IRT)
IRT owned 17 properties totaling $303.4 million at March 31, 2014
Consolidated by RAIT and externally managed by RAIT subsidiary
RAIT owns approximately 7.0 million shares of IRT common stock (approximately 39.3% of the outstanding common stock)
IRT utilizes RAIT’s relationships, broker-network & relationships; off-market transactions
(1) Includes seventeen apartment buildings, $303.4 million, owned by IRT as of March 31, 2014. At March 31, 2014, RAIT owned 39.3% of IRT’s outstanding common stock.
.
9
|
|
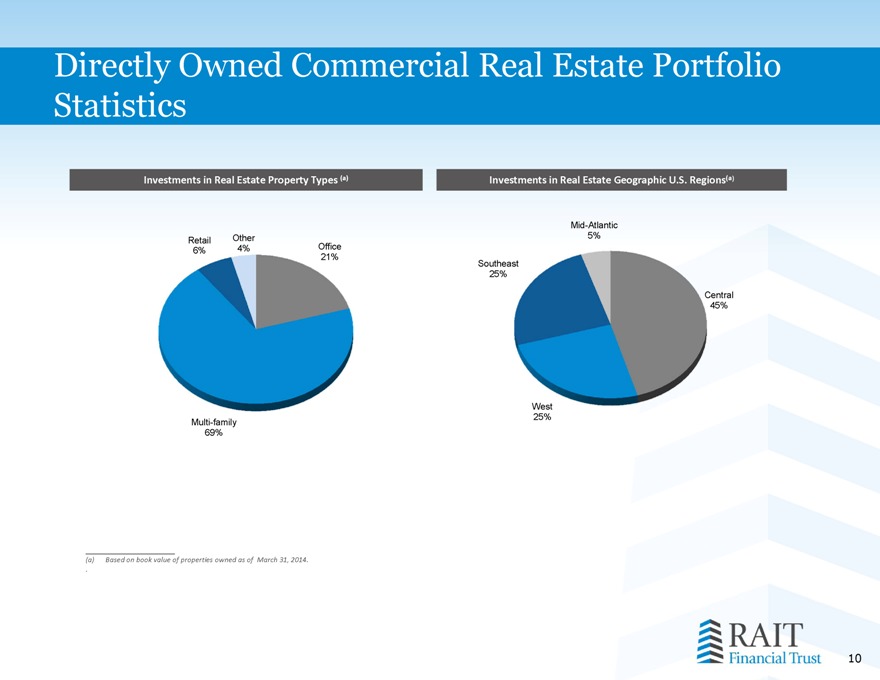
Directly Owned Commercial Real Estate Portfolio Statistics
Investments in Real Estate Property Types (a)
Retail Other Office
6% 4% 21%
Multi-family 69%
Investments in Real Estate Geographic U.S. Regions(a)
Mid-Atlantic 5%
Southeast 25%
Central 45%
West 25%
(a) Based on book value of properties owned as of March 31, 2014.
.
10
|
|
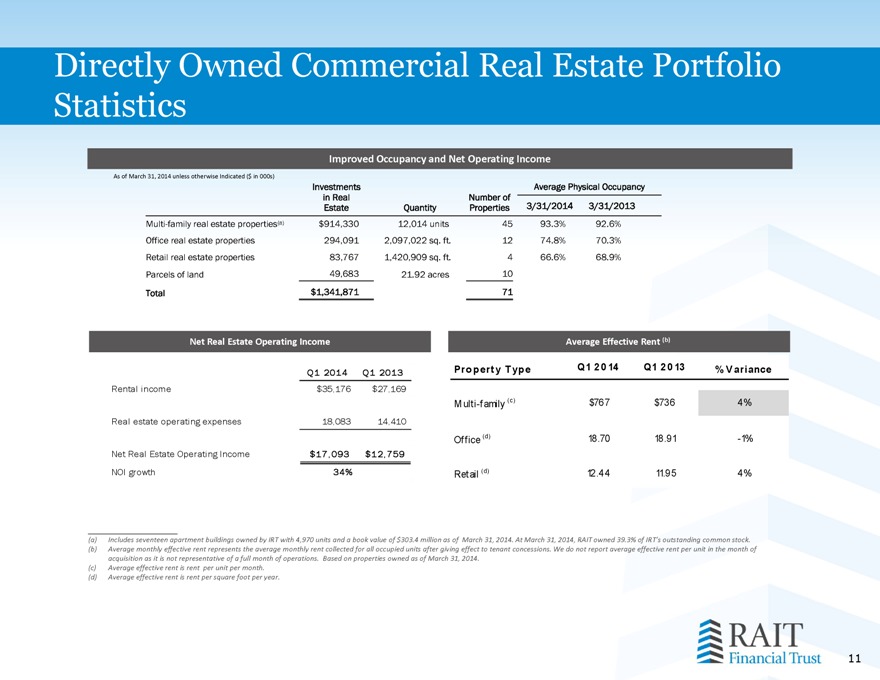
Directly Owned Commercial Real Estate Portfolio Statistics
Improved Occupancy and Net Operating Income
As of March 31, 2014 unless otherwise Indicated ($ in 000s)
Investments Average Physical Occupancy in Real Number of Estate Quantity Properties 3/31/2014 3/31/2013 Multi-family real estate properties(a) $914,330 12,014 units 45 93.3% 92.6% Office real estate properties 294,091 2,097,022 sq. ft. 12 74.8% 70.3% Retail real estate properties 83,767 1,420,909 sq. ft. 4 66.6% 68.9% Parcels of land 49,683 21.92 acres 10 Total $1,341,871 71
Net Real Estate Operating Income
Q1 2014 Q1 2013 Rental income $35,176 $27,169
Real estate operating expenses 18,083 14,410
Net Real Estate Operating Income $17,093 $12,759 NOI growth 34%
Average Effective Rent (b)
Property Type Q1 2014 Q1 2013 % Variance
Multi-family (c) $767 $736 4% Office (d) 18.70 18.91 -1% Retail (d) 12.44 11.95 4%
(a) Includes seventeen apartment buildings owned by IRT with 4,970 units and a book value of $303.4 million as of March 31, 2014. At March 31, 2014, RAIT owned 39.3% of IRT’s outstanding common stock. (b) Average monthly effective rent represents the average monthly rent collected for all occupied units after giving effect to tenant concessions. We do not report average effective rent per unit in the month of acquisition as it is not representative of a full month of operations. Based on properties owned as of March 31, 2014.
(c) Average effective rent is rent per unit per month. (d) Average effective rent is rent per square foot per year.
11
|
|
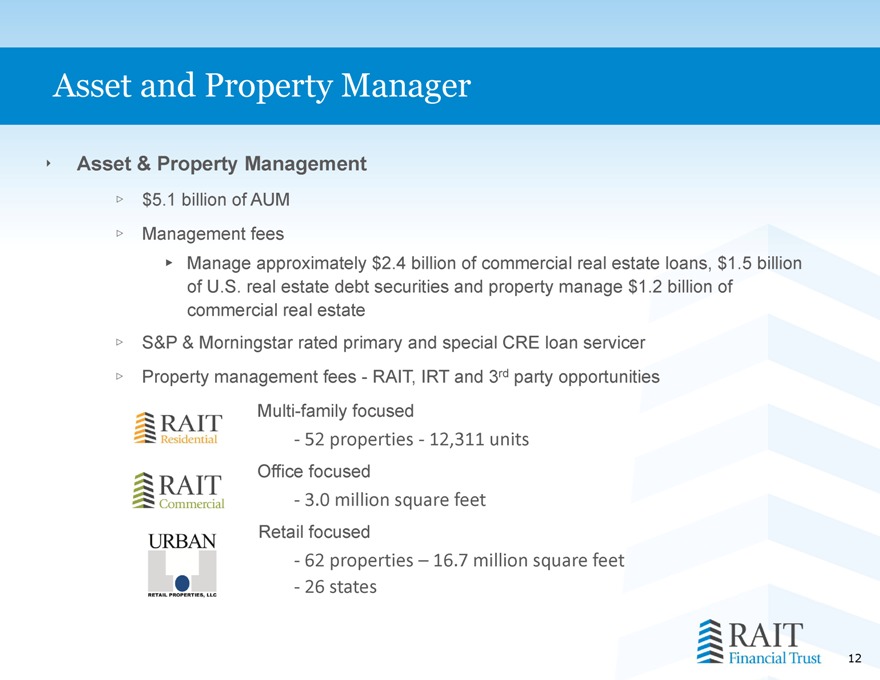
Asset and Property Manager
Asset & Property Management
$5.1 billion of AUM
Management fees
Manage approximately $2.4 billion of commercial real estate loans, $1.5 billion of U.S. real estate debt securities and property manage $1.2 billion of commercial real estate
S&P & Morningstar rated primary and special CRE loan servicer
Property management fees - RAIT, IRT and 3rd party opportunities
Multi-family focused
52 properties 12,311 units
Office focused
3.0 million square feet
Retail focused
62 properties – 16.7 million square feet
26 states
12
|
|
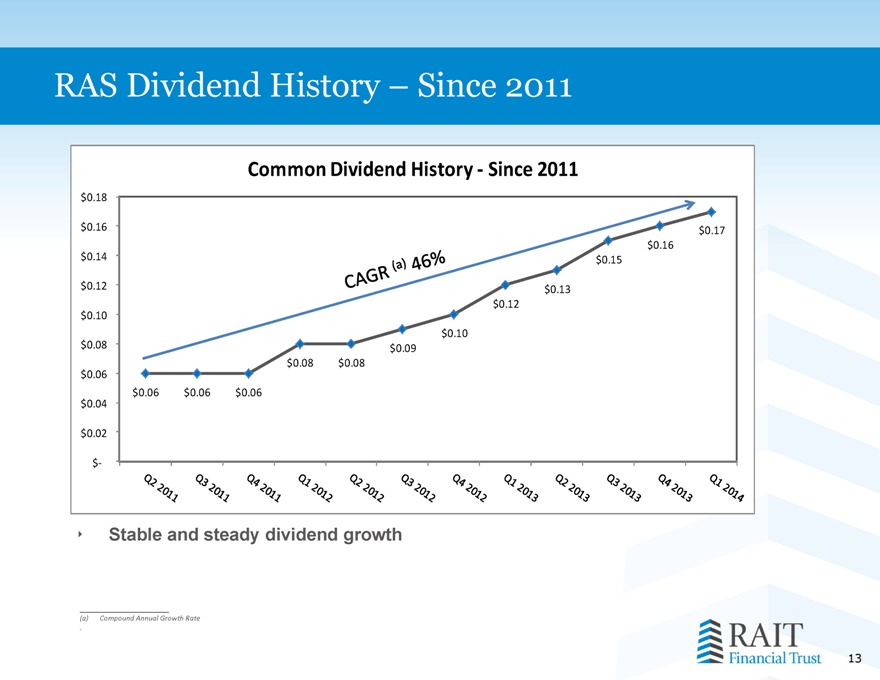
RAS Dividend History – Since 2011
Common Dividend History Since 2011
CAGR (a) 46%
$ 0.18
$ 0.16 $ 0.17
$ 0.16
$ 0.14 $ 0.15
$ 0.12 $ 0.13
$ 0.12
$ 0.10
$ 0.10
$ 0.08 $ 0.09
$ 0.08 $0.08
$ 0.06
$ 0.06 $0.06 $0.06
$ 0.04
$ 0.02
$-
Q2 2011 Q3 2011 Q4 2011 Q1 2012 Q2 2012 Q3 2012 Q4 2012 Q1 2013 Q2 2013 Q3 2013 Q4 2013 Q1 2014
Stable and steady dividend growth
(a) Compound Annual Growth Rate
13
|
|
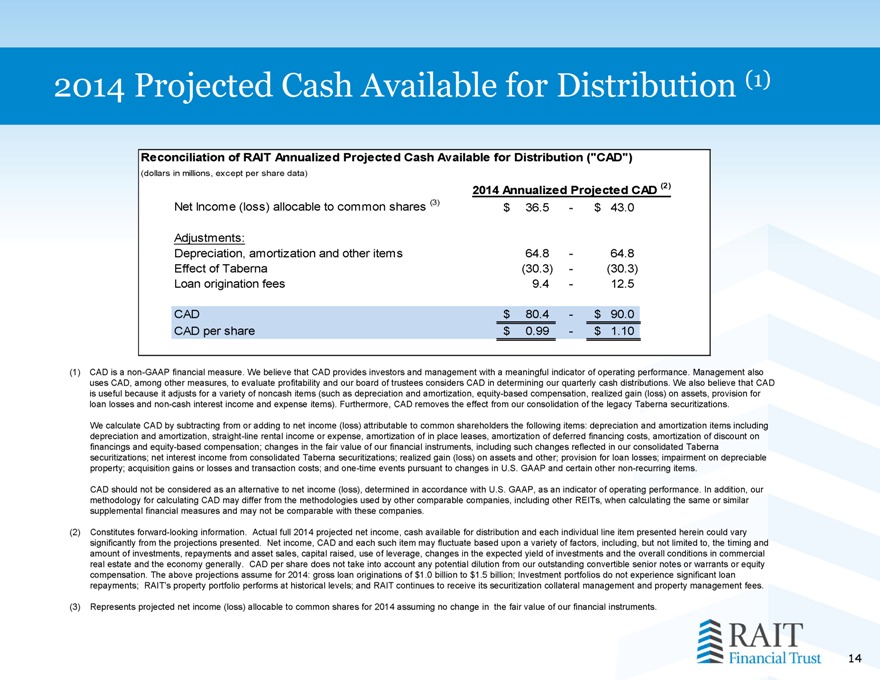
2014 Projected Cash Available for Distribution (1)
Reconciliation of RAIT Annualized Projected Cash Available for Distribution ("CAD")
(dollars in millions, except per share data)
2014 Annualized Projected CAD (2)
Net Income (loss) allocable to common shares (3) $ 36.5 - $ 43.0
Adjustments:
Depreciation, amortization and other items 64.8 - 64.8 Effect of Taberna (30.3) - (30.3) Loan origination fees 9.4 - 12.5
CAD $ 80.4 - $ 90.0 CAD per share $ 0.99 - $ 1.10
(1) CAD is a non-GAAP financial measure. We believe that CAD provides investors and management with a meaningful indicator of operating performance. Management also uses CAD, among other measures, to evaluate profitability and our board of trustees considers CAD in determining our quarterly cash distributions. We also believe that CAD is useful because it adjusts for a variety of noncash items (such as depreciation and amortization, equity-based compensation, realized gain (loss) on assets, provision for loan losses and non-cash interest income and expense items). Furthermore, CAD removes the effect from our consolidation of the legacy Taberna securitizations.
We calculate CAD by subtracting from or adding to net income (loss) attributable to common shareholders the following items: depreciation and amortization items including depreciation and amortization, straight-line rental income or expense, amortization of in place leases, amortization of deferred financing costs, amortization of discount on financings and equity-based compensation; changes in the fair value of our financial instruments, including such changes reflected in our consolidated Taberna securitizations; net interest income from consolidated Taberna securitizations; realized gain (loss) on assets and other; provision for loan losses; impairment on depreciable property; acquisition gains or losses and transaction costs; and one-time events pursuant to changes in U.S. GAAP and certain other non-recurring items.
CAD should not be considered as an alternative to net income (loss), determined in accordance with U.S. GAAP, as an indicator of operating performance. In addition, our methodology for calculating CAD may differ from the methodologies used by other comparable companies, including other REITs, when calculating the same or similar supplemental financial measures and may not be comparable with these companies.
(2) Constitutes forward-looking information. Actual full 2014 projected net income, cash available for distribution and each individual line item presented herein could vary significantly from the projections presented. Net income, CAD and each such item may fluctuate based upon a variety of factors, including, but not limited to, the timing and amount of investments, repayments and asset sales, capital raised, use of leverage, changes in the expected yield of investments and the overall conditions in commercial real estate and the economy generally. CAD per share does not take into account any potential dilution from our outstanding convertible senior notes or warrants or equity compensation. The above projections assume for 2014: gross loan originations of $1.0 billion to $1.5 billion; Investment portfolios do not experience significant loan repayments; RAIT’s property portfolio performs at historical levels; and RAIT continues to receive its securitization collateral management and property management fees.
(3) Represents projected net income (loss) allocable to common shares for 2014 assuming no change in the fair value of our financial instruments.
14
|
|
RAIT Highlights & Goals
Growth & stability through a multi-strategy approach
Utilizing RAIT’s core, integrated, real estate platform and management expertise to generate appropriate risk-adjusted returns by originating, underwriting and managing commercial real estate loans
Growing revenue through accretive capital deployment
Focus on bridge and conduit loans
Creating value in RAIT’s portfolio of owned real estate through increasing rental and occupancy rates while managing operating costs through RAIT’s property managers
Growing IRT’s portfolio of apartment properties
Expanding and maintaining our sources of liquidity
Maintaining a strong pipeline of investment opportunities
Delivering stable and growing dividends
15
|
|
Appendix
16
|
|
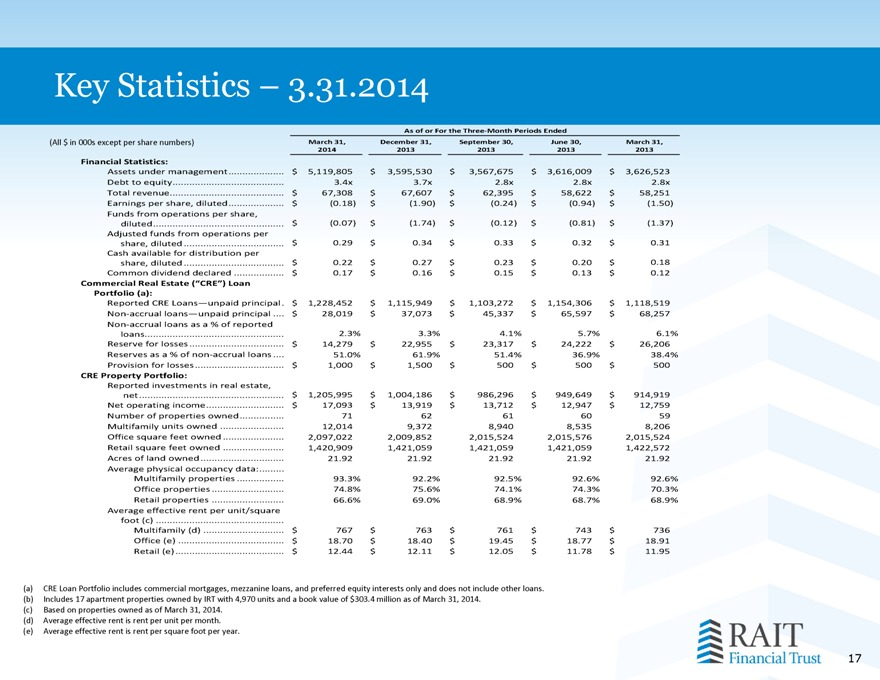
Key Statistics – 3.31.2014
As of or For the Three Month Periods Ended
(All $ in 000s except per share numbers) March 31, December 31, September 30, June 30, March 31,
2014 2013 2013 2013 2013
Financial Statistics:
Assets under management. $ 5,119,805 $ 3,595,530 $ 3,567,675 $ 3,616,009 $ 3,626,523 Debt to equity. 3.4x 3.7x 2.8x 2.8x 2.8x Total revenue. $ 67,308 $ 67,607 $ 62,395 $ 58,622 $ 58,251 Earnings per share, diluted. $ (0.18) $ (1.90) $ (0.24) $ (0.94) $ (1.50) Funds from operations per share, diluted. $ (0.07) $ (1.74) $ (0.12) $ (0.81) $ (1.37) Adjusted funds from operations per share, diluted . $ 0.29 $ 0.34 $ 0.33 $ 0.32 $ 0.31 Cash available for distribution per share, diluted . $ 0.22 $ 0.27 $ 0.23 $ 0.20 $ 0.18 Common dividend declared . $ 0.17 $ 0.16 $ 0.15 $ 0.13 $ 0.12
Commercial Real Estate (“CRE”) Loan
Portfolio (a):
Reported CRE Loans—unpaid principal . $ 1,228,452 $ 1,115,949 $ 1,103,272 $ 1,154,306 $ 1,118,519 Non accrual loans—unpaid principal . $ 28,019 $ 37,073 $ 45,337 $ 65,597 $ 68,257 Non accrual loans as a % of reported loans. 2.3% 3.3% 4.1% 5.7% 6.1% Reserve for losses . $ 14,279 $ 22,955 $ 23,317 $ 24,222 $ 26,206 Reserves as a % of non accrual loans . 51.0% 61.9% 51.4% 36.9% 38.4% Provision for losses . $ 1,000 $ 1,500 $ 500 $ 500 $ 500
CRE Property Portfolio:
Reported investments in real estate, net. $ 1,205,995 $ 1,004,186 $ 986,296 $ 949,649 $ 914,919 Net operating income. $ 17,093 $ 13,919 $ 13,712 $ 12,947 $ 12,759 Number of properties owned. 71 62 61 60 59 Multifamily units owned . 12,014 9,372 8,940 8,535 8,206 Office square feet owned . 2,097,022 2,009,852 2,015,524 2,015,576 2,015,524 Retail square feet owned . 1,420,909 1,421,059 1,421,059 1,421,059 1,422,572 Acres of land owned . 21.92 21.92 21.92 21.92 21.92 Average physical occupancy data:.
Multifamily properties . 93.3% 92.2% 92.5% 92.6% 92.6% Office properties . 74.8% 75.6% 74.1% 74.3% 70.3% Retail properties . 66.6% 69.0% 68.9% 68.7% 68.9% Average effective rent per unit/square foot (c) .
Multifamily (d) . $ 767 $ 763 $ 761 $ 743 $ 736 Office (e) . $ 18.70 $ 18.40 $ 19.45 $ 18.77 $ 18.91 Retail (e) . $ 12.44 $ 12.11 $ 12.05 $ 11.78 $ 11.95
(a) CRE Loan Portfolio includes commercial mortgages, mezzanine loans, and preferred equity interests only and does not include other loans. (b) Includes 17 apartment properties owned by IRT with 4,970 units and a book value of $303.4 million as of March 31, 2014.
(c) Based on properties owned as of March 31, 2014. (d) Average effective rent is rent per unit per month. (e) Average effective rent is rent per square foot per year.
17
|
|
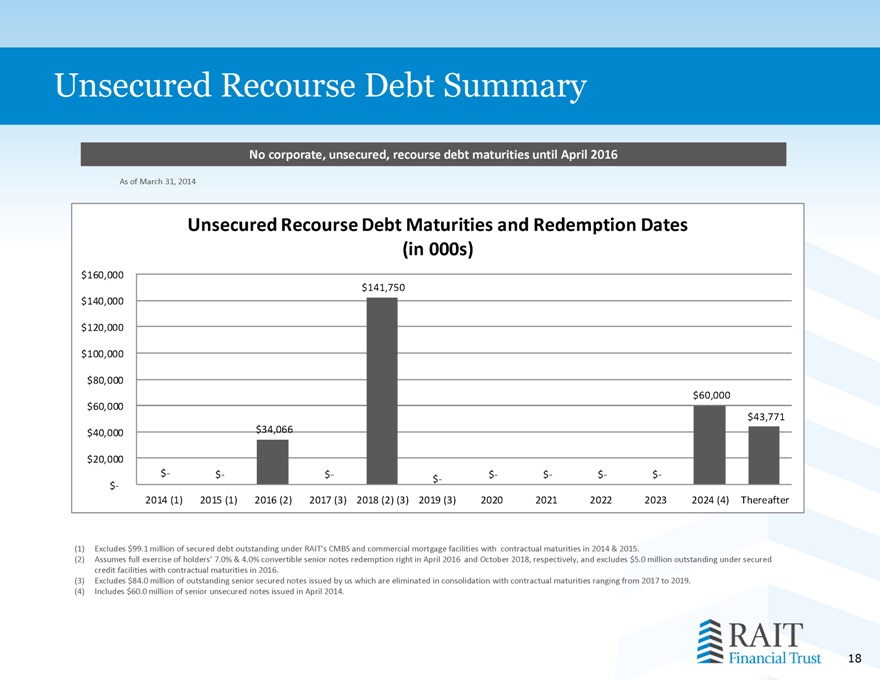
Unsecured Recourse Debt Summary
No corporate, unsecured, recourse debt maturities until April 2016
As of March 31, 2014
Unsecured Recourse Debt Maturities and Redemption Dates (in 000s)
$160,000 $141,750 $140,000
$120,000
$100,000
$80,000 $60,000 $60,000 $43,771 $40,000 $34,066
$20,000
$- $- $- $- $- $- $- $- $-
2014 (1) 2015 (1) 2016 (2) 2017 (3) 2018 (2) (3) 2019 (3) 2020 2021 2022 2023 2024 (4) Thereafter
(1) Excludes $99.1 million of secured debt outstanding under RAIT’s CMBS and commercial mortgage facilities with contractual maturities in 2014 & 2015.
(2) Assumes full exercise of holders’ 7.0% & 4.0% convertible senior notes redemption right in April 2016 and October 2018, respectively, and excludes $5.0 million outstanding under secured credit facilities with contractual maturities in 2016.
(3) Excludes $84.0 million of outstanding senior secured notes issued by us which are eliminated in consolidation with contractual maturities ranging from 2017 to 2019. (4) Includes $60.0 million of senior unsecured notes issued in April 2014.
18
|
|
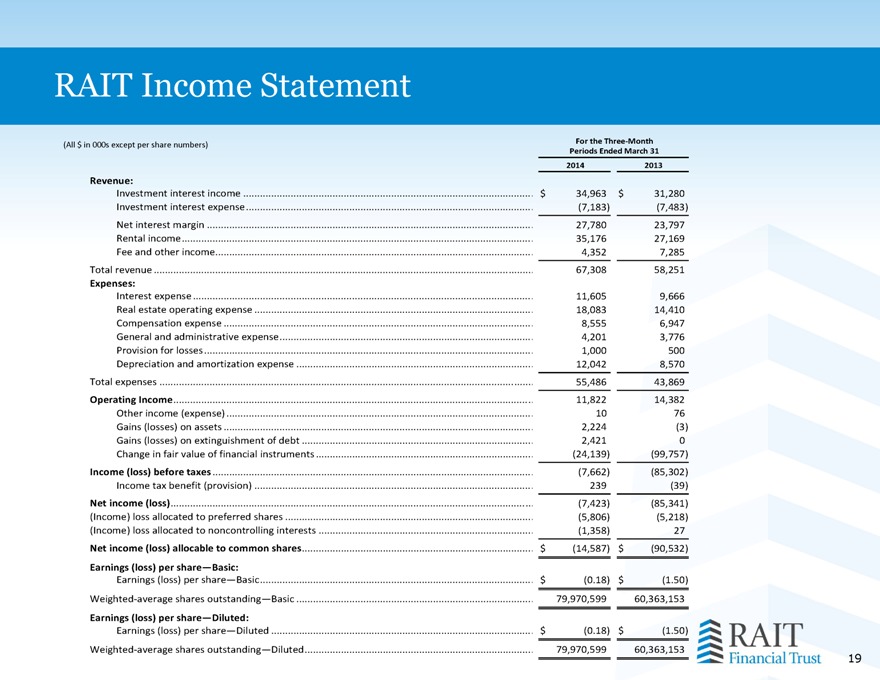
RAIT Income Statement
For the Three Month
(All $ in 000s except per share numbers) Periods Ended March 31
2014 2013
Revenue:
Investment interest income . $ 34,963 $ 31,280 Investment interest expense . (7,183) (7,483)
Net interest margin . 27,780 23,797 Rental income. 35,176 27,169 Fee and other income. 4,352 7,285
Total revenue . 67,308 58,251
Expenses:
Interest expense . 11,605 9,666 Real estate operating expense . 18,083 14,410 Compensation expense . 8,555 6,947 General and administrative expense. 4,201 3,776 Provision for losses . 1,000 500 Depreciation and amortization expense . 12,042 8,570
Total expenses . 55,486 43,869
Operating Income. 11,822 14,382 Other income (expense) . 10 76 Gains (losses) on assets . 2,224 (3) Gains (losses) on extinguishment of debt . 2,421 0 Change in fair value of financial instruments . (24,139) (99,757)
Income (loss) before taxes . (7,662) (85,302) Income tax benefit (provision) . 239 (39)
Net income (loss). (7,423) (85,341) (Income) loss allocated to preferred shares . (5,806) (5,218) (Income) loss allocated to noncontrolling interests . (1,358) 27
Net income (loss) allocable to common shares. $ (14,587) $ (90,532)
Earnings (loss) per share—Basic:
Earnings (loss) per share—Basic. $ (0.18) $ (1.50)
Weighted average shares outstanding—Basic . 79,970,599 60,363,153
Earnings (loss) per share—Diluted:
Earnings (loss) per share—Diluted . $ (0.18) $ (1.50)
Weighted average shares outstanding—Diluted. 79,970,599 60,363,153
19
|
|
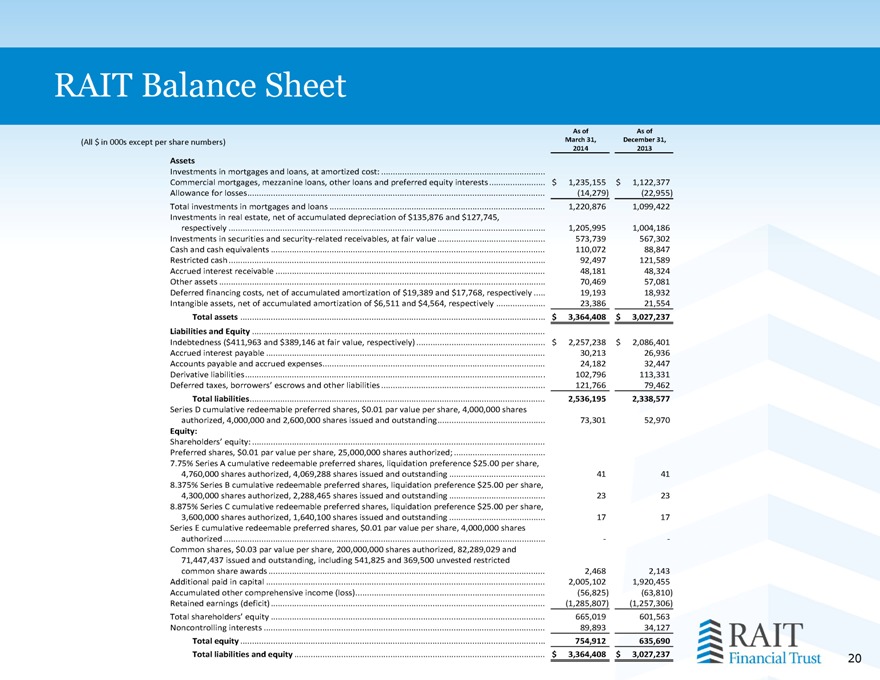
RAIT Balance Sheet
As of As of
(All $ in 000s except per share numbers) March 31, December 31, 2014 2013
Assets
Investments in mortgages and loans, at amortized cost: .
Commercial mortgages, mezzanine loans, other loans and preferred equity interests. $ 1,235,155 $ 1,122,377 Allowance for losses. (14,279) (22,955) Total investments in mortgages and loans . 1,220,876 1,099,422 Investments in real estate, net of accumulated depreciation of $135,876 and $127,745, respectively . 1,205,995 1,004,186 Investments in securities and security related receivables, at fair value . 573,739 567,302 Cash and cash equivalents . 110,072 88,847 Restricted cash . 92,497 121,589 Accrued
interest receivable 48,181 48,324 Other assets . 70,469 57,081 Deferred financing costs, net of accumulated amortization of $19,389 and $17,768, respectively . 19,193 18,932 Intangible assets, net of accumulated amortization of $6,511 and $4,564, respectively . 23,386 21,554 Total assets . $ 3,364,408 $ 3,027,237 Liabilities and Equity .
Indebtedness ($411,963 and $389,146 at fair value, respectively) . $ 2,257,238 $ 2,086,401 Accrued interest payable . 30,213 26,936 Accounts payable and accrued expenses. 24,182 32,447 Derivative liabilities. 102,796 113,331 Deferred taxes, borrowers’ escrows and other liabilities . 121,766 79,462 Total liabilities. 2,536,195 2,338,577 Series D cumulative redeemable preferred shares, $0.01 par value per share, 4,000,000 shares authorized, 4,000,000 and 2,600,000 shares issued and outstanding. 73,301 52,970
Equity:
Shareholders’ equity: . Preferred shares, $0.01 par value per share, 25,000,000 shares authorized; .
7.75% Series A cumulative redeemable preferred shares, liquidation preference $25.00 per share,
4,760,000 shares authorized, 4,069,288 shares issued and outstanding . 41 41
8.375% Series B cumulative redeemable preferred shares, liquidation preference $25.00 per share,
4,300,000 shares authorized, 2,288,465 shares issued and outstanding . 23 23
8.875% Series C cumulative redeemable preferred shares, liquidation preference $25.00 per share,
3,600,000 shares authorized, 1,640,100 shares issued and outstanding . 17 17 Series E cumulative redeemable preferred shares, $0.01 par value per share, 4,000,000 shares authorized . Common shares, $0.03 par value per share, 200,000,000 shares authorized, 82,289,029 and 71,447,437 issued and outstanding, $0.03 par value per share, 200,000,000 shares authorized, 82,289,029 and 71,447,437 issued and outstanding, including 541,825 and 369,500 unvested restricted common share awards . 2,468 2,143
Additional paid in capital . 2,005,102 1,920,455 Accumulated other comprehensive income (loss). (56,825) (63,810) Retained earnings (deficit) . (1,285,807) (1,257,306) Total shareholders’ equity . 665,019 601,563 Noncontrolling interests . 89,893 34,127 Total equity . 754,912 635,690 Total liabilities and equity . $ 3,364,408 $ 3,027,237
20
|
|
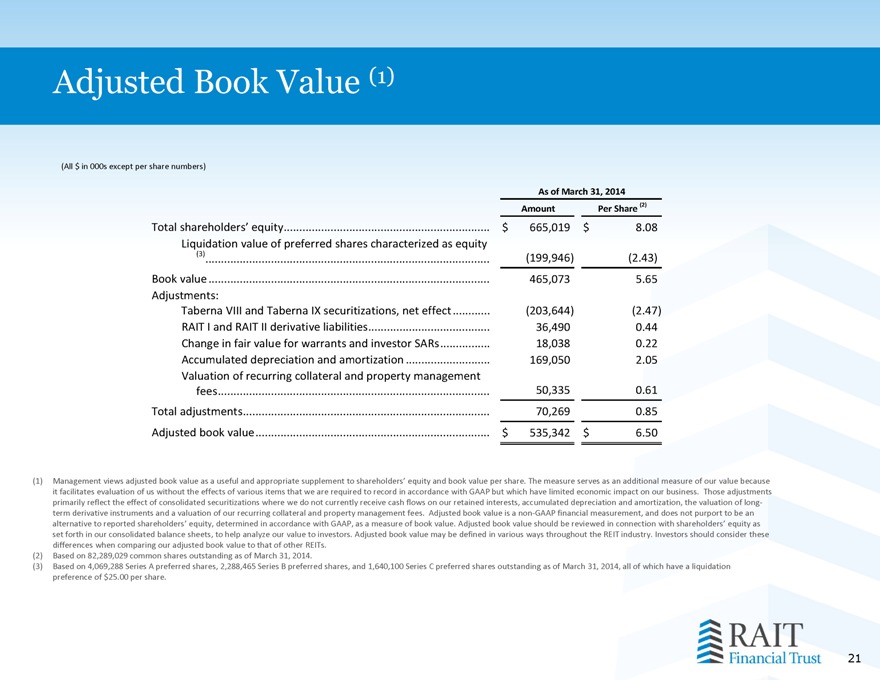
Adjusted Book Value (1)
(All $ in 000s except per share numbers)
As of March 31, 2014 Amount Per Share (2)
Total shareholders’ equity. $ 665,019 $ 8.08 Liquidation value of preferred shares characterized as equity (3) (199,946) (2.43) .
Book value . 465,073 5.65 Adjustments: Taberna VIII and Taberna IX securitizations, net effect . (203,644) (2.47) RAIT I and RAIT II derivative liabilities. 36,490 0.44 Change in fair value for warrants and investor SARs. 18,038 0.22 Accumulated depreciation and amortization . 169,050 2.05 Valuation of recurring collateral and property management fees. 50,335 0.61 Total adjustments. 70,269 0.85
Adjusted book value. $ 535,342 $ 6.50
(1) Management views adjusted book value as a useful and appropriate supplement to shareholders’ equity and book value per share. The measure serves as an additional measure of our value because it facilitates evaluation of us without the effects of various items that we are required to record in accordance with GAAP but which have limited economic impact on our business. Those adjustments primarily reflect the effect of consolidated securitizations where we do not currently receive cash flows on our retained interests, accumulated depreciation and amortization, the valuation of long-term derivative instruments and a valuation of our recurring collateral and property management fees. Adjusted book value is a non-GAAP financial measurement, and does not purport to be an alternative to reported shareholders’ equity, determined in accordance with GAAP, as a measure of book value. Adjusted book value should be reviewed in connection with shareholders’ equity as set forth in our consolidated balance sheets, to help analyze our value to investors. Adjusted book value may be defined in various ways throughout the REIT industry. Investors should consider these differences when comparing our adjusted book value to that of other REITs.
(2) Based on 82,289,029 common shares outstanding as of March 31, 2014.
(3) Based on 4,069,288 Series A preferred shares, 2,288,465 Series B preferred shares, and 1,640,100 Series C preferred shares outstanding as of March 31, 2014, all of which have a liquidation preference of $25.00 per share.
21
|
|
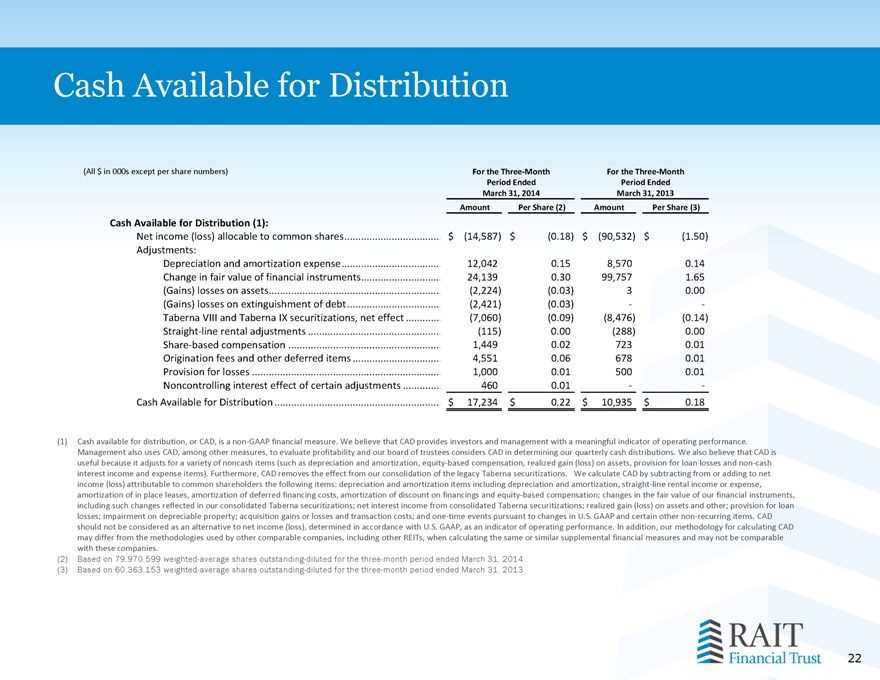
Cash Available for Distribution
(All $ in 000s except per share numbers) For the Three-Month For the Three-Month Period Ended Period Ended March 31, 2014 March 31, 2013 Amount Per Share (2) Amount Per Share (3)
Cash Available for Distribution (1):
Net income (loss) allocable to common shares. $ (14,587) $ (0.18) $ (90,532) $ (1.50) Adjustments: Depreciation and amortization expense. 12,042 0.15 8,570 0.14 Change in fair value of financial instruments. 24,139 0.30 99,757 1.65 (Gains) losses on assets. (2,224) (0.03) 3 0.00 (Gains) losses on extinguishment of debt. (2,421) (0.03) - -Taberna VIII and Taberna IX securitizations, net effect . (7,060) (0.09) (8,476) (0.14) Straight-line rental adjustments . (115) 0.00 (288) 0.00 Share-based compensation . 1,449 0.02 723 0.01 Origination fees and other deferred items . 4,551 0.06 678 0.01 Provision for losses . 1,000 0.01 500 0.01 Noncontrolling interest effect of certain adjustments . 460 0.01 - -Cash Available for Distribution $ 17,234 $ 0.22 $ 10,935 $ 0.18
(1) Cash available for distribution, or CAD, is a non-GAAP financial measure. We believe that CAD provides investors and management with a meaningful indicator of operating performance. Management also uses CAD, among other measures, to evaluate profitability and our board of trustees considers CAD in determining our quarterly cash distributions. We also believe that CAD is useful because it adjusts for a variety of noncash items (such as depreciation and amortization, equity-based compensation, realized gain (loss) on assets, provision for loan losses and non-cash interest income and expense items). Furthermore, CAD removes the effect from our consolidation of the legacy Taberna securitizations. We calculate CAD by subtracting from or adding to net income (loss) attributable to common shareholders the following items: depreciation and amortization items including depreciation and amortization, straight-line rental income or expense, amortization of in place leases, amortization of deferred financing costs, amortization of discount on financings and equity-based compensation; changes in the fair value of our financial instruments, including such changes reflected in our consolidated Taberna securitizations; net interest income from consolidated Taberna securitizations; realized gain (loss) on assets and other; provision for loan losses; impairment on depreciable property; acquisition gains or losses and transaction costs; and one-time events pursuant to changes in U.S. GAAP and certain other non-recurring items. CAD should not be considered as an alternative to net income (loss), determined in accordance with U.S. GAAP, as an indicator of operating performance. In addition, our methodology for calculating CAD may differ from the methodologies used by other comparable companies, including other REITs, when calculating the same or similar supplemental financial measures and may not be comparable with these companies.
(2) Based on 79,970,599 weighted-average shares outstanding-diluted for the three-month period ended March 31, 2014. (3) Based on 60,363,153 weighted-average shares outstanding-diluted for the three-month period ended March 31, 2013.
22