Attached files
| file | filename |
|---|---|
| 8-K - 8-K - HMS HOLDINGS CORP | a14-7073_18k.htm |
| EX-99.1 - EX-99.1 - HMS HOLDINGS CORP | a14-7073_1ex99d1.htm |
Exhibit 99.2
|
|
Q4 and Full Year 2013 Investor Call February 28, 2014 Bill Lucia, President and CEO Walter Hosp, CFO |

|
|
Safe Harbor Statement 2 This presentation contains “forward-looking statements” within the meaning of the U.S. Private Securities Litigation Reform Act of 1995 These forward-looking statements are based on current expectations, estimates, assumptions and projections that are subject to change. Should known or unknown risks or uncertainties materialize, or should underlying assumptions prove inaccurate, our actual results could differ materially from past results and those anticipated, estimated or projected. Forward-looking statements can be identified by words such as “anticipates,” “estimates,” “expects,” “projects,” “intends,” “plans,” “believes,” “will,” “target,” “seeks,” “forecast” and similar expressions and references to guidance. In particular, these include statements relating to future actions, business plans, objects and prospects, and future operating or financial performance. We caution you therefore against relying on any of these forward-looking statements. Factors that could cause or contribute to such differences include, but are not limited to: variations in our results of operations; changes in the U.S. healthcare environment and steps we take in anticipation of such changes; regulatory, budgetary or political actions that affect procurement practices; the loss of one or more major clients, including through our failure to reprocure a contract or the reduction in scope or early termination of one or more of our significant contracts; our ability to effectively manage our growth to execute on our business plans; the growth rate of spending on Medicaid/Medicare, simplification of the healthcare payment process or programmatic changes that diminish the scope of benefits; our ability to retain clients or the loss of one or more major clients; client dissatisfaction or early termination of contracts triggering significant costs or liabilities; the development by competitors of new or superior products or services; the emergence of new competitors, or the development by our clients of in-house capacity to perform the services we offer; all the risks inherent in the development, introduction, and implementation of new products and services; our failure to comply with laws and regulations governing health data or to protect such data from theft and misuse; our ability to maintain effective information systems and protect them from damage or interruption; restrictions on our ability to bid on/perform certain work due to other work we currently perform; our ability to successfully integrate our acquisitions; our ability to continue to secure contracts through the competitive bidding process and to accurately predict the cost and time to complete such contracts; our compliance with the covenants and obligations under the terms of our credit facility and our ability to generate sufficient cash to cover our interest and principal payments thereunder; and negative results of government or client reviews, audits or investigations to verify our compliance with contracts and applicable laws and regulations. A further description of these and other risks, uncertainties, and related matters can be found in our Annual Report on Form 10-K for the fiscal year ended December 31, 2012, which is available at www.hms.com under the “Investor Relations” tab. Factors or events that could cause actual results to differ may emerge from time to time and it is not possible for us to predict all of them. Any forward-looking statements are made as of the date of this press release and we do not undertake an obligation to publicly update forward-looking statements, whether as a result of new information, future events or otherwise, except as may be required by law. Use of Non-GAAP Measures This presentation contains non-GAAP measures. A reconciliation of these measures to GAAP measures is set forth in our press release issued on February 28, 2014, which is available under the Investor Relations Tab on the Company’s website (www.hms.com). |
|
|
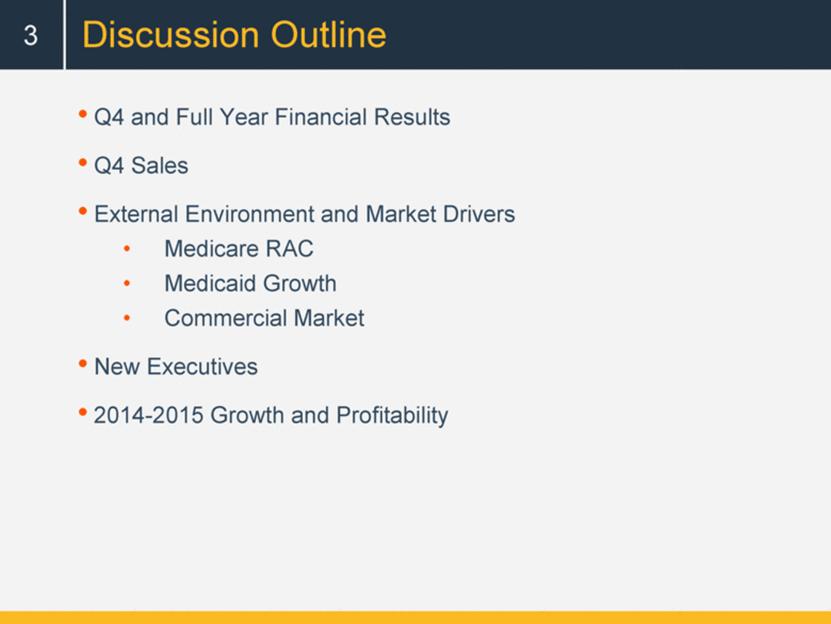
Discussion Outline 3 Q4 and Full Year Financial Results Q4 Sales External Environment and Market Drivers Medicare RAC Medicaid Growth Commercial Market New Executives 2014-2015 Growth and Profitability |
|
|
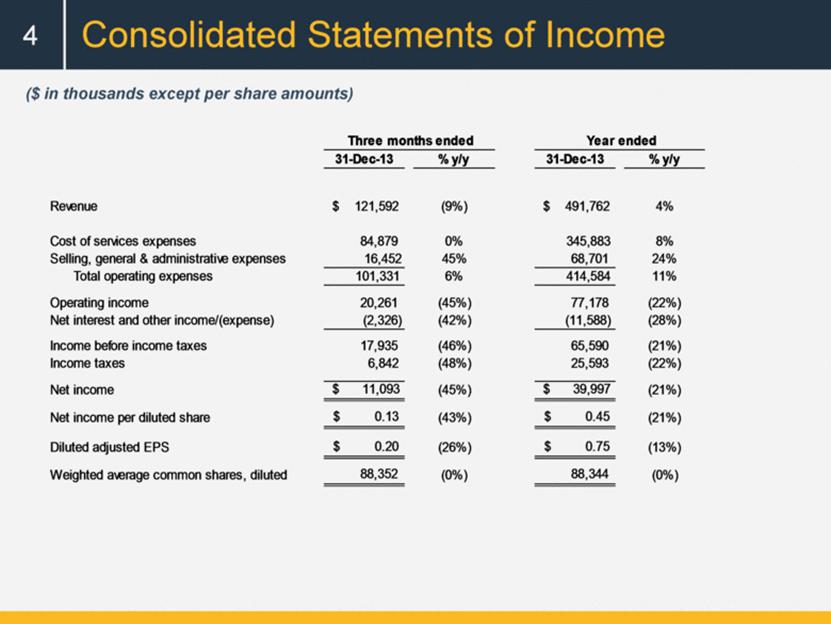
Consolidated Statements of Income 4 ($ in thousands except per share amounts) Three months ended Year ended 31-Dec-13 % y/y 31-Dec-13 % y/y Revenue $ 121,592 (9%) $ 491,762 4% Cost of services expenses 84,879 0% 345,883 8% Selling, general & administrative expenses 16,452 45% 68,701 24% Total operating expenses 101,331 6% 414,584 11% Operating income 20,261 (45%) 77,178 (22%) Net interest and other income/(expense) (2,326) (42%) (11,588) (28%) Income before income taxes 17,935 (46%) 65,590 (21%) Income taxes 6,842 (48%) 25,593 (22%) Net income $ 11,093 (45%) $ 39,997 (21%) Net income per diluted share $ 0.13 (43%) $ 0.45 (21%) Diluted adjusted EPS $ 0.20 (26%) $ 0.75 (13%) Weighted average common shares, diluted 88,352 (0%) 88,344 (0%) |
|
|
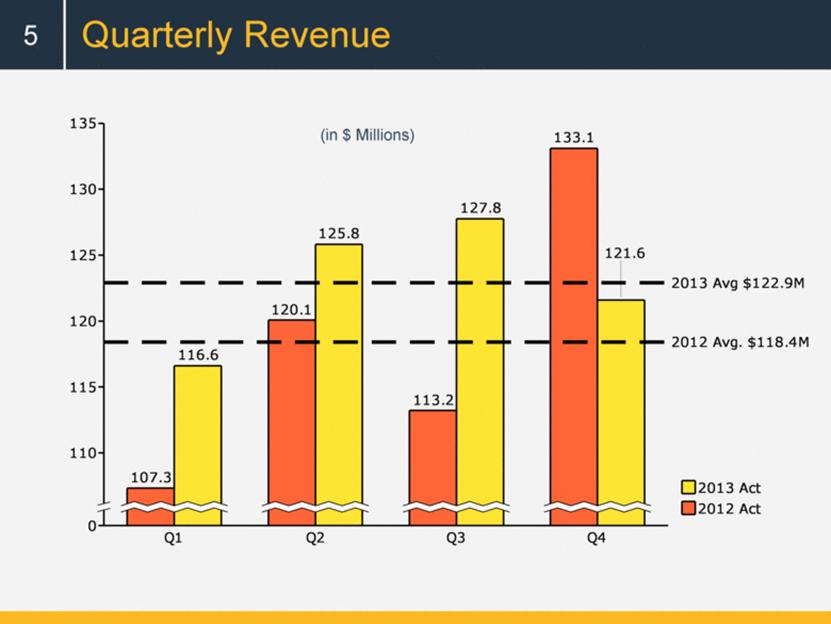
Quarterly Revenue 5 (in $ Millions) 0 110 115 120 125 130 135 2013 Avg $122.9M 2012 Avg. $118.4M Q1 107.3 116.6 Q2 120.1 125.8 Q3 113.2 127.8 Q4 133.1 121.6 2012 Act 2013 Act |
|
|
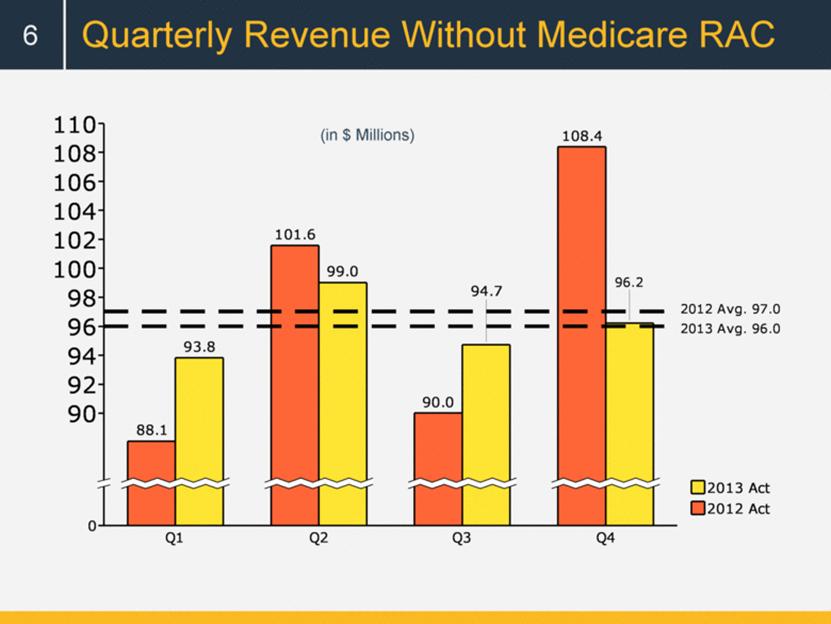
Quarterly Revenue Without Medicare RAC 6 (in $ Millions) 0 90 92 94 96 98 100 102 104 106 108 110 2012 Avg. 97.0 2013 Avg. 96.0 Q1 88.1 93.8 Q2 101.6 99.0 Q3 90.0 Q4 108.4 2012 Avg. 97.0 2013 Avg. 96.0 94.7 96.2 2012 Act 2013 Act |
|
|
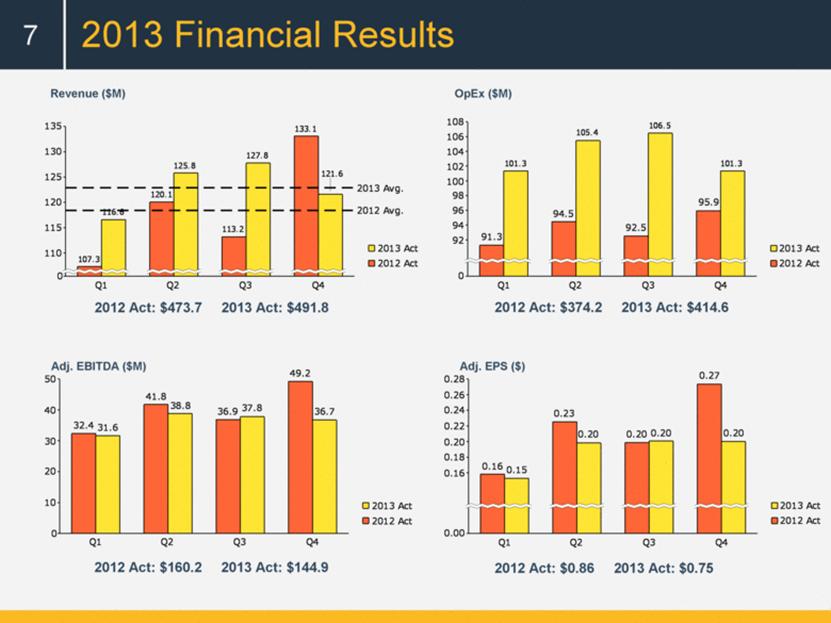
2013 Financial Results 7 Revenue ($M) OpEx ($M) Adj. EPS ($) Adj. EBITDA ($M) 2012 Act: $473.7 2013 Act: $491.8 2012 Act: $374.2 2013 Act: $414.6 2012 Act: $160.2 2013 Act: $144.9 2012 Act: $0.86 2013 Act: $0.75 0 110 115 120 125 130 135 2013 Avg. 2012 Avg. Q1 107.3 116.6 Q2 120.1 125.8 Q3 113.2 127.8 Q4 133.1 2013 Avg. 2012 Avg. 121.6 2012 Act 2013 Act 0 10 20 30 40 50 Q1 32.4 31.6 Q2 41.8 38.8 Q3 36.9 37.8 Q4 49.2 36.7 2012 Act 2013 Act 0.00 0.16 0.18 0.20 0.22 0.24 0.26 0.28 Q1 0.16 0.15 Q2 0.23 0.20 Q3 0.20 0.20 Q4 0.27 0.20 2012 Act 2013 Act 0 92 94 96 98 100 102 104 106 108 Q1 91.3 101.3 Q2 94.5 105.4 Q3 92.5 106.5 Q4 95.9 101.3 2012 Act 2013 Act |
|
|
Without MC RAC 2014 Outlook 8 Medicare RAC |
|
|
A Diversified Market and Product Mix Medicare RAC Commercial 0-2% 25-30% 2014 Growth Rates v COB Program Integrity 8-10% 20-25% 2013 Revenue By Product 2013 Revenue By Market 2014 Growth Rates 43% 30% 22% 9 5% Other Federal State Medicare RAC 61% 22% 17% |
|
|
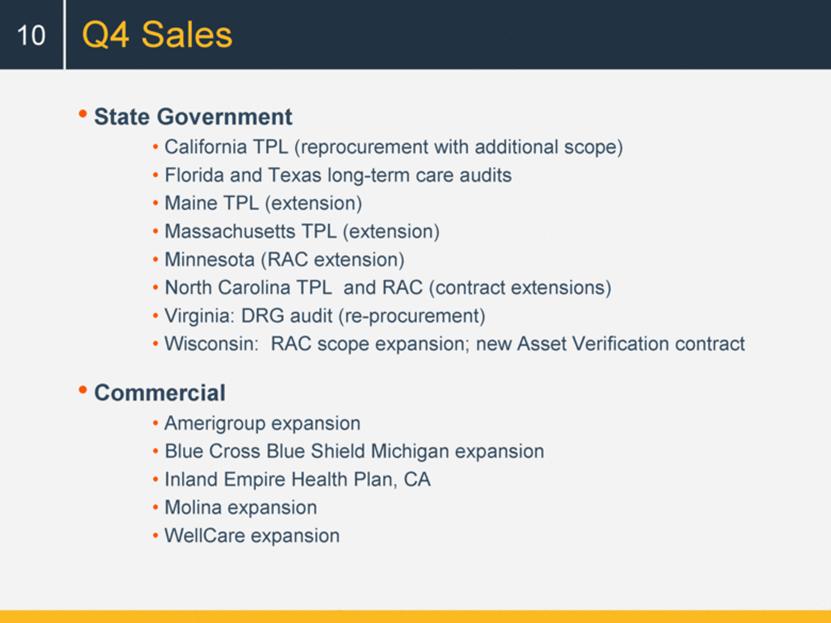
Q4 Sales 10 State Government California TPL (reprocurement with additional scope) Florida and Texas long-term care audits Maine TPL (extension) Massachusetts TPL (extension) Minnesota (RAC extension) North Carolina TPL and RAC (contract extensions) Virginia: DRG audit (re-procurement) Wisconsin: RAC scope expansion; new Asset Verification contract Commercial Amerigroup expansion Blue Cross Blue Shield Michigan expansion Inland Empire Health Plan, CA Molina expansion WellCare expansion |
|
|
External Environment/Market Drivers 11 Medicare RAC program Medicaid growth and mix Commercial market |
|
|
Medicare RAC Procurement Timeline 12 |
|
|
Medicare RAC Program 13 * CMS data from CMS RAC Program Reports; Medicare RAC program is the most effective way to control costs Momentum seen in the procurement process Enhancements required to improve the program for all stakeholders FFY Total Corrections* (in $ Millions) |
|
|
Medicaid is Growing NOTE: Enrollment percentage changes from June to June of each year. Spending growth percentages in state fiscal year. SOURCE: Medicaid Enrollment June 2013 Data Snapshot, KCMU, August 2013. Spending Data from KCMU Analysis of CMS Form 64 Data for Historic Medicaid Growth Rates. FY 2012 – 2014 data based on KCMU survey of Medicaid officials in 50 states and DC conducted by Health Management Associates, October 2013. Percent Change in Total Medicaid Spending and Enrollment, FY 1998 – FY 2014 Enrollment Growth Spending Growth SOURCE: HMA estimate for 2020, accounting for Supreme Court decision and CBO estimate of state adoption of expansion; 2010 data from: Kathy Gifford, Vernon Smith, Dyke Snipes and Julia Paradise. “A Profile of Medicaid Managed Care Programs in 2010: Findings from a 50-State Survey,” The Kaiser Commission on Medicaid and the Uninsured, September 2011. 1991 – 2000 data from HMA analysis of CMS Managed Care Reports, various years. Millions of U.S Medicaid Enrollees in Managed Care Organizations U.S. Medicaid Managed Care Enrollment Projected to Double 2010 to 2020 14 |
|
|
15 HMS Advantages in Commercial Sector Enrollment (in millions) Expenditures ($ billions) 1.6% 7% 7.7 % 24.2% Broad array of products Strong MCO relationships End-to-end solutions Proprietary datasets Analytics and clinical expertise |
|
|
New Leaders 16 20 years in the healthcare information technology Former VP of Architecture & Technology for Regence (Blue Cross Blue Shield) Developed flagship platform and benefits and claims processing system for health plans and self-insured employer groups Cynthia Nustad Former Senior VP of Claim Operations at UnitedHealthcare Oversaw business / platforms processing 500M claims annually Operational and reengineering track record Six Sigma black belt Semone Wagner Former President of Verisk Health President / CEO of Intelimedix—healthcare data analytics company Co-founded Enclarity—provider information management/data analytics Co-founded Integrity Plus Services—healthcare software and data; sold to UHC Joel Portice Former CIO of Aveta, acquired by Optum 25 years in healthcare IT, sales, operations Developed and managed IBM’s global healthcare practice Built commercial business for MedeAnalytics |
|
|
Medicaid expansion begins Significant growth in commercial New talent Revenue growth in low teens* Operating margins expanding 5%-6%* v Full-year benefit of new Medicaid lives Acceleration of commercial revenue Across the board revenue growth Further margin expansion Resumption of Medicare RAC growth v HMS is positioned for multi-year revenue and earnings growth. Summary 17 v *excluding Medicare RAC |
|
|
[LOGO] |