Attached files
| file | filename |
|---|---|
| EX-10.22 - EXHIBIT 10.22 - HMS HOLDINGS CORP | exh_1022.htm |
| EX-10.33 - EXHIBIT 10.33 - HMS HOLDINGS CORP | exh_1033.htm |
| EX-10.21 - EXHIBIT 10.21 - HMS HOLDINGS CORP | exh_1021.htm |
| EX-31.1 - EXHIBIT 31.1 - HMS HOLDINGS CORP | exh_311.htm |
| EX-32.1 - EXHIBIT 32.1 - HMS HOLDINGS CORP | exh_321.htm |
| EX-32.2 - EXHIBIT 32.2 - HMS HOLDINGS CORP | exh_322.htm |
| EX-23.1 - EXHIBIT 23.1 - HMS HOLDINGS CORP | exh_231.htm |
| EX-31.2 - EXHIBIT 31.2 - HMS HOLDINGS CORP | exh_312.htm |
| EX-21.1 - EXHIBIT 21.1 - HMS HOLDINGS CORP | exh_211.htm |
| EX-10.23 - EXHIBIT 10.23 - HMS HOLDINGS CORP | exh_1023.htm |
UNITED STATES
SECURITIES AND EXCHANGE COMMISSION
Washington, D.C. 20549
Form 10-K
| x | ANNUAL REPORT PURSUANT TO SECTION 13 OR 15(d) OF THE SECURITIES EXCHANGE ACT OF 1934 |
| For the fiscal year ended December 31, 2015 | |
| Or | |
| o | TRANSITION REPORT PURSUANT TO SECTION 13 OR 15(d) OF THE SECURITIES EXCHANGE ACT OF 1934 |
| For the transition period from to | |
Commission File Number 000-50194
![]()
HMS HOLDINGS CORP.
(Exact name of registrant as specified in its charter)
| Delaware (State or other jurisdiction of incorporation or organization) |
11-3656261 (I.R.S. Employer Identification No.) |
5615 High Point Drive, Irving, TX (Address of principal executive offices) |
75038 (Zip Code) |
(Registrant’s telephone number, including area code)
(214) 453-3000
Securities registered pursuant to Section 12(b) of the Act:
Title of each class |
Name of each exchange on which registered | |
| Common Stock $0.01 par value | NASDAQ Global Select Market |
Securities registered pursuant to section 12(g) of the Act: None
Indicate by check mark if the registrant is a well-known seasoned issuer, as defined in Rule 405 of the Securities Act. Yes x No o
Indicate by check mark if the registrant is not required to file reports pursuant to Section 13 or Section 15(d) of the Act. Yes o No x
Indicate by check mark whether the registrant (1) has filed all reports required to be filed by Section 13 or 15(d) of the Securities Exchange Act of 1934 during the preceding 12 months (or for such shorter period that the registrant was required to file such reports), and (2) has been subject to such filing requirements for the past 90 days. Yes x No o
Indicate by check mark whether the registrant has submitted electronically and posted on its corporate Web site, if any, every Interactive Data File required to be submitted and posted pursuant to Rule 405 of Regulation S-T during the preceding 12 months (or for such shorter period that the registrant was required to submit and post such files). Yes x No o
Indicate by check mark if disclosure of delinquent filers pursuant to Item 405 of Regulation S-K is not contained herein, and will not be contained, to the best of registrant’s knowledge, in definitive proxy or information statements incorporated by reference in Part III of this Form 10-K or any amendment to this Form 10-K. o
Indicate by check mark whether the registrant is a large accelerated filer, an accelerated filer, a non-accelerated filer, or a smaller reporting company. See the definitions of “large accelerated filer,” “accelerated filer” and “smaller reporting company” in Rule 12b-2 of the Exchange Act.
| Large Accelerated Filer x | Accelerated Filer o | Non-Accelerated Filer o (Do not check if a smaller reporting company) |
Smaller reporting company o |
Indicate by check mark whether the registrant is a shell company (as defined in Rule 12b-2 of the Act) Yes o No x
The aggregate market value of the registrant’s common stock held by non-affiliates as of June 30, 2015, the last business day of the registrant’s most recently completed second quarter was $1.5 billion based on the last reported sale price of the registrant’s Common Stock on the NASDAQ Global Select Market on that date. Solely for purposes of this disclosure, shares of common stock held by executive officers and directors of the registrant as of such date have been excluded because such persons may be deemed to be affiliates. This determination of executive officers and directors as affiliates is not necessarily a conclusive determination for any other purposes.
There were 84,005,986 shares of common stock outstanding as of February 25, 2016.
Documents Incorporated by Reference
Unless provided in an amendment to this Annual Report on Form 10-K, the information required by Part III is incorporated by reference to the registrant’s 2016 proxy statement, to the extent stated herein. Such proxy statement or amendment will be filed with the SEC within 120 days of the registrant’s fiscal year ended December 31, 2015.
HMS HOLDINGS CORP. AND SUBSIDIARIES
ANNUAL REPORT ON FORM 10-K
TABLE OF CONTENTS
Special Note Regarding Forward-Looking Statements
This Annual Report on Form 10-K contains “forward-looking statements” within the meaning of the U.S. Private Securities Litigation Reform Act of 1995. From time to time, we also provide forward-looking statements in other materials we release to the public, as well as oral forward-looking statements. Such statements give our expectations or forecasts of future events; they do not relate strictly to historical or current facts.
We have tried, wherever possible, to identify such statements by using words such as “aim,” “anticipate,” “believe,” “estimate,” “expect,” “forecast,” “intend,” “likely,” “may,” “plan,” “project,” “seek,” “target,” “will,” “would,” “could,” “should,” and similar expressions and references to guidance. In particular, these include statements relating to future actions, business plans, objectives and prospects, future operating or financial performance or results of current and anticipated services, acquisitions and the performance of companies we have acquired, sales efforts, expenses, interest rates, financial results, the outcome of contingencies, such as litigation, and the impact of current, pending and future U.S. healthcare legislation or changes to healthcare spending affecting Medicare, Medicaid or other publicly funded or subsidized health programs.
We cannot guarantee that any forward-looking statement will be realized. Forward-looking statements are based on our current expectations and assumptions regarding our business, the economy and other future conditions. Should known or unknown risks or uncertainties materialize, or should underlying assumptions prove inaccurate, actual results could differ materially from past results and those anticipated, estimated or projected. We caution you, therefore, against relying on any of these forward-looking statements. They are neither statements of historical fact nor guarantees or assurances of future performance. Factors that could cause or contribute to such differences include, but are not limited to, those discussed in this Annual Report on Form 10-K and in particular, the risks discussed under the heading “Risk Factors” in Part I, Item 1A of this Annual Report on Form 10-K and those discussed in other documents we file with the Securities and Exchange Commission.
Any forward-looking statements made by us in this Annual Report on Form 10-K speak only as of the date on which they are made. Factors or events that could cause actual results to differ may emerge from time to time and it is not possible for us to predict all of them. We undertake no obligation to publicly update forward-looking statements, whether as a result of new information, future events or otherwise, except as may be required by law. You are advised, however, to consult any further disclosures we make on related subjects in our Form 10-Q and Form 8-K reports and our other filings with the Securities and Exchange Commission.
HMS Holdings Corp. is a holding company whose principal business is conducted through its operating subsidiaries. Unless the context otherwise indicates, references in this Annual Report to the terms “we,” “our” and “us” refer to HMS Holdings Corp., and its subsidiaries and its affiliates.
General Overview
We operate in the U.S. healthcare insurance benefit cost containment marketplace. We provide coordination of benefits services to government and private healthcare payers and sponsors to ensure that the responsible party pays healthcare claims. Our payment integrity services ensure that healthcare claims billed are accurate and appropriate. Together, these various services help customers recover improper payments, including those from liable third parties; prevent future improper payments; reduce fraud, waste and abuse; and ensure regulatory compliance.
Demand for our services arises, in part, from healthcare funds spent in error, where another payer was actually responsible for the cost of the healthcare claim, or a mistake was made in applying complex claim processing rules. According to the Centers for Medicare & Medicaid Services (“CMS”) National Health Expenditures 2014-2024 projections (the “CMS NHE Projections”) and error rates published on paymentaccuracy.gov, the government estimates that improper payments in the Medicaid and Medicare programs totaled $117 billion in 2015. Our services focus on containing costs by detecting and reducing the errors that result in improper payment, and our revenues are based, in part, on the amounts we recover for our customers.
| 1 |
Our customers are state Medicaid agencies, government health agencies and health plans, including Medicaid managed care, Medicare Advantage and group and individual health lines of business; government and private employers; and other healthcare payers and sponsors, including child support agencies. As of December 31, 2015, we served 45 state Medicaid programs and the District of Columbia, and government health agencies, including CMS and the Veterans Health Administration (“VHA”). We also provided services to approximately 250 health plans and supported their multiple lines of business. We additionally served as a subcontractor for certain business outsourcing and technology firms.
Our revenue for the year ended December 31, 2015 was $474.2 million, an increase of $31.0 million, or 7.0%, from 2014 revenue of $443.2 million, primarily as a result of the expansion of services to our existing customers and growth through serving private health plan customers which exceeded the decline in Medicare RAC revenue.
Over the years, we have grown both organically and through targeted acquisitions. Initially, we provided coordination of benefits services to state Medicaid agencies. When Medicaid began to delegate members to managed care organizations, we began providing similar coordination of benefits services to those health plans. We launched our payment integrity services in 2007 and subsequently acquired several businesses to expand our service offerings. In 2009, we began providing cost containment services for Medicare with our acquisition of IntegriGuard, LLC (“IntegriGuard”), which does business as our wholly owned subsidiary HMS Federal, providing fraud, waste and abuse analytical services to the Medicare program, the Veterans Health Administration (“VHA”) and the Department of Defense. In 2009 and 2010, we began providing cost containment services to large self-funded employers through our acquisitions of Verify Solutions, Inc. and Chapman Kelly, Inc. In 2011, we expanded our cost containment services among federal, state and health plan payers with our acquisition of HealthDataInsights, Inc. (“HDI”). HDI provides improper payment identification services for government and private health plans, and is the Medicare Recovery Audit Contractor (“RAC”) in CMS Region D, covering 17 states and three U.S. territories. In December 2012, we extended our workers’ compensation recovery services to health plans through our asset purchase of MedRecovery Management, LLC.
The Healthcare Environment
The largest government healthcare programs are Medicare, the healthcare program for aged and disabled citizens that is administered individually by CMS and Medicaid, the program that provides medical assistance to eligible low income individuals, which is also regulated by CMS, but administered by states. For 2016, Medicare and Medicaid are projected to pay approximately 44.9% of the nation’s healthcare expenditures and serve over 128 million beneficiaries. Many of these beneficiaries are enrolled in managed care plans, which have the responsibility for both patient care and claim adjudication, though many states also continue to manage the care for certain populations on a fee for service basis.
By law, the Medicaid program is required to be the payer of last resort; that is, all other available third party resources must meet their legal obligation to pay claims before the Medicaid program pays for the care of an individual enrolled in Medicaid. Under Title XIX of the Social Security Act, states are required to take all reasonable measures to ascertain the legal liability of “third parties” for healthcare services provided to Medicaid recipients. Since 1985, we have provided state Medicaid agencies with services to identify third parties with primary liability for Medicaid claims, and since 2005, we have provided similar services to Medicaid managed care plans.
In accordance with the Medicare Prescription Drug Improvement and Modernization Act of 2003, CMS began a demonstration project utilizing recovery audit contractors to assist Medicare in identifying improper payments made to healthcare providers and suppliers. The demonstration project began in 2005 with six pilot states and was viewed as a success with Medicare RACs identifying over $900 million in overpayments and underpayments on claims of healthcare services provided to Medicare beneficiaries. The success of the demonstration project led Congress to pass the Tax Relief and Health Care Act of 2006, which made the Medicare RAC Program permanent and authorized its expansion to all 50 states by January 1, 2010.
Signed into law in February 2006, the Deficit Reduction Act of 2005 (the “DRA”) established a Medicaid Integrity Program to increase the government’s capacity to prevent, detect and address fraud, waste and abuse in the Medicaid program. The DRA also added new entities, such as self-insured plans, Pharmacy Benefit Managers (“PBMs”) and other “legally responsible” parties to the list of entities subject to the third party liability (“TPL”) provisions of the Medicaid statute. These measures, at both the federal and state level, have strengthened our ability to identify and recover erroneous payments made by our customers.
| 2 |
The Patient Protection and Affordable Care Act (the “ACA”) was signed into law in 2010. This legislation touched almost every sector of the healthcare system, and affords us a range of growth opportunities across a number of services. We are focused on three critical areas related to this legislation:
| · | Medicaid Expansion |
| · | Payment Integrity, and |
| · | Employer-Sponsored Health Coverage |
Medicaid Expansion: States that expand their Medicaid programs in accordance with the ACA receive federal funding for the total cost of the expansion for a period of three years, and reduced funding thereafter. As of early 2016, approximately two-thirds of the states opted to expand their Medicaid programs as provided under the ACA. According to the CMS NHE Projections, the number of individuals enrolled in Medicaid and the Children’s Health Insurance Program (“CHIP”) is expected to increase from 77.9 million in 2016 to 84.6 million in 2024, with expenditures over the same period expected to increase from $585 billion to $915 billion. As a result, we anticipate continued demand for our cost containment services by states and the managed care organizations they contract with. We believe that our strong history of successful contracting with Medicaid agencies and Medicaid managed care organizations will enable us to continue providing value-added services to help control the escalating costs for this expanded population.
Payment Integrity: The ACA contained a number of provisions for combating fraud, waste and abuse throughout the healthcare system, including in Medicaid and Medicare. These initiatives include: (i) requiring state Medicaid agencies to contract with state Medicaid RACs and deploy programs modeled on the Medicare RAC Program administered by CMS, (ii) expanding the Medicare RAC Program to include Medicare Part C and D, (iii) establishing a national healthcare fraud, waste and abuse data collection program and (iv) increasing scrutiny of providers and suppliers who want to participate in Medicare, Medicaid and other federally-funded programs. The ACA further required that each state establish a Medicaid RAC program by January 1, 2012. In addition, the ACA allowed for significant increases in funding for these and other fraud, waste and abuse efforts. We continue to seek opportunities to expand our current partnerships with CMS, states and health plans and to provide innovative ideas to support their payment integrity initiatives.
Employer-Sponsored Health Coverage: The ACA largely preserves and builds upon the existing employer-sponsored health coverage model. Though not all employers will be required to provide healthcare coverage, large employers (i.e. those with 50 or more full time equivalents) will be penalized starting in 2016 if (i) they do not offer coverage (or if they offer coverage that does not meet certain requirements) and (ii) one or more of their full time employees receives a federal tax credit or cost sharing subsidy through a health insurance exchange. Employers will also be prohibited from imposing waiting periods for enrollment of more than 90 days. We expect that we will be able to offer a range of audit services to employers of all sizes, which will be valuable as these employers extend coverage to their employees.
The healthcare environment continues to change as new programs are established, such as the Medicare prescription drug program and the Marketplace Exchanges, and new opportunities for oversight and improved program integrity are created. Our expertise in helping healthcare payers control costs and recover improper payments through various cost saving measures add value to the sustainability of large government healthcare programs. Although these changes in the healthcare environment create opportunities for us, they sometimes cause us to reevaluate our current business. One primary example of this is the current Medicare RAC Program. As a result of increased Medicare RAC activity and other payer pressures, which include reducing overall costs and improving quality of services provided, healthcare systems have experienced an accelerated shift in patients moving from inpatient to outpatient care. In response to concerns over this growing trend, in August 2013, CMS issued CMS Rule 1599-F, Hospital Inpatient Admission Order and Certification and Two Midnight Benchmark for Inpatient Hospital Admissions for the Fiscal Year 2014 Inpatient Prospective Payment System / Long-Term Care Hospital (the “Two Midnight Rule”) in order to clarify Medicare’s inpatient policy around when it is appropriate to admit a patient to the hospital for an inpatient stay versus when they should receive outpatient services. The Two Midnight Rule redefined the requirements for an inpatient stay with a new formal time-based standard, which initially stated that surgical procedures, diagnostic tests and other treatments (in addition to services designated as inpatient-only), are generally appropriate for inpatient hospital admission and payment under Medicare Part A when a physician (i) expects the beneficiary to require a stay that crosses at least two midnights and (ii) admits the beneficiary to the hospital based upon that expectation.
As part of the Rule’s implementation, CMS suspended the Medicare RACs’ review of inpatient hospital claims paid between October 2013 and September 2014 to determine whether the inpatient hospital admission and patient status was appropriate. CMS subsequently extended the delay of the enforcement of Two Midnight Rule claims by Medicare RACs through January 2016 in accordance with the passage of certain legislative and regulatory actions. In October 2015, CMS released updates to the Two Midnight Rule as part of CMS’ final outpatient payment rule, Calendar Year (CY) 2016 Hospital Outpatient Prospective Payment System. The final rule provided, among other things, that inpatient admissions where a physician expects the patient to need less than two midnights would be payable under Medicare Part A on a case-by-case basis. CMS also announced that Quality Improvement Organizations (“QIOs”) would assume the responsibility for conducting initial reviews of short inpatient stays and refer claim denials to Medicare Administrative Contractors. Medicare RACs would resume patient status reviews for claims with admission dates of January 1, 2016 or later that were based on providers with high denial rates upon referral by QIOs.
| 3 |
In August 2014, in response to litigation by the American Hospital Association that cited (i) ambiguities around Medicare’s hospital inpatient payment policy, (ii) flaws with CMS’ policy to fully deny payments to hospitals for these claims and (iii) that hospitals were denied timely due process because the Office of Medicare Hearings and Appeals (OMHA) had a serious backlog and was not hearing hospital appeals, CMS announced it would settle with hospitals willing to withdraw inpatient status claims currently pending in the appeals process by offering to pay hospitals 68% for all eligible claims that they have billed to Medicare. On February 9, 2016, the D.C. Circuit Court of Appeals decided to remand the case to the U.S. District Court for the District of Columbia regarding mandamus relief for three hospitals whose appeals were significantly delayed due to OMHA’s appeals backlog. While the Circuit Court’s decision agrees with plaintiffs’ expectations of an appeals process that meets statutory timeframes and their argument that Medicare RAC denials have greatly contributed to the backlog, the decision also recognized that Congress’s recent introduction of Senate Bill 2368, the Audit & Appeals Fairness, Integrity, and Reforms in Medicare (AFIRM) Act of 2015, could be viewed as significant progress towards reducing the appeals backlog and solving many of the appeals issues cited in the AHA litigation. Even if the AFIRM Act is passed, however, it will take time to reduce the backlog and improve the appeals process. As such, we believe it is likely that the current ADR limits and other review restraints will continue until substantial changes to the appeals process are implemented. We will continue to closely follow developments related to this legislation in order to further evaluate the potential impact it may have on our business.
We believe that the need and desire to have a Medicare Recovery Audit program remains a goal for CMS, however the current constraints within the program regarding the number of claims that can be reviewed, the lack of an adequate structure for establishing contingent revenue and the general uncertainty around the program raises concerns about its viability. We remain confident that we have a robust business model that has demonstrated an ability to recover hundreds of millions of dollars for the customers we serve. Our commitment to reduce fraud, waste and abuse in these government healthcare systems remains strong and we will continue to review our business model while we work with our customers to improve the program.
Principal Products and Services
Our coordination of benefits offering to customers consists of services that draw principally upon proprietary information management and data mining techniques designed to ensure that the right party pays a healthcare claim. Our payment integrity offering to customers also consists of a variety of services designed to ensure that the billing and/or payment is accurate and appropriate. As a result of our services, customers received billions of dollars in cash recoveries in 2015, and saved billions more through the prevention of erroneous payments.
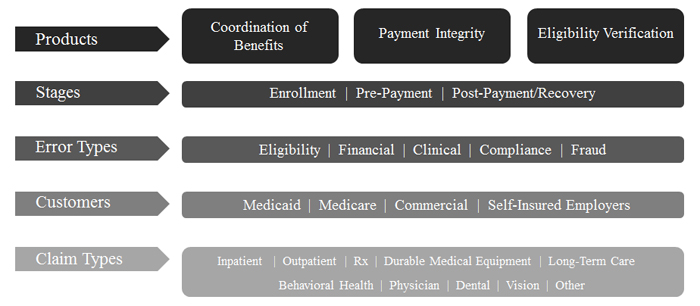
Our services are applicable to federal, state and private health plans and address errors across the payment continuum, from an individual’s enrollment in a program before any medical service is rendered, to pre-payment review of a claim by a payer, through recovery audit where discovery of an improper payment is made. Our services also address the wide spectrum of payment errors, from eligibility and coordination of benefits errors, to the identification and investigation of potential fraud, and extend to most claim types.
In general, our range of services includes the following:
| · | Coordination of benefits services. We provide cost avoidance services, in which we provide validated insurance coverage information that is used by government-sponsored payers to coordinate benefits properly for future claims that they receive. With validated insurance information, Medicaid payers can avoid unnecessary costs by ensuring––– that they pay only after all other benefits available have been exhausted, thereby complying with federal regulations that require Medicaid to be the payer of last resort. Nevertheless, due to a variety of factors, some Medicaid claims are paid even when there is a known responsible third party. Our government-sponsored program customers rely on us to identify those claims that were paid in error and recover these payments from the liable third party. Further, we also provide services to assist customers in identifying other third-party insurance and recovering medical expenses where a member is involved in a casualty or tort incident. Lastly, for Medicaid agencies exclusively, we provide estate recovery services to identify and recover Medicaid expenditures from the estates of deceased Medicaid members in accordance with state policies. |
| 4 |
| · | Payment integrity services. Our payment integrity services are designed to verify that medical services are utilized, billed and paid appropriately. Our services combine data analytics, clinical expertise and proprietary technology to identify improper payments on both a pre-payment and post-payment basis; identify and recover overpayments/underpayments; detect and prevent fraud, waste and abuse; and identify process improvements. |
| · | Eligibility verification services. Our eligibility verification services are designed to ensure that individuals meet qualifying criteria for enrollment in a healthcare program. These services include premium assistance, dependent eligibility audits and other verification solutions. |
Customers
For the years ended December 31, 2015 and 2014, respectively, none of our customers accounted for more than 10% of our total revenue. For the year ended December 31, 2013, one customer accounted for 22.3% of our total revenue.
The list of our ten largest customers changes periodically. For the years ended December 31, 2015, 2014 and 2013, our ten largest customers represented 44.0%, 40.1% and 47.2% of our total revenue, respectively. The current terms of our agreements with these customers have expiration dates between 2016 and 2020. The failure to reprocure a contract with one of these customers may have a material adverse effect on our financial condition, results of operations and cash flows.
We provide products and services under contracts (or sub-contracts) that contain various revenue structures, including contingent revenue and fixed fee arrangements. Most of our contracts have terms of three to five years, including optional renewal terms. In many instances, we provide our services pursuant to agreements that are subject to periodic reprocurements. Several of our contracts, including those with some of our largest customers, may be terminated for convenience. Because we provide our services pursuant to agreements that are open to competition from various businesses in the U.S. healthcare insurance benefit cost containment marketplace, we cannot provide assurance that our contracts, including those with our largest customers, will not be terminated for convenience, awarded to other parties, or renewed, and, if renewed, that the fee structures will be equal to those currently in effect.
Industry Trends/Opportunities
As government healthcare programs continue to grow, their ability to contain healthcare expenditures presents challenges due to the number and variety of programs at the state and federal level, the government appropriations process and the rise in the cost of care and number of beneficiaries. CMS has projected that Medicaid, CHIP and Medicare expenditures will increase to nearly $2.1 trillion by 2024. The ACA further added increased pressure on states to cover more individuals, making cost containment a high priority.
According to the CMS HNE projections, Medicare programs in 2015 covered approximately 54.5 million people and spent approximately $646 billion and Medicaid/CHIP programs covered approximately 76 million people and spent approximately $560 billion. Altogether, it is projected that the government programs we serve covered approximately 131 million people and spent $1.2 trillion in 2015. We believe that enrollment in these programs will continue to increase as a result of the ACA.
According to the CMS NHE Projections, Medicaid enrollment is projected to grow by 2.1% in 2016 over 2015, and 2.5% in 2017 over 2016. Total Medicaid spending is projected to increase at a rate of 4.5% in 2016 over 2015, and at a rate of 5.3% in 2017 over 2016. In addition, Medicare spending is projected to grow 6.1% in 2016 over 2015 and up to 20% in 2018 over 2015. There are a number of factors that could impact these projections, including medical utilization by the new enrollees under the ACA and any legislative action taken to reduce spending.
| 5 |
In response to pressures to contain the growth of state and federal Medicaid spending and to concerns about access to healthcare for low-income individuals, the use of managed care arrangements in Medicaid continues to grow. In 2015, 38 states and the District of Columbia contracted with managed care organizations to provide care to some or all of their Medicaid beneficiaries. In addition, many states have expanded the use of managed care organizations to new regions or to serve beneficiaries with more complex conditions. Of the 31 states and the District of Columbia that opted to expand Medicaid eligibility levels by early 2016 pursuant to the ACA, all except for four use Medicaid managed care organizations. The majority of new lives that have entered the Medicaid program as a result of the ACA are enrolled in managed care organizations.
Similarly, health plans also continue to assume risk for Medicare lives, with the Kaiser Family Foundation estimating that in 2015, nearly one-third of all Medicare recipients had enrolled in a Medicare Advantage plan. As health plans continue to focus on strategies to contain costs across their different lines of business, we’ll continue to focus on serving these health plans and meet their evolving needs. Regardless of the program, coordinating benefits among a growing number of healthcare payers and ensuring that claims are paid appropriately represents an enormous challenge for our customers and an ongoing opportunity for us.
Competition
The U.S. healthcare insurance benefit cost containment marketplace is a dynamic industry with a range of businesses currently able to offer cost containment services, both directly or indirectly (through subcontracting), to some or all of the various healthcare payers. In addition, with improvements in technology and the growth in healthcare spending, new businesses are incentivized to enter this marketplace. Competition is therefore robust as customers have many alternatives available to them in their effort to contain healthcare costs. In addition, many healthcare payers have the ability to perform some or all of these cost containment services themselves and choose to exercise that option.
Within our core coordination of benefits services, we compete primarily with large business outsourcing and technology firms, claims processors (including PBMs), clearinghouses, healthcare consulting firms, smaller regional vendors and other TPL service providers; these companies include Optum, Inc., Public Consulting Group, Inc., Emdeon Inc., HP and Xerox. In addition, as noted, we frequently work with customers who may elect to perform some or all of their recovery and cost avoidance functions in-house.
The competitive environment for payment integrity services includes some of the same companies that provide coordination of benefits services, as well as other Medicare RACs (CGI Federal, Inc., Cotiviti and Performant Financial Corp.); other claim audit vendors (including Cognosante and Myers & Stauffer LC); fraud, waste and abuse claim edit and predictive analysis companies (such as Emdeon, Inc., Verisk Health, Inc. and LexisNexis Risk Solutions); and numerous regional utilization management companies.
We compete based on a variety of factors, including our ability to perform a wide range of coordination of benefits-and payment integrity related functions; maximize recoveries and cost avoidance; apply our in-depth government healthcare program experience, clinical staff expertise, extensive insurance eligibility database, proprietary systems and processes; leverage our existing relationships; and sustain operations under contingency fee structures.
Business Strategy
Over the course of 2016, we expect to grow our business through a number of strategic objectives or initiatives that may include:
| · | Retain existing customers and expand scope. We will seek to retain our current customer base and expand our role with them via new audit strategies, services and claim types. |
| · | Add new customers. We will continue to market to government healthcare payers; private health plans, including Medicaid managed care, Medicare Advantage and group and individual health lines of business; and private employers. |
| · | Add new services. We will continue to look for opportunities to add services closely related to cost containment through internal development and/or acquisition. |
| · | Drive organic growth. We will seek to tap demand for our services created by steadily increasing healthcare expenditures, in particular in the managed care environment. |
| · | Improve the quality and effectiveness of our services. We will continue implementing new technology and process improvements, which we expect will enable us to increase recovery yields and promote customer satisfaction. |
| 6 |
| · | Opportunistic growth via acquisition. Strategic acquisitions are part of our growth strategy, so we will continue selectively seeking strategic assets to acquire in our target industries in order to further enhance our product offerings. Our focus is on acquisitions that have long-term growth potential, target high-growth areas and fill a strategic need in our business portfolio as we seek to provide comprehensive solutions to our customers. |
Employees
As of December 31, 2015, we had 2,316 employees, of which 2,251 were full time. Of our total employees, 208 support selling, general and administrative activities.
Financial Information About Industry Segments
Since the beginning of 2007, we have been managed and operated as one business, with a single management team that reports to the chief executive officer. We do not operate separate lines of business with respect to any of our product lines. Accordingly, we do not prepare discrete financial information with respect to separate product lines or by location and do not have separately reportable segments as defined by the guidance provided by the Financial Accounting Standards Board (the “FASB”).
Available Information
We maintain a website (www.hms.com) that contains various information about our company and our services. Through our website, we make available, free of charge, access to all reports filed with the U.S. Securities and Exchange Commission (the “SEC”), including our Annual Reports on Form 10-K, our Quarterly Reports on Form 10-Q, our Current Reports on Form 8-K and our Proxy Statements, as well as amendments to these reports or statements, as filed with or furnished to the SEC pursuant to Section 13(a) or 15(d) of the Securities Exchange Act of 1934, as amended, (the “Exchange Act”) as soon as reasonably practical after we electronically file such material with, or furnish it to, the SEC. In addition, the SEC maintains a website (www.sec.gov) that contains reports, proxy and information statements and other information regarding issuers that file electronically with the SEC. You may also read and copy this information, including any materials we file with the SEC, for a copying fee, at the SEC’s Public Reference Room at 100 F Street NE, Washington, D.C. 20549. Please call the SEC at 1-800-SEC-0330 to obtain information on the operation of the Public Reference Room. The content on any website referred to in this Annual Report on Form 10-K is not incorporated by reference into this Annual Report on Form 10-K unless expressly noted.
We also make current copies of the following documents available on our website under the Investor Relations/Corporate Governance tabs (http://investor.hms.com/corporate-governance.cfm) the Audit Committee Charter, the Compensation Committee Charter, the Nominating & Governance Committee Charter, the Compliance Committee Charter, our Code of Conduct and our Corporate Governance Guidelines. You may also obtain a copy of any of the foregoing documents, free of charge, if you submit a written request to Attention: Investor Relations, 5615 High Point Drive, Irving, Texas, 75038. We intend to disclose any future amendments or waivers to the provisions of our Code of Conduct that relate to our principal executive officer, principal financial officer, principal accounting officer, controller or persons performing similar functions by filing such information on a Current Report on Form 8-K with the SEC within four business days, to the extent such filing is required by the NASDAQ Marketplace Rules; otherwise, we will disclose such amendments or waivers by posting such information on our website.
Corporate Information
We are incorporated in the State of Delaware. We were originally incorporated on October 2, 2002 in the State of New York. On March 3, 2003, we adopted a holding company structure and assumed the business of our predecessor, Health Management Systems, Inc. In connection with the adoption of this structure, Health Management Systems, Inc., which began doing business in 1974, became our wholly owned subsidiary.
| 7 |
We provide the following cautionary discussion of risks, uncertainties and possibly inaccurate assumptions relevant to our business that, individually or in the aggregate, may cause our actual results to differ materially from expected and historical results. We note these factors for investors as permitted by the “safe harbor” provisions of the Private Securities Litigation Reform Act of 1995. You should consider these factors, but understand that it is not possible to predict or identify all such factors. Consequently, you should not consider the following to be a complete discussion of all potential risks or uncertainties involved with investing in our stock. These risk factors should be read in connection with other information set forth in this Annual Report, including our Consolidated Financial Statements and the related Notes.
Risks Relating to Our Business
Changes in the United States healthcare environment, or in laws relating to healthcare programs and policies, and steps we take in anticipation of such changes, particularly as they relate to the ACA and the Medicare and Medicaid programs, could have a material adverse effect on our business, financial condition, results of operations and cash flows.
The healthcare industry in the United States is subject to changing political, economic and regulatory influences that may affect the procurement practices and operations of federal, state and private healthcare organizations and agencies. In general, the ACA sought to improve access to healthcare by making health insurance available to more legal U.S. residents. The legislation’s strong emphasis on program integrity and cost containment, along with its expansion of Medicaid, created new opportunities to grow our business and our service offerings. However, it will be difficult to predict its full impact and influence on future changes to Medicare policy, due not only to its complexity, but also to the wide range of other factors contributing to uncertainty of the healthcare landscape. Chief among these are the 2016 elections, where several candidates on the federal level have expressed their opposition to the ACA, and some on the state level oppose Medicaid expansion. In addition, certain provisions of the legislation may be repealed or modified. The Medicare RAC Program also faces increased opposition and ongoing legal challenges.
We have made and will continue to make investments in personnel, infrastructure and product development, as well as in the overall expansion of the services that we offer in order to support existing and new customers as they implement the requirements of the ACA. As states seek to contain costs with an expanding Medicaid population, we expect to continue to see an increase in the migration of Medicaid lives from fee-for-service to managed care plans. However, future changes to the ACA and to the Medicare and Medicaid programs may also lower reimbursement rates, establish new payment models, increase or decrease government involvement in healthcare, decrease the Medicare RAC Program, and/or otherwise change the operating environment for our customers. Healthcare organizations may react to such changed circumstances and financial pressures, including those surrounding the implementation of the ACA, by taking actions such as curtailing or deferring their retention of service providers like us, which could reduce the demand for our services. Our business, financial condition, results of operations and cash flows could be adversely affected if efforts to waive, modify or otherwise change the ACA, in whole or in part, are successful, if we are unable to adapt our products and services to meet changing requirements or expand service delivery into new areas, or the demand for our services is reduced as a result of healthcare organizations’ reactions to changed circumstances and financial pressures.
Healthcare spending fluctuations, simplification of the healthcare payment process or other aspects of the healthcare financing system, budgetary pressures and/or programmatic changes diminishing the scope of program benefits, or limiting payment integrity initiatives, could reduce the need for and the price of our services, which would have a material adverse effect on our business, financial condition, results of operations and cash flows.
Our projections and expectations are premised upon consistent growth rates in spending in the Medicare and Medicaid programs, the current healthcare financing system and the need for our services within that existing framework. As enrollment in government healthcare programs continue to grow, particularly under the ACA, we expect the complexities of the healthcare benefit and payment system to continue to grow (due to factors such as the expansion of pay-for-performance programs). Our success as a company is based on offering services that improve the ability of our customers to recover revenue that would otherwise be lost often as a result of procedural inefficiencies and complexities in that system. However, the need for our services, the price customers are willing to pay for them and/or the scope and profitability of our contracts could be negatively affected by a number of factors, including a lower than projected growth in Medicare and Medicaid programs due to developments such as lower medical utilization by new enrollees under the ACA and any legislative action taken to reduce spending. Compounding this are budgetary pressures that may drive changes at the state level, including shifting lives from traditional fee-for-service plans into Medicaid managed care plans to achieve cost savings.
| 8 |
The demand for our services could also be impacted by other changes in government healthcare programs or in the level of government spending, such as: the simplification of the healthcare benefit and payment system through legislative or regulatory changes at the federal or state level (for example, legislative changes impacting the scope of mandatory audits; limiting or reducing the amount of reviewable claims and/or the look-back period for review in areas where we conduct audits); unanticipated reductions in the scope of program benefits (such as, for example, state decisions to eliminate coverage of optional Medicaid services or shifting lives into managed care plans); and/or limits placed on ongoing program integrity initiatives. Modifications in provider billing behavior and habits, often in response to the success of our services or to legislative changes to reduce healthcare spending, could also reduce the profitability of our contracts and reduce the need for our services. For example, during 2014 and 2015, HDI’s recovery audit services under its existing Medicare RAC contract were limited because of delays in the award of the new contracts resulting from pre-award protests and ongoing litigation regarding certain payment terms proposed by CMS as part of the new Medicare RAC proposals. In addition, due to CMS’ implementation of the Two-Midnight Rule, HDI’s review of inpatient hospital claims lasting less than two midnights was suspended beginning in October 2013 and Medicare RACs are no longer permitted to conduct initial medical reviews of such short inpatient stays. Instead, Medicare RACs are now restricted to reviewing hospitals that have consistently high denial rates based on QIO patient status reviews or fail to improve their performance after QIO educational intervention and are subsequently referred to a Medicare RAC by QIOs. Moreover, in connection with the rule’s restrictions, CMS proposed a reimbursement cut in Medicare payments to hospitals in order to offset an anticipated increase in the number of inpatient admissions that would likely result from hospitals no longer having the ability to bill CMS for outpatient services on hospital stays lasting less than two midnights. Federal lawsuits have been filed by hospitals challenging the Two-Midnight Rule on the grounds that the proposed payment reduction violates the Administrative Procedure Act. Revenue associated with Two-Midnight Rule recoveries initiated by Medicare RACs historically were a significant finding for the Medicare RAC program prior to implementation of the moratorium; as a result, the continued suspension or termination of this type of review activity under the Two-Midnight Rule may have a material impact on our future revenue if HDI is awarded a new Medicare RAC contract, depending upon, among other factors, how the Two Midnight Rule is applied by providers, the review strategies ultimately approved by CMS, the scope of improper claims that CMS allows HDI, and the outcome of the federal court challenges to the Two-Midnight Rule. Any of these factors could cause our financial projections to differ from our actual results, and could have a material adverse effect on our business, financial condition, results of operations and cash flows.
Further, in August 2014, CMS announced it would settle with hospitals willing to withdraw inpatient status claims currently pending in the RAC appeals process by offering to pay hospitals 68% for all eligible claims they had billed to Medicare. In June 2015, CMS notified HDI that based on the initial lists of finalized settlements, HDI owed CMS approximately $28.6 million due to adjustments in contingency fees pursuant to HDI’s contract with CMS. HDI had previously advised CMS that it disagreed with CMS’ interpretation of the contract and has requested additional support and accurate backup data for specific audits from CMS to further evaluate the potential impact of the hospital settlement on fees that it has been, or is due to be paid, and its respective position with respect to the resolution of the matter, which continues to remain uncertain at this time. While there are uncertainties in any dispute resolution and results cannot be guaranteed, HDI accrues an estimated liability for appeals based on the amount of fees that are subject to appeals, closures or other adjustments, which we estimate are probable of being returned to providers following a successful appeal. A portion of our reserve for estimated liability for appeals recorded as of December 31, 2015 may apply to this population, and there could be a material negative impact on our future revenue in future periods to the extent that (i) any final determination of amounts owed by HDI to CMS under the current Medicare RAC contract materially exceeds our accrued reserves for such appeals, (ii) HDI is required to return certain fees which have been paid or (iii) HDI’s ability to collect fees for audits already performed is affected.
Our business could be adversely affected if we fail to maintain a high level of customer retention, lose a major customer or fail to renew or reprocure a contract, or if customers elect to reduce the scope of our contracts or terminate them before their scheduled expiration dates.
Although each of our customers accounted for less than 10% of revenue from continuing operations in 2015, we generate a significant portion of our revenue from a limited number of large customers at the federal and state level. Our contracts with these customers are subject to periodic renewal and/or re-bidding processes and permit them to terminate their contracts on short notice, with or without cause. Since several of our contracts, including those with many of our largest customers, may be terminated upon short notice for convenience, dissatisfied customers might seek to exit existing contracts prior to their scheduled expiration date and could direct future business to our competitors. Government customers are also subject to financial pressures or pressure from stakeholders that may cause them to redefine or reduce the scope of our contracts (by, for example, significantly reducing the volume of data that we are permitted to audit) or terminate contracts for our services that may be regarded as non-essential. Despite our right to prompt and full payment under the terms of our contracts, we could face challenges in obtaining timely or full payments for our properly provided services from customers and parties who we provide services to. The unexpected termination, substantial reduction or failure to reprocure or renew a contract with a major customer could reduce our revenue and adversely affect our business.
| 9 |
Our success also depends on relationships we develop with our customers that enable us to understand our customers’ needs and deliver solutions and services that are tailored to meet those needs. If a customer is dissatisfied with the quality of our work or we fail to meet performance standards under our contracts, or if our products, technical infrastructure or services do not comply with the provisions of our contractual agreements or applicable regulatory requirements, we could incur additional costs that may impair the profitability of a contract and damage our ability to obtain additional work from that customer, or other current or prospective customers. For example, some of our contracts contain liquidated damages provisions and financial penalties related to performance failures, which if triggered, could adversely affect our reputation, business, financial condition, results of operations and cash flows. Although we have liability insurance, the policy coverage and limits may not be adequate to provide protection against all potential liabilities, and we may encounter, and have to litigate, disputes with our insurers over the existence and scope of coverage under those policies. We also may be required to disclose liquidated damages or other financial penalties assessed against us in connection with future bids for services with other customers, which may reduce our chances of winning such procurements. Further, under the terms of one of our contracts, we issued an irrevocable letter of credit for $3.0 million to secure our performance, which we established against our existing revolving credit facility. If a claim is made against this letter of credit or any similar instrument that we obtain in the future, we would be required to reimburse the issuer of the letter of credit for the amount of the claim.
If we lose a major customer; if we fail to maintain a high level of customer retention; if we fail to reprocure a contract; if our customers reduce the scope of our contracts or limit future contracting opportunities; or if we are exposed to significant costs, liabilities or negative publicity, our ability to compete for new contracts with current or prospective customers could be damaged and our business, financial condition, reputation, results of operations and cash flows could be materially adversely affected.
We face significant competition for our services and we expect competition to increase.
Competition among U.S. healthcare insurance benefit cost containment service providers is intense and we expect to encounter additional competition due primarily to advances in technology. Many of the cost containment services we provide are being targeted by formidable competitors with national reputations, and their success in attracting business or winning contract bids could significantly and/or adversely affect our business. Our current competitors include large business outsourcing and technology firms; the other Medicare RACs; Medicaid Management Information Systems (“MMIS”) vendors; other claim audit vendors; fraud, waste and abuse claim edit and predictive analysis companies; primary claims processors; numerous regional utilization management companies; analytics and software vendors; as well as clearinghouses, healthcare consulting firms and other TPL service providers.
In addition, current and prospective customers could compete by electing to perform some or all of their recovery and cost avoidance functions in-house, or they could develop in-house capacities for some of the services that we provide or hope to provide, therefore deciding not to engage us or reducing the quality of service they purchase from us. Certain state customers may decide to combine or “bundle” TPL services under large-scale IT procurements, allowing MMIS vendors to partner with less experienced TPL identification vendors based on preferred relationships or favorable pricing. Some of our competitors have also merged or formed business alliances with other competitors, which may affect our ability to work with potential customers. In some areas of our business, we could face potential competition from our current or former subcontractors or teaming partners, who may use their position to establish their own relationships with our customers and seek to become prime contractors on similar work in the future. As certain vendors and healthcare providers consolidate to create integrated systems with greater market recognition and financial resources, these entities may be able to offer lower prices or negotiate fee reductions on our current products and services. Although we attempt to protect ourselves against such conduct through the terms of our subcontracts and teaming agreements, a subcontractor or teaming partner may determine that the benefits of violating its contract with us outweigh the costs and risks.
We must remain competitive with our existing business and service capabilities and develop new products and services, which will require not only that we make substantial financial and resource investments, but that we quickly respond to new or emerging technologies and to changes in customer requirements and the healthcare industry. As industry standards continue to rapidly evolve, companies that have invested in proprietary technology different from our own product and service offerings, such as front-end analytics, have emerged as new competitors. There is also increasing sophistication in certain services and our competitors are constantly developing products and services that may become more efficient or appealing to our customers. Although the quality and value of new products introduced by competitors may be unknown, our current and future customers may decide to try these untested solutions because of the lower pricing models offered by our competitors. In certain cases, our competitors and potential competitors have significantly greater resources and market recognition than we have and may be able to devote greater resources to the sale of their services, the development and implementation of new and improved systems and solutions for the customers that we serve, or the pursuit of various acquisitions that allows them to quickly amass a wide array of capabilities. We cannot provide assurance that our new or modified product and service innovations will be responsive to customer preferences or industry changes, or that the product development initiatives that we prioritize will yield the gains that we anticipate, if any.
| 10 |
We cannot provide assurance that we will be able to compete successfully against existing or new competitors. In addition, we may be forced to lower our pricing, unexpectedly increase or enhance our technological or data capabilities, or modify our service offerings, or the demand for our services may decrease as a result of increased competition. Further, a failure to be responsive to our existing and potential customers’ needs or to the changing industry landscape could hinder our ability to maintain or expand our customer base, hire and retain new employees, pursue new business opportunities, complete future acquisitions and operate our business effectively. Any inability to compete effectively could materially adversely affect our business, financial condition, results of operations and cash flows.
If we are unable to protect our intellectual property rights the value of our products and services may be diminished and our business may be adversely affected.
Our success as a company depends in part upon our ability to protect our core technology and intellectual property. Our expanding operations and efforts to develop new products and services also make protection of our intellectual property more critical. However, the steps we have taken to deter misappropriation of intellectual property may be insufficient to protect our proprietary information. From time to time, competitors have attempted to use state open records and/or federal Freedom of Information Act laws to obtain our proposal responses and other documents we provide to our government customers. We cannot be certain that our efforts to protect the confidential and proprietary trade secret information or intellectual property in these proposals or other documents will always be successful, due to the many factors that go into the various state and federal decisions to release information in response to open records requests (even in spite of our objections and responses). In addition, misappropriation of our intellectual property by third parties, or any disclosure or dissemination of our confidential and proprietary business intelligence, queries, algorithms and other similar information by any means, could undermine any competitive advantage we currently derive or may derive from that intellectual property. For example, our current or former employees, consultants or other third parties may unintentionally or willfully disclose our trade secrets, know-how or other confidential and proprietary information to competitors. In order to enforce our rights, we may be required to engage in costly and time-consuming litigation or legal proceedings in which we may not ultimately prevail. On the other hand, third parties may claim that we are infringing upon or misappropriating their intellectual property. Our exposure to risks related to the use of intellectual property may also increase as a result of acquisitions since third parties may make infringement and similar or related claims after we have acquired technology. Any of these situations could cause us to expend significant time and resources and to incur substantial costs associated with litigation that may be necessary to defend ourselves or to enforce our intellectual property rights and could result in our being prevented from furnishing certain products and services. Although we have taken measures to protect our proprietary rights, we cannot provide assurance that others will not compete with our business by offering products or concepts that are substantially similar to ours. If the protection of our proprietary rights is inadequate to prevent unauthorized use or appropriation by third parties or our employees, the value of our brand and other intangible assets may be diminished and competitors may be able to more effectively mimic our products and services, which could have an adverse effect on our business, financial condition, results of operations and cash flows.
A federal or state government agency’s determination to award a contract may be challenged by an interested party. As a result, even if we win a bid, the contract may be delayed or may never be implemented if such a challenge is successful.
In order to market our services to customers, we are often required to respond to government-issued requests for proposals (“RFPs”) to compete for a contract. The state and federal laws and regulations governing procurements of goods and services provide procedures by which other bidders and other interested parties may challenge the award of a government contract. Challenges or protests to government awards may be filed even if there are no valid legal grounds on which to base the protest. If any such protests are filed, the government agency may decide to withhold a contract award or suspend performance under the contract while the protest is being considered, or may choose to take corrective action on its own, in each case, potentially delaying the start of the contract. If we are the original awardee of a protested contract, we could be forced to expend considerable funds to defend a potential award, while also incurring expenses to maintain our ability to timely start implementation in case the protest is resolved in our favor. It can take many months to resolve these protests, and even if it is resolved in our favor, the resulting delay in the start-up and funding of our work under the contracts may cause our actual results to differ materially and adversely from those anticipated. In the event of irregularities we perceive or learn of in the award or bidding process, we also may be forced to file protests in response to RFP awards to other bidders, at significant cost to us. In addition, a contract award may be terminated or the government agency may opt to solicit new bids and award a new contract if a protest is successful or the government agency chooses not to uphold its original award. We cannot provide assurance that we will prevail if a contract we are awarded is protested or that if we protest an award our challenge will be successful. Extended implementation delays or successful protests of our contract awards could have a material adverse effect on our financial condition or results of operations.
| 11 |
For example, our wholly owned subsidiary HDI has served as the Medicare RAC for Region D since October 2008. After multiple contract modifications due to the delay in procurement of the new Medicare RAC contract awards, HDI’s Medicare RAC contract now provides for a term that expires on July 31, 2016. The most recent extension further requires HDI to continue to support the appeal process from August 1, 2016 through January 31, 2018. CMS has also implemented new ADR limits for inpatient providers that set the ADR requirement to 0.5%, from the standards through 2015 of 2.0%. This change significantly impacts the volumes of claims Medicare RACs will review for inpatient providers and reduces their ability to identify overpayments and underpayments. On November 6, 2015, CMS released a new RFP for recovery audit services, including those currently performed by HDI, for each of the CMS Recovery Audit regions. This reprocurement replaces the procurement activities begun in February 2013 for the new Medicare RAC contracts, which were significantly delayed, in part, by the cancellation of the original and second procurements following the Government Accountability Office’s denial of pre-award protests and the ongoing litigation in regards to certain procurements terms. The current procurement has paused, pending the results of a second Request for Information (“RFI”) released by CMS on December 31, 2015 that sought to gather requirements for recovery auditing work for health plans. Changes to the procurement based on the RFI have not yet been made known. Currently, CMS’ answers to questions submitted regarding the Medicare RAC procurement are pending and a proposal due date has not been published. The timing and outcome of the new Medicare RAC contract awards continue to remain uncertain and the prolonged delay of the new contract awards may further impact our business. In addition, in the event HDI is awarded one or more regions, the new Medicare RAC contract may contain substantially different terms from HDI’s current contract and such terms may change or delay the timing of HDI’s revenue recognition under the current contract.
We obtain a significant portion of our business through competitive bidding in response to government requests for proposals and future contracts may not be awarded through this process on the same level and we may not reprocure certain contracts.
To effectively respond to government RFPs, we are often required to accurately estimate our cost structure for servicing a proposed contract, the time required to establish operations and the likely terms of any proposals submitted by our competitors. We must also assemble and submit a large volume of information within a RFP’s rigid timetable, and our ability to provide timely and complete responses to RFPs will greatly impact our business. Should any part of our business suffer a negative event, such as customer dispute, a government inquiry or an adverse judgment or settlement in a litigation proceeding, we may be required to disclose the occurrence of that event in a RFP, which could impact our ability to win the contract at issue. Even if we win these contracts, we are not always able to secure the most favorable contract terms and conditions with our government customers, which may impact our ability to protect our rights relating to payment, our intellectual property, our employees, and other contractual rights. We also cannot provide assurance that we will continue to obtain contracts in response to government RFPs, that we will be successful in re-winning contracts after they expire, or that our proposals will result in profitable contracts. In addition, if we are unable to win reprocurements on particular contracts, we may be precluded from entering certain customer markets for the term of the contract awarded to another party. If we are unable to consistently win new contract awards over any extended period, our business and prospects will be adversely affected.
Our ability to expand our business will be adversely affected if we fail to implement our growth strategy.
The size and the scope of our business operations have expanded over the past several years, and we expect that we will continue to grow and expand into new areas within the government and private healthcare space; however, such growth and expansion carries costs and risks that, if not properly managed, could adversely affect our business. Our future growth will depend, among other things, on our ability to successfully execute our business plans and continued efforts to improve our operations, all while remaining competitive. We must also be flexible and responsive to our customers’ needs and to changes in the political, economic and regulatory environment in which we operate. The greater size and complexity of our expanding business puts additional strain on our administrative, operational and financial resources and makes the determination of optimal resource allocation more difficult. We cannot provide assurance that we will be able to maintain or accelerate our growth. A failure to anticipate or properly address the demands and challenges that our growth strategy and potential diversification may have on our resources and existing infrastructure may result in unanticipated costs and inefficiencies and could negatively impact our ability to execute on our business plans and growth goals, which could have a material adverse effect on our business, financial condition, results of operations and cash flows.
| 12 |
Our operating results are subject to significant fluctuations due to factors including variability in the timing of when we recognize contingency fee revenue and the challenges associated with forecasting revenue for new products and services. As a result, you will not be able to rely on our operating results in any particular period as an indication of our future performance.
Our operating results may fail to match our past or projected performance. We have experienced significant variations in our revenue between reporting periods due to the timing of periodic revenue recovery projects, the timing and delays in third party payers’ claim adjudication and ultimate payment to our customers where our revenue is contingent upon such collections and delays in receiving payment for our services. Our revenue and operating results have also been impacted from period to period as a result of a number of factors, including:
| · | fluctuations in sales activity given our sales cycle |
| · | the commencement, completion or termination of contracts during any particular quarter; |
| · | expenses related to certain contracts which may be incurred in periods prior to revenue being recognized; |
| · | the timing of government contract awards; |
| · | the time required to resolve bid protests; |
| · | contract renewal discussions, which result in delayed payments for previously provided services; |
| · | technological and operational issues affecting our customers, including delays in payment receipt for previously recognized revenue due to delays in certain customers processing our findings through their systems; |
| · | adjustments to age/quality of receivables and accruals as a result of delays involving contract limitations and changes or subcontractor performance deficiencies or internal managerial decision not to pursue identified claim revenue from customers; and |
| · | regulatory changes or general economic conditions as they affect healthcare providers and payers. |
Occasionally our state and federal customers are requested by third party payers to refund payments that we previously recovered for our customers. If our state and federal customers choose to refund money in response to these requests, regardless of whether an error actually occurred in connection with the payments, we may also be required to return contingent revenue which we were previously paid associated with such refunded payments. We also typically face a long implementation period with a new customer of a new contract with an existing customer and may not be able to estimate with certainty the period in which implementation may be completed. Although we do not consider our operations to be seasonal to any material degree, we have experienced some seasonal trends in our operational volume that have caused our operating results to fluctuate.
In addition, we may not be able to accurately estimate the factors upon which we base our contract pricing, or the costs and timing for implementing and completing contracts when we introduce new products and services into the marketplace, making it difficult to reliably forecast revenue under those contracts. For a majority of our customer contracts, the payment of our fee is contingent upon the recoveries received by our customers. We also have cost-plus or time-and-material based contracts with the federal government where our revenue is recognized based on costs incurred plus an estimate of the negotiated fee earned. Our ability to earn a profit on these contracts requires that we accurately estimate the costs involved with these contracts and assess the probability of achieving certain outcomes or milestones within the contracted time period. If we do not accurately estimate the costs and timing for completing projects, or if we encounter increased or unexpected costs, delays, failures, liabilities or risks, including those outside of our control, our contracts could prove unprofitable for us or yield lower profit margins than anticipated. Although we believe that we have recorded adequate provisions in our financial statements for losses on our fixed-price and cost-plus contracts where applicable, as required under United States generally accepted accounting principles (“U.S. GAAP”), we cannot provide assurance that our contract loss provisions will be adequate to cover all actual future losses. We cannot predict the extent to which future revenue variations could occur due to these or other factors. Consequently, our results of operations are subject to significant fluctuation and our results of operations for any particular quarter or fiscal year may not be indicative of results of operations for future periods.
| 13 |
We must comply with laws and regulations regarding individual privacy and information security, including taking steps to ensure that our workforce, vendors, subcontractors and other business associates who obtain access to sensitive information about individuals maintain its confidentiality. Our failure, or a failure by our business associates, to comply with those laws and regulations, whether or not inadvertent, could subject us to legal actions, fines and penalties and negatively impact our reputation and operations.
As a service provider, we often receive, process, transmit and store protected health information (“PHI”) of individuals, as well as other financial, confidential and proprietary information belonging to our customers, our subsidiaries and third parties (e.g., private insurance companies, financial institutions) from which we obtain information. The use and disclosure of that information is regulated through federal and state laws and rules, which are changed frequently by legislation, regulatory issuances and/or administrative interpretation. Various state laws address the use and disclosure of individually identifiable financial and health data. Some are derived from the privacy and security provisions such as in the federal Gramm-Leach-Bliley Act, the Health Insurance Portability and Accountability Act of 1996 (“HIPAA”), as amended by the Health Information Technology for Economic and Clinical Health Act (“HITECH”), and the regulations implementing these laws. HIPAA also imposes standards and requirements on our business associates (as this term is defined in the HIPAA regulations), including our subcontractors and many of our vendors.
In January 2013, the U.S. Department of Health and Human Services issued Final Omnibus Privacy, Security, Breach Notification, and Enforcement Rules that modified and supplemented many of the standards and regulations under HIPAA and HITECH. These rules significantly increased the risk of liability to us and our business associates and subcontractors and made more incidents of inadvertent disclosure reportable and subject to penalties. Even though we take measures to comply with all applicable regulations and to ensure our business associates and subcontractors comply with these laws, regulations and rules, we have less than complete control over our business associates’ and subcontractors’ actions and practices. In addition, we could also be exposed to data breach risk if there is unauthorized access to one of our or our subcontractors’ secure facilities or from lost or stolen laptops, other portable media from current or former employee theft of data containing PHI, from misdirected mailings containing PHI, or other forms of administrative or operational error. If we or our subcontractors fail to comply with applicable laws; if unauthorized parties gain physical access to one of our facilities and steals or misuses confidential information; if we erroneously use or disclose data in a way that is inconsistent with our granted rights; or if such information is misdirected, lost or stolen during transmission or transport, we may suffer damage to our reputation, potential loss of existing customers and difficulty attracting new customers. We could also be exposed to, among other things, unfavorable publicity, governmental inquiry and oversight, allegations by our customers that we have not performed our contractual obligations, costs to provide notifications to affected individuals, or litigation by affected parties and possible financial obligations for damages or indemnification obligations related to the theft or misuse of such information, any of which could have a material adverse effect on our business, financial condition, results of operations and cash flows.
Further, as regulatory focus on privacy issues continues to increase and laws and regulations concerning the protection of personal information expand and become more complex, these potential risks to our business could intensify. Changes in laws or regulations associated with the enhanced protection of certain types of sensitive data, such as healthcare data or other personally identifiable information, along with increased customer demands for enhanced data security infrastructure, could greatly increase our cost of providing our services. See Risk Factor - “Our systems and networks may be subject to cyber security breaches and other disruptions that could compromise our information and harm our business" for additional information.
System interruptions or failures could expose us to liability and harm our business.
Our data and operation centers are essential to our business and our operations depend on our ability to maintain and protect our information systems. We attempt to mitigate the potential adverse effects of a disruption, relocation or change in operating environment; however, we cannot provide assurance that the situations we plan for and the amount of insurance coverage that we maintain will be adequate in any particular case. In addition, despite systems redundancy and security measures, our systems and operations are vulnerable to damage or interruption from, among other sources:
| · | power loss, transmission cable cuts and telecommunications failures; |
| · | damage or interruption caused by fire, earthquake and other natural disasters; |
| · | software defects; |
| · | cyber security breaches; and |
| · | physical break-ins, sabotage, intentional acts of vandalism, terrorist attacks and other events beyond our control. |
| 14 |
In addition, while there are backup systems in many of our operating facilities, an extended outage of utility or network services supplied by third party IT vendors or providers may delay or disrupt the delivery or performance of the services we provide for our customers. If we encounter a business interruption or fail to effectively maintain our information systems, if it takes longer than we anticipate to complete required upgrades, enhancements or integrations, or in the event our business continuity plans and business interruption insurance do not effectively compensate on a timely basis, we could suffer operational disruptions, disputes with customers, civil or criminal penalties, regulatory problems, increases in administrative expenses, loss of our ability to produce timely and accurate financial and other reports or other adverse consequences, any of which could have a material adverse effect on our business, financial condition, results of operations and cash flows.
We intend to continue to pursue acquisition opportunities, which may subject us to considerable business and financial risk, and if we are unable to successfully integrate the businesses that we acquire, we may not realize the anticipated benefits of acquisitions and our results of operations could be adversely affected.
Historically, to achieve our strategic goals, we have made a significant number of acquisitions that have expanded the products and services we offer, provided a presence in complementary business lines, or expanded our geographic presence and/or customer base. Business acquisitions and combinations involve a number of risk factors that could affect our operations, including:
| · | diversion of management’s attention and other resources; |
| · | our ability to maintain relationships with the customers of the acquired business and further develop the acquired business; |
| · | our ability to cross-sell our services and the services of the acquired businesses to our respective customers; |
| · | compliance with regulatory requirements and avoiding potential conflicts of interest in markets that we serve; |
| · | our ability to integrate the operations and personnel of the acquired business, including the transition of operations, users and customers to our existing platforms or the integration of data, systems and technology platforms with ours; |
| · | our ability to retain or replace key personnel; |
| · | entry into unfamiliar markets; |
| · | assumption of unanticipated legal or financial liabilities and/or negative publicity related to prior acts by the acquired entity; |
| · | litigation or other claims in connection with the acquired company, including claims from terminated employees, customers, former shareholders or third parties; |
| · | becoming significantly leveraged as a result of incurring debt to finance an acquisition; |
| · | unanticipated operating, accounting or management difficulties in connection with the acquired entities; |
| · | impairment of goodwill and other acquired intangible assets; and |
| · | dilution to our earnings per share. |
We intend to continue our acquisition strategy to expand and diversify our business. We cannot, however, provide assurance that we will be able to identify any potential acquisition candidates or consummate additional acquisitions or that future acquisitions will be successfully integrated or will be advantageous to us. Entities we acquire may not achieve the revenue and earnings we anticipate or their liabilities may exceed our expectations. We could face integration issues pertaining to the internal controls and operational functions of the acquired companies and we also could fail to realize cost efficiencies or synergies that we anticipated when selecting our acquisition candidates. Customer dissatisfaction or performance problems with a particular acquired entity could materially and adversely affect our reputation as a whole. We may be unable to profitably manage entities that we have acquired or that we may acquire, or we may fail to integrate them successfully without incurring substantial expenses, delays or other problems. If we fail to successfully integrate the businesses that we acquire, we may not realize any of the benefits that we anticipate in connection with the acquisitions and that could have a material adverse effect on our reputation, business, financial condition, results of operations and cash flows.
We may not be able to realize the entire book value of goodwill and other intangible assets from acquisitions.
As of December 31, 2015, we have $361.5 million of goodwill and $54.3 million of net intangible assets. We assess goodwill and other intangible assets at least annually for impairment in the second quarter of each year, or more frequently if certain events or circumstances warrant. In the event that the book value of goodwill is impaired, any such impairment would be charged to earnings in the period of impairment. We cannot provide assurance that future impairment of goodwill will not have a material adverse effect on our business, financial condition, results of operations and cash flows.
| 15 |
We are subject to extensive government regulation and our government contracts are subject to audit and investigation rights. Any violation of the laws and regulations applicable to us or a negative audit or investigation finding could have a material adverse effect on our reputation, business, financial condition, results of operations and cash flows.
Much of our business is regulated by the federal government and the states in which we operate. The laws and regulations governing our operations are generally intended to benefit and protect individual citizens, including government program beneficiaries, health plan members and providers, rather than shareholders. The government agencies administering these laws and regulations have broad latitude to enforce them. These laws and regulations, along with the terms of our government contracts, regulate how we do business, what services we offer and how we interact with our customers, providers, other healthcare payers and the public. We are subject, on an ongoing basis, to various governmental reviews, audits and investigations to verify our compliance with our contracts and applicable laws and regulations.
In addition, because we receive payments from federal and state governmental agencies, we are subject to various laws, including the Federal Acquisition Regulations, the Foreign Corrupt Practices Act, federal and state employment, equal opportunity and affirmative action laws, federal and state prompt pay statutes, as well as the Federal False Claims Act and similar state statutes, which permit government law enforcement agencies to institute suits against us for violations and, in some cases, to seek double or treble damages, penalties and assessments. In addition, private citizens, acting as whistleblowers, can sue on behalf of the government under the “qui tam” provisions of the Federal False Claims Act and similar statutory provisions in many states.
The expansion of our operations into new products and services may further expose us to requirements and potential liabilities under additional statutes and legislative schemes that have previously not been relevant to our business, such as banking and credit reporting statutes, that may both increase demands on our resources for compliance activities and subject us to potential penalties for noncompliance with statutory and regulatory standards. Increased involvement in analytic or audit work that can have an impact on the eligibility of individuals for medical coverage or specific benefits, or payments made by our customers to providers, could increase the likelihood and incidence of our being subjected to scrutiny or legal actions by parties other than our customers, based on alleged mistakes or deficiencies in our work, with significant resulting costs and strain on our resources.
If the government discovers improper or illegal activities in the course of audits or investigations, we may be subject to various civil and criminal penalties and administrative sanctions, which may include termination of contracts, forfeiture of profits, suspension of payments, fines and suspensions and debarment from doing business with the government. The risks to which we are subject, particularly under the Federal False Claims Act and similar state fraud statutes, have increased in recent years due to legislative changes that have (among other amendments) expanded the definition of a false claim to include, potentially, any unreimbursed overpayment received from, or other monetary debt owed to, a government agency. This subjects us to potential liability for a false claim, for example, where we may be overcharged for services by a subcontractor and may pass that charge on to a government customer, or where we may have a good faith disagreement with a government agency’s view of whether an overpayment has occurred. If we are found to be in violation of any applicable law or regulation, or if we receive an adverse review, audit or investigation, any resulting negative publicity, penalties or sanctions could have an adverse effect on our reputation in the industry, impair our ability to compete for new contracts and have a material adverse effect on our business, financial condition, results of operations and cash flows.
The federal government or a state may limit or prohibit the outsourcing of certain programs or functions, or may refuse to grant consents and/or waivers necessary to permit private entities, such as us, to perform certain elements of government programs or functions, or there may be other state or federal limitations on our outsourcing of work or our vendor use that obstruct cost-effective performance of our contracts.
The federal government or a state could limit or prohibit private contractors like us from operating or performing elements of certain government functions or programs. State or local governments could be required to operate such programs with government employees as a condition of receiving federal funding. Moreover, under current law, in order to privatize certain functions of government programs, the federal government must grant a consent and/or waiver to the petitioning state or local agency. If the federal government does not grant a necessary consent or waiver, the state or local agency will be unable to outsource that function to a private entity. Such a situation could eliminate a contracting opportunity or reduce the value of an existing contract.
Similarly, other state or federal limitations on outsourcing certain types of work to vendors that supplement our own workforce could make it more difficult for us to fulfill our contracts in a cost-effective manner. Certain segments of our operations use or involve vendor or subcontractor personnel located outside of the United States, who may (under carefully controlled circumstances) access certain PHI in the course of assisting us with various elements of the services we provide to our customers. There is, however, increasing pressure from an expanding number of sources to prohibit the use of off-shore labor, particularly on government contracts. The federal government and a number of states have considered laws and/or issued rules and orders that would limit, restrict or wholly prohibit the use of off-shore labor in performance of government contracts, or impose sanctions for the use of such resources. Some of our customers have already chosen to contractually limit or restrict our ability to use off-shore resources. Intensified restrictions of this type or associated penalties could raise our costs of doing business, expose us to unexpected fines or penalties, increase the prices we must charge to customers to realize a profit and eliminate or significantly reduce the value of existing contracts or potential contract opportunities, any of which could have a material adverse effect on our business, financial condition, results of operations and cash flows.
| 16 |
We may rely on subcontractors and partners to provide customers with a single-source solution or we may serve as a subcontractor to a third party prime contractor.
From time to time, we may engage subcontractors, teaming partners or other third parties to provide our customers with a single-source solution for a broader range of service needs. Similarly, we are and may in the future be engaged as a subcontractor to a third party prime contractor. Subcontracting arrangements where we are not the prime contractor pose unique risks to us because we do not have control over the customer relationship, and our ability to generate revenue under such subcontracts is dependent on the prime contractor, its performance and relationship with the customer, and its relationship with us. While we believe that we perform appropriate due diligence on our prime contractors, subcontractors and teaming partners, and that we take adequate measures to ensure that they comply with the appropriate laws and regulations, we cannot guarantee that those parties will comply with the terms set forth in their agreements with us (or in the case of a prime contractor, their agreement with the customer), or that they will be reasonable in construing their contractual rights and obligations, always act appropriately in dealing with us or customers, provide adequate service, or remain in compliance with the relevant laws, rules or regulations. We may have disputes with our prime contractors, subcontractors, teaming partners or other third parties arising from the quality and timeliness of work being performed, customer concerns, contractual interpretations or other matters. Performance deficiencies or misconduct by our prime contractors or subcontractors or perceived performance deficiencies by us could result in a contract termination and/or could adversely affect our customer relationships and reputation. We may be exposed to liability if we lose or terminate a subcontractor or teaming partner due to a dispute, and subsequently have difficulty engaging an appropriate replacement or otherwise performing their functions in-house, such that we fail to fulfill our contractual obligations to our customer. For example, our ability to service our customers and deliver and implement solutions require that we work with certain third party IT providers, including software vendors, utility and network providers, and depends on such third parties meeting our expectations in both timeliness and quality. If the services provided by these third party providers do not meet our expectations, or if they terminate or refuse to renew their relationships with us or were to offer their products to us in the future on less advantageous terms, we may not be able to deliver or perform our services for existing customers as expected, which could result in a customer terminating our contract and expose us to additional liabilities, and harm our current and future customer relationships. Likewise, we could face contractual liability in the event a prime contract, under which we serve as a subcontractor, is terminated, whether for non-performance by the prime contractor or otherwise, then our subcontract will similarly terminate and the resulting contract loss could adversely affect our business, financial condition, results of operations and cash flows.
Our business depends on effective information processing systems that are compliant with current HIPAA transaction and code set standards and the integrity of the data in, and operations of, our information systems, as well as those of other entities that provide us with data or receive data from us.
Our ability to conduct our operations and accurately report our financial results depends on the integrity of the data in our information systems and the integrity of the processes performed by those systems. These information systems and applications require continual maintenance, upgrading and enhancement to meet our operational needs, satisfy customer requests and handle our expansion and growth. Despite our testing and quality control measures, we cannot be certain that errors or system deficiencies will not be found and that remediation can be done in a timeframe that is acceptable to our customers or that customer relationships will not be impaired by the occurrence of errors or the need for remediation. In addition, implementation of upgrades and enhancements may cost more, take longer or require more testing than originally expected. Given the large amount of data we collect and manage, it is possible that hardware failures or errors or technical deficiencies in our systems could result in data loss or corruption or cause the information that we collect, utilize or disseminate to be incomplete or contain inaccuracies that our customers regard as significant.
Through several of the services we provide, situations arise in which the accuracy of our data analysis or the content and quality of our work product is central to the disposition of claims, controversies or litigation between our customers and third parties. When such situations arise, we may be required to allocate significant resources to fulfilling our contractual obligations to provide our customers with full and complete access to records, analysis and back-up documentation of our work. Assuring our capacity to fulfill these obligations, as well as actually fulfilling such obligations, can impose significant burdens on our infrastructure for data storage, maintenance and processing, requiring us to prioritize maintenance of and access to these resources, or incur additional costs to supplement them in order to satisfy our obligations. Should the frequency or scope of situations in which customers invoke these obligations increase to a substantial degree, the resulting strain on our personnel, data storage and computing resources could negatively impact other business operations.
| 17 |
Moreover, because many of the services we furnish to customers involve submitting high volumes of monetary claims to third parties (such as health insurance carriers) and processing payments from them, the efficiency and effectiveness of our own operations are to some degree dependent on the claims processing systems of these third parties and their compliance with any new transaction and code set standards. On October 1, 2015, health plans, private payers and healthcare providers were required to transition to the new ICD-10 coding system, which greatly expanded the number and detail of diagnosis codes used for inpatient, outpatient and physician claims. The transition to the new transaction and code set standard initially caused disruptions and delays as we and other stakeholders made the necessary system adjustments to be fully compliant and capable of exchanging data. Although we have successfully updated our systems to allow for processing of ICD-10 values on claims, there could be delays if the third parties with whom we work with failed to timely or effectively implement the new transaction and code set standards within the required timeframe or if they continue to be out of compliance with the new standards. Claims processing systems failures, incapacities or deficiencies internal to these third-parties may continue to significantly delay or obstruct our ability to recover money for our customers, and thereby interfere with our performance under our contracts and our ability to generate revenue from those contracts in the timeframe we anticipate, which in turn could have a material adverse effect on our business, financial condition, results of operations and cash flows.
We depend on many different entities to supply information and an inability to successfully manage our relationships with a number of these suppliers may harm the quality and availability of our services
We obtain data used in our services from many sources, including private health insurance plans, financial institutions, managed care organizations, government entities and non-government entities. In addition, our ability to normalize and fully utilize, within our contractual rights, the data we have obtained from these sources to enhance and improve our current product offerings is an important component of our growth strategy. From time to time, challenges arise in managing and maintaining our relationships with entities that are not our customers and that furnish information to us pursuant to a combination of voluntary cooperation and legal obligation under laws and regulations that are often subject to differing interpretation. Our data suppliers may determine that some uses of data for our customers are not permitted by our agreements, and seek to limit or end our access and use of certain data for particular purposes or customers. They may also make errors in compiling, transmitting or accurately characterizing data, or may have technological limitations that interfere with our receipt or use of the data we are relying upon them to provide. If a number of information sources or suppliers become unable or unwilling to provide us with certain data under terms of use that are acceptable to us and our customers, or if the applicable regulatory and law enforcement regime for use and protection of this data changes in a way that imposes unacceptable or unreasonable conditions or risks on us or disincentivizes our suppliers to continue to provide us with data, we cannot provide assurance that we will be able to obtain new agreements with alternative data suppliers on terms favorable to us, or at all. Further, although we believe that we have the legal and contractual rights necessary to use the data we have obtained from these sources to normalize and use information for our customer solutions, we cannot assure you that these entities will allow us to use their data for all potential or contemplated product or service offerings. If we lose our data sources or access to certain data; are unable to identify and reach the requisite agreements with suitable alternative suppliers and integrate these data sources into our service offerings; or there is a lack of integrity of data that our suppliers provide, we could experience service disruptions, increased costs, reduced quality of our services and/or performance penalties under our customer contracts, which could have an adverse effect on our business, financial condition, results of operations or cash flows.
Our systems and networks may be subject to cyber security breaches and other disruptions that could compromise our information and harm our business.
In the ordinary course of our business, we rely heavily upon our technology systems and networks to input, maintain and communicate the confidential and proprietary data we receive on behalf of our customers. The secure processing and maintenance of this information is critical to our operations and business strategy. Our security measures could be compromised and, as a result, our data, customers’ data, information technology or infrastructure could be accessed improperly, made unavailable, improperly modified, corrupted by computer hackers, nefarious actors, computer viruses or other malicious software programs that could attack our services, or breached due to employee error or malfeasance, all of which could create system disruptions and cause shutdowns or denials of service. This is also true for third-party products or services that we use. In addition, subcontractors, teaming partners or other third party vendors that receive or utilize confidential information on our behalf may become subject to a security breach, which may result in unauthorized access to such third party’s information systems and/or our customers’ protected information. The occurrence of any of these events could cause our services to be perceived as vulnerable, cause our customers to lose confidence in our services, negatively affect our ability to attract new customers, cause existing customers to terminate or not renew our services and damage our reputation, all of which could reduce our revenue, increase our expenses and expose us to legal claims and regulatory actions. Similarly, if our internal networks are compromised, we could be adversely affected by the loss of proprietary, trade secret or confidential technical and financial data. Because techniques used to obtain unauthorized access or sabotage systems change frequently and generally are not identified until they are launched against a target, we may be unable to anticipate these techniques or to implement adequate preventive measures. We could be forced to expend significant resources in response to a cyber-security breach, including repairing system damage, increasing cyber security protection costs by deploying additional personnel and protection technologies, paying regulatory fines and litigating and resolving legal claims and regulatory actions, all of which could increase our expenses, divert the attention of our management and key personnel away from our business operations and adversely affect our results of operations.
| 18 |
We may be a party to litigation, regulatory, or other dispute resolution proceedings, and adverse judgments or settlements in any of these proceedings could harm our business, financial condition and operating results.
We are subject and may be a party to lawsuits and other claims that arise from time to time in the ordinary course of our business. These may include lawsuits and claims related to, for example, contracts, subcontracts, teaming agreements, protection of confidential information or trade secrets, adversary proceedings arising from customer bankruptcies, employment of our workforce and immigration requirements or compliance with any of a wide array of state and federal statutes, rules and regulations that pertain to different aspects of our business. We may also be required to initiate expensive litigation or other proceedings to protect our business interests. In addition, because of the payments we receive from government customers, we may be subject to unexpected inquiries, investigations, legal actions or enforcement proceedings pursuant to the False Claims Act, healthcare fraud, waste and abuse laws or similar legislation. Any investigations, settlements or adverse judgments stemming from such legal disputes or other claims may result in significant monetary damages or injunctive relief against us, as well as reputational injury that could adversely affect us or our ability to bid in response to RFPs in one or more jurisdictions. There is a risk that we will not be successful or otherwise be able to satisfactorily resolve any pending or future litigation. In addition, litigation and other legal claims are subject to inherent uncertainties and management’s view of currently pending legal matters may change in the future. Those uncertainties include, but are not limited to, litigation costs and attorneys’ fees, unpredictable judicial or jury decisions and the differing laws and judicial proclivities regarding damage awards among the states in which we operate. Unexpected outcomes in such legal proceedings, or changes in management’s evaluation or predictions of the likely outcomes of such proceedings (possibly resulting in changes in established reserves), could have a material adverse effect on our business, financial condition, results of operations and cash flows.
We may be precluded from bidding on and/or performing certain work due to other work we currently perform.
Various laws, regulations and administrative policies prohibit companies from performing work for government agencies in capacities that might be viewed to create an actual or perceived conflict of interest. In particular, CMS has stringent conflict of interest rules, which can limit our bidding for specific work for CMS, or for other contracts that might conflict, or be perceived by CMS to conflict, with contractual work for CMS. State governments and managed care organizations also have conflict of interest restrictions that could limit our ability to bid for certain work and impede our overall sales strategy. As we continue to expand and diversify our business operations, the likelihood that customers or potential customers will perceive conflicts of interest between our various subsidiaries, products, services, activities and customer relationships may increase. Such conflicts, whether real or perceived, could result in a loss of contracts or additional internal structural barriers that delay operational efficiency, or may require that we divest ourselves of certain existing businesses or reorganize our current management and personnel structure, as well as our corporate organization and entity structure, in order to qualify for new contract awards or to appropriately mitigate conflicts and otherwise accommodate the needs as a company that is expanding in complexity. Our failure to devote sufficient care, attention and resources to managing these adjustments may result in technical or administrative errors that could expose us to potential liability or adverse regulatory action. In addition, conflict of interest rules and standards change frequently, and are subject to varying interpretations and varying degrees and consistency of enforcement at the federal, state and municipal levels, and we cannot provide assurance that we will be successful in navigating these restrictions. If we are prevented from expanding our business or are unable to effectively implement our strategic initiatives due to real or perceived conflicts of interest, our business and results of operations could be adversely affected.
| 19 |
We may not be able to manage our business effectively if we are unable to attract and retain qualified employees.
Our delivery of services has a continuing need to attract skilled personnel. For example, when we are awarded a contract, we may need to quickly hire project leaders, case management staff and other personnel with the specific qualifications required by our contracts. The additional staff could then create a concurrent demand for increased administrative personnel. Our ability to maintain our productivity and profitability is limited by our ability to recruit, employ, train and retain the skilled personnel necessary to fulfill our contractual requirements and otherwise sustain our business and operations. The success of recruitment and retention strategies depend on a number of factors, including the competitive demands for employees having the skills we need and the level of compensation required to hire and retain such employees. As our business expands and undergoes change, we may also find it difficult to preserve our corporate culture, which could reduce our ability to innovate and operate effectively or result in a loss of experienced personnel. In addition, our customers or competitors may hire away our qualified employees. Despite our best efforts to protect our interests in our agreements with employees or customers, we may not in all instances be able to secure protective contractual rights or retain our employees. Some competitors may also decide that the benefits of hiring our employees who are limited by contractual terms outweighs the costs and risks. We cannot provide assurance that we will be able to recruit the appropriate personnel in the timeframe required to fulfill our contractual obligations, we will be successful in maintaining the personnel necessary to efficiently operate and support our business, or if our recruitment and retention strategies are successful, our labor costs will not increase significantly. Our inability to hire sufficient personnel on a timely basis and without significantly increasing our labor costs could adversely affect our business, financial condition, results of operations and cash flows.
Our future success depends, in part, on the continued service and availability of key personnel and our ability to manage leadership transitions successfully.
Our ability to execute on our business plans may be impacted if our management team cannot work together effectively, or if members of our senior management team resign. In addition, our success requires that we attract, develop, motivate and retain experienced and innovative executive officers and senior managers who have successfully managed or designed government services programs or have relevant experience in other sectors of the data management or healthcare industry, and information technology professionals who have designed or implemented complex information technology projects. Innovative, experienced and technologically- proficient individuals are in great demand and are likely to remain a limited resource. Due to the intense competition for these individuals, we cannot provide assurance that we will be able to continue to attract and retain the most capable and desirable executive officers and senior managers. To the extent we lose experienced personnel, we must put processes in place for management transition, including leadership development and succession planning throughout our business, and successfully manage the transfer of critical knowledge from those individuals. We may incur increased expenses in connection with the hiring, promotion or replacement of any of these key individuals. The loss of the services of one or more of our executive officers, or the loss of significant numbers of senior managers or information technology professionals, could adversely affect our business, financial condition, results of operations and cash flows.
Our outstanding indebtedness could adversely affect our financial condition and our ability to operate our business, and we may not be able to generate sufficient cash flows to meet our debt service obligations.
In December 2011, we entered into a five-year, revolving and term secured credit agreement with certain financial institutions and Citibank, N.A. as Administrative Agent in connection with our acquisition of HDI. In May 2013, we amended and restated the credit agreement and entered into a $500 million five-year revolving credit agreement (the “Credit Agreement”). Under specified circumstances, the revolving credit facility under the Credit Agreement can be increased or one or more incremental term loan facilities can be added. Our obligations and any amounts due under the Credit Agreement are guaranteed by our material subsidiaries and secured by a security interest in all, or substantially all, of our and our subsidiaries’ physical assets. As of December 31, 2015, the outstanding principal balance due on the revolving credit facility was $197.8 million.
Our outstanding indebtedness and any additional indebtedness we incur may have important consequences for us, including, without limitation, that: we may be required to use a substantial portion of our cash flow to pay the principal of and interest on our indebtedness; our indebtedness and leverage may increase our vulnerability to adverse changes in general economic and industry conditions, as well as to competitive pressures; our ability to obtain additional financing for working capital, capital expenditures, acquisitions and for general corporate and other purposes may be limited; and our flexibility in planning for, or reacting to, changes in our business and our industry may be limited.
In addition, our ability to make payments of principal and interest on our outstanding revolving credit facility depends upon our future performance and our ability to generate cash flows. Under the terms of the Credit Agreement, we are required to comply with specified financial and operating covenants, which may limit our ability to operate our business as we otherwise might operate it. For example, our obligations may be accelerated upon the occurrence of an event of default, which includes customary events of default including, without limitation, payment defaults, failure to perform affirmative covenants, failure to refrain from actions or omissions prohibited by negative covenants, the inaccuracy of representations or warranties, cross-defaults, bankruptcy and insolvency related defaults, defaults relating to judgments, defaults due to certain ERISA related events and a change of control default. If not cured, an event of default would result in any amounts outstanding, including any accrued interest and unpaid fees, becoming immediately due and payable, which would require us to, among other things: seek additional financing in the debt or equity markets, refinance or restructure all or a portion of our indebtedness, sell selected assets, and/or reduce or delay planned capital or operating expenditures. Such measures might not be sufficient to enable us to service our debt, and any such financing or refinancing might not be available on economically favorable terms or at all. If we are not able to generate sufficient cash flows to meet our debt service obligations or are forced to take additional measures to be able to service our indebtedness, our business and results of operations could be materially and adversely affected.
| 20 |
Changes in, or interpretations of, tax rules and regulations may adversely affect our effective tax rates.
We are a United States-based company subject to various federal, state and local tax laws and regulations in multiple U.S. jurisdictions that govern numerous aspects of our business. As we expand our business, we may perform services for new customers located outside of the United States or in a U.S. Territory, which may subject us to foreign tax laws and regulations that could increase our exposure to additional tax liabilities. Unanticipated changes in our tax rates could affect our future results of operations. Our future effective tax rates could be unfavorably affected by changes in the tax rates in jurisdictions where our income is earned and taxed, by changes in, or our interpretation of, tax rules and regulations in the jurisdictions in which we do business, by providing services in new geographies, by increases in expenses not deductible for tax purposes including impairments of goodwill, by changes in U.S. GAAP or by changes in the valuation of our deferred tax assets and liabilities.
In addition, we are subject to the continual examination of our income tax returns by the U.S. Internal Revenue Service (“IRS”) and other domestic tax authorities. We regularly assess the likelihood of outcomes resulting from these examinations to determine the adequacy of our provision for income taxes and have reserved for potential adjustments that may result. There can be no assurance that the final determination of any of these examinations will not have an adverse effect on our financial condition, results of operations and cash flows.
Our health insurance coverage and self-insurance reserves may not cover future claims.
We maintain various insurance policies for company employee health, workers’ compensation, general liability and property damage. We are self-insured for our health plans, and have purchased a fully-insured stop loss policy to help offset our liability for both individual and aggregate claim costs. We are also responsible for losses up to a certain limit for workers’ compensation, general liability and property damage insurance.
For policies under which we are responsible for losses, we record a liability that represents our estimated cost of claims incurred and unpaid as of the balance sheet date. Our estimated liability is not discounted and is based on a number of assumptions and factors, including historical trends, actuarial assumptions and economic conditions, and is closely monitored and adjusted when warranted by changing circumstances. Our prior growth could affect the accuracy of estimates based on historical experience. Should a greater amount of claims occur compared to what was estimated or medical costs increase beyond what was expected, our accrued liabilities might not be sufficient and we may be required to record additional expense. Unanticipated changes may also produce materially different amounts of expense than reported under these programs, which could adversely affect our financial condition, results of operations and cash flows.
Risks Related to Our Common Stock
The market price of our common stock may be volatile.
The market price of our common stock has fluctuated widely and may continue to do so. During the 52-week period ended February 19, 2016, the closing price of our common stock on the NASDAQ Global Select market ranged from a high of $19.10 per share, to a low of $8.24 per share.
| 21 |
We expect our stock price to be subject to fluctuations as a result of a variety of factors, including factors beyond our control. Some of these factors are:
| · | actual or anticipated variations in our results of operations; |
| · | the gain or loss of significant contracts or the changes in the contingency fee rates or other significant terms of our business arrangements with our significant customers; |
| · | delays in our development and introduction of new services; |
| · | changes in government policies or regulations; |
| · | delays by state or federal government agencies in the awarding of contracts, including the impact of any protests or lawsuits filed in connection with the award of any such contracts; |
| · | developments in our relationships with current or future customers and suppliers; |
| · | operating and stock price performance of other companies that investors deem comparable to our company; |
| · | news reports relating to trends, concerns and other issues in the healthcare industry; |
| · | perceptions in the marketplace regarding us and/or our competitors; |
| · | acquisitions or business combinations, strategic partnerships, joint ventures or capital commitments by or involving us or our competitors; |
| · | political developments affecting healthcare at the federal, state or local level; |
| · | our failure to integrate acquisitions or realize anticipated benefits from acquisitions; |
| · | the hiring or departure of key personnel; |
| · | the introduction of new services by us or our competitors; |
| · | changes in estimates of our performance or recommendations by securities analysts; |
| · | the financial projections we publicly provide and any changes in or failure to meet those projections; |
| · | future sales of shares of common stock in the public market by our executive officers or directors; |
| · | any other changes in the amount of our outstanding shares, including as a result of share repurchases; |
| · | the public’s response to our press releases, or other public announcements, including our filings with the SEC; |
| · | securities class actions, shareholder lawsuits or other litigation; and |
| · | market conditions in the industry and the economy as a whole. |
In addition, the stock market often experiences significant price and volume fluctuations. These fluctuations are often unrelated to the operating performance of particular companies. These broad market fluctuations may adversely affect the market price of our common stock. When the market price of a company’s stock drops significantly, shareholders may institute securities class action litigation against that company. Any litigation against us could cause us to incur substantial costs, divert the time and attention of our management and other resources or otherwise harm our business.
Failure to maintain adequate internal controls may affect our ability to timely or accurately report our financial results.
As a public company, we are subject to the reporting requirements of the Exchange Act and other rules and regulations of the SEC, the Sarbanes-Oxley Act of 2002 and the listing requirements of the NASDAQ Global Select Market. Our management is responsible for establishing and maintaining adequate internal control over our financial reporting, as defined in Rule 13a-15(f) under the Exchange Act. Although we consistently assess the adequacy of our internal controls over financial reporting, these controls have inherent limitations, including human error, the possibility that controls could become inadequate because of changed conditions, the circumvention or overriding of controls and fraud. If we are unable to identify or to remediate material weaknesses or significant deficiencies in our internal controls, our consolidated financial statements may contain material misstatements and we could be required to restate our financial results. If our financial statements are not accurate, investors may not have a complete understanding of our operations. Likewise, if our financial statements are not filed on a timely basis as required by the SEC and NASDAQ, we could face severe consequences from those authorities. Either case may cause investors to lose confidence in our reported financial information, which could result in a material adverse effect on our business or have a negative effect on the trading price of our stock.
Because we do not intend to pay dividends, you will benefit from an investment in our common stock only if it appreciates in value.
We have paid no cash dividends on any of our capital stock to date and currently intend to retain our future earnings, if any, to fund the development and growth of our business. As a result, we do not expect to pay any cash dividends in the foreseeable future. The success of your investment in our common stock will likely depend entirely upon any future appreciation. There is no guarantee that our common stock will appreciate in value or even maintain the price at which you purchased your shares.
| 22 |
Certain provisions of our certificate of incorporation and bylaws could discourage unsolicited takeover attempts, which could depress the market price of our common stock.
Our certificate of incorporation authorizes the issuance of up to 5,000,000 shares of “blank check” preferred stock with such designations, rights and preferences as may be determined by our Board of Directors. Accordingly, our Board of Directors is empowered, without shareholder approval, to issue preferred stock with dividend, liquidation, conversion, voting or other rights, that could adversely affect the voting power or other rights of holders of our common stock. In the event of issuance, preferred stock could be utilized, under certain circumstances, as a method of discouraging, delaying, or preventing a change in control. Although we have no present intention to issue any shares of preferred stock, we cannot provide assurance that we will not do so in the future. In addition, our bylaws provide for a classified Board of Directors and require advance notice of shareholder proposals for business to be conducted at meetings of our shareholders and for nominations of candidates for election to our Board of Directors, which could also have the effect of discouraging a change of control.
Item 1B. Unresolved Staff Comments.
None.
In June 2010, we purchased the 223,000 square foot office building in Irving, Texas that serves as our corporate headquarters and as the primary center for our operational activities. In addition, in February 2014, we entered into a lease agreement for 63,922 square feet of office space in Las Vegas, Nevada. As of December 31, 2015, we leased approximately 168,000 square feet of office space in 27 other locations throughout the United States, the leases for which have expiration dates later in 2016 and through 2024. See Note 13 - “Commitments and Contingencies” in our Notes to the Consolidated Financial Statements in Item 8. Consolidated Financial Statements and Supplementary Data for additional information about our lease commitments. In general, we believe our facilities are suitable to meet our current and reasonably anticipated future needs.
The information set forth under the caption “Litigation” in Note 13 of the Notes to the Consolidated Financial Statements included in Part II, Item 8. Consolidated Financial Statements and Supplementary Data is incorporated by reference.
Item 4. Mine Safety Disclosures.
Not applicable.
Item 5. Market for Registrant’s Common Equity, Related Stockholder Matters and Issuer Purchases of Equity Securities.
Repurchases of Shares of Treasury Stock
On July 30, 2015, our Board of Directors approved a share repurchase program authorizing the repurchase of up to $75 million of our common stock from time to time on the open market or in privately negotiated transactions. The repurchase program is authorized through July 30, 2017, and may be suspended or discontinued at any time. Repurchased shares will be available for use in connection with issuance under our stock plans and for other corporate purposes. Repurchases may be made under a Rule 10b5-1 plan, which would permit shares to be repurchased when we might otherwise be precluded from doing so under insider trading laws. The timing and amount of any shares repurchased under the program will be determined by our management based on its evaluation of market conditions and other factors. During the year ended December 31, 2015, we repurchased $50 million of our common stock pursuant to this authorization and 10b5-1 plans.
| 23 |
The summary of our repurchases of our common stock through the date hereof is as follows:
| Period | Total Number of Shares Purchased | Average Price Paid Per Share | Total
Number of Shares Purchased as Part of Publicly Announced Program(1) | Maximum Approximate Dollar Value of Shares That May Yet Be Purchased Under the Program | ||||||||||||
| July 1, 2015 to July 31, 2015 | - | $ | - | - | $ | - | ||||||||||
| August 1, 2015 to August 31, 2015 | 2,562,065 | 9.40 | 2,562,065 | 50,000,000 | ||||||||||||
| September 1, 2015 to September 30, 2015 | - | - | - | - | ||||||||||||
| July 1, 2015 to September 30, 2015 | 2,652,065 | $ | 9.40 | 2,652,065 | $ | 50,000,000 | ||||||||||
| October 1, 2015 to October 31, 2015 | - | $ | - | - | $ | - | ||||||||||
| November 1, 2015 to November 30, 2015 | 1,631,119 | 11.64 | 1,631,119 | 19,000,000 | ||||||||||||
| December 1, 2015 to December 31, 2015 | 464,257 | 12.83 | 464,257 | 6,000,000 | ||||||||||||
| October 1, 2015 to December 31, 2015 | 2,095,376 | $ | 11.91 | 2,095,376 | 25,000,000 | |||||||||||
| Total | 4,747,441 | $ | 10.51 | 4,747,441 | $ | 25,000,000 | ||||||||||
| (1) | Represents shares repurchased through our Share Repurchase Program publicly announced in August 2015. |
Market Information
Our common stock is included in the NASDAQ Global Select Market, under the symbol HMSY. The table below summarizes the market closing high and low sales prices per share for our common stock for the periods indicated, as reported on the NASDAQ Global Select Market.
| High | Low | |||||||
| Year ended December 31, 2015 | ||||||||
| Quarter ended December 31, 2015 | $ | 13.05 | $ | 8.64 | ||||
| Quarter ended September 30, 2015 | $ | 17.10 | $ | 8.24 | ||||
| Quarter ended June 30, 2015 | $ | 18.18 | $ | 15.44 | ||||
| Quarter ended March 31, 2015 | $ | 21.73 | $ | 15.32 | ||||
| High | Low | |||||||
| Year ended December 31, 2014 | ||||||||
| Quarter ended December 31, 2014 | $ | 23.23 | $ | 18.39 | ||||
| Quarter ended September 30, 2014 | $ | 23.00 | $ | 18.41 | ||||
| Quarter ended June 30, 2014 | $ | 20.41 | $ | 15.74 | ||||
| Quarter ended March 31, 2014 | $ | 26.05 | $ | 18.89 | ||||
Holders
As of the close of business on February 12, 2016, there were 312 holders of record of our common stock.
Dividends
We have not paid any cash dividends on our common stock and do not anticipate paying cash dividends in the foreseeable future. Our current intention is to retain earnings to support the future growth of our business.
In addition, our Credit Agreement restricts our ability to make certain payments or distributions with respect to our capital stock, including cash dividends to our shareholders. These restrictions are described in more detail in Item 7. Management’s Discussion and Analysis of Financial Condition and Results of Operations, under “Liquidity and Capital Resources” and in Note 7 – “Credit Agreement”, in our Notes to the Consolidated Financial Statements under Item 8. Consolidated Financial Statements and Supplementary Data.
| 24 |
Comparative Stock Performance Graph
The graph below compares the cumulative total shareholder return on our common stock with the cumulative total shareholder returns of the NASDAQ Composite Index, the NASDAQ Computer & Data Processing Index and the NASDAQ Health Services Index assuming an investment of $100 on December 31, 2010 and the reinvestment of dividends through the year ended December 31, 2015.
COMPARISON OF 5 YEAR CUMULATIVE TOTAL RETURN*
Among HMS Holdings Corp., the NASDAQ Composite Index, the NASDAQ Computer & Data Processing Index and the NASDAQ Health Services Index

____________________________
| * | $100 invested on 12/31/10 in stock or index, including reinvestment of dividends. | |
| Year ending December 31. |
| 12/31/10 | 12/31/11 | 12/31/12 | 12/31/13 | 12/31/14 | 12/31/15 | |||||||||||||||||||
| HMS Holdings Corp. | $ | 100.00 | $ | 148.12 | $ | 120.06 | $ | 105.14 | $ | 97.92 | $ | 57.16 | ||||||||||||
| NASDAQ Composite | $ | 100.00 | $ | 100.53 | $ | 116.92 | $ | 166.19 | $ | 188.78 | $ | 199.95 | ||||||||||||
| NASDAQ Computer & Data Processing | $ | 100.00 | $ | 100.83 | $ | 108.27 | $ | 165.81 | $ | 190.41 | $ | 224.42 | ||||||||||||
| NASDAQ Health Services | $ | 100.00 | $ | 86.01 | $ | 97.08 | $ | 144.55 | $ | 175.56 | $ | 196.21 | ||||||||||||
Notwithstanding anything to the contrary set forth in any of our previous or future filings under the Securities Act of 1933, as amended, or the Securities Exchange Act of 1934, as amended, that might incorporate by reference this Annual Report on Form 10-K or future filings made by us under those statutes, the Stock Performance Graph is not deemed filed with the Securities and Exchange Commission, is not deemed soliciting material and shall not be deemed incorporated by reference into any of those prior filings or into any future filings we make under those statutes, except to the extent that we specifically incorporate such information by reference into a previous or future filing, or specifically request that such information be treated as soliciting material, in each case under those statutes.
| 25 |
Item 6. Selected Financial Data.
The following table sets forth selected consolidated financial amounts at and for each of the five fiscal years in the period ended December 31, 2015. It should be read in conjunction with Management’s Discussion and Analysis of Financial Condition and Results of Operations, included in Item 7 of this Annual Report and the Consolidated Financial Statements and Supplementary Data thereto, included in Item 8 of this Annual Report.
| Years ended December 31, | ||||||||||||||||||||
| 2015 | 2014 | 2013 | 2012 | 2011 | ||||||||||||||||
| Statement of Operations Data | ||||||||||||||||||||
| (in thousands, except per share amounts) | ||||||||||||||||||||
| Revenue | $ | 474,216 | $ | 443,225 | $ | 491,762 | $ | 473,696 | $ | 363,826 | ||||||||||
| Total operating expenses | 426,644 | 409,021 | 414,584 | 374,184 | 282,955 | |||||||||||||||
| Operating income | 47,572 | 34,204 | 77,178 | 99,512 | 80,871 | |||||||||||||||
| Interest expense | (7,812 | ) | (7,931 | ) | (12,460 | ) | (16,561 | ) | (605 | ) | ||||||||||
| Interest income | 49 | 57 | 71 | 12 | 65 | |||||||||||||||
| Other income, net | - | - | 801 | 382 | 632 | |||||||||||||||
| Income before income taxes | 39,809 | 26,330 | 65,590 | 83,345 | 80,963 | |||||||||||||||
| Income taxes | 15,282 | 12,383 | 25,593 | 32,829 | 33,178 | |||||||||||||||
| Net income | $ | 24,527 | $ | 13,947 | $ | 39,997 | $ | 50,516 | $ | 47,785 | ||||||||||
| Net Income Per Common Share | ||||||||||||||||||||
| Basic income per common share: | ||||||||||||||||||||
| Net income per common | ||||||||||||||||||||
| share - basic | $ | 0.28 | $ | 0.16 | $ | 0.46 | $ | 0.59 | $ | 0.56 | ||||||||||
| Diluted income per common share: | ||||||||||||||||||||
| Net income per common | ||||||||||||||||||||
| share - diluted | $ | 0.28 | $ | 0.16 | $ | 0.45 | $ | 0.57 | $ | 0.55 | ||||||||||
| Weighted average shares: | ||||||||||||||||||||
| Basic | 87,881 | 87,673 | 87,598 | 86,204 | 84,588 | |||||||||||||||
| Diluted | 88,361 | 88,164 | 88,344 | 88,365 | 87,444 | |||||||||||||||
| Years ended December 31, | ||||||||||||||||||||
| 2015 | 2014 | 2013 | 2012 | 2011 | ||||||||||||||||
| Balance Sheet Data | ||||||||||||||||||||
| (in thousands) | ||||||||||||||||||||
| Cash and cash equivalents | $ | 145,610 | $ | 133,116 | $ | 93,366 | $ | 135,227 | $ | 97,003 | ||||||||||
| Working capital | $ | 247,916 | $ | 226,271 | $ | 199,069 | $ | 205,537 | $ | 169,862 | ||||||||||
| Total assets | $ | 858,057 | $ | 880,988 | $ | 878,602 | $ | 926,052 | $ | 869,331 | ||||||||||
| Revolving credit facility | $ | 197,796 | $ | 197,796 | $ | 232,796 | $ | - | $ | - | ||||||||||
| Term loan, less current portion | $ | - | $ | - | $ | - | $ | 297,500 | $ | 332,500 | ||||||||||
| Total shareholders' equity | $ | 524,702 | $ | 533,090 | $ | 502,439 | $ | 462,874 | $ | 391,237 | ||||||||||
| 26 |
Item 7. Management’s Discussion and Analysis of Financial Condition and Results of Operations.
We begin Management’s Discussion and Analysis of Financial Condition and Results of Operations with a business overview discussion. We then present the critical accounting policies that we believe are important to understanding the assumptions and judgments incorporated in our reported financial results followed by a discussion of our results of operations. We provide an analysis of our liquidity and capital resources, including discussions of our sources of capital, cash flows and financial commitments, and present the effects of recent accounting pronouncements.
The following discussion and analysis of financial condition and results of operations should be read in conjunction with the other sections of this Annual Report, including the disclaimer regarding forward-looking statements appearing prior to Part I, Item 1, the Risk Factors appearing in Part I, Item 1A and the Consolidated Financial Statements and Supplemental Data thereto appearing in Part II, Item 8. Historical results set forth in Part II, Item 6, Item 7 and Item 8 of this Annual Report should not be taken as necessarily indicative of our future operations.
Business Overview
We are managed and operate as one business, with a single management team that reports to the Chief Executive Officer. We do not operate separate lines of business with respect to any of our product lines. We operate in the U.S. healthcare insurance benefit cost containment marketplace. We provide coordination of benefits services to government and private healthcare payers and sponsors to ensure that the responsible party pays healthcare claims. Our payment integrity services ensure that healthcare claims billed are accurate and appropriate. Together, these various services help customers recover improper payments, including from liable third parties; prevent future improper payments; reduce fraud, waste and abuse; and ensure regulatory compliance.
As of December 31, 2015, we served 45 state Medicaid programs and the District of Columbia, CMS, and the VHA. We also provided services to approximately 250 health plans and supported their multiple lines of business, including Medicaid managed care, Medicare Advantage and group and individual health. We also served as a subcontractor for certain business outsourcing and technology firms.
2015 Highlights and Year in Review
Total revenue was $474.2 million for the year ended December 31, 2015, an increase of $31.0 million compared to total revenue of $443.2 million for the year ended December 31, 2014. This increase is primarily as a result of the expansion of services to our existing customers and growth through serving private health plan customers. In addition, our state government customers continue their use of our services for coordination of benefits and other cost containment functions. Revenue excluding our Medicare RAC business for the year ended December 31, 2015 was $453.7 million, an increase of $32.5 million, or 7.7%, compared to prior year revenue excluding Medicare RAC of $421.2 million.
Our financial condition was impacted by a number of key factors in 2015, including the continued growth in Medicaid and Medicare enrollment and spending, changes to healthcare legislation and payment reform, successes in our health plan sales program, focused initiatives to accelerate contract implementations and improve operational yield, the outcome of state reprocurements, pending legal proceedings, and the increased competitive activity for our core coordination of benefits business.
For the year ended December 31, 2015, revenue from private health plans and employers was $203.1 million, an increase of $32.2 million, or 18.8%, from $170.9 million in 2014. This increase was driven by the number of new members we added to our health plan customer base and our sale of additional products to existing health plan customers. In addition, for the year ended December 31, 2015, our government revenue was $226.1 million, an increase of $0.3 million, from $225.8 million in 2014. Our non-Medicare RAC federal and other revenue for the year ended December 31, 2015 was $24.6 million, an increase of $0.1 million from $24.5 million in 2014.
CMS has been our customer since 2006. Our largest contract with CMS is through HDI, under which HDI has served as the Medicare RAC for Region D since October 2008 and which, after multiple contract modifications, now provides for a term that expires July 31, 2016. For the year ended December 31, 2015, revenue recognized under this agreement was $20.5 million, a decrease of $1.5 million from the prior year revenue of $22.0 million. The transitional reduction in revenue from the Medicare RAC from prior years is due to the continued delay of new contract awards under the Medicare RAC Program and the suspension of inpatient hospital claim reviews under the Two Midnight Rule. See the Risk Factor “Healthcare spending fluctuations, simplification of the healthcare payment process or other aspects of the healthcare financing system, budgetary pressures and/or programmatic changes diminishing the scope of program benefits, or limiting payment integrity initiatives, could reduce the need for and the price of our services, which would have a material adverse effect on our business, financial condition, results of operations and cash flows” for additional information.
| 27 |
One of our largest customers in 2015 was the New Jersey Department of Human Services. We provide TPL services to this customer pursuant a contract that was originally awarded in January 2008. We also provide Medicaid RAC and utilization review services for this customer. In July 2015, in connection with the reprocurement of the TPL contract, we received notice from the State of New Jersey Division of Purchase and Property, Procurement Bureau (the “Division”) of its intent to award the new TPL contract to another bidder. On February 12, 2016, HMS filed a protest challenging the Division’s award. On February 24, 2016, our current TPL contract was extended through March 31, 2016.
Given that these customers are some of our largest customers, failure to reprocure these contracts or an unfavorable outcome from protests or related legal proceedings could have a material adverse effect on our financial condition, results of operations and cash flows. See the Risk Factors “Our business could be adversely affected if we fail to maintain a high level of customer retention, lose a major customer or fail to renew or reprocure a contract, or if customers elect to reduce the scope of our contracts or terminate them before their scheduled expiration dates” and “A federal or state government agency’s determination to award a contract may be challenged by an interested party. As a result, even if we win a bid, the contract may be delayed or may never be implemented if such a challenge is successful.”
Outlook
To date, we have grown our business through the internal development of new services and through acquisitions of businesses whose core services strengthen our overall mission to help our customers control healthcare costs. Our largest growth during 2015 was with private health plan customers and we expect this marketplace to present the greatest opportunity for growth in the year ahead, particularly with the ongoing expansion of Medicaid and Medicare managed care (Medicare Advantage). We plan to drive our growth by leveraging our expertise and expanding our role and contracts with current customers through the introduction of new services, audit strategies and claim types. Our goal is to develop and build on these existing partnerships with our state, federal and health plan customers and our other partners to provide services that better address their business needs and promote customer satisfaction. We also expect to continue increasing recovery yields from our current products by enhancing our operating and organizational efficiency and by implementing new technology that will improve the quality and effectiveness of our service offerings.
Critical Accounting Policies
Revenue Recognition: We provide products and services under contracts that contain various fee structures, including contingency fee and fixed fee arrangements. We recognize revenue when a contract exists, services have been provided to the customer, the fee is fixed and determinable, and collectability is reasonably assured. In addition, we have contracts with the federal government which are generally cost-plus or time and material based. Revenue on cost-plus contracts is recognized based on costs incurred plus the negotiated fee earned. Revenue on time and materials contracts is recognized based on hours worked and expenses incurred.
Under our Medicare RAC contract with CMS, our Medicaid RAC contracts with various states, and similar contracts for private health plan customers, we recognize revenue when claims are sent to the customer for offset against future claims payments. Providers have the right to appeal a claim and may pursue additional appeals if the initial appeal is found in favor of the customer. We accrue an estimated liability for appeals based on the amount of revenue that is subject to appeals, closures or other adjustments and which we estimate are probable of being returned to providers following a successful appeal. This estimated liability for appeals is an offset to revenue in our Consolidated Statements of Income. Our estimates are based on our historical experience with appeals. The estimated liability for appeals of $33.1 million at December 31, 2015, and $36.8 million as of December 31, 2014, represents our estimate of the potential amount of repayments related to appeals of claims, closures and other adjustments for which revenue was previously collected. This is reflected as a separate line item in the current liabilities section of our balance sheet titled “Estimated liability for appeals.” To the extent the amount to be returned to providers following a successful appeal, closure or other adjustment exceeds the amount accrued, revenue in the applicable period would be reduced by the amount of the excess.
As of December 31, 2015, we have accrued an estimated liability for appeals and estimated allowance for appeals based on our historical experience with this activity under our customers’ contracts. At this time, we do not believe that we face a risk of significant loss in excess of the amounts accrued. Accordingly, we believe that an estimate of any possible loss in excess of the amounts accrued is immaterial. Any future changes to any of our customer contracts, including further modifications to the transition plan for incumbent Medicare RACs, may require us to apply different assumptions that could affect our estimated liability for future periods. We similarly accrue an allowance against accounts receivable related to revenue yet to be collected, based on the same estimates used to establish the estimated liability for appeals of revenue received. Our inability to correctly estimate the estimated liabilities and allowance against accounts receivable could adversely affect our revenue in future periods.
| 28 |
In addition, some of our contracts may include customer acceptance provisions. Formal customer sign-off is not always necessary to recognize revenue, provided we objectively demonstrate that the criteria specified in the acceptance provision are satisfied. Due to the range of products and services that we provide and the differing fee structures associated with each type of contract, we may recognize revenue in irregular increments.
Expense Classifications: Our cost of services is presented in the categories set forth below. Each category within cost of services excludes expenses relating to selling, general and administrative functions, which are presented separately as a component of total operating expenses. A description of the primary expense included in each category is provided below:
Cost of Services:
| · | Compensation: Salary, fringe benefits, bonus and stock compensation |
| · | Data processing: Hardware, software and data communication costs. |
| · | Occupancy: Rent, utilities, depreciation, office equipment, repair and maintenance costs. |
| · | Direct project expense: Variable costs incurred from third party providers that are directly associated with specific revenue generating projects and employee travel expense. |
| · | Other operating expense: Professional fees, temporary staffing, travel and entertainment, insurance and local and property tax costs. |
| · | Amortization of intangible assets: Amortization cost of acquisition related software and intangible assets. |
Selling, general and administrative:
| · | Expenses related to general management, marketing and administration activities including stock-based compensation expense and bad debt expense. |
Accounting for Income Taxes: Income taxes are accounted for under the asset and liability method. Under this method, deferred tax assets and liabilities are recognized for the future tax consequences attributable to temporary differences between the financial statement carrying amounts of existing assets and liabilities and their respective tax bases. This method also requires the recognition of future tax benefits for net operating loss carry-forwards. Deferred tax assets and liabilities are measured using enacted tax rates expected to apply to taxable income in the years in which those temporary differences are expected to be recovered or settled. The effect on deferred tax assets and liabilities of a change in tax rates is recognized as income in the period that includes the enactment date. A valuation allowance is provided against deferred tax assets to the extent their realization is not more likely than not.
Uncertain income tax positions are accounted for by prescribing a minimum recognition threshold that a tax position is required to meet before being recognized in the financial statements.
Valuation of Goodwill: Goodwill, representing the excess of acquisition costs over the fair value of assets and liabilities of acquired businesses, is subject to a periodic assessment for impairment in accordance with Accounting Standards Codification (“ASC”) 350—Intangibles, Goodwill and Other. We assess goodwill for impairment on an annual basis as of June 30 of each year or more frequently if an event occurs or changes in circumstances would more likely than not reduce the fair value of a reporting unit below its carrying amount. Our assessment of goodwill impairment is at the HMS Holdings Corp. entity level as we operate as a single reporting unit.
We have the option to perform a qualitative assessment to determine if an impairment is more likely than not to have occurred. If we can support the conclusion that it is more likely than not that the fair value of a reporting unit is greater than its carrying amount, then we would not need to perform the two-step impairment test for that reporting unit. If we cannot support such a conclusion, or we do not elect to perform the qualitative assessment, then the first step of the goodwill impairment test is used to identify potential impairment by comparing the fair value of a reporting unit with its carrying amount, including goodwill.
HMS completed the annual impairment test as of June 30, 2015 and determined no impairment existed. The result of the annual impairment test indicated that the fair value of the reporting unit is substantially in excess of its carrying amount, including goodwill. There were no impairment charges related to goodwill during the years ended December 31, 2015, 2014 or 2013.
| 29 |
Estimating valuation allowances and accrued liabilities, such as bad debt: The preparation of financial statements requires our management to make estimates and assumptions that affect the reported amount of assets and liabilities and disclosure of contingent assets and liabilities at the date of the financial statements and the reported amount of revenue and expenses during the reported period. In particular, management must make estimates of the probability of collecting our accounts receivable. When evaluating the adequacy of the allowance for doubtful accounts, management reviews our accounts receivable based on an analysis of historical bad debts, customer concentrations, customer credit-worthiness, current economic trends and changes in our customer payment terms. As of December 31, 2015 and 2014, the accounts receivable balance was $169.1 million and $157.1 million, respectively, net of allowance for doubtful accounts of $4.8 million and $4.5 million, respectively and estimated allowance for appeals, closures and other adjustments of $6.6 million and $4.8 million, respectively.
Stock-based Compensation: We grant stock options to purchase our common stock and restricted stock units to our employees and directors. Stock-based compensation cost is measured at the grant date based on the fair value of the award and is recognized as an expense over the requisite service period, which is generally the vesting period.
The Company estimates the fair value of all stock awards granted using the Black-Scholes option pricing model for “non-performance-based” grants and Monte Carlo simulation is used for performance-based grants with certain market conditions. The determination of the fair value of the stock based awards on the grant date using the applicable option pricing model is affected by our stock price, as well as assumptions regarding a number of complex and subjective variables. These variables include our expected stock price volatility over the expected term of the awards, actual and projected option exercise experience, a risk-free interest rate and any expected dividends. We estimate the expected term of the options granted by calculated the average term from our historical option exercise experience. We estimate the volatility of our common stock using historical volatility. The assumed risk-free interest rate is based on the yield on the measurement date of a zero-coupon U.S. Treasury bond with a maturity period equal to the option’s expected term. We do not anticipate paying any cash dividends in the foreseeable future and therefore use an expected dividend yield of zero in the option valuation models.
If factors change and we employ different assumptions for estimating stock-based compensation expense in future periods or if we decide to use a different valuation model, stock-based compensation in future periods may differ significantly from what we have recorded in the current period and could materially affect our net income and net income per share.
We estimate forfeitures at the time of grant and revise the forfeiture rate in subsequent periods if actual forfeitures differ from our estimates. If actual forfeitures vary from our estimates, we will recognize the difference in compensation expense in the period the actual forfeitures occur or at the time of vesting.
Contingencies: From time to time, we are involved in legal proceedings in the ordinary course of business. We assess the likelihood of any adverse judgments or outcomes to these contingencies as well as potential ranges of probable losses and establish reserves accordingly. Significant judgment is required to determine both probability and the estimated amount. We review these provisions at least quarterly and adjust these provisions to reflect the impact of negotiations, settlements, rulings, advice of legal counsel and updated information. Litigation is inherently unpredictable and is subject to significant uncertainties, some of which are beyond our control. The amount of reserves required may change in future periods due to new developments in each matter or changes in approach to a matter such as a change in settlement strategy.
The policies described above are not intended to be a comprehensive list of all of our accounting policies. In many cases, the accounting treatment of a particular transaction is specifically dictated by U.S. GAAP, with no need for management’s judgment in their application. There are also areas in which the audited consolidated financial statements and notes thereto included in this Form 10-K contain accounting policies and other disclosures required by U.S. GAAP.
| 30 |
Years Ended December 31, 2015 and 2014
The following table sets forth, for the periods indicated, certain items in our Consolidated Statements of Income expressed as a percentage of revenue:
| Years ended December 31, | ||||||||
| 2015 | 2014 | |||||||
| Revenue | 100 | % | 100 | % | ||||
| Cost of services: | ||||||||
| Compensation | 37.6 | 40.9 | ||||||
| Data processing | 8.6 | 8.9 | ||||||
| Occupancy | 3.3 | 3.8 | ||||||
| Direct project costs | 10.9 | 8.3 | ||||||
| Other operating costs | 6.1 | 5.6 | ||||||
| Amortization of acquisition related software and intangible assets | 5.9 | 6.5 | ||||||
| Total cost of services | 72.4 | 74.0 | ||||||
| Selling, general and administrative expenses | 17.5 | 18.3 | ||||||
| Total operating expenses | 89.9 | 92.3 | ||||||
| Operating income | 10.0 | 7.7 | ||||||
| Interest expense | (1.6 | ) | (1.8 | ) | ||||
| Other income, net | - | - | ||||||
| Income before income taxes | 8.4 | 5.9 | ||||||
| Income taxes | (3.2 | ) | (2.8 | ) | ||||
| Net income | 5.2 | % | 3.1 | % | ||||
Operating Results
Revenue for the year ended December 31, 2015 was $474.2 million, an increase of $31.0 million, or 7.0%, from revenue of $443.2 million for the year ended December 31, 2014. This resulted from a $26.7 million increase in revenue resulting from changes in the yield and scope of projects from existing customers and differences in the timing of when customer projects were completed in the current year compared to the prior year. An additional $16.1 million in revenue was generated from new customers. These increases were offset by a $10.3 million decrease related to contract expirations and completions and a $1.5 million decrease related to the reduction in Medicare RAC revenue.
Compensation expense as a percentage of revenue was 37.6% for the year ended December 31, 2015, compared to 40.9% for the prior year. Compensation expense was $178.3 million for 2015, a decrease of $3.0 million, or 1.7%, from the prior year compensation expense of $181.3 million. This reduction reflects a $4.9 million decrease in salary and overtime expense partially offset by an increase in variable compensation expense, an increase in fringe compensation expense and an increase in subcontractor expense. For the year ended December 31, 2015, we averaged 2,007 employees, a 7.4% decrease from the year ended December 31, 2014, during which we averaged 2,167 employees.
Data processing expense as a percentage of revenue was 8.6% for the year ended December 31, 2015, compared to 8.9% for the prior year. Data processing expense was $40.9 million for 2015, an increase of $1.2 million, or 3.0%, from the prior year data processing expense of $39.7 million. Improvements to our technology infrastructure and the requirement for higher transaction capacity resulted in higher expenses in 2015. Additional software costs were primarily related to software maintenance and amortization. Data costs increased along with additional hosting service expense. These increases were partially offset by a reduction of in equipment depreciation expense and reduction in equipment maintenance costs.
Occupancy expense as a percentage of revenue was 3.3% for the year ended December 31, 2015, compared to 3.8% for the prior year. Occupancy expense was $15.8 million for 2015, a decrease of $1.2 million, or 7.1%, from the prior year occupancy expense of $17.0 million. The reduction was primarily related to the downsizing of office space and relocation of our offices in Omaha, Nebraska and Albany, New York as most of the cost savings was recognized in 2015. Additional savings were realized as a result of closing several of our smaller field offices in 2014 and 2015. Beginning in 2015, the cost of unoccupied office space in any of our locations is reflected within selling, general and administrative expense.
| 31 |
Direct project expense as a percentage of revenue was 10.9% for the year ended December 31, 2015, compared to 8.3% for the prior year. Direct project expense for the current period was $51.5 million, a $14.6 million, or 39.6%, increase compared to direct project expense of $36.9 million for the prior year. Operational processes transitioned to subcontractors provided a $9.6 million increase. Data costs increased by $2.9 million related to the increase in volume of patient charts reviewed for our health plan customers. Additionally, key punch and data conversion expense increased by $1.4 million due to both the volume increase and the reformatting of electronic and hard copy remittance data.
Other operating expenses as a percentage of revenue were 6.1% for the year ended December 31, 2015, compared to 5.6% for the prior year. Other operating expenses for 2015 were $28.9 million, an increase of $4.3 million, or 17.5%, from the prior year expense of $24.6 million. This increase primarily resulted from a $3.6 million increase in temporary help and consulting expense.
Amortization of acquisition related software and intangible assets as a percentage of revenue was 5.9% for the year ended December 31, 2015, compared to 6.5% for the prior year. Amortization of acquisition related software and intangible assets for 2015 was $28.1 million, a decrease of $0.5 million, or 1.7%, compared to the prior year expense of $28.6 million. This expense consists primarily of amortization of customer relationships, trade names and software and includes a decrease in expense related to the completion of amortization in 2014 on restrictive covenants for our Verify Solutions, Inc. and MedRecovery Management, LLC acquisitions.
Selling, general and administrative expenses as a percentage of revenue were 17.5% for the year ended December 31, 2015, compared to 18.3% for the prior year. Selling, general and administrative expenses for 2015 were $83.1 million, an increase of $2.0 million, or 2.5% expense compared to the prior year expense of $81.1 million. The primary increase was due to a $2.8 million increase in salaries expense. This increase was offset by a $0.9 million decrease in software related costs. During the year ended December 31, 2015, we averaged 218 employees in the sales, general and administrative group, a 1.4% decrease over our average of 221 employees in that group during the year ended December 31, 2014.
Operating income for the year ended December 31, 2015 was $47.6 million, or 10.0% of revenue, compared to $34.2 million, or 7.7% of revenue, for the prior year.
Interest expense was $7.8 million for the year ended December 31, 2015, compared to $7.9 million for the same period in 2014. Interest expense represents borrowings under our revolving credit facility, amortization of deferred financing costs, commitment fees for our revolving credit facility and issuance fees for our letter of credit. The $0.1 million decrease compared to the prior year primarily relates to a reduction in interest on capital leases. Amortization of deferred financing costs of $2.1 million in both periods is included within interest expense.
We recorded income tax expense of $15.3 million for the year ended December 31, 2015, compared to income tax expense of $12.4 million for the year ended December 31, 2014, an increase of $2.9 million. Net income before taxes increased $13.5 million year over year, which caused an increase in tax expense of $2.9 million. Our effective tax rate decreased from 47.0% to 38.4% primarily due to a change in unitary state apportionments and permanent differences. The principal difference between the statutory rate and our effective rate is state taxes and permanent differences.
Net income of $24.5 million for the year ended December 31, 2015 represents an increase of $10.6 million compared to net income for the same period in 2014 of $13.9 million.
| 32 |
Years Ended December 31, 2014 and 2013
The following table sets forth, for the periods indicated, certain items in our Consolidated Statements of Income expressed as a percentage of revenue:
| Years ended December 31, | ||||||||
| 2014 | 2013 | |||||||
| Revenue | 100 | % | 100 | % | ||||
| Cost of services: | ||||||||
| Compensation | 40.9 | 38.7 | ||||||
| Data processing | 8.9 | 7.5 | ||||||
| Occupancy | 3.8 | 3.7 | ||||||
| Direct project costs | 8.3 | 9.2 | ||||||
| Other operating costs | 5.6 | 5.4 | ||||||
| Amortization of acquisition related software and intangible assets | 6.5 | 6.5 | ||||||
| Total cost of services | 74.0 | 71.0 | ||||||
| Selling, general and administrative expenses | 18.3 | 13.2 | ||||||
| Total operating expenses | 92.3 | 84.2 | ||||||
| Operating income | 7.7 | 15.7 | ||||||
| Interest expense | (1.8 | ) | (2.6 | ) | ||||
| Other income, net | - | 0.2 | ||||||
| Income before income taxes | 5.9 | 13.3 | ||||||
| Income taxes | (2.8 | ) | (5.2 | ) | ||||
| Net income | 3.1 | % | 8.1 | % | ||||
Operating Results
Revenue for the year ended December 31, 2014 was $443.2 million, a decrease $48.6 million, or 9.9%, from revenue of $491.8 million for the year ended December 31, 2013. This resulted from an $86.0 million decrease in revenue related to the Medicare RAC contract and a $15.7 million decrease related to contract expirations. These decreases were partially offset by a $45.4 million increase in revenue resulting from changes in the yield and scope of projects from existing customers and differences in the timing of when customer projects were completed in the current year compared to the prior year. For the year ended December 31, 2014, an additional $7.7 million in revenue was generated from new customers.
Compensation expense as a percentage of revenue was 40.9% for the year ended December 31, 2014, compared to 38.7% for the prior year. Compensation expense was $181.3 million for 2014, a decrease of $9.0 million, or 4.7%, from the prior year compensation expense of $190.3 million. This decrease reflects a $7.4 million decrease in salary and overtime expense. For the year ended December 31, 2014, we averaged 2,167 employees, a 10.5% decrease over the year ended December 31, 2013, during which we averaged 2,421 employees.
Data processing expense as a percentage of revenue was 8.9% for the year ended December 31, 2014, compared to 7.5% for the prior year. Data processing expense was $39.7 million for 2014, an increase of $2.6 million, or 7.0%, from the prior year data processing expense of $37.1 million. Improvements to our technology infrastructure and the requirement for higher transaction capacity resulted in higher expenses in 2014. Additional software costs were primarily related to software maintenance and amortization of capitalized software and additional hardware costs related to depreciation expense. These increases were partially offset by a decrease in data communications costs, data costs and data processing supplies expense.
Occupancy expense as a percentage of revenue was 3.8% for the year ended December 31, 2014, compared to 3.7% for the prior year. Occupancy expense was $17.0 million for 2014, a decrease of $1.4 million, or 7.6%, from the prior year occupancy expense of $18.4 million. The reduction was primarily related to the downsizing of office space and relocation of our office in New York City in 2013, and our offices in Charlestown, Massachusetts and Las Vegas in 2014. Additional savings were realized as a result of closing several of our smaller field offices in 2013 and 2014.
| 33 |
Direct project expense as a percentage of revenue was 8.3% for the year ended December 31, 2014, compared to 9.2% for the prior year. Direct project expense for the current period was $36.9 million, an $8.5 million, or 18.7%, decrease compared to direct project expense of $45.4 million for the prior year. The reduction reflects a $6.0 million decrease in temporary employee costs as the verification process was transitioned to subcontractors from temporary employees, which was partially offset by a $1.9 million increase in subcontractor expenses. Data costs decreased by $3.5 million as the number of patient charts reviewed were reduced from the Medicare RAC Contract. Additionally, key punch and data conversion expense decreased by $1.3 million as a portion of our customer collections data shifted from hard copy to electronic media.
Other operating expenses as a percentage of revenue were 5.6% for the year ended December 31, 2014, compared to 5.4% for the prior year. Other operating expenses for 2014 were $24.6 million, a decrease of $1.9 million, or 7.2%, from the prior year of $26.5 million. This decrease primarily resulted from decreases in travel and entertainment expense and recruiting and employee relocation.
Amortization of acquisition related software and intangible assets as a percentage of revenue was 6.5% for both years ended December 31, 2014 and 2013. Amortization of acquisition related software and intangible assets for 2014 was $28.6 million, a decrease of $3.1 million, or 9.8%, compared to the prior year expense of $31.7 million. This expense consists primarily of amortization of customer relationships, trade names and software and includes a $2.7 million decrease in expenses related to the completion of customer relationship intangible asset amortization from our acquisition of Benefits Solutions Practice Area from Public Consulting Group, Inc. in 2006. Additional decreases in amortization expense were related to the completion of restrictive covenant and trade name amortization from the Chapman Kelly, Verify Solutions and IntegriGuard acquisitions.
Selling, general and administrative expenses as a percentage of revenue were 18.3% for the year ended December 31, 2014, compared to 13.2% for the prior year. Selling, general and administrative expenses for 2014 were $81.1 million, an increase of $16.0 million, or 24.6%, compared to the prior year expense of $65.1 million. Incremental costs include a $4.3 million increase in compensation expense, including salaries expense, variable compensation, additional stock-based compensation severance, and fringe benefits. Other expenses increased by $9.6 million primarily due to a $5.1 million increase in bad debt expense and a $4.2 million increase in legal expenses related to our action against Public Consulting Group, Inc. and our former employees. See Note 13 in the footnotes to the financial statements within Item 15 - “Financial Statements” for additional information. During the year ended December 31, 2014, we averaged 221 employees in the sales, general and administrative group, a 6.3% increase over our average of 208 employees in that group during the year ended December 31, 2013.
Operating income for the year ended December 31, 2014 was $34.2 million, or 7.7% of revenue, compared to $77.2 million, or 15.7% of revenue, for the prior year.
Interest expense was $7.9 million for the year ended December 31, 2014, compared to $12.5 million for the same period in 2013. Interest expense represents borrowings under our revolving credit facility, amortization of deferred financing costs, commitment fees for our revolving credit facility and issuance fees for our Letter of Credit. The $4.6 million decrease compared to the prior year primarily relates to a $4.0 million reduction in interest on our revolving debt since our debt restructure in May 2013, which was the result of a $130.0 million reduction in our principal balance due to debt payments and a decrease in our interest rates. Amortization of deferred financing costs decreased by $1.0 million due to the debt restructure. These decreases were partially offset by an increase in commitment fees. There was no other income in the year ended December 31, 2014. Other income in the year ended 2013 represented a release of $0.8 million of the funds held in escrow related to our HDI acquisition.
We recorded income tax expense of $12.4 million for the year ended December 31, 2014, compared to income tax expense of $25.6 million for the year ended December 31, 2013, a decrease of $13.2 million. Net income before taxes decreased $39.3 million year over year, which caused a decrease in tax expense of $13.2 million. Our effective tax rate increased from 39.0% to 47.0% primarily due to a change in state apportionments and permanent differences. The principal difference between the statutory rate and our effective rate is state taxes and permanent differences.
Net income of $13.9 million for the year ended December 31, 2014 represents a decrease of $26.1 million compared to net income for the same period in 2013 of $40.0 million.
| 34 |
Off-Balance Sheet Arrangements
Other than our letter of credit, we do not have any off-balance sheet arrangements.
Liquidity and Capital Resources
At December 31, 2015, our cash and cash equivalents and net working capital were $145.6 million and $247.9 million, respectively.
In connection with our acquisition of HDI, we entered into a five-year, revolving and term secured credit agreement, (“2011 Credit Agreement”), with certain financial institutions and Citibank, N.A. as Administrative Agent. In May 2013, we amended and restated the 2011 Credit Agreement and entered into a $500 million five-year, amended and restated revolving credit agreement (“2013 Credit Agreement”). Under specified circumstances, the revolving credit facility under the 2013 Credit Agreement can be increased or one or more incremental term loan facilities can be added. Our obligations and any amounts due under the 2013 Credit Agreement are guaranteed by our material subsidiaries and secured by a security interest in all or substantially all of our and our subsidiaries’ physical assets. As of December 31, 2015, the outstanding principal balance due on the revolving credit facility was $197.8 million.
The 2013 Credit Agreement provides for an initial $500 million revolving credit facility, and, under specified circumstances, the revolving credit facility can be increased or one or more incremental term loan facilities can be added, provided that the incremental credit facilities do not exceed in the aggregate the sum of (i) $75 million plus (ii) an additional amount not less than $25 million, so long as our total secured leverage ratio, calculated giving pro forma effect to the requested incremental borrowing and other customary and appropriate pro forma adjustment events, including any permitted acquisitions, is no greater than 2.5:1.0.
The 2013 Credit Agreement contains certain customary representations and warranties, affirmative and negative covenants, and events of default. The 2013 Credit Agreement requires us to comply, on a quarterly basis, with certain principal financial covenants, including a maximum consolidated leverage ratio reducing from 3.50:1.00 to 3.25:1.00 over the next five years and a minimum interest coverage ratio of 3.00:1.00.
The interest rates applicable to the revolving credit facility are, at our option, either (i) the LIBOR multiplied by the statutory reserve rate plus an interest margin ranging from 1.50% to 2.25% based on our consolidated leverage ratio, or (ii) a base rate (which is equal to the greatest of (a) Citibank’s prime rate, (b) the federal funds effective rate plus 0.50% and (c) the one-month LIBOR plus 1.00% plus an interest margin ranging from 0.50% to 1.25% based on our consolidated leverage ratio). We will pay an unused commitment fee on the revolving credit facility during the term of the 2013 Credit Agreement ranging from 0.375% to 0.50% per annum based on our consolidated leverage ratio.
Our obligations under the 2013 Credit Agreement may be accelerated upon the occurrence of an event of default, which includes customary events of default including, without limitation, payment defaults, failures to perform affirmative covenants, failure to refrain from actions or omissions prohibited by negative covenants, the inaccuracy of representations or warranties, cross-defaults, bankruptcy and insolvency related defaults, defaults relating to judgments, defaults due to certain ERISA related events and a change of control default.
As of December 31, 2015, we were in compliance with all the terms of the 2013 Credit Agreement.
During 2015, we incurred $4.1 million of interest on the outstanding principal and $1.5 million in commitment fees on the revolving credit facility. The loan origination fee and issuance costs of $15.6 million incurred upon consummation of the 2013 Credit Agreement have been recorded as deferred financing costs and are being amortized as interest expense over the five year life of the 2013 Credit Agreement. For the year ended December 31, 2015, $2.1 million of the financing cost has been amortized to interest expense.
As part of our contractual agreement with a customer, we have an outstanding irrevocable letter of credit for $3.0 million, which we established against our existing revolving credit facility. The expiration date of the letter of credit is June 30, 2016.
We expect that operating cash flows will continue to be a primary source of liquidity for our operating needs. In addition, we have the revolving credit facility, which may be used for general corporate purposes, including acquisitions.
| 35 |
The following tables, which should be read in conjunction with our Consolidated Statements of Cash Flows, represent the cash and cash equivalents, working capital and a summary of our cash flows at December 31, 2015 and 2014, respectively:
| December 31, | ||||||||
| (In thousands) | 2015 | 2014 | ||||||
| Cash and cash equivalents | $ | 145,610 | $ | 133,116 | ||||
| Working capital | $ | 247,916 | $ | 226,271 | ||||
A summary of our cash flows is as follows:
| December 31, | ||||||||||||
| (In thousands) | 2015 | 2014 | 2013 | |||||||||
| Net cash provided by operating activities | $ | 70,716 | $ | 98,761 | $ | 101,181 | ||||||
| Net cash used in investing activities | $ | (11,817 | ) | $ | (26,201 | ) | $ | (26,283 | ) | |||
| Net cash used in financing activities | $ | (46,405 | ) | $ | (32,810 | ) | $ | (116,759 | ) | |||
| Net increase (decrease) in cash and cash equivalents | $ | 12,494 | $ | 39,750 | $ | (41,861 | ) | |||||
We believe that our cash generating capability and financial condition, together with our funds available under our 2013 Credit Agreement, will be adequate to meet our operating, investing and financing needs. Our principal source of cash has been our cash flow from operations and our $500 million five-year revolving credit facility. The primary uses of cash are compensation expenses, data processing, direct project costs and selling, general and administration expenses and acquisitions. Other sources of cash include proceeds from exercise of stock options and tax benefits associated with stock option exercises. We expect that operating cash flows will continue to be a primary source of liquidity for our operating needs.
We rely on operating cash flows and cash and cash equivalent balances to provide for our liquidity requirements. We believe that we have the ability to obtain both short-term and long-term loans to meet our financing needs for the foreseeable future. Due to our significant operating cash flows, access to capital markets and available revolving credit facility under the 2013 Credit Agreement, we continue to believe that we have the ability to meet our liquidity needs for the foreseeable future, which include:
| · | the working capital requirements of our operations; |
| · | investments in our business; |
| · | business development activities; and |
| · | repayment of our revolving credit facility under our 2013 Credit Agreement. |
In connection with our appeal process in the matter of Kern Health Systems, on September 30, 2014 we obtained a surety bond in the amount of approximately $2.2 million, which was collateralized by a cash deposit and reflected in Other current assets on our audited Consolidated Balance Sheet at December 31, 2015. See Note 13 - “Commitments and Contingencies” in our Notes to the Consolidated Financial Statements in Item 8. Consolidated Financial Statements and Supplementary Data.
Cash Flows from Operating Activities
Net cash provided by operating activities for the year ended December 31, 2015 was $70.7 million, a $28.1 million decrease from net cash provided by operating activities of $98.8 million for the year ended December 31, 2014. The decrease was related primarily to the increase in accounts receivable and the decrease in our net deferred tax liabilities and accounts payable.
Net cash provided by operating activities for the year ended December 31, 2014 was $98.8 million, a $2.4 million decrease from net cash provided by operating activities of $101.2 million for the year ended December 31, 2013. The decrease was driven primarily by the net changes in the estimated allowance for unbilled receivables, accounts receivable, accounts payable, accrued expenses and other liabilities and the provision for allowance for doubtful accounts.
Net cash provided by operating activities for the year ended December 31, 2013 was $101.2 million, an $18.2 million increase from net cash provided by operating activities of $83.0 million for the year ended December 31, 2012. Results of operations, after non-cash adjustments to net income, contributed $107.9 million to cash flows provided by operating activities, compared to a contribution of $97.4 million for the year ended December 31, 2012. This increase primarily resulted from organic growth in client accounts and cost savings from restricting initiatives during the year ended December 31, 2013. The contribution by results of operations was offset by changes in net cash outflows of $6.7 million related to our operating assets and liabilities. The net outflow was primarily due to a $21.9 million increase in our accounts receivable that was offset by an increase in our estimated liability for appeals of $14.5 million.
| 36 |
Our Days Sales Outstanding (“DSOs”) calculation can be derived by dividing total net accounts receivable at the end of period, by the daily average of the current quarter’s annualized revenue. For the year ended December 31, 2015, revenue was $474.2 million, an increase of $31.0 million compared to revenue of $443.2 million for the year ended December 31, 2014. The number of DSOs decreased by 8 days to 118 days as of December 31, 2015, as compared to 126 days as of December 31, 2014.
We expect our future DSOs to be impacted by the factors described below:
| · | increased revenue from private health plan customers that generally include longer payment terms in their contracts |
| · | delays in receipt of payment for previously recognized revenue due to timing delays in certain customers processing our findings through their systems, which has led to delays in paying us; operational issues, such as missing Explanation of Benefits, as well as an increase in appealed Medicare RAC receivables awaiting resolution |
These factors may result in higher accounts receivable balances and higher DSOs in future periods, which would reduce net cash from operating activities in those periods. We do not anticipate collection issues with these accounts receivable, however, nor do we expect that any extended collections will materially impact our liquidity.
The majority of our customer relationships have been in place for several years. Our future operating cash flows could be adversely affected by a decrease in a demand for our services, delayed payments from customers or if one or more contracts with our largest customers is terminated or not re-awarded.
Cash Flows from Investing Activities
Net cash used in investing activities for the year ended December 31, 2015 was $11.8 million, a $14.4 million decrease compared to net cash used in investing activities of $26.2 million for the year ended December 31, 2014. The decrease primarily related to a $14.1 million decrease in purchase of land, property and equipment and a $0.3 million decrease in investment in capitalized software.
Net cash used in investing activities for the year ended December 31, 2014 was $26.2 million, a $0.1 million decrease compared to net cash used in investing activities of $26.3 million for the year ended December 31, 2013. The decrease primarily related to a $0.5 million decrease in investments in common stock and a $0.1 million decrease in investment in capitalized software, partially offset by a $0.5 million increase in purchases of property and equipment.
Net cash used in investing activities for the year ended December 31, 2013 was $26.3 million, an $11.8 million decreased compared to net cash used in investing activities of $38.1 million for the year ended December 31, 2012. The decrease primarily related to the 2012 acquisition of MRM for $12.4 million, a $3.1 million decrease in purchases of property and equipment and a $2.5 million decrease in investments in common stock. These decreases were partially offset by a $4.8 million inflow in the prior year period related to a certificate of deposit reaching maturity and a $1.4 million increase in investment in capitalized software.
Cash Flows from Financing Activities
Net cash used in financing activities for the year ended December 31, 2015 was $46.4 million, a $13.6 million increase from net cash used in financing activities of $32.8 million for the year ended December 31, 2014. This increase was primarily attributable to a $35.0 million reduction in payments toward the principal outstanding on our revolving credit facility and $50.0 million used for treasury stock purchases of 4,747,441 of our shares of common stock at a weighted average price of $10.51 per share pursuant to an authorized share repurchase program as more fully described in Note 8, “Equity” to our Consolidated Financial Statements. No treasury stock purchases were made in the year ended December 31, 2014.
| 37 |
Net cash used in financing activities for the year ended December 31, 2014 was $32.8 million, an $84.0 million decrease from net cash used in financing activities of $116.8 million for the year ended December 31, 2013. This decrease was primarily attributable to a $60.0 million reduction in payments toward the principal outstanding on our revolving credit facility and a $25.0 million reduction for treasury stock purchases. No treasury stock repurchases were made in the year ended December 31, 2014.
Net cash used in financing activities for the year ended December 31, 2013 was $116.7 million, a $110.0 million increase over net cash used in net cash used in financing activities of $6.7 million for the year ended December 31, 2012. This increase was primarily attributable to $95.0 million in payments toward the principal outstanding on our revolving credit facility and an increase of $14.4 million for treasury stock purchases.
Contractual Obligations
The following table represents the scheduled maturities of our contractual cash obligations and other commitments at December 31, 2015 (in thousands):
| Payments Due by Period | ||||||||||||||||||||
| Contractual Obligations | Total | Less than 1 year | 1 - 3 years | 3 -5 years | More than 5 years | |||||||||||||||
| Operating leases (1) | $ | 43,413 | $ | 12,957 | $ | 16,050 | $ | 6,807 | $ | 7,599 | ||||||||||
| Revolving credit facility (2) | 197,796 | - | 197,796 | - | - | |||||||||||||||
| Interest expense (3) | 11,058 | 4,739 | 6,319 | - | - | |||||||||||||||
| Commitment fee (4) | 3,549 | 1,521 | 2,028 | - | - | |||||||||||||||
| Capital leases (5) | 51 | 47 | 4 | - | - | |||||||||||||||
| Letter of Credit fee (6) | 27 | 27 | - | - | - | |||||||||||||||
| Total | $ | 255,894 | $ | 19,291 | $ | 222,197 | $ | 6,807 | $ | 7,599 | ||||||||||
____________________________
| (1) | Represents the future minimum lease payments under non-cancelable operating leases. In addition to minimum rent, certain of our leases require the payment for insurance, maintenance and other costs. These costs have historically represented approximately 3 to 6 percent of the minimum rent amount. These additional amounts are not included in the table of contractual obligations as the timing and/or amounts of such payments are unknown. |
| (2) | Represents scheduled repayments of principal on the revolving credit facility under the terms of the 2013 Credit Agreement. See Note 7 - “Credit Agreement” in our Notes to the Consolidated Financial Statements in Item 8. Consolidated Financial Statements and Supplementary Data for additional information regarding the Credit Agreement. |
| (3) | Represents estimates of amounts due on revolving credit facility based on the interest rate as of December 31, 2015 and on scheduled repayments of principal. See Note 7 - “Credit Agreement” in our Notes to the Consolidated Financial Statements in Item 8. Consolidated Financial Statements and Supplementary Data for additional information regarding the 2013 Credit Agreement. |
| (4) | Represents the commitment fee due on the revolving credit facility. See Note 7 - “Credit Agreement” in our Notes to the Consolidated Financial Statements in Item 8. Consolidated Financial Statements and Supplementary Data for additional information regarding the 2013 Credit Agreement. |
| (5) | Represents the future minimum lease payments under capital leases. |
| (6) | Represents the fees for the letter of credit established against the revolving credit facility. See Note 7 - “Credit Agreement” in our Notes to the Consolidated Financial Statements in Item 8. Consolidated Financial Statements and Supplementary Data for additional information regarding the Credit Agreement. |
| 38 |
In October 2012, our Board of Directors authorized us to repurchase up to $50 million of our common stock from time to time on the open market or in privately negotiated transactions, for a period of up to two years. During this two-year period, we purchased a total of 1,101,458 shares at an average price of $22.65 per share, which amounts to $25.0 million of our common stock pursuant to this authorization.
On July 30, 2015, our Board of Directors approved a share repurchase program authorizing the repurchase of up to $75 million of our common stock from time to time on the open market or in privately negotiated transactions. The repurchase program is authorized through July 30, 2017, and may be suspended or discontinued at any time. Repurchased shares will be available for use in connection with issuance under our stock plans and for other corporate purposes. Repurchases may be made under a Rule 10b5-1 plan, which would permit shares to be repurchased when we might otherwise be precluded from doing so under insider trading laws. The timing and amount of any shares repurchased under the program will be determined by our management based on its evaluation of market conditions and other factors. During the year ended December 31, 2015, we repurchased $50 million of our common stock pursuant to this authorization and 10b5-1 plans.
Repurchased shares will be available for use in connection with our stock plans and for other corporate purposes.
As part of our contractual agreement with a customer, we have an outstanding irrevocable letter of credit for $3.0 million, which we established against our existing revolving credit facility. The expiration date of the letter of credit is June 30, 2016.
Recently Issued Accounting Pronouncements
In May 2014, the FASB issued ASU 2014-09, "Revenue from Contracts with Customers (Topic 606)," which is the new comprehensive revenue recognition standard that will supersede all existing revenue recognition guidance under U.S. GAAP. The standard's core principle is that a company will recognize revenue when it transfers promised goods or services to a customer in an amount that reflects the consideration to which the company expects to be entitled in exchange for those goods or services. ASU 2015-14, "Revenue from Contracts with Customers (Topic 606): Deferral of the Effective Date," which was issued in August 2015, revised the effective date for this ASU to annual and interim periods beginning on or after December 15, 2017, with early adoption permitted, but not earlier than the original effective date of annual and interim periods beginning on or after December 15, 2016, for public entities. Entities will have the option of using either a full retrospective approach or a modified approach to adopt the guidance in ASU 2014-09. The Company is currently evaluating the impact of adopting this guidance.
In June 2014, the FASB issued ASU 2014-12, Accounting for Share-Based Payments When the Terms of an Award Provide That a Performance Target Could Be Achieved after the Requisite Service Period (“ASU 2014-12”). ASU 2014-12 brings consistency to the accounting for share-based payment awards that require a specific performance target to be achieved in order for employees to become eligible to vest in the awards. Effective January 1, 2015, we adopted the provisions of ASU 2014-12. The adoption of this guidance did not have a material effect on our consolidated financial statements.
In April 2015, the FASB issued ASU 2015-03, Simplifying the Presentation of Debt Issuance Costs (“ASU 2015-03”). ASU 2015-03 simplifies the presentation of debt issuance costs by requiring that debt issuance costs related to a recognized debt liability be presented in the balance sheet as a direct deduction from the carrying amount of that debt liability, consistent with debt discounts. The recognition and measurement guidance for debt issuance costs are not affected by ASU 2015-03. In August 2015, FASB issued ASU 2015-15, Presentation and Subsequent Measurement of Debt Issuance Costs Associated with Line-of-Credit Arrangements (“ASU 2015-15”). ASU 2015-15 clarifies the presentation and measuring of debt issuance costs incurred in connection with line-of-credit arrangements given the lack of guidance on this topic in ASU 2015-03. For line-of-credit arrangements, an entity can continue to present debt issuance costs as an asset and amortize the deferred debt issuance costs ratably over the term of the line-of-credit arrangement. ASU 2015-03, as amended, is effective for annual reporting periods beginning after December 15, 2015, including interim periods within such annual reporting periods with early adoption permitted. ASU 2015-03 is to be retrospectively adopted to each prior reporting period presented. We do not expect the adoption of this guidance to have a material effect on our consolidated financial statements.
In April 2015, the FASB issued ASU 2015-05, Intangibles – Goodwill and Other – Internal-Use Software (Subtopic 350-40): Customer’s Accounting for Fees Paid in a Cloud Computing Arrangement (“ASU 2015-05”). ASU 2015-05 provides explicit guidance to help companies evaluate the accounting for fees paid by a customer in a cloud computing arrangement and clarifies that if a cloud computing arrangement includes a software license, the customer should account for the license consistent with its accounting for other software licenses. If the arrangement does not include a software license, the customer should account for the arrangement as a service contract. ASU 2015-05 is effective for annual reporting periods beginning after December 15, 2015, including interim periods within such annual reporting periods with early adoption permitted. We do not expect the adoption of this guidance to have a material effect on our consolidated financial statements.
| 39 |
In November 2015, the FASB issued ASU 2015-17, Income Taxes (Topic 740): Balance Sheet Classification of Deferred Taxes (“ASU 2015-17”). ASU 2015-17 simplifies the current presentation of separately classifying deferred tax assets and deferred tax liabilities as current and noncurrent in a classified balance sheet by requiring companies to present them as noncurrent. ASU 2015-17, as amended, is effective for annual reporting periods beginning after December 15, 2016, including interim periods within such annual reporting periods with early adoption permitted. We have not early adopted this guidance and are currently evaluating the effect on our consolidated financial statements.
In February 2016, the FASB issued ASU 2016-02, Leases (Topic 842) (“ASU 2016-02”). ASU 2016-02 will require most lessees to recognize a majority of the Company’s leases on the balance sheet, which will increase reported assets and liabilities. ASU 2016-02 is effective for annual reporting periods beginning after December 15, 2018. Early adoption is permitted. HMS has not early adopted this guidance and is currently evaluating the effect on the Company’s consolidated financial statements.
Other new pronouncements issued but not effective until after December 31, 2015 are not expected to have a material impact on our financial position, results of operations or liquidity.
Item 7A. Quantitative and Qualitative Disclosures About Market Risk.
At December 31, 2015, we were not a party to any derivative financial instruments. We conduct all of our business in U.S. currency and hence do not have direct foreign currency risk. We are exposed to changes in interest rates, primarily with respect to our revolving credit facility under our 2013 Credit Agreement. If the effective interest rate for all of our variable rate debt were to increase by 100 basis points (1%), our annual interest expense would increase by a maximum of $2.0 million based on our debt balances outstanding at December 31, 2015. Further, we currently invest substantially all of our excess cash in short-term investments, primarily money market accounts, where returns effectively reflect current interest rates. As a result, market interest rate changes may impact our interest income or expense. The impact will depend on variables such as the magnitude of rate changes and the level of borrowings or excess cash balances. We do not consider this risk to be material. We manage such risk by continuing to evaluate the best investment rates available for short-term, high quality investments.
Item 8. Consolidated Financial Statements and Supplementary Data.
The information required by Item 8 is found on pages 49 to 73 of this Annual Report.
Item 9. Changes in and Disagreements with Accountants on Accounting and Financial Disclosure.
None.
Item 9A. Controls and Procedures.
Evaluation of Disclosure Controls and Procedures
We maintain disclosure controls and procedures (as defined in Rule 13a-15(e) under the Securities Exchange Act of 1934 or the Exchange Act) that are designed to ensure that information required to be disclosed in our reports filed under the Securities Exchange Act of 1934, as amended, is recorded, processed, summarized and reported within the time periods specified in the SEC’s rules and forms and that such information is accumulated and communicated to our management, including our Chief Executive Officer and Chief Financial Officer, as appropriate, to allow for timely decisions regarding required disclosure. In designing and evaluating the disclosure controls and procedures, management recognizes that any controls and procedures, no matter how well designed and operated, can provide only reasonable assurance of achieving the desired control objectives, and management is required to apply its judgment in evaluating the cost-benefit relationship of possible controls and procedures.
Conclusion Regarding the Effectiveness of Disclosure Controls and Procedures
As required by Rule 13a-15(b) under the Exchange Act, management, with the participation of our Chief Executive Officer and Chief Financial Officer, performed an evaluation of the effectiveness of our disclosure controls and procedures as of December 31, 2015. Based on our evaluation, our Chief Executive Officer and Chief Financial Officer concluded that our disclosure controls and procedures were effective as of the end of period covered by this Annual Report.
Management’s Report on Internal Control Over Financial Reporting
Our management is responsible for establishing and maintaining adequate internal control over financial reporting and for the assessment of the effectiveness of internal control over financial reporting. As defined by Rule 13a-15(f) of the Exchange Act, internal control over financial reporting is a process designed by, or under the supervision of our Chief Executive Officer and our Chief Financial Officer and effected by our Board of Directors, management and other personnel, to provide reasonable assurance regarding the reliability of financial reporting and the preparation of the consolidated financial statements for external purposes in accordance with U.S. GAAP.
| 40 |
Our internal control over financial reporting includes those policies and procedures that (i) pertain to the maintenance of records that, in reasonable detail, accurately and fairly reflect our transactions and dispositions of our assets; (ii) provide reasonable assurance that transactions are recorded as necessary to permit preparation of the consolidated financial statements in accordance with generally accepted accounting principles and that our receipts and expenditures are being made only in accordance with authorizations of our management and directors; and (iii) provide reasonable assurance regarding prevention or timely detection of unauthorized acquisition, use or disposition of our assets that could have a material effect on the consolidated financial statements.
Because of its inherent limitations, internal control over financial reporting may not prevent or detect misstatements. Also, projections of any evaluation of effectiveness to future periods are subject to the risk that controls may become inadequate because of changes in conditions, or that the degree of compliance with the policies or procedures may deteriorate.
In connection with the preparation of our annual consolidated financial statements, management has undertaken an assessment of the effectiveness of our internal control over financial reporting as of December 31, 2015, based on criteria established in the Internal Control-Integrated Framework issued by the Committee of Sponsoring Organizations (“COSO”) of the Treadway Commission. Management’s assessment included an evaluation of the design of our internal control over financial reporting and testing of the operational effectiveness of those controls. In May 2013, COSO issued an updated Internal Control-Integrated Framework, or the 2013 Framework. We adopted the new framework in 2014.
Based on this assessment, management has concluded that as of December 31, 2015, our internal control over financial reporting was effective in providing assurance regarding the reliability of financial reporting and the preparation of the consolidated financial statements for external purposes in accordance with U.S. GAAP.
KPMG LLP, the independent registered public accounting firm that audited our consolidated financial statements included in this Annual Report, has issued an attestation report on our assessment of our internal control over financial reporting, a copy of which appears on page 47.
Changes in Internal Control Over Financial Reporting
There have been no changes in our internal control over financial reporting identified in connection with the evaluation of our controls performed during the quarter ended December 31, 2015 that have materially affected, or are reasonably likely to materially affect, our internal control over financial reporting.
None.
Item 10. Directors, Executive Officers and Corporate Governance.
Unless provided in an amendment to this Annual Report on Form 10-K, the following information is incorporated by reference from our definitive proxy statement for our 2016 Annual Meeting of Shareholders (“2016 Proxy Statement”) as follows: (i) information about our Board of Directors, from the proposal captioned “Election of Directors—Our Board of Directors,” (ii) information about our Executive Officers, from the section captioned “Executive Officers,” (iii) information about compliance with Section 16(a) of the Exchange Act, from the section captioned “Section 16(a) Beneficial Ownership Reporting Compliance,” (iv) information about our Code of Ethics, from the section captioned “Board of Directors and Corporate Governance—Code of Ethics,” (v) information regarding the procedures by which our shareholders may recommend nominees to our Board of Directors, from the sections captioned “Questions and Answers—Shareholder Proposals and Director Nominations” and “Board of Directors and Corporate Governance—Director Nomination Process,” and (vi) information about our Audit Committee, including the members of the Audit Committee, and our audit committee financial expert, from the section captioned “Board of Directors and Corporate Governance—Board Committees—Audit Committee.”
| 41 |
Item 11. Executive Compensation.
Unless provided in an amendment to this Annual Report on Form 10-K, information about executive compensation and the compensation of our Board of Directors is incorporated by reference from the sections of our 2016 Proxy Statement captioned “Executive Compensation,” “Director Compensation,” “Board of Directors and Corporate Governance—Compensation Committee Interlocks and Insider Participation,” and “Executive Compensation—Compensation Committee Report.”
Item 12. Security Ownership of Certain Beneficial Owners and Management and Related Stockholder Matters.
Unless provided in an amendment to this Annual Report on Form 10-K, information about the security ownership of certain beneficial owners and management is incorporated by reference from the section in our 2016 Proxy Statement captioned “Security Ownership of Certain Beneficial Owners and Management.”
Equity Compensation Plan Information
The following table summarizes information about our equity compensation plans as of December 31, 2015. For additional information about our equity compensation plans see Note 10 – “Stock-Based Compensation” in our Notes to the Consolidated Financial Statements in Item 8. Consolidated Financial Statements and Supplemental Data.
| Number of securities to be issued upon exercise of outstanding options, warrants and rights | Weighted-average exercise price of outstanding options, warrants and rights | Number of securities remaining available for future issuance under equity compensation plans (excluding securities reflected in column (a)) | ||||||||||
| Plan Category | (a) | (b) | (c) | |||||||||
| Equity compensation plans approved by shareholders (1) | 6,107,107 | $ | 14.05 | 3,413,500 | ||||||||
| HDI plans not approved by shareholders (2) | 77,128 | $ | 20.14 | 366,806 | ||||||||
| Total | 6,184,235 | |||||||||||
____________________________
| (1) | This includes stock options to purchase common stock granted under our 1999 Plan and the 2006 Stock Plan and restricted stock awards and restricted stock units granted under the 2006 Stock Plan. |
| (2) | Includes stock options to purchase common stock granted under the HDI 2011 Stock Plan, which was assumed in connection with our acquisition of HDI and approved by the Compensation Committee of our Board of Directors. |
Item 13. Certain Relationships and Related Transactions and Director Independence.
Unless provided in an amendment to this Annual Report on Form 10-K, the following information is incorporated by reference from our 2016 Proxy Statement as follows: (i) information about certain relationships and transactions with related parties from the section captioned “Board of Directors and Corporate Governance—Certain Relationships and Related Person Transactions,” and (ii) information about director independence from the section captioned “Board of Directors and Corporate Governance—Board Determination of Independence.”
| 42 |
Item 14. Principal Accounting Fees and Services.
Unless provided in an amendment to this Annual Report on Form 10-K, information about the fees for professional services rendered by our independent registered public accounting firm in 2015 and 2014 and our Audit Committee’s policy on pre-approval of audit and permissible non-audit services provided by our independent registered public accounting firm is incorporated by reference from the proposal in our 2016 Proxy Statement captioned “Ratification of the Selection of Independent Registered Public Accounting Firm.”
| 43 |
Item 15. Exhibits and Financial Statement Schedules.
| 1. | Financial Statements. |
The financial statements are listed in the Index to Consolidated Financial Statements on page 46.
| 2. | Financial Statement Schedules. |
Financial Statement Schedule II-Valuation and Qualifying Accounts is set forth on page 74. All other financial statement schedules have been omitted as they are either not required, not applicable or the information is otherwise included.
| 3. | Exhibits. |
The Exhibits are set forth on the Exhibit Index on page 75 and incorporated herein by reference.
| 44 |
SIGNATURES
Pursuant to the requirements of Section 13 or 15(d) of the Securities Exchange Act of 1934, Registrant has duly caused this Annual Report to be signed on its behalf by the undersigned, thereunto duly authorized.
| HMS Holdings Corp. | ||
| (Registrant) | ||
| By: | /s/ William C. Lucia |
|
| William C. Lucia | ||
| Chief Executive Officer (Principal Executive Officer and Duly Authorized Officer) |
||
Date: February 29, 2016
Pursuant to the requirements of the Securities Exchange Act of 1934, this Annual Report has been signed below by the following persons on behalf of the registrant and in the capacities and on the dates indicated.
| Signatures | Title | Date | ||
| /s/ William C. Lucia | Director, Chairman of the Board, President and | |||
| William C. Lucia | Chief Executive Officer (Principal Executive Officer) |
February 29, 2016 | ||
| /s/ Jeffrey S. Sherman | Executive Vice President, Chief Financial Officer and | |||
| Jeffrey S. Sherman | Treasurer (Principal Financial Officer) |
February 29, 2016 | ||
| /s/ Greg D. Aunan | Senior Vice President and Chief Accounting Officer | |||
| Greg D. Aunan | (Principal Accounting Officer) | February 29, 2016 | ||
| /s/ Robert Becker | ||||
| Robert Becker | Director | February 29, 2016 | ||
| /s/ Craig R. Callen | ||||
| Craig R. Callen | Director | February 29, 2016 | ||
| /s/ Robert M. Holster | ||||
| Robert M. Holster | Director | February 29, 2016 | ||
| /s/ William F. Miller III | ||||
| William F. Miller III | Director | February 29, 2016 | ||
| /s/ Ellen A. Rudnick | ||||
| Ellen A. Rudnick | Director | February 29, 2016 | ||
| /s/ Bart M. Schwartz | ||||
| Bart M. Schwartz | Director | February 29, 2016 | ||
| /s/ Richard H. Stowe | ||||
| Richard H. Stowe | Lead Independent Director | February 29, 2016 | ||
| /s/ Cora M. Tellez | ||||
| Cora M. Tellez | Director | February 29, 2016 |
| 45 |
HMS HOLDINGS CORP. AND SUBSIDIARIES
INDEX TO CONSOLIDATED FINANCIAL STATEMENTS
| 46 |
Report of Independent Registered Public Accounting Firm
The Board of Directors and Shareholders
HMS Holdings Corp.:
We have audited the accompanying consolidated balance sheets of HMS Holdings Corp. and subsidiaries as of December 31, 2015 and 2014, and the related consolidated statements of income, shareholders’ equity, and cash flows for each of the years in the three-year period ended December 31, 2015. In connection with our audits of the consolidated financial statements, we also have audited financial statement schedule II. These consolidated financial statements and financial statement schedule are the responsibility of the Company’s management. Our responsibility is to express an opinion on these consolidated financial statements and financial statement schedule based on our audits.
We conducted our audits in accordance with the standards of the Public Company Accounting Oversight Board (United States). Those standards require that we plan and perform the audit to obtain reasonable assurance about whether the financial statements are free of material misstatement. An audit includes examining, on a test basis, evidence supporting the amounts and disclosures in the financial statements. An audit also includes assessing the accounting principles used and significant estimates made by management, as well as evaluating the overall financial statement presentation. We believe that our audits provide a reasonable basis for our opinion.
In our opinion, the consolidated financial statements referred to above present fairly, in all material respects, the financial position of HMS Holdings Corp. and subsidiaries as of December 31, 2015 and 2014, and the results of their operations and their cash flows for each of the years in the three-year period ended December 31, 2015, in conformity with U.S. generally accepted accounting principles. Also in our opinion, the related financial statement schedule, when considered in relation to the basic consolidated financial statements taken as a whole, present fairly, in all material respects, the information set forth therein.
We also have audited, in accordance with the standards of the Public Company Accounting Oversight Board (United States), HMS Holdings Corp.’s internal control over financial reporting as of December 31, 2015, based on criteria established in Internal Control – Integrated Framework (2013) issued by the Committee of Sponsoring Organizations of the Treadway Commission (COSO), and our report dated February 29, 2016 expressed an unqualified opinion on the effectiveness of the Company’s internal control over financial reporting.
| /s/ KPMG LLP | |
|
KPMG LLP |
| 47 |
Report of Independent Registered Public Accounting Firm
The Board of Directors and Shareholders
HMS Holdings Corp.:
We have audited HMS Holdings Corp.’s internal control over financial reporting as of December 31, 2015, based on criteria established in Internal Control – Integrated Framework (2013) issued by the Committee of Sponsoring Organizations of the Treadway Commission (COSO). HMS Holdings Corp.’s management is responsible for maintaining effective internal control over financial reporting and for its assessment of the effectiveness of internal control over financial reporting, included in the accompanying Management’s Report on Internal Control over Financial Reporting. Our responsibility is to express an opinion on the Company’s internal control over financial reporting based on our audit.
We conducted our audit in accordance with the standards of the Public Company Accounting Oversight Board (United States). Those standards require that we plan and perform the audit to obtain reasonable assurance about whether effective internal control over financial reporting was maintained in all material respects. Our audit included obtaining an understanding of internal control over financial reporting, assessing the risk that a material weakness exists, and testing and evaluating the design and operating effectiveness of internal control based on the assessed risk. Our audit also included performing such other procedures as we considered necessary in the circumstances. We believe that our audit provides a reasonable basis for our opinion.
A company’s internal control over financial reporting is a process designed to provide reasonable assurance regarding the reliability of financial reporting and the preparation of financial statements for external purposes in accordance with generally accepted accounting principles. A company’s internal control over financial reporting includes those policies and procedures that (i) pertain to the maintenance of records that, in reasonable detail, accurately and fairly reflect the transactions and dispositions of the assets of the company; (ii) provide reasonable assurance that transactions are recorded as necessary to permit preparation of financial statements in accordance with generally accepted accounting principles, and that receipts and expenditures of the company are being made only in accordance with authorizations of management and directors of the company; and (iii) provide reasonable assurance regarding prevention or timely detection of unauthorized acquisition, use, or disposition of the company’s assets that could have a material effect on the financial statements.
Because of its inherent limitations, internal control over financial reporting may not prevent or detect misstatements. Also, projections of any evaluation of effectiveness to future periods are subject to the risk that controls may become inadequate because of changes in conditions, or that the degree of compliance with the policies or procedures may deteriorate.
In our opinion, HMS Holdings Corp. maintained, in all material respects, effective internal control over financial reporting as of December 31, 2015, based on Internal Control – Integrated Framework (2013) issued by the Committee of Sponsoring Organizations of the Treadway Commission.
We also have audited, in accordance with the standards of the Public Company Accounting Oversight Board (United States), the consolidated balance sheets of HMS Holdings Corp. and subsidiaries as of December 31, 2015 and 2014, and the related consolidated statements of income, shareholders’ equity, and cash flows for each of the years in the three-year period ended December 31, 2015, and our report dated February 29, 2016 expressed an unqualified opinion on those consolidated financial statements.
/s/ KPMG LLP |
|
| KPMG LLP Dallas, Texas February 29, 2016 |
| 48 |
HMS HOLDINGS CORP. AND SUBSIDIARIES
CONSOLIDATED BALANCE SHEETS
(in thousands, except share and per share amounts)
| December 31, | ||||||||
| 2015 | 2014 | |||||||
| Assets | ||||||||
| Current assets: | ||||||||
| Cash and cash equivalents | $ | 145,610 | $ | 133,116 | ||||
| Accounts receivable, net of allowance for doubtful accounts of $4,849 and $4,535, respectively and estimated allowance for appeals of $6,614 and $4,824, at December 31, 2015 and 2014, respectively | 169,146 | 157,101 | ||||||
| Prepaid expenses | 11,261 | 11,810 | ||||||
| Prepaid income taxes | - | 5,142 | ||||||
| Deferred income taxes | 7,460 | 7,811 | ||||||
| Other current assets | 3,051 | 2,639 | ||||||
| Total current assets | 336,528 | 317,619 | ||||||
| Property and equipment, net | 96,551 | 116,027 | ||||||
| Goodwill | 361,468 | 361,468 | ||||||
| Intangible assets, net | 54,308 | 74,578 | ||||||
| Deferred tax assets | 4,873 | 6,957 | ||||||
| Other assets | 4,329 | 4,339 | ||||||
| Total assets | $ | 858,057 | $ | 880,988 | ||||
| Liabilities and Shareholders' Equity | ||||||||
| Current liabilities: | ||||||||
| Accounts payable, accrued expenses and other liabilities | $ | 51,661 | $ | 54,549 | ||||
| Estimated liability for appeals | 33,078 | 36,799 | ||||||
| Income taxes payable | 3,873 | - | ||||||
| Total current liabilities | 88,612 | 91,348 | ||||||
| Long-term liabilities: | ||||||||
| Revolving credit facility | 197,796 | 197,796 | ||||||
| Deferred tax liabilities | 38,421 | 50,853 | ||||||
| Deferred rent | 6,006 | 5,037 | ||||||
| Other liabilities | 2,520 | 2,864 | ||||||
| Total long-term liabilities | 244,743 | 256,550 | ||||||
| Total liabilities | 333,355 | 347,898 | ||||||
| Commitments and contingencies (Note 13) | ||||||||
| Shareholders' equity: | ||||||||
| Preferred stock -- $0.01 par value; 5,000,000 shares authorized; none issued | - | - | ||||||
| Common stock -- $0.01 par value; 125,000,000 shares authorized; 95,263,461 shares issued and 83,989,715 shares outstanding at December 31, 2015; 94,511,444 shares issued and 87,985,139 shares outstanding at December 31, 2014 | 952 | 943 | ||||||
| Capital in excess of par value | 330,290 | 313,214 | ||||||
| Retained earnings | 288,474 | 263,947 | ||||||
| Treasury stock, at cost: 11,273,746 and 6,526,305 shares at December 31, 2015 and 2014, respectively | (95,014 | ) | (45,014 | ) | ||||
| Total shareholders' equity | 524,702 | 533,090 | ||||||
| Total liabilities and shareholders' equity | $ | 858,057 | $ | 880,988 | ||||
See accompanying notes to the consolidated financial statements.
| 49 |
HMS HOLDINGS CORP. AND SUBSIDIARIES
CONSOLIDATED STATEMENTS OF INCOME
(in thousands, except per share amounts)
| Years ended December 31, | ||||||||||||
| 2015 | 2014 | 2013 | ||||||||||
| Revenue | $ | 474,216 | $ | 443,225 | $ | 491,762 | ||||||
| Cost of services: | ||||||||||||
| Compensation | 178,272 | 181,273 | 190,324 | |||||||||
| Data processing | 40,915 | 39,661 | 37,115 | |||||||||
| Occupancy | 15,766 | 16,950 | 18,397 | |||||||||
| Direct project expenses | 51,527 | 36,866 | 45,382 | |||||||||
| Other operating expenses | 28,895 | 24,588 | 26,491 | |||||||||
| Amortization of acquisition related software and intangible assets | 28,148 | 28,612 | 31,747 | |||||||||
| Total cost of services | 343,523 | 327,950 | 349,456 | |||||||||
| Selling, general and administrative expenses | 83,121 | 81,071 | 65,128 | |||||||||
| Total operating expenses | 426,644 | 409,021 | 414,584 | |||||||||
| Operating income | 47,572 | 34,204 | 77,178 | |||||||||
| Interest expense | (7,812 | ) | (7,931 | ) | (12,460 | ) | ||||||
| Interest income | 49 | 57 | 71 | |||||||||
| Other income, net | - | - | 801 | |||||||||
| Income before income taxes | 39,809 | 26,330 | 65,590 | |||||||||
| Income taxes | 15,282 | 12,383 | 25,593 | |||||||||
| Net income | $ | 24,527 | $ | 13,947 | $ | 39,997 | ||||||
| Basic income per common share: | ||||||||||||
| Net income per common share -- basic | $ | 0.28 | $ | 0.16 | $ | 0.46 | ||||||
| Diluted income per common share: | ||||||||||||
| Net income per common share -- diluted | $ | 0.28 | $ | 0.16 | $ | 0.45 | ||||||
| Weighted average shares: | ||||||||||||
| Basic | 87,881 | 87,673 | 87,598 | |||||||||
| Diluted | 88,361 | 88,164 | 88,344 | |||||||||
See accompanying notes to the consolidated financial statements
| 50 |
HMS HOLDINGS CORP. AND SUBSIDIARIES
CONSOLIDATED STATEMENTS OF SHAREHOLDERS’ EQUITY
(in thousands except share and per share amounts)
| Common Stock | Treasury Stock | |||||||||||||||||||||||||||
| # of Shares Issued | Par Value | Capital in Excess of Par Value | Retained Earnings | # of Shares | Amount | Total Shareholders' Equity | ||||||||||||||||||||||
| Balance at January 1, 2013 | 92,374,539 | $ | 923 | $ | 271,962 | $ | 210,003 | 5,424,847 | $ | (20,014 | ) | $ | 462,874 | |||||||||||||||
| Net income | - | - | - | 39,997 | - | - | 39,997 | |||||||||||||||||||||
| Stock-based compensation expense | - | - | 11,997 | - | - | - | 11,997 | |||||||||||||||||||||
| Purchase of treasury stock | - | - | - | - | 1,101,458 | (25,000 | ) | (25,000 | ) | |||||||||||||||||||
| Exercise of stock options | 1,305,538 | 12 | 9,248 | - | - | - | 9,260 | |||||||||||||||||||||
| Vesting of restricted stock awards and units, net of shares withheld for employee tax | 146,376 | 1 | (1,923 | ) | - | - | - | (1,922 | ) | |||||||||||||||||||
| Excess tax benefit from exercise of stock options | - | - | 5,233 | - | - | - | 5,233 | |||||||||||||||||||||
| Balance at December 31, 2013 | 93,826,453 | 936 | 296,517 | 250,000 | 6,526,305 | (45,014 | ) | 502,439 | ||||||||||||||||||||
| Net income | - | - | - | 13,947 | - | - | 13,947 | |||||||||||||||||||||
| Stock-based compensation expense | - | - | 13,356 | - | - | - | 13,356 | |||||||||||||||||||||
| Exercise of stock options | 516,552 | 5 | 4,105 | - | - | - | 4,110 | |||||||||||||||||||||
| Vesting of restricted stock awards and units, net of shares withheld for employee tax | 168,439 | 2 | (1,660 | ) | - | - | - | (1,658 | ) | |||||||||||||||||||
| Excess tax benefit from exercise of stock options | - | - | 1,795 | - | - | - | 1,795 | |||||||||||||||||||||
| Shortfall due to exercise of stock options | - | - | (323 | ) | - | - | - | (323 | ) | |||||||||||||||||||
| Deferred tax asset reversal for unexercised stock options | - | - | (576 | ) | - | - | - | (576 | ) | |||||||||||||||||||
| Balance at December 31, 2014 | 94,511,444 | 943 | 313,214 | 263,947 | 6,526,305 | (45,014 | ) | 533,090 | ||||||||||||||||||||
| Net income | - | - | - | 24,527 | - | - | 24,527 | |||||||||||||||||||||
| Stock-based compensation expense | - | - | 14,297 | - | - | - | 14,297 | |||||||||||||||||||||
| Purchase of treasury stock | - | - | - | - | 4,747,441 | (50,000 | ) | (50,000 | ) | |||||||||||||||||||
| Exercise of stock options | 577,559 | 7 | 4,180 | - | - | - | 4,187 | |||||||||||||||||||||
| Vesting of restricted stock units, net of shares withheld for employee tax | 174,458 | 2 | (1,031 | ) | - | - | - | (1,029 | ) | |||||||||||||||||||
| Excess tax benefit from exercise of stock options | - | - | 1,569 | - | - | - | 1,569 | |||||||||||||||||||||
| Tax shortfall due to exercise of stock options and vesting of restricted stock units | - | - | (827 | ) | - | - | - | (827 | ) | |||||||||||||||||||
| Deferred tax asset reversal for unexercised stock options | - | - | (1,112 | ) | - | - | - | (1,112 | ) | |||||||||||||||||||
| - | ||||||||||||||||||||||||||||
| Balance at December 31, 2015 | 95,263,461 | $ | 952 | $ | 330,290 | $ | 288,474 | 11,273,746 | $ | (95,014 | ) | $ | 524,702 | |||||||||||||||
See accompanying notes to the consolidated financial statements.
| 51 |
HMS HOLDINGS CORP. AND SUBSIDIARIES
CONSOLIDATED STATEMENTS OF CASH FLOWS
(in thousands)
| Years ended December 31, | ||||||||||||
| 2015 | 2014 | 2013 | ||||||||||
| Operating activities: | ||||||||||||
| Net income | $ | 24,527 | $ | 13,947 | $ | 39,997 | ||||||
| Adjustments to reconcile net income to net cash provided by operating activities: | ||||||||||||
| Depreciation and amortization of property and equipment | 30,328 | 32,864 | 31,360 | |||||||||
| Amortization of intangible assets | 20,270 | 20,734 | 23,631 | |||||||||
| Amortization of deferred financing costs | 2,084 | 2,084 | 3,077 | |||||||||
| Stock-based compensation expense | 14,297 | 13,356 | 11,997 | |||||||||
| Excess tax benefit from exercised stock options | (1,569 | ) | (1,795 | ) | (5,233 | ) | ||||||
| Deferred income taxes | (14,020 | ) | (12,290 | ) | (4,354 | ) | ||||||
| Loss on disposal of fixed assets | 84 | 219 | 431 | |||||||||
| Change in fair value of contingent consideration | - | (517 | ) | 35 | ||||||||
| Changes in operating assets and liabilities: | ||||||||||||
| Accounts receivable | (12,045 | ) | 14,625 | (14,956 | ) | |||||||
| Prepaid expenses | 549 | 1,132 | 1,341 | |||||||||
| Prepaid income taxes | 6,711 | 3,445 | (1,559 | ) | ||||||||
| Other current assets | (412 | ) | (2,150 | ) | (172 | ) | ||||||
| Other assets | 10 | 121 | 28 | |||||||||
| Income taxes payable | 3,873 | - | - | |||||||||
| Accounts payable, accrued expenses and other liabilities | (250 | ) | 18,039 | 1,050 | ||||||||
| Estimated liability for appeals | (3,721 | ) | (5,053 | ) | 14,508 | |||||||
| Net cash provided by operating activities | 70,716 | 98,761 | 101,181 | |||||||||
| Investing activities: | ||||||||||||
| Purchases of land, property and equipment | (8,620 | ) | (22,687 | ) | (22,127 | ) | ||||||
| Investment in capitalized software | (3,197 | ) | (3,514 | ) | (3,656 | ) | ||||||
| Investment in common stock | - | - | (500 | ) | ||||||||
| Net cash used in investing activities | (11,817 | ) | (26,201 | ) | (26,283 | ) | ||||||
| Financing activities: | ||||||||||||
| Repayment of revolving credit facility | - | (35,000 | ) | (95,000 | ) | |||||||
| Proceeds from exercise of stock options | 4,187 | 4,110 | 9,260 | |||||||||
| Excess tax benefit from exercised stock options | 1,569 | 1,795 | 5,233 | |||||||||
| Payments of tax withholdings on behalf of employees for net-share settlement for stock-based compensation | (1,029 | ) | (1,658 | ) | (1,922 | ) | ||||||
| Payments on capital lease obligations | (1,132 | ) | (1,629 | ) | (1,711 | ) | ||||||
| Payments on contingent consideration | - | (428 | ) | - | ||||||||
| Purchases of treasury stock | (50,000 | ) | - | (25,000 | ) | |||||||
| Repayment of term loan | - | - | (8,750 | ) | ||||||||
| Proceeds from revolving credit facility | - | - | 4,046 | |||||||||
| Payment of financing fees related to revolving credit facility | - | - | (2,915 | ) | ||||||||
| Net cash used in financing activities | (46,405 | ) | (32,810 | ) | (116,759 | ) | ||||||
| Net increase (decrease) in cash and cash equivalents | 12,494 | 39,750 | (41,861 | ) | ||||||||
| Cash and cash equivalents at beginning of year | 133,116 | 93,366 | 135,227 | |||||||||
| Cash and cash equivalents at end of year | $ | 145,610 | $ | 133,116 | $ | 93,366 | ||||||
| Supplemental disclosure of cash flow information: | ||||||||||||
| Cash paid for income taxes | $ | 22,878 | $ | 21,144 | $ | 34,922 | ||||||
| Cash paid for interest | $ | 5,694 | $ | 4,458 | $ | 9,520 | ||||||
| Supplemental disclosure of noncash activities: | ||||||||||||
| Accrued property and equipment purchases | $ | 729 | $ | 1,610 | $ | 1,725 | ||||||
| Equipment purchased through capital leases | $ | - | $ | 20 | $ | 2,401 | ||||||
See accompanying notes to the consolidated financial statements.
| 52 |
HMS HOLDINGS CORP. AND SUBSIDIARIES
NOTES TO THE CONSOLIDATED FINANCIAL STATEMENTS
1. Organization and Business
HMS Holdings Corp, (the “Company” or “HMS”) provides coordination of benefits services to government and private healthcare payers and sponsors to ensure that the responsible party pays healthcare claims. Additionally, the Company’s payment integrity services ensure that healthcare claims billed are accurate and appropriate. Together, these various services help customers recover amounts from liable third parties; prevent future improper payments; reduce fraud, waste and abuse; and ensure regulatory compliance.
The Company has grown both organically and through targeted acquisitions. Initially, the Company provided coordination of benefits services to state Medicaid agencies, then expanded its business by providing similar services to managed care organizations when Medicaid began designating members to those plans. After launching payment integrity services in 2007, HMS grew its product suite and expanded its reach in the marketplace by acquiring IntegriGuard, LLC (2009), Verify Solutions, Inc. (2009), Chapman Kelly, Inc. (2010), HealthDataInsights, Inc. (“HDI”) (2011) and MedRecovery Management, LLC (2012).
HMS is incorporated in the State of Delaware. The Company was originally incorporated on October 2, 2002 in the State of New York. On March 3, 2003, the Company adopted a holding company structure and assumed the business of the Company’s predecessor, Health Management Systems, Inc. In connection with the adoption of this structure, Health Management Systems, Inc. which began doing business in 1974, became the Company’s wholly owned subsidiary.
HMS is managed and operated as one business, with a single management team that reports to the Chief Executive Officer. HMS does not operate separate lines of business with respect to any of the Company’s product lines.
2. Summary of Significant Accounting Policies
(a) Principles of Consolidation
The consolidated financial statements include the Company’s accounts and transactions and those of the Company’s wholly owned subsidiaries. All significant intercompany balances and transactions have been eliminated in consolidation.
(b) Use of Estimates
The preparation of the consolidated financial statements in conformity with United States generally accepted accounting principles (“U.S. GAAP”) requires management to make estimates and assumptions that affect the reported amounts of assets and liabilities and disclosure of contingent assets and liabilities at the date of the financial statements and the reported amounts of revenues and expenses during the reporting period. Actual results could differ from those estimates.
(c) Reclassifications
Certain reclassifications were made to prior year amounts to conform to the current period presentation.
(d) Cash and Cash Equivalents
The Company considers all highly liquid investments with an original maturity of three months or less to be cash equivalents. Cash equivalents consist of deposits that are readily convertible into cash.
(e) Concentration of Credit Risk
Financial instruments (principally cash and cash equivalents, accounts receivable, accounts payable and accrued expenses) are carried at cost, which approximates fair value due to the short-term maturity of these instruments. The Company’s long-term debt or revolving credit facility is carried at cost. Due to the variable interest rate associated with the revolving credit facility and the variable interest margin based upon the Company’s consolidated leverage ratio, the fair value of the credit facility approximates its carrying value.
| 53 |
The Company’s policy is to limit credit exposure by placing cash in accounts which are exposed to minimal interest rate and credit risk. HMS maintains cash in cash depository accounts, U.S. Treasuries, and money market mutual funds with large financial institutions with a minimum credit rating of A1/P1 or better, as defined by Standard and Poor’s. The balance at these institutions generally exceeds the maximum balance insured by the Federal Deposit Insurance Corporation of up to $250,000 per entity. HMS has not experienced any losses on the bank deposits and believes these deposits do not expose the Company to any significant credit risk.
The Company is subject to potential credit risk related to changes in economic conditions within the healthcare market. However, HMS believes that the billing and collection policies are adequate to minimize the potential credit risk. The Company performs ongoing credit evaluations of customers and generally does not require collateral. HMS has no history of significant losses from uncollectible accounts.
(f) Property and Equipment
Property and equipment are stated at cost less accumulated depreciation. Depreciation is provided over the estimated useful lives of the assets utilizing the straight-line method. HMS amortizes leasehold improvements on a straight-line basis over the term of the related lease, including any anticipated renewal periods, or the life of the leasehold improvement, whichever is shorter. Equipment leased under capital leases is depreciated over the shorter of (i) the term of the lease and (ii) the estimated useful life of the equipment. The depreciation expense on assets acquired under capital leases is in selling, general and administrative expense (“SG&A”). Estimated useful lives are as follows:
| Equipment (in years) | 2 | - | 3 | |
| Leasehold improvements (in years) | 3 | - | 10 | |
| Furniture and fixtures (in years) | 3 | - | 5 | |
| Building and building improvements (in years) | up to 39.5 |
(g) Software and Software Development Cost
Software development costs related to software that is acquired or developed for internal use while in the application development stage are capitalized. All other costs to develop software for internal use, either in the preliminary project stage or post-implementation stage, are expensed as incurred. Amortization of software and software development costs is calculated on a straight-line basis over the expected economic life, generally estimated to be 5 to 10 years.
(h) Goodwill
Goodwill is the excess of acquisition costs over the fair value of assets and liabilities of acquired businesses, is subject to a periodic assessment for impairment in accordance with Accounting Standards Codification (“ASC”) 350—Intangibles, Goodwill and Other. HMS assesses goodwill for impairment on an annual basis as of June 30th of each year or more frequently if an event occurs or changes in circumstances would more likely than not reduce the fair value of a reporting unit below its carrying amount. Assessment of goodwill impairment is at the HMS Holdings Corp. entity level as the Company operates as a single reporting unit.
The Company has the option to perform a qualitative assessment to determine if impairment is more likely than not to have occurred. If the Company can support the conclusion that it is more likely than not that the fair value of a reporting unit is greater than its carrying amount, then HMS would not need to perform the two-step impairment test for that reporting unit. If the Company cannot support such a conclusion, or the Company does not elect to perform the qualitative assessment, then the first step of the goodwill impairment test is used to identify potential impairment by comparing the fair value of a reporting unit with its carrying amount, including goodwill.
HMS completed the annual impairment test as of June 30, 2015 and determined no impairment existed. The result of the annual impairment test indicated that the fair value of the reporting unit is significantly in excess of its carrying value.
There were no impairment charges related to goodwill during the fiscal years ended December 31, 2015, 2014 or 2013.
(i) Long-Lived Assets
Long-lived assets, which include property and equipment and intangible assets, are reviewed for impairment whenever events or changes in circumstances indicate that the carrying amount of an asset may not be recoverable. Recoverability of assets to be held and used is measured by a comparison of the carrying value of its asset group to the estimated undiscounted future net cash flows expected to be generated by the asset. If such assets are considered to be impaired, the impairment to be recognized is measured by the amount by which the carrying value of the asset group exceeds the fair value of the assets, which amount is charged to earnings. Fair value is based on a projection of the estimated discounted future net cash flows expected to result from the asset group, using a discount rate reflective of the Company’s cost of funds.
| 54 |
The Company did not recognize any impairment charges related to the long-lived assets, property and equipment intangible assets, during the years ended December 31, 2015, 2014 or 2013, as management believes that carrying amounts were not impaired.
(j) Acquisition Accounting
The Company assign values to assets acquired and liabilities assumed based upon their fair value. In most instances there is not a readily defined or listed market price for individual assets and liabilities acquired in connection with a business, including intangible assets. The determination of fair value for individual assets and liabilities in many instances requires a high degree of estimation. The valuation of intangible assets, in particular, is very subjective. The use of different valuation techniques and assumptions could change the amounts and useful lives assigned to the assets and liabilities acquired, including goodwill and other intangible assets and related amortization expense.
(k) Income Taxes
Income taxes are accounted for under the asset and liability method. Under this method, deferred tax assets and liabilities are recognized for the future tax consequences attributable to temporary differences between the financial statement carrying amounts of existing assets and liabilities and their respective tax bases. This method also requires the recognition of future tax benefits for net operating loss carry-forwards. Deferred tax assets and liabilities are measured using enacted tax rates expected to apply to taxable income in the years in which those temporary differences are expected to be recovered or settled. The effect on deferred tax assets and liabilities of a change in tax rates is recognized as income in the period that includes the enactment date. A valuation allowance is provided against deferred tax assets to the extent their realization is not more likely than not.
Uncertain income tax positions are accounted for by prescribing a minimum recognition threshold that a tax position is required to meet before being recognized in the financial statements.
(l) Revenue Recognition and Estimated Liability for Appeals
The Company provides services under contracts that contain various fee structures, including contingency fee and fixed fee arrangements. Revenue is recognized when a contract exists, services have been provided to the customer, the fee is fixed and determinable, and collectability is reasonably assured. In addition, the Company has contracts with the federal government which are generally cost-plus or time and material based. Revenue on cost-plus contracts is recognized based on costs incurred plus the negotiated fee earned. Revenue on time and materials contracts is recognized based on hours worked and expenses incurred.
Under the Company’s Medicare Recovery Audit Contractor (“RAC”) contract with the Centers for Medicare & Medicaid Services (“CMS”), the Medicaid RAC contracts with various states, and similar contracts for private health plan customers, HMS recognizes revenue when claims are sent to the customer for offset against future claims payments. Providers have the right to appeal a claim and may pursue additional appeals if the initial appeal is found in favor of the customer. HMS accrues an estimated liability for appeals based on the amount of revenue that is subject to appeals, closures or other adjustments and which HMS estimate are probable of being returned to providers following a successful appeal. This estimated liability for appeals is an offset to revenue in the Company’s Consolidated Statements of Income. The Company’s estimates are based on the Company’s historical experience with appeals. The estimated liability for appeals of $33.1 million and $36.8 million as of December 31, 2015 and 2014, respectively, represents the Company’s estimate of the potential amount of repayments related to appeals of claims, closures and other adjustments for which revenue was previously collected. This is reflected as a separate line item in the current liabilities section of the balance sheet titled “Estimated liability for appeals.” To the extent the amount to be returned to providers following a successful appeal, closure or other adjustment exceeds the amount accrued, revenue in the applicable period would be reduced by the amount of the excess.
As of December 31, 2015, HMS has an estimated liability for appeals and estimated allowance for appeals (which is an offset to accounts receivable) based on the Company’s historical experience with this activity under the Company’s customers’ contracts. Any future changes to any of the Company’s customer contracts, including further modifications to the transition plan for incumbent Medicare RACs may require the Company to apply different assumptions that could affect HMS’ estimated liability for future periods. The Company similarly accrues an allowance against accounts receivable related to revenue yet to be collected, based on the same estimates used to establish the estimated liability for appeals of revenue received.
| 55 |
In addition, some of the Company’s contracts may include customer acceptance provisions. Formal customer sign-off is not always necessary to recognize revenue, provided HMS objectively demonstrates that the criteria specified in the acceptance provision are satisfied. Due to the range of products and services that HMS provides and the differing fee structures associated with each type of contract, revenue may be recognized in irregular increments.
(m) Stock-Based Compensation
The Company estimates the fair value of all stock awards granted using the Black-Scholes option pricing model for “non-performance-based” grants and Monte Carlo simulation is used for performance-based grants with certain market conditions.
The determination of the fair value of the stock based awards on the grant date using the applicable option pricing model is affected by the Company’s stock price, as well as assumptions regarding a number of complex and subjective variables. These variables include the Company’s expected stock price volatility over the expected term of the awards, actual and projected option exercise experience, a risk-free interest rate and any expected dividends. The Company estimates the expected term of the options granted by calculated the average term from the Company’s historical option exercise experience and volatility of the common stock using historical volatility. The assumed risk-free interest rate is based on the yield on the measurement date of a zero-coupon U.S. Treasury bond with a maturity period equal to the option’s expected term. The Company does not anticipate paying any cash dividends in the foreseeable future and therefore uses an expected dividend yield of zero in the option valuation models.
The Company estimates forfeitures at the time of grant and revises the forfeiture rate in subsequent periods if actual forfeitures differ from estimates. If actual forfeitures vary from estimates, a difference in compensation expense will be recognized in the period the actual forfeitures occur or at the time of vesting.
The fair value of each award is determined and the compensation expense is recognized over the service period. Compensation expense reflects an estimate of the number of awards expected to vest after taking into consideration an estimate of award forfeitures based on actual experience. Upon the exercise of stock options or the vesting of restricted stock units and restricted stock awards, the resulting excess tax benefits, if any, are credited to additional paid-in capital. Any resulting tax deficiencies will first be offset against those cumulative credits to additional paid-in capital. If the cumulative credits to additional paid-in capital are exhausted, tax deficiencies will be recorded to the provision for income taxes. Excess tax benefits are required to be reflected as financing cash inflows in the accompanying Consolidated Statements of Cash Flows.
(n) Fair Value of Financial Instruments
The Company had no financial assets or liabilities measured at fair value was of December 31, 2015 and 2014. However, if HMS opted to measure financial assets and liabilities at fair value in the future, the policy is to measure fair value based on valuation techniques using the best information available, which may include quoted market prices, market comparables and discounted cash flow projections. In general, and where applicable, quoted prices in active markets are used for identical assets to determine fair value. If quoted prices in active markets for identical assets are not available to determine fair value, then the Company uses quoted prices for similar assets and liabilities or inputs that are observable either directly or indirectly. If quoted prices for identical or similar assets are not available, the Company uses internally developed valuation models, whose inputs include bid prices, and third party valuations utilizing underlying asset assumptions.
The fair values of the Company’s financial instruments reflect the price that would be received to sell an asset or paid to transfer a liability in an orderly transaction between market participants at the measurement date (exit price). In addition, the Financial Accounting Standards Board (the “FASB”), authoritative guidance requires disclosure of the fair value of financial instruments, both assets and liabilities recognized and not recognized in the statement of financial position, for which it is practicable to estimate fair value.
| 56 |
The Company’s financial instruments are categorized into a three-level fair value hierarchy that prioritizes the inputs to valuation techniques used to measure fair value into three broad levels. The fair value hierarchy gives the highest priority to quoted prices in active markets for identical assets or liabilities (Level 1) and the lowest priority to unobservable inputs (Level 3). If the inputs used to measure fair value fall within different levels of the hierarchy, the category level is based on the lowest priority level input that is significant to the fair value measurement of the instrument. In the event the fair value is not readily available or determinable, the financial instrument is carried at cost and referred to as a cost method investment. The evaluation of whether an investment’s fair value is less than cost is determined by using a disclosed fair value estimate, if one is available, otherwise, it is determined by evaluating whether an event or change in circumstances has occurred that may have a significant adverse effect on the fair value of the investment (an impairment indicator). HMS is not aware of any identified events or change in circumstances that would have a significant adverse effect on the carrying value of the cost method investments. Financial instruments recorded at fair value on the consolidated balance sheets are categorized as follows:
| · | Level 1: Observable inputs such as quoted prices in active markets; |
| · | Level 2: Inputs, other than the quoted prices in active markets, that are observable either directly or indirectly; and |
| · | Level 3: Unobservable inputs in which there is little or no market data, which require the reporting entity to develop its own assumptions. |
The carrying amounts of cash equivalents, accounts receivable, accounts payable and accrued expenses approximate fair value due to the short-term nature of their maturities. Due to the variable interest rate associated with the revolving credit facility and the variable interest margin based upon the Company’s consolidated leverage ratio, the fair value of the credit facility approximates its carrying value.
(o) Leases
HMS accounts for the lease agreements as either operating or capital leases, depending on certain defined criteria. Lease costs are amortized on a straight-line basis without regard to deferred payment terms, such as rent holidays, that defer the commencement date of required payments. Additionally, incentives such as tenant improvement allowances, are capitalized and are treated as a reduction of rental expense over the term of the lease agreement.
(p) Recently Issued Accounting Pronouncements
In May 2014, the FASB issued ASU 2014-09, Revenue from Contracts with Customers (Topic 606) (“ASU 2014-09”), which is the new comprehensive revenue recognition standard that will supersede all existing revenue recognition guidance under U.S. GAAP. The standard's core principle is that a company will recognize revenue when it transfers promised goods or services to a customer in an amount that reflects the consideration to which the company expects to be entitled in exchange for those goods or services. ASU 2015-14, Revenue from Contracts with Customers (Topic 606): Deferral of the Effective Date, which was issued in August 2015, revised the effective date for this ASU to annual and interim periods beginning on or after December 15, 2017, with early adoption permitted, but not earlier than the original effective date of annual and interim periods beginning on or after December 15, 2016, for public entities. Entities will have the option of using either a full retrospective approach or a modified approach to adopt the guidance in ASU 2014-09. The Company is currently evaluating the impact of adopting this guidance.
In June 2014, the FASB issued ASU 2014-12, Accounting for Share-Based Payments When the Terms of an Award Provide That a Performance Target Could Be Achieved after the Requisite Service Period (“ASU 2014-12”). ASU 2014-12 brings consistency to the accounting for share-based payment awards that require a specific performance target to be achieved in order for employees to become eligible to vest in the awards. Effective January 1, 2015, HMS adopted the provisions of ASU 2014-12. The adoption of this guidance did not have a material effect on the Company’s consolidated financial statements.
In April 2015, the FASB issued ASU 2015-03, Simplifying the Presentation of Debt Issuance Costs (“ASU 2015-03”). ASU 2015-03 simplifies the presentation of debt issuance costs by requiring that debt issuance costs related to a recognized debt liability be presented in the balance sheet as a direct deduction from the carrying amount of that debt liability, consistent with debt discounts. The recognition and measurement guidance for debt issuance costs are not affected by ASU 2015-03. In August 2015, FASB issued ASU 2015-15, Presentation and Subsequent Measurement of Debt Issuance Costs Associated with Line-of-Credit Arrangements (“ASU 2015-15”). ASU 2015-15 clarifies the presentation and measuring of debt issuance costs incurred in connection with line-of-credit arrangements given the lack of guidance on this topic in ASU 2015-03. For line-of-credit arrangements, an entity can continue to present debt issuance costs as an asset and amortize the deferred debt issuance costs ratably over the term of the line-of-credit arrangement. ASU 2015-03, as amended, is effective for annual reporting periods beginning after December 15, 2015, including interim periods within such annual reporting periods with early adoption permitted. ASU 2015-03 is to be retrospectively adopted to each prior reporting period presented. HMS does not expect the adoption of this guidance to have a material effect on the Company’s consolidated financial statements.
| 57 |
In April 2015, the FASB issued ASU 2015-05, Intangibles – Goodwill and Other – Internal-Use Software (Subtopic 350-40): Customer’s Accounting for Fees Paid in a Cloud Computing Arrangement (“ASU 2015-05”). ASU 2015-05 provides explicit guidance to help companies evaluate the accounting for fees paid by a customer in a cloud computing arrangement and clarifies that if a cloud computing arrangement includes a software license, the customer should account for the license consistent with its accounting for other software licenses. If the arrangement does not include a software license, the customer should account for the arrangement as a service contract. ASU 2015-05 is effective for annual reporting periods beginning after December 15, 2015, including interim periods within such annual reporting periods with early adoption permitted. HMS does not expect the adoption of this guidance to have a material effect on the Company’s consolidated financial statements.
In November 2015, the ASB issued ASU 2015-17, Income Taxes (Topic 740): Balance Sheet Classification of Deferred Taxes (“ASU 2015-17”). ASU 2015-17 simplifies the current presentation of separately classifying deferred tax assets and deferred tax liabilities as current and noncurrent in a classified balance sheet by requiring companies to present them as noncurrent. ASU 2015-17, as amended, is effective for annual reporting periods beginning after December 15, 2016, including interim periods within such annual reporting periods with early adoption permitted. HMS has not early adopted this guidance and is currently evaluating the effect on the Company’s consolidated financial statements.
In February 2016, the FASB issued ASU 2016-02, Leases (Topic 842) (“ASU 2016-02”). ASU 2016-02 will require most lessees to recognize a majority of the Company’s leases on the balance sheet, which will increase reported assets and liabilities. ASU 2016-02 is effective for annual reporting periods beginning after December 15, 2018. Early adoption is permitted. HMS has not early adopted this guidance and is currently evaluating the effect on the Company’s consolidated financial statements.
Other new pronouncements issued but not effective until after December 31, 2015 are not expected to have a material impact on our financial position, results of operations or liquidity.
3. Property and Equipment
Property and equipment as of December 31, 2015 and 2014 consisted of the following (in thousands):
| December 31, | ||||||||
| 2015 | 2014 | |||||||
| Equipment | $ | 90,496 | $ | 94,686 | ||||
| Leasehold improvements | 8,512 | 9,194 | ||||||
| Building | 8,624 | 8,624 | ||||||
| Building improvements | 11,367 | 8,762 | ||||||
| Land | 2,769 | 2,769 | ||||||
| Furniture and fixtures | 10,858 | 12,107 | ||||||
| Capitalized software | 104,266 | 101,069 | ||||||
| 236,892 | 237,211 | |||||||
| Less accumulated depreciation and amortization | (140,341 | ) | (121,184 | ) | ||||
| Property and equipment, net | $ | 96,551 | $ | 116,027 | ||||
Depreciation and amortization expense related to property and equipment charged to operations for the years ended December 31, 2015, 2014 and 2013 was $30.3 million, $32.9 million and $31.4 million, respectively. Net capital leases included as part of equipment were approximately $51,000 and $1.2 million at December 31, 2015 and 2014, respectively. Accumulated depreciation for equipment under capital leases was approximately $6.0 million and $4.8 million for the years ended December 31, 2015 and 2014. Depreciation expense for equipment under capital leases for the years ended December 31, 2015, 2014 and 2013 was approximately $1.2 million, $1.6 million, and $1.7 million, respectively.
| 58 |
4. Intangible Assets
Intangible assets consisted of the following as of December 31, 2015 and 2014 (in thousands):
| Gross Value | Accumulated Amortization | Net Book Value | Useful Life (years) | |||||||||||||
| December 31, 2015 | ||||||||||||||||
| Customer relationships | $ | 101,806 | $ | (57,497 | ) | $ | 44,309 | 5 | - | 10 | ||||||
| Restrictive covenants | 16,800 | (13,580 | ) | 3,220 | 3 | - | 7 | |||||||||
| Trade name | 17,000 | (10,221 | ) | 6,779 | 3 | - | 5 | |||||||||
| $ | 135,606 | $ | (81,298 | ) | $ | 54,308 | ||||||||||
| December 31, 2014 | ||||||||||||||||
| Customer relationships | $ | 102,755 | $ | (44,020 | ) | $ | 58,735 | 5 | - | 10 | ||||||
| Restrictive covenants | 18,000 | (11,394 | ) | 6,606 | 3 | - | 7 | |||||||||
| Trade name | 17,000 | (7,763 | ) | 9,237 | 3 | - | 5 | |||||||||
| $ | 137,755 | $ | (63,177 | ) | $ | 74,578 | ||||||||||
Amortization expense of intangible assets is expected to approximate the following (in thousands):
| Year ending December 31, | |||||
| 2016 | $ | 19,934 | |||
| 2017 | 16,613 | ||||
| 2018 | 15,992 | ||||
| 2019 | 1,582 | ||||
| 2020 | 187 | ||||
| Thereafter | - | ||||
For the years ended December 31, 2015, 2014 and 2013, amortization expense related to intangible assets was $20.3 million, $20.7 million and $23.6 million, respectively.
There were no changes in the carrying amount of goodwill for the years ended December 31, 2015 and 2014.
5. Accounts Payable, Accrued Expenses and Other Liabilities
Accounts payable, accrued expenses and other liabilities as of December 31, 2015 and 2014 consisted of the following (in thousands):
| December 31, | ||||||||
| 2015 | 2014 | |||||||
| Accounts payable, trade | $ | 7,790 | $ | 14,840 | ||||
| Accrued compensation | 21,948 | 16,895 | ||||||
| Accrued operating expenses | 21,923 | 22,814 | ||||||
| Total accounts payable, accrued expenses and other liabilities | $ | 51,661 | $ | 54,549 | ||||
| 59 |
6. Income Taxes
The income tax expense for the years ended December 31, 2015, 2014 and 2013 is as follows (in thousands):
| December 31, | ||||||||||||
| 2015 | 2014 | 2013 | ||||||||||
| Current tax expense: | ||||||||||||
| Federal | $ | 25,852 | $ | 20,244 | $ | 25,211 | ||||||
| State | 3,450 | 4,429 | 4,736 | |||||||||
| 29,302 | 24,673 | 29,947 | ||||||||||
| Deferred tax expense (benefit): | ||||||||||||
| Federal | (12,571 | ) | (12,421 | ) | (3,485 | ) | ||||||
| State | (1,449 | ) | 131 | (869 | ) | |||||||
| (14,020 | ) | (12,290 | ) | (4,354 | ) | |||||||
| Total income tax expense | $ | 15,282 | $ | 12,383 | $ | 25,593 | ||||||
A reconciliation of the income tax expense calculated using the applicable federal statutory rates to the actual income tax expense for the years ended December 31, 2015, 2014 and 2013 is as follows (in thousands):
| December 31, | ||||||||||||||||||||||||
| 2015 | % | 2014 | % | 2013 | % | |||||||||||||||||||
| Computed at federal statutory rate | $ | 13,934 | 35.0 | $ | 9,215 | 35.0 | $ | 22,946 | 35.0 | |||||||||||||||
| State and local tax expense, net of federal benefit | 1,038 | 2.6 | 2,973 | 11.3 | 2,448 | 3.7 | ||||||||||||||||||
| Other, net | 310 | 0.8 | 195 | 0.7 | 199 | 0.3 | ||||||||||||||||||
| Total income tax expense | $ | 15,282 | 38.4 | $ | 12,383 | 47.0 | $ | 25,593 | 39.0 | |||||||||||||||
The Company’s effective tax rate decreased to 38.4% for the year ended December 31, 2015 from 47.0% for the year ended December 31, 2014, primarily due to a change in unitary state apportionments and permanent differences. The principal differences between the statutory rate and the Company’s effective rate are state taxes and permanent differences.
Deferred income taxes are recognized for the future tax consequences of temporary differences between the financial statement and tax bases of assets and liabilities. The tax effect of temporary differences that give rise to a significant portion of the deferred tax assets and deferred tax liabilities at December 31, 2015 and 2014 were as follows (in thousands):
| December 31, | ||||||||
| 2015 | 2014 | |||||||
| Deferred tax assets: | ||||||||
| Deferred stock-based compensation expense | $ | 9,059 | $ | 7,739 | ||||
| Goodwill and intangible assets | 10,449 | 10,416 | ||||||
| Accounts receivable | - | 2,576 | ||||||
| Allowance for doubtful accounts | 1,766 | 1,473 | ||||||
| Deferred rent | 1,119 | 783 | ||||||
| Tenant improvements | 1,392 | 1,339 | ||||||
| Net operating loss carry-forwards | 113 | 122 | ||||||
| Accrued expenses and other | 6,298 | 3,337 | ||||||
| Total deferred tax assets | 30,196 | 27,785 | ||||||
| Deferred tax liabilities: | ||||||||
| Goodwill and intangible assets | 54,586 | 61,328 | ||||||
| Property and equipment | 3,098 | 6,107 | ||||||
| Capitalized software cost | 3,473 | 3,392 | ||||||
| Total deferred tax liabilities | 61,157 | 70,827 | ||||||
| Total net deferred tax liabilities | $ | 30,961 | $ | 43,042 | ||||
| Net current deferred tax assets | $ | (7,460 | ) | $ | (7,811 | ) | ||
| Net non-current deferred tax liabilities | 38,421 | 50,853 | ||||||
| Total net deferred tax liabilities | $ | 30,961 | $ | 43,042 | ||||
| 60 |
During 2015, the Company utilized $4.3 million in tax deductions arising from stock-based compensation, which resulted in an excess tax benefit of $1.6 million that was recorded to capital in excess of par value and an offsetting reduction to taxes payable.
The total amount of unrecognized tax benefits was approximately $1.3 million for both December 31, 2015 and 2014, respectively, (net of the federal benefit for state issues) that, if recognized, would favorably affect the Company’s future effective tax rate. The accrued liability for interest expense and penalties related to unrecognized tax benefits was $0.4 million and $0.2 million for December 31, 2015 and 2014, respectively. HMS includes interest expense and penalties in the provision for income taxes in the Consolidated Statements of Income. The amount of interest expense (net of federal and state income tax benefits) and penalties in the Consolidated Statements of Income for the years ended December 31, 2015 and 2014 was $0.4 million and $0.2 million, respectively. The Company believes it is reasonably possible that amount of unrecognized tax benefits may decrease, by $0.8 million during 2016, due to the expiration of the statute of limitations in various state jurisdictions.
A reconciliation of the beginning and ending amounts of unrecognized tax benefits for the twelve months ended December 31, 2015 and 2014 are as follows (in thousands):
| December 31, | ||||||||
| 2015 | 2014 | |||||||
| Unrecognized tax benefits at January 1 | $ | 1,329 | $ | 1,034 | ||||
| Additions for tax positions of prior periods | 565 | 484 | ||||||
| Additions for tax positions of current periods | - | - | ||||||
| Reductions related to the expiration of statutes of limitations | (565 | ) | (189 | ) | ||||
| Unrecognized tax benefits at December 31 | $ | 1,329 | $ | 1,329 | ||||
At December 31, 2015, HMS had pre-tax net operating loss carryforwards of approximately $1.3 million, which will begin to expire in 2021.
The Company files income tax returns with the U.S. Federal government and various state jurisdictions. HMS is no longer subject to U.S. Federal income tax examinations for years before 2012. HMS operates in a number of state and local jurisdictions, most of which have never audited the Company’s records. Accordingly, HMS is subject to state and local income tax examinations based upon the various statutes of limitations in each jurisdiction. The Company is currently being examined by the State of New York.
7. Credit Agreement
In connection with the acquisition of HDI, the Company entered into a five-year, revolving and term secured credit agreement, (“2011 Credit Agreement”), with certain financial institutions and Citibank, N.A. as Administrative Agent. In May 2013, the Company amended and restated the 2011 Credit Agreement and entered into a $500 million five-year, amended and restated revolving credit agreement (“2013 Credit Agreement”). During the year ended December 31, 2015, no principal payments were made against the Company’s revolving credit facility. During the year ended December 31, 2014, HMS made principal payments of $35.0 million against the revolving credit facility. The $197.8 million principal balance of the revolving credit facility is due in May 2018.
The 2013 Credit Agreement provides for an initial $500 million revolving credit facility, and, under specified circumstances, the revolving credit facility can be increased or one or more incremental term loan facilities can be added, provided that the incremental credit facilities do not exceed in the aggregate the sum of (a) $75 million plus (b) an additional amount not less than $25 million, so long as the total secured leverage ratio, calculated giving pro forma effect to the requested incremental borrowing and other customary and appropriate pro forma adjustment events, including any permitted acquisitions, is no greater than 2.5:1.0. The 2013 Credit Agreement is collateralized by the Company’s assets.
The 2013 Credit Agreement contains certain customary representations and warranties, affirmative and negative covenants, and events of default. The 2013 Credit Agreement requires the Company to comply, on a quarterly basis, with certain principal financial covenants, including a maximum consolidated leverage ratio reducing from 3.50:1.00 to 3.25:1.00 over the next five years and a minimum interest coverage ratio of 3.00:1.00.
The interest rates applicable to the revolving credit facility are, at the Company’s option, either (a) the LIBOR multiplied by the statutory reserve rate plus an interest margin ranging from 1.50% to 2.25% based on the Company’s consolidated leverage ratio, or (b) a base rate (which is equal to the greatest of (a) Citibank’s prime rate, (b) the federal funds effective rate plus 0.50% and (c) the one-month LIBOR plus 1.00% plus an interest margin ranging from 0.50% to 1.25% based on the Company’s consolidated leverage ratio). HMS pays an unused commitment fee on the revolving credit facility during the term of the 2013 Credit Agreement ranging from 0.375% to 0.50% per annum based on the consolidated leverage ratio.
| 61 |
Obligations under the 2013 Credit Agreement may be accelerated upon the occurrence of an event of default, which includes customary events of default including, without limitation, payment defaults, failures to perform affirmative covenants, failure to refrain from actions or omissions prohibited by negative covenants, the inaccuracy of representations or warranties, cross-defaults, bankruptcy and insolvency related defaults, defaults relating to judgments, defaults due to certain ERISA related events and a change of control default. As of December 31, 2015, the Company was in compliance with all the terms of the 2013 Credit Agreement.
Borrowings under the 2013 Credit Agreement were used to refinance the outstanding principal and unpaid interest of $323.8 million and $1.1 million, respectively, under the term loan of the 2011 Credit Agreement. Lender fees of $2.9 million were paid in connection with amending and restating the Credit Agreement. These fees are included in deferred financing costs and will amortized through the term of the 2013 Credit Agreement
The interest expense and the commitment fees on the unused portion of the Company’s revolving credit facility are as follows (in thousands):
| December 31, | ||||||||||||
| 2015 | 2014 | 2013 | ||||||||||
| Interest expense | $ | 4,117 | $ | 4,186 | $ | 8,156 | ||||||
| Commitment fees | $ | 1,513 | $ | 1,465 | $ | 887 | ||||||
At December 31, 2015 and December 31, 2014, the unamortized balance of deferred origination fees and debt issue costs were $4.9 million and $6.9 million, respectively. HMS amortized $2.1 million for both December 31, 2015 and 2014, respectively, of interest expense related to the Company’s deferred origination fees and debt issue costs.
Although HMS expects that operating cash flows will continue to be a primary source of liquidity for the Company’s operating needs, the revolving credit facility, which may be used for general corporate purposes, including acquisitions, is available for future cash flow needs, if necessary.
As part of a contractual agreement with a customer, the Company has an outstanding irrevocable letter of credit for $3.0 million, which was established against the existing revolving credit facility. The expiration date of the letter of credit is June 30, 2016.
8. Equity
(a) Treasury Stock
On July 30, 2015, the Company’s Board of Directors approved a share repurchase program authorizing the repurchase of up to $75 million of the Company’s common stock from time to time on the open market or in privately negotiated transactions. The repurchase program is authorized through July 30, 2017, and may be suspended or discontinued at any time. Repurchased shares will be available for use in connection with issuance under the Company’s stock plans and for other corporate purposes. Repurchases also be made under a Rule 10b5-1 plan, which would permit shares to be repurchased when HMS might otherwise be precluded from doing so under insider trading laws. The timing and amount of any shares repurchased under the program will be determined by management based on its evaluation of market conditions and other factors. During the year ended December 31, 2015, the Company repurchased $50 million of the Company’s common stock pursuant to this authorization and 10b5-1 plans.
| 62 |
The summary of the Company’s repurchases of the common stock through the date hereof is as follows:
| Period | Total Number of Shares Purchased | Average Price Paid Per Share | Total
Number of Shares Purchased as Part of Publicly Announced Program(1) | Maximum Approximate Dollar Value of Shares That May Yet Be Purchased Under the Program | ||||||||||||
| July 1, 2015 to July 31, 2015 | - | $ | - | - | $ | - | ||||||||||
| August 1, 2015 to August 31, 2015 | 2,562,065 | 9.40 | 2,562,065 | 50,000,000 | ||||||||||||
| September 1, 2015 to September 30, 2015 | - | - | - | - | ||||||||||||
| July 1, 2015 to September 30, 2015 | 2,652,065 | $ | 9.40 | 2,652,065 | $ | 50,000,000 | ||||||||||
| October 1, 2015 to October 31, 2015 | - | $ | - | - | $ | - | ||||||||||
| November 1, 2015 to November 30, 2015 | 1,631,119 | 11.64 | 1,631,119 | 19,000,000 | ||||||||||||
| December 1, 2015 to December 31, 2015 | 464,257 | 12.83 | 464,257 | 6,000,000 | ||||||||||||
| October 1, 2015 to December 31, 2015 | 2,095,376 | $ | 11.91 | 2,095,376 | 25,000,000 | |||||||||||
| Total | 4,747,441 | $ | 10.51 | 4,747,441 | $ | 25,000,000 | ||||||||||
| (1) | Represents shares repurchased through the Company’s Share Repurchase Program publicly announced in August 2015. |
(b) Preferred Stock
The Company’s certificate of incorporation, as amended, authorizes the issuance of up to 5,000,000 shares of “blank check” preferred stock with such designations, rights and preferences as may be determined by the Company’s Board of Directors. As of December 31, 2015, no preferred stock had been issued.
9. Employee Benefit Plan
The Company sponsors the HMS Holdings Corp. 401(k) Plan (the “401(k) Plan”) for eligible employees. Eligible employees must complete 90 days of service in order to enroll in the 401(k) Plan. Participants may make voluntary contributions to the 401(k) Plan of up to 60% of their annual base pre-tax compensation not to exceed the federally determined maximum allowable contribution. In addition, the 401(k) Plan permits the Company to make discretionary contributions. During 2015, 2014 and 2013 HMS matched 100% of the first 3% of pay contributed by each eligible employee and 50% on the next 2% of pay contributed. These matching contributions vest immediately and are not in the form of the Company’s common stock.
For the years ended December 31, 2015, 2014 and 2013, HMS contributed $4.8 million, $5.0 million and $4.6 million, respectively, to the 401(k) Plan in the form of matching contributions.
10. Stock-Based Compensation
The Company grants stock options to purchase HMS common stock, restricted stock awards and restricted stock units to HMS employees and directors under the Amended 2011 Stock Option and Stock Issuance Plan (the “HDI 2011 Stock Plan”), which the Company assumed in connection with the acquisition of HDI and the Fourth Amended and Restated 2006 Stock Plan (the “2006 Stock Plan”). The HDI 2011 Stock Plan superseded the HDI Amended 2004 Stock Option/Stock Issuance Plan. The 2006 Stock Plan was adopted in June 2006 and superseded the 1999 Long-Term Incentive Stock Plan (the “1999 Plan”). The Company has previously granted stock options outside of the plans, and as of December 31, 2015, none of those stock options remain outstanding.
Stock-based compensation expense is measured at the grant date based on the fair value of the award and is recognized as expense over the requisite service period, which is generally the vesting period. Stock options granted under the HDI 2011 Stock Plan had vesting schedules ranging from one month to four years. Stock options granted under the 2006 Stock Plan generally vest over a one to four year period. All stock options granted under the 1999 Plan and outside the Company’s plans are fully vested. The restricted stock awards and restricted stock units granted under the 2006 Stock Plan vest over a one to five year period and the related stock-based compensation expense is ratably recognized over those same time periods.
| 63 |
During 2015, the Company revised the presentation of stock-based compensation expense. All stock-based compensation was previously recorded in SG&A, and in the current year the company has corrected the presentation to include a portion of the stock-compensation expense in cost of services-compensation expense. The Company has reflected stock compensation expense of $5.1 million and $4.5 million for the years ended December 31, 2014 and 2013, respectively in cost of services-compensation expense. In previous years, this amount was reflected in SG&A but classification was corrected in 2015 to conform to current year presentation. For the year ended December 31, 2015, the Company had stock compensation expense of $6.2 million included in cost of services – compensation and $8.1 million in SG&A, respectively.
The excess tax benefit from the exercise of stock options for the years ended December 31, 2015, 2014 and 2013 was $1.6 million, $1.8 million and $5.2 million, respectively.
(a) Amended 2011 Stock Option and Stock Issuance Plan
The Company assumed the HDI 2011 Stock Plan in connection with the acquisition of HDI. As of December 31, 2015, there were stock options to purchase 77,128 shares of common stock outstanding under the HDI 2011 Stock Plan.
The HDI 2011 Stock Plan is divided into two separate equity programs: a stock option grant program and a stock issuance program. The HDI 2011 Stock Plan permits the grant of incentive stock options, non-qualified stock options and share awards. A total of 836,122 shares have been authorized for issuance under the 2011 Stock Plan. The maximum number of shares available to be issued under the Plan is currently 366,806 shares, subject to adjustments for any stock splits, stock dividends or other specified adjustments which may take place in the future. Former HDI employees as well as new (i) employees, (ii) non-employee directors and (iii) consultants and other independent advisors are eligible to participate in the HDI 2011 Stock Plan. However, only employees are eligible to receive incentive stock options. The exercise price of stock options granted under the HDI 2011 Stock Plan may not be less than fair market value of a share of stock on the grant date, as measured by the closing price of the Company’s common stock on the NASDAQ Global Select Market and the term of a stock option may not exceed ten years.
(b) Fourth Amended and Restated 2006 Stock Plan
The 2006 Stock Plan permits the grant of incentive stock options, non-qualified stock options, stock appreciation rights (“SARs”), restricted stock awards and restricted stock units, performance shares and performance units and other share awards.
The Company’s 2006 Stock Plan was approved by the shareholders in June 2006. The purpose of the 2006 Stock Plan is to furnish a material incentive to HMS employees and non-employee directors by making available to them the benefits of a larger common stock ownership through stock options and awards. The Company believes that these increased incentives stimulate the efforts of employees and non-employee directors towards the Company’s continued success, as well as assist in the recruitment of new employees and non-employee directors.
A total of 18,000,000 shares have been authorized for issuance under the 2006 Stock Plan. Any shares issued in connection with awards other than stock options and SARs are counted against the 18,000,000 share limit as one and eighty-five hundredths (1.85) of a share for every one share issued in connection with such award or by which the award is valued by reference.
All of the Company’s employees as well as HMS non-employee directors are eligible to participate in the 2006 Stock Plan. However, only HMS employees are eligible to receive incentive stock. The exercise price of stock options granted under the 2006 Stock Plan may not be less than fair market value of a share of stock on the grant date, as measured by the closing price of the Company’s common stock on the NASDAQ Global Select Market and the term of a stock option may not exceed seven years.
In November 2015, the Compensation Committee of the Board of Directors approved the grant of non-qualified stock options to purchase an aggregate of 612,391 shares of common stock to certain HMS directors, executive officers and employees, under the 2006 Stock Plan at an exercise price of $11.20 per share, which was the closing price of the Company’s common stock on the grant date. The Committee also approved the grant of non-qualified stock options to purchase an aggregate of 555,000 shares of common stock to certain of the Company’s directors and employees, including HMS executive officers, granted under the 2006 Stock Plan at an exercise price of $14 per share, equal to 125% of the fair market value on the grant date. The Committee also approved the grant of 57,391 restricted stock units to directors on the same date. The stock options granted to HMS employees and executive officers vest as follows: one-third increments on the first, second and third anniversaries of the Grant Date. The stock options and restricted units granted to HMS directors in November 2015 vest quarterly over a one year period commencing on December 31, 2015.
| 64 |
During the year ended December 31, 2015, HMS granted stock options to purchase an aggregate of 2,442,081 shares of common stock and 726,784 restricted stock units under the 2006 Stock Plan.
As of December 31, 2015, there were 3,413,500 shares of common stock available for future grant under the 2006 Stock Plan. The Company had the following outstanding under the 2006 Stock Plan as of December 31, 2015: (i) stock options to purchase 4,952,950 shares of common stock and (ii) 1,154,157 restricted stock units. There are no restricted stock awards outstanding under the 2006 Stock Plan as of December 31, 2015.
(c) 1999 Long-Term Incentive Plan
The 1999 Plan was approved by the Company’s shareholders in March 1999 and was superseded by the 2006 Stock Plan in June 2006. Accordingly, no additional awards or options may be granted thereunder. As of December 31, 2015, there were no stock options outstanding under the 1999 Plan. As of December 31, 2014, there were 74,290 stock options outstanding under the 1999 Plan.
(d) Options Issued Outside the Plans
As of December 31, 2015, there were stock options to purchase an aggregate of 180,000 shares of the Company’s common stock outstanding that were not granted under the 2006 Stock Plan, the 1999 Plan or the HDI 2011 Stock Plan, of which 180,000 stock options were granted in July 2007 to the Company’s former Chief Financial Officer under the terms of his employment agreement. All of these stock options were exercised during 2015.
(e) Summary of Stock Options
Presented below is a summary of the stock option activity for the year ended December 31, 2015:
| Shares | Weighted Average Exercise Price | Weighted Average Remaining Contractual Terms | Aggregate Intrinsic Value | |||||||||||||
| (shares and aggregate intrinsic value in thousands) | ||||||||||||||||
| Outstanding at December 31, 2014 | 4,101 | $ | 18.72 | |||||||||||||
| Granted | 2,442 | 14.69 | ||||||||||||||
| Exercised | (578 | ) | 7.25 | |||||||||||||
| Forfeitures | (560 | ) | 21.53 | |||||||||||||
| Expired | (375 | ) | 24.10 | |||||||||||||
| Outstanding at December 31, 2015 | 5,030 | 17.37 | 5.10 | 3,728 | ||||||||||||
| Expected to vest at December 31, 2015 | 3,104 | 16.42 | 6.22 | 714 | ||||||||||||
| Exercisable at December 31, 2015 | 1,857 | $ | 18.98 | 3.19 | $ | 2,999 | ||||||||||
For awards subject to service-based vesting conditions, HMS recognizes stock-based compensation expense, net of estimated forfeitures, equal to the grant date fair value of stock options on a straight-line basis over the requisite service period, which is generally the vesting term. For awards subject to both performance and service-based vesting conditions, HMS recognizes stock-based compensation expense using the straight-line recognition method when it is probable that the performance condition will be achieved. Forfeitures are estimated at the time of grant and revised, if necessary, in subsequent periods if actual forfeitures differ from those estimates.
The fair value of each option grant with service-based vesting conditions was estimated using the Black-Scholes pricing models. The performance share awards granted in 2015 and 2014 to executive management only are market condition awards as attainment is based on the performance of the Company’s common stock for the relevant performance period. These awards were valued on the date of grant using a Monte Carlo simulation model.
| 65 |
Expected volatilities are calculated based on the historical volatility of the Company’s common stock. Management monitors stock option exercises and employee termination patterns to estimate forfeiture rates within the valuation model. Separate groups of employees that have similar historical exercise behavior are considered separately for valuation purposes. The expected holding period of options represents the period of time that options granted are expected to be outstanding. The expected terms of options granted are based on the Company’s historical experience for similar types of stock option awards. The risk-free interest rate is based on U.S. Treasury notes. HMS does not anticipate paying any cash dividends in the foreseeable future and therefore, use an expected dividend yield of zero in the option valuation models.
The weighted-average grant-date fair value per share of the stock options granted during the years ended December 31, 2015, 2014 and 2013 was $5.37, $7.59 and $7.07, respectively. HMS estimated the fair value of each stock option grant on the date of grant using a Black-Scholes option pricing model and weighted–average assumptions set forth in the following table:
| Years ended December 31, | ||||||||||||
| 2015 | 2014 | 2013 | ||||||||||
| Expected dividend yield | 0 | % | 0 | % | 0 | % | ||||||
| Risk-free interest rate | 1.54 | % | 1.57 | % | 1.21 | % | ||||||
| Expected volatility | 40.62 | % | 38.18 | % | 37.22 | % | ||||||
| Expected life (years) | 4.89 | 4.82 | 4.51 | |||||||||
During the years ended December 31, 2015, 2014 and 2013, the Company issued 577,559 shares, 516,552 shares and 1,305,538 shares, respectively, of the Company’s common stock upon the exercise of outstanding stock options and received proceeds of $4.2 million, $4.1 million and $9.2 million, respectively. The total intrinsic value of options exercised during the years ended December 31, 2015, 2014 and 2013 was $5.9 million, $6.5 million and $23.9 million, respectively.
Stock-based compensation expense relating to stock options charged against income was approximately $6.4 million, $7.6 million and $6.7 million, for the years ended December 31, 2015, 2014 and 2013, respectively.
As of December 31, 2015, there was approximately $14.5 million of total unrecognized compensation cost, adjusted for estimated forfeitures, related to stock options outstanding, which is expected to be recognized over a weighted-average period of 1.42 years.
(f) Restricted Stock Units
In 2015, 2014 and 2013, certain employees received restricted stock units under the 2006 Stock Plan. The fair value of restricted stock units is estimated based on the closing sale price of the Company’s common stock on the NASDAQ Global Select Market on the date of issuance. The total number of restricted stock units expected to vest is adjusted by estimated forfeiture rates. As of December 31, 2015, 2014 and 2013, 1,029,972, 813,346 and 571,204 restricted stock units remain unvested and there was approximately $13.4 million, $13.8 million and $11.6 million, respectively, of unamortized compensation cost related to restricted stock units which is expected to be recognized over the remaining weighted-average vesting period of 1.16 years.
Stock-based compensation expense related to restricted stock units was $7.9 million, $5.7 million and $4.5 million for the years ended December 31, 2015, 2014 and 2013, respectively.
| 66 |
A summary of the status of the Company’s restricted stock units and of changes in restricted stock units outstanding under the 2006 Stock Plan, as amended, as of December 31, 2015 is as follows:
| Number of Units | Weighted Average Grant Date Fair Value per Share | Aggregate Intrinsic Value | ||||||||||
| (in thousands, except for weighted average grant date fair value per unit) | ||||||||||||
| Outstanding balance at December 31, 2014 | 910 | $ | 22.84 | |||||||||
| Granted | 727 | 16.23 | ||||||||||
| Vesting of restricted stock units, net of shares withheld for taxes | (174 | ) | 23.22 | |||||||||
| Shares withheld for taxes | (71 | ) | 23.22 | |||||||||
| Forfeitures | (238 | ) | 21.60 | |||||||||
| Outstanding balance at December 31, 2015 | 1,154 | $ | 18.85 | $ | 14,274 | |||||||
(g) Restricted Stock Awards
Certain executive officers have received grants of restricted stock awards under the 2006 Stock Plan. The vesting of restricted stock awards is subject to the executive officers’ continued employment with the Company. Recipients of restricted stock awards are not required to provide the Company with any consideration other than rendering service and in addition, restricted stock holders are permitted to vote and receive dividends.
The stock-based compensation expense for restricted stock awards is determined based on the closing market price of the Company’s common stock on the grant date of the awards applied to the total number of awards that are anticipated to fully vest. Shares withheld to pay taxes are retired upon the vesting of the restricted stock awards. HMS did not issue restricted stock awards during the year ended December 31, 2015. At December 31, 2015, there are no unvested shares underlying restricted stock awards and there is no unrecognized compensation cost related to restricted stock awards. For the years ended December 31, 2014 and 2013, stock-based compensation expense related to restricted stock awards was $0.1 million, and $0.7 million, respectively.
11. Earnings per Share
The following table sets forth the computation of basic and diluted earnings per share for the years ended December 31, 2015, 2014 and 2013.
| Years ended December 31, | ||||||||||||
| 2015 | 2014 | 2013 | ||||||||||
| (in thousands, except per share data) | ||||||||||||
| Net income | $ | 24,527 | $ | 13,947 | $ | 39,997 | ||||||
| Weighted average common shares outstanding-basic | 87,881 | 87,673 | 87,598 | |||||||||
| Plus: net effect of dilutive stock options and restricted common shares | 480 | 491 | 746 | |||||||||
| Weighted average common shares outstanding-diluted | 88,361 | 88,164 | 88,344 | |||||||||
| Net income per common share-basic | $ | 0.28 | $ | 0.16 | $ | 0.46 | ||||||
| Net income per common share-diluted | $ | 0.28 | $ | 0.16 | $ | 0.45 | ||||||
For the years ended December 31, 2015, 2014 and 2013, 3,480,458, 2,422,628 and 1,111,795 stock options, respectively, were not included in the diluted earnings per share calculation because the effect would have been anti-dilutive. For the years ended December 31, 2015, 2014 and 2013, restricted stock units representing 315,999, 90,905 and 88,327 shares of common stock, respectively, were not included in the diluted earnings per share calculation because the effect would have been anti-dilutive.
| 67 |
12. Transactions with Officers, Related Parties and Others
(a) Public Consulting Group, Inc.
Subsequent to the Company’s acquisition of Benefits Solutions Practice Area (“BSPA”) from Public Consulting Group, Inc. (“PCG”) in 2006, HMS has entered into subcontractor agreements with PCG, pursuant to which the Company provides cost containment services. In February 2013, HMS further amended and extended the Company’s Master Teaming and Non-Compete Agreements with PCG, first entered into in September 2006, and (ii) Supplementary Medicaid RAC Contract Teaming and Confidentiality with PCG, first entered into in July 2011. Both of these agreements expired on December 31, 2013.
For the year ended December 31, 2013, revenue recognized under subcontractor agreements with PCG was $0.4 million. No revenue was recognized during 2015 and 2014. As of December 31, 2015 and 2014, no accounts receivable were outstanding related to these subcontract agreements with PCG.
In connection with the BSPA acquisition, HMS entered into an Intercompany Services Agreement (“ISA”) with PCG to allow each party to perform services for the other, such as information technology support and contractual transition services. Services performed under the ISA were billed at pre-determined rates specified in the ISA. No significant services were rendered by PCG under the ISA during 2015 and 2014. For the year ended December 31, 2013, services rendered by PCG under the ISA were valued at approximately $42,000. For the year ended December 31, 2015, HMS did not render services to PCG. For the years ended December 31, 2014 and 2013, HMS services rendered to PCG were valued at approximately $21,000 and $70,000, respectively.
Since the BSPA acquisition, amounts collected by or paid on the Company’s behalf by PCG are reimbursed to PCG at cost. For the years ended December 31, 2015 and 2014, HMS did not owe any amount to PCG.
(b) Employment Agreements
Effective March 1, 2013, and as amended on April 30, 2013 and January 20, 2015, HMS entered into an Executive Employment Agreement with William C. Lucia, the Company’s President and Chief Executive Officer, with a termination date of February 28, 2018 (the “Agreement”). Mr. Lucia is eligible to receive bonus compensation from the Company in respect of each calendar year (or portion thereof) during the term of his employment, in each case as may be determined by the Company’s Compensation Committee in its sole discretion on the basis of performance or such other criteria as may be established from time to time by the Compensation Committee in its sole discretion. Mr. Lucia’s annualized base salary remains at $650,000 and his target bonus remains at 100% of his base salary.
If the Company terminates Mr. Lucia’s employment without Cause (as defined in the Agreement), in connection with a Change in Control (as defined in the Agreement) or otherwise, or if his employment ceases because of his disability or if he terminates his employment with Good Reason (as defined in the Agreement), then provided Mr. Lucia executes and does not revoke a separation agreement and release and complies with certain restrictive covenants, he will be entitled to receive cash severance in an amount equal to (i) 24 times his monthly base salary paid ratably in equal installments over a 24 month period, (ii) twice a bonus component that will vary depending upon whether the bonus for the year of termination is intended to be performance-based compensation and the performance is satisfied or whether the bonus is under a different program, in which case it will be his target bonus and will be paid on the same schedule as (i) above, and (iii) continued health coverage for 24 months or until he becomes eligible for health coverage from another employer, whichever is earlier.
If the Company terminates Mr. Lucia’s employment without Cause or Mr. Lucia resigns for Good Reason, Mr. Lucia will be treated as continuing in service for the purposes of the vesting of any equity award until the earliest of: (i) the end of the Noncompetition Period (as defined in Mr. Lucia’s Noncompetition, Nonsolicitation, Proprietary and Confidential Information and Developments Agreement with the Company (the “Restrictive Covenants Agreement”)), (ii) the last of the applicable vesting dates under such awards, or (iii) the termination or violation of the Restrictive Covenants Agreement. Additionally, if the Company terminates Mr. Lucia’s employment without Cause or Mr. Lucia resigns for Good Reason, and a Change in Control occurs within six months following such termination, then with respect to any equity awards outstanding or deemed to be outstanding, or canceled or forfeited as a result of Mr. Lucia’s termination or such Change in Control, Mr. Lucia will receive a cash payment equal to the excess of the amount he would have received for such equity awards if he were continuing in service as of the date of the Change in Control and terminated immediately thereafter over the amount actually received, paid in a single lump sum payment at the time provided in the Agreement.
| 68 |
In addition, under the terms of HMS employment agreements with the Company’s other executive officers, under certain circumstances, HMS could be required to provide severance in an amount equal to 12 times his/her monthly base salary plus a lump sum amount equal to 12 times the difference between the monthly COBRA coverage premium for the same type of medical and dental coverage the executive is receiving as of the date his/her employment ends and his/her then monthly employee contribution, which amount may be used for any purpose.
13. Commitments and Contingencies
(a) Lease commitments
The Company leases office space, data processing equipment and software licenses under operating leases that expire on various dates through 2024. The lease agreements provide for rent escalations. Lease expense, exclusive of sublease income, for the year ended December 31, 2015, 2014 and 2013 was $5.4 million, $6.9 million and $7.6 million, respectively. Sublease income was $25,000, $42,000 and $0.3 million for the years ended December 31, 2015, 2014 and 2013, respectively.
Minimum annual lease payments to be made both under capital leases and operating leases, net of nominal sublease payments to be received for each of the next five years ending December 31 and thereafter are as follows (in thousands):
| Capital Lease Payments | Operating Lease Payments | ||||||||
| 2016 | $ | 47 | $ | 12,957 | |||||
| 2017 | 4 | 10,133 | |||||||
| 2018 | - | 5,917 | |||||||
| 2019 | - | 3,544 | |||||||
| 2020 | - | 3,263 | |||||||
| Thereafter | - | 7,599 | |||||||
| 51 | $ | 43,413 | |||||||
| Less: Interest | - | ||||||||
| $ | 51 | ||||||||
(b) Litigation
Kern Health Systems: In August 2011, in the Superior Court of the State of California, County of Los Angeles, Kern Health Systems (“KHS”) sought to recover in excess of $7.0 million exclusive of interest, attorneys’ fees and costs, against HMS’s wholly owned subsidiary Allied Management Group Special Investigation Unit, Inc. (“AMG”) and two of AMG’s former owners Dennis Demetre and Lori Lewis (collectively, the “Defendants”), jointly and severally, on causes of action for breach of contract, professional negligence, intentional misrepresentation, negligent misrepresentation and unfair business practices under the California Business and Professions Code. In June 2014, the jury issued its verdict in favor of all the Defendants, and against KHS, on all causes of action except negligent misrepresentation. On that cause of action, the jury issued a verdict against all the Defendants, jointly and severally, in the sum of $1.38 million. The negligent misrepresentation verdict was based on representations to KHS allegedly made by AMG and Demetre in the spring of 2008, prior to the Company’s acquisition of AMG. HMS believes that the jury erroneously awarded damages based on an error inasmuch as the jury unanimously found that the Defendants (through Demetre) made the negligent misrepresentation to KHS while having reasonable grounds for believing the representation to be true. Based on the jury’s verdict, HMS believes AMG is properly characterized as the prevailing party on the breach of contract claim. AMG has filed an appeal of the verdict and is seeking to recover its attorneys’ fees and costs in the sum of approximately $2.3 million. HMS has not recorded an obligation at this time, as the Company continues to believe that it is probable that AMG will prevail on the appeal of this matter, although there are risks and uncertainties related to any litigation, including appeals, and neither the Company nor its counsel can assure litigation results. Pending the appeal process, HMS was required to obtain a surety bond in the amount of 150% of the final judgment amount, or approximately $2.2 million, which was collateralized by a cash deposit and is reflected in other current assets on the Company’s Consolidated Balance Sheet as of December 31, 2015.
Dennis Demetre and Lori Lewis: In July 2012, Dennis Demetre and Lori Lewis (the “Plaintiffs”), filed an action in the Supreme Court of the State of New York against HMS Holdings Corp., claiming an undetermined amount of damages alleging that various actions unlawfully deprived the Plaintiffs of the acquisition earn-out portion of the purchase price of AMG under the applicable Stock Purchase Agreement (the “SPA”) and that HMS had breached certain contractual provisions under the SPA. The Plaintiffs filed a second amended complaint with two causes of action for breach of contract and one cause of action for breach of implied covenant of good faith and fair dealing. Although the Plaintiffs also alleged an action based on fraud, the court dismissed that claim and further denied their subsequent appeal to resurrect the dismissed claim. HMS filed a counterclaim for breach of contract arising out of the Plaintiffs’ failure to indemnify the Company for costs, including attorneys’ fees arising out of the Company’s defense of the Kern Health Systems matter described above and for fraud and negligent misrepresentation arising out of the Plaintiffs’ misrepresentations concerning capabilities of their software platform. In July 2015, the court granted in part and denied in part the Plaintiffs’ motion to dismiss HMS’s counterclaims, allowing its counterclaim for breach of contract to proceed but dismissing the counterclaims for fraud and negligent misrepresentation. On January 4, 2016, HMS moved for summary judgment on (i) its remaining counterclaim for breach of contract against the Plaintiffs and (ii) the Plaintiffs’ breach of contract causes of action against HMS. A pretrial conference has been set for April 2016 but no trial date has been set. HMS believes it has a meritorious defense and will continue to defend this matter vigorously, although there are risks and uncertainties related to any litigation. As such, HMS has not accrued for any loss contingencies related to this matter because no assessment can been made as to the likely outcome of this lawsuit or whether the outcome will be material to the Company.
| 69 |
Restrictive Covenants, Trade Secret, Contract and other Causes of Action in Texas and New York: HMS is the plaintiff in lawsuits filed in August 2014, entitled HMS Holdings Corp., et al. v. Public Consulting Group, Inc., James Gambino and Jason Ramos, in the District Court of Dallas County, Texas (the “Texas Action”), and HMS Holdings Corp., et al. v. Matthew Arendt, Sean Curtin and Danielle Lange, in the New York State Supreme Court, Albany County (the “New York Action”). In July 2015, HMS filed a third related lawsuit, entitled HMS Holdings Corp., et al. v. Elena Moiseenko and Joseph Flora, in the New York State Supreme Court, Albany County (the “Second New York Action”). These suits allege that, in violation of their respective contractual, statutory and common law obligations to the Company, defendants PCG, Joseph Flora and former HMS employees Gambino, Ramos, Arendt, Curtin, Lange and Moiseenko unlawfully misappropriated HMS’s confidential, proprietary and trade secret information and committed other wrong doing. The lawsuits seek damages and injunctive relief and assert causes of action including breach of contract, breach of fiduciary duty and misappropriation of trade secrets. HMS has sought injunctions in all three Actions.
In July 2015, the court in the Texas Action found that HMS had proved the existence of unlawful conduct and had demonstrated a probable right to recovery at trial regarding its claims against PCG, Gambino and Ramos and that an injunction was necessary to avoid imminent and irreparable harm to the Company. As such, the Texas court issued an order that granted a temporary injunction against those defendants that was ordered to remain in place through the time of trial in the Texas Action (the “Texas Injunction”). As a condition to obtaining the Texas Injunction, HMS was required to post a surety bond in the amount of $0.5 million. In August 2015, HMS filed an appeal of the Texas Injunction to, among other things, expand upon the relief the trial court had awarded in order to enjoin PCG from providing TPL services to State Medicaid agencies through the time of trial, which PCG, Gambino and Ramos cross-appealed. Oral argument in this matter is set for March 2016. Additionally, in August 2015, PCG filed a counterclaim against the Company in the Texas Action claiming damages for alleged business disparagement and for tortious interference with an existing contract and prospective business relations, which HMS denied. In October 2015, PCG moved for partial summary judgment on HMS’s claims requesting that the court enter a judgment in favor of PCG on the issue of damages suffered in connection with certain PCG TPL proposals. On December 4, 2015, the Texas court denied PCG’s motion for partial summary judgment. On December 14, 2015, PCG filed an application for temporary injunction that would prohibit HMS from referring to certain conclusions made by the court in the Texas Injunction, which relate to the conduct of PCG or PCG’s employees, as “factual findings” in the Company’s future discussions with state authorities charged with awarding TPL contracts. If granted, PCG’s temporary injunction would last through the time of trial in the Texas Action, which is set for April 25, 2016.
In May 2015, the court in the New York action issued an order granting HMS’s motion for spoliation against Curtin and Lange finding that these defendants had engaged in egregious misconduct regarding the wrongful destruction of evidence. The court ordered Curtin and Lange to repay the Company’s associated attorneys’ fees and costs. Pursuant to the court’s order, HMS is seeking reimbursement of approximately $0.45 million from these defendants. In July 2015, following the Texas court’s ruling on the Texas Injunction, the court in the New York Action issued its decision and order on HMS’s motion for a preliminary injunction against Curtin, Lange and Arendt. The New York court found that HMS had successfully established a likelihood of prevailing on its non-solicitation claims against all three defendants and on its trade secret misappropriation claims against Curtin and Lange; however, the court held that injunctive relief in the New York Action was not necessary due to the Texas Injunction. The court’s order also preserved the Company’s right to again seek injunctive relief in the New York Action in the event of a change of status regarding the Texas Injunction. Trial in the New York Action is tentatively set for June 6, 2016.
In August 2015, the court in the Second New York Action entered a temporary restraining order against defendants Moiseenko and Flora pending the court’s final determination of HMS’s application for a preliminary injunction in this matter. Flora generally denied HMS’s motion, and Moiseenko opposed it on its merits and filed a cross-motion to dismiss the complaint on the grounds of improper forum. On November 13, 2015, the court in the Second New York Action issued an order granting a preliminary injunction against Flora after concluding that HMS had demonstrated a probable right to recovery at trial on its claim that Flora had misappropriated and misused the Company’s trade secrets. The court’s order also granted Moiseenko’s motion to dismiss without prejudice to refiling in a proper forum.
| 70 |
As HMS has disclosed in previous filings with the SEC, in July 2015, HMS received notice that reprocurement of its TPL contract with the New Jersey Department of Human Services had been awarded to PCG. On February 12, 2016, HMS filed a protest with the State of New Jersey Division of Purchase and Property challenging the award. After multiple contract extensions, HMS’s current TPL contract with the New Jersey Department of Human Services expires on March 31, 2016. In addition, in August 2015, the New York State Office of Medicaid General Inspector (“OMIG”) awarded HMS the new Medicaid Third Party Liability Match and Recovery Services contract. PCG filed a protest of the award with the New York Office of the State Comptroller, which HMS and OMIG opposed. On January 8, 2016, HMS entered into an amendment to extend its existing TPL contract with OMIG through April 6, 2016. No decision has been rendered regarding the outcome of either protest.
While HMS believes its legal claims are meritorious, there are inherent uncertainties in any litigation, and there can be no assurances that HMS will ultimately prevail at trial or in legal proceedings related to the lawsuits, such as protests, or that the rulings in these proceedings are or will be adequate to protect the Company’s confidential or trade secret information or that the rulings or outcomes in these matters would not have an adverse effect on the Company’s business, financial condition or operating results.
From time to time, HMS may be subject to investigations, legal proceedings and other disputes arising in the ordinary course of the Company’s business, including but not limited to regulatory audits, billing and contractual disputes and employment-related matters. The Company’s contractual relationships, including those with federal and state government entities, subject HMS operations, billing and business practices to scrutiny and audit by those entities and other multiple agencies and levels of government, as well as to frequent transitions and changes in the personnel responsible for oversight of the Company’s contractual performance. Every so often, HMS may have contractual disputes with the Company’s customers arising from differing interpretations of contractual provisions that define the Company’s rights, obligations, scope of work or terms of payment, and with associated claims of liability for inaccurate or improper billing for reimbursement of contract fees, or for sanctions or damages for alleged performance deficiencies. Resolution of such disputes may involve litigation or may require that HMS accept some amount of loss or liability in order to avoid customer abrasion, negative marketplace perceptions and other disadvantageous results that could affect the Company’s business, financial condition, results of operations and cash flows.
HMS records accruals for outstanding legal matters when it believes it is probable that a loss will be incurred and the amount can be reasonably estimated. The Company evaluates, on a quarterly basis, developments in legal matters that could affect the amount of any accrual and developments that would make a loss contingency both probable and reasonably estimable. If a loss contingency is not both probable and estimable, HMS does not establish an accrued liability. As of December 31, 2015, HMS accrued $2.6 million for litigation or other legal proceedings asserted or pending against the Company that could have, in the aggregate, a material adverse effect on its financial condition, results of operations or cash flows, and believe that adequate provision for any probable and estimable losses has been made in its consolidated financial statements. Although HMS believes that none of the Company’s accruals for outstanding legal matters are material to the Company’s financial position, the ultimate result of any current or future litigation or other legal proceedings, audits or disputes is inherently unpredictable and could result in liabilities that are higher than currently predicted.
14. Customer Concentration
(a) Geographic Information
The Company operates within the United States.
(b) Major Customers
For the years ended December 31, 2015 and 2014, respectively, none of the Company’s customers accounted for more than 10% of the Company’s total revenue. For the year ended December 31, 2013, one customer accounted for 22.3% of the Company’s total revenue.
| 71 |
(c) Concentration of Revenue
The list of the Company’s ten largest customers changes periodically. For the years ended December 31, 2015, 2014 and 2013, the Company’s ten largest customers represented 44.0%, 40.1% and 47.2% of HMS’ total revenue, respectively. The Company’s three largest customers accounted for 18.3%, 19.8% and 32.5% of total revenue for each of the years ended December 31, 2015, 2014 and 2013, respectively. The Company’s agreements with the ten current largest customers expire between 2016 and 2020. In many instances, HMS provides services pursuant to agreements that may be renewed subject to a competitive reprocurement process. Several of the Company’s contracts, including those with some of the largest customers, may be terminated for convenience.
15. Subsequent Events
Stock-Based Compensation
On February 18, 2016, the Compensation Committee of the Board of Directors approved March 2, 2016 grants of stock option awards and restricted stock units to employees. The stock options and restricted stock units vest over 3 years. The Company estimates the fair value of these grants to be $12.9 million, utilizing the method and assumptions set forth in Note 10 – “Stock-Based Compensation.”
In connection with the preparation of these audited consolidated financial statements, an evaluation of subsequent events was performed through the date these audited consolidated financial statements were issued and there are no other events that have occurred that would require adjustments or disclosure to the Company’s audited consolidated financial statements.
16. Quarterly Financial Data (unaudited)
The table below summarizes the Company’s unaudited quarterly operating results for the last two fiscal years (in thousands, except per share amounts).
| Year ended December 31, 2015 | First Quarter | Second Quarter | Third Quarter | Fourth Quarter | ||||||||||||
| Revenue | $ | 110,324 | $ | 116,934 | $ | 118,444 | $ | 128,514 | ||||||||
| Operating income | $ | 7,981 | $ | 11,752 | $ | 13,016 | $ | 14,823 | ||||||||
| Net income | $ | 3,522 | $ | 5,418 | $ | 6,862 | $ | 8,725 | ||||||||
| Net income per common share - basic | $ | 0.04 | $ | 0.06 | $ | 0.08 | $ | 0.10 | ||||||||
| Net income per common share - diluted | $ | 0.04 | $ | 0.06 | $ | 0.08 | $ | 0.10 | ||||||||
| Cost of services - compensation expense, as reported | $ | 42,726 | $ | 42,303 | $ | 42,330 | $ | 46,694 | ||||||||
| Cost of services - compensation expense, as revised | $ | 44,067 | $ | 43,883 | $ | 43,628 | ||||||||||
| Selling, general and administrative expenses, as reported | $ | 21,302 | $ | 20,863 | $ | 21,399 | $ | 22,582 | ||||||||
| Selling, general and administrative expenses, as revised | $ | 19,961 | $ | 19,283 | $ | 21,295 | ||||||||||
| 72 |
| Year ended December 31, 2014 | First Quarter | Second Quarter | Third Quarter | Fourth Quarter | ||||||||||||
| Revenue | $ | 104,707 | $ | 112,561 | $ | 113,796 | $ | 112,161 | ||||||||
| Operating income (loss) | $ | 7,797 | $ | 12,558 | $ | 13,940 | $ | (91 | ) | |||||||
| Net income (loss) | $ | 3,353 | $ | 6,038 | $ | 6,950 | $ | (2,394 | ) | |||||||
| Net income (loss) per common share - basic | $ | 0.04 | $ | 0.07 | $ | 0.08 | $ | (0.03 | ) | |||||||
| Net income (loss) per common share - diluted | $ | 0.04 | $ | 0.07 | $ | 0.08 | $ | (0.03 | ) | |||||||
| Cost of services - compensation expense, as reported | $ | 46,921 | $ | 43,130 | $ | 42,375 | $ | 43,772 | ||||||||
| Cost of services - compensation expense, as revised | $ | 48,038 | $ | 44,380 | $ | 43,464 | $ | 45,391 | ||||||||
| Selling, general and administrative expenses, as reported | $ | 16,489 | $ | 19,023 | $ | 19,334 | $ | 24,117 | ||||||||
| Selling, general and administrative expenses, as revised | $ | 15,372 | $ | 18,256 | $ | 18,297 | $ | 29,146 | ||||||||
| 73 |
SCHEDULE II – VALUATION AND QUALIFYING ACCOUNTS
For the years ended December 31, 2015, 2014 and 2013
Allowance for doubtful accounts and estimated liability for appeals as of December 31, 2015, 2014 and 2013 are as follows:
| Allowance for doubtful accounts (in thousands): | ||||
| Balance, December 31, 2012 | $ | 3,476 | ||
| Provision | 2,225 | |||
| Recoveries | (2,220 | ) | ||
| Charge-offs | (1,521 | ) | ||
| Balance, December 31, 2013 | $ | 1,960 | ||
| Provision | 8,195 | |||
| Recoveries | (17 | ) | ||
| Charge-offs | (5,603 | ) | ||
| Balance, December 31, 2014 | $ | 4,535 | ||
| Provision | 3,509 | |||
| Recoveries | (100 | ) | ||
| Charge-offs | (3,095 | ) | ||
| Balance, December 31, 2015 | $ | 4,849 | ||
| Estimated liability for appeals and estimated allowance for appeals (in thousands): | ||||
| Balance, December 31, 2012 | $ | 34,426 | ||
| Provision | 41,076 | |||
| Appeals found in providers favor | (19,711 | )* | ||
| Balance, December 31, 2013 | $ | 55,791 | ** | |
| Provision | 16,822 | |||
| Appeals found in providers favor | (30,990 | )* | ||
| Balance, December 31, 2014 | $ | 41,623 | ** | |
| Provision | 15,642 | |||
| Appeals found in providers favor | (17,573 | )* | ||
| Balance, December 31, 2015 | $ | 39,692 | ** | |
____________________________
* For the years ended December 31, 2015, 2014, and 2013 included within the estimated allowance for appeals found in favor of providers, $6.2 million, $24.3 million and $6.3 million, respectively, was activity associated with HDI’s Medicare RAC contract.
**Includes $6,614, $4,824 and $13,939 related to estimated allowance for appeals that apply to uncollected accounts receivable as of December 31, 2015, 2014, and 2013, respectively.
| 74 |
HMS Holdings Corp. and Subsidiaries
Exhibit Index
Where an exhibit is filed by incorporation by reference to a previously filed registration statement or report, such registration statement or report is identified after the description of the exhibit.
Exhibit |
Description | |
| 2.1 | Agreement and Plan of Merger, dated as of December 16, 2002, among Health Management Systems, Inc., HMS Holdings Corp. and HMS Acquisition Corp. Incorporated by reference to Exhibit A to HMS Holdings Corp.’s Prospectus and Proxy Statement, filed with the SEC on January 24, 2003. | |
| 2.2 | Agreement and Plan of Merger, dated as of July 17, 2013, between the HMS Holdings Corp., a Delaware corporation and HMS Holdings Corp., a New York corporation. Incorporated by reference to Exhibit 2.1 to HMS Holding Corp.'s Current Report on Form 8-K12G, File No. 000-50194, filed with the SEC on July 23, 2013. | |
| 3.1 | Conformed copy of Certificate of Incorporation of HMS Holdings Corp., as amended through July 9, 2015. Incorporated by reference to Exhibit 3.1 to HMS Holding Corp.'s Quarterly Report on Form 10-Q for the quarter ended June 30, 2015, File No. 000-50194, filed with the SEC on August 10, 2015. | |
| 3.2 | By-laws of HMS Holdings Corp. Incorporated by reference to Exhibit 3.2 to HMS Holding Corp.'s Current Report on Form 8-K12G, File No. 000-50194, filed with the SEC on July 23, 2013. | |
| 4.1 | Specimen Common Stock Certificate. Incorporated by reference to Exhibit 4.1 to HMS Holding Corp.'s Current Report on Form 8-K12G, File No. 000-50194, filed with the SEC on July 23, 2013. | |
| 4.2 | See Exhibits 3.1 and 3.2 for provisions defining the rights of holders of common stock of HMS Holdings Corp. | |
| 10.1† | HMS Holdings Corp. 1999 Long-Term Incentive Stock Plan, as amended. Incorporated by reference to Exhibit 4 to HMS Holdings Corp.’s Registration Statement on Form S-8, File No. 333-108436, filed with the SEC on September 2, 2003. | |
| 10.2† | HMS Holdings Corp. Fourth Amended and Restated 2006 Stock Plan (the “2006 Stock Plan”). Incorporated by reference to Exhibit 3.1 to HMS Holdings Corp.’s Current Report on Form 8-K, File No. 000-50194, filed with the SEC on July 12, 2011. | |
| 10.3† | Amendment No. 1 to the 2006 Stock Plan. Incorporated by reference to Exhibit 10.6 to HMS Holdings Corp.’s Annual Report on Form 10-K, File No. 000-50194, filed with the SEC on February 29, 2012. | |
| 10.4† | Form of 2009 Non-Qualified Stock Option Agreement under the 2006 Stock Plan. Incorporated by reference Exhibit 10.1 to HMS Holding Corp.’s Quarterly Report on Form 10-Q for the quarter ended September 30, 2009, File No. 000-50194, filed with the SEC on November 6, 2009. | |
| 10.5† | Form of 2010 Director Non-Qualified Stock Option Agreement under the 2006 Stock Plan. Incorporated by reference to Exhibit 10.2 to HMS Holdings Corp.’s Quarterly Report on Form 10-Q, File No. 000-50194, filed with the SEC on November 8, 2010. | |
| 10.6† | Form 2010 Employee Non-Qualified Stock Option Agreement under the 2006 Stock Plan. Incorporated by reference to Exhibit 10.4 to HMS Holdings Corp.’s Quarterly Report on Form 10-Q, File No. 000-50194, filed with the SEC on November 8, 2010. | |
| 10.7† | Form of 2011 Director Non-Qualified Stock Option Agreement under the 2006 Stock Plan. Incorporated by reference to Exhibit 10.16 to HMS Holdings Corp.’s Annual Report on Form 10-K, File No. 000-50194, filed with the SEC on February 29, 2012. | |
| 10.8† | Form of 2011 Employee Non-Qualified Stock Option Agreement under the 2006 Stock Plan. Incorporated by reference to Exhibit 10.18 to HMS Holdings Corp.’s Annual Report on Form 10-K, File No. 000-50194, filed with the SEC on February 29, 2012. | |
| 10.9† | Form of 2012 Director Non-Qualified Stock Option Agreement under the 2006 Stock Plan. Incorporated by reference to Exhibit 10.20 to HMS Holdings Corp.’s Annual Report on Form 10-K, File No. 000-50194, filed with the SEC on March 1, 2013. | |
| 10.10† | Form of 2012 Executive Non-Qualified Stock Option Agreement under the 2006 Stock Plan. Incorporated by reference to Exhibit 10.22 to HMS Holdings Corp.’s Annual Report on Form 10-K, File No. 000-50194, filed with the SEC on March 1, 2013. |
| 75 |
Exhibit |
Description | |
| 10.11† | Form of 2013 Executive Restricted Stock Unit Agreement under the 2006 Stock Plan. Incorporated by reference to Exhibit 10.24 to HMS Holdings Corp.’s Annual Report on Form 10-K, File No. 000-50194, filed with the SEC on March 1, 2013. | |
| 10.12† | Form of 2013 Director Non-Qualified Stock Option Agreement under the 2006 Stock Plan. Incorporated by reference to Exhibit 10.1 to HMS Holding Corp.’s Quarterly Report on Form 10-Q for the quarter ended March 31, 2014, File No. 000-50194, filed with the SEC on May 12, 2014. | |
| 10.13† | Form of 2013 Executive Non-Qualified Stock Option Agreement under the 2006 Stock Plan. Incorporated by reference to Exhibit 10.3 to HMS Holding Corp.’s Quarterly Report on Form 10-Q for the quarter ended March 31, 2014, File No. 000-50194, filed with the SEC on May 12, 2014. | |
| 10.14† | Form of March 2014 Executive Restricted Stock Unit Agreement under the 2006 Stock Plan. Incorporated by reference to Exhibit 10.4 to HMS Holding Corp.’s Quarterly Report on Form 10-Q for the quarter ended March 31, 2014, File No. 000-50194, filed with the SEC on May 12, 2014. | |
| 10.15† | Form of November 2014 Executive Restricted Stock Unit Agreement under the 2006 Stock Plan. Incorporated by reference to Exhibit 10.1 to HMS Holding Corp.’s Quarterly Report on Form 10-Q for the quarter ended September 30, 2014, File No. 000-50194, filed with the SEC on November 10, 2014. | |
| 10.16† | Form of 2014 Director Non-Qualified Stock Option Agreement under the 2006 Stock Plan. Incorporated by reference to Exhibit 10.26 to HMS Holding Corp.’s Annual Report on Form 10-K for the year ended December 31, 2014, File No. 000-50194, filed with the SEC on March 2, 2015. | |
| 10.17† | Form of 2014 Director Restricted Stock Unit Agreement under the 2006 Stock Plan. Incorporated by reference to Exhibit 10.27 to HMS Holding Corp.’s Annual Report on Form 10-K for the year ended December 31, 2014, File No. 000-50194, filed with the SEC on March 2, 2015. | |
| 10.18† | Form of 2014 Executive Non-Qualified Stock Option Agreement under the 2006 Stock Plan. Incorporated by reference to Exhibit 10.28 to HMS Holding Corp.’s Annual Report on Form 10-K for the year ended December 31, 2014, File No. 000-50194, filed with the SEC on March 2, 2015. | |
| 10.19† | Form of March 2015 Executive Non-Qualified Stock Option Agreement under the 2006 Stock Plan. Incorporated by reference Exhibit 10.1 to HMS Holding Corp.'s Quarterly Report on Form 10-Q for the quarter ended March 31, 2015, File No. 000-50194, filed with the SEC on May 11, 2015. | |
| 10.20† | Form of March 2015 Executive Restricted Stock Unit Agreement under the 2006 Stock Plan. Incorporated by reference Exhibit 10.2 to HMS Holding Corp.'s Quarterly Report on Form 10-Q for the quarter ended March 31, 2015, File No. 000-50194, filed with the SEC on May 11, 2015. | |
| 10.21†* | Form of 2015 Director Non-Qualified Stock Option Agreement under the 2006 Stock Plan. | |
| 10.22†* | Form of 2015 Director Restricted Stock Unit Agreement under the 2006 Stock Plan. | |
| 10.23†* | Form of November 2015 Executive Non-Qualified Stock Option Agreement under the 2006 Stock Plan. | |
| 10.24† | HealthDataInsights, Inc. Amended 2004 Stock Option/Stock Issuance Plan. Incorporated by reference to Exhibit 10.20 to HMS Holdings Corp.’s Annual Report on Form 10-K, File No. 000-50194, filed with the SEC on February 29, 2012. | |
| 10.25† | HDI Holdings, Inc. Amended 2011 Stock Option and Stock Issuance Plan (the “HDI 2011 Stock Plan”). Incorporated by reference to Exhibit 10.21 to HMS Holdings Corp.’s Annual Report on Form 10-K, File No. 000-50194, filed with the SEC on February 29, 2012. | |
| 10.26† | Form of 2011 Employee Non-Qualified Stock Option Agreement under the HDI 2011 Stock Plan. Incorporated by reference to Exhibit 10.22 to HMS Holdings Corp.’s Annual Report on Form 10-K, File No. 000-50194, filed with the SEC on February 29, 2012. | |
| 10.27† | Executive Employment Agreement between William C. Lucia and HMS Holdings Corp. dated March 1, 2013. Incorporated by reference to Exhibit 10.20 to HMS Holdings Corp.’s Annual Report on Form 10-K, File No. 000-50194, filed with the SEC on March 1, 2013. | |
| 10.28† | Letter of Amendment to Executive Employment Agreement between William C. Lucia and HMS Holdings Corp. dated April 30, 2013. Incorporated by reference to Exhibit 10.1 to HMS Holdings Corp.’s Annual Report on Form 10-K/A, File No. 000-50194, filed with the SEC on April 30, 2013. |
| 76 |
Exhibit |
Description | |
| 10.29† | Second Amendment to Executive Employment Agreement between HMS Holdings Corp. and William C. Lucia dated January 20, 2015. Incorporated by reference to Exhibit 10.1 to HMS Holding Corp.’s Current Report on Form 8-K, Filed No. 000-50194, filed with the SEC on January 23, 2015. | |
| 10.30† | Employment Agreement between Jeffrey S. Sherman and HMS Holdings Corp. dated July 28, 2014. Incorporated by reference to Exhibit 10.1 to HMS Holdings Corp.’s Current Report on Form 8-K, File No. 000-50194, filed with the SEC on September 8, 2014. | |
| 10.31† | Employment Agreement between Semone Wagner and HMS Holdings Corp. dated January 16, 2013. Incorporated by reference to Exhibit 99.2 to HMS Holding Corp.’s Annual Report on Form 10-K for the year ended December 31, 2013, File No. 000-50194, filed with the SEC on March 3, 2014. | |
| 10.32† | Employment Agreement between Cynthia Nustad and HMS Business Services, Inc. dated May 15, 2012. Incorporated by reference to Exhibit 10.47 to Amendment No. 1 to HMS Holding Corp.’s Annual Report on Form 10-K/A for the year ended December 31, 2014, File No. 000-50194, filed with the SEC on April 30, 2015. | |
| 10.33†* | Employment Agreement between Douglas M. Williams and HMS Holdings Corp. dated November 13, 2013. | |
| 10.34† | Form of Indemnification Agreement. Incorporated by reference to Exhibit 10.1 to HMS Holdings Corp.’s Current Report on Form 8-K, File No. 000-50194, filed with the SEC on August 6, 2014. | |
| 10.35† | HMS Holdings Corp. Director Deferred Compensation Plan. Incorporated by reference to Exhibit 10.62 to HMS Holdings Corp.’s Annual Report on Form 10-K for the year ended December 31, 2010, File No. 000-50194, filed with the SEC on March 1, 2011. | |
| 10.36† | HMS Holdings Corp. Annual Incentive Plan. Incorporated by reference to Exhibit 99.1 to HMS Holdings Corp.’s Current Report on Form 8-K, File No. 000-50194, filed with the SEC on July 12, 2011. | |
| 10.37 | Credit Agreement dated May 3, 2013 among HMS Holdings Corp., the Guarantors Party thereto, the Lenders party thereto and Citibank, N.A. as Administrative Agent. Incorporated by reference to Exhibit 10.1 to HMS Holdings Corp.’s Current Report on Form 8-K, File No. 000-50194, filed with the SEC on May 6, 2013. | |
| 10.38 | HealthDataSights, Inc. Lease between New Russell One LLC and HMS Business Services, Inc. dated February 27, 2014. Incorporated by reference to Exhibit 10.5 to HMS Holdings Corp.’s Quarterly Report on Form 10-Q for the quarter ended March 31, 2014, File No. 000-50194, filed with the SEC on May 12, 2014. | |
| 14.1 | HMS Holdings Corp. Amended Code of Conduct. Incorporated by reference to Exhibit 14.1 to HMS Holding Corp.’s Annual Report on Form 10-K for the year ended December 31, 2014, File No. 000-50194, filed with the SEC on March 2, 2015. | |
| 21.1* | HMS Holdings Corp. List of Subsidiaries | |
| 23.1* | Consent of Independent Registered Public Accounting Firm | |
| 31.1* | Rule 13a-14(a)/15d-14(a) Certification of the Principal Executive Officer of HMS Holdings Corp., as adopted pursuant to Section 302 of the Sarbanes-Oxley Act of 2002 | |
| 31.2* | Rule 13a-14(a)/15d-14(a) Certification of the Principal Financial Officer of HMS Holdings Corp., as adopted pursuant to Section 302 of the Sarbanes-Oxley Act of 2002 | |
| 32.1‡ | Section 1350 Certification of the Principal Executive Officer of HMS Holdings Corp., as adopted pursuant to Section 906 of the Sarbanes-Oxley Act of 2002 | |
| 32.2‡ | Section 1350 Certification of the Principal Financial Officer of HMS Holdings Corp., as adopted pursuant to Section 906 of the Sarbanes-Oxley Act of 2002 |
| 77 |
Exhibit |
Description | |
| 101.INS* | XBRL Instance Document | |
| 101.SCH* | XBRL Taxonomy Extension Schema Document | |
| 101.CAL* | XBRL Taxonomy Extension Calculation Linkbase Document | |
| 101.DEF* | XBRL Taxonomy Extension Definition Linkbase Document | |
| 101.LAB* | XBRL Taxonomy Extension Label Linkbase Document | |
| 101.PRE* | XBRL Taxonomy Extension Presentation Linkbase Document |
____________________________
| † | Indicates a management contract or compensatory plan, contract or arrangement |
| * | Filed herewith |
| ‡ | Furnished herewith |
78