Attached files
| file | filename |
|---|---|
| EX-32.2 - EXHIBIT 32.2 - HMS HOLDINGS CORP | exh_322.htm |
| EX-32.1 - EXHIBIT 32.1 - HMS HOLDINGS CORP | exh_321.htm |
| EX-31.2 - EXHIBIT 31.2 - HMS HOLDINGS CORP | exh_312.htm |
| EX-31.1 - EXHIBIT 31.1 - HMS HOLDINGS CORP | exh_311.htm |
| EX-23.2 - EXHIBIT 23.2 - HMS HOLDINGS CORP | exh_232.htm |
| EX-23.1 - EXHIBIT 23.1 - HMS HOLDINGS CORP | exh_231.htm |
| EX-21.1 - EXHIBIT 21.1 - HMS HOLDINGS CORP | exh_211.htm |
UNITED STATES
SECURITIES AND EXCHANGE COMMISSION
Washington, D.C. 20549
Form 10-K
| x | ANNUAL REPORT PURSUANT TO SECTION 13 OR 15(d) OF THE SECURITIES EXCHANGE ACT OF 1934 |
| For the fiscal year ended December 31, 2017 | |
| Or | |
| o | TRANSITION REPORT PURSUANT TO SECTION 13 OR 15(d) OF THE SECURITIES EXCHANGE ACT OF 1934 |
| For the transition period from to | |
Commission File Number 000-50194
![]()
HMS HOLDINGS CORP.
(Exact name of registrant as specified in its charter)
| Delaware (State or other jurisdiction of incorporation or organization) |
11-3656261 (I.R.S. Employer Identification No.) |
|
5615 High Point Drive, Irving, TX (Address of principal executive offices) |
75038 (Zip Code) |
(Registrant’s telephone number, including area code)
(214) 453-3000
Securities registered pursuant to Section 12(b) of the Act:
|
Title of each class |
Name of each exchange on which registered | |
| Common Stock $0.01 par value |
The Nasdaq Stock Market LLC (Nasdaq Global Select Market) |
Securities registered pursuant to section 12(g) of the Act: None
Indicate by check mark if the registrant is a well-known seasoned issuer, as defined in Rule 405 of the Securities Act. Yes x No o
Indicate by check mark if the registrant is not required to file reports pursuant to Section 13 or Section 15(d) of the Act. Yes o No x
Indicate by check mark whether the registrant (1) has filed all reports required to be filed by Section 13 or 15(d) of the Securities Exchange Act of 1934 during the preceding 12 months (or for such shorter period that the registrant was required to file such reports), and (2) has been subject to such filing requirements for the past 90 days. Yes x No o
Indicate by check mark whether the registrant has submitted electronically and posted on its corporate Web site, if any, every Interactive Data File required to be submitted and posted pursuant to Rule 405 of Regulation S-T (§ 232.405 of this chapter) during the preceding 12 months (or for such shorter period that the registrant was required to submit and post such files). Yes x No o
Indicate by check mark if disclosure of delinquent filers pursuant to Item 405 of Regulation S-K (§229.405 of this chapter) is not contained herein, and will not be contained, to the best of registrant’s knowledge, in definitive proxy or information statements incorporated by reference in Part III of this Form 10-K or any amendment to this Form 10-K. ¨
Indicate by check mark whether the registrant is a large accelerated filer, an accelerated filer, a non-accelerated filer, a smaller reporting company, or emerging growth company. See the definitions of “large accelerated filer,” “accelerated filer,” “smaller reporting company” and “emerging growth company” in Rule 12b-2 of the Exchange Act.
| Large accelerated filer x | Accelerated filer o | Non-accelerated filer o (Do not check if a smaller reporting company) |
Smaller reporting company o |
Emerging growth company o
If an emerging growth company, indicate by check mark if the registrant has elected not to use the extended transition period for complying with any new or revised financial accounting standards provided pursuant to Section 13(a) of the Exchange Act. o
Indicate by check mark whether the registrant is a shell company (as defined in Rule 12b-2 of the Act) Yes o No x
The aggregate market value of the registrant’s common stock held by non-affiliates as of June 30, 2017, the last business day of the registrant’s most recently completed second quarter was $1.5 billion based on the last reported sale price of the registrant’s common stock on the Nasdaq Global Select Market on that date. Solely for purposes of this disclosure, shares of common stock held by executive officers, directors and persons who hold 10% or more of the outstanding shares of common stock of the registrant as of such date have been excluded because such persons may be deemed to be affiliates. This determination is not necessarily a conclusive determination for any other purposes.
There were 82,891,340 shares of common stock outstanding as of February 16, 2018.
Documents Incorporated by Reference
Unless provided in an amendment to this Annual Report on Form 10-K, the information required by Part III is incorporated by reference to the registrant’s 2018 proxy statement, to the extent stated herein. Such proxy statement or amendment will be filed with the SEC within 120 days of the registrant’s fiscal year ended December 31, 2017.
HMS HOLDINGS CORP. AND SUBSIDIARIES
ANNUAL REPORT ON FORM 10-K
TABLE OF CONTENTS
Glossary of Terms and Abbreviations
| 2017 Form 10-K | HMS Holdings Corp. Annual Report on Form 10-K for the year ended December 31, 2017 | |
| ACA | Patient Protections and Affordable Care Act, as amended by the Health Care and Education Reconciliation Act of 2010 | |
| ACO | Accountable Care Organization | |
| ADR | Additional Documentation Request | |
| ASC | Accounting Standards Codification | |
| ASO | Administrative Service Only | |
| ASU | Accounting Standards Update | |
| CHIP | Children's Health Insurance Program | |
| CMS | Centers for Medicare & Medicaid Services | |
| CMS NHE | CMS National Health Expenditures | |
| COSO | Committee of Sponsoring Organizations of the Treadway Commission | |
| Credit Agreement | The Amended and Restated Credit Agreement dated as of May 3, 2013, as amended by Amendment No. 1 to Amended and Restated Credit Agreement dated as of March 8, 2017, and as further amended by Amendment No. 2 to Amended and Restated Credit Agreement, dated as of December 19, 2017, by and among HMS Holdings Corp., the Guarantors party thereto, the Lenders party thereto and Citibank, N.A. as Administrative Agent | |
| DRA | Deficit Reduction Act of 2005 | |
| DSO | Days Sales Outstanding | |
| ERISA | Employment Retirement Income Security Act of 1974 | |
| Exchange Act | Securities Exchange Act of 1934, as amended | |
| FASB | Financial Accounting Standards Board | |
| HIPAA | Health Insurance Portability and Accountability Act of 1996 | |
| HITECH | Health Information Technology for Economic and Clinical Health | |
| IRC | Internal Revenue Code | |
| IRS | U.S Internal Revenue Service | |
| LIBOR | Intercontinental Exchange London Interbank Offered Rate | |
| MCO | Managed care organization | |
| MMIS | Medicaid Management Information Systems | |
| PBM | Pharmacy Benefit Manager | |
| PHI | Protected health information | |
| PI | Payment Integrity | |
| R&D Credit | U.S. Research and Experimentation Tax Credit pursuant to IRC Section 41 | |
| RAC | Recovery Audit Contractor | |
| RFP | Request for proposal | |
| SEC | U.S. Securities and Exchange Commission | |
| Securities Act | Securities Act of 1933, as amended | |
| Section 199 Deduction | U.S. Production Activities Deduction pursuant to IRC Section 199 | |
| SG&A | Selling, general and administrative | |
| TPL | Third-party liability | |
| U.S. GAAP | United States Generally Accepted Accounting Principles | |
| VHA | Veterans Health Administration | |
| 2011 HDI Plan | HDI Holdings, Inc. Amended 2011 Stock Option and Stock Issuance Plan | |
| 2006 Stock Plan | HMS Holdings Corp. Fourth Amended and Restated 2006 Stock Plan, as amended by Amendment No. 1 to the HMS Holdings Corp. Fourth Amended and Restated 2006 Stock Plan dated as of February 16, 2012 | |
| 2016 Omnibus Plan | HMS Holdings Corp. 2016 Omnibus Incentive Plan | |
| 2011 HDI Plan | HDI Holdings, Inc. Amended 2011 Stock Option and Stock Issuance Plan | |
| 2017 Tax Act | Tax Cuts and Jobs Act of 2017 | |
| 401(k) Plan | HMS Holdings Corp. 401(k) Plan | |
| 1 |
Cautionary Note Regarding Forward-Looking Statements
For purposes of this 2017 Form 10-K, the terms “HMS,” “Company,” “we, “us, and “our” refer to HMS Holdings Corp. and its consolidated subsidiaries unless the context clearly indicates otherwise. Included in this 2017 Form 10-K are “forward-looking statements” within the meaning of the U.S. Private Securities Litigation Reform Act of 1995. From time to time, we also provide forward-looking statements in other materials we release to the public, as well as oral forward-looking statements. Such statements relate to our current expectations, projections and assumptions about our business, the economy and future events or conditions. They do not relate strictly to historical or current facts.
We have tried to identify forward-looking statements by using words such as “aim,” “anticipate,” “believe,” “estimate,” “expect,” “forecast,” “future,” “intend,” “likely,” “may,” “plan,” “project,” “seek,” “strategy,” “target,” “will,” “would,” “could,” “should,” and similar expressions and references to guidance, although some forward-looking statements may be expressed differently. These statements include, among other things, information concerning our future growth, business strategy, strategic or operational initiatives, our future operating or financial performance, our ability to invest in and utilize our data and analytics capabilities to expand our capabilities, the benefits and synergies to be obtained from completed and future acquisitions, the future performance of companies we have acquired, the future effect of different accounting determinations or remediation activities, the sufficiency of our sources of funding for working capital, capital expenditures, acquisitions, stock repurchases, debt repayments and other matters, our future expenses, interest rates, tax rates and financial results, the impact of changes to U.S. healthcare legislation or healthcare spending affecting Medicare, Medicaid or other publicly funded or subsidized health programs, and other statements regarding our possible future actions, business plans, objectives and prospects.
Forward-looking statements are not guarantees and involve risks, uncertainties and assumptions that are difficult to predict. Actual results may differ materially from past results and from those indicated by such forward-looking statements if known or unknown risks or uncertainties materialize, or if underlying assumptions prove inaccurate. These risks and uncertainties include, among other things:
| § | our ability to execute our business plans or growth strategy; |
| § | our ability to innovate, develop or implement new or enhanced solutions or services; |
| § | the nature of investment and acquisition opportunities we are pursuing, and the successful execution of such investments and acquisitions; |
| § | our ability to successfully integrate acquired businesses and realize synergies; |
| § | variations in our results of operations; |
| § | our ability to accurately forecast the revenue under our contracts and solutions; |
| § | our ability to protect our systems from damage, interruption or breach, and to maintain effective information and technology systems and networks; |
| § | our ability to protect our intellectual property rights, proprietary technology, information processes and know-how; |
| § | significant competition for our solutions and services; |
| § | our failure to maintain a high level of customer retention or the unexpected reduction in scope or termination of key contracts with major customers; |
| § | customer dissatisfaction, our non-compliance with contractual provisions or regulatory requirements; |
| § | our failure to meet performance standards triggering significant costs or liabilities under our contracts; |
| § | our inability to manage our relationships with information and data sources and suppliers; |
| § | reliance on subcontractors and other third party providers and parties to perform services; |
| § | our ability to continue to secure contracts and favorable contract terms through the competitive bidding process; |
| § | pending or threatened litigation; |
| § | unfavorable outcomes in legal proceedings; |
| § | our success in attracting qualified employees and members of our management team; |
| § | our ability to generate sufficient cash to cover our interest and principal payments under our credit facility, or to borrow or use credit; |
| § | unexpected changes in tax laws, regulations or guidance and unexpected changes in our effective tax rate; |
| § | unanticipated increases in the number or amount of claims for which we are self-insured; |
| 2 |
| § | our ability to develop, implement and maintain effective internal control over financial reporting; |
| § | changes in the U.S. healthcare environment or healthcare financing system, including regulatory, budgetary or political actions that affect healthcare spending or the practices and operations of healthcare organizations; |
| § | our failure to comply with applicable laws and regulations governing individual privacy and information security or to protect such information from theft and misuse; |
| § | our ability to comply with current and future legal and regulatory requirements; |
| § | negative results of government or customer reviews, audits or investigations; |
| § | state or federal limitations related to outsourcing or certain government programs or functions; |
| § | restrictions on bidding or performing certain work due to perceived conflicts of interests; |
| § | the market price of our common stock and lack of dividend payments; and |
| § | anti-takeover provisions in our corporate governance documents. |
These and other risks are discussed under the headings “Part I, Item 1. Business,” “Part I, Item 1A. Risk Factors,” “Part II, Item 7. Management’s Discussion and Analysis of Financial Condition and Results of Operations,” and “Part II, Item 7A. Quantitative and Qualitative Disclosures about Market Risk” of this 2017 Form 10-K and in other documents we file with the SEC.
Any forward-looking statements made by us in this 2017 Form 10-K speak only as of the date on which they are made. We undertake no obligation to publicly update forward-looking statements, whether as a result of new information, future events or otherwise, except as may be required by law. We caution readers not to place undue reliance upon any of these forward-looking statements. You are advised, however, to consult any further disclosures we make on related subjects in our Form 10-Q and Form 8-K reports and our other filings with the SEC.
Market and Industry Data
This 2017 Form 10-K contains market, industry and government data and forecasts that have been obtained from publicly available information, various industry publications and other published industry sources. We have not independently verified the information and cannot make any representation as to the accuracy or completeness of such information. None of the reports and other materials of third party sources referred to in this 2017 Form 10-K were prepared for use in, or in connection with, this report.
Trademarks and Tradenames
We have a number of registered trademarks, including HMS®, as well as the corresponding HMS + logo design mark, HMS IntegritySource®, Eliza® and Essette®. These and other trademarks of ours appearing in this report are our property. Solely for convenience, trademarks and trade names of ours referred to in this 2017 Form 10-K may appear without the ® or ™ symbols, but such references are not intended to indicate, in any way, that we will not assert, to the fullest extent under applicable law, our rights or the right of the applicable licensor to these trademarks and trade names. This report contains additional trade names and trademarks of other companies. We do not intend our use or display of other companies' trade names or trademarks to imply an endorsement or sponsorship of us by such companies, or any relationship with any of these companies.
| 3 |
PART I
Founded in 1974, HMS is a leading provider of cost containment solutions in the U.S. healthcare marketplace. We use innovative technology, extensive data services and powerful analytics, to deliver coordination of benefits, payment integrity and care management and consumer engagement solutions to help healthcare payers improve financial performance and clinical outcomes. We provide coordination of benefits services to government and commercial healthcare payers and sponsors to ensure that the responsible party pays healthcare claims. Our payment integrity services ensure healthcare claims billed are accurate and appropriate, and our care management and consumer engagement technology helps risk-bearing organizations to better engage with and manage the care delivered to their members. Together these various services help customers recover erroneously paid amounts from liable third parties; prevent future improper payments; reduce fraud, waste and abuse; better manage the care their members receive; engage healthcare consumers to improve clinical outcomes while increasing member satisfaction and retention; and achieve regulatory compliance. We currently operate as one business segment with a single management team that reports to the Chief Executive Officer.
HMS began its operations as Health Management Systems, Inc., which became our wholly owned subsidiary in March 2003 when we assumed its business in connection with the adoption of a holding company structure. In recent years HMS has grown both organically and through targeted acquisitions of businesses that helped expand our product suite, including IntegriGuard, LLC (2009), HealthDataInsights, Inc.(“HDI”) (2011), Essette, Inc. (“Essette”) (2016), Eliza Holding Corp. (“Eliza”) (2017) and others. The acquisitions of Essette and Eliza significantly expanded the breadth of solutions we offer entities taking risk, creating a new care management and consumer engagement vertical for HMS.
We were originally incorporated in the State of New York in October 2002 and reincorporated in the State of Delaware in July 2013. Our principal executive offices are located at 5615 High Point Drive, Irving, Texas 75038, and our telephone number is (214) 453-3000. As of December 31, 2017, we had approximately 2,500 employees. Additional information about HMS is available on our website at www.hms.com.
Copies of our recent Annual Reports on Form 10-K, Quarterly Reports on Form 10-Q, Current Reports on Form 8-K and Proxy Statements, as well as amendments to these reports or statements, are available free of charge on our website through the Investor Relations page, as soon as reasonably practicable after we electronically file them with, or furnish them to, the SEC. These materials, as well as similar materials for SEC registrants, may be obtained directly from the SEC through their website at http://www.sec.gov. You may also read and copy materials we furnish to or file with the SEC at the SEC’s Public Reference Room at 100 F Street NE, Washington, D.C. 20549. Information on the operation of the Public Reference Room may be obtained by calling the SEC at 1-800-SEC-0330.
The content of any website referred to in this 2017 Form 10-K is not incorporated by reference into this filing unless expressly noted. References to the URLs for these websites are intended to be inactive textual references only.
| 4 |
Our Solutions
Our services are applicable to federal, state and commercial health plans and other healthcare entities taking payment risk. Our coordination of benefits and payment integrity services are designed to address errors across the payment continuum, beginning with an individual’s enrollment in a program before any medical service is rendered, to pre-payment review of a claim by a payer, through recovery where identification of an improper payment is made via audit. Our services address a wide spectrum of payment errors, including eligibility and coordination of benefits errors, the identification and investigation of potential fraud, and determinations that claim amounts paid were improper and our services extend to most claim types. Our care management and consumer engagement services also assist customers in managing quality, risk, cost and compliance across all lines of business. As a result of these services, customers received billions of dollars in cash recoveries in 2017, and saved billions more through the prevention of erroneous payments, improved clinical outcomes for their members, and reduced enrollment turnover.
In general, our range of products and services include the following:
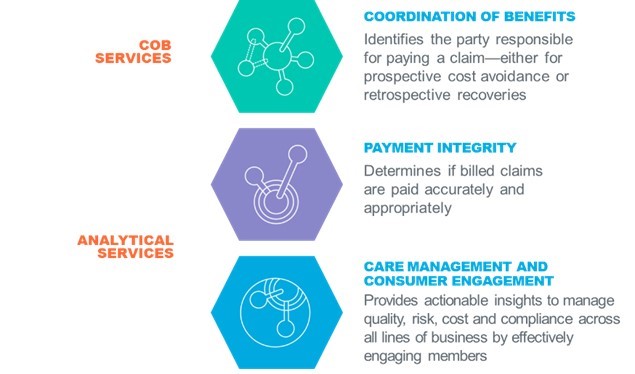
COB SERVICES
Coordination of Benefits
Our coordination of benefits services are provided primarily for state governments and Medicaid managed care plans and draw principally upon proprietary information management and data mining techniques designed to ensure that the correct party pays a healthcare claim. We offer cost avoidance services, which include providing validated insurance coverage information that is used by payers to coordinate benefits properly for future claims. With validated insurance information, Medicaid payers can avoid unnecessary costs by ensuring that they pay only after all other insurance coverage available has been exhausted, thereby complying with federal regulations that require Medicaid to be the payer of last resort. Nevertheless, due to a variety of factors, some Medicaid claims are paid even when there is a known responsible third party. Our government-sponsored program customers rely on us to identify those claims that were paid in error and recover these payments from the liable third party. Further, we also provide services to assist customers in identifying other third-party insurance and recovering medical expenses where a member is involved in a casualty or tort incident. Lastly, for Medicaid agencies exclusively, we provide estate recovery services to identify and recover Medicaid expenditures from the estates of deceased Medicaid members in accordance with state policies. For the years ended December 31, 2017, 2016 and 2015, our coordination of benefit services represented 73.4%, 72.2% and 71.2% of our total revenue, respectively.
| 5 |
ANALYTICAL SERVICES
Payment Integrity
Our payment integrity services are designed to ensure that healthcare payments are accurate and appropriate. These services are applicable to all customers that HMS serves, including federal and state governments, commercial health plans and other at-risk entities. Our solutions are designed to verify that medical services are utilized, billed and paid appropriately. We combine data analytics, clinical expertise and proprietary algorithms and technology to identify improper payments on both a pre-payment and post-payment basis; identify and recover overpayments/underpayments; detect and prevent fraud, waste and abuse; and identify process improvements. For the years ended December 31, 2017, 2016 and 2015, our payment integrity services represented 20.0%, 27.6% and 28.8% of our total revenue, respectively.
Care Management and Consumer Engagement
Our care management and consumer engagement solutions help our customers manage the care delivered to their members with a focus on improving clinical outcomes and patient engagement. We offer a broad foundation of technology and service solutions to support a health engagement management framework, which enable health plans and other risk-bearing entities to better manage costs and clinical outcomes and improve their member experience. Our care management and consumer engagement vertical leverages HMS data and analytics with a combination of Essette and Eliza solutions currently aimed at care management, risk management and member engagement in order to provide customers with a tailored, integrated platform that addresses core healthcare industry challenges on an enterprise scale. For the years ended December 31, 2017 and 2016, our care management and consumer engagement services represented 6.6% and 0.2%, of our total revenue, respectively.
Intellectual Property
Our ability to develop and maintain the proprietary aspects of our technology and operate without infringing the proprietary rights of others are important to our business and competitive position. We establish and protect our proprietary technology and intellectual property through a combination of patents, patent applications, trademarks, copyrights, domain names, and trade secrets, including know-how, confidentiality and invention assignment agreements, security measures, non-disclosure agreements with third parties, and other contractual rights.
We own a number of patents and trademarks that are important to HMS. As of December 31, 2017, our patent portfolio is comprised of approximately 50 domestic and international patents, and we are currently pursuing numerous patent applications in the United States and around the world. We have a number of registered trademarks, including HMS®, and the corresponding HMS + logo design mark, HMS IntegritySource®, Eliza®, Essette® and other registered and common law trademarks. We also hold copyrights relating to certain aspects of our products and services. While we consider all of these proprietary rights important in the operation of our business, we do not believe any one individual technology is essential to our business.
Customers
We provide our solutions to customers across a broad range of entities within the healthcare industry, including health plans, state agencies, federal programs, private employers and other at-risk providers. For the years ended December 31, 2017, 2016 and 2015, our total revenue was $521.2 million, $489.7 million and $474.2 million, respectively. No single customer accounted for 10% or more of our total revenue during any period presented.
The composition of our 10 largest customers changes periodically. For the years ended December 31, 2017, 2016 and 2015, our 10 largest customers represented 39.5%, 40.6% and 44.0% of our total revenue, respectively. The current terms of our agreements with these customers have expiration dates ranging between 2018 and 2023. Several of our contracts, including those with some of our largest customers, may be terminated for convenience. The early termination of a contract with one of our significant customers may have an adverse effect on our financial condition, results of operations and cash flows.
| 6 |
We provide products and services under contracts (or subcontracts) that contain various revenue structures, including contingent revenue and to a lesser extent fixed-fee arrangements. Many of our state government contracts have terms ranging from three to five years, including renewal terms at the option of the customer. In many instances, we provide our services pursuant to agreements that are subject to periodic reprocurements. Because we provide our services pursuant to agreements that are open to competition from various businesses in the U.S. healthcare insurance benefit cost containment arena, we cannot provide assurance that our contracts, including those with our largest customers, will not be terminated for convenience, awarded to other parties, or renewed. Additionally, we cannot provide assurance that our contracts, if renewed, will have the same fee structures or otherwise be on satisfactory terms.
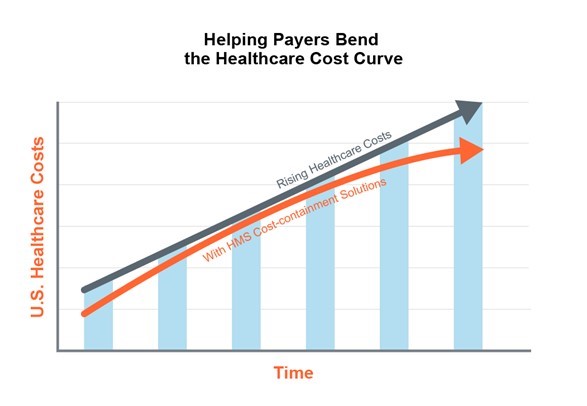
Industry Trends and Opportunities
U.S. healthcare expenditures continue to escalate and consume a large proportion of the U.S. GDP, presenting challenges for payers who wish to contain and reduce costs while also promoting quality healthcare outcomes. These aims are the same across all at-risk entities, including commercial health plans and government healthcare programs, such as Medicaid and Medicare.
Within the commercial market, health plans sell policies directly to individuals (on the open market or via health insurance exchanges), contract with employers to underwrite their employees’ care, or contract with self-insured employers to oversee benefit administration to their employees. This market also includes a growing number of risk bearing provider-sponsored plans that operate and market health plan benefits. According to CMS NHE projections, private health insurance covered approximately 200.1 million individuals at a cost of $1.2 trillion in 2017.
Several commercial health plans also offer government-sponsored lines of business, including partnering with Medicare, Medicaid and CHIP to oversee care delivery for beneficiaries enrolled in those programs. Government managed care grew out of pressures to contain the growth of state and federal program spending and to address general concerns about healthcare access. In most states, managed care is currently the predominant delivery system for Medicaid. As of July 2017, all states except three had some form of managed care in place, including the District of Columbia. Among the 39 Medicaid programs (38 states plus the District of Columbia) with comprehensive risk-based MCOs, 29 states reported that 75% or more of their Medicaid beneficiaries were enrolled in MCOs as of July 1, 2017. More states continue to carve-out complex populations as well as behavioral health services into MCO contracts. Of the 32 Medicaid programs (31 states plus the District of Columbia) that opted to expand Medicaid eligibility levels pursuant to the ACA, 27 states were using MCOs to cover newly eligible adults as of July, 2017. Of those 27 states, 24 states covered more than 75% of beneficiaries in this group through risk-based managed care. It is unclear at this time how, if at all, efforts in Congress to “repeal and replace” the ACA could affect any of the state expansions or potential future growth of Medicaid lives and expenditures. As Congress continues to debate proposals to repeal major portions of the ACA, including the ACA’s Marketplace and Medicaid coverage expansions, as well as other proposals to fundamentally restructure Medicaid’s financing structure, the implications of these proposals remain unclear.
Similarly, managed care health plans also continue to assume risk for Medicare lives, with the Kaiser Family Foundation estimating that 33% of all Medicare beneficiaries, or 19.0 million lives, were enrolled in a Medicare Advantage Plan in 2017. HMS also continues to serve government-sponsored agencies’ legacy fee-for-service programs at the state and federal level. These plans are generally reliant on and susceptible to the government appropriations process that determines their budget and governs the number of beneficiaries they serve.
According to the CMS NHE projections, Medicare programs in 2017 covered approximately 57.7 million people at a cost of approximately $718.7 billion and Medicaid/CHIP covered approximately 79.9 million people, costing approximately $604.1 billion. Altogether, it is projected that the government programs we serve covered approximately 137.6 million people at a total cost of approximately $1.32 trillion in 2017.
CMS projects Medicaid spending and enrollment will grow 6.0% and 1.7%, respectively in 2018 over 2017. CHIP spending is expected to grow 6.7% in 2018 over 2017, and CHIP enrollment is expected to increase 3.5% in 2018 over 2017. As commercial and government health plans continue to focus on strategies to contain costs across their different lines of business, we will continue to focus on serving them and meeting their evolving needs. Regardless of the program, coordinating benefits among a growing number of healthcare payers and ensuring that claims are paid appropriately represents an enormous challenge for our customers and an ongoing opportunity for us.
| 7 |
Regulatory Environment
The market for cost containment solutions is large and growing, driven by increasing healthcare costs and payment complexities. For 2018, Medicare and Medicaid are projected to pay approximately 45.3% of the nation’s healthcare expenditures and serve over 140.7 million beneficiaries. Many of these beneficiaries are enrolled in managed care plans, which have the responsibility for both patient care and claim adjudications. Since 1985, we have provided state Medicaid agencies with services to identify third parties with primary liability for Medicaid claims, and since 2005, we have provided similar services to Medicaid managed care plans.
In 2006, Congress enacted the DRA and created the Medicaid Integrity Program under the Social Security Act to increase the government’s capacity to prevent, detect and address fraud, waste and abuse in the Medicaid program. Later that year, Congress passed the Tax Relief and Health Care Act of 2006, which established the Medicare RAC program. HDI was awarded one of the first contracts under the program. In October 2016, CMS made a new round of awards and we again were awarded a region. These measures, at both the federal and state level, have strengthened our ability to identify and recover erroneous payments on behalf of our customers.
The ACA was signed into law in 2010. It included many provisions impacting healthcare delivery and payment programs, including employer-sponsored health coverage, expansion of the Medicaid program, health insurance exchanges with premium subsidies, and payment integrity efforts. In 2017, Congress considered the revision or repeal of some or all of the ACA. Options that have been considered include issuing block grants or establishing per capita caps for state Medicaid populations, and looking at program design alternatives for future enrollment criteria. We will monitor ACA-related changes as they develop and assess their potential impact, as well as any opportunities they may present for our customers and for us.
Competition
The U.S. healthcare insurance benefit cost containment marketplace is a dynamic industry with a range of businesses currently able to offer cost containment services, both directly or indirectly (through subcontracting), to some or all of the various healthcare payers. In addition, with improvements in technology and the growth in healthcare spending, new businesses are incentivized to enter this marketplace. Many healthcare payers also have the ability to perform some or all of these cost containment services themselves and choose to exercise that option. Competition is therefore robust as customers have many alternatives available to them in their effort to contain healthcare costs.
We compete based on a variety of factors, including our ability to perform a wide range of coordination of benefits and payment integrity related functions; proven results to maximize recoveries and cost avoidance; our in-depth government healthcare program experience; clinical staff expertise; extensive insurance eligibility database; proprietary systems and processes; existing relationships with various customers and other industry stakeholders; and our ability to provide customers with actionable intelligence to improve clinical outcomes and patient engagement.
Within our core coordination of benefits services, we compete primarily with large business outsourcing and technology firms, claims processors and PBMs, clearinghouses, healthcare consulting firms, smaller regional vendors and other TPL service providers. In addition, we frequently work with customers who may elect to perform some or all of their recovery and cost avoidance functions in-house. The competitive environment for payment integrity services includes some of the same companies that provide coordination of benefits services. Within the care management and risk analytics sector, we compete primarily with vendors who provide these and other population health management technology services. Companies with whom we compete across our product offerings include:
| § Accenture | § Cotiviti Corporation | § Inovalon | § SCIO Health Analytics |
| § CaseNet | § Equian, LLC | § LexisNexis | § Verscend Technologies, Inc. |
| § Change Healthcare | § Experian Health | § MedHok | § Welltok |
| § Cognizant/TriZetto Healthcare Products | § Optum | § DXC Technology Solutions | § Conduent |
| § IBM Watson Health | § Performant Financial Corp. | § ZeOmega |
| 8 |
Business Strategy
We believe that the steadily increasing enrollment and rising expenditures for Medicare and Medicaid, with most new enrollees entering managed care plans; an aging U.S. population with an increasing concentration of individuals with high cost chronic conditions and often co-morbidities; and the overall complexity of the healthcare claims payment system in the U.S. all combine to create substantial growth opportunities for the suite of cost containment solutions we offer.
We also believe these factors present growth opportunities for our care management and consumer engagement solutions. We expect to grow our business over the course of 2018 and beyond, both organically and inorganically, by leveraging existing key assets (e.g., our data, analytics, in-house expertise, and distribution channel) and pursuing a number of strategic objectives or initiatives, including:
| § | Expanding the scope of our relationship with existing customers – by selling additional products and services, including those designed to improve member engagement and improve clinical outcomes. |
| § | Adding new customers – by marketing to commercial health plans, including Medicaid managed care and Medicare Advantage plans, at-risk group and individual health lines of business and ASO; government healthcare payers, including Medicaid agencies, state employee health benefit plans and CHIP; at-risk provider organizations and ACOs; and commercial employers. |
| § | Introducing new “homegrown” products and services – through internal development initiatives designed to enhance or expand our existing suite of cost containment solutions. |
| § | Utilizing big data – to create a more nimble operating environment, create operating efficiencies, improve the yield on our existing product suite and identify new revenue opportunities within our current service delivery models. |
| 9 |
| § | Promoting automation and innovation to improve the efficiency and effectiveness of our services – by continuing to implement new technology and process improvements designed to increase recovery yields, increase customer satisfaction, and achieve greater operating efficiencies. |
| § | Building out our new care management and consumer engagement technology platform – by continuing to grow a broad foundation of technology and service solutions to help customers better manage quality, cost and compliance across all lines of business. Our first steps in this strategy were the acquisition of Essette and Eliza. |
| § | Prudent deployment of capital – by investing in internal growth initiatives; selectively investing in capabilities, technologies, and assets to complement our core cost-containment expertise; building care management and care coordination adjacencies to complement the Essette and Eliza acquisitions; and expanding our data analytics capabilities. Our focus may include acquisitions that represent long-term growth potential, target high-growth areas, are accretive to earnings, and fill a strategic need in our business portfolio as we seek to provide increasingly comprehensive solutions to our customers. We may also repurchase our shares, pursuant to a two-year $50 million authority granted by our Board of Directors in November 2017. |
| 10 |
Our business is subject to significant risks, including the risks and uncertainties described below. You should carefully consider these risks, as well as the other information in this 2017 Form 10-K, including our Consolidated Financial Statements and the related Notes. The occurrence of any of these risks could adversely affect our business, financial condition, results of operations, and cash flows in a material way.
Risks Relating to Our Company
Our ability to expand our business will be adversely affected if we fail to implement our growth strategy.
The size and the scope of our business operations have expanded over the past several years, and we currently intend to continue to grow and expand into new areas of the healthcare industry; however, such growth and expansion carries costs and risks that, if not properly managed, could adversely affect our business. Our future growth will depend on, among other things, our ability to successfully execute our business plans, which includes retaining existing customers, attracting new customers and improving our operations, all while remaining competitive. We must also be flexible and responsive to our customers’ needs and to changes in the political, economic and regulatory environment in which we operate. The greater size and complexity of our expanding business puts additional strain on our administrative, operational and financial resources and can make optimal resource allocation more difficult to determine. We may not be able to maintain or accelerate our growth. A failure to anticipate or properly address the demands and challenges that our growth strategy and potential diversification may have on our resources and existing infrastructure may result in unanticipated costs and inefficiencies and could negatively impact our ability to execute on our business plans and growth goals, which could have a material adverse effect on our business, financial condition, results of operations and cash flows.
If we fail to innovate and develop new or enhanced solutions and services, or if these solutions and services are not adopted by our customers, it could have a material adverse effect on our business, financial condition, results of operations and cash flows.
Part of our growth strategy depends on our ability to respond to the evolving healthcare landscape with new and enhanced solutions and services that our existing and potential customers are willing to adopt. The development, marketing and implementation of these solutions and services may require that we make substantial financial and resource investments. We face risks that our new or modified solutions and services may not be responsive to customer preferences or industry changes, and that the solution and service development initiatives that we prioritize may not yield the gains that we anticipate, if any. If we are unable to predict market preferences or healthcare industry changes, or if we are unable to develop or adapt solutions and services that are responsive to existing and potential customers’ needs, we may fail to expand our business, which could constrain our future revenue growth and materially adversely affect our business, financial condition, results of operations and cash flows.
Our acquisition strategy may subject us to considerable business and financial risk.
Historically, to achieve our strategic goals, we have made a significant number of acquisitions that have expanded the solutions and services we offer, provided a presence in complementary business lines, or expanded our geographic presence and/or customer base. For example, we acquired IntegriGuard, LLC in September 2009; Verify Solutions, Inc. in December 2009; Allied Management Group-Special Investigation Unit in June 2010; Chapman Kelly, Inc. in August 2010; HDI in December 2011; MedRecovery Management, LLC in December 2012; Essette in September 2016; and Eliza in April 2017.
| 11 |
We intend to pursue future acquisitions that will continue to expand and diversify our business and to periodically engage in discussions regarding such possible acquisitions. We are subject to risks and uncertainties relating to our ability to identify suitable potential acquisition candidates, to consummate additional acquisitions that will be advantageous to us, and to successfully integrate future acquisitions. Future and potential business acquisitions involve a number of risk factors that could affect our operations, including, but not limited to:
| § | diversion of management’s attention and other resources; |
| § | our ability to successfully and timely integrate operational, accounting and technology functions, policies, processes, systems and controls, and to implement these functions, policies, processes, systems and controls, without incurring substantial expenses, delays, difficulties or other issues; |
| § | our ability to integrate personnel and human resource systems as well as the cultures of the acquired business; |
| § | our ability to retain or replace the key personnel of the acquired business; |
| § | our ability to maintain relationships with the customers of the acquired business and further develop the acquired business; |
| § | our ability to cross-sell our solutions and services and the solutions and services of the acquired business to our respective customers; |
| § | customer dissatisfaction or performance problems with the acquired business; |
| § | our ability to comply with regulatory requirements and avoid potential conflicts of interest in markets that we serve; |
| § | the misuse of intellectual property by the personnel of the acquired business; |
| § | our ability to successfully enter into unfamiliar markets; |
| § | assumption of unanticipated legal or financial liabilities and/or negative publicity related to prior acts by the acquired business; |
| § | we may become subject to litigation or other claims in connection with the acquired business, including claims from terminated employees, customers, former shareholders or third parties; |
| § | we may become significantly leveraged as a result of incurring debt to finance an acquisition; |
| § | the acquired business may not perform as projected which could negatively impact earnings or contingent consideration; |
| § | we may suffer impairment of goodwill and other acquired intangible assets; and |
| § | we may suffer dilution to our earnings per share. |
If we fail to adequately address these risks, or to successfully integrate the businesses that we acquire, we may not realize cost efficiencies, synergies or other benefits that we anticipated when selecting our acquisition candidates, and our reputation, business, financial condition, results of operations and cash flows could be materially adversely affected.
You will not be able to rely on our operating results in any particular period as an indication of our future performance because they are subject to significant fluctuation which may cause the market price of our common stock to decrease significantly.
Our revenue and operating results may fail to match our past or projected performance and could vary significantly from period-to-period as a result of a number of factors, some of which are outside of our control. We have experienced fluctuations in our revenue and operating results in the past and they may vary in the future for reasons that include, but are not limited to:
| § | fluctuations in sales activity given our sales cycle; |
| § | the length of contract and implementation periods; |
| § | the commencement, completion or termination of contracts during any particular quarter; |
| § | contract costs and expenses, which may be incurred in periods prior to revenue being recognized; |
| § | the timing of period revenue recovery projects and third party payers’ claim adjudication; |
| § | the billing and budgeting cycles of our customers; |
| § | the timing of government procurement activities, including when contract awards are announced and the time required to resolve bid protests; |
| § | contract renewal discussions, which may result in delayed payments for services already performed; |
| § | changes in the pricing structure or other significant terms in our contract, or the scope of services we perform; |
| § | technological and operational issues affecting our customers, including delays in payment receipt for previously recognized revenue due to delays in certain customers processing our findings through their systems, and restrictions on our ability to use or access certain data or a lack of integrity or quality in the data or information we receive from certain data sources; |
| § | adjustments to age/quality of receivables and accruals as a result of factors such as delays involving contract limitations or changes, subcontractor performance deficiencies or internal managerial decisions not to pursue identified claim revenue from customers; |
| 12 |
| § | the impact of service disruptions or delays in the systems or operations of subcontractors, partners, vendors and other third party providers on which we rely on to deliver a single-source solution or service to our customers; |
| § | changes in applicable laws; |
| § | changes in accounting policies or guidelines concerning the timing of recognition of revenue; and |
| § | regulatory changes or general economic conditions as they affect healthcare providers and payers. |
We cannot predict the extent to which future variations could occur due to these or other factors. In addition, occasionally our state and federal customers are requested by third party payers to refund payments that we previously recovered for our customers. If our state and federal customers choose to refund money in response to these requests, regardless of whether an error actually occurred in connection with the payments, we may also be required to return contingent revenue which we were previously paid associated with such refunded payment. Consequently, our operating results are subject to significant fluctuation for any particular quarter, fiscal year, or other period, and may not be indicative of future periods. Our business is also subject to seasonal patterns resulting from increased efforts at year-end by certain customers to generate additional savings, complete compliance obligations and close gaps in care. However, taken as a whole, we do not consider our operations to be seasonal to any material degree. Due to all of these factors, our revenue and operating results are difficult to predict and are subject to significant fluctuation, which may cause the market price of our common stock to decrease significantly.
We face challenges associated with forecasting the revenue under our contracts, and any failure to accurately forecast such revenue could have a material adverse effect on our business, financial condition, results of operations and cash flows.
We may not be able to accurately estimate the factors upon which we base our contract pricing, or the costs and timing for implementing and completing contracts. For a majority of our customer contracts, the payment of our fee is contingent upon the recoveries received by our customers. We also have cost-plus or time-and-material based contracts with the federal government where our revenue is recognized based on costs incurred plus an estimate of the negotiated fee earned. Our ability to earn a profit on these contracts requires that we accurately estimate the costs involved with these contracts and assess the probability of achieving certain outcomes or milestones within the contracted time period. In addition, we cannot predict with certainty the costs or the period in which implementation or contracts may be completed when we introduce new solutions or services into the marketplace. We may also face a long implementation period with a new customer or a new contract with an existing customer, making it difficult to reliably forecast revenue under those contracts. If we do not accurately estimate the costs and timing for completing projects, or if we encounter increased or unexpected costs, delays, failures, liabilities or risks, including those outside of our control, our contracts could prove unprofitable for us or yield lower profit margins than anticipated. Although we believe that we have recorded adequate provisions in our financial statements for losses on our fixed-price and cost-plus contracts where applicable, as required under U.S. GAAP, our contract loss provisions may not be adequate to cover all actual future losses.
System interruptions or failures could expose us to liability and harm our business.
Our data and operation centers are essential to our business and our operations depend on our ability to maintain and protect our information systems. We attempt to mitigate the potential adverse effects of a disruption, relocation or change in operating environment; however, the situations we plan for and the amount of insurance coverage that we maintain may not be adequate in every case. Despite systems redundancy and security measures, our systems and operations are vulnerable to damage or interruption from, among other sources:
| § | power loss, transmission cable cuts and telecommunications failures; |
| § | fire, flood, earthquake and other natural disasters; |
| § | hardware failures or software defects; |
| § | operator error; |
| § | cyber security breaches; and |
| § | physical break-ins, sabotage, intentional acts of vandalism, terrorist attacks and other events beyond our control. |
| 13 |
In addition, while there are backup systems in many of our operating facilities, an extended outage of utility or network services supplied by third party IT vendors or providers may delay or disrupt the delivery or performance of the solutions and services we provide for our customers. If we encounter a lengthy business interruption, or in the event our business continuity plans and business interruption insurance coverage are not adequate or fail to compensate us on a timely basis, we could suffer operational disruptions, disputes with customers, civil or criminal penalties, regulatory problems, increases in administrative expenses, loss of our ability to produce timely and accurate financial and other reports, damage to our reputation or customer relationships or other adverse consequences, any of which could have a material adverse effect on our business, financial condition, results of operations and cash flows.
Our systems and networks and those of third parties on which we rely may be subject to cyber security breaches and other disruptions that could compromise our information and harm our business.
In the ordinary course of our business, we rely heavily upon our technology systems and networks, as well as on the products and services of third-party providers, to input, transmit, maintain and communicate the confidential and proprietary data we receive from our customers and other data suppliers (e.g. private insurance plans, financial institutions, etc.). In addition, subcontractors, teaming partners or other third-party vendors may receive or utilize this information on our behalf in support of the services we perform for our customers. The secure processing and maintenance of this information is critical to our operations and business strategy. Although we have spent significant resources to implement security and privacy programs and controls, train our workforce and augment our security measures with the implementation of new technologies and processes, our information technology and infrastructure, and those of third parties on which we rely, have been, and will likely continue to be subject to computer hacking, acts of vandalism or theft, malware, computer viruses or other malicious codes, phishing, employee error or malfeasance, catastrophes, unforeseen events or other cyber-attacks. To date, we have seen no material impact on our business or operations from these attacks, however, we may be unable to implement adequate preventive measures to protect against such compromises in the future or to effectively adapt our security measures to evolving security risks. As a result, our technology systems, including our data and our customers’ data, could be accessed improperly, made unavailable, improperly modified, corrupted or otherwise breached or compromised, or we could suffer system disruptions, shutdowns and denials of service. Similarly, we could be materially adversely affected by the loss of proprietary, trade secret or confidential technical and financial data if our internal networks are compromised. The occurrence of any of these events could harm the market perception of the effectiveness of our security measures, lead to reputational damage or the loss of our customers’ confidence in our solutions and services, negatively affect our ability to attract new customers, cause existing customers to terminate or not renew our solutions and services, or to deter them from using our solutions or services in the future, all of which could reduce our revenue, increase our expenses and expose us to potential liability under privacy, security or other applicable laws and regulations. We could also be forced to expend significant resources in response to a security breach, including investigating the cause of the breach, repairing system damage, remediating vulnerabilities in our security procedures, increasing cyber security protection costs by deploying additional personnel and protection technologies, paying regulatory fines and litigation costs, and resolving legal claims and regulatory actions, all of which could increase our expenses, divert the attention of our management and key personnel away from our business operations and materially adversely affect our business, financial condition, results of operations and cash flows.
If we are unable to protect our proprietary technology, information, processes, know-how, and other intellectual property and intellectual property rights, or become subject to claims of infringing or misappropriating the intellectual property of third parties, the value of our solutions and services may be diminished and our business may be materially adversely affected.
Our success as a company depends in part upon our ability to protect our core technology and intellectual property. Our expanding operations and efforts to develop new solutions and services also make protection of our intellectual property more critical. We seek to protect our intellectual property and other proprietary information through a combination of patent, trademark, copyright, trade secret and unfair competition laws, confidentiality agreements and invention assignment agreements with employees, consultants and other third parties, as well as through the terms of our agreements with customers and vendors, and other security measures. However, the steps we have taken to deter misappropriation of intellectual property may be insufficient to protect our proprietary information. Misappropriation of our intellectual property by third parties, or any disclosure or dissemination of our confidential and proprietary business intelligence, queries, algorithms and other similar information by any means, could undermine any competitive advantage we currently derive or may derive from that intellectual property. For example, our current or former employees, consultants or other third parties may unintentionally or willfully disclose our trade secrets, know-how or other confidential and proprietary information to competitors. Competitors have also attempted to use state open records and/or federal Freedom of Information Act laws to obtain our proposal responses and other documents we provide to our government customers. We cannot be certain that our efforts to protect the confidential and proprietary trade secret information or intellectual property in these proposals or other documents will always be successful, due to the many factors underlying the various state and federal decisions to release information in response to open records requests (even in spite of our objections and efforts to protect such information). In addition, there remains the possibility that others will independently develop competing technologies that may be equivalent or superior to ours. If our efforts to protect our intellectual property and other proprietary rights are inadequate to prevent unauthorized use or appropriation by third parties or our employees, the value of our brand and other intangible assets may be diminished and others may be able to more effectively compete with our business by offering solutions or concepts that are substantially similar to ours, which could have a material adverse effect on our business, financial condition, results of operations and cash flows.
| 14 |
In addition, third parties may claim that we are infringing upon or misappropriating their intellectual property, or assert other legal challenges to our intellectual property. Our exposure to risks related to the use of intellectual property may also increase as a result of acquisitions because third parties may make infringement and similar or related claims after we have acquired technology. Any of these situations could cause us to expend significant time and resources and to incur substantial costs associated with litigation or legal proceedings that may be necessary to defend ourselves or to enforce our intellectual property rights, in which we may not ultimately prevail, and could result in our being prevented from furnishing certain solutions and services.
We face significant competition for our solutions and services and we expect competition to increase, which could materially adversely affect our business, financial condition, results of operations and cash flows.
The market for healthcare cost containment solutions is intensely competitive, driven by rapidly changing technologies, evolving industry standards and customer demands to become more efficient. Our competitors range in size from large, diversified national companies to small, specialized firms, and could include current or former subcontractors or teaming partners seeking to establish direct relationships with our customers in order to perform similar services as the prime contractor, as well as current and prospective customers that elect to perform recovery and cost avoidance functions in-house or to develop in-house capacities for solutions and services that we provide or hope to provide. Consolidation among vendors and healthcare providers, as well as the merging of some of our competitors or formation of business alliances with other competitors, have contributed to the increasingly competitive environment. For example, certain state customers have combined or “bundled” TPL services under large-scale IT procurements, allowing MMIS vendors to partner with less experienced TPL identification vendors based on preferred relationships or favorable pricing. In addition, companies that have invested in proprietary technology different from our own solution and service offerings, such as front-end analytics, have emerged as new competitors due to the rapidly evolving healthcare landscape. There is also increasing sophistication in the solutions and services that our competitors are developing that may become more efficient or appealing to our customers. In order to remain competitive, we may need to quickly develop and market new and enhanced solutions and services responsive to emerging technologies and changes in the healthcare industry, which may require that we make substantial financial and resource investments.
We may not be able to compete successfully against our existing or future competitors. Some of these competitors have significantly greater financial and technical resources, and others have longer operating histories and greater name recognition than we do in certain markets. They may be able to (i) offer lower prices or negotiate fee reductions on our current solutions and services, (ii) respond more quickly than we can to new and emerging technologies and changing customer requirements, (iii) devote greater resources to the sale of their products and the development and implementation of new and improved systems, solutions and services for customers that we serve, and (iv) pursue various acquisitions that allow them to rapidly amass a wide array of capabilities. We may be forced to lower our pricing, unexpectedly increase or enhance our technological or data capabilities, or modify our solution or service offerings. Notwithstanding any changes we make in response to increased competition, the demand for our solutions and services may decrease as a result of increased competition. A failure to be responsive to our existing and potential customers’ needs or the changing industry landscape could hinder our ability to maintain or expand our customer base, hire and retain new employees, pursue new business opportunities, complete future acquisitions and operate our business effectively. Any inability to compete effectively could materially adversely affect our business, financial condition, results of operations and cash flows.
| 15 |
Our business could be materially adversely affected if we fail to maintain a high level of customer retention, if our customers elect to reduce the scope of our contracts or terminate them before their scheduled expiration dates or if we fail to meet performance standards under our customer contracts.
We historically have derived and expect to continue to generate a significant portion of our revenue from a limited number of large customers at the federal and state level. Our contracts with these customers are subject to periodic renewal and some permit them to terminate their contracts on short notice, with or without cause. If a customer is dissatisfied with the quality of our work or if we fail to meet performance standards under our contracts, or if our solutions, technical infrastructure or services do not comply with the provisions of our contractual agreements or applicable regulatory requirements, customers might seek to reduce the scope of the services we perform or prematurely terminate their agreements with us, or we could incur additional costs that may impair the profitability of a contract and damage our ability to obtain additional work from that customer, or other current or prospective customers. For example, some of our contracts contain liquidated damages provisions and financial penalties related to performance failures, which if triggered, could materially adversely affect our reputation, business, financial condition, results of operations and cash flows. We also may be required to disclose such liquidated damages or other financial penalties assessed against us in connection with future bids for services with other customers.
In addition, government customers are subject to financial pressures or pressure from stakeholders that may cause them to terminate contracts for our services that may be regarded as non-essential or to redefine or reduce the scope of our contracts by, for example, significantly reducing the volume of data that we are permitted to audit or renewing the contract at lower performance fee levels. Despite our right to prompt and full payment under the terms of our contracts, we could face challenges in obtaining timely or full payments for our properly provided services from our customers. If there is a substantial reduction in the scope of our services under, or a termination of, any of our key contracts with our major customers, or if we are exposed to significant costs, liabilities or negative publicity, our ability to compete for new contracts with current or prospective customer could be damaged and our business, financial condition, reputation, results of operations and cash flows could be materially adversely affected.
Any failure to maintain effective information processing systems and the integrity of the data in, and operations of, those systems could materially adversely affect our business, financial condition, results of operations and cash flows.
Our ability to conduct our operations and accurately report our financial results depends on the integrity of the data in our information systems and the processes performed by those systems. As a result of the services we provide, we process a number of complex transactions that require us to access, store, retrieve, manipulate, manage and transmit our customers’ information and data, external data, as well as our own data. Although we have invested a great deal of time and resources in developing systems, processes and controls that protect the integrity of the data, such measures cannot provide absolute security. It is possible that failures or errors in hardware and software, including those in third-party technology, or technical deficiencies in our systems could result in data loss or corruption, or cause the data that we collect, utilize or disseminate to be incomplete or contain inaccuracies that our customers regard as significant. In addition, these information systems and applications require continual maintenance, upgrading and enhancement to meet our operational needs, satisfy customer requests and handle our expansion and growth. Despite our testing and quality control measures, we cannot be certain that errors or system deficiencies will not be found and that remediation can be done in a timeframe that is acceptable to our customers, or that customer relationships will not be impaired by the occurrence of errors or the need for remediation. In addition, implementation of upgrades and enhancements may cost more, take longer or require more testing than originally expected. Situations may also arise in which the accuracy of our data analysis or the content and quality of our work product is central to the disposition of claims, controversies or litigation between our customers and third parties that would require us to allocate significant resources to fulfilling our contractual obligations to provide our customers with full and complete access to records, analysis and back-up documentation of our work. Assuring our capacity to fulfill these obligations as well as actually fulfilling them could impose significant burdens on our infrastructure for data storage, maintenance and processing, and require us to incur increased costs to supplement our personnel, data storage and computing resources, which could materially and negatively impact other business operations.
| 16 |
We depend on many different entities to supply information and an inability to successfully manage our relationships with a number of these suppliers may harm the quality and availability of our solutions and services.
We obtain the data used in our solutions and services from many sources, including commercial health insurance plans, financial institutions, managed care organizations, government entities and non-government entities. From time to time, challenges arise in managing and maintaining our relationships with data sources that are not our customers and that furnish information to us pursuant to a combination of voluntary cooperation and legal obligations under laws and regulations that are often subject to differing interpretation. For example, data suppliers could seek to limit or end our access to and use of their data if they determine that certain uses of data for our customers are not permitted by our agreements, or such suppliers may make errors in compiling, transmitting or accurately characterizing data or have technological limitations that interfere with our receipt or use of the data we rely on them to provide. If a number of our information sources become unable or unwilling to provide us with certain data under terms of use that are acceptable to us and our customers, or if laws and regulations for use and protection of this data changes in a way that disincentivizes our suppliers, or imposes unacceptable or unreasonable conditions or risks on us, we may not be able to obtain new or favorable agreements with alternative data suppliers. In addition, our ability to normalize and fully utilize the information we have received from various data sources in order to enhance and improve current solutions for our customers is an important component of our growth strategy. Although we believe that we have the legal and contractual rights necessary to normalize and use the data we have obtained from these sources for potential or contemplated products and service offerings, we cannot provide assurance that these entities will permit the use of their data for these purposes. If we lose a number of our data sources or access to certain data and are unable to identify and reach the requisite agreements with suitable alternative suppliers or fail to successfully integrate them into our solutions and services, or if there is a lack of accuracy or integrity in the data that current or future suppliers provide, we could experience service disruptions, increased costs, reduced quality of our solutions and services, or performance penalties under our customer contracts, which could have a material adverse effect on our business, financial condition, results of operations and cash flows.
We may rely on subcontractors and other third party providers to provide customers with a single-source solution or service or we may serve as a subcontractor to a third party prime contractor. If these parties fail to satisfy their obligations to us or if we are unable to maintain these relationships, our business, financial condition, results of operations and cash flows could be materially adversely affected.
In some areas of our business we may engage subcontractors, teaming partners, vendors or other third party providers to provide our customers with a single-source solution or service for a broader range of service needs. These third parties include software vendors, utility and network providers and other information technology service providers. Our ability to deliver and implement solutions and serve our customers effectively depends on these third parties meeting our service standards in both timeliness and quality, and in certain instances, on our ability to obtain customer approval for the use of these third party subcontractors. While we believe that we perform appropriate due diligence on these third parties and take adequate measures to ensure that they comply with the appropriate laws and regulations, we cannot guarantee that they will comply with the terms set forth in their agreements with us. Performance deficiencies or misconduct by subcontractors, teaming partners, vendors or other third party providers may be perceived as inadequacies in our solutions or services or cause us to fail to fulfill our contractual obligations to our customers, which could materially adversely affect our customer relationships and reputation, result in termination of a customer contract, and subject us to a dispute with our customer. In addition, if our third party service providers terminate or refuse to renew their relationships with us or offer their products to us in the future on less advantageous terms, we may not be able to perform or deliver solutions or services for existing customers as expected.
Similarly, we are and may in the future be engaged as a subcontractor to a third party prime contractor. Subcontracting arrangements where we are not the prime contractor pose unique risks to us because we do not have control over the customer relationship, and our ability to generate revenue under such subcontracts is dependent on the prime contractor, its performance and relationship with the customer, and its relationship with us. We cannot be certain that the prime contractor will provide adequate and timely services to the customer, comply with the terms of its prime contract with the customer or its subcontract agreement with us, or that it will construe its contractual rights and obligations in a reasonable way, act appropriately in dealing with us or customers, and remain in compliance with the relevant laws, rules or regulations. Any failure of the prime contractor to adequately perform its obligations under the prime contract or to comply with applicable laws, rules and regulations could materially adversely affect our reputation and subject us to a dispute with the prime contractor or the customer. In the event a prime contract is terminated, whether for non-performance by the prime contractor or otherwise, our subcontract will similarly terminate, and the resulting contract loss could materially adversely affect our business, financial condition, results of operations and cash flows.
| 17 |
We obtain a portion of our business through competitive bidding in response to government requests for proposals. Reprocurements and future contracts may not be awarded through this process on the same level or our contract awards may be challenged by interested parties which could materially adversely affect our business, financial condition, results of operations and cash flows.
In order to market our solutions and compete for contracts with existing and potential state and federal customers, we are often required to respond to government-issued RFPs. These RFP responses typically require us to assemble and submit a large volume of information within a rigid timetable, and to accurately estimate our cost structure for servicing the proposed contract, the time required to establish operations and the likely terms of any proposals submitted by our competitors. We may also be required to disclose the occurrence of any negative events suffered by our business, such as customer disputes, a government inquiry or an adverse judgment or settlement in litigation or a legal proceeding, which could impair our ability to win the contract at issue or have a material adverse effect on our reputation in the industry.
Even if we win these contracts, we may fail to secure favorable contract terms and conditions, or a government’s determination to award us the contract may be challenged by an interested party. Under the state and federal laws and regulations governing procurements of goods and services, challenges and award protests may be filed even if there are no valid legal grounds on which to base the protest. The filing of such challenges could potentially delay the start or implementation of the contract if the government agency determines to withhold a contract award or suspend contract performance while the protest is being considered, or to take corrective action on its own, such as soliciting new bids or terminating the contract award or current procurement. In the event of irregularities, we perceive or learn of in the award or bidding process, we also may be forced to file protests in response to RFP awards to other bidders. Resolution of a protest, even in our favor, could force us to expend considerable funds in disputing the potential award or to incur additional expenses to maintain our ability to timely start implementation, which may cause our actual results to differ materially and adversely from those anticipated. In addition, if we are unable to win reprocurements or protests of particular contracts, we may be precluded from entering certain customer markets for the term of the contract awarded to another party. Any failure to continue to obtain contracts in response to government RFPs, to design proposals that result in profitable contracts, to win new contracts or re-procure current contracts after they expire or to prevail in protests or challenges of contract awards could have a material adverse effect on our business, financial condition, results of operations and cash flows.
Adverse judgments or settlements in legal proceedings could materially harm our business, financial condition, operating results and cash flows.
We are subject and may be a party to legal proceedings and claims that arise from time to time in the ordinary course of our business, which may include those related to, for example, claims brought by our customers in connection with billing and contractual disputes, subcontracts and teaming agreements, protection of confidential information or trade secrets, claims relating to pending, terminated or completed acquisitions or dispositions, adversary proceedings arising from customer bankruptcies, employment of our workforce and immigration requirements or compliance with any of a wide array of state and federal statutes, rules and regulations that pertain to different aspects of our business. We may also be required to initiate expensive litigation or other proceedings to protect our business interests. There is a risk that we will not be successful or otherwise be able to satisfactorily resolve any pending or future litigation. In addition, litigation and other legal claims are subject to inherent uncertainties and management’s view of currently pending legal matters may change in the future. Those uncertainties include, but are not limited to, litigation costs and attorneys’ fees, unpredictable judicial or jury decisions and the differing laws and judicial proclivities regarding damage awards among the states in which we operate. Resolution may also require that HMS accept some amount of loss or liability in order to avoid customer abrasion, negative marketplace perceptions and other disadvantageous results. Unexpected outcomes in such legal proceedings, or changes in management’s evaluation or predictions of the likely outcomes of such proceedings (possibly resulting in changes in established reserves), could have a material adverse effect on our business, financial condition, results of operations and cash flows.
| 18 |
As previously reported, in November 2017, the Company was the subject of an adverse verdict in a breach of contract claim against the Company arising out of an acquisition in 2010. The adverse verdict resulted in a jury award of $60 million in damages to the plaintiffs. The Company intends to appeal the verdict and believes that strong grounds exist to overturn or greatly reduce the damages awarded by the jury. See the information under “Litigation” in Note 13 to the Consolidated Financial Statements in Part II, Item 8 for further discussion about this proceeding.
We may not be able to deliver our solutions and services efficiently if we are unable to attract and retain qualified employees.
Our successful delivery of solutions and services and ability to maintain our productivity and profitability is dependent on our ability to identify, recruit, employ, train and retain skilled personnel. The success of recruitment and retention strategies depend on a number of factors, including the competitive demands for employees having the skills we need and the level of compensation required to hire and retain such employees. As our business expands and undergoes change, we may also find it difficult to preserve our corporate culture, which could reduce our ability to innovate and operate effectively or result in a loss of experienced personnel. In addition, customers or competitors may hire away our qualified employees. We may not be able to recruit or maintain the personnel necessary to efficiently operate and support our business in the future, and even if our recruitment and retention strategies are successful, our labor costs may increase significantly. Our inability to hire sufficient personnel on a timely basis without significantly increasing our labor costs could materially adversely affect our business, financial condition, results of operations and cash flows.
Our future success depends, in part, on the continued service of members of our management team.
Our ability to execute on our business plans and future success requires that we attract, develop, motivate and retain experienced and innovative executive officers and senior managers who have successfully managed, designed or implemented government services programs or information technology projects, or have relevant experience in other sectors of data management or the healthcare industry. These individuals are in great demand and are likely to remain a limited resource in our industry. The loss of services of one or more members of our management team could adversely affect our business, financial condition, results of operations and cash flows. In addition, to the extent we lose an executive officer or senior manager, we may incur increased expenses in connection with the hiring, promotion or replacement of these individuals and the transition of leadership and critical knowledge.
Our outstanding indebtedness could materially adversely affect our financial condition and our ability to operate our business, and we may not be able to generate sufficient cash flows to meet our debt service obligations or capital requirements.
On December 19, 2017, HMS and certain subsidiaries entered into Amendment No. 2 to Amended and Restated Credit Agreement (the “Amendment”), which amends our existing Credit Agreement. Among other things, the Amendment provides for a senior secured revolving facility in an aggregate principal amount equal to $500 million and extends the maturity date of the revolving facility to December 19, 2022 (the “Amended Revolving Facility”). The Amended Revolving Facility is secured, subject to certain customary carve-outs and exceptions, by a first priority lien and security interest in substantially all of our tangible and intangible assets.
| 19 |
As of December 31, 2017, the outstanding principal balance due under our Credit Agreement was $240.0 million. Our outstanding indebtedness and any additional indebtedness we incur may have important consequences for us, including, without limitation, that:
| § | we may be required to use a substantial portion of our cash flow to pay the principal of and interest on our indebtedness; |
| § | our indebtedness and leverage may increase our vulnerability to adverse changes in general economic and industry conditions, as well as to competitive pressures; |
| § | our indebtedness may expose us to the risk of increased interest rates because certain of our borrowings are and will be at variable interest rates; |
| § | our ability to obtain additional financing for working capital, capital expenditures, acquisitions and for general corporate and other purposes may be limited; |
| § | our indebtedness and leverage may prevent us from taking advantage of business opportunities as they arise or successfully carrying out our plans to expand our business; and |
| § | our flexibility in planning for, or reacting to, changes in our business and our industry may be limited. |
Under the Credit Agreement, we are also required to comply with specified financial and operating covenants, which may limit our ability to operate our business as we otherwise might operate it. The Amended Revolving Facility contains (i) certain affirmative covenants that impose certain reporting and/or performance obligations on us and our restricted subsidiaries, (ii) certain negative covenants that generally limit, subject to various exceptions, us and our restricted subsidiaries from taking certain actions, including, without limitation, incurring indebtedness, creating liens, engaging in mergers and consolidations, disposing of certain assets or property, making certain investments and acquisitions, entering into certain transactions with affiliates, swap agreements or sale-leasebacks, making certain restricted payments, including dividends and share repurchases, changing our fiscal year or the lines of business that we or our restricted subsidiaries conduct to a material extent, and prepaying certain junior indebtedness, (iii) financial covenants consisting of a maximum consolidated leverage ratio and a minimum interest coverage ratio, and (iv) customary events of default for financings of this type.
Our obligations under the Amended Revolving Facility may be declared due and payable upon the occurrence and during the continuance of an event of default, which includes, without limitation: non-payment of principal or reimbursement obligation when due; non-payment of interest, fees and other amounts for a period of five business days after the due date; material inaccuracies of representations and warranties; failure to perform or observe covenants, conditions or agreements (subject to any applicable grace periods); cross-defaults to certain indebtedness; inability to pay debts; certain acts of bankruptcy or insolvency; certain ERISA events; failure to pay certain material judgments; and a change of control as defined in the Credit Agreement. If not cured, an event of default could result in any amounts outstanding, including any accrued interest and unpaid fees, becoming immediately due and payable, and would give our lenders the right to proceed against the collateral granted to them to secure the debt, which would require us to, among other things, seek additional financing in the debt or equity markets, refinance or restructure all or a portion of our indebtedness, sell selected assets, and/or reduce or delay planned capital or operating expenditures. Such measures might not be sufficient to enable us to service our debt, and any such financing or refinancing might not be available on economically favorable terms or at all. Our ability to make payments of principal and interest on our outstanding credit facility depends upon our future performance and our ability to generate cash flows, and if we are unable to generate sufficient cash flows to meet our debt service obligations or are forced to take additional measures to be able to service our indebtedness, our business, financial condition and results of operations could be materially and adversely affected.
Changes in, or interpretations of, tax rules and regulations may materially adversely affect our effective tax rates.
We are a United States-based company subject to various federal, state and local tax laws and regulations in multiple U.S. jurisdictions that govern numerous aspects of our business. As we expand our business, we may perform services for new customers located outside of the United States or in a U.S. Territory, which may subject us to foreign tax laws and regulations that could increase our exposure to additional tax liabilities. Our future effective tax rates could also be materially affected by changes in the tax rates in jurisdictions where our income is earned and taxed, by changes in, or our interpretation of, tax rules and regulations in the jurisdictions in which we do business, by increases in expenses not deductible for tax purposes including impairments of goodwill, by changes in U.S. GAAP or by changes in the valuation of our deferred tax assets and liabilities. The 2017 Tax Act was enacted on December 22, 2017 and is generally effective for tax years beginning after December 31, 2017. The 2017 Tax Act, among other things, includes a reduction to the U.S. corporate tax rate, modifications to the limitations on certain deductions for executive compensation, new limitations on interest deductions, repeal of the section 199 Deduction, and capital investment deductions in certain circumstances, and a shift of the U.S. taxation of multinational corporations from a tax on worldwide income to a territorial system. We are currently in the process of analyzing the effects of this new legislation on our business, and although we believe that the impact of the new legislation might be beneficial to us at this time, the ultimate outcome of the new legislation on our business and financial condition is uncertain. Any unanticipated changes in our tax rates could affect our future results of operations.
| 20 |
In addition, we are subject to the continual examination of our income tax returns by the IRS and other domestic tax authorities. We regularly assess the likelihood of outcomes resulting from these examinations to determine the adequacy of our provision for income taxes and have reserved for potential adjustments that may result. The final determination of any of these examinations could have a material adverse effect on our business, financial condition, results of operations and cash flows.
Our health insurance coverage and self-insurance reserves may not cover future claims, which could materially adversely affect our business, financial condition, results of operations and cash flows.
We maintain various insurance policies for company employee health, workers’ compensation, general liability and property damage. We are self-insured for our health plans, and have purchased a fully-insured stop loss policy to help offset our liability for both individual and aggregate claim costs. We are also responsible for losses up to a certain limit for workers’ compensation, general liability and property damage insurance.
For policies under which we are responsible for losses, we record a liability that represents our estimated cost of claims incurred and unpaid as of the balance sheet date. Our estimated liability is not discounted and is based on a number of assumptions and factors, including historical trends, actuarial assumptions and economic conditions, and is closely monitored and adjusted when warranted by changing circumstances. Our prior growth could affect the accuracy of estimates based on historical experience. Should a greater amount of claims occur compared to what was estimated or medical costs increase beyond what was expected, our accrued liabilities might not be sufficient and we may be required to record additional expense. Unanticipated changes may also produce materially different amounts of expense than reported under these programs, which could materially adversely affect our business, financial condition, results of operations and cash flows.
Although we believe that we have remediated previously identified material weaknesses in our internal control over financial reporting, our financial statements could be materially misstated if we fail to remedy other material weaknesses that we may identify in the future, or if we are unable to develop, implement and maintain effective internal control over financial reporting in future periods.
In connection with management’s assessment of our internal control over financial reporting for the December 31, 2016 reporting period, we identified material weaknesses related to the calculation of the estimated liability for appeals balance in connection with our CMS reserve and the valuation of our accounts receivable allowance. As further described under the heading “Changes in Internal Control Over Financial Reporting” in Part II, Item 9A of this 2017 Form 10-K, we have implemented measures to address these material weaknesses and have successfully completed the testing necessary to conclude that the material weaknesses have been remediated.
In future periods, these remedial measures may not operate effectively, or we may fail to design or implement effective controls or to otherwise maintain effective internal control over financial reporting, and additional material weaknesses or significant deficiencies in our internal control over financial reporting may occur or be discovered. As a result, we may fail to meet our future reporting obligations on a timely basis, our financial statements may contain material misstatements or our operating results or financial condition may otherwise be negatively impacted, and we may be subject to litigation and regulatory actions, any of which may cause us to incur substantial costs, adversely affect investor perceptions and potentially result in a decline in the market price of our common stock. In addition, these failures may also cause us to incur substantial additional costs in future periods relating to the implementation of remedial measures or limit our ability to obtain financing under our Credit Agreement, which could adversely impact our business, financial condition, results of operations and cash flows.
| 21 |
Risks Relating to Our Industry
Our business could be materially adversely affected by changes in the U.S. healthcare environment or in laws relating to healthcare programs and policies, particularly as they relate to the ACA and the Medicare and Medicaid programs.
The healthcare industry in which we operate is subject to changing political, economic and regulatory influences that directly affect the practices and operations of federal, state and commercial healthcare organizations in the United States. In March 2010, the ACA was passed, and its emphasis on program integrity and cost containment, along with its expansion of Medicaid, created new opportunities to grow our business and our service offerings. However, some of the provisions of the ACA have yet to be implemented and there have been a number of judicial and legal challenges to certain aspects of the ACA. Since January 2017, the President has signed two executive orders and other directives designed to waive, defer, grant exemptions from or delay the implementation of certain requirements mandated by the ACA. Concurrently, Congress has considered legislation that would repeal or repeal and replace all or part of the ACA. In December 2017, the Tax Act was enacted and signed into law, one part of which repeals the “individual mandate” introduced by the ACA effective January 1, 2019. There have also been a number of proposed and adopted legislative initiatives and healthcare reform proposals from state and federal governments, including, (i) initiatives and proposals that would fundamentally change the financial structure of the Medicaid program (currently funded jointly by the states and the U.S. Federal Government) that could result in early termination or non-renewal of our contracts with certain state government customers, and (ii) initiatives and proposals at the federal level that may reduce reimbursement rates to states, establish new payment models, increase or decrease government involvement in healthcare, decrease the Medicare RAC Program, or otherwise change the operating environment for our customers. Healthcare organizations may react to such changed circumstances and financial pressures by taking actions to ramp up, curtail or defer their retention of cost containment providers like us, which could impact the demand for our solutions and services and our ability to increase or maintain sales of our existing solutions and services. While certain changes may present new opportunities to us, our business, financial condition, results of operations and cash flows could be materially adversely affected if we are unable to adapt our solutions and services to meet changing requirements or expand service delivery into new areas, or if the demand for our solutions and services is reduced as a result of efforts to waive, modify or otherwise change the ACA, in whole or in part, and as a result of other future legislative changes affecting Medicare, Medicaid or other publicly funded or subsidized health programs. Although we will continue to evaluate the effect that the ACA and its possible repeal and replacement may have on our business, it is difficult to predict the full impact and influence that the ACA and the varying healthcare reform measures may have on the U.S. healthcare industry or policy, and any resulting changes may take time to unfold.
Healthcare spending fluctuations, simplification of the healthcare payment process or other aspects of the healthcare financing system, budgetary pressures and/or programmatic changes diminishing the scope of program benefits, or limiting payment integrity initiatives, could reduce the need for and the price of our solutions and services, which would have a material adverse effect on our business, financial condition, results of operations and cash flows.
Our projections and expectations are premised, in part, upon consistent growth rates in the Medicare and Medicaid programs and in government spending on these programs, and in the current healthcare financing system and the need for our solutions and services within that existing framework. Our success as a company is based on offering solutions and services that improve the ability of our customers to identify and recover revenue that would otherwise be lost often as a result of procedural inefficiencies and complexities in the healthcare delivery and payment system. However, the need for our solutions and services, the price customers are willing to pay for them and the scope and profitability of our contracts could be negatively affected by a number of factors, including, but not limited to:
| § | a lower than projected growth in Medicare and Medicaid programs and expenditures; |
| § | the simplification of the healthcare benefit and payment system through legislative or regulatory changes at the federal or state level (for example, legislative changes impacting the scope of mandatory audits; limiting or reducing the amount of reviewable claims and/or the look-back period for review in areas where we conduct audits); |
| § | changes in the level of federal government spending due to budgetary or deficit considerations, including the continuance of existing programs, as well as budgetary pressures that may drive changes at the state level; |
| § | the transition of healthcare beneficiaries from fee-for-service plans to value-based plans; |
| 22 |
| § | unanticipated reductions in the scope of healthcare program benefits (such as, for example, state decisions to eliminate coverage of optional Medicaid populations or services or shifting lives into managed care plans); |
| § | modifications in provider billing behavior and habits, often in response to the success of our solutions and services or to changes that reduce healthcare spending; |
| § | customer improvements and enhancements to their internal healthcare claims and billing processes; |
| § | the adoption of healthcare plans with significantly higher deductibles; |
| § | limits placed on ongoing program integrity initiatives, including the Medicare RAC program; and |
| § | legislative healthcare reforms and developments, including the absence of near-term compliance deadlines effected by the ACA, the possible repeal or modification of the ACA, and other legislative actions to reduce program eligibility or services, or reform Medicaid spending. |
For example, during 2014 and 2015, our recovery audit services under HDI’s Medicare RAC contract were limited because of significant delays in procurement activities for the new Medicare RAC contract awards, resulting from, in part, the cancellation of the original and second procurements following the denial of pre-award protests and ongoing litigation regarding certain payment terms proposed by CMS as part of the new Medicare RAC proposals. In response to the delays, CMS allowed the Medicare RAC contractors, including HDI, to perform active recovery auditing through July 2016 and certain limited administrative activities, including collections, related to findings through January 31, 2018.
In October 2016, CMS announced the new Medicare RAC contract awards, including the award of RAC Region 4 to our wholly owned subsidiary. Under the new Medicare RAC contracts, CMS implemented modified ADR limits that reduces the ADR requirement to 0.5%. The modified ADR limits, which CMS first announced in January 2016, is a 75% reduction from the 2.0% ADR limit established for the HDI Medicare RAC contract. In addition, in April 2016, CMS instituted a sliding scale policy adjusting ADR limits based on provider denial rate after three 45-day ADR cycles. In January 2018, CMS further modified this methodology, indicating that underpayments identified by the RAC would be precluded from the sliding scale policy. These changes have significant impact on the volumes of claims that Medicare RACs are permitted to review for inpatient providers and reduces their ability to identify overpayments and underpayments under the new Medicare RAC contracts. HMS is currently waiting for CMS to operationalize the sliding scale under the new Medicare RAC contract, which is expected to increase the current ADR limit to a requirement less than the 2.0% limit that was previously set under the prior contracts.
Further, in connection with our first Medicare RAC contract, CMS announced in 2014 that it would settle with hospitals willing to withdraw inpatient status claims currently pending in the RAC appeals process by offering to pay hospitals 68% for all eligible claims they had billed to Medicare. In June 2015, CMS notified HDI that based on the initial lists of finalized settlements, HDI owed CMS approximately $28.6 million due to adjustments in contingency fees under our existing Medicare RAC contract. HDI previously advised CMS that it disagrees with CMS’ interpretation of the contract and that CMS does not have the contractual right, among other things, to require refunding fees already paid. In addition, in September 2016, CMS announced that it would extend an opportunity for another round of settlements for hospitals that were eligible for but did not choose to participate in the 2014 settlement, with CMS offering to pay 66% for all eligible claims they had billed to Medicare. The implication of these settlements related to the claims for which HDI already has been paid remains uncertain.
Although we do not anticipate that our new Medicare RAC contract will represent a significant portion of our business going forward, our Medicare RAC contract still represents a future business opportunity for us. However, there could be a material negative impact on our future revenue to the extent that (i) any final determination of amounts owed by us to CMS under HDI’s Medicare RAC contract materially exceeds our accrued reserves for such appeals, (ii) we are required to increase or decrease our contractually required reserves with respect to pending appeals due to changes in appeal performance, changes in data provided to us from other entities in the RAC process, or other related factors, (iii) we are required to repay a portion of prior fees associated with the hospital settlements, (iv) we are unable to obtain full payments for properly provided services, or (v) future fees payable to us by CMS are reduced. The occurrence of any of these events or other changes to the Medicare RAC program that materially reduce our revenue or profitability with such program may have an adverse effect on our future business, financial condition, results of operations and cash flows.
| 23 |
A failure to comply with the laws and regulations that apply to companies in our industry regarding individual privacy and information security could subject us to legal actions, fines and penalties and negatively impact our reputation and operations.
As a service provider, we often receive, process, transmit and store sensitive data, including PHI and personally identifiable information of individuals, as well as other financial, confidential and proprietary information belonging to our customers, subsidiaries, data supplies and other third parties from which we obtain information. The use and disclosure of that information is regulated at the federal, state, international and industry levels and we are also obligated by our contractual requirements with customers. For example, we are subject to federal regulation under HIPAA, as amended by HITECH, and the Final Omnibus Privacy, Security, Breach Notification, and Enforcement Rule, as well as various state laws. HIPAA also imposes standards and requirements on our business associates (as defined under HIPAA).
Even though we take measures to comply with all applicable regulations and to ensure our business associates and subcontractors comply with these laws, regulations and rules, we have less than complete control over our business associates’ and subcontractors’ actions and practices. We may be exposed to data breach risk if there is unauthorized access to one of our or our subcontractors’ secure facilities or from lost or stolen laptops or other portable media from current or former employee theft of data containing PHI, from computer hacking, malware, computer viruses or other malicious codes, phishing or other cyber-attacks, from misdirected mailings containing PHI, or other forms of administrative or operational error. If we or our subcontractors fail to comply with applicable laws; if unauthorized parties gain physical access to one of our facilities and steal or misuse confidential information; if we erroneously use or disclose data in a way that is inconsistent with our granted rights; or if such information is misdirected, lost or stolen during transmission or transport, we may suffer damage to our reputation, potential loss of existing customers and difficulty attracting new customers. We could also be exposed to, among other things, unfavorable publicity, governmental inquiry and oversight, allegations by our customers that we have not performed our contractual obligations, costs to provide notifications to affected individuals, fines or other penalties imposed by government regulatory agencies, or litigation by affected parties and possible financial obligations for damages or indemnification obligations related to the theft or misuse of such information, any of which could have a material adverse effect on our business, financial condition, results of operations and cash flows.
In addition, laws, rules and regulations concerning the protection of personal information are subject to frequent change by legislation, regulatory issuances or administrative interpretation. As regulatory focus on privacy issues continues to increase and these laws and regulations continue to expand and become more complex, these potential risks to our business could intensify. Changes in laws or regulations associated with the enhanced protection of certain types of sensitive data, such as healthcare data or other personally identifiable information, along with increased customer demands for enhanced data security infrastructure, could greatly increase our cost of providing our solutions and services, and may subject us to additional liabilities.
We are subject to extensive government regulation, including government and customer audits and investigations relating to our compliance with the laws and regulations applicable to companies in our industry, and a negative finding or other adverse determination could have a material adverse effect on our reputation, business, financial condition, results of operations and cash flows.
Much of our business is regulated by the federal government and the states in which we operate. The laws and regulations governing our operations are generally intended to benefit and protect individual citizens, including government program beneficiaries, other health plan members and providers, and the federal and state governmental agencies administering these laws and regulations have broad latitude to enforce them. As such, we are subject, on an ongoing basis, to various governmental and customer reviews, audits and investigations to verify our compliance with our contracts and applicable laws and regulations, as well as legal actions and enforcement proceedings. For example, because we receive payments from federal and state governmental agencies, we are subject to laws, such as the Federal Acquisition Regulations, the U.S. Foreign Corrupt Practices Act, federal and state employment, equal opportunity and affirmative action laws, and federal and state prompt pay statutes. We are also subject to the Federal False Claims Act and similar state statutes, which permit government law enforcement agencies to institute suits against us for violations and, in some cases, to seek double or treble damages, penalties and assessments. In addition, private citizens, acting as whistleblowers, can sue on behalf of the government under the “qui tam” provisions of the Federal False Claims Act and similar statutory provisions in many states.
| 24 |
As we expand into new areas of the healthcare industry, we may develop new or enhanced solutions that may further expose us to requirements under additional statutes and legislative schemes that have previously not been relevant to our business, such as banking and credit reporting statutes. For example, in connection with our acquisition of Eliza, we became subject to the Telephone Consumer Protection Act of 1991, state and federal audio and telephone recording laws, and other related state and federal laws and regulations as a result of the member engagement services that we perform. Increased involvement in analytic or audit work that can have an impact on the eligibility of individuals for medical coverage or specific benefits, or payments made by our customers to providers, could increase the likelihood and incidence of our being subjected to scrutiny or legal actions by parties other than our customers, based on alleged mistakes or deficiencies in our work, with significant resulting costs and strain on our resources.
These laws and regulations, along with the terms of our government contracts, regulate how we do business, what solutions and services we offer and how we interact with customers, providers, other healthcare payers and the public. If the government discovers improper or illegal activities in the course of audits or investigations, we may be subject to various civil and criminal penalties and administrative sanctions, which may include termination of contracts, forfeiture of profits, suspension of payments, fines and suspensions and debarment from doing business with the government. Similarly, if our customers assert that we have failed to properly perform or comply with our contractual obligations, or if the carriers to which we send billings assert that we have failed to properly comply with applicable federal or state billing rules and regulations, we may be required to provide refunds or make payments to resolve such issues. If we are found to be in violation of any applicable law or regulation, or if we receive an adverse review, audit or investigation from a government agency or customer related to our compliance with such laws or regulations or the terms of our government contracts, any resulting negative publicity, penalties or sanctions could have an adverse effect on our reputation in the industry, impair our ability to compete for new contracts or bid in response to RFPs in one or more jurisdictions and have a material adverse effect on our business, financial condition, results of operations and cash flows.
Federal and state governments may limit or prohibit outsourcing of certain programs or functions, refuse to grant consents or waivers necessary to permit private entities to perform such work, or impose other limitations on outsourcing or certain vendors that may obstruct cost-effective performance of our contracts.
Federal or state governments could limit or prohibit private contractors like us from operating or performing elements of certain government functions or programs. As a condition of receiving federal funding, state, and local governments may be required to operate such programs with government employees. Under current law, in order to privatize certain functions of government programs, the federal government must grant a consent and/or waiver to the petitioning state or local agency. If the federal government does not grant a necessary consent or waiver, the state or local agency will be unable to outsource that function to a commercial entity. Such a situation could eliminate a contracting opportunity or reduce the value of an existing contract.
Similarly, other state or federal limitations on outsourcing certain types of work to vendors that supplement our workforce could make it more difficult for us to fulfill our contracts in a cost-effective manner. Certain areas of our operations use or involve vendor or subcontractor personnel located outside of the United States, who may (under carefully controlled circumstances) access certain PHI in the course of assisting us with various elements of the services we provide to our customers. The federal government and a number of states have considered laws or issued rules, regulations, and orders that would limit, restrict or wholly prohibit the use of offshore labor in performance of government contracts, or impose sanctions for the use of such resources. Some of our customers have already chosen to contractually limit or restrict our ability to use offshore resources. Intensified restrictions of this type or associated penalties could raise our costs of doing business, expose us to unexpected fines or penalties, increase the prices we must charge to customers to realize a profit and eliminate or significantly reduce the value of existing contracts or potential contract opportunities, any of which could have a material adverse effect on our business, financial condition, results of operations and cash flows.
| 25 |
We may be precluded from bidding on or performing certain work due to work we currently perform, which could materially adversely affect our business, financial condition, results of operations and cash flows.
Various laws, regulations and administrative policies prohibit companies from performing work for government agencies in capacities that might be viewed to create an actual or perceived conflict of interest. In particular, CMS has stringent conflict of interest rules, which can limit our bidding for specific work for CMS, or for other contracts that might conflict, or be perceived by CMS to conflict, with contractual work for CMS. State governments and managed care organizations also have conflict of interest restrictions that could limit our ability to bid for certain work and impede our overall sales strategy. As we continue to expand and diversify our business operations, the likelihood that customers or potential customers will perceive conflicts of interest between our various subsidiaries, solutions, services, activities and customer relationships may increase. Such conflicts, whether real or perceived, could result in a loss of contracts or additional internal structural barriers that delay operational efficiency. We may also need to divest certain existing businesses or reorganize our current management and personnel structure, as well as our corporate organization and entity structure, in order to qualify for new contract awards or to appropriately mitigate conflicts and otherwise accommodate the needs as a company that is expanding in complexity. Our failure to devote sufficient care, attention and resources to managing these adjustments may result in technical or administrative errors that could expose us to potential liability or adverse regulatory action. In addition, conflict of interest rules and standards change frequently, and are subject to varying interpretations and varying degrees and consistency of enforcement. We may not be successful in navigating these restrictions. If we are prevented from expanding our business or are unable to effectively implement our strategic initiatives due to real or perceived conflicts of interest, our business, financial condition, results of operations and cash flows could be materially adversely affected.
Risks Related to Our Common Stock
The market price of our common stock may be volatile, and fluctuations in the price of our common stock may materially adversely affect our business, financial condition, results of operations and cash flows and materially adversely affect our shareholders.
The market price of our common stock has fluctuated widely and may continue to do so. During the 52-week period ended December 31, 2017, our common stock intra-day traded on the Nasdaq Global Select Market as high as $20.90 per share and as low as $11.01 per share. Our stock price is subject to fluctuation as a result of a variety of factors, including factors beyond our control, such as the risk factors described above and those which are related to:
| § | quarterly or annual earnings results or those of other companies in our industry; |
| § | changes in estimates of our performance or recommendations by securities analysts or in the operating and stock price performance of other companies that investors deem comparable to our company; |
| § | news reports relating to trends, concerns and other issues in the healthcare industry, including perceptions in the marketplace regarding us and our competitors; |
| § | the financial projections we publicly provide and any changes in or failure to meet those projections; |
| § | future sales of shares of common stock in the public market by our executive officers or directors; |
| § | any other changes in the amount of our outstanding shares, including as a result of share repurchases; |
| § | actual or proposed changes in federal or state laws affecting the healthcare industry; |
| § | changes in accounting principles; |
| § | the public’s response to our press releases, or other public announcements, including our filings with the SEC; |
| § | securities class actions, shareholder lawsuits or other litigation; and |
| § | market conditions in the industry and the economy as a whole. |
In addition, the stock market often experiences significant price and volume fluctuations. These broad market fluctuations may materially adversely affect the market price of our common stock regardless of our operating performance. When the market price of a company’s stock drops significantly, shareholders may institute securities class action litigation against that company. Any litigation against us could cause us to incur substantial costs, divert the time and attention of our management and other resources or otherwise harm our business.
| 26 |
Because we do not intend to pay dividends, you will benefit from an investment in our common stock only if it appreciates in value.
We have not paid or declared cash dividends on any of our capital stock to date and currently intend to retain our future earnings, if any, to fund the development and continued growth of our business and repurchase shares opportunistically from time to time. As a result, we do not expect to pay any cash dividends in the foreseeable future. The success of your investment in our common stock will likely depend entirely upon any future appreciation. There is no guarantee that our common stock will appreciate in value or even maintain the price at which you purchased your shares.
Certain provisions of our certificate of incorporation and bylaws could discourage unsolicited takeover attempts, which could depress the market price of our common stock.
Our certificate of incorporation authorizes the issuance of up to 5,000,000 shares of “blank check” preferred stock with such designations, rights and preferences as may be determined by our Board of Directors. Accordingly, our Board of Directors is empowered, without shareholder approval, to issue preferred stock with dividend, liquidation, conversion, voting or other rights, that could adversely affect the voting power or other rights of holders of our common stock. In the event of issuance, preferred stock could be utilized, under certain circumstances, as a method of discouraging, delaying, or preventing a change in control. Although we have no present intention to issue any shares of preferred stock, it is possible that we will do so in the future. In addition, our bylaws currently provide for a classified Board of Directors, require advance notice of shareholder proposals for business to be conducted at meetings of our shareholders and for nominations of candidates for election to our Board of Directors and provide for Delaware as an exclusive forum for certain disputes with our shareholders, all of which could also have the effect of discouraging a change of control.
Item 1B. Unresolved Staff Comments
None.
| Location | Approximate Square Footage | Owned/Leased | ||||
| Irving, TX | 242,260 | Owned | ||||
| Las Vegas, NV | 63,593 | Leased | ||||
| Westerville, OH | 25,212 | Leased | ||||
| Irvine, CA | 23,790 | Leased | ||||
| New York , NY | 12,259 | Leased | ||||
| Charlestown, MA | 13,628 | Leased | ||||
| All Other Locations | 77,914 | Leased | ||||
As of December 31, 2017, we leased approximately 111,000 square feet of office space in 20 other locations throughout the United States, the leases for which have expiration dates through 2024. See “Lease Commitments” in Note 13 to the Consolidated Financial Statements in Part II, Item 8 for additional information. In general, we believe our facilities are suitable to meet our current and reasonably anticipated future needs.
The information set forth under the caption “Litigation” in Note 13 to the Consolidated Financial Statements in Part II, Item 8 is incorporated herein by reference.
Item 4. Mine Safety Disclosures
Not applicable.
| 27 |
PART II
Item 5. Market for Registrant’s Common Equity, Related Shareholder Matters and Issuer Purchases of Equity Securities
Market Information
Our common stock is included in the Nasdaq Global Select Market, under the symbol HMSY. The table below summarizes the high and low closing sales prices per share for our common stock for the periods indicated, as reported on the Nasdaq Global Select Market.
| Quarter Ended | March 31, | June 30, | September 30, | December 31, | ||||||||||||
| Fiscal Year 2017 | ||||||||||||||||
| High | $ | 20.33 | $ | 20.68 | $ | 20.15 | $ | 20.32 | ||||||||
| Low | $ | 17.76 | $ | 17.91 | $ | 17.36 | $ | 15.55 | ||||||||
| Fiscal Year 2016 | ||||||||||||||||
| High | $ | 14.42 | $ | 18.38 | $ | 23.46 | $ | 22.03 | ||||||||
| Low | $ | 10.22 | $ | 13.67 | $ | 17.44 | $ | 16.18 | ||||||||
Repurchases of Shares of Common Stock
See “Equity’ in Note 9 to the Consolidated Financial Statements in Part II, Item 8 for additional information regarding share repurchases. The following are our monthly stock repurchases for the fourth quarter of fiscal year 2017, all of which were made as part of publicly announced plans or programs:
| Period | Total Number of Shares Purchased | Average Price Paid Per Share | Total Number of Shares Purchased as Part of Publicly Announced Program(1) | Maximum Approximate Dollar Value of Shares That May Yet Be Purchased Under the Program | ||||||||||||
| October 1, 2017 to October 31, 2017 | — | $ | — | — | $ | — | ||||||||||
| November 1, 2017 to November 30, 2017 | 674,813 | 16.23 | 674,813 | 39,044,882 | ||||||||||||
| December 1, 2017 to December 31, 2017 | 190,502 | 16.61 | 190,502 | 35,880,666 | ||||||||||||
| October 1, 2017 to December 31, 2017 | 865,315 | $ | 16.33 | 865,315 | ||||||||||||
| (1) | On November 1, 2017, the Board of Directors of the Company approved a share repurchase program authorizing the Company to repurchase up to $50.0 million of shares of its common stock from time to time on the open market or in privately negotiated or other transactions. We publicly announced the program in November 2017. The repurchase program is authorized for a period of up to two years, and may be suspended or discontinued at any time. In order to facilitate repurchases, the Company may enter into a Rule 10b5-1 plan from time to time, which would permit shares to be repurchased when the Company might otherwise be precluded from doing so under insider trading laws or because of a self-imposed trading blackout period. All repurchases for the periods presented were made under the program and using cash resources. |
| 28 |
Holders
As of the close of business on February 16, 2018, there were 263 holders of record of our common stock.
Dividends
We have not paid or declared any cash dividends on our common stock and do not anticipate paying cash dividends in the foreseeable future. Our current intention is to retain future earnings to support the continued growth of our business and possibly for the repurchase of shares from time to time. Our Board of Directors will evaluate various factors, including, without limitation, our future earnings, operating cash flows, financial condition, results of operations and capital requirements in determining whether to pay any cash dividends in the future. In addition, our Credit Agreement generally limits, subject to certain exceptions, our ability to make certain payments or distributions with respect to our capital stock, including cash dividends to our shareholders. These restrictions are described in more detail under the headings “Credit Agreement” and “Liquidity and Capital Resources” in Part II, Item 7. Management’s Discussion and Analysis of Financial Condition and Results of Operations, and in Note 8 to the Consolidated Financial Statements in Part II, Item 8.
| 29 |
Comparative Stock Performance Graph
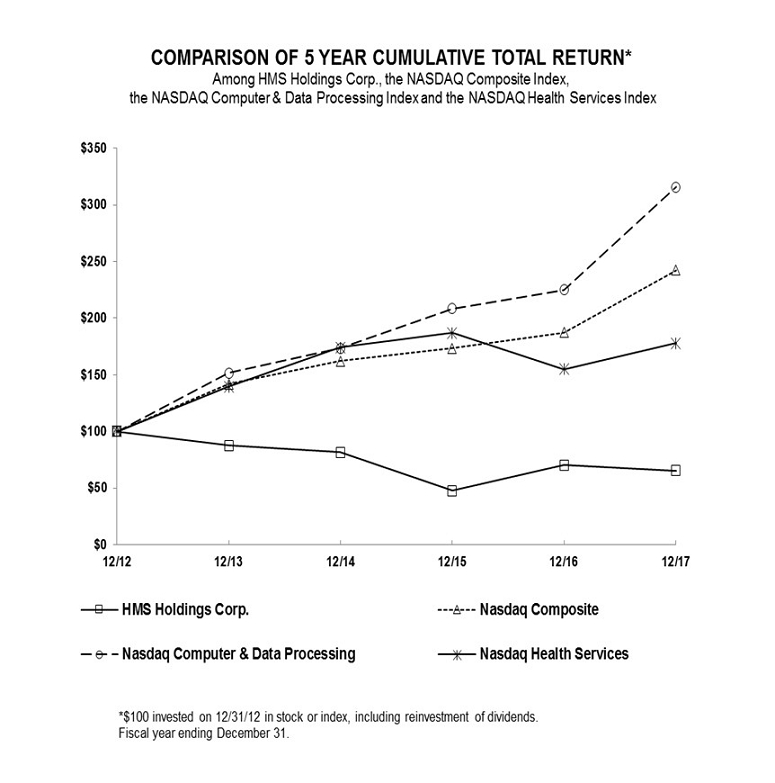
The graph below compares the cumulative total shareholder return on our common stock with the cumulative total shareholder returns of the Nasdaq Composite Index, the Nasdaq Computer & Data Processing Index and the Nasdaq Health Services Index assuming an investment of $100 on December 31, 2012 and the reinvestment of dividends through the year ended December 31, 2017.
| 12/31/12 | 12/31/13 | 12/31/14 | 12/31/15 | 12/31/16 | 12/31/17 | |||||||||||||||||||
| HMS Holdings Corp. | $ | 100.00 | $ | 87.58 | $ | 81.56 | $ | 47.61 | $ | 70.06 | $ | 65.39 | ||||||||||||
| Nasdaq Composite | $ | 100.00 | $ | 141.63 | $ | 162.09 | $ | 173.33 | $ | 187.19 | $ | 242.29 | ||||||||||||
| Nasdaq Computer & Data Processing | $ | 100.00 | $ | 151.54 | $ | 173.50 | $ | 208.25 | $ | 224.83 | $ | 315.58 | ||||||||||||
| Nasdaq Health Services | $ | 100.00 | $ | 139.64 | $ | 173.97 | $ | 187.09 | $ | 155.05 | $ | 177.93 | ||||||||||||
Notwithstanding anything to the contrary set forth in any of our previous or future filings under the Securities Act or the Exchange Act that might incorporate by reference this 2017 Form 10-K or future filings made by us under those statutes, the Comparative Stock Performance Graph is not deemed filed with the SEC, is not deemed soliciting material and shall not be deemed incorporated by reference into any of those prior filings or into any future filings we make under those statutes, except to the extent that we specifically incorporate such information by reference into a previous or future filing, or specifically request that such information be treated as soliciting material, in each case under those statutes.
| 30 |
Item 6. Selected Financial Data
The following table sets forth selected consolidated financial amounts at and for each of the five fiscal years in the period ended December 31, 2017. It should be read in conjunction with Part II, Item 7. Management’s Discussion and Analysis of Financial Condition and Results of Operations, and the Consolidated Financial Statements and Notes thereto, in Part II, Item 8 of this 2017 Form 10-K.
Statement of Operations Data
| Years ended December 31, | ||||||||||||||||||||
| (in thousands, except per share amounts) | 2017 | 2016 | 2015 | 2014 | 2013 | |||||||||||||||
| Revenue | $ | 521,212 | $ | 489,720 | $ | 474,216 | $ | 443,225 | $ | 491,762 | ||||||||||
| Total operating expenses | 470,781 | 432,051 | 426,644 | 409,021 | 414,584 | |||||||||||||||
| Operating income | 50,431 | 57,669 | 47,572 | 34,204 | 77,178 | |||||||||||||||
| Interest expense | (10,871 | ) | (8,519 | ) | (7,812 | ) | (7,931 | ) | (12,460 | ) | ||||||||||
| Interest income | 295 | 321 | 49 | 57 | 71 | |||||||||||||||
| Other income, net | — | — | — | — | 801 | |||||||||||||||
| Income before income taxes | 39,855 | 49,471 | 39,809 | 26,330 | 65,590 | |||||||||||||||
| Income taxes | (199 | ) | 11,835 | 15,282 | 12,383 | 25,593 | ||||||||||||||
| Net income | $ | 40,054 | $ | 37,636 | $ | 24,527 | $ | 13,947 | $ | 39,997 | ||||||||||
| Net Income Per Common Share | ||||||||||||||||||||
| Basic income per common share: | ||||||||||||||||||||
| Net income per common share - basic | $ | 0.48 | $ | 0.45 | $ | 0.28 | $ | 0.16 | $ | 0.46 | ||||||||||
| Diluted income per common share: | ||||||||||||||||||||
| Net income per common share - diluted | $ | 0.47 | $ | 0.43 | $ | 0.28 | $ | 0.16 | $ | 0.45 | ||||||||||
| Weighted average shares: | ||||||||||||||||||||
| Basic | 83,821 | 84,221 | 87,881 | 87,673 | 87,598 | |||||||||||||||
| Diluted | 85,088 | 86,987 | 88,361 | 88,164 | 88,344 | |||||||||||||||
Balance Sheet Data
| Years ended December 31, | ||||||||||||||||||||
| (in thousands) | 2017 | 2016 | 2015 | 2014 | 2013 | |||||||||||||||
| Cash and cash equivalents | $ | 83,313 | $ | 175,999 | $ | 145,610 | $ | 133,116 | $ | 93,366 | ||||||||||
| Working capital | $ | 199,967 | $ | 277,478 | $ | 240,456 | $ | 226,271 | $ | 199,069 | ||||||||||
| Total assets | $ | 975,160 | $ | 882,755 | $ | 850,597 | $ | 880,988 | $ | 878,602 | ||||||||||
| Revolving credit facility | $ | 240,000 | $ | 197,796 | $ | 197,796 | $ | 197,796 | $ | 232,796 | ||||||||||
| Total shareholders' equity | $ | 606,229 | $ | 556,610 | $ | 524,702 | $ | 533,090 | $ | 502,439 | ||||||||||
| 31 |
Item 7. Management’s Discussion and Analysis of Financial Condition and Results of Operations
The following Management’s Discussion and Analysis is intended to help the reader understand the results of operations and financial condition of HMS. You should read this discussion and analysis in conjunction with the other sections of this 2017 Form 10-K, including the Cautionary Note Regarding Forward-Looking Statements appearing prior to Part I, the information in Part I, Item 1A, and the Consolidated Financial Statements and Notes thereto in Part II, Item 8. The historical results set forth in Part II, Item 6, Item 7 and Item 8 of this 2017 Form 10-K should not be taken as necessarily indicative of our future operations or financial results.
Business Overview
HMS is a leading provider of cost containment solutions in the U.S. healthcare marketplace. Using innovative technology as well as extensive data services and powerful analytics, we deliver coordination of benefits, payment integrity and care management and consumer engagement solutions through our operating subsidiaries to help healthcare payers improve performance and outcomes. We are managed and operate as one business segment with a single management team that reports to the Chief Executive Officer. Together our various services help our customers recover improper payments; prevent future improper payments; reduce fraud, waste and abuse; better manage the care that members receive; engage healthcare consumers to improve outcomes and increase retention; and achieve regulatory compliance.

We serve state Medicaid programs, commercial health plans, federal government health agencies, government and private employers, CHIPs and other healthcare payers and sponsors. We also serve as a subcontractor for certain business outsourcing and technology firms. As of December 31, 2017, our customer base included the following:
| § | over 40 state Medicaid programs; |
| § | approximately 325 health plans, including 23 of the top 25 health plans nationally (based on membership) in support of their multiple lines of business, including Medicaid managed care, Medicare Advantage and group and individual health; |
| § | over 225 private employers; |
| § | CMS, the Centers for Disease Control and Prevention, and the Department of Veterans Affairs; and |
| § | PBMs, third-party administrators and other risk-bearing entities, including independent practice associations, hospital systems, ACOs and specialty care organizations. |
Outlook
We have grown our business both organically, through internal innovation and the development of new products and services, as well as by acquisition of businesses whose core services strengthened our overall mission to help our customers contain healthcare costs. Our largest growth during 2017 was with commercial health plan customers, both organically and via the acquisition of Eliza, and we currently expect this marketplace to present the greatest opportunity for growth in the year ahead. In addition to cross-sales of care management and consumer engagement solutions and other internal growth initiatives in 2018, various factors related to the macro healthcare environment are expected to contribute to our expected growth, including:
| § | an aging U.S. population with high-cost, chronic conditions and often co-morbidities. |
| § | projected growth in Medicare enrollment from 2016 to 2025 is estimated by CMS to be at 28%, with a projected increase in spending of 88% during this same time period; |
| § | Medicaid expenditures are projected to grow 64% from 2016 to 2025 based on CMS NHE projections; |
| § | government program payment error rates remain high at approximately 10%; |
| § | more than half of the U.S. population is projected by CMS to remain covered by employer-sponsored plans; and |
| § | increased healthcare industry focus on improved population health, enhanced consumer outcomes and experience, and reduced costs. |
| 32 |
We plan to drive our future growth by leveraging our expertise to expand product offerings, attracting new customers and broadening our relationships with current customers through the introduction of new services, audit strategies and claim types. Our goal is to develop and build on existing partnerships with our state, federal and commercial health plan customers to provide services that better address their business needs and promote consumer engagement and satisfaction in the constantly evolving healthcare marketplace. We also expect to continue increasing recovery yields from our current products by enhancing our operating and organizational efficiency and by implementing new big data technologies that will improve the quality and effectiveness of our service offerings.
Critical Accounting Policies and Estimates
Our consolidated financial statements are prepared in accordance with U.S. GAAP. The preparation of these consolidated financial statements requires us to make estimates and assumptions that affect the reported amounts of assets, liabilities, revenue, costs and expenses, and related disclosures. We evaluate our estimates and assumptions on an ongoing basis. Our estimates are based on historical experience and various other assumptions that we believe to be reasonable under the circumstances. Our actual results could differ from these estimates. The accounting policies that we believe to be the most critical to an understanding of our financial condition and results of operations and that require the most complex and subjective management judgments are below:
Revenue Recognition
|
Description |
Judgments and Uncertainties |
Effect if Actual Results Differ from Assumptions |
| We provide services under contracts that contain various fee structures, including contingency fee and fixed fee arrangements. Revenue is recognized when a contract exists, services have been provided to the customer, the fee is fixed and determinable, and collectability is reasonably assured. In addition, the Company has a limited number of contracts with the federal government which are generally cost-plus or time and materials based. Revenue on cost-plus contracts is recognized based on costs incurred plus the negotiated fee earned. Revenue on time and materials contracts is recognized based on hours worked and expenses incurred. In addition, some of our contracts may include customer acceptance provisions. | Formal customer sign-off is not always necessary to recognize revenue, provided we objectively demonstrate that the criteria specified in the acceptance provision are satisfied. Due to the range of products and services that HMS provides and the differing fee structures associated with each type of contract, revenue may be recognized in irregular increments. A portion of our revenue is recorded net of an estimate of future revenue adjustments, with an offsetting entry to accounts receivable allowance, based on historical patterns of billing adjustments, length of operating and collection cycle and customer negotiations, behaviors and payment patterns. Changes in these estimates are recorded to revenue in the period of change. | If we were to change any of these judgments or estimates, it could cause a material increase or decrease in the amount of revenue we report in a particular period. |
| 33 |
Estimated Liability for Appeals
|
Description |
Judgments and Uncertainties |
Effect if Actual Results Differ from Assumptions |
| Under our contracts with certain commercial health plan customers and our Medicare RAC contracts with CMS, we recognize revenue when HMS claim findings are sent to the Company’s customers for offset against future claim payments to providers. These contracts permit providers the right to appeal HMS claim findings and to pursue additional appeals if the initial appeal is found in favor of HMS’s customer. The total estimated liability for appeals balance was $30.8 million as of each of December 31, 2017 and December 31, 2016. | The appeal process established under the Medicare RAC contract with CMS includes five levels of appeals and resolution of appeals can take substantial time to resolve. HMS records (i) a liability for findings which have been adjudicated in favor of providers and (ii) an estimated liability based on the amount of revenue that is subject to appeals and which is probable of being adjudicated in favor of providers following their successful appeal. Our estimate is based on the Company’s historical experience. |
To the extent the amount to be returned to providers following a successful appeal exceeds or is less than the amount recorded, revenue in the applicable period would be reduced or increased by such amount. Any future changes to any of our customer contract, including modifications to the Medicare RAC contract, may require us to apply different assumptions that could materially affect both the Company’s revenue and estimated liability for appeals in future periods.
|
Business Combinations
|
Description |
Judgments and Uncertainties |
Effect if Actual Results Differ from Assumptions |
| We record assets acquired and liabilities assumed in a business combination based upon their acquisition date fair values. Goodwill is the excess of acquisition costs over the fair values of assets and liabilities of acquired businesses. During the measurement period, which is up to one year from the acquisition date, we may record adjustments to the assets acquired and liabilities assumed, with the corresponding offset to goodwill. Upon the conclusion of the measurement period, any subsequent adjustments are recorded to earnings. | In most instances there is not a readily defined or listed market price for individual assets and liabilities acquired in connection with a business, including intangible assets. We determine fair value through various valuation techniques including discounted cash flow models, quoted market values and third party independent appraisals, as considered necessary. Significant assumptions used in those techniques include, but are not limited to, growth rates, discount rates, customer attrition rates, expected levels of revenues, earnings, cash flows and tax rates. |
The use of different valuation techniques and assumptions are highly subjective and inherently uncertain and, as a result, actual results may differ materially from estimates.
|
| 34 |
Impairment of Goodwill
|
Description |
Judgments and Uncertainties |
Effect if Actual Results Differ from Assumptions |
| Goodwill is subject to a periodic assessment for impairment. We assess goodwill for impairment on an annual basis as of June 30th of each year or more frequently if an event occurs or changes in circumstances would more likely than not reduce the fair value of a reporting unit below its carrying amount. Assessment of goodwill impairment is at the HMS Holdings Corp. entity level as we operate as a single reporting unit. |
We have the option to perform a qualitative assessment to determine if impairment is more likely than not to have occurred.
When the optional qualitative assessment of goodwill impairment is performed, significant judgment is required in the assessment of qualitative factors including but not limited to an evaluation of macroeconomic conditions as they relate to our business, industry and market trends, as well as the overall future financial performance of our reporting units and future opportunities in the markets in which they operate.
If we can support the conclusion that it is more likely than not that the fair value of a reporting unit is greater than its carrying amount using the optional qualitative assessment, then the Company would not need to perform the two-step impairment test. If the Company cannot support such a conclusion, or the Company does not elect to perform the qualitative assessment, then the first step of the goodwill impairment test is used to identify potential impairment by comparing the fair value of the reporting unit with its carrying amount, including goodwill. |
We completed the annual impairment test as of June 30, 2017 using the optional qualitative assessment and determined no impairment existed. The Company’s carrying amount of goodwill was $487.6 million as of December 31, 2017. There were no impairment charges related to goodwill during the years ended December 31, 2017, 2016 or 2015. However, if actual results are not consistent with our estimates or assumptions, we may be exposed to an impairment charge that could materially adversely impact our consolidated financial position and results of operations.
|
Impairment of Long-Lived and Intangible Assets
|
Description |
Judgments and Uncertainties |
Effect if Actual Results Differ from Assumptions |
| Long-lived assets, including property and equipment and intangible assets, are reviewed for impairment whenever events or changes in circumstances indicate that the carrying amount of the asset may not be recoverable. When indicators exist, recoverability of assets is measured by a comparison of the carrying value of the asset group to the estimated undiscounted future net cash flows expected to be generated by the asset. If such assets are considered to be impaired, the impairment to be recognized and charged to earnings is measured by the amount by which the carrying value of the asset group exceeds the fair value of the assets. | We use significant judgment in assessing events or changes in circumstances which indicate that the carrying amount of the asset may not be recoverable. |
The Company’s carrying amount of Long-lived assets, including property and equipment and intangible assets was $190.1 million as of December 31, 2017. The Company did not recognize any impairment charges related to long-lived and intangible assets during the years ended December 31, 2017, 2016 or 2015. However, if actual results are not consistent with our estimates or assumptions, we may be exposed to an impairment charge that could materially adversely impact our consolidated financial position and results of operations.
|
| 35 |
Valuation of Stock-Based Compensation
|
Description |
Judgments and Uncertainties |
Effect if Actual Results Differ from Assumptions |
| The determination of the fair value of the options on the grant date using the Black-Scholes pricing model and/or the Monte Carlo Simulation is affected by the Company’s stock price, as well as assumptions regarding a number of complex and subjective variables. Certain key variables include: the Company’s expected stock price volatility over the expected term of the awards; a risk-free interest rate; and any expected dividends. The fair value of all awards also includes an estimate of expected forfeitures. | We estimate stock price volatility based on the historical volatility of the Company’s common stock and estimate the expected term of the awards based on the Company’s historical option exercises for similar types of stock option awards. The assumed risk-free interest rate is based on the yield on the measurement date of a zero-coupon U.S. Treasury bond with a maturity period equal to the option’s expected term. The Company does not anticipate paying any cash dividends in the foreseeable future and therefore, uses an expected dividend yield of zero in the option valuation models. Forfeitures are estimated based on historical experience. | If we were to change any of these judgments or estimates, it could cause a material increase or decrease in the amount of stock compensation expense we report in a particular period. For example, if actual forfeitures vary from estimates, a difference in compensation expense will be recognized in the period the actual forfeitures occur. |
Income Taxes
|
Description |
Judgments and Uncertainties |
Effect if Actual Results Differ from Assumptions |
| Income taxes are accounted for under the asset and liability method. Under this method, deferred tax assets and liabilities are recognized for the future tax consequences attributable to temporary differences between the financial statement carrying amounts of existing assets and liabilities and their respective tax bases. This method also requires the recognition of future tax benefits for net operating loss carry-forwards. |
Deferred tax assets and liabilities are measured using enacted tax rates expected to apply to taxable income in the years in which those temporary differences are expected to be recovered or settled. The effect on deferred tax assets and liabilities of a change in tax rates is recognized as income or expense in the period that includes the enactment date. A valuation allowance is provided against deferred tax assets to the extent their realization is not more likely than not.
Uncertain income tax positions are accounted for by prescribing a minimum recognition threshold that a tax position is required to meet before being recognized in the financial statements. We make adjustments to these reserves in accordance with the income tax accounting guidance when facts and circumstances change, such as the closing of a tax audit or the refinement of an estimate. |
To the extent that the final tax outcome of these matters is different than the amounts recorded, such differences will affect the provision for income taxes in the period in which such determination is made, and could have a material impact on our financial condition and operating results.
Although the Company believes that it has adequately reserved for uncertain tax positions (including interest and penalties), it can provide no assurance that the final tax outcome of these matters will not be materially different.
|
| 36 |
Contingencies
|
Description |
Judgments and Uncertainties |
Effect if Actual Results Differ from Assumptions |
| From time to time, we are involved in legal proceedings in the ordinary course of business. We assess the likelihood of any adverse judgments or outcomes to these contingencies as well as potential ranges or probable losses and establish reserves accordingly. | We record accruals for outstanding legal matters when we believe it is probable that a loss will be incurred and the amount can be reasonable estimated. Significant judgment is required to determine both probability and the estimated amount. We review these provisions at least quarterly and adjusts the provisions to reflect the impact of negotiations, settlements, rulings, advice of legal counsel and updated information. | Litigation is inherently unpredictable and is subject to significant uncertainties, some of which are beyond the Company’s control. The amount of reserves required may change in future periods due to new developments in each matter or changes in approach to a matter such as a change in settlement strategy which could have a material impact on our financial condition and operating results. |
For further information on these critical accounting policies and all other significant accounting policies refer to the discussion under “Business and Summary of Significant Accounting Policies” in our Note 1 to the Consolidated Financial Statements in Part II, Item 8.
| 37 |
Results of Operations
2017 Highlights
| § | Significantly expanded market penetration with the acquisition of Eliza; |
| § | Amended our existing Credit Agreement; and |
| § | Repurchased approximately 865,000 shares of common stock for $14.1 million. |
Comparison of 2017 to 2016 and 2016 to 2015
| Dollars in millions | Year ended December 31, | $ Change | % Change | % Change | % Change | |||||||||||||||||||||||
| 2017 | 2016 | 2015 | 2017 vs 2016 | 2016 vs 2015 | ||||||||||||||||||||||||
| Revenue | $ | 521.2 | $ | 489.7 | $ | 474.2 | $ | 31.5 | 6.4 | % | $ | 15.5 | 3.3 | % | ||||||||||||||
| Cost of Services : | ||||||||||||||||||||||||||||
| Compensation | 202.0 | 189.3 | 178.3 | 12.7 | 6.7 | 11.0 | 6.2 | |||||||||||||||||||||
| Data Processing | 45.7 | 37.3 | 40.9 | 8.4 | 22.5 | (3.6 | ) | (8.8 | ) | |||||||||||||||||||
| Occupancy | 17.2 | 14.0 | 15.8 | 3.2 | 22.9 | (1.8 | ) | (11.4 | ) | |||||||||||||||||||
| Direct project costs | 41.4 | 46.3 | 51.5 | (4.9 | ) | (10.6 | ) | (5.2 | ) | (10.1 | ) | |||||||||||||||||
| Other operating costs | 28.4 | 27.8 | 28.9 | 0.6 | 2.2 | (1.1 | ) | (3.8 | ) | |||||||||||||||||||
| Amortization of acquisition related software and intangible assets | 30.4 | 28.0 | 28.1 | 2.4 | 8.6 | (0.1 | ) | (0.4 | ) | |||||||||||||||||||
| Total Cost of Services | 365.1 | 342.7 | 343.5 | 22.4 | 6.5 | (0.8 | ) | (0.2 | ) | |||||||||||||||||||
| Selling, general and administrative expenses | 105.7 | 89.4 | 83.1 | 16.3 | 18.2 | 6.3 | 7.6 | |||||||||||||||||||||
| Total Operating Expenses | 470.8 | 432.1 | 426.6 | 38.7 | 9.0 | 5.5 | 1.3 | |||||||||||||||||||||
| Operating Income | 50.4 | 57.6 | 47.6 | (7.2 | ) | (12.5 | ) | 10.0 | 21.0 | |||||||||||||||||||
| Interest expense | (10.8 | ) | (8.5 | ) | (7.8 | ) | (2.3 | ) | 27.1 | (0.7 | ) | 9.0 | ||||||||||||||||
| Interest income | 0.3 | 0.3 | - | - | - | 0.3 | - | |||||||||||||||||||||
| Income before income taxes | 39.9 | 49.4 | 39.8 | (9.5 | ) | (19.2 | ) | 9.6 | 24.1 | |||||||||||||||||||
| Income taxes | (0.2 | ) | 11.8 | 15.3 | (12.0 | ) | (101.7 | ) | (3.5 | ) | (22.9 | ) | ||||||||||||||||
| Net Income | $ | 40.1 | $ | 37.6 | $ | 24.5 | $ | 2.5 | 6.6 | % | $ | 13.1 | 53.5 | % | ||||||||||||||
Revenue
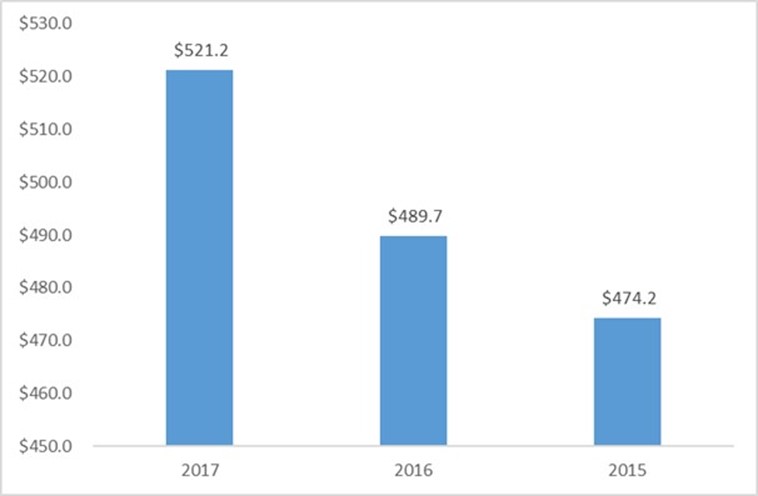
Revenue in Millions
| 38 |
2017 vs. 2016
During the year ended December 31, 2017, revenue was $521.2 million, an increase of $31.5 million or 6.4% compared to $489.7 million for the year ended December 31, 2016.
| § | By product: |
| o | Coordination of benefits product revenue increased $29.0 million or 8.2% which was attributable to yield improvements and the addition of Medicaid enrollees which entered our customer eligibility files in 2017. |
| o | Analytical services product revenue increased $2.5 million or 1.9% which was attributable to Eliza contributing revenue of $30.4 million since its acquisition in April 2017 and revenue from Essette increasing $2.9 million as compared to prior year. These increases were offset by decreases totaling $30.8 million comprised of Medicare RAC revenue of $14.7 million because the Medicare RAC D program ceased generating revenue in late 2016, as expected, and program integrity revenue of $16.1 million due to various contract completions and expirations. |
| § | By market: |
| o | Commercial health plan market revenue increased $39.0 million or 17.0% which was attributable to Eliza contributing revenue of $30.4 million since its acquisition in April 2017, Essette increasing revenue $2.9 million as compared to prior year and expanded commercial health plan scopes, including the addition of health plans to current contracts and yield improvements. |
| o | State government market revenue grew by $7.9 million or 3.6%, which was attributable to expanded scopes and yield improvements. |
| o | Federal government market revenue decreased $15.4 million, which was primarily attributable to a reduction of Medicare RAC revenue because the Medicare RAC D program ceased generating revenue in late 2016, as expected. |
2016 vs. 2015
During the year ended December 31, 2016, revenue was $489.7 million, an increase of $15.5 million or 3.3% compared to $474.2 million for the year ended December 31, 2015.
| § | By product: |
| o | Coordination of benefits product revenue increased $16.2 million or 4.8% which was primarily attributable to an increase in subrogation revenue. |
| o | Analytical services product revenue decreased $0.7 million or 0.5% which was attributable to decreases in Medicare RAC revenue of $3.4 million, employer services revenue of $1.8 million due to various contract completions and expirations and eligibility services revenue of $0.5 million. These decreases were offset by a $4.1 million increase in our program integrity revenue which was attributable to expanded scopes and yield improvements and $0.9 million of revenue contributed by Essette in 2016 after the date of its acquisition. |
| § | By market: |
| o | Commercial health plan market revenue increased $27.2 million or 13.4%, which was attributable to expanded scopes, including adding additional health plans to current customer contracts, and yield improvements. |
| o | State government market revenue decreased $7.0 million or 3.1%, which was attributable to a reduction in revenue from certain customers. |
| o | Federal government market revenue decreased $4.7 million or 10.3%, which was primarily attributable to a reduction of Medicare RAC activity due to delays in contract reprocurement. |
| 39 |
Cost of Services
Cost of Services in millions
2017 vs. 2016
During the year ended December 31, 2017, total cost of services was $365.1 million, an increase of $22.4 million or 6.5% compared to $342.7 million for the year ended December 31, 2016. This change resulted primarily from increases in compensation expense of $12.8 million, data processing expense of $8.4 million, and amortization of intangibles expense of $2.4 million.
| § | The Eliza acquisition and the related compensation, data processing, occupancy and amortization of intangibles expenses incurred since the transaction represents $23.4 million of the increase. |
| § | Excluding Eliza, total cost of services decreased by $1.0 million which was primarily related to a reduction in direct project costs partially offset by increases in data processing and compensation expenses. |
2016 vs. 2015
During the year ended December 31, 2016, total cost of services was $342.7 million, a decrease of $0.8 million or 0.2% compared to $343.5 million for the year ended December 31, 2015.
| § | Direct project costs decreased by $5.2 million primarily related to the reduction of Medicare RAC activity. |
| § | Data processing expense decreased by $3.6 million primarily related to a reduction in depreciation expense. |
| § | Occupancy expense decreased by $1.8 million related to the closure of an office in 2015. |
| § | Other operating expenses decreased by $1.1 million related to net decreases of temporary staff, subcontractors and consulting fees. |
| § | Compensation expense increased by $11.1 million related to additional salaries, variable compensation and fringe benefits expenses partially offset by a decrease in stock-based compensation expense. |
| 40 |
Selling, General and Administrative expenses
SG&A in millions
2017 vs. 2016
During the year ended December 31, 2017, SG&A expense was $105.7 million, an increase of $16.3 million or 18.2% compared to $89.4 million for the year ended December 31, 2016.
| § | The Eliza acquisition and related transaction fees and other SG&A expenses incurred since its acquisition represented $8.7 million of the increase. |
| § | Excluding Eliza, stock compensation expense also increased by $7.3 million primarily due to stock compensation expense for retirement eligible employees. |
2016 vs. 2015
During the year ended December 31, 2016, SG&A expense was $89.4 million, an increase of $6.3 million or 7.6% compared to $83.1 million for the year ended December 31, 2015.
| § | Increases totaling $14.1 million were comprised of compensation costs of $6.1 million, consulting expense of $4.0 million, fringe benefits expense of $1.6 million, and other expenses of $2.4 million. |
| § | These increases were partially offset by a $7.8 million reduction in legal fees and settlements. |
Income Taxes
2017 vs. 2016
During the year ended December 31, 2017, we recorded an income tax benefit of ($0.2) million, a decrease of $12.0 million compared to the year ended December 31, 2016.
| § | On December 22, 2017, the 2017 Tax Act was signed into law and includes provisions reducing the federal tax rate for years beginning in 2018 from 35% to 21%. |
| § | Our effective tax rate was (0.5%) for the year ended December 31, 2017 compared to an effective tax rate of 23.9% for the year ended December 31, 2016. The decrease is primarily due to the revaluation of our deferred tax liabilities based on the reduced federal tax rate described above. |
| § | Our normalized effective tax rate of 36.1% for 2017 is comparable to our normalized effective tax rate of 36.2% for 2016. |
| 41 |
2016 vs. 2015
During the year ended December 31, 2016, we recorded income tax expense of $11.8 million, a decrease of $3.5 million compared to the year ended December 31, 2015.
| § | Our effective tax rate decreased from 38.4% to 23.9%, which reflects a $6.2 million tax benefit recognized in the third quarter of 2016 that was related to prior period R&D Credits and Section 199 Deductions. |
Off-Balance Sheet Arrangements
We do not have any off-balance sheet arrangements.
Credit Agreement
In May 2013, we entered into the Credit Agreement with certain lenders and Citibank, N.A. as administrative agent. The Credit Agreement originally provided for an initial $500 million five-year revolving credit facility maturing on May 3, 2018. The obligations and amounts due under the original revolving credit facility were secured by a first security priority interest in all or substantially all of our and our material 100% owned subsidiaries’ assets. The original revolving credit facility contained customary representations and warranties, affirmative and negative covenants, including financial covenants, and events of default.
In March 2017, we amended the Credit Agreement to allow, among other things, an extension of our requirement to furnish to Citibank, N.A., as administrative agent, and the lenders party to the Credit Agreement, copies of financial statements and other information within 90 days of the fiscal year-end to 180 days for the fiscal year-ended December 31, 2016. We furnished the required financial statements, which included our audited consolidated balance sheet and related statements of income, stockholders’ equity and cash flows, within the extended time period.
Amended Revolving Facility
On December 19, 2017, we entered into an amendment to the Credit Agreement that, among other things, provides for an extension of the maturity date of our existing senior secured revolving credit facility, which includes a $50 million sublimit for the issuance of letters of credit and a $25 million sublimit for swingline loans. In addition, the Amended Revolving Facility includes an accordion feature that permits us to increase the revolving facility up to the sum of (a) the greater of $120 million and 100% of Consolidated EBITDA (as defined in the Credit Agreement) and (b) additional amounts so long as our first lien leverage ratio (as defined in the Credit Agreement) on a pro forma basis is not greater than 3.00:1.00, in each case subject to obtaining commitments from lenders therefor and meeting certain other conditions. The Amended Revolving Facility will mature on December 19, 2022.
As of December 31, 2017, the outstanding principal balance due on the Amended Revolving Facility was $240.0 million.
Our obligations under the Amended Revolving Facility are secured, subject to certain customary carve-outs and exceptions, by a first priority lien and security interest in substantially all of our tangible and intangible assets and our material restricted subsidiaries’. The Amended Revolving Facility contains customary representations and warranties, affirmative and negative covenants, including financial covenants and restrictions on share repurchases, and events of default applicable to us and our restricted subsidiaries. We are required to comply, on a quarterly basis, with two financial covenants:(i) a minimum interest coverage ratio of 3:00:1:00, and (ii) a maximum consolidated leverage ratio of 4.75:1.00 through December 2019 and 4.25:1.00 from and after January 2020 (in each case, as such ratios are defined in the Credit Agreement). The consolidated leverage ratio is subject to a step-up to 5.25:1.00 for four full consecutive fiscal quarters following a permitted acquisition or similar investment.
Borrowings under the Amended Revolving Facility bear interest at a rate equal to either (a) a base rate plus an interest margin ranging from 0.50% to 1.00% or (b) an adjusted LIBO rate, plus an interest margin ranging from 1.50% to 2.00% based on the Company’s consolidated leverage ratio for the applicable period.
| 42 |
We paid lender, legal and other fees of $2.3 million and accrued interest of $1.5 million. Proceeds of the Amended Revolving Facility may be used to provide working capital from time to time for the Company, and for other general corporate purposes and activities permitted by the Credit Agreement.
As of December 31, 2017, we were in compliance with all terms of the Credit Agreement.
As part of a contractual agreement with a customer, the Company has an outstanding irrevocable letter of credit for $5.4 million, which is issued against the Amended Revolving Facility and expires April 26, 2018.
See Note 8 to the Consolidated Financial Statements in Part II, Item 8 for additional information regarding our Credit Agreement.
Liquidity and Capital Resources
The following tables should be read in conjunction with the Consolidated Financial Statements and Notes thereto, in Part II, Item 8 of this 2017 Form 10-K.
Our cash and cash equivalents, working capital and available borrowings under our credit facility (based upon the borrowing base and financial covenants in our Credit Agreement) were as follows:
| Years Ended December 31, | ||||||||
| (In thousands) | 2017 | 2016 | ||||||
| Cash and cash equivalents | $ | 83,313 | $ | 175,999 | ||||
| Working capital | $ | 199,967 | $ | 277,478 | ||||
| Available borrowings under credit facility | $ | 254,600 | $ | 183,881 | ||||
A summary of our cash flows was as follows:
| Years Ended December 31, | ||||||||||||
| (In thousands) | 2017 | 2016 | 2015 | |||||||||
| Net cash provided by operating activities | $ | 86,464 | $ | 88,639 | $ | 72,285 | ||||||
| Net cash used in investing activities | (204,364 | ) | (39,201 | ) | (11,817 | ) | ||||||
| Net cash provided by / (used in) financing activities | 25,214 | (19,049 | ) | (47,974 | ) | |||||||
| Net (decrease) / increase in cash and cash equivalents | $ | (92,686 | ) | $ | 30,389 | $ | 12,494 | |||||
Our cash and cash equivalents and working capital were lower as of December 31, 2017 as compared to December 31, 2016, primarily as a result of cash used for our acquisition of Eliza on April 17, 2017. Our available borrowings were higher as of December 31, 2017 as compared to December 31, 2016 as a result of the Amended Revolving Facility as described above.
Our principal source of cash has been our cash flow from operations and our $500 million five-year revolving credit facility. Other sources of cash include proceeds from exercise of stock options and tax benefits associated with stock option exercises. The primary uses of cash are capital investments, compensation expenses, data processing, direct project costs and SG&A expenses and acquisitions. We may also use available cash to repurchase shares of our common stock.
We believe that expected cash flows from operations, available cash and cash equivalents, and funds available under our revolving credit facility will be sufficient to meet our liquidity requirements for the following year, which include:
| § | the working capital requirements of our operations; |
| § | investments in our business; |
| § | business development activities; |
| § | repurchases of common stock; and |
| § | repayment of our revolving credit facility. |
| 43 |
Any projections of future earnings and cash flows are subject to substantial uncertainty. We may need to access debt and equity markets in the future if unforeseen costs or opportunities arise, to meet working capital requirements, fund acquisitions or repay our indebtedness under the Credit Agreement. If we need to obtain new debt or equity financing in the future, the terms and availability of such financing may be impacted by economic and financial market conditions as well as our financial condition and results of operations at the time we seek additional financing.
Cash Flows from Operating Activities
Net cash provided by operating activities for the year ended December 31, 2017 was $86.5 million, a $2.1 million decrease from net cash provided by operating activities of $88.6 million for the year ended December 31, 2016. The decrease was primarily due to a decrease in deferred income taxes of $13.0 million related to our revaluation of the Company’s deferred tax balances from the federal tax rate of 35% to 21% under the 2017 Tax Act, offset by an increase in stock based compensation expense $10.9 million primarily related to retirement eligible employees. The decrease was also impacted by changes in operating assets and liabilities and offset by increases in net income, and depreciation and amortization expenses.
Net cash provided by operating activities for the year ended December 31, 2016 was $88.6 million, a $16.3 million increase from net cash provided by operating activities of $72.3 million for the year ended December 31, 2015. The increase was primarily due to an increase in net income as adjusted for non-cash items including decreased stock-based compensation expense and deferred income taxes, as well as an increase in accounts payable and other liabilities.
Net cash provided by operating activities for the year ended December 31, 2015 was $72.3 million, a $28.3 million decrease from net cash provided by operating activities of $100.6 million for the year ended December 31, 2014. This decrease was primarily due to an increase in accounts receivable and a decrease in our net deferred tax liabilities and accounts payable, partially offset by an increase in net income.
Our DSO calculation can be derived by dividing total net accounts receivable at the end of period, by the daily average of the current quarter’s annualized revenue. For the year ended December 31, 2017, revenue was $521.2 million, an increase of $31.5 million compared to revenue of $489.7 million for the year ended December 31, 2016. DSO decreased by 9 days to 115 days as of December 31, 2017, as compared to 124 days as of December 31, 2016. The change was due to strong cash collections as well as an increase in revenue in the fourth quarter of the current year as compared to the fourth quarter of the prior year. We do not currently anticipate collection issues with our accounts receivable, however, nor do we currently expect that any extended collections will materially impact our liquidity.
The majority of our customer relationships have been in place for several years. Our future operating cash flows could be adversely affected by a decrease in a demand for our services, delayed payments from customers or if one or more contracts with our largest customers is terminated or not renewed.
Cash Flows from Investing Activities
Net cash used in investing activities for the year ended December 31, 2017 was $204.4 million, a $165.2 million increase compared to net cash used in investing activities of $39.2 million for the year ended December 31, 2016. This increase was primarily due to the use of approximately $171.2 million for the Eliza acquisition in April 2017 as compared to the use of approximately $20.7 million for the Essette acquisition in September 2016. Purchases of property and equipment and investment in capitalized software also increased by $12.0 million year over year.
Net cash used in investing activities for the year ended December 31, 2016 was $39.2 million, a $27.4 million increase compared to net cash used in investing activities of $11.8 million for the year ended December 31, 2015. This increase was primarily due to the use of approximately $20.7 million for the Essette acquisition in September 2016. Purchases of property and equipment and investment in capital software also increased by $9.2 million. These increases were partially offset by the receipt of proceeds from the sale of a cost basis investment of approximately $2.5 million.
| 44 |
Net cash used in investing activities for the year ended December 31, 2015 was $11.8 million, a $14.4 million decrease compared to net cash used in investing activities of $26.2 million for the year ended December 31, 2014. The decrease was primarily related to a $14.1 million decrease in purchase of property and equipment and a $0.3 million decrease in investment in capitalized software.
We currently expect to incur capital expenditures of $33.0 million during the year ended December 31, 2018.
Cash Flows from Financing Activities
Net cash provided by financing activities for the year ended December 31, 2017 was $25.2 million, a $44.2 million increase from net cash used in financing activities of $19.0 million for the year ended December 31, 2016. This increase was primarily attributable to $42.2 million of proceeds from additional borrowings under our amended credit facility.
Net cash used in financing activities for the year ended December 31, 2016 was $19.0 million, a $29.0 million decrease from net cash used in financing activities of $48.0 million for the year ended December 31, 2015. This decrease was primarily attributable to a decrease in share repurchases of $20.5 million as compared to the prior year of $50.0 million.
Net cash used in financing activities for the year ended December 31, 2015 was $48.0 million, a $13.4 million increase from net cash used in financing activities of $34.6 million for the year ended December 31, 2014. This increase was primarily attributable to $50.0 million used in 2015 for share repurchases, partially offset by a $35.0 million reduction in payments toward the principal outstanding on our revolving credit facility.
Share Repurchase Program
During the year ended December 31, 2017, we repurchased 0.9 million shares of our common stock for approximately $14.1 million using cash resources. See the discussion under “Repurchases of Shares of Common Stock” under Part II, Item 5 and “Equity” in Note 9 to the Consolidated Financial Statements under Part II, Item 8 for additional information regarding share repurchases.
Contractual Obligations
The following table represents the scheduled maturities of our contractual cash obligations and other commitments:
| Payments Due by Period (in thousands) | ||||||||||||||||||||
| Contractual Obligations (8) | Total | Less than 1 year | 1 - 3 years | 3 -5 years | More than 5 years | |||||||||||||||
| Operating leases (1) | $ | 19,938 | $ | 6,393 | $ | 8,773 | $ | 4,772 | $ | - | ||||||||||
| Revolving credit facility (2) | 240,000 | - | - | 240,000 | - | |||||||||||||||
| Interest expense (3) | 40,633 | 8,212 | 24,636 | 7,785 | - | |||||||||||||||
| Commitment fee (4) | 4,789 | 968 | 2,904 | 917 | - | |||||||||||||||
| Capital leases (5) | 198 | 190 | 8 | - | - | |||||||||||||||
| Letter of Credit fee (6) | 34 | 34 | - | - | - | |||||||||||||||
| Purchase obligations and commitments (7) | 2,476 | 2,476 | - | - | - | |||||||||||||||
| Total | $ | 308,068 | $ | 18,273 | $ | 36,321 | $ | 253,474 | $ | - | ||||||||||
| 45 |
| (1) | Represents the future minimum lease payments under non-cancelable operating leases. In addition to minimum rent, certain leases require the payment for insurance, maintenance and other costs. These additional amounts are not included in the table of contractual obligations as the timing and/or amounts of such payments are unknown. |
| (2) | Represents scheduled repayments of principal on the revolving credit facility under the terms of our Credit Agreement. See Note 8 to the Consolidated Financial Statements in Part II, Item 8 for additional information regarding the Credit Agreement. |
| (3) | Represents estimates of amounts due on revolving credit facility based on the interest rate as of December 31, 2017 and on scheduled repayments of principal. See Note 8 to the Consolidated Financial Statements in Part II, Item 8 for additional information regarding the Credit Agreement. |
| (4) | Represents the commitment fee due on the revolving credit facility. See Note 8 to the Consolidated Financial Statements in Part II, Item 8 for additional information regarding the Credit Agreement. |
| (5) | Represents the future minimum lease payments under capital leases. |
| (6) | Represents the fees for the letter of credit issued against the revolving credit facility. See Note 8 to the Consolidated Financial Statements in Part II, Item 8 for additional information regarding the Credit Agreement. |
| (7) | Represents future purchases related to outstanding purchase orders and supplier requisitions. |
| (8) | The Company has excluded long-term unrecognized tax benefits, net of interest and penalties, of $8.2 million from the amounts presented as the timing of these obligations is uncertain. |
Recently Issued Accounting Pronouncements
The information set forth under the caption “Summary of Significant Accounting Policies” in Note 1 to the Consolidated Financial Statements in Part II, Item 8 is incorporated herein by reference.
Item 7A. Quantitative and Qualitative Disclosures About Market Risk
At December 31, 2017, we were not a party to any derivative financial instruments. We conduct all of our business in U.S. currency and hence do not have direct foreign currency risk. We are exposed to changes in interest rates, primarily with respect to our revolving credit facility under our Credit Agreement. If the effective interest rate for all of our variable rate debt were to increase by 100 basis points (1%), our annual interest expense would increase by a maximum of $2.4 million based on our debt balances outstanding at December 31, 2017. Further, we currently invest substantially all of our excess cash in short-term investments, primarily money market accounts, where returns effectively reflect current interest rates. As a result, market interest rate changes may impact our interest income or expense. The impact will depend on variables such as the magnitude of rate changes and the level of borrowings or excess cash balances. We do not consider this risk to be material. We manage such risk by continuing to evaluate the best investment rates available for short-term, high quality investments.
Item 8. Consolidated Financial Statements and Supplementary Data
The information required by Item 8 is found on pages 61 to 64 of this 2017 Form 10-K.
Item 9. Changes in and Disagreements with Accountants on Accounting and Financial Disclosure
None.
| 46 |
Item 9A. Controls and Procedures
(a) Evaluation of Disclosure Controls and Procedures
We are responsible for maintaining disclosure controls and procedures (as defined in Rule 13a-15(e) under the Exchange Act) that are designed to ensure that information required to be disclosed in our reports filed under the Exchange Act is recorded, processed, summarized and reported within the time periods specified in the SEC’s rules and forms and that such information is accumulated and communicated to our management, including our Chief Executive Officer and Chief Financial Officer, as appropriate, to allow for timely decisions regarding required disclosure. In designing and evaluating the disclosure controls and procedures, management recognizes that any controls and procedures, no matter how well designed and operated, can provide only reasonable assurance of achieving the desired control objectives, and management is required to apply its judgment in evaluating the cost-benefit relationship of possible controls and procedures
As required by Rule 13a-15(b) under the Exchange Act, management, with the participation of our Chief Executive Officer and Chief Financial Officer, performed an evaluation of the effectiveness of our disclosure controls and procedures as of December 31, 2017. Based on that evaluation, our Chief Executive Officer and Chief Financial Officer concluded that our disclosure controls and procedures were effective as of the end of the period covered by the 2017 Form 10-K.
(b) Management’s Report on Internal Control Over Financial Reporting
Our management is responsible for establishing and maintaining adequate internal control over financial reporting and for the assessment of the effectiveness of internal control over financial reporting. As defined by Rule 13a-15(f) of the Exchange Act, internal control over financial reporting is a process designed by, or under the supervision of our Chief Executive Officer and our Chief Financial Officer and effected by our Board of Directors, management and other personnel, to provide reasonable assurance regarding the reliability of financial reporting and the preparation of the consolidated financial statements for external purposes in accordance with U.S. GAAP.
Our internal control over financial reporting includes those policies and procedures that (i) pertain to the maintenance of records that, in reasonable detail, accurately and fairly reflect our transactions and dispositions of our assets; (ii) provide reasonable assurance that transactions are recorded as necessary to permit preparation of the consolidated financial statements in accordance with generally accepted accounting principles and that our receipts and expenditures are being made only in accordance with authorizations of our management and directors; and (iii) provide reasonable assurance regarding prevention or timely detection of unauthorized acquisition, use or disposition of our assets that could have a material effect on the consolidated financial statements.
In connection with the preparation of our annual consolidated financial statements, management has undertaken an assessment of the effectiveness of our internal control over financial reporting as of December 31, 2017, based on criteria established in the Internal Control-Integrated Framework issued by COSO. Management’s assessment included an evaluation of the design of our internal control over financial reporting and testing of the operational effectiveness of those controls. Based on that assessment, we believe that the Company’s internal control over financial reporting was effective based on those criteria as of December 31, 2017.
On April 17, 2017, we completed our acquisition of Eliza. We are in the process of evaluating the existing controls and procedures of Eliza and integrating Eliza into our internal control over financial reporting. In accordance with SEC Staff guidance permitting a company to exclude an acquired business from management’s assessment of the effectiveness of internal control over financial reporting for the year in which the acquisition is completed, we have excluded the Eliza business acquired in 2017 from our assessment of the effectiveness of internal control over financial reporting as of December 31, 2017. Eliza represented twenty percent of the Company’s total assets as of December 31, 2017, and six percent of the Company’s revenues for the year ended December 31, 2017. The scope of management’s assessment of the effectiveness of the design and operation of the Company’s disclosure controls and procedures as of December 31, 2017 includes all of the Company’s consolidated operations except for those disclosure controls and procedures of Eliza that are subsumed by internal control over financial reporting.
Our independent registered public accounting firm, Grant Thornton LLP, audited our consolidated financial statements and has issued an attestation report on the effectiveness of our internal control over financial reporting as of December 31, 2017, a copy of which appears on page 60 of this filing.
Because of its inherent limitations, internal control over financial reporting may not prevent or detect misstatements. Also, projections of any evaluation of effectiveness to future periods are subject to the risk that controls may become inadequate because of changes in conditions, or that the degree of compliance with the policies or procedures may deteriorate.
| 47 |
(c) Changes in Internal Control Over Financial Reporting
During the quarter ended December 31, 2016, management identified material weaknesses in our internal control over financial reporting related to (i) the calculation our estimated liability for appeals associated with our contract with CMS (the “CMS Reserve”) and (ii) the valuation of our accounts receivable allowance (the “Allowance”). A material weakness is a deficiency, or combination of deficiencies, in internal control over financial reporting such that there is a reasonable possibility that a material misstatement in our annual or interim financial statements will not be prevented or detected on a timely basis.
As described in Management’s Report on Internal Control Over Financial Reporting in Item 9A of our 2016 Form 10-K, management determined that we did not maintain an effective control environment based on lack of established reporting lines and defined authorities and responsibilities for financial reporting at our wholly owned subsidiary, HDI, and did not have an effective risk assessment process on a periodic basis to assess the effects of changes in business operations and turnover of our employees that significantly impact our financial processes and internal control over financial reporting related to (i) our estimated liability for appeals associated with our contract with CMS (the “CMS Reserve”) and (ii) the valuation of our accounts receivable allowance (the “Allowance”). As a result, we did not design and implement effective process level control activities, specifically management review controls over the measurement and disclosure of the CMS Reserve and the Allowance and controls over the completeness and accuracy of data used to calculate the CMS Reserve and the Allowance.
To remediate the material weaknesses described above we:
| § | clarified our risk assessment process in regards to external factors, such as conditions in the Company's industry and environment, and internal factors, such as personnel who may lack the necessary financial reporting competencies, information systems that may fail to accurately capture business transactions, or financial reporting processes that may not be adequately aligned with the requirements in the applicable financial reporting framework; |
| § | restructured and
redefined certain individuals’ responsibilities in regards to internal control over financial reporting and have added additional full time personnel which we believe will continue to strengthen internal control over financial reporting specifically related to our risk assessment process; |
| § | realigned existing
subsidiary and corporate reporting lines which we believe will clarify existing subsidiary authorities and responsibilities for financial reporting and will enhance corporate-level oversight of the subsidiary activities; |
| § | engaged an independent
third party professional services firm to assist in enhancing and clarifying process flows and the underlying process level controls around the CMS Reserve and the Allowance; |
| § | implemented additional
process level controls surrounding the completeness and accuracy of the underlying data and reports; |
| § | trained personnel with respect to supporting documentation used in process level controls; |
| § | enhanced and clarified existing review control procedures over our models for the CMS Reserve and the Allowance including adding additional specific review criteria utilized; and |
| § | implemented additional
layers of review controls specifically over the CMS Reserve and the Allowance, including the review by more experienced personnel. |
Management completed testing during the quarter ended December 31, 2017 and determined that the measures described above were effectively designed and demonstrated effective operation for a sufficient period of time to enable the Company to conclude that the material weaknesses have been remediated.
Except as noted above, there have been no changes to the Company’s internal control over financial reporting as of December 31, 2017 that have materially affected, or are reasonably likely to materially affect, our internal control over financial reporting.
None.
| 48 |
PART III
Item 10. Directors, Executive Officers and Corporate Governance
The information required by this Item 10 is incorporated herein by reference to the applicable disclosure found in our definitive proxy statement to be filed with the SEC pursuant to Regulation 14A under the Exchange Act in connection with HMS Holdings Corp.’s 2018 Annual Meeting of Shareholders under the captions “Proposal One: Election of Class I Directors,” “Executive Officers,” “Section 16(a) Beneficial Ownership Reporting Compliance,” “Director Nomination Process,” “Additional Information—Shareholder Proposals and Director Nominations for 2019 Annual Meeting,” and “Board Committees and Related Matters.”
Our Board of Directors has adopted a Code of Conduct applicable to all of our directors, officers and employees, including all employees, officers, directors, contractors, contingent workers and business affiliates of HMS subsidiaries. The Code of Conduct is publicly available on our website under the “Investors—Corporate Governance” tab at http://investor.hms.com/corporate governance.cfm and can also be obtained free of charge by sending a written request to our Corporate Secretary. To the extent permissible under the Nasdaq Marketplace Rules, we intend to disclose amendments to our Code of Conduct, as well as waivers of the provisions thereof, that relate to our principal executive officer, principal financial officer, principal accounting officer, controller or persons performing similar functions on the Company’s website under the “Investors—Corporate Governance” tab at http://investor.hms.com/corporate-governance.cfm.
Item 11. Executive Compensation
The information required by this Item 11 is incorporated herein by reference to the applicable disclosure found in our definitive proxy statement to be filed with the SEC pursuant to Regulation 14A under the Exchange Act in connection with HMS Holdings Corp.’s 2018 Annual Meeting of Shareholders under the captions “Executive Compensation,” “Director Compensation,” “Compensation Committee Interlocks and Insider Participation,” and “Compensation Committee Report.”
Item 12. Security Ownership of Certain Beneficial Owners and Management and Related Shareholder Matters
Except as provided below, the information required by this Item 12 is incorporated herein by reference to the applicable disclosure found in our definitive proxy statement to be filed with the SEC pursuant to Regulation 14A under the Exchange Act in connection with HMS Holdings Corp.’s 2018 Annual Meeting of Shareholders under the caption “Ownership of HMS Common Stock.”
Equity Compensation Plan Information
The following table summarizes information about our equity compensation plans as of December 31, 2017. For additional information about our equity compensation plans see the discussion set forth under the caption “Stock-Based Compensation” in Note 11 to the Consolidated Financial Statements in Part II, Item 8.
| 49 |
| Number of securities to be issued upon exercise of outstanding options, warrants and rights | Weighted-average exercise price of outstanding options, warrants and rights | Number of securities remaining available for future issuance under equity compensation plans (excluding securities reflected in column (a)) | ||||||||||
| Plan Category | (a) | (b) | (c) | |||||||||
| Equity compensation plans approved by shareholders | 6,869,758 | (1) | $ | 17.42 | 6,031,544 | |||||||
| Equity compensation plans not approved by shareholders | 31,300 | (2) | $ | 17.89 | — | |||||||
| Total | 6,901,058 | |||||||||||
| (1) | This includes stock options and restricted stock units granted under our 2006 Stock Plan and 2016 Omnibus Plan. |
| (2) | This includes stock options granted under the 2011 HDI Plan, which was assumed in connection with our acquisition of HDI and approved by the Compensation Committee of our Board. |
Item 13. Certain Relationships and Related Transactions and Director Independence
The information required by this Item 13 is incorporated herein by reference to the applicable disclosure found in our definitive proxy statement to be filed with the SEC pursuant to Regulation 14A under the Exchange Act in connection with HMS Holdings Corp.’s 2018 Annual Meeting of Shareholders under the captions “Certain Relationships and Related Transactions” and “Director Independence.”
Item 14. Principal Accounting Fees and Services
The information required by this Item 14 is incorporated herein by reference to the applicable disclosure from the proposal captioned “Ratification of the Selection of Independent Registered Public Accounting Firm” found in our definitive proxy statement to be filed with the SEC pursuant to Regulation 14A under the Exchange Act in connection with HMS Holdings Corp.’s 2018 Annual Meeting of Shareholders.
| 50 |
PART IV
Item 15. Exhibits and Financial Statement Schedules
| 1. | Financial Statements. |
The financial statements are listed in the Index to Consolidated Financial Statements on page 58.
| 2. | Financial Statement Schedules. |
Financial Statement Schedule II-Valuation and Qualifying Accounts is set forth on page 88. All other financial statement schedules have been omitted as they are either not required, not applicable or the information is otherwise included.
| 3. | Exhibits. |
The Exhibits include agreements to which the Company is a party or has a beneficial interest. The agreements have been filed to provide investors with information regarding their respective terms. The agreements are not intended to provide any other actual information about the Company or its business or operations. In particular, the assertions embodied in any representations, warranties, and covenants contained in the agreements may be subject to qualifications with respect to knowledge and materiality different from those applicable to investors and may be qualified by information in confidential disclosure schedules not included with the exhibits. These disclosure schedules may contain information that modifies, qualifies and creates exceptions to the representations, warranties and covenants set forth in the agreements. Moreover, certain representations, warranties, and covenants in the agreements may have been used for the purpose of allocating risk between parties, rather than establishing matters as facts. In addition, information concerning the subject matter of the representations, warranties and covenants may have changed after the date of the respective agreement, which subsequent information may or may not be fully reflected in the Company’s public disclosures. Accordingly, investors should not rely on the representations, warranties and covenants in the agreements as characterizations of the actual state of facts about the Company or its business or operations on the date hereof.
Where an exhibit is filed by incorporation by reference to a previously filed registration statement or report, such registration statement or report is identified after the description of the exhibit.
| 51 |
| 52 |
| 53 |
| 54 |
| 101.INS | XBRL Instance Document |
| 101.SCH | XBRL Taxonomy Extension Schema Document |
| 101.CAL | XBRL Taxonomy Extension Calculation Linkbase Document |
| 101.DEF | XBRL Taxonomy Extension Definition Linkbase Document |
| 101.LAB | XBRL Taxonomy Extension Label Linkbase Document |
| 101.PRE | XBRL Taxonomy Extension Presentation Linkbase Document |
______________________
| † | Indicates a management contract or compensatory plan, contract or arrangement |
| * | The certifications attached hereto as Exhibit 32.1 and Exhibit 32.2 are furnished with this 2017 Form 10-K and shall not be deemed “filed” by the Company for purposes of Section 18 of the Securities Exchange Act of 1934, as amended. |
None.
| 55 |
SIGNATURES
Pursuant to the requirements of Section 13 or 15(d) of the Securities Exchange Act of 1934, as amended, the Registrant has duly caused this Annual Report on Form 10-K to be signed on its behalf by the undersigned, thereunto duly authorized on February 27, 2018.
| HMS Holdings Corp. | |
| /s/ WILLIAM C. LUCIA | |
| William C. Lucia | |
| Chairman of the Board, President and Chief Executive Officer |
Pursuant to the requirements of the Securities Exchange Act of 1934, as amended, this Annual Report on Form 10-K has been signed below by the following persons on behalf of the Registrant and in the capacities indicated on February 27, 2018.
| Signature | Title | |
|
/s/ WILLIAM C. LUCIA William C. Lucia |
Director, Chairman of the Board, President and Chief Executive Officer (Principal Executive Officer) | |
|
/s/ JEFFREY S. SHERMAN Jeffrey S. Sherman |
Executive Vice President, Chief Financial Officer and Treasurer (Principal Financial Officer) | |
|
/s/ GREG D. AUNAN Greg D. Aunan |
Senior Vice President and Chief Accounting Officer (Principal Accounting Officer) | |
|
/s/ ROBERT BECKER Robert Becker |
Director | |
|
/s/ CRAIG R. CALLEN Craig R. Callen |
Director | |
|
/s/ ELLEN A. RUDNICK Ellen A. Rudnick |
Director | |
|
/s/ BART M. SCHWARTZ Bart M. Schwartz |
Director | |
|
/s/ RICHARD H. STOWE Richard H. Stowe |
Director | |
|
/s/ CORA M. TELLEZ Cora M. Tellez |
Director | |
| 56 |
HMS HOLDINGS CORP. AND SUBSIDIARIES
INDEX TO CONSOLIDATED FINANCIAL STATEMENTS
| 57 |
Report of Independent Registered Public Accounting Firm
Board of Directors and Shareholders
HMS Holdings Corp.
Opinion on the financial statements
We have audited the accompanying consolidated balance sheet of HMS Holdings Corp. (a Delaware corporation) and subsidiaries (the “Company”) as of December 31, 2017, the related consolidated statements of income, changes in shareholders’ equity, and cash flows for the year ended December 31, 2017 and the related notes and schedule (collectively referred to as the “financial statements”). In our opinion, the financial statements present fairly, in all material respects, the financial position of the Company as of December 31, 2017, and the results of its operations and its cash flows for the year ended December 31, 2017, in conformity with accounting principles generally accepted in the United States of America.
We also have audited, in accordance with the standards of the Public Company Accounting Oversight Board (United States) (“PCAOB”), the Company’s internal control over financial reporting as of December 31, 2017, based on criteria established in the 2013 Internal Control—Integrated Framework issued by the Committee of Sponsoring Organizations of the Treadway Commission (“COSO”), and our report dated February 27, 2018 expressed an unmodified opinion.
Basis for opinion
These financial statements are the responsibility of the Company’s management. Our responsibility is to express an opinion on the Company’s financial statements based on our audit. We are a public accounting firm registered with the PCAOB and are required to be independent with respect to the Company in accordance with the U.S. federal securities laws and the applicable rules and regulations of the Securities and Exchange Commission and the PCAOB.
We conducted our audit in accordance with the standards of the PCAOB. Those standards require that we plan and perform the audit to obtain reasonable assurance about whether the financial statements are free of material misstatement, whether due to error or fraud. Our audit included performing procedures to assess the risks of material misstatement of the financial statements, whether due to error or fraud, and performing procedures that respond to those risks. Such procedures included examining, on a test basis, evidence supporting the amounts and disclosures in the financial statements. Our audit also included evaluating the accounting principles used and significant estimates made by management, as well as evaluating the overall presentation of the financial statements. We believe that our audit provides a reasonable basis for our opinion.
|
/s/ Grant Thornton LLP Grant Thornton LLP
|
We have served as the Company’s auditor since 2017.
|
Dallas,
Texas |
| 58 |
Report of Independent Registered Public Accounting Firm
The Board of Directors and Shareholders
HMS Holdings Corp.:
We have audited the accompanying consolidated balance sheets of HMS Holdings Corp. and subsidiaries as of December 31, 2016, and the related consolidated statements of income, shareholders’ equity, and cash flows for each of the years in the two-year period ended December 31, 2016. In connection with our audits of the consolidated financial statements, we also have audited financial statement schedule II. These consolidated financial statements and financial statement schedule are the responsibility of the Company’s management. Our responsibility is to express an opinion on these consolidated financial statements and financial statement schedule based on our audits.
We conducted our audits in accordance with the standards of the Public Company Accounting Oversight Board (United States). Those standards require that we plan and perform the audit to obtain reasonable assurance about whether the financial statements are free of material misstatement. An audit includes examining, on a test basis, evidence supporting the amounts and disclosures in the financial statements. An audit also includes assessing the accounting principles used and significant estimates made by management, as well as evaluating the overall financial statement presentation. We believe that our audits provide a reasonable basis for our opinion.
In our opinion, the consolidated financial statements referred to above present fairly, in all material respects, the financial position of HMS Holdings Corp. and subsidiaries as of December 31, 2016, and the results of their operations and their cash flows for each of the years in the two-year period ended December 31, 2016, in conformity with U.S. generally accepted accounting principles. Also in our opinion, the related financial statement schedule, when considered in relation to the basic consolidated financial statements taken as a whole, presents fairly, in all material respects, the information set forth therein.
| /s/ KPMG LLP | |
| KPMG LLP | |
| Dallas, Texas | |
| June 6, 2017 |
| 59 |
Report of Independent Registered Public Accounting Firm
Board of Directors and Shareholders
HMS Holdings Corp.
Opinion on internal control over financial reporting
We have audited the internal control over financial reporting of HMS Holdings Corp. (a Delaware corporation) and subsidiaries (the “Company”) as of December 31, 2017, based on criteria established in the 2013 Internal Control—Integrated Framework issued by the Committee of Sponsoring Organizations of the Treadway Commission (“COSO”). In our opinion, the Company maintained, in all material respects, effective internal control over financial reporting as of December 31, 2017, based on criteria established in the 2013 Internal Control—Integrated Framework issued by COSO.
We also have audited, in accordance with the standards of the Public Company Accounting Oversight Board (United States) (“PCAOB”), the consolidated financial statements of the Company as of and for the year ended December 31, 2017, and our report dated February 27, 2018 expressed an unqualified opinion on those financial statements.
Basis for opinion
The Company’s management is responsible for maintaining effective internal control over financial reporting and for its assessment of the effectiveness of internal control over financial reporting, included in Management’s Report on Internal Control and Financial Reporting (“Management’s Report”). Our responsibility is to express an opinion on the Company’s internal control over financial reporting based on our audit. We are a public accounting firm registered with the PCAOB and are required to be independent with respect to the Company in accordance with the U.S. federal securities laws and the applicable rules and regulations of the Securities and Exchange Commission and the PCAOB.
We conducted our audit in accordance with the standards of the PCAOB. Those standards require that we plan and perform the audit to obtain reasonable assurance about whether effective internal control over financial reporting was maintained in all material respects. Our audit included obtaining an understanding of internal control over financial reporting, assessing the risk that a material weakness exists, testing and evaluating the design and operating effectiveness of internal control based on the assessed risk, and performing such other procedures as we considered necessary in the circumstances. We believe that our audit provides a reasonable basis for our opinion.
Our audit of, and opinion on, the Company’s internal control over financial reporting does not include the internal control over financial reporting of Eliza Holding Corp., a wholly-owned subsidiary, whose financial statements reflect total assets and revenues constituting twenty and six percent, respectively, of the related consolidated financial statement amounts as of and for the year ended December 31, 2017. As indicated in the accompanying Management’s Report, Eliza Holding Corp. was acquired during 2017. Management’s assertion on the effectiveness of the Company’s internal control over financial reporting excluded internal control over financial reporting of Eliza Holding Corp.
Definition and limitations of internal control over financial reporting
A company’s internal control over financial reporting is a process designed to provide reasonable assurance regarding the reliability of financial reporting and the preparation of financial statements for external purposes in accordance with generally accepted accounting principles. A company’s internal control over financial reporting includes those policies and procedures that (1) pertain to the maintenance of records that, in reasonable detail, accurately and fairly reflect the transactions and dispositions of the assets of the company; (2) provide reasonable assurance that transactions are recorded as necessary to permit preparation of financial statements in accordance with generally accepted accounting principles, and that receipts and expenditures of the company are being made only in accordance with generally accepted accounting principles, and that receipts and expenditures of the company are being made only in accordance with authorizations of management and directors of the company; and (3) provide reasonable assurance regarding prevention or timely detection of unauthorized acquisition, use, or disposition of the company’s assets that could have a material effect on the financial statements.
Because of its inherent limitations, internal control over financial reporting may not prevent or detect misstatements. Also, projections of any evaluation of effectiveness to future periods are subject to the risk that controls may become inadequate because of changes in conditions, or that the degree of compliance with the policies or procedures may deteriorate.
|
/s/ Grant Thornton LLP Grant Thornton LLP
|
| 60 |
HMS HOLDINGS CORP. AND SUBSIDIARIES
CONSOLIDATED BALANCE SHEETS
(in thousands, except share and per share amounts)
| December 31, 2017 | December 31, 2016 | |||||||
| Assets | ||||||||
| Current assets: | ||||||||
| Cash and cash equivalents | $ | 83,313 | $ | 175,999 | ||||
| Accounts receivable, net of allowance of $14,799 and $10,772, at December 31, 2017 and 2016, respectively | 189,460 | 173,582 | ||||||
| Prepaid expenses | 16,589 | 13,699 | ||||||
| Income tax receivable | 1,892 | 3,354 | ||||||
| Deferred financing costs, net | 564 | - | ||||||
| Other current assets | 836 | 1,001 | ||||||
| Total current assets | 292,654 | 367,635 | ||||||
| Property and equipment, net | 98,581 | 92,167 | ||||||
| Goodwill | 487,617 | 379,716 | ||||||
| Intangible assets, net | 91,482 | 37,797 | ||||||
| Deferred financing costs, net | 2,237 | 2,790 | ||||||
| Other assets | 2,589 | 2,650 | ||||||
| Total assets | $ | 975,160 | $ | 882,755 | ||||
| Liabilities and Shareholders' Equity | ||||||||
| Current liabilities: | ||||||||
| Accounts payable, accrued expenses and other liabilities | $ | 61,900 | $ | 59,402 | ||||
| Estimated liability for appeals | 30,787 | 30,755 | ||||||
| Total current liabilities | 92,687 | 90,157 | ||||||
| Long-term liabilities: | ||||||||
| Revolving credit facility | 240,000 | 197,796 | ||||||
| Net deferred tax liabilities | 21,989 | 22,717 | ||||||
| Deferred rent | 4,852 | 5,427 | ||||||
| Other liabilities | 9,403 | 10,048 | ||||||
| Total long-term liabilities | 276,244 | 235,988 | ||||||
| Total liabilities | 368,931 | 326,145 | ||||||
| Commitments and contingencies (Note 13) | ||||||||
| Shareholders' equity: | ||||||||
| Preferred stock -- $0.01 par value; 5,000,000 shares authorized; none issued | - | - | ||||||
| Common stock -- $0.01 par value; 175,000,000 shares authorized; 96,536,251 shares issued and 83,256,858 shares outstanding at December 31, 2017; 95,966,852 shares issued and 83,552,774 shares outstanding at December 31, 2016 | 965 | 959 | ||||||
| Capital in excess of par value | 368,721 | 345,025 | ||||||
| Retained earnings | 366,164 | 326,110 | ||||||
| Treasury stock, at cost -- 13,279,393 shares at December 31, 2017 and 12,414,078 shares at December 31, 2016 | (129,621 | ) | (115,484 | ) | ||||
| Total shareholders' equity | 606,229 | 556,610 | ||||||
| Total liabilities and shareholders' equity | $ | 975,160 | $ | 882,755 | ||||
See accompanying notes to the consolidated financial statements.
| 61 |
HMS HOLDINGS CORP. AND SUBSIDIARIES
CONSOLIDATED STATEMENTS OF INCOME
(in thousands, except per share amounts)
| Years Ended December 31, | ||||||||||||
| 2017 | 2016 | 2015 | ||||||||||
| Revenue | $ | 521,212 | $ | 489,720 | $ | 474,216 | ||||||
| Cost of services: | ||||||||||||
| Compensation | 202,049 | 189,271 | 178,272 | |||||||||
| Data processing | 45,723 | 37,337 | 40,915 | |||||||||
| Occupancy | 17,190 | 14,000 | 15,766 | |||||||||
| Direct project expenses | 41,347 | 46,254 | 51,527 | |||||||||
| Other operating expenses | 28,425 | 27,778 | 28,895 | |||||||||
| Amortization of acquisition related software and intangible assets | 30,393 | 28,030 | 28,148 | |||||||||
| Total cost of services | 365,127 | 342,670 | 343,523 | |||||||||
| Selling, general and administrative expenses | 105,654 | 89,381 | 83,121 | |||||||||
| Total operating expenses | 470,781 | 432,051 | 426,644 | |||||||||
| Operating income | 50,431 | 57,669 | 47,572 | |||||||||
| Interest expense | (10,871 | ) | (8,519 | ) | (7,812 | ) | ||||||
| Interest income | 295 | 321 | 49 | |||||||||
| Income before income taxes | 39,855 | 49,471 | 39,809 | |||||||||
| Income tax expense | (199 | ) | 11,835 | 15,282 | ||||||||
| Net income | $ | 40,054 | $ | 37,636 | $ | 24,527 | ||||||
| Basic income per common share: | ||||||||||||
| Net income per common share -- basic | $ | 0.48 | $ | 0.45 | $ | 0.28 | ||||||
| Diluted income per common share: | ||||||||||||
| Net income per common share -- diluted | $ | 0.47 | $ | 0.43 | $ | 0.28 | ||||||
| Weighted average shares: | ||||||||||||
| Basic | 83,821 | 84,221 | 87,881 | |||||||||
| Diluted | 85,088 | 86,987 | 88,361 | |||||||||
See accompanying notes to the consolidated financial statements
| 62 |
HMS HOLDINGS CORP. AND SUBSIDIARIES
CONSOLIDATED STATEMENTS OF SHAREHOLDERS’ EQUITY
(in thousands except share and per share amounts)
| Common Stock | Treasury Stock | |||||||||||||||||||||||||||
| # of Shares Issued | Par Value | Capital in Excess of Par Value | Retained Earnings | # of Shares | Amount | Total Shareholders' Equity | ||||||||||||||||||||||
| Balance at January 1, 2015 | 94,511,444 | $ | 943 | $ | 313,214 | $ | 263,947 | 6,526,305 | $ | (45,014 | ) | $ | 533,090 | |||||||||||||||
| Net income | - | - | - | 24,527 | - | - | 24,527 | |||||||||||||||||||||
| Stock-based compensation expense | - | - | 14,297 | - | - | - | 14,297 | |||||||||||||||||||||
| Purchase of treasury stock | - | - | - | - | 4,747,441 | (50,000 | ) | (50,000 | ) | |||||||||||||||||||
| Exercise of stock options | 577,559 | 7 | 4,180 | - | - | - | 4,187 | |||||||||||||||||||||
| Vesting of restricted stock awards and units, net of shares withheld for employee tax | 174,458 | 2 | (1,031 | ) | - | - | - | (1,029 | ) | |||||||||||||||||||
| Excess tax benefit from exercise of stock options | - | - | 1,569 | - | - | - | 1,569 | |||||||||||||||||||||
| Shortfall due to exercise of stock options | - | - | (827 | ) | - | - | - | (827 | ) | |||||||||||||||||||
| Deferred tax asset reversal for unexercised stock options | - | - | (1,112 | ) | - | - | - | (1,112 | ) | |||||||||||||||||||
| Balance at December 31, 2015 | 95,263,461 | $ | 952 | $ | 330,290 | $ | 288,474 | 11,273,746 | $ | (95,014 | ) | $ | 524,702 | |||||||||||||||
| Net income | - | - | - | 37,636 | - | - | 37,636 | |||||||||||||||||||||
| Stock-based compensation expense | - | - | 13,277 | - | - | - | 13,277 | |||||||||||||||||||||
| Purchase of treasury stock | - | - | - | - | 1,140,332 | (20,470 | ) | (20,470 | ) | |||||||||||||||||||
| Exercise of stock options | 510,512 | 5 | 2,935 | - | - | - | 2,940 | |||||||||||||||||||||
| Vesting of restricted stock awards and units, net of shares withheld for employee tax | 192,879 | 2 | (1,477 | ) | - | - | - | (1,475 | ) | |||||||||||||||||||
| Balance at December 31, 2016 | 95,966,852 | 959 | 345,025 | 326,110 | 12,414,078 | (115,484 | ) | 556,610 | ||||||||||||||||||||
| Net income | - | - | - | 40,054 | - | - | 40,054 | |||||||||||||||||||||
| Stock-based compensation expense | - | - | 24,143 | - | - | - | 24,143 | |||||||||||||||||||||
| Purchase of treasury stock | - | - | - | - | 865,315 | (14,137 | ) | (14,137 | ) | |||||||||||||||||||
| Exercise of stock options | 172,326 | 2 | 2,718 | - | - | - | 2,720 | |||||||||||||||||||||
| Vesting of restricted stock awards and units, net of shares withheld for employee tax | 397,073 | 4 | (3,165 | ) | - | - | - | (3,161 | ) | |||||||||||||||||||
| Balance at December 31, 2017 | 96,536,251 | $ | 965 | $ | 368,721 | $ | 366,164 | 13,279,393 | $ | (129,621 | ) | $ | 606,229 | |||||||||||||||
See accompanying notes to the consolidated financial statements.
| 63 |
HMS HOLDINGS CORP. AND SUBSIDIARIES
CONSOLIDATED STATEMENTS OF CASH FLOWS
(in thousands)
| Years ended December 31, | ||||||||||||
| 2017 | 2016 | 2015 | ||||||||||
| Operating activities: | ||||||||||||
| Net income | $ | 40,054 | $ | 37,636 | $ | 24,527 | ||||||
| Adjustments to reconcile net income to net cash provided by operating activities: | ||||||||||||
| Depreciation and amortization of property, equipment and software | 27,515 | 24,882 | 30,328 | |||||||||
| Amortization of intangible assets | 22,555 | 20,164 | 20,270 | |||||||||
| Amortization of deferred financing costs | 2,258 | 2,083 | 2,084 | |||||||||
| Stock-based compensation expense | 24,143 | 13,277 | 14,297 | |||||||||
| Deferred income taxes | (20,409 | ) | (7,368 | ) | (14,020 | ) | ||||||
| (Gain) / Loss on disposal of assets | 209 | (948 | ) | 84 | ||||||||
| Change in fair value of contingent consideration | (2,865 | ) | - | - | ||||||||
| Changes in operating assets and liabilities, net of the effect of acquisitions: | ||||||||||||
| Accounts receivable | (6,976 | ) | (3,554 | ) | (12,045 | ) | ||||||
| Prepaid expenses | (1,463 | ) | (2,399 | ) | 549 | |||||||
| Prepaid income taxes | - | - | 6,711 | |||||||||
| Other current assets | 165 | 2,066 | (412 | ) | ||||||||
| Other assets | 124 | 234 | 10 | |||||||||
| Income taxes receivable / (payable) | 1,462 | (7,227 | ) | 3,873 | ||||||||
| Accounts payable, accrued expenses, deferred rent and other liabilities | (340 | ) | 12,116 | (250 | ) | |||||||
| Estimated liability for appeals | 32 | (2,323 | ) | (3,721 | ) | |||||||
| Net cash provided by operating activities | 86,464 | 88,639 | 72,285 | |||||||||
| Investing activities: | ||||||||||||
| Acquisition of a business, net of cash acquired | (171,321 | ) | (20,678 | ) | - | |||||||
| Proceeds from sale of cost basis investment | - | 2,496 | - | |||||||||
| Purchases of property and equipment | (17,318 | ) | (13,703 | ) | (8,620 | ) | ||||||
| Investment in capitalized software | (15,725 | ) | (7,316 | ) | (3,197 | ) | ||||||
| Net cash used in investing activities | (204,364 | ) | (39,201 | ) | (11,817 | ) | ||||||
| Financing activities: | ||||||||||||
| Proceeds from credit facility | 42,204 | - | - | |||||||||
| Payments for deferred financing costs | (2,269 | ) | - | - | ||||||||
| Proceeds from exercise of stock options | 2,720 | 2,940 | 4,187 | |||||||||
| Payments of tax withholdings on behalf of employees for net-share settlement for stock-based compensation | (3,161 | ) | (1,475 | ) | (1,029 | ) | ||||||
| Payments on capital lease obligations | (143 | ) | (44 | ) | (1,132 | ) | ||||||
| Purchases of treasury stock | (14,137 | ) | (20,470 | ) | (50,000 | ) | ||||||
| Net cash provided by / (used in) financing activities | 25,214 | (19,049 | ) | (47,974 | ) | |||||||
| Net (decrease) / increase in cash and cash equivalents | (92,686 | ) | 30,389 | 12,494 | ||||||||
| Cash and cash equivalents | ||||||||||||
| Cash and cash equivalents at beginning of year | 175,999 | 145,610 | 133,116 | |||||||||
| Cash and cash equivalents at end of year | $ | 83,313 | $ | 175,999 | $ | 145,610 | ||||||
| Supplemental disclosure of cash flow information: | ||||||||||||
| Cash paid for income taxes | $ | 17,995 | $ | 20,326 | $ | 22,878 | ||||||
| Cash paid for interest | $ | 9,944 | $ | 6,196 | $ | 5,694 | ||||||
| Supplemental disclosure of noncash activities: | ||||||||||||
| Change in balance of accrued property and equipment purchases | $ | 51 | $ | 684 | $ | 729 | ||||||
See accompanying notes to the consolidated financial statements.
| 64 |
HMS HOLDINGS CORP. AND SUBSIDIARIES
NOTES TO THE CONSOLIDATED FINANCIAL STATEMENTS
| 1. | Business and Summary of Significant Accounting Policies |
(a) Business
HMS is a leading provider of cost containment solutions in the U.S. healthcare marketplace. We use innovative technology, extensive data services and powerful analytics to deliver coordination of benefits, payment integrity and care management and consumer engagement solutions to help healthcare payers improve financial performance and clinical outcomes. We provide coordination of benefits services to government and commercial healthcare payers and sponsors to ensure that the responsible party pays healthcare claims. Our payment integrity services ensure healthcare claims billed are accurate and appropriate, and our care management and consumer engagement technology helps risk-bearing organizations to better engage with and manage the care delivered to their members. Together these various services help customers recover erroneously paid amounts from liable third parties; prevent future improper payments; reduce fraud, waste and abuse; better manage the care their members receive; engage healthcare consumers to improve clinical outcomes while increasing member satisfaction and retention; and achieve regulatory compliance. We currently operate as one business segment with a single management team that reports to the Chief Executive Officer.
(b) Summary of Significant Accounting Policies
| (i) | Principles of Consolidation |
The consolidated financial statements include the Company’s accounts and transactions and those of the Company’s wholly owned subsidiaries. All intercompany balances and transactions have been eliminated in consolidation.
| (ii) | Use of Estimates |
The preparation of the consolidated financial statements in conformity with U.S. GAAP requires management to make estimates and assumptions that affect the reported amounts of assets and liabilities and disclosure of contingent assets and liabilities at the date of the financial statements and the reported amounts of revenues and expenses during the reporting period. Actual results could differ from those estimates.
| (iii) | Cash and Cash Equivalents |
The Company considers all highly liquid investments with an original maturity of three months or less to be cash equivalents. Cash equivalents consist of deposits that are readily convertible into cash.
| (iv) | Concentration of Credit Risk |
The Company’s policy is to limit credit exposure by placing cash in accounts which are exposed to minimal interest rate and credit risk. HMS maintains cash and cash equivalents in cash depository accounts with large financial institutions with a minimum credit rating of A1/P1 or better, as defined by Standard and Poor’s. The balance at these institutions generally exceeds the maximum balance insured by the Federal Deposit Insurance Corporation of up to $250,000 per entity. HMS has not experienced any losses in cash and cash equivalents and believes these cash and cash equivalents do not expose the Company to any significant credit risk.
The Company is subject to potential credit risk related to changes in economic conditions within the healthcare market. However, HMS believes that the billing and collection policies are adequate to minimize the potential credit risk. The Company performs ongoing credit evaluations of customers and generally does not require collateral.
| 65 |
| (v) | Property and Equipment |
Property and equipment are stated at cost less accumulated depreciation. Depreciation is provided over the estimated useful lives of the assets utilizing the straight-line method. HMS amortizes leasehold improvements on a straight-line basis which is typically five to ten years. Equipment leased under capital leases is depreciated over the shorter of (i) the term of the lease and (ii) the estimated useful life of the equipment. Capitalized software costs relate to software that is acquired or developed for internal use while in the application development stage. All other costs to develop software for internal use, either in the preliminary project stage or post-implementation stage, are expensed as incurred. Amortization of capitalized software is calculated on a straight-line basis over the expected economic life. Land is not depreciated.
Estimated useful lives are as follows:
| Property and Equipment | Useful Life (in years) | |||
| Equipment | 2 | to | 3 | |
| Leasehold improvements | 5 | to | 10 | |
| Furniture and fixtures | 5 | |||
| Capitalized software | 3 | to | 10 | |
| Building and building improvements | up to 39.5 | |||
Property and equipment is reviewed for impairment whenever events or changes in circumstances indicate that the carrying amount of the asset may not be recoverable. When indicators exist, recoverability of assets is measured by a comparison of the carrying value of the asset group to the estimated undiscounted future net cash flows expected to be generated by the asset. If such assets are considered to be impaired, the impairment to be recognized and charged to earnings is measured by the amount by which the carrying value of the asset group exceeds the fair value of the assets. The Company did not recognize any impairment charges related to property and equipment during the years ended December 31, 2017, 2016 or 2015.
| (vi) | Intangible assets |
The Company records assets acquired and liabilities assumed in a business combination based upon their acquisition date fair values. In most instances there is not a readily defined or listed market price for individual assets and liabilities acquired in connection with a business, including intangible assets. The Company determines fair value through various valuation techniques including discounted cash flow models, quoted market values and third party independent appraisals, as considered necessary. Significant assumptions used in those techniques include, but are not limited to, growth rates, discount rates, customer attrition rates, expected levels of revenues, earnings, cash flows and tax rates. The use of different valuation techniques and assumptions are highly subjective and inherently uncertain and, as a result, actual results may differ materially from estimates.
All of the Company’s intangible assets are subject to amortization and are amortized using the straight-line method over their estimated period of benefit. Estimated useful lives are as follows:
| Intangible Assets | Useful Life (in years) | |||
| Customer relationships | 5 | - | 15 | |
| Restrictive covenants | 1 | - | 3 | |
| Trade names | 1.5 | - | 7 | |
| Intellectual property | 3 | - | 5 | |
| 66 |
Intangible assets are reviewed for impairment whenever events or changes in circumstances indicate that the carrying amount of the asset may not be recoverable. When indicators exist, recoverability of assets is measured by a comparison of the carrying value of the asset group to the estimated undiscounted future net cash flows expected to be generated by the asset. If such assets are considered to be impaired, the impairment to be recognized and charged to earnings is measured by the amount by which the carrying value of the asset group exceeds the fair value of the assets. The Company did not recognize any impairment charges related to intangible assets during the years ended December 31, 2017, 2016 or 2015.
| (vii) | Goodwill |
Goodwill is the excess of acquisition costs over the fair values of assets and liabilities of acquired businesses. During the measurement period, which is up to one year from the acquisition date, the Company may record adjustments to the assets acquired and liabilities assumed, with the corresponding offset to goodwill. Upon the conclusion of the measurement period, any subsequent adjustments are recorded to earnings.
Goodwill is subject to a periodic assessment for impairment. The Company assesses goodwill for impairment on an annual basis as of June 30th of each year or more frequently if an event occurs or changes in circumstances would more likely than not reduce the fair value of a reporting unit below its carrying amount. Assessment of goodwill impairment is at the HMS Holdings Corp. entity level as the Company operates as a single reporting unit. The Company has the option to perform a qualitative assessment to determine if impairment is more likely than not to have occurred. When the optional qualitative assessment of goodwill impairment is performed, significant judgment is required in the assessment of qualitative factors including but not limited to an evaluation of macroeconomic conditions as they relate to our business, industry and market trends, as well as the overall future financial performance of our reporting units and future opportunities in the markets in which they operate. If the Company can support the conclusion that it is more likely than not that the fair value of a reporting unit is greater than its carrying amount using the optional qualitative assessment, then the Company would not need to perform the two-step impairment test. If the Company cannot support such a conclusion, or the Company does not elect to perform the qualitative assessment, then the first step of the goodwill impairment test is used to identify potential impairment by comparing the fair value of the reporting unit with its carrying amount, including goodwill. The Company completed the annual impairment test as of June 30, 2017 using the optional qualitative assessment and determined no impairment existed. There were no impairment charges related to goodwill during the years ended December 31, 2017, 2016 or 2015.
| (viii) | Income Taxes |
Income taxes are accounted for under the asset and liability method. Under this method, deferred tax assets and liabilities are recognized for the future tax consequences attributable to temporary differences between the financial statement carrying amounts of existing assets and liabilities and their respective tax bases. This method also requires the recognition of future tax benefits for net operating loss carry-forwards. Deferred tax assets and liabilities are measured using enacted tax rates expected to apply to taxable income in the years in which those temporary differences are expected to be recovered or settled. The effect on deferred tax assets and liabilities of a change in tax rates is recognized as income or expense in the period that includes the enactment date. A valuation allowance is provided against deferred tax assets to the extent their realization is not more likely than not. Uncertain income tax positions are accounted for by prescribing a minimum recognition threshold that a tax position is required to meet before being recognized in the financial statements. Although the Company believes that it has adequately reserved for uncertain tax positions (including interest and penalties), it can provide no assurance that the final tax outcome of these matters will not be materially different. The Company makes adjustments to these reserves in accordance with the income tax accounting guidance when facts and circumstances change, such as the closing of a tax audit or the refinement of an estimate. To the extent that the final tax outcome of these matters is different than the amounts recorded, such differences will affect the provision for income taxes in the period in which such determination is made, and could have a material impact on our financial condition and operating results.
| 67 |
| (ix) | Revenue Recognition |
The Company provides services under contracts that contain various fee structures, including contingency fee and fixed fee arrangements. Revenue is recognized when a contract exists, services have been provided to the customer, the fee is fixed and determinable, and collectability is reasonably assured. In addition, the Company has contracts with the federal government which are generally cost-plus or time and material based. Revenue on cost-plus contracts is recognized based on costs incurred plus the negotiated fee earned. Revenue on time and materials contracts is recognized based on hours worked and expenses incurred. In addition, some of the Company’s contracts may include customer acceptance provisions. Formal customer sign-off is not always necessary to recognize revenue, provided HMS objectively demonstrates that the criteria specified in the acceptance provision are satisfied. Due to the range of products and services that HMS provides and the differing fee structures associated with each type of contract, revenue may be recognized in irregular increments. A portion of our revenue is recorded net of an estimate of future revenue adjustments, with an offsetting entry to accounts receivable allowance, based on historical patterns of billing adjustments, length of operating and collection cycle and customer negotiations, behaviors and payment patterns. Changes in these estimates are recorded to revenue in the period of change.
| (x) | Estimated Liability for Appeals |
Under the Company’s contracts with certain commercial health plan customers and its Medicare RAC contracts with CMS, HMS recognizes revenue when HMS claim findings are sent to the Company’s customers for offset against future claim payments to providers. These contracts permit providers the right to appeal HMS claim findings and to pursue additional appeals if the initial appeal is found in favor of HMS’s customer. The appeal process established under the Medicare RAC contract with CMS includes five levels of appeals, and resolution of appeals can take substantial time to resolve. HMS records a) a liability for findings which have been adjudicated in favor of providers and b) an estimated liability based on the amount of revenue that is subject to appeals and which are probable of being adjudicated in favor of providers following their successful appeal. The Company’s estimate is based on the Company’s historical experience.
The total estimated liability for appeals balance of $30.8 million as of December 31, 2017 and December 31, 2016, respectively, includes $19.3 million and $17.3 million, respectively, of Medicare RAC claim findings which have been adjudicated in favor of providers, and $8.5 million and $11.1 million, respectively, of the Company’s estimate of the potential amount of Medicare RAC repayments that are probable of being adjudicated in favor of providers following a successful appeal. Additionally, the total estimated liability for appeals balance includes $3.0 million and $2.4 million related to commercial customers claim appeals. The provision included in the estimated liability for appeals is an offset to revenue in the Company’s Consolidated Statements of Income.
To the extent the amount to be returned to providers following a successful appeal exceeds or is less than the amount recorded, revenue in the applicable period would be reduced or increased by such amount. Any future changes to any of the Company’s customer contracts, including modifications to the Medicare RAC contract, may require the Company to apply different assumptions that could materially affect both the Company’s revenue and estimated liability for appeals in future periods.
| 68 |
| (xi) | Expense Classifications |
HMS cost of services is presented in the categories set forth below. Each category within cost of services excludes expenses relating to SG&A functions, which are presented separately as a component of total operating costs. A description of the primary expenses included in each category is as follows:
Cost of Services:
| § | Compensation: Salary, fringe benefits, bonus and stock-based compensation. |
| § | Data processing: Hardware, software and data communication costs. |
| § | Occupancy: Rent, utilities, depreciation, office equipment and repair and maintenance costs. |
| § | Direct project expense: Variable costs incurred from third party providers that are directly associated with specific revenue generating projects and employee travel expenses. |
| § | Other operating expenses: Professional fees, temporary staffing, travel and entertainment, insurance and local and property tax costs. |
| § | Amortization of acquisition related software and intangible assets: Amortization of the cost of acquisition related software and intangible assets. |
SG&A:
| § | Expenses related to general management, marketing and administrative activities. |
| (xii) | Estimating Valuation Allowances and Accrued Liabilities |
The preparation of financial statements requires management to make estimates and assumptions that affect the reported amount of assets and liabilities and disclosure of contingent assets and liabilities at the date of the financial statements and the reported amount of revenue and expenses during the reported period. In particular, management must make estimates of the probability of collecting accounts receivable. When evaluating the adequacy of the accounts receivable allowance, management reviews the accounts receivables based on an analysis of historical revenue adjustments, bad debts, customer concentrations, customer credit-worthiness, current economic trends and changes in customer payment terms. As of December 31, 2017 and 2016, the accounts receivable balance was $189.5 million and $173.6 million, net of allowance of $14.8 million and $10.8 million, respectively.
| (xiii) | Stock-Based Compensation |
Long-Term Incentive Award Plans
The Company grants stock options and restricted stock units (“equity awards”) to HMS employees and non-employee directors under the 2016 Omnibus Plan, as approved by the Company’s shareholders on June 23, 2016. The 2016 Omnibus Plan replaced and superseded the Company’s 2006 Stock Plan and 2011 HDI Plan. The number of securities remaining available for future issuance under equity compensation plans, excluding securities to be issued upon exercise of outstanding options and vesting of restricted stock units, is 6,031,554 shares. All of the Company’s employees as well as HMS non-employee directors are eligible to participate in the 2016 Omnibus Plan. Awards granted under the 2016 Omnibus Plan generally vest over one to four years. The exercise price of stock options granted under the 2016 Omnibus Plan may not be less than the fair market value of a share of stock on the grant date, as measured by the closing price of the Company’s common stock on the Nasdaq Global Select Market and the term of a stock option may not exceed ten years. The Company currently grants two types of equity awards: 1) equity awards with service conditions and 2) equity awards with market and service conditions. The market condition is based on the Company’s common stock price during the applicable measurement period.
Stock-Based Compensation Expense
The Company recognizes stock-based compensation expense equal to the grant date fair value of the award on a straight-line basis over the requisite service period.
The fair value of each option grant with only service-based conditions is estimated using the Black-Scholes pricing model. The fair value of each option grant with market and service-based conditions is estimated using a Monte Carlo simulation model. The fair value of each restricted stock unit is calculated based on the closing sale price of the Company’s common stock on the grant date.
| 69 |
The determination of the fair value of the options on the grant date using the Black-Scholes pricing model and/or the Monte Carlo simulation model is affected by the Company’s stock price, as well as assumptions regarding a number of complex and subjective variables. Certain key variables include: the Company’s expected stock price volatility over the expected term of the awards; a risk-free interest rate; and any expected dividends. The Company estimates stock price volatility based on the historical volatility of the Company’s common stock and estimates the expected term of the awards based on the Company’s historical option exercises for similar types of stock option awards. The assumed risk-free interest rate is based on the yield on the measurement date of a zero-coupon U.S. Treasury bond with a maturity period equal to the option’s expected term. The Company does not anticipate paying any cash dividends in the foreseeable future and therefore, uses an expected dividend yield of zero in the option valuation models. The fair value of all awards also includes an estimate of expected forfeitures. Forfeitures are estimated based on historical experience. If actual forfeitures vary from estimates, a difference in compensation expense will be recognized in the period the actual forfeitures occur. Upon the exercise of stock options or the vesting of restricted stock units, the resulting excess tax benefits or deficiencies, if any, are recognized as income tax expense or benefit.
| (xiv) | Fair Value of Financial Instruments |
Financial instruments are categorized into a three-level fair value hierarchy that prioritizes the inputs to valuation techniques used to measure fair value into three broad levels. The fair value hierarchy gives the highest priority to quoted prices in active markets for identical assets or liabilities (Level 1) and the lowest priority to unobservable inputs (Level 3). If the inputs used to measure fair value fall within different levels of the hierarchy, the category level is based on the lowest priority level input that is significant to the fair value measurement of the instrument. In the event the fair value is not readily available or determinable, the financial instrument is carried at cost and referred to as a cost method investment. The fair value hierarchy is as follows:
| § | Level 1: Observable inputs such as quoted prices in active markets; |
| § | Level 2: Inputs, other than the quoted prices in active markets, that are observable either directly or indirectly; and |
| § | Level 3: Unobservable inputs in which there is little or no market data, which require the reporting entity to develop its own assumptions. |
| (xv) | Leases |
HMS accounts for lease agreements as either operating or capital leases, depending on certain defined criteria. Lease costs are amortized on a straight-line basis without regard to deferred payment terms, such as rent holidays, that defer the commencement date of required payments. Additionally, incentives such as tenant improvement allowances, are capitalized and are treated as a reduction of rental expense over the term of the lease agreement.
| (xvi) | Contingencies |
From time to time, HMS is involved in legal proceedings in the ordinary course of business. The Company assesses the likelihood of any adverse judgments or outcomes to these contingencies as well as potential ranges or probable losses and establishes reserves accordingly. HMS records accruals for outstanding legal matters when it believes it is probable that a loss will be incurred and the amount can be reasonable estimated. Significant judgment is required to determine both probability and the estimated amount. HMS reviews these provisions at least quarterly and adjusts the provisions to reflect the impact of negotiations, settlements, rulings, advice of legal counsel and updated information. Litigation is inherently unpredictable and is subject to significant uncertainties, some of which are beyond the Company’s control. The amount of reserves required may change in future periods due to new developments in each matter or changes in approach to a matter such as a change in settlement strategy.
| 70 |
| (xvii) | Recent Accounting Guidance |
Recently Adopted Accounting Guidance
In April 2015, the FASB issued ASU No. 2015-05, Intangibles – Goodwill and Other – Internal-Use Software (Subtopic 350-40): Customer’s Accounting for Fees Paid in a Cloud Computing Arrangement (“ASU 2015-05”). ASU 2015-05 provides explicit guidance to help companies evaluate the accounting for fees paid by a customer in a cloud computing arrangement and clarifies that if a cloud computing arrangement includes a software license, the customer should account for the license consistent with its accounting for other software licenses. If the arrangement does not include a software license, the customer should account for the arrangement as a service contract. ASU 2015-05 is effective for annual reporting periods beginning after December 15, 2015, including interim periods within such annual reporting periods with early adoption permitted. The adoption of this guidance did not have a material effect on the Company’s consolidated financial statements.
In September 2015, the FASB issued ASU No. 2015-16, Simplifying the Accounting for Measurement-Period Adjustments, (“ASU 2015-16”). ASU 2015-16 eliminates the requirement to restate prior period financial statements for business combination measurement period adjustments. ASU 2015-16 requires the cumulative impact of a measurement period adjustment, including the impact of prior periods, be recognized in the reporting period in which the adjustment is identified. The guidance requires an acquirer to present separately on the face of the income statement, or disclose in the notes, the portion of the adjustment recorded in current-period earnings by line item that would have been recorded in previous reporting periods, if the adjustment to the provisional amounts had been recognized as of the acquisition date. ASU 2015-16 is applied prospectively and is effective for public business entities for interim and annual periods beginning after December 15, 2015. The adoption of this guidance did not have a material effect on the Company’s consolidated financial statements.
In November 2015, the FASB issued ASU No. 2015-17, Income Taxes (Topic 740): Balance Sheet Classification of Deferred Taxes (“ASU 2015-17”). ASU 2015-17 simplifies the current presentation of separately classifying deferred tax assets and deferred tax liabilities as current and noncurrent in a classified balance sheet by requiring companies to present them as noncurrent. ASU 2015-17, as amended, is effective for annual reporting periods beginning after December 15, 2016, including interim periods within such annual reporting periods with early adoption permitted. The Company elected to early adopt the new guidance in the fourth quarter of fiscal year 2016. The Company elected to apply the presentation requirements for the balance sheet retrospectively to all periods presented which resulted in a decrease to total current assets and total long term liabilities of $7.5 million at December 31, 2015.
In March 2016, the FASB issued ASU No. 2016-09, Compensation – Stock Compensation (Topic 718): Improvements to Employee Share-Based Payment Accounting, (“ASU 2016-09”) that changes the accounting for certain aspects of share-based payments to employees. The new guidance requires excess tax benefits and tax deficiencies to be recorded in the income statement when stock awards vest or are settled. In addition, cash flows related to excess tax benefits will no longer be separately classified as a financing activity apart from other income tax cash flows. The standard also allows Companies to repurchase more of an employee’s vesting shares for tax withholding purposes without triggering liability accounting, clarifies that all cash payments made to tax authorities on an employee’s behalf for withheld shares should be presented as a financing activity on the cash flows statement and provides an accounting policy election to account for forfeitures as they occur. ASU 2016-09 is effective for annual reporting periods beginning after December 15, 2016, including interim periods within such annual reporting periods with early adoption permitted. The Company elected to early adopt the new guidance in the fourth quarter of fiscal year 2016 which requires us to reflect any adjustments as of January 1, 2016, the beginning of the annual period that includes the interim period of adoption. The primary impact of adoption was the recognition of excess tax benefits in the provision for income taxes rather than paid-in capital for all periods in fiscal year 2016. Additional amendments to the accounting for income taxes and minimum statutory withholding tax requirements had no impact to retained earnings as of January 1, 2016, where the cumulative effect of these changes are required to be recorded. The Company elected to continue to estimate forfeitures expected to occur to determine the amount of compensation cost to be recognized in each period. The Company elected to apply the presentation requirements for cash flows related to excess tax benefits retrospectively to all periods presented which resulted in an increase to both net cash from operations and net cash used in financing of $1.6 million for the year ended December 31, 2015. Adoption of the new standard resulted in the recognition of net excess tax benefits in the provision for income taxes rather than paid-in capital of $1.9 million for the year ended December 31, 2016. The presentation requirements for cash flows related to employee taxes paid for withheld shares had no impact to any the 2016 and 2015 periods presented on the consolidated statements of cash flow since such cash flows have historically been presented as a financing activity.
| 71 |
Recent Accounting Guidance Not Yet Adopted
In May 2014, the FASB issued ASU No. 2014-09, Revenue from Contracts with Customers (Topic 606) (“ASU 2014-09”), which is the new comprehensive revenue recognition standard that will supersede all existing revenue recognition guidance under U.S. GAAP. The FASB has recently issued several amendments to the standard. ASU 2014-09 is effective for annual reporting periods beginning after December 15, 2017, including interim periods within such annual reporting periods with early adoption permitted. The Company does not plan to early adopt this guidance and therefore will adopt on January 1, 2018. The guidance permits two methods of adoption: retrospectively to each prior reporting period presented (full retrospective method), or retrospectively with the cumulative effect of initially applying the guidance recognized at the date of initial application (modified retrospective method). The Company will adopt ASU 2014-09 using the modified retrospective method. The Company, with the assistance of external consultants, developed and followed a formal implementation program, which included analyzing the standard’s impact on our contract portfolio, comparing our historical accounting policies and practices to the requirements of the new standard, and identifying differences from applying the requirements of the new standard to our contracts, We also developed transitional internal controls to ensure the adequate implementation of this guidance including, reporting on the progress of the implementation to those in charge of governance on a regular basis during the project’s duration. We have completed our assessment and contract review. Based on the analysis, the Company believes the impact of adopting the new guidance is not material to the results of operations; however, adoption of this guidance will require changes to business processes and systems to support the new revenue recognition accounting and additional required disclosures. The Company does not anticipate that our internal control framework will materially change, but rather that existing internal controls will be modified and augmented as necessary.
In February 2016, the FASB issued ASU No. 2016-02, Leases (Topic 842) (“ASU 2016-02”). ASU 2016-02 will require most lessees to recognize a majority of the company’s leases on the balance sheet, which will increase reported assets and liabilities. ASU 2016-02 is effective for annual reporting periods beginning after December 15, 2018 including interim periods within such annual reporting periods with early adoption permitted. The Company has not early adopted this guidance and is currently evaluating the impact on the Company’s consolidated financial statements of adopting this guidance. The Company does not expect this guidance to have a material impact to the Company’s results of operations.
In August 2016, the FASB issued ASU No. 2016-15, Statements of Cash Flows (Topic 230): Classification of Certain Cash Receipts and Cash Payments (“ASU 2016-15”). ASU 2016-15 clarifies where certain cash receipts and cash payments are presented and classified in the statement of cash flows. The amendments are effective for annual reporting periods beginning after December 15, 2017, and for interim reporting periods within such annual periods. The adoption of this guidance is not expected to have a material effect on the Company’s consolidated financial statements.
In January 2017, the FASB issued ASU No. 2017-01, Business Combinations (Topic 805) – Clarifying the Definition of a Business (“ASU 2017-01”). ASU 2017-01 finalizes previous proposals regarding shareholder concerns that the definition of a business is applied too broadly. The guidance assists entities with evaluating whether transactions should be accounted for as acquisitions of assets or of businesses. The amendments are effective for annual periods beginning after December 15, 2017, including interim periods within those periods. The adoption of this guidance is not expected to have a material effect on the Company’s consolidated financial statements.
In January 2017, the FASB issued ASU No. 2017-04, Goodwill and Other (Topic 350): Simplifying the Test for Goodwill Impairment (“ASU 2017-04”). This amendment simplifies the manner in which an entity is required to test for goodwill impairment by eliminating Step 2 from the goodwill impairment test. Step 2 measures goodwill impairment loss by comparing the implied fair value of a reporting unit’s goodwill with the carrying amount of that goodwill. The amendment simplifies this approach by having the entity (1) perform its annual or interim goodwill impairment test by comparing the fair value of a reporting unit with its carrying amount, and (2) recognize an impairment charge for the amount by which the carrying amount exceeds the reporting unit’s fair value, with the understanding that the loss recognized should not exceed the total amount of goodwill allocated to that reporting unit. The amendment is effective in fiscal years beginning after December 15, 2019. Early adoption is permitted for all entities for interim or annual goodwill impairment tests performed on testing dates after January 1, 2017. The Company does not expect this guidance to have a material impact to the Company’s financial position or results of operations.
| 72 |
In May 2017, the FASB issued ASU No. 2017-09, Compensation – Stock Compensation (Topic 718): Scope of Modification Accounting, (“ASU 2017-09”). ASU 2017-09 requires entities to apply modification accounting to changes made to a share-based payment award. The new guidance specifies that entities will apply modification accounting to changes to a share-based payment award only if any of the following are not the same immediately before and after the change: 1) The award’s fair value (or calculated value or intrinsic value, if those measurement methods are used), 2) the award’s vesting conditions, and 3) the award’s classification as an equity or liability instrument. ASU 2017-09 is effective for annual reporting periods beginning after December 15, 2017, including interim periods within such annual periods, with early adoption permitted. The Company does not plan to early adopt this guidance and therefore will adopt on January 1, 2018. The Company does not expect this guidance to have a material impact to the Company’s financial position or results of operations.
| 2. | Fair Value of Financial Instruments |
Financial instruments (principally cash and cash equivalents, accounts receivable, accounts payable and accrued expenses) are carried at cost, which approximates fair value due to the short-term maturity of these instruments. The Company’s long-term credit facility is carried at cost, which due to the variable interest rate associated with the revolving credit facility, cost approximates its fair value. The Company has no Level 1 or Level 2 financial instruments and there were no transfers between Level 1 or Level 2 financial instruments. Included in Other liabilities on the Consolidated Balance Sheets at December 31, 2017 is a $35,000 contingent consideration liability classified as Level 3. The liability is valued using a Monte Carlo simulation and includes unobservable inputs such as expected levels of revenues and discount rates. Changes in the unobservable inputs in the fair value measurement of this instrument could result in a significant change in the fair value measurement.
The following table summarizes the changes in fair value for all financial instruments measured at fair value on a recurring basis using significant unobservable inputs (Level 3) (in thousands):
| Beginning balance as of January 1, 2016 | - | |||
| Sales | - | |||
| Settlements | - | |||
| Purchases | - | |||
| Issuances | 2,900 | |||
| Net (gains)/losses included in selling, general and administrative expenses | - | |||
| Transfers into Level 3 | - | |||
| Transfers out of Level 3 | - | |||
| Ending balance as of December 31, 2016 | $ | 2,900 | ||
| Sales | - | |||
| Settlements | - | |||
| Purchases | - | |||
| Issuances | - | |||
| Net (gains)/losses included in selling, general and administrative expenses | (2,865 | ) | ||
| Transfers into Level 3 | - | |||
| Transfers out of Level 3 | - | |||
| Ending balance as of December 31, 2017 | $ | 35 | ||
| 73 |
| 3. | Acquisitions |
| (a) | Eliza Holding Corp. |
On April 17, 2017, the Company completed the acquisition of 100% of the outstanding capital stock of Eliza, for a preliminary purchase price of $171.6 million funded with available liquidity of approximately 75% cash on hand and 25% from the Company’s existing credit line. Eliza is a cloud based technology platform which provides comprehensive and personalized health engagement solutions designed to improve clinical outcomes and reduce costs. Eliza reaches and engages members through a proprietary, scalable technology solution that leverages a multi-channel communications platform incorporating consumer and proprietary data sources, analytics, and behavior-driven program design to help clients achieve desired outcomes.
The purchase price was subject to certain post-closing purchase price adjustments and the initial purchase price allocation as of the date of acquisition was based on a preliminary valuation. Estimates and assumptions for which the Company is still obtaining or evaluating information are subject to change up to one year from the acquisition date as additional information becomes available and adjustments may require a change in the amounts allocated to goodwill during the periods in which the adjustments are determined. The intangible assets are valued using various methods which requires several judgments, including growth rates, discount rates, customer attrition rates, and expected levels of revenues, earnings, cash flows and tax rates. The intangible assets are amortized over their estimated useful lives on a straight-line basis and are not expected to be deductible for taxable purposes. As such, the Company recorded a net deferred tax liability which is comprised of deferred tax liabilities recognized in connection with the acquired intangible assets partially offset by deferred tax assets associated with acquired net operating loss carryforwards and credits. Goodwill was determined based on the difference between the purchase price and the fair values of the tangible and intangible assets acquired. Goodwill recognized from the acquisition was a result of synergies to be realized from future revenue growth is not deductible for tax purposes, has an indefinite useful life and will be included in the Company’s annual impairment testing or between annual tests if an indicator of impairment exists.
During the third and fourth quarters of fiscal 2017, the Company made adjustments to the preliminary purchase price allocation which resulted in an increase of $8.9 million to the fair value of acquired intangible assets, a decrease of $1.8 million to the fair value of the acquired tangible assets, an increase of $3.6 million to the deferred tax liability associated with the acquired intangible assets and a decrease of $3.5 million to goodwill. The Company also changed the estimated useful life of the acquired customer relationships intangible asset from 36 years to 15 years. The updated allocation of the purchase price to the fair value of the assets acquired and the liabilities assumed as of April 17, 2017, the effective date of the acquisition, is as follows (in thousands):
| Cash and cash equivalents | $ | 435 | ||
| Accounts receivable | 8,902 | |||
| Prepaid expenses | 1,427 | |||
| Property and equipment | 1,146 | |||
| Intangible assets | 76,240 | |||
| Goodwill | 107,754 | |||
| Other assets | 63 | |||
| Accounts payable | (2,620 | ) | ||
| Deferred tax liability | (19,681 | ) | ||
| Other liabilities | (2,057 | ) | ||
| Total purchase price | $ | 171,609 |
| 74 |
The purchase price allocated to the intangibles acquired was as follows (in thousands):
Useful Life (in years) | ||||||
| Customer relationships | 15 | $ | 56,200 | |||
| Intellectual property | 6 | 19,600 | ||||
| Trade name | 1.5 | 310 | ||||
| Restrictive covenants | 1 | 130 | ||||
| Fair value of intangibles acquired | $ | 76,240 | ||||
Acquisition costs recorded to selling, general and administrative expenses were as follows (in thousands):
| Other operating expenses - consulting fees | $ | 3,515 | ||
| Other operating expenses - legal fees | 832 | |||
| Other operating expenses - transaction costs | 185 | |||
| Acquisition-related costs | $ | 4,532 |
The financial results of Eliza have been included in the Company’s consolidated financial statements since the date of acquisition. Eliza contributed approximately $30.4 million in revenue to HMS results of operations from the date of acquisition through December 31, 2017.
| (b) | Essette |
On September 2, 2016, the Company acquired the outstanding capital stock of Essette, a care management technology company which helps risk-bearing organizations manage the care delivered to their members, for aggregate consideration of $24.2 million, which is primarily comprised of cash payments of $21.3 million. To fund the purchase price, the Company utilized cash on hand. The purchase price was subject to adjustment based upon the final amount of adjusted working capital of Essette at closing.
The Company allocated the purchase price, net of cash acquired, to a) at their acquisition date fair values, the following tangible assets: net deferred tax assets of $0.9 million and other net assets of $0.9 million and b) at their acquisition date fair values, the following amortizing intangible assets: intellectual property of $2.1 million, customer relationships of $1.3 million, restrictive covenants of $0.1 million, and trade name of $0.1 million. Goodwill of $18.2 million represents the excess purchase price over the net identifiable tangible and intangible assets. The intangible assets are valued using various methods which requires several judgments, including growth rates, discount rates, customer attrition rates, and expected levels of revenues, earnings, cash flows and tax rates. The intangible assets are amortized over their estimated useful lives on a straight-line basis and are not expected to be deductible for tax purposes. The goodwill recognized from the acquisition was a result of expected synergies to be realized from future revenue growth, is not expected to be deductible for tax purposes, has an indefinite useful life and will be included in the Company’s annual impairment testing. Contingent consideration, up to an aggregate maximum of $12.0 million, will be payable in calendar years 2017, 2018, or 2019, respectively, should Essette achieve certain revenue targets as defined in the stock purchase agreement. The contingent consideration is valued using a method which requires several judgments but primarily include discount rates and expected levels of revenues. In the fourth quarter 2016, purchase accounting adjustments included a $1.1 million increase to total transaction consideration and to goodwill, a $0.7 million increase to other net assets, and a $0.2 million increase in the customer relationship intangible. In the second quarter of 2017, the Company recorded a final working capital adjustment of $147,000 to goodwill.
The immaterial results of Essette’s operations since September 2, 2016 have been included in the Company’s consolidated financial statements.
| 75 |
As a result of the Eliza acquisition and subsequent adjustment related to Essette, the changes in the carrying amount of goodwill were as follows (in thousands):
| Balance at December 31, 2017 | $ | 487,617 | ||
| Eliza acquisition | 107,754 | |||
| Essette adjustment | 147 | |||
| Balance at December 31, 2016 | $ | 379,716 | ||
| Essette acquisition | 18,248 | |||
| Balance at December 30, 2015 | $ | 361,468 |
| 4. | Property and Equipment |
Property and equipment consisted of the following (in thousands):
| December 31, | ||||||||
| 2017 | 2016 | |||||||
| Equipment | $ | 106,768 | $ | 94,345 | ||||
| Leasehold improvements | 8,357 | 8,637 | ||||||
| Building | 8,624 | 8,624 | ||||||
| Building improvements | 14,546 | 12,671 | ||||||
| Land | 2,769 | 2,769 | ||||||
| Furniture and fixtures | 10,352 | 10,728 | ||||||
| Capitalized software | 125,655 | 110,696 | ||||||
| 277,071 | 248,470 | |||||||
| Less: accumulated depreciation and amortization | (178,490 | ) | (156,303 | ) | ||||
| Property and equipment, net | $ | 98,581 | $ | 92,167 | ||||
| December 31, | ||||||||||||
| (in thousands) | 2017 | 2016 | 2015 | |||||||||
| Depreciation and amortization expense related to property and equipment | $ | 27,515 | $ | 24,882 | $ | 30,328 | ||||||
| 76 |
| 5. | Intangible Assets |
Intangible assets consisted of the following (in thousands):
| Gross Carrying Amount | Accumulated Amortization | Net Carrying Amount | Weighted Average Amortization Period (in years) | |||||||||||||
| December 31, 2017 | ||||||||||||||||
| Customer relationships | $ | 159,290 | $ | (89,106 | ) | $ | 70,184 | 11.3 | ||||||||
| Trade names | 16,246 | (13,916 | ) | 2,330 | 1 | |||||||||||
| Intellectual property | 21,700 | (2,874 | ) | 18,826 | 5.2 | |||||||||||
| Restrictive covenants | 263 | (121 | ) | 142 | 1.3 | |||||||||||
| Total | $ | 197,499 | $ | (106,017 | ) | $ | 91,482 | 18.6 | ||||||||
| Gross Carrying Amount | Accumulated Amortization | Net Carrying Amount | Weighted Average Amortization Period (in years) | |||||||||||||
| December 31, 2016 | ||||||||||||||||
| Customer relationships | $ | 103,090 | $ | (71,914 | ) | $ | 31,176 | 11.3 | ||||||||
| Trade names | 15,936 | (11,393 | ) | 4,543 | 1 | |||||||||||
| Intellectual property | 2,100 | (140 | ) | 1,960 | 5.2 | |||||||||||
| Restrictive covenants | 133 | (15 | ) | 118 | 1.3 | |||||||||||
| Total | $ | 121,259 | $ | (83,462 | ) | $ | 37,797 | 18.6 | ||||||||
Amortization expense of intangible assets is expected to approximate the following (in thousands):
| Year ending December 31, | ||||
| 2018 | $ | 23,858 | ||
| 2019 | 9,258 | |||
| 2020 | 7,804 | |||
| 2021 | 7,477 | |||
| 2022 | 7,197 | |||
| Thereafter | 35,888 | |||
| Total | $ | 91,482 | ||
For the years ended December 31, 2017, 2016 and 2015, amortization expense related to intangible assets was $22.6 million, $20.2 million and $20.3 million, respectively.
| 6. | Accounts Payable, Accrued Expenses and Other Liabilities |
Accounts payable, accrued expenses and other liabilities consisted of the following (in thousands):
| December 31, 2017 | December 31, 2016 | |||||||
| Accounts payable, trade | $ | 19,330 | $ | 13,847 | ||||
| Accrued compensation and other | 24,072 | 28,507 | ||||||
| Accrued operating expenses | 18,498 | 17,048 | ||||||
| Total accounts payable, accrued expenses and other liabilities | $ | 61,900 | $ | 59,402 | ||||
| 77 |
| 7. | Income Taxes |
Income tax expense is as follows (in thousands):
| December 31, | ||||||||||||
| 2017 | 2016 | 2015 | ||||||||||
| Current tax expense: | ||||||||||||
| Federal | $ | 17,008 | $ | 16,274 | $ | 25,852 | ||||||
| State | 3,201 | 2,929 | 3,450 | |||||||||
| Total current tax expense: | 20,209 | 19,203 | 29,302 | |||||||||
| Deferred tax expense (benefit): | ||||||||||||
| Federal | (19,425 | ) | (7,115 | ) | (12,571 | ) | ||||||
| State | (983 | ) | (253 | ) | (1,449 | ) | ||||||
| Total deferred tax benefit: | (20,408 | ) | (7,368 | ) | (14,020 | ) | ||||||
| Total income tax expense | $ | (199 | ) | $ | 11,835 | $ | 15,282 | |||||
A reconciliation of the income tax expense calculated using the applicable federal statutory rate to the actual income tax expense is as follows (in thousands):
| December 31, | ||||||||||||||||||||||||
| 2017 | % | 2016 | % | 2015 | % | |||||||||||||||||||
| Computed at federal statutory rate | $ | 13,949 | 35.0 | $ | 17,315 | 35.0 | $ | 13,934 | 35.0 | |||||||||||||||
| State and local tax expense, net of federal benefit | 2,226 | 5.6 | 2,448 | 5.0 | 1,038 | 2.6 | ||||||||||||||||||
| Net permanent deduction and credit tax benefits from prior years | - | - | (6,213 | ) | (12.6 | ) | - | - | ||||||||||||||||
| Net permanent deduction and credit tax benefits from current year | (1,513 | ) | (3.8 | ) | (1,509 | ) | (3.1 | ) | - | - | ||||||||||||||
| Tax Reform - Revaluation of Deferrals | (15,130 | ) | (38.0 | ) | - | - | - | - | ||||||||||||||||
| Acquisition adjustments | (1,003 | ) | (2.5 | ) | - | - | - | - | ||||||||||||||||
| Acquisition costs | 697 | 1.7 | 203 | 0.4 | - | - | ||||||||||||||||||
| Other, net | 575 | 1.5 | (409 | ) | (0.8 | ) | 310 | 0.8 | ||||||||||||||||
| Total income tax expense | $ | (199 | ) | (0.5 | ) | $ | 11,835 | 23.9 | $ | 15,282 | 38.4 | |||||||||||||
The Company’s effective tax rate decreased to (0.5%) for the year ended December 31, 2017 from 23.9% for the year ended December 31, 2016, primarily due to the revaluation of the Company’s deferred tax balances from the federal tax rate reduction of 35% to 21% under the 2017 Tax Act which was signed into law on December 22, 2017. The net benefits for the 2017 Tax Act as recorded as provisional amounts as of December 31, 2017, represent the Company's best estimate using information available to the Company as of February 27, 2018. The Company anticipates U.S. regulatory agencies will issue further regulations over the next year which may alter this estimate. The Company is still evaluating, among other things, the application of limitations for executive compensation related to contracts existing prior to November 2, 2017. The Company will refine its estimates to incorporate new or better information as it comes available through the filing date of its 2017 U.S. income tax returns in the fourth quarter of 2018.
As a result of an analysis performed during 2016, the Company determined certain activities it performs qualify for (i) R&D Credits provided in IRC Section 41 and (ii) the Section 199 Deduction provided in IRC Section 199. As a result, the Company recognized net tax benefits during the year ended December 31, 2016 of $6.2 million for federal and state R&D Credits and the Section 199 Deduction relating to tax years 2012 through 2015.
| 78 |
Deferred income taxes are recognized for the future tax consequences of temporary differences between the financial statement and tax bases of assets and liabilities. The tax effect of temporary differences that give rise to a significant portion of the deferred tax assets and deferred tax liabilities are as follows (in thousands):
| December 31, | ||||||||
| 2017 | 2016 | |||||||
| Deferred tax assets: | ||||||||
| Stock-based compensation | $ | 9,980 | $ | 10,373 | ||||
| Goodwill and intangible assets | 6,524 | 10,711 | ||||||
| Allowance for doubtful accounts | 3,822 | 4,108 | ||||||
| Deferred rent | 909 | 1,120 | ||||||
| Tenant improvements | 669 | 1,226 | ||||||
| Estimated liability for appeals | 7,775 | 11,596 | ||||||
| Net operating loss carry-forwards | 3,358 | 2,141 | ||||||
| Tax credit carry-forwards | 3,667 | - | ||||||
| Property and equipment | 256 | 79 | ||||||
| Accrued expenses and other | 3,615 | 7,811 | ||||||
| Total deferred tax assets | 40,575 | 49,165 | ||||||
| Deferred tax liabilities: | ||||||||
| Goodwill and intangible assets | 48,186 | 52,729 | ||||||
| Section 481(a) adjustment | 7,413 | 14,757 | ||||||
| Prepaid expenses | 624 | - | ||||||
| Capitalized software cost | 6,341 | 4,396 | ||||||
| Total deferred tax liabilities | 62,564 | 71,882 | ||||||
| Total net deferred tax liabilities | $ | 21,989 | $ | 22,717 | ||||
Included in Other liabilities on the Consolidated Balance Sheets, are the total amount of unrecognized tax benefits of approximately $8.2 million and $7.4 million as of December 31, 2017 and 2016, respectively, net of the federal benefit for state issues that, if recognized, would favorably affect the Company’s future effective tax rate. Also included in Other Liabilities on the Consolidated Balance Sheets, are accrued liabilities for interest expense and penalties related to unrecognized tax benefits of $0.6 million at both December 31, 2017 and 2016. HMS includes interest expense and penalties in the provision for income taxes in the Consolidated Statements of Income. The amount of interest expense, net of federal and state income tax benefits, and penalties in the Consolidated Statements of Income for the years ended December 31, 2017, 2016 and 2015 was $0.02 million, $0.2 million and $0.6 million, respectively. The Company believes it is reasonably possible the amount of unrecognized tax benefits may decrease by $1.8 million during 2018, due to the expiration of the statute of limitations in various jurisdictions.
A reconciliation of the beginning and ending amounts of unrecognized tax benefits are as follows (in thousands):
| December 31, | ||||||||
| 2017 | 2016 | |||||||
| Unrecognized tax benefits at January 1 | $ | 7,433 | $ | 1,329 | ||||
| Additions for tax positions taken during prior periods | 599 | 763 | ||||||
| Additions for tax positions taken during current period including amended prior years | 1,174 | 5,931 | ||||||
| Reductions related to the expiration of statutes of limitations | (972 | ) | (590 | ) | ||||
| Unrecognized tax benefits at December 31 | $ | 8,234 | $ | 7,433 | ||||
The Company increased the provision for unrecognized tax benefits by $1.2 million during the year ended December 31, 2017, related to tax benefits recognized associated with R&D Credits and the Section 199 Deduction for all open tax years.
| 79 |
At December 31, 2017, HMS had federal and state pre-tax net operating loss and tax credit carryforwards of approximately $34.1 million and $3.7 million, respectively, which will be available to offset future taxable income. If not used, these net operating loss and tax credit carryforwards will begin to expire in 2021 and 2019, respectively. The Company files income tax returns with the U.S. Federal government and various state jurisdictions. HMS is no longer subject to U.S. Federal income tax examinations for years before 2012. The Company is currently under audit by the Internal Revenue Service for years 2013 and 2014 and no assessments have been received. HMS operates in a number of state and local jurisdictions. Accordingly, HMS is subject to state and local income tax examinations based upon the various statutes of limitations in each jurisdiction. Previously recognized Texas refund claims are currently being examined by the state. The Company is currently being examined by the State of Illinois and has received preliminary assessments of an immaterial amount which the Company is reviewing.
| 8. | Credit Agreement |
On December 19, 2017, the Company entered into an amendment to the Credit Agreement, which, among other things, extended the maturity of its then existing revolving credit facility by five years to December 2022. The availability of funds under the Amended Revolving Facility includes sublimits for (a) up to $50 million for the issuance of letters of credit and (b) up to $25 million for swingline loans. In addition, the Company may increase the commitments under the Amended Revolving Facility and/or add one or more incremental term loan facilities, provided that such incremental facilities do not exceed in the aggregate the sum of (i) the greater of $120 million and 100% of Consolidated EBITDA (as defined in the Credit Agreement) and (ii) an additional amount so long as our first lien leverage ratio (as defined in the Credit Agreement) on a pro forma basis is not greater than 3.00:1.00, subject to obtaining commitments from lenders therefor and meeting certain other conditions.
During the year ended December 31, 2016, no principal payments were made against the Company’s then existing revolving credit facility. As of December 31, 2017, the outstanding principal balance due on the Amended Revolving Facility was $240.0 million.
Borrowings under the Amended Revolving Facility will bear interest at a rate equal to, at the Company’s election (except with respect to swingline borrowings, which will accrue interest based only at the base rate), either:
| § | a base rate determined by reference to the greatest of (a) the prime or base commercial lending rate of the administrative agent as in effect on the relevant date, (b) the federal funds effective rate plus 0.50% and (c) the one-month LIBO rate plus 1.00%, plus an interest margin ranging from 0.50% to 1.00% based on the Company’s consolidated leverage ratio for the applicable period; or |
| § | an adjusted LIBO rate, equal to the LIBO rate for the applicable interest period multiplied by the statutory reserve rate (equal to (x) one divided by (y) one minus the aggregate of the maximum reserve percentage (including any marginal, special, emergency or supplemental reserves) established by the Board of Governors of the Federal Reserve System of the United States), plus an interest margin ranging from 1.50% to 2.00% based on the Company’s consolidated leverage ratio for the applicable period. |
In addition to paying interest on the outstanding principal, the Company is required to pay unused commitment fees on the revolving credit facility during the term of the Credit Agreement ranging from 0.375% to 0.250% per annum based on the Company’s consolidated leverage ratio and letter of credit fees equal to 0.125% per annum on the aggregate face amount of each letter of credit, as well as customary agency fees.
The Amended Revolving Facility is secured, subject to certain customary carve-outs and exceptions, by a first priority lien and security interest in substantially all tangible and intangible assets of the Company and certain subsidiaries of the Company. The Amended Revolving Facility contains certain restrictive covenants, which affect, among other things, the ability of the Company and its subsidiaries to incur indebtedness, create liens, make investments, sell or otherwise dispose of assets, engage in mergers or consolidations with other entities, and pay dividends or repurchase stock. The Company is also required to comply, on a quarterly basis, with two financial covenants: (i) a minimum interest coverage ratio of 3:00:1:00, and (ii) a maximum consolidated leverage ratio of 4.75:1.00 through December 2019 and 4.25:1.00 from and after January 2020. The consolidated leverage ratio is subject to a step-up to 5.25:1.00 for four full consecutive fiscal quarters following a permitted acquisition or similar investment. As of December 31, 2017, the Company was in compliance with all terms of the Credit Agreement.
| 80 |
Interest expense and the commitment fees on the unused portion of the Company’s revolving credit facility are as follows (in thousands):
| December 31, | ||||||||||||
| 2017 | 2016 | 2015 | ||||||||||
| Interest expense | $ | 7,170 | $ | 4,837 | $ | 4,117 | ||||||
| Commitment fees | $ | 1,359 | $ | 1,518 | $ | 1,513 | ||||||
The Company deferred $2.3 million of financing fees associated with the amendment. At December 31, 2017 and 2016, the unamortized balance of deferred financing costs was $2.8 million, in both periods. The Company amortized deferred financing costs of $2.3 million in in the year ended December 31, 2017 and $2.1 million in in the years ended December 31, 2016 and 2015.
As part of a contractual agreement with a customer, the Company has an outstanding irrevocable letter of credit for $5.4 million, which is issued against the Amended Revolving Facility and expires April 26, 2018.
| 9. | Equity |
(a) Share Repurchase
On November 1, 2017, the Board of Directors of the Company approved a share repurchase program authorizing the Company to repurchase up to $50.0 million in shares of its common stock from time to time on the open market or in privately negotiated or other transactions. The repurchase program is authorized for a period of up to two years, and may be suspended or discontinued at any time. Repurchased shares will be available for use in connection with reissuance under the Company’s stock plans and for other corporate purposes. The timing and amount of any shares repurchased under the program will be determined by the Company’s management based on its evaluation of market conditions, share price and other factors. In order to facilitate repurchases, the Company may enter into a Rule 10b5-1 plan from time to time, which would permit shares to be repurchased when the Company might otherwise be precluded from doing so under insider trading laws or because of a self-imposed trading blackout period. All repurchases in fiscal year 2017 were made in the fourth quarter. All repurchases for the periods presented were made under the program and using cash resources.
Following are the Company’s monthly stock repurchases for the fourth quarter of fiscal year 2017, all of which were made as part of publicly announced plans or programs:
| Period | Total Number of Shares Purchased | Average Price Paid Per Share | Total Number of Shares Purchased as Part of Publicly Announced Program(1) | Maximum Approximate Dollar Value of Shares That May Yet Be Purchased Under the Program | ||||||||||||
| October 1, 2017 to October 31, 2017 | — | $ | — | — | $ | — | ||||||||||
| November 1, 2017 to November 30, 2017 | 674,813 | 16.23 | 674,813 | 39,044,882 | ||||||||||||
| December 1, 2017 to December 31, 2017 | 190,502 | 16.61 | 190,502 | 35,880,666 | ||||||||||||
| October 1, 2017 to December 31, 2017 | 865,315 | $ | 16.33 | 865,315 | ||||||||||||
(1) Represents shares repurchased through the Company’s Share Repurchase Program publicly announced in November 2017.
| 81 |
(b) Preferred Stock
The Company’s certificate of incorporation, as amended, authorizes the issuance of up to 5,000,000 shares of “blank check” preferred stock with such designations, rights and preferences as may be determined by the Company’s Board of Directors. As of December 31, 2017, no preferred stock had been issued.
| 10. | Employee Benefit Plan |
The Company sponsors the 401(k) Plan for eligible employees. Eligible employees must complete 90 days of service in order to enroll in the 401(k) Plan. Participants may make voluntary contributions to the 401(k) Plan of up to 60% of their annual base pre-tax compensation not to exceed the federally determined maximum allowable contribution. In addition, the 401(k) Plan permits the Company to make discretionary contributions. During 2017, 2016 and 2015, HMS matched 100% of the first 3% of pay contributed by each eligible employee and 50% on the next 2% of pay contributed. These matching contributions vest immediately and are not in the form of the Company’s common stock.
For the years ended December 31, 2017, 2016 and 2015, HMS contributed $5.9 million, $4.8 million and $4.8 million, respectively, to the 401(k) Plan in the form of matching contributions.
| 11. | Stock-Based Compensation |
Stock-Based Compensation Expense
Total stock-based compensation expense in the Company’s Consolidated Statements of Income related to the Company’s long-term incentive award plans was as follows (in thousands):
| December 31, | ||||||||||||
| 2017 | 2016 | 2015 | ||||||||||
| Cost of services-compensation | $ | 7,354 | $ | 3,805 | $ | 6,242 | ||||||
| Selling, general and administrative | 16,789 | 9,472 | 8,055 | |||||||||
| Total | $ | 24,143 | $ | 13,277 | $ | 14,297 | ||||||
Stock Options
Stock-based compensation expense related to stock options was approximately $10.3 million, $6.9 million and $6.4 million for the years ended December 31, 2017, 2016 and 2015, respectively.
| 82 |
Presented below is a summary of stock option activity for the year ended December 31, 2017 (in thousands except for weighted average exercise price and weighted average remaining contractual terms):
| Number of Options | Weighted Average Exercise Price | Weighted Average Remaining Contractual Terms | Aggregate Intrinsic Value | |||||||||||||
| Outstanding balance at December 31, 2016 | 5,191 | $ | 17.35 | |||||||||||||
| Granted | 1,003 | 18.91 | ||||||||||||||
| Exercised | (172 | ) | 15.96 | |||||||||||||
| Forfeitures | (146 | ) | 16.09 | |||||||||||||
| Expired | (322 | ) | 22.34 | |||||||||||||
| Outstanding balance at December 31, 2017 | 5,554 | 17.35 | 5.00 | $ | 8,274 | |||||||||||
| Expected to vest at December 31, 2017 | 1,543 | 16.14 | 6.64 | 2,489 | ||||||||||||
| Exercisable at December 31, 2017 | 3,180 | $ | 18.24 | 3.77 | $ | 4,663 | ||||||||||
As of December 31, 2017 and 2016, the company had 2,372,682 and 3,039,844, respectively, in unvested options with a weighted-average-grant-date fair value of $6.39 and $5.70, respectively. The weighted average grant date fair value per share of the stock options granted during the years ended December 31, 2017, 2016 and 2015 was $7.66, $5.55 and $5.37, respectively. HMS estimated the fair value of each stock option grant on the date of grant using a Black-Scholes option pricing model. Weighted–average assumptions are set forth in the following table:
| December 31, | ||||||||||||
| 2017 | 2016 | 2015 | ||||||||||
| Expected dividend yield | - | - | - | |||||||||
| Risk-free interest rate | 1.8 | % | 1.2 | % | 1.5 | % | ||||||
| Expected volatility | 44.2 | % | 44.0 | % | 40.6 | % | ||||||
| Expected life (years) | 5.0 | 4.9 | 4.9 | |||||||||
HMS estimated the fair value of market condition option grants on the date of grant using a Monte-Carlo simulation model. Assumptions are set forth in the following table:
| December 31, | ||||||||||||
| 2017 | 2016 | 2015 | ||||||||||
| Expected dividend yield | - | - | - | |||||||||
| Risk-free interest rate | 2.2 | % | 1.6 | % | 2.0 | % | ||||||
| Expected volatility | 52.5 | % | 40.5 | % | 39.6 | % | ||||||
| Expected life (years) | 6.5 | 4.9 | 4.9 | |||||||||
During the years ended December 31, 2017, 2016 and 2015, the Company issued 172,326, 510,512 and 577,559 shares, respectively, of the Company’s common stock upon the exercise of outstanding stock options and received proceeds of $2.7 million, $2.9 million and $4.2 million, respectively. The total intrinsic value of stock options exercised during the years ended December 31, 2017, 2016 and 2015 was $0.5 million, $6.3 million and $5.9 million, respectively.
As of December 31, 2017, there was approximately $8.4 million of total unrecognized compensation cost related to stock options outstanding, which is expected to be recognized over a weighted average period of 2.11 years.
The total tax benefits recognized on stock-based compensation for the years ended December 31, 2017, 2016 and 2015 was $4.0 million, $4.1 million and $3.4 million, respectively.
| 83 |
Restricted Stock Units
Stock-based compensation expense related to restricted stock units was $13.8 million, $6.4 million and $7.9 million for the years ended December 31, 2017, 2016 and 2015, respectively.
Presented below is a summary of restricted stock units activity for the year ended December 31, 2017 (in thousands, except for weighted average grant date fair value per unit):
| Number of Units | Weighted Average Grant Date Fair Value per Unit | |||||||
| Outstanding balance at December 31, 2016 | 1,413 | $ | 16.44 | |||||
| Granted | 612 | 18.86 | ||||||
| Vesting of restricted stock units, net of units withheld for taxes | (397 | ) | 15.39 | |||||
| Units withheld for taxes | (172 | ) | 15.39 | |||||
| Forfeitures | (110 | ) | 15.37 | |||||
| Outstanding balance at December 31, 2017 | 1,346 | $ | 17.65 | |||||
As of December 31, 2017, approximately 1,117,245 restricted stock units remained unvested and there was approximately $10.0 million of unrecognized compensation cost related to restricted stock units, which is expected to be recognized over a weighted average vesting period of 0.83 years.
| 12. | Earnings per Share |
The following table sets forth the computation of basic and diluted earnings per share (in thousands, except per share data):
| Years ended December 31, | ||||||||||||
| 2017 | 2016 | 2015 | ||||||||||
| Net income | $ | 40,054 | $ | 37,636 | $ | 24,527 | ||||||
| Weighted average common shares outstanding-basic | 83,821 | 84,221 | 87,881 | |||||||||
| Plus: net effect of dilutive stock options and restricted stock units | 1,267 | 2,766 | 480 | |||||||||
| Weighted average common shares outstanding-diluted | 85,088 | 86,987 | 88,361 | |||||||||
| Net income per common share-basic | $ | 0.48 | $ | 0.45 | $ | 0.28 | ||||||
| Net income per common share-diluted | $ | 0.47 | $ | 0.43 | $ | 0.28 | ||||||
For the years ended December 31, 2017, 2016 and 2015: (i) 2,646,100, 2,070,771 and 3,480,458 stock options, respectively, and (ii) restricted stock units representing 31,155, 46,651 and 305,999 shares of common stock, respectively, were not included in the diluted earnings per share calculation because the effect would have been anti-dilutive.
| 13. | Commitments and Contingencies |
(a) Lease Commitments
The Company leases office space, data processing equipment and software licenses under operating leases that expire on various dates through 2024. The lease agreements provide for rent escalations. Lease expense, exclusive of immaterial sublease income, for the years ended December 31, 2017, 2016 and 2015 was $5.1 million, $5.0 million and $5.4 million, respectively.
| 84 |
Minimum annual lease payments to be made under operating leases, net of nominal sublease payments to be received and exclusive nominal capital leases, for each of the next five years ending December 31 and thereafter are as follows (in thousands):
| Operating Lease Payments | ||||
| 2018 | $ | 6,393 | ||
| 2019 | 3,509 | |||
| 2020 | 3,183 | |||
| 2021 | 2,081 | |||
| 2022 | 1,836 | |||
| Thereafter | 2,936 | |||
| Total | $ | 19,938 | ||
(b) Litigation
In July 2012, Dennis Demetre and Lori Lewis (the “Plaintiffs”), filed an action in the Supreme Court of the State of New York against HMS Holdings Corp., claiming an undetermined amount of damages alleging that various actions by HMS unlawfully deprived the Plaintiffs of the acquisition earn-out portion of the purchase price for Allied Management Group Special Investigation Unit (“AMG”) under the applicable Stock Purchase Agreement (the “SPA”) and that HMS had breached certain contractual provisions under the SPA. The Plaintiffs filed a second amended complaint with two causes of action for breach of contract and one cause of action for breach of implied covenant of good faith and fair dealing. HMS asserted a counterclaim against Plaintiffs for breach of contract based on contractual indemnification costs, including attorneys’ fees arising out of the Company’s defense of AMG in Kern Health Systems v. AMG, Dennis Demetre and Lori Lewis (the “California Action”), which are recoverable under the SPA. In June 2016, Kern Health Systems and AMG entered into a settlement agreement that resolved all claims in the California Action. In July 2017, the Court issued a decision on the Company’s motion for partial summary judgment and granted the motion in part, dismissing one of Plaintiffs’ breach of contract causes of action against HMS. On November 3, 2017, following a jury trial, a verdict was returned in favor of the Plaintiffs on a breach of contract claim, and the jury awarded $60 million in damages to the Plaintiffs. On November 20, 2017, the Company filed a post-trial motion for an order granting it judgment notwithstanding the verdict or, alternatively, setting aside the jury’s award of damages. A hearing on the motion is set for March 2018. The Company continues to believe that strong grounds exist to overturn or greatly reduce the damages awarded by the jury. In light of the Company’s belief that the jury award was unsupportable as a matter of law, the Company has not recorded a reserve for this pending litigation. HMS will continue to monitor developments in assessing the probability and measurability of any related loss contingency.
In February 2018, the Company received a Civil Investigative Demand from the Texas Attorney General, purporting to investigate possible unspecified violations of the Texas Medicaid Fraud Prevention Act. HMS intends to cooperate with the investigation.
From time to time, HMS may be subject to investigations, legal proceedings and other disputes arising in the ordinary course of the Company’s business, including but not limited to regulatory audits, billing and contractual disputes, employment-related matters and post-closing disputes related to acquisitions. Due to the Company’s contractual relationships, including those with federal and state government entities, HMS’s operations, billing and business practices are subject to scrutiny and audit by those entities and other multiple agencies and levels of government, as well as to frequent transitions and changes in the personnel responsible for oversight of the Company’s contractual performance. HMS may have contractual disputes with its customers arising from differing interpretations of contractual provisions that define the Company’s rights, obligations, scope of work or terms of payment, and with associated claims of liability for inaccurate or improper billing for reimbursement of contract fees, or for sanctions or damages for alleged performance deficiencies. Resolution of such disputes may involve litigation or may require that HMS accept some amount of loss or liability in order to avoid customer abrasion, negative marketplace perceptions and other disadvantageous results that could affect the Company’s business, financial condition, results of operations and cash flows.
HMS records accruals for outstanding legal matters when it believes it is probable that a loss will be incurred and the amount can be reasonably estimated. The Company evaluates, on a quarterly basis, developments in legal matters that could affect the amount of any accrual and developments that would make a loss contingency both probable and reasonably estimable. If a loss contingency is not both probable and estimable, HMS does not establish an accrued liability.
| 85 |
| 14. | Customer Concentration |
(a) Geographic Information
The Company operates within the United States.
(b) Major Customers
For the years ended December 31, 2017, 2016 and 2015 no one individual Company customer accounted for more than 10% of the Company’s total revenue.
(c) Concentration of Revenue
The composition of the Company’s ten largest customer’s changes periodically. For the years ended December 31, 2017, 2016 and 2015, the Company’s ten largest customers represented 39.5%, 40.6% and 44.0% of HMS’ total revenue, respectively. The Company’s agreements with the ten current largest customers expire between 2018 and 2023. In many instances, HMS provides services pursuant to agreements that may be renewed or subject to a competitive reprocurement process. Several of the Company’s contracts, including those with some of its largest customers, may be terminated for convenience.
| 15. | Subsequent Events |
Annual Grants to Employees
On February 15, 2018, the Compensation Committee of the Board of Directors approved approximately $18.6 million in stock option and restricted stock unit awards to employees. The awards generally will vest over three years and will be issued three business days subsequent to the filing of this 2017 Form 10-K.
In connection with the preparation of our consolidated financial statements, an evaluation of subsequent events was performed through the date of filing and there were no events that have occurred that would require adjustments to the financial statements or disclosure.
| 16. | Quarterly Financial Data (Unaudited) |
The table below summarizes the Company’s unaudited quarterly operating results for the last two fiscal years (in thousands, except per share amounts):
| 2017 | First Quarter | Second Quarter | Third Quarter | Fourth Quarter | Year Ended | |||||||||||||||
| Revenue | $ | 113,733 | $ | 133,313 | $ | 125,673 | $ | 148,493 | $ | 521,212 | ||||||||||
| Operating income | $ | 3,943 | $ | 14,361 | $ | 12,861 | $ | 19,266 | $ | 50,431 | ||||||||||
| Net income | $ | 1,442 | $ | 6,517 | $ | 6,372 | $ | 25,723 | $ | 40,054 | ||||||||||
| Net income per common share - basic | $ | 0.02 | $ | 0.08 | $ | 0.08 | $ | 0.30 | $ | 0.48 | ||||||||||
| Net income per common share - diluted | $ | 0.02 | $ | 0.08 | $ | 0.07 | $ | 0.30 | $ | 0.47 | ||||||||||
| 2016 | First Quarter | Second Quarter | Third Quarter | Fourth Quarter | Year Ended | |||||||||||||||
| Revenue | $ | 119,763 | $ | 123,550 | $ | 124,604 | $ | 125,590 | $ | 489,720 | ||||||||||
| Operating income | $ | 9,909 | $ | 16,352 | $ | 12,650 | $ | 18,758 | $ | 57,669 | ||||||||||
| Net income | $ | 4,570 | $ | 9,869 | $ | 14,046 | $ | 9,151 | $ | 37,636 | ||||||||||
| Net income per common share - basic | $ | 0.05 | $ | 0.12 | $ | 0.17 | $ | 0.11 | $ | 0.45 | ||||||||||
| Net income per common share - diluted | $ | 0.05 | $ | 0.11 | $ | 0.16 | $ | 0.11 | $ | 0.43 | ||||||||||
| 86 |
SCHEDULE II – VALUATION AND QUALIFYING ACCOUNTS
For the years ended December 31, 2017, 2016 and 2015
Accounts receivable allowance and Estimated liability for appeals as of December 31, 2017, 2016 and 2015 are as follows:
Accounts receivable allowance (in thousands):
| Balance at Beginning of Year | Provision | Recoveries | Charge-offs | Balance at End of Year | ||||||||||||||||
| Year ended December 31, 2015 | $ | 9,359 | 8,046 | (100 | ) | (5,841 | ) | $ | 11,464 | |||||||||||
| Year ended December 31, 2016 | $ | 11,464 | 21,583 | 108 | (22,383 | ) | $ | 10,772 | ||||||||||||
| Year ended December 31, 2017 | $ | 10,772 | 20,233 | - | (16,206 | ) | $ | 14,799 | ||||||||||||
Estimated liability for appeals (in thousands):
| Balance at Beginning of Year | Provision | Appeals found in providers favor | Balance at End of Year | |||||||||||||
| Year ended December 31, 2015 | $ | 19,314 | 2,610 | (9,123 | ) | $ | 12,801 | |||||||||
| Year ended December 31, 2016 | $ | 12,801 | 721 | (2,396 | ) | $ | 11,126 | |||||||||
| Year ended December 31, 2017 | $ | 11,126 | 83 | (2,665 | ) | $ | 8,544 | |||||||||
The above chart represents the CMS estimated reserve liability only.
87