Attached files
| file | filename |
|---|---|
| EX-10.4 - EXHIBIT 10.4 - HMS HOLDINGS CORP | exh_104.htm |
| EX-32.2 - EXHIBIT 32.2 - HMS HOLDINGS CORP | exh_322.htm |
| EX-32.1 - EXHIBIT 32.1 - HMS HOLDINGS CORP | exh_321.htm |
| EX-31.2 - EXHIBIT 31.2 - HMS HOLDINGS CORP | exh_312.htm |
| EX-31.1 - EXHIBIT 31.1 - HMS HOLDINGS CORP | exh_311.htm |
| EX-10.5 - EXHIBIT 10.5 - HMS HOLDINGS CORP | exh_105.htm |
| EX-10.3 - EXHIBIT 10.3 - HMS HOLDINGS CORP | exh_103.htm |
| EX-10.2 - EXHIBIT 10.2 - HMS HOLDINGS CORP | exh_102.htm |
UNITED STATES
SECURITIES AND EXCHANGE COMMISSION
Washington, D.C. 20549
FORM 10-Q
| x | QUARTERLY REPORT PURSUANT TO SECTION 13 OR 15(d) OF THE SECURITIES EXCHANGE ACT OF 1934 |
For the quarterly period ended March 31, 2018
Or
| o | TRANSITION REPORT PURSUANT TO SECTION 13 OR 15(d) OF THE SECURITIES EXCHANGE ACT OF 1934 |
For the transition period from to
Commission File Number 000-50194
![]()
HMS HOLDINGS CORP.
(Exact name of registrant as specified in its charter)
| Delaware | 11-3656261 |
| (State or Other Jurisdiction of Incorporation or Organization) | (I.R.S. Employer Identification No.) |
| 5615 High Point Drive, Irving, TX | 75038 |
| (Address of principal executive offices) | (Zip Code) |
(Registrant’s Telephone Number, Including Area Code)
(214) 453-3000
Indicate by check mark whether the registrant (1) has filed all reports required to be filed by Section 13 or 15(d) of the Securities Exchange Act of 1934 during the preceding 12 months (or for such shorter period that the registrant was required to file such reports), and (2) has been subject to such filing requirements for the past 90 days. Yes x No o
Indicate by check mark whether the registrant has submitted electronically and posted on its corporate Web site, if any, every Interactive Data File required to be submitted and posted pursuant to Rule 405 of Regulation S-T (§232.405 of this chapter) during the preceding 12 months (or for shorter period that the registrant was required to submit and post such files). x Yes o No
Indicate by check mark whether the registrant is a large accelerated filer, an accelerated filer, a non-accelerated filer, smaller reporting company, or an emerging growth company. See the definitions of “large accelerated filer,” “accelerated filer,” “smaller reporting company” and “emerging growth company” in Rule 12b-2 of the Exchange Act. (Check one):
| Large accelerated filer x | Accelerated filer o |
| Non-accelerated filer o | Smaller reporting company o |
| (Do not check if a smaller reporting company) | |
| Emerging growth company o |
If an emerging growth company, indicate by check mark if the registrant has elected not to use the extended transition period for complying with any new or revised financial accounting standards provided pursuant to Section 13(a) of the Exchange Act. o
Indicate by check mark whether the registrant is a shell company (as defined in Rule 12b-2 of the Exchange Act). Yes o No x
As of April 27, 2018, there were approximately 83,216,661 shares of the registrant’s common stock (par value $0.01 per share) outstanding.
HMS HOLDINGS CORP. AND SUBSIDIARIES
QUARTERLY REPORT ON FORM 10-Q
FOR THE THREE MONTHS ENDED MARCH 31, 2018
INDEX
| 2 |
Glossary of Terms and Abbreviations
| Form 10-Q | HMS Holdings Corp. Quarterly Report on Form 10-Q for the three months ended March 31, 2018 | |
| 2017 Form 10-K | HMS Holdings Corp. Annual Report on Form 10-K for the year ended December 31, 2017 | |
| ACA | Patient Protections and Affordable Care Act, as amended by the Health Care and Education | |
| ACO | Accountable Care Organization | |
| ADR | Additional Documentation Request | |
| ASC | Accounting Standards Codification | |
| ASO | Administrative Service Only | |
| ASU | Accounting Standards Update | |
| CHIP | Children's Health Insurance Program | |
| CMS | Centers for Medicare & Medicaid Services | |
| CMS NHE | CMS National Health Expenditures | |
| COSO | Committee of Sponsoring Organizations of the Treadway Commission | |
| Credit Agreement | The Amended and Restated Credit Agreement dated as of May 3, 2013, as amended by Amendment No. 1 to Amended and Restated Credit Agreement dated as of March 8, 2017, and as further amended by Amendment No. 2 to Amended and Restated Credit Agreement, dated as of December 19, 2017, by and among HMS Holdings Corp. the Guarantors party thereto, the Lenders party thereto and Citibank, N.A. as Administrative Agent | |
| DRA | Deficit Reduction Act of 2005 | |
| DSO | Days Sales Outstanding | |
| ERISA | Employment Retirement Income Security Act of 1974 | |
| Exchange Act | Securities Exchange Act of 1934, as amended | |
| FASB | Financial Accounting Standards Board | |
| HIPAA | Health Insurance Portability and Accountability Act of 1996 | |
| HITECH | Health Information Technology for Economic and Clinical Health | |
| IRC | Internal Revenue Code | |
| IRS | U.S Internal Revenue Service | |
| LIBOR | Intercontinental Exchange London Interbank Offered Rate | |
| MCO | Managed care organization | |
| MMIS | Medicaid Management Information Systems | |
| PBM | Pharmacy Benefit Manager | |
| PHI | Protected health information | |
| PI | Payment Integrity | |
| PMPM | Per Member Per Month | |
| PMPY | Per Member Per Year | |
| R&D Credit | U.S. Research and Experimentation Tax Credit pursuant to IRC Section 41 | |
| RAC | Recovery Audit Contractor | |
| RFP | Request for proposal | |
| SEC | U.S. Securities and Exchange Commission | |
| Securities Act | Securities Act of 1933, as amended | |
| Section 199 Deduction | U.S. Production Activities Deduction pursuant to IRC Section 199 | |
| SG&A | Selling, general and administrative | |
| TPL | Third-party liability | |
| U.S. GAAP | United States Generally Accepted Accounting Principles | |
| VHA | Veterans Health Administration | |
| 2011 HDI Plan | HDI Holdings, Inc. Amended 2011 Stock Option and Stock Issuance Plan | |
| 2006 Stock Plan | HMS Holdings Corp. Fourth Amended and Restated 2006 Stock Plan, as amended by Amendment No. 1 to the HMS Holdings Corp. Fourth Amended and Restated 2006 Stock Plan dated as of February 16, 2017 | |
| 2016 Omnibus Plan | HMS Holdings Corp. 2016 Omnibus Incentive Plan | |
| 2011 HDI Plan | HDI Holdings, Inc. Amended 2011 Stock Option and Stock Issuance Plan | |
| 2017 Tax Act | Tax Cuts and Jobs Act of 2017 | |
| 401(k) Plan | HMS Holdings Corp. 401(k) Plan |
| 3 |
Cautionary Note Regarding Forward-Looking Statements
For purposes of this Form 10-Q, the terms “HMS,” “Company,” “we,” “us,” and “our” refer to HMS Holdings Corp. and its consolidated subsidiaries unless the context clearly indicates otherwise. Included in this Form 10-Q are “forward-looking statements” within the meaning of the U.S. Private Securities Litigation Reform Act of 1995. From time to time, we also provide forward-looking statements in other materials we release to the public, as well as oral forward-looking statements. Such statements relate to our current expectations, projections and assumptions about our business, the economy and future events or conditions. They do not relate strictly to historical or current facts.
We have tried to identify forward-looking statements by using words such as “aim,” “anticipate,” “believe,” “estimate,” “expect,” “forecast,” “future,” “intend,” “likely,” “may,” “plan,” “project,” “seek,” “strategy,” “target,” “will,” “would,” “could,” “should,” and similar expressions and references to guidance, although some forward-looking statements may be expressed differently. These statements include, among other things, information concerning our future growth, business strategy, strategic or operational initiatives, our future operating or financial performance, our ability to invest in and utilize our data and analytics capabilities to expand our solutions and services, the benefits and synergies to be obtained from completed and future acquisitions, the future performance of companies we have acquired, the future effect of different accounting determinations or remediation activities, the sufficiency of our sources of funding for working capital, capital expenditures, acquisitions, stock repurchases, debt repayments and other matters, our future expenses, interest rates, effective tax rates and financial results, the impact of changes to U.S. healthcare legislation or healthcare spending affecting Medicare, Medicaid or other publicly funded or subsidized health programs, and other statements regarding our possible future actions, business plans, objectives and prospects.
Forward-looking statements are not guarantees and involve risks, uncertainties and assumptions that are difficult to predict. Actual results may differ materially from past results and forward-looking statements if known or unknown risks or uncertainties materialize, or if underlying assumptions prove inaccurate. These risks and uncertainties include, among other things:
| § | our ability to execute our business plans or growth strategy; |
| § | our ability to innovate, develop or implement new or enhanced solutions or services; |
| § | the nature of investment and acquisition opportunities we are pursuing, and the successful execution of such investments and acquisitions; |
| § | our ability to successfully integrate acquired businesses and realize synergies; |
| § | variations in our results of operations; |
| § | our ability to accurately forecast the revenue under our contracts and solutions; |
| § | our ability to protect our systems from damage, interruption or breach, and to maintain effective information and technology systems and networks; |
| § | our ability to protect our intellectual property rights, proprietary technology, information processes and know-how; |
| § | significant competition relating to our solutions and services; |
| § | our failure to maintain a high level of customer retention or the unexpected reduction in scope or termination of key contracts with major customers; |
| § | customer dissatisfaction or our non-compliance with contractual provisions or regulatory requirements; |
| § | our failure to meet performance standards triggering significant costs or liabilities under our contracts; |
| § | our inability to manage our relationships with information and data sources and suppliers; |
| § | our reliance on subcontractors and other third party providers and parties to perform services; |
| § | our ability to continue to secure contracts and favorable contract terms through the competitive bidding process; |
| § | pending or threatened litigation; |
| § | unfavorable outcomes in legal proceedings; |
| § | our success in attracting and retaining qualified employees and members of our management team; |
| 4 |
| § | our ability to generate sufficient cash to cover our interest and principal payments under our credit facility, or to borrow or use credit; |
| § | unexpected changes in tax laws, regulations or guidance and unexpected changes in our effective tax rate; |
| § | unanticipated increases in the number or amount of claims for which we are self-insured; |
| § | our ability to develop, implement and maintain effective internal control over financial reporting; |
| § | changes in the U.S. healthcare environment or healthcare financing system, including regulatory, budgetary or political actions that affect healthcare spending or the practices and operations of healthcare organizations; |
| § | our failure to comply with applicable laws and regulations governing individual privacy and information security or to protect such information from theft and misuse; |
| § | our ability to comply with current and future legal and regulatory requirements; |
| § | negative results of government or customer reviews, audits or investigations; |
| § | state or federal limitations related to outsourcing of certain government programs or functions; |
| § | restrictions on bidding or performing certain work due to perceived conflicts of interests; |
| § | the market price of our common stock and lack of dividend payments; and |
| § | anti-takeover provisions in our corporate governance documents. |
These and other risks are discussed under the headings “Part I, Item 1. Business,” “Part I. Item 1A, Risk Factors,” “Part II, Item 7. Management’s Discussion and Analysis of Financial Condition and Results of Operations,” and “Part II, Item 7A. Quantitative and Qualitative Disclosures About Market Risk,” of our 2017 Form 10-K and in other documents we file with the SEC.
Any forward-looking statements made by us in this Form 10-Q speak only as of the date on which they are made. We undertake no obligation to publicly update forward-looking statements, whether as a result of new information, future events or otherwise, except as may be required by law. We caution readers not to place undue reliance upon any of these forward-looking statements. You are advised, however, to consult any further disclosures we make on related subjects in our Form 10-K, Form 10-Q and Form 8-K reports and our other filings with the SEC.
Market and Industry Data
This Form 10-Q contains market, industry and government data and forecasts that have been obtained from publicly available information, various industry publications and other published industry sources. We have not independently verified the information and cannot make any representation as to the accuracy or completeness of such information. None of the reports and other materials of third party sources referred to in this Form 10-Q were prepared for use in, or in connection with, this report.
Trademarks and Tradenames
We have a number of registered trademarks, including HMS®, as well as the corresponding HMS + logo design mark, HMS IntegritySource®, Eliza® and Essette®. These and other trademarks of ours appearing in this report are our property. Solely for convenience, trademarks and trade names of ours referred to in this Form 10-Q may appear without the ® or ™ symbols, but such references are not intended to indicate, in any way, that we will not assert, to the fullest extent under applicable law, our rights or the right of the applicable licensor to these trademarks and trade names. This report contains additional trade names and trademarks of other companies. We do not intend our use or display of other companies' trade names or trademarks to imply an endorsement or sponsorship of us by such companies, or any relationship with any of these companies.
| 5 |
PART I — FINANCIAL INFORMATION
HMS HOLDINGS CORP. AND SUBSIDIARIES
(in thousands, except share and per share amounts)
| March 31, 2018 | December 31, 2017 | |||||||
| Assets | (unaudited) | |||||||
| Current assets: | ||||||||
| Cash and cash equivalents | $ | 83,898 | $ | 83,313 | ||||
| Accounts receivable, net of allowance of $14,371 and $14,799, at March 31, 2018 and December 31, 2017, respectively | 187,132 | 189,460 | ||||||
| Prepaid expenses | 14,050 | 16,589 | ||||||
| Income tax receivable | - | 1,892 | ||||||
| Deferred financing costs, net | 564 | 564 | ||||||
| Other current assets | 367 | 836 | ||||||
| Total current assets | 286,011 | 292,654 | ||||||
| Property and equipment, net | 96,037 | 98,581 | ||||||
| Goodwill | 487,617 | 487,617 | ||||||
| Intangible assets, net | 85,361 | 91,482 | ||||||
| Deferred financing costs, net | 2,096 | 2,237 | ||||||
| Other assets | 2,614 | 2,589 | ||||||
| Total assets | $ | 959,736 | $ | 975,160 | ||||
| Liabilities and Shareholders' Equity | ||||||||
| Current liabilities: | ||||||||
| Accounts payable, accrued expenses and other liabilities | $ | 45,445 | $ | 61,900 | ||||
| Income tax payable | 1,027 | - | ||||||
| Estimated liability for appeals | 22,622 | 30,787 | ||||||
| Total current liabilities | 69,094 | 92,687 | ||||||
| Long-term liabilities: | ||||||||
| Revolving credit facility | 240,000 | 240,000 | ||||||
| Net deferred tax liabilities | 21,212 | 21,989 | ||||||
| Deferred rent | 4,673 | 4,852 | ||||||
| Other liabilities | 9,614 | 9,403 | ||||||
| Total long-term liabilities | 275,499 | 276,244 | ||||||
| Total liabilities | 344,593 | 368,931 | ||||||
| Commitments and contingencies (Note 12) | ||||||||
| Shareholders' equity: | ||||||||
| Preferred stock -- $0.01 par value; 5,000,000 shares authorized; none issued | — | — | ||||||
| Common stock -- $0.01 par value; 175,000,000 shares authorized; 96,876,154 shares issued and 83,212,960 shares outstanding at March 31, 2018; 96,536,251 shares issued and 83,256,858 shares outstanding at December 31, 2017 | 965 | 965 | ||||||
| Capital in excess of par value | 375,772 | 368,721 | ||||||
| Retained earnings | 373,982 | 366,164 | ||||||
| Treasury stock, at cost: 13,663,194 shares at March 31, 2018 and 13,279,393 shares at December 31, 2017 | (135,576 | ) | (129,621 | ) | ||||
| Total shareholders' equity | 615,143 | 606,229 | ||||||
| Total liabilities and shareholders' equity | $ | 959,736 | $ | 975,160 | ||||
See accompanying notes to unaudited consolidated financial statements.
| 6 |
HMS HOLDINGS CORP. AND SUBSIDIARIES
CONSOLIDATED STATEMENTS OF INCOME
(in thousands, except per share amounts)
(unaudited)
Three Months Ended March 31, | ||||||||
| 2018 | 2017 | |||||||
| Revenue | $ | 141,425 | $ | 113,733 | ||||
| Cost of services: | ||||||||
| Compensation | 56,079 | 48,920 | ||||||
| Information technology | 12,263 | 9,783 | ||||||
| Occupancy | 4,383 | 3,547 | ||||||
| Direct project expenses | 10,083 | 10,443 | ||||||
| Other operating expenses | 6,565 | 7,203 | ||||||
| Amortization of acquisition related software and intangible assets | 8,132 | 6,286 | ||||||
| Total cost of services | 97,505 | 86,182 | ||||||
| Selling, general and administrative expenses | 31,998 | 23,608 | ||||||
| Total operating expenses | 129,503 | 109,790 | ||||||
| Operating income | 11,922 | 3,943 | ||||||
| Interest expense | (2,648 | ) | (2,286 | ) | ||||
| Interest income | 120 | 155 | ||||||
| Income before income taxes | 9,394 | 1,812 | ||||||
| Income taxes | 3,003 | 370 | ||||||
| Net income | $ | 6,391 | $ | 1,442 | ||||
| Basic income per common share: | ||||||||
| Net income per common share -- basic | $ | 0.08 | $ | 0.02 | ||||
| Diluted income per common share: | ||||||||
| Net income per common share -- diluted | $ | 0.07 | $ | 0.02 | ||||
| Weighted average shares: | ||||||||
| Basic | 83,933 | 83,617 | ||||||
| Diluted | 85,682 | 85,580 | ||||||
See accompanying notes to unaudited consolidated financial statements.
| 7 |
HMS HOLDINGS CORP. AND SUBSIDIARIES
CONSOLIDATED STATEMENT OF SHAREHOLDERS’ EQUITY
(in thousands, except share amounts)
(unaudited)
| Common Stock | Treasury Stock | |||||||||||||||||||||||||||
| # of Shares Issued | Par Value | Capital in Excess of Par Value | Retained Earnings | # of Shares | Amount | Total Shareholders' Equity | ||||||||||||||||||||||
| Balance at December 31, 2017 | 96,536,251 | $ | 965 | $ | 368,721 | $ | 366,164 | 13,279,393 | $ | (129,621 | ) | $ | 606,229 | |||||||||||||||
| Adoption of accounting standard (Note 1 and 3) | - | - | - | 1,427 | - | - | 1,427 | |||||||||||||||||||||
| Net income | - | - | - | 6,391 | - | - | 6,391 | |||||||||||||||||||||
| Stock-based compensation expense | - | - | 9,494 | - | - | - | 9,494 | |||||||||||||||||||||
| Purchase of treasury stock | - | - | - | - | 383,801 | (5,955 | ) | (5,955 | ) | |||||||||||||||||||
| Exercise of stock options | 9,043 | - | 144 | - | - | - | 144 | |||||||||||||||||||||
| Vesting of restricted stock awards and units, net of shares withheld for employee tax | 330,860 | - | (2,587 | ) | - | - | - | (2,587 | ) | |||||||||||||||||||
| Balance at March 31, 2018 | 96,876,154 | $ | 965 | $ | 375,772 | $ | 373,982 | 13,663,194 | $ | (135,576 | ) | $ | 615,143 | |||||||||||||||
See accompanying notes to the unaudited consolidated financial statements.
| 8 |
HMS HOLDINGS CORP. AND SUBSIDIARIES
CONSOLIDATED STATEMENTS OF CASH FLOWS
(in thousands)
(unaudited)
| Three
Months Ended March 31, | ||||||||
| 2018 | 2017 | |||||||
| Operating activities: | ||||||||
| Net income | $ | 6,391 | $ | 1,442 | ||||
| Adjustments to reconcile net income to net cash provided by operating activities: | ||||||||
| Depreciation and amortization of property, equipment and software | 7,345 | 6,235 | ||||||
| Amortization of intangible assets | 6,121 | 4,327 | ||||||
| Amortization of deferred financing costs | 141 | 521 | ||||||
| Stock-based compensation expense | 9,494 | 5,386 | ||||||
| Deferred income taxes | (777 | ) | 248 | |||||
| Loss on disposal of assets | 72 | - | ||||||
| Release of estimated liability for appeals | (8,436 | ) | - | |||||
| Changes in operating assets and liabilities: | ||||||||
| Accounts receivable | 2,328 | 6,978 | ||||||
| Prepaid expenses | 2,539 | (2,677 | ) | |||||
| Other current assets | 469 | 433 | ||||||
| Other assets | (25 | ) | 84 | |||||
| Income taxes receivable / (payable) | 2,919 | (734 | ) | |||||
| Accounts payable, accrued expenses and other liabilities | (14,115 | ) | (19,646 | ) | ||||
| Estimated liability for appeals | 271 | 789 | ||||||
| Net cash provided by operating activities | 14,737 | 3,386 | ||||||
| Investing activities: | ||||||||
| Purchases of property and equipment | (791 | ) | (6,282 | ) | ||||
| Investment in capitalized software | (4,963 | ) | (2,206 | ) | ||||
| Net cash used in investing activities | (5,754 | ) | (8,488 | ) | ||||
| Financing activities: | ||||||||
| Proceeds from exercise of stock options | 144 | 2 | ||||||
| Payments of tax withholdings on behalf of employees for net-share settlement for stock-based compensation | (2,587 | ) | (2,608 | ) | ||||
| Payments on capital lease obligations | - | (2 | ) | |||||
| Purchases of treasury stock | (5,955 | ) | - | |||||
| Net cash used in financing activities | (8,398 | ) | (2,608 | ) | ||||
| Net increase (decrease) in cash and cash equivalents | 585 | (7,710 | ) | |||||
| Cash and Cash Equivalents | ||||||||
| Cash and cash equivalents at beginning of year | 83,313 | 175,999 | ||||||
| Cash and cash equivalents at end of period | $ | 83,898 | $ | 168,289 | ||||
| Supplemental disclosure of cash flow information: | ||||||||
| Cash paid for income taxes | $ | 626 | $ | 734 | ||||
| Cash paid for interest | $ | 2,055 | $ | 1,686 | ||||
| Supplemental disclosure of non-cash activities: | ||||||||
| Change in balance of accrued property and equipment purchases | $ | 881 | $ | (1,244 | ) | |||
See accompanying notes to the unaudited consolidated financial statements.
| 9 |
HMS HOLDINGS CORP. AND SUBSIDIARIES
NOTES TO THE CONSOLIDATED FINANCIAL STATEMENTS
For the Three Months Ended March 31, 2018 and 2017
(unaudited)
| 1. | Business and Summary of Significant Accounting Policies |
(a) Business
HMS is a leading provider of cost containment solutions in the U.S. healthcare marketplace. We use innovative technology, extensive data services and powerful analytics to deliver coordination of benefits, payment integrity and care management and consumer engagement solutions to help healthcare payers improve financial performance and clinical outcomes. We provide coordination of benefits services to government and commercial healthcare payers and sponsors to ensure that the responsible party pays healthcare claims. Our payment integrity services ensure healthcare claims billed are accurate and appropriate, and our care management and consumer engagement technology helps risk-bearing organizations to better engage with and manage the care delivered to their members. Together these various services help customers recover erroneously paid amounts from liable third parties; prevent future improper payments; reduce fraud, waste and abuse; better manage the care their members receive; engage healthcare consumers to improve clinical outcomes while increasing member satisfaction and retention; and achieve regulatory compliance. We currently operate as one business segment with a single management team that reports to our Chief Executive Officer.
The accompanying consolidated financial statements and notes are unaudited. Accordingly, they do not include all of the information and notes required by U.S. GAAP for complete financial statements. These statements include all adjustments (which include only normal recurring adjustments, except as disclosed) that management considers necessary to present a fair statement of the Company’s results of operations, financial position and cash flows. The results reported in these unaudited consolidated financial statements should not be regarded as necessarily indicative of results that may be expected for the entire year. It is suggested that these unaudited consolidated financial statements be read in conjunction with the Company’s consolidated financial statements as of and for the year ended December 31, 2017 which were filed with the SEC as part of the 2017 Form 10-K. The consolidated balance sheet as of December 31, 2017 included herein was derived from audited financial statements, but does not include all disclosures required by U.S. GAAP.
The preparation of the Company’s unaudited consolidated financial statements requires management to make certain estimates and assumptions that affect the reported amounts of assets and liabilities, primarily accounts receivable, intangible assets, fixed assets, accrued expenses, estimated liability for appeals, the disclosure of contingent liabilities at the date of the unaudited consolidated financial statements and the reported amounts of revenue and expenses during the reporting periods. The Company’s actual results could differ from those estimates.
These unaudited consolidated financial statements include HMS accounts and transactions and those of the Company’s wholly owned subsidiaries. All significant intercompany balances and transactions have been eliminated in consolidation.
(b) Summary of Significant Accounting Policies
There have been no material changes to the Company’s significant accounting policies that are referenced in the 2017 Form 10-K other than as described below with respect to revenue recognition.
| 10 |
Recently Adopted Accounting Pronouncements
In May 2014, the FASB issued ASU 2014-09, Revenue from Contracts with Customers (Topic 606) (“ASU 2014-09”), which is the new comprehensive revenue recognition standard that supersedes all existing revenue recognition guidance under U.S. GAAP. The Company adopted ASU 2014-09 on January 1, 2018 to all contracts using the modified retrospective method. The Company recognized the cumulative effect of initially applying the new revenue standard as an adjustment to the opening balance of retained earnings. The financial information for comparative prior periods has not been restated and continues to be reported under the accounting standards in effect for those periods. The affect of adopting ASU 2014-09 in the current reporting period as compared with the guidance that was in effect before the change is immaterial. The Company’s internal control framework did not materially change, but existing internal controls were modified due to certain changes to business processes and systems to support the new revenue recognition standard as necessary. The Company expects the impact of the adoption of the new standard to be immaterial to its net income and its internal control framework on an ongoing basis.
In August 2016, the FASB issued ASU No. 2016-15, Statements of Cash Flows (Topic 230): Classification of Certain Cash Receipts and Cash Payments (“ASU 2016-15”). ASU 2016-15 clarifies where certain cash receipts and cash payments are presented and classified in the statement of cash flows. The amendments are effective for annual reporting periods beginning after December 15, 2017, and for interim reporting periods within such annual periods. The Company adopted this guidance on January 1, 2018. The adoption of this guidance did not have a material effect on the Company’s consolidated financial statements.
In January 2017, the FASB issued ASU No. 2017-01, Business Combinations (Topic 805) – Clarifying the Definition of a Business (“ASU 2017-01”). ASU 2017-01 finalizes previous proposals regarding shareholder concerns that the definition of a business is applied too broadly. The guidance assists entities with evaluating whether transactions should be accounted for as acquisitions of assets or of businesses. The amendments are effective for annual periods beginning after December 15, 2017, including interim periods within those periods. The Company adopted this guidance on January 1, 2018. The adoption of this guidance did not have a material effect on the Company’s consolidated financial statements.
In May 2017, the FASB issued ASU No. 2017-09, Compensation – Stock Compensation (Topic 718) – Scope of Modification Accounting, (“ASU 2017-09”). ASU 2017-09 requires entities to apply modification accounting to changes made to a share-based payment award. The new guidance specifies that entities will apply modification accounting to changes to a share-based payment award only if any of the following are not the same immediately before and after the change: 1) The award’s fair value (or calculated value or intrinsic value, if those measurement methods are used), 2) the award’s vesting conditions, and 3) the award’s classification as an equity or liability instrument. ASU 2017-09 is effective for annual reporting periods beginning after December 15, 2017, including interim periods within such annual periods, with early adoption permitted. The Company adopted this guidance on January 1, 2018. The adoption of this guidance did not have a material effect on the Company’s consolidated financial statements.
Recently Issued Accounting Pronouncements
In February 2016, the FASB issued ASU No. 2016-02, Leases (Topic 842) (“ASU 2016-02”). ASU 2016-02 will require most lessees to recognize a majority of the company’s leases on the balance sheet, which will increase reported assets and liabilities. ASU 2016-02 is effective for annual reporting periods beginning after December 15, 2018 including interim periods within such annual reporting periods with early adoption permitted. The Company has not early adopted this guidance. The Company is currently developing a preliminary implementation plan. One major element of this plan will involve reviewing historical lease agreements to quantify the impact of adoption. Depending on the results of the Company’s review, there could be material changes to the Company’s financial position and/or results of operations. The Company expects to complete the review of historical agreements and the overall assessment process by the end of the fourth quarter of 2018.
| 11 |
In January 2017, the FASB issued ASU No. 2017-04, Goodwill and Other (Topic 350): Simplifying the Test for Goodwill Impairment (“ASU 2017-04”). This amendment simplifies the manner in which an entity is required to test for goodwill impairment by eliminating Step 2 from the goodwill impairment test. Step 2 measures goodwill impairment loss by comparing the implied fair value of a reporting unit’s goodwill with the carrying amount of that goodwill. The amendment simplifies this approach by having the entity (1) perform its annual or interim goodwill impairment test by comparing the fair value of a reporting unit with its carrying amount, and (2) recognize an impairment charge for the amount by which the carrying amount exceeds the reporting unit’s fair value, with the understanding that the loss recognized should not exceed the total amount of goodwill allocated to that reporting unit. The amendment is effective for public entities that are SEC filers prospectively for their annual, or any interim, goodwill impairment tests in fiscal years beginning after December 15, 2019. Early adoption is permitted for all entities for interim or annual goodwill impairment tests performed on testing dates after January 1, 2017. The Company is currently evaluating the impact on the Company’s financial statements of adopting this guidance.
| 2. | Fair Value of Financial Instruments |
Financial instruments (principally cash and cash equivalents, accounts receivable, accounts payable and accrued expenses) are carried at cost, which approximates fair value due to the short-term maturity of these instruments. The Company’s long-term credit facility is carried at cost, which, due to the variable interest rate associated with the revolving credit facility, approximates its fair value. The Company has no Level 1 or Level 2 financial instruments and there were no transfers between Level 1 or Level 2 financial instruments. Included in Other liabilities on the unaudited Consolidated Balance Sheets at March 31, 2018 is a $35,000 contingent consideration liability classified as Level 3 which remains unchanged from December 31, 2017. The liability is valued using a Monte Carlo simulation and includes unobservable inputs such as expected levels of revenues and discount rates. Changes in the unobservable inputs of this instrument could result in a significant change in the fair value measurement.
| 3. | Revenue Recognition |
The Company’s revenue disaggregated by product for the three-months ended March 31 is as follows (in thousands):
| 2018 | 2017 | |||||||
| Coordination of benefits | $ | 91,752 | $ | 88,491 | ||||
| Analytical services | 49,673 | 25,242 | ||||||
| Total | $ | 141,425 | $ | 113,733 | ||||
Coordination of benefits
Coordination of benefits revenue is derived from contracts with state governments and Medicaid managed care plans that typically span 3 to 5 years with the option to renew. Types of services within these contracts could include: (a) the identification of erroneously paid claims; (b) the delivery of verified commercial insurance coverage information; (c) the identification of paid claims where another third party is liable; and (d) the identification and enrollment of Medicaid members who have access to affordable employer insurance. Most of these contracts contain multiple tasks/deliverables, all of which are not separately identifiable as they are highly interrelated and indistinct within the context of the contract. Therefore, each type of service represents a single, distinct performance obligation. Revenue derived from these performance obligations is largely based on variable consideration where, based on the number of claims or amount of findings the Company identified, a contingent or fixed transaction price/recovery percentage is allocated to each distinct performance obligation. Revenue is recognized when, or as, the performance obligation is satisfied. Due to the timing and volume of information provided from our customers, range of performance obligations and the differing consideration associated with each type of contract, revenue may be recognized in varying increments. Generally, coordination of benefit contract payment terms are not standardized within the respective contract; however, payment is typically due on demand and there is a clear and distinct history of customers making consistent payments.
| 12 |
Analytical services
The Company’s analytical services revenue consists mostly of payment integrity services but also care management and consumer engagement services.
Payment integrity services revenue is derived from contracts with federal and state governments, commercial health plans and other at-risk entities that can span several years with the option to renew. Types of services within these contracts could include: (a) services designed to ensure that healthcare payments are accurate and appropriate; and (b) the identification of over/(under)payments or inaccurate charges based on a review of medical records. Most of these contracts contain multiple tasks/deliverables, all of which are not separately identifiable as they are highly interrelated and indistinct within the context of the contract. Therefore, each type of service represents a single, distinct performance obligation. Revenue derived from these performance obligations is largely based on variable consideration where, based on the number of claims or amount of findings the Company identified, a contingent or fixed transaction price/recovery percentage is allocated to each distinct performance obligation. Revenue is recognized when, or as, the performance obligation is satisfied. Due to the timing and volume of information provided from our customers, range of performance obligations and the differing consideration associated with each type of contract, revenue may be recognized in varying increments. Generally, payment integrity contract payment terms are not standardized within the respective contract; however, payment is typically due on demand and there is a clear and distinct history of customers making consistent payments.
Care management and consumer engagement services revenue is derived from contracts with health plans and other risk-bearing entities that can span several years with the option to renew. Types of services within these contracts could include: (a) programs designed to improve member engagement; and (b) outreach services designed to improve clinical outcomes. Most of these contracts contain multiple tasks/deliverables, all of which are not separately identifiable as they are highly interrelated and indistinct within the context of the contract. Therefore, each type of service represents a single, distinct performance obligation. Revenue derived from these services is largely based on consideration associated with prices per order/transfer and PMPM/PMPY fees and is generally recognized monthly/yearly based on the services performed; therefore, the amount of variable consideration does not often need to be estimated for these agreements. Additionally, certain care management and consumer engagement services contracts have distinct performance obligations related to software license and implementation fees which have historically been recognized as revenue ratably over the life of the contract. However, upon adoption of ASU 2014-09 revenue for software licenses is recognized at the beginning of the license period when control is transferred as the license is installed and revenue for implementation fees is recognized when control is as transferred over time as the implementation is being performed. As the performance obligation is deemed to have been satisfied and control transferred to our customers for software licenses and implementation fees on or before December 31, 2017, the Company recorded a decrease to deferred revenue and an increase to opening retained earnings of $1.4 million as of January 1, 2018 for the cumulative impact of adopting ASU 2014-09. A portion of the Company’s care management and consumer engagement services are deferred and revenue is recognized over time. Deferred revenue of this nature was approximately $5.0 million and $6.4 million as of March 31, 2018 and December 31, 2017 and is included in Accounts payable, accrued expenses and other liabilities in the Consolidated Balance Sheets. Generally, care management and consumer engagement contract payment terms are stated within the contract and are due within an explicitly stated time period (e.g., 30, 45, 60 days) from the date of invoice.
Contract modifications are routine in nature and often done to account for changes in the contract specifications or requirements. In most instances, contract modifications are for services that are not distinct, and, therefore, modifications are accounted for as part of the existing contract.
| 13 |
| 4. | Accounts Receivable and Accounts Receivable Allowance |
The Company’s accounts receivable, net, consisted of the following (in thousands):
| March
31, 2018 | December
31, 2017 | |||||||
| Accounts receivable | $ | 201,503 | $ | 204,259 | ||||
| Allowance | (14,371 | ) | (14,799 | ) | ||||
| Accounts receivable, net | $ | 187,132 | $ | 189,460 | ||||
We record an accounts receivable allowance, based on historical patterns of billing adjustments, length of operating and collection cycle and customer negotiations, behaviors and payment patterns. Changes in these estimates are recorded to revenue in the period of change. A summary of the activity in the accounts receivable allowance was as follows (in thousands):
March 31, 2018 | December 31, 2017 | |||||||
| Balance--beginning of period | $ | 14,799 | $ | 10,772 | ||||
| Provision | 5,011 | 20,233 | ||||||
| Charge-offs | (5,439 | ) | (16,206 | ) | ||||
| Recoveries | - | - | ||||||
| Balance--end of period | $ | 14,371 | $ | 14,799 | ||||
| 5. | Intangible Assets and Goodwill |
Intangible assets consisted of the following (in thousands, except for weighted average amortization period):
| Gross
Carrying Amount | Accumulated
Amortization | Net
Carrying Amount | Weighted
Average Amortization Period (in years) | |||||||||||||
| March 31, 2018 | ||||||||||||||||
| Customer relationships | $ | 159,290 | $ | (93,677 | ) | $ | 65,613 | 11.3 | ||||||||
| Trade names | 16,246 | (14,470 | ) | 1,776 | 1 | |||||||||||
| Intellectual property | 21,700 | (3,796 | ) | 17,904 | 5.2 | |||||||||||
| Restrictive covenants | 263 | (195 | ) | 68 | 1.3 | |||||||||||
| Total | $ | 197,499 | $ | (112,138 | ) | $ | 85,361 | |||||||||
| 14 |
| Gross
Carrying Amount | Accumulated
Amortization | Net
Carrying Amount | Weighted
Average Amortization Period (in years) | |||||||||||||
| December 31, 2017 | ||||||||||||||||
| Customer relationships | $ | 159,290 | $ | (89,106 | ) | $ | 70,184 | 11.3 | ||||||||
| Trade names | 16,246 | (13,916 | ) | 2,330 | 1 | |||||||||||
| Intellectual property | 21,700 | (2,874 | ) | 18,826 | 5.2 | |||||||||||
| Restrictive covenants | 263 | (121 | ) | 142 | 1.3 | |||||||||||
| Total | $ | 197,499 | $ | (106,017 | ) | $ | 91,482 | |||||||||
Amortization expense of intangible assets is expected to approximate the following (in thousands):
| Year ending December 31, | ||||
| 2018 | $ | 17,735 | ||
| 2019 | 9,258 | |||
| 2020 | 7,804 | |||
| 2021 | 7,477 | |||
| 2022 | 7,197 | |||
| Thereafter | 35,890 | |||
| Total | $ | 85,361 | ||
For the three months ended March 31, 2018 and 2017 amortization expense related to intangible assets was $6.1 million and $4.3 million, respectively.
There were no changes in the carrying amount of goodwill for the quarter ended March 31, 2018.
| 6. | Accounts Payable, Accrued Expenses and Other Liabilities |
Accounts payable, accrued expenses and other liabilities consisted of the following (in thousands):
| March
31, 2018 | December
31, 2017 | |||||||
| Accounts payable, trade | $ | 10,416 | $ | 19,330 | ||||
| Accrued compensation and other | 16,341 | 24,072 | ||||||
| Accrued operating expenses | 18,688 | 18,498 | ||||||
| Total accounts payable, accrued expenses and other liabilities | $ | 45,445 | $ | 61,900 | ||||
| 7. | Income Taxes |
The Company’s effective tax rate increased to 32.0% for the three months ended March 31, 2018 from 20.4% for the three months ended March 31, 2017. The effective tax rate for the three months ended March 31, 2018 includes discrete tax expense for interest on uncertain tax benefits and net stock compensation shortfalls as well as a net federal tax reform benefit comprised of a federal tax rate decrease, net of state impact, offset by tax increases for officer compensation deduction limits and loss of the Section 199 Deduction. For the three months ended March 31, 2018, the differences between the federal statutory rate and our effective tax rate are state taxes, equity compensation impacts, unrecognized tax benefits, including interest, officer compensation deduction limits, R&D Credits, and other permanent differences.
| 15 |
The effective tax rate for the three months ended March 31, 2018 represents the Company’s best estimate using information available to the Company as of May 7, 2018. The Company anticipates U.S. regulatory agencies will issue further regulations over the next nine months which may alter this estimate. The Company is still evaluating, among other things, the application of limitations for executive compensation related to contracts existing prior to November 2, 2017. The Company will refine its estimates to incorporate new or better information as it becomes available through the filing date of its 2017 U.S. income tax returns in the fourth quarter of 2018.
Included in Other Liabilities on the Consolidated Balance Sheets, are the total amount of unrecognized tax benefits of approximately $8.5 million and $8.2 million, as of March 31, 2018 and December 31, 2017, respectively, (net of the federal benefit for state issues) that, if recognized, would favorably affect the Company’s future effective tax rate. Also included in Other Liabilities on the Consolidated Balance Sheets, are accrued liabilities for interest expense and penalties related to unrecognized tax benefits of $0.8 million and $0.6 million as of March 31, 2018 and December 31, 2017, respectively. HMS includes interest expense and penalties in the provision for income taxes in the unaudited Consolidated Statements of Income. The amount of interest expense (net of federal and state income tax benefits) and penalties in the unaudited Consolidated Statements of Income for the three months ended March 31, 2018 and 2017 was $0.2 million and $0.1 million, respectively. The Company believes it is reasonably possible that the amount of unrecognized tax benefits may decrease by $1.8 million over the next twelve months, due to the expiration of the statute of limitations in federal and various state jurisdictions.
HMS files income tax returns with the U.S. Federal government and various state and local jurisdictions. HMS is no longer subject to U.S. Federal income tax examinations for years before 2012. The Company is currently under audit by the Internal Revenue Service for years 2013 and 2014, and no assessments have been received. HMS operates in a number of state and local jurisdictions. Accordingly, HMS is subject to state and local income tax examinations based on the various statutes of limitations in each jurisdiction. Previously recognized Texas refund claims are currently being examined by the state.
| 8. | Estimated Liability For Appeals |
Under the Company’s contracts with certain commercial health plan customers and its Medicare RAC contracts with CMS (included within the Company’s analytical services product revenue), providers have the right to appeal HMS claim findings and to pursue additional appeals if the initial appeal is found in favor of HMS’s customer. The appeal process established under the Medicare RAC contract with CMS includes five levels of appeals, and resolution of appeals can take substantial time to resolve. HMS records a) a return obligation liability for findings which have been adjudicated in favor of providers and b) an estimated return obligation liability based on the amount of revenue that is subject to appeals and which are probable of being adjudicated in favor of providers following their successful appeal. The Company’s estimate is based on the Company’s historical experience. To the extent the amount to be returned to providers following a successful appeal exceeds or is less than the amount recorded, revenue in the applicable period would be reduced or increased by such amount. Any future changes to any of the Company’s customer contracts, including modifications to the Medicare RAC contract, may require the Company to apply different assumptions that could materially affect both the Company’s revenue and estimated liability for appeals in future periods.
The Company’s original Medicare RAC contract with CMS expired on January 31, 2018. As a result of the contract expiration, the Company’s contractual obligation with respect to any appeals resolved in favor of providers subsequent to the expiration date have ceased and therefore the Company released its estimated liability and increased revenue by $8.4 million during the first quarter of 2018. The Company continues to assess the remaining Medicare RAC liability to determine management’s best estimate of liability for any findings which have been previously adjudicated prior to the expiration of the contract.
| 16 |
The total estimated liability for appeals balance of $22.6 million and $30.8 million as of March 31, 2018 and December 31, 2017, respectively, includes $19.4 million and $19.3 million, respectively, of Medicare RAC claim findings which have been adjudicated in favor of providers, and $0.0 million and $8.5 million, respectively, of the Company’s estimate of the potential amount of Medicare RAC repayments that are probable of being adjudicated in favor of providers following a successful appeal. Additionally, the total estimated liability for appeals balance includes $3.2 million and $3.0 million related to commercial customers claim appeals. The provision included in the estimated liability for appeals is an offset to revenue in the Company’s Consolidated Statements of Income.
A summary of the activity in the estimated liability for appeals related to the Company’s original Medicare RAC contract was as follows (in thousands):
| March
31, 2018 | December
31, 2017 | |||||||
| Balance--beginning of period | $ | 8,544 | $ | 11,126 | ||||
| Provision | - | 83 | ||||||
| Appeals found in providers favor | (108 | ) | (2,665 | ) | ||||
| Release of liability | (8,436 | ) | - | |||||
| Balance--end of period | $ | - | $ | 8,544 | ||||
| 9. | Credit Agreement |
In December 2017, the Company entered into an amendment to its Credit Agreement, which, among other things, extended the maturity of its then existing revolving credit facility by five years to December 2022 (the “Amended Revolving Facility”). The availability of funds under the Amended Revolving Facility includes sublimits for (a) up to $50 million for the issuance of letters of credit and (b) up to $25 million for swingline loans. In addition, the Company may increase the commitments under the Amended Revolving Facility and/or add one or more incremental term loan facilities, provided that such incremental facilities do not exceed in the aggregate the sum of (i) the greater of $120 million and 100% of Consolidated EBITDA (as defined in the Credit Agreement) and (ii) an additional amount so long as our first lien leverage ratio (as defined in the Credit Agreement) on a pro forma basis is not greater than 3.00:1.00, subject to obtaining commitments from lenders therefor and meeting certain other conditions.
As of March 31, 2018 and December 31, 2017, the outstanding principal balance due on the Amended Revolving Facility was $240.0 million. No principal payments were made against the Company’s Amended Revolving Facility during the three months ended March 31, 2018.
Borrowings under the Amended Revolving Facility bear interest at a rate equal to, at the Company’s election (except with respect to swingline borrowings, which will accrue interest based only at the base rate), either:
| § | a base rate determined by reference to the greatest of (a) the prime or base commercial lending rate of the administrative agent as in effect on the relevant date, (b) the federal funds effective rate plus 0.50% and (c) the one-month LIBO rate plus 1.00%, plus an interest margin ranging from 0.50% to 1.00% based on the Company’s consolidated leverage ratio for the applicable period; or |
| § | an adjusted LIBO rate, equal to the LIBO rate for the applicable interest period multiplied by the statutory reserve rate (equal to (x) one divided by (y) one minus the aggregate of the maximum reserve percentage (including any marginal, special, emergency or supplemental reserves) established by the Board of Governors of the Federal Reserve System of the United States), plus an interest margin ranging from 1.50% to 2.00% based on the Company’s consolidated leverage ratio for the applicable period. |
In addition to paying interest on the outstanding principal, the Company is required to pay unused commitment fees on the Amended Revolving Facility during the term of the Credit Agreement ranging from 0.375% to 0.250% per annum based on the Company’s consolidated leverage ratio and letter of credit fees equal to 0.125% per annum on the aggregate face amount of each letter of credit, as well as customary agency fees.
| 17 |
The Amended Revolving Facility is secured, subject to certain customary carve-outs and exceptions, by a first priority lien and security interest in substantially all tangible and intangible assets of the Company and certain subsidiaries of the Company. The Amended Revolving Facility contains certain restrictive covenants, which affect, among other things, the ability of the Company and its subsidiaries to incur indebtedness, create liens, make investments, sell or otherwise dispose of assets, engage in mergers or consolidations with other entities, and pay dividends or repurchase stock. The Company is also required to comply, on a quarterly basis, with two financial covenants: (i) a minimum interest coverage ratio of 3:00:1:00, and (ii) a maximum consolidated leverage ratio of 4.75:1.00 through December 2019 and 4.25:1.00 from and after January 2020. The consolidated leverage ratio is subject to a step-up to 5.25:1.00 for four full consecutive fiscal quarters following a permitted acquisition or similar investment. As of March 31, 2018, the Company was in compliance with all terms of the Credit Agreement.
Interest expense and the commitment fees on the unused portion of the Company’s revolving credit facility were as follows (in thousands):
| Three
Months Ended March 31, | ||||||||
| 2018 | 2017 | |||||||
| Interest expense | $ | 2,070 | $ | 1,374 | ||||
| Commitment fees | 239 | 378 | ||||||
As of March 31, 2018 and December 31, 2017, the unamortized balance of deferred origination fees and debt issuance costs were $2.7 million and $2.8 million, respectively. For the three month periods ended March 31, 2018 and 2017, HMS amortized $0.1 million and $0.5 million, respectively, of interest expense related to the Company’s deferred origination fees and debt issue costs.
Although HMS expects that operating cash flows will continue to be a primary source of liquidity for the Company’s operating needs, the Amended Revolving Facility may be used for general corporate purposes, including, but not limited to acquisitions, if necessary.
As part of the Company’s contractual agreement with a customer, HMS has an outstanding irrevocable letter of credit for $5.4 million, which is issued against the Amended Revolving Facility and expires June 22, 2018.
| 18 |
| 10. | Earnings Per Share |
The following table reconciles the basic to diluted weighted average common shares outstanding using the treasury stock method (in thousands, except per share amounts):
| Three
Months Ended March 31, | ||||||||
| 2018 | 2017 | |||||||
| Net income | $ | 6,391 | $ | 1,442 | ||||
| Weighted average common shares outstanding-basic | 83,933 | 83,617 | ||||||
| Plus: net effect of dilutive stock options and restricted stock units | 1,749 | 1,963 | ||||||
| Weighted average common shares outstanding-diluted | 85,682 | 85,580 | ||||||
| Net income per common share-basic | $ | 0.08 | $ | 0.02 | ||||
| Net income per common share-diluted | $ | 0.07 | $ | 0.02 | ||||
For the three months ended March 31, 2018 and 2017, 3,118,939 and 2,106,397 stock options, respectively, were not included in the diluted earnings per share calculation because the effect would have been anti-dilutive. For the three months ended March 31, 2018 and 2017, restricted stock units representing 58,743 and 42,056 shares of common stock, respectively, were not included in the diluted earnings per share calculation because the effect would have been anti-dilutive.
| 11. | Stock-Based Compensation |
(a) Stock-Based Compensation Expense
Total stock-based compensation expense in the Company’s unaudited Consolidated Statements of Income related to the Company’s long-term incentive award plans was as follows (in thousands):
| Three
Months Ended March 31, | ||||||||
| 2018 | 2017 | |||||||
| Cost of services-compensation | $ | 2,563 | $ | 2,040 | ||||
| Selling, general and administrative | 6,931 | 3,346 | ||||||
| Total | $ | 9,494 | $ | 5,386 | ||||
(b) Stock Options
Stock-based compensation expense related to stock options was approximately $4.0 million and $2.1 million for the three months ended March 31, 2018 and 2017, respectively.
| 19 |
Presented below is a summary of stock option activity for the three months ended March 31, 2018 (in thousands except for weighted average exercise price and weighted average remaining contractual terms):
| Number
of Options | Weighted Average Exercise Price | Weighted Average Remaining Contractual Terms | Aggregate Intrinsic Value | |||||||||||||
| Outstanding balance at December 31, 2017 | 5,554 | $ | 17.35 | |||||||||||||
| Granted | 923 | 19.41 | ||||||||||||||
| Exercised | (9 | ) | 15.97 | |||||||||||||
| Forfeitures | (21 | ) | 15.74 | |||||||||||||
| Expired | (21 | ) | 20.36 | |||||||||||||
| Outstanding balance at March 31, 2018 | 6,426 | 17.70 | 5.53 | $ | 7,875 | |||||||||||
| Expected to vest at March 31, 2018 | 1,657 | 17.48 | 8.12 | 1,691 | ||||||||||||
| Exercisable at March 31, 2018 | 3,908 | $ | 17.84 | 3.90 | $ | 5,331 | ||||||||||
During the three months ended March 31, 2018 and 2017, the Company issued 9,043 and 677 shares, respectively, of the Company’s common stock upon the exercise of outstanding stock options and received proceeds of $144,408 and $1,836, respectively. The total intrinsic value of stock options exercised during the three months ended March 31, 2018 and 2017 was $13,849 and $10,903, respectively.
As of March 31, 2018, there was approximately $10.5 million of total unrecognized compensation cost related to stock options outstanding, which is expected to be recognized over a weighted average period of 2.47 years.
The weighted-average grant date fair value per share of the stock options granted during the three months ended March 31, 2018 was $6.83. There were no stock options granted during the three months ended March 31, 2017. HMS estimated the fair value of each stock option grant on the date of grant using a Black-Scholes option pricing model and weighted–average assumptions set forth in the following table:
| Three
Months Ended March 31, | ||||||||
| 2018 | 2017 | |||||||
| Expected dividend yield | - | - | ||||||
| Risk-free interest rate | 2.66 | % | - | |||||
| Expected volatility | 42.49 | % | - | |||||
| Expected life (years) | 6.00 | - | ||||||
The total tax benefits recognized on stock-based compensation for the three months ended March 31, 2018 and 2017 is $2.1 million and $3.1 million, respectively.
| (c) | Restricted Stock Units |
Stock-based compensation expense related to restricted stock units was $5.5 million and $3.3 million for the three months ended March 31, 2018 and 2017, respectively.
| 20 |
Presented below is a summary of restricted stock units activity for the three months ended March 31, 2018 (in thousands, except for weighted average grant date fair value per unit):
| Number
of Units | Weighted
Average Grant Date Fair Value per Unit | |||||||
| Outstanding balance at December 31, 2017 | 1,346 | $ | 17.65 | |||||
| Granted | 699 | 16.93 | ||||||
| Vesting of restricted stock units, net of units withheld for taxes | (331 | ) | 16.85 | |||||
| Units withheld for taxes | (154 | ) | 16.85 | |||||
| Forfeitures | (11 | ) | 16.60 | |||||
| Outstanding balance at March 31, 2018 | 1,549 | $ | 17.56 | |||||
As of March 31, 2018, 1,363,295 restricted stock units remained unvested and there was approximately $16.0 million of unrecognized compensation cost related to restricted stock units, which is expected to be recognized over a weighted average vesting period of 1.54 years.
| 12. | Commitments and Contingencies |
In July 2012, Dennis Demetre and Lori Lewis (the “Plaintiffs”), filed an action in the Supreme Court of the State of New York against HMS Holdings Corp., claiming an undetermined amount of damages alleging that various actions by HMS unlawfully deprived the Plaintiffs of the acquisition earn-out portion of the purchase price for Allied Management Group Special Investigation Unit (“AMG”) under the applicable Stock Purchase Agreement (the “SPA”) and that HMS had breached certain contractual provisions under the SPA. The Plaintiffs filed a second amended complaint with two causes of action for breach of contract and one cause of action for breach of implied covenant of good faith and fair dealing. HMS asserted a counterclaim against Plaintiffs for breach of contract based on contractual indemnification costs, including attorneys’ fees arising out of the Company’s defense of AMG in Kern Health Systems v. AMG, Dennis Demetre and Lori Lewis (the “California Action”), which are recoverable under the SPA. In June 2016, Kern Health Systems and AMG entered into a settlement agreement that resolved all claims in the California Action. In July 2017, the Court issued a decision on the Company’s motion for partial summary judgment and granted the motion in part, dismissing one of Plaintiffs’ breach of contract causes of action against HMS. On November 3, 2017, following a jury trial, a verdict was returned in favor of the Plaintiffs on a breach of contract claim, and the jury awarded $60 million in damages to the Plaintiffs. On March 14, 2018, the Court held a hearing on the Company’s post-trial motion for an order granting it judgment notwithstanding the verdict or, alternatively, setting aside the jury’s award of damages. A decision on the motion has not yet been issued by the Court. The Company continues to believe that strong grounds exist to overturn or greatly reduce the damages awarded by the jury. In light of the Company’s belief that the jury award was unsupportable as a matter of law, the Company has not recorded a reserve for this pending litigation. HMS will continue to monitor developments in assessing the probability and measurability of any related loss contingency.
In February 2018, the Company received a Civil Investigative Demand from the Texas Attorney General, purporting to investigate possible unspecified violations of the Texas Medicaid Fraud Prevention Act. The Company has been cooperating with the government and providing documents and information in response to the Civil Investigative Demand.
From time to time, HMS may be subject to investigations, legal proceedings and other disputes arising in the ordinary course of the Company’s business, including but not limited to regulatory audits, billing and contractual disputes, employment-related matters and post-closing disputes related to acquisitions. Due to the Company’s contractual relationships, including those with federal and state government entities, HMS’s operations, billing and business practices are subject to scrutiny and audit by those entities and other multiple agencies and levels of government, as well as to frequent transitions and changes in the personnel responsible for oversight of the Company’s contractual performance. HMS may have contractual disputes with its customers arising from differing interpretations of contractual provisions that define the Company’s rights, obligations, scope of work or terms of payment, and with associated claims of liability for inaccurate or improper billing for reimbursement of contract fees, or for sanctions or damages for alleged performance deficiencies. Resolution of such disputes may involve litigation or may require that HMS accept some amount of loss or liability in order to avoid customer abrasion, negative marketplace perceptions and other disadvantageous results that could affect the Company’s business, financial condition, results of operations and cash flows.
| 21 |
HMS records accruals for outstanding legal matters when it believes it is probable that a loss will be incurred and the amount can be reasonably estimated. The Company evaluates, on a quarterly basis, developments in legal matters that could affect the amount of any accrual and developments that would make a loss contingency both probable and reasonably estimable. If a loss contingency is not both probable and estimable, HMS does not establish an accrued liability.
| 13. | Subsequent Events |
In connection with the preparation of these unaudited Consolidated Financial Statements, an evaluation of subsequent events was performed through the date of filing and there were no events that have occurred that would require adjustments to the financial statements or disclosure.
| 22 |
| Item 2. | Management’s Discussion and Analysis of Financial Condition and Results of Operations |
The following Management’s Discussion and Analysis is intended to help the reader understand the results of operations and financial condition of HMS. You should read this discussion and analysis in conjunction with the other sections of this Form 10-Q, including the Cautionary Note Regarding Forward-Looking Statements appearing prior to Part I and the unaudited Consolidated Financial Statements and Notes thereto in Part I, Item 1. The historical results set forth in Part I, Item 1 and Item 2 of this Form 10-Q should not be taken as necessarily indicative of our future operations or financial results.
Business Overview
HMS is a leading provider of cost containment solutions in the U.S. healthcare marketplace. Using innovative technology as well as extensive data services and powerful analytics, we deliver coordination of benefits, payment integrity, and care management and consumer engagement solutions through our operating subsidiaries to help healthcare payers improve financial performance and clinical outcomes. Together our various services help our customers recover improper payments; prevent future improper payments; reduce fraud, waste and abuse; better manage the care that their members receive; engage healthcare consumers to improve clinical outcomes and increase retention; and achieve regulatory compliance.
We serve state Medicaid programs, commercial health plans, federal government health agencies, government and private employers, CHIPs and other healthcare payers and sponsors. We also serve as a subcontractor for certain business outsourcing and technology firms. As of March 31, 2018, our customer base included the following:
| § | over 40 state Medicaid programs; |
| § | approximately 325 health plans, including 23 of the top 25 health plans nationally (based on membership) in support of their multiple lines of business, including Medicaid managed care, Medicare Advantage and group and individual health; |
| § | over 225 private employers; |
| § | CMS, the Centers for Disease Control and Prevention, and the Department of Veterans Affairs; and |
| § | PBMs, third-party administrators and other risk-bearing entities, including independent practice associations, hospital systems, ACOs and specialty care organizations. |
Critical Accounting Policies and Estimates
Since the date of our 2017 Form 10-K, there have been no material changes to our critical accounting policies other than with respect to revenue recognition as described in Notes 1 and 3 to the unaudited Consolidated Financial Statements in Part I, Item 1 of this Form 10-Q. With respect to our accounting policies other than revenue recognition, refer to the discussion in our 2017 Form 10-K under “Critical Accounting Policies and Estimates” in Part II, Item 7. Management’s Discussion and Analysis of Financial Condition and Results of Operations and “Business and Summary of Significant Accounting Policies” in Note 1 to the Consolidated Financial Statements under Part II, Item 8.
| 23 |
RESULTS
As of and for the period ended March 31, 2018
| § | Revenue of $141.4 million increased $27.7 million, or 24.4% over the same quarter in 2017; |
| § | Operating income of $11.9 million increased by $8.0 million over the same quarter in 2017; |
| § | Net income of $6.3 million increased $4.9 million over the same quarter in 2017; and |
| § | First quarter 2018 cash flow from operations was $14.7 million |
Comparison of Three Months Ended March 31, 2018 to March 31, 2017
| dollars in millions | Three
Months Ended March 31, | $ Change | % Change | |||||||||||||
| 2018 | 2017 | 2018 vs 2017 | ||||||||||||||
| Revenue | $ | 141.4 | $ | 113.7 | $ | 27.7 | 24.4 | % | ||||||||
| Cost of Services : | ||||||||||||||||
| Compensation | 56.1 | 48.9 | 7.2 | 14.7 | ||||||||||||
| Information technology | 12.3 | 9.8 | 2.5 | 25.5 | ||||||||||||
| Occupancy | 4.4 | 3.6 | 0.8 | 22.2 | ||||||||||||
| Direct project costs | 10.1 | 10.4 | (0.3 | ) | (2.9 | ) | ||||||||||
| Other operating costs | 6.5 | 7.2 | (0.7 | ) | (9.7 | ) | ||||||||||
| Amortization of acquisition related software and intangible assets | 8.1 | 6.3 | 1.8 | 28.6 | ||||||||||||
| Total Cost of Services | 97.5 | 86.2 | 11.3 | 13.1 | ||||||||||||
| Selling, general and administrative expenses | 32.0 | 23.6 | 8.4 | 35.6 | ||||||||||||
| Total Operating Expenses | 129.5 | 109.8 | 19.7 | 17.9 | ||||||||||||
| Operating Income | 11.9 | 3.9 | 8.0 | 205.1 | ||||||||||||
| Interest expense | (2.6 | ) | (2.3 | ) | (0.3 | ) | 13.0 | |||||||||
| Interest income | 0.1 | 0.2 | (0.1 | ) | (50.0 | ) | ||||||||||
| Income before income taxes | 9.4 | 1.8 | 7.6 | 422.2 | ||||||||||||
| Income taxes | 3.0 | 0.4 | 2.6 | 650.0 | ||||||||||||
| Net Income | $ | 6.4 | $ | 1.4 | $ | 5.0 | 357.1 | % | ||||||||
Revenue (in millions)

Three Months Ended March 31 – 2018 vs. 2017
During the three months ended March 31, 2018 revenue was $141.4 million, an increase of $27.7 million or 24.4% compared to revenue of $113.7 million for the prior year quarter.
| 24 |
| ▪ | By product: |
| o | Coordination of benefits revenue increased $3.2 million or 3.6% which was attributable to incremental services and yield increases provided to existing customers in our cost avoidance business. |
| o | Analytical services revenue increased $24.5 million or 97.2% which was attributable to our Eliza subsidiary (acquired in April 2017) contributing revenue of $9.7 million and revenue from Essette increasing $0.7 million as compared to prior year quarter. Medicare RAC revenue increased by $9.7 million, primarily relating to an $8.4 million release of our Medicare RAC appeals liability due to contract expiration. Payment integrity revenue increased $4.4 million as compared to prior year quarter primarily due to increased demand from existing clients, yield enhancements and improvements in provider processes. |
| ▪ | By market: |
| o | Commercial health plan market revenue increased $16.7 million or 30.3% which was attributable to our Eliza subsidiary (acquired in April 2017) contributing revenue of $9.7 million and revenue from Essette increasing $0.7 million as compared to the prior year quarter. Other increases were related to incremental services and yield increases provided to existing customers in our cost avoidance business. |
| o | State government market revenue grew by $1.3 million or 2.4%, which was attributable to expanded scopes and yield improvements. |
| o | Federal government market revenue increased $9.7 million, primarily relating to an $8.4 million release of our Medicare RAC appeals liability due to contract expiration. Payment integrity revenue increased $4.4 million as compared to prior year quarter primarily due to increased demand from existing clients, yield enhancements and improvements in provider processes. |
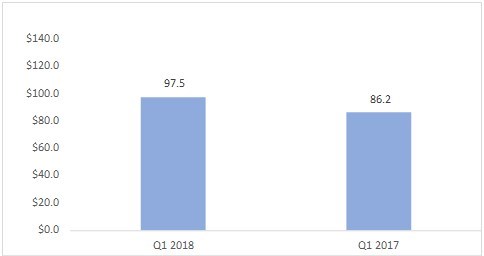
Total Cost of Services (in millions)
| 25 |
Three Months Ended March 31 – 2018 vs. 2017
During three months ended March 31, 2018, total cost of services was $97.5 million, an increase of $11.3 million or 13.1% compared to $86.2 million for the prior year period.
|
▪
▪ |
Our Eliza subsidiary (acquired in April 2017) and its related compensation, information technology, occupancy and amortization of intangibles expenses represented $8.3 million of the increase.
Cost of sales also increased by $3.7 million due to higher non-Eliza compensation related expenses. |
Selling, General and Administrative expenses (in millions)

Three Months Ended March 31 – 2018 vs. 2017
During the three months ended March 31, 2018, SG&A expense was $32.0 million, an increase of $8.4 million or 35.6% compared to $23.6 million for the prior year period.
| § | Our Eliza subsidiary (acquired in April 2017) represented $3.2 million of the increase. |
| § | Excluding Eliza, stock compensation expense increased by $3.6 million due to an increase in the number of retirement eligible employees and variable compensation expense increased by $1.2 million. |
Income Taxes
Three Months Ended March 31 – 2018 vs. 2017
The Company’s effective tax rate increased to 32.0% for the three months ended March 31, 2018 from 20.4% for the three months ended March 31, 2017. The effective tax rate for the three months ended March 31, 2018 includes discrete tax expense for interest on uncertain tax benefits and net stock compensation shortfalls as well as a net federal tax reform benefit comprised of a federal tax rate decrease, net of state impact, partially offset by tax increases for officer compensation deduction limits and loss of the Section 199 Deduction. Excluding the above mentioned discrete tax expense and net federal tax reform benefit, our effective tax rate would approximate 38.7% for the three months ended March 31, 2018. For the three months ended March 31, 2018, the differences between the federal statutory rate and our effective tax rate are state taxes, equity compensation impacts, unrecognized tax benefits, including interest, officer compensation deduction limits, R&D Credits, and other permanent differences.
| 26 |
Off-Balance Sheet Arrangements
We do not have any off-balance sheet arrangements.
Liquidity and Capital Resources
The following tables should be read in conjunction with the unaudited Consolidated Financial Statements and Notes thereto in Part I, Item 1 of this Form 10-Q.
Our cash and cash equivalents, working capital and available borrowings under our credit facility (based upon the borrowing base and financial covenants in our Credit Agreement) were as follows (in thousands):
| March
31, 2018 | December
31, 2017 | |||||||
| Cash and cash equivalents | $ | 83,898 | $ | 83,313 | ||||
| Working capital | $ | 216,917 | $ | 199,967 | ||||
| Available borrowings under credit facility | $ | 338,498 | $ | 254,600 | ||||
A summary of our cash flows was as follows (in thousands):
| Three
Months Ended March 31, | ||||||||
| 2018 | 2017 | |||||||
| Net cash provided by operating activities | $ | 14,737 | $ | 3,386 | ||||
| Net cash used in investing activities | (5,754 | ) | (8,488 | ) | ||||
| Net cash used in financing activities | (8,398 | ) | (2,608 | ) | ||||
| Net increase (decrease) in cash and cash equivalents | $ | 585 | $ | (7,710 | ) | |||
Our principal source of cash has been our cash flow from operations and our $500 million five-year revolving credit facility. Other sources of cash include proceeds from the exercise of stock options and tax benefits associated with stock option exercises. The primary uses of cash are capital investments, acquisitions, compensation expenses, information technology, direct project costs, SG&A expenses and repurchases of our common stock.
We believe that expected cash flows from operations, available cash and cash equivalents, and funds available under our revolving credit facility will be sufficient to meet our liquidity requirements for the following year, which include:
| § | the working capital requirements of our operations; |
| § | investments in our business; |
| § | business development activities; |
| § | repurchases of common stock; and |
| § | repayment of our revolving credit facility. |
Any projections of future earnings and cash flows are subject to substantial uncertainty. We may need to access debt and equity markets in the future if unforeseen costs or opportunities arise, to meet working capital requirements, fund acquisitions or repay our indebtedness under the Credit Agreement. If we need to obtain new debt or equity financing in the future, the terms and availability of such financing may be impacted by economic and financial market conditions as well as our financial condition and results of operations at the time we seek additional financing.
| 27 |
Cash Flows from Operating Activities
Net cash provided by operating activities for the three months ended March 31, 2018 was $14.7 million, an increase of $11.3 million as compared to net cash provided by operating activities of $3.4 million for the three months ended March 31, 2017. The increase in operating cash flow is primarily attributable to increases in net income, stock-based compensation, income taxes receivable and prepaid expenses, together with a decrease in accounts payable, accrued expenses and other liabilities. These were partially offset by the non-cash release of the estimated liability for appeals and a decrease in accounts receivable.
Cash Flows from Investing Activities
Net cash used in investing activities for the three months ended March 31, 2018 was $5.8 million, a $2.7 million decrease compared to net cash used in investing activities of $8.5 million for the three months ended March 31, 2017 due to decreases in purchases of property and equipment which were partially offset by increases in investments in capital software.
Cash Flows from Financing Activities
Net cash used in financing activities for the three months ended March 31, 2018 was $8.4 million, a $5.8 million increase compared to net cash used in financing activities of $2.6 million for the three months ended March 31, 2017 due primarily to share repurchases.
Contractual Obligations
There have been no material changes outside the ordinary course of business in our contractual obligations as presented in our 2017 Form 10-K.
Recently Issued Accounting Pronouncements
The information set forth under the caption “Recently Issued Accounting Pronouncements” in Note 1 to the unaudited Consolidated Financial Statements in Part I, Item 1 is incorporated herein by reference.
| Item 3. | Quantitative and Qualitative Disclosures About Market Risk |
There have been no material changes to the market risks discussed in Item 7A to Part II of our 2017 Form 10-K.
| Item 4. | Controls and Procedures |
We are responsible for maintaining disclosure controls and procedures (as defined in Rule 13a-15(e) under the Exchange Act) that are designed to ensure that information required to be disclosed in our reports filed under the Exchange Act is recorded, processed, summarized and reported within the time periods specified in the SEC’s rules and forms and that such information is accumulated and communicated to our management, including our Chief Executive Officer and our Chief Financial Officer, as appropriate, to allow for timely decisions regarding required disclosure. In designing and evaluating the disclosure controls and procedures, management recognizes that any controls and procedures, no matter how well designed and operated, can provide only reasonable assurance of achieving the desired control objectives, and management is required to apply its judgment in evaluating the cost-benefit relationship of possible controls and procedures.
As required by Rule 13a-15(b) under the Exchange Act, management, with the participation of our Chief Executive Officer and Chief Financial Officer, performed an evaluation of the effectiveness of our disclosure controls and procedures as of March 31, 2018. Based on that evaluation, our Chief Executive Officer and Chief Financial Officer concluded that our disclosure controls and procedures were effective to provide reasonable assurance that their objectives were met as of the end of the period covered by this Form 10-Q.
There have been no changes in the Company's internal control over financial reporting identified in connection with the evaluation of our controls performed during the three months ended March 31, 2018, that have materially affected, or are reasonably likely to materially affect, our internal control over financial reporting.
| 28 |
| Item 1. | Legal Proceedings |
The information set forth under the caption “Commitments and Contingencies” in Note 12 to the unaudited Consolidated Financial Statements of this Form 10-Q is incorporated herein by reference.
| Item 1A. | Risk Factors |
In addition to the information set forth in this Form 10-Q, the risks that are discussed in the 2017 Form 10-K, under the headings “Part I, Item 1. Business,” “Part I, Item 1A. Risk Factors” and “Part II, Item 7A. Quantitative and Qualitative Disclosures About Market Risk,” should be carefully considered as such risks could materially affect the Company’s business, financial conditions or future results. There has been no material change in the Company’s risk factors from those described in the 2017 Form 10-K.
These risks are not the only risks facing the Company. Additional risks and uncertainties not currently known to the Company or that it currently deems to be immaterial also may have a material adverse effect on the Company’s business, financial condition or future results.
| Item 2. | Unregistered Sales of Equity Securities and Use of Proceeds |
Repurchases of Shares of Common Stock
On November 1, 2017, the Board of Directors of the Company approved a share repurchase program authorizing the Company to repurchase up to $50.0 million of shares of its common stock from time to time on the open market or in privately negotiated or other transactions. We publicly announced the program in November 2017. The repurchase program is authorized for a period of up to two years, and may be suspended or discontinued at any time. In order to facilitate repurchases, the Company may enter into a Rule 10b5-1 plan from time to time, which would permit shares to be repurchased when the Company might otherwise be precluded from doing so under insider trading laws or because of a self-imposed trading blackout period. During the three months ended March 31, 2018, we repurchased 383,801 shares of our common stock for approximately $6.0 million. All repurchases for the periods presented were made under the program and using cash resources.
The summary of our repurchases of shares of our common stock through the reported periods are:
| Period | Total
Number of Shares Purchased | Average
Price Paid Per Share | Total
Number of Shares Purchased as Part of Publicly Announced Program | Maximum
Approximate Dollar Value of Shares That May Yet Be Purchased Under the Program | ||||||||||||
| January 1, 2018 to January 31, 2018 | — | $ | — | — | $ | — | ||||||||||
| February 1, 2018 to February 28, 2018 | 383,801 | 15.50 | 383,801 | 29,933,055 | ||||||||||||
| March 1, 2018 to March 31, 2018 | — | — | — | — | ||||||||||||
| January 1, 2018 to March 31, 2018 | 383,801 | $ | 15.50 | 383,801 | 29,933,055 | |||||||||||
| 29 |
| Item 6. | Exhibits |
The Exhibits include agreements to which the Company is a party or has a beneficial interest. The agreements have been filed to provide investors with information regarding their respective terms. The agreements are not intended to provide any other actual information about the Company or its business or operations. In particular, the assertions embodied in any representations, warranties, and covenants contained in the agreements may be subject to qualifications with respect to knowledge and materiality different from those applicable to investors and may be qualified by information in confidential disclosure schedules not included with the exhibits. These disclosure schedules may contain information that modifies, qualifies and creates exceptions to the representations, warranties and covenants set forth in the agreements. Moreover, certain representations, warranties, and covenants in the agreements may have been used for the purpose of allocating risk between parties, rather than establishing matters as facts. In addition, information concerning the subject matter of the representations, warranties and covenants may have changed after the date of the respective agreement, which subsequent information may or may not be fully reflected in the Company’s public disclosures. Accordingly, investors should not rely on the representations, warranties and covenants in the agreements as characterizations of the actual state of facts about the Company or its business or operations on the date hereof.
Where an exhibit is filed by incorporate by reference to a previously filed registration statement or report, such registration statement or report is identified after the description of the exhibit.
| 30 |
| 32.2 | ||
| 101.INS | XBRL Instance Document | |
| 101.SCH | XBRL Taxonomy Extension Schema Document | |
| 101.CAL | XBRL Taxonomy Extension Calculation Linkbase Document | |
| 101.DEF | XBRL Taxonomy Extension Definition Linkbase Document | |
| 101.LAB | XBRL Taxonomy Extension Label Linkbase Document | |
| 101.PRE | XBRL Taxonomy Extension Presentation Linkbase Document |
____________________
| † | Indicates a management contract or compensatory plan, contract or arrangement |
| * | The certifications attached hereto as Exhibit 32.1 and Exhibit 32.2 are furnished with this Form 10-Q and shall not be deemed “filed” by the Company for purposes of Section 18 of the Securities Exchange Act of 1934, as amended. |
| 31 |
Pursuant to the requirements of the Securities Exchange Act of 1934, as amended, the Registrant has duly caused this report to be signed on its behalf by the undersigned thereunto duly authorized.
| Date: | May 7, 2018 | HMS HOLDINGS CORP. | ||
| By: | /s/ William C. Lucia | |||
| William C. Lucia | ||||
| President and Chief Executive Officer | ||||
| (Principal Executive Officer) | ||||
| By: | /s/ Jeffrey S. Sherman | |||
| Jeffrey S. Sherman | ||||
| Executive Vice President, Chief Financial Officer and Treasurer | ||||
(Principal Financial Officer)
|
||||
32