Attached files
| file | filename |
|---|---|
| EX-95 - EXHIBIT 95 - POTASH CORP OF SASKATCHEWAN INC | d561863dex95.htm |
| EX-32 - EXHIBIT 32 - POTASH CORP OF SASKATCHEWAN INC | d561863dex32.htm |
| EX-31.B - EXHIBIT 31(B) - POTASH CORP OF SASKATCHEWAN INC | d561863dex31b.htm |
| EX-31.A - EXHIBIT 31(A) - POTASH CORP OF SASKATCHEWAN INC | d561863dex31a.htm |
UNITED STATES SECURITIES AND EXCHANGE COMMISSION
Washington, D.C. 20549
Form 10-Q
| þ | QUARTERLY REPORT PURSUANT TO SECTION 13 OR 15(d) OF THE SECURITIES EXCHANGE ACT OF 1934 |
For the Quarterly Period Ended June 30, 2013
OR
| ¨ | TRANSITION REPORT PURSUANT TO SECTION 13 OR 15(d) OF THE SECURITIES EXCHANGE ACT OF 1934 |
Commission File Number 1-10351
Potash Corporation of Saskatchewan Inc.
(Exact name of registrant as specified in its charter)
| Canada | N/A | |
| (State or other jurisdiction of incorporation or organization) |
(I.R.S. Employer Identification No.) | |
| 122 — 1st Avenue South Saskatoon, Saskatchewan, Canada (Address of principal executive offices) |
S7K 7G3 (Zip Code) | |
306-933-8500
(Registrant’s telephone number, including area code)
Indicate by check mark whether the registrant (1) has filed all reports required to be filed by Sections 13 or 15(d) of the Securities Exchange Act of 1934 during the preceding 12 months (or for such shorter period that the registrant was required to file such reports), and (2) has been subject to such filing requirements for the past 90 days.
Yes þ No ¨
Indicate by check mark whether the registrant has submitted electronically and posted on its corporate Web site, if any, every Interactive Data File required to be submitted and posted pursuant to Rule 405 of Regulation S-T during the preceding 12 months (or for such shorter period that the registrant was required to submit and post such files).
Yes ¨ No ¨
Indicate by check mark whether the registrant is a large accelerated filer, an accelerated filer, a non-accelerated filer, or a smaller reporting company. See the definitions of “large accelerated filer,” “accelerated filer” and “smaller reporting company” in Rule 12b-2 of the Exchange Act. (Check one):
| Large accelerated filer þ | Accelerated filer ¨ | Non-accelerated filer ¨ | Smaller reporting company ¨ | |||
| (Do not check if a smaller reporting company) |
Indicate by check mark whether the registrant is a shell company (as defined in Exchange Act Rule 12b-2).
Yes ¨ No þ
As at June 30, 2013, Potash Corporation of Saskatchewan Inc. had 866,920,656 Common Shares outstanding.
Part I. Financial Information
Item 1. Financial Statements
Potash Corporation of Saskatchewan Inc.
Condensed Consolidated Statements of Financial Position
(in millions of US dollars)
(unaudited)
| As at | June 30, 2013 |
December 31, 2012 |
||||||
| Assets |
||||||||
| Current assets |
||||||||
| Cash and cash equivalents |
$ | 630 | $ | 562 | ||||
| Receivables |
949 | 1,089 | ||||||
| Inventories (Note 2) |
720 | 762 | ||||||
| Prepaid expenses and other current assets |
67 | 83 | ||||||
| 2,366 | 2,496 | |||||||
| Non-current assets |
||||||||
| Property, plant and equipment |
11,844 | 11,505 | ||||||
| Investments in equity-accounted investees |
1,266 | 1,254 | ||||||
| Available-for-sale investments |
2,011 | 2,481 | ||||||
| Other assets |
404 | 344 | ||||||
| Intangible assets |
134 | 126 | ||||||
| Total Assets |
$ | 18,025 | $ | 18,206 | ||||
| Liabilities |
||||||||
| Current liabilities |
||||||||
| Short-term debt and current portion of long-term debt (Note 3) |
$ | 495 | $ | 615 | ||||
| Payables and accrued charges |
1,062 | 1,188 | ||||||
| Current portion of derivative instrument liabilities |
49 | 51 | ||||||
| 1,606 | 1,854 | |||||||
| Non-current liabilities |
||||||||
| Long-term debt (Note 3) |
2,968 | 3,466 | ||||||
| Derivative instrument liabilities |
146 | 167 | ||||||
| Deferred income tax liabilities |
1,843 | 1,482 | ||||||
| Pension and other post-retirement benefit liabilities (Note 4) |
413 | 569 | ||||||
| Asset retirement obligations and accrued environmental costs |
592 | 645 | ||||||
| Other non-current liabilities and deferred credits |
140 | 111 | ||||||
| Total Liabilities |
7,708 | 8,294 | ||||||
| Shareholders’ Equity |
||||||||
| Share capital (Note 5) |
1,585 | 1,543 | ||||||
| Contributed surplus |
310 | 299 | ||||||
| Accumulated other comprehensive income |
946 | 1,399 | ||||||
| Retained earnings |
7,476 | 6,671 | ||||||
| Total Shareholders’ Equity |
10,317 | 9,912 | ||||||
| Total Liabilities and Shareholders’ Equity |
$ | 18,025 | $ | 18,206 | ||||
(See Notes to the Condensed Consolidated Financial Statements)
| 1 | PotashCorp 2013 Second Quarter Quarterly Report on Form 10-Q |
Potash Corporation of Saskatchewan Inc.
Condensed Consolidated Statements of Income
(in millions of US dollars except per-share amounts)
(unaudited)
| Three Months Ended June 30 |
Six Months Ended June 30 |
|||||||||||||||
| 2013 | 2012 | 2013 | 2012 | |||||||||||||
| Sales (Note 6) |
$ | 2,144 | $ | 2,396 | $ | 4,244 | $ | 4,142 | ||||||||
| Freight, transportation and distribution |
(147 | ) | (123 | ) | (296 | ) | (227 | ) | ||||||||
| Cost of goods sold |
(1,018 | ) | (1,074 | ) | (2,102 | ) | (2,018 | ) | ||||||||
| Gross Margin |
979 | 1,199 | 1,846 | 1,897 | ||||||||||||
| Selling and administrative expenses |
(51 | ) | (56 | ) | (117 | ) | (113 | ) | ||||||||
| Provincial mining and other taxes |
(81 | ) | (72 | ) | (144 | ) | (100 | ) | ||||||||
| Share of earnings of equity-accounted investees |
37 | 68 | 117 | 143 | ||||||||||||
| Dividend income |
54 | 67 | 54 | 67 | ||||||||||||
| Impairment of available-for-sale investment |
— | (341 | ) | — | (341 | ) | ||||||||||
| Other expenses |
(11 | ) | (8 | ) | (12 | ) | (11 | ) | ||||||||
| Operating Income |
927 | 857 | 1,744 | 1,542 | ||||||||||||
| Finance costs |
(39 | ) | (31 | ) | (74 | ) | (65 | ) | ||||||||
| Income Before Income Taxes |
888 | 826 | 1,670 | 1,477 | ||||||||||||
| Income taxes (Note 8) |
(245 | ) | (304 | ) | (471 | ) | (464 | ) | ||||||||
| Net Income |
$ | 643 | $ | 522 | $ | 1,199 | $ | 1,013 | ||||||||
| Net Income per Share (Note 9) |
||||||||||||||||
| Basic |
$ | 0.74 | $ | 0.61 | $ | 1.39 | $ | 1.18 | ||||||||
| Diluted |
$ | 0.73 | $ | 0.60 | $ | 1.37 | $ | 1.16 | ||||||||
| Dividends Declared per Share |
$ | 0.35 | $ | 0.14 | $ | 0.63 | $ | 0.28 | ||||||||
(See Notes to the Condensed Consolidated Financial Statements)
| PotashCorp 2013 Second Quarter Quarterly Report on Form 10-Q | 2 |
Potash Corporation of Saskatchewan Inc.
Condensed Consolidated Statements of Comprehensive Income
(in millions of US dollars)
(unaudited)
| Three Months Ended June 30 |
Six Months Ended June 30 |
|||||||||||||||
| (Net of related income taxes) | 2013 | 2012 | 2013 | 2012 | ||||||||||||
| Net Income |
$ | 643 | $ | 522 | $ | 1,199 | $ | 1,013 | ||||||||
| Other comprehensive (loss) income |
||||||||||||||||
| Items that will not be reclassified to net income: |
||||||||||||||||
| Net actuarial gain (loss) on defined benefit plans(1) |
150 | (73 | ) | 150 | (84 | ) | ||||||||||
| Items that may be reclassified subsequently to net income: |
||||||||||||||||
| Available-for-sale investments |
||||||||||||||||
| Net fair value loss during the period(2) |
(656 | ) | (256 | ) | (470 | ) | (134 | ) | ||||||||
| Reclassification to income of unrealized loss on impaired investment |
— | 341 | — | 341 | ||||||||||||
| Cash flow hedges |
||||||||||||||||
| Net fair value loss during the period(3) |
— | (2 | ) | — | (15 | ) | ||||||||||
| Reclassification to income of net loss(4) |
8 | 13 | 19 | 25 | ||||||||||||
| Other |
(2 | ) | (2 | ) | (2 | ) | (2 | ) | ||||||||
| Other Comprehensive (Loss) Income |
(500 | ) | 21 | (303 | ) | 131 | ||||||||||
| Comprehensive Income |
$ | 143 | $ | 543 | $ | 896 | $ | 1,144 | ||||||||
| (1) | Net of income taxes of $(87) (2012 — $44) for the three months ended June 30, 2013 and $(87) (2012 — $48) for the six months ended June 30, 2013. |
| (2) | Available-for-sale investments are comprised of shares in Israel Chemicals Ltd. and Sinofert Holdings Limited. |
| (3) | Cash flow hedges are comprised of natural gas derivative instruments and are net of income taxes of $NIL (2012 — $2) for the three months ended June 30, 2013 and $NIL (2012 — $10) for the six months ended June 30, 2013. |
| (4) | Net of income taxes of $(4) (2012 — $(8)) for the three months ended June 30, 2013 and $(10) (2012 — $(16)) for the six months ended June 30, 2013. |
(See Notes to the Condensed Consolidated Financial Statements)
| 3 | PotashCorp 2013 Second Quarter Quarterly Report on Form 10-Q |
Potash Corporation of Saskatchewan Inc.
Condensed Consolidated Statements of Cash Flow
(in millions of US dollars)
(unaudited)
| Three Months Ended June 30 |
Six Months Ended June 30 |
|||||||||||||||
| 2013 | 2012 | 2013 | 2012 | |||||||||||||
| Operating Activities |
||||||||||||||||
| Net income |
$ | 643 | $ | 522 | $ | 1,199 | $ | 1,013 | ||||||||
| Adjustments to reconcile net income to cash provided by operating activities |
||||||||||||||||
| Depreciation and amortization |
186 | 157 | 340 | 285 | ||||||||||||
| Share-based compensation |
5 | 2 | 21 | 18 | ||||||||||||
| Impairment of available-for-sale investment |
— | 341 | — | 341 | ||||||||||||
| Realized excess tax benefit related to share-based compensation |
9 | 1 | 10 | 3 | ||||||||||||
| Provision for deferred income tax |
151 | 152 | 253 | 204 | ||||||||||||
| Net distributed (undistributed) earnings of equity-accounted investees |
70 | 57 | (7 | ) | (16 | ) | ||||||||||
| Pension and other post-retirement benefits |
9 | 6 | (22 | ) | 15 | |||||||||||
| Asset retirement obligations and accrued environmental costs |
(6 | ) | 23 | (4 | ) | 10 | ||||||||||
| Other long-term liabilities and miscellaneous |
40 | 13 | 53 | 26 | ||||||||||||
| Subtotal of adjustments |
464 | 752 | 644 | 886 | ||||||||||||
| Changes in non-cash operating working capital |
||||||||||||||||
| Receivables |
170 | (43 | ) | 66 | 6 | |||||||||||
| Inventories |
(6 | ) | 18 | 41 | 44 | |||||||||||
| Prepaid expenses and other current assets |
12 | (2 | ) | 13 | (16 | ) | ||||||||||
| Payables and accrued charges |
(81 | ) | (25 | ) | (23 | ) | (339 | ) | ||||||||
| Subtotal of changes in non-cash operating working capital |
95 | (52 | ) | 97 | (305 | ) | ||||||||||
| Cash provided by operating activities |
1,202 | 1,222 | 1,940 | 1,594 | ||||||||||||
| Investing Activities |
||||||||||||||||
| Additions to property, plant and equipment |
(354 | ) | (483 | ) | (850 | ) | (959 | ) | ||||||||
| Other assets and intangible assets |
(5 | ) | 6 | (10 | ) | (14 | ) | |||||||||
| Cash used in investing activities |
(359 | ) | (477 | ) | (860 | ) | (973 | ) | ||||||||
| Financing Activities |
||||||||||||||||
| Repayment of and finance costs on long-term debt obligations |
(4 | ) | (2 | ) | (254 | ) | (2 | ) | ||||||||
| Repayment of short-term debt obligations |
(580 | ) | (552 | ) | (369 | ) | (384 | ) | ||||||||
| Dividends |
(233 | ) | (118 | ) | (410 | ) | (177 | ) | ||||||||
| Issuance of common shares |
19 | 1 | 21 | 3 | ||||||||||||
| Cash used in financing activities |
(798 | ) | (671 | ) | (1,012 | ) | (560 | ) | ||||||||
| Increase in Cash and Cash Equivalents |
45 | 74 | 68 | 61 | ||||||||||||
| Cash and Cash Equivalents, Beginning of Period |
585 | 417 | 562 | 430 | ||||||||||||
| Cash and Cash Equivalents, End of Period |
$ | 630 | $ | 491 | $ | 630 | $ | 491 | ||||||||
| Cash and cash equivalents comprised of: |
||||||||||||||||
| Cash |
$ | 40 | $ | 86 | $ | 40 | $ | 86 | ||||||||
| Short-term investments |
590 | 405 | 590 | 405 | ||||||||||||
| $ | 630 | $ | 491 | $ | 630 | $ | 491 | |||||||||
| Supplemental cash flow disclosure |
||||||||||||||||
| Interest paid |
$ | 91 | $ | 64 | $ | 100 | $ | 102 | ||||||||
| Income taxes paid |
$ | 52 | $ | 176 | $ | 107 | $ | 492 | ||||||||
(See Notes to the Condensed Consolidated Financial Statements)
| PotashCorp 2013 Second Quarter Quarterly Report on Form 10-Q | 4 |
Potash Corporation of Saskatchewan Inc.
Condensed Consolidated Statements of Changes in Equity
(in millions of US dollars)
(unaudited)
| Accumulated Other Comprehensive Income | ||||||||||||||||||||||||||||||||||||
| Share Capital |
Contributed Surplus |
Net unrealized gain on available-for- sale investments |
Net loss on derivatives designated as cash flow hedges |
Net actuarial gain on defined benefit plans |
Other | Total Accumulated Other Comprehensive Income |
Retained Earnings |
Total Equity(1) |
||||||||||||||||||||||||||||
| Balance — December 31, 2012 |
$ | 1,543 | $ | 299 | $ | 1,539 | $ | (138 | ) | $ | — | (2) | $ | (2 | ) | $ | 1,399 | $ | 6,671 | $ | 9,912 | |||||||||||||||
| Net income |
— | — | — | — | — | — | — | 1,199 | 1,199 | |||||||||||||||||||||||||||
| Other comprehensive (loss) income |
— | — | (470 | ) | 19 | 150 | (2 | ) | (303 | ) | — | (303 | ) | |||||||||||||||||||||||
| Dividends declared |
— | — | — | — | — | — | — | (544 | ) | (544 | ) | |||||||||||||||||||||||||
| Effect of share-based compensation including issuance of common shares |
29 | 11 | — | — | — | — | — | — | 40 | |||||||||||||||||||||||||||
| Shares issued for dividend reinvestment plan |
13 | — | — | — | — | — | — | — | 13 | |||||||||||||||||||||||||||
| Transfer of net actuarial gain on defined benefit plans |
— | — | — | — | (150 | ) | — | (150 | ) | 150 | — | |||||||||||||||||||||||||
| Balance — June 30, 2013 |
$ | 1,585 | $ | 310 | $ | 1,069 | $ | (119 | ) | $ | — | (2) | $ | (4 | ) | $ | 946 | $ | 7,476 | $ | 10,317 | |||||||||||||||
| (1) | All equity transactions were attributable to common shareholders. |
| (2) | Any amounts incurred during a period are closed out to retained earnings at each period-end. Therefore, no balance exists at the beginning or end of period. |
| Accumulated Other Comprehensive Income | ||||||||||||||||||||||||||||||||||||
| Share Capital |
Contributed Surplus |
Net unrealized gain on available-for- sale investments |
Net loss on derivatives designated as cash flow hedges |
Net actuarial loss on defined benefit plans |
Other | Total Accumulated Other Comprehensive Income |
Retained Earnings |
Total Equity(1) |
||||||||||||||||||||||||||||
| Balance — December 31, 2011 |
$ | 1,483 | $ | 291 | $ | 982 | $ | (168 | ) | $ | — | (2) | $ | 2 | $ | 816 | $ | 5,257 | $ | 7,847 | ||||||||||||||||
| Net income |
— | — | — | — | — | — | — | 1,013 | 1,013 | |||||||||||||||||||||||||||
| Other comprehensive income (loss) |
— | — | 207 | 10 | (84 | ) | (2 | ) | 131 | — | 131 | |||||||||||||||||||||||||
| Dividends declared |
— | — | — | — | — | — | — | (241 | ) | (241 | ) | |||||||||||||||||||||||||
| Effect of share-based compensation including issuance of common shares |
4 | 24 | — | — | — | — | — | — | 28 | |||||||||||||||||||||||||||
| Shares issued for dividend reinvestment plan |
3 | — | — | — | — | — | — | — | 3 | |||||||||||||||||||||||||||
| Transfer of net actuarial loss on defined benefit plans |
— | — | — | — | 84 | — | 84 | (84 | ) | — | ||||||||||||||||||||||||||
| Balance — June 30, 2012 |
$ | 1,490 | $ | 315 | $ | 1,189 | $ | (158 | ) | $ | — | (2) | $ | — | $ | 1,031 | $ | 5,945 | $ | 8,781 | ||||||||||||||||
| (1) | All equity transactions were attributable to common shareholders. |
| (2) | Any amounts incurred during a period are closed out to retained earnings at each period-end. Therefore, no balance exists at the beginning or end of period. |
(See Notes to the Condensed Consolidated Financial Statements)
| 5 | PotashCorp 2013 Second Quarter Quarterly Report on Form 10-Q |
Potash Corporation of Saskatchewan Inc.
Notes to the Condensed Consolidated Financial Statements
For the Three and Six Months Ended June 30, 2013
(in millions of US dollars except as otherwise noted)
(unaudited)
Standards, amendments and interpretations effective and applied
The International Accounting Standards Board (“IASB”) and International Financial Reporting Interpretations Committee (“IFRIC”) have issued the following standards and amendments or interpretations to existing standards that are effective and applied.
| Standard | Description | Impact | ||
| Amendments to IAS 1, Presentation of Financial Statements | Amendments require items within other comprehensive income (“OCI”) that may be reclassified to the profit or loss section of the income statement to be grouped together. | Adopted retrospectively effective January 1, 2013. The format of the company’s consolidated statements of comprehensive income has changed. Prior periods’ figures have been reclassified to conform with the current period’s presentation. | ||
| Amendments to IFRS 7, Financial Instruments: Disclosures | Issued as part of its offsetting project, addresses common disclosure requirements related to financial instruments. | Adopted retrospectively effective January 1, 2013. Applicable disclosures are included in Note 10 to these unaudited interim condensed consolidated financial statements, and will be included in the company’s 2013 annual consolidated financial statements. | ||
| IFRS 10, Consolidated Financial Statements | Builds on existing principles by identifying the concept of control as the determining factor in whether an entity should be included within the consolidated financial statements of the parent company. | Adopted retrospectively effective January 1, 2013 with no change to the company’s consolidated financial statements. | ||
| IFRS 11, Joint Arrangements | Removes a choice in accounting method and requires equity accounting for participants in joint ventures. Also focuses on the rights and obligations of an arrangement rather than its legal form. | Adopted prospectively effective January 1, 2013 with no change to the company’s consolidated financial statements. | ||
| IFRS 12, Disclosure of Interests in Other Entities | Establishes a new and comprehensive standard on disclosure requirements for all forms of interest in other entities, including subsidiaries, joint arrangements, associates and unconsolidated structured entities. | Adopted prospectively effective January 1, 2013. Applicable disclosures will be included in the company’s 2013 annual consolidated financial statements. | ||
| IFRS 13, Fair Value Measurement | Establishes a single framework for measuring fair value and introduces consistent disclosure requirements on fair value measurements. | Adopted prospectively effective January 1, 2013. Applicable disclosures included in Note 10 to these unaudited interim condensed consolidated financial statements, and will be included in the company’s 2013 annual consolidated financial statements. |
| PotashCorp 2013 Second Quarter Quarterly Report on Form 10-Q | 6 |
| Standard | Description | Impact | ||
| Amendments to IAS 19, Employee Benefits | Changes relating to the recognition, measurement, presentation and disclosure of post-employment benefits. The amendment also changes the accounting for termination benefits and short-term employment benefits, along with other minor clarifications. | Adopted prospectively effective January 1, 2013. The amendments resulted in changes in accounting policy but did not result in any material adjustments to the company’s consolidated financial statements. Previously, the company calculated interest costs on the defined benefit obligation and the expected return on plan assets, and included such amounts within employee costs in cost of goods sold and selling and administrative expenses, as applicable. The net interest cost will now be calculated on the net funded status and included in finance costs. Previously, vested past service costs were recognized immediately and unvested past service costs were amortized on a straight-line basis over the average period until the benefits became vested. All past service costs will now be recognized immediately. Actuarial gains and losses will continue to be recognized in OCI, and closed out to retained earnings each period. Required additional disclosures will be included in the company’s 2013 annual consolidated financial statements. | ||
| IFRIC 20, Stripping Costs in the Production Phase of a Surface Mine | Clarifies the requirements for accounting for stripping costs in the production phase of a surface mine. | Adopted effective January 1, 2013 with no change to the company’s consolidated financial statements. |
Standards, amendments and interpretations not yet effective and not applied
The IASB and IFRIC issued the following standards and amendments or interpretations to existing standards that are not yet effective and not applied. The company does not anticipate early adoption of these standards at this time.
| Standard | Description | Impact | Effective Date(1) | |||
| Amendments to IAS 32, Offsetting Financial Assets and Financial Liabilities | Issued as part of the IASB’s offsetting project, amendments clarify certain items regarding offsetting financial assets and financial liabilities. | The company is reviewing the standard to determine the potential impact, if any; however, no significant impact is anticipated. | January 1, 2014, applied retrospectively. | |||
| Amendments to IAS 36, Recoverable Amount Disclosures for Non-Financial Assets | Amendments were issued that clarify disclosure requirements for the recoverable amount of an asset or cash-generating unit. | The company is reviewing the standard to determine the potential impact, if any; however, no significant impact is anticipated. | January 1, 2014, applied retrospectively. | |||
| IFRIC 21, Levies | Provides guidance on when to recognize a liability for a levy imposed by a government. | The company is reviewing the interpretation to determine the potential impact, if any. | January 1, 2014, applied retrospectively. | |||
| IFRS 9, Financial Instruments | Initially issued guidance on the classification and measurement of financial assets. Additional guidance was issued on the classification and measurement of financial liabilities. Further, amendments were issued that will modify the requirements for transition from IAS 39 to IFRS 9. | The company is reviewing the standard to determine the potential impact, if any. | January 1, 2015, applied prospectively. |
| (1) | Effective date for annual periods beginning on or after the stated date. |
| 7 | PotashCorp 2013 Second Quarter Quarterly Report on Form 10-Q |
2. Inventories
| June 30, 2013 |
December 31, 2012 |
|||||||
| Finished products |
$ | 351 | $ | 417 | ||||
| Intermediate products |
92 | 82 | ||||||
| Raw materials |
90 | 91 | ||||||
| Materials and supplies |
187 | 172 | ||||||
| $ | 720 | $ | 762 | |||||
3. Long-Term Debt
During the first quarter of 2013, the company fully repaid $250 of 4.875 percent 10-year senior notes at maturity. At June 30, 2013, the company classified as current the $500 aggregate principal amount of 5.250 percent senior notes due May 15, 2014.
In May 2013, the company’s $750 credit facility was terminated and the company amended its $2,750 credit facility, increasing it to $3,500 and extending the maturity to May 31, 2018.
4. Pension and Other Post-Retirement Benefits
A remeasurement of the defined benefit plan assets and liabilities was performed at June 30, 2013. As a result of a change in the discount rate and actual return on plan assets, the company recorded net actuarial gains on defined benefit plan obligations of $150 in OCI, which was recognized immediately in retained earnings at June 30, 2013. The company’s defined benefit pension and other post-retirement benefit liabilities decreased by $133, accrued pension benefit assets increased by $104 and deferred income tax liabilities increased by $87 at June 30, 2013.
The discount rate used to determine the benefit obligation for the company’s significant plans at June 30, 2013 was 4.60 percent (December 31, 2012 — 3.85 percent).
The benefit obligations and plan assets for the company’s pension and other post-retirement plans were as follows:
| June 30, 2013 |
December 31, 2012(1) |
|||||||
| Present value of defined benefit obligations |
$ | (1,466 | ) | $ | (1,612 | ) | ||
| Fair value of plan assets |
1,160 | 1,052 | ||||||
| Funded status |
(306 | ) | (560 | ) | ||||
| Unvested prior service costs not recognized in statements of financial position |
— | (5 | ) | |||||
| Pension and other post-retirement benefit liabilities |
$ | (306 | ) | $ | (565 | ) | ||
| Balance comprised of: |
||||||||
| Other assets |
$ | 119 | $ | 16 | ||||
| Liabilities |
||||||||
| Current |
(12 | ) | (12 | ) | ||||
| Non-current |
(413 | ) | (569 | ) | ||||
| Pension and other post-retirement benefit liabilities |
$ | (306 | ) | $ | (565 | ) | ||
| (1) | As described in Note 1, the company prospectively adopted amendments to IAS 19, Employee Benefits. Unvested prior service costs were recognized in the company’s consolidated financial statements on January 1, 2013. |
| PotashCorp 2013 Second Quarter Quarterly Report on Form 10-Q | 8 |
5. Share Capital
Authorized
The company is authorized to issue an unlimited number of common shares without par value and an unlimited number of first preferred shares. The common shares are not redeemable or convertible. No first preferred shares have been issued.
Issued
| Number of Common Shares |
Consideration | |||||||
| Balance — December 31, 2012 |
864,900,513 | $ | 1,543 | |||||
| Issued under option plans |
1,724,916 | 29 | ||||||
| Issued for dividend reinvestment plan |
295,227 | 13 | ||||||
| Balance — June 30, 2013 |
866,920,656 | $ | 1,585 | |||||
Share Repurchase Program
On July 24, 2013, the company’s Board of Directors authorized a share repurchase program of up to $2,000 of PotashCorp’s outstanding common shares (5 percent of its outstanding common shares) through a normal course issuer bid. The commencement of the share repurchase program is subject to regulatory approval and will be for a one-year period from the date of commencement following receipt of such approval. The timing and amount of purchases under the program are dependent upon the availability and alternative uses of capital, market conditions, applicable US and Canadian regulations and other factors.
6. Segment Information
The company’s operating segments have been determined based on reports reviewed by the Chief Executive Officer, its chief operating decision-maker, that are used to make strategic decisions. The company has three reportable operating segments: potash, nitrogen and phosphate. These operating segments are differentiated by the chemical nutrient contained in the product that each produces. Inter-segment sales are made under terms that approximate market value. The accounting policies of the segments are the same as those described in Note 1.
| Three Months Ended June 30, 2013 | ||||||||||||||||||||
| Potash | Nitrogen | Phosphate | All Others | Consolidated | ||||||||||||||||
| Sales |
$ | 975 | $ | 629 | $ | 540 | $ | — | $ | 2,144 | ||||||||||
| Freight, transportation and distribution |
(68 | ) | (27 | ) | (52 | ) | — | (147 | ) | |||||||||||
| Net sales — third party |
907 | 602 | 488 | — | ||||||||||||||||
| Cost of goods sold |
(294 | ) | (326 | ) | (398 | ) | — | (1,018 | ) | |||||||||||
| Gross margin |
613 | 276 | 90 | — | 979 | |||||||||||||||
| Depreciation and amortization |
(67 | ) | (42 | ) | (74 | ) | (3 | ) | (186 | ) | ||||||||||
| Inter-segment sales |
— | 38 | — | — | — | |||||||||||||||
| Assets |
8,914 | 2,198 | 2,485 | 4,428 | 18,025 | |||||||||||||||
| Cash flows for additions to property, plant and equipment |
264 | 27 | 57 | 6 | 354 | |||||||||||||||
| Three Months Ended June 30, 2012 | ||||||||||||||||||||
| Potash | Nitrogen | Phosphate | All Others | Consolidated | ||||||||||||||||
| Sales |
$ | 1,185 | $ | 642 | $ | 569 | $ — | $ | 2,396 | |||||||||||
| Freight, transportation and distribution |
(55 | ) | (24 | ) | (44 | ) | — | (123 | ) | |||||||||||
| Net sales — third party |
1,130 | 618 | 525 | — | ||||||||||||||||
| Cost of goods sold |
(329 | ) | (316 | ) | (429 | ) | — | (1,074 | ) | |||||||||||
| Gross margin |
801 | 302 | 96 | — | 1,199 | |||||||||||||||
| Depreciation and amortization |
(56 | ) | (35 | ) | (64 | ) | (2 | ) | (157 | ) | ||||||||||
| Inter-segment sales |
— | 50 | — | — | — | |||||||||||||||
| Assets |
8,106 | 2,096 | 2,519 | 4,103 | 16,824 | |||||||||||||||
| Cash flows for additions to property, plant and equipment |
338 | 82 | 49 | 14 | 483 | |||||||||||||||
| 9 | PotashCorp 2013 Second Quarter Quarterly Report on Form 10-Q |
| Six Months Ended June 30, 2013 | ||||||||||||||||||||
| Potash | Nitrogen | Phosphate | All Others | Consolidated | ||||||||||||||||
| Sales |
$ | 1,860 | $ | 1,288 | $ | 1,096 | $ | — | $ | 4,244 | ||||||||||
| Freight, transportation and distribution |
(139 | ) | (52 | ) | (105 | ) | — | (296 | ) | |||||||||||
| Net sales — third party |
1,721 | 1,236 | 991 | — | ||||||||||||||||
| Cost of goods sold |
(604 | ) | (689 | ) | (809 | ) | — | (2,102 | ) | |||||||||||
| Gross margin |
1,117 | 547 | 182 | — | 1,846 | |||||||||||||||
| Depreciation and amortization |
(108 | ) | (80 | ) | (145 | ) | (7 | ) | (340 | ) | ||||||||||
| Inter-segment sales |
— | 109 | — | — | — | |||||||||||||||
| Assets |
8,914 | 2,198 | 2,485 | 4,428 | 18,025 | |||||||||||||||
| Cash flows for additions to property, plant and equipment |
613 | 72 | 122 | 43 | 850 | |||||||||||||||
| Six Months Ended June 30, 2012 | ||||||||||||||||||||
| Potash | Nitrogen | Phosphate | All Others | Consolidated | ||||||||||||||||
| Sales |
$ | 1,768 | $ | 1,192 | $ | 1,182 | $— | $ | 4,142 | |||||||||||
| Freight, transportation and distribution |
(89 | ) | (53 | ) | (85 | ) | — | (227 | ) | |||||||||||
| Net sales — third party |
1,679 | 1,139 | 1,097 | — | ||||||||||||||||
| Cost of goods sold |
(551 | ) | (618 | ) | (849 | ) | — | (2,018 | ) | |||||||||||
| Gross margin |
1,128 | 521 | 248 | — | 1,897 | |||||||||||||||
| Depreciation and amortization |
(86 | ) | (70 | ) | (124 | ) | (5 | ) | (285 | ) | ||||||||||
| Inter-segment sales |
— | 92 | — | — | — | |||||||||||||||
| Assets |
8,106 | 2,096 | 2,519 | 4,103 | 16,824 | |||||||||||||||
| Cash flows for additions to property, plant and equipment |
681 | 155 | 99 | 24 | 959 | |||||||||||||||
7. Share-Based Compensation
On May 16, 2013, the company’s shareholders approved the 2013 Performance Option Plan under which the company may, after February 19, 2013 and before January 1, 2014, grant options to acquire up to 3,000,000 common shares. Under the plan, the exercise price shall not be less than the quoted market closing price of the company’s common shares on the last trading day immediately preceding the date of the grant, and an option’s maximum term is 10 years. In general, options will vest, if at all, according to a schedule based on the three-year average excess of the company’s consolidated cash flow return on investment over weighted average cost of capital. As of June 30, 2013, options to purchase a total of 1,952,000 common shares had been granted under the plan. The weighted average fair value of options granted was $15.13 per share, estimated as of the date of grant using the Black-Scholes-Merton option-pricing model with the following weighted average assumptions:
| Exercise price per option |
$ | 43.80 | ||
| Expected annual dividend per share |
$ | 1.40 | ||
| Expected volatility |
50% | |||
| Risk-free interest rate |
1.06% | |||
| Expected life of options |
5.5 years |
8. Income Taxes
A separate estimated average annual effective tax rate is determined for each taxing jurisdiction and applied individually to the interim period pre-tax income of each jurisdiction.
| Three Months Ended June 30 | Six Months Ended June 30 | |||||||||||||||
| 2013 | 2012 | 2013 | 2012 | |||||||||||||
| Income tax expense |
$ | 245 | $ | 304 | $ | 471 | $ | 464 | ||||||||
| Actual effective tax rate on ordinary earnings |
25% | 26% | 26% | 25% | ||||||||||||
| Actual effective tax rate including discrete items |
28% | 37% | 28% | 31% | ||||||||||||
| Discrete tax adjustments that impacted the tax rate |
$ | 18 | $ | 5 | $ | 37 | $ | 3 | ||||||||
| PotashCorp 2013 Second Quarter Quarterly Report on Form 10-Q | 10 |
Significant items to note include the following:
| Ÿ | In the first six months of 2013, a tax expense of $16 ($1 in the second quarter) was recorded to adjust the 2012 income tax provision. |
| Ÿ | In second-quarter 2013, a deferred tax expense of $11 was recorded as a result of a Canadian income tax rate increase. |
| Ÿ | In second-quarter 2012, the impairment of the company’s available-for-sale investment in Sinofert Holdings Limited (“Sinofert”) was not deductible for tax purposes. |
Income tax balances within the consolidated statements of financial position were comprised of the following:
| Income Tax Assets (Liabilities) | Statements of Financial Position Location | June 30, 2013 |
December 31, 2012 |
|||||||
| Current income tax assets: |
||||||||||
| Current |
Receivables | $ | 78 | $ | 124 | |||||
| Non-current |
Other assets | 126 | 130 | |||||||
| Deferred income tax assets |
Other assets | 26 | 30 | |||||||
| Total income tax assets |
$ | 230 | $ | 284 | ||||||
| Current income tax liabilities: |
||||||||||
| Current |
Payables and accrued charges | $ | (4 | ) | $ | (2 | ) | |||
| Non-current |
Other non-current liabilities and deferred credits | (137 | ) | (110 | ) | |||||
| Deferred income tax liabilities |
Deferred income tax liabilities | (1,843 | ) | (1,482 | ) | |||||
| Total income tax liabilities |
$ | (1,984 | ) | $ | (1,594 | ) | ||||
9. Net Income per Share
Net income per share was calculated on the following weighted average number of shares:
| Three Months Ended June 30 |
Six Months Ended June 30 |
|||||||||||||||
| 2013 | 2012 | 2013 | 2012 | |||||||||||||
| Basic |
865,991,000 | 858,988,000 | 865,526,000 | 858,888,000 | ||||||||||||
| Diluted |
877,141,000 | 875,507,000 | 876,930,000 | 875,813,000 | ||||||||||||
| 11 | PotashCorp 2013 Second Quarter Quarterly Report on Form 10-Q |
10. Financial Instruments
Fair Value
Estimated fair values for financial instruments are designed to approximate amounts at which the instruments could be exchanged in a current arm’s-length transaction between knowledgeable willing parties. The valuation policies and procedures for financial reporting purposes are determined by the company’s finance department.
Presented below is a comparison of the fair value of certain financial instruments to their carrying values.
| June 30, 2013 | December 31, 2012 | |||||||||||||||
|
Carrying Amount of Liability |
Fair Value of Liability |
Carrying Amount of Liability |
Fair Value of Liability |
|||||||||||||
| Long-term debt senior notes |
$ | 3,500 | $ | 3,868 | $ | 3,750 | $ | 4,284 | ||||||||
| PotashCorp 2013 Second Quarter Quarterly Report on Form 10-Q | 12 |
The following table presents the company’s fair value hierarchy for financial assets and financial liabilities carried at fair value on a recurring basis.
| Fair Value Measurements at Reporting Date Using: | ||||||||||||||||
| Carrying Amount of Asset (Liability) |
Quoted Prices in Active Markets for Identical Assets (Level 1)(1) |
Significant Other (Level 2)(1,2) |
Significant (Level 3)(2) |
|||||||||||||
| June 30, 2013 |
||||||||||||||||
| Derivative instrument assets |
||||||||||||||||
| Natural gas derivatives |
$ | 8 | $ | — | $ | — | $ | 8 | ||||||||
| Investments in ICL and Sinofert |
2,011 | 2,011 | — | — | ||||||||||||
| Derivative instrument liabilities |
||||||||||||||||
| Natural gas derivatives |
(190 | ) | — | (9 | ) | (181 | ) | |||||||||
| Foreign currency derivatives |
(5 | ) | — | (5 | ) | — | ||||||||||
| December 31, 2012 |
||||||||||||||||
| Derivative instrument assets |
||||||||||||||||
| Natural gas derivatives |
$ | 9 | $ | — | $ | — | $ | 9 | ||||||||
| Foreign currency derivatives |
1 | — | 1 | — | ||||||||||||
| Investments in ICL and Sinofert |
2,481 | 2,481 | — | — | ||||||||||||
| Derivative instrument liabilities |
||||||||||||||||
| Natural gas derivatives |
(218 | ) | — | (18 | ) | (200 | ) | |||||||||
| (1) | During the six months ended June 30, 2013 and twelve months ended December 31, 2012, there were no transfers between Level 1 and Level 2. |
| (2) | During the six months ended June 30, 2013, there were no transfers into Level 3 and $1 of gains was transferred out of Level 3 into Level 2 as (due to the passage of time) the terms of certain natural gas derivatives now matured within 36 months. During the twelve months ended December 31, 2012, there were no transfers into Level 3 and $10 of losses was transferred out of Level 3 into Level 2 as (due to the passage of time) the terms of certain natural gas derivatives now matured within 36 months. Our policy is to recognize transfers at the end of the reporting period. |
The following table presents the company’s fair value measurements using significant unobservable inputs (Level 3):
| Natural Gas Derivatives | ||||||||
| Six Months Ended June 30, 2013 |
Twelve Months Ended December 31, 2012 |
|||||||
| Balance, beginning of period |
$ | (191 | ) | $ | (229 | ) | ||
| Total (losses) gains (realized and unrealized) before income taxes |
||||||||
| Included in net income (cost of goods sold) |
(13 | ) | (27 | ) | ||||
| Included in other comprehensive income |
14 | 16 | ||||||
| Purchases |
— | — | ||||||
| Sales |
— | — | ||||||
| Issues |
— | — | ||||||
| Settlements |
18 | 39 | ||||||
| Transfers of (gains) losses out of Level 3 |
(1 | ) | 10 | |||||
| Balance, end of period |
$ | (173 | ) | $ | (191 | ) | ||
| Gains (losses) for the period included in net income (cost of goods sold) were: |
||||||||
| Change in unrealized gains (losses) relating to instruments still held at the reporting date |
$ | — | $ | — | ||||
| Total losses (realized and unrealized) |
(13 | ) | (27 | ) | ||||
11. Seasonality
The company’s sales of fertilizer can be seasonal. Typically, fertilizer sales are highest in the second quarter of the year, due to the North American spring planting season. However, planting conditions and the timing of customer purchases will vary each year and sales can be expected to shift from one quarter to another.
| 13 | PotashCorp 2013 Second Quarter Quarterly Report on Form 10-Q |
| PotashCorp 2013 Second Quarter Quarterly Report on Form 10-Q | 14 |
| 15 | PotashCorp 2013 Second Quarter Quarterly Report on Form 10-Q |
| PotashCorp 2013 Second Quarter Quarterly Report on Form 10-Q | 16 |
| 17 | PotashCorp 2013 Second Quarter Quarterly Report on Form 10-Q |
| PotashCorp 2013 Second Quarter Quarterly Report on Form 10-Q | 18 |
Key Performance Drivers — Performance Compared to Targets
Through our integrated value model, we set, evaluate and refine our goals and priorities to drive improvements that benefit all those impacted by our business. We demonstrate our accountability by tracking and reporting our progress against targets related to each goal. Our long-term goals and 2013 targets are set out on pages 42 to 52 of our 2012 Annual Integrated Report. A summary of our progress against selected goals and representative annual targets is set out below.
| Goal | Representative 2013 Annual Target |
Performance to June 30, 2013 | ||
| Create superior long-term shareholder value. | Exceed total shareholder return performance for our sector and the DAXglobal Agribusiness Index. | PotashCorp’s total shareholder return was -5 percent in the first six months of 2013 compared to our sector’s weighted average return (based on market capitalization) of -13 percent and the DAXglobal Agribusiness Index weighted average return (based on market capitalization) of NIL percent. | ||
| Be the supplier of choice to the markets we serve. | Reduce domestic potash net rail cycle time through the Chicago corridor by 10 percent in 2014, compared to 2011 levels. | The domestic potash net rail cycle time through the Chicago corridor during the second quarter of 2013 showed improvement to both the first quarter of 2013 and the comparable second quarter of the benchmark 2011 period. Improved rail performance during the second quarter resulted in a 7 percent reduction in the net rail cycle time in comparison to the 2013 first quarter which was impacted by severe and prolonged winter weather in the Canadian prairies. On a year to date basis we are still slightly above the benchmark 2011 net rail cycle time number but anticipate further improvements in rail performance should allow us to achieve our targeted performance on an annual basis in 2014. | ||
| Attract and retain talented, motivated and productive employees who are committed to our long-term goals. | Maintain an annual employee turnover rate (excluding retirements) of 5 percent or less. | Employee turnover rate (excluding retirements) on an annualized basis for the first six months of 2013 was 4.4 percent. | ||
| Achieve no harm to people. |
Become one of the safest resource companies in the world within five years by achieving a recordable injury rate in the lowest quartile of a best-in-class peer group. | A five-year strategic plan was developed in the second quarter of 2013. A benchmark group of best-in-class peer companies will be developed in the third quarter of 2013. | ||
| Reduce total site recordable injury rate to 1.25 (per 200,000 hours worked) or lower. | During the first six months of 2013, total site recordable injury rate was 1.00. | |||
| Achieve no damage to the environment. | Reduce total reportable incidents (releases, permit excursions and spills) by 15 percent from 2012 levels. | Annualized total reportable incidents were up 5 percent during the first six months of 2013 compared to 2012 annual levels. Compared to the first six months of 2012, total reportable incidents were down 17 percent. |
Earnings Guidance — Second Quarter 2013
| Company Guidance | Actual Results | |||||||
| Earnings per share |
$ | 0.70 – $0.85 | $ | 0.73 | ||||
| 19 | PotashCorp 2013 Second Quarter Quarterly Report on Form 10-Q |
Overview of Actual Results
| Three Months Ended June 30 | Six Months Ended June 30 | |||||||||||||||||||||||||||||||
| Dollars (millions) — except per-share amounts | 2013 | 2012 | Change | % Change | 2013 | 2012 | Change | % Change | ||||||||||||||||||||||||
| Sales |
$ | 2,144 | $ | 2,396 | $ | (252 | ) | (11 | ) | $ | 4,244 | $ | 4,142 | $ | 102 | 2 | ||||||||||||||||
| Gross margin |
979 | 1,199 | (220 | ) | (18 | ) | 1,846 | 1,897 | (51 | ) | (3 | ) | ||||||||||||||||||||
| Operating income |
927 | 857 | 70 | 8 | 1,744 | 1,542 | 202 | 13 | ||||||||||||||||||||||||
| Net income |
643 | 522 | 121 | 23 | 1,199 | 1,013 | 186 | 18 | ||||||||||||||||||||||||
| Net income per share — diluted |
0.73 | 0.60 | 0.13 | 22 | 1.37 | 1.16 | 0.21 | 18 | ||||||||||||||||||||||||
| Other comprehensive (loss) income |
(500 | ) | 21 | (521 | ) | n/m | (303 | ) | 131 | (434 | ) | n/m | ||||||||||||||||||||
| n/m | = not meaningful |
| PotashCorp 2013 Second Quarter Quarterly Report on Form 10-Q | 20 |
Balance Sheet
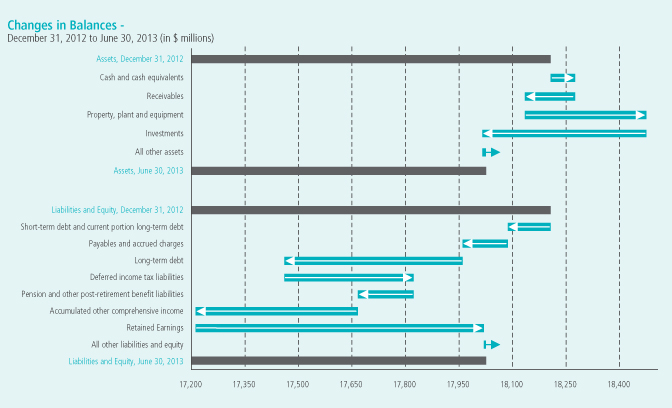
The most significant contributors to the changes in our statements of financial position were as follows(1):
| (1) | Direction of arrows refers to increase or decrease. |
| Assets | Liabilities | |
|
i Available-for-sale investments were mainly impacted by the lower fair value of our investments in ICL and Sinofert.
h Property, plant and equipment increased primarily (72 percent) due to our previously announced potash capacity expansions and other potash projects.
i Receivables fell due to a reduction in income tax, potash production tax and trade receivables from Canpotex Limited (Canpotex).
h Cash provided by operations exceeded cash used to purchase property, plant and equipment, repay short-term debt and long-term debt and pay dividends, resulting in higher cash and cash equivalents. |
i Short-term debt and current portion of long-term debt fell due to the repayment of commercial paper and long-term debt. Long-term debt declined as our senior notes due May 15, 2014 were classified as current during the second quarter of 2013.
h Deferred income tax liabilities increased primarily due to tax depreciation exceeding accounting depreciation, the tax impact on the remeasurement of our defined benefit plans (see Note 4 to the financial statements in this Form 10-Q), reduced deferred tax assets on unexercised stock options and a Canadian income tax rate increase.
i Payables and accrued charges were impacted by (1) lower trade payables; (2) higher dividends payable due to announced increases in dividends per share; and (3) fewer other payables due to decreases in accrued capital expenditures across all plant sites and payments made to settle the company’s eight anti-trust lawsuits. | |
| Equity | ||
| h Equity was impacted by net income, other comprehensive loss (both discussed in more detail above) and dividends declared during the first six months of 2013. | ||
As at June 30, 2013, $501 million (December 31, 2012 — $481 million) of our cash and cash equivalents were
held in certain foreign subsidiaries. There are no current plans to repatriate these funds in a taxable manner.
| 21 | PotashCorp 2013 Second Quarter Quarterly Report on Form 10-Q |
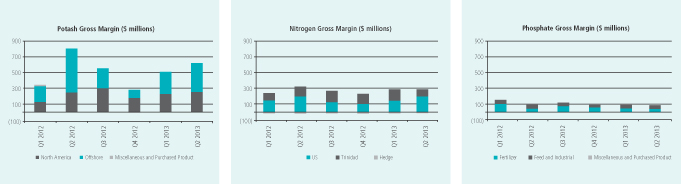
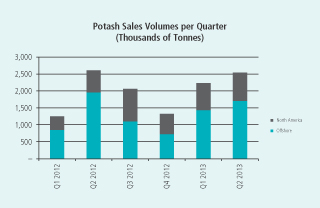
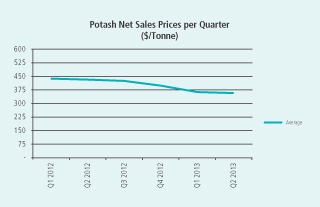
Potash
Potash Financial Performance
| Three Months Ended June 30 | ||||||||||||||||||||||||||||||||||||
| Dollars (millions) | Tonnes (thousands) | Average per Tonne(1) | ||||||||||||||||||||||||||||||||||
| 2013 | 2012 | % Change | 2013 | 2012 | % Change | 2013 | 2012 | % Change | ||||||||||||||||||||||||||||
| Manufactured product |
||||||||||||||||||||||||||||||||||||
| Net sales |
||||||||||||||||||||||||||||||||||||
| North America |
$ | 352 | $ | 326 | 8 | 834 | 651 | 28 | $ | 421 | $ | 502 | (16 | ) | ||||||||||||||||||||||
| Offshore |
554 | 803 | (31 | ) | 1,711 | 1,955 | (12 | ) | $ | 324 | $ | 411 | (21 | ) | ||||||||||||||||||||||
| 906 | 1,129 | (20 | ) | 2,545 | 2,606 | (2 | ) | $ | 356 | $ | 433 | (18 | ) | |||||||||||||||||||||||
| Cost of goods sold |
(290 | ) | (328 | ) | (12 | ) | $ | (114 | ) | $ | (125 | ) | (9 | ) | ||||||||||||||||||||||
| Gross margin |
616 | 801 | (23 | ) | $ | 242 | $ | 308 | (21 | ) | ||||||||||||||||||||||||||
| Other miscellaneous and purchased product gross margin(2) |
(3 | ) | — | n/m | ||||||||||||||||||||||||||||||||
| Gross Margin |
$ | 613 | $ | 801 | (23 | ) | $ | 241 | $ | 308 | (22 | ) | ||||||||||||||||||||||||
| n/m | = not meaningful |
| (1) | Rounding differences may occur due to the use of whole dollars in per-tonne calculations. |
| (2) | Comprised of net sales of $1 million (2012 — $1 million) less cost of goods sold of $4 million (2012 — $1 million). |
| PotashCorp 2013 Second Quarter Quarterly Report on Form 10-Q | 22 |
| Six Months Ended June 30 | ||||||||||||||||||||||||||||||||||||
| Dollars (millions) | Tonnes (thousands) | Average per Tonne(1) | ||||||||||||||||||||||||||||||||||
| 2013 | 2012 | % Change | 2013 | 2012 | % Change | 2013 | 2012 | % Change | ||||||||||||||||||||||||||||
| Manufactured product |
||||||||||||||||||||||||||||||||||||
| Net sales |
||||||||||||||||||||||||||||||||||||
| North America |
$ | 683 | $ | 525 | 30 | 1,628 | 1,051 | 55 | $ | 419 | $ | 500 | (16 | ) | ||||||||||||||||||||||
| Offshore |
1,031 | 1,147 | (10 | ) | 3,143 | 2,804 | 12 | $ | 328 | $ | 409 | (20 | ) | |||||||||||||||||||||||
| 1,714 | 1,672 | 3 | 4,771 | 3,855 | 24 | $ | 359 | $ | 434 | (17 | ) | |||||||||||||||||||||||||
| Cost of goods sold |
(594 | ) | (546 | ) | 9 | $ | (124 | ) | $ | (142 | ) | (13 | ) | |||||||||||||||||||||||
| Gross margin |
1,120 | 1,126 | (1 | ) | $ | 235 | $ | 292 | (20 | ) | ||||||||||||||||||||||||||
| Other miscellaneous and purchased product gross margin(2) |
(3 | ) | 2 | n/m | ||||||||||||||||||||||||||||||||
| Gross Margin |
$ | 1,117 | $ | 1,128 | (1 | ) | $ | 234 | $ | 293 | (20 | ) | ||||||||||||||||||||||||
| n/m | = not meaningful |
| (1) | Rounding differences may occur due to the use of whole dollars in per-tonne calculations. |
| (2) | Comprised of net sales of $7 million (2012 — $7 million) less cost of goods sold of $10 million (2012 — $5 million). |
Potash gross margin variance attributable to:
| Three Months Ended June 30 2013 vs. 2012 |
Six Months Ended June 30 2013 vs. 2012 |
|||||||||||||||||||||||||||||||
| Change in Prices/Costs |
Change in Prices/Costs |
|||||||||||||||||||||||||||||||
| Dollars (millions) | Change in Sales Volumes |
Net Sales |
Cost of Goods Sold |
Total | Change in Sales Volumes |
Net Sales |
Cost of Goods Sold |
Total | ||||||||||||||||||||||||
| Manufactured product |
||||||||||||||||||||||||||||||||
| North America |
$ | 77 | $ | (68 | ) | $ | (1 | ) | $ | 8 | $ | 235 | $ | (131 | ) | $ | 3 | $ | 107 | |||||||||||||
| Offshore |
(75 | ) | (150 | ) | 32 | (193 | ) | 107 | (255 | ) | 35 | (113 | ) | |||||||||||||||||||
| Change in market mix |
(24 | ) | 23 | 1 | — | (31 | ) | 31 | — | — | ||||||||||||||||||||||
| Total manufactured product |
$ | (22 | ) | $ | (195 | ) | $ | 32 | (185 | ) | $ | 311 | $ | (355 | ) | $ | 38 | (6 | ) | |||||||||||||
| Other miscellaneous and purchased product |
(3 | ) | (5 | ) | ||||||||||||||||||||||||||||
| Total |
$ | (188 | ) | $ | (11 | ) | ||||||||||||||||||||||||||
| 23 | PotashCorp 2013 Second Quarter Quarterly Report on Form 10-Q |
|
|
|
|
|
|
Canpotex sales to major markets, by percentage of sales volumes, were as follows:
| Three Months Ended June 30 | Six Months Ended June 30 | |||||||||||||||||||||||||||||||
| 2013 | 2012 | Change | % Change | 2013 | 2012 | Change | % Change | |||||||||||||||||||||||||
| Asia (excluding China and India) |
44 | 36 | 8 | 22 | 42 | 47 | (5 | ) | (11 | ) | ||||||||||||||||||||||
| Latin America |
26 | 35 | (9 | ) | (26 | ) | 26 | 28 | (2 | ) | (7 | ) | ||||||||||||||||||||
| China |
15 | 21 | (6 | ) | (29 | ) | 19 | 16 | 3 | 19 | ||||||||||||||||||||||
| India |
12 | 6 | 6 | 100 | 8 | 6 | 2 | 33 | ||||||||||||||||||||||||
| Oceania, Europe and Other |
3 | 2 | 1 | 50 | 5 | 3 | 2 | 67 | ||||||||||||||||||||||||
| 100 | 100 | 100 | 100 | |||||||||||||||||||||||||||||
| PotashCorp 2013 Second Quarter Quarterly Report on Form 10-Q | 24 |
The most significant contributors to the change in total gross margin quarter over quarter were as follows(1):
| (1) | Direction of arrows refers to impact on gross margin. |
| Net Sales Prices | Sales Volumes | Cost of Goods Sold | ||
| i Increased competitive pressures resulted in lower prices in all key markets. |
h In North America, robust demand at the farm level pushed sales volumes higher.
i Offshore sales volumes were down largely as a result of a decline in our Canpotex entitlement and a larger percentage of first-half shipments from New Brunswick during the first quarter of 2013. |
h Brine management costs fell as our tolling agreement at Esterhazy expired at the end of 2012.
h 4 shutdown weeks were taken in 2013 mainly as a result of weather-related pond issues at our Patience Lake facility (11 shutdown weeks were taken in 2012 due to weather-related pond issues at our Patience Lake facility and unplanned maintenance at our Rocanville and Allan facilities).
h More product from our lower-cost mines went to offshore customers resulting in a positive cost of goods sold variance. | ||
| The change in market mix produced an unfavorable variance of $24 million related to sales volumes and a favorable variance of $23 million in sales prices due to less lower-priced standard product |
||||
The most significant contributors to the change in total gross margin year over year were as follows(1):
| (1) | Direction of arrows refers to impact on gross margin. |
| Net Sales Prices | Sales Volumes | Cost of Goods Sold | ||
| i Our average realized potash price trailed the first six months of 2012, reflecting lower pricing that took hold late in 2012 and early 2013. |
h With limited dealer inventory carried into 2013 and strong agricultural fundamentals, North American sales volumes grew. Buyer destocking occurred in the first half of 2012.
h Canpotex shipped record first-half volumes due to settlements with China and India occurring earlier than the previous year and less inventory being carried into 2013 in major offshore spot markets. |
h Brine management costs fell as our tolling agreement at Esterhazy expired at the end of 2012.
h 20 shutdown weeks were taken in 2013 mainly as a result of our strategy to match production with market demand and weather-related pond issues at our Patience Lake facility (40 shutdown weeks were taken in 2012 to match supply to demand; during this downtime, we opted to allocate resources to non-production activities rather than lay off employees, which resulted in higher shutdown costs). | ||
| 25 | PotashCorp 2013 Second Quarter Quarterly Report on Form 10-Q |
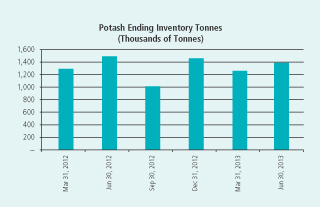
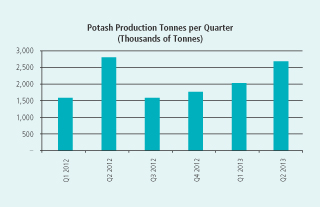
Potash Non-Financial Performance
| Three Months Ended June 30 | Six Months Ended June 30 | |||||||||||||||||||||||
| 2013 | 2012 | % Change | 2013 | 2012 | % Change | |||||||||||||||||||
| KCl tonnes produced (thousands) |
2,677 | 2,807 | (5 | ) | 4,702 | 4,382 | 7 | |||||||||||||||||
| Total site recordable injury rate |
1.18 | 1.97 | (40 | ) | 1.30 | 2.05 | (37 | ) | ||||||||||||||||
| Employee turnover percentage (annualized) |
5.5% | 5.6% | (2 | ) | 5.1% | 5.1% | — | |||||||||||||||||
| Waste (000’s tonnes) |
5,790 | 4,790 | 21 | 10,295 | 7,504 | 37 | ||||||||||||||||||
| Environmental incidents |
2 | 3 | (33 | ) | 8 | 5 | 60 | |||||||||||||||||
During the second quarter of 2013, we successfully completed a safe Canpotex entitlement run at Cory which will allow us a greater proportion of Canpotex sales to offshore markets and almost offsets the loss from the ending of our long-term tolling agreement at Esterhazy.
Potash production fell quarter over quarter mainly as a result of reduced operating rates. Potash production increased year over year primarily due to the reduction in shutdown weeks as discussed above.
Total site recordable injury rate declined because of the effort by the site teams and an external consultant on targeted safety improvement projects at Allan, Cory and Rocanville as well as on-going safety improvements at other sites.
Waste is comprised of byproducts, including: coarse and fine tailings and salt as brine to injection wells. Waste increased quarter over quarter due to increased mining waste per tonne combined with increased mining at certain sites, which also contributed to an overall increase in waste year over year.
The increase in environmental incidents in potash for the first six months of 2013 is due largely to several failures of refrigerant lines in new HVAC units installed at New Brunswick.
Nitrogen
Nitrogen Financial Performance
| Three Months Ended June 30 | ||||||||||||||||||||||||||||||||||||
| Dollars (millions) | Tonnes (thousands) | Average per Tonne(1) | ||||||||||||||||||||||||||||||||||
| 2013 | 2012 | % Change | 2013 | 2012 | % Change | 2013 | 2012 | % Change | ||||||||||||||||||||||||||||
| Manufactured product |
||||||||||||||||||||||||||||||||||||
| Net sales |
||||||||||||||||||||||||||||||||||||
| Ammonia |
$ | 299 | $ | 265 | 13 | 516 | 517 | — | $ | 580 | $ | 512 | 13 | |||||||||||||||||||||||
| Urea |
120 | 181 | (34 | ) | 277 | 295 | (6 | ) | $ | 432 | $ | 613 | (30 | ) | ||||||||||||||||||||||
| Solutions/Nitric acid/Ammonium nitrate |
170 | 124 | 37 | 656 | 493 | 33 | $ | 259 | $ | 251 | 3 | |||||||||||||||||||||||||
| 589 | 570 | 3 | 1,449 | 1,305 | 11 | $ | 406 | $ | 436 | (7 | ) | |||||||||||||||||||||||||
| Cost of goods sold |
(316 | ) | (290 | ) | 9 | $ | (219 | ) | $ | (222 | ) | (1 | ) | |||||||||||||||||||||||
| Gross margin |
273 | 280 | (3 | ) | $ | 187 | $ | 214 | (13 | ) | ||||||||||||||||||||||||||
| Other miscellaneous and purchased product gross margin(2) |
3 | 22 | (86 | ) | ||||||||||||||||||||||||||||||||
| Gross Margin |
$ | 276 | $ | 302 | (9 | ) | $ | 190 | $ | 231 | (18 | ) | ||||||||||||||||||||||||
| (1) | Rounding differences may occur due to the use of whole dollars in per-tonne calculations. |
| (2) | Comprised of net sales of $13 million (2012 — $48 million) less cost of goods sold of $10 million (2012 — $26 million). |
| PotashCorp 2013 Second Quarter Quarterly Report on Form 10-Q | 26 |
| Six Months Ended June 30 | ||||||||||||||||||||||||||||||||||||
| Dollars (millions) | Tonnes (thousands) | Average per Tonne(1) | ||||||||||||||||||||||||||||||||||
| 2013 | 2012 | % Change | 2013 | 2012 | % Change | 2013 | 2012 | % Change | ||||||||||||||||||||||||||||
| Manufactured product |
||||||||||||||||||||||||||||||||||||
| Net sales |
||||||||||||||||||||||||||||||||||||
| Ammonia |
$ | 610 | $ | 495 | 23 | 1,029 | 1,033 | — | $ | 593 | $ | 480 | 24 | |||||||||||||||||||||||
| Urea |
265 | 335 | (21 | ) | 582 | 629 | (7 | ) | $ | 455 | $ | 533 | (15 | ) | ||||||||||||||||||||||
| Solutions/Nitric acid/Ammonium nitrate |
331 | 234 | 41 | 1,278 | 933 | 37 | $ | 259 | $ | 250 | 4 | |||||||||||||||||||||||||
| 1,206 | 1,064 | 13 | 2,889 | 2,595 | 11 | $ | 417 | $ | 410 | 2 | ||||||||||||||||||||||||||
| Cost of goods sold |
(665 | ) | (578 | ) | 15 | $ | (230 | ) | $ | (223 | ) | 3 | ||||||||||||||||||||||||
| Gross margin |
541 | 486 | 11 | $ | 187 | $ | 187 | — | ||||||||||||||||||||||||||||
| Other miscellaneous and purchased product gross margin(2) |
6 | 35 | (83 | ) | ||||||||||||||||||||||||||||||||
| Gross Margin |
$ | 547 | $ | 521 | 5 | $ | 189 | $ | 201 | (6 | ) | |||||||||||||||||||||||||
| (1) | Rounding differences may occur due to the use of whole dollars in per-tonne calculations. |
| (2) | Comprised of net sales of $30 million (2012 — $75 million) less cost of goods sold of $24 million (2012 — $40 million). |
Nitrogen gross margin variance attributable to:
| Three Months Ended June 30 2013 vs. 2012 |
Six Months Ended June 30 2013 vs. 2012 |
|||||||||||||||||||||||||||||||
| Change in Prices/Costs |
Change in Prices/Costs |
|||||||||||||||||||||||||||||||
| Dollars (millions) | Change in Sales Volumes |
Net Sales |
Cost of Goods Sold |
Total | Change in Sales Volumes |
Net Sales |
Cost of Goods Sold |
Total | ||||||||||||||||||||||||
| Manufactured product |
||||||||||||||||||||||||||||||||
| Ammonia |
$ | 3 | $ | 35 | $ | (36 | ) | $ | 2 | $ | 1 | $ | 117 | $ | (58 | ) | $ | 60 | ||||||||||||||
| Urea |
(9 | ) | (49 | ) | (10 | ) | (68 | ) | (18 | ) | (45 | ) | (19 | ) | (82 | ) | ||||||||||||||||
| Solutions, NA, AN |
28 | 5 | 16 | 49 | 60 | 11 | (7) | 64 | ||||||||||||||||||||||||
| Hedge |
— | — | 10 | 10 | — | — | 13 | 13 | ||||||||||||||||||||||||
| Change in market mix |
47 | (34 | ) | (13 | ) | — | 74 | (61 | ) | (13 | ) | — | ||||||||||||||||||||
| Total manufactured product |
$ | 69 | $ | (43 | ) | $ | (33 | ) | (7 | ) | $ | 117 | $ | 22 | $ | (84 | ) | 55 | ||||||||||||||
| Other miscellaneous and purchased product |
(19 | ) | (29 | ) | ||||||||||||||||||||||||||||
| Total |
$ | (26 | ) | $ | 26 | |||||||||||||||||||||||||||
| 27 | PotashCorp 2013 Second Quarter Quarterly Report on Form 10-Q |
|
|
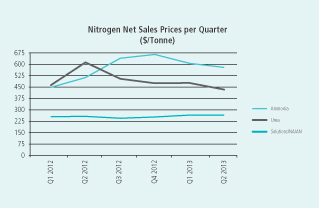
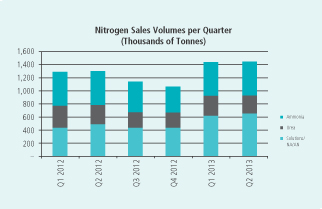
| Three Months Ended June 30 | Six Months Ended June 30 | |||||||||||||||||||||||||||||||
| Sales Tonnes (thousands) |
Price per Tonne | Sales Tonnes (thousands) |
Price per Tonne | |||||||||||||||||||||||||||||
| 2013 | 2012 | 2013 | 2012 | 2013 | 2012 | 2013 | 2012 | |||||||||||||||||||||||||
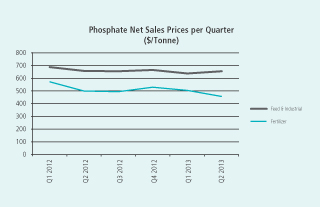
| Fertilizer |
455 | 432 | $ | 456 | $ | 541 | 819 | 807 | $ | 441 | $ | 481 | ||||||||||||||||||||
| Industrial and Feed |
994 | 873 | $ | 384 | $ | 385 | 2,070 | 1,788 | $ | 408 | $ | 378 | ||||||||||||||||||||
| 1,449 | 1,305 | $ | 406 | $ | 436 | 2,889 | 2,595 | $ | 417 | $ | 410 | |||||||||||||||||||||
| PotashCorp 2013 Second Quarter Quarterly Report on Form 10-Q | 28 |
The most significant contributors to the change in total gross margin quarter over quarter were as follows(1):
| (1) | Direction of arrows refers to impact on gross margin. |
| Net Sales Prices | Sales Volumes | Cost of Goods Sold | ||||||||||||
| i |
Our average realized prices fell, primarily reflecting a sharp decline in urea prices due to a delayed spring application season and significant product availability from offshore suppliers. |
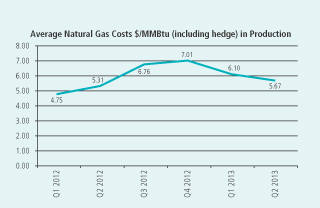
h | Increased production of downstream nitrogen products was primarily the result of the restart of ammonia capacity at Geismar. | i | Average natural gas costs in production, including hedge, increased 7 percent. Natural gas costs in Trinidad production rose 3 percent (contract price indexed, in part, to Tampa ammonia prices) while our US spot costs for natural gas used in production increased 70 percent. Including losses on our hedge position, US gas prices increased 21 percent. | |||||||||
| The change in market mix produced a favorable variance of $47 million related to sales volumes and an unfavorable variance of $34 million in sales prices due to more lower-priced products being sold. | h | The cost of goods sold variance was positive for solutions/nitric acid/ammonium nitrate due to the impact of costs associated with Geismar in 2012 that did not repeat in 2013. | ||||||||||||
The most significant contributors to the change in total gross margin year over year were as follows(1):
| (1) | Direction of arrows refers to impact on gross margin. |
| Net Sales Prices | Sales Volumes | Cost of Goods Sold | ||||||||||
|
h
i |
Sales prices rose due to strong spot ammonia pricing achieved in the second half of 2012 that carried over into 2013, despite prices declining throughout the first half of 2013.
Urea prices fell due to large import volumes positioned ahead of a delayed spring season and a surge in urea exports from China. |
h
i |
Additional ammonia capacity at Geismar and Augusta led to an increase in saleable tonnes of downstream products.
Urea volumes were down as gas interruptions in Trinidad led us to divert more production to higher-margin ammonia. |
i | Average natural gas costs in production, including hedge, increased 17 percent. Natural gas costs in Trinidad production rose 22 percent while our US spot costs for natural gas used in production increased 44 percent. Including losses on our hedge position, US gas prices increased 12 percent. | |||||||
|
The change in market mix produced a favorable variance of $74 million related to sales volumes and an unfavorable variance of $61 million in sales prices due to more lower-priced products being sold. |
i | Increased costs in the first quarter of 2013, due to the restart of a plant at Geismar, caused the cost of goods sold variance for solutions/nitric acid/ammonium nitrate to be higher. | ||||||||||
Nitrogen Non-Financial Performance
| Three Months Ended June 30 | Six Months Ended June 30 | |||||||||||||||||||||||
| 2013 | 2012 | % Change | 2013 | 2012 | % Change | |||||||||||||||||||
| N tonnes produced (thousands) |
726 | 697 | 4 | 1,449 | 1,378 | 5 | ||||||||||||||||||
| Total site recordable injury rate |
0.63 | 0.51 | 24 | 0.56 | 0.37 | 51 | ||||||||||||||||||
| Employee turnover percentage (annualized) |
4.6% | 5.1% | (10 | ) | 5.1% | 4.7% | 9 | |||||||||||||||||
| Greenhouse gas emissions (CO2 equivalent tonnes/tonne of product) |
2.5 | 2.3 | 9 | 2.3 | 2.3 | — | ||||||||||||||||||
| Environmental incidents |
— | 1 | (100 | ) | 1 | 3 | (67 | ) | ||||||||||||||||
Recordable injuries fell slightly quarter over quarter but the total site recordable injury rate rose as a result of more hours worked in 2012, due to the Geismar ammonia restart project. There were eight recordable injuries in the first half of 2013 compared to seven in the same period in 2012, resulting in an increase in the nitrogen total site recordable injury rate.
Additional greenhouse gases were emitted quarter over quarter due to the startup of our Geismar ammonia plant. On an ongoing basis, CO2 from production is contracted to be sold to a third party.
| 29 | PotashCorp 2013 Second Quarter Quarterly Report on Form 10-Q |
Phosphate
Phosphate Financial Performance
| Three Months Ended June 30 | ||||||||||||||||||||||||||||||||||||
| Dollars (millions) | Tonnes (thousands) | Average per Tonne(1) | ||||||||||||||||||||||||||||||||||
| 2013 | 2012 | % Change | 2013 | 2012 | % Change | 2013 | 2012 | % Change | ||||||||||||||||||||||||||||
| Manufactured product |
||||||||||||||||||||||||||||||||||||
| Net sales |
||||||||||||||||||||||||||||||||||||
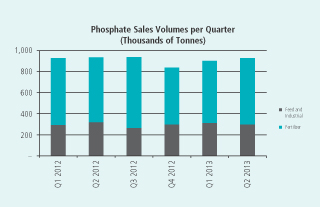
| Fertilizer |
$ | 288 | $ | 308 | (6 | ) | 635 | 619 | 3 | $ | 454 | $ | 498 | (9 | ) | |||||||||||||||||||||
| Feed and Industrial |
193 | 208 | (7 | ) | 295 | 317 | (7 | ) | $ | 654 | $ | 656 | — | |||||||||||||||||||||||
| 481 | 516 | (7 | ) | 930 | 936 | (1 | ) | $ | 517 | $ | 552 | (6 | ) | |||||||||||||||||||||||
| Cost of goods sold |
(395 | ) | (425 | ) | (7 | ) | $ | (422 | ) | $ | (454 | ) | (7 | ) | ||||||||||||||||||||||
| Gross margin |
86 | 91 | (5 | ) | $ | 95 | $ | 98 | (3 | ) | ||||||||||||||||||||||||||
| Other miscellaneous and purchased product gross margin(2) |
4 | 5 | (20 | ) | ||||||||||||||||||||||||||||||||
| Gross Margin |
$ | 90 | $ | 96 | (6 | ) | $ | 97 | $ | 103 | (6 | ) | ||||||||||||||||||||||||
| (1) | Rounding differences may occur due to the use of whole dollars in per-tonne calculations. |
| (2) | Comprised of net sales of $7 million (2012 — $9 million) less cost of goods sold of $3 million (2012 — $4 million). |
| Six Months Ended June 30 | ||||||||||||||||||||||||||||||||||||
| Dollars (millions) | Tonnes (thousands) | Average per Tonne(1) | ||||||||||||||||||||||||||||||||||
| 2013 | 2012 | % Change | 2013 | 2012 | % Change | 2013 | 2012 | % Change | ||||||||||||||||||||||||||||
| Manufactured product |
||||||||||||||||||||||||||||||||||||
| Net sales |
||||||||||||||||||||||||||||||||||||
| Fertilizer |
$ | 585 | $ | 671 | (13 | ) | 1,225 | 1,256 | (2 | ) | $ | 478 | $ | 534 | (10 | ) | ||||||||||||||||||||
| Feed and Industrial |
392 | 409 | (4 | ) | 608 | 610 | — | $ | 644 | $ | 670 | (4 | ) | |||||||||||||||||||||||
| 977 | 1,080 | (10 | ) | 1,833 | 1,866 | (2 | ) | $ | 533 | $ | 579 | (8 | ) | |||||||||||||||||||||||
| Cost of goods sold |
(802 | ) | (841 | ) | (5 | ) | $ | (437 | ) | $ | (450 | ) | (3 | ) | ||||||||||||||||||||||
| Gross margin |
175 | 239 | (27 | ) | $ | 96 | $ | 129 | (26 | ) | ||||||||||||||||||||||||||
| Other miscellaneous and purchased product gross margin(2) |
7 | 9 | (22 | ) | ||||||||||||||||||||||||||||||||
| Gross Margin |
$ | 182 | $ | 248 | (27 | ) | $ | 99 | $ | 133 | (26 | ) | ||||||||||||||||||||||||
| (1) | Rounding differences may occur due to the use of whole dollars in per-tonne calculations. |
| (2) | Comprised of net sales of $14 million (2012 — $17 million) less cost of goods sold of $7 million (2012 — $8 million). |
Phosphate gross margin variance attributable to:
| Three Months Ended June 30 2013 vs. 2012 |
Six Months Ended June 30 2013 vs. 2012 |
|||||||||||||||||||||||||||||||
| Change in Prices/Costs |
Change in Prices/Costs |
|||||||||||||||||||||||||||||||
| Dollars (millions) | Change in Sales Volumes |
Net Sales |
Cost of Goods Sold |
Total | Change in Sales Volumes |
Net Sales |
Cost of Goods Sold |
Total | ||||||||||||||||||||||||
| Manufactured product |
||||||||||||||||||||||||||||||||
| Fertilizer |
$ | 8 | $ | (31 | ) | $ | 21 | $ | (2 | ) | $ | (6 | ) | $ | (70 | ) | $ | 21 | $ | (55 | ) | |||||||||||
| Feed and Industrial |
(9 | ) | (2 | ) | 8 | (3 | ) | (2 | ) | (16 | ) | 9 | (9 | ) | ||||||||||||||||||
| Change in market mix |
— | 1 | (1 | ) | — | — | 2 | (2 | ) | — | ||||||||||||||||||||||
| Total manufactured product |
$ | (1 | ) | $ | (32 | ) | $ | 28 | (5 | ) | $ | (8 | ) | $ | (84 | ) | $ | 28 | (64 | ) | ||||||||||||
| Other miscellaneous and purchased product |
(1 | ) | (2 | ) | ||||||||||||||||||||||||||||
| Total |
$ | (6 | ) | $ | (66 | ) | ||||||||||||||||||||||||||
| PotashCorp 2013 Second Quarter Quarterly Report on Form 10-Q | 30 |
|
|
The most significant contributors to the change in total gross margin quarter over quarter were as follows(1):
| (1) | Direction of arrows refers to impact on gross margin. |
| Net Sales Prices | Cost of Goods Sold | |||||||
| i |
Our average realized phosphate prices for the quarter were down as a result of a decline in prices for fertilizer products. |
h | Costs were impacted by lower sulfur costs (down 17 percent) and a positive adjustment to our phosphate asset retirement obligation in 2013 (due to an increase in the relevant discount rates) compared to a negative adjustment in 2012 (due to lower relevant discount rates). Also, 2012 included costs associated with our Aurora workforce reduction. | |||||
| i | Ammonia (up 11 percent) and rock input costs were higher. |
The most significant contributors to the change in total gross margin year over year were as follows(1):
| (1) | Direction of arrows refers to impact on gross margin. |
| Net Sales Prices | Cost of Goods Sold | |||||||
| i |
Our average realized phosphate price was down from the same period last year, with fertilizer products experiencing the largest decline. | h | Costs were impacted by lower sulfur costs (down 20 percent), adjustments to our asset retirement obligations (the relevant discount rates increased in 2013 and decreased in 2012) and our Aurora workforce reduction in the second quarter of 2012. | |||||
| i | Ammonia (up 10 percent) and rock input costs were higher. |
Phosphate Non-Financial Performance
| Three Months Ended June 30 | Six Months Ended June 30 | |||||||||||||||||||||||
| 2013 | 2012 | % Change | 2013 | 2012 | % Change | |||||||||||||||||||
|
P2O5 tonnes produced (thousands) |
521 | 500 | 4 | 1,020 | 986 | 3 | ||||||||||||||||||
|
P2O5 operating rate percentage |
88% | 84% | 5 | 86% | 83% | 4 | ||||||||||||||||||
| Total site recordable injury rate |
1.42 | 0.35 | 306 | 0.95 | 0.57 | 67 | ||||||||||||||||||
| Employee turnover percentage (annualized) |
2.7% | 3.5% | (23 | ) | 3.1% | 3.4% | (9 | ) | ||||||||||||||||
| Water usage (m3 per tonne of product) |
29 | 31 | (6 | ) | 30 | 34 | (12 | ) | ||||||||||||||||
| Recycled water used in operations (percentage) |
94% | 93% | 1 | 94% | 93% | 1 | ||||||||||||||||||
| Environmental incidents |
1 | 1 | — | 1 | 4 | (75 | ) | |||||||||||||||||
The phosphate recordable injury rate increased largely due to an increase in employee injuries at Aurora.
Employee turnover fell as a work force reduction at our Aurora location occurred in the second quarter of 2012.
Water usage in our phosphate operations decreased primarily due to more water recycling at our White Springs location (less rain water to recycle in 2012).
| 31 | PotashCorp 2013 Second Quarter Quarterly Report on Form 10-Q |
Other Expenses and Income
| Three Months Ended June 30 | Six Months Ended June 30 | |||||||||||||||||||||||||||||||
| Dollars (millions) | 2013 | 2012 | Change | % Change | 2013 | 2012 | Change | % Change | ||||||||||||||||||||||||
| Selling and administrative expenses |
$ | (51 | ) | $ | (56 | ) | $ | 5 | (9 | ) | $ | (117 | ) | $ | (113 | ) | $ | (4 | ) | 4 | ||||||||||||
| Provincial mining and other taxes |
(81 | ) | (72 | ) | (9 | ) | 13 | (144 | ) | (100 | ) | (44 | ) | 44 | ||||||||||||||||||
| Share of earnings of equity-accounted investees |
37 | 68 | (31 | ) | (46 | ) | 117 | 143 | (26 | ) | (18 | ) | ||||||||||||||||||||
| Dividend income |
54 | 67 | (13 | ) | (19 | ) | 54 | 67 | (13 | ) | (19 | ) | ||||||||||||||||||||
| Impairment of available-for-sale investment |
— | (341 | ) | 341 | (100 | ) | — | (341 | ) | 341 | (100 | ) | ||||||||||||||||||||
| Other expenses |
(11 | ) | (8 | ) | (3 | ) | 38 | (12 | ) | (11 | ) | (1 | ) | 9 | ||||||||||||||||||
| Finance costs |
(39 | ) | (31 | ) | (8 | ) | 26 | (74 | ) | (65 | ) | (9 | ) | 14 | ||||||||||||||||||
| Income taxes |
(245 | ) | (304 | ) | 59 | (19 | ) | (471 | ) | (464 | ) | (7 | ) | 2 | ||||||||||||||||||
Weighted average debt obligations outstanding and the associated interest rates were as follows:
| Dollars (millions) — except percentage amounts | Three Months Ended June 30 | Six Months Ended June 30 | ||||||||||||||||||||||||||||||||
| Obligations | Weighted Average | 2013 | 2012 | Change | % Change | 2013 | 2012 | Change | % Change | |||||||||||||||||||||||||
| Long-term debt(1) |
Outstanding |
$ | 3,506 | $ | 3,757 | $ | (251) | (7 | ) | $ | 3,610 | $ | 3,757 | $ | (147) | (4 | ) | |||||||||||||||||
| Effective interest rate | 5.2% | 5.2% | —% | — | 5.2% | 5.2% | —% | — | ||||||||||||||||||||||||||
| Short-term debt |
Outstanding | $ | 269 | $ | 698 | $ | (429) | (61 | ) | $ | 354 | $ | 768 | $ | (414) | (54 | ) | |||||||||||||||||
| Effective interest rate | 0.3% | 0.4% | (0.1)% | (25 | ) | 0.3% | 0.4% | (0.1)% | (25 | ) | ||||||||||||||||||||||||
| (1) | Includes current portion |
For the second quarter, income taxes decreased due to lower ordinary earnings before taxes. For the first six months of the year, income taxes increased due to higher discrete tax adjustments which were mostly offset by lower income taxes on reduced ordinary earnings before taxes. Effective tax rates and discrete items were as follows:
| Three Months Ended June 30 |
Six Months Ended June 30 |
|||||||||||||||
| Dollars (millions) — except percentage amounts | 2013 | 2012 | 2013 | 2012 | ||||||||||||
| Actual effective tax rate on ordinary earnings |
25% | 26% | 26% | 25% | ||||||||||||
| Actual effective tax rate including discrete items |
28% | 37% | 28% | 31% | ||||||||||||
| Discrete tax adjustments that impacted the rate |
$(18) | $(5) | $(37) | $(3) | ||||||||||||
| PotashCorp 2013 Second Quarter Quarterly Report on Form 10-Q | 32 |
Liquidity and Capital Resources
Cash Requirements
Contractual Obligations and Other Commitments
Our contractual obligations and other commitments detailed on pages 81 and 82 of our 2012 Annual Integrated Report summarize certain of our liquidity and capital resource requirements, excluding obligations that have original maturities of less than one year, planned (but not legally committed) capital expenditures or potential share repurchases.
Capital Expenditures
Based on anticipated exchange rates, during 2013 we expect to incur capital expenditures, including capitalized interest, of approximately $960 million for opportunity capital and approximately $690 million to sustain operations at existing levels and for major repairs and maintenance (including plant turnarounds).
Page 58 of our 2012 Annual Integrated Report outlines key potash construction projects and their expected total cost, as well as the impact of these projects on capacity expansion/debottlenecking and any expected remaining spending on each project still in progress. The most significant of these potash projects(1) on which funds are expected to be spent in 2013, excluding capitalized interest, are outlined in the table below:
| CDN Dollars (millions) | 2013 Forecast | Total Forecast(2) | Started | Expected Completion(3) (Description) |
Forecasted Remaining Spending (after 2013)(2) |
|||||||||||||
| Allan, Saskatchewan |
$ | 50 | $ | 770 | 2008 | 2012 (general expansion) | $ | — | ||||||||||
| New Brunswick |
$ | 160 | $ | 2,180 | 2007 | 2013 (mine shaft and mill) | $ | 370 | ||||||||||
| Rocanville, Saskatchewan |
$ | 540 | $ | 2,810 | 2008 | 2014 (mine shaft and mill) | $ | 220 | ||||||||||
| (1) | The expansion at each of these projects is discussed in the technical report for such project filed on SEDAR in accordance with National Instrument 43-101 Standards of Disclosure for Mineral Projects. |
| (2) | Amounts are based on the most recent forecast amounts approved by the Board of Directors, and are subject to change based on project timelines, cost changes and ongoing project reviews. |
| (3) | Excludes ramp-up time. We expect these projects will be fully ramped up by the end of 2015, subject to market conditions. |
In 2011, we began the process to restart our anhydrous ammonia plant in Geismar, Louisiana. We invested approximately $260 million ($20 million in 2013) to increase ammonia production by an estimated 500,000 tonnes. We started production in the first quarter of 2013.
We anticipate starting an expansion of ammonia production at our Lima, Ohio plant in 2013. We are investing approximately $190 million through the fourth quarter of 2015 ($40 million in 2013) to increase our capacity in ammonia (88,000 tons) and urea (80,000 tons).
We anticipate that all capital spending will be financed by internally generated cash flows supplemented, if and as necessary, by borrowing from existing financing sources.
Sources and Uses of Cash
Cash flows from operating, investing and financing activities, as reflected in the unaudited interim Condensed Consolidated Statements of Cash Flow, are summarized in the following table:
| Three Months Ended June 30 | Six Months Ended June 30 | |||||||||||||||||||||||||||||||
| Dollars (millions) | 2013 | 2012 | Change | % Change | 2013 | 2012 | Change | % Change | ||||||||||||||||||||||||
| Cash provided by operating activities |
$ | 1,202 | $ | 1,222 | $ | (20 | ) | (2 | ) | $ | 1,940 | $ | 1,594 | $ | 346 | 22 | ||||||||||||||||
| Cash used in investing activities |
(359 | ) | (477 | ) | 118 | (25 | ) | (860 | ) | (973 | ) | 113 | (12 | ) | ||||||||||||||||||
| Cash used in financing activities |
(798 | ) | (671 | ) | (127 | ) | 19 | (1,012 | ) | (560 | ) | (452 | ) | 81 | ||||||||||||||||||
| 33 | PotashCorp 2013 Second Quarter Quarterly Report on Form 10-Q |
The following table presents summarized working capital information:
| Dollars (millions) — except ratio amounts | June 30, 2013 | December 31, 2012 | Change | % Change | ||||||||||||
| Current assets |
$ | 2,366 | $ | 2,496 | $ | (130 | ) | (5 | ) | |||||||
| Current liabilities |
(1,606 | ) | (1,854 | ) | 248 | (13 | ) | |||||||||
| Working capital |
760 | 642 | 118 | 18 | ||||||||||||
| Working capital ratio |
1.47 | 1.35 | 0.12 | 9 | ||||||||||||
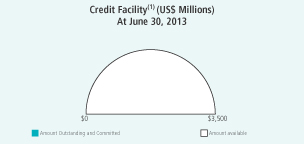
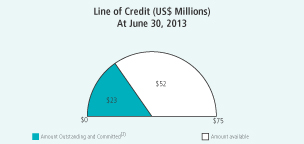
| PotashCorp 2013 Second Quarter Quarterly Report on Form 10-Q | 34 |
| 35 | PotashCorp 2013 Second Quarter Quarterly Report on Form 10-Q |
Quarterly Financial Highlights
| Dollars (millions) — except per-share amounts |
June 30, 2013 |
March 31, 2013 |
December 31, 2012 |
September 30, 2012 |
June 30, 2012 |
March 31, 2012 |
December 31, 2011 |
September 30, 2011 |
||||||||||||||||||||||||
| Sales |
$ | 2,144 | $ | 2,100 | $ | 1,642 | $ | 2,143 | $ | 2,396 | $ | 1,746 | $ | 1,865 | $ | 2,321 | ||||||||||||||||
| Gross margin |
979 | 867 | 586 | 927 | 1,199 | 698 | 890 | 1,132 | ||||||||||||||||||||||||
| Net income |
643 | 556 | 421 | 645 | 522 | 491 | 683 | 826 | ||||||||||||||||||||||||
| Net income per share — basic |
0.74 | 0.64 | 0.49 | 0.75 | 0.61 | 0.57 | 0.80 | 0.96 | ||||||||||||||||||||||||
| Net income per share — diluted |
0.73 | 0.63 | 0.48 | 0.74 | 0.60 | 0.56 | 0.78 | 0.94 | ||||||||||||||||||||||||
| PotashCorp 2013 Second Quarter Quarterly Report on Form 10-Q | 36 |
| 37 | PotashCorp 2013 Second Quarter Quarterly Report on Form 10-Q |
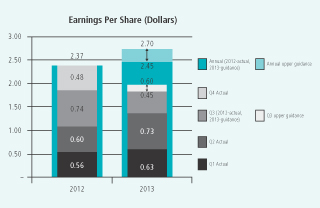
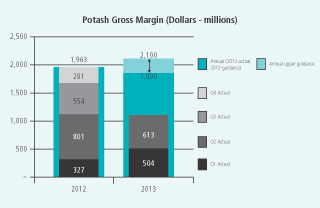
|
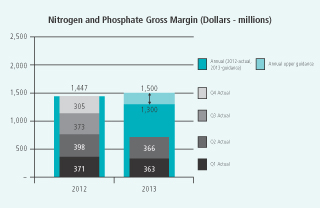
|
| PotashCorp 2013 Second Quarter Quarterly Report on Form 10-Q | 38 |
| 39 | PotashCorp 2013 Second Quarter Quarterly Report on Form 10-Q |
| PotashCorp 2013 Second Quarter Quarterly Report on Form 10-Q | 40 |
Part II. Other Information
Item 6. Exhibits
(a) Exhibits
| Incorporated by Reference | ||||||||||
| Exhibit Number |
Description of Document | Form | Filing Date/Period End Date |
Exhibit Number (if different) | ||||||
| 3(a) |
Articles of Continuance of the registrant dated May 15, 2002. | 10-Q | 6/30/2002 | |||||||
| 3(b) |
Bylaws of the registrant effective May 15, 2002. | 10-Q | 6/30/2002 | |||||||
| 4(a) |
Indenture dated as of February 27, 2003, between the registrant and U.S. Bank National Association, as successor trustee. | 10-K | 12/31/2002 | 4(c) | ||||||
| 4(b) |
Form of Note relating to the registrant’s offering of $500,000,000 principal amount of 5.875% Notes due December 1, 2036. | 8-K | 11/30/2006 | 4(a) | ||||||
| 4(c) |
Form of Note relating to the registrant’s offering of $500,000,000 principal amount of 5.25% Notes due May 15, 2014. | 8-K | 5/1/2009 | 4(a) | ||||||
| 4(d) |
Form of Note relating to the registrant’s offering of $500,000,000 principal amount of 6.50% Notes due May 15, 2019. | 8-K | 5/1/2009 | 4(b) | ||||||
| 4(e) |
Form of Note relating to the registrant’s offering of $500,000,000 principal amount of 3.75% Notes due September 30, 2015. | 8-K | 9/25/2009 | 4(a) | ||||||
| 4(f) |
Form of Note relating to the registrant’s offering of $500,000,000 principal amount of 4.875% Notes due March 30, 2020. | 8-K | 9/25/2009 | 4(b) | ||||||
| 4(g) |
Revolving Term Credit Facility Agreement between The Bank of Nova Scotia and other financial institutions and the registrant dated as of December 11, 2009. | 8-K | 12/15/2009 | 4(a) | ||||||
| 4(h) |
Revolving Term Credit Facility First Amending Agreement between The Bank of Nova Scotia and other financial institutions and the registrant dated as of September 23, 2011. | 8-K | 9/26/2011 | 4(a) | ||||||
| 4(i) |
Revolving Term Credit Facility Second Amending Agreement between The Bank of Nova Scotia and other financial institutions and the registrant dated as of May 24, 2013. | 8-K | 5/28/2013 | 4(a) | ||||||
| 4(j) |
Form of Note relating to the registrant’s offering of $500,000,000 principal amount of 3.25% Notes due December 1, 2017. | 8-K | 11/29/2010 | 4(a) | ||||||
| 4(k) |
Form of Note relating to the registrant’s offering of $500,000,000 principal amount of 5.625% Notes due December 1, 2040. | 8-K | 11/29/2010 | 4(b) | ||||||
| 4(l) |
Agreement of Resignation, Appointment and Acceptance, dated as of June 25, 2013, by and among the registrant, The Bank of Nova Scotia Trust Company of New York and U.S. Bank National Association. | 8-K | 6/27/2013 | 4(a) | ||||||
| 41 | PotashCorp 2013 Second Quarter Quarterly Report on Form 10-Q |
The registrant hereby undertakes to file with the Securities and Exchange Commission, upon request, copies of any constituent instruments defining the rights of holders of long-term debt of the registrant or its subsidiaries that have not been filed herewith because the amounts represented thereby are less than 10% of the total assets of the registrant and its subsidiaries on a consolidated basis.
| Incorporated by Reference | ||||||||||
| Exhibit Number |
Description of Document | Form | Filing Date/Period End Date |
Exhibit Number (if different) | ||||||
| 10(a) |
Sixth Voting Agreement dated April 22, 1978, between Central Canada Potash, Division of Noranda, Inc., Cominco Ltd., International Minerals and Chemical Corporation (Canada) Limited, PCS Sales and Texasgulf Inc. | F-1 (File No. |
9/28/1989 | 10(f) | ||||||
| 10(b) |
Canpotex Limited Shareholders Seventh Memorandum of Agreement effective April 21, 1978, between Central Canada Potash, Division of Noranda Inc., Cominco Ltd., International Minerals and Chemical Corporation (Canada) Limited, PCS Sales, Texasgulf Inc. and Canpotex Limited as amended by Canpotex S&P amending agreement dated November 4, 1987. | F-1 (File No. |
9/28/1989 | 10(g) | ||||||
| 10(c) |
Producer Agreement dated April 21, 1978, between Canpotex Limited and PCS Sales. | F-1 (File No. |
9/28/1989 | 10(h) | ||||||
| 10(d) |
Canpotex/PCS Amending Agreement, dated as of October 1, 1992. | 10-K | 12/31/1995 | 10(f) | ||||||
| 10(e) |
Canpotex PCA Collateral Withdrawing/PCS Amending Agreement, dated as of October 7, 1993. | 10-K | 12/31/1995 | 10(g) | ||||||
| 10(f) |
Canpotex Producer Agreement amending agreement dated as of July 1, 2002. | 10-Q | 6/30/2004 | 10(g) | ||||||
| 10(g) |
Esterhazy Restated Mining and Processing Agreement dated January 31, 1978, between International Minerals & Chemical Corporation (Canada) Limited and the registrant’s predecessor. | F-1 (File No. |
9/28/1989 | 10(e) | ||||||
| 10(h) |
Agreement dated December 21, 1990, between International Minerals & Chemical Corporation (Canada) Limited and the registrant, amending the Esterhazy Restated Mining and Processing Agreement dated January 31, 1978. | 10-K | 12/31/1990 | 10(p) | ||||||
| 10(i) |
Agreement effective August 27, 1998, between International Minerals & Chemical (Canada) Global Limited and the registrant, amending the Esterhazy Restated Mining and Processing Agreement dated January 31, 1978 (as amended). | 10-K | 12/31/1998 | 10(l) | ||||||
| 10(j) |
Agreement effective August 31, 1998, among International Minerals & Chemical (Canada) Global Limited, International Minerals & Chemical (Canada) Limited Partnership and the registrant assigning the interest in the Esterhazy Restated Mining and Processing Agreement dated January 31, 1978 (as amended) held by International Minerals & Chemical (Canada) Global Limited to International Minerals & Chemical (Canada) Limited Partnership. | 10-K | 12/31/1998 | 10(m) | ||||||
| 10(k) |
Potash Corporation of Saskatchewan Inc. Stock Option Plan — Directors, as amended. | 10-K | 12/31/2006 | 10(l) | ||||||
| 10(l) |
Potash Corporation of Saskatchewan Inc. Stock Option Plan — Officers and Employees, as amended. | 10-K | 12/31/2006 | 10(m) | ||||||
| 10(m) |
Short-Term Incentive Plan of the registrant effective January 1, 2000, as amended. | 8-K | 3/13/2012 | 10(a) | ||||||
| 10(n) |
Resolution and Forms of Agreement for Supplemental Executive Retirement Income Plan, for officers and key employees of the registrant. | 10-K | 12/31/1995 | 10(o) | ||||||
| 10(o) |
Amending Resolution and revised forms of agreement regarding Supplemental Retirement Income Plan of the registrant. | 10-Q | 6/30/1996 | 10(x) | ||||||
| 10(p) |
Amended and restated Supplemental Executive Retirement Income Plan of the registrant and text of amendment to existing supplemental income plan agreements. | 10-Q | 9/30/2000 | 10(mm) | ||||||
| 10(q) |
Amendment, dated February 23, 2009, to the amended and restated Supplemental Executive Retirement Income Plan. | 10-K | 12/31/2008 | 10(r) | ||||||
| 10(r) |
Amendment, dated December 29, 2010, to the amended and restated Supplemental Executive Retirement Income Plan. | 10-K | 12/31/2010 | |||||||
| 10(s) |
Form of Letter of amendment to existing supplemental income plan agreements of the registrant. | 10-K | 12/31/2002 | 10(cc) | ||||||
| 10(t) |
Amended and restated agreement dated February 20, 2007, between the registrant and William J. Doyle concerning the Supplemental Executive Retirement Income Plan. | 10-K | 12/31/2006 | 10(s) | ||||||
| 10(u) |
Amendment, dated December 24, 2008, to the amended and restated agreement, dated February 20, 2007, between the registrant and William J. Doyle concerning the Supplemental Executive Retirement Income Plan. | 10-K | 12/31/2008 | 10(u) | ||||||
| 10(v) |
Amendment, dated February 23, 2009, to the amended and restated agreement, dated February 20, 2007, between the registrant and William J. Doyle concerning the Supplemental Executive Retirement Income Plan. | 10-K | 12/31/2008 | 10(v) | ||||||
| PotashCorp 2013 Second Quarter Quarterly Report on Form 10-Q | 42 |
| Incorporated by Reference | ||||||||||
| Exhibit Number |
Description of Document | Form | Filing Date/Period End Date |
Exhibit Number (if different) | ||||||
| 10(w) |
Amendment, dated February 23, 2009, to the amended and restated agreement, dated August 2, 1996, between the registrant and Wayne R. Brownlee concerning the Supplemental Executive Retirement Income Plan. | 10-K | 12/31/2008 | 10(w) | ||||||
| 10(x) |
Amendment, dated December 29, 2010, to the amended and restated agreement, dated February 20, 2007, between the registrant and William J. Doyle concerning the Supplemental Executive Retirement Income Plan. | 10-K | 12/31/2010 | 10(y) | ||||||
| 10(y) |
Amendment, dated December 29, 2010, to the amended and restated agreement, dated August 2, 1996, between the registrant and Wayne R. Brownlee concerning the Supplemental Executive Retirement Income Plan. | 10-K | 12/31/2010 | 10(z) | ||||||
| 10(z) |
Supplemental Retirement Agreement dated December 24, 2008, between the registrant and Stephen F. Dowdle. | 10-K | 12/31/2011 | 10(bb) | ||||||
| 10(aa) |
Supplemental Retirement Benefits Plan for U.S. Executives dated effective January 1, 1999. | 10-Q | 6/30/2002 | 10(aa) | ||||||
| 10(bb) |
Amendment No. 1, dated December 24, 2008, to the Supplemental Retirement Plan for U.S. Executives. | 10-K | 12/31/2008 | 10(z) | ||||||
| 10(cc) |
Amendment No. 2, dated February 23, 2009, to the Supplemental Retirement Plan for U.S. Executives. | 10-K | 12/31/2008 | 10(aa) | ||||||
| 10(dd) |
Forms of Agreement dated December 30, 1994, between the registrant and certain officers of the registrant. | 10-K | 12/31/1995 | 10(p) | ||||||
| 10(ee) |
Amendment, dated December 31, 2010, to the Agreement, dated December 30, 1994 between the registrant and William J. Doyle. | 10-K | 12/31/2010 | 10(ff) | ||||||
| 10(ff) |
Form of Agreement of Indemnification dated August 8, 1995, between the registrant and certain officers and directors of the registrant. | 10-K | 12/31/1995 | 10(q) | ||||||
| 10(gg) |
Resolution and Form of Agreement of Indemnification dated January 24, 2001. | 10-K | 12/31/2000 | 10(ii) | ||||||
| 10(hh) |
Resolution and Form of Agreement of Indemnification — July 21, 2004. | 10-Q | 6/30/2004 | 10(ii) | ||||||
| 10(ii) |
Chief Executive Officer Medical and Dental Benefits. | 10-K | 12/31/2010 | 10(jj) | ||||||
| 10(jj) |
Potash Corporation of Saskatchewan Inc. Deferred Share Unit Plan for Non-Employee Directors. | 10-Q | 3/31/2012 | 10(ll) | ||||||
| 10(kk) |
Potash Corporation of Saskatchewan Inc. 2005 Performance Option Plan and Form of Option Agreement, as amended. | 10-K | 12/31/2006 | 10(cc) | ||||||
| 10(ll) |
Potash Corporation of Saskatchewan Inc. 2006 Performance Option Plan and Form of Option Agreement, as amended. | 10-K | 12/31/2006 | 10(dd) | ||||||
| 10(mm) |
Potash Corporation of Saskatchewan Inc. 2007 Performance Option Plan and Form of Option Agreement. | 10-Q | 3/31/2007 | 10(ee) | ||||||
| 10(nn) |
Potash Corporation of Saskatchewan Inc. 2008 Performance Option Plan and Form of Option Agreement. | 10-Q | 3/31/2008 | 10(ff) | ||||||
| 10(oo) |
Potash Corporation of Saskatchewan Inc. 2009 Performance Option Plan and Form of Option Agreement. | 10-Q | 3/31/2009 | 10(mm) | ||||||
| 10(pp) |
Potash Corporation of Saskatchewan Inc. 2010 Performance Option Plan and Form of Option Agreement. | 8-K | 5/7/2010 | 10.1 | ||||||
| 10(qq) |
Potash Corporation of Saskatchewan Inc. 2011 Performance Option Plan and Form of Option Agreement. | 8-K | 5/13/2011 | 10(a) | ||||||
| 10(rr) |
Potash Corporation of Saskatchewan Inc. 2012 Performance Option Plan and Form of Option Agreement. | 8-K | 5/18/2012 | 10(a) | ||||||
| 10(ss) |
Potash Corporation of Saskatchewan Inc. 2013 Performance Option Plan and Form of Option Agreement | 8-K | 5/17/2013 | 10(a) | ||||||
| 10(tt) |
Medium-Term Incentive Plan of the registrant effective January 1, 2012. | 10-K | 12/31/2011 | 10(uu) | ||||||
| 31(a) |
Certification pursuant to Section 302 of the Sarbanes-Oxley Act of 2002. | |||||||||
| 31(b) |
Certification pursuant to Section 302 of the Sarbanes-Oxley Act of 2002. | |||||||||
| 32 |
Certification pursuant to Section 906 of the Sarbanes-Oxley Act of 2002. | |||||||||
| 95 |
Information concerning mine safety violations or other regulatory matters required by Section 1503(a) of the Dodd-Frank Wall Street Reform and Consumer Protection Act. | |||||||||
| 43 | PotashCorp 2013 Second Quarter Quarterly Report on Form 10-Q |
Signatures
Pursuant to the requirements of the Securities Exchange Act of 1934, the registrant has duly caused this report to be signed on its behalf by the undersigned, thereunto duly authorized.
| POTASH CORPORATION OF SASKATCHEWAN INC. | ||||
| July 30, 2013 | By: | /s/ JOSEPH PODWIKA | ||
| Joseph Podwika | ||||
| Senior Vice President, General Counsel and Secretary | ||||
| July 30, 2013 | By: | /s/ WAYNE R. BROWNLEE | ||
| Wayne R. Brownlee | ||||
| Executive Vice President, Treasurer and Chief Financial Officer (Principal Financial and Accounting Officer) | ||||
| PotashCorp 2013 Second Quarter Quarterly Report on Form 10-Q | 44 |
EXHIBIT INDEX
| Incorporated by Reference | ||||||||||
| Exhibit Number |
Description of Document | Form | Filing Date/Period End Date |
Exhibit Number (if different) | ||||||
| 3(a) |
Articles of Continuance of the registrant dated May 15, 2002. | 10-Q | 6/30/2002 | |||||||
| 3(b) |
Bylaws of the registrant effective May 15, 2002. | 10-Q | 6/30/2002 | |||||||
| 4(a) |
Indenture dated as of February 27, 2003, between the registrant and U.S. Bank National Association, as successor trustee. | 10-K | 12/31/2002 | 4(c) | ||||||
| 4(b) |
Form of Note relating to the registrant’s offering of $500,000,000 principal amount of 5.875% Notes due December 1, 2036. | 8-K | 11/30/2006 | 4(a) | ||||||
| 4(c) |
Form of Note relating to the registrant’s offering of $500,000,000 principal amount of 5.25% Notes due May 15, 2014. | 8-K | 5/1/2009 | 4(a) | ||||||
| 4(d) |
Form of Note relating to the registrant’s offering of $500,000,000 principal amount of 6.50% Notes due May 15, 2019. | 8-K | 5/1/2009 | 4(b) | ||||||
| 4(e) |
Form of Note relating to the registrant’s offering of $500,000,000 principal amount of 3.75% Notes due September 30, 2015. | 8-K | 9/25/2009 | 4(a) | ||||||
| 4(f) |
Form of Note relating to the registrant’s offering of $500,000,000 principal amount of 4.875% Notes due March 30, 2020. | 8-K | 9/25/2009 | 4(b) | ||||||
| 4(g) |
Revolving Term Credit Facility Agreement between The Bank of Nova Scotia and other financial institutions and the registrant dated as of December 11, 2009. | 8-K | 12/15/2009 | 4(a) | ||||||
| 4(h) |
Revolving Term Credit Facility First Amending Agreement between The Bank of Nova Scotia and other financial institutions and the registrant dated as of September 23, 2011. | 8-K | 9/26/2011 | 4(a) | ||||||
| 4(i) |
Revolving Term Credit Facility Second Amending Agreement between The Bank of Nova Scotia and other financial institutions and the registrant dated as of May 24, 2013. | 8-K | 5/28/2013 | 4(a) | ||||||
| 4(j) |
Form of Note relating to the registrant’s offering of $500,000,000 principal amount of 3.25% Notes due December 1, 2017. | 8-K | 11/29/2010 | 4(a) | ||||||
| 4(k) |
Form of Note relating to the registrant’s offering of $500,000,000 principal amount of 5.625% Notes due December 1, 2040. | 8-K | 11/29/2010 | 4(b) | ||||||
| 4(l) |
Agreement of Resignation, Appointment and Acceptance, dated as of June 25, 2013, by and among the registrant, The Bank of Nova Scotia Trust Company of New York and U.S. Bank National Association. | 8-K | 6/27/2013 | 4(a) | ||||||
The registrant hereby undertakes to file with the Securities and Exchange Commission, upon request, copies of any constituent instruments defining the rights of holders of long-term debt of the registrant or its subsidiaries that have not been filed herewith because the amounts represented thereby are less than 10% of the total assets of the registrant and its subsidiaries on a consolidated basis.
| Incorporated by Reference | ||||||||||
| Exhibit Number |
Description of Document | Form | Filing Date/Period End Date |
Exhibit Number (if different) | ||||||
| 10(a) |
Sixth Voting Agreement dated April 22, 1978, between Central Canada Potash, Division of Noranda, Inc., Cominco Ltd., International Minerals and Chemical Corporation (Canada) Limited, PCS Sales and Texasgulf Inc. | F-1 (File No. |
9/28/1989 | 10(f) | ||||||
| 10(b) |
Canpotex Limited Shareholders Seventh Memorandum of Agreement effective April 21, 1978, between Central Canada Potash, Division of Noranda Inc., Cominco Ltd., International Minerals and Chemical Corporation (Canada) Limited, PCS Sales, Texasgulf Inc. and Canpotex Limited as amended by Canpotex S&P amending agreement dated November 4, 1987. | F-1 (File No. |
9/28/1989 | 10(g) | ||||||
| 10(c) |
Producer Agreement dated April 21, 1978, between Canpotex Limited and PCS Sales. | F-1 (File No. |
9/28/1989 | 10(h) | ||||||
| 10(d) |
Canpotex/PCS Amending Agreement, dated as of October 1, 1992. | 10-K | 12/31/1995 | 10(f) | ||||||
| 10(e) |
Canpotex PCA Collateral Withdrawing/PCS Amending Agreement, dated as of October 7, 1993. | 10-K | 12/31/1995 | 10(g) | ||||||
| 10(f) |
Canpotex Producer Agreement amending agreement dated as of July 1, 2002. | 10-Q | 6/30/2004 | 10(g) | ||||||
| 10(g) |
Esterhazy Restated Mining and Processing Agreement dated January 31, 1978, between International Minerals & Chemical Corporation (Canada) Limited and the registrant’s predecessor. | F-1 (File No. |
9/28/1989 | 10(e) | ||||||
| 10(h) |
Agreement dated December 21, 1990, between International Minerals & Chemical Corporation (Canada) Limited and the registrant, amending the Esterhazy Restated Mining and Processing Agreement dated January 31, 1978. | 10-K | 12/31/1990 | 10(p) | ||||||
| 10(i) |
Agreement effective August 27, 1998, between International Minerals & Chemical (Canada) Global Limited and the registrant, amending the Esterhazy Restated Mining and Processing Agreement dated January 31, 1978 (as amended). | 10-K | 12/31/1998 | 10(l) | ||||||
| 10(j) |
Agreement effective August 31, 1998, among International Minerals & Chemical (Canada) Global Limited, International Minerals & Chemical (Canada) Limited Partnership and the registrant assigning the interest in the Esterhazy Restated Mining and Processing Agreement dated January 31, 1978 (as amended) held by International Minerals & Chemical (Canada) Global Limited to International Minerals & Chemical (Canada) Limited Partnership. | 10-K | 12/31/1998 | 10(m) | ||||||
| 10(k) |
Potash Corporation of Saskatchewan Inc. Stock Option Plan — Directors, as amended. | 10-K | 12/31/2006 | 10(l) | ||||||
| 10(l) |
Potash Corporation of Saskatchewan Inc. Stock Option Plan — Officers and Employees, as amended. | 10-K | 12/31/2006 | 10(m) | ||||||
| 10(m) |
Short-Term Incentive Plan of the registrant effective January 1, 2000, as amended. | 8-K | 3/13/2012 | 10(a) | ||||||
| 10(n) |
Resolution and Forms of Agreement for Supplemental Executive Retirement Income Plan, for officers and key employees of the registrant. | 10-K | 12/31/1995 | 10(o) | ||||||
| 10(o) |
Amending Resolution and revised forms of agreement regarding Supplemental Retirement Income Plan of the registrant. | 10-Q | 6/30/1996 | 10(x) | ||||||
| 10(p) |
Amended and restated Supplemental Executive Retirement Income Plan of the registrant and text of amendment to existing supplemental income plan agreements. | 10-Q | 9/30/2000 | 10(mm) | ||||||
| 10(q) |
Amendment, dated February 23, 2009, to the amended and restated Supplemental Executive Retirement Income Plan. | 10-K | 12/31/2008 | 10(r) | ||||||
| 10(r) |
Amendment, dated December 29, 2010, to the amended and restated Supplemental Executive Retirement Income Plan. | 10-K | 12/31/2010 | |||||||
| 10(s) |
Form of Letter of amendment to existing supplemental income plan agreements of the registrant. | 10-K | 12/31/2002 | 10(cc) | ||||||
| 10(t) |
Amended and restated agreement dated February 20, 2007, between the registrant and William J. Doyle concerning the Supplemental Executive Retirement Income Plan. | 10-K | 12/31/2006 | 10(s) | ||||||
| 10(u) |
Amendment, dated December 24, 2008, to the amended and restated agreement, dated February 20, 2007, between the registrant and William J. Doyle concerning the Supplemental Executive Retirement Income Plan. | 10-K | 12/31/2008 | 10(u) | ||||||
| 10(v) |
Amendment, dated February 23, 2009, to the amended and restated agreement, dated February 20, 2007, between the registrant and William J. Doyle concerning the Supplemental Executive Retirement Income Plan. | 10-K | 12/31/2008 | 10(v) | ||||||
| Incorporated by Reference | ||||||||||
| Exhibit Number |
Description of Document | Form | Filing Date/Period End Date |
Exhibit Number (if different) | ||||||
| 10(w) |
Amendment, dated February 23, 2009, to the amended and restated agreement, dated August 2, 1996, between the registrant and Wayne R. Brownlee concerning the Supplemental Executive Retirement Income Plan. | 10-K | 12/31/2008 | 10(w) | ||||||
| 10(x) |
Amendment, dated December 29, 2010, to the amended and restated agreement, dated February 20, 2007, between the registrant and William J. Doyle concerning the Supplemental Executive Retirement Income Plan. | 10-K | 12/31/2010 | 10(y) | ||||||
| 10(y) |
Amendment, dated December 29, 2010, to the amended and restated agreement, dated August 2, 1996, between the registrant and Wayne R. Brownlee concerning the Supplemental Executive Retirement Income Plan. | 10-K | 12/31/2010 | 10(z) | ||||||
| 10(z) |
Supplemental Retirement Agreement dated December 24, 2008, between the registrant and Stephen F. Dowdle. | 10-K | 12/31/2011 | 10(bb) | ||||||
| 10(aa) |
Supplemental Retirement Benefits Plan for U.S. Executives dated effective January 1, 1999. | 10-Q | 6/30/2002 | 10(aa) | ||||||
| 10(bb) |
Amendment No. 1, dated December 24, 2008, to the Supplemental Retirement Plan for U.S. Executives. | 10-K | 12/31/2008 | 10(z) | ||||||
| 10(cc) |
Amendment No. 2, dated February 23, 2009, to the Supplemental Retirement Plan for U.S. Executives. | 10-K | 12/31/2008 | 10(aa) | ||||||
| 10(dd) |
Forms of Agreement dated December 30, 1994, between the registrant and certain officers of the registrant. | 10-K | 12/31/1995 | 10(p) | ||||||
| 10(ee) |
Amendment, dated December 31, 2010, to the Agreement, dated December 30, 1994 between the registrant and William J. Doyle. | 10-K | 12/31/2010 | 10(ff) | ||||||
| 10(ff) |
Form of Agreement of Indemnification dated August 8, 1995, between the registrant and certain officers and directors of the registrant. | 10-K | 12/31/1995 | 10(q) | ||||||
| 10(gg) |
Resolution and Form of Agreement of Indemnification dated January 24, 2001. | 10-K | 12/31/2000 | 10(ii) | ||||||
| 10(hh) |
Resolution and Form of Agreement of Indemnification — July 21, 2004. | 10-Q | 6/30/2004 | 10(ii) | ||||||
| 10(ii) |
Chief Executive Officer Medical and Dental Benefits. | 10-K | 12/31/2010 | 10(jj) | ||||||
| 10(jj) |
Potash Corporation of Saskatchewan Inc. Deferred Share Unit Plan for Non-Employee Directors. | 10-Q | 3/31/2012 | 10(ll) | ||||||
| 10(kk) |
Potash Corporation of Saskatchewan Inc. 2005 Performance Option Plan and Form of Option Agreement, as amended. | 10-K | 12/31/2006 | 10(cc) | ||||||
| 10(ll) |
Potash Corporation of Saskatchewan Inc. 2006 Performance Option Plan and Form of Option Agreement, as amended. | 10-K | 12/31/2006 | 10(dd) | ||||||
| 10(mm) |
Potash Corporation of Saskatchewan Inc. 2007 Performance Option Plan and Form of Option Agreement. | 10-Q | 3/31/2007 | 10(ee) | ||||||
| 10(nn) |
Potash Corporation of Saskatchewan Inc. 2008 Performance Option Plan and Form of Option Agreement. | 10-Q | 3/31/2008 | 10(ff) | ||||||
| 10(oo) |
Potash Corporation of Saskatchewan Inc. 2009 Performance Option Plan and Form of Option Agreement. | 10-Q | 3/31/2009 | 10(mm) | ||||||
| 10(pp) |
Potash Corporation of Saskatchewan Inc. 2010 Performance Option Plan and Form of Option Agreement. | 8-K | 5/7/2010 | 10.1 | ||||||
| 10(qq) |
Potash Corporation of Saskatchewan Inc. 2011 Performance Option Plan and Form of Option Agreement. | 8-K | 5/13/2011 | 10(a) | ||||||
| 10(rr) |
Potash Corporation of Saskatchewan Inc. 2012 Performance Option Plan and Form of Option Agreement. | 8-K | 5/18/2012 | 10(a) | ||||||
| 10(ss) |
Potash Corporation of Saskatchewan Inc. 2013 Performance Option Plan and Form of Option Agreement | 8-K | 5/17/2013 | 10(a) | ||||||
| 10(tt) |
Medium-Term Incentive Plan of the registrant effective January 1, 2012. | 10-K | 12/31/2011 | 10(uu) | ||||||
| 31(a) |
Certification pursuant to Section 302 of the Sarbanes-Oxley Act of 2002. | |||||||||
| 31(b) |
Certification pursuant to Section 302 of the Sarbanes-Oxley Act of 2002. | |||||||||
| 32 |
Certification pursuant to Section 906 of the Sarbanes-Oxley Act of 2002. | |||||||||
| 95 |
Information concerning mine safety violations or other regulatory matters required by Section 1503(a) of the Dodd-Frank Wall Street Reform and Consumer Protection Act. | |||||||||