Attached files
| file | filename |
|---|---|
| EX-10.NN - EXHIBIT 10(NN) - POTASH CORP OF SASKATCHEWAN INC | d800670dex10nn.htm |
| EX-31.A - EXHIBIT 31(A) - POTASH CORP OF SASKATCHEWAN INC | d800670dex31a.htm |
| EX-31.B - EXHIBIT 31(B) - POTASH CORP OF SASKATCHEWAN INC | d800670dex31b.htm |
| EX-32 - EXHIBIT 32 - POTASH CORP OF SASKATCHEWAN INC | d800670dex32.htm |
| EX-95 - EXHIBIT 95 - POTASH CORP OF SASKATCHEWAN INC | d800670dex95.htm |
| 10-Q - FORM 10-Q COURTESY PDF - POTASH CORP OF SASKATCHEWAN INC | d800670d10q1.pdf |
UNITED STATES SECURITIES AND EXCHANGE COMMISSION
Washington, D.C. 20549
Form 10-Q
| þ | QUARTERLY REPORT PURSUANT TO SECTION 13 OR 15(d) OF THE SECURITIES EXCHANGE ACT OF 1934 |
For the Quarterly Period Ended September 30, 2014
OR
| ¨ | TRANSITION REPORT PURSUANT TO SECTION 13 OR 15(d) OF THE SECURITIES EXCHANGE ACT OF 1934 |
Commission File Number 1-10351
Potash Corporation of Saskatchewan Inc.
(Exact name of registrant as specified in its charter)
| Canada | N/A | |
| (State or other jurisdiction of incorporation or organization) |
(I.R.S. Employer Identification No.) | |
| 122 — 1st Avenue South Saskatoon, Saskatchewan, Canada (Address of principal executive offices) |
S7K 7G3 (Zip Code) | |
306-933-8500
(Registrant’s telephone number, including area code)
Indicate by check mark whether the registrant (1) has filed all reports required to be filed by Sections 13 or 15(d) of the Securities Exchange Act of 1934 during the preceding 12 months (or for such shorter period that the registrant was required to file such reports), and (2) has been subject to such filing requirements for the past 90 days.
Yes þ No ¨
Indicate by check mark whether the registrant has submitted electronically and posted on its corporate Web site, if any, every Interactive Data File required to be submitted and posted pursuant to Rule 405 of Regulation S-T during the preceding 12 months (or for such shorter period that the registrant was required to submit and post such files).
Yes ¨ No ¨
Indicate by check mark whether the registrant is a large accelerated filer, an accelerated filer, a non-accelerated filer, or a smaller reporting company. See the definitions of “large accelerated filer,” “accelerated filer” and “smaller reporting company” in Rule 12b-2 of the Exchange Act. (Check one):
| Large accelerated filer þ | Accelerated filer ¨ | Non-accelerated filer ¨ | Smaller reporting company ¨ | |||
| (Do not check if a smaller reporting company) |
Indicate by check mark whether the registrant is a shell company (as defined in Exchange Act Rule 12b-2).
Yes ¨ No þ
As at October 3, 2014, Potash Corporation of Saskatchewan Inc. had 829,695,745 Common Shares outstanding.
Part I. Financial Information
Item 1. Financial Statements
Potash Corporation of Saskatchewan Inc.
Condensed Consolidated Statements of Financial Position
(in millions of US dollars)
(unaudited)
| As at | September 30, 2014 |
December 31, 2013 |
||||||
| Assets |
||||||||
| Current assets |
||||||||
| Cash and cash equivalents |
$ | 152 | $ | 628 | ||||
| Receivables |
820 | 752 | ||||||
| Inventories (Note 2) |
690 | 728 | ||||||
| Prepaid expenses and other current assets |
58 | 81 | ||||||
| 1,720 | 2,189 | |||||||
| Non-current assets |
||||||||
| Property, plant and equipment |
12,428 | 12,233 | ||||||
| Investments in equity-accounted investees |
1,230 | 1,276 | ||||||
| Available-for-sale investments (Note 3) |
1,490 | 1,722 | ||||||
| Other assets |
351 | 401 | ||||||
| Intangible assets |
142 | 137 | ||||||
| Total Assets |
$ | 17,361 | $ | 17,958 | ||||
| Liabilities |
||||||||
| Current liabilities |
||||||||
| Short-term debt and current portion of long-term debt (Note 4) |
$ | 980 | $ | 967 | ||||
| Payables and accrued charges |
948 | 1,104 | ||||||
| Current portion of derivative instrument liabilities |
49 | 42 | ||||||
| 1,977 | 2,113 | |||||||
| Non-current liabilities |
||||||||
| Long-term debt (Note 4) |
3,212 | 2,970 | ||||||
| Derivative instrument liabilities |
107 | 129 | ||||||
| Deferred income tax liabilities |
2,150 | 2,013 | ||||||
| Pension and other post-retirement benefit liabilities |
422 | 410 | ||||||
| Asset retirement obligations and accrued environmental costs |
608 | 557 | ||||||
| Other non-current liabilities and deferred credits |
125 | 138 | ||||||
| Total Liabilities |
8,601 | 8,330 | ||||||
| Shareholders’ Equity |
||||||||
| Share capital (Note 5) |
1,620 | 1,600 | ||||||
| Contributed surplus |
229 | 219 | ||||||
| Accumulated other comprehensive income |
495 | 673 | ||||||
| Retained earnings |
6,416 | 7,136 | ||||||
| Total Shareholders’ Equity |
8,760 | 9,628 | ||||||
| Total Liabilities and Shareholders’ Equity |
$ | 17,361 | $ | 17,958 | ||||
(See Notes to the Condensed Consolidated Financial Statements)
| 1 | PotashCorp 2014 Third Quarter Quarterly Report on Form 10-Q |
Potash Corporation of Saskatchewan Inc.
Condensed Consolidated Statements of Income
(in millions of US dollars except per-share and share amounts)
(unaudited)
| Three Months Ended September 30 | Nine Months Ended September 30 | |||||||||||||||
| 2014 | 2013 | 2014 | 2013 | |||||||||||||
| Sales (Note 6) |
$ | 1,641 | $ | 1,520 | $ | 5,213 | $ | 5,764 | ||||||||
| Freight, transportation and distribution |
(141 | ) | (139 | ) | (465 | ) | (435 | ) | ||||||||
| Cost of goods sold |
(911 | ) | (897 | ) | (2,847 | ) | (2,999 | ) | ||||||||
| Gross Margin |
589 | 484 | 1,901 | 2,330 | ||||||||||||
| Selling and administrative expenses |
(49 | ) | (48 | ) | (172 | ) | (165 | ) | ||||||||
| Provincial mining and other taxes |
(52 | ) | (10 | ) | (175 | ) | (154 | ) | ||||||||
| Share of earnings of equity-accounted investees |
20 | 57 | 85 | 174 | ||||||||||||
| Dividend income |
7 | 31 | 100 | 85 | ||||||||||||
| Impairment of available-for-sale investment (Note 3) |
— | — | (38 | ) | — | |||||||||||
| Other income (expenses) |
5 | (9 | ) | 36 | (21 | ) | ||||||||||
| Operating Income |
520 | 505 | 1,737 | 2,249 | ||||||||||||
| Finance costs |
(47 | ) | (33 | ) | (142 | ) | (107 | ) | ||||||||
| Income Before Income Taxes |
473 | 472 | 1,595 | 2,142 | ||||||||||||
| Income taxes (Note 8) |
(156 | ) | (116 | ) | (466 | ) | (587 | ) | ||||||||
| Net Income |
$ | 317 | $ | 356 | $ | 1,129 | $ | 1,555 | ||||||||
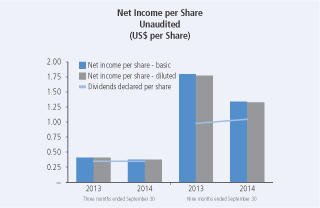
| Net Income per Share |
||||||||||||||||
| Basic |
$ | 0.38 | $ | 0.41 | $ | 1.34 | $ | 1.80 | ||||||||
| Diluted |
$ | 0.38 | $ | 0.41 | $ | 1.33 | $ | 1.77 | ||||||||
| Dividends Declared per Share |
$ | 0.35 | $ | 0.35 | $ | 1.05 | $ | 0.98 | ||||||||
| Weighted Average Shares Outstanding |
||||||||||||||||
| Basic |
829,506,000 | 866,108,000 | 840,837,000 | 865,707,000 | ||||||||||||
| Diluted |
835,835,000 | 874,339,000 | 847,429,000 | 876,027,000 | ||||||||||||
(See Notes to the Condensed Consolidated Financial Statements)
| PotashCorp 2014 Third Quarter Quarterly Report on Form 10-Q | 2 |
Potash Corporation of Saskatchewan Inc.
Condensed Consolidated Statements of Comprehensive Income
(in millions of US dollars)
(unaudited)
| Three Months Ended September 30 | Nine Months Ended September 30 | |||||||||||||||
| (Net of related income taxes) | 2014 | 2013 | 2014 | 2013 | ||||||||||||
| Net Income |
$ | 317 | $ | 356 | $ | 1,129 | $ | 1,555 | ||||||||
| Other comprehensive loss |
||||||||||||||||
| Items that will not be reclassified to net income: |
||||||||||||||||
| Net actuarial gain on defined benefit plans (1) |
— | — | — | 150 | ||||||||||||
| Items that have been or may be subsequently reclassified to net income: |
||||||||||||||||
| Available-for-sale investments (2) |
||||||||||||||||
| Net fair value loss during the period |
(229 | ) | (267 | ) | (194 | ) | (737 | ) | ||||||||
| Cash flow hedges |
||||||||||||||||
| Net fair value loss during the period (3) |
(6 | ) | — | (7 | ) | — | ||||||||||
| Reclassification to income of net loss (4) |
7 | 6 | 20 | 25 | ||||||||||||
| Other |
(1 | ) | 3 | 3 | 1 | |||||||||||
| Other Comprehensive Loss |
(229 | ) | (258 | ) | (178 | ) | (561 | ) | ||||||||
| Comprehensive Income |
$ | 88 | $ | 98 | $ | 951 | $ | 994 | ||||||||
| (1) | Net of income taxes of $NIL (2013 — $NIL) for the three months ended September 30, 2014 and $NIL (2013 — $(87)) for the nine months ended September 30, 2014. |
| (2) | Available-for-sale investments are comprised of shares in Israel Chemicals Ltd. and Sinofert Holdings Limited. |
| (3) | Cash flow hedges are comprised of natural gas derivative instruments and were net of income taxes of $3 (2013 — $NIL) for the three months ended September 30, 2014 and $4 (2013 — $NIL) for the nine months ended September 30, 2014. |
| (4) | Net of income taxes of $(3) (2013 — $(4)) for the three months ended September 30, 2014 and $(11) (2013 — $(14)) for the nine months ended September 30, 2014. |
(See Notes to the Condensed Consolidated Financial Statements)
| 3 | PotashCorp 2014 Third Quarter Quarterly Report on Form 10-Q |
Potash Corporation of Saskatchewan Inc.
Condensed Consolidated Statements of Cash Flow
(in millions of US dollars)
(unaudited)
| Three Months Ended September 30 | Nine Months Ended September 30 | |||||||||||||||
| 2014 | 2013 | 2014 | 2013 | |||||||||||||
| Operating Activities |
||||||||||||||||
| Net income |
$ | 317 | $ | 356 | $ | 1,129 | $ | 1,555 | ||||||||
| Adjustments to reconcile net income to cash provided by operating activities |
||||||||||||||||
| Depreciation and amortization |
161 | 149 | 519 | 489 | ||||||||||||
| Share-based compensation |
3 | 4 | 22 | 25 | ||||||||||||
| Net distributed (undistributed) earnings of equity-accounted investees |
54 | (55 | ) | 51 | (62 | ) | ||||||||||
| Impairment of available-for-sale investment (Note 3) |
— | — | 38 | — | ||||||||||||
| Provision for deferred income tax |
32 | 58 | 142 | 311 | ||||||||||||
| Pension and other post-retirement benefits |
2 | 12 | 23 | (10 | ) | |||||||||||
| Asset retirement obligations and accrued environmental costs |
7 | (12 | ) | 16 | (16 | ) | ||||||||||
| Other long-term liabilities and miscellaneous |
7 | 6 | 10 | 69 | ||||||||||||
| Subtotal of adjustments |
266 | 162 | 821 | 806 | ||||||||||||
| Changes in non-cash operating working capital |
||||||||||||||||
| Receivables |
24 | 96 | (80 | ) | 162 | |||||||||||
| Inventories |
7 | (12 | ) | 24 | 29 | |||||||||||
| Prepaid expenses and other current assets |
(6 | ) | (17 | ) | 21 | (4 | ) | |||||||||
| Payables and accrued charges |
(34 | ) | 31 | (14 | ) | 8 | ||||||||||
| Subtotal of changes in non-cash operating working capital |
(9 | ) | 98 | (49 | ) | 195 | ||||||||||
| Cash provided by operating activities |
574 | 616 | 1,901 | 2,556 | ||||||||||||
| Investing Activities |
||||||||||||||||
| Additions to property, plant and equipment |
(303 | ) | (360 | ) | (726 | ) | (1,210 | ) | ||||||||
| Other assets and intangible assets |
(2 | ) | 2 | (12 | ) | (8 | ) | |||||||||
| Cash used in investing activities |
(305 | ) | (358 | ) | (738 | ) | (1,218 | ) | ||||||||
| Financing Activities |
||||||||||||||||
| Proceeds from long-term debt obligations |
— | — | 737 | — | ||||||||||||
| Repayment of and finance costs on long-term debt obligations |
— | — | (500 | ) | (254 | ) | ||||||||||
| Proceeds from (repayment of) short-term debt obligations |
55 | 113 | 14 | (256 | ) | |||||||||||
| Dividends |
(281 | ) | (290 | ) | (857 | ) | (700 | ) | ||||||||
| Repurchase of common shares |
— | (166 | ) | (1,065 | ) | (166 | ) | |||||||||
| Issuance of common shares |
2 | 10 | 32 | 31 | ||||||||||||
| Cash used in financing activities |
(224 | ) | (333 | ) | (1,639 | ) | (1,345 | ) | ||||||||
| Increase (Decrease) in Cash and Cash Equivalents |
45 | (75 | ) | (476 | ) | (7 | ) | |||||||||
| Cash and Cash Equivalents, Beginning of Period |
107 | 630 | 628 | 562 | ||||||||||||
| Cash and Cash Equivalents, End of Period |
$ | 152 | $ | 555 | $ | 152 | $ | 555 | ||||||||
| Cash and cash equivalents comprised of: |
||||||||||||||||
| Cash |
$ | 63 | $ | 59 | $ | 63 | $ | 59 | ||||||||
| Short-term investments |
89 | 496 | 89 | 496 | ||||||||||||
| $ | 152 | $ | 555 | $ | 152 | $ | 555 | |||||||||
| Supplemental cash flow disclosure |
||||||||||||||||
| Interest paid |
$ | 40 | $ | 23 | $ | 132 | $ | 123 | ||||||||
| Income taxes paid |
$ | 122 | $ | 6 | $ | 292 | $ | 113 | ||||||||
(See Notes to the Condensed Consolidated Financial Statements)
| PotashCorp 2014 Third Quarter Quarterly Report on Form 10-Q | 4 |
Potash Corporation of Saskatchewan Inc.
Condensed Consolidated Statements of Changes in Equity
(in millions of US dollars)
(unaudited)
| Accumulated Other Comprehensive Income | ||||||||||||||||||||||||||||||||||||
| Share Capital |
Contributed Surplus |
Net unrealized gain on available-for- sale investments |
Net loss on derivatives designated as cash flow hedges |
Net actuarial gain on defined benefit plans |
Other | Total Accumulated Other Comprehensive Income |
Retained Earnings |
Total Equity (1) |
||||||||||||||||||||||||||||
| Balance — December 31, 2013 |
$ | 1,600 | $ | 219 | $ | 780 | $ | (105 | ) | $ | — | (2) | $ | (2 | ) | $ | 673 | $ | 7,136 | $ | 9,628 | |||||||||||||||
| Net income |
— | — | — | — | — | — | — | 1,129 | 1,129 | |||||||||||||||||||||||||||
| Other comprehensive (loss) income |
— | — | (194 | ) | 13 | — | 3 | (178 | ) | — | (178 | ) | ||||||||||||||||||||||||
| Share repurchase (Note 5) |
(53 | ) | (2 | ) | — | — | — | — | — | (976 | ) | (1,031 | ) | |||||||||||||||||||||||
| Dividends declared |
— | — | — | — | — | — | — | (873 | ) | (873 | ) | |||||||||||||||||||||||||
| Effect of share-based compensation including issuance of common shares |
43 | 12 | — | — | — | — | — | — | 55 | |||||||||||||||||||||||||||
| Shares issued for dividend reinvestment plan |
30 | — | — | — | — | — | — | — | 30 | |||||||||||||||||||||||||||
| Balance — September 30, 2014 |
$ | 1,620 | $ | 229 | $ | 586 | $ | (92 | ) | $ | — | (2) | $ | 1 | $ | 495 | $ | 6,416 | $ | 8,760 | ||||||||||||||||
| Balance — December 31, 2012 |
$ | 1,543 | $ | 299 | $ | 1,539 | $ | (138 | ) | $ | — | (2) | $ | (2 | ) | $ | 1,399 | $ | 6,671 | $ | 9,912 | |||||||||||||||
| Net income |
— | — | — | — | — | — | — | 1,555 | 1,555 | |||||||||||||||||||||||||||
| Other comprehensive (loss) income |
— | — | (737 | ) | 25 | 150 | 1 | (561 | ) | — | (561 | ) | ||||||||||||||||||||||||
| Share repurchase (Note 5) |
(11 | ) | (79 | ) | — | — | — | — | — | (105 | ) | (195 | ) | |||||||||||||||||||||||
| Dividends declared |
— | — | — | — | — | — | — | (846 | ) | (846 | ) | |||||||||||||||||||||||||
| Effect of share-based compensation including issuance of common shares |
42 | 1 | — | — | — | — | — | — | 43 | |||||||||||||||||||||||||||
| Shares issued for dividend reinvestment plan |
26 | — | — | — | — | — | — | — | 26 | |||||||||||||||||||||||||||
| Transfer of net actuarial gain on defined benefit plans |
— | — | — | — | (150 | ) | — | (150 | ) | 150 | — | |||||||||||||||||||||||||
| Balance — September 30, 2013 |
$ | 1,600 | $ | 221 | $ | 802 | $ | (113 | ) | $ | — | (2) | $ | (1 | ) | $ | 688 | $ | 7,425 | $ | 9,934 | |||||||||||||||
| (1) | All equity transactions were attributable to common shareholders. |
| (2) | Any amounts incurred during a period are closed out to retained earnings at each period-end. Therefore, no balance exists at the beginning or end of period. |
(See Notes to the Condensed Consolidated Financial Statements)
| 5 | PotashCorp 2014 Third Quarter Quarterly Report on Form 10-Q |
Potash Corporation of Saskatchewan Inc.
Notes to the Condensed Consolidated Financial Statements
For the Three and Nine Months Ended September 30, 2014
(in millions of US dollars except as otherwise noted)
(unaudited)
Standards, amendments and interpretations effective and applied
The International Accounting Standards Board (“IASB”) and International Financial Reporting Interpretations Committee (“IFRIC”) have issued the following standards and amendments or interpretations to existing standards that were effective and applied by the company.
| Standard | Description | Impact | ||
| Amendments to IAS 32, Offsetting Financial Assets and Financial Liabilities | Issued as part of the IASB’s offsetting project, amendments clarify certain items regarding offsetting financial assets and financial liabilities. | Adopted retrospectively effective January 1, 2014 with no change to the company’s consolidated financial statements. | ||
| Amendments to IAS 36, Recoverable Amount Disclosures for Non-Financial Assets | Amendments were issued that clarify disclosure requirements for the recoverable amount of an asset or CGU. | Adopted retrospectively effective January 1, 2014 with no change to the company’s consolidated financial statements. | ||
| IFRIC 21, Levies | Provides guidance on when to recognize a liability for a levy imposed by a government. | Adopted retrospectively effective January 1, 2014 with no change to the company’s consolidated financial statements. | ||
| Amendments to IAS 19, Employee Benefits | Issued to simplify the accounting for employee or third-party contributions to defined benefit plans that are independent of the number of years of employee service. | Adopted retrospectively effective July 1, 2014 with no change to the company’s consolidated financial statements. |
Standards, amendments and interpretations not yet effective and not applied
The IASB and IFRIC have issued the following standards and amendments or interpretations to existing standards that were not yet effective and not applied at September 30, 2014. The company does not anticipate early adoption of these standards at this time.
| Standard | Description | Impact | Effective Date (1) | |||
| Amendments to IAS 16, Property, Plant and Equipment and IAS 38, Intangible Assets | Issued to clarify acceptable methods of depreciation and amortization. | The company is reviewing the standard to determine the potential impact, if any; however, no significant impact is anticipated. | January 1, 2016, applied prospectively. | |||
| Amendments to IFRS 11, Joint Arrangements | Issued to provide additional guidance on accounting for the acquisition of an interest in a joint operation. | The company is reviewing the standard to determine the potential impact, if any; however, no significant impact is anticipated. | January 1, 2016, applied prospectively. |
| (1) | Effective date for annual periods beginning on or after the stated date. |
| PotashCorp 2014 Third Quarter Quarterly Report on Form 10-Q | 6 |
| Standard | Description | Impact | Effective Date (1) | |||
| IFRS 15, Revenue From Contracts With Customers | Issued to provide guidance on the recognition of revenue from contracts with customers including multiple-element arrangements and transactions not previously addressed comprehensively, and enhance disclosures about revenue. | The company is reviewing the standard to determine the potential impact, if any. | January 1, 2017, applied retrospectively with certain limitations. | |||
| IFRS 9, Financial Instruments | Issued to replace IAS 39, providing guidance on the classification, measurement and disclosure of financial instruments and introducing a new hedge accounting model. | The company is reviewing the standard to determine the potential impact, if any. | January 1, 2018, applied retrospectively with certain exceptions. |
| (1) | Effective date for annual periods beginning on or after the stated date. |
2. Inventories
| September 30, 2014 |
December 31, 2013 |
|||||||
| Finished products |
$ | 307 | $ | 340 | ||||
| Intermediate products |
79 | 85 | ||||||
| Raw materials |
93 | 101 | ||||||
| Materials and supplies |
211 | 202 | ||||||
| $ | 690 | $ | 728 | |||||
3. Available-for-Sale Investments
The company assesses at the end of each reporting period whether there is objective evidence of impairment. A significant or prolonged decline in the fair value of the investment below its cost would be evidence that the asset is impaired. If objective evidence of impairment exists, the impaired amount (i.e., the unrealized loss) is recognized in net income; any subsequent reversals would be recognized in other comprehensive income (“OCI”) and would not flow back into net income. Any subsequent decline in fair value below the carrying amount at the impairment date would represent a further impairment to be recognized in net income.
During 2012, the company concluded its investment in Sinofert Holdings Limited (“Sinofert”) was impaired due to the significance by which fair value was below cost. As a result, an impairment loss of $341 was recognized in net income during 2012. At March 31, 2014, the company concluded its investment in Sinofert was further impaired due to the fair value declining below the carrying amount of $238 at the previous impairment date. As a result, an impairment loss of $38 was recognized in net income during the three months ended March 31, 2014. The fair value was determined through the market value of Sinofert shares on the Hong Kong Stock Exchange.
Changes in fair value, and related accounting, for the company’s investment in Sinofert since December 31, 2013 were as follows:
| Impact of Unrealized Loss on: | ||||||||||||||||
| Fair Value | Unrealized Loss |
OCI and AOCI | Net Income and Retained Earnings |
|||||||||||||
| Balance — December 31, 2013 |
$ | 254 | $ | (325 | ) | $ | 16 | $ | (341 | ) | ||||||
| Decrease in fair value and recognition of impairment |
(54 | ) | (54 | ) | (16 | ) | (38 | ) | ||||||||
| Balance — March 31, 2014 |
$ | 200 | $ | (379 | ) | $ | — | $ | (379 | ) | ||||||
| Increase in fair value subsequent to recognition of impairment |
10 | 10 | 10 | — | ||||||||||||
| Balance — June 30, 2014 |
$ | 210 | $ | (369 | ) | $ | 10 | $ | (379 | ) | ||||||
| Increase in fair value subsequent to recognition of impairment |
11 | 11 | 11 | — | ||||||||||||
| Balance — September 30, 2014 |
$ | 221 | $ | (358 | ) | $ | 21 | $ | (379 | ) | ||||||
| 7 | PotashCorp 2014 Third Quarter Quarterly Report on Form 10-Q |
4. Long-Term Debt
On March 7, 2014, the company closed the issuance of $750 of 3.625 percent senior notes due March 15, 2024. The senior notes were issued under a US shelf registration statement.
On March 7, 2014, the company issued a notice of redemption for all of its outstanding $500 of 5.250 percent senior notes due May 15, 2014. On April 7, 2014, the company completed the redemption of all $500 of the senior notes at a redemption price of 100.497 percent of the principal amount of the notes redeemed plus accrued interest.
During the third quarter of 2014, the company classified as current the $500 aggregate principal amount of 3.750 percent senior notes due September 30, 2015.
5. Share Capital
Authorized
The company is authorized to issue an unlimited number of common shares without par value and an unlimited number of first preferred shares. The common shares are not redeemable or convertible. The first preferred shares may be issued in one or more series with rights and conditions to be determined by the Board of Directors. No first preferred shares have been issued.
Issued
| Number of Common Shares |
Consideration | |||||||
| Balance — December 31, 2013 |
856,116,325 | $ | 1,600 | |||||
| Issued under option plans |
1,929,900 | 43 | ||||||
| Issued for dividend reinvestment plan |
850,412 | 30 | ||||||
| Repurchased |
(29,200,892 | ) | (53 | ) | ||||
| Balance — September 30, 2014 |
829,695,745 | $ | 1,620 | |||||
Share Repurchase Program
On July 24, 2013, the company’s Board of Directors authorized a share repurchase program of up to 5 percent of PotashCorp’s outstanding common shares (up to $2,000 of its outstanding common shares) through a normal course issuer bid. Shares could be repurchased from time to time on the open market commencing August 2, 2013 through August 1, 2014 at prevailing market prices. The timing and amount of purchases under the program were dependent upon the availability and alternative uses of capital, market conditions, applicable US and Canadian regulations and other factors. The company completed the repurchase program by June 30, 2014.
| Three Months Ended September 30 | Nine Months Ended September 30 | |||||||||||||||
| 2014 | 2013 | 2014 | 2013 | |||||||||||||
| Common shares repurchased for cancellation |
NIL | 6,300,000 | 29,200,892 | 6,300,000 | ||||||||||||
| Average price per share |
$ | — | $ | 30.95 | $ | 35.31 | $ | 30.95 | ||||||||
| Repurchase resulted in a reduction of: |
||||||||||||||||
| Share capital |
$ | — | $ | 11 | $ | 53 | $ | 11 | ||||||||
| Contributed surplus (1) |
— | 79 | 2 | 79 | ||||||||||||
| Retained earnings (1) |
— | 105 | 976 | 105 | ||||||||||||
| Total cost |
$ | — | $ | 195 | $ | 1,031 | $ | 195 | ||||||||
| (1) | The excess of net cost over the average book value of the shares. |
| PotashCorp 2014 Third Quarter Quarterly Report on Form 10-Q | 8 |
6. Segment Information
The company has three reportable operating segments: potash, nitrogen and phosphate. These reportable operating segments are differentiated by the chemical nutrient contained in the product that each produces. Inter-segment sales are made under terms that approximate market value. The accounting policies of the segments are the same as those described in Note 1 and are measured in a manner consistent with that of the financial statements. The company’s operating segments have been determined based on reports reviewed by the Chief Executive Officer, its chief operating decision-maker, that are used to make strategic decisions.
| Three Months Ended September 30, 2014 | ||||||||||||||||||||
| Potash | Nitrogen | Phosphate | All Others | Consolidated | ||||||||||||||||
| Sales — third party |
$ | 633 | $ | 562 | $ | 446 | $ | — | $ | 1,641 | ||||||||||
| Freight, transportation and distribution — third party |
(64 | ) | (30 | ) | (47 | ) | — | (141 | ) | |||||||||||
| Net sales — third party |
569 | 532 | 399 | — | ||||||||||||||||
| Cost of goods sold — third party |
(274 | ) | (314 | ) | (323 | ) | — | (911 | ) | |||||||||||
| Margin (cost) on inter-segment sales (1) |
— | 15 | (15 | ) | — | — | ||||||||||||||
| Gross margin |
295 | 233 | 61 | — | 589 | |||||||||||||||
| Depreciation and amortization in cost of goods sold |
(48 | ) | (42 | ) | (66 | ) | — | (156 | ) | |||||||||||
| Assets |
9,452 | 2,282 | 2,403 | 3,224 | 17,361 | |||||||||||||||
| Cash flows for additions to property, plant and equipment |
138 | 94 | 65 | 6 | 303 | |||||||||||||||
| (1) | Inter-segment net sales were $25. |
| Three Months Ended September 30, 2013 | ||||||||||||||||||||
| Potash | Nitrogen | Phosphate | All Others | Consolidated | ||||||||||||||||
| Sales — third party |
$ | 539 | $ | 493 | $ | 488 | $ | — | $ | 1,520 | ||||||||||
| Freight, transportation and distribution — third party |
(57 | ) | (26 | ) | (56 | ) | — | (139 | ) | |||||||||||
| Net sales — third party |
482 | 467 | 432 | — | ||||||||||||||||
| Cost of goods sold — third party |
(254 | ) | (304 | ) | (339 | ) | — | (897 | ) | |||||||||||
| Margin (cost) on inter-segment sales (1) |
— | 15 | (15 | ) | — | — | ||||||||||||||
| Gross margin |
228 | 178 | 78 | — | 484 | |||||||||||||||
| Depreciation and amortization in cost of goods sold |
(36 | ) | (41 | ) | (69 | ) | — | (146 | ) | |||||||||||
| Assets |
9,063 | 2,195 | 2,464 | 4,131 | 17,853 | |||||||||||||||
| Cash flows for additions to property, plant and equipment |
259 | 40 | 56 | 5 | 360 | |||||||||||||||
| (1) | Inter-segment net sales were $31. |
| Nine Months Ended September 30, 2014 | ||||||||||||||||||||
| Potash | Nitrogen | Phosphate | All Others | Consolidated | ||||||||||||||||
| Sales — third party |
$ | 2,051 | $ | 1,799 | $ | 1,363 | $ | — | $ | 5,213 | ||||||||||
| Freight, transportation and distribution — third party |
(229 | ) | (89 | ) | (147 | ) | — | (465 | ) | |||||||||||
| Net sales — third party |
1,822 | 1,710 | 1,216 | — | ||||||||||||||||
| Cost of goods sold — third party |
(832 | ) | (979 | ) | (1,036 | ) | — | (2,847 | ) | |||||||||||
| Margin (cost) on inter-segment sales (1) |
— | 45 | (45 | ) | — | — | ||||||||||||||
| Gross margin |
990 | 776 | 135 | — | 1,901 | |||||||||||||||
| Depreciation and amortization in cost of goods sold |
(165 | ) | (128 | ) | (234 | ) | — | (527 | ) | |||||||||||
| Assets |
9,452 | 2,282 | 2,403 | 3,224 | 17,361 | |||||||||||||||
| Cash flows for additions to property, plant and equipment |
365 | 209 | 141 | 11 | 726 | |||||||||||||||
| (1) | Inter-segment net sales were $83. |
| 9 | PotashCorp 2014 Third Quarter Quarterly Report on Form 10-Q |
| Nine Months Ended September 30, 2013 | ||||||||||||||||||||
| Potash | Nitrogen | Phosphate | All Others | Consolidated | ||||||||||||||||
| Sales — third party |
$ | 2,399 | $ | 1,781 | $ | 1,584 | $ | — | $ | 5,764 | ||||||||||
| Freight, transportation and distribution — third party |
(196 | ) | (78 | ) | (161 | ) | — | (435 | ) | |||||||||||
| Net sales — third party |
2,203 | 1,703 | 1,423 | — | ||||||||||||||||
| Cost of goods sold — third party |
(858 | ) | (1,018 | ) | (1,123 | ) | — | (2,999 | ) | |||||||||||
| Margin (cost) on inter-segment sales (1) |
— | 40 | (40 | ) | — | — | ||||||||||||||
| Gross margin |
1,345 | 725 | 260 | — | 2,330 | |||||||||||||||
| Depreciation and amortization in cost of goods sold |
(137 | ) | (121 | ) | (214 | ) | — | (472 | ) | |||||||||||
| Assets |
9,063 | 2,195 | 2,464 | 4,131 | 17,853 | |||||||||||||||
| Cash flows for additions to property, plant and equipment |
872 | 112 | 178 | 48 | 1,210 | |||||||||||||||
| (1) | Inter-segment net sales were $111. |
7. Share-Based Compensation
On May 15, 2014, the company’s shareholders approved the 2014 Performance Option Plan under which the company may, after February 20, 2014 and before January 1, 2015, grant options to acquire up to 3,500,000 common shares. Under the plan, the exercise price shall not be less than the quoted market closing price of the company’s common shares on the last trading day immediately preceding the date of the grant, and an option’s maximum term is 10 years. In general, options will vest, if at all, according to a schedule based on the three-year average excess of the company’s consolidated cash flow return on investment over weighted average cost of capital. As of September 30, 2014, options to purchase a total of 2,547,900 common shares had been granted under the plan. The weighted average fair value of options granted was $9.42 per share, estimated as of the date of grant using the Black-Scholes-Merton option-pricing model with the following weighted average assumptions:
| Exercise price per option |
$ | 37.15 | ||
| Expected annual dividend per share |
$ | 1.40 | ||
| Expected volatility |
39% | |||
| Risk-free interest rate |
1.67% | |||
| Expected life of options |
5.4 years |
8. Income Taxes
A separate estimated average annual effective tax rate was determined for each taxing jurisdiction and applied individually to the interim period pre-tax income of each jurisdiction.
| Three Months Ended September 30 | Nine Months Ended September 30 | |||||||||||||||
| 2014 | 2013 | 2014 | 2013 | |||||||||||||
| Income tax expense |
$ | 156 | $ | 116 | $ | 466 | $ | 587 | ||||||||
| Actual effective tax rate on ordinary earnings |
28% | 25% | 27% | 26% | ||||||||||||
| Actual effective tax rate including discrete items |
33% | 25% | 29% | 27% | ||||||||||||
| Discrete tax adjustments that impacted the tax rate |
$ | 25 | $ | — | $ | 21 | $ | 37 | ||||||||
Significant items to note include the following:
| Ÿ | The actual effective tax rate on ordinary earnings for the three and nine months ended September 30, 2014 increased compared to the same periods last year due to different income weightings between jurisdictions. |
| Ÿ | In third-quarter 2014, a deferred tax expense of $11 was recorded as a result of a Chilean income tax rate increase. |
| Ÿ | In first-quarter 2014, a non-tax deductible impairment of the company’s available-for-sale investment in Sinofert was recorded. This increased the actual effective tax rate including discrete items for the nine months ended September 30, 2014 by 1 percent. |
| Ÿ | In the first nine months of 2013, a tax expense of $9 (recovery of $7 in the third quarter) was recorded to adjust the 2012 income tax provision. |
| Ÿ | In second-quarter 2013, a deferred tax expense of $11 was recorded as a result of a Canadian income tax rate increase. |
| PotashCorp 2014 Third Quarter Quarterly Report on Form 10-Q | 10 |
Income tax balances within the condensed consolidated statements of financial position were comprised of the following:
| Income Tax Assets (Liabilities) | Statements of Financial Position Location | September 30, 2014 |
December 31, 2013 |
|||||||
| Current income tax assets |
||||||||||
| Current |
Receivables | $ | 70 | $ | 90 | |||||
| Non-current |
Other assets | 112 | 126 | |||||||
| Deferred income tax assets |
Other assets | 8 | 21 | |||||||
| Total income tax assets |
$ | 190 | $ | 237 | ||||||
| Current income tax liabilities |
||||||||||
| Current |
Payables and accrued charges | $ | (13 | ) | $ | (3 | ) | |||
| Non-current |
Other non-current liabilities and deferred credits | (122 | ) | (135 | ) | |||||
| Deferred income tax liabilities |
Deferred income tax liabilities | (2,150 | ) | (2,013 | ) | |||||
| Total income tax liabilities |
$ | (2,285 | ) | $ | (2,151 | ) | ||||
9. Financial Instruments
Fair Value
Estimated fair values for financial instruments are designed to approximate amounts at which the instruments could be exchanged in a current arm’s-length transaction between knowledgeable willing parties. The valuation policies and procedures for financial reporting purposes are determined by the company’s finance department.
Financial instruments included in the consolidated statements of financial position are measured either at fair value or amortized cost. The tables below explain the valuation methods used to determine the fair value of each financial instrument and its associated level in the fair value hierarchy.
| Financial Instruments Measured at Fair Value | Fair Value Method | |
| Cash and cash equivalents | Approximated carrying value. | |
| Investments in Israel Chemicals Ltd. (“ICL”) and Sinofert designated as available-for-sale | Based on the closing bid price of the common shares (Level 1) as of the statements of financial position dates. | |
| Foreign currency derivatives not traded in an active market | Determined using quoted forward exchange rates (Level 2) at the statements of financial position dates. | |
| Natural gas swaps not traded in an active market | Based on a discounted cash flow model. The inputs used in the model included contractual cash flows based on prices for natural gas futures contracts, fixed prices and notional volumes specified by the swap contracts, the time value of money, liquidity risk, the company’s own credit risk (related to instruments in a liability position) and counterparty credit risk (related to instruments in an asset position). Certain of the futures contract prices used as inputs in the model were supported by prices quoted in an active market (Level 2) and others were not based on observable market data (Level 3). For valuations that included both observable and unobservable data, if the unobservable input was determined to be significant to the overall inputs, the entire valuation was categorized in Level 3. |
| 11 | PotashCorp 2014 Third Quarter Quarterly Report on Form 10-Q |
For natural gas swaps, the primary input into the valuation model was natural gas futures prices, which were based on delivery at the Henry Hub and were observable only for up to three years in the future. The unobservable futures price range at September 30, 2014 was $4.15 to $5.01 per MMBtu (December 31, 2013 — $4.00 to $4.54 per MMBtu). Changes in the unobservable natural gas futures prices would not result in significantly higher or lower fair values as any price change would be counterbalanced by offsetting derivative positions for the majority of the company’s derivatives. Interest rates used to discount estimated cash flows at September 30, 2014 were between 0.15 percent and 3.69 percent (December 31, 2013 — between 0.17 percent and 3.59 percent) depending on the settlement date.
| Financial Instruments Measured at Amortized Cost | Fair Value Method | |
| Receivables, short-term debt and payables and accrued charges | Assumed to approximate carrying value due to their short-term nature. | |
| Long-term debt senior notes | Quoted market prices (Level 1 or 2 depending on the market liquidity of the debt). | |
| Other long-term debt instruments | Assumed to approximate carrying value. |
Presented below is a comparison of the fair value of the company’s senior notes to their carrying values.
| September 30, 2014 | December 31, 2013 | |||||||||||||||
|
Carrying Amount of Liability |
Fair Value of Liability |
Carrying Amount of Liability |
Fair Value of Liability |
|||||||||||||
| Long-term debt senior notes |
$ | 3,750 | $ | 4,152 | $ | 3,500 | $ | 3,791 | ||||||||
The following table presents the company’s fair value hierarchy for financial assets and financial liabilities carried at fair value on a recurring basis.
| Fair Value Measurements at Reporting Date Using: | ||||||||||||||||
| Carrying Amount of Asset (Liability) |
Quoted Prices in Active Markets for Identical Assets (Level 1) (1) |
Significant Other (Level 2) (1,2) |
Significant (Level 3) (2) |
|||||||||||||
| September 30, 2014 |
||||||||||||||||
| Derivative instrument assets |
||||||||||||||||
| Natural gas derivatives |
$ | 10 | $ | — | $ | (7 | ) | $ | 17 | |||||||
| Investments in ICL and Sinofert |
1,490 | 1,490 | — | — | ||||||||||||
| Derivative instrument liabilities |
||||||||||||||||
| Natural gas derivatives |
(152 | ) | — | (25 | ) | (127 | ) | |||||||||
| Foreign currency derivatives |
(4 | ) | — | (4 | ) | — | ||||||||||
| December 31, 2013 |
||||||||||||||||
| Derivative instrument assets |
||||||||||||||||
| Natural gas derivatives |
$ | 8 | $ | — | $ | — | $ | 8 | ||||||||
| Investments in ICL and Sinofert |
1,722 | 1,722 | — | — | ||||||||||||
| Derivative instrument liabilities |
||||||||||||||||
| Natural gas derivatives |
(170 | ) | — | (21 | ) | (149 | ) | |||||||||
| Foreign currency derivatives |
(1 | ) | — | (1 | ) | — | ||||||||||
| (1) | During the nine months ended September 30, 2014 and twelve months ended December 31, 2013, there were no transfers between Level 1 and Level 2. |
| (2) | During the nine months ended September 30, 2014, there were no transfers into Level 3 and $19 of losses was transferred out of Level 3 into Level 2 as (due to the passage of time) the terms of certain natural gas derivatives now matured within 36 months. During the twelve months ended December 31, 2013, there were no transfers into Level 3 and $14 of losses was transferred out of Level 3 into Level 2 as (due to the passage of time) the terms of certain natural gas derivatives now matured within 36 months. The company’s policy is to recognize transfers at the end of the reporting period. |
| PotashCorp 2014 Third Quarter Quarterly Report on Form 10-Q | 12 |
The following table presents a reconciliation of the beginning and ending balances of the company’s fair value measurements using significant unobservable inputs (Level 3):
| Natural Gas Derivatives | ||||||||
| Nine Months Ended September 30, 2014 |
Twelve Months Ended December 31, 2013 |
|||||||
| Balance, beginning of period |
$ | (141 | ) | $ | (191 | ) | ||
| Total (losses) gains (realized and unrealized) before income taxes |
||||||||
| Included in net income, within cost of goods sold |
(15 | ) | (27 | ) | ||||
| Included in other comprehensive income |
4 | 27 | ||||||
| Purchases |
— | — | ||||||
| Sales |
— | — | ||||||
| Issues |
— | — | ||||||
| Settlements |
23 | 36 | ||||||
| Transfers of losses out of Level 3 |
19 | 14 | ||||||
| Balance, end of period |
$ | (110 | ) | $ | (141 | ) | ||
| (Losses) gains for the period included in net income, within cost of goods sold, were: |
||||||||
| Change in unrealized (losses) gains relating to instruments still held at the reporting date |
$ | (1 | ) | $ | — | |||
| Total losses, realized and unrealized |
(15 | ) | (27 | ) | ||||
10. Seasonality
The company’s sales of fertilizer can be seasonal. Typically, fertilizer sales are highest in the second quarter of the year, due to the North American spring planting season. However, planting conditions and the timing of customer purchases will vary each year and sales can be expected to shift from one quarter to another.
| 13 | PotashCorp 2014 Third Quarter Quarterly Report on Form 10-Q |
| PotashCorp 2014 Third Quarter Quarterly Report on Form 10-Q | 14 |
| 15 | PotashCorp 2014 Third Quarter Quarterly Report on Form 10-Q |
Key Performance Drivers — Performance Compared to Targets
Through our integrated value model, we set, evaluate and refine our goals and priorities to drive improvements that benefit all those impacted by our business. We demonstrate our accountability by tracking and reporting our progress against targets related to each goal. Our long-term goals and 2014 targets are set out on pages 40 to 50 of our 2013 Annual Integrated Report. A summary of our progress against selected goals and representative annual targets is set out below.
| Goal | Representative 2014 Annual Target | Performance to September 30, 2014 | ||
| Create superior long-term shareholder value. | Exceed total shareholder return performance for our sector and the DAXglobal Agribusiness Index. | PotashCorp’s total shareholder return was 8 percent in the first nine months of 2014 compared to our sector’s weighted average return (based on market capitalization) of NIL percent and the DAXglobal Agribusiness Index weighted average return (based on market capitalization) of 1 percent. | ||
| Be the supplier of choice to the markets we serve. | Reduce domestic potash net rail cycle time through the Chicago corridor by 10 percent in 2014, compared to 2011 levels. | The domestic potash net rail cycle time through the Chicago corridor during the third quarter of 2014 did not show improvement to the second quarter 2014 performance or any of the prior third quarter periods. Persistent congestion created from an increase in North American rail volumes coupled with a shortage of locomotive power and crews continued to yield lower train velocity than the first nine months of 2013. Our 2014 third quarter net rail cycle time was 28 percent above the prior year third quarter and 16 percent above the 2011 benchmark quarter. For the first nine months of 2014, our domestic potash net rail cycle time through the Chicago corridor was 29 percent above the prior year period and 28 percent above the benchmark 2011 performance. We continue to work with our rail partners to increase efficiency and reduce transit times but we currently believe we will not be able to achieve the stated goal of a 10 percent reduction in net rail cycle times during the 2014 calendar year. | ||
| Attract and retain talented, motivated and productive employees who are committed to our long-term goals. | Fill 75 percent of senior staff openings with qualified internal candidates. | The percentage of senior staff positions filled internally in the first nine months of 2014 was 84 percent. | ||
| Achieve no harm to people. | Achieve zero life-altering injuries at our sites. | Tragically, we had a fatality at our Cory potash facility during the first quarter of 2014. | ||
|
Reduce total site recordable injury rate to 0.95 (per 200,000 hours worked) or lower. |
During the first nine months of 2014, total site recordable injury rate was 1.20. | |||
| Achieve no damage to the environment. | Reduce total reportable incidents (releases, permit excursions and spills) by 15 percent from 2013 levels. | Annualized total reportable incidents were up 49 percent during the first nine months of 2014 compared to 2013 annual levels. Compared to the first nine months of 2013, total reportable incidents were up 46 percent. |
| PotashCorp 2014 Third Quarter Quarterly Report on Form 10-Q | 16 |
Earnings Guidance — Third Quarter 2014
| Company Guidance | Actual Results | |||||
| Earnings per share |
$0.35 – $0.45 | $ | 0.38 | |||
Overview of Actual Results
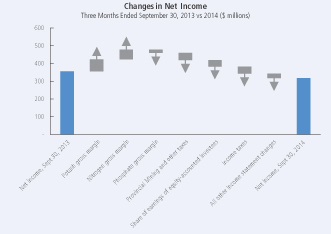
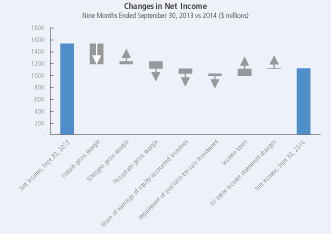
| Three Months Ended September 30 | Nine Months Ended September 30 | |||||||||||||||||||||||||||||||
| Dollars (millions) — except per-share amounts | 2014 | 2013 | Change | % Change | 2014 | 2013 | Change | % Change | ||||||||||||||||||||||||
| Sales |
$ | 1,641 | $ | 1,520 | $ | 121 | 8 | $ | 5,213 | $ | 5,764 | $ | (551 | ) | (10 | ) | ||||||||||||||||
| Gross margin |
589 | 484 | 105 | 22 | 1,901 | 2,330 | (429 | ) | (18 | ) | ||||||||||||||||||||||
| Operating income |
520 | 505 | 15 | 3 | 1,737 | 2,249 | (512 | ) | (23 | ) | ||||||||||||||||||||||
| Net income |
317 | 356 | (39 | ) | (11 | ) | 1,129 | 1,555 | (426 | ) | (27 | ) | ||||||||||||||||||||
| Net income per share — diluted |
0.38 | 0.41 | (0.03 | ) | (7 | ) | 1.33 | 1.77 | (0.44 | ) | (25 | ) | ||||||||||||||||||||
| Other comprehensive loss |
(229 | ) | (258 | ) | 29 | (11 | ) | (178 | ) | (561 | ) | 383 | (68 | ) | ||||||||||||||||||
|
|
| 17 | PotashCorp 2014 Third Quarter Quarterly Report on Form 10-Q |
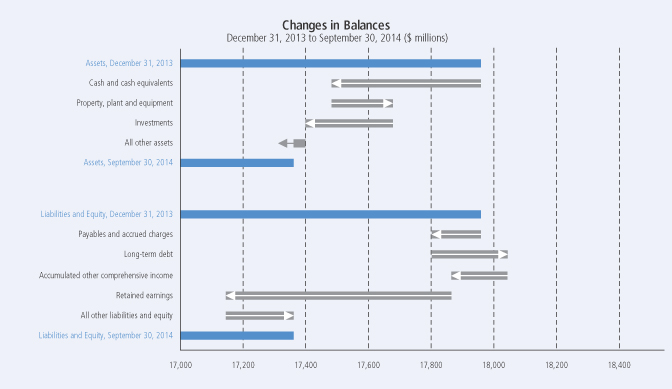
Statement of Financial Position
| PotashCorp 2014 Third Quarter Quarterly Report on Form 10-Q | 18 |
The most significant contributors to the changes in our statements of financial position were as follows (direction of arrows refers to increase or decrease):
| Assets | Liabilities | |
|
h Property, plant and equipment increased primarily due to our previously announced potash and nitrogen capacity expansions and other potash projects, partially offset by routine and accelerated depreciation.
i Available-for-sale investments were mainly impacted by the lower fair value of our investment in ICL. |
h Short-term debt and current portion of long-term debt increased due to the reclassification of $500 million in senior notes due September 30, 2015 as current in the third quarter of 2014 and an increase in commercial paper outstanding, partially offset by the redemption of $500 million in senior notes in the second quarter of 2014.
i Payables and accrued charges were lower largely due to reduced capital spending and share repurchase payables outstanding at December 31, 2013.
h Long-term debt was higher as a result of the issuance of $750 million in senior notes in the first quarter of 2014, partially offset by our senior notes due September 30, 2015 being classified as current during the third quarter of 2014. |
| Equity |
| i Equity was mainly impacted by net income (discussed in more detail above), dividends declared and common shares repurchased for cancellation (see Note 5 to the financial statements in this Form 10-Q) during the first nine months of 2014. |
| 19 | PotashCorp 2014 Third Quarter Quarterly Report on Form 10-Q |
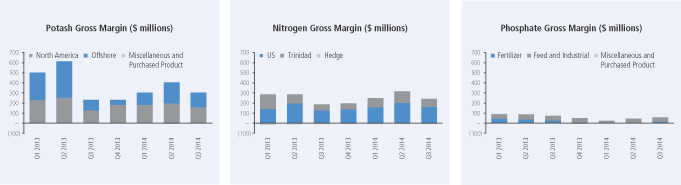
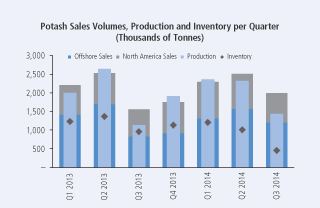
Potash
Potash Financial Performance
| Three Months Ended September 30 | ||||||||||||||||||||||||||||||||||||
| Dollars (millions) | Tonnes (thousands) | Average per Tonne (1) | ||||||||||||||||||||||||||||||||||
| 2014 | 2013 | % Change | 2014 | 2013 | % Change | 2014 | 2013 | % Change | ||||||||||||||||||||||||||||
| Manufactured product |
||||||||||||||||||||||||||||||||||||
| Net sales |
||||||||||||||||||||||||||||||||||||
| North America |
$ | 272 | $ | 240 | 13 | 789 | 721 | 9 | $ | 344 | $ | 333 | 3 | |||||||||||||||||||||||
| Offshore |
293 | 240 | 22 | 1,221 | 843 | 45 | $ | 240 | $ | 285 | (16 | ) | ||||||||||||||||||||||||
| 565 | 480 | 18 | 2,010 | 1,564 | 29 | $ | 281 | $ | 307 | (8 | ) | |||||||||||||||||||||||||
| Cost of goods sold |
(264 | ) | (248 | ) | 6 | $ | (131 | ) | $ | (159 | ) | (18 | ) | |||||||||||||||||||||||
| Gross margin |
301 | 232 | 30 | $ | 150 | $ | 148 | 1 | ||||||||||||||||||||||||||||
|
Other miscellaneous and purchased product gross margin (2) |
(6 | ) | (4 | ) | 50 | |||||||||||||||||||||||||||||||
| Gross Margin |
$ | 295 | $ | 228 | 29 | $ | 147 | $ | 146 | 1 | ||||||||||||||||||||||||||
| (1) | Rounding differences may occur due to the use of whole dollars in per-tonne calculations. |
| (2) | Comprised of net sales of $4 million (2013 — $2 million) less cost of goods sold of $10 million (2013 — $6 million). |
| Nine Months Ended September 30 | ||||||||||||||||||||||||||||||||||||
| Dollars (millions) | Tonnes (thousands) | Average per Tonne (1) | ||||||||||||||||||||||||||||||||||
| 2014 | 2013 | % Change | 2014 | 2013 | % Change | 2014 | 2013 | % Change | ||||||||||||||||||||||||||||
| Manufactured product |
||||||||||||||||||||||||||||||||||||
| Net sales |
||||||||||||||||||||||||||||||||||||
| North America |
$ | 866 | $ | 923 | (6 | ) | 2,720 | 2,349 | 16 | $ | 318 | $ | 393 | (19 | ) | |||||||||||||||||||||
| Offshore |
942 | 1,271 | (26 | ) | 4,126 | 3,986 | 4 | $ | 228 | $ | 319 | (29 | ) | |||||||||||||||||||||||
| 1,808 | 2,194 | (18 | ) | 6,846 | 6,335 | 8 | $ | 264 | $ | 346 | (24 | ) | ||||||||||||||||||||||||
| Cost of goods sold |
(799 | ) | (842 | ) | (5 | ) | $ | (117 | ) | $ | (133 | ) | (12 | ) | ||||||||||||||||||||||
| Gross margin |
1,009 | 1,352 | (25 | ) | $ | 147 | $ | 213 | (31 | ) | ||||||||||||||||||||||||||
|
Other miscellaneous and purchased product gross margin (2) |
(19 | ) | (7 | ) | 171 | |||||||||||||||||||||||||||||||
| Gross Margin |
$ | 990 | $ | 1,345 | (26 | ) | $ | 145 | $ | 212 | (32 | ) | ||||||||||||||||||||||||
| (1) | Rounding differences may occur due to the use of whole dollars in per-tonne calculations. |
| (2) | Comprised of net sales of $14 million (2013 — $9 million) less cost of goods sold of $33 million (2013 — $16 million). |
Potash gross margin variance attributable to:
| Three Months Ended September 30 2014 vs. 2013 |
Nine Months Ended September 30 2014 vs. 2013 |
|||||||||||||||||||||||||||||||
| Change in Prices/Costs |
Change in Prices/Costs |
|||||||||||||||||||||||||||||||
| Dollars (millions) | Change in Sales Volumes |
Net Sales |
Cost of Goods Sold |
Total | Change in Sales Volumes |
Net Sales |
Cost of Goods Sold |
Total | ||||||||||||||||||||||||
| Manufactured product |
||||||||||||||||||||||||||||||||
| North America |
$ | 13 | $ | 13 | $ | 7 | $ | 33 | $ | 114 | $ | (203 | ) | $ | 16 | $ | (73 | ) | ||||||||||||||
| Offshore |
90 | (69 | ) | 15 | 36 | 33 | (373 | ) | 70 | (270 | ) | |||||||||||||||||||||
| Change in market mix |
13 | (12 | ) | (1 | ) | — | (14 | ) | 13 | 1 | — | |||||||||||||||||||||
| Total manufactured product |
$ | 116 | $ | (68 | ) | $ | 21 | $ | 69 | $ | 133 | $ | (563 | ) | $ | 87 | (343 | ) | ||||||||||||||
| Other miscellaneous and purchased product |
(2 | ) | (12 | ) | ||||||||||||||||||||||||||||
| Total |
$ | 67 | $ | (355 | ) | |||||||||||||||||||||||||||
| PotashCorp 2014 Third Quarter Quarterly Report on Form 10-Q | 20 |
|
|
Offshore sales to major markets, by percentage of sales volumes, were as follows:
| Three Months Ended September 30 | Nine Months Ended September 30 | |||||||||||||||||||||||||||||||||||||||||||||||
| By Canpotex (1) | From New Brunswick | By Canpotex (1) | From New Brunswick | |||||||||||||||||||||||||||||||||||||||||||||
| 2014 | 2013 | % Change | 2014 | 2013 | % Change | 2014 | 2013 | % Change | 2014 | 2013 | % Change | |||||||||||||||||||||||||||||||||||||
| Other Asian countries (2) |
38 | 39 | (3 | ) | — | — | — | 42 | 41 | 2 | — | — | — | |||||||||||||||||||||||||||||||||||
| Latin America |
32 | 34 | (6 | ) | 100 | 100 | — | 29 | 28 | 4 | 100 | 100 | — | |||||||||||||||||||||||||||||||||||
| China |
9 | 8 | 13 | — | — | — | 13 | 17 | (24 | ) | — | — | — | |||||||||||||||||||||||||||||||||||
| India |
14 | 9 | 56 | — | — | — | 9 | 8 | 13 | — | — | — | ||||||||||||||||||||||||||||||||||||
| Oceania, Europe and Other |
7 | 10 | (30 | ) | — | — | — | 7 | 6 | 17 | — | — | — | |||||||||||||||||||||||||||||||||||
| 100 | 100 | 100 | 100 | 100 | 100 | 100 | 100 | |||||||||||||||||||||||||||||||||||||||||
| (1) | Canpotex Limited (Canpotex). |
| (2) | All Asian countries except China and India. |
The most significant contributors to the change in total gross margin quarter over quarter were as follows (direction of arrows refers to impact on gross margin):
| Net Sales Prices | Sales Volumes | Cost of Goods Sold | ||
| i Our average realized potash price trailed last year’s third quarter due to lower offshore prices as the sharp decline through the final half of 2013 had yet to be fully reflected in prior-period results. A greater proportion of sales to lower-priced offshore markets also had a negative impact. |
h Offshore sales volumes were up as the comparative period in 2013 saw significantly more volatility and uncertainty.
h In North America, sales volumes increased as customers took deliveries in anticipation of strong farmer demand to replenish crop nutrients following an expected record harvest. |
h Costs were lower due to our workforce reduction and operational changes announced in December 2013 along with our decision to optimize production at our lowest cost facility.
h The Canadian dollar weakened relative to the US dollar, reducing cost of goods sold. |
| 21 | PotashCorp 2014 Third Quarter Quarterly Report on Form 10-Q |
The most significant contributors to the change in total gross margin year over year were as follows (direction of arrows refers to impact on gross margin):
| Net Sales Prices | Sales Volumes | Cost of Goods Sold | ||
| i Potash prices were lower as the sharp decline during the second half of 2013 weighed on price realizations, though prices rose compared to the trailing quarters due to tighter supplies and record global demand. |
h North American totals were up due to low distributor inventories at the start of the year, higher acreage and application rates and earlier second-half customer engagement for the fall application season.
h Our offshore sales volumes rose due to increased demand but were constrained by limited product availability in the third quarter of 2014 and rail constraints in the first half of 2014. |
h Shutdown weeks were lower in 2014 (14 shutdown weeks) compared to 2013 (32 shutdown weeks) primarily as a result of our strategy to match production with demand in 2013.
h Costs were lower due to our workforce reduction and operational changes announced in December 2013 along with our decision to optimize production at our lowest cost facility.
h The Canadian dollar weakened relative to the US dollar, reducing cost of goods sold.
h More product from our lower-cost mines was sold to offshore customers resulting in a higher cost of goods sold variance. | ||
Potash Non-Financial Performance
| Three Months Ended September 30 | Nine Months Ended September 30 | |||||||||||||||||||||||||
| 2014 | 2013 | % Change | 2014 | 2013 | % Change | |||||||||||||||||||||
| Production |
KCl tonnes produced (thousands) |
1,453 | 1,150 | 26 | 6,169 | 5,852 | 5 | |||||||||||||||||||
| Safety |
Total site recordable injury rate |
2.53 | 1.75 | 45 | 1.96 | 1.45 | 35 | |||||||||||||||||||
| Life-altering injuries |
— | — | — | 1 | — | n/m | ||||||||||||||||||||
| Employee |
Percentage of senior staff positions filled internally |
100% | 100% | — | 100% | 100% | — | |||||||||||||||||||
| Environmental |
Waste (million tonnes) |
3.6 | 2.8 | 29 | 12.9 | 13.2 | (2 | ) | ||||||||||||||||||
| Environmental incidents |
3 | 3 | — | 12 | 11 | 9 | ||||||||||||||||||||
| n/m | = not meaningful |
| PotashCorp 2014 Third Quarter Quarterly Report on Form 10-Q | 22 |
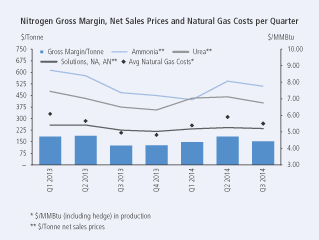
Nitrogen
Nitrogen Financial Performance
| Three Months Ended September 30 | ||||||||||||||||||||||||||||||||||||
| Dollars (millions) | Tonnes (thousands) | Average per Tonne (1) | ||||||||||||||||||||||||||||||||||
| 2014 | 2013 | % Change | 2014 | 2013 | % Change | 2014 | 2013 | % Change | ||||||||||||||||||||||||||||
| Manufactured product (2) |
||||||||||||||||||||||||||||||||||||
| Net sales |
||||||||||||||||||||||||||||||||||||
| Ammonia |
$ | 269 | $ | 239 | 13 | 528 | 512 | 3 | $ | 509 | $ | 468 | 9 | |||||||||||||||||||||||
| Urea |
100 | 82 | 22 | 248 | 218 | 14 | $ | 402 | $ | 376 | 7 | |||||||||||||||||||||||||
| Solutions, Nitric acid, Ammonium nitrate |
182 | 158 | 15 | 773 | 700 | 10 | $ | 236 | $ | 226 | 4 | |||||||||||||||||||||||||
| 551 | 479 | 15 | 1,549 | 1,430 | 8 | $ | 356 | $ | 335 | 6 | ||||||||||||||||||||||||||
| Cost of goods sold |
(322 | ) | (304 | ) | 6 | $ | (209 | ) | $ | (212 | ) | (1 | ) | |||||||||||||||||||||||
| Gross margin |
229 | 175 | 31 | $ | 147 | $ | 123 | 20 | ||||||||||||||||||||||||||||
| Other miscellaneous and purchased product gross margin (3) |
4 | 3 | 33 | |||||||||||||||||||||||||||||||||
| Gross Margin |
$ | 233 | $ | 178 | 31 | $ | 150 | $ | 124 | 21 | ||||||||||||||||||||||||||
| (1) | Rounding differences may occur due to the use of whole dollars in per-tonne calculations. |
| (2) | Includes inter-segment ammonia sales, comprised of: net sales $25 million, cost of goods sold $10 million and 41,000 sales tonnes (2013 — net sales $29 million, cost of goods sold $14 million and 57,000 sales tonnes). Inter-segment profits are eliminated on consolidation. |
| (3) | Comprised of third-party and inter-segment sales, including: third-party net sales $6 million less cost of goods sold $2 million (2013 — net sales $17 million less cost of goods sold $14 million) and inter-segment net sales $NIL million less cost of goods sold $NIL million (2013 — net sales $2 million less cost of goods sold $2 million). Inter-segment profits are eliminated on consolidation. |
| Nine Months Ended September 30 | ||||||||||||||||||||||||||||||||||||
| Dollars (millions) | Tonnes (thousands) | Average per Tonne (1) | ||||||||||||||||||||||||||||||||||
| 2014 | 2013 | % Change | 2014 | 2013 | % Change | 2014 | 2013 | % Change | ||||||||||||||||||||||||||||
| Manufactured product (2) |
||||||||||||||||||||||||||||||||||||
| Net sales |
||||||||||||||||||||||||||||||||||||
| Ammonia |
$ | 875 | $ | 899 | (3 | ) | 1,776 | 1,620 | 10 | $ | 493 | $ | 555 | (11 | ) | |||||||||||||||||||||
| Urea |
364 | 347 | 5 | 854 | 800 | 7 | $ | 426 | $ | 433 | (2 | ) | ||||||||||||||||||||||||
| Solutions, Nitric acid, Ammonium nitrate |
526 | 489 | 8 | 2,211 | 1,978 | 12 | $ | 238 | $ | 247 | (4 | ) | ||||||||||||||||||||||||
| 1,765 | 1,735 | 2 | 4,841 | 4,398 | 10 | $ | 365 | $ | 395 | (8 | ) | |||||||||||||||||||||||||
| Cost of goods sold |
(1,001 | ) | (1,019 | ) | (2 | ) | $ | (207 | ) | $ | (232 | ) | (11 | ) | ||||||||||||||||||||||
| Gross margin |
764 | 716 | 7 | $ | 158 | $ | 163 | (3 | ) | |||||||||||||||||||||||||||
|
Other miscellaneous and purchased product gross margin (3) |
12 | 9 | 33 | |||||||||||||||||||||||||||||||||
| Gross Margin |
$ | 776 | $ | 725 | 7 | $ | 160 | $ | 165 | (3 | ) | |||||||||||||||||||||||||
| (1) | Rounding differences may occur due to the use of whole dollars in per-tonne calculations. |
| (2) | Includes inter-segment ammonia sales, comprised of: net sales $81 million, cost of goods sold $36 million and 141,000 sales tonnes (2013 — net sales $79 million, cost of goods sold $39 million and 136,000 sales tonnes). Inter-segment profits are eliminated on consolidation. |
| (3) | Comprised of third-party and inter-segment sales, including: third-party net sales $26 million less cost of goods sold $14 million (2013 — net sales $47 million less cost of goods sold $38 million) and inter-segment net sales $2 million less cost of goods sold $2 million (2013 — net sales $32 million less cost of goods sold $32 million). Inter-segment profits are eliminated on consolidation. |
| 23 | PotashCorp 2014 Third Quarter Quarterly Report on Form 10-Q |
Nitrogen gross margin variance attributable to:
| Three Months Ended September 30 2014 vs. 2013 |
Nine Months Ended September 30 2014 vs. 2013 |
|||||||||||||||||||||||||||||||
| Change in Prices/Costs |
Change in Prices/Costs |
|||||||||||||||||||||||||||||||
| Dollars (millions) | Change in Sales Volumes |
Net Sales |
Cost of Goods Sold |
Total | Change in Sales Volumes |
Net Sales |
Cost of Goods Sold |
Total | ||||||||||||||||||||||||
| Manufactured product |
||||||||||||||||||||||||||||||||
| Ammonia |
$ | 1 | $ | 26 | $ | (1 | ) | $ | 26 | $ | 56 | $ | (112 | ) | $ | 41 | $ | (15 | ) | |||||||||||||
| Urea |
8 | 5 | (1 | ) | 12 | 14 | (6 | ) | 3 | 11 | ||||||||||||||||||||||
| Solutions, NA, AN |
11 | 9 | (5 | ) | 15 | 26 | (21 | ) | 39 | 44 | ||||||||||||||||||||||
| Hedge |
— | — | 1 | 1 | — | — | 8 | 8 | ||||||||||||||||||||||||
| Change in product mix |
6 | (6 | ) | — | — | 6 | (6 | ) | — | — | ||||||||||||||||||||||
| Total manufactured product |
$ | 26 | $ | 34 | $ | (6 | ) | 54 | $ | 102 | $ | (145 | ) | $ | 91 | 48 | ||||||||||||||||
| Other miscellaneous and purchased product |
1 | 3 | ||||||||||||||||||||||||||||||
| Total |
$ | 55 | $ | 51 | ||||||||||||||||||||||||||||
|
|
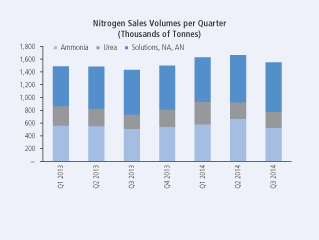
| Three Months Ended September 30 | Nine Months Ended September 30 | |||||||||||||||||||||||||||||||
| Sales Tonnes (thousands) |
Price per Tonne | Sales Tonnes (thousands) |
Price per Tonne | |||||||||||||||||||||||||||||
| 2014 | 2013 | 2014 | 2013 | 2014 | 2013 | 2014 | 2013 | |||||||||||||||||||||||||
| Fertilizer |
571 | 463 | $ | 339 | $ | 335 | 1,699 | 1,361 | $ | 377 | $ | 416 | ||||||||||||||||||||
| Industrial and Feed |
978 | 967 | $ | 365 | $ | 335 | 3,142 | 3,037 | $ | 358 | $ | 385 | ||||||||||||||||||||
| 1,549 | 1,430 | $ | 356 | $ | 335 | 4,841 | 4,398 | $ | 365 | $ | 395 | |||||||||||||||||||||
| PotashCorp 2014 Third Quarter Quarterly Report on Form 10-Q | 24 |
The most significant contributors to the change in total gross margin quarter over quarter were as follows (direction of arrows refers to impact on gross margin):
| Net Sales Prices | Sales Volumes | |||
| h With key benchmark pricing at higher levels, our average realized price increased. |
h Improved production levels across all nitrogen facilities more than offset losses from gas curtailments in Trinidad. |
The most significant contributors to the change in total gross margin year over year were as follows (direction of arrows refers to impact on gross margin):
| Net Sales Prices | Sales Volumes | Cost of Goods Sold | ||
| i Ammonia prices fell as strong demand and supply challenges in key producing regions were more prevalent in 2013 than 2014. |
h Ammonia volumes were up due to the availability of production at Geismar and Augusta in 2014 (both projects began producing part-way through the first half of 2013) compared to the same period in 2013, which also led to an increase in saleable downstream products. |
i Average costs, including our hedge position, for natural gas used as feedstock in production increased 1 percent. Costs for natural gas used as feedstock in Trinidad production fell 6 percent (contract price indexed, in part, to Tampa ammonia prices) while our US spot costs for natural gas increased 20 percent. Including losses on our hedge position, US gas prices rose 13 percent.
h The cost of goods sold variance for ammonia mainly reflected lower costs in 2014 for natural gas used as feedstock in Trinidad production compared to 2013, partially offset by higher US natural gas costs in 2014 compared to 2013. This affected ammonia to a greater extent than urea.
h The cost of goods sold variance was better for solutions, nitric acid and ammonium nitrate due mainly to the impact of costs associated with Geismar in 2013 that did not repeat in 2014. |
Nitrogen Non-Financial Performance
| Three Months Ended September 30 |
Nine Months Ended September 30 |
|||||||||||||||||||||||||
| 2014 | 2013 | % Change | 2014 | 2013 | % Change | |||||||||||||||||||||
| Production |
N tonnes produced (thousands) |
787 | 705 | 12 | 2,450 | 2,155 | 14 | |||||||||||||||||||
| Safety |
Total site recordable injury rate |
0.71 | 0.76 | (7 | ) | 0.51 | 0.63 | (19 | ) | |||||||||||||||||
| Employee |
Percentage of senior staff positions filled internally |
n/a | n/a | n/a | 100% | 100% | — | |||||||||||||||||||
| Environmental |
Greenhouse gas emissions (CO2 equivalent tonnes/tonne of product) |
2.3 | 2.4 | (4 | ) | 2.3 | 2.3 | — | ||||||||||||||||||
| Environmental incidents |
3 | — | n/m | 4 | 1 | 300 | ||||||||||||||||||||
n/a = not applicable as there were no senior staff positions filled during the period
n/m = not meaningful
| 25 | PotashCorp 2014 Third Quarter Quarterly Report on Form 10-Q |
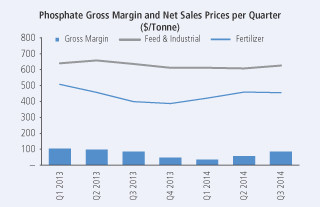
Phosphate
Phosphate Financial Performance
| Three Months Ended September 30 | ||||||||||||||||||||||||||||||||||||
| Dollars (millions) | Tonnes (thousands) | Average per Tonne (1) | ||||||||||||||||||||||||||||||||||
| 2014 | 2013 | % Change | 2014 | 2013 | % Change | 2014 | 2013 | % Change | ||||||||||||||||||||||||||||
| Manufactured product |
||||||||||||||||||||||||||||||||||||
| Net sales |
||||||||||||||||||||||||||||||||||||
| Fertilizer |
$ | 201 | $ | 250 | (20 | ) | 445 | 634 | (30 | ) | $ | 452 | $ | 395 | 14 | |||||||||||||||||||||
| Feed and Industrial |
174 | 176 | (1 | ) | 280 | 279 | — | $ | 621 | $ | 631 | (2 | ) | |||||||||||||||||||||||
| 375 | 426 | (12 | ) | 725 | 913 | (21 | ) | $ | 517 | $ | 467 | 11 | ||||||||||||||||||||||||
| Cost of goods sold |
(317 | ) | (351 | ) | (10 | ) | $ | (437 | ) | $ | (384 | ) | 14 | |||||||||||||||||||||||
| Gross margin |
58 | 75 | (23 | ) | $ | 80 | $ | 83 | (4 | ) | ||||||||||||||||||||||||||
| Other miscellaneous and purchased product gross margin (2) |
3 | 3 | — | |||||||||||||||||||||||||||||||||
| Gross Margin |
$ | 61 | $ | 78 | (22 | ) | $ | 84 | $ | 85 | (1 | ) | ||||||||||||||||||||||||
| (1) | Rounding differences may occur due to the use of whole dollars in per-tonne calculations. |
| (2) | Comprised of net sales of $24 million (2013 — $6 million) less cost of goods sold of $21 million (2013 — $3 million). |
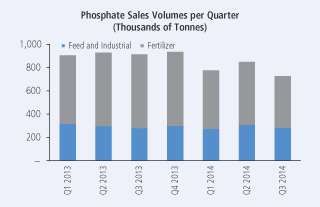
| Nine Months Ended September 30 | ||||||||||||||||||||||||||||||||||||
| Dollars (millions) | Tonnes (thousands) | Average per Tonne (1) | ||||||||||||||||||||||||||||||||||
| 2014 | 2013 | % Change | 2014 | 2013 | % Change | 2014 | 2013 | % Change | ||||||||||||||||||||||||||||
| Manufactured product |
||||||||||||||||||||||||||||||||||||
| Net sales |
||||||||||||||||||||||||||||||||||||
| Fertilizer |
$ | 656 | $ | 835 | (21 | ) | 1,486 | 1,859 | (20 | ) | $ | 441 | $ | 449 | (2 | ) | ||||||||||||||||||||
| Feed and Industrial |
526 | 568 | (7 | ) | 862 | 887 | (3 | ) | $ | 610 | $ | 640 | (5 | ) | ||||||||||||||||||||||
| 1,182 | 1,403 | (16 | ) | 2,348 | 2,746 | (14 | ) | $ | 503 | $ | 511 | (2 | ) | |||||||||||||||||||||||
| Cost of goods sold |
(1,055 | ) | (1,153 | ) | (8 | ) | $ | (449 | ) | $ | (420 | ) | 7 | |||||||||||||||||||||||
| Gross margin |
127 | 250 | (49 | ) | $ | 54 | $ | 91 | (41 | ) | ||||||||||||||||||||||||||
| Other miscellaneous and purchased product gross margin (2) |
8 | 10 | (20 | ) | ||||||||||||||||||||||||||||||||
| Gross Margin |
$ | 135 | $ | 260 | (48 | ) | $ | 57 | $ | 95 | (40 | ) | ||||||||||||||||||||||||
| (1) | Rounding differences may occur due to the use of whole dollars in per-tonne calculations. |
| (2) | Comprised of net sales of $34 million (2013 — $20 million) less cost of goods sold of $26 million (2013 — $10 million). |
Phosphate gross margin variance attributable to:
| Three Months Ended September 30 2014 vs. 2013 |
Nine Months Ended September 30 2014 vs. 2013 |
|||||||||||||||||||||||||||||||
| Change in Prices/Costs |
Change in Prices/Costs |
|||||||||||||||||||||||||||||||
| Dollars (millions) | Change in Sales Volumes |
Net Sales |
Cost of Goods Sold |
Total | Change in Sales Volumes |
Net Sales |
Cost of Goods Sold |
Total | ||||||||||||||||||||||||
| Manufactured product |
||||||||||||||||||||||||||||||||
| Fertilizer |
$ | (14 | ) | $ | 28 | $ | (25 | ) | $ | (11 | ) | $ | (31 | ) | $ | (14 | ) | $ | (47 | ) | $ | (92 | ) | |||||||||
| Feed and Industrial |
2 | (1 | ) | (7 | ) | (6 | ) | (8 | ) | (23 | ) | — | (31 | ) | ||||||||||||||||||
| Change in product mix |
(13 | ) | 13 | — | — | (19 | ) | 19 | — | — | ||||||||||||||||||||||
| Total manufactured product |
$ | (25 | ) | $ | 40 | $ | (32 | ) | (17 | ) | $ | (58 | ) | $ | (18 | ) | $ | (47 | ) | (123 | ) | |||||||||||
| Other miscellaneous and purchased product |
— | (2 | ) | |||||||||||||||||||||||||||||
| Total |
$ | (17 | ) | $ | (125 | ) | ||||||||||||||||||||||||||
| PotashCorp 2014 Third Quarter Quarterly Report on Form 10-Q | 26 |
|
|
The most significant contributors to the change in total gross margin quarter over quarter were as follows (direction of arrows refers to impact on gross margin):
| Net Sales Prices | Sales Volumes | Cost of Goods Sold | ||||||||||||
|
h |
Our average realized phosphate price increased largely due to a greater proportion of our production being allocated to higher-netback feed and industrial products, in addition to improved prices for our fertilizer products because of better market fundamentals. | i | The closure in July of our Suwannee River chemical plant, combined with mechanical challenges at our White Springs facility, constrained the number of tonnes available for sale. | i | Depreciation was higher due to accelerated depreciation related to fertilizer as a result of operational changes announced in the fourth quarter of 2013 prior to the closure of the Suwannee River chemical plant at our White Springs facility at the end of July 2014.
| |||||||||
| i | Unfavorable adjustments to our asset retirement obligations occurred in 2014 (due to a decrease in relevant discount rates) while favorable adjustments occurred in 2013 (due to an increase in relevant discount rates).
| |||||||||||||
The most significant contributors to the change in total gross margin year over year were as follows (direction of arrows refers to impact on gross margin):
| Net Sales Prices | Sales Volumes | Cost of Goods Sold | ||||||||||||
|
i |
Industrial prices were down due to certain contracts being tied to input costs on a lagging basis. |
i | Volumes fell as weather-related production issues, logistical issues and an extended plant turnaround at White Springs in the third quarter of 2014 reduced operating rates across all our facilities and constrained our sales. | i
|
|
|
Depreciation was higher due to accelerated depreciation related to fertilizer as a result of operational changes announced in the fourth quarter of 2013.
| |||||||
| h | Sulfur costs were down 19 percent and ammonia costs were down 10 percent, reducing our cost of goods sold. | |||||||||||||
| i | Unfavorable adjustments to our asset retirement obligations occurred in 2014 while favorable adjustments occurred in 2013 as a result of changes in the relevant discount rates. | |||||||||||||
Phosphate Non-Financial Performance
| Three Months Ended September 30 | Nine Months Ended September 30 | |||||||||||||||||||||||||
| 2014 | 2013 | % Change | 2014 | 2013 | % Change | |||||||||||||||||||||
| Production |
P2O5 tonnes produced (thousands) |
431 | 533 | (19 | ) | 1,259 | 1,553 | (19 | ) | |||||||||||||||||
|
P2O5 operating rate percentage |
83% | 90% | (8 | ) | 74% | 87% | (15 | ) | ||||||||||||||||||
| Safety |
Total site recordable injury rate |
0.59 | 1.35 | (56 | ) | 1.12 | 1.07 | 5 | ||||||||||||||||||
| Employee |
Percentage of senior staff positions filled internally |
60% | 100% | (40 | ) | 81% | 72% | 13 | ||||||||||||||||||
| Environmental |
Water usage (m3 per tonne of product) |
25 | 28 | (11 | ) | 26 | 29 | (10 | ) | |||||||||||||||||
| Recycled water used in operations (percentage) |
95% | 94% | 1 | 95% | 94% | 1 | ||||||||||||||||||||
| Environmental incidents |
2 | — | n/m | 3 | 1 | 200 | ||||||||||||||||||||
n/m = not meaningful
| 27 | PotashCorp 2014 Third Quarter Quarterly Report on Form 10-Q |
Other Expenses and Income
| Three Months Ended September 30 | Nine Months Ended September 30 | |||||||||||||||||||||||||||||||
| Dollars (millions) | 2014 | 2013 | Change | % Change | 2014 | 2013 | Change | % Change | ||||||||||||||||||||||||
| Selling and administrative expenses |
$ | (49 | ) | $ | (48 | ) | $ | (1 | ) | 2 | $ | (172 | ) | $ | (165 | ) | $ | (7 | ) | 4 | ||||||||||||
| Provincial mining and other taxes |
(52 | ) | (10 | ) | (42 | ) | 420 | (175 | ) | (154 | ) | (21 | ) | 14 | ||||||||||||||||||
| Share of earnings of equity-accounted investees |
20 | 57 | (37 | ) | (65 | ) | 85 | 174 | (89 | ) | (51 | ) | ||||||||||||||||||||
| Dividend income |
7 | 31 | (24 | ) | (77 | ) | 100 | 85 | 15 | 18 | ||||||||||||||||||||||
| Impairment of available-for-sale investment |
— | — | — | n/m | (38 | ) | — | (38 | ) | n/m | ||||||||||||||||||||||
| Other income (expenses) |
5 | (9 | ) | 14 | n/m | 36 | (21 | ) | 57 | n/m | ||||||||||||||||||||||
| Finance costs |
(47 | ) | (33 | ) | (14 | ) | 42 | (142 | ) | (107 | ) | (35 | ) | 33 | ||||||||||||||||||
| Income taxes |
(156 | ) | (116 | ) | (40 | ) | 34 | (466 | ) | (587 | ) | 121 | (21 | ) | ||||||||||||||||||
n/m = not meaningful
| PotashCorp 2014 Third Quarter Quarterly Report on Form 10-Q | 28 |
Weighted average debt obligations outstanding and the associated interest rates were as follows:
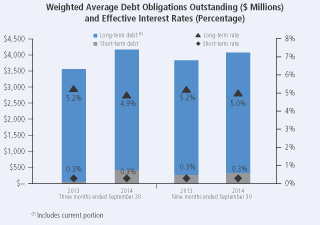
For the third quarter, income taxes increased due to a higher actual effective tax rate on ordinary earnings and higher discrete tax adjustments. For the first nine months of the year, income taxes decreased due to lower ordinary earnings before taxes and discrete tax adjustments partially offset by a higher actual effective tax rate on ordinary earnings. Effective tax rates and discrete items were as follows:
| Three Months Ended September 30 |
Nine Months Ended September 30 |
|||||||||||||||
| Dollars (millions), except percentage amounts | 2014 | 2013 | 2014 | 2013 | ||||||||||||
| Actual effective tax rate on ordinary earnings |
28% | 25% | 27% | 26% | ||||||||||||
| Actual effective tax rate including discrete items |
33% | 25% | 29% | 27% | ||||||||||||
| Discrete tax adjustments that impacted the rate |
$ | (25 | ) | $ | — | $ | (21 | ) | $ | (37 | ) | |||||
Significant items to note are described in Note 8 to the financial statements in this Form 10-Q.
For the first nine months of 2014, 70 percent of the effective tax rate on the current year’s ordinary earnings pertained to current income taxes (2013 — 50 percent) and 30 percent related to deferred income taxes (2013 — 50 percent). The increase in the current portion was largely due to lower tax depreciation.
Liquidity and Capital Resources
Cash Requirements
Contractual Obligations and Other Commitments
Our contractual obligations and other commitments detailed on pages 84 and 85 of our 2013 Annual Integrated Report summarize certain of our liquidity and capital resource requirements, excluding obligations that have original maturities of less than one year, planned (but not legally committed) capital expenditures or potential share repurchases. Significant items during 2014 that affected our contractual obligations and other commitments were as follows as of September 30, 2014:
| Ÿ | The issuance of 3.625 percent senior notes due March 15, 2024 during the first quarter of 2014 increased our long-term debt obligations by $750 million and estimated annual interest payments by $27 million |
| Ÿ | During the second quarter of 2014, the company completed the early redemption of all its outstanding $500 million of 5.250 percent senior notes due May 15, 2014. |
| Ÿ | During the third quarter of 2014, the company entered into a purchase commitment for certain phosphate products with OCP S.A. for specified purchase quantities and prices based on market rates at the time of delivery. The purchase commitment was approximately $445 million based on expected contract prices and expires in 2016. |
Capital Expenditures
Based on anticipated exchange rates, during 2014 we expect to incur capital expenditures, including capitalized interest, of approximately $555 million for opportunity capital and approximately $575 million to sustain operations at existing levels and for major repairs and maintenance (including plant turnarounds).
| 29 | PotashCorp 2014 Third Quarter Quarterly Report on Form 10-Q |
Page 62 of our 2013 Annual Integrated Report outlines key potash construction projects and their expected total cost, as well as the impact of these projects on capacity expansion/debottlenecking and any expected remaining spending on each project still in progress. The most significant of these potash projects(1) on which funds are expected to be spent in 2014, excluding capitalized interest, are outlined in the table below:
| CDN Dollars (billions) | 2014 Forecast | Total Forecast (2) | Started | Expected Completion (3) (Description) |
Forecasted Remaining Spending (after 2014) (2) |
|||||||||||||
| New Brunswick |
$ | 0.1 | $ | 2.2 | 2007 | 2014 (mine shaft and mill) | $ | 0.3 | ||||||||||
| Rocanville, Saskatchewan |
$ | 0.2 | $ | 2.8 | 2008 | 2015 (mine shaft and mill) | $ | — | ||||||||||
| (1) | The expansion at each of these projects is discussed in the technical report for such project filed on SEDAR in accordance with National Instrument 43-101 Standards of Disclosure for Mineral Projects. |
| (2) | Amounts are based on the most recent forecast amounts approved by the Board of Directors, and are subject to change based on project timelines and costs. |
| (3) | Excludes ramp-up time. We expect these projects will be fully ramped up by the end of 2015, subject to market conditions. |
In 2013, we began an expansion of ammonia production at our Lima, Ohio plant. We are investing approximately $210 million through the fourth quarter of 2015 ($110 million in 2014) to increase our capacity in ammonia (100,000 tonnes) and urea (73,000 tonnes).
We anticipate that all capital spending will be financed by internally generated cash flows supplemented, if and as necessary, by borrowing from existing financing sources.
Sources and Uses of Cash
Cash flows from operating, investing and financing activities, as reflected in the unaudited interim condensed consolidated statements of cash flow in this Form 10-Q, are summarized in the following table:
| Three Months Ended September 30 | Nine Months Ended September 30 | |||||||||||||||||||||||||||||||
| Dollars (millions) | 2014 | 2013 | Change | % Change | 2014 | 2013 | Change | % Change | ||||||||||||||||||||||||
| Cash provided by operating activities |
$ | 574 | $ | 616 | $ | (42 | ) | (7 | ) | $ | 1,901 | $ | 2,556 | $ | (655 | ) | (26 | ) | ||||||||||||||
| Cash used in investing activities |
(305 | ) | (358 | ) | 53 | (15 | ) | (738 | ) | (1,218 | ) | 480 | (39 | ) | ||||||||||||||||||
| Cash used in financing activities |
(224 | ) | (333 | ) | 109 | (33 | ) | (1,639 | ) | (1,345 | ) | (294 | ) | 22 | ||||||||||||||||||
| Increase (decrease) in cash and cash equivalents |
$ | 45 | $ | (75 | ) | $ | 120 | n/m | $ | (476 | ) | $ | (7 | ) | $ | (469 | ) | n/m | ||||||||||||||
| n/m | = not meaningful |
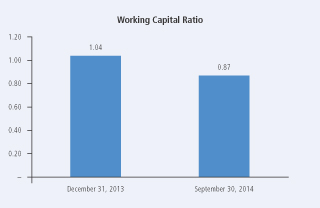
| PotashCorp 2014 Third Quarter Quarterly Report on Form 10-Q | 30 |
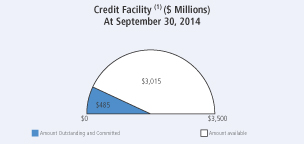
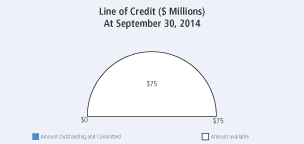
| 31 | PotashCorp 2014 Third Quarter Quarterly Report on Form 10-Q |
Quarterly Financial Highlights
| Dollars (millions), except per-share amounts |
September 30, 2014 |
June 30, 2014 |
March 31, 2014 |
December 31, 2013 |
September 30, 2013 |
June 30, 2013 |
March 31, 2013 |
December 31, 2012 |
||||||||||||||||||||||||
| Sales |
$ | 1,641 | $ | 1,892 | $ | 1,680 | $ | 1,541 | $ | 1,520 | $ | 2,144 | $ | 2,100 | $ | 1,642 | ||||||||||||||||
| Gross margin |
589 | 747 | 565 | 460 | 484 | 979 | 867 | 586 | ||||||||||||||||||||||||
| Net income |
317 | 472 | 340 | 230 | 356 | 643 | 556 | 421 | ||||||||||||||||||||||||
| Net income per share — basic (1) |
0.38 | 0.56 | 0.40 | 0.27 | 0.41 | 0.74 | 0.64 | 0.49 | ||||||||||||||||||||||||
| Net income per share — diluted (1) |
0.38 | 0.56 | 0.40 | 0.26 | 0.41 | 0.73 | 0.63 | 0.48 | ||||||||||||||||||||||||
| (1) | Net income per share for each quarter has been computed based on the weighted average number of shares issued and outstanding during the respective quarter, including the dilutive number of shares assumed for the diluted earnings per share computation; therefore, as the number of shares varies each period, quarterly amounts may not add to the annual total. |
| Certain aspects of our business can be impacted by seasonal factors. Fertilizers are sold primarily for spring and fall application in both Northern and Southern Hemispheres. However, planting conditions and the timing of customer purchases will vary each year and fertilizer sales can be expected to shift from one quarter to another. Most feed and industrial sales are by contract and are more evenly distributed throughout the year. |
| PotashCorp 2014 Third Quarter Quarterly Report on Form 10-Q | 32 |
| 33 | PotashCorp 2014 Third Quarter Quarterly Report on Form 10-Q |

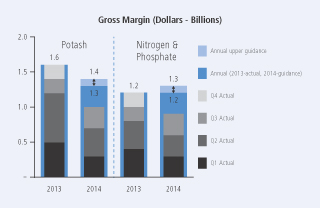
| PotashCorp 2014 Third Quarter Quarterly Report on Form 10-Q | 34 |
| 35 | PotashCorp 2014 Third Quarter Quarterly Report on Form 10-Q |
Part II. Other Information
Item 1. Legal Proceedings
For a description of certain other legal and environmental proceedings, see Note 11 to the unaudited interim condensed consolidated financial statements included in Part I of this Quarterly Report on Form 10-Q.
Item 6. Exhibits
(a) Exhibits
| Incorporated By Reference (File No. 001-10351, unless otherwise indicated) | ||||||||
| Exhibit Number |
Description of Document | Form | Filing Date/Period End Date |
Exhibit Number (if different) | ||||
| 3(a) | Articles of Continuance of the registrant dated May 15, 2002. | 10-Q | 6/30/2002 | |||||
| 3(b) | Bylaws of the registrant effective May 15, 2002. | 10-Q | 6/30/2002 | |||||
| 4(a) | Indenture dated as of February 27, 2003, between the registrant and U.S. Bank National Association, as successor to The Bank of Nova Scotia Trust Company of New York. | 10-K | 12/31/2002 | 4(c) | ||||
| 4(b) | Form of Note relating to the registrant’s offering of $500,000,000 principal amount of 5.875% Notes due December 1, 2036. | 8-K | 11/30/2006 | 4(a) | ||||
| 4(c) | Form of Note relating to the registrant’s offering of $500,000,000 principal amount of 6.50% Notes due May 15, 2019. | 8-K | 5/1/2009 | 4(b) | ||||
| 4(d) | Form of Note relating to the registrant’s offering of $500,000,000 principal amount of 3.75% Notes due September 30, 2015. | 8-K | 9/25/2009 | 4(a) | ||||
| 4(e) | Form of Note relating to the registrant’s offering of $500,000,000 principal amount of 4.875% Notes due March 30, 2020. | 8-K | 9/25/2009 | 4(b) | ||||
| 4(f) | Form of Note relating to the registrant’s offering of $750,000,000 principal amount of 3.625% Notes due March 15, 2024. | 8-K | 3/7/2014 | 4(a) | ||||
| 4(g) | Revolving Term Credit Facility Agreement between the Bank of Nova Scotia and other financial institutions and the registrant dated December 11, 2009. | 8-K | 12/15/2009 | 4(a) | ||||
| 4(h) | Revolving Term Credit Facility First Amending Agreement between the Bank of Nova Scotia and other financial institutions and the registrant dated September 23, 2011. | 8-K | 9/26/2011 | 4(a) | ||||
| 4(i) | Revolving Term Credit Facility Second Amending Agreement between the Bank of Nova Scotia and other financial institutions and the registrant dates as of May 24, 2013. | 8-K | 5/28/2013 | 4(a) | ||||
| 4(j) | Form of Note relating to the registrant’s offering of $500,000,000 principal amount of 3.25% Notes due December 1, 2017. | 8-K | 11/29/2010 | 4(a) | ||||
| PotashCorp 2014 Third Quarter Quarterly Report on Form 10-Q | 36 |
| Incorporated By Reference (File No. 001-10351, unless otherwise indicated) | ||||||||
| Exhibit Number |
Description of Document | Form | Filing Date/Period End Date |
Exhibit Number (if different) | ||||
| 4(k) | Form of Note relating to the registrant’s offering of $500,000,000 principal amount of 5.625% Notes due December 1, 2040. | 8-K | 11/29/2010 | 4(b) | ||||
| 4(l) | Agreement of Resignation, Appointment and Acceptance, dated as of June 25, 2013, by and among the registrant, The Bank of Nova Scotia Trust Company of New York and U.S. Bank National Association. | 8-K | 6/27/2013 | 4(a) | ||||
| 4(m) | Revolving Term Credit Facility Third Amending Agreement between the Bank of Nova Scotia and other financial institutions and the registrant dated July 8, 2014. |
10-Q | 07/29/2014 | |||||
The registrant hereby undertakes to file with the Securities and Exchange Commission, upon request, copies of any constituent instruments defining the rights of holders of long-term debt of the registrant or its subsidiaries that have not been filed herewith because the amounts represented thereby are less than 10% of the total assets of the registrant and its subsidiaries on a consolidated basis.
| Incorporated By Reference (File No. 001-10351, unless otherwise indicated) | ||||||||||
| Exhibit Number |
Description of Document | Form | Filing Date/Period End Date |
Exhibit Number (if different) | ||||||
| 10(a) | Consolidated, Restated and Amended Canpotex Shareholders’ Agreement, Eighth Memorandum of Agreement dated January 1, 2014 between Agrium Inc., Mosaic Canada Crop Nutrition, LP, by its general partner, 4379934 Canada Ltd., the registrant and Canpotex Limited. | 10-K | 12/31/2013 | |||||||
| 10(b) | Consolidated, Restated and Amended Producer Agreement, Eighth Memorandum of Agreement dated January 1, 2014 between Canpotex Limited, Agrium Inc., Mosaic Canada Crop Nutrition, LP, by its general partner, 4379934 Canada Ltd. and the registrant. | 10-K | 12/31/2013 | |||||||
| 10(c) | Short-Term Incentive Plan of the registrant effective January 1, 2000, as amended. | 8-K | 3/13/2012 | 10(a) | ||||||
| 10(d) | Resolution and Forms of Agreement for Supplemental Executive Retirement Income Plan, for officers and key employees of the registrant. | 10-K | 12/31/1995 | 10(o) | ||||||
| 10(e) | Amending Resolution and revised forms of agreement regarding Supplemental Retirement Income Plan of the registrant. | 10-Q | 6/30/1996 | 10(x) | ||||||
| 10(f) | Amended and restated Supplemental Executive Retirement Income Plan of the registrant and text of amendment to existing supplemental income plan agreements. | 10-Q | 9/30/2000 | 10(mm) | ||||||
| 10(g) | Amendment, dated February 23, 2009, to the amended and restated Supplemental Executive Retirement Income Plan. | 10-K | 12/31/2008 | 10(r) | ||||||
| 10(h) | Amendment, dated December 29, 2010, to the amended and restated Supplemental Executive Retirement Income Plan. | 10-K | 12/31/2010 | 10(r) | ||||||
| 10(i) | Form of Letter of amendment to existing supplemental income plan agreements of the registrant. | 10-K | 12/31/2002 | 10(cc) | ||||||
| 10(j) | Amended and restated agreement dated February 20, 2007, between the registrant and William J. Doyle concerning the Supplemental Executive Retirement Income Plan. | 10-K | 12/31/2006 | 10(s) | ||||||
| 10(k) | Amendment, dated December 24, 2008, to the amended and restated agreement, dated February 20, 2007, between the registrant and William J. Doyle concerning the Supplemental Executive Retirement Income Plan. | 10-K | 12/31/2008 | 10(u) | ||||||
| 10(l) | Amendment, dated February 23, 2009, to the amended and restated agreement, dated February 20, 2007, between the registrant and William J. Doyle concerning the Supplemental Executive Retirement Income Plan. | 10-K | 12/31/2008 | 10(v) | ||||||
| 10(m) | Amendment, dated February 23, 2009, to the amended and restated agreement, dated August 2, 1996, between the registrant and Wayne R. Brownlee concerning the Supplemental Executive Retirement Income Plan. | 10-K | 12/31/2008 | 10(w) | ||||||
| 37 | PotashCorp 2014 Third Quarter Quarterly Report on Form 10-Q |
| Incorporated By Reference (File No. 001-10351, unless otherwise indicated) | ||||||||||
| Exhibit Number |
Description of Document | Form | Filing Date/Period End Date |
Exhibit Number (if different) | ||||||
| 10(n) | Amendment, dated December 29, 2010, to the amended and restated agreement, dated February 20, 2007, between the registrant and William J. Doyle concerning the Supplemental Executive Retirement Income Plan. | 10-K | 12/31/2010 | 10(y) | ||||||
| 10(o) | Amendment, dated December 29, 2010, to the amended and restated agreement, dated August 2, 1996, between the registrant and Wayne R. Brownlee concerning the Supplemental Executive Retirement Income Plan. | 10-K | 12/31/2010 | 10(z) | ||||||
| 10(p) | Supplemental Retirement Agreement dated December 24, 2008, between the registrant and Stephen F. Dowdle. | 10-K | 12/31/2011 | 10(bb) | ||||||
| 10(q) | Supplemental Retirement Benefits Plan for U.S. Executives dated effective January 1, 1999. | 10-Q | 6/30/2002 | 10(aa) | ||||||
| 10(r) | Amendment No. 1, dated December 24, 2008, to the Supplemental Retirement Plan for U.S. Executives. | 10-K | 12/31/2008 | 10(z) | ||||||
| 10(s) | Amendment No. 2, dated February 23, 2009, to the Supplemental Retirement Plan for U.S. Executives. | 10-K | 12/31/2008 | 10(aa) | ||||||
| 10(t) | Amendment No. 3, dated December 2, 2013, to the Supplemental Retirement Plan for U.S. Executives. | 10-K | 12/31/2013 | |||||||
| 10(u) | Amendment No. 4, dated February 25, 2014 to the Supplemental Retirement Plan for U.S. Executives. | 10-K | 12/31/2013 | |||||||
| 10(v) | Forms of Agreement dated December 30, 1994, between the registrant and certain officers of the registrant. | 10-K | 12/31/1995 | 10(p) | ||||||
| 10(w) | Amendment, dated December 31, 2010, to the Agreement, dated December 30, 1994 between the registrant and William J. Doyle. | 10-K | 12/31/2010 | 10(ff) | ||||||
| 10(x) | Form of Agreement of Indemnification dated August 8, 1995, between the registrant and certain officers and directors of the registrant. | 10-K | 12/31/1995 | 10(q) | ||||||
| 10(y) | Resolution and Form of Agreement of Indemnification dated January 24, 2001. | 10-K | 12/31/2000 | 10(ii) | ||||||
| 10(z) | Resolution and Form of Agreement of Indemnification dated July 21, 2004. | 10-Q | 6/30/2004 | 10(ii) | ||||||
| 10(aa) | Chief Executive Officer Medical and Dental Benefits. | 10-K | 12/31/2010 | 10(jj) | ||||||
| 10(bb) | The Potash Corporation of Saskatchewan Inc. Deferred Share Unit Plan for Non-Employee Directors. | 10-Q | 3/31/2012 | 10(ll) | ||||||
| 10(cc) | Potash Corporation of Saskatchewan Inc. 2005 Performance Option Plan and Form of Option Agreement, as amended. | 10-Q | 3/31/2005 | 10(nn) | ||||||
| 10(dd) | Potash Corporation of Saskatchewan Inc. 2006 Performance Option Plan and Form of Option Agreement, as amended. | 10-Q | 3/31/2006 | |||||||
| 10(ee) | Potash Corporation of Saskatchewan Inc. 2007 Performance Option Plan and Form of Option Agreement. | 10-Q | 3/31/2007 | |||||||
| 10(ff) | Potash Corporation of Saskatchewan Inc. 2008 Performance Option Plan and Form of Option Agreement. | 10-Q | 3/31/2008 | |||||||
| 10(gg) | Potash Corporation of Saskatchewan Inc. 2009 Performance Option Plan and Form of Option Agreement. | 10-Q | 3/31/2009 | 10(mm) | ||||||
| 10(hh) | Potash Corporation of Saskatchewan Inc. 2010 Performance Option Plan and Form of Option Agreement. | 8-K | 5/7/2010 | 10.1 | ||||||
| 10(ii) | Potash Corporation of Saskatchewan Inc. 2011 Performance Option Plan and Form of Option Agreement. | 8-K | 5/13/2011 | 10(a) | ||||||
| 10(jj) | Potash Corporation of Saskatchewan Inc. 2012 Performance Option Plan and Form of Option Agreement. | 8-K | 5/18/2012 | 10(a) | ||||||
| 10(kk) | Potash Corporation of Saskatchewan Inc. 2013 Performance Option Plan and Form of Option Agreement. | 8-K | 5/17/2013 | 10(a) | ||||||
| 10(ll) | Potash Corporation of Saskatchewan Inc. 2014 Performance Option Plan and Form of Option Agreement. | 8-K | 5/16/2014 | 10(a) | ||||||
| 10(mm) | Medium-Term Incentive Plan of the registrant effective January 1, 2012. | 10-K | 12/31/2011 | 10(uu) | ||||||
| 10(nn) | Executive Employment Agreement, dated July 1, 2014, between the registrant and Jochen A. Tilk. | |||||||||
| PotashCorp 2014 Third Quarter Quarterly Report on Form 10-Q | 38 |
| Incorporated By Reference (File No. 001-10351, unless otherwise indicated) | ||||||||
| Exhibit Number |
Description of Document | Form | Filing Date/Period End Date |
Exhibit Number (if different) | ||||
| 31(a) | Certification pursuant to Section 302 of the Sarbanes-Oxley Act of 2002. | |||||||
| 31(b) | Certification pursuant to Section 302 of the Sarbanes-Oxley Act of 2002. | |||||||
| 32 | Certification pursuant to Section 906 of the Sarbanes-Oxley Act of 2002. | |||||||
| 95 | Information concerning mine safety violations or other regulatory matters required by Section 1503(a) of the Dodd-Frank Wall Street Reform and Consumer Protection Act. | |||||||
| 39 | PotashCorp 2014 Third Quarter Quarterly Report on Form 10-Q |
Signatures
Pursuant to the requirements of the Securities Exchange Act of 1934, the registrant has duly caused this report to be signed on its behalf by the undersigned, thereunto duly authorized.
| POTASH CORPORATION OF SASKATCHEWAN INC. | ||||
| October 28, 2014 | By: | /s/ JOSEPH PODWIKA | ||
| Joseph Podwika | ||||
| Senior Vice President, General Counsel and Secretary | ||||
| October 28, 2014 | By: | /s/ WAYNE R. BROWNLEE | ||
| Wayne R. Brownlee | ||||
| Executive Vice President, Treasurer and Chief Financial Officer (Principal Financial and Accounting Officer) | ||||
| PotashCorp 2014 Third Quarter Quarterly Report on Form 10-Q | 40 |
EXHIBIT INDEX
| Incorporated By Reference (File No. 001-10351, unless otherwise indicated) | ||||||||
| Exhibit Number |
Description of Document | Form | Filing Date/Period End Date |
Exhibit Number (if different) | ||||
| 3(a) | Articles of Continuance of the registrant dated May 15, 2002. | 10-Q | 6/30/2002 | |||||
| 3(b) | Bylaws of the registrant effective May 15, 2002. | 10-Q | 6/30/2002 | |||||
| 4(a) | Indenture dated as of February 27, 2003, between the registrant and U.S. Bank National Association, as successor to The Bank of Nova Scotia Trust Company of New York. | 10-K | 12/31/2002 | 4(c) | ||||
| 4(b) | Form of Note relating to the registrant’s offering of $500,000,000 principal amount of 5.875% Notes due December 1, 2036. | 8-K | 11/30/2006 | 4(a) | ||||
| 4(c) | Form of Note relating to the registrant’s offering of $500,000,000 principal amount of 6.50% Notes due May 15, 2019. | 8-K | 5/1/2009 | 4(b) | ||||
| 4(d) | Form of Note relating to the registrant’s offering of $500,000,000 principal amount of 3.75% Notes due September 30, 2015. | 8-K | 9/25/2009 | 4(a) | ||||
| 4(e) | Form of Note relating to the registrant’s offering of $500,000,000 principal amount of 4.875% Notes due March 30, 2020. | 8-K | 9/25/2009 | 4(b) | ||||
| 4(f) | Form of Note relating to the registrant’s offering of $750,000,000 principal amount of 3.625% Notes due March 15, 2024. | 8-K | 3/7/2014 | 4(a) | ||||
| 4(g) | Revolving Term Credit Facility Agreement between the Bank of Nova Scotia and other financial institutions and the registrant dated December 11, 2009. | 8-K | 12/15/2009 | 4(a) | ||||
| 4(h) | Revolving Term Credit Facility First Amending Agreement between the Bank of Nova Scotia and other financial institutions and the registrant dated September 23, 2011. | 8-K | 9/26/2011 | 4(a) | ||||
| 4(i) | Revolving Term Credit Facility Second Amending Agreement between the Bank of Nova Scotia and other financial institutions and the registrant dates as of May 24, 2013. | 8-K | 5/28/2013 | 4(a) | ||||
| 4(j) | Form of Note relating to the registrant’s offering of $500,000,000 principal amount of 3.25% Notes due December 1, 2017. | 8-K | 11/29/2010 | 4(a) | ||||
| Incorporated By Reference (File No. 001-10351, unless otherwise indicated) | ||||||||
| Exhibit Number |
Description of Document | Form | Filing Date/Period End Date |
Exhibit Number (if different) | ||||
| 4(k) | Form of Note relating to the registrant’s offering of $500,000,000 principal amount of 5.625% Notes due December 1, 2040. | 8-K | 11/29/2010 | 4(b) | ||||
| 4(l) | Agreement of Resignation, Appointment and Acceptance, dated as of June 25, 2013, by and among the registrant, The Bank of Nova Scotia Trust Company of New York and U.S. Bank National Association. | 8-K | 6/27/2013 | 4(a) | ||||
| 4(m) | Revolving Term Credit Facility Third Amending Agreement between the Bank of Nova Scotia and other financial institutions and the registrant dated July 8, 2014. |
10-Q | 07/29/2014 | |||||
The registrant hereby undertakes to file with the Securities and Exchange Commission, upon request, copies of any constituent instruments defining the rights of holders of long-term debt of the registrant or its subsidiaries that have not been filed herewith because the amounts represented thereby are less than 10% of the total assets of the registrant and its subsidiaries on a consolidated basis.
| Incorporated By Reference (File No. 001-10351, unless otherwise indicated) | ||||||||||
| Exhibit Number |
Description of Document | Form | Filing Date/Period End Date |
Exhibit Number (if different) | ||||||
| 10(a) | Consolidated, Restated and Amended Canpotex Shareholders’ Agreement, Eighth Memorandum of Agreement dated January 1, 2014 between Agrium Inc., Mosaic Canada Crop Nutrition, LP, by its general partner, 4379934 Canada Ltd., the registrant and Canpotex Limited. | 10-K | 12/31/2013 | |||||||
| 10(b) | Consolidated, Restated and Amended Producer Agreement, Eighth Memorandum of Agreement dated January 1, 2014 between Canpotex Limited, Agrium Inc., Mosaic Canada Crop Nutrition, LP, by its general partner, 4379934 Canada Ltd. and the registrant. | 10-K | 12/31/2013 | |||||||
| 10(c) | Short-Term Incentive Plan of the registrant effective January 1, 2000, as amended. | 8-K | 3/13/2012 | 10(a) | ||||||
| 10(d) | Resolution and Forms of Agreement for Supplemental Executive Retirement Income Plan, for officers and key employees of the registrant. | 10-K | 12/31/1995 | 10(o) | ||||||
| 10(e) | Amending Resolution and revised forms of agreement regarding Supplemental Retirement Income Plan of the registrant. | 10-Q | 6/30/1996 | 10(x) | ||||||
| 10(f) | Amended and restated Supplemental Executive Retirement Income Plan of the registrant and text of amendment to existing supplemental income plan agreements. | 10-Q | 9/30/2000 | 10(mm) | ||||||
| 10(g) | Amendment, dated February 23, 2009, to the amended and restated Supplemental Executive Retirement Income Plan. | 10-K | 12/31/2008 | 10(r) | ||||||
| 10(h) | Amendment, dated December 29, 2010, to the amended and restated Supplemental Executive Retirement Income Plan. | 10-K | 12/31/2010 | 10(r) | ||||||
| 10(i) | Form of Letter of amendment to existing supplemental income plan agreements of the registrant. | 10-K | 12/31/2002 | 10(cc) | ||||||
| 10(j) | Amended and restated agreement dated February 20, 2007, between the registrant and William J. Doyle concerning the Supplemental Executive Retirement Income Plan. | 10-K | 12/31/2006 | 10(s) | ||||||
| 10(k) | Amendment, dated December 24, 2008, to the amended and restated agreement, dated February 20, 2007, between the registrant and William J. Doyle concerning the Supplemental Executive Retirement Income Plan. | 10-K | 12/31/2008 | 10(u) | ||||||
| 10(l) | Amendment, dated February 23, 2009, to the amended and restated agreement, dated February 20, 2007, between the registrant and William J. Doyle concerning the Supplemental Executive Retirement Income Plan. | 10-K | 12/31/2008 | 10(v) | ||||||
| 10(m) | Amendment, dated February 23, 2009, to the amended and restated agreement, dated August 2, 1996, between the registrant and Wayne R. Brownlee concerning the Supplemental Executive Retirement Income Plan. | 10-K | 12/31/2008 | 10(w) | ||||||
| Incorporated By Reference (File No. 001-10351, unless otherwise indicated) | ||||||||||
| Exhibit Number |
Description of Document | Form | Filing Date/Period End Date |
Exhibit Number (if different) | ||||||
| 10(n) | Amendment, dated December 29, 2010, to the amended and restated agreement, dated February 20, 2007, between the registrant and William J. Doyle concerning the Supplemental Executive Retirement Income Plan. | 10-K | 12/31/2010 | 10(y) | ||||||
| 10(o) | Amendment, dated December 29, 2010, to the amended and restated agreement, dated August 2, 1996, between the registrant and Wayne R. Brownlee concerning the Supplemental Executive Retirement Income Plan. | 10-K | 12/31/2010 | 10(z) | ||||||
| 10(p) | Supplemental Retirement Agreement dated December 24, 2008, between the registrant and Stephen F. Dowdle. | 10-K | 12/31/2011 | 10(bb) | ||||||
| 10(q) | Supplemental Retirement Benefits Plan for U.S. Executives dated effective January 1, 1999. | 10-Q | 6/30/2002 | 10(aa) | ||||||
| 10(r) | Amendment No. 1, dated December 24, 2008, to the Supplemental Retirement Plan for U.S. Executives. | 10-K | 12/31/2008 | 10(z) | ||||||
| 10(s) | Amendment No. 2, dated February 23, 2009, to the Supplemental Retirement Plan for U.S. Executives. | 10-K | 12/31/2008 | 10(aa) | ||||||
| 10(t) | Amendment No. 3, dated December 2, 2013, to the Supplemental Retirement Plan for U.S. Executives. | 10-K | 12/31/2013 | |||||||
| 10(u) | Amendment No. 4, dated February 25, 2014 to the Supplemental Retirement Plan for U.S. Executives. | 10-K | 12/31/2013 | |||||||
| 10(v) | Forms of Agreement dated December 30, 1994, between the registrant and certain officers of the registrant. | 10-K | 12/31/1995 | 10(p) | ||||||
| 10(w) | Amendment, dated December 31, 2010, to the Agreement, dated December 30, 1994 between the registrant and William J. Doyle. | 10-K | 12/31/2010 | 10(ff) | ||||||
| 10(x) | Form of Agreement of Indemnification dated August 8, 1995, between the registrant and certain officers and directors of the registrant. | 10-K | 12/31/1995 | 10(q) | ||||||
| 10(y) | Resolution and Form of Agreement of Indemnification dated January 24, 2001. | 10-K | 12/31/2000 | 10(ii) | ||||||
| 10(z) | Resolution and Form of Agreement of Indemnification dated July 21, 2004. | 10-Q | 6/30/2004 | 10(ii) | ||||||
| 10(aa) | Chief Executive Officer Medical and Dental Benefits. | 10-K | 12/31/2010 | 10(jj) | ||||||
| 10(bb) | The Potash Corporation of Saskatchewan Inc. Deferred Share Unit Plan for Non-Employee Directors. | 10-Q | 3/31/2012 | 10(ll) | ||||||
| 10(cc) | Potash Corporation of Saskatchewan Inc. 2005 Performance Option Plan and Form of Option Agreement, as amended. | 10-Q | 3/31/2005 | 10(nn) | ||||||
| 10(dd) | Potash Corporation of Saskatchewan Inc. 2006 Performance Option Plan and Form of Option Agreement, as amended. | 10-Q | 3/31/2006 | |||||||
| 10(ee) | Potash Corporation of Saskatchewan Inc. 2007 Performance Option Plan and Form of Option Agreement. | 10-Q | 3/31/2007 | |||||||
| 10(ff) | Potash Corporation of Saskatchewan Inc. 2008 Performance Option Plan and Form of Option Agreement. | 10-Q | 3/31/2008 | |||||||
| 10(gg) | Potash Corporation of Saskatchewan Inc. 2009 Performance Option Plan and Form of Option Agreement. | 10-Q | 3/31/2009 | 10(mm) | ||||||
| 10(hh) | Potash Corporation of Saskatchewan Inc. 2010 Performance Option Plan and Form of Option Agreement. | 8-K | 5/7/2010 | 10.1 | ||||||
| 10(ii) | Potash Corporation of Saskatchewan Inc. 2011 Performance Option Plan and Form of Option Agreement. | 8-K | 5/13/2011 | 10(a) | ||||||
| 10(jj) | Potash Corporation of Saskatchewan Inc. 2012 Performance Option Plan and Form of Option Agreement. | 8-K | 5/18/2012 | 10(a) | ||||||
| 10(kk) | Potash Corporation of Saskatchewan Inc. 2013 Performance Option Plan and Form of Option Agreement. | 8-K | 5/17/2013 | 10(a) | ||||||
| 10(ll) | Potash Corporation of Saskatchewan Inc. 2014 Performance Option Plan and Form of Option Agreement. | 8-K | 5/16/2014 | 10(a) | ||||||
| 10(mm) | Medium-Term Incentive Plan of the registrant effective January 1, 2012. | 10-K | 12/31/2011 | 10(uu) | ||||||
| 10(nn) | Executive Employment Agreement, dated July 1, 2014, between the registrant and Jochen A. Tilk. | |||||||||
| Incorporated By Reference (File No. 001-10351, unless otherwise indicated) | ||||||||
| Exhibit Number |
Description of Document | Form | Filing Date/Period End Date |
Exhibit Number (if different) | ||||
| 31(a) | Certification pursuant to Section 302 of the Sarbanes-Oxley Act of 2002. | |||||||
| 31(b) | Certification pursuant to Section 302 of the Sarbanes-Oxley Act of 2002. | |||||||
| 32 | Certification pursuant to Section 906 of the Sarbanes-Oxley Act of 2002. | |||||||
| 95 | Information concerning mine safety violations or other regulatory matters required by Section 1503(a) of the Dodd-Frank Wall Street Reform and Consumer Protection Act. | |||||||