Attached files
| file | filename |
|---|---|
| 8-K - FORM 8-K - RAIT Financial Trust | d545236d8k.htm |
 1
RAIT Financial Trust
Investor Presentation
May 2013
Exhibit 99.1 |
 2
Forward Looking Statements &
Non-GAAP Financial Measures
This document and the related presentation may contain forward-looking
statements within the meaning of the Private Securities Litigation
Reform Act of 1995. These forward-looking statements include, but are not
limited to, statements about RAIT Financial Trust’s (“RAIT”) plans,
objectives, expectations and intentions with respect to future operations,
products, dividends, cash from investments and services and other
statements that are not historical facts. Forward-looking statements are
sometimes identified by the words “may”, “will”, “should”, “potential”,
“predict”, “continue”, “project”,
“guide”, or other similar words or expressions. These forward-looking statements are based upon the current
beliefs
and
expectations
of
RAIT's
management
and
are
inherently
subject
to
significant
business,
economic
and
competitive
uncertainties
and contingencies, many of which are difficult to predict and generally not
within RAIT’s control. In addition, these forward-looking statements
are subject to assumptions with respect to future business strategies and
decisions that are subject to change. RAIT does not guarantee that the
assumptions underlying such forward looking statements are free from errors. Actual results may differ materially from the anticipated
results discussed in these forward-looking statements.
The following factors, among others, could cause actual results to differ
materially from the anticipated results or other expectations expressed
in the forward-looking statements: the risk factors and other disclosure contained in filings by RAIT with the Securities and
Exchange Commission (“SEC”), including, without limitation,
RAIT’s most recent annual and quarterly reports filed with SEC. RAIT’s SEC filings
are available on RAIT’s website at www.raitft.com.
You are cautioned not to place undue reliance on these forward-looking
statements, which speak only as of the date of this presentation. All
subsequent written and oral forward-looking statements attributable to RAIT
or any person acting on its behalf are expressly qualified in their
entirety by the cautionary statements contained or referred to in this document
and the related presentation. Except to the extent required by
applicable law or regulation, RAIT undertakes no obligation to update these
forward-looking statements to reflect events or circumstances
after
the
date
of
this
presentation
or
to
reflect
the
occurrence
of
unanticipated
events.
This document and the related presentation may contain non-U.S. generally
accepted accounting principles (“GAAP”) financial measures. A
reconciliation of these non-GAAP financial measures to the most directly
comparable GAAP financial measure is included in this document and/or
RAIT’s most recent annual and quarterly reports. This
presentation is for informational purposes only and does not constitute an offer to sell or a solicitation of an offer to buy any securities of
RAIT
or
Independence
Realty
Trust,
Inc.
(“IRT”)
,
a
RAIT
sponsored
and
managed
multifamily
equity
REIT.
This
document
and
the
related
presentation
may
discuss
an
offering
of
common
stock
by
IRT.
A
registration
statement
relating
to
these
securities
has
been
filed
with
the
SEC
but has not yet become effective. These securities may not be sold nor may
offers to buy be accepted prior to the time the registration statement
becomes effective. A copy of the registration statement may be obtained
by contacting RAIT’s investor relations at the contact
information
in
our
most
recent
press
release
and
is
available
on
the
SEC’s
website
at
www.SEC.gov.
Forward
Looking
Statements,
Non-
GAAP
Financial
Measures
&
Securities
Offering
Disclaimers |
 3
RAIT Financial Trust (“RAIT”) (NYSE: RAS), is a multi-strategy
commercial real estate company organized as an internally-managed
REIT with $3.7 billion of assets under management RAIT’s IPO
- January 1998
Focus on delivering strong-risk adjusted returns
Scalable, “in-house”, commercial real estate platform with over
380 employees Offices –
Philadelphia, New York, Chicago, Charlotte, Minneapolis
RAIT funded $94.9 million of loans in the quarter ended March 31, 2013
consisting of $69.4 million conduit loans, $20.8 million bridge loans
and a $4.7 million mezzanine loan No corporate, unsecured, recourse debt
maturities until April 2016 Increased quarterly common dividend to $0.12
for the first quarter 2013 – a 20% increase from
the fourth quarter 2012 and a 100% increase over the last five quarters
Seasoned executive team with strong real estate equity and debt
experience As of March 31, 2013
About RAIT |
 4
COMMERCIAL REAL ESTATE
OWNER & OPERATOR
-
Maximize value over time
-
Hedges against inflation
-
Adds stability to the asset mix
COMMERICAL REAL ESTATE
LENDER
-
Significant lending opportunity
-
One-source financing option to
middle market: originate,
underwrite, close & service
commercial real estate loans
ASSET & PROPERTY MANAGER
-
Full service property
management capabilities
-
Asset Manager: S&P &
Morningstar rated primary and
special loan servicer
Commercial Real Estate Platform
$3.7 Billion Assets Under
Management
Multi-
Strategy Business Approach
As of March 31, 2013 |
 5
The lending opportunity
Over
$1.5
trillion
of
CRE
debt
is
expected
to
mature
through
2018
(1)
Limited competition for small balance conduit loans and short term
transitional loans Increasing CMBS activity: $32.4 billion issued
through May 3, 2013 & market expects to end 2013 with around $65
billion of issuance, approximately a 35% increase over the $48 billion issued in
2012
(2)
Equity gap drives bridge and mezzanine lending opportunities
RAIT’s goal
Capitalize on lending opportunity utilizing existing, scalable platform and
internal expertise to originate and underwrite bridge, mezzanine and
conduit loans of $5 million to $30 million on multi- family, office,
retail and light industrial properties RAIT’s competitive
advantage: uniquely positioned to deliver a one-source financing option to our
borrowers
Active credit and risk management
(1)
Morgan Stanley (January 2011), Bloomberg LP, Foresight Analytics, Trepp and
Intex (2)
Commercial Mortgage Alert
Commercial Real Estate Lender |
 6
Funding
Warehouse providers
Barclays –
conduit loans
Citibank –
conduit loans
Credit Suisse AG –
bridge loans
RAIT’s balance sheet
Loan types
Conduit loans –
for sale loans: stable properties, 5 to 10 yr, fixed rate, approximate
coupon range 3.75%-5.00%
Bridge loans –
balance sheet loans: transitional properties, 3 to 5 yr, floating rate over
libor,
origination
&
exit
fee,
approximate
coupon
range:
5.75%
-
8%
with
floors
Mezzanine loans –
balance sheet loans: stable properties, floating rate, origination & exit
fees, approximate coupon: 10%+
Commercial Real Estate Lender |
 7
Pipeline
Growing pipeline of potential opportunities
$180 million of loans under application as of May 2, 2013
Loan fundings & sales
Loan Fundings
($ in millions)
Q1 2013
FY 2012
Conduit Loans
69.4
$
119.3
$
Bridge Loans
20.8
$
240.8
$
Mezzanine Loans
4.7
$
15.4
$
Total Fundings
94.9
$
375.5
$
Conduit Loans Sales
($ in millions)
Q1 2013
FY 2012
Sale amount
41.4
$
97.9
$
Fee income from loan sales
3.1
$
6.2
$
Commercial Real Estate Lender
As of March 31, 2013 |
 8
By Property Type
(1)
By Geographic Region
(1)
Improved credit performance of the loan portfolio
As of March 31, 2013 unless otherwise Indicated ($ in 000s)
Office
42%
Multi-family
24%
Retail
28%
Other
6%
Central
33%
Mid Atlantic
29%
Southeast
13%
West
16%
Northeast
9%
CRE Loan Portfolio Statistics
(1) Based on book value at
3/31/2013. Book Value
Weighted-
Average
Coupon
Range of Maturities
Number of
Loans
Key Statistics
Q1 2013
Q4 2012
Commercial Real Estate (CRE) Loans
Non-accrual loans
$68,257
$69,08
Commercial mortgages
$755,824
6.4%
May 2013 to Apr. 2023
58
% change
(1.2%)
Mezzanine loans
270,132
9.3%
May 2013 to Nov. 2038
82
Reserve for losses
26,206
30,40
Preferred equity interests
63,744
9.7%
Mar. 2014 to Aug. 2025
15
% change
(14%)
Total CRE Loans
$1,089,700
7.3%
155
Provision for losses
500
50
Other loans
34,957
4.6%
May 2013 to Oct. 2016
2
% change
0%
Total investments in loans
$1,124,657
7.2%
157
|
 9
Directly owned real estate portfolio
Strategy to maximize value over time through increasing occupancy and higher
rental rates Provides stability to asset mix and hedges against
inflation $1.0 billion of CRE properties at March 31, 2013
Portfolio is internally managed by seasoned property management
professionals 4% average effective rent growth in multi-family
portfolio from March 31, 2012 to March 31, 2013
Opportunistically acquire properties
Acquire well located apartment buildings in secondary markets via Independence
Realty Trust, Inc.
IRT acquired Runaway Bay apartments in Indianapolis, Indiana (October
2012) »
192
garden
style
apartments;
$15.8
million
acquisition
at
a
6.9%
cap
rate;
$10.2
million
first
mortgage
at
3.59%; expected 15% year one return on equity
Utilize broker-network & relationships; off-market
transactions Commercial Real Estate Owner |
 10
(a)
Based on book value of properties owned as of March 31, 2013.
.
Directly Owned Commercial Real Estate Portfolio
Statistics
Office
26%
Multi-family
61%
Retail
8%
Other
5%
Central
32%
West
34%
Southeast
29%
Mid-Atlantic
5%
Investments
in
Real
Estate
Property
Types
(a)
Investments
in
Real
Estate
Geographic
U.S.
Regions
(a)
|
 11
Net Real Estate Operating Income
Average Effective Rent
(a)
Investments
in Real
Estate
Quantity
Number of
Properties
Average Physical Occupancy
3/31/2013
12/31/2012
Multi-family real estate properties
$615,059
8,206 units
34
92.6%
90.0%
Office real estate properties
273,570
2,015,524 sq. ft.
11
70.3%
72.8%
Retail real estate properties
83,018
1,422,572 sq. ft.
4
68.9%
73.2%
Parcels of land
48,100
21.92 acres
10
–
–
Total
$1,019,747
59
85.9%
85.1%
(a)
Based on properties owned as of March 31, 2013.
(b)
Average effective rent is rent per unit per month.
(c)
Average effective rent is rent per square foot per year.
Improved Occupancy and Net Operating Income
Q1 2013
Q1 2012
Rental income
$27,169
$24,831
Real estate operating expenses
14,410
13,797
Net Real Estate Operating Income
$12,759
$11,034
NOI growth
16%
Average Occupancy
85.9%
85.0%
As of March 31, 2013 unless otherwise Indicated ($ in 000s)
Property Type
Q1 2013
Q1 2012
% Variance
Multi-family
(b)
$720
$691
4%
Office
(c)
18.91
21.53
-12%
Retail
(c)
11.95
10.59
13%
Directly Owned Commercial Real Estate Portfolio
Statistics |
 12
Asset management
Management fees
Manage approximately $2 billion of commercial real estate loans and $1.6 billion
of U.S. real estate debt securities
S&P & Morningstar rated primary and special CRE loan servicer
Property management
Property management fees –
RAIT, IRT and 3
rd
party opportunities
Jupiter Communities -
Multi-family focused
49 properties –
10,649 units
CRP Commercial Services -
Office focused
2.7 million square feet
Independence
Realty
Trust,
Inc.
–
RAIT
sponsored
&
managed
multi-family
equity
REIT
Transition to an underwritten public offering
Externally managed by RAIT affiliate
Asset and Property Manager
As of March 31, 2013 |
 13
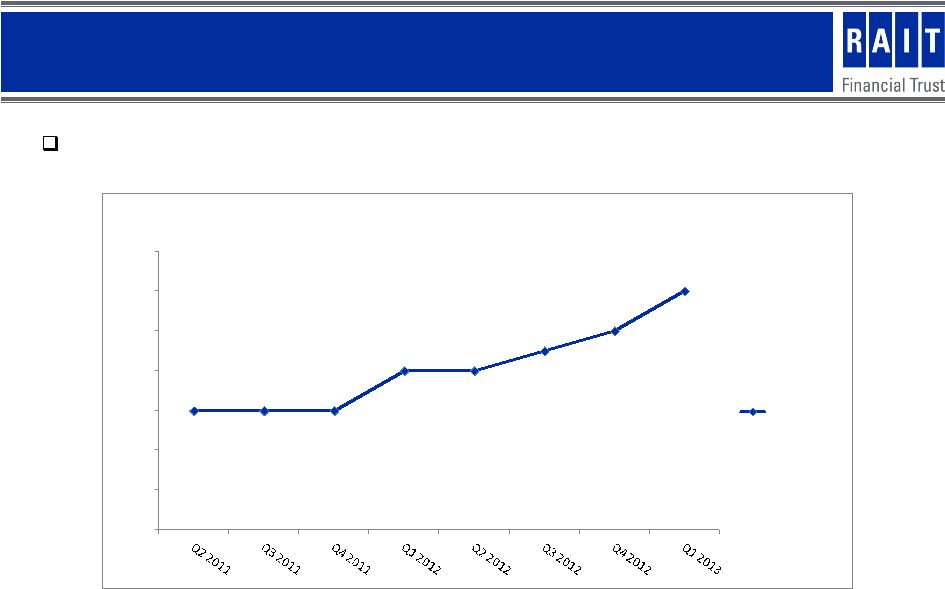
Operating Income –
2 year History
Strong operating income growth |
 14
$0.06
$0.06
$0.06
$0.08
$0.08
$0.09
$0.10
$0.12
$-
$0.02
$0.04
$0.06
$0.08
$0.10
$0.12
$0.14
RAS Common Dividend History -
2 year history
RAS Dividend
RAS Dividend History –
2 Year History
Stable and steady dividend growth |
 15
(1)
Constitutes forward-looking information. Actual full 2013 projected
cash received from investments and each individual line item presented herein could vary significantly
from the projections presented. The above projections assume: RAIT does
not raise any other capital; Investment portfolios do not experience significant loan repayments;
RAIT increases the amount of loan originations and conduit loan sales from
historical levels; RAIT’s property portfolio performs at historical levels; RAIT continues to receive
its securitization collateral management and property management
fees; and RAIT’s sponsored companies experience growth in their
investment portfolios by the end of the period covered.
2013 Projected Cash Received from Investments
(1)
($'s in millions, except per share amounts)
2013
Projected In-flows
$ 182 -
$203
Less: CRE and Property level interest costs
(52)
Less: Corporate interest and preferred dividends
(34)
Less: General and administrative costs
(33)
-
(34)
Net cash flow available to common shareholders
$63
$84
Per Share
$ 0.93
$ 1.23 |
 16
RAIT will continue to focus on:
Growth & stability through a multi-strategy approach
Utilizing RAIT’s core, integrated, real estate platform and management
expertise to generate appropriate risk-adjusted returns by
originating, underwriting and managing commercial real estate
loans Growing cash flow through accretive capital deployment
Focus on conduit and transitional loans
Continue to actively manage credit risk
Effectively manage RAIT’s portfolio of owned real estate to deliver
increasing rental and occupancy rates while managing operating costs
Leveraging RAIT’s capabilities to grow fee income and assets under
management Maintaining a strong pipeline of investment opportunities
Delivering stable and growing dividends
RAIT Highlights |
 17
Appendix |
 18
No unsecured, recourse debt maturities until April 2016
(1)
Does not include $15.9 million of secured debt on RAIT’s CMBS and
commercial mortgage facilities. (2)
Assumes full exercise of holders’
7.0% convertible senior notes redemption right in April 2016.
(3)
Includes
senior
secured
notes
issued
by
us
with
an
aggregate
principal
amount
equal
to
$92,000
with
a
weighted
average
coupon
of
7.0%,
which
are
eliminated
in
consolidation
$-
$-
$-
$122,608
$46,000
$23,000
$23,000
$-
$43,771
$-
$20,000
$40,000
$60,000
$80,000
$100,000
$120,000
$140,000
2013 (1)
2014
2015
2016 (2)
2017 (3)
2018 (3)
2019 (3)
2020
Thereafter
Unsecured Recourse Debt Maturities and Redemption Dates
(in 000s)
Unsecured Recourse Debt Summary
As of March 31, 2013 |
 19
Adjusted Book Value
(1)
(1)
Management
views
adjusted
book
value
as
a
useful
and
appropriate
supplement
to
shareholders’
equity
and
book
value
per
share.
The
measure
serves
as
an
additional
measure
of
our
value
because it facilitates evaluation of us without the effects of various items
that we are required to record in accordance with GAAP but which have limited economic impact on our
business.
Those adjustments primarily reflect the effect of consolidated securitizations
where we do not currently receive cash flows on our retained interests, accumulated depreciation and
amortization, the valuation of long-term derivative instruments and a
valuation of our recurring collateral and property management fees. Adjusted book value is a non-GAAP financial
measurement,
and
does
not
purport
to
be
an
alternative
to
reported
shareholders’
equity,
determined
in
accordance
with
GAAP,
as
a
measure
of
book
value.
Adjusted
book
value
should
be
reviewed
in
connection
with
shareholders’
equity
as
set
forth
in
our
consolidated
balance
sheets,
to
help
analyze
our
value
to
investors.
Adjusted
book
value
may
be
defined
in
various
ways
throughout the REIT industry. Investors should consider these differences when
comparing our adjusted book value to that of other REITs. (2)
Based on 60,758,957 common shares outstanding as of March 31, 2013.
(3)
Based
on
3,749,288
Series
A
preferred
shares,
2,288,465
Series
B
preferred
shares,
and
1,640,100
Series
C
preferred
shares
outstanding
as
of
March
31,
2013,
all
of
which
have
a
liquidation preference of $25.00 per share.
As of March 31, 2013
Amount
Per Share (2)
Total shareholders’ equity
........................................................................................................................
$
764,978
$
12.59
Liquidation value of preferred shares characterized as equity (3)
...............................................
(191,946)
(3.16)
Book value
.................................................................................................................................................
573,032
9.43
Adjustments:
Taberna VIII and Taberna IX securitizations
...................................................................................
(406,898)
(6.70)
RAIT I and RAIT II derivative liabilities
............................................................................................
62,144
1.02
Change in fair value for warrants and investor SARs
.................................................................... 10,673
0.18
Accumulated depreciation and amortization
.................................................................................
123,499
2.03
Valuation of recurring collateral and property management fees
................................................ 19,180
0.32
Total adjustments
.....................................................................................................................................
(191,402)
(3.15)
Adjusted book value
..................................................................................................................................
$
381,630
$
6.28
Adjusted Book Value
(1)
(All $ in 000s except per share numbers) |
 20
(1)
We believe that funds from operations, or FFO, and adjusted funds from
operations, or AFFO, each of which are non-GAAP measures, are additional appropriate measures of the operating
performance of a REIT and us in particular. We compute FFO in accordance with
the standards established by the National Association of Real Estate Investment Trusts, or NAREIT, as net
income or loss allocated to common shares (computed in accordance with GAAP),
excluding real estate-related depreciation and amortization expense, gains or losses on sales of real estate
and the cumulative effect of changes in accounting principles. AFFO is a
computation made by analysts and investors to measure a real estate company's cash flow generated by operations.
We calculate AFFO by adding to or subtracting from FFO: change in fair value of
financial instruments; gains or losses on debt extinguishment; capital expenditures, net of any direct financing
associated with those capital expenditures; straight-line rental effects;
amortization of various deferred items and intangible assets; and share-based compensation. Our calculation of AFFO
differs from the methodology used for calculating AFFO by certain other REITs
and, accordingly, our AFFO may not be comparable to AFFO reported by other REITs. Our management utilizes FFO
and AFFO as measures of our operating performance, and believes they are also
useful to investors, because they facilitate an understanding of our operating performance after adjustment for
certain
non-cash
items,
such
as
real
estate
depreciation,
share-based
compensation
and
various
other
items
required
by
GAAP
that
may
not
necessarily
be
indicative
of
current
operating
performance and that may not accurately compare our operating performance
between periods. Furthermore, although FFO, AFFO and other supplemental performance measures are defined
in various ways throughout the REIT industry, we also believe that FFO and AFFO
may provide us and our investors with an additional useful measure to compare our financial performance to
certain
other
REITs.
Neither
FFO
nor
AFFO
is
equivalent
to
net
income
or
cash
generated
from
operating
activities
determined
in
accordance
with
U.S.
GAAP.
Furthermore,
FFO
and
AFFO
do
no
t represent amounts available for management's discretionary use
because of needed capital replacement or expansion, debt service obligations
or other commitments or uncertainties. Neither FFO nor AFFO should be
considered as an alternative to net income as an indicator of our operating performance or as an alternative to cash flow from operating activities as a
measure of our liquidity.
References
to
“we”,
“us”,
and
“our”
refer
to
RAIT
Financial
Trust
and
its
subsidiaries.
(2)
Based on 60,363,153 weighted-average shares outstanding-diluted for the
three-month period ended March 31, 2013. (3)
Based on 44,150,924 weighted-average shares outstanding-diluted for the
three-month period ended March 31, 2012. For the Three-Month
Period Ended
March 31, 2013
For the Three-Month
Period Ended
March 31, 2012
Amount
Per Share (1)
Amount
Per Share (2)
Funds From Operations:
Net income (loss) allocable to common shares
........................................................ $
(90,532)
$
(1.50
$
(107,019
$
(2.42)
Adjustments:
Real estate depreciation and amortization
................................................... 7,973
0.13
7,459
0.17
(Gains) losses on the sale of real estate
........................................................
0
0.00
0
0.00
Funds From Operations
..............................................................................................
$
(82,559)
$
(1.37
$
(99,560
$
(2.25)
Adjusted Funds From Operations:
Funds From Operations
..............................................................................................
$
(82,559)
$
(1.37
$
(99,560
$
(2.25)
Adjustments:
Change in fair value of financial instruments
................................................ 99,757
1.65
108,923
2.48
(Gains) losses on debt extinguishment
..........................................................
0
0.00
(1,574
(0.04)
Capital expenditures, net of direct financing
................................................. (172)
0.00
(248
(0.01)
Straight-line rental adjustments
..................................................................... (288)
0.00
(306
(0.01)
Amortization of deferred items and intangible assets
.................................. 1,133
0.02
1,526
0.03
Share-based
compensation............................................................................
723
0.01
557
0.01
Adjusted Funds From
Operations...............................................................................
$
18,594
$
0.31
$
9,318
$
0.21
Adjusted Funds from Operations
(1)
(All $ in 000s except per share numbers) |
 21
RAIT Income Statement
(All $ in 000s except per share numbers) |
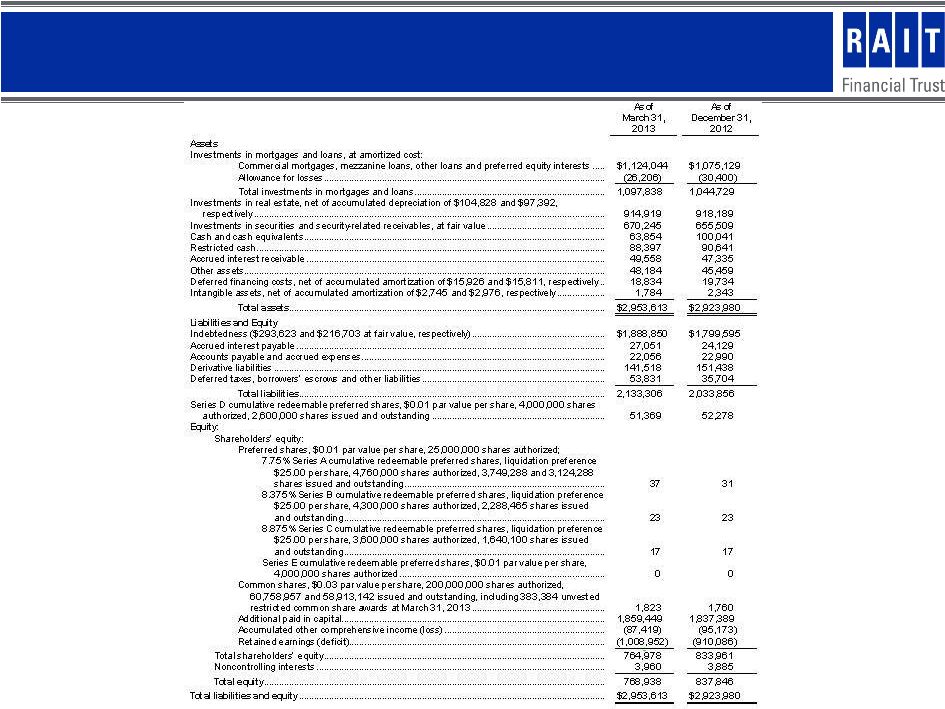 22
RAIT Balance Sheet
(All $ in 000s except per share numbers) |