Attached files
| file | filename |
|---|---|
| EX-99.1 - EX-99.1 - TCF FINANCIAL CORP | a13-10326_1ex99d1.htm |
| 8-K - 8-K - TCF FINANCIAL CORP | a13-10326_18k.htm |
Exhibit 99.2
|
|
E hibit 99 2 Exhibit 99.2 TCF Financial Corporation 2013 First Quarter Earnings Results Presentation |

|
|
Agenda . First Quarter Highlights - William Cooper Chairman & CEO) p ( ) . Credit / Expenses - (Chief Financial Officer) Mike Jones . Lending C i D hl (Vi Ch i fL di ) - Craig Dahl Vice Chairman of Lending) . Deposits & Fee Generation / Capital - Tom Jasper (Vice Chairman of Funding, Operations & Finance) . Summary - William Cooper (Chairman & CEO) . Q&A 2 |

|
|
First . 25 5 million 308 3 from first 2012 Quarter Highlights Net income of $25.5 million, up $308.3 million quarter . Earnings per share of 16 cents, up 100 percent from first quarter 2012 before the balance sheet charge repositioning . Net interest margin of 4.72 percent, up 58 bps from first quarter 2012 . Pre-tax pre-provision profit of $87.7 million, up 24.3 percent from first quarter 20121 . Provision for credit losses of $38.4 million, down 20.9 percent from first quarter 2012 . Over 60-day accruing delinquent loans decreased by $15.5 million, or 16.3 percent, from fourth quarter 2012 . Non-accrual loans and leases and other real estate owned decreased $61.3 million, or 12.9 percent, from fourth quarter 2012 . Average loans and leases increased $792.4 million, or 5.4 percent, from first quarter 2012 . Average deposits increased $1.8 billion, or 14.4 percent, from first quarter 2012 3 1 Pre-tax pre-provision profit (“PTPP”) is calculated as total revenues less non-interest expense. First quarter 2012 PTPP excludes the non-recurring net loss of $473.8 million related to the balance sheet repositioning completed in the first quarter of 2012. |

|
|
First Quarter Highlights – Revenue ($ millions) 8 5%from 1Q12 Growth Net Interest Income Fees & Other Revenue Net Interest Margin 1 1Q13 i t d b 2 Total revenue up 8.5% g $302 $292 $269 $298 $300 . revenue impacted by: . Customer-driven nature of leasing revenue $198 $201 $201 $199 $89 $100 $99 $101 $93 . Seasonality of deposit account fees . Decreased consumer spending $180 4 14% 4.86% 4 85% 4.79% 4.72% . Sale of consumer real estate and auto loans . 1Q13 net margin impacted by: 4.14% 4.85% Q g p y . Loan and lease yield compression due to the lower interest rate environment 3/12 6/12 9/12 12/12 3/13 1 E l d i /(l ) l f iti f $76 6 illi $13 1 illi $13 0 illi $(528) th d d $0 t 3/12 6/12 9/12 12/12 d 3/13 . Higher than anticipated asset liquidity balances 4 Excludes gains/(losses) on sales of securities of 76.6 million, 13.1 million, 13.0 million, thousand, and at 12, 12, 12, 12, and 13, respectively 2 Annualized |

|
|
First Quarter Highlights – Banks $10-$50 billion l 1 Peer Analysis As a % of average assets : Net interest 4 36% 3 28% TCF 1Q132 in total assets1 2012 Average income 4.36% 3.28% Adjusted non-interest income 3 2.03% 1.24% Adjusted revenue 3 6.40% 4.52% Adj. pre-tax pre-provision profit 4 1.92% 1.67% . TCF has a higher margin because more j p p p p Net interest margin 4.72% 3.58% Yield on loans 5.38% 5.15% it has loans at a higher rate and deposits at a lower rate Yield on securities 2.84% 2.82% Rate on deposits .28% .50% . TCF has more fee income due to a large and diversified base As a % of average assets: Securities 3.70% 24.56% Loans and leases 84.80% 65.72% Deposits 76.94% 75.99% of revenue sources p Borrowings 10.61% 12.62% 1 All publicly-traded banks and thrifts excluding TCF 2 Annualized 3 Excludes gains on sales of securities and non-recurring items (see “Reconciliation of GAAP to Non-GAAP Financial Measures – Revenue Ratios” slide) 5 4 Total revenue less non-interest expense; excludes gains on sales of securities and non-recurring items (see “Reconciliation of GAAP to Non-GAAP Financial Measures – Revenue Ratios” slide) Source: Banks $10-$50 Billion in Total Assets data – SNL Financial LC; 12/31/2012 |

|
|
Credit Quality Highlights Consumer Real Estate – key metrics show positive trend as home values improve . Over 60-day delinquencies1 decreased $13.3 million, or 14.9 percent, from fourth quarter 2012 . Non-accrual loans and leases and other real estate owned decreased $38.0 million, or 12.5 percent, from fourth quarter 2012 . Net charge-offs decreased $3.5 million, or 10.2 percent, from fourth quarter 2012 Commercial – credit issues contained . Non accrual loans and leases and other real estate 21 3 million or 13 7 Non-owned decreased $21.3 million, 13.7 percent, from fourth quarter 2012 . Classified assets down $44.8 million from fourth quarter 2012 . Net charge-offs of $7.8 million, down $502 thousand, or 6.0 percent, from fourth quarter 2012 Leasing, Auto and Finance – Inventory continued strong credit performance . First quarter net charge-offs of 17 bps2, down 1 bp from fourth quarter 2012 . Over 60-day delinquencies1 of 5 bps, down 1 bp from fourth quarter 2012 6 1 Excluding non-accrual loans and leases and acquired portfolios 2 Annualized |

|
|
Credit Trends N A lL dL dOh R lE O d ($ millions) $542 $600 Non-Accrual Loans and Leases and Other Real Estate Owned Over 60-day Delinquencies (1) Net Charge-offs $458 $438 $433 $436 $450 $476 $415 $439 (2) $400 $500 $359 (2) $293 (2) $300 $ $ $200 $101 $103 114 112 $108 $98 $95 $80 $ $53 $58 $ $104 $ $ $100 44 39 $45 46 41 $0 2Q11 3Q11 4Q11 1Q12 2Q12 3Q12 4Q12 1Q13 (1) E l d i d f li d l l d l 7 Excludes acquired portfolios and non-accrual loans and leases. (2) Excludes $122.1 million, $117.7 million and $103.2 million of non-accrual assets at March 31, 2013, December 31, 2012 and September 30, 2012, respectively, associated with the implementation of clarifying bankruptcy-related regulatory guidance in the third quarter of 2012. |

|
|
Home Prices S&P/Case-Shiller Home Price Indices in Case TCF Markets show slow improvement in our core markets in 2012 and 2013 140.00 150.00 AZ-Phoenix CO-Denver IL-Chicago MI-Detroit MN-Minneapolis 110 00 120.00 130.00 80 00 90.00 100.00 110.00 60.00 70.00 80.00 Case-Home Price Indices are constructed to accurately track single-located in 50.00 Jan-09 Jan-10 Jan-11 Jan-12 Jan-13 8 The S&P/Case Shiller the price path of typical single family homes each metropolitan area provided. The S&P/Case-Shiller Composite of 20 Home Price Index is a value-weighted average of the 20 metro area indices. The indices have a base value of 100 in January 2000; thus, for example, a current index value of 150 translates to a 50% appreciation rate since January 2000 for a typical home located within the subject market. |

|
|
Core Operating Expenses ($ millions) G i Other Deposit Premiums & Marketing Occupancy & Equipment Grow revenue into expense base in 2013 $187 $ 189 $186 $207 $195 200 p y q p Compensation & Benefits . Higher compensation expenses due to continuing 89 150 growth in lending platforms and quarter seasonality of taxes 100 payroll . Accelerated foreclosed real t t 50 estate expenses 0 9 3/12 6/12 9/12 12/12 3/13 |
|
|
Lending – Portfolio Balances ($ millions) $15,208 $15,613 TCF i t i ll 11% 12% Inventory Finance . maintains a welldiversified loan and lease portfolio by 21% 20% 53% Wholesale Leasing & Equipment Finance Commercial business unit, segment, geography, rate, duration and collateral type 23% 21% Auto Finance Consumer RE & Other . First quarter loan growth despite $470 million in 1% 5% loan sales 44% 42% 47% Retail 10 3/12 3/13 |
|
|
Annual Loan and Lease O i i ti Originations origination opportunities continue ($ millions) 1Q12 1Q13 Change Change in New Volume Loan and lease Period Beginning Balance $14,150 $15,426 $1,276 ($ millions) 1Q12 vs. 1Q13 g New Volume 2,694 2,670 (24) Run-off 1 (1,636) (2,483) (847) Consumer Real Estate $ 144 Auto Finance 167 l l Period Ending Balances $15,208 $15,613 $405 Total Retail 311 Commercial 4 Leasing ( 11) g ) Inventory Finance2 (328) Total (335) . Strong diversity across asset classes . 1Q12 was impacted by the buy-out of Wholesale Total Lending $ (24) BRP assets of $589.2 million, as the program commenced 11 1 Includes activity from payments, pre-payments, charge-offs and loan and lease sales 2 Origination levels impacted by the high velocity of fundings and repayments with dealers |

|
|
Loan and Lease Sales ($ millions) 20 Gains on Sales of Consumer Real Estate Loans Gains on Sales of Auto Loans Sales of consumer real estate and auto loans is a core competency and revenue stream $15.3 15 . 1Q13 auto loan sales of $179.8 million with gain of $7.1 million $4 6 $8.1 $12.0 10 . 1Q13 consumer real estate loan sales of $279.2 million with gain of $8 1 illi 4.6 $.9 $5.5 $7.7 8.1 million . TCF’s strong origination capabilities bl th i ti t hil $5.5 $7.5 $6.9 $7.1 $2.3 5 enable the organization to grow while generating fee income $2.3 0 3/12 6/12 9/12 12/12 3/13 12 |

|
|
Loan and Lease Yields Utilize diverse lending mix to remain competitive 1Q13 1Q12 2Q12 3Q12 4Q12 despite low rate environment Consumer real estate 5.65% 5.54% 5.60% 5.60% 5.58% Auto Finance 7.44 6.89 5.97 5.53 5.23 Commercial 5.32 5.16 5.14 5.10 4.86 Leasing & Equipment Finance 5.63 5.48 5.33 5.24 5.11 Inventory Finance 6.58 6.07 6.19 6.11 6.16 Total Loans and Leases 5.65 5.52 5.50 5.47 5.38 . Competitive commercial marketplace; large banks in all of our markets competing on price for assets . Growth in auto business with yield compression due to lower yields on new originations in the current low rate environment and continued sales of lower FICO originations 13 |

|
|
Deposit Generation CD's Ch k p Quarterly Average Balances millions) $13 558 $13 757 14 000 Checking Money Market Savings . Checking account attrition t h d li df fi ($ $14,038 $12,268 $13,047 13,558 13,757 12,000 14,000 rates have declined for five consecutive quarters A ttld ith 8,000 10,000 . Average total deposits have increased for ten consecutive quarters 6,000 , . Target marketing, providing the right products to the right t th h i 2,000 4,000 customers through various channels at the right time . 0 3/12 6/12 9/12 12/12 3/13 Senior Funding process uses “switches and dials” to deliver on lending demand 14 .30% .31% .32% .32% .28% Average cost: |

|
|
Net Banking Fee Generation g ($ millions) Net fee income stabilized 1Q12 2Q12 3Q12 4Q12 1Q13 1Q12 vs 1Q13 card Fees & service charges, revenue and ATM revenue1 $56.0 $63.3 $62.8 $62.8 $57.2 2.1% Fees affected by return to free checking 5.3 4.6 -- -- -- (100)% M k i & d i Marketing deposit account premium expense (8.6) (7.1) (4.7) (4.8) (6.3) (26.7)% Net Fee Income $52.7 $60.8 $58.1 $58.0 $50.9 (3.4)% . Net checking accounts have grown three consecutive quarters by an annualized average of 5.2% . Net fee income was down from the fourth quarter of 2012 by $7.1 million, impacted by first quarter q y p y q seasonality and lower first quarter consumer spending . “Retail sales in the U.S. dropped in March by the most in nine months, pointing to a slowdown in consumer spending as the first quarter drew to a close. Purchases fell 0.4 percent, the biggest b k ” l b ( / / ) setback since June” ~ Bloomberg (4/12/13) . “the latest Thomson Reuters/University of Michigan reading on consumer sentiment fell to the lowest level in nine months.” ~Wall Street Journal (4/12/13) 15 1 Net of fees affected by return to free checking |

|
|
Capital Ratios – Holding Company Sufficient capital levels for growth strategy Ratios 4Q12 1Q13 Capital 1Q13_ Tangible realized common equity1 7.52% 7.55% Tier 1 common capital2 9.21% 9.24% Tier 1 leverage capital 9.21% 9.23% Tier 1 risk-based capital 11.09% 11.14% Total risk-based capital 13.63% 13.49% . Focus on building capital through retained earnings in the quarter and going forward 16 1 See “Reconciliation of GAAP to Non-GAAP Financial Measures – Tangible Realized Common Equity” slide 2 See “Reconciliation of GAAP to Non-GAAP Financial Measures – Tier 1 Common Capital Ratio” slide |
|
|
Summary . Continued credit improvement in 1Q13 . Decreasing non-accrual loans and leases and other real estate owned . Improving home values in our markets . Key commercial credit metrics all show improvement in 1Q13 . Balancing a diversified revenue base . Revitalized deposit base leading to revenue growth opportunities . Core loan sale opportunities in auto finance and consumer real estate . Strong net interest margin following balance sheet repositioning g g g p g . Disciplined growth in high-quality lending businesses . Continued growth in finance Co t ued g o t auto a ce . Inventory finance growth opportunities through new programs and relationship expansion with existing dealers 17 |

|
|
Cautionary Statements for Purposes of the Safe Harbor Provisions of the Securities Litigation Reform Act Any statements contained in this earnings presentation regarding the outlook for the Company’s businesses and their respective markets, such as projections of future performance, guidance, statements of the Company’s plans and objectives, forecasts of market trends and other matters, are forward-looking statements based on the Company’s assumptions and beliefs. Such statements may be identified by such words or phrases as “will likely result,” “are expected to,” “will continue,” “outlook,” “will benefit,” “is anticipated,” “estimate,” “project,” “management believes” or similar expressions. These forward-looking statements are subject to certain risks and uncertainties that could cause actual results to differ materially from those discussed in such statements and no assurance given results in forward-achieved For these statements TCF claims the protection of the safe harbor can be that the any looking statement will be achieved. statements, for forward-looking statements contained in the Private Securities Litigation Reform Act of 1995. Any forward-looking statement speaks only as of the date on which it is made, and we disclaim any obligation to subsequently revise any forward-looking statement to reflect events or circumstances after such date or to reflect the occurrence of anticipated or unanticipated events. Certain factors could cause the Company’s future results to differ materially from those expressed or implied in any forward-looking statements contained in f py f ff y f p p y f g this earnings release. These factors include the factors discussed in Part I, Item 1A of the Company’s Annual Report on Form 10-K under the heading “Risk Factors,” the factors discussed below and any other cautionary statements, written or oral, which may be made or referred to in connection with any such forward-looking statements. Since it is not possible to foresee all such factors, these factors should not be considered as complete or exhaustive. Adverse Economic or Business Conditions; Competitive Conditions; Credit and Other Risks. Deterioration in general economic and banking industry dii i l di d f l i i dd f l i d d f i d b (i l di d b f h US) i dhi h f conditions, including defaults, anticipated defaults or rating agency downgrades of sovereign debt including debt of the U.S.), or continued high rates of or increases in unemployment in TCF’s primary banking markets; adverse economic, business and competitive developments such as shrinking interest margins, reduced demand for financial services and loan and lease products, deposit outflows, deposit account attrition or an inability to increase the number of deposit accounts; customers completing financial transactions without using a bank; adverse changes in credit quality and other risks posed by TCF’s loan, lease, investment and securities available for sale portfolios, including declines in commercial or residential real estate values or changes in the allowance for loan f p f , g g f and lease losses dictated by new market conditions or regulatory requirements; interest rate risks resulting from fluctuations in prevailing interest rates or other factors that result in a mismatch between yields earned on TCF’s interest-earning assets and the rates paid on its deposits and borrowings; foreign currency exchange risks; counterparty risk, including the risk of defaults by our counterparties or diminished availability of counterparties who satisfy our credit quality requirements; decreases in demand for the types of equipment that TCF leases or finances; the effect of any negative publicity. Legislative and Regulatory Requirements. New consumer protection and supervisory requirements and regulations, including those resulting from action by the Consumer Financial Protection Bureau and changes in the scope of Federal preemption of state laws that could be applied to national banks; the imposition of requirements with an adverse impact relating to TCF’s lending, loan collection and other business activities as a result of the Dodd-Frank Act, or other legislative or regulatory developments such as mortgage foreclosure moratorium laws or imposition of underwriting or other limitations that impact the ability to use certain variable-rate legislative, or other affecting customer account charges income; 18 variable products; impact of regulatory changes and fee changes to bankruptcy laws which would result in the loss of all or part of TCF’s security interest due to collateral value declines; deficiencies in TCF’s (continued) |

|
|
Cautionary Statements for Purposes of the Safe Harbor Provisions of the Securities Litigation Reform Act (continued) compliance Secrecy Act in past or future periods which may result in regulatory enforcement action including under the Bank periods, monetary penalties; increased health care costs resulting from Federal health care reform legislation; adverse regulatory examinations and resulting enforcement actions or other adverse consequences such as increased capital requirements or higher deposit insurance assessments; heightened regulatory practices, requirements or expectations, including, but not limited to, requirements related to the Bank Secrecy Act and anti-money laundering compliance activity. Earnings/Capital Risks and Constraints, Liquidity Risks. Limitations on TCF’s ability to pay dividends or to increase dividends because of financial g p q y y p y ff performance deterioration, regulatory restrictions or limitations; increased deposit insurance premiums, special assessments or other costs related to adverse conditions in the banking industry, the economic impact on banks of the Dodd-Frank Act and other regulatory reform legislation; the impact of financial regulatory reform, including additional capital, leverage, liquidity and risk management requirements or changes in the composition of qualifying regulatory capital (including those resulting from U.S. implementation of Basel III requirements); adverse changes in securities markets directly or indirectly affecting TCF’s sell assets or to fund its operations; diminished unsecured rating downgrades unfavorable TCF s ability to borrowing capacity resulting from TCF credit and conditions in the credit markets that restrict or limit various funding sources; costs associated with new regulatory requirements or interpretive guidance relating to liquidity; uncertainties relating to customer opt-in preferences with respect to overdraft fees on point of sale and ATM transactions or the success of TCF’s reintroduction of free checking, which may have an adverse impact on TCF’s fee revenue; uncertainties relating to future retail deposit account changes, including limitations on TCF’s ability to predict customer behavior and the impact on TCF’s fee revenues. Supermarket Branching Risk; Growth Risks. Adverse developments affecting TCF’s supermarket banking relationships or any of the supermarket chains in which TCF maintains supermarket branches, including SUPERVALU’s sale of several of its supermarket chains, including Jewel-Osco®, in which TCF has 156 branches; slower than anticipated growth in existing or acquired businesses; inability to successfully execute on TCF’s growth strategy through acquisitions or cross-selling opportunities; failure to expand or diversify TCF’s balance sheet through programs or new opportunities; failure to successfully tt t d t i t i l di th f il t tt t d t i f t d d l t d th i t fi b i i k l t d attract and retain new customers, including the failure to attract and retain manufacturers and dealers to expand the inventory finance business; risks related to new products and addition of distribution channels (or entry into new markets) for existing products. Technological and Operational Matters. Technological or operational difficulties, loss or theft of information, cyber-attacks and other security breaches, counterparty failures and the possibility that deposit account losses (fraudulent checks, etc.) may increase; failure to keep pace with technological change. Risks Results litigation class action litigation concerning TCF’s activities processes or Litigation Risks. of litigation, including TCF s lending or deposit including account servicing fees or charges, or employment practices, and possible increases in indemnification obligations for certain litigation against Visa U.S.A. and potential reductions in card revenues resulting from such litigation or other litigation against Visa. Accounting, Audit, Tax and Insurance Matters. Changes in accounting standards or interpretations of existing standards; federal or state monetary, fiscal or tax policies, including adoption of state legislation that would increase state taxes; ineffective internal controls; adverse state or Federal tax assessments or 19 p g p f g ff findings in tax audits; lack of or inadequate insurance coverage for claims against TCF; potential for claims and legal action related to TCF’s fiduciary responsibilities. |

|
|
Appendix 20 |
|
|
Reconciliation of GAAP to Non-GAAP Financial Measures – Tangible Realized C E it1 Common Equity1 Mar 31 ($000s) Dec 31 Computation of tangible realized common equity to tangible assets Total equity $ 1,876,643 $ 1,900,159 Mar. 31, 2013 Dec. 31, 2012 Less: Non-controlling interest in subsidiaries 13,270 20,933 Total TCF stockholders’ equity 1,863,373 1,879,226 Less: Preferred stock 263,240 263,240 Goodwill 225,640 225,640 Intangibles 8,674 7,860 Accumulated other comprehensive income 12 443 3 536 12,443 3,536 Tangible realized common equity $ 1,353,376 $ 1,378,950 Total assets $ 18,225,917 $ 18,504,026 Less: Goodwill 225,640 225,640 Intangibles 8,674 7,860 Tangible assets $ 17,991,603 $ 18,270,526 1 When capital adequacy and utilization, management considers Common Equity Tangible Assets g , , , , Total realized common equity to tangible assets 7.52 % 7.55 % 21 evaluating financial measures such as Tangible Realized to and the Tier 1 Common Capital Ratio. These measures are non-GAAP financial measures and are viewed by management as useful indicators of capital levels available to withstand unexpected market or economic conditions, and also provide investors, regulators, and other users with information to be viewed in relation to other banking institutions. |

|
|
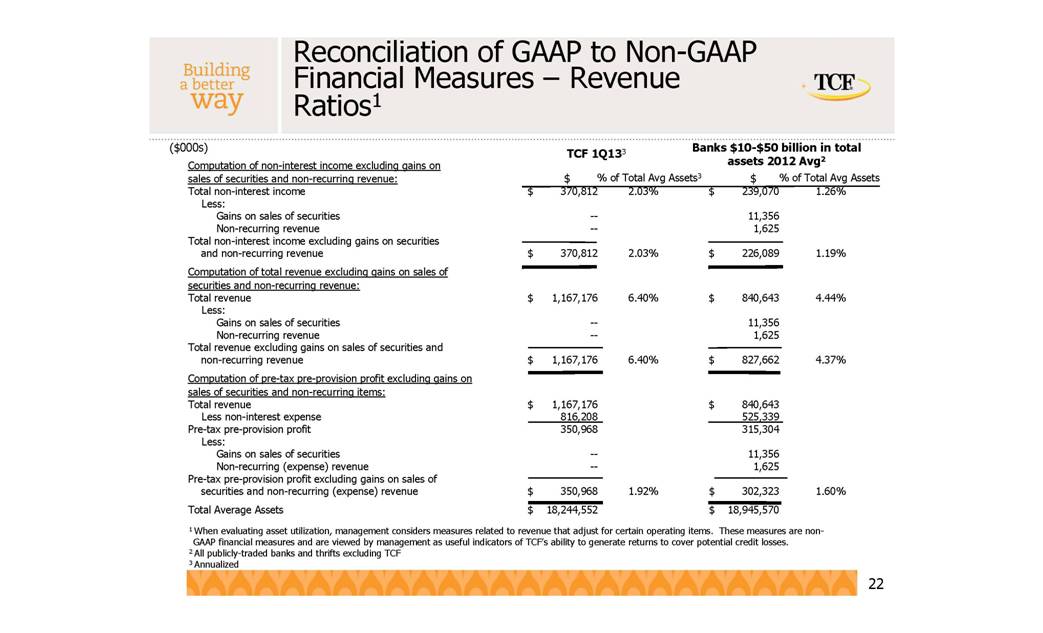
Reconciliation of GAAP to Non-GAAP Financial Measures – Revenue R ti 1 f l d Ratios1 TCF 1Q133 Banks $10-$50 billion in total assets 2012 Avg2 ($000s) $ Computation of non-interest income excluding gains on sales of securities and non-recurring revenue: Total non-interest income $ 370,812 2.03% $ 239,070 1.26% Less: Gains on sales of securities -- 11,356 % of Total Avg Assets3 $ % of Total Avg Assets Non-recurring revenue -- 1,625 Total non-interest income excluding gains on securities and non-recurring revenue $ 370,812 2.03% $ 226,089 1.19% Computation of total revenue excluding gains on sales of securities and non-recurring revenue: Total revenue $ 1,167,176 6.40% $ 840,643 4.43% Less: Gains on sales of securities -- 11,356 Non-recurring revenue -- 1,625 gains on Total revenue excluding sales of securities and non-recurring revenue $ 1,167,176 6.40% $ 827,662 4.37% Computation of pre-tax pre-provision profit excluding gains on sales of securities and non-recurring items: Total revenue $ 1,167,176 $ 840,643 , , , Less non-interest expense 816,208 525,339 Pre-tax pre-provision profit 350,968 315,304 Less: Gains on sales of securities -- 11,356 Non-recurring expense) revenue -- 1,625 g ( p ) , Pre-tax pre-provision profit excluding gains on sales of securities and non-recurring (expense) revenue $ 350,968 1.92% $ 302,323 1.60% Total Average Assets $ 18,244,552 $ 18,945,570 1 When utilization, management considers measures related to operating items. non- 22 evaluating asset revenue that adjust for certain These measures are non GAAP financial measures and are viewed by management as useful indicators of TCF’s ability to generate returns to cover potential credit losses. 2 All publicly-traded banks and thrifts excluding TCF 3 Annualized |
|
|
Reconciliation of GAAP to Non-GAAP Financial Measures – Tier 1 Common Capital ($000s) p Ratio1 Dec. 31, 2012 Tier 1 risk-based capital ratio: Tier 1 capital $ 1,633,336 Mar. 31, 2013 $ 1,666,630 Total risk-weighted assets $ 14,733,203 Tier 1 risk-based capital ratio 11.09 % $ 14,964,703 11.14 % Computation of tier 1 common capital ratio: Tier 1 capital $ 1,633,336 Less: $ 1,666,630 Preferred stock 263,240 Qualifying non-controlling interest in subsidiaries 13,270 263,240 20,933 Tier 1 common capital 1,356,826 Tier 1 common capital ratio 9.21 % 1,382,457 9.24 % 1 When capital adequacy and utilization, management considers Common Equity Tangible 23 evaluating financial measures such as Tangible Realized to Assets and the Tier 1 Common Capital Ratio. These measures are non-GAAP financial measures and are viewed by management as useful indicators of capital levels available to withstand unexpected market or economic conditions, and also provide investors, regulators, and other users with information to be viewed in relation to other banking institutions. |
