Attached files
| file | filename |
|---|---|
| 8-K - FORM 8-K - FURMANITE CORP | d499389d8k.htm |
| EX-99.1 - EX-99.1 - FURMANITE CORP | d499389dex991.htm |
 Furmanite Corporation
QUARTER & YEAR ENDED
DECEMBER 31, 2012
Charles R. Cox, Chairman & CEO
Joseph E. Milliron, President & COO
Robert S. Muff, Principal Financial Officer
Exhibit 99.2 |
 2
Certain of the Company’s
statements in this presentation are not purely historical, and as such
are “forward-looking statements” within the meaning of the Private Securities
Litigation Reform Act of 1995. These include statements regarding
management’s plans, beliefs, expectations, intentions or projections
of the future. Forward-looking statements involve risks and
uncertainties, including without limitation, the various risks inherent in
the Company’s business, and other risks and uncertainties detailed most
recently in this presentation and the Company’s Form 10-K as of
December 31, 2012 filed with the Securities and Exchange Commission. One
or more of these factors could affect the Company’s business and
financial results in future periods, and could cause actual results to
differ materially from plans and projections. There can be no assurance that the
forward-looking statements made in this document will prove to be accurate,
and issuance of such forward-looking statements should not be
regarded as a representation by the Company, or any other person, that
the objectives and plans of the Company will be achieved. All
forward-looking statements made in this presentation are based on
information presently available to management, and the Company assumes no
obligation to update any forward-looking statements. Safe Harbor Statement
|
 Furmanite Corporation
QUARTER & YEAR ENDED
DECEMBER 31, 2012
Charles R. Cox, Chairman & CEO
3 |
 4
2012 Perspective
•
Critically Important Year for Furmanite
•
Major Change and Progress
•
Concludes Three Years of Preparation for Future
•
All Elements of Transformation Now in Place
•
EMEA Restructuring Complete
•
Q4 Revenues & Earnings Positive Indication
•
Entering 2013 Positioned for Accelerated Growth
Charles R. Cox, Chairman & CEO |
 Furmanite Corporation
QUARTER & YEAR ENDED
DECEMBER 31, 2012
Financial Review
Robert S. Muff, Principal Financial Officer
5 |
 Condensed
Consolidated Statements of Income ($
in
000s
except
percentages
and
per
share
amounts)
(Unaudited)
6
For the Three Months Ended
December 31,
2012
% of
Rev
2011
% of
Rev
Change
Revenues
$ 93,203
100.0%
$ 81,814
100.0%
$ 11,389
Operating costs
64,347
69.0%
58,451
71.4%
5,896
Depreciation and amortization expense
2,571
2.8%
1,951
2.4%
620
Selling, general and administrative expense
19,352
20.8%
16,819
20.6%
2,533
Operating income, excluding restructuring costs
6,933
7.4%
4,593
5.6%
2,340
Restructuring costs
2,745
2.9%
96
0.1%
2,649
Operating income
4,188
4.5%
4,497
5.5%
(309)
Interest and other income (expense), net
(235)
(286)
51
Income before income taxes
3,953
4,211
(258)
Income tax (expense) benefit
(2,882)
7,005
(9,887)
Net income
$ 1,071
$ 11,216
$ (10,145)
Diluted earnings per share
$ 0.03
$ 0.30
$ (0.27)
Adjusted diluted earnings per share*
$ 0.10
$ 0.30
$ (0.20)
* Excludes $2.7 million and $0.1 million
of restructuring costs, net of tax for the three months ended December 31, 2012 and 2011,
respectively. |
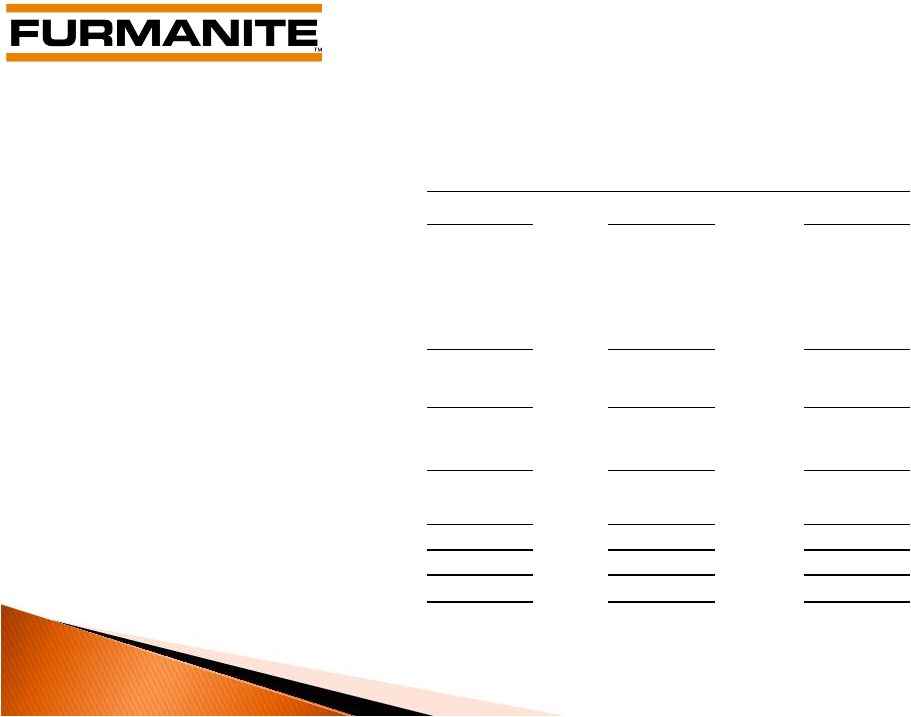
 Condensed
Consolidated Statements of Income ($ in 000s except percentages and per share
amounts) 7
For the Twelve Months Ended
December 31,
2012
% of
Rev
2011
% of
Rev
Change
Revenues
$ 326,492
100.0%
$ 316,207
100.0%
$ 10,285
Operating costs
231,051
70.8%
218,983
69.2%
12,068
Depreciation and amortization expense
8,889
2.7%
8,231
2.6%
658
Selling, general and administrative expense
75,463
23.1%
68,176
21.6%
7,287
Operating income, excluding restructuring costs
11,089
3.4%
20,817
6.6%
(9,728)
Restructuring costs
3,577
1.1%
366
0.1%
3,211
Operating income
7,512
2.3%
20,451
6.5%
(12,939)
Interest and other income (expense), net
(1,342)
(1,143)
(199)
Income before income taxes
6,170
19,308
(13,138)
Income tax (expense) benefit
(5,365)
4,662
(10,027)
Net income
$ 805
$ 23,970
$ (23,165)
Diluted earnings per share
$ 0.02
$ 0.64
$ (0.62)
Adjusted diluted earnings per share*
$ 0.11
$ 0.65
$ (0.54)
* Excludes $3.6 million and $0.4 million of restructuring costs, net of tax for the years
ended December 31, 2012 and 2011, respectively. |
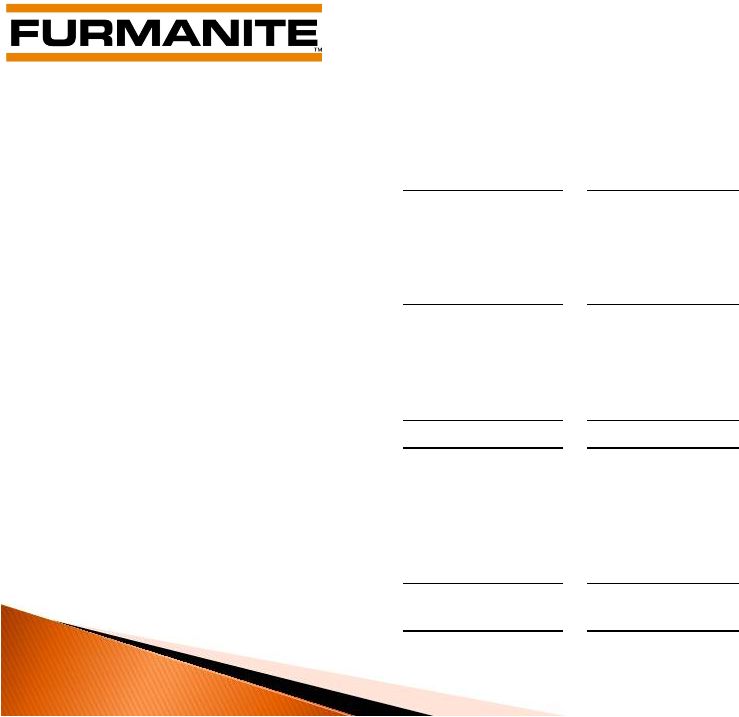 Condensed Consolidated Balance Sheets
($ in 000s)
8
December 31,
December 31,
2012
2011
Cash
$ 33,185
$ 34,524
Trade receivables, net
77,042
71,508
Inventories
31,711
26,557
Other current assets
15,355
13,171
Total current assets
157,293
145,760
Property and equipment, net
42,243
34,060
Other assets
32,092
27,412
Total assets
$ 231,628
$ 207,232
Total current liabilities
$ 50,439
$ 41,999
Total long-term debt
39,609
31,051
Other liabilities
22,501
15,293
Total stockholders' equity
119,079
118,889
Total liabilities and
stockholders' equity
$ 231,628
$ 207,232 |
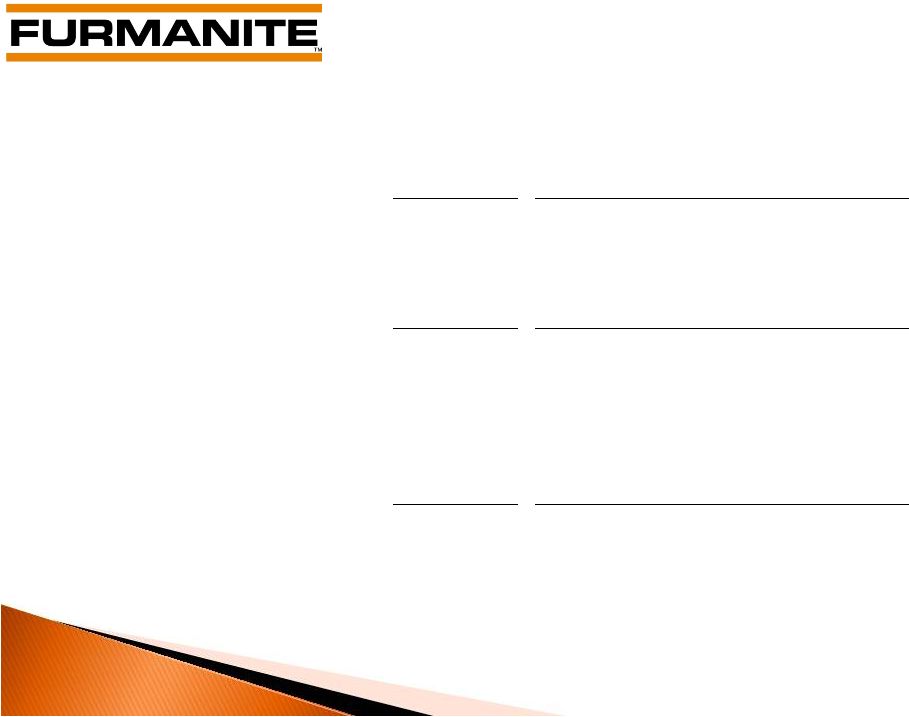
 Condensed Consolidated Statements of Cash Flows
($ in 000s)
9
For the Years Ended
December 31,
2012
2011
Net income
$ 805
$ 23,970
Depreciation, amortization and other non-cash items
14,741
921
Working capital changes
(669)
(17,003)
Net cash provided by operating activities
14,877
7,888
Capital expenditures
(9,286)
(6,450)
Acquisition of businesses, net of cash acquired
(12,540)
(4,073)
Payments on debt
(34,191)
(207)
Proceeds from issuance of debt
39,300
–
Other, net
129
407
Effect of exchange rate changes on cash
372
(211)
Decrease in cash and cash equivalents
(1,339)
(2,646)
Cash and cash equivalents at beginning of year
34,524
37,170
Cash and cash equivalents at end of year
$ 33,185
$ 34,524 |
 Furmanite Corporation
QUARTER & YEAR ENDED
DECEMBER 31, 2012
Operations Review
Joseph E. Milliron, President and Chief Operating Officer
10 |
 As of December 31, 2012
11
Global Service Network
The
Americas
827 technicians
56% of YTD revenues
30 locations
378 technicians
33% of YTD revenues
30 locations
132 technicians
11% of YTD revenues
15 locations
EMEA
APAC |
 12
Total
Americas
EMEA
APAC
On-line Services 4
th
Qtr. 2012
$ 36,200
$ 20,730
$ 12,220
$ 3,250
On-line Services 4
th
Qtr. 2011
34,410
18,462
12,220
3,728
Variance
$ 1,790
$ 2,268
$ (478)
On-line Services YTD 2012
$ 126,819
$ 69,734
$ 42,221
$ 14,864
On-line Services YTD 2011
124,836
67,139
43,909
13,788
Variance
$ 1,983
$ 2,595
$ 1,076
Business
and
Geographic
Data
–
On-line¹
Services
Revenues
($ in 000’s) (Unaudited)
1
Formerly referred to as under-pressure services
$
$
–
(1,688) |
 Business
and
Geographic
Data
–
Off-line¹
Services
Revenues
($ in 000’s) (Unaudited)
13
1
Formerly referred to as turnaround services
Total
Americas
EMEA
APAC
Off-line
Services
4
th
Qtr.
2012
$ 42,561
$ 25,713
$ 12,038
4,810
Off-line
Services
4
th
Qtr.
2011
34,622
18,632
11,110
4,880
Variance
$ 7,939
Off-line Services YTD 2012
$ 146,013
$ 83,430
$ 42,783
$ 19,800
Off-line Services YTD 2011
137,883
66,785
50,147
20,951
Variance
$ 8,130
(1,151)
928
$
(70)
$
(7,364)
$
$
$
$
16,645
7,081
$ |
 To safely and ethically establish
Furmanite as the World leader in all our
Service Lines by 2014, through
Innovation, Global Teamwork, Market
Dominance, Project Excellence and
Customer Service Perfection.
“The World Leader in All
Service Lines
by
2014”
14
Furmanite Vision |
 Furmanite Corporation
Review of 4Q 2012
March 8, 2013
www.furmanite.com
15 |