Attached files
| file | filename |
|---|---|
| 8-K - 8-K - TCF FINANCIAL CORP | a13-4831_18k.htm |
Exhibit 99.1
|
|
TCF Financial Corporation 2012 Fourth Quarter Investor Presentation Logo TCF Financial Corporation Foundational strength. Visionary future. |
|
|
Cautionary Statements for Purposes of the Safe Harbor Provisions of the Securities Litigation Reform Act Any statements contained in this investor presentation regarding the outlook for the Company’s businesses and their respective markets, such as projections of future performance, guidance, statements of the Company’s plans and objectives, forecasts of market trends and other matters, are forward-looking statements based on the Company’s assumptions and beliefs. Such statements may be identified by such words or phrases as “will likely result,” “are expected to,” “will continue,” “outlook,” “will benefit,” “is anticipated,” “estimate,” “project,” “management believes” or similar expressions. These forward-looking statements are subject to certain risks and uncertainties that could cause actual results to differ materially from those discussed in such statements and no assurance can be given that the results in any forward-looking statement will be achieved. For these statements, TCF claims the protection of the safe harbor for forward-looking statements contained in the Private Securities Litigation Reform Act of 1995. Any forward-looking statement speaks only as of the date on which it is made, and we disclaim any obligation to subsequently revise any forward-looking statement to reflect events or circumstances after such date or to reflect the occurrence of anticipated or unanticipated events. Certain factors could cause the Company’s future results to differ materially from those expressed or implied in any forward-looking statements contained in this investor presentation. These factors include the factors discussed in Part I, Item 1A of the Company’s Annual Report on Form 10-K under the heading “Risk Factors,” the factors discussed below and any other cautionary statements, written or oral, which may be made or referred to in connection with any such forward-looking statements. Since it is not possible to foresee all such factors, these factors should not be considered as complete or exhaustive. Adverse Economic or Business Conditions; Competitive Conditions; Credit and Other Risks. Deterioration in general economic and banking industry conditions, including defaults, anticipated defaults or rating agency downgrades of sovereign debt (including debt of the U.S.), or continued high rates of or increases in unemployment in TCF’s primary banking markets; adverse economic, business and competitive developments such as shrinking interest margins, reduced demand for financial services and loan and lease products, deposit outflows, deposit account attrition or an inability to increase the number of deposit accounts; customers completing financial transactions without using a bank; adverse changes in credit quality and other risks posed by TCF’s loan, lease, investment and securities available for sale portfolios, including declines in commercial or residential real estate values or changes in the allowance for loan and lease losses dictated by new market conditions or regulatory requirements; interest rate risks resulting from fluctuations in prevailing interest rates or other factors that result in a mismatch between yields earned on TCF’s interest-earning assets and the rates paid on its deposits and borrowings; foreign currency exchange risks; counterparty risk, including the risk of defaults by our counterparties or diminished availability of counterparties who satisfy our credit quality requirements; decreases in demand for the types of equipment that TCF leases or finances; the effect of any negative publicity. Legislative and Regulatory Requirements. New consumer protection and supervisory requirements and regulations, including those resulting from action by the Consumer Financial Protection Bureau and changes in the scope of Federal preemption of state laws that could be applied to national banks; the imposition of requirements with an adverse impact relating to TCF’s lending, loan collection and other business activities as a result of the Dodd-Frank Act, or other legislative or regulatory developments such as mortgage foreclosure moratorium laws or imposition of underwriting or other limitations that impact the ability to use certain variable-rate products; impact of legislative, regulatory or other changes affecting customer account charges and fee income; changes to bankruptcy laws which would result in the loss of all or part of TCF’s security interest due to collateral value declines; deficiencies in TCF’s compliance under the Bank Secrecy Act in past or future periods, which may result in regulatory enforcement action including monetary penalties; increased health care costs resulting from Federal health care reform legislation; adverse regulatory examinations and resulting enforcement actions or other adverse consequences such as increased capital requirements or higher deposit insurance assessments; heightened regulatory practices, requirements (continued) |
|
|
or expectations, including, but not limited to, requirements related to the Bank Secrecy Act and anti-money laundering compliance activity. Earnings/Capital Risks and Constraints, Liquidity Risks. Limitations on TCF’s ability to pay dividends or to increase dividends because of financial performance deterioration, regulatory restrictions or limitations; increased deposit insurance premiums, special assessments or other costs related to adverse conditions in the banking industry, the economic impact on banks of the Dodd-Frank Act and other regulatory reform legislation; the impact of financial regulatory reform, including additional capital, leverage, liquidity and risk management requirements or changes in the composition of qualifying regulatory capital (including those resulting from U.S. implementation of Basel III requirements); adverse changes in securities markets directly or indirectly affecting TCF’s ability to sell assets or to fund its operations; diminished unsecured borrowing capacity resulting from TCF credit rating downgrades and unfavorable conditions in the credit markets that restrict or limit various funding sources; costs associated with new regulatory requirements or interpretive guidance relating to liquidity; uncertainties relating to customer opt-in preferences with respect to overdraft fees on point of sale and ATM transactions or the success of TCF’s reintroduction of TCF Free CheckingSM which may have an adverse impact on TCF’s fee revenue; uncertainties relating to future retail deposit account changes, including limitations on TCF’s ability to predict customer behavior and the impact on TCF’s fee revenues. Supermarket Branching Risk; Growth Risks. Adverse developments affecting TCF’s supermarket banking relationships or any of the supermarket chains in which TCF maintains supermarket branches, including the announcement on January 10, 2013 by SUPERVALU that it had entered into an agreement to sell several of its supermarket chains, including Jewel-Osco® in which TCF has 157 branches; slower than anticipated growth in existing or acquired businesses; inability to successfully execute on TCF’s growth strategy through acquisitions or cross-selling opportunities; failure to expand or diversify TCF’s balance sheet through programs or new opportunities; failure to successfully attract and retain new customers, including the failure to attract and retain manufacturers and dealers to expand the inventory finance business; product additions and addition of distribution channels (or entry into new markets) for existing products. Technological and Operational Matters. Technological or operational difficulties, loss or theft of information, cyber-attacks and other security breaches, counterparty failures and the possibility that deposit account losses (fraudulent checks, etc.) may increase; failure to keep pace with technological change. Litigation Risks. Results of litigation, including class action litigation concerning TCF’s lending or deposit activities including account servicing processes or fees or charges, or employment practices, and possible increases in indemnification obligations for certain litigation against Visa U.S.A. and potential reductions in card revenues resulting from such litigation or other litigation against Visa. Accounting, Audit, Tax and Insurance Matters. Changes in accounting standards or interpretations of existing standards; federal or state monetary, fiscal or tax policies, including adoption of state legislation that would increase state taxes; ineffective internal controls; adverse state or Federal tax assessments or findings in tax audits; lack of or inadequate insurance coverage for claims against TCF; potential for claims and legal action related to TCF’s fiduciary responsibilities. Cautionary Statements for Purposes of the Safe Harbor Provisions of the Securities Litigation Reform Act (continued) |
|
|
Corporate Profile $3,405 $1,567 $553 $3,198 $6,702 . $18.2 billion national bank holding company headquartered in Minnesota • 39th largest publicly-traded U.S. based bank holding company by asset size . 428 bank branches in eight states, • 26th largest U.S. branch network • 5 campus alliances; 5th largest in campus card banking relationships . Total equity to total assets of 10.30% . Tangible realized common equity of 7.11%1 . Tangible book value of $8.36 . 85% of total assets are loans & leases At December 31, 2012 1 36 7 108 25 53 194 4 Well-Diversified Loan Portfolio ($ millions) Commercial Lending 25% Consumer Real Estate and Other 63% At 12/31/01 $5,242 $2,045 $957 1 See “Reconciliation of GAAP to Non-GAAP Financial Measures – Tangible Realized Common Equity” slide At 12/31/12 Branch Summary Leasing & Equipment Finance 12% Leasing & Equipment Finance 21% Inventory Finance 10% Consumer Real Estate and Other 43% Commercial Lending 22% Auto Finance 4% |
|
|
As a % of average assets : Net interest income 4.32% 3.23% Adjusted non-interest income 3 2.15% 1.25% Adjusted revenue 3 6.47% 4.48% Adj. pre-tax pre-provision profit 4 1.97% 1.62% Net interest margin 4.65% 3.57% Yield on loans 5.53% 5.18% Yield on securities 3.33% 2.86% Rate on deposits .31% .53% As a % of average assets: Securities 5.94% 25.18% Loans and leases 83.88% 62.93% Deposits 72.89% 74.43% Borrowings 15.17% 11.97% TCF 2012 Banks $10-$50 billion in total assets1 YTD 3Q12 Average2 . TCF has a higher margin because it has more loans at a higher rate and deposits at a lower rate . TCF has more fee income due to a large and diversified base of revenue sources, including its national lending businesses 1 Excludes TCF 2 Annualized 3 Excludes gains on sales of securities and non-recurring items (see “Reconciliation of GAAP to Non-GAAP Financial Measures – Revenue Ratios” slide) 4 Total revenue less non-interest expense; excludes gains on sales of securities and non-recurring items (see “Reconciliation of GAAP to Non-GAAP Financial Measures – Revenue Ratios” slide) Peer Analysis |
|
|
A Building and Investing Year . Expansion of National Lending Programs (2011 and Forward) . Functionally Organized Management Structure (January 2012) . Balance Sheet Repositioning (March 2012) . Prudential Bank & Trust Deposit Acquisition (June 2012) . Preferred Stock and Subordinated Debt Offerings (June 2012) . The Return of TCF’s Free Checking Product (June 2012) . Trust Preferred Redemption (July 2012) . Preferred Stock Offering (December 2012) 2012: Repositioning, reinventing and improving performance 2013: Execution and results |
|
|
Revenue & Expenses |
|
|
$173 $180 $198 $201 $201 $92 $89 $100 $99 $101 3.92% 4.14% 4.86% 4.85% 4.79% 12/11 3/12 6/12 9/12 12/12 Net Interest Income Fees & Other Revenue Net Interest Margin $302 $265 $269 $298 $300 1 ($ millions) 1 Excludes gains/(losses) on sales of securities of $5.8 million, $76.6 million, $13.1 million, $13.0 million, and $(528) thousand at 12/11, 3/12, 6/12, 9/12, and 12/12, respectively 2 Annualized . 4Q12 revenue impacted by: . Steady fee and service charge income related to net growth in checking account base . Sale of auto loans . Sale of consumer real estate loans .4Q12 net margin impacted by: .Loan and lease yield compression due to the lower interest rate environment Revenue Growth 2 |

|
|
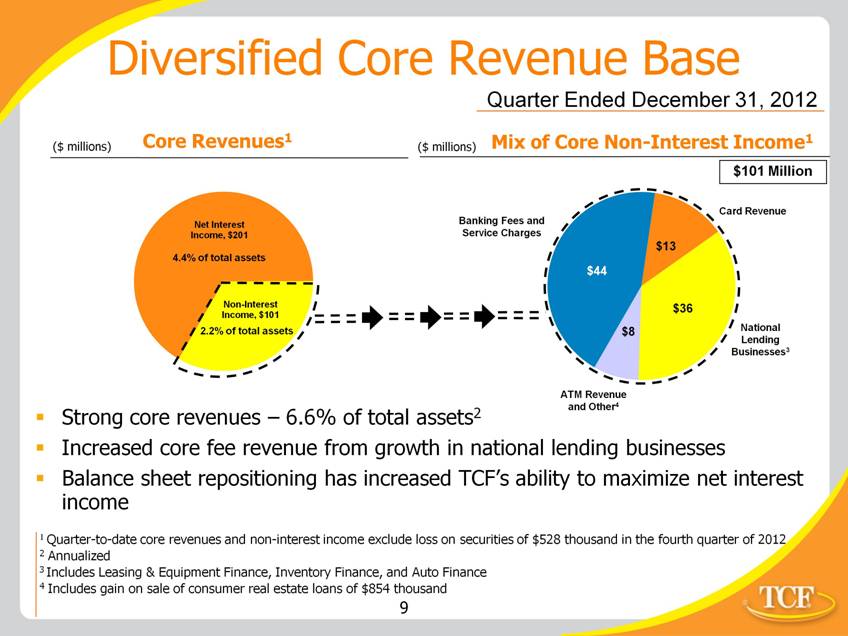
Diversified Core Revenue Base Core Revenues1 Mix of Core Non-Interest Income1 ($ millions) Quarter Ended December 31, 2012 ($ millions) 2.2% of total assets $101 Million Strong core revenues – 6.6% of total assets2 Increased core fee revenue from growth in national lending businesses Balance sheet repositioning has increased TCF’s ability to maximize net interest income Banking Fees and Service Charges Card Revenue National Lending Businesses3 ATM Revenue and Other4 4.4% of total assets 1 Quarter-to-date core revenues and non-interest income exclude loss on securities of $528 thousand in the fourth quarter of 2012 2 Annualized 3 Includes Leasing & Equipment Finance, Inventory Finance, and Auto Finance 4 Includes gain on sale of consumer real estate loans of $854 thousand |
|
|
4Q11 1Q12 2Q12 3Q12 4Q12 Change from Prior Quarter Fees & Service Charges, Card Revenue and ATM Revenue $71.3 $61.3 $67.9 $62.8 $62.8 -- % Marketing & Deposit Account Premium Expense 8.7 8.6 7.1 4.7 4.8 2.0% Net Fee Income $62.6 $52.7 $60.8 $58.1 $58.0 (.1)% Reintroduction of TCF’s free checking product focuses on quality relationships, not volume of sales Net fee income was relatively flat compared to third quarter of 2012 due to the increase in account growth and additional fees related to accounts acquired from Prudential offsetting the seasonal overdraft fee decrease for the quarter Expect to rebuild net fee income (in consideration of seasonal changes) through quality account net growth and new product initiatives Marketing and premium expenses have declined and stabilized since the reintroduction of TCF’s free checking product Net checking accounts have grown two consecutive quarters by an average of 5.4%1 ($ millions) Net Banking Fee Generation 1 Annualized |

|
|
$176 $187 $189 $186 $207 0 50 100 150 200 12/11 3/12 6/12 9/12 12/12 Other Deposit Premiums & Marketing Occupancy & Equipment Compensation & Benefits ($ millions) Core Operating Expenses . Ramp up of compensation expenses in revenue-producing national lending businesses, primarily auto finance . Expect to grow revenue into this expense base during 2013 4Q12 Core Operating Expenses Core operating expenses $ 207.4 One time items: Civil money penalty for BSA 10.0 Other one time expenses 5.7 Total one time items 15.7 Adjusted core operating expenses $ 191.7 |
|
|
Balance Sheet Growth |

|
|
Loan & Lease Balances $13,346 $14,591 $14,788 $14,150 $15,426 10,000 11,000 12,000 13,000 14,000 15,000 16,000 12/08 12/09 12/10 12/11 12/12 ($ millions) Well Diversified Portfolio % of Total Loans & Leases: Consumer Real Estate 55% 50% 49% 49% 43% Commercial 26% 26% 25% 24% 22% Leasing & Equipment Finance 19% 21% 21% 23% 21% Inventory Finance -- 3% 5% 4% 10% Auto Finance -- -- -- -- 4% 9% 2012 Growth Rate |
|
|
($ billions) 2011 2012 Change Period Beginning Balance $14.8 $14.2 $ (.6) New Volume 5.6 10.6 5.0 Run-off 1 (6.2) (9.4) (3.2) Period Ending Balances $14.2 $15.4 $ 1.2 ($ millions) 2012 vs. 2011 Consumer Real Estate $ 350 Commercial 856 Leasing 192 Inventory Finance2 2,613 Auto Finance 1,016 Total Lending $ 5,027 Change in New Volume 1 Includes activity from payments, pre-payments, charge-offs and loan and lease sales 2 Origination levels impacted by the high velocity of fundings and repayments with dealers . Strong diversity across asset classes .Origination growth from all businesses Annual Loan & Lease Originations |
|
|
4Q11 Consumer real estate 5.71% 5.65% 5.54% 5.60% 5.60% Commercial 5.40 5.32 5.16 5.14 5.10 National lending businesses 6.13 5.91 5.73 5.62 5.53 Total Loans and Leases 5.75 5.65 5.52 5.50 5.47 Loan & Lease Yields . Competitive commercial marketplace; large banks in all of our markets competing on price for assets . Growth in national lending with some yield compression due to lower yields on new originations of the portfolio in the current low rate environment 1Q12 2Q12 3Q12 4Q12 |
|
|
Strong Deposit Franchise $9,849 $11,386 $11,455 $12,103 $13,757 8,000 9,000 10,000 11,000 12,000 13,000 14,000 12/08 12/09 12/10 12/11 12/12 Primary funding source for asset growth Quarterly Average Balances ($ millions) Average rate: 1.51% .74% .46% .32% .32% % of total deposits: Checking 40% 36% 38% 37% 34% Savings & Money Market 35% 52% 53% 54% 50% CDs 25% 12% 9% 9% 16% Average total deposits have increased for 9 consecutive quarters |
|
|
1 Quarterly average balances 2 Annualized . Convenience • TCF attracts a large and diverse customer base by offering a host of convenient banking services: – Free Checking – Conveniently located traditional, supermarket and campus branches open seven days a week – Free debit cards, free coin counting and free withdrawals at nearly 660 ATMs – TCF Free Online Banking and Free Mobile Banking . Primary funding source for loan growth Savings 44% CDs 16% Money Market 6% Checking 34% $6,103 At 12/31/12 $2,206 $820 $4,628 ($000s) Average interest rate on deposits: .32%2 Low-Cost Deposit Base1 Deposit Strategy |
|
|
Credit Quality |
|
|
. Consumer Real Estate . Over 60-day delinquencies decreased $4.4 million, or 4.7 percent, from September 30, 2012 . Net charge-offs down $40.8 million, or 54.6 percent, from September 30, 2012 ($43.9 million bankruptcy-related regulatory guidance impact in third quarter 2012) . Excluding the impact of the bankruptcy-related regulatory guidance1, net charge-offs have decreased in five consecutive quarters . Non-performing assets2 down $14.9 million, or 4.7 percent, from September 30, 2012 . Commercial . Net charge-offs down $12.2 million, or 59.4 percent, from September 30, 2012 . Non-performing assets down $48.9 million, or 24 percent, from September 30, 2012 . National Lending . Fourth quarter net charge-offs of 18 bps3 . Continued strong credit performance in the national lending businesses Credit Quality – Linked Quarter 1 $43.9 million in 3Q12 and $5.4 million in 4Q12 2 Non-accrual loans and real estate owned 3Annualized |
|
|
Consumer Real Estate Over 60-day delinquencies decreased $20.5 million, or 18.7 percent, from 2011 Net charge-offs down $23.2 million, or 15.2 percent, from 20111 Non-performing assets down $50.4 million, or 21.2 percent, from 20111 Commercial Net charge-offs down $2.2 million, or 5.4 percent, from 2011 Non-performing assets down $19.5 million, or 11.2 percent, from 2011 National Lending 2012 net charge-offs of 26 bps, down 8 bps from 2011 Continued strong credit performance in the national lending businesses Credit Quality – Year-over-Year 1 Excludes impact of bankruptcy-related regulatory guidance |
|
|
Credit Quality – Consumer Real Estate ($ millions) 60+ Day Delinquencies Accruing TDRs Non-Accrual Loans & Leases 1 Excludes the impact of bankruptcy-related regulatory guidance 2 Annualized 1.63% 1.55% 1.51% 1.46% 1.38% 1.00% 1.20% 1.40% 1.60% 1.80% 12/11 3/12 6/12 9/12 12/12 $149 $149 $141 $130 $117 $104 $118 0 100 200 300 12/11 3/12 6/12 9/12 12/12 Consumer Real Estate Impact of bankruptcy-related regulatory guidance $234 $433 $445 $466 $457 $478 0 100 200 300 400 500 600 12/11 3/12 6/12 9/12 12/12 1 $88 $85 $83 $86 $70 50 60 70 80 90 100 12/11 3/12 6/12 9/12 12/12 Real Estate Owned $183 $184 $188 $179 $182 100 125 150 175 200 12/11 3/12 6/12 9/12 12/12 Allowance for Loan and Lease Losses Net-Charge-offs2 2.15% 2.09% 2.05% 1.85% 1.71% 2.59% 0.00% 1.00% 2.00% 3.00% 4.00% 5.00% 12/11 3/12 6/12 9/12 12/12 Consumer Real Estate Impact of bankruptcy-related regulatory guidance 4.44% 1 $235 1 1 2.04% |
|
|
Credit Quality – Commercial ($ millions) Accruing TDRs Non-Accrual Loans & Leases 1 Excludes classified assets that are 60+ days delinquent 2 Annualized $128 $136 $150 $169 $128 0 50 100 150 200 12/11 3/12 6/12 9/12 12/12 $98 $110 $103 $120 $145 0 20 40 60 80 100 120 140 160 12/11 3/12 6/12 9/12 12/12 $330 $314 $296 $213 $224 0 100 200 300 400 12/11 3/12 6/12 9/12 12/12 Performing Classified Assets1 Real Estate Owned $47 $42 $43 $35 $27 0 10 20 30 40 50 12/11 3/12 6/12 9/12 12/12 Allowance for Loan and Lease Losses $47 $50 $51 $54 $52 40 45 50 55 12/11 3/12 6/12 9/12 12/12 1.79% .18% .97% 2.32% .97% 0.0% 0.5% 1.0% 1.5% 2.0% 2.5% 12/11 3/12 6/12 9/12 12/12 Net-Charge-offs2 |
|
|
Credit Quality – National Lending 60+ Day Delinquencies1 Net-Charge-offs .44% .65% .29% .18% .08% 0.00% 0.10% 0.20% 0.30% 0.40% 0.50% 0.60% 0.70% 2008 2009 2010 2011 2012 .50% .91% .85% .34% .26% 0.0% 0.2% 0.4% 0.6% 0.8% 1.0% 2008 2009 2010 2011 2012 $20 $34 $29 $24 $33 0 5 10 15 20 25 30 35 40 2008 2009 2010 2011 2012 Allowance for Loan and Lease Losses $21 $51 $35 $21 $15 0 20 40 60 80 2008 2009 2010 2011 2012 Non-Accrual Loans & Leases ($ millions) 1 Includes acquired portfolios |
|
|
Capital |
|
|
1 See “Reconciliation of GAAP to Non-GAAP Financial Measures – Tangible Realized Common Equity” slide 2 See “Reconciliation of GAAP to Non-GAAP Financial Measures – Tier 1 Common Capital Ratio” slide Capital Ratios 3Q12 4Q12 Tangible realized common equity1 7.55% 7.52% Tier 1 common capital2 9.17% 9.21% Tier 1 leverage capital 8.66% 9.21% Tier 1 risk-based capital 10.40% 11.09% Total risk-based capital 12.96% 13.63% . Issued $100 million of 6.45% Series B Non-Cumulative Perpetual Preferred Stock in fourth quarter 2012 . Continue to build capital through retained earnings in the quarter and going forward . Basel III (Notice of Proposed Rulemaking) is in a comment period and not scheduled to start phasing in until 2014, with full compliance by 2019 Capital Ratios – Holding Company |
|
|
2012 in Review . Building and Investing Year - Expansion of national lending businesses, functional management structure, balance sheet repositioning, deposit acquisition, preferred stock and subordinated debt offerings, trust preferred redemption, investments in BSA program, and the return of TCF Free Checking . Strong loan and lease growth continues in the national lending businesses . Gateway profitable in first year . Significant growth in inventory finance . Strong deposit growth and improved checking results . Credit trends across all business lines continue to be encouraging 2013 Outlook . Execution and Results Year . Continued growth in national lending businesses . Build retail customer base through core products . Focus on performance improvement in credit . Increase revenue into expanded cost structure driven by growing businesses Summary |
|
|
Appendix |
|
|
Loan & Lease Geographic Diversification ($ millions) 28 At 12/31/12: Consumer Real Estate and Other Commercial Real Estate and Commercial Business Leasing and Equipment Finance Inventory Finance Auto Finance Total Minnesota $ 2,512.8 $ 839.9 $ 94.9 $ 39.8 $ 12.0 $ 3,499.3 Illinois 2,004.0 757.6 105.4 36.6 36.1 2,939.7 Michigan 750.2 596.8 133.4 57.7 11.5 1,549.6 Wisconsin 406.0 669.7 61.0 53.7 1.2 1,191.5 California 211.1 19.1 432.3 48.7 110.0 821.2 Colorado 581.5 107.3 45.0 18.6 13.1 765.5 Canada -- -- 2.2 491.7 -- 493.9 Texas -- 15.8 266.8 85.3 36.1 404.1 Florida 2.5 43.0 146.8 64.8 30.2 287.2 New York 2.1 -- 164.6 55.8 15.1 237.6 Ohio 2.9 44.1 130.8 37.1 7.7 222.8 Pennsylvania 4.6 -- 136.3 48.4 17.8 207.2 Arizona 44.0 38.8 73.8 13.7 18.4 188.8 Indiana 21.9 72.3 61.3 23.6 5.8 185.0 Other 158.7 200.9 1,343.5 491.5 237.8 2,432.4 Total $ 6,702.4 $ 3,405.2 $ 3,198.0 $ 1,567.2 $ 552.8 $ 15,425.7 |
|
|
Leasing & Equipment Finance $2,545 $3,177 $3,232 $3,212 $3,281 0 1,000 2,000 3,000 4,000 12/08 12/09 12/10 12/11 12/12 Core Portfolio Acquired Portfolio 1 Includes operating leases of $82.9 million at December 31, 2012 2 Excludes acquired portfolios of $167.1 million and non-accrual loans and leases (Balances in $ millions)1 At December 31, 2012 . 14th largest bank-affiliated leasing company and 29th largest equipment finance/leasing company in the U.S. . Diverse equipment types • 24% specialty vehicles, 14% manufacturing, 13% medical, 11% construction . 435 employees . 4Q12 fee revenue of $26.1 million, 26% of total fees and other revenue . 5.24% quarterly average yield . 4Q12 originations up 17% from 3Q12 . Over 60-day delinquency rate . 08%2 . Net charge-offs: 2011 2012 .41% . 32% . Uninstalled backlog of $443 million Core portfolio increased 8.9% year-over-year |
|
|
TCF Inventory Finance $4 $469 $792 $625 $1,567 0 200 400 600 800 1,000 1,200 1,400 1,600 1,800 12/08 12/09 12/10 12/11 12/12 Electronics & Appliances Lawn & Garden Powersports & Other (Balances in $ millions) At December 31, 2012 . Focus on lawn and garden products, powersports, consumer electronics and appliances, recreation vehicles and marine products . Experienced and seasoned management . Operates in the U.S. and Canada . 296 employees . 100% variable-rate receivables . 6.11% quarterly average yield1 . Over 60-day delinquency rate .01%2 . Net charge-offs: 2011 2012 .10% .10% . Credit support from equipment manufacturers . Credit risk spread across more than 8,800 active dealers $942 million of growth during 2012 1 Annualized 2 Excludes non-accrual loans |
|
|
Auto Finance . Indirect auto finance company headquartered in Anaheim, CA . Experienced and seasoned management team . 400 employees, up 228 from 12/31/11 . Nearly 6,200 active dealer relationships . Originating loans to consumers in 43 states . 5.53% quarterly average yield . Over 60-day delinquency rate .10%2 . 2012 net charge-off rate .38% . Managed portfolio of $1.3 billion . Gains on sales of auto loans – $6.9 million in 4Q12 . Originates and services primarily used retail auto loans acquired from franchised and independent dealers across the country $4 $139 $262 $407 $553 0 50 100 150 200 250 300 350 400 450 500 550 12/11 3/12 6/12 9/12 12/12 At December 31, 2012 (Balances in $ millions)1 Total originations of $1.2 billion in 2012 1 Excludes loans held for sale and assets serviced for others 2 Excludes non-accrual loans Total Originations: $33 $208 $299 $336 $362 |
|
|
64% first mortgage lien positions, average loan amount of $112,949 36% junior lien positions, average loan amount of $41,053 59% fixed-rate, 41% variable-rate Average home value of $290,7571 Yields: 5.95% fixed-rate, 5.07% variable-rate Over 60-day delinquency rate 1.38%2 Net charge-offs: 2010 2011 2012 1.80% 2.18% 2.65% Average FICO score of the retail lending operation: At origination – 729; updated 4Q12 – 727 37% of loan balances have been originated since January 1, 2009, with 2012 net charge-offs of .19% Consumer Real Estate (Balances in $ millions) 1 Based on recent appraisal value 2 Excludes non-accrual loans $6,895 $6,675 $7,281 $7,156 $7,302 At December 31, 2012 |
|
|
Commercial Lending $3,491 $3,719 $3,646 $3,449 $3,405 2,000 2,500 3,000 3,500 4,000 12/08 12/09 12/10 12/11 12/12 (Balances in $ millions) At December 31, 2012 . Commercial real estate – $3.1 billion • 33% apartment loans • 24% retail services • 15% office buildings • 11% industrial buildings . Commercial highlights • 5.10% quarterly average yield • 78% fixed-rate, 22% variable-rate • Over 60-day delinquency rate .08%1 • Net charge-offs: 2010 2011 2012 1.31% 1.15% 1.12% • CRE location mix: 91% TCF banking markets, 9% other . Continue to look for strategic expansion opportunities that fit TCF’s profile . New commercial banking division called TCF Capital Funding specializing in asset-based and cash flow lending to smaller middle market companies across the U.S. 1 Excludes non-accrual loans Secured Lending Philosophy |
|
|
1 When evaluating capital adequacy and utilization, management considers financial measures such as Tangible Realized Common Equity to Tangible Assets and the Tier 1 Common Capital Ratio. These measures are non-GAAP financial measures and are viewed by management as useful indicators of capital levels available to withstand unexpected market or economic conditions, and also provide investors, regulators, and other users with information to be viewed in relation to other banking institutions. Reconciliation of GAAP to Non-GAAP Financial Measures – Tangible Realized Common Equity1 Computation of tangible realized common equity to tangible assets Total equity $ 1,764,669 $ 1,876,643 Less: Non-controlling interest in subsidiaries 13,205 13,270 Total TCF stockholders’ equity 1,751,464 1,863,373 Less: Preferred stock 166,721 263,240 Goodwill 225,640 225,640 Intangibles 9,092 8,674 Accumulated other comprehensive income 18,067 12,443 Tangible realized common equity $ 1,331,944 $ 1,353,376 Total assets $17,878,393 $ 18,225,917 Less: Goodwill 225,640 225,640 Intangibles 9,092 8,674 Tangible assets $17,643,661 $ 17,991,603 Total realized common equity to tangible assets 7.55 % 7.52 % Dec. 31, 2012 ($000s) Sept. 30, 2012 |
|
|
$ Computation of non-interest income excluding gains on sales of securities and non-recurring revenue: Total non-interest income $ 490,423 2.72% $ 178,766 1.32% Less: Gains on sales of securities 102,232 7,153 Non-recurring revenue -- 1,201 Total non-interest income excluding gains on securities and non-recurring revenue $ 388,191 2.15% $ 170,412 1.25% Computation of total revenue excluding gains on sales of securities and non-recurring revenue: Total revenue $ 1,270,442 7.04% $ 630,292 4.55% Less: Gains on sales of securities 102,232 7,153 Non-recurring revenue -- 1,201 Total revenue excluding gains on sales of securities and non-recurring revenue $ 1,168,210 6.47% $ 621,938 4.48% Computation of pre-tax pre-provision profit excluding gains on sales of securities and non-recurring items: Total revenue $ 1,270,442 $ 630,292 Less non-interest expense 1,362,554 395,584 Pre-tax pre-provision profit (92,112) 234,708 Less: Gains on sales of securities 102,232 7,153 Non-recurring (expense) revenue (550,735) 1,201 Pre-tax pre-provision profit excluding gains on sales of securities and non-recurring (expense) revenue $ 356,391 1.97% $ 226,354 1.62% Total Average Assets $ 18,055,644 $ 18,908,671 Reconciliation of GAAP to Non-GAAP Financial Measures – Revenue Ratios1 ($000s) TCF 2012 Banks $10-$50 billion in total assets YTD 3Q12 Avg2, 3 1 When evaluating asset utilization, management considers measures related to revenue that adjust for certain operating items. These measures are non- GAAP financial measures and are viewed by management as useful indicators of TCF’s ability to generate returns to cover potential credit losses. 2 Excludes TCF 3 Annualized % of Total Avg Assets3 $ % of Total Avg Assets3 |
|
|
Sept. 30, 2012 Tier 1 risk-based capital ratio: Tier 1 capital $ 1,515,050 Total risk-weighted assets $ 14,562,779 Tier 1 risk-based capital ratio 10.40 % Computation of tier 1 common capital ratio: Tier 1 capital $ 1,515,050 Less: Preferred stock 166,721 Qualifying non-controlling interest in subsidiaries 13,205 Tier 1 common capital 1,335,124 Tier 1 common capital ratio 9.17 % ($000s) Dec. 31, 2012 $ 1,633,336 $ 14,733,203 11.09 % $ 1,633,336 263,240 13,270 1,356,826 9.21 % Reconciliation of GAAP to Non-GAAP Financial Measures – Tier 1 Common Capital Ratio1 1 When evaluating capital adequacy and utilization, management considers financial measures such as Tangible Realized Common Equity to Tangible Assets and the Tier 1 Common Capital Ratio. These measures are non-GAAP financial measures and are viewed by management as useful indicators of capital levels available to withstand unexpected market or economic conditions, and also provide investors, regulators, and other users with information to be viewed in relation to other banking institutions. |
|
|
Source References & Footnotes Slide: Corporate Profile 39th largest publicly-traded U.S. based bank holding company – SNL Financial, LC; 9/30/2012 26th largest branch network – SNL Financial, LC; 4Q12 5th largest in campus card relationships - CR80News; April 2012 Slide: Peer Analysis Banks $10-$50 Billion in Total Assets data – SNL Financial LC; 9/30/2012 Slide: Leasing & Equipment Finance 14th largest bank-affiliated leasing company – The Monitor; 2012 Monitor Bank 40 29th largest equipment finance/leasing company – The Monitor; 2012 Monitor 100 |