Attached files
| file | filename |
|---|---|
| 8-K - 8-K - TCF FINANCIAL CORP | a12-25009_18k.htm |
| EX-99.1 - EX-99.1 - TCF FINANCIAL CORP | a12-25009_1ex99d1.htm |
Exhibit 99.2
|
|
TCF Financial Corporation 2012 Third Quarter Earnings Results Presentation |
|
|
Agenda . Third Quarter Highlights - William Cooper (Chairman & CEO) . Credit - Mike Jones (Chief Financial Officer) . Lending - Craig Dahl (Vice Chairman of Lending) . Deposits & Fee Generation / Capital - Tom Jasper (Vice Chairman of Funding) . Summary - William Cooper (Chairman & CEO) . Q&A 2 |

|
|
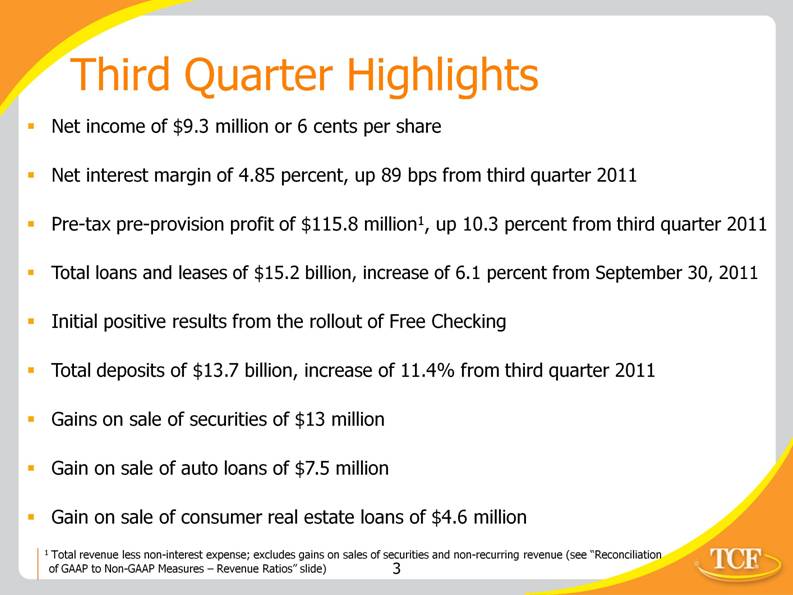
Third Quarter Highlights . Net 9.3 income of $million or 6 cents per share . Net interest margin of 4.85 percent, up 89 bps from third quarter 2011 . Pre-tax pre-provision profit of $115.8 million1, up 10.3 percent from third quarter 2011 . Total loans and leases of $15.2 billion, increase of 6.1 percent from September 30, 2011 . Initial positive results from the rollout of Free Checking p g . Total deposits of $13.7 billion, increase of 11.4% from third quarter 2011 . Gains on sale of securities of $13 million G i l f t l f 7 5 illi . Gain on sale of auto loans of $7.5 million . Gain on sale of consumer real estate loans of $4.6 million 3 1 Total revenue less non-interest expense; excludes gains on sales of securities and non-recurring revenue (see “Reconciliation of GAAP to Non-GAAP Measures – Revenue Ratios” slide) |
|
|
Third Quarter Highlights( ti d) . Adopted accounting methodology change driven by industry-wide Highlights (continued) industry regulatory bankruptcy clarification . $31.5 million of additional consumer provision . $103.2 million of additional consumer non-accrual loans . Aggressively addressed commercial credit issues gg y . $15 million increase in commercial provision from 2Q12 . real 60-day decreased $7 2Q12 Consumer estate over 60 delinquencies million from . Excluding the effects of the regulatory bankruptcy clarification: l l $ ll d f . Consumer real estate non-accruals – 130 million, down 7% from 2Q12 . Consumer real estate net charge-offs – $31 million, down 10% from 2Q12 . Commercial classified assets decreased $80 million from 2Q12 . Real estate owned decreased $5 million from 2Q12 4 |

|
|
Thi d Q a te Third Quarter Highlights – Revenue Growth1 Fees & Other Revenue Net ($ millions) 2012 YTD results by: 14-year high Growth Interest Income Net Interest Margin $292 $298 $300 . impacted . Balance sheet repositioning occurring in 1Q12 y g net interest margin rate 2 $100 $ 99 $265 $269 . Strong yields on loans and leases driven by mix changes in the portfolio . Sale of loans $176 $173 $180 $198 $201 $116 $92 $89 auto . 9/12 net margin 3.96% 3.92% 4.14% 4.86% 4.85% impacted by: . Increases in auto finance balances . Redemption of trust preferred 9/11 12/11 3/12 6/12 9/12 securities 5 1 Excludes gains on securities of $5.8 million, $76.6 million, $13.1 million and $13.0 million at 12/11, 3/12, 6/12 and 9/12, respectively 2 Annualized |

|
|
Third Quarter Highlights – TCF 3Q12 Banks $10-$50 billion in total assets1 2Q12 Average Peer Analysis As a % of total assets 2 : Net interest income 4.49% 3.17% Total non-interest income 3 2.22% 1.22% T t l 3 6 70% 4 39% . TCF has a higher margin because it has more loans at a higher rate more deposits Total revenue 6.70% 4.39% Pre-tax pre-provision profit 3,4 2.59% 1.54% Net interest margin 2 4.85% 3.58% and at a lower rate g Yield on loans 2 5.50% 5.20% Yield on securities 2 3.15% 2.89% Rate on deposits 2 .32% .52% . TCF has more fee income because it has a high number of retail checking accounts, as As a % of total assets: Securities 3.1% 25.3% Loans and leases 85.1% 61.6% g , well as fee income from its national lending businesses Deposits 76.7% 74.8% Borrowings 11.5% 12.3% 1 Excludes TCF 6 2 Annualized 3 Excludes gains on sales of securities and non-recurring revenue (see “Reconciliation of GAAP to Non-GAAP Measures – Revenue Ratios” slide) 4 Total revenue less non-interest expense |

|
|
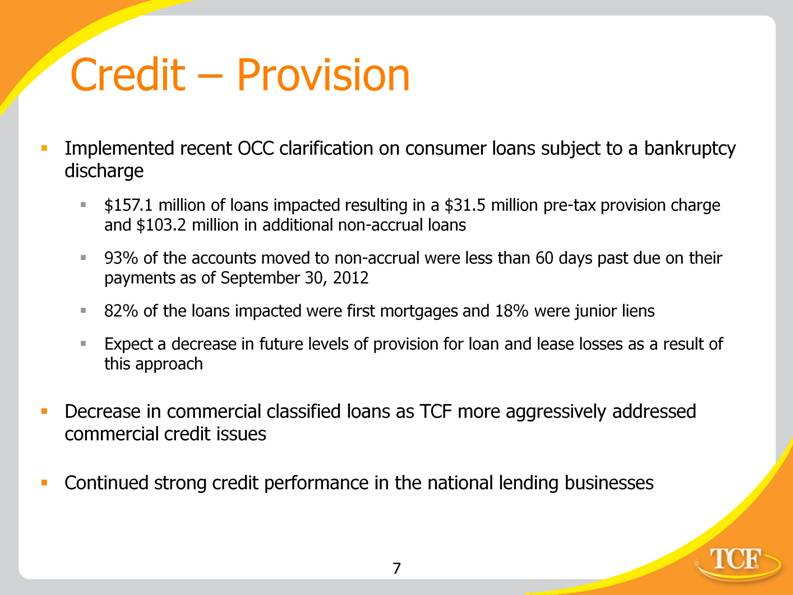
Credit Provision – . Implemented recent OCC clarification on consumer loans subject to a bankruptcy discharge $ ll f l d l $ ll h . 157.1 million of loans impacted resulting in a 31.5 million pre-tax provision charge and $103.2 million in additional non-accrual loans . 93% of the accounts moved to non-accrual were less than 60 days past due on their y p payments as of September 30, 2012 . 82% of the loans impacted were first mortgages and 18% were junior liens . Expect a decrease in future levels of provision for loan and lease losses as a result of this approach . Decrease in commercial classified loans as TCF more aggressively addressed commercial credit issues . Continued strong credit performance in the national lending businesses 7 |
|
|
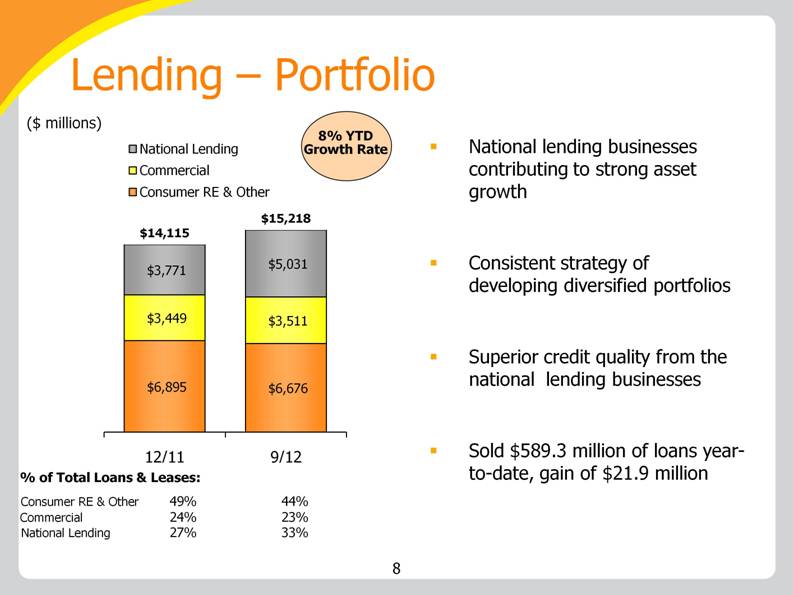
Lending ($ millions) 8% YTD – Portfolio Growth Rate National Lending Commercial Consumer RE & Other . National lending businesses contributing to strong asset growth $5 031 $14,115 $15,218 g o t . strategy $3,449 $3,511 $3,771 5,031 Consistent of developing diversified portfolios $6,895 $6,676 . Superior credit quality from the national lending businesses 12/11 9/12 . Sold $589.3 million of loans year- % of Total Loans & Leases: Consumer RE & Other 49% 44% Commercial 24% 23% N ti l L di 27% 33% to-date, gain of $21.9 million 8 |
|
|
($ billions) 3Q11 YTD 3Q12 YTD Change Period Beginning Balance $14.8 $14.1 $ (.7) New Volume 4.2 7.8 3.6 Run-off 1 (4.7) (6.7) (2.0) Period Ending Balances $14.3 $15.2 $ .9 ($ millions) 3Q12 YTD vs. 3Q11 YTD Retail Lending $ 171 Commercial Banking 597 Leasing 206 Inventory Finance2 1,870 Auto Finance 739 Total Lending $ 3,583 Change in Volume 1 Includes activity from payments, pre-payments, charge-offs and loan and lease sales 2 Origination levels impacted by the high velocity of fundings and repayments with dealers Strong diversity across asset classes Origination growth from all businesses Lending – Originations |

|
|
4Q11 Balance Yield 3Q12 Balance Yield Balance Inc./(Dec.) $ % Consumer real estate $ 6,933 5.71 % $ 6,729 5.60 % $ (204) (3) % Commercial 3,477 5.40 3,538 5.14 61 2 National lending businesses 3,811 6.13 4,973 5.62 1,162 30 Other 18 8.91 16 7.83 (2) (11) Total $ 14,239 5.75 $ 15,256 5.50 $ 1,017 7 Lending – Yields (Average balance, $ millions) Competitive commercial marketplace; large banks in all of our markets competing on price for assets Maintaining yields in national lending businesses with diversification and pricing discipline |

|
|
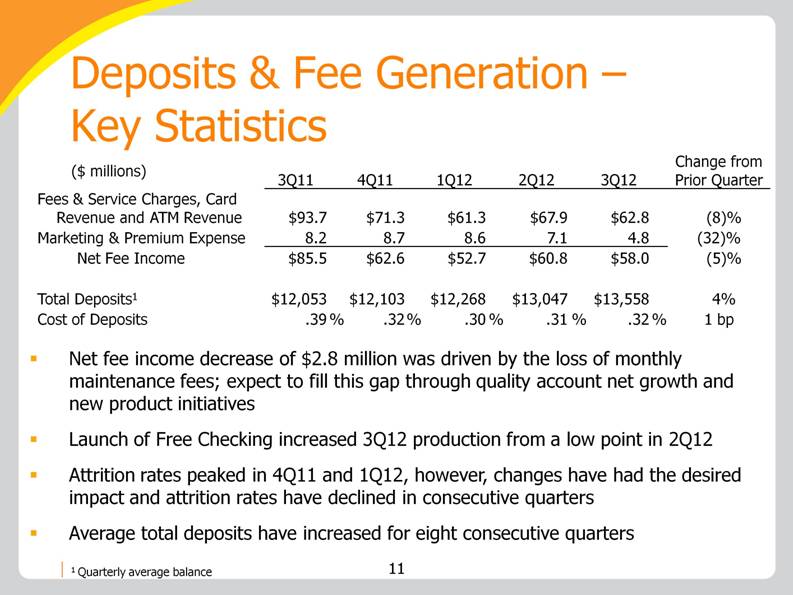
3Q11 4Q11 1Q12 2Q12 3Q12 Change from Prior Quarter Fees & Service Charges, Card Revenue and ATM Revenue $93.7 $71.3 $61.3 $67.9 $62.8 (8)% Marketing & Premium Expense 8.2 8.7 8.6 7.1 4.8 (32)% Net Fee Income $85.5 $62.6 $52.7 $60.8 $58.0 (5)% Total Deposits1 $12,053 $12,103 $12,268 $13,047 $13,558 4% Cost of Deposits .39 % .32 % .30 % .31 % .32 % 1 bp Net fee income decrease of $2.8 million was driven by the loss of monthly maintenance fees; expect to fill this gap through quality account net growth and new product initiatives Launch of Free Checking increased 3Q12 production from a low point in 2Q12 Attrition rates peaked in 4Q11 and 1Q12, however, changes have had the desired impact and attrition rates have declined in consecutive quarters Average total deposits have increased for eight consecutive quarters ($ millions) 1 Quarterly average balance Deposits & Fee Generation – Key Statistics |
|
|
Year-over-Year Prior Quarter 3Q11 4Q11 1Q12 2Q12 3Q12 $ Change % Change $ Change % Change 1 Marketing $1.1 $2.3 $2.6 $5.4 $4.3 $ 3.2 N.M. $(1.1) (21)% 2 Premiums 7.0 6.5 6.0 1.7 .5 (6.5) (93)% (1.2) (71)% 3 Total $8.1 $8.8 $8.6 $7.1 $4.8 $(3.3) (41)% $(2.3) (33)% New product offering drives new strategy in marketing Shifted strategy from customer-specific high dollar premiums to broader direct marketing and brand messaging targeting quality relationships, not just volume of sales Focus on cross-sell and retention Invest in product development and channel enhancements Marketing & Premium Expenses ($ millions) Fee Generation – Key Statistics N.M. Not Meaningful |

|
|
Ratios Holding Company Capital – Capital Ratios 2Q12 3Q12 Tangible realized common equity1 7.50% 7.55% equity to total 9 83% 9 87% . Continue to build capital through retained earnings in the quarter and going forward Total assets 9.83% 9.87% Tier 1 common capital2 9.26% 9.17% g g . Basel III (Notice of Proposed Rulemaking) is in a comment Tier 1 leverage capital 8.64% 8.66% Tier 1 risk-based capital 10.53% 10.40% period and not scheduled to start phasing in until 2014, with full Total risk-based capital 13.11% 12.96% compliance by 2019 13 1 See “Reconciliation of GAAP to Non-GAAP Measures – Tangible Realized Common Equity” slide 2 See “Reconciliation of GAAP to Non-GAAP Measures – Tier 1 Common Capital Ratio” slide |

|
|
3Q12 Diluted earnings per share excluding unusual items (non-GAAP measure)1 $.18 Unusual items pre-tax effect: Commercial Credit – aggressively addressed credit issues (.06) Gains on securities .05 Gain on sale of consumer real estate loans .02 Implementation of clarifying bankruptcy-related regulatory guidance (.13) Subtotal (.12) Diluted earnings per share $.06 EPS Summary 1 In contrast to GAAP-basis measures, the diluted EPS measure has been calculated excluding gains on sales of securities and other non-recurring revenue. Management reviews these measures on an on-going basis and has included this information because of current interest in the industry. |

|
|
Summary Summary . 2012: Restructuring, reinventing and improving performance R F Ch ki h h d h d i d ff i dhki . Return to Free Checking has had the desired effect – increased checking account production and decreased attrition . lease growth continues in the lending businesses Strong loan and national . Credit trends continue to be encouraging as we work through a challenging environment Outlook . 2013: Execution and results . Focus on performance improvement through credit 15 |

|
|
Cautionary Statements for Purposes of the Safe Harbor Provisions of the Securities Litigation Reform Act g Any statements contained in this earnings release regarding the outlook for the Company’s businesses and their respective markets, such as projections of future performance, guidance, statements of the Company’s plans and objectives, forecasts of market trends and other matters, are forward-looking statements based on the Company’s assumptions and beliefs. Such statements may be identified by such words or phrases as “will likely result,” “are expected to,” “will continue,” “outlook,” “will benefit,” “is anticipated,” “estimate,” “project,” “management believes” or l Th f dl k b k d h ld l l dff similar expressions. These forward-looking statements are subject to certain risks and uncertainties that could cause actual results to differ materially from those discussed in such statements and no assurance can be given that the results in any forward-looking statement will be achieved. For these statements, TCF claims the protection of the safe harbor for forward-looking statements contained in the Private Securities Litigation Reform Act of 1995. Any forward-looking statement speaks only as of the date on which it is made, and we disclaim any obligation to subsequently revise forward-looking statement to reflect or circumstances after date or to reflect the occurrence anticipated or evise any fo wa d eflect events o ci cumstances afte such o eflect occu ence of o unanticipated events. Certain factors could cause the Company’s future results to differ materially from those expressed or implied in any forward-looking statements contained in this release. These factors include the factors discussed in Part I, Item 1A of the Company’s Annual Report on Form 10-K for the year ended December 31, 2011 under the heading “Risk Factors,” the factors discussed below and any other cautionary statements, written or oral, g f y y which may be made or referred to in connection with any such forward-looking statements. Since it is not possible to foresee all such factors, these factors should not be considered as complete or exhaustive. .Adverse Economic or Business Conditions, Credit and Other Risks Deterioration in general economic and banking industry conditions, including defaults, anticipated defaults or rating agency downgrades of sovereign debt (including debt of the U.S.), or continued high rates of or increases in unemployment in TCF’s primary banking markets; adverse economic, business and competitive developments such as shrinking interest margins, deposit outflows, deposit account attrition or an inability to increase the number of deposit accounts; adverse changes in credit quality and other risks posed by TCF’s loan, lease, investment and securities available for sale portfolios, including declines in commercial or residential real estate values or changes in the allowance for loan and lease losses dictated by new market conditions or regulatory requirements; interest rate risks resulting from fluctuations in interest rates or other between yields earned on TCF’s interest-earning prevailing factors that result in a mismatch TCF s assets and the rates paid on its deposits and borrowings; foreign currency exchange risks; counterparty risk, including the risk of defaults by our counterparties or diminished availability of counterparties who satisfy our credit quality requirements; decreases in demand for the types of equipment that TCF leases or finances. .Legislative Requirements New consumer regulations, resulting from and Regulatory protection and supervisory requirements and including those action by the CFPB and changes in the scope of Federal preemption of state laws that could be applied to national banks; the imposition of requirements with an adverse impact relating to TCF’s lending, loan collection and other business activities as a result of the Dodd-Frank Act, or other legislative or regulatory developments such as mortgage foreclosure moratorium laws or imposition of underwriting or other limitations that impact ability to use certain variable-rate products; impact of legislative, regulatory or other changes affecting customer account charges and fee income expense; changes to bankruptcy laws which result in the loss of all or TCF’s security interest due to collateral value 16 or would part of TCF s declines; deficiencies in TCF’s compliance under the Bank Secrecy Act in past or future periods, which may result in regulatory enforcement action including monetary penalties; increased health care costs resulting from Federal health care reform legislation; adverse regulatory examinations (continued) |

|
|
Cautionary Statements for Purposes of the Safe Harbor the Securities Reform and resulting enforcement actions or other adverse consequences such as increased capital requirements or higher deposit insurance assessments; heightened regulatory practices, requirements or expectations, including, but not limited to, requirements related to the Bank Secrecy Act and antimoney laundering compliance activity. E i /C it lRi k dC t i t Li idit Ri k Li it ti TCF’ bilit t di id d t i di id d b f fi i l Provisions of Litigation Act (continued) .Earnings/Capital Risks and Constraints, Liquidity Risks Limitations on TCF’s ability to pay dividends or to increase dividends because of financial performance deterioration, regulatory restrictions or limitations; increased deposit insurance premiums, special assessments or other costs related to adverse conditions in the banking industry, the economic impact on banks of the Dodd-Frank Act and other regulatory reform legislation; the impact of financial regulatory reform, including additional capital, leverage, liquidity and risk management requirements or changes in the composition of qualifying regulatory capital (including those resulting from U.S. implementation of Basel III requirements); adverse changes in securities markets q fy g g y p ( g gf p f q ); g directly or indirectly affecting TCF’s ability to sell assets or to fund its operations; diminished unsecured borrowing capacity resulting from TCF credit rating downgrades and unfavorable conditions in the credit markets that restrict or limit various funding sources; costs associated with new regulatory requirements or interpretive guidance relating to liquidity; uncertainties relating to customer opt-in preferences with respect to overdraft fees on point of sale and ATM transactions or the success of TCF’s reintroduction of the Free Checking product which may have an adverse impact TCF’ f t i ti l ti t f t t ild it t h i l di li it ti TCF’ bilit t di t t on TCF s fee revenue; uncertainties relating to future retail deposit account changes, including limitations on TCF s ability to predict customer behavior and the impact on TCF’s fee revenues. .Competitive Conditions; Supermarket Branching Risk; Growth Risks Reduced demand for financial services and loan and lease products; adverse developments affecting TCF’s supermarket banking relationships or any of the supermarket chains in which TCF maintains supermarket branches 11 alternatives; customers completing transactions including the announcement on July 11, 2012 by SuperValu that it is exploring strategic financial without using a bank; the effect of any negative publicity; slower than anticipated growth in existing or acquired businesses; inability to successfully execute on TCF’s growth strategy through acquisitions or cross-selling opportunities; failure to expand or diversify our balance sheet through programs or new opportunities; failure to successfully attract and retain new customers; product additions and addition of distribution channels (or entry into new markets) for existing products; limitations on TCF’s ability to attract and retain manufacturers and dealers to expand the inventory finance business or dealers in connection with its expansion of the automobile finance business. .Technological and Operational Matters Technological or operational difficulties, loss or theft of information, counterparty failures and the possibility that deposit account losses (fraudulent checks, etc.) may increase; failure to keep pace with technological change. Liti ti Ri k R lt f liti ti i l di l ti liti ti i TCF’ l di d it l i ti iti i l di t .Litigation Risks Results of litigation, including class action litigation concerning TCF’s lending, deposit or leasing activities including account servicing processes or fees or charges, or employment practices, and possible increases in financial obligations for certain litigation against Visa U.S.A. and potential reductions in card revenues resulting from such litigation or other litigation against Visa. .Accounting, Audit, Tax and Insurance Matters Changes in accounting standards or interpretations of existing standards; federal or state monetary, 17 g g g p f g f y fiscal or tax policies, including adoption of state legislation that would increase state taxes; ineffective internal controls; adverse state or Federal tax assessments or findings in tax audits; lack of or inadequate insurance coverage for claims against TCF; potential for claims and legal action related to TCF’s fiduciary responsibilities. |

|
|
Appendix 18 |
|
|
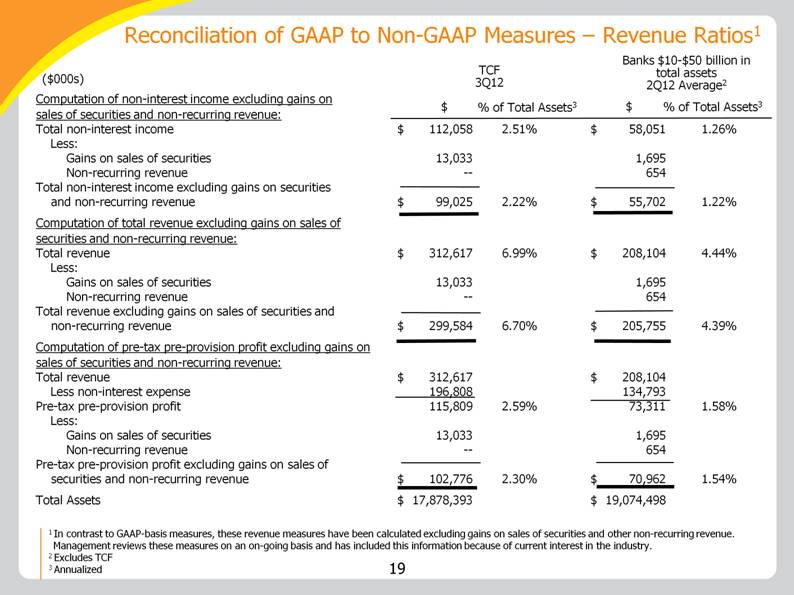
Reconciliation of GAAP to Non-GAAP Measures – Revenue Ratios1 TCF Banks $ 10-$50 billion in $ Computation of non-interest income excluding gains on sales of securities and non-recurring revenue: non-interest $ 112,058 2.51% $ 58,051 1.26% ($000s) 3Q12 $ total assets 2Q12 Average2 % of Total Assets3 $ % of Total Assets3 Total non income Less: Gains on sales of securities 13,033 1,695 Non-recurring revenue -- 654 Total non-interest income excluding gains on securities d i $ 99 025 2 22% $ 55 702 1 22% and non-recurring revenue 99,025 2.22% 55,702 1.22% Computation of total revenue excluding gains on sales of securities and non-recurring revenue: Total revenue $ 312,617 7.00% $ 208,104 4.44% Less: Gains on sales of securities 13,033 1,695 Non-recurring revenue -- 654 Total revenue excluding gains on sales of securities and non-recurring revenue $ 299,584 6.70% $ 205,755 4.39% g , , Computation of pre-tax pre-provision profit excluding gains on sales of securities and non-recurring revenue: Total revenue $ 312,617 $ 208,104 Less non-interest expense 196,808 134,793 p , , Pre-tax pre-provision profit 115,809 2.59% 73,311 1.58% Less: Gains on sales of securities 13,033 1,695 Non-recurring revenue -- 654 Pre tax pre Pre-pre-provision profit excluding gains on sales of securities and non-recurring revenue $ 102,776 2.30% $ 70,962 1.54% Total Assets $ 17,878,393 $ 19,074,498 19 1 In contrast to GAAP-basis measures, these revenue measures have been calculated excluding gains on sales of securities and other non-recurring revenue. Management reviews these measures on an on-going basis and has included this information because of current interest in the industry. 2 Excludes TCF 3 Annualized |
|
|
Reconciliation of GAAP to Non-GAAP Measures – Tangible Realized Equity1 Common Equity Computation of total equity to total assets: Total equity $ 1 755 908 $ 1 764 669 Sept. 30, 2012 ($000s) Jun. 30, 2012 1,755,908 1,764,669 Total assets $ 17,870,597 $ 17,878,393 Total equity to total assets 9.83 % 9.87 % Computation of tangible realized common equity to tangible assets Total equity $ 1,755,908 $ 1,764,669 Less: Non-controlling interest in subsidiaries 14,937 13,205 Total TCF stockholders’ equity 1,740,971 1,751,464 Less: Preferred stock 166,721 166,721 Goodwill 225,640 225,640 Intangibles 9,516 9,092 Accumulated other comprehensive income 15,703 18,067 Tangible realized common equity $ 1,323,391 $ 1,331,944 Total assets $ 17,870,597 $ 17,878,393 Less: Goodwill 225,640 225,640 Intangibles 9,516 9,092 Tangible assets $ 17,635,441 $ 17,643,661 Total realized common equity to tangible assets 7.50 % 7.55% 20 1 In contrast to GAAP-basis measures, tangible realized common equity excludes the effect of goodwill, other intangibles and accumulated other comprehensive income (loss). Management reviews tangible realized common equity as an ongoing measure and has included this information because of current interest in the industry. The methodology for calculating tangible realized common equity may vary between companies. |

|
|
Reconciliation of GAAP to Non-GAAP Measures –Tier 1 Common Ratio1 Jun. 30, 2012 ($000s) Sept. 30, 2012 Capital Ratio Tier 1 risk-based capital ratio: Tier 1 capital $ 1,508,176 Total risk-assets $ 14,319,406 $ 1,515,050 $ 14,562,779 risk weighted Tier 1 risk-based capital ratio 10.53 % Computation of tier 1 capital ratio: 10.40 % common Tier 1 capital $ 1,508,176 Less: $ 1,515,050 Preferred stock 166,721 Qualifying trust preferred securities -- Qualifying non-controlling interest in 14 937 166,721 -- 13 205 subsidiaries 14,937 Tier 1 common capital 1,326,518 Tier 1 common capital ratio 9.26 % 13,205 1,335,124 9.17 % 1 to GAAP-common capital ratio excludes the effect securities and 21 In contrast GAAP basis measures, the total tier 1 of qualifying trust preferred qualifying non-controlling interest in subsidiaries. Management reviews the total tier 1 common capital ratio as an on-going measure and has included this information because of current interest in the industry. The methodology for calculating total tier 1 common capital may vary between companies. |
