Attached files
| file | filename |
|---|---|
| EX-32.1 - EXHIBIT 32.1 - CROSSROADS LIQUIDATING TRUST | d429658dex321.htm |
| EX-32.2 - EXHIBIT 32.2 - CROSSROADS LIQUIDATING TRUST | d429658dex322.htm |
| EX-31.1 - EXHIBIT 31.1 - CROSSROADS LIQUIDATING TRUST | d429658dex311.htm |
| EX-31.2 - EXHIBIT 31.2 - CROSSROADS LIQUIDATING TRUST | d429658dex312.htm |
Table of Contents
UNITED STATES
SECURITIES AND EXCHANGE COMMISSION
WASHINGTON, D.C. 20549
FORM 10-Q
| x | QUARTERLY REPORT PURSUANT TO SECTION 13 OR 15(d) OF THE SECURITIES EXCHANGE ACT OF 1934 |
FOR THE QUARTER ENDED SEPTEMBER 30, 2012.
| ¨ | TRANSITION REPORT PURSUANT TO SECTION 13 OR 15(d) OF THE SECURITIES EXCHANGE ACT OF 1934 |
COMMISSION FILE NUMBER: 0-53504
KEATING CAPITAL, INC.
(Exact name of registrant as specified in its charter)
| Maryland | 26-2582882 | |
| (State or other jurisdiction of incorporation or organization) |
(I.R.S. Employer Identification No.) |
5251 DTC Parkway, Suite 1100
Greenwood Village, CO 80111
(Address of principal executive office)
(720) 889-0139
(Registrant’s telephone number, including area code)
Indicate by check mark whether the registrant (1) has filed all reports required to be filed by Section 13 or 15(d) of the Securities Exchange Act of 1934 during the preceding 12 months (or for such shorter period that the registrant was required to file such reports), and (2) has been subject to such filing requirements for the past 90 days. Yes x No ¨.
Indicate by check mark whether the registrant has submitted electronically and posted on its corporate Web site, if any, every Interactive Data File required to be submitted and posted pursuant to Rule 405 of Regulation S-T (§232.405 of this chapter) during the preceding 12 months (or for such shorter period that the registrant was required to submit and post such files). Yes ¨ No ¨.
Indicate by check mark whether the registrant is a large accelerated filer, an accelerated filer, a non-accelerated filer, or a smaller reporting company. See definition of “accelerated filer,” “large accelerated filer” and “smaller reporting company” in Rule 12b-2 of the Exchange Act. (Check one):
| Large accelerated filer |
¨ |
Accelerated filer |
¨ | |||
| Non-accelerated filer |
x (Do not check if a smaller reporting company) |
Smaller reporting company |
¨ | |||
Indicate by check mark whether the registrant is a shell company (as defined in Rule 12b-2 of the Exchange Act). Yes ¨ No x.
Indicate the number of shares outstanding of each of the issuer’s classes of common stock, as of the latest practicable date.
The number of shares of the issuer’s Common Stock, $0.001 par value, outstanding as of October 25, 2012 was 9,213,311.
Table of Contents
| Page | ||||||
| PART I. FINANCIAL INFORMATION |
||||||
| Item 1. |
1 | |||||
| Statements of Assets and Liabilities (unaudited) as of September 30, 2012 and December 31, 2011 |
1 | |||||
| Statements of Operations (unaudited) for the three and nine months ended September 30, 2012 and 2011 |
2 | |||||
| 3 | ||||||
| Statements of Cash Flows (unaudited) for the nine months ended September 30, 2012 and 2011 |
4 | |||||
| Schedule of Investments as of September 30, 2012 (unaudited) |
5 | |||||
| 8 | ||||||
| 10 | ||||||
| Item 2. |
Management’s Discussion and Analysis of Financial Condition and Results of Operations |
28 | ||||
| Item 3. |
70 | |||||
| Item 4. |
70 | |||||
| PART II. OTHER INFORMATION |
||||||
| Item 1. |
71 | |||||
| Item 1A. |
71 | |||||
| Item 2. |
73 | |||||
| Item 3. |
73 | |||||
| Item 4. |
73 | |||||
| Item 5. |
73 | |||||
| Item 6. |
74 | |||||
| 75 | ||||||
Table of Contents
PART I – FINANCIAL INFORMATION
| Item 1. | Financial Statements |
Statements of Assets and Liabilities
(Unaudited)
| September 30, 2012 |
December 31, 2011 |
|||||||
| Assets |
||||||||
| Investments in portfolio company securities at fair value: |
||||||||
| Non-control/non-affiliate investments: |
||||||||
| Private portfolio companies (Cost: $51,935,049 and $25,379,750, respectively) |
$ | 53,186,794 | $ | 24,992,349 | ||||
| Publicly-traded portfolio companies (Cost: $1,505,162 and $2,553,250, respectively) |
1,699,681 | 2,671,631 | ||||||
| Affiliate investments: |
||||||||
| Private portfolio companies (Cost: $8,000,080 and $8,000,080, respectively) |
9,880,000 | 9,610,000 | ||||||
|
|
|
|
|
|||||
| Total, investments in portfolio company securities at fair value (Cost: $61,440,291 and $35,933,080, respectively) |
64,766,475 | 37,273,980 | ||||||
| Cash and cash equivalents |
10,801,679 | 39,606,512 | ||||||
| Receivable for investments sold |
59,429 | — | ||||||
| Prepaid expenses and other assets |
128,013 | 62,746 | ||||||
| Deferred offering costs |
261,091 | — | ||||||
|
|
|
|
|
|||||
| Total assets |
$ | 76,016,687 | $ | 76,943,238 | ||||
|
|
|
|
|
|||||
| Liabilities |
||||||||
| Base management fees payable to investment adviser |
$ | 124,735 | $ | 130,969 | ||||
| Accrued incentive fees payable to investment adviser |
721,677 | 268,180 | ||||||
| Administrative expenses payable to investment adviser |
52,188 | 47,285 | ||||||
| Accounts payable |
87,580 | 70,602 | ||||||
| Accrued expenses and other liabilities |
80,051 | 41,487 | ||||||
|
|
|
|
|
|||||
| Total liabilities |
1,066,231 | 558,523 | ||||||
|
|
|
|
|
|||||
| Net assets |
||||||||
| Common stock, $0.001 par value; 200,000,000 authorized; 9,283,781 and 9,283,781 shares issued, respectively |
$ | 9,284 | $ | 9,284 | ||||
| Additional paid-in capital |
75,302,711 | 75,302,711 | ||||||
| Treasury stock, at cost, 70,470 and 0 shares held, respectively |
(508,943 | ) | — | |||||
| Accumulated net investment loss |
(3,460,983 | ) | (268,180 | ) | ||||
| Accumulated undistributed net realized gain on investments |
282,203 | — | ||||||
| Net unrealized appreciation on investments |
3,326,184 | 1,340,900 | ||||||
|
|
|
|
|
|||||
| Total net assets |
$ | 74,950,456 | $ | 76,384,715 | ||||
|
|
|
|
|
|||||
| Total liabilities and net assets |
$ | 76,016,687 | $ | 76,943,238 | ||||
|
|
|
|
|
|||||
| Net asset value per share (on 9,213,311 and 9,283,781 shares outstanding, respectively) |
$ | 8.14 | $ | 8.23 | ||||
|
|
|
|
|
|||||
The accompanying notes are an integral part of these financial statements.
1
Table of Contents
Statements of Operations
(Unaudited)
| Three Months Ended, | Nine Months Ended, | |||||||||||||||
| September 30, 2012 |
September 30, 2011 |
September 30, 2012 |
September 30, 2011 |
|||||||||||||
| Investment income |
||||||||||||||||
| Interest and dividend income: |
||||||||||||||||
| Certificate of deposit and money market investments |
$ | 537 | $ | 6,382 | $ | 3,377 | $ | 49,660 | ||||||||
|
|
|
|
|
|
|
|
|
|||||||||
| Total investment income |
537 | 6,382 | 3,377 | 49,660 | ||||||||||||
|
|
|
|
|
|
|
|
|
|||||||||
| Operating expenses |
||||||||||||||||
| Base management fees |
383,061 | 389,007 | 1,151,127 | 764,375 | ||||||||||||
| Incentive fees |
242,117 | (155,391 | ) | 453,498 | (2,871 | ) | ||||||||||
| Administrative expenses allocated from investment adviser |
157,372 | 96,757 | 476,645 | 330,263 | ||||||||||||
| Legal and professional fees |
119,831 | 89,337 | 522,083 | 357,135 | ||||||||||||
| Directors fees |
40,000 | 31,289 | 120,000 | 90,289 | ||||||||||||
| Stock transfer agent fees |
17,934 | 40,555 | 47,100 | 163,215 | ||||||||||||
| Printing and fulfillment expenses |
24,102 | 23,444 | 89,548 | 152,583 | ||||||||||||
| Postage and delivery expenses |
7,343 | 7,201 | 51,825 | 136,696 | ||||||||||||
| Stock issuance expenses |
— | 1,625 | — | 114,388 | ||||||||||||
| Travel and entertainment expenses |
19,137 | 20,064 | 63,758 | 304,503 | ||||||||||||
| General and administrative expenses |
72,155 | 45,708 | 220,596 | 205,331 | ||||||||||||
|
|
|
|
|
|
|
|
|
|||||||||
| Total operating expenses |
1,083,052 | 589,596 | 3,196,180 | 2,615,907 | ||||||||||||
|
|
|
|
|
|
|
|
|
|||||||||
| Net investment loss |
(1,082,515 | ) | (583,214 | ) | (3,192,803 | ) | (2,566,247 | ) | ||||||||
|
|
|
|
|
|
|
|
|
|||||||||
| Net realized (loss) gain on investments |
||||||||||||||||
| Non-control/non-affiliate investments |
(121,428 | ) | — | 282,203 | — | |||||||||||
|
|
|
|
|
|
|
|
|
|||||||||
| Total net realized (loss) gain on investments |
(121,428 | ) | — | 282,203 | — | |||||||||||
|
|
|
|
|
|
|
|
|
|||||||||
| Net change in unrealized appreciation (depreciation) on investments |
||||||||||||||||
| Non-control/non-affiliate investments |
1,052,013 | (1,502,874 | ) | 1,715,284 | (740,276 | ) | ||||||||||
| Affiliate investments |
280,000 | 725,920 | 270,000 | 725,920 | ||||||||||||
|
|
|
|
|
|
|
|
|
|||||||||
| Total net change in unrealized appreciation (depreciation) on investments |
1,332,013 | (776,954 | ) | 1,985,284 | (14,356 | ) | ||||||||||
|
|
|
|
|
|
|
|
|
|||||||||
| Net increase (decrease) in net assets resulting from operations |
$ | 128,070 | $ | (1,360,168 | ) | $ | (925,316 | ) | $ | (2,580,603 | ) | |||||
|
|
|
|
|
|
|
|
|
|||||||||
| Net investment loss per common share outstanding (basic and diluted) |
$ | (0.12 | ) | $ | (0.06 | ) | $ | (0.34 | ) | $ | (0.42 | ) | ||||
|
|
|
|
|
|
|
|
|
|||||||||
| Net increase (decrease) in net assets resulting from operations per common share outstanding (basic and diluted) |
$ | 0.01 | $ | (0.15 | ) | $ | (0.10 | ) | $ | (0.42 | ) | |||||
|
|
|
|
|
|
|
|
|
|||||||||
| Weighted average common shares outstanding (basic and diluted) |
9,237,502 | 9,103,658 | 9,265,626 | 6,125,439 | ||||||||||||
|
|
|
|
|
|
|
|
|
|||||||||
The accompanying notes are an integral part of these financial statements.
2
Table of Contents
Statements of Changes in Net Assets
(Unaudited)
| Common Stock | Additional Paid-in Capital |
Treasury Stock At Cost |
Accumulated Net Investment Loss |
Accumulated Undistributed Net Realized Gain on Investments |
Unrealized Appreciation (Depreciation) on Investments |
Distributions In Excess of Net Investment Income |
Net Assets |
|||||||||||||||||||||||||||||
| Shares (1) | Par Value | |||||||||||||||||||||||||||||||||||
| Balance at December 31, 2010 (3) |
2,860,299 | $ | 2,860 | $ | 21,991,847 | $ | — | $ | (115,423 | ) | $ | — | $ | 577,116 | $ | — | $ | 22,456,400 | ||||||||||||||||||
| Net (decrease) increase in net assets from operations |
— | — | — | — | (2,566,247 | ) | — | (14,356 | ) | — | (2,580,603 | ) | ||||||||||||||||||||||||
| Issuance of common stock, net of offering costs of $6,180,594 (2) |
4,767,943 | 6,424 | 57,803,329 | — | — | — | — | — | 57,809,753 | |||||||||||||||||||||||||||
| Amortization of deferred offering costs |
— | — | (488,363 | ) | — | — | — | — | — | (488,363 | ) | |||||||||||||||||||||||||
| Distributions in excess of net investment income and net realized gains |
— | — | — | — | — | — | — | (446,837 | ) | (446,837 | ) | |||||||||||||||||||||||||
|
|
|
|
|
|
|
|
|
|
|
|
|
|
|
|
|
|
|
|||||||||||||||||||
| Balance at September 30, 2011 (3) |
7,628,242 | $ | 9,284 | $ | 79,306,813 | $ | — | $ | (2,681,670 | ) | $ | — | $ | 562,760 | $ | (446,837 | ) | $ | 76,750,350 | |||||||||||||||||
|
|
|
|
|
|
|
|
|
|
|
|
|
|
|
|
|
|
|
|||||||||||||||||||
| Balance at December 31, 2011 (3) |
9,283,781 | $ | 9,284 | $ | 75,302,711 | $ | — | $ | (268,180 | ) | $ | — | $ | 1,340,900 | $ | — | $ | 76,384,715 | ||||||||||||||||||
| Net (decrease) increase in net assets from operations |
— | — | — | — | (3,192,803 | ) | 282,203 | 1,985,284 | — | (925,316 | ) | |||||||||||||||||||||||||
| Repurchase of common stock |
— | — | — | (508,943 | ) | — | — | — | — | (508,943 | ) | |||||||||||||||||||||||||
|
|
|
|
|
|
|
|
|
|
|
|
|
|
|
|
|
|
|
|||||||||||||||||||
| Balance at September 30, 2012 (3) |
9,283,781 | $ | 9,284 | $ | 75,302,711 | $ | (508,943 | ) | $ | (3,460,983 | ) | $ | 282,203 | $ | 3,326,184 | $ | — | $ | 74,950,456 | |||||||||||||||||
|
|
|
|
|
|
|
|
|
|
|
|
|
|
|
|
|
|
|
|||||||||||||||||||
| (1) | Represents common shares issued. |
| (2) | All shares were sold at a price of either $9.30 or $10.00, depending on whether or not sales commissions were waived by the dealer manager. |
| (3) | See Note 2—Income Taxes. |
The accompanying notes are an integral part of these financial statements.
3
Table of Contents
Statements of Cash Flows
(Unaudited)
| Nine Months Ended | ||||||||
| September 30, 2012 |
September 30, 2011 |
|||||||
| Cash flows from operating activities |
||||||||
| Net decrease in net assets resulting from operations |
$ | (925,316 | ) | $ | (2,580,603 | ) | ||
| Adjustments to reconcile net decrease in net assets resulting from operations to net cash used in operating activities: |
||||||||
| Net realized gain on investments |
(282,203 | ) | — | |||||
| Net change in unrealized (appreciation) depreciation on investments |
(1,985,284 | ) | 14,356 | |||||
| Changes in operating assets and liabilities: |
||||||||
| Increase in prepaid expenses and other assets |
(65,267 | ) | (8,238 | ) | ||||
| (Decrease) increase in base management fees payable to investment adviser |
(6,234 | ) | 38,881 | |||||
| Increase (decrease) in accrued incentive fees payable to investment adviser |
453,497 | (2,871 | ) | |||||
| Increase (decrease) in administrative expenses payable to investment adviser |
4,903 | (8,556 | ) | |||||
| Decrease in reimbursable expenses payable to investment adviser |
— | (3,068 | ) | |||||
| Increase (decrease) in accounts payable |
16,978 | (30,919 | ) | |||||
| Increase (decrease) in accrued expenses and other liabilities |
38,564 | (41,264 | ) | |||||
|
|
|
|
|
|||||
| Net cash used in operating activities |
(2,750,362 | ) | (2,622,282 | ) | ||||
| Cash flows from investing activities |
||||||||
| Investments in portfolio companies |
(27,082,799 | ) | (27,756,430 | ) | ||||
| Net proceeds from sales of portfolio company investments |
1,798,362 | — | ||||||
| Purchases of short-term investments |
— | (89,000,000 | ) | |||||
| Proceeds from maturities of short-term investments |
— | 102,500,000 | ||||||
|
|
|
|
|
|||||
| Net cash used in investing activities |
(25,284,437 | ) | (14,256,430 | ) | ||||
| Cash flows from financing activities |
||||||||
| Gross proceeds from issuance of common stock |
— | 63,990,347 | ||||||
| Offering costs from issuance of common stock |
— | (6,180,594 | ) | |||||
| Additions to deferred stock offering costs |
(261,091 | ) | (154,681 | ) | ||||
| Repurchase of common stock |
(508,943 | ) | — | |||||
| Stockholder distributions as a return of capital |
— | (446,837 | ) | |||||
|
|
|
|
|
|||||
| Net cash (used in) provided by financing activities |
(770,034 | ) | 57,208,235 | |||||
|
|
|
|
|
|||||
| Net (decrease) increase in cash and cash equivalents |
(28,804,833 | ) | 40,329,523 | |||||
| Cash and cash equivalents, beginning of period |
39,606,512 | 4,753,299 | ||||||
|
|
|
|
|
|||||
| Cash and cash equivalents, end of period |
$ | 10,801,679 | $ | 45,082,822 | ||||
|
|
|
|
|
|||||
| Supplemental disclosure of non-cash financing activities |
||||||||
| Amortization of deferred offering costs |
$ | — | $ | 488,363 | ||||
The accompanying notes are an integral part of these financial statements.
4
Table of Contents
Schedule of Investments
September 30, 2012
(Unaudited)
| Portfolio Company |
Industry / Description (1) |
Type of Investment (2) |
Shares / Warrants |
Cost (3) | Value (4) | Value as % of Net Assets |
||||||||||||||
| Non-Control/Non-Affiliate Investments (5) |
||||||||||||||||||||
| Private Portfolio Companies: |
||||||||||||||||||||
| Livescribe, Inc. |
Technology - Consumer Electronics | Series C Convertible Preferred Stock |
1,000,000 | $ | 471,295 | $ | 87,000 | 0.12 | % | |||||||||||
| Series C Convertible Preferred Stock Warrants |
125,000 | 29,205 | 110 | * | ||||||||||||||||
| Exercise price $0.50 per share; expire 6/30/2015 |
||||||||||||||||||||
| Series C-1 Convertible Preferred Stock |
100,660 | 47,528 | 28,000 | 0.04 | % | |||||||||||||||
| Series C-1 Convertible Preferred Stock Warrants |
12,582 | 2,853 | 813 | * | ||||||||||||||||
| Exercise price $0.50 per share; expire 7/8/2016 |
||||||||||||||||||||
| Series C-2 Convertible Preferred Stock |
553,059 | 55,306 | 48,000 | 0.06 | % | |||||||||||||||
| MBA Polymers, Inc. |
Cleantech - Plastics Recycling | Series G Convertible Preferred Stock | 2,000,000 | 2,000,000 | 2,120,000 | 2.83 | % | |||||||||||||
| BrightSource Energy, Inc. |
Cleantech - Solar Thermal Energy | Series E Convertible Preferred Stock | 288,531 | 2,500,006 | 1,820,000 | 2.43 | % | |||||||||||||
| Harvest Power, Inc. |
Cleantech - Waste Management | Series B Convertible Preferred Stock | 580,496 | 2,499,999 | 3,540,000 | 4.72 | % | |||||||||||||
| Suniva, Inc. |
Cleantech - Solar Photovoltaic Cells | Series D Convertible Preferred Stock | 197,942 | 2,500,007 | 1,350,000 | 1.80 | % | |||||||||||||
| Xtime, Inc. |
Internet & Software - Software as a Service |
Series F Convertible Preferred Stock | 1,573,234 | 3,000,000 | 4,430,000 | 5.91 | % | |||||||||||||
| Common Stock Warrants | 22,581 | — | 12,878 | 0.02 | % | |||||||||||||||
| Exercise price $0.01 per share; expire 8/24/2018 |
||||||||||||||||||||
| Subject to restrictions on exercisability |
||||||||||||||||||||
| Kabam, Inc. |
Internet & Software - Online Multiplayer Games |
Series D Convertible Preferred Stock | 1,046,017 | 1,328,860 | 1,070,000 | 1.43 | % | |||||||||||||
| Tremor Video, Inc. |
Internet & Software - Online Video Advertising |
Series F Convertible Preferred Stock | 642,994 | 4,000,001 | 3,920,000 | 5.23 | % | |||||||||||||
| TrueCar, Inc. |
Internet & Software - Consumer Website |
Common Stock | 566,037 | 2,999,996 | 2,690,000 | 3.59 | % | |||||||||||||
| Agilyx Corporation |
Cleantech - Renewable Oils |
Series C Convertible Preferred Stock | 1,092,956 | 4,000,000 | 3,770,000 | 5.03 | % | |||||||||||||
| Zoosk, Inc. |
Internet & Software - Online Dating |
Series E Convertible Preferred Stock | 715,171 | 2,999,999 | 2,999,999 | 4.00 | % | |||||||||||||
The accompanying notes are an integral part of these financial statements.
5
Table of Contents
Keating Capital, Inc.
Schedule of Investments
September 30, 2012
(Unaudited)
| Portfolio Company |
Industry / Description (1) |
Type of Investment (2) |
Shares / Warrants |
Cost (3) | Value (4) | Value as % of Net Assets |
||||||||||||||
| Non-Control/Non-Affiliate Investments (5) |
||||||||||||||||||||
| LifeLock, Inc. |
Internet & Software - Identity Theft Protection | Series E Convertible Preferred Stock |
634,711 | 4,875,000 | 6,800,000 | 9.07 | % | |||||||||||||
| Series E Convertible Preferred Stock Warrants |
158,678 | 125,000 | — | 0.00 | % | |||||||||||||||
| Exercise price $0.01 per share; expire 3/14/2019 |
||||||||||||||||||||
| SilkRoad, Inc. (9) |
Internet & Software - Software as a Service |
Series C Convertible Preferred Stock |
17,711,654 | 5,000,000 | 5,000,000 | 6.67 | % | |||||||||||||
| Glam Media, Inc. |
Internet & Software - Social Media |
Series F Convertible Preferred Stock |
1,196,315 | 4,999,999 | 4,999,999 | 6.67 | % | |||||||||||||
| Stoke, Inc. |
Technology - Communications Equipment |
Common Stock | 1,000,000 | 3,500,000 | 3,500,000 | 4.67 | % | |||||||||||||
| Jumptap, Inc. |
Internet & Software - Mobile Advertising |
Series G Convertible Preferred Stock | 695,023 | 4,999,995 | 4,999,995 | 6.67 | % | |||||||||||||
|
|
|
|
|
|
|
|||||||||||||||
| Subtotal - Non-Control/Non-Affiliate Investments, Private Portfolio Companies |
$ | 51,935,049 | $ | 53,186,794 | 70.96 | % | ||||||||||||||
|
|
|
|
|
|
|
|||||||||||||||
| Publicly Traded Portfolio Companies: |
||||||||||||||||||||
| Solazyme, Inc. (6) |
Cleantech - Renewable Oils and Bioproducts |
Common Stock | 147,927 | 1,505,162 | 1,699,681 | 2.27 | % | |||||||||||||
|
|
|
|
|
|
|
|||||||||||||||
| Subtotal - Non-Control/Non-Affiliate Investments, Publicly Traded Portfolio Companies |
$ | 1,505,162 | $ | 1,699,681 | 2.27 | % | ||||||||||||||
|
|
|
|
|
|
|
|||||||||||||||
| Affiliate Investments (5) |
||||||||||||||||||||
| Private Portfolio Companies: |
||||||||||||||||||||
| Corsair Components, Inc. (7) |
Technology - PC Gaming Hardware | Common Stock | 640,000 | 3,411,080 | 5,460,000 | 7.28 | % | |||||||||||||
| Common Stock Warrants | 160,000 | 589,000 | 140,000 | 0.19 | % | |||||||||||||||
| Exercise price $0.05 per share; expire 7/6/2016 |
||||||||||||||||||||
| Subject to restrictions on exercisability |
||||||||||||||||||||
| Metabolon, Inc. |
Technology - Molecular Diagnostics and Services |
Series D Convertible Preferred Stock | 2,229,021 | 4,000,000 | 4,280,000 | 5.71 | % | |||||||||||||
|
|
|
|
|
|
|
|||||||||||||||
| Subtotal - Affiliate Investments, Private Portfolio Companies |
$ | 8,000,080 | $ | 9,880,000 | 13.18 | % | ||||||||||||||
|
|
|
|
|
|
|
|||||||||||||||
| Total - Investments in Portfolio Company Securities (8) |
$ | 61,440,291 | $ | 64,766,475 | 86.41 | % | ||||||||||||||
|
|
|
|
|
|
|
|||||||||||||||
The accompanying notes are an integral part of these financial statements.
6
Table of Contents
Keating Capital, Inc.
Schedule of Investments
September 30, 2012
(Unaudited)
| Reconciliation to Net Assets |
Amount | % of Net Assets |
||||||
| Investments in portfolio company securities at fair value |
$ | 64,766,475 | 86.41 | % | ||||
| Cash and cash equivalents (includes investments in money market funds consisting of 10,586,760 Class A shares in the SEI Daily Income Trust Government Fund (SEOXX) with a value of $1 per share, or $10,586,760) |
10,801,679 | 14.41 | % | |||||
| Receivable for investments sold |
59,429 | 0.08 | % | |||||
| Prepaid expenses and other assets |
128,013 | 0.17 | % | |||||
| Deferred offering costs |
261,091 | 0.35 | % | |||||
| Less: Total Liabilities |
(1,066,231 | ) | (1.42 | %) | ||||
|
|
|
|
|
|||||
| Net Assets |
$ | 74,950,456 | 100.00 | % | ||||
|
|
|
|
|
|||||
| * | Percentages less than 0.01% |
| (1) | The Company classifies its portfolio companies into three industries: (i) technology, (ii) Internet and software, and (iii) cleantech. The further description generally identifies the types of products or services provided by each portfolio company. |
| (2) | Convertible preferred, common stock, warrants and equity interests are generally non-income producing. Except for the convertible preferred stock in SilkRoad and Jumptap, all convertible preferred stock investments carry a non-cumulative, preferred dividend payable when and if declared by the portfolio company’s board of directors. In the case of SilkRoad, the shares of convertible preferred stock carry a cumulative preferred dividend, which is payable only when declared by the portfolio company’s board of directors or upon a qualifying liquidation event. In the case of Jumptap, the shares of convertible preferred stock carry a cumulative preferred dividend, which is payable only when declared by the portfolio company’s board of directors. During the nine months ended September 30, 2012, the preferred dividends on our Series B convertible preferred stock in Harvest Power, Inc. were changed from a cumulative to a non-cumulative dividend. Since no dividends have been declared or paid, or are expected to be declared or paid, with respect to these convertible preferred stock investments, these investments are considered to be non-income producing. |
| (3) | Gross unrealized appreciation, gross unrealized depreciation, and net unrealized appreciation for federal income tax purposes totaled $7,051,318, $3,725,134 and $3,326,184, respectively. The tax cost of investments is $61,440,291. |
| (4) | Except for common stock in one publicly traded portfolio company, all investments were valued at fair value as determined in good faith by the Board of Directors and are subject to legal restrictions on transfer (including lockup and other contractual restrictions) as of September 30, 2012. See Valuation of Investments under Note 2 of the Notes to Financial Statements. |
| (5) | Control Investments are defined by the Investment Company Act of 1940, as amended (the “1940 Act”), as investments in which the Company owns more than 25% of the voting securities or where the Company has the ability to nominate greater than 50% of the board representation. Affiliate Investments are defined by the 1940 Act as investments in which the Company owns between 5% and 25% of the voting securities. Non-Control/Non-Affiliate Investments are defined by the 1940 Act as investments that are neither Control Investments nor Affiliate Investments. |
| (6) | The Company sold 65,000 shares of Solazyme common stock with an aggregate cost basis of $575,588 during the nine months ended September 30, 2012. |
| (7) | Corsair Components, Inc. completed a 1-for-5 reverse stock split effective April 24, 2012. As a result of the reverse stock split, the Company now owns 640,000 shares of common stock and warrants to purchase 160,000 shares of common stock at an exercise price of $0.05 per share. Prior to the reverse stock split, the Company previously owned 3,200,000 shares of common stock and warrants to purchase 800,000 shares of common stock at an exercise price of $0.01 per share. |
| (8) | All portfolio company investments constituted qualifying investments under Section 55(a) of the 1940 Act as of September 30, 2012, with the exception of 100,000 shares of Solazyme, Inc. common stock acquired in open market transactions with a cost and value of $1,080,759 and $1,149,000, respectively, which represent approximately 1.4% and 1.5% of total assets. |
| (9) | Effective July 17, 2012, SilkRoad Technology Holdings, Inc. changed its name to SilkRoad, Inc. |
The accompanying notes are an integral part of these financial statements.
7
Table of Contents
Schedule of Investments
December 31, 2011
(Unaudited)
| Portfolio Company |
Industry / Description (1) |
Type of Investment (2) |
Shares / Warrants |
Cost (3) | Value (4) | Value as % of Net Assets |
||||||||||||||
| Non-Control/Non-Affiliate Investments (5) |
||||||||||||||||||||
| Private Portfolio Companies: |
||||||||||||||||||||
| Livescribe, Inc. |
Technology - Consumer Electronics | Series C Convertible Preferred Stock |
1,000,000 | $ | 471,295 | $ | 139,000 | 0.18 | % | |||||||||||
| Series C Convertible Preferred Stock Warrants |
125,000 | 29,205 | 1,140 | * | ||||||||||||||||
| Exercise price $0.50 per share; expire 6/30/2015 |
||||||||||||||||||||
| Series C-1 Convertible Preferred Stock |
100,660 | 47,528 | 14,001 | 0.02 | % | |||||||||||||||
| Series C-1 Convertible Preferred Stock Warrants |
12,582 | 2,853 | 183 | * | ||||||||||||||||
| Exercise price $0.50 per share; expire 7/8/2016 |
||||||||||||||||||||
| MBA Polymers, Inc. |
Cleantech - Plastics Recycling | Series G Convertible Preferred Stock |
2,000,000 | 2,000,000 | 2,000,000 | 2.62 | % | |||||||||||||
| BrightSource Energy, Inc. |
Cleantech - Solar Thermal Energy | Series E Convertible Preferred Stock |
288,531 | 2,500,006 | 2,500,006 | 3.27 | % | |||||||||||||
| Harvest Power, Inc. |
Cleantech - Waste Management | Series B Convertible Preferred Stock |
580,496 | 2,499,999 | 2,499,999 | 3.27 | % | |||||||||||||
| Suniva, Inc. |
Cleantech - Solar Photovoltaic Cells | Series D Convertible Preferred Stock |
197,942 | 2,500,007 | 2,500,007 | 3.27 | % | |||||||||||||
| Xtime, Inc. |
Internet & Software - Software as a Service |
Series F Convertible Preferred Stock |
1,573,234 | 3,000,000 | 3,000,000 | 3.93 | % | |||||||||||||
| Common Stock Warrants | 22,581 | — | 9,156 | 0.01 | % | |||||||||||||||
| Exercise price $0.01 per share; expire 8/24/2018 Subject to restrictions on exercisability |
||||||||||||||||||||
| Kabam, Inc. |
Internet & Software - Online Multiplayer Games |
Series D Convertible Preferred Stock |
1,046,017 | 1,328,860 | 1,328,860 | 1.74 | % | |||||||||||||
| Tremor Video, Inc. |
Internet & Software - Online Video Advertising |
Series F Convertible Preferred Stock |
642,994 | 4,000,001 | 4,000,001 | 5.24 | % | |||||||||||||
| TrueCar, Inc. |
Internet & Software - Consumer Website |
Common Stock |
566,037 | 2,999,996 | 2,999,996 | 3.93 | % | |||||||||||||
| Agilyx Corporation |
Cleantech - Renewable Oils |
Series C Convertible Preferred Stock |
1,092,956 | 4,000,000 | 4,000,000 | 5.24 | % | |||||||||||||
|
|
|
|
|
|
|
|||||||||||||||
| Subtotal - Non-Control/Non-Affiliate Investments, Private Portfolio Companies |
$ | 25,379,750 | $ | 24,992,349 | 32.72 | % | ||||||||||||||
|
|
|
|
|
|
|
|||||||||||||||
| Publicly Traded Portfolio Companies: |
||||||||||||||||||||
| NeoPhotonics Corporation |
Technology - Communications Equipment |
Common Stock | 160,000 | 1,000,000 | 732,800 | 0.96 | % | |||||||||||||
| Solazyme, Inc. |
Cleantech - Renewable Oils and Bioproducts |
Common Stock | 162,927 | 1,553,250 | 1,938,831 | 2.54 | % | |||||||||||||
|
|
|
|
|
|
|
|||||||||||||||
| Subtotal - Non-Control/Non-Affiliate Investments, Publicly Traded Portfolio Companies |
$ | 2,553,250 | $ | 2,671,631 | 3.50 | % | ||||||||||||||
|
|
|
|
|
|
|
|||||||||||||||
The accompanying notes are an integral part of these financial statements.
8
Table of Contents
Keating Capital, Inc.
Schedule of Investments
December 31, 2011
(Unaudited)
| Portfolio Company |
Industry / Description (1) |
Type of Investment (2) |
Shares / Warrants |
Cost (3) | Value (4) | Value as % of Net Assets |
||||||||||||||
| Affiliate Investments (5) |
||||||||||||||||||||
| Private Portfolio Companies: |
||||||||||||||||||||
| Metabolon, Inc. |
Technology - Molecular Diagnostics and Services |
Series D Convertible Preferred Stock |
2,229,021 | 4,000,000 | 4,000,000 | 5.24 | % | |||||||||||||
| Corsair Components, Inc. |
Technology - PC Gaming Hardware |
Common Stock | 3,200,000 | 3,411,080 | 5,400,000 | 7.07 | % | |||||||||||||
| Common Stock Warrants | 800,000 | 589,000 | 210,000 | 0.27 | % | |||||||||||||||
| Exercise price $0.01 per share; expire 7/6/2016 Subject to restrictions on exercisability |
||||||||||||||||||||
|
|
|
|
|
|
|
|||||||||||||||
| Subtotal - Affiliate Investments, Private Portfolio Companies |
$ | 8,000,080 | $ | 9,610,000 | 12.58 | % | ||||||||||||||
|
|
|
|
|
|
|
|||||||||||||||
| Total - Investments in Portfolio Company Securities (6) |
$ | 35,933,080 | $ | 37,273,980 | 48.80 | % | ||||||||||||||
|
|
|
|
|
|
|
|||||||||||||||
| Reconciliation to Net Assets |
Amount | % of Net Assets |
||||||
| Investments in portfolio company securities at fair value |
$ | 37,273,980 | 48.80 | % | ||||
| Cash and cash equivalents (includes investments in money market funds consisting of 39,505,875 Class A shares in the SEI Daily Income Trust Government Fund (SEOXX) with a value of $1 per share, or $39,505,875) |
39,606,512 | 51.85 | % | |||||
| Prepaid expenses and other assets |
62,746 | 0.08 | % | |||||
| Less: Total Liabilities |
(558,523 | ) | (0.73 | %) | ||||
|
|
|
|
|
|||||
| Net Assets |
$ | 76,384,715 | 100.00 | % | ||||
|
|
|
|
|
|||||
| * | Percentages less than 0.01% |
| (1) | The Company classifies its portfolio companies into three industries: (i) technology, (ii) Internet and software, and (iii) cleantech. The further description generally identifies the types of products or services provided by each portfolio company. |
| (2) | Convertible preferred, common stock, warrants and equity interests are generally non-income producing. Except for the convertible preferred stock in Harvest Power, Inc., all convertible preferred stock investments carry a non-cumulative, preferred dividend payable when and if declared by the portfolio company’s board of directors. In the case of Harvest Power, Inc., the shares of convertible preferred stock carry a cumulative preferred dividend, which is payable only when declared by the portfolio company’s board of directors or upon a qualifying liquidation event. Since no dividends have been declared or paid, or are expected to be declared or paid, with respect to these convertible preferred stock investments, these investments are considered to be non-income producing. |
| (3) | Gross unrealized appreciation, gross unrealized depreciation, and net unrealized appreciation for federal income tax purposes totaled $2,383,657, $1,042,757 and $1,340,900, respectively. The tax cost of investments is $35,933,080. |
| (4) | Except for common stock in two publicly traded portfolio companies, all investments were valued at fair value as determined in good faith by the Board of Directors and are subject to legal restrictions on transfer (including lockup and other contractual restrictions) as of December 31, 2011. See Valuation of Investments under Note 2 of the Notes to Financial Statements. |
| (5) | Control Investments are defined by the Investment Company Act of 1940, as amended (the “1940 Act”), as investments in which the Company owns more than 25% of the voting securities or where the Company has the ability to nominate greater than 50% of the board representation. Affiliate Investments are defined by the 1940 Act as investments in which the Company owns between 5% and 25% of the voting securities. Non-Control/Non-Affiliate Investments are defined by the 1940 Act as investments that are neither Control Investments nor Affiliate Investments. |
| (6) | All portfolio company investments constituted qualifying investments under Section 55(a) of the 1940 Act as of December 31, 2011, with the exception of 50,000 shares of Solazyme, Inc. common stock with a cost and value of $553,259 and $595,000, respectively, purchased in open market transactions during the fourth quarter of 2011. |
The accompanying notes are an integral part of these financial statements.
9
Table of Contents
Keating Capital, Inc.
(Unaudited)
| 1. | Description of Business |
Keating Capital, Inc. (the “Company”) was incorporated on May 9, 2008 under the laws of the State of Maryland and is an externally managed, non-diversified, closed-end management investment company that has elected to be regulated as a business development company under the Investment Company Act of 1940, as amended (the “1940 Act”), as of November 20, 2008. The Company commenced its portfolio company investment activities in January 2010. The shares of the Company’s common stock were listed on the Nasdaq Capital Market beginning December 12, 2011.
The Company’s investment objective is to maximize capital appreciation. The Company seeks to accomplish its capital appreciation objective by making investments in the equity securities of later stage, typically venture capital-backed, pre-initial public offering (“pre-IPO”) companies that are committed to and capable of becoming public. The Company provides investors with the ability to participate in a unique fund that allows its stockholders to share in the potential value accretion that the Company believes typically occurs once a company transforms from private to public status, or what the Company refers to as the private-public valuation arbitrage. The Company generally acquires equity securities, including preferred stock that is convertible into common stock, common stock, and warrants exercisable into common or preferred stock. The Company may in some cases invest in debentures or loans that are convertible into or settled with common stock; however, as of September 30, 2012 and December 31, 2011, none of the Company’s investments were convertible debentures or loans. The Company’s investments are made principally through direct investments in prospective portfolio companies. However, the Company may also purchase equity securities in private secondary transactions from current or former management or employees, or early stage investors in private companies that meet its investment criteria.
Keating Investments, LLC (“Keating Investments”), or the “investment adviser,” serves as the Company’s external investment adviser and also provides the Company with administrative services necessary for it to operate. In this capacity, Keating Investments is primarily responsible for the selection, evaluation, structure, valuation and administration of the Company’s investment portfolio, subject to the supervision of the Company’s Board of Directors. Keating Investments is a registered investment adviser under the Investment Advisers Act of 1940, as amended.
| 2. | Basis of Presentation; Summary of Significant Accounting Policies |
Basis of Presentation
The interim financial statements of the Company are prepared in accordance with accounting principles generally accepted in the United States of America (“GAAP”) for interim financial information and pursuant to the requirements for reporting on Form 10-Q and Regulation S-X. In the opinion of management, all adjustments, all of which were of a normal recurring nature, considered necessary for the fair presentation of financial statements for the interim period have been included. The results of operations for the current period are not necessarily indicative of results that ultimately may be achieved for any other interim period or for the year ending December 31, 2012. The interim unaudited financial statements and notes hereto should be read in conjunction with the audited financial statements and notes thereto contained in the Company’s Annual Report on Form 10-K for the year ended December 31, 2011.
Consolidation
Under the 1940 Act rules and the regulations pursuant to Article 6 of Regulation S-X, the Company is precluded from consolidating any entity other than another investment company or an operating company that provides substantially all of its services and benefits to the Company. The Company’s financial statements include only the accounts of Keating Capital as the Company has no subsidiaries.
Reclassifications
For the three and nine months ended September 30, 2012, the Company separately classified travel and entertainment expenses as an individual line item in its Statement of Operations. Travel and entertainment were previously included as a component of general and administrative expenses in the Statement of Operations. For comparative purposes, this line item has been separately classified in the Company’s Statement of Operations for the three and nine months ended September 30, 2011.
Use of Estimates
The preparation of financial statements in conformity with accounting principles generally accepted in the United States of America (“GAAP”) requires the Company’s management to make estimates and assumptions that affect the reported amounts of assets and liabilities at the date of the financial statements and the reported amounts of income and expenses during the reported period. Such estimates and judgments could change in the future as more information becomes known, and actual results could differ from these
estimates and the differences could be material. The Company considers its significant estimates to include the fair value of investments in portfolio company securities (see Note 3) and income taxes (see “Income Taxes”).
10
Table of Contents
Keating Capital, Inc.
Notes to Financial Statements
(Unaudited)
Valuation of Investments
Investments are stated at value as defined under the 1940 Act, in accordance with the applicable regulations of the SEC, and in accordance with Accounting Standards Codification Topic 820, “Fair Value Measurement and Disclosures,” (“ASC 820”). Value, as defined in Section 2(a)(41) of the 1940 Act, is: (i) the market price for those securities for which a market quotation is readily available, and (ii) the fair value as determined in good faith by the Board of Directors for all other assets (see Note 3).
At September 30, 2012 and December 31, 2011, approximately 83.0% and 45.0%, respectively, of the Company’s gross assets represented investments in portfolio companies that are valued at fair value by the Board of Directors. The Company makes investments in later stage, typically venture capital-backed, private, pre-IPO companies in technology, Internet and software, and cleantech. Given the nature of investing in the securities of private companies, the Company’s investments are generally considered Level 3 assets under ASC 820 until these portfolio companies become public and begin trading on a stock exchange and these securities are no longer subject to any post-initial public offering (“post-IPO”) lockup restrictions. As such, the Company values all of its investments, other than unrestricted securities in publicly traded portfolio companies, at fair value as determined in good faith by the Company’s Board of Directors, pursuant to a consistent valuation policy in accordance with the provisions of ASC 820 and the 1940 Act.
Determination of fair values involves subjective judgments and estimates. Due to the inherent uncertainty in determining the fair value of investments that do not have a readily available market value, the fair value of the Company’s investments determined in good faith by its Board may differ significantly from the value that would have been used had a ready market existed for such investments, and the differences could be material. Changes in valuation of these equity securities are recorded in the Statement of Operations as “Net change in unrealized appreciation (depreciation) on investments.”
The 1940 Act requires periodic valuation of each investment in the Company’s portfolio to determine the Company’s net asset value. Under the 1940 Act, unrestricted securities with readily available market quotations are to be valued at the closing market price on the valuation date; all other assets must be valued at fair value as determined in good faith by or under the direction of the Board of Directors.
Equity investments for which market quotations are readily available are generally valued at the most recently available closing market prices. However, equity investments for which market quotations are readily available, but which are subject to lockup provisions restricting the resale of such investments for a specified period of time, are valued at a discount to the most recently available closing market prices.
With respect to investments for which market quotations are not readily available, the Company’s Board of Directors undertakes a multi-step valuation process each quarter, as described below:
| • | The Company’s quarterly valuation process begins with each portfolio company investment being initially valued by Keating Investments’ senior investment professionals responsible for the portfolio investment; |
| • | The Chairman of the Company’s Valuation Committee, in consultation with the Company’s management, will determine each calendar quarter which investments in the Company’s portfolio for which market quotations are not readily available will be reviewed by a third-party valuation firm, engaged by the Company’s Board, provided, however, that a review will be conducted by a third-party valuation firm for each new portfolio company investment made during a calendar quarter and for any portfolio company for which market quotations are not readily available and whose valuation has not been reviewed in the prior twelve months; |
| • | The Company’s Valuation Committee reviews the preliminary valuations, and the Company’s investment adviser and the third-party valuation firm respond and supplement the preliminary valuation to reflect any comments provided by the Valuation Committee; and |
| • | The Company’s Board discusses the valuations and determines, in good faith, the fair value of each investment in the Company’s portfolio for which market quotations are not readily available based on the input of the Company’s investment adviser, the third-party valuation firm, and the Company’s Valuation Committee. |
11
Table of Contents
Keating Capital, Inc.
Notes to Financial Statements
(Unaudited)
Investment Categories and Approaches to Determining Fair Value
ASC 820 defines fair value as the price that would be received to sell an asset or paid to transfer a liability in an orderly transaction between market participants at the measurement date (exit price). In accordance with ASC 820, the Company uses a three-tier fair value hierarchy, which prioritizes the inputs used in measuring fair value as follows:
| • | Level 1: Observable inputs such as unadjusted quoted prices in active markets; |
| • | Level 2: Includes inputs such as quoted prices for similar securities in active markets and quoted prices for identical securities where there is little or no activity in the market; and |
| • | Level 3: Unobservable inputs for which little or no market data exists, therefore requiring an entity to develop its own assumptions. |
The Company applies the framework for determining fair value as described above to the valuation of investments in each of the following categories:
Equity Investments
Equity investments for which market quotations are readily available in an active market are generally valued at the most recently available closing market prices and are classified as Level 1 assets. However, equity investments for which market quotations are readily available, but which are subject to lockup provisions restricting the resale of such investments for a specified period of time, are valued at a discount to the most recently available closing market prices and, accordingly, are classified as Level 3 assets.
The fair values of the Company’s equity investments for which market quotations are not readily available (including investments in convertible preferred stock) are determined based on various factors and are classified as Level 3 assets. To determine the fair value of a portfolio company for which market quotations are not readily available, the Company may analyze the portfolio company’s most recently available historical and projected financial results, public market comparables, and other factors. The Company may also consider other events, including the transaction in which the Company acquired its securities, subsequent equity sales by the portfolio company, mergers or acquisitions affecting the portfolio company, or the completion of an initial public offering (“IPO”) by the portfolio company. In addition, the Company may consider the trends of the portfolio company’s basic financial metrics from the time of its original investment until the measurement date, with material improvement of these metrics indicating a possible increase in fair value, while material deterioration of these metrics may indicate a possible reduction in fair value. The fair values of the Company’s portfolio company securities are generally discounted for lack of marketability or when the securities are illiquid, such as when there are restrictions on resale or the lack of an established trading market which will generally be the case for pre-IPO companies, as well as during any lockup period to which the Company is subject with respect to public companies in its portfolio.
The fair value of common and preferred stock warrants is generally determined by using option pricing models, such as the Black-Scholes model or, in cases of certain warrants where the Company’s ability to exercise may be contingent or be subject to certain metrics, a Monte Carlo simulation.
12
Table of Contents
Keating Capital, Inc.
Notes to Financial Statements
(Unaudited)
Fair Value of Investments
The following table categorizes the Company’s cash equivalents, short-term investments, and portfolio company investments measured at fair value based upon the lowest level of significant input used in the valuation as of September 30, 2012 and December 31, 2011:
| Description |
Quoted
Prices In Active Markets For Identical Assets (Level 1) |
Significant Other Observable Inputs (Level 2) |
Significant Unobservable Inputs (Level 3) |
Total Fair Value |
||||||||||||
| As of September 30, 2012 |
||||||||||||||||
| Private Portfolio Company Securities: |
||||||||||||||||
| Convertible Preferred Stock |
$ | — | $ | — | $ | 51,262,993 | $ | 51,262,993 | ||||||||
| Convertible Preferred Stock Warrants |
— | — | 923 | 923 | ||||||||||||
| Common Stock |
— | — | 11,650,000 | 11,650,000 | ||||||||||||
| Common Stock Warrants |
— | — | 152,878 | 152,878 | ||||||||||||
| Publicly Traded Portfolio Company Securities: |
||||||||||||||||
| Common Stock |
1,699,681 | — | — | 1,699,681 | ||||||||||||
| Cash Equivalents: |
||||||||||||||||
| Money Market Funds |
10,586,760 | — | — | 10,586,760 | ||||||||||||
|
|
|
|
|
|
|
|
|
|||||||||
| Total |
$ | 12,286,441 | $ | — | $ | 63,066,794 | $ | 75,353,235 | ||||||||
|
|
|
|
|
|
|
|
|
|||||||||
| As of December 31, 2011 |
||||||||||||||||
| Private Portfolio Company Securities: |
||||||||||||||||
| Convertible Preferred Stock |
$ | — | $ | — | $ | 25,981,874 | $ | 25,981,874 | ||||||||
| Convertible Preferred Stock Warrants |
— | — | 1,323 | 1,323 | ||||||||||||
| Common Stock |
— | — | 8,399,996 | 8,399,996 | ||||||||||||
| Common Stock Warrants |
— | — | 219,156 | 219,156 | ||||||||||||
| Publicly Traded Portfolio Company Securities |
||||||||||||||||
| Common Stock |
2,671,631 | — | — | 2,671,631 | ||||||||||||
| Cash Equivalents: |
||||||||||||||||
| Money Market Funds |
39,505,875 | — | — | 39,505,875 | ||||||||||||
|
|
|
|
|
|
|
|
|
|||||||||
| Total |
$ | 42,177,506 | $ | — | $ | 34,602,349 | $ | 76,779,855 | ||||||||
|
|
|
|
|
|
|
|
|
|||||||||
The following table provides a reconciliation of the changes in fair value for the Company’s portfolio company investments measured at fair value using significant unobservable inputs (Level 3) for the nine months ended September 30, 2012:
| Level 3 Portfolio Company Investments (Preferred Stock) |
Level 3 Portfolio Company Investments (Preferred Warrants) |
Level 3 Portfolio Company Investments (Common Stock) |
Level 3 Portfolio Company Investments (Common Warrants) |
Total | ||||||||||||||||
| Fair Value at December 31, 2011 |
$ | 25,981,874 | $ | 1,323 | $ | 8,399,996 | $ | 219,156 | $ | 34,602,349 | ||||||||||
| New investments in Level 3 portfolio company securities at cost |
22,930,299 | 125,000 | 3,500,000 | — | 26,555,299 | |||||||||||||||
| Gross transfers out of Level 3 to Level 1 |
— | — | — | — | — | |||||||||||||||
| Total unrealized (depreciation) appreciation on Level 3 portfolio company securities included in change in net assets |
2,350,820 | (125,400 | ) | (249,996 | ) | (66,278 | ) | 1,909,146 | ||||||||||||
|
|
|
|
|
|
|
|
|
|
|
|||||||||||
| Fair Value at September 30, 2012 |
$ | 51,262,993 | $ | 923 | $ | 11,650,000 | $ | 152,878 | $ | 63,066,794 | ||||||||||
|
|
|
|
|
|
|
|
|
|
|
|||||||||||
| Total unrealized (depreciation) appreciation on Level 3 portfolio company securities included in change in net assets that were still held by the Company at September 30, 2012 |
$ | 2,350,820 | $ | (125,400 | ) | $ | (249,996 | ) | $ | (66,278 | ) | $ | 1,909,146 | |||||||
|
|
|
|
|
|
|
|
|
|
|
|||||||||||
13
Table of Contents
Keating Capital, Inc.
Notes to Financial Statements
(Unaudited)
The following table provides a reconciliation of the changes in fair value for the Company’s portfolio company investments measured at fair value using significant unobservable inputs (Level 3) for the year ended December 31, 2011:
| Level 3 Portfolio Company Investments (Preferred Stock) |
Level 3 Portfolio Company Investments (Preferred Warrants) |
Level 3 Portfolio Company Investments (Common Stock) |
Level 3 Portfolio Company Investments (Common Warrants) |
Total | ||||||||||||||||
| Fair Value at December 31, 2010 |
$ | 4,149,991 | $ | 27,616 | $ | — | $ | — | $ | 4,177,607 | ||||||||||
| New investments in Level 3 portfolio company securities at cost |
24,776,401 | 2,853 | 6,411,076 | 589,000 | 31,779,330 | |||||||||||||||
| Gross transfers out of Level 3 to Level 1 |
(2,549,991 | ) | — | — | (2,549,991 | ) | ||||||||||||||
| Total unrealized (depreciation) appreciation on Level 3 portfolio company securities included in change in net assets |
(394,527 | ) | (29,146 | ) | 1,988,920 | (369,844 | ) | 1,195,403 | ||||||||||||
|
|
|
|
|
|
|
|
|
|
|
|||||||||||
| Fair Value at December 31, 2011 |
$ | 25,981,874 | $ | 1,323 | $ | 8,399,996 | $ | 219,156 | $ | 34,602,349 | ||||||||||
|
|
|
|
|
|
|
|
|
|
|
|||||||||||
| Total unrealized (depreciation) appreciation on Level 3 portfolio company securities included in change in net assets that were still held by the Company at December 31, 2011 |
$ | (394,527 | ) | $ | (29,146 | ) | $ | 1,988,920 | $ | (369,844 | ) | $ | 1,195,403 | |||||||
|
|
|
|
|
|
|
|
|
|
|
|||||||||||
The Company’s investments in securities of private companies are generally considered Level 3 assets under ASC 820 until these portfolio companies become public and begin trading on a stock exchange and until such time as these securities are no longer subject to any post-IPO lockup restrictions, at which time the Company transfers the value of these securities as of the prior year-end into Level 1 assets.
For the nine months ended September 30, 2012, there were no transfers out of Level 3 assets. For the year ended December 31, 2011, transfers out of Level 3 – “Portfolio Company Investments (Preferred Stock)” resulted from two of the Company’s portfolio companies, NeoPhotonics Corporation (“NeoPhotonics”) and Solazyme, Inc. (“Solazyme”) completing an initial public offering and the Company’s securities in these portfolio companies being converted into common stock with the lockup restrictions on these common shares subsequently lapsing during 2011. As of December 31, 2010, the Company’s convertible preferred stock investments in NeoPhotonics and Solazyme had a fair value of $1,550,000 and $999,991, respectively, as determined in good faith by the Company’s Board of Directors and were included as a component of Level 3 – “Portfolio Company Investments (Preferred Stock).” These investments were transferred into Level 1 within the fair value hierarchy during 2011.
Significant Unobservable Inputs for Level 3 Portfolio Company Securities
The significant unobservable inputs that may be used in the fair value measurement of the Company’s investments in convertible preferred stock and common stock for which market quotations are not readily available include: prior or contemporaneous transactions in the equity of the portfolio company (“Precedent Transactions”); revenue, earnings before interest, taxes, depreciation and amortization (“EBITDA”), and price to earnings (“P/E”) multiples (collectively, “Multiples”) for comparable public company and comparable transactions; discount rates applied in a discounted cash flow analysis of the portfolio company; and discounts for lack of marketability (“DLOM”). A change in the assumptions used for Precedent Transactions and Multiples may indicate a directionally similar change in the fair value of the Company’s investments in convertible preferred stock or common stock, while a change in the assumptions used for discount rate and DLOM may indicate a directionally opposite change in the fair value of the portfolio company investment.
The significant unobservable input used in the fair value measurement of the Company’s investments in convertible preferred stock warrants and common stock warrants for which market quotations are not readily available is the equity volatility of comparable public companies. A change in the assumption used for equity volatility may indicate a directionally similar change in the fair value of the convertible preferred stock warrant or common stock warrant investment.
14
Table of Contents
Keating Capital, Inc.
Notes to Financial Statements
(Unaudited)
The following provides quantitative information about the Company’s Level 3 fair value measurements as of September 30, 2012:
| September 30, 2012 |
| |||||||||||||||
| Investment Type |
Fair Value | Valuation Technique(s) |
Unobservable Input |
Range | Weighted Average (1) | |||||||||||
| Private Portfolio Company Investments: Convertible Preferred Stock | $ | 51,262,993 | Precedent transactions | Precedent transactions | n/a | to | n/a | n/a | ||||||||
| Comparable transactions | Revenue multiple | 3.5 | 12.7 | 8.5 | ||||||||||||
| Comparable public companies | Revenue multiple | 0.5 | to | 7.0 | 2.8 | |||||||||||
| EBITDA multiple | 4.2 | to | 37.1 | 10.7 | ||||||||||||
| P/E multiple | 6.4 | to | 15.7 | 12.8 | ||||||||||||
| Discount for lack of marketability | 20% | to | 45% | 34% | ||||||||||||
| Discounted cash flow | Discount rate | 23% | to | 50% | 36% | |||||||||||
| Terminal revenue multiple | 0.7 | to | 7.0 | 4.5 | ||||||||||||
| Terminal EBITDA multiple | 6.8 | to | 23.7 | 15.4 | ||||||||||||
| Terminal P/E multiple | 13.5 | to | 21.6 | 17.3 | ||||||||||||
| Discount for lack of marketability | 20% | to | 45% | 34% | ||||||||||||
| Private Portfolio Company Investments: Convertible Preferred Stock Warrants | $ | 923 | Option pricing model | Comparable public company equity volatility | 49% | to | 53% | 51% | ||||||||
| Private Portfolio Company Investments: Common Stock | $ | 11,650,000 | Precedent transactions | Precedent transactions | n/a | to | n/a | n/a | ||||||||
| Comparable public companies | Revenue multiple | 0.3 | to | 3.6 | 1.8 | |||||||||||
| EBITDA multiple | 3.7 | to | 11.9 | 6.8 | ||||||||||||
| P/E multiple | 9.6 | to | 24.6 | 15.6 | ||||||||||||
| Discount for lack of marketability | 30% | to | 35% | 33% | ||||||||||||
| Discounted cash flow | Discount rate | 35% | to | 50% | 38% | |||||||||||
| Terminal revenue multiple | 0.5 | to | 5.9 | 2.8 | ||||||||||||
| Terminal EBITDA multiple | 5.4 | to | 17.0 | 9.2 | ||||||||||||
| Terminal P/E multiple | 15.3 | to | 32.2 | 22.3 | ||||||||||||
| Discount for lack of marketability | 30% | to | 35% | 33% | ||||||||||||
| Private Portfolio Company Investments: Common Stock Warrants | $ | 152,878 | Option pricing model | Comparable public company equity volatility | 48% | to | 48% | 48% | ||||||||
| (1) | Weighted average based on fair value of as of September 30, 2012. |
Valuation of Financial Instruments
The Company believes that the carrying amounts of its financial instruments, consisting of cash and cash equivalents (including money market funds), receivables, accounts payable and accrued liabilities approximate the fair values of such items due to the short maturity of such instruments.
Portfolio Company Investment Classification
The Company classifies its portfolio company investments in accordance with the requirements of the 1940 Act. Under the 1940 Act, “Control Investments” are defined as investments in which the Company owns more than 25% of the voting securities or has rights to nominate greater than 50% of the board representation. Under the 1940 Act, “Affiliate Investments” are defined as investments in which the Company owns between 5% and 25% of the voting securities. Under the 1940 Act, “Non-Control/Non-Affiliate Investments” are defined as investments that are neither Control Investments nor Affiliate Investments.
At September 30, 2012 and December 31, 2011, the Company had two portfolio company investments, Metabolon, Inc. and Corsair Components, Inc., which were Affiliate Investments, and the Company had no Control Investments. No income was derived from these Affiliate Investments as both are non-income producing equity investments (see Note 9).
Cash and Cash Equivalents
Cash and cash equivalents are composed of demand deposits with original maturities of 90 days or less and investments in money market funds. The Company primarily invests its cash on hand in money market funds that invest primarily in U.S. Treasury securities, U.S. Government agency securities, and repurchase agreements fully-collateralized by such securities. Cash needed to fund the Company’s near-term operating expenses is held in a bank depository account.
Offering Costs
Offering expenses directly related to the Company’s continuous public offering, which concluded June 30, 2011, totaling $965,169 on a cumulative basis were initially deferred and subsequently amortized and charged against the gross proceeds of the continuous public offering, as a reduction to additional paid-in capital, on a straight-line basis beginning with the closing of the first common stock issuance on January 11, 2010 and continuing through the conclusion of the offering period on June 30, 2011. During the six months ended June 30, 2011, deferred offering costs totaling $488,363 were amortized and charged as a reduction to additional paid-in capital.
15
Table of Contents
Keating Capital, Inc.
Notes to Financial Statements
(Unaudited)
Offering expenses incurred subsequent to January 11, 2010 associated with maintaining the registration of the continuous public offering (e.g., legal, accounting, printing and blue sky) were expensed as incurred. During the nine months ended September 30, 2011, $114,388 in offering expenses associated with maintaining the registration of the continuous public offering were expensed as incurred and were classified as Stock Issuance Expenses in the accompanying Statement of Operations.
On March 15, 2012, the Company filed a registration statement on Form N-2 for an equity offering of its common stock, which was last amended by the Company on August 23, 2012. For the three and nine months ended September 30, 2012, the Company incurred $19,576 and $261,091, respectively, in offering expenses associated with the equity offering, including the preparation of the registration statement in connection therewith. Such costs were capitalized and will be either charged to equity upon the conclusion of the equity offering, or expensed if the Company does not complete the equity offering.
Concentration of Credit Risk
The Company may place its cash and cash equivalents with various financial institutions and, at times, cash held in depository accounts at such institutions may exceed the Federal Deposit Insurance Corporation insured limit. The Company has not experienced any losses in such accounts and believes it is not exposed to any significant credit risk.
Securities Transactions
Securities transactions are accounted for on the date the transaction for the purchase or sale of the securities is entered into by the Company (i.e., trade date). Securities transactions outside conventional channels, such as private transactions, are recorded as of the date the Company obtains the right to demand the securities purchased or to collect the proceeds from a sale, and incurs an obligation to pay for securities purchased or to deliver securities sold, respectively. Cash due from brokers related to sales of securities that had not settled as of the balance sheet date is classified as receivable for investments sold. Commissions and other costs associated with transactions involving securities, including legal expenses, are included in the cost basis of purchases and deducted from the proceeds of sales.
Interest and Dividend Income
Interest income from certificates of deposit and other short-term investments is recorded on an accrual basis to the extent such amounts are expected to be collected, and accrued interest income is evaluated periodically for collectability.
The Company’s preferred equity investments may pay fixed or adjustable rate, non-cumulative dividends and will generally have a “preference” over common equity in the payment of non-cumulative dividends and the liquidation of a portfolio company’s assets. In order to be payable, non-cumulative distributions on such preferred equity must be declared by the portfolio company’s board of directors. Non-cumulative dividend income from preferred equity investments in portfolio companies is recorded when such dividends are declared or at the point an obligation exists for a portfolio company to make a distribution.
In limited instances, the Company’s preferred equity investments may include cumulative dividend provisions, where such cumulative dividends, whether or not declared, accrue at a specified rate from the original investment date, have a “preference” over other classes of preferred equity and common equity with respect to payment, and are payable only when and if declared by a portfolio company’s board of directors or upon a qualifying liquidation event. Cumulative dividends are recorded when such dividends are declared by the portfolio company’s board of directors, or when a specified event occurs triggering an obligation to pay such dividends. When recorded, cumulative dividends are added to the balance of the preferred equity investment and are recorded as dividend income in the statement of operations.
The Company’s preferred and common stock, warrants, and equity interests are generally non-income producing. Except for the convertible preferred stock investment in SilkRoad, Inc. f/k/a SilkRoad Technology Holdings, Inc. (“SilkRoad”) and Jumptap, Inc. (“Jumptap”), all convertible preferred stock investments carry a non-cumulative, preferred dividend payable when and if declared by the portfolio company’s board of directors. In the case of SilkRoad, the shares of convertible preferred stock carry a cumulative preferred dividend, which is payable only when and if declared by the portfolio company’s board of directors or upon a qualifying liquidation event. In the case of Jumptap, the shares of convertible preferred stock carry a cumulative preferred dividend, which is payable only when and if declared by the portfolio company’s board of directors. As part of a new convertible preferred stock financing by Harvest Power, Inc. (“Harvest Power”), which had its initial closing during the three months ended March 31, 2012, the preferred dividends on the Company’s convertible preferred stock were changed from a cumulative to a non-cumulative dividend. Although the Company’s preferred stock investments typically carry a dividend rate, in some cases with a payment preference over
16
Table of Contents
Keating Capital, Inc.
Notes to Financial Statements
(Unaudited)
other classes of equity, the Company does not expect dividends (whether cumulative or non-cumulative) to be declared and paid on its preferred stock investments, or on its common stock investments, since its portfolio companies typically prefer to retain profits, if any, in their businesses. Accordingly, since no dividends have been declared or paid, or are expected to be declared or paid, with respect to these convertible preferred stock investments, these investments are considered to be non-income producing.
During the three and nine months ended September 30, 2012 and 2011, there were no non-cumulative or cumulative dividends received or recorded.
Realized Gain or Loss and Unrealized Appreciation or Depreciation of Portfolio Investments
Realized gain or loss is recognized when an investment is disposed of and is computed as the difference between the Company’s cost basis in the investment at the disposition date and the net proceeds received from such disposition (after reduction for commissions and other selling expenses). Realized gains and losses on investment transactions are determined by specific identification. Unrealized appreciation or depreciation is computed as the difference between the fair value of the investment and the cost basis of such investment.
Income Taxes
Effective January 1, 2010, the Company elected to be treated for tax purposes as a RIC under the Code. The Company intends to operate so as to qualify as a RIC. To maintain RIC tax treatment, the Company must meet specified source-of-income and asset diversification requirements and distribute annually at least 90% of its investment company taxable income.
As a RIC, the Company generally will not have to pay corporate-level federal income taxes on any investment company taxable income (which is generally the Company’s net ordinary income plus the excess, if any, of realized net short-term capital gains over realized net long-term capital losses) or any realized net capital gains (which is generally net realized long-term capital gains in excess of net realized short-term capital losses) that the Company distributes to its stockholders as dividends. Taxable income generally differs from net income for financial reporting purposes due to temporary and permanent differences in the recognition of income and expenses. In addition, taxable income generally excludes any unrealized appreciation or depreciation in the Company’s portfolio company investments, because gains and losses are not included in taxable income until they are realized and required to be recognized.
The Company is not required to distribute its realized net capital gains, if any, to stockholders to maintain RIC tax treatment. However, the Company generally will have to pay corporate-level federal income taxes on any realized net capital gains that the Company does not distribute to its stockholders. In the event the Company retains any of its realized net capital gains, including amounts retained to pay incentive fees to the investment adviser or to pay annual operating expenses, the Company may designate the retained amount as a deemed distribution to stockholders and will be required to pay corporate-level tax on the retained amount.
The Company would also be subject to certain excise taxes imposed on RICs if it fails to distribute during each calendar year an amount at least equal to the sum of: (i) 98% of its ordinary income for the calendar year, (ii) 98.2% of its capital gains in excess of capital losses for the one-year period ending on October 31 of the calendar year, and (iii) any ordinary income and net capital gains for preceding years that were not distributed during such years. The Company will not be subject to this excise tax on amounts on which the Company is required to pay corporate income tax (such as retained realized net capital gains).
Because federal income tax regulations differ from accounting principles generally accepted in the United States, distributions from net realized gains for financial reporting purposes may include short-term capital gains which are included in ordinary income for tax purposes. Accounting principles generally accepted in the United States require that certain components of net assets relating to permanent differences be reclassified between financial and tax reporting. These reclassifications have no effect on the net assets or net asset value per share and are intended to enable the Company’s stockholders to determine the amount of accumulated and undistributed earnings they potentially could receive in the future and on which they could be taxed.
As of December 31, 2011, the Company’s net investment loss of $3,557,265, representing the Company’s 2011 ordinary loss for tax purposes which may not be carried forward to future years by a RIC, was charged to additional paid-in capital. In addition, as of December 31, 2011, the Company’s distribution during 2011 of $446,837, which was treated as a return of capital to stockholders for income tax purposes, was classified as a return of capital and thus charged to additional paid-in capital.
The aggregate gross unrealized appreciation and depreciation, the net unrealized appreciation, and the aggregate cost of the Company’s portfolio company securities for federal income tax purposes as of September 30, 2012 and December 31, 2011 were as follows:
17
Table of Contents
Keating Capital, Inc.
Notes to Financial Statements
(Unaudited)
| September 30, 2012 |
December 31, 2011 |
|||||||
| Aggregate cost of portfolio company securities for federal income tax purposes |
$ | 61,440,291 | $ | 35,933,080 | ||||
|
|
|
|
|
|||||
| Gross unrealized appreciation of portfolio company securities |
7,051,318 | 2,383,657 | ||||||
| Gross unrealized depreciation of portfolio company securities |
(3,725,134 | ) | (1,042,757 | ) | ||||
|
|
|
|
|
|||||
| Net unrealized appreciation of portfolio company securities |
$ | 3,326,184 | $ | 1,340,900 | ||||
|
|
|
|
|
|||||
As of September 30, 2012, the Company had no undistributed ordinary income or capital loss carryforwards for federal income tax purposes and $282,203 in undistributed long-term capital gains. As of December 31, 2011 and September 30, 2011, the Company had no undistributed ordinary income, undistributed long-term capital gains or capital loss carryforwards for federal income tax purposes.
The Company evaluates tax positions taken or expected to be taken in the course of preparing its tax returns to determine whether the tax positions are “more-likely-than-not” of being sustained by the applicable tax authority. Tax positions deemed to meet a “more-likely-than-not” threshold would be recorded as a tax benefit or expense in the applicable period. Although the Company files federal and state tax returns, its major tax jurisdiction is federal. The 2009, 2010 and 2011 federal tax years for the Company remain subject to examination by the Internal Revenue Service. The 2009, 2010 and 2011 state tax years for the Company remain subject to examination by the Colorado Department of Revenue.
As of September 30, 2012 and December 31, 2011, the Company had not recorded a liability for any unrecognized tax positions. Management’s evaluation of uncertain tax positions may be subject to review and adjustment at a later date based upon factors including, but not limited to, an on-going analysis of tax laws, regulations and interpretations thereof. The Company’s policy is to include interest and penalties related to income taxes, if applicable, in general and administrative expenses. There were no such expenses for the three and nine months ended September 30, 2012 and 2011.
Dividends and Distributions
Dividends and distributions to common stockholders must be approved by the Company’s Board of Directors and any dividend payable is recorded on the ex-dividend date. On February 11, 2011, the Company’s Board of Directors declared a special cash distribution of $446,837, or $0.13 per share outstanding on the record date. The distribution was paid on February 17, 2011 to the Company’s stockholders of record as of February 15, 2011. This special cash distribution was based on the unrealized appreciation the Company had recorded on its investment in NeoPhotonics Corporation (“NeoPhotonics”) at the time of the distribution, following NeoPhotonics’ completion of its IPO.
For federal income tax purposes, distributions paid to stockholders are reported as ordinary income, return of capital, long-term capital gains or a combination thereof. The Company’s distribution of $446,837 to stockholders in February 2011 was characterized as a return of capital for federal income tax purposes since the Company did not generate any investment company taxable income or realized net capital gains during the year ended December 31, 2011.
The Company has adopted an “opt out” dividend reinvestment plan that provides for reinvestment of dividends and distributions on behalf of the Company’s stockholders, unless a stockholder elects to receive cash. As a result, if the Board of Directors authorizes, and the Company declares a cash dividend or distribution, then the Company’s stockholders who have not “opted out” of the dividend reinvestment plan will have their cash dividend automatically reinvested in additional shares of the Company’s common stock, rather than receiving the cash dividends or distributions. The Company’s distribution of $446,837 to stockholders in February 2011 was not eligible for reinvestment under the dividend reinvestment plan since the Company’s shares of common stock had not been listed on a stock exchange at the time of the distribution.
Distributions to the Company’s stockholders will be payable only when and as declared by the Company’s Board of Directors and will be paid out of assets legally available for distribution. All distributions will be paid at the discretion of the Board of Directors. The Board of Directors maintains a distribution policy with the objective of distributing the Company’s net capital gains (which are defined as the Company’s realized capital gains in excess of realized capital losses during the year, without regard to the long-term or short-term character of such gains or losses), if any, after reduction for any incentive fees payable to the Company’s investment adviser, the Company’s operating expenses, and any other retained amounts. The Company’s Board of Directors currently intends to declare distributions (if any) at least annually, at the end of each year. Since the Company’s portfolio company investments will typically not generate current income (i.e., dividends or interest income), the Company does not typically expect to generate net
18
Table of Contents
Keating Capital, Inc.
Notes to Financial Statements
(Unaudited)
ordinary income from which it could make distributions to its stockholders. Distributions will also depend on the Company’s financial condition, maintenance of RIC status, corporate-level income and excise tax planning, compliance with applicable business development company regulations and such other factors as the Company’s Board of Directors may deem relevant from time to time.
In the event the Company retains some or all of its realized net capital gains, including amounts retained to pay incentive fees to the investment adviser or operating expenses, the Company may designate the retained amount as a deemed distribution to stockholders. In such case, among other consequences, the Company will pay corporate-level tax on the retained amount, each U.S. stockholder will be required to include its share of the deemed distribution in income as if it had been actually distributed to the U.S. stockholder, and the U.S. stockholder will be entitled to claim a credit or refund equal to its allocable share of the corporate-level tax the Company pays on the retained realized net capital gain.
Per Share Information
Net changes in net assets resulting from operations per common share, or basic earnings per share, are calculated using the weighted average number of common shares outstanding for the period presented. Diluted earnings per share are not presented as there are no potentially dilutive securities outstanding.
Recently Issued Accounting Pronouncements
From time to time, new accounting pronouncements are issued by the Financial Accounting Standards Board (“FASB”) or other standards setting bodies that are adopted by the Company as of the specified effective date. Unless otherwise discussed, the Company believes that the impact of recently issued standards that are not yet effective will not have a material impact on its financial statements upon adoption.
| 3. | Investments |
The Company’s investments in portfolio companies consist of securities issued by private and publicly traded companies consisting of convertible preferred stock, common stock, and warrants to purchase convertible preferred stock and common stock.
During the three months ended September 30, 2012, the Company invested approximately $18,000 in one existing private portfolio company. The Company did not make any investments in new portfolio companies during the three months ended September 30, 2012.
During the nine months ended September 30, 2012, the Company made investments totaling approximately $26.5 million in six new private portfolio companies, approximately $55,000 in one of the Company’s existing private portfolio companies, and approximately $0.5 million in Solazyme, Inc. (“Solazyme”), one of the Company’s existing publicly traded portfolio companies.
During the three months ended September 30, 2012, the Company sold 160,000 shares of its common stock in NeoPhotonics having an aggregate cost of $1,000,000, for an aggregate sales price (net of commissions and selling expenses) of $878,572. Accordingly, the Company realized a capital loss of $121,428 on the Company’s sale of these shares during the three months ended September 30, 2012. As of September 30, 2012, the Company no longer holds any shares of NeoPhotonics.
During the nine months ended September 30, 2012, the Company sold 65,000 shares of Solazyme’s common stock having an aggregate cost of $575,588 for an aggregate sales price (net of commissions and selling expenses) of $979,219. Accordingly, the Company realized a capital gain of $403,631 on the Company’s sale of these shares during the nine months ended September 30, 2012. The Company did not sell any shares of Solazyme’s common stock during the three months ended September 30, 2012.
The Company did not sell any portfolio company securities during the three and nine months ended September 30, 2011.
See the accompanying schedule of investments for the fair value of the Company’s investments in portfolio companies. The methodology for the determination of the fair value of the Company’s investments in portfolio companies is discussed in Note 2.
The following table summarizes the composition of the Company’s investment portfolio by type of security at cost and fair value as of September 30, 2012 and December 31, 2011.
19
Table of Contents
Keating Capital, Inc.
Notes to Financial Statements
(Unaudited)
| September 30, 2012 | December 31, 2011 | |||||||||||||||||||||||
| Investment Type |
Cost | Fair Value | Percentage of Portfolio |
Cost | Fair Value | Percentage of Portfolio |
||||||||||||||||||
| Private Portfolio Companies: |
||||||||||||||||||||||||
| Convertible Preferred Stock |
$ | 49,277,995 | $ | 51,262,993 | 79.15 | % | $ | 26,347,696 | $ | 25,981,874 | 69.70 | % | ||||||||||||
| Convertible Preferred Stock Warrants |
157,058 | 923 | 0.00 | % | 32,058 | 1,323 | 0.00 | % | ||||||||||||||||
| Common Stock |
9,911,076 | 11,650,000 | 17.99 | % | 6,411,076 | 8,399,996 | 22.54 | % | ||||||||||||||||
| Common Stock Warrants |
589,000 | 152,878 | 0.24 | % | 589,000 | 219,156 | 0.59 | % | ||||||||||||||||
| Publicly Traded Portfolio Companies: |
||||||||||||||||||||||||
| Common Stock |
1,505,162 | 1,699,681 | 2.62 | % | 2,553,250 | 2,671,631 | 7.17 | % | ||||||||||||||||
|
|
|
|
|
|
|
|
|
|
|
|
|
|||||||||||||
| Total |
$ | 61,440,291 | $ | 64,766,475 | 100.00 | % | $ | 35,933,080 | $ | 37,273,980 | 100.00 | % | ||||||||||||
|
|
|
|
|
|
|
|
|
|
|
|
|
|||||||||||||
The following table summarizes the composition of the Company’s investment portfolio by industry classification at cost and fair value as of September 30, 2012 and December 31, 2011.
| September 30, 2012 | December 31, 2011 | |||||||||||||||||||||||
| Industry Classification |
Cost | Fair Value | Percentage of Portfolio |
Cost | Fair Value | Percentage of Portfolio |
||||||||||||||||||
| Internet & Software |
$ | 34,328,850 | $ | 36,922,871 | 57.01 | % | $ | 11,328,857 | $ | 11,338,013 | 30.42 | % | ||||||||||||
| Cleantech |
15,005,174 | 14,299,681 | 22.08 | % | 15,053,262 | 15,438,843 | 41.42 | % | ||||||||||||||||
| Technology |
12,106,267 | 13,543,923 | 20.91 | % | 9,550,961 | 10,497,124 | 28.16 | % | ||||||||||||||||
|
|
|
|
|
|
|
|
|
|
|
|
|
|||||||||||||
| Total |
$ | 61,440,291 | $ | 64,766,475 | 100.00 | % | $ | 35,933,080 | $ | 37,273,980 | 100.00 | % | ||||||||||||
|
|
|
|
|
|
|
|
|
|
|
|
|
|||||||||||||
The following table summarizes the composition of the Company’s investment portfolio by geographic region of the United States at cost and fair value as of September 30, 2012 and December 31, 2011. The geographic composition is determined by the location of the corporate headquarters of the portfolio company at the time of the Company’s investment.
| September 30, 2012 | December 31, 2011 | |||||||||||||||||||||||
| Geographic Location |
Cost | Fair Value | Percentage of Portfolio |
Cost | Fair Value | Percentage of Portfolio |
||||||||||||||||||
| West |
$ | 38,440,289 | $ | 41,676,480 | 64.35 | % | $ | 22,933,073 | $ | 24,273,973 | 65.12 | % | ||||||||||||
| Northeast |
11,499,995 | 12,459,995 | 19.24 | % | 6,500,000 | 6,500,000 | 17.44 | % | ||||||||||||||||
| Southeast |
6,500,007 | 5,630,000 | 8.69 | % | 6,500,007 | 6,500,007 | 17.44 | % | ||||||||||||||||
| Midwest |
5,000,000 | 5,000,000 | 7.72 | % | — | — | 0.00 | % | ||||||||||||||||
|
|
|
|
|
|
|
|
|
|
|
|
|
|||||||||||||
| Total |
$ | 61,440,291 | $ | 64,766,475 | 100.00 | % | $ | 35,933,080 | $ | 37,273,980 | 100.00 | % | ||||||||||||
|
|
|
|
|
|
|
|
|
|
|
|
|
|||||||||||||
| 4. | Related Party Agreements and Transactions |
Investment Advisory and Administrative Services Agreement
Subject to the overall supervision of the Company’s Board of Directors, the investment adviser manages the Company’s day-to-day operations and provides the Company with investment advisory services. Under the terms of the Investment Advisory and Administrative Services Agreement, the investment adviser:
| • | Determines the composition of the Company’s investment portfolio, the nature and timing of the changes to the investment portfolio and the manner of implementing such changes; |
| • | Determines which securities the Company will purchase, retain or sell; |
| • | Identifies, evaluates and negotiates the structure of investments the Company makes, including performing due diligence on prospective portfolio companies; and |
| • | Closes, monitors and services the investments the Company makes. |
20
Table of Contents
Keating Capital, Inc.
Notes to Financial Statements
(Unaudited)
The investment adviser’s services under the Investment Advisory and Administrative Services Agreement are not exclusive, and it is free to furnish similar services to other entities so long as its services to the Company are not impaired.
The Company pays the investment adviser a fee for its investment advisory services under the Investment Advisory and Administrative Services Agreement consisting of two components: (i) a base management fee, and (ii) an incentive fee. The Company’s officers do not receive any compensation directly from the Company. However, the principals and officers of the investment adviser who also serve as the Company’s officers receive compensation from, or may have financial interests in, the investment adviser, which may be funded by or economically related to the investment advisory fees paid by the Company to the investment adviser under to the Investment Advisory and Administrative Services Agreement.
Base Management Fee
The base management fee (the “Base Fee”) is calculated at an annual rate of 2% of the Company’s gross assets, where gross assets include any borrowings for investment purposes. The Company did not have any borrowings as of September 30, 2012 or December 31, 2011. The Base Fee is payable monthly in arrears, and is calculated based on the value of the Company’s gross assets at the end of the most recently completed calendar quarter, and adjusted for any equity capital raises or repurchases during the current calendar quarter.
The Company recorded Base Fees of $383,061 and $389,007 for the three months ended September 30, 2012 and 2011, respectively, and Base Fees of $1,151,127 and $764,375 for the nine months ended September 30, 2012 and 2011, respectively. As of September 30, 2012 and December 31, 2011, Base Fees payable to the investment adviser were $124,735 and $130,969, respectively.
Incentive Fee
The incentive fee is determined and payable in arrears as of the end of each calendar year (or upon termination of the Investment Advisory and Administrative Services Agreement, as of the termination date), and equals 20% of the Company’s realized capital gains, if any, on a cumulative basis from inception through the end of each calendar year, computed net of all realized capital losses and unrealized capital depreciation on a cumulative basis, less the aggregate amount of any previously paid incentive fees, with respect to each of the investments in the Company’s portfolio. For purposes of determining the incentive fee to be paid, realized capital gains, realized capital losses and unrealized capital depreciation are each determined without regard to the holding period for the Company’s investments and include both long-term (held more than 12 months) and short-term holdings. The investment adviser is not entitled to an incentive fee on investment income generated from interest or dividends on its portfolio company investments. For purposes of calculating the incentive fee, realized capital gains and losses include both short-term and long-term capital gains and losses.
During the three months ended September 30, 2012, the Company recorded incentive fee expense of $242,117 resulting from: (i) an increase in net unrealized appreciation on the Company’s portfolio company investments of $1,332,013 during such period, and (ii) a decrease in the Company’s cumulative net realized capital gains of $121,428 during such period. For the three months ended September 30, 2011, the Company recorded a reduction in incentive fee expense of $155,391 resulting from a decrease in net unrealized appreciation on the Company’s portfolio company investments of $776,954 during such period.
During the nine months ended September 30, 2012, the Company recorded incentive fee expense of $453,498 resulting from: (i) an increase in net unrealized appreciation of $1,985,284 on the Company’s portfolio company investments during such period, and (ii) an increase in the Company’s cumulative net realized capital gains of $282,203 during such period. For the nine months ended September 30, 2011, the Company recorded a reduction in incentive fee expense of $2,871 resulting from a decrease in net unrealized appreciation on the Company’s portfolio company investments of $14,356 during such period.
As of September 30, 2012 and December 31, 2011, the Company had accrued incentive fees payable to the investment adviser in the amounts of $721,677 and $268,180, respectively.
The incentive fees are calculated and paid annually based on cumulative net realized capital gains (taking into account cumulative realized capital losses) reduced by unrealized depreciation on any investments that have a fair value below the Company’s investment cost and incentive fees previously paid. Accordingly, the accrued incentive fee of $665,237 as of September 30, 2012 related to net unrealized appreciation of $3,326,184 as of September 30, 2012 may differ from the actual incentive fee that may be paid to the investment adviser depending on whether the Company is ultimately able to dispose of its portfolio company investments and generate a net realized capital gain at least commensurate with the net unrealized appreciation recorded as of September 30, 2012. Further, the accrued incentive fee of $56,440 as of September 30, 2012 related to the cumulative net realized capital gain of $282,203 as of
21
Table of Contents
Keating Capital, Inc.
Notes to Financial Statements
(Unaudited)
September 30, 2012 may differ from the actual incentive fee paid to the investment adviser depending on the performance of the Company’s portfolio company investments taken as a whole for the year ended December 31, 2012. As of September 30, 2012, no incentive fees related to the cumulative net realized capital gain of $282,203 would have been due and payable to the investment adviser since the aggregate unrealized depreciation on the Company’s investments that have a fair value below the Company’s investment cost exceeded the amount of the cumulative net realized capital gain.
Administrative Services
Pursuant to the Investment Advisory and Administrative Services Agreement, the investment adviser furnishes the Company with office facilities, equipment, and clerical, bookkeeping and record-keeping services. The investment adviser also performs, or facilitates the performance of, certain administrative services, which includes being responsible for the financial records which the Company is required to maintain, and preparing reports to the Company’s stockholders and reports filed with the SEC.
In addition, the investment adviser assists the Company with its portfolio accounting and bookkeeping, managing portfolio collections and reporting, performing stockholder and investor relations services, determining and publishing its net asset value, overseeing the preparation and filing of its tax returns, printing and disseminating reports to its stockholders, providing support for its risk management efforts and generally overseeing the payment of its expenses and performance of administrative and professional services rendered to the Company by others.
The Company reimburses the investment adviser for the allocable portion of overhead and other expenses incurred by the investment adviser in performing its administrative obligations under the Investment Advisory and Administrative Services Agreement, including the allocable portion of compensation of the Company’s Chief Financial Officer and Chief Compliance Officer, and their respective staff. However, during the three and nine months ended September 30, 2012 and 2011, no portion of the Company’s Chief Compliance Officer’s compensation was allocated to the Company since he is also a member of the investment adviser’s Investment Committee. Allocated administrative expenses are payable to the investment adviser monthly in arrears.
The Company recorded allocated administrative expenses of $157,372 and $96,757 for the three months ended September 30, 2012 and 2011, respectively, and allocated administrative expenses of $476,645 and $330,263 for the nine months ended September 30, 2012 and 2011, respectively. As of September 30, 2012 and December 31, 2011, allocated administrative expenses payable to the investment adviser were $52,188 and $47,285, respectively.
The Company also agreed to reimburse the investment adviser for separation payments due to the Company’s former Chief Financial Officer. In consideration for certain separation services, the former Chief Financial Officer was paid a separation payment equal to $8,000 per month (prorated for any partial month) for the period commencing on November 16, 2011 and ending April 30, 2012.
Duration and Termination
An amended and restated version of the Investment Advisory and Administrative Services Agreement, which is presently in effect, was approved by the Company’s Board of Directors on April 17, 2009, and by the Company’s stockholders on May 14, 2009. On April 13, 2012, the Company’s Board of Directors (including the non-interested directors) renewed the current Investment Advisory and Administrative Services Agreement for an additional year. The current Investment Advisory and Administrative Services Agreement will remain in effect from year to year thereafter if approved annually by (i) the vote of the Board of Directors, or by the vote of a majority of the Company’s outstanding voting securities, and (ii) the vote of a majority of the directors who are not interested persons. An affirmative vote of the holders of a majority of the Company’s outstanding voting securities is also necessary in order to make material amendments to the current Investment Advisory and Administrative Services Agreement.
The Investment Advisory and Administrative Services Agreement automatically terminates in the event of its assignment. As required by the 1940 Act, the Investment Advisory and Administrative Services Agreement provides that the Company may terminate the agreement without penalty upon 60 days’ written notice to the investment adviser. If the investment adviser wishes to voluntarily terminate the Investment Advisory and Administrative Services Agreement, it must give stockholders a minimum of 120 days’ notice prior to termination and must pay all expenses associated with its termination. The Investment Advisory and Administrative Services Agreement may also be terminated, without penalty, upon the vote of a majority of the Company’s outstanding voting securities.
License Agreement
The Company entered into a license agreement with the investment adviser, pursuant to which the investment adviser granted the Company a non-exclusive license to use the name “Keating.” Under the license agreement, the Company has the right to use the “Keating” name and logo for so long as Keating Investments or one of its affiliates remains the Company’s investment adviser. Other than with respect to this limited license, the Company has no legal right to the “Keating” name or logo. The License Agreement will remain in effect for as long as the Investment Advisory and Administrative Services Agreement with the investment adviser is in effect.
22
Table of Contents
Keating Capital, Inc.
Notes to Financial Statements
(Unaudited)
Joint Liability Insurance Agreement
The Company maintains a directors and officers liability insurance policy covering the directors and officers of the Company, insuring the Company against loss that it may be required or permitted to pay as indemnities of the directors and officers of the Company, and insuring the Company for certain securities claims. The Company also maintains an additional policy providing for excess coverage in the case of non-indemnifiable claims, covering its directors and officers. The coverages under these polices in certain cases extend to the officers, managers and employees of the investment adviser, and to the investment adviser’s Investment Committee. On November 4, 2011, the Company and the investment adviser entered into a joint liability insurance agreement, which was approved by the Company’s non-interested directors, that allocates the premium cost of the directors and officers liability insurance policy and the excess coverage policy between the Company and the investment adviser and provides for the allocation of any deductibles and losses in excess of applicable insurance limits. For the directors and officers liability insurance policy covering the policy years ending August 28, 2012 and August 28, 2013, the joint liability insurance agreement specifies that 10% of the total premium under this policy be allocated to the investment adviser. None of the premium under the excess coverage policy is allocated to the investment adviser.
| 5. | Capital Stock |
The Company’s authorized capital stock consists of 200,000,000 shares of stock, par value $0.001 per share, all of which has initially been designated as common stock. Each share of common stock entitles the holder to one vote.
From January 11, 2010 through June 30, 2011, the Company raised $78,423,340, net of issuance costs, in a continuous public offering of 8,713,705 shares of its common stock, with the final closing of escrowed funds from subscribing investors occurring July 11, 2011. The shares of common stock were offered at $10.00 per share, adjusted for volume discounts and commission waivers. All shares in the continuous public offering were sold at a price of either $9.30 or $10.00, depending on whether or not sales commissions were waived by the dealer manager. The continuous public offering resulted in gross proceeds of $86,800,000, or an average price of $9.96 per share. The investment adviser purchased 564 shares of common stock in the continuous public offering at a price of $10.00 per share.
On May 9, 2012, the Company’s Board of Directors authorized a stock repurchase program of up to $5.0 million. Under the repurchase program, the Company is authorized to repurchase shares of the Company’s common stock in open market transactions, including through block purchases, depending on prevailing market conditions and other factors. The stock repurchase program will expire on November 8, 2012, unless extended by the Company’s Board of Directors. The repurchase program may be extended, modified or discontinued at any time for any reason. The repurchase program does not obligate the Company to acquire any specific number of shares, and all repurchases will be made in accordance with SEC Rule 10b-18, which sets certain restrictions on the method, timing, price and volume of stock repurchases. During the three and nine months ended September 30, 2012, the Company repurchased 31,482 shares and 70,470 shares of its common stock at an average price of $7.36 and $7.22 per share, including commissions, with a total cost of $231,745 and $508,943, respectively. The Company’s net asset value per share increased by $0.01 per share as a result of the share repurchases during the nine months ended September 30, 2012. The 70,470 shares of common stock repurchased under the Company’s stock repurchase program have not been retired or cancelled, remain issued but not outstanding shares, and were held in treasury as of September 30, 2012.
| 6. | Commitments and Contingencies |
In the normal course of business, the Company may enter into investment agreements under which it commits to make an investment in a portfolio company at some future date or over a specified period of time.
The Company maintains a directors and officers insurance policy and an excess coverage policy for non-indemnifiable claims covering the Company and its officers and directors. The Company has also agreed to indemnify its directors and officers to the maximum extent permitted by Maryland law subject to the restrictions in the 1940 Act.
As of September 30, 2012, the Company was not a party to any material legal proceedings. However, from time to time, the Company may be party to certain legal proceedings incidental to the normal course of its business including the enforcement of its rights under contracts with its portfolio companies.
23
Table of Contents
Keating Capital, Inc.
Notes to Financial Statements
(Unaudited)
| 7. | Net Changes in Net Assets Per Share Resulting from Operations |
The following table sets forth the computation of the basic and diluted per share net decrease in net assets resulting from operations for the three and nine months ended September 30, 2012 and 2011:
| Three Months Ended | Nine Months Ended | |||||||||||||||
| September 30, 2012 |
September 30, 2011 |
September 30, 2012 |
September 30, 2011 |
|||||||||||||
| Net increase (decrease) in net assets resulting from operations |
$ | 128,070 | $ | (1,360,168 | ) | $ | (925,316 | ) | $ | (2,580,603 | ) | |||||
| Basic and diluted weighted average shares |
9,237,502 | 9,103,658 | 9,265,626 | 6,125,439 | ||||||||||||
| Basic and diluted net increase (decrease) in net assets per share resulting from operations |
$ | 0.01 | $ | (0.15 | ) | $ | (0.10 | ) | $ | (0.42 | ) | |||||
|
|
|
|
|
|
|
|
|
|||||||||
During the three and nine months ended September 30, 2012 and 2011, the Company had no dilutive securities outstanding.
24
Table of Contents
Keating Capital, Inc.
Notes to Financial Statements
(Unaudited)
| 8. | Financial Highlights |
The following is a schedule of financial highlights for the nine months ended September 30, 2012 and 2011.
Keating Capital, Inc.
Financial Highlights
| Nine Months Ended | ||||||||
| September 30, 2012 |
September 30, 2011 |
|||||||
| Per common share data |
||||||||
| Net asset value, beginning of period |
$ | 8.23 | $ | 7.85 | ||||
| Net investment loss* |
(0.34 | ) | (0.42 | ) | ||||
| Net realized gain on investments* |
0.03 | — | ||||||
| Net change in unrealized appreciation on investments* |
0.21 | — | ||||||
|
|
|
|
|
|||||
| Net decrease in net assets resulting from operations |
(0.10 | ) | (0.42 | ) | ||||
|
|
|
|
|
|||||
| Stockholder distributions: |
||||||||
| Distributions as a return of capital* |
— | (0.07 | ) | |||||
|
|
|
|
|
|||||
| Net decrease in net assets resulting for stockholder distributions |
— | (0.07 | ) | |||||
|
|
|
|
|
|||||
| Capital stock transactions: |
||||||||
| Issuance of common stock in continuous public offering (1) |
— | 2.00 | ||||||
| Offering costs from issuance of common stock* |
— | (1.01 | ) | |||||
| Amortization of deferred offering costs* |
— | (0.08 | ) | |||||
| Repurchases of common stock (2) |
0.01 | — | ||||||
|
|
|
|
|
|||||
| Net increase in net assets from capital stock transactions |
0.01 | 0.91 | ||||||
|
|
|
|
|
|||||
| Net asset value, end of period |
$ | 8.14 | $ | 8.27 | ||||
|
|
|
|
|
|||||
| Ratios and supplemental data: |
||||||||
| Per share market price, end of period (3) |
$ | 7.08 | — | |||||
| Total return based on change in net asset value (4) |
(1.09 | %) | 6.24 | % | ||||
| Total return based on stock price (5) |
(16.31 | %) | — | |||||
| Common shares outstanding, end of period |
9,213,311 | 9,283,604 | ||||||
| Weighted average common shares outstanding during period |
9,265,626 | 6,125,439 | ||||||
| Net assets, end of period |
$ | 74,950,456 | $ | 76,750,350 | ||||
| Annualized ratio of operating expenses to average net assets |
5.63 | % | 7.03 | % | ||||
| Annualized ratio of net investment loss to average net assets |
(5.63 | %) | (6.90 | %) | ||||
| Weighted average debt per common share (6) |
$ | — | $ | — | ||||
| Portfolio turnover (7) |
2.46 | % | — | |||||
| * | Based on weighted average shares outstanding during the period. |
| (1) | Represents the average increase in net asset value attributable to each share issued during the nine months ended September 30, 2011. |
| (2) | For the nine months ended September 30, 2012, the increase in net asset value attributable to the shares repurchased was $0.01 per share. There were no shares repurchased during the nine months ended September 30, 2011. |
| (3) | The shares of the Company’s common stock were listed on the Nasdaq Capital Market beginning December 12, 2011. Accordingly, there was no market price for the shares as of September 30, 2011. |
| (4) | Total return based on change in net asset value equals the change in the end of the period net asset value over the beginning of the period net asset value plus distributions paid per weighted average share during the period, divided by the beginning of the period net asset value. This return calculation has not been annualized. |
| (5) | Total return based on stock price equals the change in the end of the period stock price over the beginning of period stock price plus distributions paid per weighted average share during the period, divided by the beginning of period stock price. This return calculation has not been annualized. |
| (6) | As of September 30, 2012 and 2011, the Company did not have any debt. |
| (7) | For the nine months ended September 30, 2012, portfolio turnover is calculated as net proceeds from the sale of portfolio company investments during the period divided by average net assets during the period. This calculation has not been annualized. Since there were no sales of portfolio company investments during the nine months ended September 30, 2011, there was no portfolio turnover. |
25
Table of Contents
Keating Capital, Inc.
Notes to Financial Statements
(Unaudited)
| 9. | Investments in and Advances to Affiliates |
During the nine months ended September 30, 2012, the Company had two portfolio company investments, Metabolon, Inc. and Corsair Components, Inc., which were Affiliate Investments, and the Company had no Control Investments. The following is a schedule of the Company’s investments in these two affiliates during the nine months ended September 30, 2012. For the nine months ended September 30, 2012, the Company made no advances to these two affiliates.
| Three Months Ended September 30, 2012 |
Nine Months Ended September 30, 2012 |
|||||||||||||||||||||||||||||
| Portfolio Company (1) |
Investment Description |
Number of Shares / Warrants |
Amount of Interest and Dividends Credited to Income (2) |
Amount of Interest and Dividends Credited to Income (2) |
December 31, 2011 Fair Value |
Gross Additions (3) |
Gross Reductions (4) |
September 30, 2012 Fair Value |
||||||||||||||||||||||
| Affiliate Investments |
||||||||||||||||||||||||||||||
| Corsair Components, Inc. |
Common Stock (5) |
640,000 | $ | — | $ | — | $ | 5,400,000 | $ | 60,000 | $ | — | $ | 5,460,000 | ||||||||||||||||
| Common Stock Warrants (5) |
160,000 | — | — | 210,000 | — | (70,000 | ) | 140,000 | ||||||||||||||||||||||
| Metabolon, Inc. |
Series D Convertible Preferred Stock |
2,229,021 | — | — | 4,000,000 | 280,000 | — | 4,280,000 | ||||||||||||||||||||||
|
|
|
|
|
|
|
|
|
|
|
|
|
|||||||||||||||||||
| Total Affiliate Investments |
$ | — | $ | — | $ | 9,610,000 | $ | 340,000 | $ | (70,000 | ) | $ | 9,880,000 | |||||||||||||||||
|
|
|
|
|
|
|
|
|
|
|
|
|
|||||||||||||||||||
| (1) | The Company had no control investments as defined by the 1940 Act during the nine months ended September 30, 2012. |
| (2) | Affiliate investments consist of convertible preferred stock, common stock and common stock warrants that are generally non-income producing and restricted. The convertible preferred stock investment carries a non-cumulative, preferred dividend payable when and if declared by the portfolio company’s board of directors. Since no dividends have been declared or paid, or are expected to be declared or paid, with respect to these convertible preferred stock investments, these investments are considered to be non-income producing. |
| (3) | Gross additions include increases in investments resulting from new portfolio company investments, paid-in-kind interest or dividends, and exchange of one or more existing securities for one or more new securities. Gross additions also include net decreases in unrealized depreciation or net increases in unrealized appreciation. |
| (4) | Gross reductions include decreases in investments resulting from sales and the exchange of one or more existing securities for one or more new securities. Gross reductions also include net increases in unrealized depreciation or net decreases in unrealized appreciation. |
| (5) | Corsair Components, Inc. completed a 1-for-5 reverse stock split effective April 24, 2012. As a result of the reverse stock split, the Company now owns 640,000 shares of common stock and warrants to purchase 160,000 shares of common stock at an exercise price of $0.05 per share. Prior to the reverse stock split, the Company previously owned 3,200,000 shares of common stock and warrants to purchase 800,000 shares of common stock at an exercise price of $0.01 per share. |
During the nine months ended September 30, 2011, the Company had two portfolio company investments, Metabolon, Inc. and Corsair Components, Inc., which were Affiliate Investments, and the Company had no Control Investments. The following is a schedule of the Company’s investments in these two affiliates during the nine months ended September 30, 2011. For the nine months ended September 30, 2011, the Company made no advances to these two affiliates.
| Three Months Ended September 30, 2011 |
Nine Months Ended September 30, 2011 |
|||||||||||||||||||||||||||||
| Portfolio Company (1) |
Investment Description |
Number of Shares / Warrants |
Amount of Interest and Dividends Credited to Income (2) |
Amount of Interest and Dividends Credited to Income (2) |
December 31, 2010 Fair Value |
Gross Additions (3) |
Gross Reductions (4) |
September 30, 2011 Fair Value |
||||||||||||||||||||||
| Affiliate Investments |
||||||||||||||||||||||||||||||
| Corsair Components, Inc. |
Common Stock |
3,200,000 | $ | — | $ | — | $ | — | $ | 4,096,000 | $ | — | $ | 4,096,000 | ||||||||||||||||
| Common Stock Warrants |
800,000 | — | — | — | 630,000 | — | 630,000 | |||||||||||||||||||||||
| Metabolon, Inc. |
Series D Convertible Preferred Stock |
2,229,021 | — | — | — | 4,000,000 | — | 4,000,000 | ||||||||||||||||||||||
|
|
|
|
|
|
|
|
|
|
|
|
|
|||||||||||||||||||
| Total Affiliate Investments |
$ | — | $ | — | $ | — | $ | 8,726,000 | $ | — | $ | 8,726,000 | ||||||||||||||||||
|
|
|
|
|
|
|
|
|
|
|
|
|
|||||||||||||||||||
| (1) | The Company had no control investments as defined by the 1940 Act during the nine months ended September 30, 2011. |
| (2) | Affiliate investments consist of convertible preferred stock, common stock and common stock warrants that are generally non-income producing and restricted. The convertible preferred stock investment carries a non-cumulative, preferred dividend payable when and if declared by the portfolio company’s board of directors. Since no dividends have been declared or paid, or are expected to be declared or paid, with respect to these convertible preferred stock investments, these investments are considered to be non-income producing. |
| (3) | Gross additions include increases in investments resulting from new portfolio company investments, paid-in-kind interest or dividends, and exchange of one or more existing securities for one or more new securities. Gross additions also include net decreases in unrealized depreciation or net increases in unrealized appreciation. |
| (4) | Gross reductions include decreases in investments resulting from sales and the exchange of one or more existing securities for one or more new securities. Gross reductions also include net increases in unrealized depreciation or net decreases in unrealized appreciation. |
26
Table of Contents
Keating Capital, Inc.
Notes to Financial Statements
(Unaudited)
The above schedules should be read in conjunction with the Schedule of Investments set forth above and Notes 2 and 3 to these Financial Statements.
| 10. | Subsequent Events |
On October 2, 2012, LifeLock priced its IPO at $9.00 per share. The shares of LifeLock’s common stock began trading on the New York Stock Exchange on October 3, 2012. In connection with LifeLock’s IPO, the shares of Series E preferred stock held by the Company automatically converted into 944,513 shares of LifeLock’s common stock, based on an adjusted conversion price of $5.29 per share. The Series E preferred stock warrants were cancelled in connection with the IPO. The shares of LifeLock’s common stock that the Company received upon conversion of the Series E preferred stock are subject to a 180-day lockup provision which will expire in April 2013.
On October 5, 2012, Xtime completed a Series 2 convertible preferred stock financing in which the Company did not participate. Immediately prior to the closing of the Series 2 convertible preferred stock round, all of the existing holders of Xtime’s preferred stock (including the Series F preferred stockholders) converted their existing preferred stock into newly-created Series 1A convertible preferred stock and certain warrants to acquire additional shares of Xtime’s common stock for nominal consideration upon an IPO (the “IPO warrants”). As a holder of Series F preferred stock, the Company received one share of Series 1A preferred stock for each share of Series F preferred stock that the Company held, plus IPO warrants which grant the Company the right to acquire additional shares of common stock, calculated at the time of the IPO based on the actual IPO price, at an exercise price of $0.01 per share. The Company continues to hold warrants to acquire 22,581 shares of Xtime common stock which the Company received as part of the Series F round.
On October 9, 2012, Agilyx raised additional funds as part of a Series D convertible preferred stock financing in which the Company did not participate.
On October 24, 2012, BrightSource completed an initial closing of its Series 1 convertible preferred stock financing which resulted in the automatic conversion of the Series E preferred stock held by the Company into 96,177 shares of BrightSource’s common stock. As part of the initial closing of the Series 1 convertible preferred stock round, the Company made a $397,125 investment in BrightSource’s Series 1 preferred stock, which represented the Company’s full pro rata participation amount in the round. Existing preferred stockholders investing their full pro rata participation amount in the Series 1 round also received shares of Series 1A preferred stock and additional shares of common stock.
27
Table of Contents
| Item 2. | Management’s Discussion and Analysis of Financial Condition and Results of Operations |
FORWARD-LOOKING STATEMENTS AND PROJECTIONS
This quarterly report on Form 10-Q contains forward-looking statements that involve substantial risks and uncertainties. These forward-looking statements are not historical facts, but are based on current management expectations that involve substantial risks, uncertainties, and other factors, some of which are beyond our control and difficult to predict and could cause actual results to differ materially from those expressed in, or implied by, these forward-looking statements. Forward-looking statements relate to future events or our future financial performance. We generally identify forward-looking statements by terminology such as “may,” “will,” “should,” “expects,” “plans,” “anticipates,” “could,” “intends,” “target,” “projects,” “contemplates,” “believes,” “estimates,” “predicts,” “potential” or “continue” or the negative of these terms or other similar words. Important assumptions include our ability to originate new portfolio company investment opportunities, the success of our portfolio companies in completing an initial public offering within our targeted timeframes, our ability to achieve certain returns on our investments, and our ability to access additional capital. The forward-looking statements contained in this quarterly report on Form 10-Q include statements as to:
| • | our future operating results; |
| • | our business prospects and the prospects of our existing and prospective portfolio companies; |
| • | the impact of the investments we expect to make; |
| • | our ability to identify future portfolio companies that meet our investment criteria; |
| • | the impact of a protracted decline in the market for initial public offerings (“IPOs”) on our business; |
| • | our relationships with venture capital firms and investment banks that are the primary sources of our investment opportunities; |
| • | the expected market for venture capital investments in later stage, private, pre-IPO companies; |
| • | the dependence of our future success on the general economy and its impact on the industries in which we invest; |
| • | our ability to access the equity markets to raise capital to fund future portfolio company investments; |
| • | the ability of our portfolio companies to achieve their operating performance objectives and complete an IPO within our targeted timeframe; |
| • | our ability to invest at valuations which allow us to achieve our targeted returns within our expected holding periods; |
| • | our regulatory structure and tax status, including any changes in laws and regulations; |
| • | our ability to operate as a business development company and a regulated investment company; |
| • | the adequacy of our cash resources and working capital; |
| • | our ability to generate realized capital gains from the disposition of our portfolio company interests after they have completed an IPO; |
| • | the timing, form and amount of any dividend distributions; |
| • | the valuation of any investments in portfolio companies, particularly those having no liquid trading market; and |
| • | our ability to recover unrealized losses. |
Although we believe that the assumptions on which these forward-looking statements are based are reasonable, any of those assumptions could prove to be inaccurate, and as a result, the forward-looking statements based on those assumptions also could be inaccurate. In light of these and other uncertainties, the inclusion of a projection or forward-looking statement in this quarterly report on Form 10-Q should not be regarded as a representation by us that our plans and objectives will be achieved. These risks and uncertainties include those described or identified in “Risk Factors” in our most recent annual report on Form 10-K previously filed with the SEC. You should not place undue reliance on these forward-looking statements, which apply only as of the date of this quarterly report on Form 10-Q. Except as required by the federal securities laws, we undertake no obligation to revise or update any forward-looking statements, whether as a result of new information, future events or otherwise, to reflect events or circumstances occurring after the date of this quarterly report on Form 10-Q. The forward-looking statements and projections contained in this quarterly report on Form 10-Q are excluded from the safe harbor protection provided by Section 27A of the Securities Act of 1933, as amended, or the Securities Act.
28
Table of Contents
MANAGEMENT’S DISCUSSION AND ANALYSIS
OF FINANCIAL CONDITION AND RESULTS OF OPERATIONS
The following discussion should be read in conjunction with our financial statements and related notes and other financial information appearing elsewhere in this quarterly report on Form 10-Q. In addition to historical information, the following discussion and other parts of this quarterly report on Form 10-Q contain forward-looking information that involves risks and uncertainties. Our actual results could differ materially from those anticipated by such forward-looking information due to the factors discussed under “Risk Factors” in our most recent annual report on Form 10-K and quarterly report on Form 10-Q previously filed with the SEC and “Forward-Looking Statements and Projections” and the “Risk Factors” appearing elsewhere herein.
Overview
We are a closed-end, non-diversified investment company that has elected to be regulated as a business development company under the 1940 Act. As a business development company, we are required to comply with certain regulatory requirements. For instance, we generally have to invest at least 70% of our total assets in “qualifying assets,” including securities of private U.S. companies, cash, cash equivalents, U.S. government securities and high-quality debt investments that mature in one year or less.
Effective January 1, 2010, we elected to be treated for tax purposes as a regulated investment company, or a RIC, under Subchapter M of the Code. We intend to operate so as to qualify as a RIC and, as such, we have made no provision for income taxes as of December 31, 2011.
We are externally managed by Keating Investments, LLC (“Keating Investments” or the “investment adviser”) an investment adviser that was founded in 1997 and is registered under the Investment Advisers Act of 1940, as amended (“Advisers Act”). As our investment adviser, Keating Investments is responsible for managing our day-to-day operations including, without limitation, identifying, evaluating, negotiating, closing, monitoring and servicing our investments. Keating Investments also provides us with the administrative services necessary for us to operate. Our investment activities are managed by Keating Investments pursuant to the Investment Advisory and Administrative Services Agreement. See “Investment Advisory and Administrative Services Agreement” below.
We specialize in making pre-IPO investments in innovative, emerging growth companies that are committed to and capable of becoming public. We provide investors with the ability to participate in a unique fund that allows our stockholders to share in the potential value accretion that we believe typically occurs once a company transforms from private to public status, or what we refer to as the private-public valuation arbitrage. Our shares are listed on Nasdaq under the ticker symbol “KIPO.”
By design, our fund has been structured as a high risk/high return investment vehicle. While we have discretion in the investment of our capital, we seek long-term capital appreciation through investments principally in equity securities that we believe will maximize our total return. Although our preferred stock investments typically carry a dividend rate, in some cases with a payment preference over other classes of equity, we do not expect dividends (whether cumulative or non-cumulative) to be declared and paid on our preferred stock investments, or on our common stock investments, since our portfolio companies typically prefer to retain profits, if any, in their businesses. Accordingly, our equity investments are not expected to generate current income (i.e., dividends or interest income), which makes us different from other business development companies that primarily make debt investments from which they receive current yield in the form of interest income. Our primary source of investment return will be generated from net capital gains, if any, realized on the disposition of our portfolio company investments, which typically will occur after a portfolio company completes an IPO and after expiration of a customary 180-day post-IPO lockup restriction.
Our investment objective is to maximize capital appreciation. We seek to accomplish our capital appreciation objective by making investments in the equity securities of later stage, typically venture capital-backed, pre-IPO companies that are committed to and capable of becoming public. In accordance with our investment objective, we seek to invest in equity securities of principally U.S.-based, private companies with an equity value of between $100 million and $1 billion. We refer to companies with an equity value of between $100 million and less than $250 million as “micro-cap companies” and companies with an equity value of between $250 million and $1 billion as “small-cap companies.”
We have identified three core investment criteria that we believe are important in meeting our investment objective. These core criteria provide the primary basis for making our investment decisions; however, we may not require each prospective portfolio company in which we choose to invest to meet all of these core criteria.
| • | High quality growth companies. We seek to invest primarily in micro-cap and small-cap companies that are already generating annual revenue in excess of $10 million on a trailing 12-month basis and which we believe have growth potential. |
29
Table of Contents
| • | Commitment to complete IPO. We seek to invest in public ready micro-cap and small-cap companies whose management teams are committed to, and capable of, becoming public companies, whose businesses we believe will benefit from status as public companies, and that we believe are capable of completing IPOs and obtaining exchange listings typically within 18 months after we complete our investments. |
| • | Potential for return on investment. Because of the value differential which we believe exists between public and private companies as a result of the liquidity premium, or what we refer to as the private-public valuation arbitrage, as discussed below, we seek to make investments that create the potential for a 2x return on our investment once the company is publicly traded and assuming our expected investment horizon of 36 months. We may also pursue investments with a shorter expected investment horizon, where we believe the portfolio company may file for an IPO sooner than 12 months or has a registration statement filed at the time of our investment, in which case our targeted 2x return on our investment may be correspondingly reduced. |
We generally acquire our equity securities principally through direct investments in prospective portfolio companies that meet our investment criteria. However, we may also purchase our equity securities directly from current or former management or early stage investors in private secondary transactions, or from current or former non-management employees where the company or its management is coordinating the transaction process. We use a disciplined approach to our initial investment assessment and continued portfolio monitoring which relies primarily on the detailed financial and business information we receive about the portfolio company and our access to and discussions with management, both prior to and after our investment. We expect that the primary sources of our investment opportunities will be from our relationships with venture capital firms and investment banks. Our investment adviser sources our investments through its principal office located in Greenwood Village, Colorado as well as through an additional office in Menlo Park, California.
Our portfolio company investments are currently composed of, and we anticipate that our portfolio will continue to be composed of, investments primarily in the form of preferred stock that is convertible into common stock, common stock, and warrants exercisable into common or preferred stock. While we expect most of our portfolio company investments to be in the form of equity securities, we may in some cases invest in debentures or loans that are convertible into or settled with common stock. At September 30, 2012, none of our portfolio company investments were convertible debentures or loans.
We believe that investing in an issuer’s most senior equity securities and/or negotiating certain structural protections are ways to potentially mitigate the otherwise high risks associated with pre-IPO investing. The equity securities that we acquire directly from an issuer are typically the issuer’s most senior preferred stock at the time of our investment or, in cases where we acquire common shares, the issuer typically has only common stock outstanding. However, the equity securities that we acquire directly from selling stockholders are typically common stock and may not represent the most senior equity securities of the issuer. Of the 20 portfolio company investments we have made, at the time of our initial investment in these companies, 17 of these initial investments represented the company’s most senior preferred stock, and two of these initial investments represented common shares where the company had only common stock outstanding. Our initial investment in the common shares of Stoke, Inc. (“Stoke”), which we acquired from Stoke employees, is the only initial investment where we did not acquire the company’s most senior equity securities since Stoke had preferred stock outstanding at the time of our initial investment. We invested in Stoke because we believed it represented an opportunity to invest in a company that met our investment criteria even though it was not looking to raise additional equity financing at the time.
During the three months ended September 30, 2012, we disposed of our entire interest in NeoPhotonics Corporation (“NeoPhotonics”). As a result, our portfolio as of September 30, 2012 consists of 19 companies, one publicly traded company, Solazyme, Inc. (“Solazyme”), and 18 private companies. However, LifeLock, Inc. (“LifeLock”) completed its IPO on October 2, 2012 and its shares began trading on the New York Stock Exchange on October 3, 2012. See “Management’s Discussion and Analysis of Financial Condition and Results of Operations – Recent Developments.”
As of September 30, 2012, we continued to own the most senior equity securities of 16 of our 19 portfolio companies. We consider ourselves as owning a portfolio company’s most senior equity securities if: (i) the preferred equity securities which we acquired in our initial investment represent the portfolio company’s most senior equity securities outstanding as of September 30, 2012, or (ii) the common equity securities owned by us as of September 30, 2012 represent the portfolio company’s only class of equity securities outstanding. Accordingly, our determination of the most senior equity securities of a portfolio company takes into account a portfolio company’s issuance of more senior equity securities following our initial investment. It is possible that our portfolio companies may issue equity securities that are more senior to us if they decide to raise additional capital before an IPO. Two of our private portfolio companies, BrightSource Energy, Inc. (“BrightSource”) and Agilyx Corporation (“Agilyx”), in which we owned the most senior equity securities of each company at the time of our investment, raised additional funds in private equity financings subsequent to September 30, 2012. As a result, our initial investments in BrightSource and Agilyx no longer represent the most senior equity securities in these two portfolio companies. See “Management’s Discussion and Analysis of Financial Condition and Results of Operations – Recent Developments.”
30
Table of Contents
We target our pre-IPO investing activities on direct investments in the most senior equity securities of later-stage innovative, emerging growth companies that agree to provide us with financial information both at the time of our initial investment and on an ongoing basis thereafter. The average age of our current portfolio companies at the time of our initial investment was eight years. In addition, the financing round in which we made our initial investment represented, on average, the portfolio company’s fifth, or Series E, financing round. Of our 19 portfolio company investments as of September 30, 2012, 17 have been direct investments in a portfolio company and two have been acquired in secondary transactions. We have been the lead investor in seven of our 19 portfolio company investments. As of September 30, 2012, we also have access to financial information for all of our portfolio companies.
The following table details certain information and other characteristics of our portfolio companies as of September 30, 2012.
| Initial Keating Capital Investment Date |
Portfolio Company (1) |
Portfolio Company Founding Year |
Portfolio Company Status as of September 30, 2012 |
Portfolio Company Age at Initial Investment in Years (2) |
Initial Investment / Purchase Transaction (3) |
Lead or Participating Investor |
Initial Keating Capital Participation Round |
Number of Portfolio Company Financing Rounds Prior to Keating Capital Initial Investment |
Portfolio Company’s Most Senior Equity Security (4) |
Access to Portfolio Company Financial Information | ||||||||||
| Jul-10 |
Livescribe, Inc. |
2007 | Private Company | 3 | Direct Investment | Participating | Series C Preferred | 2 | No | Yes - Contractual Rights | ||||||||||
| Jul-10 |
Solazyme, Inc. |
2003 | Public Company | 7 | Direct Investment | Participating | Series D Preferred | 3 | Yes | Yes - Publicly Reporting | ||||||||||
| Oct-10 |
MBA Polymers, Inc. |
1993 | Private Company | 17 | Direct Investment | Participating | Series G Preferred | 6 | Yes | Yes - Contractual Rights | ||||||||||
| Feb-11 |
BrightSource Energy, Inc. (5) |
2006 | Private Company | 5 | Direct Investment | Participating | Series E Preferred | 4 | Yes | Yes - Contractual Rights | ||||||||||
| Mar-11 |
Harvest Power, Inc. |
2008 | Private Company | 3 | Direct Investment | Participating | Series B Preferred | 1 | No | Yes - Contractual Rights | ||||||||||
| Mar-11 |
Suniva, Inc. | 2007 | Private Company | 4 | Direct Investment | Participating | Series D Preferred | 3 | Yes | Yes - Contractual Rights | ||||||||||
| Jun-11 |
Xtime, Inc. | 1999 | Private Company | 12 | Direct Investment | Lead | Series F Preferred | 5 | Yes | Yes - Contractual Rights | ||||||||||
| Jul-11 |
Corsair Components, Inc. |
1994 | Private Company - IPO Registration on File |
17 | Secondary Purchase | Lead | Common | None | Yes | Yes - Contractual Rights | ||||||||||
| Aug-11 |
Metabolon, Inc. |
2000 | Private Company | 11 | Direct Investment | Lead | Series D Preferred | 3 | Yes | Yes - Contractual Rights | ||||||||||
| Aug-11 |
Kabam, Inc. | 2006 | Private Company | 5 | Direct Investment | Participating | Series D Preferred | 3 | Yes | Yes - Contractual Rights | ||||||||||
| Sep-11 |
Tremor Video, Inc. |
2005 | Private Company | 6 | Direct Investment | Participating | Series F Preferred | 5 | Yes | Yes - Contractual Rights | ||||||||||
| Sep-11 |
TrueCar, Inc. |
2005 | Private Company | 6 | Direct Investment | Participating | Common | 4 | Yes | Yes - Contractual Rights | ||||||||||
| Dec-11 |
Agilyx Corporation (5) |
2004 | Private Company | 7 | Direct Investment | Lead | Series C Preferred | 2 | Yes | Yes - Contractual Rights | ||||||||||
| Jan-12 |
Zoosk, Inc. | 2007 | Private Company | 5 | Direct Investment | Participating | Series E Preferred | 4 | Yes | Yes - Contractual Rights | ||||||||||
| Mar-12 |
LifeLock, Inc. (6) |
2005 | Private Company - IPO Registration on File |
7 | Direct Investment | Participating | Series E Preferred | 4 | Yes | Yes - Contractual Rights | ||||||||||
| Mar-12 |
SilkRoad, Inc. |
2003 | Private Company | 9 | Direct Investment | Participating | Series C Preferred | 2 | Yes | Yes - Contractual Rights | ||||||||||
| May-12 |
Glam Media, Inc. |
2004 | Private Company | 8 | Direct Investment | Lead | Series F Preferred | 5 | Yes | Yes - Contractual Rights | ||||||||||
| Jun-12 |
Stoke, Inc. | 2004 | Private Company | 8 | Secondary Purchase | Lead (7) | Common | 5 | No | Yes - Contractual Rights | ||||||||||
| Jun-12 |
Jumptap, Inc. |
2005 | Private Company | 7 | Direct Investment | Lead | Series G Preferred | 6 | Yes | Yes - Contractual Rights | ||||||||||
| Average Age of Portfolio Company at Time of Keating Capital’s Initial Investment (in years) | 8 | Average Number of Portfolio Company Financing Rounds Prior to Keating Capital’s Initial Investment (8) | 4 | |||||||||||||||||
| (1) | During the three months ended September 30, 2012, we disposed of our entire interest in NeoPhotonics and, as a result, NeoPhotonics has not been included in the above table. |
| (2) | Reflects the age of each portfolio company (in years) at the time of Keating Capital’s initial investment. |
| (3) | Reflects the type of transaction in which Keating Capital acquired its initial investment in each portfolio company. A “direct investment” means an investment in equity securities issued directly by the portfolio company. A “secondary purchase” means an acquisition of equity securities from a portfolio company’s current or former management or early stage investors in private secondary transactions, or from current or former non-management employees where the portfolio company or its management is coordinating the transaction. |
| (4) | Keating Capital is considered to own a portfolio company’s most senior equity securities if: (i) the preferred equity securities which Keating Capital acquired in its initial investment represent the portfolio company’s most senior equity securities outstanding as of September 30, 2012, or (ii) the common equity securities owned by Keating Capital as of September 30, 2012 represent the portfolio company’s only class of equity securities outstanding. Accordingly, the determination of most senior equity securities of a portfolio company takes into account a portfolio company’s issuance of more senior equity securities following Keating Capital’s initial investment. |
| (5) | Two of our private portfolio companies, BrightSource and Agilyx, in which we owned the most senior equity security, completed private equity financings subsequent to September 30, 2012 and, as a result, our initial investments in these two portfolio companies no longer represent their most senior equity securities. |
| (6) | LifeLock completed the pricing of its IPO on October 2, 2012, and the shares of LifeLock’s common stock began trading on the New York Stock Exchange on October 3, 2012. |
| (7) | Keating Capital was the sole investor. |
| (8) | Average calculation excludes Corsair since it had not raised equity financing from institutional investors prior to Keating Capital’s initial investment. A new series of preferred stock issued upon conversion of an existing series of preferred stock and rounds issued in acquisitions are not considered new round. |
31
Table of Contents
In each of our investments, we may seek to negotiate structural protections such as conversion rights which would result in our receiving shares of common stock at a discount to the IPO price upon conversion at the time of the IPO, or warrants that would result in our receiving additional shares for a nominal exercise price at the time of an IPO. In some circumstances, these structural protections will apply only if the IPO price is below stated levels. In some cases, our decision to pursue an investment opportunity will be dependent on obtaining some structural protections that are expected to enhance our ability to meet our targeted return on the investment. Of our investments in 18 private portfolio companies as of September 30, 2012, we have been provided some structural protection with respect to investments in ten of these portfolio companies. However, our structural protection in BrightSource, which had a structurally protected appreciation multiple at IPO of 1.25x our investment cost, was eliminated as part of a private equity financing which occurred subsequent to September 30, 2012. See “Management’s Discussion and Analysis of Financial Condition and Results of Operations – Recent Developments” for a discussion of the private equity financing by BrightSource subsequent to September 30, 2012.
We typically do not seek to take a control position in our investments through ownership, board seats, observation rights or other control features. However, we offer significant managerial assistance to our portfolio companies.
We intend to maximize our potential for capital appreciation by taking advantage of the private-public valuation arbitrage, or the premium, that we believe is generally associated with having a more liquid asset, such as a publicly traded security. Typically, we believe investors place a premium on liquidity, or having the ability to sell stock more quickly and efficiently through an established stock exchange than through private transactions. Specifically, we believe that an exchange listing, if obtained, should generally provide our portfolio companies with greater visibility, marketability and liquidity than they would otherwise be able to achieve without such a listing. As a result, we believe that public companies typically trade at higher valuations – generally 2x or more – than private companies with similar financial attributes. By going public and listing on an exchange, we believe that our portfolio companies have the potential to receive the benefit of this liquidity premium. There can be no assurance that our portfolio companies will trade at these higher valuations once they are public and listed on an exchange.
In general, we seek to invest in later stage, private, pre-IPO companies that we believe will be able to file a registration statement with the SEC for an IPO within approximately 12 months after our initial investment, and complete an IPO and obtain an exchange listing within approximately 18 months after the closing of our initial investment. After the IPO is completed, we typically will be subject to a lockup restriction which prohibits us from selling our investment during a customary 180-day period following the IPO. Once this lockup restriction expires, we expect to sell our shares in the portfolio company in the public markets over the following 12 months. However, we have the discretion to hold our position to the extent we believe the portfolio company is not being appropriately valued in the public markets or is adversely affected by market or industry cyclicality. Accordingly, we anticipate our typical investment horizon for portfolio investments will be 36 months. However, we may pursue investments with a shorter expected investment horizon, where we believe the portfolio company may file for an IPO sooner than 12 months or has a registration statement filed at the time of our investment. In each case, we have the discretion to hold securities for a longer period. The table below illustrates our targeted portfolio company investment horizon.
Targeted Portfolio Company Investment Horizon

| 1 | Following an IPO, our shares are generally subject to customary 180-day lockup restrictions. |
We are focused on the potential value transformation that we believe our portfolio companies will experience as they complete an IPO and become publicly traded and correspondingly achieve a market equity value comparable to their publicly traded peers. We target our investments in portfolio companies that we believe can complete this value transformation within our targeted 36-month holding period, compared to typical private equity and venture capital funds which take typically seven years or more. As a result, we may have low or negative returns in our initial years with any potential valuation accretion typically occurring in later years as our portfolio companies complete their IPOs and become publicly traded. However, there can be no assurance that we will be able to achieve our targeted return on any individual portfolio company investment if and when it goes public, or on the portfolio as a whole.
32
Table of Contents
We have an IPO, event-driven strategy, and we attempt to generate returns by accepting the risks of owning illiquid securities of later stage private companies. The process of a portfolio company transforming from private to public ownership does not happen automatically, and both the timing and completion of an IPO process is subject to uncertainty. If this process did happen quickly and with certainty, there would be less of an illiquidity discount available to us when we make our investments. Instead, the private to public transformation process takes time and we have incorporated an expected three year holding period into our strategy.
As of September 30, 2012, the total value of our investments in our 19 portfolio companies was $64.8 million, and we had cash and cash equivalents of $10.8 million. On March 15, 2012, we filed a registration statement on Form N-2 for an equity offering of our common stock. On August 23, 2012, we filed our second, and most recent, amendment to the registration statement. Based on our current level of assets and any proceeds we raise from our equity offering, the targeted size of our individual portfolio company investments will be approximately $5 million, but we may invest more than this amount in certain opportunistic situations. We expect that most of our portfolio company investments will represent approximately 5% of our gross assets measured at the time of investment. However, based on our investment adviser’s assessment of each portfolio company’s relative quality, fundamentals and valuation, we may make opportunistic portfolio company investments that could represent up to 25% of our gross assets at the time of investment. An individual portfolio company investment may be smaller than our targeted size and weighting at the time of the initial investment due to factors such as the size of investment made available to us and our cash available for investment. We expect that the size of our individual portfolio company investments and their weighting in our overall portfolio will fluctuate over time based on a variety of factors including, but not limited to additional follow-on investments in existing portfolio companies, dispositions, unrealized appreciation or depreciation, an increased asset base as a result of the issuance of additional equity, or a decreased asset base as a result of repurchases of our own equity. We currently expect to have a portfolio of approximately 25 companies, taking into account our current portfolio composition, our cash and cash equivalents currently available for investment, and the capital from any possible equity offering.
We may also consider making follow-on investments in an existing private portfolio company that is seeking to raise additional capital in subsequent private equity financing rounds. Existing portfolio companies may elect, or be required, to raise additional capital prior to pursuing an IPO for any number of reasons including: (i) to fund additional spending in marketing and/or research and development to develop their business, (ii) to fund working capital deficiencies due to weaker than expected revenue growth or higher than expected operating expenses, (iii) to fund business acquisitions or strategic joint ventures, and (iv) to increase cash reserves in advance of an anticipated IPO. In evaluating follow-on investment opportunities, we typically assess a number of additional factors beyond the three core investment criteria we use in making our initial investment decisions. These additional factors may include: (i) the portfolio company’s continued commitment to an IPO, (ii) the achievement of pre-IPO milestones since our initial investment, (iii) the size of our portfolio company investment relative to our overall portfolio, (iv) any industry trends affecting the portfolio company or other portfolio investments in similar industries, (v) the impact of a follow-on investment on our diversification requirements so we can continue to qualify as a RIC for tax purposes, and (vi) the possible adverse consequences to our existing investment if we elect not to make a follow-on investment, such as the forced conversion of our preferred stock into common stock at an unfavorable conversion rate and the corresponding loss of any liquidation preferences or other rights and privileges that may be applicable to the securities we currently hold. See “Management’s Discussion and Analysis of Financial Condition and Results of Operations – Recent Developments” for a discussion of private equity financings by BrightSource, Xtime and Agilyx subsequent to September 30, 2012.
Our primary source of investment return will be generated from net capital gains, if any, realized on the disposition of our portfolio company investments, which typically will occur after a portfolio company completes an IPO. We are typically prohibited from exiting investments in our publicly traded portfolio companies until the expiration of the customary 180-day post-IPO lockup period. These agreements, which we are usually required to enter into as part of our investment, prohibit us and other significant existing investors from selling stock in the portfolio company or hedging such securities during the customary 180 days following an IPO. We may dispose of these securities at our discretion at any time following the lockup period based on our business judgment. However, we will have no ability to mitigate the high volatility that is a typical characteristic of IPO aftermarket trading and is driven by such factors as overall market conditions, the industry conditions for the particular sector in which the portfolio company operates, the portfolio company’s performance, the relative size of the public float, and the potential selling activities of other pre-IPO investors and possibly management.
For our portfolio company investments where the lockup period following the IPO has expired and the stock becomes freely tradable, we typically do not begin selling automatically upon expiration of the lockup period. We expect to sell our positions over a period of time, typically during the 12 months following the expiration of our lockup, although we may sell more rapidly or in one or more block transactions. Factors that we may consider include, but are not limited to, the following:
| • | The target price determined by our investment adviser based on its business judgment and what it believes to be the portfolio company’s intrinsic value. |
| • | The application of public company multiples and our proprietary analysis to a variety of operating metrics for each portfolio company. The primary operating metrics that we typically consider are revenue, earnings before interest, taxes, depreciation and amortization (“EBITDA”) and net income. |
| • | Other factors that may be adversely or favorably affecting a particular portfolio company’s stock price, including overall market conditions, industry cyclicality, or issues specific to the portfolio company. |
33
Table of Contents
While we typically do not intend to purchase stock in a portfolio company’s IPO or in open market transactions thereafter, under certain circumstances, we may consider making additional investments in a publicly traded portfolio company in open market purchases, which will increase our position in the company. We typically will consider open market purchases of shares in our publicly traded portfolio companies as a means to bring our overall investment closer to our targeted percentage of our gross assets per portfolio company investment. In such cases, our initial private investments may have been limited due to the level of our gross assets at the time of the initial investment. However, we may be unable to make follow-on investments in our publicly traded portfolio companies as a result of certain regulatory restrictions on a business development company’s investments in publicly traded securities with market capitalizations in excess of $250 million. See “Taxation and Regulatory Requirements.”
Current Economic and Market Environment
Beginning in the fall of 2008, the global economy entered a financial crisis and recession. Volatile capital and credit markets, declining business and consumer confidence, and increased unemployment precipitated a continuing economic slowdown. While certain economic conditions in the United States have shown signs of improvement, economic growth has been slow and uneven as consumers continue to be affected by high unemployment rates and depressed housing values. In addition, recent concerns and events such as economic uncertainty surrounding financial regulatory reform and its effect on the revenues of financial services companies, U.S. debt and budget matters and the sovereign debt crisis in Europe, may continue to impact economic recovery and the financial services industry. There can be no assurance that governmental or other measures to aid economic recovery will be effective. During such economic uncertainty and market volatility, we may have difficulty raising equity capital to fund additional portfolio company investments once we become fully invested. Continued adverse economic conditions could also have a material adverse effect on our portfolio companies (including their ability to complete IPOs), our business and the value of your investment.
On August 5, 2011, Standard & Poor’s Rating Services (“S&P”) downgraded the U.S. credit rating from its top rank of AAA to AA+. The downgrade of the U.S. credit rating could have a material adverse effect on the financial markets and economic conditions in the United States and throughout the world. Additionally, austerity measures necessary to reduce the deficit could result in a slowing economy in the near term. The impact of this or any further downgrades to the U.S. government’s sovereign credit rating, or its perceived creditworthiness, and the impact of the current crisis in Europe with respect to the ability of certain European Union countries to continue to service their sovereign debt obligations is inherently unpredictable and could adversely effect the U.S. and global financial markets and economic conditions.
In addition, adverse market and economic conditions that could occur due to a downgrade of the U.S. credit rating on the United States’ debt could result in increasing borrowing costs, a falling value of the dollar, less stable financial markets and slowing or negative economic growth in the near term. These events could adversely affect our business in a variety ways, including, but not limited to, adversely impacting our portfolio companies’ ability to obtain financing, or obtaining financing but at significantly higher costs or lower valuations than the preceding financing rounds. Market disruptions could also delay the timing of going public by our private portfolio companies and affect the value of our publicly traded portfolio companies, which as of September 30, 2012, accounted for 2.6% percent of our investment portfolio and 2.2% of our gross assets. If any of these events were to occur, it could materially adversely affect our business, financial condition and results of operations.
In addition to the downgrade of the U.S. credit rating, on August 8, 2011, S&P downgraded the credit ratings of Fannie Mae, Freddie Mac, and other entities linked to long-term U.S. debt. As of September 30, 2012, our portfolio included $10.6 million of money market funds that invest in U.S. Treasuries and other U.S. Government agency-backed securities. These money market funds could be adversely affected by these recent credit downgrades.
IPO Market Conditions and Developments
The number of U.S. IPOs in the third quarter of 2012 declined to 26, from 31 IPOs in the second quarter of 2012. Total IPO proceeds raised in the third quarter of 2012 amounted to approximately $6.4 billion, compared to approximately $22.7 billion in the second quarter of 2012 (which included the $16 billion Facebook IPO in May 2012). The consumer and technology sectors accounted for half of the IPOs in the third quarter of 2012, During the nine months ended September 30, 2012, 99 U.S. IPOs were completed and raised approximately $35 billion in proceeds (including the Facebook IPO), compared to 96 companies completing IPOs during the nine months ended September 30, 2011 resulting in proceeds of approximately $29 billion. In the period from October 1, 2012 to October 24, 2012, 17 U.S. IPOs have priced raising aggregate proceeds of approximately $4.7 billion.
On April 5, 2012, the Jumpstart Our Business Start-ups Act (the “JOBS Act”), which was designed to make it easier for small businesses and emerging growth companies to raise capital and complete the IPO process, was signed into law. The JOBS Act amends the Securities Act and the Securities Exchange Act to add a new category of issuer, an “emerging growth company,” broadly defined as a company with less than $1 billion of annual gross revenue in the fiscal year prior to its IPO. For companies that qualify as “emerging growth companies,”, the JOBS Act provides exemptions from certain disclosure requirements and auditing and
34
Table of Contents
accounting rules that we believe discouraged many smaller companies from going public. For example, the JOBS Act amends Section 404 of the Sarbanes-Oxley Act to exempt emerging growth companies from the requirement to include an auditor’s statement attesting to management’s internal controls over financial reporting for up to five years. Among the changes implemented by the JOBS Act, we perceive the following potentially will have the most impact on the IPO market:
| • | Reducing the number of years of audited financial statements that emerging growth companies are required to disclose in their registration statements from three years to two years; |
| • | Allowing emerging growth companies to submit a draft IPO registration statement for confidential review by the SEC prior to making a public filing; |
| • | Permitting emerging growth companies to communicate with Qualified Institutional Buyers (QIBs), institutions and accredited investors before or after the filing of a registration statement to determine whether these prospective investors might be interested in the offering; |
| • | Allowing investment banks to publish research reports on pending offerings, even while serving as an underwriter; and |
| • | Waiving conflict of interest and three-way communications rules involving research analysts, investment bankers, and an emerging growth company’s management. |
We believe the reforms provided for in the JOBS Act have the potential to reduce many of the barriers to going public for emerging growth companies by making the process faster, easier and less costly. Many of the provisions of the JOBS Act affecting IPOs are subject to SEC rulemaking, and there are no assurances that the SEC will act in a timely fashion to implement such changes, or what additional requirements the rulemaking may impose on emerging growth companies. Also, the extent to which market practices regarding the conduct of IPOs will change as a result of the JOBS Act is unclear at this time.
Portfolio and Investment Activity
The 1940 Act requires periodic valuation of each portfolio investment to determine our net asset value. Value, as defined in Section 2(a)(41) of the 1940 Act, is: (i) the market price for those securities for which a market quotation is readily available, and (ii) for all other securities and assets, fair value is as determined in good faith by our Board of Directors. Given the nature of investing in the securities of private companies, our investments generally will not have readily available market quotations. Generally, our equity investments in publicly traded companies in which the lockup restriction has expired are valued at the closing market price on the valuation date. However, equity investments in publicly traded portfolio companies which remain subject to lockup restrictions are valued in good faith by our Board of Directors based on a discount to the most recently available closing market prices. Our equity investments in private companies will not generally have readily available market quotations and, as such, are valued at fair value as determined in good faith by or under the direction of our Board of Directors. As of September 30, 2012 and December 31, 2011, 83.0% and 45.0%, respectively, of our gross assets represented investments in portfolio companies valued at fair value by our Board of Directors.
35
Table of Contents
Portfolio Composition
The following table details the composition of our portfolio company investments by security, at cost and value as of September 30, 2012.
| September 30, 2012 | ||||||||||||||||||||||||
| Portfolio Company |
Investment Date |
Investment Description |
Shares/ Warrants |
Cost (Per Share) |
Cost | Value | Unrealized Appreciation (Depreciation) |
|||||||||||||||||
| Publicly Traded Portfolio Companies: |
||||||||||||||||||||||||
| Solazyme, Inc. (1) |
Jul-10 | Common Stock | 47,927 | $ | 8.86 | $ | 424,403 | $ | 550,681 | $ | 126,278 | |||||||||||||
| Q4 2011 | Common Stock - Open Market Purchases | 50,000 | 11.07 | 553,259 | 574,500 | 21,241 | ||||||||||||||||||
| Q1 2012 | Common Stock - Open Market Purchases | 50,000 | 10.55 | 527,500 | 574,500 | 47,000 | ||||||||||||||||||
|
|
|
|
|
|
|
|||||||||||||||||||
| Total - Publicly Traded Portfolio Companies |
$ | 1,505,162 | $ | 1,699,681 | $ | 194,519 | ||||||||||||||||||
|
|
|
|
|
|
|
|||||||||||||||||||
| Private Portfolio Companies That Have an IPO Registration on File: |
||||||||||||||||||||||||
| Corsair Components, Inc. (2) |
Jul-11 | Common Stock | 640,000 | $ | 5.33 | $ | 3,411,080 | $ | 5,460,000 | $ | 2,048,920 | |||||||||||||
| Jul-11 | Common Stock Warrants | 160,000 | 3.68 | 589,000 | 140,000 | (449,000 | ) | |||||||||||||||||
| LifeLock, Inc. (3) |
Mar-12 | Series E Convertible Preferred Stock | 634,711 | 7.68 | 4,875,000 | 6,800,000 | 1,925,000 | |||||||||||||||||
| Mar-12 | Series E Convertible Preferred Stock Warrants | 158,678 | 0.79 | 125,000 | — | (125,000 | ) | |||||||||||||||||
|
|
|
|
|
|
|
|||||||||||||||||||
| Total - Private Portfolio Companies That Have an IPO Registration on File |
$ | 9,000,080 | $ | 12,400,000 | $ | 3,399,920 | ||||||||||||||||||
| Private Portfolio Companies: |
||||||||||||||||||||||||
| Livescribe, Inc. |
Jul-10 | Series C Convertible Preferred Stock | 1,000,000 | $ | 0.47 | $ | 471,295 | $ | 87,000 | $ | (384,295 | ) | ||||||||||||
| Jul-10 | Series C Convertible Preferred Stock Warrants | 125,000 | 0.23 | 29,205 | 110 | (29,095 | ) | |||||||||||||||||
| Jul-11 | Series C-1 Convertible Preferred Stock | 54,906 | 0.47 | 25,925 | 15,273 | (10,652 | ) | |||||||||||||||||
| Jul-11 | Series C-1 Convertible Preferred Stock Warrants | 6,863 | 0.23 | 1,556 | 443 | (1,113 | ) | |||||||||||||||||
| Nov-11 | Series C-1 Convertible Preferred Stock | 45,754 | 0.47 | 21,603 | 12,727 | (8,876 | ) | |||||||||||||||||
| Nov-11 | Series C-1 Convertible Preferred Stock Warrants | 5,719 | 0.23 | 1,297 | 370 | (927 | ) | |||||||||||||||||
| Jan-12 | Series C-2 Convertible Preferred Stock (4) | 184,353 | 0.10 | 18,435 | 16,000 | (2,435 | ) | |||||||||||||||||
| May-12 | Series C-2 Convertible Preferred Stock (4) | 184,353 | 0.10 | 18,436 | 16,000 | (2,436 | ) | |||||||||||||||||
| Jul-12 | Series C-2 Convertible Preferred Stock (4) | 184,353 | 0.10 | 18,435 | 16,000 | (2,435 | ) | |||||||||||||||||
| MBA Polymers, Inc. |
Oct-10 | Series G Convertible Preferred Stock | 1,100,000 | 1.00 | 1,100,000 | 1,166,000 | 66,000 | |||||||||||||||||
| Feb-11 | Series G Convertible Preferred Stock | 900,000 | 1.00 | 900,000 | 954,000 | 54,000 | ||||||||||||||||||
| BrightSource Energy, Inc. (5) |
Feb-11 | Series E Convertible Preferred Stock | 288,531 | 8.66 | 2,500,006 | 1,820,000 | (680,006 | ) | ||||||||||||||||
| Harvest Power, Inc. |
Mar-11 | Series B Convertible Preferred Stock | 580,496 | 4.31 | 2,499,999 | 3,540,000 | 1,040,001 | |||||||||||||||||
| Suniva, Inc. |
Mar-11 | Series D Convertible Preferred Stock | 197,942 | 12.63 | 2,500,007 | 1,350,000 | (1,150,007 | ) | ||||||||||||||||
| Xtime, Inc. (5) |
Jun-11 | Series F Convertible Preferred Stock | 1,573,234 | 1.91 | 3,000,000 | 4,430,000 | 1,430,000 | |||||||||||||||||
| Aug-11 | Common Stock Warrants | 22,581 | — | — | 12,878 | 12,878 | ||||||||||||||||||
| Metabolon, Inc. |
Aug-11 | Series D Convertible Preferred Stock | 2,229,021 | 1.79 | 4,000,000 | 4,280,000 | 280,000 | |||||||||||||||||
| Kabam, Inc. |
Aug-11 | Series D Convertible Preferred Stock | 1,046,017 | 1.27 | 1,328,860 | 1,070,000 | (258,860 | ) | ||||||||||||||||
| Tremor Video, Inc. |
Sep-11 | Series F Convertible Preferred Stock | 642,994 | 6.22 | 4,000,001 | 3,920,000 | (80,001 | ) | ||||||||||||||||
| TrueCar, Inc. |
Sep-11 | Common Stock | 566,037 | 5.30 | 2,999,996 | 2,690,000 | (309,996 | ) | ||||||||||||||||
| Agilyx Corporation (5) |
Dec-11 | Series C Convertible Preferred Stock | 1,092,956 | 3.66 | 4,000,000 | 3,770,000 | (230,000 | ) | ||||||||||||||||
| Zoosk, Inc. |
Jan-12 | Series E Convertible Preferred Stock | 715,171 | 4.19 | 2,999,999 | 2,999,999 | — | |||||||||||||||||
| SilkRoad, Inc. |
Mar-12 | Series C Convertible Preferred Stock | 12,398,158 | 0.28 | 3,500,000 | 3,500,000 | — | |||||||||||||||||
| May-12 | Series C Convertible Preferred Stock | 5,313,496 | 0.28 | 1,500,000 | 1,500,000 | — | ||||||||||||||||||
| Glam Media, Inc. |
May-12 | Series F Convertible Preferred Stock | 1,196,315 | 4.18 | 4,999,999 | 4,999,999 | — | |||||||||||||||||
| Stoke, Inc. |
Jun-12 | Common Stock | 1,000,000 | 3.50 | 3,500,000 | 3,500,000 | — | |||||||||||||||||
| Jumptap, Inc. |
Jun-12 | Series G Convertible Preferred Stock | 695,023 | 7.19 | 4,999,995 | 4,999,995 | — | |||||||||||||||||
|
|
|
|
|
|
|
|||||||||||||||||||
| Total - Private Portfolio Companies |
$ | 50,935,049 | $ | 50,666,794 | $ | (268,255 | ) | |||||||||||||||||
|
|
|
|
|
|
|
|||||||||||||||||||
| Total - All Portfolio Companies |
$ | 61,440,291 | $ | 64,766,475 | $ | 3,326,184 | ||||||||||||||||||
|
|
|
|
|
|
|
|||||||||||||||||||
| (1) | We sold 65,000 shares of Solazyme common stock with an aggregate cost basis of $575,588 during the nine months ended September 30, 2012. |
| (2) | Corsair Components, Inc. completed a 1-for-5 reverse stock split effective April 24, 2012. As a result of the reverse stock split, the Company now owns 640,000 shares of common stock and warrants to purchase 160,000 shares of common stock at an exercise price of $0.05 per share. Prior to the reverse stock split, the Company owned 3,200,000 shares of common stock and warrants to purchase 800,000 shares of common stock at an exercise price of $0.01 per share. |
| (3) | LifeLock completed the pricing of its IPO on October 2, 2012, and the shares of LifeLock’s common stock began trading on the New York Stock Exchange on October 3, 2012. In connection with LifeLock’s IPO, the shares of LifeLock’s Series E preferred stock we held automatically converted into 944,513 shares of common stock, based on an adjusted conversion price of $5.29 per share. The Series E preferred stock warrants were cancelled in connection with LifeLock’s IPO. The shares of common stock we received upon conversion of the Series E preferred stock are subject to a 180-day lockup provision which will expire in April 2013. |
| (4) | Difference in cost basis and unrealized depreciation due to rounding. |
| (5) | See “Management’s Discussion and Analysis of Financial Condition and Results of Operations — Recent Developments” for a discussion of private equity financings by these portfolio companies subsequent to September 30, 2012. |
See “Management’s Discussion and Analysis of Financial Condition and Results of Operations – Recent Developments” for a discussion of private equity financings by BrightSource, Xtime and Agilyx subsequent to September 30, 2012.
36
Table of Contents
NeoPhotonics Corporation. On January 25, 2010, we completed a $1,000,000 investment in the Series X convertible preferred stock of NeoPhotonics Corporation (“NeoPhotonics”). Our investment in NeoPhotonics was part of a $46 million Series X preferred stock offering. NeoPhotonics, headquartered in San Jose, California, is a developer and manufacturer of photonic integrated circuit based components, modules and subsystems for use in telecommunications networks.
NeoPhotonics completed an IPO on February 2, 2011 at a price of $11.00 per share. NeoPhotonics is listed on the New York Stock Exchange under the ticker symbol NPTN. Immediately prior to the IPO, our NeoPhotonics Series X preferred stock converted into 160,000 shares of NeoPhotonics common stock. The shares of NeoPhotonics common stock we received upon conversion were subject to a 180-day lockup provision which expired in August 2011. During the three months ended September 30, 2012, we sold 160,000 shares of NeoPhotonics common stock for an aggregate sales price (net of commissions and selling expenses) of $878,572, or an average price per share of $5.49. As of September 30, 2012, we no longer hold any shares of NeoPhotonics.
Solazyme, Inc. On July 16, 2010, we completed a $999,991 investment in the Series D convertible preferred stock of Solazyme, Inc. (“Solazyme”). Our investment in Solazyme was part of a $60 million Series D preferred stock offering. Solazyme is a renewable oils and green bioproducts company based in South San Francisco, California. Founded in 2003, Solazyme develops and commercializes algal oil and bioproducts for the fuels and chemicals, nutrition, and skin and personal care markets.
Solazyme completed an IPO on May 27, 2011 at a price of $18.00 per share. Solazyme is listed on the Nasdaq Global Market under the ticker symbol SZYM. Immediately prior to the IPO, our Solazyme Series D preferred stock converted into 112,927 shares of Solazyme common stock. The shares of Solazyme common stock we received upon conversion were subject to a 180-day lockup provision which expired in November 2011.
We purchased 50,000 shares of Solazyme’s common stock in open market transactions for an aggregate purchase price of $553,259, or an average price per share of $11.07, including commissions, during the fourth quarter of 2011. We also purchased 50,000 shares of Solazyme’s common stock in open market transactions for an aggregate purchase price of $527,500, or an average price per share of $10.55, including commissions, during January 2012.
During the nine months ended September 30, 2012, we sold 65,000 shares of Solazyme’s common stock for an aggregate sales price (net of commissions and selling expenses) of $979,219, or an average price per share of $15.06. We did not sell any shares of Solazyme’s common stock during the three months ended September 30, 2012. At September 30, 2012, we continued to own 147,927 shares of Solazyme’s common stock which were valued at $1,699,681, based on Solazyme’s closing market price of $11.49 per share.
BrightSource Energy, Inc. On February 28, 2011, we completed a $2,500,006 investment in the Series E convertible preferred stock of BrightSource Energy, Inc. (“BrightSource”), which BrightSource included as part of its February 28, 2011 closing. Our investment in BrightSource was part of a $200 million Series E preferred stock offering. BrightSource, headquartered in Oakland, California, is a developer of utility scale solar thermal plants which generate solar energy for utility and industrial companies using its proprietary solar thermal tower technology.
In the event of a qualifying IPO, each share of Series E convertible preferred stock is automatically converted into shares of BrightSource’s common stock at the lower of: (i) the purchase price per share of Series E convertible preferred stock, subject to customary adjustments such as stock splits, or (ii) 80% of the offering price in the qualifying IPO. Based on this structural protection, the holders of Series E convertible preferred stock are entitled to a structurally protected appreciation multiple of 1.25x our investment cost at the time of the IPO based on the IPO price. However, the common stock received upon conversion would be subject to a 180-day lockup period following the completion of the IPO. We can give no assurances that BrightSource will complete an IPO, and even if completed, when it may be completed and at what price and under what terms.
On October 24, 2012, BrightSource completed an initial closing of its Series 1 convertible preferred stock financing, which resulted in the automatic conversion of the Series E preferred stock we held into 96,177 shares of BrightSource’s common stock and the elimination of our structural protection associated with the Series E preferred stock. As part of the initial closing of the Series 1 financing round, we made a $397,125 investment in BrightSource’s Series 1 convertible preferred stock, which represented our full pro rata participation amount in the round. Existing preferred stockholders investing their full pro rata participation amount in the Series 1 round also received shares of Series 1A preferred stock and additional shares of common stock. The Series 1A preferred stock which we received for making our pro rata investment in the Series 1 round allowed us to retain the liquidation preference amount that was attributed to our shares of Series E preferred stock, although the Series 1A liquidation preference is subordinate to the liquidation preference of the Series 1 preferred stock.
On April 22, 2011, BrightSource filed a registration statement on Form S-1 for a $250 million IPO of its common stock. After filing a number of amendments to its registration statement, the last of which was filed on March 30, 2012, BrightSource withdrew its registration statement on April 12, 2012.
37
Table of Contents
At September 30, 2012, our Series E convertible preferred stock investment in BrightSource was valued at $1,820,000 based upon a fair value determination made in good faith by our Board of Directors.
Corsair Components, Inc. On July 6, 2011, we completed a $4,000,080 investment in the common stock and warrants of Corsair Components, Inc. (“Corsair”) as part of a private purchase transaction with certain founders and current and former management employees of Corsair (the “Sellers”). Corsair is a private company headquartered in Fremont, California and is a designer and supplier of high-performance components to the personal computer, or PC, gaming hardware market.
Corsair had previously filed a registration statement on Form S-1 on April 23, 2010 for an IPO of its common stock. According to amendment No. 10 to its registration statement, Corsair completed a 1-for-5 reverse stock split of its common stock effective April 24, 2012. On May 24, 2012, Corsair announced that it had postponed its IPO due to weak equity market conditions. Since its announced IPO postponement, Corsair has not updated its registration statement on file with the SEC. For purposes of this quarterly report on Form 10-Q, with respect to our investment in the common stock and warrants of Corsair, the number of shares and warrants and exercise price of the warrants are reflected after giving effect to this reverse stock split unless otherwise indicated.
Shares of our Corsair common stock also have certain demand and piggyback registration rights. In the event of an IPO, any shares of common stock held by us following the IPO (i.e., any shares which we were unable to include for resale in the IPO) would be subject to a 180-day lockup period following the completion of the IPO.
Pursuant to the common stock and warrant purchase agreement governing the private purchase transaction with the Sellers, we purchased 640,000 shares of Corsair common stock at price of $6.25 per share and warrants to purchase 160,000 shares of common stock at a price of $0.0005 per share. The warrants were negotiated as a structural protection and grant us the right to purchase from the Sellers up to 160,000 shares of Corsair common stock at an exercise price of $0.05 per share. The warrants expire on the earlier of: (i) the consummation of an IPO by Corsair at an offering price of at least $12.50 per share of common stock, (ii) upon a sale of Corsair which results in holders of Corsair common stock receiving net sales proceeds of at least $12.50 per share, or (iii) July 6, 2016. These warrants would entitle us to a structurally protected appreciation multiple of 2x our overall Corsair investment cost at the time of the IPO based on the IPO price, provided Corsair prices at its IPO at $10.00 per share or greater.
The warrants are exercisable only upon: (i) Corsair completing an IPO of its common stock at an offering price of less than $12.50 per share, (ii) a sale of Corsair which results in holders of Corsair common stock receiving net sales proceeds of less than $12.50 per share, and (iii) if Corsair does not complete an IPO or sale prior to July 6, 2016, the warrants will be deemed to have been automatically exercised on such date. If the warrants become exercisable as a result of an IPO or sale of Corsair, the number of warrants will be proportionately decreased from 160,000 to the extent that the IPO price or net sale proceeds, as the case may be, exceeds $10.00 per share but is less than $12.50 per share, and the number of warrants will be reduced to zero if the IPO price or net sale proceeds, as the case may be, equals or exceeds $12.50 per share. Accordingly, if the warrants become exercisable as a result of an IPO or sale, we will be entitled to receive the full 160,000 warrants only if the IPO price or net sale proceeds, as the case may be, is $10.00 per share or less.
To estimate the fair value of warrants as of the initial investment date, the common stock and warrants were considered components of a portfolio of securities purchased for $4,000,080. However, since the number of common shares underlying the warrants is variable based on whether an IPO or sale of Corsair is greater than $12.50 per share in which case, the number of warrants is zero, or is $10.00 per share or less in which case the number of warrants is 160,000, the fair value of the warrants was derived using an option pricing model within the framework of a Monte Carlo numerical-based analysis, which takes into consideration the variability in the number of common shares underlying the warrants based on a range of IPO or sale prices for Corsair.
For financial reporting purposes, our investment in Corsair common stock was assigned a cost of $3,411,080 and the warrants were assigned a cost of $589,000 based on the fair value of the warrants as of the initial investment. At September 30, 2012, our common stock investment in Corsair was valued at $5,460,000 based on a fair value determination made in good faith by our Board of Directors. At September 30, 2012, our common stock warrants in Corsair were valued at $140,000 based on a fair value determination made in good faith by our Board of Directors. On a combined basis, our investment in Corsair’s common stock and warrants has an aggregate cost of $4,000,080 and an aggregate fair value, as of September 30, 2012, of $5,600,000.
Livescribe, Inc. On July 1, 2010, we completed a $500,500 investment in the Series C convertible preferred stock and warrants of Livescribe Inc. (“Livescribe”). Our investment in Livescribe was part of a $39 million Series C preferred stock offering. Livescribe, a private company headquartered in Oakland, California, is a developer and marketer of a mobile, paper-based computing platform consisting of smartpens, dot paper, smartpen applications, accessories, desktop software, an online community and development tools. Livescribe’s smartpens are currently available from consumer electronics retailers in the U.S. and in several international markets.
38
Table of Contents
For financial reporting purposes, our investment in Livescribe’s Series C convertible preferred stock was assigned a cost of $471,295 and the warrants were assigned a cost of $29,205 based on the fair value of the warrants as of the initial investment date calculated using the Black-Scholes option pricing model. At September 30, 2012, our Series C convertible preferred stock investment in Livescribe was valued at $87,000 based on a fair value determination made in good faith by our Board of Directors. At September 30, 2012, our Series C convertible preferred stock warrants in Livescribe were valued at $110 based on a fair value determination made in good faith by our Board of Directors.
On July 8, 2011, we completed a $27,481 investment in the Series C-1 convertible preferred stock and warrants of Livescribe as part of the first tranche which raised a total of $4.5 million from certain of Livescribe’s existing preferred stock investors. On November 14, 2011, we completed a $22,900 investment in the Series C-1 convertible preferred stock and warrants of Livescribe as part of the second tranche which raised a total of $3.7 million from certain of Livescribe’s existing preferred stock investors. We made our decision to invest in the Series C-1 convertible preferred stock round principally on our assessment of Livescribe’s business opportunity and prospects at the time of the investment.
For financial reporting purposes, our investment in Livescribe’s Series C-1 convertible preferred stock was assigned a cost of $47,528, and the warrants were assigned a cost of $2,853 based on the fair value of the warrants as of their respective investment dates calculated using the Black-Scholes option pricing model. At September 30, 2012, our Series C-1 convertible preferred stock investment in Livescribe was valued at $28,000 based on a fair value determination made in good faith by our Board of Directors. At September 30, 2012, our Series C-1 convertible preferred stock warrants in Livescribe were valued at $813 based on a fair value determination made in good faith by our Board of Directors.
On January 12, 2012, we made an investment of $18,435 in the Series C-2 convertible preferred stock of Livescribe as part of the first tranche which raised approximately $3.3 million from certain of Livescribe’s existing preferred stock investors. On May 10, 2012, we made an investment of $18,436 in the Series C-2 convertible preferred stock of Livescribe as part of the second tranche which raised approximately $3.3 million from certain of Livescribe’s existing preferred stock investors. On July 24, 2012, we made an investment of $18,435 in the Series C-2 convertible preferred financing of Livescribe as part of the third and final tranche which raised approximately $3.3 million from certain of Livescribe’s existing preferred stock investors. The proceeds of the Series C-2 convertible preferred stock round were intended to provide additional working capital for Livescribe to continue its operations through 2012, although there are no assurances that Livescribe will have sufficient capital to operate through 2012. If we had not funded, or failed to commit to fund, our pro rata share of the Series C-2 round, our Series C convertible preferred stock would have been converted into common stock at an unfavorable rate compared to the existing conversion rate, and we would have lost any liquation preference or other rights and privileges otherwise applicable to our Series C preferred stock. As part of the Series C-2 convertible preferred stock financing, the conversion price for our shares of Series C and Series C-1 convertible preferred stock were reduced based on the anti-dilution rights of the holders of the Series C and Series C-1 convertible preferred stock. The holders of Series C-2 preferred stock have a liquidation preference that is senior to the liquidation preference of the holders of Series C and C-1 preferred stock. The liquidation preference of the Series C and C-1 preferred stock is pari passu. At September 30, 2012, our Series C-2 convertible preferred stock investment in Livescribe was valued at $48,000 based on a fair value determination made in good faith by our Board of Directors.
On a combined basis, our investment in Livescribe’s Series C and C-1 preferred stock and warrants and Series C-2 preferred stock has an aggregate cost of $606,187 and an aggregate fair value, as of September 30, 2012, of $163,923.
MBA Polymers, Inc. On October 15, 2010, we completed a $1,100,000 investment in the Series G convertible preferred stock of MBA Polymers, Inc. (“MBA Polymers”). Our investment in MBA Polymers was part of a $25 million Series G convertible preferred stock offering. On February 22, 2011, we made an additional investment of $900,000 in MBA Polymers’ Series G convertible preferred stock. Our additional investment was part of an aggregate additional Series G preferred stock offering of approximately $15 million. MBA Polymers, a private company headquartered in Richmond, California, is a global manufacturer of recycled plastics sourced from end of life durable goods, such as computers, electronics, appliances and automobiles. At September 30, 2012, our Series G convertible preferred stock investment in MBA Polymers was valued at $2,120,000 based upon a fair value determination made in good faith by our Board of Directors.
Harvest Power, Inc. On March 9, 2011, we completed a $2,499,999 investment in Series B convertible preferred stock of Harvest Power, Inc. (“Harvest Power”). Our investment in Harvest Power was part of a $66 million Series B preferred stock offering. Founded in 2008 and headquartered in Waltham, Massachusetts, Harvest Power acquires, owns and operates organic waste facilities that convert organic waste, such as food scraps and yard debris, into compost, mulch and renewable energy. On March 30, 2012, Harvest Power completed the $110 million initial closing of a Series C convertible preferred stock financing from new and existing investors. Harvest Power completed an additional tranche of the Series C round for $15 million in July 2012. As a result of the Series C round, our investment in Harvest Power’s Series B preferred stock does not represent an investment in Harvest Power’s most senior equity securities. Further, as part of the Series C convertible preferred stock financing, the preferred dividends on our Series B convertible preferred stock were changed from a cumulative to a non-cumulative dividend. At September 30, 2012, our Series B convertible preferred stock investment in Harvest Power was valued at $3,540,000 based upon a fair value determination made in good faith by our Board of Directors.
39
Table of Contents
Suniva, Inc. On March 31, 2011, we completed a $2,500,007 investment in the Series D convertible preferred stock of Suniva, Inc. (“Suniva”). Our investment in Suniva was part of a $106 million Series D preferred stock offering. Founded in 2007 and headquartered in Norcross, Georgia, Suniva is a manufacturer of high-efficiency solar photovoltaic cells and modules focused on delivering high-power solar energy products. At September 30, 2012, our Series D convertible preferred stock investment in Suniva was valued at $1,350,000 based upon a fair value determination made in good faith by our Board of Directors.
Xtime, Inc. On June 14, 2011, we completed a $3,000,000 investment in the Series F convertible preferred stock of Xtime, Inc. (“Xtime”). Our investment in Xtime was part of a $5 million Series F preferred stock offering in which we were the lead investor. Founded in 1999 and headquartered in Redwood Shores, California, Xtime is a software as a service provider of Web scheduling and CRM solutions for automotive service departments. At September 30, 2012, our Series F convertible preferred stock investment in Xtime was valued at $4,430,000 based upon a fair value determination made in good faith by our Board of Directors.
In August 2011, Xtime completed the final closing of the $5 million Series F convertible preferred stock round. As part of the final closing, Xtime’s existing investors who invested more than their pro rata share in the Series F convertible preferred round (based on amounts they had invested in Xtime’s prior preferred stock rounds), received warrants to acquire shares of Xtime’s common stock at an exercise price of $0.01 per share. In order to preserve our post-money, fully diluted ownership interest in Xtime, we also received warrants to acquire 22,581 shares of Xtime common stock on the same terms as the warrants issued to existing investors. In the event Xtime completes a qualifying IPO, the number of warrants will be reduced by 50%. At September 30, 2012, our common stock warrants in Xtime were valued at $12,878 based on a fair value determination made in good faith by our Board of Directors.
On October 5, 2012, Xtime completed a Series 2 convertible preferred stock financing in which we did not participate. Immediately prior to the closing of the Series 2 convertible preferred stock round, all of the existing holders of Xtime’s preferred stock (including the Series F preferred stockholders) converted their existing preferred stock into newly-created Series 1A convertible preferred stock and certain warrants to acquire additional shares of Xtime’s common stock for nominal consideration upon an IPO (the “IPO warrants”). As a holder of Series F preferred stock, we received one share of Series 1A preferred stock for each share of Series F preferred stock that we held, plus IPO warrants which grant us the right to acquire additional shares of common stock, calculated at the time of the IPO based on the actual IPO price, at an exercise price of $0.01 per share. We continue to hold warrants to acquire 22,581 shares of Xtime common stock which we received as part of the Series F round.
Metabolon, Inc. On August 25, 2011, we completed a $4,000,000 investment in the Series D convertible preferred stock of Metabolon, Inc. (“Metabolon”). Our investment in Metabolon was part of a $13 million Series D preferred stock offering, in which we were the lead investor. Founded in 2000 and headquartered in Research Triangle Park, North Carolina, Metabolon is a molecular diagnostics and services company offering metabolic profiling technology that uses advanced bioinformatics and data analytics software to identify, quantify, and analyze biochemical processes occurring within cells. Metabolon is utilizing biomarkers identified by its technology in the development of molecular diagnostic tests intended to detect and measure the aggression and stage of diseases such as diabetes and cancer. At September 30, 2012, our Series D convertible preferred stock investment in Metabolon was valued at $4,280,000 based upon a fair value determination made in good faith by our Board of Directors.
Kabam, Inc. On August 29, 2011, we completed a $1,328,860 investment in the Series D convertible preferred stock of Kabam, Inc. (“Kabam”). Our investment in Kabam was part of an $86 million Series D preferred stock offering. Founded in 2006 and headquartered in Redwood City, California, Kabam is an Internet-based social gaming company that combines the immersion of massively multiplayer games with the connectivity and interaction of social games. At September 30, 2012, our Series D convertible preferred stock investment in Kabam was valued at $1,070,000 based upon a fair value determination made in good faith by our Board of Directors.
Tremor Video, Inc. On September 6, 2011, we completed a $4,000,001 investment in the Series F convertible preferred stock of Tremor Video, Inc. (“Tremor Video”). Our investment in Tremor Video was part of a $37 million Series F preferred stock offering. Founded in 2005 and headquartered in New York, New York, Tremor Video is an online video technology and advertising company that provides video advertising solutions to major brand advertisers and publishers of Web videos. At September 30, 2012, our Series F convertible preferred stock investment in Tremor Video was valued at $3,920,000 based upon a fair value determination made in good faith by our Board of Directors.
TrueCar, Inc. On September 26, 2011, we completed a $2,999,996 investment in the common stock of TrueCar, Inc. (“TrueCar”). Our investment in TrueCar was part of a $50 million common stock offering. Subsequent to the initial closing of the common stock offering, TrueCar raised an additional $14 million from other investors from the sale of its common stock on the same price and terms as our investment. Founded in 2005 and based in Santa Monica, California, TrueCar is an online research and pricing tool for consumers interested in buying a new or used vehicle. At September 30, 2012, our common stock investment in TrueCar was valued at $2,690,000 based upon a fair value determination made in good faith by our Board of Directors.
40
Table of Contents
Agilyx Corporation. On December 16, 2011, we completed a $4,000,000 investment in the Series C convertible preferred stock of Agilyx Corporation (“Agilyx”). Our investment in Agilyx was part of a $25 million Series C convertible preferred stock offering, in which we were the lead investor. Founded in 2004 and based in Beaverton, Oregon, Agilyx is an alternative energy company that economically converts difficult-to-recycle waste plastics into high value synthetic oil. At September 30, 2012, our Series C convertible preferred stock investment in Agilyx was valued at $3,770,000 based upon a fair value determination made in good faith by our Board of Directors. On October 9, 2012, Agilyx raised additional funds as part of a Series D convertible preferred stock financing in which we did not participate. As a result of the Series D round, our investment in Agilyx’ Series C preferred stock does not represent an investment in Agilyx’ most senior equity securities.
Zoosk, Inc. On January 27, 2012, we completed a $2,999,999 investment in the Series E convertible preferred stock of Zoosk, Inc. (“Zoosk”). Our investment in Zoosk was part of a $21 million Series E convertible preferred stock offering. Founded in 2007 and headquartered in San Francisco, California, Zoosk operates online dating communities which allow users to join, browse, and send a limited number of messages for free. Zoosk users can upgrade to a premium subscription for full access or purchase virtual currency to buy select features and virtual gifts. At September 30, 2012, our Series E convertible preferred stock investment in Zoosk was valued at $2,999,999 based upon a fair value determination made in good faith by our Board of Directors.
LifeLock, Inc. On March 14, 2012, we completed a $5,000,000 investment in the Series E convertible preferred stock and warrants of LifeLock, Inc (“LifeLock”). Our investment in LifeLock was part of a $108 million Series E convertible preferred stock offering. Founded in 2005 and based in Tempe, Arizona, LifeLock offers consumer identity theft protection services. As part of the Series E preferred stock offering, LifeLock acquired ID Analytics, Inc., an enterprise identity risk management company.
For financial reporting purposes, our investment in LifeLock’s Series E convertible preferred stock was assigned a cost of $4,875,000, and the warrants were assigned a cost of $125,000 based on the fair value of the warrants as of the initial investment date. At September 30, 2012, our Series E convertible preferred stock investment in LifeLock was valued at $6,800,000 based on a fair value determination made in good faith by our Board of Directors. At September 30, 2012, our Series E convertible preferred stock warrants in LifeLock were valued at $0 based on a fair value determination made in good faith by our Board of Directors.
On October 2, 2012, LifeLock priced its IPO at $9.00 per share. The shares of LifeLock’s common stock began trading on the New York Stock Exchange on October 3, 2012. In connection with LifeLock’s IPO, the Series E preferred stock we held automatically converted into 944,513 shares of LifeLock’s common stock, based on an adjusted conversion price of $5.29 per share. The adjusted conversion price was calculated based on our structurally protected appreciation multiple of 1.7x our investment cost. The Series E preferred stock warrants were cancelled in connection with the IPO. The shares of LifeLock’s common stock we received upon conversion of the Series E preferred stock are subject to a 180-day lockup provision which will expire in April 2013.
SilkRoad, Inc. On March 28, 2012, we made a $3,500,000 investment in the Series C convertible preferred stock of SilkRoad, Inc. f/k/a SilkRoad Technology Holdings, Inc. (“SilkRoad”). On May 9, 2012, we made an additional investment of $1,500,000 in a second tranche of SilkRoad’s Series C convertible preferred stock financing. SilkRoad raised a total of $35 million in the Series C convertible preferred stock financing from new and existing investors in the initial and second tranches. Effective July 17, 2012, SilkRoad changed its corporate name from SilkRoad Technology Holdings, Inc. to SilkRoad, Inc. and raised an additional $2.9 million in a third tranche of the Series C round at the same price and on the same terms as our investment. Founded in 2003 and headquartered in Chicago, Illinois, SilkRoad is a global provider of cloud-based social talent management software, including tools for human resource management systems, recruiting, onboarding, learning, and performance management. SilkRoad’s comprehensive suite of human resource management solutions, the Life Suite, assists companies with managing the entire employee life cycle from pre-hire to retire. At September 30, 2012, our Series C convertible preferred stock investment in SilkRoad was valued at $5,000,000 based upon a fair value determination made in good faith by our Board of Directors.
Glam Media, Inc. On May 25, 2012, we completed a $4,999,999 investment in the Series F convertible preferred stock of Glam Media, Inc. (“Glam Media”). Our investment in Glam Media was part of a $15 million Series F convertible preferred stock offering. Founded in 2004 and headquartered in Brisbane, California, Glam Media is an online media and social networking company focused on matching targeted audiences with targeted content through its properties in the lifestyle, entertainment, home, health and wellness, food and parenting categories. At September 30, 2012, our Series F convertible preferred stock investment in Glam Media was valued at $4,999,999 based upon a fair value determination made in good faith by our Board of Directors.
Stoke, Inc. On June 5, 2012, we completed a $3,500,000 investment in the common stock of Stoke, Inc. (“Stoke”). Our investment in Stoke was structured as a secondary purchase of shares of common stock from certain Stoke employees. Our secondary purchase was facilitated by Stoke. Since Stoke has shares of preferred stock outstanding, our common stock investment in Stoke does not represent an investment in Stoke’s most senior equity securities. Founded in 2004 and headquartered in Santa Clara, California, Stoke is a systems designer and equipment manufacturer for mobile communications infrastructure networks. At September 30, 2012, our common stock investment in Stoke was valued at $3,500,000 based upon a fair value determination made in good faith by our Board of Directors.
41
Table of Contents
Jumptap, Inc. On June 29, 2012, we completed a $4,999,995 investment in the Series G convertible preferred stock of Jumptap, Inc. (“Jumptap”). Our investment in Jumptap was part of a $27.5 million Series G convertible preferred stock offering. Founded in 2005 and headquartered in Cambridge, Massachusetts, Jumptap is a mobile advertising network and data platform that helps global brands to target, place and track advertising on mobile phones and tablets. At September 30, 2012, our Series G convertible preferred stock investment in Jumptap was valued at $4,999,995 based upon a fair value determination made in good faith by our Board of Directors.
The following table summarizes the composition of our portfolio company investments by type of security at cost and value as of September 30, 2012 and December 31, 2011.
| September 30, 2012 | December 31, 2011 | |||||||||||||||||||||||
| Investment Type |
Cost | Fair Value | Percentage of Portfolio |
Cost | Fair Value | Percentage of Portfolio |
||||||||||||||||||
| Private Portfolio Companies: |
||||||||||||||||||||||||
| Convertible Preferred Stock |
$ | 49,277,995 | $ | 51,262,993 | 79.15 | % | $ | 26,347,696 | $ | 25,981,874 | 69.70 | % | ||||||||||||
| Convertible Preferred Stock Warrants |
157,058 | 923 | 0.00 | % | 32,058 | 1,323 | 0.00 | % | ||||||||||||||||
| Common Stock |
9,911,076 | 11,650,000 | 17.99 | % | 6,411,076 | 8,399,996 | 22.54 | % | ||||||||||||||||
| Common Stock Warrants |
589,000 | 152,878 | 0.24 | % | 589,000 | 219,156 | 0.59 | % | ||||||||||||||||
| Publicly Traded Portfolio Companies: |
||||||||||||||||||||||||
| Common Stock |
1,505,162 | 1,699,681 | 2.62 | % | 2,553,250 | 2,671,631 | 7.17 | % | ||||||||||||||||
|
|
|
|
|
|
|
|
|
|
|
|
|
|||||||||||||
| Total |
$ | 61,440,291 | $ | 64,766,475 | 100.00 | % | $ | 35,933,080 | $ | 37,273,980 | 100.00 | % | ||||||||||||
|
|
|
|
|
|
|
|
|
|
|
|
|
|||||||||||||
The following table summarizes the composition of our portfolio company investments by industry classification at cost and value as of September 30, 2012 and December 31, 2011.
| September 30, 2012 | December 31, 2011 | |||||||||||||||||||||||
| Industry Classification |
Cost | Fair Value | Percentage of Portfolio |
Cost | Fair Value | Percentage of Portfolio |
||||||||||||||||||
| Internet & Software |
$ | 34,328,850 | $ | 36,922,871 | 57.01 | % | $ | 11,328,857 | $ | 11,338,013 | 30.42 | % | ||||||||||||
| Cleantech |
15,005,174 | 14,299,681 | 22.08 | % | 15,053,262 | 15,438,843 | 41.42 | % | ||||||||||||||||
| Technology |
12,106,267 | 13,543,923 | 20.91 | % | 9,550,961 | 10,497,124 | 28.16 | % | ||||||||||||||||
|
|
|
|
|
|
|
|
|
|
|
|
|
|||||||||||||
| Total |
$ | 61,440,291 | $ | 64,766,475 | 100.00 | % | $ | 35,933,080 | $ | 37,273,980 | 100.00 | % | ||||||||||||
|
|
|
|
|
|
|
|
|
|
|
|
|
|||||||||||||
The following table summarizes the composition of our portfolio company investments by geographic region of the United States at cost and value as of September 30, 2012 and December 31, 2011. The geographic composition is determined by the location of the corporate headquarters of the portfolio company at the time of our investment.
| September 30, 2012 | December 31, 2011 | |||||||||||||||||||||||
| Geographic Location |
Cost | Fair Value | Percentage of Portfolio |
Cost | Fair Value | Percentage of Portfolio |
||||||||||||||||||
| West |
$ | 38,440,289 | $ | 41,676,480 | 64.35 | % | $ | 22,933,073 | $ | 24,273,973 | 65.12 | % | ||||||||||||
| Northeast |
11,499,995 | 12,459,995 | 19.24 | % | 6,500,000 | 6,500,000 | 17.44 | % | ||||||||||||||||
| Southeast |
6,500,007 | 5,630,000 | 8.69 | % | 6,500,007 | 6,500,007 | 17.44 | % | ||||||||||||||||
| Midwest |
5,000,000 | 5,000,000 | 7.72 | % | — | — | 0.00 | % | ||||||||||||||||
|
|
|
|
|
|
|
|
|
|
|
|
|
|||||||||||||
| Total |
$ | 61,440,291 | $ | 64,766,475 | 100.00 | % | $ | 35,933,080 | $ | 37,273,980 | 100.00 | % | ||||||||||||
|
|
|
|
|
|
|
|
|
|
|
|
|
|||||||||||||
Portfolio Activity
The total value of our investments in 19 portfolio companies was $64.8 million at September 30, 2012, as compared to $37.3 million in 14 portfolio companies at December 31, 2011. During the three months ended September 30, 2012, as part of the third and final tranche of the Series C-2 convertible preferred stock of Livescribe, we made an additional investment of $18,435 in the
42
Table of Contents
Series C-2 convertible preferred stock financing. We did not make any investments in new portfolio companies during the three months ended September 30, 2012. During the nine months ended September 30, 2012, we made investments totaling $26.5 million in six new private portfolio companies, approximately $55,000 in an existing private portfolio company, and approximately $0.5 million in Solazyme, an existing publicly traded portfolio company.
During the three months ended Sptember 30, 2012, we sold 160,000 shares of NeoPhotonics’ common stock having an aggregate cost of $1,000,000, or $6.25 per share, for an aggregate sales price (net of commissions and selling expenses) of $878,572, or an average price per share of $5.49. The shares of NeoPhotonics’ common stock that we sold were acquired upon conversion of the NeoPhotonics Series X preferred stock we held at the time of its IPO. Accordingly, we realized a capital loss of $121,428 on our sale of these shares during the three months ended September 30, 2012, which represents a 0.88x return on our investment (or a 12% loss) in these shares over our weighted-average holding period of 31 months. As of September 30, 2012, we no longer own any shares of NeoPhotonics.
For a discussion of the changes in the unrealized appreciation (depreciation) on our portfolio company investments during the three months ended September 30, 2012, see “Results of Operations” below.
Portfolio Analysis
As of September 30, 2012, we held investments in 19 portfolio companies, which consisted of the most senior preferred equity in 13 companies and common stock in three companies whose capitalizations consisted of only common stock. As of September 30, 2012: (i) our preferred stock investment in Harvest Power no longer consists of the most senior preferred stock because Harvest Power issued more senior preferred stock in a Series C preferred stock round in March 2012 in which we did not participate, (ii) our common stock investment in Stoke does not consist of the most senior equity securities since Stoke had preferred stock outstanding at the time of our initial investment, and (iii) our initial investment in Livescribe no longer consists of the most senior preferred stock because Livescribe has issued more senior preferred stock since our initial investment; however, we have participated in each of Livescribe’s subsequent financing rounds. Two of our private portfolio companies, BrightSource and Agilyx, in which we owned the most senior equity securities of each company at the time of our investment, raised additional funds in private equity financings subsequent to September 30, 2012. As a result, our initial investments in these two portfolio companies no longer represent their most senior equity securities, although we did participate in BrightSource’s subsequent preferred stock financing round. See “Management’s Discussion and Analysis of Financial Condition and Results of Operations – Recent Developments”
Our preferred and common stock, warrants, and equity interests are generally non-income producing. Except for the convertible preferred stock investments in SilkRoad and Jumptap, all convertible preferred stock investments carry a non-cumulative, preferred dividend payable when and if declared by the portfolio company’s board of directors. In the case of SilkRoad, the shares of convertible preferred stock carry a cumulative preferred dividend, which is payable only when and if declared by the portfolio company’s board of directors or upon a qualifying liquidation event. In the case of Jumptap, the shares of convertible preferred stock carry a cumulative preferred dividend, which is payable only when and if declared by the portfolio company’s board of directors. During the nine months ended September 30, 2012, the preferred dividends on our Series B convertible preferred stock in Harvest Power were changed from a cumulative to a non-cumulative dividend in connection with Harvest Power’s Series C round. Since no dividends have been declared or paid, or are expected to be declared or paid, with respect to these convertible preferred stock investments, these investments are considered to be non-income producing.
Our primary source of investment return will be generated from net capital gains, if any, realized on the disposition of our portfolio company investments, which typically will occur after a portfolio company completes an IPO. Accordingly, we assess our portfolio company investments against a number of our targeted performance metrics including, among others:
| • | whether the portfolio company has filed a registration within 12 months of our initial investment; |
| • | whether the portfolio company has completed an IPO within 18 months of our initial investment; |
| • | whether we were able to liquidate our portfolio company interests within 36 months of our initial investment; |
| • | whether we were able to achieve our targeted 2x unrealized appreciation on our portfolio company investment at the time of its IPO based on the IPO price; and |
| • | whether we were able to dispose of our portfolio company interests to achieve our targeted 2x realized return upon sale of our investment. |
43
Table of Contents
In the event we acquire investments where we believe there may be a shorter expected investment horizon, such as when we believe the portfolio company may file for an IPO sooner than 12 months or has a registration statement filed at the time of our investment, we may correspondingly reduce our targeted return and adjust our targeted performance metrics accordingly.
In making our performance assessment, we have grouped our portfolio company investments into three categories. Our first category is our portfolio companies that have completed an IPO, or what we refer to as our publicly traded portfolio companies. Our publicly traded portfolio companies include those companies whose securities we hold may still be subject to a post-IPO lockup restriction. Our second category is our portfolio companies that have filed a registration statement but have not completed an IPO, or what we refer to as private portfolio companies that have filed for an IPO. The third category is our portfolio companies that have neither filed a registration statement nor completed an IPO, or what we refer as our private portfolio companies.
As of September 30, 2012, our portfolio consisted entirely of equity securities. Our one publicly traded portfolio company, Solazyme, represented by value approximately 2.6% of our total portfolio company securities at September 30, 2012. Two of our private portfolio companies, Corsair and LifeLock, had registration statements publicly on file with the SEC and represented by value approximately 19.1% of our total portfolio securities at September 30, 2012. LifeLock completed the pricing of its IPO on October 2, 2012 and began trading on the New York Stock Exchange on October 3, 2012. One of our private portfolio companies, Corsair, was in registration with the SEC to complete an IPO, but announced on May 24, 2012 that it had postponed its IPO due to weak equity market conditions. Since its announced IPO postponement, Corsair has not updated its registration statement on file with the SEC. Corsair represented by value approximately 8.6% of our total portfolio company securities at September 30, 2012. BrightSource was previously in registration with the SEC, but withdrew its registration statement on April 12, 2012. BrightSource represented by value approximately 2.8% of our total portfolio company securities at September 30, 2012.
The remaining 78.2% of our portfolio company securities by value at September 30, 2012 (including BrightSource) consisted of restricted securities in 16 private companies which have not completed an IPO or have not publicly filed a registration statement for an IPO with the SEC. Over time, as we continue to make additional investments and as our initial investments make progress towards or complete an IPO, we expect our overall portfolio to be more evenly spread across different stages and our targeted timelines for each stage, such as readying for an IPO (first 12 months after our investment), completion of an IPO (at approximately after 18 months after our investment), and disposition of our investment following the post-IPO lockup period (typically, 36 months after our investment).
Publicly Traded Portfolio Companies. NeoPhotonics and Solazyme have completed IPOs and the lockup restrictions on our NeoPhotonics and Solazyme securities expired in August 2011 and November 2011, respectively.
NeoPhotonics priced its IPO and listed on the New York Stock Exchange on February 2, 2011, after an initial registration statement filing on April 15, 2010. Based on our investment date of January 25, 2010, NeoPhotonics filed its registration statement and completed its IPO within three months and 12 months, respectively, of our investment, compared to our targeted time frames of 12 months and 18 months. During the three months ended September 30, 2012, we sold 160,000 shares of NeoPhotonics common stock having an aggregate cost of $1,000,000, or $6.25 per share, for an aggregate sales price (net of commissions and selling expenses) of $878,572, or an average price per share of $5.49. The shares of NeoPhotonics common stock that we sold were acquired upon conversion of NeoPhotonics Series X preferred stock at the time of its IPO. Accordingly, we realized a capital loss of $121,428 on our sale of these shares, which represents a 0.88x return on our investment (or a 12% loss) in these shares over our weighted-average holding period of 31 months. As of September 30, 2012, we no longer hold any shares of NeoPhotonics.
Solazyme priced its IPO and listed on Nasdaq on May 27, 2011, after an initial registration statement filing on March 11, 2011. Based on our investment date of July 16, 2010, Solazyme filed its registration statement and completed its IPO within eight months and 11 months, respectively, of our investment, compared to our targeted time frames of 12 months and 18 months. The shares of Solazyme’s common stock that we received upon conversion of the Series D preferred stock at their IPO have a cost basis of $8.86 per share. Based on Solazyme’s IPO price of $18.00 per share, which represented a 2.0x unrealized appreciation multiple based on the IPO price, we were at our targeted 2x unrealized appreciation at the time of the IPO. Since Solazyme’s IPO, the price of Solazyme shares has been volatile.
During the fourth quarter of 2011 and the first quarter of 2012, we purchased an aggregate of 100,000 shares of Solazyme’s common stock in open market transactions for an aggregate purchase price of $1,080,759, or an average price per share of $10.81, including commissions. Our last purchase of Solazyme common stock in open market transactions occurred in January 2012. Although we typically do not intend to purchase stock in a portfolio company’s IPO or in open market transactions thereafter, we made additional investments in Solazyme through open market purchases to bring our overall investment in Solazyme closer to our targeted percentage of our gross assets per portfolio company investment. Our initial $1,000,000 private investment in Solazyme was limited due to the level of our gross assets at the time of the initial investment.
44
Table of Contents
During the nine months ended September 30, 2012, we sold 65,000 shares of Solazyme’s common stock at an average price of $15.06 per share (net of commissions and selling expenses) resulting in a realized gain of $403,631, which represents an average 1.7x return on our investment over the 20 to 24 months that we held these shares. However, the price of Solazyme’s shares has since decreased, with a closing price of $11.49 as of September 30, 2012, which, compared to the cost basis of $8.86 per share on our original investment and an average cost basis of $10.81 per share on our open market purchases, is below the targeted return we seek to achieve upon a sale of our investment. We did not sell any shares of Solazyme’s common stock during the three months ended September 30, 2012.
As of September 30, 2012, our original investment in Solazyme has been in our portfolio for 27 months, compared to our targeted 36-month overall holding period. Although we believe that Solazyme has been meeting most of its stated milestones, we believe the market price of this company reflects the inherent risks and uncertainties of the cleantech sector, and the inherent difficulties in evaluating early stage businesses where the achievement of significant revenue and earnings are usually many years in the future. Additionally, the cleantech industry as a whole has been adversely impacted by the recent bankruptcy filing by solar panel manufacturer Solyndra which had previously received a substantial U.S. government loan guarantee, the global uncertainty about continued government subsidies to support these emerging technologies, the continued challenges to find cost effective cleantech solutions, and what is perceived as a currently unfavorable market for cleantech IPOs.
There can be no assurances that we will be able to dispose of our interests in these publicly traded portfolio companies within our targeted holding period or at prices that would allow us to achieve our targeted return, or any return at all.
Private Portfolio Companies That Have an IPO Registration on File. Corsair is currently in registration with the SEC to complete its IPO. Corsair filed its initial registration statement with the SEC on April 23, 2010, prior to our investment on July 6, 2011. On May 24, 2012, Corsair announced that it had postponed its IPO due to weak equity market conditions. Since its announced IPO postponement, Corsair has not updated its registration statement on file with the SEC. We can give no assurances that Corsair will update its registration statement or complete an IPO, and even if an IPO is completed, when it may be completed, at what price and under what terms, and whether any of our shares will be included for resale in the IPO. As of September 30, 2012, Corsair has been in our portfolio for 15 months, compared to our targeted 18 months to complete an IPO and our targeted 36-month holding period.
LifeLock publicly filed a registration statement in connection with its IPO with the SEC on August 28, 2012, approximately six months following our investment in the company. On October 2, 2012, LifeLock priced its IPO at $9.00 per share. LifeLock’s shares began trading on the New York Stock Exchange under the ticker symbol “LOCK” on October 3, 2012, approximately seven months following our investment compared to our targeted time frame of 18 months. In connection with LifeLock’s IPO, the shares of LifeLock’s Series E preferred stock we held automatically converted into 944,513 shares of LifeLock’s common stock, based on an adjusted conversion price of $5.29 per share. The adjusted conversion price was calculated based on our structurally protected appreciation multiple of 1.7x our investment cost. The shares of LifeLock’s common stock we received upon conversion of the Series E preferred stock are subject to a 180-day lockup provision which will expire in April 2013.
There can be no assurances that any of our private portfolio companies that have publicly filed a registration statement will be able to complete their IPOs within our targeted time frame, or at all. Even if these portfolio companies are able to complete an IPO, we may not be able to dispose of our interests in these publicly traded portfolio companies within our targeted holding period or at prices that would allow us to achieve our targeted return, or any return at all.
Private Portfolio Companies. As of September 30, 2012, we had investments in 16 private portfolio companies that do not have a registration statement publicly on file with the SEC or have not publicly announced the submission of a registration for confidential review by the SEC. One of the provisions of the JOBS Act allows emerging growth companies to submit a draft IPO registration statement for confidential review by the SEC prior to making a public filing. Companies that submit a registration statement for confidential review by the SEC may elect to publicly announce that they have made such confidential submission without disclosing the content of such submission. Our private portfolio company investments consist of convertible preferred stock, common stock, and warrants to purchase preferred stock and common stock. As of September 30, 2012, these private portfolio company investments had an aggregate cost of $50.9 million and an aggregate value of $50.7 million, resulting in net unrealized appreciation of $268,255.
As of September 30, 2012, our initial investments in five private portfolio companies – Livescribe, MBA Polymers, BrightSource, Harvest Power and Suniva – have been in our portfolio for periods between 18 and 27 months, beyond our targeted 18-month time frame to complete an IPO following our initial investment. None of these companies has a registration statement on file with the SEC for an IPO, although BrightSource previously filed a registration statement which was withdrawn on April 12, 2012.
We also have investments in five private portfolio companies – Xtime, Metabolon, Kabam, Tremor Video and TrueCar – which, as of September 30, 2012, have been in our portfolio for periods between 12 and 16 months, beyond our targeted 12-month period to file a registration statement. We do not expect these private portfolio companies to complete an IPO within our targeted 18-month time frame following our initial investment.
45
Table of Contents
Holding Periods. As of September 30, 2012, the average holding period of our 19 portfolio companies was 13.5 months based on our initial investment, and the weighted-average holding period (based on the fair value of each portfolio company as of September 30, 2012) was 10.6 months. The table below analyzes the average and weighted-average holding periods of our 19 portfolio companies by the following categories: (i) those portfolio companies that have completed an IPO or that have a registration statement on file with the SEC, and (ii) those portfolio companies that have not completed an IPO or do not have a registration statement on file with the SEC. Within this latter category, we have further segmented these portfolio companies into the following groups: (i) those portfolio companies in which we have held our initial investment less than 12 months, (ii) those portfolio companies in which we have held our initial investment for between 12 months and 18 months and are beyond our targeted 12-month time frame for filing a registration statement for an IPO, and (iii) those portfolio companies in which we have held our initial investment for more than 18 months and are beyond our targeted 18-month time frame for completing an IPO.
Portfolio Company Holding Period Analysis1
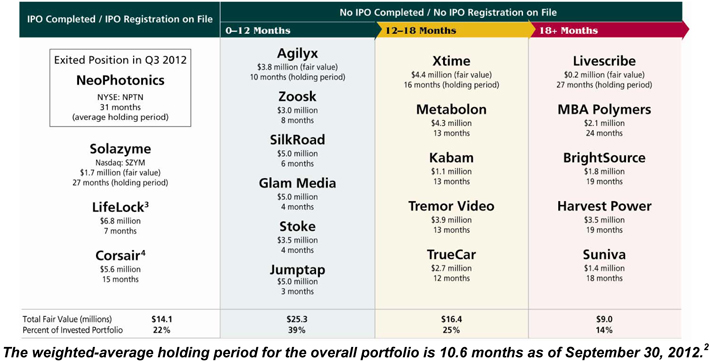
| 1 | As of September 30, 2012. Each of our portfolio companies are subject to many risks, including downturns. There is also no assurance that any of our portfolio companies will complete an IPO or other liquidity event. |
| 2 | Weighted-average holding period is calculated using the holding period of each of our portfolio companies (based on our initial investment date) weighted using the fair value of each portfolio company as of September 30, 2012. Weighted-average holding period calculation excludes NeoPhotonics which was disposed of during Q3 2012. |
| 3 | LifeLock completed an IPO on October 2, 2012, and its shares of common stock began trading on October 3, 2012, on the New York Stock Exchange under the ticker symbol “LOCK.” |
| 4 | On May 24, 2012, Corsair announced that it had postponed its IPO due to weak equity market conditions. Since its announced IPO postponement, Corsair has not updated its registration statement on file with the SEC. |
The weighted-average holding period for our first investment, NeoPhotonics, which we disposed of in its entirety during the three months ended September 30, 2012, was 31 months and was within our targeted 36-month holding period. Excluding NeoPhotonics, three of our portfolio companies – Solazyme, LifeLock and Corsair – have completed an IPO or have a registration statement publicly on file with the SEC and have an aggregate fair value of $14.1 million as of September 30, 2012, or approximately 22% of our invested portfolio as measured by fair value. Five of our portfolio companies – Livescribe, MBA Polymers, BrightSource, Harvest Power and Suniva – have not completed an IPO within our targeted 18-month time frame following our initial investment and have an aggregate fair value of $9.0 million as of September 30, 2012, or approximately 14% of our invested portfolio as measured by fair value.
While the foregoing portfolio company holding period analysis is based on certain discrete events – a registration statement publicly on file with the SEC, the completion of an IPO, and the disposition of our investment – which we refer to as “lagging” indicators, we believe that a number of our portfolio companies continue to prepare for and make progress towards an IPO. Our assessment of a portfolio company’s IPO preparation and progress is based on information our investment adviser may obtain in its quarterly update calls with our portfolio company management teams with respect to certain pre-IPO indicators, or what we refer to as “leading” indicators. These leading indicators include: (i) adding new members of senior management (e.g., a CFO with public company experience), (ii) meeting with investment banking firms and conducting a “bakeoff” to select underwriters, (iii) testing the waters by meeting with prospective institutional IPO investors, (iv) determining (and then achieving) the key operating milestones that need to be met to increase the probability of a successful IPO, (v) holding an IPO “organizational meeting” to begin preparation for the IPO process, and (vi) drafting the IPO registration statement. Due to the confidential nature of our investment adviser’s discussions with management, we are precluded from discussing the presence or absence of these “leading” indicators with respect to specific portfolio companies.
Based on our assessment of these “leading” indicators, we believe that several of our portfolio companies are making progress toward an IPO that is consistent with our targeted time frames and holding periods. However, there can be no assurances that any of our private portfolio companies will publicly file, or confidentially submit, a registration statement within our targeted 12-month time frame or be able to complete an IPO within our targeted 18-month time frame, or at all. Even if these portfolio companies are able to complete an IPO, we may not be able to dispose of our interests in these publicly traded portfolio companies within our targeted 36-month holding period or at prices that would allow us to our targeted 2x return on our investment, or any return at all. In cases where we have reduced our targeted return due to a shorter expected investment horizon, there can be no assurance that our portfolio company will be able to complete an IPO, or that we will be able to dispose of our investment, in this shorter time frame at our targeted return. There can be no assurance that we will be able to achieve our targeted return on our portfolio company investments if and when they go public.
In the event our portfolio companies fail to complete an IPO within our targeted 18-month time frame, we may need to make additional investments in these portfolio companies, along with other existing investors, to fund their operations. In some cases, if we elect not to fund our pro rata share of these additional investments, there may be adverse consequences including the forced conversion of our preferred stock into common stock at an unfavorable conversion rate and the corresponding loss of any liquidation preferences or other rights and privileges that may be applicable to the securities we currently hold.
Due to the perpetual nature of our corporate structure, we believe that we can be a patient investor in our portfolio companies, allowing them flexibility to access IPO windows when the timing and pricing may be best for the company and us. In the event of a prolonged closure of the IPO markets, we can be flexible as our portfolio companies wait for a market recovery or seek alternative exit strategies. However, there may be situations where our portfolio companies will not perform as planned and thus be unable to go public under any circumstances. There may also be situations where a specific industry or sector will no longer be attractive to IPO investors.
46
Table of Contents
In such cases, we will consider whether the portfolio company has already passed, or is likely to exceed, our targeted 18-month IPO completion period. If we believe the portfolio company will not complete an IPO within this period, our investment adviser has the discretion to consider a number of alternative strategies including:
| • | Pursuing a negotiated sale of our interests to an existing investor; |
| • | Attempting to influence the portfolio company’s management to pursue a strategic merger or sale; |
| • | Identifying potential third party investors interested in purchasing all or a portion of our interest; and |
| • | Accessing the trading platforms of private secondary marketplaces that have emerged as an alternative to traditional public equity exchanges to provide liquidity principally to the stockholders of venture capital-backed, private companies, to the extent that such a market may exist for the subject portfolio company. |
Our ability to liquidate our investments under any of these strategies will be highly uncertain although we expect to have a greater chance of success if our investments contain structural protections. Nonetheless, even if we are successful in liquidating an investment under these circumstances, we are not likely to achieve our targeted return and we may suffer a loss on our investment.
Structural Protections. Of our investments in 18 private portfolio companies as of September 30, 2012, we have been provided some structural protection with respect to investments in ten of these portfolio companies. However, subsequent to September 30, 2012, our structural protection in BrightSource, which had a structurally protected appreciation multiple at IPO of 1.25x our investment cost, was eliminated when the Series E preferred stock we held was automatically converted into common stock as part of BrightSource’s Series 1 convertible preferred stock financing on October 24, 2012. Accordingly, our structural protection analysis as of September 30, 2012 has been presented, excluding our previous BrightSource structurally protected appreciation since we no longer have structural protection on that investment.
Our structural protections typically include conversion rights upon an IPO which would result in our receiving shares of common stock at a discount to the IPO price upon conversion at the time of the IPO, or warrants that would result in our receiving additional shares for a nominal exercise price at the time of an IPO. Our structural protection in nine private portfolio companies (excluding BrightSource) as of September 30, 2012 can be summarized as follows:
| • | Four of these portfolio companies (with an aggregate cost of $19.0 million and aggregate fair value of $20.7 million, respectively, as of September 30, 2012) have structural protections that would, in the event of an IPO, entitle us to receive shares of common stock with a weighted-average aggregate value, at the time of issuance, of 1.56x our investment cost. We refer to this multiple as our structurally protected appreciation multiple. |
| • | Five of these portfolio companies (with an aggregate cost of $18.0 million and an aggregate fair value of $21.4 million as of September 30, 2012) have a structurally protected appreciation multiple of 2.0x our investment cost upon an IPO. |
As of September 30, 2012, our structurally protected appreciation on these investments would, if each of these nine portfolio companies completed an IPO, result in an increase in our unrealized appreciation of $23.6 million at the time of the IPO.
| Portfolio Companies with Structurally Protected Appreciation at IPO: |
Number of Portfolio Companies |
Weighted-Average Structurally Protected Appreciation Multiple at IPO |
Cost of Investment as of September 30, 2012 (in millions) |
Fair Value of Investment as of September 30, 2012 (in millions) |
Potential Increase in Unrealized Appreciation Based on Structural Protections at IPO as of September 30, 2012 (in millions) |
|||||||||||||||
| Equal to or greater than 1.5x but less than 2.0x (1) |
4 | 1.56x | $ | 19.0 | $ | 20.7 | $ | 9.0 | ||||||||||||
| Equal to 2.0x |
5 | 2.00x | $ | 18.0 | $ | 21.4 | $ | 14.6 | ||||||||||||
| Total |
9 | 1.78x | $ | 37.0 | $ | 42.1 | $ | 23.6 | ||||||||||||
| (1) | Includes LifeLock which had a structurally protected appreciation multiple of 1.7x our investment cost and completed its IPO on October 2, 2012. Our investments in three remaining portfolio companies in this category provide for an increase in the structurally protected appreciation multiple up to 2x our investment cost if the portfolio company fails to complete an IPO within certain time frames. The above table reflects the structurally protected appreciation multiple in effect as of September 30, 2012 for these three portfolio companies. |
On October 2, 2012, LifeLock priced its IPO at $9.00 per share. The shares of LifeLock’s common stock began trading on the New York Stock Exchange on October 3, 2012. In connection with LifeLock’s IPO, the 634,711 shares of Series E preferred stock which we purchased in March 2012 for $5 million, or $7.88 per share, were automatically converted into 944,513 shares of LifeLock’s common stock, based on an adjusted conversion price of $5.29 per share. The adjusted conversion price of $5.29 per share represents our cost basis in the shares of LifeLock’s common stock we received and was calculated based on our structurally protected appreciation multiple of 1.7x our investment cost of $5.0 million – meaning we received common shares at the time of LifeLock’s IPO that had a market value of $8.5 million based on the $9.00 IPO price. Prior to giving effect to LifeLock’s IPO, as of September 30, 2012, the fair value of our Series E preferred stock investment in LifeLock was $6.8 million and the potential increase in unrealized appreciation based on the structural protections at IPO was $1.7 million, out of the overall potential increase in unrealized appreciation based on the structural protections at IPO of $23.6 million reflected in the above table.
47
Table of Contents
The structurally protected appreciation is calculated assuming each portfolio company completes an IPO. Further, the structurally protected appreciation is not impacted by the IPO price, since the structural protections are designed to derive such appreciation at any IPO price at the time of the IPO. The only exceptions are: (i) the structural protection provided in the Corsair common stock investment where the structurally protected appreciation of 2.0x of our investment cost begins to decline as the Corsair IPO price falls below $10.00 per share, and (ii) the structural protection provided in one of our other private portfolio companies where the structurally protected appreciation of 2.0x of our investment cost begins to decline as the IPO price falls below our cost basis per share. In each of the nine portfolio company investments that have structural protections, it is possible for us to achieve an unrealized appreciation at IPO in excess of the structurally protected appreciation amount where the portfolio company’s IPO price exceeds a threshold amount.
Our ability to realize the structurally protected appreciation at the time of the IPO will depend on a number of factors including each portfolio company’s completion of an IPO, any adjustment to the special IPO conversion price that may be negotiated prior to or during the IPO process, the possible subsequent issuance of more senior securities that may impact the relative value of the structural protection, and fluctuations in the market price of each portfolio company’s common shares until such time as the common shares received upon conversion can be disposed of following the expiration of a customary 180-day post-IPO lockup period. Accordingly, the structurally protected appreciation would not be available unless each portfolio company completes an IPO. Further, even if an IPO is completed, the structurally protected appreciation would not be realized unless the market price of each portfolio company’s common shares equals or exceeds the IPO price at the time such shares are disposed of following the post-IPO lockup period.
Of the nine portfolio companies that have structurally protected appreciation at the time of an IPO, five of these portfolio companies (including LifeLock), as of September 30, 2012, provide us with a senior right and preference upon the portfolio company’s sale or liquidation to receive a distribution of the portfolio company’s assets (after payment of liabilities) equal to 1.7x to 2.0x our investment cost. However, subsequent to September 30, 2012, our preferred stock liquidation preference in one of these portfolio companies was changed to provide us with a senior liquidation preference equal to 1.0x our investment cost, with a right to participate in any remaining distributions (after the payment of all preferred stock liquidation preferences) with the holders of common stock on an as converted basis. Our ability to realize the structurally protected appreciation at the time of a sale or liquidation of the portfolio company will depend on a number of factors including each portfolio company’s completion of a sale or liquidation, the realization of sales or liquidation proceeds (after payment of liabilities) sufficient to pay our senior preference amount, any adjustment to our preference amount that may be negotiated prior to any sale or liquidation, and the possible subsequent issuance of more senior securities that may make our preference rights subordinate to the preference rights of senior security holders. Upon a sale or liquidation of these portfolio companies, we also retain the right to convert our shares of preferred stock to common if, upon conversion, the amount we would receive on our common stock is greater than our preference amount. In addition to these five portfolio companies, we also have structurally protected appreciation with respect to a sale of Corsair which would entitle us to receive 2.0x our investment cost in such sale; provided, however, that our 2.0x structural protection in a sale begins to decline if the Corsair sale price falls below $10.00 per share.
Results of Operations
The principal measure of our financial performance is the net increase (decrease) in our net assets resulting from operations, which includes net investment income (loss), net realized gain (loss) on investments and net unrealized appreciation (depreciation) on investments. Net investment income (loss) is the difference between our income from interest, dividends, fees and other investment income and our operating expenses. Net realized gain (loss), if any, is the difference between the net proceeds of sales of portfolio company securities and their stated cost. Net unrealized appreciation (depreciation) from investments is the net change in the fair value of our investment portfolio.
Set forth below are the results of operations for the three and nine months ended September 30, 2012 and 2011.
Comparison of Three Months ended September 30, 2012 and 2011
Investment Income. For the three months ended September 30, 2012 and 2011, we earned interest and dividend income from money market investments of $537 and $6,382, respectively, a decrease of $5,845 compared to the prior period. No other investment income was recorded during the three months ended September 30, 2012 and 2011.
Our preferred and common stock, warrants, and equity interests are generally non-income producing. Although our preferred stock investments typically carry a dividend rate, in some cases with a payment preference over other classes of equity, we do not expect dividends (whether cumulative or non-cumulative) to be declared and paid on our preferred stock investments, or on our common stock investments, since our portfolio companies typically prefer to retain profits, if any, in their businesses. Since no dividends have been declared or paid, or are expected to be declared or paid, with respect to these convertible preferred stock investments, these investments are considered to be non-income producing. Accordingly, we expect that our investments in portfolio companies will consist of securities that typically do not provide current income through interest or dividend income.
48
Table of Contents
We invest our cash on hand in money market funds that invest primarily in U.S. Treasury securities, U.S. Government agency securities, and repurchase agreements fully-collateralized by such securities. However, the investment income we generate from these money market funds is not expected to be significant.
Our primary source of investment return will be generated from net capital gains, if any, realized on the disposition of our portfolio company investments, which typically will occur after the portfolio company completes an IPO and after the expiration of a customary 180-day post-IPO lockup agreement. Dispositions of our portfolio company investments are discretionary and based on our business judgment. Since we typically do not expect to generate current income from our portfolio company investments, our operating expenses will be financed from our capital base during periods of time between realizations of capital gains on our investments, if any.
Operating Expenses. Our primary operating expenses include the payment of: (i) investment advisory fees to our investment adviser, Keating Investments, (ii) our allocable portion of overhead and other expenses incurred by Keating Investments, as our administrator, in performing its administrative obligations under the Investment Advisory and Administrative Services Agreement, and (iii) other operating expenses as detailed below. Our investment advisory fee compensates our investment adviser for its work in identifying, evaluating, negotiating, closing, monitoring and servicing our investments. See “Investment Advisory and Administrative Services Agreement” below. We bear all other expenses of our operations and transactions, including, without limitation:
| • | costs of calculating our net asset value, including the cost of any third-party valuation services; |
| • | costs of effecting sales and repurchases of shares of our common stock and other securities; |
| • | fees payable to third parties relating to, or associated with, making investments, including fees and expenses associated with performing due diligence reviews of prospective investments; |
| • | costs related to organization and offerings; |
| • | transfer agent and custodial fees; |
| • | fees and expenses associated with marketing efforts; |
| • | federal and state registration fees; |
| • | any stock exchange listing fees; |
| • | applicable federal, state and local taxes; |
| • | independent directors’ fees and expenses; |
| • | brokerage commissions; |
| • | costs of proxy statements, stockholders’ reports and notices; |
| • | fidelity bond, directors and officers/errors and omissions liability insurance and other insurance premiums; |
| • | direct costs such as printing, mailing, and long distance telephone; |
| • | fees and expenses associated with independent audits and outside legal costs; |
| • | costs associated with our reporting and compliance obligations under the 1940 Act, Sarbanes-Oxley Act, and applicable federal and state securities laws; and |
| • | all other expenses incurred by either Keating Investments or us in connection with administering our business, including payments under the Investment Advisory and Administrative Services Agreement that will be based upon our allocable portion of overhead and other expenses incurred by Keating Investments in performing its obligations under the Investment Advisory and Administrative Services Agreement, including our allocable portion of the compensation of our Chief Financial Officer and Chief Compliance Officer, and their respective staff. |
Operating expenses for the three months ended September 30, 2012 and 2011 were $1,083,052 and $589,596, respectively, an increase of $493,456 compared to the prior period. A summary of the items comprising the increase in our operating expenses for the three months ended September 30, 2012 compared to the three months ended September 30, 2011 is set forth in the table below.
49
Table of Contents
| Three Months Ended | ||||||||||||
| September 30, 2012 |
September 30, 2011 |
Increase / (Decrease) |
||||||||||
| Operating Expenses |
||||||||||||
| Base management fees |
$ | 383,061 | $ | 389,007 | $ | (5,946 | ) | |||||
| Incentive fees |
242,117 | (155,391 | ) | 397,508 | ||||||||
| Administrative expenses allocated from investment adviser |
157,372 | 96,757 | 60,615 | |||||||||
| Legal and professional fees |
119,831 | 89,337 | 30,494 | |||||||||
| Directors’ fees |
40,000 | 31,289 | 8,711 | |||||||||
| Stock transfer agent fees |
17,934 | 40,555 | (22,621 | ) | ||||||||
| Printing and fulfillment expenses |
24,102 | 23,444 | 658 | |||||||||
| Postage and delivery expenses |
7,343 | 7,201 | 142 | |||||||||
| Stock issuance expenses |
— | 1,625 | (1,625 | ) | ||||||||
| Travel and entertainment expenses |
19,137 | 20,064 | (927 | ) | ||||||||
| General and administrative expenses |
72,155 | 45,708 | 26,447 | |||||||||
|
|
|
|
|
|
|
|||||||
| Total Operating Expenses |
$ | 1,083,052 | $ | 589,596 | $ | 493,456 | ||||||
|
|
|
|
|
|
|
|||||||
The decrease of $5,946 in base management fees for the three months ended September 30, 2012 compared to the three months ended September 30, 2011 was the result of a decrease in our gross assets on which the base management fee is calculated.
The increase of $397,508 in incentive fees for the three months ended September 30, 2012 compared to the three months ended September 30, 2011 was the result of $1,332,013 in net unrealized appreciation offset by $121,428 of realized capital losses on our portfolio company investments during the three months ended September 30, 2012, compared to $776,954 of net unrealized depreciation on our portfolio company investments during the three months ended September 30, 2011. See “Investment Advisory and Administrative Services Agreement” below.
The increase of $60,615 in administrative expenses allocated from our investment adviser for the three months ended September 30, 2012 compared to the three months ended September 30, 2011 was primarily the result of the allocation to us of additional salary and benefit expenses associated with our management and administration.
The increase of $30,494 in legal and professional fees for the three months ended September 30, 2012 compared to the three months ended September 30, 2011 was primarily the result of: (i) an increase in valuation services fees of $15,643 associated with the increase in our portfolio company investments since September 30, 2011, and (ii) an increase of $15,000 in fees paid to public relations firms driven by our focus on building and enhancing our stockholder communications, investor relations and brand marketing programs.
The increase of $8,711 in directors’ fees for the three months ended September 30, 2012 compared to the three months ended September 30, 2011 was the result of (i) an increase in the number of independent directors from three to four, and (ii) increases in annual fees paid to independent directors.
The decreases of $22,621 in stock transfer agent fees during the three months ended September 30, 2012 compared to the three months ended September 30, 2011 were primarily the result of higher transfer agent fees prior to the listing of our common stock on Nasdaq in December 2011.
The decrease of $1,625 in stock issuance expenses during the three months ended September 30, 2012 compared to the three months ended September 30, 2011 was the result of the conclusion of our continuous public offering on June 30, 2011, with the final closing occurring in July 2011.
The increase of $26,447 in general and administrative expenses during the three months ended September 30, 2012 compared to the three months ended September 30, 2011 was primarily the result of increases in seminar and conference fees and insurance expenses, which were partially offset by decreases in marketing and advertising expenses and bank service charges.
We continue to focus on building and enhancing our stockholder communications, investor relations and brand marketing programs which we began in anticipation of the listing of our common stock on Nasdaq Capital Market in December 2011. We believe it is important to continue to develop these programs as they will be the foundation of our investor relations initiatives as we anticipate that we will need to access the capital markets from time to time to raise additional capital to fund new portfolio company investments. While some of these expenses may be one-time in nature, the majority of these expenses will continue, and may increase over time, as we attempt to develop interest in the Company and an active trading market for our shares.
50
Table of Contents
Our operating expenses (excluding base management fees, incentive fees and stock issuance costs) for the three months ended September 30, 2012 and 2011 were $457,874 and $354,355, respectively, an increase of $103,519 compared to the prior period. This increase was primarily related to increases in administrative expenses allocated from our investment adviser, legal and professional fees, and general and administrative expenses. We expect our operating expenses (excluding base management fees, incentive fees and stock issuance costs) to range from $500,000 to $625,000 each quarter through the end of 2013; however, such expenses are expected to increase to about $750,000 each quarter if we are successful in completing an equity offering. We do not expect to incur significant incremental operating expenses (excluding base management fees, incentive fees and stock issuance costs) from any increase in our capital base from approximately $100 million to $250 million. Accordingly, based on our current level of assets and any proceeds we raise from future equity offerings, we would expect our annualized operating expense ratio to decline as we raise more capital since the rate of increase in total operating expenses (including base management fees) should be less than the rate of increase in our net assets as a result of an equity offering.
Net Investment Loss. Net investment losses for the three months ended September 30, 2012 and 2011 were $1,082,515 and $583,214, respectively. The increase of $499,301 in net investment loss for the three months ended September 30, 2012 compared to the three months ended September 30, 2011 is attributable to an increase in our operating expenses of $493,456, primarily the result of an increase in incentive fees, which were partially offset by a decrease in our interest and dividend income of $5,845.
Basic and diluted net investment loss per common share was $0.12 for the three months ended September 30, 2012 compared to basic and diluted net investment loss per common share of $0.06 for the three months ended September 30, 2011.
Realized Gains (Losses) on Investments. For the three months ended September 30, 2012 and 2011, realized losses on investments totaled $121,428 and $0, respectively. During the three months ended September 30, 2012, we sold 160,000 shares of NeoPhotonics common stock having an aggregate cost of $1,000,000, or $6.25 per share, for an aggregate sales price (net of commissions and selling expenses) of $878,572, or an average price per share of $5.49. Accordingly, we realized a capital loss of $121,428 on our sale of these shares during the three months ended September 30, 2012. During the three months ended September 30, 2011, we did not dispose of any of our investments in portfolio companies and, accordingly, we had no realized gains or losses during the three months ended September 30, 2011.
Net Change in Unrealized Appreciation (Depreciation) on Investments. For the three months ended September 30, 2012 and 2011, the net change in unrealized appreciation (depreciation) on investments totaled $1,332,013 and $(776,954), respectively.
The following table summarizes the cost and value of our portfolio company investments as of September 30, 2012 and June 30, 2012, and the change in unrealized appreciation (depreciation) on each individual portfolio company investment comprising the net change in unrealized appreciation (depreciation) on investments of $1,332,013 for the three months ended September 30, 2012.
51
Table of Contents
| September 30, 2012 | June 30, 2012 | |||||||||||||||||||||||||||
| Portfolio Company |
Cost | Value | Unrealized Appreciation (Depreciation) |
Cost | Value | Unrealized Appreciation (Depreciation) |
Change
In Unrealized Appreciation (Depreciation) |
|||||||||||||||||||||
| Private Portfolio Companies: |
||||||||||||||||||||||||||||
| Livescribe, Inc. |
$ | 606,187 | $ | 163,923 | $ | (442,264 | ) | $ | 587,752 | $ | 180,412 | $ | (407,340 | ) | $ | (34,924 | ) | |||||||||||
| MBA Polymers, Inc. |
2,000,000 | 2,120,000 | 120,000 | 2,000,000 | 2,240,000 | 240,000 | (120,000 | ) | ||||||||||||||||||||
| BrightSource Energy, Inc. |
2,500,006 | 1,820,000 | (680,006 | ) | 2,500,006 | 2,190,000 | (310,006 | ) | (370,000 | ) | ||||||||||||||||||
| Harvest Power, Inc. |
2,499,999 | 3,540,000 | 1,040,001 | 2,499,999 | 3,500,000 | 1,000,001 | 40,000 | |||||||||||||||||||||
| Suniva, Inc. |
2,500,007 | 1,350,000 | (1,150,007 | ) | 2,500,007 | 1,510,000 | (990,007 | ) | (160,000 | ) | ||||||||||||||||||
| Xtime, Inc. |
3,000,000 | 4,442,878 | 1,442,878 | 3,000,000 | 3,749,040 | 749,040 | 693,838 | |||||||||||||||||||||
| Corsair Components, Inc. |
4,000,080 | 5,600,000 | 1,599,920 | 4,000,080 | 5,600,000 | 1,599,920 | — | |||||||||||||||||||||
| Metabolon, Inc. |
4,000,000 | 4,280,000 | 280,000 | 4,000,000 | 4,000,000 | — | 280,000 | |||||||||||||||||||||
| Kabam, Inc. |
1,328,860 | 1,070,000 | (258,860 | ) | 1,328,860 | 1,100,000 | (228,860 | ) | (30,000 | ) | ||||||||||||||||||
| Tremor Video, Inc. |
4,000,001 | 3,920,000 | (80,001 | ) | 4,000,001 | 4,000,001 | — | (80,001 | ) | |||||||||||||||||||
| TrueCar, Inc. |
2,999,996 | 2,690,000 | (309,996 | ) | 2,999,996 | 2,999,996 | — | (309,996 | ) | |||||||||||||||||||
| Agilyx Corporation |
4,000,000 | 3,770,000 | (230,000 | ) | 4,000,000 | 4,000,000 | — | (230,000 | ) | |||||||||||||||||||
| Zoosk, Inc. |
2,999,999 | 2,999,999 | — | 2,999,999 | 2,999,999 | — | — | |||||||||||||||||||||
| LifeLock, Inc. |
5,000,000 | 6,800,000 | 1,800,000 | 5,000,000 | 5,000,000 | — | 1,800,000 | |||||||||||||||||||||
| SilkRoad, Inc. |
5,000,000 | 5,000,000 | — | 5,000,000 | 5,000,000 | — | — | |||||||||||||||||||||
| Glam Media, Inc. |
4,999,999 | 4,999,999 | — | 4,999,999 | 4,999,999 | — | — | |||||||||||||||||||||
| Stoke, Inc. |
3,500,000 | 3,500,000 | — | 3,500,000 | 3,500,000 | — | — | |||||||||||||||||||||
| Jumptap, Inc. |
4,999,995 | 4,999,995 | — | 4,999,995 | 4,999,995 | — | — | |||||||||||||||||||||
| Publicly Traded Portfolio Companies: |
||||||||||||||||||||||||||||
| NeoPhotonics Corporation |
— | — | — | 1,000,000 | 790,400 | (209,600 | ) | 209,600 | ||||||||||||||||||||
| Solazyme, Inc. |
1,505,162 | 1,699,681 | 194,519 | 1,505,162 | 2,056,185 | 551,023 | (356,504 | ) | ||||||||||||||||||||
|
|
|
|
|
|
|
|
|
|
|
|
|
|
|
|||||||||||||||
| Total |
$ | 61,440,291 | $ | 64,766,475 | $ | 3,326,184 | $ | 62,421,856 | $ | 64,416,027 | $ | 1,994,171 | $ | 1,332,013 | ||||||||||||||
|
|
|
|
|
|
|
|
|
|
|
|
|
|
|
|||||||||||||||
The net change in unrealized depreciation in Solazyme, one of our publicly traded portfolio company investments, during the three months ended September 30, 2012 reflects the change in market price for this portfolio company, and we will continue to be subject to market fluctuations in the price of Solazyme. The net change in unrealized depreciation in NeoPhotonics was the result of our disposition of all of the shares we held in NeoPhotonics during the three months ended September 30, 2012. The change in unrealized appreciation (depreciation) on certain of our private portfolio company investments during the three months ended September 30, 2012 is primarily attributable to one or more of the following reasons:
| • | A significant change in the portfolio company’s financial condition or operating performance compared to projections, and any significant changes to the portfolio company’s budget relative to previous projections. |
| • | A reduction in our weighting of the precedent transaction value since such value may no longer represent the best indicator of fair value within a range of fair values developed from the various valuation approaches and methods used. Precedent transactions may include the transaction in which we acquired our portfolio company interests, as well as subsequent transactions in the equity of the portfolio company, in which we may or may not have participated. In assessing whether the precedent transaction continues to represent the best indicator, or an indicator, of fair value at valuation dates subsequent to the date of the precedent transaction, we typically will consider the recency of the precedent transaction, along with significant changes in portfolio company’s business performance and financial condition and other significant events or conditions occurring subsequent to the date of the precedent transaction. |
| • | The establishment of a new precedent transaction value based on a more recent transaction involving the portfolio company’s equity securities, whether or not we participated in such transaction, taking into account the price, rights, preferences and limitations of the equity securities. |
| • | A change in the market multiples of the selected comparable public companies used to value a portfolio company. |
| • | An adjustment to the discount for lack of marketability due to a significant change in the time frame in which the portfolio company expects to pursue or complete an IPO or sale. |
52
Table of Contents
A discussion of the net change in unrealized (depreciation) during the three months ended September 30, 2012 for certain of our portfolio company investments follows:
| • | The appreciation in the fair value of our investment in LifeLock during the three months ended September 30, 2012 was primarily the result of a reduction in our weighting of the precedent transaction value in favor of a weighting to the IPO value and the discount for lack of marketability applied to our LifeLock investment, which were based on LifeLock’s progress toward an IPO, including the filing of a registration statement on August 28, 2012 and LifeLock’s commencement of an IPO road show in September 2012. |
| • | The appreciation in the fair value of our investment in Xtime during the three months ended September 30, 2012 was the result of a number of factors including Xtime’s equity value as implied by the terms of Xtime’s Series 2 convertible preferred stock financing (including the conversion the shares of Series F preferred stock we held for newly-created Series 1A convertible preferred stock and certain warrants to acquire additional shares of Xtime’s common stock for nominal consideration upon an IPO), which financing was substantially negotiated as of September 30, 2012 and closed on October 5, 2012. |
| • | The depreciation in the fair value of our investment in BrightSource during the three months ended September 30, 2012 was the result of the implied equity value of BrightSource derived from the initial closing of BrightSource’s Series 1 convertible preferred stock financing, which was substantially negotiated as of September 30, 2012 and held on October 24, 2012, the securities we received in connection with the conversion of the Series E preferred, our pro rata participation in the Series 1 convertible preferred stock financing, and other factors. |
| • | The changes in the fair value of our investments in Metabolon, TrueCar and Agilyx during the three months ended September 30, 2012 were the result of reductions in our weightings of the precedent transaction value based on the length of time which has transpired since the closing of our investments, our increased weightings on values derived under the comparable public company and discounted cash flow methods, and other factors. |
The net change in unrealized appreciation (depreciation) on investments of $(776,954) for the three months ended September 30, 2011 was comprised of: (i) an increase of $105,000 in unrealized appreciation on our common stock investment in NeoPhotonics, (ii) an decrease of $1,358,000 in unrealized appreciation on our common stock investment in Solazyme, (iii) an increase of $259,030 in unrealized depreciation on our preferred stock and preferred stock warrants investment in Livescribe, (iv) an increase of $725,920 in unrealized appreciation on our common stock investment in Corsair, and (v) an increase of $9,156 in unrealized appreciation on our common stock warrants in Xtime. The primary factor driving the net change in unrealized appreciation (depreciation) on NeoPhotonics and Solazyme, both publicly traded portfolio companies, during the three months ended September 30, 2011 was a change in market prices for these companies.
Upon sale of any of our portfolio company investments, the value that is ultimately realized could be different from the value currently reflected in our financial statements, and this difference could be material.
Net Increase (Decrease) in Net Assets Resulting From Operations and Per Share Information. The net increase in our net assets resulting from operations for the three months ended September 30, 2012 was $128,070, which included $121,428 in realized losses and $1,332,013 in net unrealized appreciation on investments recorded during such period, compared to a net decrease in our net assets resulting from operations for the three months ended September 30, 2011 of $1,360,168, which included $776,954 in net unrealized depreciation on investments recorded during such period.
Basic and diluted net increase in net assets resulting from operations per common share was $0.01 for the three months ended September 30, 2012, compared to basic and diluted net decrease in net assets resulting from operations per common share of $0.15 per common share for the three months ended September 30, 2011.
Comparison of Nine Months ended September 30, 2012 and 2011
Investment Income. For the nine months ended September 30, 2012 and 2011, we earned interest and dividend income from certificates of deposit and money market investments of $3,377 and $49,660, respectively, a decrease of $46,283 compared to the prior period. No other investment income was recorded during the nine months ended September 30, 2012 and 2011.
Operating Expenses. Operating expenses for the nine months ended September 30, 2012 and 2011 were $3,196,180 and $2,615,907, respectively, an increase of $580,273 compared to the prior period. A summary of the items comprising the increase in our operating expenses for the nine months ended September 30, 2012 compared to the nine months ended September 30, 2011 is set forth in the table below.
53
Table of Contents
| Nine Months Ended | ||||||||||||
| September 30, 2012 |
September 30, 2011 |
Increase / (Decrease) |
||||||||||
| Operating Expenses |
||||||||||||
| Base management fees |
$ | 1,151,127 | $ | 764,375 | $ | 386,752 | ||||||
| Incentive fees |
453,498 | (2,871 | ) | 456,369 | ||||||||
| Administrative expenses allocated from investment adviser |
476,645 | 330,263 | 146,382 | |||||||||
| Legal and professional fees |
522,083 | 357,135 | 164,948 | |||||||||
| Directors’ fees |
120,000 | 90,289 | 29,711 | |||||||||
| Stock transfer agent fees |
47,100 | 163,215 | (116,115 | ) | ||||||||
| Printing and fulfillment expenses |
89,548 | 152,583 | (63,035 | ) | ||||||||
| Postage and delivery expenses |
51,825 | 136,696 | (84,871 | ) | ||||||||
| Stock issuance expenses |
— | 114,388 | (114,388 | ) | ||||||||
| Travel and entertainment expenses |
63,758 | 304,503 | (240,745 | ) | ||||||||
| General and administrative expenses |
220,596 | 205,331 | 15,265 | |||||||||
|
|
|
|
|
|
|
|||||||
| Total Operating Expenses |
$ | 3,196,180 | $ | 2,615,907 | $ | 580,273 | ||||||
|
|
|
|
|
|
|
|||||||
The increase of $386,752 in base management fees for the nine months ended September 30, 2012 compared to the nine months ended September 30, 2011 was the result of an increase in our gross assets on which the base management fee is calculated. The increase in our gross assets was primarily the result of the net proceeds received during 2011 from the sale of common stock in our continuous public offering, which concluded on June 30, 2011.
The increase of $456,369 in incentive fees for the nine months ended September 30, 2012 compared to the nine months ended September 30, 2011 was the result of $1,985,284 in net unrealized appreciation and $282,203 of realized capital gains on our portfolio company investments during the nine months ended September 30, 2012, compared to $14,536 of net unrealized depreciation on our portfolio company investments during the nine months ended September 30, 2011. See “Investment Advisory and Administrative Services Agreement” below.
The increase of $146,382 in administrative expenses allocated from our investment adviser for the nine months ended September 30, 2012 compared to the nine months ended September 30, 2011 was primarily the result of the allocation to us of additional salary and benefit expenses associated with our management and administration.
The increase of $164,948 in legal and professional fees for the nine months ended September 30, 2012 compared to the nine months ended September 30, 2011 was primarily the result of: (i) an increase in audit and tax fees of $77,771 associated with the increase in our portfolio company investments since September 30, 2011, (ii) an increase of $60,848 in fees paid to public relations firms driven by our focus on building and enhancing our stockholder communications, investor relations and brand marketing programs, (iii) an increase in valuation services of $37,281 associated with the increase in our portfolio company investments since September 30, 2011, and (iv) an increase in website design and maintenance fees of $14,100. The increase in legal and professional fees for the nine months ended September 30, 2012 was partially offset by a decrease in other consulting fees of $38,203.
The increase of $29,711 in directors’ fees for the nine months ended September 30, 2012 compared to the nine months ended September 30, 2011 was the result of (i) an increase in the number of independent directors from three to four, and (ii) increases in annual fees paid to independent directors.
The decreases of: (i) $116,115 in stock transfer agent fees, (ii) $63,035 in printing and fulfillment expenses, and (iii) $84,871 in postage and delivery expenses during the nine months ended September 30, 2012 compared to the nine months ended September 30, 2011 were primarily the result of higher transfer agents fees prior to the listing of our common stock on Nasdaq Capital Market in December 2011 and increased printing and production volume and related mailing of investor and marketing materials during the nine months ended September 30, 2011 associated with our continuous public offering, which concluded on June 30, 2011.
The decrease of $114,388 in stock issuance expenses during the nine months ended September 30, 2012 compared to the nine months ended September 30, 2011 was the result of the conclusion of our continuous public offering on June 30, 2011.
The decrease of $240,475 in travel and entertainment expenses during the nine months ended September 30, 2012 compared to the nine months ended September 30, 2011 was primarily the result of increased travel and travel-related expenses related to investor conferences and meetings during the nine months ended September 30, 2011 associated with our continuous public offering, which concluded June 30, 2011.
The increase of $15,265 in general and administrative expenses during the nine months ended September 30, 2012 compared to the nine months ended September 30, 2011 was primarily the result of decreases in marketing and advertising expenses and bank service charges, partially offset by increases in database and information services subscription expenses, regulatory fees, and insurance expenses.
54
Table of Contents
Net Investment Loss. Net investment losses for the nine months ended September 30, 2012 and 2011 were $3,192,803 and $2,566,247, respectively. The increase of $626,556 in net investment loss for the nine months ended September 30, 2012 compared to the nine months ended September 30, 2011 is attributable to an increase in our operating expenses of $580,273, along with a decrease in our interest and dividend income of $46,283.
Basic and diluted net investment loss per common share was $0.34 for the nine months ended September 30, 2012 compared to basic and diluted net investment loss per common share of $0.42 for the nine months ended September 30, 2011.
Realized Gains (Losses) on Investments. For the nine months ended September 30, 2012 and 2011, realized gains on investments totaled $282,203 and $0, respectively. During the nine months ended September 30, 2012, we sold 65,000 shares of Solazyme’s common stock having an aggregate cost of $575,588, or $8.86 per share, for an aggregate sales price (net of commissions and selling expenses) of $979,219, or an average price per share of $15.06. The shares of Solazyme’s common stock that we sold were specifically identified as the shares we acquired upon conversion of the Series D preferred stock at the time of the IPO. Accordingly, we realized a capital gain of $403,631 on our sale of these Solazyme shares in the nine months ended September 30, 2012. During the nine months ended September 30, 2012, we also sold 160,000 shares of NeoPhotonics common stock having an aggregate cost of $1,000,000, or $6.25 per share, for an aggregate sales price (net of commissions and selling expenses) of $878,572, or an average price per share of $5.49. Accordingly, we realized a capital loss of $121,428 on our sale of these NeoPhotonics shares in the nine months ended September 30, 2012. During the nine months ended September 30, 2011, we did not dispose of any of our investments in portfolio companies and, accordingly, we had no realized gains or losses during the nine months ended September 30, 2011.
Net Change in Unrealized Appreciation (Depreciation) on Investments. For the nine months ended September 30, 2012 and 2011, the net change in unrealized appreciation (depreciation) on investments totaled $1,985,284 and $(14,356), respectively.
The following table summarizes the cost and value of our portfolio company investments as of September 30, 2012 and December 31, 2011, and the change in unrealized appreciation (depreciation) on each individual portfolio company investment comprising the net change in unrealized appreciation (depreciation) on investments of $1,985,284 for the nine months ended September 30, 2012.
| September 30, 2012 | December 31, 2011 | |||||||||||||||||||||||||||
| Portfolio Company |
Cost | Value | Unrealized Appreciation (Depreciation) |
Cost | Value | Unrealized Appreciation (Depreciation) |
Change
In Unrealized Appreciation (Depreciation) |
|||||||||||||||||||||
| Private Portfolio Companies: |
||||||||||||||||||||||||||||
| Livescribe, Inc. |
$ | 606,187 | $ | 163,923 | $ | (442,264 | ) | $ | 550,881 | $ | 154,324 | $ | (396,557 | ) | $ | (45,707 | ) | |||||||||||
| MBA Polymers, Inc. |
2,000,000 | 2,120,000 | 120,000 | 2,000,000 | 2,000,000 | — | 120,000 | |||||||||||||||||||||
| BrightSource Energy, Inc. |
2,500,006 | 1,820,000 | (680,006 | ) | 2,500,006 | 2,500,006 | — | (680,006 | ) | |||||||||||||||||||
| Harvest Power, Inc. |
2,499,999 | 3,540,000 | 1,040,001 | 2,499,999 | 2,499,999 | — | 1,040,001 | |||||||||||||||||||||
| Suniva, Inc. |
2,500,007 | 1,350,000 | (1,150,007 | ) | 2,500,007 | 2,500,007 | — | (1,150,007 | ) | |||||||||||||||||||
| Xtime, Inc. |
3,000,000 | 4,442,878 | 1,442,878 | 3,000,000 | 3,009,156 | 9,156 | 1,433,722 | |||||||||||||||||||||
| Corsair Components, Inc. |
4,000,080 | 5,600,000 | 1,599,920 | 4,000,080 | 5,610,000 | 1,609,920 | (10,000 | ) | ||||||||||||||||||||
| Metabolon, Inc. |
4,000,000 | 4,280,000 | 280,000 | 4,000,000 | 4,000,000 | — | 280,000 | |||||||||||||||||||||
| Kabam, Inc. |
1,328,860 | 1,070,000 | (258,860 | ) | 1,328,860 | 1,328,860 | — | (258,860 | ) | |||||||||||||||||||
| Tremor Video, Inc. |
4,000,001 | 3,920,000 | (80,001 | ) | 4,000,001 | 4,000,001 | — | (80,001 | ) | |||||||||||||||||||
| TrueCar, Inc. |
2,999,996 | 2,690,000 | (309,996 | ) | 2,999,996 | 2,999,996 | — | (309,996 | ) | |||||||||||||||||||
| Agilyx Corporation |
4,000,000 | 3,770,000 | (230,000 | ) | 4,000,000 | 4,000,000 | — | (230,000 | ) | |||||||||||||||||||
| Zoosk, Inc. |
2,999,999 | 2,999,999 | — | — | — | — | — | |||||||||||||||||||||
| LifeLock, Inc. |
5,000,000 | 6,800,000 | 1,800,000 | — | — | — | 1,800,000 | |||||||||||||||||||||
| SilkRoad, Inc. |
5,000,000 | 5,000,000 | — | — | — | — | — | |||||||||||||||||||||
| Glam Media, Inc. |
4,999,999 | 4,999,999 | — | — | — | — | — | |||||||||||||||||||||
| Stoke, Inc. |
3,500,000 | 3,500,000 | — | — | — | — | — | |||||||||||||||||||||
| Jumptap, Inc. |
4,999,995 | 4,999,995 | — | — | — | — | — | |||||||||||||||||||||
| Publicly Traded Portfolio Companies: |
||||||||||||||||||||||||||||
| NeoPhotonics Corporation |
— | — | — | 1,000,000 | 732,800 | (267,200 | ) | 267,200 | ||||||||||||||||||||
| Solazyme, Inc. |
1,505,162 | 1,699,681 | 194,519 | 1,553,250 | 1,938,831 | 385,581 | (191,062 | ) | ||||||||||||||||||||
|
|
|
|
|
|
|
|
|
|
|
|
|
|
|
|||||||||||||||
| Total |
$ | 61,440,291 | $ | 64,766,475 | $ | 3,326,184 | $ | 35,933,080 | $ | 37,273,980 | $ | 1,340,900 | $ | 1,985,284 | ||||||||||||||
|
|
|
|
|
|
|
|
|
|
|
|
|
|
|
|||||||||||||||
55
Table of Contents
The net change in unrealized appreciation (depreciation) on our publicly traded portfolio company investments in NeoPhotonics and Solazyme during the nine months ended September 30, 2012 reflects the change in market prices for these portfolio companies and our disposition of these investments, and we will continue to be subject to market fluctuations in the prices of our remaining investment in Solazyme. The change in unrealized appreciation (depreciation) on certain of our private portfolio company investments during the nine months ended September 30, 2012 is primarily attributable to one or more of the following reasons:
| • | A significant change in the portfolio company’s financial condition or operating performance compared to projections, and any significant changes to the portfolio company’s budget relative to previous projections. |
| • | A reduction in our weighting of the precedent transaction value since such value may no longer represent the best indicator of fair value within a range of fair values developed from the various valuation approaches and methods used. |
| • | The establishment of a new precedent transaction value based on a more recent transaction involving the portfolio company’s equity securities, whether or not we participated in such transaction, taking into account the price, rights, preferences and limitations of the equity securities. |
| • | A change in the market multiples of the selected comparable public companies used to value a portfolio company. |
| • | An adjustment to the discount for lack of marketability due to a significant change in the time frame in which the portfolio company expects to pursue or complete an IPO or sale. |
A discussion of the net change in unrealized (depreciation) during the nine months ended September 30, 2012 for certain of our portfolio company investments follows:
| • | The appreciation in the fair value of our investment in LifeLock during the nine months ended September 30, 2012 was primarily the result of a reduction in our weighting of the precedent transaction value in favor of a weighting to the IPO value and the reduction in the discount for lack of marketability applied to our LifeLock investment, which were based on LifeLock’s progress toward an IPO, including the filing of a registration statement on August 28, 2012 and LifeLock’s commencement of an IPO road show in September 2012. |
| • | The depreciation in the fair value of our investment in BrightSource during the nine months ended September 30, 2012 was the result of the implied equity value of BrightSource derived from the initial closing of BrightSource’s Series 1 convertible preferred stock financing, the securities we received in connection with the conversion of the Series E preferred, our pro rata participation in the Series 1 convertible preferred stock financing, and other factors. |
| • | The appreciation in the fair value of our investment in Harvest Power during the nine months ended September 30, 2012 was primarily the result of Harvest Power’s equity value as implied by the Series C convertible preferred stock financing, which was initially closed in March 2012 with an additional closing in July 2012, and other factors. |
| • | The depreciation in the fair value of our investment in Suniva during the nine months ended September 30, 2012 was primarily the result of a deterioration in Suniva’s operating performance compared to projections, reductions in the 2012 budget relative to previous projections, reductions in the relevant multiples of comparable public companies since the date of our investment, and changes in Suniva’s financial condition during the nine months ended September 30, 2012. |
| • | The appreciation in the fair value of our investment in Xtime during the nine months ended September 30, 2012 was the result of Xtime’s equity value as implied by the terms of Xtime’s Series 2 convertible preferred stock financing (including the conversion the shares of Series F preferred stock we held for newly-created Series 1A convertible preferred stock and certain warrants to acquire additional shares of Xtime’s common stock for nominal consideration upon an IPO), a reduction in our weighting of the precedent transaction value based on the length of time which has transpired since the closing of our investment, and other factors. |
| • | The changes in the fair values of our investments in Metabolon, Kabam, TrueCar and Agilyx during the nine months ended September 30, 2012 were the result of reductions in our weightings of the precedent transaction value based on the length of time which has transpired since the closing of our investments, our increased weightings on values derived under the comparable public company, discounted cash flow and comparable transaction methods, as applicable, and other factors. |
56
Table of Contents
The net change in unrealized appreciation (depreciation) on investments of $(14,356) for the nine months ended September 30, 2011 was comprised of: (i) an decrease of $449,000 in unrealized appreciation on our common stock investment in NeoPhotonics, (ii) an increase of $22,991 in unrealized depreciation on our common stock investment in Solazyme, (iii) an increase of $277,441 in unrealized depreciation on our preferred stock and preferred stock warrants investment in Livescribe, (iv) an increase of $725,920 in unrealized appreciation on our common stock investment in Corsair, and (v) an increase of $9,156 in unrealized appreciation on our common stock warrants in Xtime. The primary factor driving the net change in unrealized appreciation (depreciation) on NeoPhotonics and Solazyme, both publicly traded portfolio companies, during the nine months ended September 30, 2011 was a change in market prices for these companies.
Net Decrease in Net Assets Resulting From Operations and Per Share Information. The net decrease in our net assets resulting from operations for the nine months ended September 30, 2012 was $925,316, which included $282,203 in realized gains and $1,985,284 in net unrealized appreciation on investments recorded during such period, compared to a net decrease in our net assets resulting from operations for the nine months ended September 30, 2011 of $2,580,603, which included $14,536 in net unrealized depreciation on investments recorded during such period.
Basic and diluted net decrease in net assets resulting from operations per common share was $0.10 for the nine months ended September 30, 2012, compared to basic and diluted net decrease in net assets resulting from operations per common share of $0.42 per common share for the nine months ended September 30, 2011.
Financial Condition, Liquidity and Capital Resources
As of September 30, 2012, we had cash and cash equivalents of $10,801,679. We primarily invest our cash on hand in money market funds that invest primarily in U.S. Treasury securities, U.S. Government agency securities, and repurchase agreements fully-collateralized by such securities. The investment income we generate from these money market funds is not expected to be significant. Cash needed to fund our near-term operating expenses is held in a bank depository account.
As of September 30, 2012, we were fully invested based on our currently available funds. It is our policy to retain approximately $10 million in cash and cash equivalents to fund our future operating expenses. We intend to access the capital markets from time to time in the future to raise cash to fund new investments. We expect to have a portfolio of approximately 25 companies, taking into account our current portfolio composition and the capital from any possible equity offering. Since we typically do not expect to generate current income from our portfolio company investments, our operating expenses will be financed from our capital base during periods of time between realizations of capital gains on our investments, if any. We expect to deploy the proceeds from any equity offering within six to 12 months after the completion of any offering.
As of September 30, 2012, we had no indebtedness and total accounts payable and accrued expenses of $1,066,231, including amounts owed to our investment adviser. As of September 30, 2012, amounts owed to our investment adviser consist of $124,735 of base management fees, $52,188 of administrative expenses, and $721,677 of accrued incentive fees related to net unrealized appreciation and realized gain on our investments as of September 30, 2012. See “Investment Advisory and Administrative Services Agreement” below.
We will not borrow funds or issue senior securities, including preferred stock, to finance the purchase of our investment in portfolio companies for at least one year from the date of the completion of any equity offering.
From January 11, 2010 through June 30, 2011, we raised $78,423,340, net of issuance costs, in a continuous public offering of 8,713,705 shares of our common stock, with the final closing of escrowed funds from subscribing investors occurring on July 11, 2011. The shares of common stock were offered at $10.00 per share, adjusted for volume discounts and commission waivers. All shares in the continuous public offering were sold at a price of either $9.30 or $10.00, depending on whether or not sales commissions were waived by the dealer manager. The continuous public offering resulted in gross proceeds of $86,800,000, or an average price of $9.96 per share. The investment adviser purchased 564 shares of common stock in the continuous public offering at a price of $10.00 per share.
Because the portfolio company securities that we acquire are typically illiquid until an IPO or sale of the company, we generally cannot predict the regularity and time periods between dispositions of our portfolio company investments and the realizations of capital gains, if any, from such dispositions. Dispositions of our portfolio company investments are discretionary and based on our business judgment. If we are successful in disposing of a portfolio company investment, we intend to reinvest the principal amount of our investment in new portfolio company opportunities, with any gain that we may realized being distributed to our stockholders after we pay any incentive fees earned by our investment adviser and our operating expenses.
57
Table of Contents
We intend to access the capital markets from time to time in the future to raise cash to fund new investments. We intend to file registration statements with the SEC to offer for sale, from time to time, shares of our common stock, in one or more underwritten public offerings, at-the-market offerings, negotiated transactions, block trades, best efforts or a combination of these methods. We intend to use the proceeds from these offerings to fund additional investments in portfolio companies consistent with our investment objective. If we are not able to access the capital markets to raise cash to fund new investments, we may not be able to grow our business and fully execute our business strategy and could decrease our investment income, if any, and cause our net asset value to deteriorate.
On March 15, 2012, we filed a registration statement on Form N-2 for an equity offering of our common stock. On August 23, 2012 we filed our second, and most recent, amendment to the registration statement. For the three and nine months ended September 30, 2012, we incurred $19,576 and $261,091, respectively, in offering expenses associated with the equity offering, including the preparation of the registration statement filed in connection therewith. Such costs were capitalized and will be either charged to equity upon the conclusion of the equity offering, or expensed if we do not complete the equity offering.
At our 2012 Annual Meeting of Stockholders, our stockholders approved a proposal to issue up to 50% of our outstanding common stock at a price (after reduction for commissions and discounts) below our net asset value per share at the time of such issuance. Our Board of Directors has also adopted a policy which prohibits us from selling or issuing shares of our common stock at an offering price per share (offering price to public before commissions and discounts) which represents a discount to the then current net asset value per share of more than 15%. This authorization will expire on the earlier of June 1, 2013 or the date of our 2013 Annual Meeting of Stockholders. In order to sell shares pursuant to this authorization, we cannot sell or issue shares of our common stock at a price below our net asset value per share at the time unless our Board of Directors determines that such sale or issuance would be in our and our stockholders’ best interests. Sales of our common stock at a price below our net asset value per share will dilute the interests of existing stockholders, have the effect of reducing our net asset value per share, and may reduce our market price per share. In addition, continuous sales of common stock below net asset value may have a negative impact on total returns and could have a negative impact on the market price of our shares of common stock.
On May 9, 2012, our Board of Directors authorized a stock repurchase program of up to $5.0 million. Under the repurchase program, we are authorized to repurchase shares of our common stock in open market transactions, including through block purchases, depending on prevailing market conditions and other factors. Our stock repurchase program was originally set to expire on November 8, 2012; however, on October 26, 2012, our Board of Directors extended our stock repurchase program for an additional six months. The program will now expire on May 8, 2013, unless extended further by our Board of Directors. The repurchase program may be extended, modified or discontinued at any time for any reason. The repurchase program does not obligate us to acquire any specific number of shares, and all repurchases will be made in accordance with Rule 10b-18 under the Exchange Act, which sets certain restrictions on the method, timing, price and volume of stock repurchases. Details of the monthly share repurchases under our stock repurchase program during the three months ended September 30, 2012 are set forth in the table below.
| Period |
Total Number of Shares Repurchased |
Total Cost of Shares Repurchased |
Average Price Paid per Share |
Total Number of Shares Purchased as Part of the Publicly Announced Program (1) |
Total Cost of Shares Purchased as Part of the Publicly Announced Program (1) |
Maximum Dollar Value of Shares that May Yet be Purchased Under the Program (1) |
||||||||||||||||||
| July 2012 |
— | $ | — | $ | — | — | $ | — | $ | 4,722,802 | ||||||||||||||
| August 2012 |
5,469 | 38,648 | 7.07 | 5,469 | 38,648 | 4,684,154 | ||||||||||||||||||
| September 2012 |
26,013 | 193,097 | 7.42 | 26,013 | 193,097 | 4,491,057 | ||||||||||||||||||
|
|
|
|
|
|
|
|
|
|
|
|||||||||||||||
| Total - Q3 2012 |
31,482 | $ | 231,745 | $ | 7.36 | 31,482 | $ | 231,745 | ||||||||||||||||
| (1) | On May 9, 2012, the Company’s Board of Directors authorized a stock repurchase program of up to $ 5.0 million. The stock repurchase program was originally set to expire on November 8, 2012; however, on October 26, 2012, our Board of Directors extended our stock repurchase program for an additional six months. The program will now expire on May 8, 2013, unless extended further by our Board of Directors. |
Since the inception of our stock repurchase program, we have repurchased 70,470 shares of our common stock at an average price of $7.22 per share, including commissions, for a total cost of $508,943, and our net asset value per share has increased by $0.01 per share as a result of these share repurchases. The 70,470 shares of common stock repurchased under our stock repurchase program have not been retired or cancelled, remain issued but not outstanding shares, and were held in treasury as of September 30, 2012.
Dividends and Distributions
Dividends and distributions to our common stockholders must be approved by our Board of Directors and any dividend payable is recorded on the ex-dividend date. On February 11, 2011, our Board of Directors declared a special cash distribution of $446,837, or $0.13 per share outstanding on the record date. The distribution was paid on February 17, 2011 to our stockholders of
58
Table of Contents
record as of February 15, 2011. This special cash distribution was based on the unrealized appreciation we had recorded on our NeoPhotonics investment at the time of the distribution, following NeoPhotonics’ completion of its IPO. In the future, we do not expect to pay distributions based on the unrealized appreciation of our private or public company investments.
For federal income tax purposes, distributions paid to our stockholders are characterized and reported as ordinary income, return of capital, long-term capital gains or a combination thereof. Our distribution of $446,837 to stockholders in February 2011 was characterized as a return of capital for federal income tax purposes since we did not generate any investment company taxable income or realized net capital gains during the year ended December 31, 2011.
Distributions to our stockholders will be payable only when and as declared by our Board of Directors and will be paid out of assets legally available for distribution. All distributions will be paid at the discretion of our Board of Directors. We plan to make distributions from any assets legally available for distribution and will be required to determine the extent to which such distributions are paid out of current or accumulated earnings, realized capital gains or are returns of capital. To the extent there is a return of capital, investors will be required to reduce their basis in our stock for federal tax purposes, which will result in higher tax liability when the shares are sold, even if they have not increased in value or have lost value. In addition, any return of capital paid out of offering proceeds will be net of any sales load and offering expenses associated with sales of shares of our common stock.
Our Board of Directors currently maintains a distribution policy with the objective of distributing our net capital gains (which we define for this purpose as our realized capital gains in excess of realized capital losses during the year, without regard to the long-term or short-term character of such gains or losses), if any, after reduction for any incentive fees payable to our investment adviser, our operating expenses, and any other retained amounts. Our Board of Directors currently intends to declare distributions (if any) at least annually, at the end of each year. Since our portfolio company investments will typically not generate current income (i.e., dividends or interest income), we do not expect to generate net ordinary income from which we could make distributions to our stockholders. Our distributions will also depend on our financial condition, maintenance of our RIC status, corporate-level income and excise tax planning, compliance with applicable business development company regulations and such other factors as our Board of Directors may deem relevant from time to time. Our Board of Directors intends to distribute to our stockholders in the fourth quarter of this year the net realized capital gains (if any) from any dispositions of our shares of NeoPhotonics and Solazyme.
We will have substantial fluctuations in our distribution payments to stockholders, since we expect to have an average holding period for our portfolio company investments of up to 36 months. Our ability to pay distributions will be based on our ability to invest our capital in securities of suitable portfolio companies in a timely manner, our portfolio companies achieving a liquidity event through either an IPO or sale of the company, and our ability to dispose of our positions at a gain following the liquidity event. We can give no assurance that we will be able to realize any net capital gains from the sale of our portfolio company investments. Accordingly, there can be no assurance that we will pay distributions to our stockholders in the future, and any distributions we do pay to stockholders will typically be paid only from net capital gains, if any, from the disposition of our portfolio company investments, after reduction for any incentive fees, operating expenses or other retained amounts.
Distributions in excess of our current and accumulated earnings and profits would generally be treated first as a return of capital to the extent of the stockholder’s tax basis, and any remaining distributions would be treated as a capital gain. The determination of the tax attributes of our distributions is made annually as of the end of our fiscal year based upon our taxable income for the full year and distributions paid for the full year. Our distribution of $446,837 paid to stockholders in February 2011 was characterized as a return of capital for income tax purposes. There can be no certainty to stockholders that this determination is representative of what the tax attributes of our future distributions to stockholders, if any, will actually be. Each year a statement on Form 1099-DIV identifying the source of the distribution (i.e., paid from ordinary income, paid from net capital gains on the sale of portfolio company investments, and/or a return of capital which is a nontaxable distribution) is mailed to our stockholders.
In the event we retain some or all of our realized net capital gains, including amounts retained to pay incentive fees to our investment adviser or our operating expenses, we may designate the retained amount as a deemed distribution to stockholders. In such case, among other consequences, we will pay corporate-level tax on the retained amount, each U.S. stockholder will be required to include its share of the deemed distribution in income as if it had been actually distributed to the U.S. stockholder, and the U.S. stockholder will be entitled to claim a credit or refund equal to its allocable share of the corporate-level tax that we pay on the retained realized net capital gain.
We have adopted an “opt out” dividend reinvestment plan that provides for reinvestment of dividends and distributions on behalf of our stockholders, unless a stockholder elects to receive cash. As a result, if our Board of Directors authorizes, and we declare a cash dividend or distribution, then our stockholders who have not “opted out” of the dividend reinvestment plan will have their cash dividend automatically reinvested in additional shares of our common stock, rather than receiving the cash dividends or distributions. Our distribution of $446,837 to stockholders in February 2011 was not eligible for reinvestment under the dividend reinvestment plan since our shares of common stock had not been listed on a stock exchange at the time of the distribution.
59
Table of Contents
Investment Advisory and Administrative Services Agreement
We have entered into an Investment Advisory and Administrative Services Agreement, pursuant to which Keating Investments has agreed to serve as our investment adviser and to furnish us with certain administrative services necessary to conduct our day-to-day operations. This agreement is terminable by either party upon proper notice. We pay Keating Investments a fee for its investment advisory services under the Investment Advisory and Administrative Services Agreement consisting of two components; (i) a base management fee, and (ii) an incentive fee. We also reimburse Keating Investments for our allocable portion of overhead and other administrative expenses incurred by it in performing its administrative obligations under the Investment Advisory and Administrative Services Agreement, including an allocable portion of the compensation of our Chief Financial Officer and Chief Compliance Officer, and their respective staff.
Our officers do not receive any compensation directly from us. However, the principals and officers of the investment adviser who also serve as the Company’s officers receive compensation from, or may have financial interests in, the investment adviser, which may be funded by or economically related to the investment advisory fees paid by us to the investment adviser under to the Investment Advisory and Administrative Services Agreement.
The base management fee (the “Base Fee”) is calculated at an annual rate of 2% of our gross assets. The Base Fee is payable monthly in arrears, and is calculated based on the value of our gross assets at the end of the most recently completed calendar quarter, and adjusted for any equity capital raises or repurchases during the current calendar quarter. We recorded Base Fees of $383,061 and $389,007 for the three months ended September 30, 2012 and 2011, respectively. We recorded Base Fees of $1,151,127 and $764,375 for the nine months ended September 30, 2012 and 2011, respectively. As of September 30, 2012 and December 31, 2011, Base Fees payable to the investment adviser were $124,735 and $130,969, respectively.
The incentive fee is payable in arrears as of the end of each calendar year and equals 20% of our realized capital gains, if any, on a cumulative basis from inception through the end of each calendar year, computed net of all realized capital losses and unrealized capital depreciation on a cumulative basis, less the aggregate amount of any previously paid incentive fees. For purposes of determining the incentive fee to be paid, realized capital gains, realized capital losses and unrealized capital depreciation are each determined without regard to the holding period for our investments and include both long-term (held more than 12 months) and short-term holdings.
During the three months ended September 30, 2012, we recorded an incentive fee expense of $242,117 resulting from: (i) an increase in net unrealized appreciation on our portfolio company investments of $1,332,013 during such period, and (ii) a decrease in our cumulative net realized capital gains of $121,428 during such period. For the three months ended September 30, 2011, we recorded a reduction in incentive fee expense of $155,391 resulting from a decrease in net unrealized appreciation on our portfolio company investments of $766,954 during such period.
During the nine months ended September 30, 2012, we recorded an incentive fee expense of $453,498 resulting from: (i) an increase in net unrealized appreciation of $1,985,284 on our portfolio company investments during such period, and (ii) an increase in our cumulative net realized capital gains of $282,203 during such period. For the nine months ended September 30, 2011, we recorded a reduction in incentive fee expense of $2,871 resulting from a decrease in net unrealized appreciation on our portfolio company investments of $14,356 during such period.
As of September 30, 2012 and December 31, 2011, we had accrued incentive fees payable to the investment adviser in the amounts of $721,677 and $268,180, respectively. The incentive fees are calculated and paid annually based on cumulative net realized capital gains (taking into account cumulative realized capital losses) reduced by unrealized depreciation on any investments that have a fair value below our investment cost and incentive fees previously paid. Accordingly, the accrued incentive fee of $665,237 as of September 30, 2012 related to net unrealized appreciation of $3,326,184 as of September 30, 2012 may differ from the actual incentive fee that may be paid to the investment adviser depending on whether we are ultimately able to dispose of our portfolio company investments and generate a net realized capital gain at least commensurate with the net unrealized appreciation recorded as of September 30, 2012. Further, the accrued incentive fee of $56,440 as of September 30, 2012 related to the cumulative net realized capital gain of $282,203 as of September 30, 2012 may differ from the actual incentive fee paid to the investment adviser depending on the performance of our portfolio company investments taken as a whole for the year ended December 31, 2012. As of September 30, 2012, no incentive fees related to the cumulative net realized capital gain of $282,203 would have been due and payable to the investment adviser since the aggregate unrealized depreciation on our investments that have a fair value below our investment cost exceeded the amount of the cumulative net realized capital gain.
We reimburse the investment adviser for the allocable portion of overhead and other expenses incurred by the investment adviser in performing its administrative obligations under the Investment Advisory and Administrative Services Agreement, including the allocable portion of compensation of our Chief Financial Officer and Chief Compliance Officer, and their respective staff.
60
Table of Contents
However, during the three and nine months ended September 30, 2012, no portion of our Chief Compliance Officer’s compensation was allocated to us since he is also a member of the investment adviser’s Investment Committee. Allocated administrative expenses are payable to the investment adviser monthly in arrears.
We recorded allocated administrative expenses of $157,372 and $96,757 for the three months ended September 30, 2012 and 2011, respectively, and allocated administrative expenses of $476,645 and $330,263 for the nine months ended September 30, 2012 and 2011, respectively. As of September 30, 2012 and December 31, 2011, allocated administrative expenses payable to the investment adviser were $52,188 and $47,285, respectively. We also agreed to reimburse the investment adviser for separation payments due to the Company’s former Chief Financial Officer. In consideration for certain separation services, the former Chief Financial Officer was paid a separation payment equal to $8,000 per month (prorated for any partial month) for the period November 16, 2011 through April 30, 2012.
An amended and restated version of the Investment Advisory and Administrative Services Agreement, which is presently in effect, was approved by our Board of Directors on April 17, 2009, and by our stockholders on May 14, 2009. On April 13, 2012, our Board of Directors (including the non-interested directors) renewed the current Investment Advisory and Administrative Services Agreement for an additional year. The current Investment Advisory and Administrative Services Agreement will remain in effect from year to year thereafter if approved annually by (i) the vote of our Board of Directors, or by the vote of a majority of our outstanding voting securities, and (ii) the vote of a majority of our directors who are not interested persons. An affirmative vote of the holders of a majority of our outstanding voting securities is also necessary in order to make material amendments to the current Investment Advisory and Administrative Services Agreement.
Commitments and Contingencies
In the normal course of business, we may enter into investment agreements under which we commit to make an investment in a portfolio company at some future date or over a specified period of time.
We maintain a directors and officers insurance policy and an excess coverage policy for non-indemnifiable claims covering us and our officers and directors. We have also agreed to indemnify our directors and officers to the maximum extent permitted by Maryland law subject to the restrictions in the 1940 Act.
As of September 30, 2012, we and our officers and directors are not a party to any material legal proceedings. However, from time to time, we may be party to certain legal proceedings incidental to the normal course of our business including the enforcement of our rights under contracts with our portfolio companies.
Off-Balance Sheet Arrangements
As of September 30, 2012, we had no off-balance sheet arrangements.
Critical Accounting Policies
The preparation of financial statements and related disclosures in conformity with accounting principles generally accepted in the United States of America requires management to make estimates and assumptions that affect the reported amounts of assets and liabilities, disclosure of contingent assets and liabilities at the date of the financial statements, and revenues and expenses during the periods reported. Actual results could materially differ from those estimates. We have identified the following items as critical accounting policies.
Valuation of portfolio company investments. The most significant estimate inherent in the preparation of our financial statements is the valuation of our portfolio investments and the related amounts of unrealized appreciation and depreciation. Value, as defined in Section 2(a)(41) of the 1940 Act, is: (i) the market price for those securities for which a market quotation is readily available, and (ii) for all other securities and assets, fair value is as determined in good faith by our Board of Directors. As of September 30, 2012 and December 31, 2011, 83.0% and 45.0%, respectively, of our gross assets represented investments in portfolio companies valued at fair value by our Board of Directors.
Accounting Standards Codification Topic 820, “Fair Value Measurement and Disclosures,” (“ASC 820”) defines fair value as the price that would be received to sell an asset or paid to transfer a liability in an orderly transaction between market participants at the measurement date (exit price). In accordance with ASC 820, the Company uses a three-tier fair value hierarchy, which prioritizes the inputs used in measuring fair value as follows:
| • | Level 1: Observable inputs such as unadjusted quoted prices in active markets; |
61
Table of Contents
| • | Level 2: Includes inputs such as quoted prices for similar securities in active markets and quoted prices for identical securities where there is little or no activity in the market; and |
| • | Level 3: Unobservable inputs for which little or no market data exists, therefore requiring an entity to develop its own assumptions. |
We make investments in later stage, typically venture capital-backed, private, pre-IPO companies in technology, Internet and software, and cleantech. Given the nature of investing in the securities of private companies, our investments are generally considered Level 3 assets under ASC 820 until these portfolio companies become public and begin trading on a stock exchange and until such time as these securities are no longer subject to any post-IPO lockup restrictions. As such, we value all of our investments, other than unrestricted securities in publicly traded portfolio companies, at fair value as determined in good faith pursuant to a consistent valuation policy and our Board of Directors in accordance with the provisions of ASC 820 and the 1940 Act.
Determination of fair values involves subjective judgments and estimates. Accordingly, this critical accounting policy expresses the uncertainty with respect to the possible effect of such valuations, and any change in such valuations, on our financial statements. We generally have agreements with our portfolio companies to receive financial and other information with respect to our private portfolio companies on a quarterly basis. However, for our quarterly fair value determinations, we typically will only have access to a portfolio company’s actual financial results as of or for the quarter end which precedes the quarter end for which our fair value determination relates. In addition, we typically only receive updated financial projections for a portfolio company on an annual basis. Due to the inherent uncertainty in determining the fair value of investments that do not have a readily available market value, the fair value of our investments determined in good faith by our Board of Directors may differ significantly from the value that would have been used had a ready market existed for such investments, and the differences could be material. Changes in valuation of these equity securities are recorded in our Statement of Operations as “Net change in unrealized appreciation (depreciation) on investments.” In addition, the net changes in unrealized appreciation (depreciation) on investments that we record each period will affect the amount of any accrued incentive fees payable to the investment adviser. Changes in valuation of any of our investments in privately held companies from one period to another may be volatile.
As of September 30, 2012, all of our investments in portfolio companies were determined to be Level 3 assets, except for our investment in the common stock of Solazyme, which was determined to be a Level 1 asset following the expiration of a 180-day lockup provision in November 2011.
Determining fair value requires that judgment be applied to the specific facts and circumstances of each portfolio investment while employing a consistently applied valuation process for the types of investments we make. We are required to specifically value each individual investment on a quarterly basis.
The 1940 Act requires periodic valuation of each portfolio investment to determine our net asset value. Under the 1940 Act, unrestricted securities with readily available market quotations in an active market are valued at the closing market price on the valuation date; all other assets must be valued at fair value as determined in good faith by or under the direction of our Board of Directors.
Our equity investments for which market quotations are readily available in an active market are generally valued at the most recently available closing market prices and are classified as Level 1 assets. However, equity investments for which market quotations are readily available, but which are subject to lockup provisions restricting the resale of such investments for a specified period of time, are valued at a discount to the most recently available closing market prices and, accordingly, are classified as Level 3 assets.
With respect to investments for which market quotations are not readily available, our Board of Directors undertakes a multi-step valuation process each quarter, as described below:
| • | Our quarterly valuation process begins with each portfolio company investment being initially valued by the senior investment professionals of Keating Investments, our investment adviser, responsible for the portfolio investment; |
| • | The Chairman of our Valuation Committee, in consultation with management, will determine each calendar quarter which investments in our portfolio for which market quotations are not readily available will be reviewed by a third-party valuation firm, provided, however, that a review will be conducted by a third-party valuation firm for each new portfolio company investment made during a calendar quarter and for any portfolio company for which market quotations are not readily available and whose valuation has not been reviewed in the prior twelve months; |
62
Table of Contents
| • | Our Valuation Committee reviews the preliminary valuations, and our investment adviser and the third-party valuation firm respond and supplement the preliminary valuation to reflect any comments provided by our Valuation Committee; and |
| • | Our Board of Directors discusses the valuations and determines, in good faith, the fair value of each investment in our portfolio for which market quotations are not readily available based on the input of our investment adviser, the third-party valuation firm, and our Valuation Committee. |
The fair values of our equity investments for which market quotations are not readily available (including investments in convertible preferred stock) are determined based on various factors and are classified as Level 3 assets. To determine the fair value of a portfolio company for which market quotations are not readily available, we may analyze the portfolio company’s most recently available historical and projected financial results, public market comparables, and other factors. We may also consider other events, including the transaction in which we acquired our securities, subsequent equity sales by the portfolio company, mergers or acquisitions affecting the portfolio company, or the completion of an IPO by the portfolio company. In addition, we may consider the trends of the portfolio company’s basic financial metrics from the time of our original investment until the measurement date, with material improvement of these metrics indicating a possible increase in fair value, while material deterioration of these metrics may indicate a possible reduction in fair value. The fair values of our portfolio company securities are generally discounted for lack of marketability or when the securities are illiquid, such as when there are restrictions on resale or the lack of an established trading market which will generally be the case for pre-IPO companies, as well as during any lockup period to which we are subject with respect to public companies in our portfolio.
The fair value of common and preferred stock warrants is generally determined by using option pricing models, such as the Black-Scholes model or, in cases of certain warrants where the Company’s ability to exercise may be contingent or be subject to certain metrics, a Monte Carlo simulation.
The following provides quantitative information about our Level 3 fair value measurements as of September 30, 2012:
| September 30, 2012 | ||||||||||||||||||||
| Investment Type |
Fair Value | Valuation Technique(s) |
Unobservable Input |
Range |
Weighted Average (1) |
|||||||||||||||
| Private Portfolio Company | $ | 51,262,993 | Precedent transactions | Precedent transactions | n/a | to | n/a | n/a | ||||||||||||
| Investments: Convertible Preferred Stock | Comparable transactions | Revenue multiple | 3.5 | 12.7 | 8.5 | |||||||||||||||
| Comparable public companies | Revenue multiple | 0.5 | to | 7.0 | 2.8 | |||||||||||||||
| EBITDA multiple | 4.2 | to | 37.1 | 10.7 | ||||||||||||||||
| P/E multiple | 6.4 | to | 15.7 | 12.8 | ||||||||||||||||
| Discount for lack of marketability | 20% | to | 45% | 34 | % | |||||||||||||||
| Discounted cash flow | Discount rate | 23% | to | 50% | 36 | % | ||||||||||||||
| Terminal revenue multiple | 0.7 | to | 7.0 | 4.5 | ||||||||||||||||
| Terminal EBITDA multiple | 6.8 | to | 23.7 | 15.4 | ||||||||||||||||
| Terminal P/E multiple | 13.5 | to | 21.6 | 17.3 | ||||||||||||||||
| Discount for lack of marketability | 20% | to | 45% | 34 | % | |||||||||||||||
| Private Portfolio Company Investments: Convertible Preferred Stock Warrants | $ | 923 | Option pricing model | Comparable public company equity volatility | 49% | to | 53% | 51 | % | |||||||||||
| Private Portfolio Company Investments: Common Stock | $ | 11,650,000 | Precedent transactions | Precedent transactions | n/a | to | n/a | n/a | ||||||||||||
| Comparable public companies | Revenue multiple | 0.3 | to | 3.6 | 1.8 | |||||||||||||||
| EBITDA multiple | 3.7 | to | 11.9 | 6.8 | ||||||||||||||||
| P/E multiple | 9.6 | to | 24.6 | 15.6 | ||||||||||||||||
| Discount for lack of marketability | 30% | to | 35% | 33 | % | |||||||||||||||
| Discounted cash flow | Discount rate | 35% | to | 50% | 38 | % | ||||||||||||||
| Terminal revenue multiple | 0.5 | to | 5.9 | 2.8 | ||||||||||||||||
| Terminal EBITDA multiple | 5.4 | to | 17.0 | 9.2 | ||||||||||||||||
| Terminal P/E multiple | 15.3 | to | 32.2 | 22.3 | ||||||||||||||||
| Discount for lack of marketability | 30% | to | 35% | 33 | % | |||||||||||||||
| Private Portfolio Company Investments: Common Stock Warrants | $ | 152,878 | Option pricing model | Comparable public company equity volatility | 48% | to | 48% | 48 | % | |||||||||||
| (1) | Weighted average based on fair value of as of September 30, 2012. |
We currently have engaged third-party valuation firms to conduct an initial valuation review of each new private portfolio company investment and, in accordance with our valuation policy, periodic updated valuation reviews for our portfolio investments that are not publicly traded.
63
Table of Contents
Federal Income Taxes. From incorporation through December 31, 2009, we were treated as a corporation under Subchapter C of the Internal Revenue Code of 1986, as amended (the “Code”). Effective January 1, 2010, we elected to be treated for tax purposes as a regulated investment company, or RIC, under the Code. We intend to operate so as to qualify as a RIC and, as such, have made no provision for income taxes as of September 30, 2012.
As a RIC, we generally will not have to pay corporate-level federal income taxes on any investment company taxable income (which is generally our net ordinary income plus the excess, if any, of realized net short-term capital gains over realized net long-term capital losses) or any realized net capital gains (which is generally net realized long-term capital gains in excess of net realized short-term capital losses) that we distribute to our stockholders as dividends. Taxable income generally differs from net income for financial reporting purposes due to temporary and permanent differences in the recognition of income and expenses. In addition, taxable income generally excludes any unrealized appreciation or depreciation in our portfolio company investments, because gains and losses are not included in taxable income until they are realized and required to be recognized.
To maintain RIC tax treatment, we must meet specified source-of-income and asset diversification requirements (as described below) and distribute annually at least 90% of our investment company taxable income. Because federal income tax rules differ from accounting principles generally accepted in the United States, distributions in accordance with tax rules may differ from net investment income and realized gains recognized for financial reporting purposes. Differences may be permanent or temporary in nature.
We are not required to distribute our realized net capital gains, if any, to stockholders to maintain RIC tax treatment. However, we generally will have to pay corporate-level federal income taxes on any realized net capital gains that we do not distribute to our stockholders. In the event we retain any of our realized net capital gains, including amounts retained to pay incentive fees to our investment adviser or to pay our operating expenses, we may designate the retained amount as a deemed distribution to our stockholders and will be required to pay corporate-level tax on the retained amount.
We would also be subject to an excise tax imposed on RICs if we fail to distribute during each calendar year an amount at least equal to the sum of: (i) 98% of our ordinary income for the calendar year, (ii) 98.2% of our capital gains in excess of capital losses for the one-year period ending on October 31 of the calendar year, and (iii) any ordinary income and net capital gains for preceding years that were not distributed during such years. We will not be subject to this excise tax on amounts on which we are required to pay corporate income tax (such as retained realized net capital gains).
Recent Developments
On October 2, 2012, LifeLock priced its IPO at $9.00 per share. The shares of LifeLock’s common stock began trading on the New York Stock Exchange on October 3, 2012. In connection with LifeLock’s IPO, the 634,711 shares of Series E preferred stock which we purchased in March 2012 for $5 million, or $7.88 per share, were automatically converted into 944,513 shares of LifeLock’s common stock, based on an adjusted conversion price of $5.29 per share. The adjusted conversion price was calculated based on our structurally protected appreciation multiple of 1.7x our investment cost – meaning we received common shares at the time of LifeLock’s IPO that had a market value of $8.5 million based on the $9.00 IPO price. The Series E preferred stock warrants were cancelled in connection with the IPO. The shares of LifeLock’s common stock we received upon conversion of the Series E preferred stock are subject to a 180-day lockup provision which will expire in April 2013.
On October 5, 2012, Xtime completed a Series 2 convertible preferred stock financing in which we did not participate so that we would not violate the diversification requirements for us to continue to qualify as a RIC for tax purposes. Immediately prior to the closing of the Series 2 convertible preferred stock round, all of the existing holders of Xtime’s preferred stock (including the Series F preferred stockholders) convert their existing preferred stock into newly-created Series 1A convertible preferred stock and certain warrants to acquire additional shares of Xtime’s common stock for nominal consideration upon an IPO (the “IPO warrants”). As a holder of Series F preferred stock, we received one share of Series 1A preferred stock for each share of Series F preferred stock that we held, plus IPO warrants which grant us the right to acquire additional shares of common stock, calculated at the time of the IPO based on the actual IPO price, at an exercise price of $0.01 per share. We continue to hold warrants to acquire 22,581 shares of Xtime common stock which we received as part of the Series F round.
On October 9, 2012, Agilyx raised additional funds as part of a Series D convertible preferred stock financing in which we did not participate so that we would not violate the diversification requirements for us to continue to qualify as a RIC for tax purposes.
On October 24, 2012, BrightSource completed an initial closing of its Series 1 convertible preferred stock financing which resulted in the automatic conversion of the Series E preferred stock we held into 96,177 shares of BrightSource’s common stock and the elimination of our structural protection associated with the Series E preferred stock. As part of the initial closing of the Series 1 financing round, we completed a $397,125 investment in BrightSource’s Series 1 convertible preferred stock, which represented our full pro rata participation amount in the round. Existing preferred stockholders investing their full pro rata participation amount in the Series 1 round also received shares of Series 1A preferred stock and additional shares of common stock. The Series 1A preferred stock which
64
Table of Contents
we received for making our pro rata investment in the Series 1 round allowed us to retain the liquidation preference amount that was attributed to our shares of Series E preferred stock, although the Series 1A liquidation preference is subordinate to the liquidation preference of the Series 1 preferred stock.
Taxation and Regulatory Requirements
RIC Requirements
From incorporation through December 31, 2009, we were treated as a corporation under the Internal Revenue Code of 1986, as amended (the “Code”). Effective January 1, 2010, we elected to be treated for tax purposes as a regulated investment company, or RIC, under the Code. We intend to operate so as to qualify as a RIC and, as such, have made no provision for income taxes as of September 30, 2012. However, our continued qualification as a RIC requires that we comply with certain requirements contained in Subchapter M of the Code that may affect our ability to pursue additional business opportunities or strategies that, if we were to determine we should pursue, could diminish the desirability of qualifying, or impede our ability to qualify, as a RIC. For example, a RIC must meet certain requirements, including source of income and asset diversification requirements (as described below) and distributing annually at least 90% of its investment company taxable income (the “Annual Distribution Requirement”).
As a RIC, we generally will not have to pay corporate-level federal income taxes on any investment company taxable income (which is generally our net ordinary income plus the excess, if any, of realized net short-term capital gains over realized net long-term capital losses) or any realized net capital gains (which is generally net realized long-term capital gains in excess of net realized short-term capital losses) that we distribute to our stockholders as dividends. We will be subject to United States federal income tax at the regular corporate rates on any investment company taxable income or capital gain not distributed (or deemed distributed) to our stockholders.
In order to qualify and continue to qualify as a RIC for federal income tax purposes and obtain the tax benefits accorded to a RIC, in addition to satisfying the Annual Distribution Requirement, we must, among other things:
| • | Have in effect at all times during each taxable year an election to be regulated as a business development company under the 1940 Act; |
| • | Derive in each taxable year at least 90% of our gross income from (i) dividends, interest, payments with respect to certain securities loans, gains from the sale of stock or other securities, or other income derived with respect to our business of investing in such stock or securities and (ii) net income derived from an interest in a “qualified publicly traded limited partnership” (the “90% Income Test”); and |
| • | Diversify our holdings so that at the end of each quarter of the taxable year: |
| • | at least 50% of the value of our assets consists of cash, cash equivalents, U.S. government securities, securities of other RICs, and other securities if such other securities of any one issuer do not represent more than 5% of the value of our assets or more than 10% of the outstanding voting securities of such issuer; and |
| • | no more than 25% of the value of our assets is invested in (i) securities (other than U.S. government securities or securities of other RICs) of one issuer, (ii) securities of two or more issuers that are controlled, as determined under applicable tax rules, by us and that are engaged in the same or similar or related trades or businesses, or (iii) securities of one or more “qualified publicly traded partnerships” (the “Diversification Tests”). |
We satisfied the above RIC requirements during our 2010 and 2011 taxable years. Since we did not generate investment company taxable income in 2010 or 2011, we were not required to make any distributions to satisfy the Annual Distribution Requirement. We also did not generate any realized net capital gains in 2010 or 2011 and, as a result, we were not required to make any distributions to satisfy the Excise Tax Avoidance Requirement, as described below.
Distributions, or deemed distributions, of our net capital gains properly reported by us as “capital gain dividends” will be taxable to a U.S. stockholder as long-term capital gains, regardless of the U.S. stockholder’s holding period for his, her or its shares. In general, non-corporate U.S. stockholders are subject to a maximum federal income tax rate of 15% on their long-term capital gains recognized in taxable years beginning before January 1, 2013. For taxable years beginning after December 31, 2012, non-corporate U.S. stockholders will be subject to a maximum federal income tax rate of 20% on their long-term capital gains. In addition, for taxable years beginning after December 31, 2012, individuals with income in excess of $200,000 ($250,000 in the case of married individuals filing jointly) are generally subject to an additional 3.8% tax on their net capital gains.
65
Table of Contents
In order to avoid a 4% non-deductible federal excise tax imposed on RICs, we must also distribute during each calendar year an amount at least equal to the sum of: (i) 98% of our ordinary income for the calendar year, (ii) 98.2% of our capital gains in excess of capital losses for the one-year period ending on October 31 of the calendar year, and (iii) any ordinary income and net capital gains for preceding years that were not distributed during such years (the “Excise Tax Avoidance Requirement”). We will not be subject to this excise tax on amounts on which we are required to pay corporate income tax (such as retained realized net capital gains). We currently intend to make sufficient distributions (including deemed distributions of retained realized net capital gains) each taxable year to avoid the payment of the excise tax.
Investment Company Act of 1940
We have elected to be regulated as a business development company under the 1940 Act. The 1940 Act requires that a majority of our directors be persons other than “interested persons,” as that term is defined in the 1940 Act. In addition, the 1940 Act provides that we may not change the nature of our business so as to cease to be, or to withdraw our election as, a business development company without the approval of a “majority of our outstanding voting securities,” within the meaning of the 1940 Act.
Qualifying assets. Under the 1940 Act, a business development company may not acquire any asset other than assets of the type listed in Section 55(a) of the 1940 Act, which are referred to here as “qualifying assets,” unless, at the time the acquisition is made, qualifying assets represent at least 70% of the company’s total assets (the “70% test”). The principal categories of qualifying assets relevant to our business are any of the following:
| (1) | Securities purchased in transactions not involving any public offering from the issuer of such securities, which issuer (subject to certain limited exceptions) is an eligible portfolio company, or from any person who is, or has been during the preceding 13 months, an affiliated person of an eligible portfolio company, or from any other person, subject to such rules as may be prescribed by the SEC. An eligible portfolio company is defined in the 1940 Act as any issuer which: |
| (a) | is organized under the laws of, and has its principal place of business in, the United States; |
| (b) | is not an investment company (other than a small business investment company wholly owned by the business development company) or a company that would be an investment company but for certain exclusions under the 1940 Act; and |
| (c) | Satisfies any of the following: |
| (i) | does not have any class of securities that is traded on a national securities exchange; |
| (ii) | has a class of securities listed on a national securities exchange, but has an aggregate market value of outstanding voting and non-voting common equity of less than $250 million; |
| (iii) | is controlled by a business development company or group of companies including a business development company and the business development company has an affiliated person who is a director of the eligible portfolio company; or |
| (iv) | is a small and solvent company having gross assets of not more than $4.0 million and capital and surplus of not less than $2.0 million. |
| (2) | Securities of any eligible portfolio company that we control. |
| (3) | Securities purchased in a private transaction from a U.S. issuer that is not an investment company or from an affiliated person of the issuer, or in transactions incident thereto, if the issuer is in bankruptcy and subject to reorganization or if the issuer, immediately prior to the purchase of its securities was unable to meet its obligations as they came due without material assistance other than conventional lending or financing arrangements. |
| (4) | Securities of an eligible portfolio company purchased from any person in a private transaction if there is no ready market for such securities and we already own 60% of the outstanding equity of the eligible portfolio company. |
| (5) | Securities received in exchange for or distributed on or with respect to securities described in (1) through (4) above, or pursuant to the exercise of warrants or rights relating to such securities. |
| (6) | Cash, cash equivalents, certificates of deposit, U.S. Government securities or high-quality debt securities maturing in one year or less from the time of investment. |
66
Table of Contents
Control, as defined by the 1940 Act, is presumed to exist where a business development company beneficially owns more than 25% of the outstanding voting securities of the portfolio company.
If less than 70% of our total assets are comprised of qualifying assets, we would generally not be permitted to acquire any additional non-qualifying assets, until such time as 70% of our then current total assets were comprised of qualifying assets. We would not be required, however, to dispose of any non-qualifying assets in such circumstances.
As of September 30, 2012, we believe all of our portfolio company investments constituted qualifying investments under Section 55(a) of the 1940 Act, with the exception of 100,000 shares of Solazyme, Inc. common stock acquired in open market transactions with a cost and value of $1,080,759 and $1,149,000, respectively, which represent approximately 1.4% and 1.5% of total assets.
We do not intend to acquire securities issued by any investment company that exceed the limits imposed by the 1940 Act. Under these limits, we generally cannot acquire more than 3% of the voting stock of any investment company (as defined in the 1940 Act), invest more than 5% of the value of our gross assets in the securities of one such investment company or invest more than 10% of the value of our gross assets in the securities of such investment companies in the aggregate. With regard to that portion of our portfolio invested in securities issued by investment companies, it should be noted that such investments might subject our stockholders to additional expenses.
In addition, a business development company must have been organized and have its principal place of business in the United States and must be operated for the purpose of making investments in the types of securities described in (1), (2) or (3) above.
Managerial assistance to portfolio companies. In general, in order to count portfolio securities as qualifying assets for the purpose of the 70% test, we must either control the issuer of the securities or must offer to make available to the issuer of the securities (other than small and solvent companies described above) significant managerial assistance; except that, where we purchase such securities in conjunction with one or more other persons acting together, one of the other persons in the group may make available such managerial assistance. Making available managerial assistance means, among other things, any arrangement whereby the business development company, through its directors, officers or employees, offers to provide, and, if requested to, provides significant guidance and counsel concerning the management, operations or business objectives and policies of a portfolio company. We expect that any managerial assistance we provide to our portfolio companies will likely involve consulting and advice on the going public process and public capital markets.
Senior securities. We are permitted, under specified conditions, to issue multiple classes of debt and one class of stock senior to our common stock if our asset coverage, as defined in the 1940 Act, is at least equal to 200% immediately after each such issuance. In addition, while any senior securities remain outstanding, we must make provisions to prohibit any distribution to our stockholders or the repurchase of such securities or shares unless we meet the applicable asset coverage ratios at the time of the distribution or repurchase. We may also borrow amounts up to 5% of the value of our gross assets for temporary or emergency purposes without regard to asset coverage.
Although we will not borrow funds or issue senior securities, including preferred stock, to finance the purchase of our investments in portfolio companies for at least one year following the completion of an equity offering of our common stock, in the event we do borrow funds to make investments thereafter, we are exposed to the risks of leverage, which may be considered a speculative investment technique. Borrowings, also known as leverage, magnify the potential for gain and loss on amounts invested and therefore increase the risks associated with investing in our securities. In addition, the costs associated with our borrowings, including any increase in the management fee payable to our investment adviser will be borne by our common stockholders.
Proxy voting policies and procedures. We vote proxies relating to our portfolio securities in the best interest of our stockholders. We review on a case-by-case basis each proposal submitted to a stockholder vote to determine its impact on the portfolio securities held by us. Although we generally vote against proposals that may have a negative impact on our portfolio securities, we may vote for such a proposal if there exists compelling long-term reasons to do so.
Our proxy voting decisions are made by our investment adviser’s principals. To ensure that our vote is not the product of a conflict of interest, we require that: (i) anyone involved in the decision making process disclose to our Chief Compliance Officer any potential conflict that he is aware of and any contact that he has had with any interested party regarding a proxy vote; and (ii) employees involved in the decision making process or vote administration are prohibited from revealing how we intend to vote on a proposal in order to reduce any attempted influence from interested parties.
67
Table of Contents
Stockholders may obtain information regarding how we voted proxies with respect to our portfolio securities by making a written request for proxy voting information to: Chief Compliance Officer, Keating Capital, Inc., 5251 DTC Parkway, Suite 1100, Greenwood Village, Colorado 80111.
Temporary investments. Pending investment in other types of “qualifying assets,” as described above, our investments may consist of cash, cash equivalents, certificates of deposit, U.S. government securities or high-quality debt securities maturing in one year or less. The management fee payable to our investment adviser will not be reduced while our assets are invested in such temporary investments.
Code of ethics. We and our investment adviser have each adopted a code of ethics pursuant to Rule 17j-1 under the 1940 Act and Rule 204A-1 under the Advisers Act, respectively, that establishes procedures for personal investments and restricts certain transactions by our personnel. Our codes of ethics generally do not permit investments by our employees in securities that may be purchased or held by us. You may read and copy these codes of ethics at the SEC’s Public Reference Room in Washington, DC. You may obtain information on the operation of the Public Reference Room by calling the SEC at (202) 551-8090. In addition, each code of ethics is available on the SEC’s website at www.sec.gov. You may also obtain copies of the codes of ethics, after paying a duplicating fee, by electronic request at the following Email address: publicinfo@sec.gov, or by writing the SEC’s Public Reference Section, 100 F Street, N.E., Washington, DC 20549. You may also obtain a copy of our code of ethics on our website at www.keatingcapital.com.
Related Parties
We have a number of business relationships with affiliated or related parties. We have entered into the Investment Advisory and Administrative Services Agreement with Keating Investments. Mr. Keating, our President, Chief Executive Officer and Chairman of the Board of Directors, is the Managing Member, the majority owner and an executive officer of Keating Investments. Mr. Rogers, our Chief Investment Officer, and Mr. Schweiger, our Chief Operating Officer, Chief Compliance Officer, Secretary and a director, are also each an executive officer and member of Keating Investments. Mr. Hills, our Chief Financial Officer and Treasurer is also an executive officer of Keating Investments. We have also entered into a license agreement with Keating Investments, pursuant to which Keating Investments has granted us a non-exclusive, royalty-free license to use the name “Keating Capital.”
Currently, our investment adviser’s principals, Messrs. Keating, Rogers and Schweiger, and the investment professionals and administrative personnel currently retained by Keating Investments, do not serve as principals of or provide services to other investment funds affiliated with Keating Investments; however, they may do so in the future. If they do, persons and entities may in the future manage investment funds with investment objective similar to ours. In addition, our current executive officers and directors, serve or may serve as officers, directors or principals of entities that operate in the same or related line of business as we do, including investment funds managed by our affiliates. Accordingly, we may not be given the opportunity to participate in certain investments made by investment funds managed by advisers affiliated with Keating Investments. In the event that Keating Investments or its affiliates provide investment advisory services to other entities, we expect that our management and our independent directors will attempt to resolve any conflicts in a fair and equitable manner taking into account factors that would include the investment objective, amount of assets under management and available for investment in new portfolio companies, portfolio composition and return expectations of us and any other entity, and other factors deemed appropriate. However, in the event such conflicts do arise in the future, Keating Investments intends to allocate investment opportunities in a fair and equitable manner consistent with our investment objective and strategies so that we are not disadvantaged in relation to any other affiliate or client of Keating Investments.
We rely, in part, on Keating Investments to manage our day-to-day activities and to implement our investment strategy. Keating Investments may, in the future, be involved with activities which are unrelated to us. As a result of these activities, Keating Investments, its employees and certain of its affiliates may have conflicts of interest in allocating their time between us and other activities in which they may become involved. Keating Investments and its employees will devote only as much of its time to our business as Keating Investments and its employees, in their judgment, determine is reasonably required, which may be substantially less than their full time. Therefore, Keating Investments, its personnel, and certain affiliates may experience conflicts of interest in allocating management time, services, and functions among us and any other business ventures in which they or any of their key personnel, as applicable, may become involved. This could result in actions that are more favorable to other affiliated entities than to us. In such event, we intend to have our independent directors review our investment adviser’s performance periodically, but not less than annually, to assure that Keating Investments is fulfilling its obligations to us under the Investment Advisory and Administration Agreement, that any conflicts are handled in a fair and equitable manner and that Keating Investments has sufficient personnel to discharge fully its responsibilities to all activities in which they are involved.
As a business development company, we may be limited in our ability to invest in any portfolio company in which any fund or other client managed by Keating Investments, or any of its affiliates has an investment. We may also be limited in our ability to co-invest in a portfolio company with Keating Investments or one or more of its affiliates. Subject to obtaining exemptive relief from the SEC, we also may co-invest with any such investment entity to the extent permitted by the 1940 Act, or the rules and regulations thereunder.
68
Table of Contents
In the ordinary course of business, we may enter into transactions with portfolio companies that may be considered related party transactions. In order to ensure that we do not engage in any prohibited transactions with any persons affiliated with us, we have implemented certain policies and procedures whereby our executive officers screen each of our transactions for any possible affiliations, close or remote, between the proposed portfolio investment, us, companies controlled by us and our employees and directors. We will not enter into any agreements unless and until we are satisfied that no affiliations prohibited by the 1940 Act exist or, if such affiliations exist, we have taken appropriate actions to seek board review and approval or exemptive relief for such transaction. Our Board of Directors reviews these procedures on an annual basis.
The Audit Committee of our Board of Directors is required to review and approve any transactions with related parties (as such term is defined in Item 404 of Regulation S-K).
In addition, our code of business conduct and ethics, which is applicable to all our all employees, officers and directors, requires that all employees, officers and directors avoid any conflict, or the appearance of a conflict, between an individual’s personal interests and our interests. Our code of business conduct and ethics is available on our website at www.keatingcapital.com.
69
Table of Contents
| Item 3. | Quantitative and Qualitative Disclosures about Market Risk |
Our business activities contain elements of risk. We consider the primary type of market risk attributable to us to be valuation risk.
Valuation Risk. Value, as defined in Section 2(a)(41) of the 1940 Act, is (i) the market price for those securities for which market quotations are readily available and (ii) fair value as determined in good faith by, or under the direction of, the Board of Directors for all other assets. (See Note 2, Valuation of Investments, included in “Item 1. Financial Statements”)
Because there is initially no public market for the equity securities of the private companies in which we invest, the valuation of these investments is estimated in good faith by our Board of Directors, in accordance with our valuation procedures. In the absence of a readily ascertainable market value, the estimated value of our portfolio of equity securities may differ significantly from the value that would be placed on the portfolio if a ready market for the equity securities existed. Changes in valuation of these equity securities are recorded in our Statement of Operations as “Net change in unrealized appreciation (depreciation) on investments.” Changes in valuation of any of our investments in privately held companies from one period to another may be volatile.
Interest Rate Risk. As of September 30, 2012, we had cash and cash equivalents of $10,801,679. We primarily invest our cash on hand in money market funds that invest primarily in U.S. Treasury securities, U.S. Government agency securities, and repurchase agreements fully-collateralized by such securities. Cash needed to fund our near-term operating expenses is held in a bank depository account. Based on the investment of cash on hand in these money market funds, pending subsequent investment in portfolio companies in accordance with our investment objective, we have market risk exposure relating to fluctuations in interest rates. During September 2012, our money market funds earned an effective annualized dividend of approximately 0.02%. Assuming no other changes to our holdings of money market funds as of September 30, 2012, a one percentage point change in the underlying dividend rate payable on our money market funds as of September 30, 2012 would not have a material effect on the amount of dividend income earned from our money market funds for the following 90-day period.
We have not engaged in any hedging activities since our inception and we do not expect to engage in any hedging activities with respect to the market risks to which we are exposed. We also do not intend to lend the securities of our publicly traded portfolio companies to generate fee income.
| Item 4. | Controls and Procedures |
As of September 30, 2012 (the end of the period covered by this quarterly report), we, including our Chief Executive Officer and Chief Financial Officer, evaluated the effectiveness of the design and operation of our disclosure controls and procedures (as defined in Rule 13a-15(e) of the 1934 Act). Based on that evaluation, our management, including our Chief Executive Officer and Chief Financial Officer, concluded that our disclosure controls and procedures were effective and provided reasonable assurance that information required to be disclosed in our periodic SEC filings is recorded, processed, summarized and reported within the time periods specified in the SEC’s rules and forms, and that such information is accumulated and communicated to our management, including our Chief Executive Officer and Chief Financial Officer, as appropriate, to allow timely decisions regarding required disclosure. However, in evaluating the disclosure controls and procedures, management recognized that any controls and procedures, no matter how well designed and operated can provide only reasonable assurance of achieving the desired control objectives, and management necessarily was required to apply its judgment in evaluating the cost-benefit relationship of possible controls and procedures.
Management has not identified any change in our internal control over financial reporting that occurred during the third quarter of 2012 that has materially affected, or is reasonably likely to materially affect, our internal control over financial reporting.
70
Table of Contents
PART II – OTHER INFORMATION
| Item 1. | Legal Proceedings |
We are not currently subject to any material legal proceedings, nor, to our knowledge, is any material legal proceeding threatened against us. From time to time, we may be a party to certain legal proceedings in the ordinary course of business, including proceedings relating to the enforcement of our rights under contracts with our portfolio companies. While the outcome of these legal proceedings cannot be predicted with certainty, we do not expect that these proceedings will have a material effect upon our financial condition or results of operations.
| Item 1A. | Risk Factors |
Except as described below, there has been no material changes during the nine months ended September 30, 2012 to the risk factors discussed in Item 1A. Risk Factors in our Annual Report on Form 10-K for the year ended December 31, 2011.
We may not succeed in negotiating structural protections for our investments, and cannot assure you that we will realize gains from structural protections in our investments.
As part of our investment strategy, our investment adviser may attempt to negotiate structural protections that are expected to provide for an enhanced return upon an IPO event or otherwise enhance our ability to meet our targeted return on our portfolio company investments. Such structural protections may include conversion rights which would result in us receiving shares of common stock at a discount to the IPO price upon conversion at the time of the IPO, or warrants that would result in us receiving additional shares for a nominal exercise price at the time of an IPO. We have negotiated structural protections of this type in nine of our 18 private portfolio company investments as of September 30, 2012, excluding our previous BrightSource structurally protected appreciation since we no longer have structural protection on that investment due to a private equity financing by BrightSource subsequent to September 30, 2012.
There can be no assurance that our investment adviser will succeed in negotiating structural protections for our future investments. Even if it succeeds in obtaining such protections, our ability to realize the value of these structural protections (which we sometimes refer to as “structurally protected appreciation”) will depend on a number of factors including the completion of the IPO, any adjustment to the terms of the structural protection that may be negotiated during the IPO process, and the possible subsequent issuance of more senior securities that may impact the relative value of our investment. Further, even if an IPO is completed, we would not realize any structurally protected appreciation unless the market price of the portfolio company’s common shares equaled or exceeded the IPO price at the time such shares were disposed of following the lockup period. Further, our ability to realize any structurally protected appreciation at the time of a sale or liquidation of a portfolio company will depend on a number of factors including the completion of a sale or liquidation, the realization of sales or liquidation proceeds (after payment of liabilities) sufficient to pay our senior preference amount, any adjustment to our preference amount that may be negotiated prior to any sale or liquidation, and the possible subsequent issuance of more senior securities that may make our preference rights subordinate to the preference rights of senior security holders. As a result, there can be no assurance that we will be able to realize the potential value of these structural protections even if we are able to obtain them.
Some of our portfolio companies are subject to complex regulation, and any compliance failures or regulatory action could materially adversely affect their business.
The businesses of some our of portfolio companies are subject to extensive, complex and continually changing federal and state laws and regulations and the regulations of foreign agencies. If these companies fail to comply with any applicable law, rule or regulation, they could be subject to fines and penalties, indemnification claims by their clients, or become the subject of a regulatory agency enforcement action, each of which would materially adversely affect their business and reputation.
These companies may also become subject to additional regulatory and compliance requirements as a result of changes in laws or regulations, or as a result of any expansion or enhancement of our existing products and services or any new products or services they may offer in the future. Compliance with any new regulatory requirements may divert internal resources and take significant time and effort. Their compliance processes may not be sufficient to prevent assertions that they failed to comply with any applicable law, rule or regulation.
Any claims of noncompliance brought against our portfolio companies, regardless of merit or ultimate outcome, could subject them to investigation by the Department of Labor, the Federal Trade Commission, Internal Revenue Service, the Treasury Department or other federal and state regulatory authorities, which could result in substantial costs to them and divert management’s attention and other resources away from their operations. In addition, investor perceptions of the subject company may suffer and could cause a decline in the market price of their securities, reducing the value of our investments in them.
71
Table of Contents
If our common stock trades below its net asset value per share, our ability to raise additional equity capital will be adversely affected, and any offering of our common stock at a price below net asset value will result in immediate dilution to existing stockholders upon the closing of any such offering.
We are not generally able to issue and sell our common stock at a price below net asset value per share. We may, however, sell our common stock, or warrants, options or rights to acquire our common stock, at a price below the then-current net asset value of our common stock if our Board of Directors determines that such sale is in the best interests of Keating Capital and its stockholders, and our stockholders approve such sale. In this regard, at our 2012 Annual Meeting of Stockholders our stockholders approved a proposal to sell or otherwise issue up to 50% of our outstanding common stock at a price below our net asset value per share at the time of such issuance. Our Board of Directors has also adopted a policy which prohibits us from selling or issuing shares of our common stock at an offering price per share which represents a discount to the then current net asset value per share of more than 15%.
If our common stock trades below net asset value, the higher dilution to our existing stockholders may result in it being unattractive to raise new equity, which may limit our ability to grow. The risk of trading below net asset value is separate and distinct from the risk that our net asset value per share may decline.
If we were to issue shares at a price below net asset value, such sales would result in an immediate dilution to existing common stockholders, which would include a reduction in the net asset value per share as a result of the issuance. This dilution would also include a proportionately greater decrease in a stockholder’s interest in our earnings and assets and voting interest in us than the increase in our assets resulting from such issuance.
In addition, if we determine to conduct additional offerings in the future there may be even greater discounts if we determine to conduct such offerings at prices below net asset value. As a result, existing stockholders would experience further dilution and additional discounts to the price of our common stock. Because the number of shares of common stock that could be so issued and the timing of any issuance is not currently known, the actual dilutive effect of an offering cannot be predicted.
72
Table of Contents
A portion of our distributions may constitute a return of capital and affect our stockholders’ tax basis in our shares.
We plan to make distributions from any assets legally available for distribution and will be required to determine the extent to which such distributions are paid out of current or accumulated earnings, realized capital gains or are returns of capital. To the extent there is a return of capital, investors will be required to reduce their basis in our stock for federal tax purposes, which will result in higher tax liability when the shares are sold, even if they have not increased in value or have lost value. In addition, any return of capital paid out of offering proceeds will be net of any sales load and offering expenses associated with sales of shares of our common stock.
If we sell common stock at a discount to our net asset value per share, stockholders who do not participate in such sale will experience immediate dilution in an amount that may be material.
At our 2012 Annual Meeting of Stockholders, our stockholders approved a proposal to sell or otherwise issue up to 50% of our outstanding common stock at a price below our net asset value per share at the time of such issuance. Our Board of Directors has also adopted a policy which prohibits us from selling or issuing shares of our common stock at an offering price per share which represents a discount to the then current net asset value per share of more than 15%. No change can be made to this policy without unanimous approval of our independent directors. We cannot issue shares of our common stock at a price below net asset value unless our Board of Directors determines that it would be in our and our stockholders’ best interests to do so. The issuance or sale by us of shares of our common stock at a discount to net asset value poses a risk of dilution to our stockholders. In particular, stockholders who do not purchase additional shares of common stock at or below the discounted price in proportion to their current ownership will experience an immediate decrease in net asset value per share (as well as in the aggregate net asset value of their shares of common stock if they do not participate at all). These stockholders will also experience a disproportionately greater decrease in their participation in our earnings and assets and their voting power than the increase we experience in our assets, potential earning power and voting interests from such issuance or sale. In addition, such sales may adversely affect the price at which our common stock trades.
| Item 2. | Unregistered Sales of Equity Securities and Use of Proceeds |
We did not engage in any unregistered sales of equity securities during the three months ended September 30, 2012. Details of the monthly share repurchases under our stock repurchase program during the three months ended September 30, 2012 are set forth in the table below.
| Period |
Total Number of Shares Repurchased |
Total Cost of Shares Repurchased |
Average Price Paid per Share |
Total Number of Shares Purchased as Part of the Publicly Announced Program (1) |
Total Cost of Shares Purchased as Part of the Publicly Announced Program (1) |
Maximum Dollar Value of Shares that May Yet be Purchased Under the Program (1) |
||||||||||||||||||
| July 2012 |
— | $ | — | $ | — | — | $ | — | $ | 4,722,802 | ||||||||||||||
| August 2012 |
5,469 | 38,648 | 7.07 | 5,469 | 38,648 | 4,684,154 | ||||||||||||||||||
| September 2012 |
26,013 | 193,097 | 7.42 | 26,013 | 193,097 | 4,491,057 | ||||||||||||||||||
| Total - Q3 2012 |
31,482 | $ | 231,745 | $ | 7.36 | 31,482 | $ | 231,745 | ||||||||||||||||
| (1) | On May 9, 2012, the Company’s Board of Directors authorized a stock repurchase program of up to $5.0 million. The stock repurchase program was originally set to expire on November 8, 2012; however, on October 26, 2012, our Board of Directors extended our stock repurchase program for an additional six months. The program will now expire on May 8, 2013, unless extended further by our Board of Directors. |
Since the inception of our stock repurchase program in May 2012, we have repurchased 70,470 shares of our common stock at an average price of $7.22 per share, including commissions, for a total cost of $508,943.
| Item 3. | Defaults upon Senior Securities |
Not applicable.
| Item 4. | Mine Safety Disclosures |
Not applicable.
| Item 5. | Other Information |
None.
73
Table of Contents
| Item 6. | Exhibits. |
| 3.1 | Amended and Restated Articles of Incorporation (Incorporated by reference to Post-Effective Amendment No. 1 to the Registrant’s Registration Statement on Form N-2 (File No. 333-157217), filed on April 21, 2010) | |
| 3.2 | Articles of Amendment to Amended and Restated Articles of Incorporation (Incorporated by reference to Post-Effective Amendment No. 3 to the Registrant’s Registration Statement on Form N-2 (File No. 333-157217), filed on May 27, 2010) | |
| 3.3 | Amended and Restated Bylaws (Incorporated by reference to the Registrant’s Current Report on Form 8-K (File No. 0-53504), filed on April 23, 2009) | |
| 3.4 | Amendment to Bylaws dated August 5, 2010 (Incorporated by reference to the Registrant’s Current Report on Form 8-K (File No. 0-53504), filed on August 9, 2010) | |
| 3.5 | Amendment to Bylaws dated October 22, 2010 (Incorporated by reference to the Registrant’s Current Report on Form 8-K (File No. 0-53504), filed on October 26, 2010) | |
| 3.6 | Amended and Restated Dividend Reinvestment Plan (Incorporated by reference to the Registrant’s Quarterly Report on Form 10-Q (File No. 0-53504), filed on August 12, 2011) | |
| 4.1 | Form of Share Certificate (Incorporated by reference to the Registrant’s Annual Report on Form 10-K (File No. 0-53504), filed on March 9, 2009) | |
| 10.1 | Form of Amended and Restated Investment Advisory and Administrative Services Agreement (Incorporated by reference to Amendment No. 1 to the Registrant’s Registration Statement on Form N-2 (File No. 333-157217), filed on May 1, 2009) | |
| 10.2 | License Agreement between the Company and Keating Investments, LLC (Incorporated by reference to the Registrant’s Registration Statement on Form 10 (File No. 0-53504), filed on November 20, 2008) | |
| 10.3 | Form of Indemnification Agreement for Directors (Incorporated by reference to Amendment No. 2 to the Registrant’s Registration Statement on Form N-2 (File No. 333-157217), filed on June 5, 2009) | |
| 10.4 | Custody Agreement between the Company and Steele Street Bank & Trust (Incorporated by reference to the Registrant’s Registration Statement on Form 10 (File No. 0-53504), filed on November 20, 2008) | |
| 11 | Computation of Per Share Earnings (included in the notes to the unaudited financial statements contained in this report) | |
| 31.1* | Certification of Chief Executive Officer pursuant to Rule 13a-14 of the Securities Exchange Act of 1934, as amended. | |
| 31.2* | Certification of Chief Financial Officer pursuant to Rule 13a-14 of the Securities Exchange Act of 1934, as amended. | |
| 32.1* | Certification of Chief Executive Officer pursuant to Section 906 of The Sarbanes-Oxley Act of 2002. | |
| 32.2* | Certification of Chief Financial Officer pursuant to Section 906 of The Sarbanes-Oxley Act of 2002. | |
| * | Filed herewith. | |
74
Table of Contents
Pursuant to the requirements of Section 13 or 15(d) of the Securities Exchange Act of 1934, the Registrant has duly caused the report to be signed on its behalf by the undersigned, thereunto duly authorized.
| Date: October 26, 2012 |
KEATING CAPITAL, INC. | |||||||
| By: | /S/ TIMOTHY J. KEATING | |||||||
| Timothy J. Keating President and Chief Executive Officer (Principal Executive Officer) | ||||||||
| By: | /S/ STEPHEN M. HILLS | |||||||
| Stephen M. Hills Chief Financial Officer and Treasurer (Principal Accounting and Financial Officer) | ||||||||
75