Attached files
| file | filename |
|---|---|
| EX-31.1 - EXHIBIT 31.1 - CROSSROADS LIQUIDATING TRUST | a50058708ex31-1.htm |
| EX-31.2 - EXHIBIT 31.2 - CROSSROADS LIQUIDATING TRUST | a50058708ex31-2.htm |
| EX-32.1 - EXHIBIT 32.1 - CROSSROADS LIQUIDATING TRUST | a50058708ex32-1.htm |
| EX-32.2 - EXHIBIT 32.2 - CROSSROADS LIQUIDATING TRUST | a50058708ex32-2.htm |
UNITED STATES
SECURITIES AND EXCHANGE COMMISSION
WASHINGTON, D.C. 20549
FORM 10-Q
|
x
|
QUARTERLY REPORT PURSUANT TO SECTION 13 OR 15(d) OF THE SECURITIES EXCHANGE ACT OF 1934
|
FOR THE QUARTER ENDED SEPTEMBER 30, 2011.
|
¨
|
TRANSITION REPORT PURSUANT TO SECTION 13 OR 15(d) OF THE SECURITIES EXCHANGE ACT OF 1934
|
COMMISSION FILE NUMBER: 0-53504
KEATING CAPITAL, INC.
(Exact name of registrant as specified in its charter)
|
Maryland
|
26-2582882
|
|
|
(State or other jurisdiction of
incorporation or organization)
|
(I.R.S. Employer
Identification No.)
|
5251 DTC Parkway, Suite 1100
Greenwood Village, CO 80111
(Address of principal executive office)
(720) 889-0139
(Registrant’s telephone number, including area code)
Indicate by check mark whether the registrant (1) has filed all reports required to be filed by Section 13 or 15(d) of the Securities Exchange Act of 1934 during the preceding 12 months (or for such shorter period that the registrant was required to file such reports), and (2) has been subject to such filing requirements for the past 90 days. Yes x No ¨.
Indicate by check mark whether the registrant has submitted electronically and posted on its corporate Web site, if any, every Interactive Data File required to be submitted and posted pursuant to Rule 405 of Regulation S-T (§232.405 of this chapter) during the preceding 12 months (or for such shorter period that the registrant was required to submit and post such files). Yes o No o
Indicate by check mark whether the registrant is a large accelerated filer, an accelerated filer, a non-accelerated filer, or a smaller reporting company. See definition of “accelerated filer,” “large accelerated filer” and “smaller reporting company” in Rule 12b-2 of the Exchange Act. (Check one):
| Large accelerated filer o |
Accelerated filer ¨
|
|
| Non-accelerated filer x |
Smaller reporting company ¨
|
|
| (Do not check if a smaller reporting company) |
Indicate by check mark whether the registrant is a shell company (as defined in Rule 12b-2 of the Exchange Act). Yes ¨ No x.
Indicate the number of shares outstanding of each of the issuer’s classes of common stock, as of the latest practicable date.
The number of shares of the issuer’s Common Stock, $0.001 par value, outstanding as of November 8, 2011 was 9,283,604.
TABLE OF CONTENTS
| 1 | |||||
| 1 | |||||
| 2 | |||||
| 3 | |||||
| 4 | |||||
| 5 | |||||
| 7 | |||||
| 8 | |||||
| 9 | |||||
| 24 | |||||
| 53 | |||||
| 53 | |||||
|
|
|||||
| 54 | |||||
| 54 | |||||
| 55 | |||||
| 55 | |||||
| 55 | |||||
| 56 | |||||
| 57 | |||||
|
|
58 | ||||
i
|
Financial Statements
|
Statement of Assets and Liabilities
(Unaudited)
| September 30, | December 31, | |||||||
| 2011 | 2010 | |||||||
|
Assets
|
||||||||
|
Investments in portfolio company securities at fair value:
|
||||||||
|
Non-control/non-affiliate investments:
|
||||||||
|
Private portfolio companies
|
||||||||
|
(Cost: $21,356,850 and $3,600,491, respectively)
|
$ | 21,115,681 | $ | 4,177,607 | ||||
|
Publicly-traded portfolio companies
|
||||||||
|
(Cost: $1,999,991 and $0, respectively)
|
2,078,000 | - | ||||||
|
Affiliate investments:
|
||||||||
|
Private portfolio companies
|
||||||||
|
(Cost: $8,000,080 and $0, respectively)
|
8,726,000 | - | ||||||
|
Total, investments in portfolio company securities at fair value
|
31,919,681 | 4,177,607 | ||||||
|
Short-term investments at fair value
|
||||||||
|
(Cost: $0 and $13,500,000, respectively)
|
- | 13,500,000 | ||||||
|
Cash and cash equivalents
|
45,082,822 | 4,753,299 | ||||||
|
Prepaid expenses and other assets
|
100,363 | 92,125 | ||||||
|
Deferred offering costs
|
- | 333,682 | ||||||
|
Total Assets
|
77,102,866 | 22,856,713 | ||||||
|
Liabilities
|
||||||||
|
Base management fees payable to Investment Adviser
|
129,512 | 90,631 | ||||||
|
Accrued incentive fees payable to Investment Adviser
|
112,552 | 115,423 | ||||||
|
Administrative expenses payable to Investment Adviser
|
32,792 | 41,348 | ||||||
|
Reimbursable expenses payable to Investment Adviser
|
- | 3,068 | ||||||
|
Accounts payable
|
49,356 | 80,275 | ||||||
|
Accrued expenses and other liabilities
|
28,304 | 69,568 | ||||||
|
Total Liabilities
|
352,516 | 400,313 | ||||||
|
Net Assets
|
$ | 76,750,350 | $ | 22,456,400 | ||||
|
Components of Net Assets:
|
||||||||
|
Common stock, $0.001 par value; 200,000,000 shares authorized;
|
||||||||
|
9,283,604 and 2,860,299 shares issued and outstanding as of
|
||||||||
|
September 30, 2011 and December 31, 2010, respectively
|
$ | 9,284 | $ | 2,860 | ||||
|
Additional paid-in capital
|
82,693,321 | 25,378,355 | ||||||
|
Accumulated undistributed net investment loss
|
(6,068,178 | ) | (3,501,931 | ) | ||||
|
Accumulated distributions in excess of net realized gains on investments
|
(446,837 | ) | - | |||||
|
Net unrealized appreciation on investments
|
562,760 | 577,116 | ||||||
|
Net Assets
|
$ | 76,750,350 | $ | 22,456,400 | ||||
|
Common Shares Outstanding
|
9,283,604 | 2,860,299 | ||||||
|
Net Asset Value Per Outstanding Common Share
|
$ | 8.27 | $ | 7.85 | ||||
The accompanying notes are an integral part of these financial statements.
1
|
Three Months Ended
|
Nine Months Ended
|
|||||||||||||||
|
September 30,
|
September 30,
|
September 30,
|
September 30,
|
|||||||||||||
|
2011
|
2010
|
2011
|
2010
|
|||||||||||||
|
Investment Income
|
||||||||||||||||
|
Interest and dividend income:
|
||||||||||||||||
|
Certificate of deposit and money market investments
|
$ | 6,382 | $ | 12,428 | $ | 49,660 | $ | 26,047 | ||||||||
|
Other income
|
- | - | - | 10,000 | ||||||||||||
|
Total Investment Income
|
6,382 | 12,428 | 49,660 | 36,047 | ||||||||||||
|
Operating Expenses
|
||||||||||||||||
|
Base management fees
|
389,007 | 59,709 | 764,375 | 128,245 | ||||||||||||
|
Incentive fees (decrease)
|
(155,391 | ) | - | (2,871 | ) | - | ||||||||||
|
Administrative expenses allocated from Investment Adviser
|
96,757 | 112,921 | 330,263 | 284,761 | ||||||||||||
|
Legal and professional fees
|
89,337 | 45,063 | 357,135 | 244,580 | ||||||||||||
|
Directors' fees
|
31,289 | 25,250 | 90,289 | 82,750 | ||||||||||||
|
Stock transfer agent fees
|
40,555 | 48,362 | 163,215 | 142,642 | ||||||||||||
|
Printing and fulfillment expenses
|
23,444 | 26,757 | 152,583 | 48,938 | ||||||||||||
|
Postage and delivery expenses
|
7,201 | 19,310 | 136,696 | 43,627 | ||||||||||||
|
Stock issuance expenses
|
1,625 | 8,747 | 114,388 | 115,940 | ||||||||||||
|
General and administrative expenses
|
65,772 | 80,495 | 509,834 | 172,141 | ||||||||||||
|
Total Operating Expenses
|
589,596 | 426,614 | 2,615,907 | 1,263,624 | ||||||||||||
|
Net Investment Loss
|
(583,214 | ) | (414,186 | ) | (2,566,247 | ) | (1,227,577 | ) | ||||||||
|
Net Change in Unrealized Appreciation (Depreciation) on Investments
|
||||||||||||||||
|
Non-control/non-affiliate investments
|
(1,502,874 | ) | 27,364 | (740,276 | ) | 577,364 | ||||||||||
|
Affiliate investments
|
725,920 | - | 725,920 | - | ||||||||||||
|
Net Change in Unrealized Appreciation (Depreciation) On Investments
|
(776,954 | ) | 27,364 | (14,356 | ) | 577,364 | ||||||||||
|
Net Decrease in Net Assets Resulting From Operations
|
$ | (1,360,168 | ) | $ | (386,822 | ) | $ | (2,580,603 | ) | $ | (650,213 | ) | ||||
|
Net Decrease in Net Assets Resulting from Operations
|
||||||||||||||||
|
Per Common Share
|
$ | (0.15 | ) | $ | (0.26 | ) | $ | (0.42 | ) | $ | (0.59 | ) | ||||
|
Weighted Average Number of Common Shares Outstanding:
|
||||||||||||||||
|
Basic and Diluted
|
9,103,658 | 1,493,101 | 6,125,439 | 1,097,041 | ||||||||||||
The accompanying notes are an integral part of these financial statements.
2
Statements of Changes in Net Assets
(Unaudited)
|
Nine Months Ended
|
||||||||
|
September 30,
|
September 30,
|
|||||||
|
2011
|
2010
|
|||||||
|
Changes in Net Assets from Operations
|
||||||||
|
Net investment loss
|
$ | (2,566,247 | ) | $ | (1,227,577 | ) | ||
|
Net change in unrealized appreciation (depreciation) on investments
|
(14,356 | ) | 577,364 | |||||
|
Net Decrease in Net Assets Resulting from Operations
|
(2,580,603 | ) | (650,213 | ) | ||||
|
Changes in Net Assets from Stockholder Distributions
|
||||||||
|
Distributions in excess of net realized gains on investments
|
(446,837 | ) | - | |||||
|
Net Decrease in Net Assets Resulting from Stockholder Distributions
|
(446,837 | ) | - | |||||
|
Changes in Net Assets from Capital Stock Transactions
|
||||||||
|
Issuance of common stock in continuous public offering (1)
|
63,990,347 | 11,884,658 | ||||||
|
Offering costs from issuance of common stock
|
(6,180,594 | ) | (1,147,023 | ) | ||||
|
Amortization of deferred offering costs
|
(488,363 | ) | (327,014 | ) | ||||
|
Net Increase in Net Assets Resulting From Capital Stock Transactions
|
57,321,390 | 10,410,621 | ||||||
|
Net Increase in Net Assets
|
54,293,950 | 9,760,408 | ||||||
|
Net assets at beginning of period
|
22,456,400 | 3,719,496 | ||||||
|
Net Assets at End of Period (2)
|
$ | 76,750,350 | $ | 13,479,904 | ||||
|
(1)
|
All shares were sold at a price of either $9.30 or $10.00, depending on whether or not sales commissions were waived by the dealer manager.
|
|
(2)
|
Net Assets at September 30, 2011 and 2010 include no accumulated undistributed net investment income and no accumulated undistributed net realized gains.
|
The accompanying notes are an integral part of these financial statements.
3
|
Nine Months Ended
|
||||||||
|
September 30,
|
September 30,
|
|||||||
|
2011
|
2010
|
|||||||
|
Cash Flows From Operating Activities
|
||||||||
|
Net decrease in net assets resulting from operations
|
$ | (2,580,603 | ) | $ | (650,213 | ) | ||
|
Adjustments to reconcile net decrease in net assets resulting from operations
|
||||||||
|
to net cash used in operating activities:
|
||||||||
|
Net change in unrealized depreciation (appreciation) on investments
|
14,356 | (577,364 | ) | |||||
|
Changes in operating assets and liabilities:
|
||||||||
|
(Increase) in prepaid expenses and other assets
|
(8,238 | ) | (52,339 | ) | ||||
|
Increase in base management fees payable to Investment Adviser
|
38,881 | 30,241 | ||||||
|
(Decrease) in accrued incentive fees payable to Investment Adviser
|
(2,871 | ) | - | |||||
|
(Decrease) increase in administrative expenses payable to Investment Adviser
|
(8,556 | ) | 45,785 | |||||
|
(Decrease) in reimbursable expenses payable to Investment Adviser
|
(3,068 | ) | (18,063 | ) | ||||
|
(Decrease) increase in accounts payable
|
(30,919 | ) | 16,964 | |||||
|
(Decrease) increase in accrued expenses and other liabilities
|
(41,264 | ) | 3,240 | |||||
|
Net cash used in operating activities
|
(2,622,282 | ) | (1,201,749 | ) | ||||
|
Cash Flows From Investing Activities
|
||||||||
|
Investments in portfolio companies
|
(27,756,430 | ) | (2,500,491 | ) | ||||
|
Purchases of short-term investments
|
(89,000,000 | ) | (52,500,000 | ) | ||||
|
Proceeds from maturities of short-term investments
|
102,500,000 | 47,500,000 | ||||||
|
Net cash provided by (used in) investing activities
|
(14,256,430 | ) | (7,500,491 | ) | ||||
|
Cash Flows From Financing Activities
|
||||||||
|
Gross proceeds from issuance of common stock
|
63,990,347 | 11,884,658 | ||||||
|
Offering costs from issuance of common stock
|
(6,180,594 | ) | (1,147,023 | ) | ||||
|
Additions to deferred stock offering costs
|
(154,681 | ) | (210,875 | ) | ||||
|
Stockholder distributions
|
(446,837 | ) | - | |||||
|
Net cash provided by financing activities
|
57,208,235 | 10,526,760 | ||||||
|
Net increase in cash and cash equivalents
|
40,329,523 | 1,824,520 | ||||||
|
Cash and cash equivalents, beginning of period
|
4,753,299 | 367,918 | ||||||
|
Cash and cash equivalents, end of period
|
$ | 45,082,822 | $ | 2,192,438 | ||||
|
Supplemental Disclosure of Non-Cash Financing Activities
|
||||||||
|
Amortization of deferred offering costs
|
$ | 488,363 | $ | 327,014 | ||||
The accompanying notes are an integral part of these financial statements.
4
|
% of
|
||||||||||||||||||||
|
Portfolio Company
|
Industry / Description
|
Type of Investment
|
Shares
|
Cost
|
Fair Value
|
Net Assets
|
||||||||||||||
|
Non-Control/Non-Affiliate Investments (1)
|
||||||||||||||||||||
|
Private Portfolio Companies:
|
||||||||||||||||||||
|
Livescribe, Inc.
|
Technology - Consumer Electronics
|
Series C Convertible Preferred Stock (3)(4)
|
1,000,000 | 471,295 | 257,000 | 0.33 | % | |||||||||||||
|
Series C Convertible Preferred Stock Warrants (7)
|
125,000 | 29,205 | 6,229 | 0.01 | % | |||||||||||||||
|
Series C-1 Convertible Preferred Stock (3)(4)
|
54,906 | 25,925 | 14,001 | 0.02 | % | |||||||||||||||
|
Series C-1 Convertible Preferred Stock Warrants (8)
|
6,863 | 1,556 | 426 | 0.00 | % | |||||||||||||||
|
MBA Polymers, Inc.
|
Cleantech - Plastics Recycling
|
Series G Convertible Preferred Stock (3)(4)
|
2,000,000 | 2,000,000 | 2,000,000 | 2.61 | % | |||||||||||||
|
BrightSource Energy, Inc.
|
Cleantech - Solar Thermal Energy
|
Series E Convertible Preferred Stock (3)(4)
|
288,531 | 2,500,006 | 2,500,006 | 3.26 | % | |||||||||||||
|
Harvest Power, Inc.
|
Cleantech - Waste Management
|
Series B Convertible Preferred Stock (3)(5)
|
580,496 | 2,499,999 | 2,499,999 | 3.26 | % | |||||||||||||
|
Suniva, Inc.
|
Cleantech - Solar Photovoltaic Cells
|
Series D Convertible Preferred Stock (3)(4)
|
197,942 | 2,500,007 | 2,500,007 | 3.26 | % | |||||||||||||
|
Xtime, Inc.
|
Internet & Software - Software as a Service
|
Series F Convertible Preferred Stock (3)(4)
|
1,573,234 | 3,000,000 | 3,000,000 | 3.91 | % | |||||||||||||
|
Common Stock Warrants (9)
|
22,581 | - | 9,156 | 0.01 | % | |||||||||||||||
|
Kabam, Inc.
|
Internet & Software - Online Multiplayer Games
|
Series D Convertible Preferred Stock (3)(4)
|
1,046,017 | 1,328,860 | 1,328,860 | 1.73 | % | |||||||||||||
|
Tremor Video, Inc.
|
Internet & Software - Online Video Advertising
|
Series F Convertible Preferred Stock (3)(4)
|
642,994 | 4,000,001 | 4,000,001 | 5.20 | % | |||||||||||||
|
TrueCar, Inc.
|
Internet & Software - Consumer Website
|
Common Stock (6)
|
566,037 | 2,999,996 | 2,999,996 | 3.91 | % | |||||||||||||
|
Subtotal - Non-Control/Non-Affiliate Investments, Private Portfolio Companies
|
$ | 21,356,850 | $ | 21,115,681 | 27.51 | % | ||||||||||||||
|
Publicly-Traded Portfolio Companies:
|
||||||||||||||||||||
|
NeoPhotonics Corporation
|
Technology - Communications Equipment
|
Common Stock (11)
|
160,000 | 1,000,000 | 1,101,000 | 1.43 | % | |||||||||||||
|
Solazyme, Inc.
|
Cleantech - Renewable Oils and Bioproducts
|
Common Stock (12)
|
112,927 | 999,991 | 977,000 | 1.27 | % | |||||||||||||
|
Subtotal - Non-Control/Non-Affiliate Investments, Publicly-Traded Portfolio Companies
|
$ | 1,999,991 | $ | 2,078,000 | 2.70 | % | ||||||||||||||
|
Affiliate Investments (1)
|
||||||||||||||||||||
|
Private Portfolio Companies:
|
||||||||||||||||||||
|
Metabolon, Inc.
|
Technology - Molecular Diagnostics and Services
|
Series D Convertible Preferred Stock (3)(4)
|
2,229,021 | 4,000,000 | 4,000,000 | 5.21 | % | |||||||||||||
|
Corsair Components, Inc.
|
Technology - PC Gaming Hardware
|
Common Stock (6)
|
3,200,000 | 3,411,080 | 4,096,000 | 5.34 | % | |||||||||||||
|
Common Stock Warrants (10)
|
800,000 | 589,000 | 630,000 | 0.82 | % | |||||||||||||||
|
Subtotal - Affiliate Investments, Private Portfolio Companies
|
$ | 8,000,080 | $ | 8,726,000 | 11.37 | % | ||||||||||||||
|
Total - Investments in Portfolio Company Securities (2)
|
$ | 31,356,921 | $ | 31,919,681 | 41.59 | % | ||||||||||||||
The accompanying notes are an integral part of these financial statements.
5
Schedule of Investments
September 30, 2011
(Unaudited)
|
% of
|
|||||
|
Reconciliation to Net Assets
|
Amount
|
Net Assets
|
|||
|
Investments in portfolio company securities at fair value
|
$ |
31,919,681
|
41.59%
|
||
|
Cash and cash equivalents
|
45,082,822
|
58.74%
|
|||
|
Prepaid expenses and other assets
|
100,363
|
0.13%
|
|||
|
Less: Total Liabilities
|
(352,516)
|
-0.46%
|
|||
|
Net Assets
|
$ |
76,750,350
|
100.00%
|
||
|
(1)
|
Control investments are defined by the Investment Company Act of 1940, as amended (the "1940 Act"), as investments in which more than 25% of the voting securities are owned or where the ability to nominate greater
|
|
than 50% of the board representation is maintained. Affiliate investments are defined by the 1940 Act as investments in which between 5% and 25% of the voting securities are owned.
|
|
|
Non-Control/Non-Affiliate investments are defined by the 1940 Act as investments that are neither Control Investments nor Affiliate Investments.
|
|
|
(2)
|
The aggregate cost basis for federal income tax purposes of investments in portfolio company securities is $31,356,921. The gross unrealized appreciation based on the tax cost basis of these securities is $836,076.
|
|
The gross unrealized depreciation based on the tax cost basis of these securities is $273,316. The net unrealized appreciation based on the tax cost basis of these securities is $562,760.
|
|
|
(3)
|
The shares of common and preferred stock represented by these investments are subject to legal restrictions on transfer pursuant to the Securities Act of 1933, as amended (the "Securities Act") and may only be sold
|
|
pursuant to a registration statement under the Securities Act or an available exemption from registration thereunder. These shares are also subject to a contractual lockup for a period of six months following completion of an
|
|
|
initial public offering.
|
|
|
(4)
|
The shares of preferred stock represented by these investments carry a non-cumulative, preferred dividend payable when and if declared by the portfolio company's board of directors.
|
|
Since no dividends have been declared or paid with respect to these investments, these investments are considered to be non-income producing.
|
|
|
(5)
|
The shares of preferred stock represented by this investment carry a cumulative preferred dividend, which is payable only when declared by the portfolio company's board of directors or upon a qualifying liquidation event.
|
|
Since no dividends have been declared or paid with respect to this investment, this investment is considered to be non-income producing.
|
|
|
(6)
|
The shares of common stock represented by these investments are considered to be non-income producing.
|
|
(7)
|
The warrants grant the holder the right to purchase shares of Series C convertible preferred stock at an exercise price of $0.50 per share, have a contractual life of five years, and expire on June 30, 2015.
|
|
(8)
|
The warrants grant the holder the right to purchase shares of Series C-1 convertible preferred stock at an exercise price of $0.50 per share, have a contractual life of five years, and expire on July 8, 2016.
|
|
(9)
|
The warrants grant the holder the right to purchase shares of common stock at an exercise price of $0.01 per share, have a contractual life of seven years, and expire on August 24, 2018. In the event the issuer completes a qualifying IPO, the number of warrants will be reduced by 50%.
|
|
(10)
|
The warrants grant the holder the right to purchase up to 800,000 shares of common stock from certain selling stockholders at an exercise price of $0.01 per share. The warrants expire on the earlier of: (i) the consummation of an
an initial public offering ("IPO") by Corsair Components, Inc. ("Corsair") at an offering price of at least $2.50 per share of common stock, (ii) upon a sale of Corsair which results in holders of Corsair common stock receiving
net sales proceeds of at least $2.50 per share, or (iii) July 6, 2016. The warrants are exercisable only upon: (i) Corsair completing an IPO of its common stock at an offering price of less than $2.50 per share, (ii) a sale of Corsair which results in holders of Corsair common stock receiving net sales proceeds of less than $2.50 per share, and (iii) if Corsair does not complete an IPO or sale prior to July 6, 2016, the warrants will be deemed to have been automatically exercised on such date. If the warrants become exercisable as a result of an IPO or sale of Corsair, the number of warrants will be proportionately decreased from 800,000 to the extent that the IPO price or net sales proceeds, as the case may be, exceeds $2.00 per share but is less than $2.50 per share, and the number of warrants will be reduced to zero if the IPO price or net sale proceeds, as the case may be, equals or exceeds $2.50 per share.
|
|
(11)
|
On February 2, 2011, NeoPhotonics completed an initial public offering of its common stock at a price of $11.00 per share. Immediately prior to the initial public offering, the Company’s Series X convertible preferred stock
|
|
converted into 160,000 shares of NeoPhotonics common stock, which common shares were subject to a 180 day lockup provision that expired in August 2011.
|
|
|
(12)
|
On May 27, 2011, Solazyme completed an initial public offering of its common stock at a price of $18.00 per share. Immediately prior to the initial public offering, the Company’s Series D convertible preferred stock
|
|
converted into 112,927 shares of Solazyme common stock, which common shares are subject to a 180 day lockup provision expiring in November 2011.
|
The accompanying notes are an integral part of these financial statements.
6
|
% of
|
||||||||||||||||||||
|
Portfolio Company
|
Industry / Description
|
Type of Investment
|
Shares
|
Cost
|
Fair Value
|
Net Assets
|
||||||||||||||
|
Non-Control/Non-Affiliate Investments (1)
|
||||||||||||||||||||
|
Private Portfolio Companies:
|
||||||||||||||||||||
|
NeoPhotonics Corporation
|
Technology - Communications Equipment
|
Series X Convertible Preferred Stock (3)(4)(7)
|
10,000 | $ | 1,000,000 | $ | 1,550,000 | 6.90 | % | |||||||||||
|
Livescribe, Inc.
|
Technology - Consumer Electronics
|
Series C Convertible Preferred Stock (3)(4)
|
1,000,000 | 471,295 | 500,000 | 2.23 | % | |||||||||||||
| Series C Convertible Preferred Stock Warrants (5) | 125,000 | 29,205 | 27,616 | 0.12 | % | |||||||||||||||
|
Solazyme, Inc.
|
Cleantech - Renewable Oils and Bioproducts
|
Series D Convertible Preferred Stock (3)(4)
|
112,927 | 999,991 | 999,991 | 4.45 | % | |||||||||||||
|
MBA Polymers, Inc.
|
Cleantech - Plastics Recycling
|
Series G Convertible Preferred Stock (3)(4)
|
1,100,000 | 1,100,000 | 1,100,000 | 4.90 | % | |||||||||||||
|
Total - Investments in Portfolio Company Securities (2)
|
$ | 3,600,491 | $ | 4,177,607 | 18.60 | % | ||||||||||||||
|
Short-Term Investments
|
||||||||||||||||||||
|
Certificates of Deposit Maturing on January 6, 2011 (6)
|
||||||||||||||||||||
|
Annual Percentage Yield of 0.45%
|
$ | 13,500,000 | $ | 13,500,000 | 60.12 | % | ||||||||||||||
|
Total - Short-Term Investments
|
$ | 13,500,000 | $ | 13,500,000 | 60.12 | % | ||||||||||||||
|
Total - Investments in Portfolio Company Securities and Short-Term Investments
|
$ | 17,100,491 | $ | 17,677,607 | 78.72 | % | ||||||||||||||
|
% of
|
||||||||||||||||||||
|
Reconciliation to Net Assets
|
Amount
|
Net Assets
|
||||||||||||||||||
|
Investments in portfolio company securities and short-term investments
|
$ | 17,677,607 | 78.72 | % | ||||||||||||||||
|
Cash and cash equivalents
|
4,753,299 | 21.17 | % | |||||||||||||||||
|
Prepaid expenses and other assets
|
92,125 | 0.41 | % | |||||||||||||||||
|
Deferred offering costs
|
333,682 | 1.48 | % | |||||||||||||||||
|
Less: Total Liabilities
|
(400,313 | ) | -1.78 | % | ||||||||||||||||
|
Net Assets
|
$ | 22,456,400 | 100.00 | % | ||||||||||||||||
|
(1)
|
Control investments are defined by the Investment Company Act of 1940, as amended (the "1940 Act"), as investments in which more than 25% of the voting securities are owned or where the ability to nominate greater
|
|
than 50% of the board representation is maintained. Affiliate investments are defined by the 1940 Act as investments in which between 5% and 25% of the voting securities are owned.
|
|
|
Non-Control/Non-Affiliate investments are defined by the 1940 Act as investments that are neither Control Investments nor Affiliate Investments.
|
|
|
(2)
|
The aggregate cost basis for federal income tax purposes of Non-Control/Non-Affiliate investments is $3,600,491. The gross unrealized appreciation based on the tax cost basis of these securities is $578,705.
|
|
The gross unrealized depreciation based on the tax cost basis of these securities is $1,589.
|
|
|
(3)
|
The shares of preferred stock represented by these investments are subject to legal restrictions on transfer pursuant to the Securities Act and may only be sold pursuant to a registration statement
|
|
under the Securities Act or an available exemption from registration thereunder. These shares are also subject to a contractual lockup for a period of 180 days following completion of an initial public offering.
|
|
|
(4)
|
The shares of preferred stock represented by these investments carry a non-cumulative, preferred dividend payable when and if declared by the portfolio company's board of directors.
|
|
Since no dividends have been declared or paid with respect to these investments, these investments are considered to be non-income producing.
|
|
|
(5)
|
The warrants grant the holder the right to purchase shares of Series C convertible preferred stock at an exercise price of $0.50 per share, have a contractual life of five years, and expire on June 30, 2015.
|
|
(6)
|
Fair value reflects amortized cost as of December 31, 2010.
|
|
(7)
|
On February 2, 2011, NeoPhotonics completed an initial public offering of its common stock at a price of $11.00 per share. Immediately prior to the initial public offering, the Company’s Series X convertible preferred
|
|
stock converted into 160,000 shares of NeoPhotonics common stock, which common shares were subject to a 180 day lockup provision that expired in August 2011.
|
The accompanying notes are an integral part of these financial statements.
7
|
Nine Months Ended
|
||||||||
|
September 30,
|
September 30,
|
|||||||
|
2011
|
2010
|
|||||||
|
Per Common Share Data
|
||||||||
|
Net asset value, beginning of period (1)
|
$ | 7.85 | $ | 6.53 | ||||
|
Net investment loss (2)
|
(0.42 | ) | (1.12 | ) | ||||
|
Net change in unrealized appreciation on investments (2)
|
- | 0.53 | ||||||
|
Net (decrease) increase in net assets resulting from operations
|
(0.42 | ) | (0.59 | ) | ||||
|
Stockholder distributions:
|
||||||||
|
Distributions in excess of net realized gains on investments (2)
|
(0.07 | ) | - | |||||
|
Net decrease in net assets resulting for stockholder distributions
|
(0.07 | ) | - | |||||
|
Capital stock transactions:
|
||||||||
|
Issuance of common stock in continuous public offering (3)
|
2.00 | 3.06 | ||||||
|
Offering costs from issuance of common stock (2)
|
(1.01 | ) | (1.05 | ) | ||||
|
Amortization of deferred offering costs (2)
|
(0.08 | ) | (0.30 | ) | ||||
|
Net increase in net assets from capital stock transactions
|
0.91 | 1.71 | ||||||
|
Net asset value, end of period (1)
|
$ | 8.27 | $ | 7.65 | ||||
|
Common shares outstanding, beginning of period
|
2,860,299 | 569,900 | ||||||
|
Common shares outstanding, end of period
|
9,283,604 | 1,762,971 | ||||||
|
Weighted average common shares outstanding during period
|
6,125,439 | 1,097,041 | ||||||
|
Total return based on change in net asset value and stockholder distributions (4)
|
17.15 | % | ||||||
|
Supplemental Data and Ratios
|
||||||||
|
Net assets, beginning of period
|
$ | 22,456,400 | $ | 3,719,496 | ||||
|
Net assets, end of period
|
$ | 76,750,350 | $ | 13,479,904 | ||||
|
Average net assets during period
|
$ | 49,603,375 | $ | 8,599,700 | ||||
|
Annualized ratio of operating expenses to average net assets
|
7.03 | % | 19.59 | % | ||||
|
Annualized ratio of net investment loss to average net assets
|
-6.90 | % | -19.03 | % | ||||
|
Portfolio turnover (5)
|
- | - | ||||||
|
(1)
|
Based on total shares outstanding at the beginning and end of the corresponding period.
|
|
(2)
|
Based on weighted average shares outstanding during the period.
|
|
(3)
|
Represents the average increase in net asset value attributable to each share issued during the nine months ended September 30, 2011 and 2010.
|
|
(4)
|
Total return for the nine months ended September 30, 2011 and 2010 was calculated as the change in net asset value per share for each period, plus stockholder distributions per weighted average share paid during each period, divided by the net asset value per share at the beginning of the period. For the nine months ended September 30, 2011 and 2010, total return has not been annualized.
|
|
(5)
|
For the nine months ended September 30, 2011 and 2010, the only investment activity subject to the calculation of portfolio turnover was an aggregate of $27,756,430 and $2,500,491, respectively, in portfolio company investments. Since there were no sales of portfolio company investments during these periods, there was no portfolio turnover.
|
The accompanying notes are an integral part of these financial statements.
8
Notes to Financial Statements
(Unaudited)
1. Organization
Keating Capital, Inc. (“Keating Capital” or the “Company”) was incorporated on May 9, 2008 under the laws of the State of Maryland and is an externally managed, non-diversified, closed-end management investment company that has elected to be regulated as a business development company under the Investment Company Act of 1940, as amended (the “1940 Act”), as of November 20, 2008. During 2010, the Company satisfied the requirements to qualify as a regulated investment company (“RIC”) and has elected to be treated as a RIC under Subchapter M of the Internal Revenue Code (the “Code”) effective for the 2010 tax year (see Federal and State Income Taxes under Note 2).
The Company specializes in making pre-initial public offering (“IPO”) investments in innovative, high growth private companies that are committed to and capable of becoming public. The Company generally acquires equity securities, including convertible preferred securities that are convertible into common stock, common stock, and warrants exercisable into common or preferred stock. The Company may in some cases invest in debentures that are convertible into common stock. The Company’s investments are made principally through direct investments in prospective portfolio companies. However, the Company may also purchase equity securities in secondary transactions from selling stockholders in later stage, private, pre-IPO companies, who are typically either current or former management or early stage investors in these companies.
Keating Investments, LLC (“Keating Investments” or the “Investment Adviser”) serves as the Company’s external investment adviser and also provides the Company with administrative services necessary for it to operate. In this capacity, Keating Investments is primarily responsible for the selection, evaluation, structure, valuation and administration of the Company’s investment portfolio, subject to the supervision of the Company’s Board of Directors. Keating Investments is a registered investment adviser under the Investment Advisers Act of 1940, as amended.
2. Significant Accounting Policies
Basis of Presentation
The interim financial statements of the Company are prepared in accordance with accounting principles generally accepted in the United States of America (“GAAP”) for interim financial information and pursuant to the requirements for reporting on Form 10-Q and Regulation S-X. In the opinion of management, all adjustments, all of which were of a normal recurring nature, considered necessary for the fair presentation of financial statements for the interim period have been included. The results of operations for the current period are not necessarily indicative of results that ultimately may be achieved for any other interim period or for the year ending December 31, 2011. The interim unaudited financial statements and notes hereto should be read in conjunction with the audited financial statements and notes thereto contained in the Company’s Annual Report on Form 10-K for the year ended December 31, 2010.
Consolidation
Under the 1940 Act rules and the regulations pursuant to Article 6 of Regulation S-X, the Company is precluded from consolidating any entity other than another investment company or an operating company that provides substantially all of its services and benefits to the Company. The Company’s financial statements include only the accounts of Keating Capital as the Company has no subsidiaries.
Reclassifications
For the three and nine months ended September 30, 2011, the Company separately classified Stock Transfer Agent Fees, Printing and Fulfillment Expenses, and Postage and Delivery Expenses as individual line items in its Statement of Operations. Stock Transfer Agent Fees were previously included as a component of Legal and Professional Fees, and Printing and Fulfillment Expenses and Postage and Delivery Expenses were previously included as components of General and Administrative Expenses in the Statement of Operations. For comparative purposes, these line items have also been separately classified in the Company’s Statement of Operations for the three and nine months ended September 30, 2010.
Use of Estimates
The preparation of financial statements in conformity with Generally Accepted Accounting Principles in the United States of America (“GAAP”) requires the Company’s management to make estimates and assumptions that affect the reported amounts of assets and liabilities at the date of the financial statements and the reported amounts of income and expenses during the reported period. Actual results could differ from these estimates and the differences could be material. The Company considers its significant estimates to include the fair value of investments in portfolio company securities (see Note 3).
9
Keating Capital, Inc.
Notes to Financial Statements
(Unaudited)
Valuation of Investments
Investments are stated at value as defined under the 1940 Act, in accordance with the applicable regulations of the Securities and Exchange Commission (the “SEC”) and in accordance with Accounting Standards Codification Topic 820, “Fair Value Measurement and Disclosures,” (“ASC 820”). Value, as defined in Section 2(a)(41) of the 1940 Act, is: (i) the market price for those securities for which a market quotation is readily available, and (ii) the fair value as determined in good faith by, or under the direction of, the Board of Directors for all other assets (see Note 3).
At September 30, 2011, the Company’s financial statements included portfolio company investments valued at $31,919,681, with a cost of $31,356,921. The fair value of the Company’s portfolio company investments was determined in good faith by the Company’s Board of Directors and in accordance with ASC 820. Upon sale of the Company’s portfolio company investments, the value that is ultimately realized could be different from what is currently reflected in the Company’s financial statements, and this difference could be material.
Portfolio Company Investment Classification
The Company classifies its portfolio company investments in accordance with the requirements of the 1940 Act. Under the 1940 Act, “Control Investments” are defined as investments in which the Company owns more than 25% of the voting securities or has rights to maintain greater than 50% of the board representation. Under the 1940 Act, “Affiliate Investments” are defined as investments in which the Company owns between 5% and 25% of the voting securities. Under the 1940 Act, “Non-Control/Non-Affiliate Investments” are defined as investments that are neither Control Investments nor Affiliate Investments.
Cash and Cash Equivalents
Cash and cash equivalents are comprised of demand deposits and investments in money market funds with original maturities of 90 days or less.
Deferred Offering Costs
Deferred offering costs were comprised of expenses directly related to the continuous public offering of the Company’s common stock, which concluded on June 30, 2011. These expenses were initially deferred and subsequently amortized and charged against the gross proceeds of the continuous public offering, as a reduction to additional paid-in capital, on a straight-line basis beginning with the closing of the first common stock issuance on January 11, 2010 and continuing through the conclusion of the offering period on June 30, 2011. Offering expenses incurred subsequent to January 11, 2010 associated with maintaining the registration of the continuous public offering (e.g., legal, accounting, printing and blue sky) were expensed as incurred, while other offering-related expenses were capitalized and subsequently charged against the gross proceeds of the continuous public offering on a straight-line basis through June 30, 2011 (see Note 6).
Concentration of Credit Risk
The Company may place its cash and cash equivalents with various financial institutions and, at times, cash held in depository accounts at such institutions may exceed the Federal Deposit Insurance Corporation insured limit.
Securities Transactions
Securities transactions are accounted for on the date the transaction for the purchase or sale of the securities is entered into by the Company (i.e., trade date). Securities transactions outside conventional channels, such as private transactions, are recorded as of the date the Company obtains the right to demand the securities purchased or to collect the proceeds from a sale, and incurs an obligation to pay for securities purchased or to deliver securities sold, respectively.
Interest and Dividend Income
Interest income from certificates of deposit and other short-term investments is recorded on an accrual basis to the extent such amounts are expected to be collected, and accrued interest income is evaluated periodically for collectability.
The Company’s preferred equity investments may pay fixed or adjustable rate non-cumulative dividends and will generally have a “preference” over common equity in the payment of non-cumulative dividends and the liquidation of a portfolio company's assets. In order to be payable, non-cumulative distributions on such preferred equity must be declared by the portfolio company's board of directors. Non-cumulative dividend income from preferred equity investments in portfolio companies is recorded when such dividends are declared or at the point an obligation exists for a portfolio company to make a distribution.
10
Keating Capital, Inc.
Notes to Financial Statements
(Unaudited)
In limited instances, the Company’s preferred equity investments may include cumulative dividend provisions, where such cumulative dividends, whether or not declared, accrue at a specified rate from the original investment date, have a “preference” over other classes of preferred equity and common equity with respect to payment, and are payable only when declared by a portfolio company’s board of directors or upon a qualifying liquidation event. Cumulative dividends are recorded when such dividends are declared by the portfolio company’s board of directors, or when a specified event occurs triggering an obligation to pay such dividends. When recorded, cumulative dividends are added to the balance of the preferred equity investment and are recorded as dividend income in the statement of operations.
During the three and nine months ended September 30, 2011 and 2010, there were no non-cumulative or cumulative dividends recorded.
Other Income
Other income is comprised of fees, if any, for due diligence, structuring, transaction services, consulting services and management services rendered to portfolio companies and prospective portfolio companies. For services that are separately identifiable from the Company’s investment, income is recognized as earned, which is generally when the investment or other applicable transaction closes, or when the services are rendered if payment is not subject to the closing of an investment transaction.
During the nine months ended September 30, 2010, the Company recorded $10,000 in other income representing a non-refundable due diligence fee received from a prospective portfolio company in December of 2009, which was initially recorded as deferred income and was subsequently recognized as income when the proposed investment transaction failed to close in February 2010.
Realized Gain or Loss and Unrealized Appreciation or Depreciation of Portfolio Investments
Realized gain or loss is recognized when an investment is disposed of and is computed as the difference between the Company's cost basis in the investment at the disposition date and the net proceeds received from such disposition. Realized gains and losses on investment transactions are determined by specific identification. Unrealized appreciation or depreciation is computed as the difference between the fair value of the investment and the cost basis of such investment.
Federal and State Income Taxes
During 2010, the Company satisfied the requirements to qualify as a RIC under Subchapter M of the Code and has elected to be treated as a RIC for U.S. federal income tax purposes effective for the 2010 tax year. To maintain RIC tax treatment, the Company must meet specified source-of-income and asset diversification requirements and distribute annually at least 90% of its investment company taxable income (which is generally the Company’s net ordinary income plus the excess, if any, of realized net short-term capital gains over realized net long-term capital losses).
As a RIC, the Company generally will not have to pay corporate-level federal income taxes on any investment company taxable income or any realized net capital gains (which is generally realized net long-term capital gains in excess of realized net short-term capital losses) that the Company distributes to its stockholders. In the event the Company retains any of its realized net capital gains, including amounts retained to pay incentive fees to the Investment Adviser or to pay annual operating expenses, the Company will likely designate the retained amount as a deemed distribution to stockholders and will be required to pay corporate-level tax on the retained amount.
The Company would also be subject to certain excise taxes imposed on RICs if it fails to distribute during each calendar year an amount at least equal to the sum of: (i) 98% of its ordinary income for the calendar year, (ii) 98.2% of its capital gains in excess of capital losses for the one-year period ending on October 31 of the calendar year, and (iii) any ordinary income and net capital gains for preceding years that were not distributed during such years. The Company will not be subject to this excise tax on amounts on which the Company is required to pay corporate income tax (such as retained realized net capital gains).
The Company has made no provision for income taxes as of September 30, 2011 since it expects to continue to qualify as a RIC for its 2011 taxable year and did not generate any investment company taxable income or realized net capital gains during the three or nine months ended September 30, 2011.
11
Keating Capital, Inc.
Notes to Financial Statements
(Unaudited)
| The Company evaluates tax positions taken or expected to be taken in the course of preparing its tax returns to determine whether the tax positions are “more-likely-than-not” of being sustained by the applicable tax authority. Tax positions deemed to meet a “more-likely-than-not” threshold would be recorded as a tax benefit or expense in the applicable period. Although the Company files federal and state tax returns, its major tax jurisdiction is federal. The 2008, 2009 and 2010 federal tax years for the Company remain subject to examination by the Internal Revenue Service. | |
|
As of September 30, 2011 and December 31, 2010, the Company had not recorded a liability for any unrecognized tax positions. Management’s evaluation of uncertain tax positions may be subject to review and adjustment at a later date based upon factors including, but not limited to, an on-going analysis of tax laws, regulations and interpretations thereof. The Company’s policy is to include interest and penalties related to income taxes, if applicable, in general and administrative expenses. There were no such expenses for the three and nine months ending September 30, 2011 and 2010.
|
|
|
The aggregate cost of portfolio company securities for federal income tax purposes and portfolio company securities with unrealized appreciation and depreciation based on tax cost basis, were as follows as of September 30, 2011 and December 31, 2010:
|
|
September 30,
|
December 31,
|
||||||||
|
2011
|
2010
|
||||||||
|
Aggregate cost of portfolio company securities
|
|||||||||
|
for federal income tax purposes
|
$ | 31,356,921 | $ | 3,600,491 | |||||
|
Gross unrealized appreciation of portfolio company securities
|
836,076 | 578,705 | |||||||
|
Gross unrealized depreciation of portfolio company securities
|
(273,316 | ) | (1,589 | ) | |||||
|
Net unrealized appreciation of portfolio company securities
|
$ | 562,760 | $ | 577,116 | |||||
|
Dividends and Distributions
|
|
|
Dividends and distributions to common stockholders are recorded when declared.
|
|
|
Net realized capital gains, if any, after reduction for any incentive fees payable to the Investment Adviser, annual operating expenses and any other retained amounts, are expected to be distributed at least annually. In the event the Company retains some or all of its realized net capital gains, including amounts retained to pay incentive fees to the Investment Adviser or annual operating expenses, the Company will likely designate the retained amount as a deemed distribution to stockholders. In such case, among other consequences, the Company will pay corporate-level tax on the retained amount, each U.S. stockholder will be required to include its share of the deemed distribution in income as if it had been actually distributed to the U.S. stockholder, and the U.S. stockholder will be entitled to claim a credit or refund equal to its allocable share of the corporate-level tax the Company pays on the retained realized net capital gain.
|
|
|
On February 11, 2011, the Company’s Board of Directors declared a special cash distribution of $446,837, or $0.13 per share outstanding on the record date. The distribution was paid on February 17, 2011 to the Company’s stockholders of record as of February 15, 2011 (see Note 7).
|
|
|
Per Share Information
|
|
|
Net changes in net assets resulting from operations per common share, or basic earnings per share, are calculated using the weighted average number of common shares outstanding for the period presented. Diluted earnings per share are not presented as there are no potentially dilutive securities outstanding.
|
|
|
Recently Issued Accounting Pronouncements
|
|
|
From time to time, new accounting pronouncements are issued by the Financial Accounting Standards Board (“FASB”) or other standards setting bodies that are adopted by the Company as of the specified effective date. Unless otherwise discussed, the Company believes that the impact of recently issued standards that are not yet effective will not have a material impact on its financial statements upon adoption.
|
12
Keating Capital, Inc.
Notes to Financial Statements
(Unaudited)
In May 2011, the FASB issued Accounting Standards Update No. 2011-04 - Fair Value Measurement: Amendments to Achieve Common Fair Value Measurement and Disclosure Requirements in U.S. GAAP and IFRS, or ASU 2011-04. ASU 2011-04 clarifies the application of existing fair value measurement and disclosure requirements, changes the application of some requirements for measuring fair value and requires additional disclosure for fair value measurements. In addition, the disclosure requirements are expanded to include for fair value measurements categorized in Level 3 of the fair value hierarchy: (i) a quantitative disclosure of the unobservable inputs and assumptions used in the measurement; (ii) a description of the valuation processes in place; and (iii) a narrative description of the sensitivity of the fair value to changes in unobservable inputs and interrelationships between those inputs. ASU 2011-04 is effective for interim and annual periods beginning after December 15, 2011, for public entities. The Company is evaluating the impact that the adoption of this update may have on its financial position, results of operations and related disclosures.
3. Valuation of Investments
The 1940 Act requires periodic valuation of each investment in the Company’s portfolio to determine the Company’s net asset value. Under the 1940 Act, unrestricted securities with readily available market quotations are to be valued at the current market value; all other assets must be valued at fair value as determined in good faith by or under the direction of the Board of Directors.
Investments for which market quotations are readily available are recorded in the Company’s financial statements at such market quotations. However, investments for which market quotations are readily available, but which are subject to lockup provisions restricting the resale of such investments for a specified period of time, are valued at a discount to the most recently available closing market prices.
With respect to investments for which market quotations are not readily available, the Company’s Board of Directors undertakes a multi-step valuation process each quarter, as described below:
|
|
·
|
The Company’s quarterly valuation process begins with each portfolio company investment being initially valued by Keating Investments’ senior investment professionals responsible for the portfolio investment;
|
|
|
·
|
Third-party valuation firms engaged by the Company’s Board of Directors review these preliminary valuations at such times as determined by the Company’s Board of Directors, provided, however, that a review will be conducted by a third-party valuation firm for each new portfolio company investment made during a calendar quarter, at such time as the valuation for a specific portfolio company investment is increased, and at least once every twelve months;
|
|
|
·
|
The Company’s Valuation Committee reviews the preliminary valuations, and the Company’s Investment Adviser and the third-party valuation firms respond and supplement the preliminary valuation to reflect any comments provided by the Valuation Committee; and
|
|
|
·
|
The Company’s Board of Directors discusses the valuations and determines, in good faith, the fair value of each investment in the Company’s portfolio for which market quotations are not readily available based on the input of the Company’s Investment Adviser, the third-party valuation firms, and the Company’s Valuation Committee.
|
Investment Categories and Approaches to Determining Fair Value
ASC 820 defines fair value as the price that would be received to sell an asset or paid to transfer a liability in an orderly transaction between market participants at the measurement date (exit price). In accordance with ASC 820, the Company uses a three-tier fair value hierarchy, which prioritizes the inputs used in measuring fair value as follows:
|
|
·
|
Level 1: Observable inputs such as unadjusted quoted prices in active markets;
|
|
|
·
|
Level 2: Includes inputs such as quoted prices for similar securities in active markets and quoted prices for identical securities where there is little or no activity in the market; and
|
13
Keating Capital, Inc.
Notes to Financial Statements
(Unaudited)
|
|
·
|
Level 3: Unobservable inputs for which little or no market data exists, therefore requiring an entity to develop its own assumptions.
|
The Company applies the framework for determining fair value as described above to the valuation of investments in each of the following categories:
Short-Term Investments
Short-term investments, which were comprised of investments in certificates of deposit with original maturities of 90 days or less at December 31, 2010, are valued at amortized cost, which approximates fair value. The amortized cost method involves recording a security at its cost (i.e., principal amount plus any premium and less any discount) on the date of purchase and thereafter amortizing/accreting that difference between the principal amount due at maturity and cost assuming a constant yield to maturity as determined at the time of purchase.
As of September 30, 2011, the Company no longer held any instruments classified as short-term investments, as its cash balances were invested in a money market fund and classified as a component of cash and cash equivalents. The money market fund in which the Company has invested its cash balances invests primarily in U.S. Treasury securities, U.S. Government agency securities, and repurchase agreements fully-collateralized by such securities. During the nine months ended September 30, 2011, prior to the investment of cash balances in this money market fund, the Company’s cash balances were invested in certificates of deposit and classified as short-term investments. During the nine months ended September 30, 2011, cumulative purchases of certificates of deposit totaled $89,000,000 and cumulative maturities totaled $102,500,000. During the nine months ended September 30, 2010 the Company’s short-term investments were comprised exclusively of investments in certificates of deposit with four week maturities, with cumulative purchases totaling $52,500,000 and cumulative maturities totaling $47,500,000.
Equity Investments
Equity investments for which market quotations are readily available are generally valued at the most recently available closing market prices. However, equity investments for which market quotations are readily available, but which are subject to lockup provisions restricting the resale of such investments for a specified period of time, are valued at a discount to the most recently available closing market prices.
The fair values of the Company’s equity investments for which market quotations are not readily available (including investments in convertible preferred stock) are determined based on various factors. To determine the fair value of a portfolio company, the Company analyzes the portfolio company’s historical and projected financial results, industry valuation benchmarks and public market comparables, and other factors. The Company also considers other events, including private mergers and acquisitions, the transaction in which we acquired our securities, public offering or subsequent equity sales. In addition, the Company considers the trends of the portfolio company’s basic financial metrics from the time of our original investment until the measurement date, with material improvement of these metrics indicating a possible increase in fair value, while material deterioration of these metrics may indicate a possible reduction in fair value. The fair values of the Company’s portfolio companies’ securities are generally discounted for lack of marketability or when the securities are illiquid, such as when there are restrictions on resale or the lack of an established trading market.
The fair value of common and preferred stock warrants is generally determined by using the Black-Scholes option pricing model or, in cases of certain “structured” warrants where the Company’s ability to exercise may be contingent or be subject to certain performance metrics, an option pricing model based on large numbers of simulations that take into account these special terms.
14
Keating Capital, Inc.
Notes to Financial Statements
(Unaudited)
|
Fair Value of Investments
|
|
|
The following table categorizes the Company’s cash equivalents, short-term investments, and portfolio company investments measured at fair value based upon the lowest level of significant input used in the valuation as of September 30, 2011 and December 31, 2010:
|
|
Quoted Prices In
|
||||||||||||||||
|
Active Markets
|
Significant Other
|
Significant
|
||||||||||||||
|
For Identical Assets
|
Observable Inputs
|
Unobservable Inputs
|
Total
|
|||||||||||||
|
Description
|
(Level 1)
|
(Level 2)
|
(Level 3)
|
Fair Value
|
||||||||||||
|
As of September 30, 2011
|
||||||||||||||||
|
Private Portfolio Company Securities:
|
||||||||||||||||
|
Preferred Stock
|
$ | - | $ | - | $ | 22,099,874 | $ | 22,099,874 | ||||||||
|
Preferred Stock Warrants
|
- | - | 6,655 | 6,655 | ||||||||||||
|
Common Stock
|
- | - | 7,095,996 | 7,095,996 | ||||||||||||
|
Common Stock Warrants
|
- | - | 639,156 | 639,156 | ||||||||||||
|
Publicly-Traded Portfolio Company Securities:
|
||||||||||||||||
|
Common Stock (1)
|
1,101,000 | - | 977,000 | 2,078,000 | ||||||||||||
|
Cash Equivalents:
|
||||||||||||||||
|
Money Market Funds
|
45,069,165 | - | - | 45,069,165 | ||||||||||||
|
Total
|
$ | 46,170,165 | $ | - | $ | 30,818,681 | $ | 76,988,846 | ||||||||
|
As of December 31, 2010
|
||||||||||||||||
|
Private Portfolio Company Securities:
|
||||||||||||||||
|
Preferred Stock
|
$ | - | $ | - | $ | 4,149,991 | $ | 4,149,991 | ||||||||
|
Preferred Stock Warrants
|
- | - | 27,616 | 27,616 | ||||||||||||
|
Short-Term Investments:
|
||||||||||||||||
|
Certificates of Deposit (2)
|
||||||||||||||||
|
(Maturing on January 6, 2011)
|
- | 13,500,000 | - | 13,500,000 | ||||||||||||
|
Total
|
$ | - | $ | 13,500,000 | $ | 4,177,607 | $ | 17,677,607 | ||||||||
|
(1)
|
Though a quoted price in an active market exist for the Company's common stock investment in Solazyme, Inc. with a fair value of $977,000 at September 30, 2011, this investment is subject to a lockup provision which has not expired as of September 30, 2011 and, as a result, this investment has been valued at a discount to the quoted market price and catorgized as Level 3 in the fair value hierarchy. |
|
(2)
|
Fair value reflects amortized cost as of December 31, 2010.
|
|
The following table provides a reconciliation of the changes in fair value for the Company’s portfolio company investments measured at fair value using significant unobservable inputs (Level 3) for the three months ended September 30, 2011:
|
|
Level 3
|
Level 3
|
Level 3
|
Level 3
|
|||||||||||||||||
|
Portfolio Company
|
Portfolio Company
|
Portfolio Company
|
Portfolio Company |
|
||||||||||||||||
|
Investments
|
Investments
|
Investments
|
Investments
|
|||||||||||||||||
|
Three months ended September 30, 2011:
|
(Preferred Stock)
|
(Preferred Warrants)
|
(Common Stock)
|
(Common Warrants)
|
Total
|
|||||||||||||||
|
Fair Value at June 30, 2011
|
$ | 12,985,012 | $ | 24,205 | $ | 3,331,000 | $ | - | $ | 16,340,217 | ||||||||||
|
New investments in Level 3 portfolio company securities at cost
|
9,354,786 | 1,556 | 6,411,076 | 589,000 | 16,356,418 | |||||||||||||||
|
Gross transfers out of Level 3 to Level 1
|
- | - | (996,000 | ) | - | (996,000 | ) | |||||||||||||
|
Total unrealized appreciation (depreciation) on Level 3 portfolio company securities included in change in net assets
|
(239,924 | ) | (19,106 | ) | (673,080 | ) | 50,156 | (881,954 | ) | |||||||||||
|
Fair Value at September 30, 2011
|
$ | 22,099,874 | $ | 6,655 | $ | 8,072,996 | $ | 639,156 | $ | 30,818,681 | ||||||||||
|
Total unrealized appreciation (depreciation) on Level 3 portfolio company securities included in change in net assets that were still held by the Company at September 30, 2011.
|
$ | (239,924 | ) | $ | (19,106 | ) | $ | (673,080 | ) | $ | 50,156 | $ | (881,954 | ) | ||||||
15
Keating Capital, Inc.
Notes to Financial Statements
(Unaudited)
|
As of June 30, 2011, the Company’s common stock investment in NeoPhotonics Corporation (“NeoPhotonics”) had a fair value of $996,000 as determined in good faith by the Company’s Board of Directors and was included as a component of Level 3 Portfolio Company Investments (Common Stock). Though a quoted price in an active market existed for the Company’s common stock investment in NeoPhotonics as of June 30, 2011, such investment was subject to a 180 day lockup provision expiring in August 2011 and, as a result, was valued at a 10% discount to the quoted market price of $6.92 per share as of June 30, 2011 and categorized within Level 3 of the fair value hierarchy. Upon expiration of the 180 day lockup provision in August 2011, the Company’s common stock investment in NeoPhotonics was transferred out of Level 3 and into Level 1 within the fair value hierarchy, with the fair value of the Company’s common stock investment in NeoPhotonics of $1,101,000 based on the quoted market price of $6.88 per share as of September 30, 2011, resulting in an increase in unrealized appreciation of $105,000 during the three months ended September 30, 2011.
|
|
|
The following table provides a reconciliation of the changes in fair value for the Company’s portfolio company investments measured at fair value using significant unobservable inputs (Level 3) for the nine months ended September 30, 2011:
|
|
Level 3
|
Level 3
|
Level 3
|
Level 3
|
|||||||||||||||||
|
Portfolio Company
|
Portfolio Company
|
Portfolio Company
|
Portfolio Company
|
|||||||||||||||||
|
Investments
|
Investments
|
Investments
|
Investments
|
|||||||||||||||||
|
Nine months ended September 30, 2011:
|
(Preferred Stock)
|
(Preferred Warrants)
|
(Common Stock)
|
(Common Warrants)
|
Total
|
|||||||||||||||
|
Fair Value at December 31, 2010
|
$ | 4,149,991 | $ | 27,616 | $ | - | $ | - | $ | 4,177,607 | ||||||||||
|
New investments in Level 3 portfolio company securities at cost
|
20,754,798 | 1,556 | 6,411,076 | 589,000 | 27,756,430 | |||||||||||||||
|
Transfers from preferred stock to common stock within Level 3
|
(999,991 | ) | - | 999,991 | - | - | ||||||||||||||
|
Gross transfers out of Level 3 to Level 1
|
(1,550,000 | ) | - | - | (1,550,000 | ) | ||||||||||||||
|
Total unrealized appreciation (depreciation) on Level 3 portfolio company securities included in change in net assets
|
(254,924 | ) | (22,517 | ) | 661,929 | 50,156 | 434,644 | |||||||||||||
|
Fair Value at September 30, 2011
|
$ | 22,099,874 | $ | 6,655 | $ | 8,072,996 | $ | 639,156 | $ | 30,818,681 | ||||||||||
|
Total unrealized appreciation (depreciation) on Level 3 portfolio company securities included in change in net assets that were still held by the Company at September 30, 2011.
|
$ | (254,924 | ) | $ | (22,517 | ) | $ | 661,929 | $ | 50,156 | $ | 434,644 | ||||||||
|
As of December 31, 2010, the Company’s Series X convertible preferred stock investment in NeoPhotonics Corporation (“NeoPhotonics”) had a fair value of $1,550,000 as determined in good faith by the Company’s Board of Directors and was included as a component of Level 3 Portfolio Company Investments (Preferred Stock) as NeoPhotonics was a private company for which market quotations for its shares were not available as of December 31, 2010. As a result of NeoPhotonics’ initial public offering on February 2, 2011 (where the Company’s preferred stock was converted into common stock) and upon expiration of the 180 day lockup provision associated with such shares of common stock in August 2011, the Company’s common stock investment in NeoPhotonics was transferred out of Level 3 and into Level 1 within the fair value hierarchy, with the fair value of the Company’s common stock investment in NeoPhotonics of $1,101,000 based on the quoted market price of $6.88 per share as of September 30, 2011, resulting in an increase in unrealized (depreciation) of $(449,000) during the nine months ended September 30, 2011.
|
|
|
As of December 31, 2010, the Company’s Series D convertible preferred stock investment in Solazyme, Inc. (“Solazyme”) had a fair value of $999,991 as determined in good faith by the Company’s Board of Directors and was included as a component of Level 3 Portfolio Company Investments (Preferred Stock) as Solazyme was a private company for which market quotations for its shares were not available as of December 31, 2010. As a result of Solazyme’s initial public offering on May 27, 2011 and the conversion of the Company’s preferred stock into common stock, such investment was reclassified from preferred stock to common stock within Level 3 of the fair value hierarchy during the nine months ended September 30, 2011. Though a quoted price in an active market exists for the Company’s common stock investment in Solazyme as of September 30, 2011, such investment is subject to a 180 day lockup provision expiring in November 2011 and, as a result, has been valued at price of $8.65 per share, a 10% discount to the quoted market price of $9.61 per share as of September 30, 2011, and categorized within Level 3 of the fair value hierarchy.
|
16
Keating Capital, Inc.
Notes to Financial Statements
(Unaudited)
4. Investment Portfolio
During the three months ended September 30, 2011, the Company made investments totaling $16,356,418 in six private companies, consisting of preferred stock, common stock, and warrants to acquire preferred stock and common stock.
During the nine months ended September 30, 2011, the Company made investments totaling $27,756,430 in 11 private companies, consisting of preferred stock, common stock, and warrants to acquire preferred stock and common stock.
Portfolio Company Investment Activity – Quarter Ended March 31, 2011
MBA Polymers, Inc. On February 22, 2011, the Company made a $900,000 follow-on investment in Series G convertible preferred stock of MBA Polymers, Inc. (“MBA Polymers”). This follow-on investment was in addition to the $1.1 million investment in the Series G convertible preferred stock of MBA Polymers made by the Company in October 2010.
BrightSource Energy, Inc. On March 1, 2011, the Company completed a $2,500,006 investment in the Series E convertible preferred stock of BrightSource Energy, Inc. (“BrightSource”). BrightSource is a private company headquartered in Oakland, California and is a developer of utility scale solar thermal plants which generate solar energy for utility and industrial companies using its proprietary solar thermal tower technology. On April 22, 2011, BrightSource filed a registration statement on Form S-1 to go public through a $250 million initial public offering of its common stock. BrightSource filed amendment No. 4 to its registration statement on October 12, 2011. In the event of a qualifying initial public offering, the Series E convertible preferred stock would be automatically converted into shares of BrightSource’s common stock. The common stock issued upon conversion would be subject to a 180 day lockup period following the completion of the initial public offering.
Harvest Power, Inc. On March 9, 2011, the Company made a $2,499,999 investment in the Series B convertible preferred stock of Harvest Power, Inc. (“Harvest Power”). Harvest Power is a private company headquartered in Waltham, Massachusetts that acquires, owns and operates organic waste facilities that convert organic waste, such as food scraps and yard debris, into compost, mulch and renewable energy.
Suniva, Inc. On March 31, 2011, the Company made a $2,500,007 investment in the Series D convertible preferred stock of Suniva, Inc. (“Suniva”). Suniva is a private company headquartered in Norcross, Georgia and is a manufacturer of high-efficiency solar photovoltaic cells and modules focused on delivering high-power solar energy products.
Portfolio Company Investment Activity – Quarter Ended June 30, 2011
Xtime, Inc. On June 14, 2011, the Company made a $3,000,000 investment in the Series F convertible preferred stock of Xtime, Inc. (“Xtime”). Xtime is a private company headquartered in Redwood Shores, California and is a software as a service provider of Web scheduling and CRM solutions for automotive service departments. In August 2011, Xtime, Inc. completed the final closing of the Series F convertible preferred stock round. As part of the final closing, Xtime’s existing investors who invested more than their pro rata share in the Series F convertible preferred round (based on amounts they had invested in Xtime’s prior preferred stock rounds), received warrants to acquire shares of Xtime’s common stock at an exercise price of $0.01 per share. In order to preserve its post-money, fully diluted ownership interest in Xtime, the Company received warrants to acquire 22,581 shares of Xtime common stock on the same terms the warrants issued to existing investors. In the event Xtime completes a qualifying initial public offering, the number of warrants will be reduced by 50%.
Portfolio Company Investment Activity – Quarter Ended September 30, 2011
Corsair Components, Inc. On July 6, 2011, the Company made a $4,000,080 investment in the common stock and warrants of Corsair Components, Inc. (“Corsair”) as part of a private purchase transaction with certain founders and current and former management employees of Corsair (the “Sellers”). Corsair is a private company headquartered in Freemont, California and is a designer and supplier of high-performance components to the personal computer, or PC, gaming hardware market. Corsair had previously filed a registration statement on Form S-1 on April 23, 2010 for an initial public offering of its common stock. Corsair filed amendment No. 6 to its registration statement on July 22, 2011. In the event of an initial public offering, the common stock held by the Company would be subject to a 180 day lockup period following the completion of the initial public offering.
17
Keating Capital, Inc.
Notes to Financial Statements
(Unaudited)
Pursuant to the common stock and warrant purchase agreement with the Sellers, the Company purchased 3,200,000 shares of Corsair common stock at price of $1.25 per share and 800,000 common stock warrants at a price of $0.0001 per warrant. The warrants grant the Company the right to purchase from the Sellers up to 800,000 shares of Corsair common stock at an exercise price of $0.01 per share. The warrants expire on the earlier of: (i) the consummation of an initial public offering by Corsair at an offering price of at least $2.50 per share of common stock, (ii) upon a sale of Corsair which results in holders of Corsair common stock receiving net sales proceeds of at least $2.50 per share, or (iii) July 6, 2016.
The warrants are exercisable only upon: (i) Corsair completing an IPO of its common stock at an offering price of less than $2.50 per share, (ii) a sale of Corsair which results in holders of Corsair common stock receiving net sales proceeds of less than $2.50 per share, and (iii) if Corsair does not complete an IPO or sale prior to July 6, 2016, the warrants will be deemed to have been automatically exercised on such date. If the warrants become exercisable as a result of an IPO or sale of Corsair, the number of warrants will be proportionately decreased from 800,000 to the extent that the IPO price or net sale proceeds, as the case may be, exceeds $2.00 per share but is less than $$2.50 per share, and the number of warrants will be reduced to zero if the IPO price or net sale proceeds, as the case may be, equals or exceeds $2.50 per share. Accordingly, if the warrants become exercisable as a result of an IPO or sale, the Company will be entitled to receive the full 800,000 warrants only if the IPO price or net sale proceeds, as the case may be, is $2.00 per share or less.
To estimate the fair value of warrants as of the initial investment date, the common stock and warrants were considered components of a portfolio of securities purchased for $4,000,080. However, since the number of common shares underlying the warrants is variable (ranging from zero to 800,000) based on whether an IPO or sale of Corsair exceeds $2.00 per share, the fair value of the warrants was derived using an option pricing model within the framework of a Monte Carlo numerical-based analysis, which takes into consideration the variability in the number of common shares underlying the warrants based on a range of IPO or sale prices for Corsair.
For financial reporting purposes, the common stock was assigned a cost of $3,411,080 and the warrants were assigned a cost of $589,000 based on the fair value of the warrants as of the initial investment.
Livescribe, Inc. On July 8, 2011, the Company made a $27,481 investment in the Series C-1 convertible preferred stock and warrants of Livescribe, Inc. (“Livescribe”), a portfolio company in which the Company had previously invested $500,500 in July of 2010. The Company has also committed to make an additional investment of $22,900 in the Series C-1 convertible preferred stock and warrants of Livescribe as part of a second closing that will occur no later than April 30, 2012. The Company has received notice that the second closing is expected to occur on or about November 9, 2011.. For financial reporting purposes, the Series C-1 convertible preferred stock was assigned a cost of $25,925 and the warrants were assigned a cost of $1,556 based on the fair value of the warrants as of the initial investment date calculated using the Black-Scholes option pricing model.
Metabolon, Inc. On August 25, 2011, the Company made a $4,000,000 investment in the Series D convertible preferred stock of Metabolon, Inc. (“Metabolon”). Metabolon is a private company headquartered in Research Triangle Park, North Carolina and is a molecular diagnostics and services company offering a novel metabolic profiling technology that uses advanced bioinformatics and data analytics software to identify, quantify, and analyze biochemical processes occurring within cells.
Kabam, Inc. On August 29, 2011, the Company made a $1,328,860 investment in the Series D convertible preferred stock of Kabam, Inc. (“Kabam”). Kabam is a private company headquartered in Redwood City, California and is a developer of massively multiplayer games. Kabam is a leader in the next wave of internet-based social gaming by combining the immersion of massively multiplayer games with the connectivity and interaction of social games.
Tremor Video, Inc. On September 6, 2011, the Company made a $4,000,001 investment in the Series F convertible preferred stock of Tremor Video, Inc. (“Tremor Video”). Tremor Video is a private company headquartered in New York City and is an online video technology and advertising company that provides video advertising solutions to Fortune 1000 brand advertisers and top tier publishers of Web videos.
18
Keating Capital, Inc.
Notes to Financial Statements
(Unaudited)
|
TrueCar, Inc. On September 26, 2011, the Company made a $2,999,996 investment in the common stock of TrueCar, Inc. (“TrueCar”). TrueCar is a private company headquartered in Santa Monica, California that provides an online research and pricing tool for consumers interested in buying a new or used vehicle to research any make and model and see a histogram of actual transaction prices for that vehicle in a specific geographic area. Through TrueCar’s platform, consumers also have access to average prices paid, recent sales data, monthly price trends and vehicle pricing details, which show dealer cost, and factory invoice, as well as customer and dealer incentives being offered.
|
|
|
Except for the foregoing portfolio company investments, there was no other portfolio company investment activity during the three and nine months ended September 30, 2011. There were also no sales of portfolio company investments during the three and nine months ended September 30, 2011.
|
|
|
Investment Portfolio Composition
|
|
|
The following table summarizes the composition of the Company’s investment portfolio, excluding short-term investments in certificates of deposit, by type of security at cost and fair value as of September 30, 2011 and December 31, 2010.
|
|
September 30, 2011
|
December 31, 2010
|
|||||||||||||||||||||||
|
Percentage
|
Percentage
|
|||||||||||||||||||||||
|
Investment Type
|
Cost
|
Fair Value
|
of Portfolio
|
Cost
|
Fair Value
|
of Portfolio
|
||||||||||||||||||
|
Private Portfolio Companies:
|
||||||||||||||||||||||||
|
Preferred Stock
|
$ | 22,326,093 | $ | 22,099,874 | 69.24 | % | $ | 3,571,286 | $ | 4,149,991 | 99.34 | % | ||||||||||||
|
Preferred Stock Warrants
|
30,761 | 6,655 | 0.02 | % | 29,205 | 27,616 | 0.66 | % | ||||||||||||||||
|
Common Stock
|
6,411,076 | 7,095,996 | 22.23 | % | - | - | - | |||||||||||||||||
|
Common Stock Warrants
|
589,000 | 639,156 | 2.00 | % | - | - | - | |||||||||||||||||
|
Publicly-Traded Portfolio Companies:
|
||||||||||||||||||||||||
|
Common Stock
|
1,999,991 | 2,078,000 | 6.51 | % | - | - | - | |||||||||||||||||
|
Total
|
$ | 31,356,921 | $ | 31,919,681 | 100.00 | % | $ | 3,600,491 | $ | 4,177,607 | 100.00 | % | ||||||||||||
|
The following table summarizes the composition of the Company’s investment portfolio, excluding short-term investments in certificates of deposit, by industry classification at cost and fair value as of September 30, 2011 and December 31, 2010.
|
|
September 30, 2011
|
December 31, 2010
|
|||||||||||||||||||||||
|
Percentage
|
Percentage
|
|||||||||||||||||||||||
|
Industry Classification
|
Cost
|
Fair Value
|
of Portfolio
|
Cost
|
Fair Value
|
of Portfolio
|
||||||||||||||||||
|
Internet & Software
|
$ | 11,328,857 | $ | 11,338,013 | 35.52 | % | $ | - | $ | - | - | |||||||||||||
|
Cleantech
|
10,500,003 | 10,477,012 | 32.82 | % | 2,099,991 | 2,099,991 | 50.27 | % | ||||||||||||||||
|
Technology
|
9,528,061 | 10,104,656 | 31.66 | % | 1,500,500 | 2,077,616 | 49.73 | % | ||||||||||||||||
|
Total
|
$ | 31,356,921 | $ | 31,919,681 | 100.0 | % | $ | 3,600,491 | $ | 4,177,607 | 100.00 | % | ||||||||||||
19
Keating Capital, Inc.
Notes to Financial Statements
(Unaudited)
|
The following table summarizes the composition of the Company’s investment portfolio, excluding short-term investments in certificates of deposit, by geographic region of the United States at cost and fair value as of September 30, 2011 and December 31, 2010. The geographic composition is determined by the location of the corporate headquarters of the portfolio company.
|
|
September 30, 2011
|
December 31, 2010
|
|||||||||||||||||||||||
|
Percentage
|
Percentage
|
|||||||||||||||||||||||
|
Geographic Location
|
Cost
|
Fair Value
|
of Portfolio
|
Cost
|
Fair Value
|
of Portfolio
|
||||||||||||||||||
|
West
|
$ | 18,356,914 | $ | 18,919,674 | 59.28 | % | $ | 3,600,491 | $ | 4,177,607 | 100.00 | % | ||||||||||||
|
Northeast
|
6,500,000 | 6,500,000 | 20.36 | % | - | - | - | |||||||||||||||||
|
Southeast
|
6,500,007 | 6,500,007 | 20.36 | % | - | - | - | |||||||||||||||||
|
Total
|
$ | 31,356,921 | $ | 31,919,681 | 100.00 | % | $ | 3,600,491 | $ | 4,177,607 | 100.00 | % | ||||||||||||
|
5.
|
Related Party Agreements and Transactions
|
|
Investment Advisory and Administrative Services Agreement
|
|
|
Subject to the overall supervision of the Company’s Board of Directors, the Investment Adviser manages the Company’s day-to-day operations and provides the Company with investment advisory services. Under the terms of the Investment Advisory and Administrative Services Agreement, the Investment Adviser:
|
|
|
·
|
Determines the composition of the Company’s investment portfolio, the nature and timing of the changes to the investment portfolio and the manner of implementing such changes;
|
|
|
·
|
Determines which securities the Company will purchase, retain or sell;
|
|
|
·
|
Identifies, evaluates and negotiates the structure of investments the Company makes, including performing due diligence on prospective portfolio companies; and
|
|
|
·
|
Closes, monitors and services the investments the Company makes.
|
|
The Investment Adviser’s services under the Investment Advisory and Administrative Services Agreement are not exclusive, and it is free to furnish similar services to other entities so long as its services to the Company are not impaired.
|
|
|
The Company pays the Investment Adviser a fee for its investment advisory services under the Investment Advisory and Administrative Services Agreement consisting of two components: (i) a base management fee, and (ii) an incentive fee.
|
|
|
Base Management Fee
|
|
|
The base management fee (the “Base Fee”) is calculated at an annual rate of 2% of the Company’s gross assets, where gross assets include any borrowings for investment purposes. The Company did not have any borrowings for the three and nine months ended September 30, 2011 or 2010. The Base Fee is payable monthly in arrears, and is calculated based on the value of the Company’s gross assets at the end of the most recently completed calendar quarter, and adjusted for any equity capital raises or repurchases during the current calendar quarter.
|
|
|
The Company recorded Base Fees of $389,007 and $59,709 for the three months ended September 30, 2011 and 2010, respectively. The Company recorded Base Fees of $764,375 and $128,245 for the nine months ended September 30, 2011 and 2010, respectively. As of September 30, 2011 and December 31, 2010, Base Fees payable to the Investment Adviser were $129,512 and $90,631, respectively.
|
|
|
Incentive Fee
|
|
| The incentive fee is determined and payable in arrears as of the end of each calendar year (or upon termination of the Investment Advisory and Administrative Services Agreement, as of the termination date), and equals 20% of the Company’s realized capital gains, if any, on a cumulative basis from inception through the end of each calendar year, computed net of all realized capital losses and unrealized capital depreciation on a cumulative basis, less the aggregate amount of any previously paid incentive fees, with respect to each of the investments in the Company’s portfolio. The Investment Adviser is not entitled to an incentive fee on investment income generated from interest or dividends on its portfolio company investments. | |
20
Keating Capital, Inc.
Notes to Financial Statements
(Unaudited)
During the three and nine months ended September 30, 2011 and 2010, no incentive fees were earned by or payable to the Investment Adviser in accordance with the contractual terms of the Investment Advisory and Administrative Services Agreement since the Company did not generate any realized capital gains during such periods. However, during the three and nine months ended September 30, 2011, the Company recorded $155,391 and $2,871 in reductions to incentive fee expense, respectively, resulting from the increase in net unrealized depreciation on its portfolio company investments of $(776,954) and $(14,356) during the three and nine months ended September 30, 2011, respectively. Additionally, as of September 30, 2011 and December 31, 2010, the Company had recorded accrued incentive fees payable to the Investment Adviser in the amounts of $112,552 and $115,423, respectively, with respect to $562,760 and $577,115 of net unrealized appreciation on its portfolio company investments as of September 30, 2011 and December 31, 2010. Since the incentive fee is only payable based on realized capital gains (after reduction for realized capital losses and unrealized depreciation), the accrued incentive fee of $112,552 as of September 30, 2011 may differ from the actual incentive fee that may be paid to the Investment Adviser depending on whether the Company is ultimately able to dispose of its portfolio company investments and generate a net realized capital gain at least commensurate with the unrealized appreciation recorded.
Administrative Services
Pursuant to the Investment Advisory and Administrative Services Agreement, the Investment Adviser furnishes the Company with office facilities, equipment, and clerical, bookkeeping and record-keeping services. The Investment Adviser also performs, or facilitates the performance of, certain administrative services, which includes being responsible for the financial records which the Company is required to maintain, and preparing reports to the Company’s stockholders and reports filed with the SEC.
In addition, the Investment Adviser assists the Company with its portfolio accounting and bookkeeping, managing portfolio collections and reporting, performing stockholder and investor relations services, determining and publishing its net asset value, overseeing the preparation and filing of its tax returns, printing and disseminating reports to its stockholders, providing support for its risk management efforts and generally overseeing the payment of its expenses and performance of administrative and professional services rendered to the Company by others.
The Company reimburses the Investment Adviser for the allocable portion of overhead and other expenses incurred by the Investment Adviser in performing its administrative obligations under the Investment Advisory and Administrative Services Agreement, including the allocable portion of compensation of the Company’s Chief Financial Officer and Chief Compliance Officer, and their respective staff. Allocated administrative expenses are payable to the Investment Adviser monthly in arrears.
The Company recorded allocated administrative expenses of $96,757 and $112,921 for the three months ended September 30, 2011 and 2010, respectively. The Company recorded allocated administrative expenses of $330,263 and $284,761 for the nine months ended September 30, 2011 and 2010, respectively. As of September 30, 2011 and December 31, 2010, allocated administrative expenses payable to the Investment Adviser were $32,792 and $41,348, respectively.
Reimbursable Expenses
Reimbursable expenses payable to the Investment Adviser totaling $0 and $3,068 in the accompanying Statement of Assets and Liabilities at September 30, 2011 and December 31, 2010, respectively, represent amounts owed to Investment Adviser for direct expenses of the Company that were paid on its behalf by the Investment Adviser.
Duration and Termination
The Investment Advisory and Administrative Services Agreement was initially approved by the Company’s Board of Directors and its sole stockholder on July 28, 2008. An amended and restated version of the Investment Advisory and Administrative Services Agreement, which is presently in effect, was approved by the Company’s Board of Directors on April 17, 2009, and by the Company’s stockholders on May 14, 2009. Unless earlier terminated as described below, the current Investment Advisory and Administrative Services Agreement will remain in effect for a period of two years from the date it was approved by the Board of Directors and will remain in effect from year to year thereafter if approved annually by (i) the vote of the Company’s Board of Directors, or by the vote of a majority of the Company’s outstanding voting securities, and (ii) the vote of a majority of the Company’s directors who are not interested persons. An affirmative vote of the holders of a majority of the Company’s outstanding voting securities is also necessary in order to make material amendments to the Investment Advisory and Administrative Services Agreement. The Company’s Board of Directors (including the independent directors) approved the renewal of the Investment Advisory and Administrative Services Agreement for an additional year at its meeting held on April 12, 2011.
21
Keating Capital, Inc.
Notes to Financial Statements
(Unaudited)
The Investment Advisory and Administrative Services Agreement automatically terminates in the event of its assignment. As required by the 1940 Act, the Investment Advisory and Administrative Services Agreement provides that the Company may terminate the agreement without penalty upon 60 days’ written notice to the Investment Adviser. If the Investment Adviser wishes to voluntarily terminate the Investment Advisory and Administrative Services Agreement, it must give stockholders a minimum of 120 days’ notice prior to termination and must pay all expenses associated with its termination. The Investment Advisory and Administrative Services Agreement may also be terminated, without penalty, upon the vote of a majority of the Company’s outstanding voting securities.
License Agreement
On July 28, 2008, the Company entered into a license agreement (the “License Agreement”) with the Investment Adviser pursuant to which the Investment Adviser granted the Company a non-exclusive license to use the name “Keating.” Under the License Agreement, the Company has a right to use the Keating name and logo, for as long as the Investment Adviser or one of its affiliates remains the Company’s investment adviser. Other than with respect to this limited license, the Company has no legal right to the “Keating” name or logo. The License Agreement will remain in effect for as long as the Investment Advisory and Administrative Services Agreement with the Investment Adviser is in effect.
Joint Liability Insurance Agreement
The Company maintains a directors and officers liability insurance policy (“D&O Policy”) covering the directors and officers of the Company, insuring the Company against loss that it may be required or permitted to pay as indemnities of the directors and officers of the Company, and insuring the Company for certain securities claims. The Company also maintains an additional policy providing for excess coverage in the case of non-indemnifiable claims (“Excess Policy”), covering its directors and officers. The coverages under the D&O Policy and Excess Policy in certain cases extend to the officers, managers and employees of the Investment Adviser, and to the Investment Adviser’s Investment Committee. On November 4, 2011, the Company and the Investment Adviser entered into a joint liability insurance agreement (“Insurance Agreement”) which allocates the premium cost of the D&O Policy and the Excess Policy between the Company and the Investment Adviser and provides for the allocation of any deductibles and losses in excess of applicable insurance limits.
For the D&O Policy covering the policy year ending August 28, 2012, the Insurance Agreement specifies that 10% of the total D&O Policy premium be allocated to the Investment Adviser. None of the premium under the Excess Policy premium is allocated to the Investment Adviser.
6. Capital Stock
The Company’s authorized capital stock consists of 200,000,000 shares of stock, par value $0.001 per share, all of which has initially been designated as common stock.
From August 27, 2008 through November 12, 2008, the Company sold 569,800 shares of common stock in a private offering to various qualified purchasers at $10.00 per share, resulting in gross proceeds of $5,698,000 (the “Private Offering”). After the payment of placement agent commissions and other offering costs of $454,566, the Company received net proceeds of $5,243,434 in connection with the Private Offering.
On June 11, 2009, the Company commenced a continuous public offering pursuant to which the Company intended to sell from time-to-time up to 10 million shares of its common stock at an initial offering price of $10.00 per share, adjusted for volume discounts and commission waivers. The continuous public offering concluded on June 30, 2011, with the final closing of escrowed funds received from subscribing investors occurring on July 11, 2011. During the period from June 11, 2009 through December 31, 2009, no shares of common stock were sold and no proceeds were received from the Company’s continuous public offering.
During the year ended December 31, 2010, the Company sold 2,290,399 shares of common stock at an average price of $9.96 per share, resulting in gross proceeds of $22,809,653 and net proceeds of $20,613,587, after payment of $2,196,066 in dealer manager fees and commissions.
During the nine months ended September 30, 2011, the Company sold 6,423,306 shares of common stock at an average price of $9.96 per share, resulting in gross proceeds of $63,990,347 and net proceeds of $57,809,753, after payment of $6,180,594 in dealer manager fees and commissions.
22
Keating Capital, Inc.
Notes to Financial Statements
(Unaudited)
|
On a cumulative basis under the continuous public offering, the Company sold 8,713,705 shares of common stock at an average price of $9.96 per share, resulting in gross proceeds of $86,800,000 and net proceeds of $78,423,340, after payment of $8,376,660 in dealer manager fees and commissions. Included in the continuous public offering were 564 shares of common stock issued to the Investment Adviser at a price of $10.00 per share and for total gross proceeds of $5,640.
|
|
|
Offering expenses directly related to the continuous public offering totaling $965,169 on a cumulative basis were initially deferred and subsequently amortized and charged against the gross proceeds of the continuous public offering, as a reduction to additional paid-in capital, on a straight-line basis beginning with the closing of the first common stock issuance on January 11, 2010 and continuing through the conclusion of the offering period on June 30, 2011. During the year ended December 31, 2010, deferred offering costs totaling $476,806 were amortized and charged as a reduction to additional paid-in capital. During the nine months ended September 30, 2011, deferred offering costs totaling $488,363 were amortized and charged as a reduction to additional paid-in capital.
|
|
|
|
|
|
Offering expenses incurred subsequent to January 11, 2010 associated with maintaining the registration of the continuous public offering (e.g., legal, accounting, printing and blue sky) were expensed as incurred. During the three months ended September 30, 2011 and 2010, $1,625 and $8,747, respectively, in offering expenses associated with maintaining the registration of the continuous public offering were expensed as incurred and were classified as Stock Issuance Expenses in the accompanying Statement of Operations. During the nine months ended September 30, 2011 and 2010, $114,388 and $115,940, respectively, in offering expenses associated with maintaining the registration of the continuous public offering were expensed as incurred and were classified as Stock Issuance Expenses in the accompanying Statement of Operations.
|
|
7.
|
Stockholder Distributions
|
|
On February 11, 2011, the Company’s Board of Directors declared a special cash distribution of $0.13 cents per share. The distribution was paid on February 17, 2011 to the Company’s stockholders of record as of February 15, 2011. As of the record date, there were 3,437,212 shares of common stock outstanding resulting in a cash distribution totaling $446,837. This special cash distribution was paid based on the unrealized appreciation recorded on the Company’s NeoPhotonics investment as of the distribution date and, as such, will be treated as a return of capital to its stockholders. However, in the event the Company is able to sell all or a portion of its NeoPhotonics common shares, or any of its other portfolio company investments with a holding period of at least one year at the time of sale, at a gain during 2011, all or a portion of this special distribution may be reclassified at year end as a capital gain distribution to the Company’s stockholders.
|
|
|
8.
|
Changes in Net Assets Per Share
|
|
The following table sets forth the computation of the basic and diluted per share net decrease in net assets resulting from operations for the three and nine months ended September 30, 2011 and 2010:
|
|
Three Months Ended
|
Nine Months Ended
|
|||||||||||||||
|
September 30,
|
September 30,
|
September 30,
|
September 30,
|
|||||||||||||
|
2011
|
2010
|
2011
|
2010
|
|||||||||||||
|
Numerator for (decrease) in net assets per share
|
$ | (1,360,168 | ) | $ | (386,822 | ) | $ | (2,580,603 | ) | $ | (650,213 | ) | ||||
|
Denominator for basic and diluted weighted average shares
|
9,103,658 | 1,493,101 | 6,125,439 | 1,097,041 | ||||||||||||
|
Basic and diluted net (decrease) in net assets per share
|
||||||||||||||||
|
resulting from operations
|
$ | (0.15 | ) | $ | (0.26 | ) | $ | (0.42 | ) | $ | (0.59 | ) | ||||
|
During the three and nine months ended September 30, 2011 and 2010, the Company had no dilutive securities outstanding.
|
23
|
Management’s Discussion and Analysis of Financial Condition and Results of Operations.
|
FORWARD-LOOKING STATEMENTS
Some of the statements in this quarterly report on Form 10-Q constitute forward-looking statements because they relate to future events or our future performance or financial condition. These forward-looking statements are not historical facts, but rather are based on current expectations, estimates and projections about us, our prospective portfolio investments, our industry, our beliefs, and our assumptions. The forward-looking statements contained in this quarterly report on Form 10-Q may include statements as to:
|
|
·
|
Our future operating results;
|
|
|
·
|
Our business prospects and the prospects of our portfolio companies;
|
|
|
·
|
The impact of the investments that we expect to make;
|
|
|
·
|
The ability of our portfolio companies to achieve their objectives;
|
|
|
·
|
Our expected financings and investments;
|
|
|
·
|
The adequacy of our cash resources and working capital; and
|
|
|
·
|
The timing of cash flows, if any, from the operations of our portfolio companies.
|
In addition, words such as “anticipate,” “believe,” “expect” and “intend” indicate a forward-looking statement, although not all forward-looking statements include these words. The forward-looking statements contained in this quarterly report on Form 10-Q involve risks and uncertainties. Our actual results could differ materially from those implied or expressed in the forward-looking statements for any reason, including the factors set forth in “Risk Factors” in our annual report on Form 10-K filed with the SEC on February 28, 2011 and elsewhere in this quarterly report on Form 10-Q or incorporated by reference herein.
We have based the forward-looking statements included in this quarterly report on Form 10-Q on information available to us at the time we filed this quarterly report on Form 10-Q with the SEC, and we assume no obligation to update any such forward-looking statements. Except as required by the federal securities laws, we undertake no obligation to revise or update any forward-looking statements, whether as a result of new information, future events or otherwise. You are advised to consult any additional disclosures that we may make directly to you or through reports that we in the future may file with the SEC, including annual reports on Form 10-K, quarterly reports on Form 10-Q and current reports on Form 8-K. The forward-looking statements and projections contained in this quarterly report on Form 10-Q are excluded from the safe harbor protection provided by Section 21E of the Securities Exchange Act of 1934, as amended (the “Exchange Act”).
24
MANAGEMENT’S DISCUSSION AND ANALYSIS
OF FINANCIAL CONDITION AND RESULTS OF OPERATIONS
The following Management’s Discussion and Analysis of Financial Condition and Results of Operations should be read in conjunction with our financial statements and the related notes and schedules thereto.
Business Overview
We are a closed-end, non-diversified investment company that has elected to be regulated as a business development company under the Investment Company Act of 1940, as amended (the “1940 Act”). We specialize in making pre-initial public offering (“IPO”) investments in innovative, high growth private companies that are committed to and capable of becoming public. We provide individual investors with the ability to participate in a unique fund that invests in a private company's later stage, pre-IPO financing round—an opportunity that has historically been reserved for institutional investors.
We believe we provide three core benefits to our stockholders as follows:
· We believe we are the first and only public investment fund exclusively dedicated to pre-IPO investing in the U.S. Unlike private venture capital funds, we believe that our fund is transparent and will provide liquidity to our stockholders once our common stock becomes listed on the Nasdaq Capital Market, which we expect will occur by the end of 2011.
· We provide access to later-stage (i.e., pre-IPO) investments in emerging growth companies that would otherwise be difficult to access or inaccessible for most of our individual investors.
· Because of our profile as a flexible, non-controlling investor, we believe we are well positioned to participate in the last round of private financing that high growth companies typically need before they complete an IPO.
In certain cases, we are able to act as the lead investor in pre-IPO financing rounds because existing institutional investors may be precluded from doing so due to their ownership or board participation. In these cases, we may be able to propose terms as the new lead investor with larger existing investors typically participating in this pre-IPO round as well. Unlike other funds, we are able to act as a lead investor because we will not seek to take a control position through ownership or board seats. Furthermore, our ability to typically make investment decisions in a relatively short time frame (i.e., usually within 30 days if information is provided to us in a timely manner) is attractive to the company’s existing management and institutional investors and therefore makes us a desirable partner in a transaction with other institutional investors.
Our Investment Adviser
We are externally managed by Keating Investments, LLC (“Keating Investments”), an investment adviser that was founded in 1997 and is registered under the Investment Advisers Act of 1940, as amended (the “Advisers Act”). As our investment adviser, Keating Investments is responsible for managing our day-to-day operations including, without limitation, identifying, evaluating, negotiating, closing, monitoring and servicing our investments. Keating Investments also provides us with the administrative services necessary for us to operate. Our investment activities are managed by Keating Investments pursuant to an investment advisory and administrative services agreement (the “Investment Advisory and Administrative Services Agreement”).
The managing member and majority owner of Keating Investments is Timothy J. Keating. Our investment adviser’s senior investment professionals are Timothy J. Keating, our President, Chief Executive Officer and Chairman of our Board of Directors, Frederic M. Schweiger, our Chief Operating Officer, Chief Compliance Officer and Secretary, Kyle L. Rogers, our Chief Investment Officer and Ranjit P. Mankekar, our Chief Financial Officer, Treasurer and a member of our Board of Directors. In addition, Keating Investments employs three other investment professionals dedicated to portfolio company origination, due diligence and financial analysis.
Keating Investments has established an investment committee (“Investment Committee”) that must unanimously approve each new portfolio company investment that we make. The members of the Investment Committee currently consist of Timothy J. Keating, Kyle L. Rogers and Frederic M. Schweiger.
Under the Investment Advisory and Administrative Services Agreement, we have agreed to pay Keating Investments, for its investment advisory services, a base management fee based on our gross assets as well as an incentive fee based on our performance. The base management fee (the “Base Fee”) is calculated at an annual rate of 2% of our gross assets, where gross assets include any borrowings for investment purposes. We do not presently expect to use borrowed funds for the purpose of making portfolio investments. The base management fee is payable monthly in arrears, and is calculated based on the value of our gross assets at the end of the most recently completed calendar quarter, and appropriately adjusted for any equity capital raises or repurchases during the current calendar quarter.
25
The incentive fee is determined and payable in arrears as of the end of each calendar year and equals 20% of our realized capital gains, if any, on a cumulative basis from inception through the end of each calendar year, computed net of all realized capital losses and unrealized capital depreciation on a cumulative basis, less the aggregate amount of any previously paid incentive fees.
We also reimburse Keating Investments on a monthly basis for our allocable portion of overhead and other expenses incurred by it in performing its administrative obligations under the Investment Advisory and Administrative Services Agreement, including our allocable portion of the compensation of our Chief Financial Officer and Chief Compliance Officer, and their respective staff.
Governance
Our Board of Directors monitors and performs an oversight role with respect to our business and affairs, including with respect to investment practices and performance, compliance with regulatory requirements and the services, expenses and performance of our service providers. Among other things, our Board of Directors approves the appointment of our investment adviser and officers, reviews and monitors the services and activities performed by our investment adviser and officers, and approves the engagement, and reviews the performance of, our independent registered public accounting firm. Pursuant to the requirements under the 1940 Act and to satisfy the Nasdaq listing standards, our Board of Directors is comprised of a majority of non-interested, independent, directors.
Our Board of Directors has established the Audit Committee, the Valuation Committee and the Nominating Committee to assist the Board of Directors in fulfilling its oversight responsibilities. Each of these committees is comprised solely of non-interested, or independent, directors. The Audit Committee’s responsibilities include overseeing our accounting and financial reporting processes, our systems of internal controls over financial reporting, and audits of our financial statements. The Valuation Committee’s responsibilities include reviewing preliminary portfolio company investment valuations from our investment adviser and making recommendations to our Board of Directors regarding the valuation of each investment in our portfolio. The Nominating Committee’s responsibilities include identifying qualified individuals to serve on our Board of Directors, and to select, or recommend that the Board of Directors select, the Board nominees.
Our Investment Strategy
Our fund is focused on capital appreciation and growth, which we seek to achieve through investments in the equity securities of later stage, private, pre-IPO companies. By design, the fund has been structured as a high risk/high return investment vehicle. While we have discretion in the investment of our capital, we seek long-term capital appreciation through investments principally in equity securities that we believe will maximize our total return.
Our investment objective is to maximize capital appreciation. We seek to accomplish our capital appreciation objective by making investments in the equity securities of later stage, typically venture capital backed, pre-IPO companies. We expect that our investment portfolio will consist of securities that do not provide current income through interest or dividend income. In accordance with our investment objective, we seek to invest in equity securities of principally U.S.-based, private companies with an equity value of between $100 million and $1 billion. We refer to companies with an equity value of between $100 million and less than $250 million to as “micro-cap companies” and companies with an equity value of between $250 million and $1 billion as “small-cap companies.”
Our portfolio company investments are typically in the form of convertible preferred securities that are convertible into common stock, common stock, warrants exercisable into common or preferred stock, or structured as a loan that is convertible into common stock. While we expect most of our portfolio company investments to be in the form of equity securities, we may in some cases invest in debentures that are convertible into common stock.
We generally acquire our equity securities principally through direct investments in prospective portfolio companies. However, we may also purchase equity securities in so-called “secondary transactions” from selling stockholders in later stage, private, pre-IPO companies, who are typically either current or former management or early stage investors in these companies. Our secondary investment opportunities are typically sourced though either private secondary markets that specialize in the trading of private company securities or our investment banking relationships. At the time of our investment, the equity securities we acquire are generally illiquid due to restrictions on resale and to the lack of an established trading market.
We intend to maximize our potential for capital appreciation by taking advantage of the premium we believe is generally associated with having a more liquid asset, such as a publicly traded security. Specifically, we believe that an exchange listing, if obtained, will generally provide our portfolio companies with greater visibility, marketability and liquidity than they would otherwise be able to achieve without such a listing. We believe investors place a premium on liquidity, or having the ability to sell stock quickly and efficiently through an established stock exchange. As a result, we believe that public companies typically trade at higher valuations – generally 2x or more – than private companies with similar financial attributes. By going public and listing on an exchange, we believe that our portfolio companies have the potential to receive the benefit of this liquidity premium. However, there can be no assurance that our portfolio companies will trade at these higher valuations once they are public and listed on an exchange.
26
We do not intend to borrow funds in the foreseeable future to finance the purchase of our investments in portfolio companies. However, in the event we do borrow funds to make investments, we are exposed to the risks of leverage, which may be considered a speculative investment technique. Borrowings, also known as leverage, magnify the potential for gain and loss on amounts invested and therefore increase the risks associated with investing in our securities. In addition, the costs associated with our borrowings, including any increase in the management fee payable to our investment adviser, will be borne by our common stockholders. We also do not intend to lend the securities of our publicly traded portfolio companies to generate fee income.
Current Market Opportunity and Conditions
Over the past 15 years, the public capital formation process in the U.S. has changed, with the average market capitalization of a company completing an IPO and the average amount raised in an IPO having increased substantially. As a result of these market conditions, micro- and small-cap companies generally must demonstrate an ability to raise private capital prior to an IPO to be successful in the IPO process. We believe these pre-IPO rounds evidence existing investors’ continuing commitment to the company, establish new investors’ pricing for the round, and strengthen the company’s balance sheet as it prepares for the IPO process.
While existing institutional investors typically participate in the pre-IPO financing, these companies must also be able to attract new investors to validate the pricing of the later-stage, pre-IPO round. In a number of cases, we have participated in, and set the terms of, these pre-IPO rounds since the existing investors have been conflicted as a result of their ownership interests or board participation. Further, since we do not require board seats, observation rights, or other control provisions, we allow the current management and board to remain focused on executing the company’s business strategy. As a non-controlling pre-IPO investor, we believe we are well positioned to participate in the final round of pre-IPO financing before these micro- and small-cap companies go public.
While the stock market has declined sharply during the third quarter of 2011 – the Dow Jones Industrial Average, or Dow, recording a drop of 12% – volatility also spiked. The Dow increased or decreased more than 200 points for 18 days during the third quarter. In August, there were four consecutive days of 400 point swings in the Dow – a first in the 115-year history of the index. The CBOE Volatility Index, commonly referred to as VIX, a measure of market expectations of short-term volatility, increased 160% during the third quarter. We believe recent stock market volatility has affected the U.S. IPO market and a decline in volatility could be a catalyst for the IPO market.
A stock market characterized by high volatility and declining prices/valuation multiples can be both positive and negative for our investment strategy. On the one hand, it adversely impacts the timing and value of our portfolio company exits, both in terms of companies completing IPOs and ultimately in the value we are able to realize from the disposition of our publicly traded portfolio companies after our lockup restrictions expire. On the other hand, declining valuations of comparable public companies or recently completed IPOs that we typically analyze in assessing new portfolio company investments may provide us with better pricing or terms, or both, for these new investments.
Based on our experience, while the third quarter 2011 IPO market was lower than in previous quarters, we believe there will be an increased appetite for risk for growth companies that have solid revenue and demonstrate profitability. This, in turn, should allow for an increase in IPO activity in the fourth quarter of 2011 and into 2012. Our overall goals remain unchanged. We intend to maintain our position in investing in the securities of later stage, pre-IPO companies that are positioned for growth and to potentially increase our NAV.
As of September 30, 2011, we have cash reserves of $45.1 million, all of which are currently invested in money market funds backed by U.S. Treasury securities, U.S. Government agency securities, and repurchase agreements fully-collateralized by such securities. We intend to use these cash reserves to finance our new, and possibly follow-on, investments in equity securities. We believe the current economic climate will also provide us opportunities to invest this capital at attractive valuations.
27
We compete for investment opportunities with later stage venture capital firms, private equity firms, public funds investing in private companies, other business development companies, existing portfolio company investors, and investors participating in private secondary markets. Many of these entities have greater financial and managerial resources than we have.
We currently anticipate completing five to ten investments per year until the proceeds of our continuous public offering have been invested. Assuming we can deploy our capital at this rate, we anticipate that it will take approximately 18 months to invest substantially all of our capital in portfolio companies. We can provide no assurance that we will be able to meet our anticipated pace of investment.
Our Investment Criteria
We have identified three core criteria that we believe are important in meeting our investment objective. These core criteria provide the primary basis for making our investment decisions; however, we may not require each prospective portfolio company in which we choose to invest to meet all of these core criteria.
· High quality growth companies. We seek to invest primarily in micro-cap and small-cap companies that are already generating annual revenue in excess of $10 million on a trailing 12-month basis and which we believe have growth potential. However, in certain opportunistic situations, we may invest in development stage, pre-revenue stage and early revenue stage companies if there is a clear and verifiable path to generating meaningful revenue within the next 12 months. We examine the market segment in which each prospective portfolio company is operating, including its size, geographic focus and competition, to determine whether that company is likely to meet its projected growth rate prior to investing.
· Commitment to complete IPO. We seek to invest in public ready micro-cap and small-cap companies whose management teams are committed to, and capable of, becoming public companies, whose businesses we believe will benefit from status as public companies, and that we believe are capable of completing IPOs and obtaining exchange listings typically within 18 months after we complete our investments. We generally require that our portfolio companies have in place, or be committed to hiring, a qualified chief financial officer, have complete or near-complete audited financial statements, for a minimum of two years, and satisfy or are committed to satisfying certain governance requirements for an exchange listing (including the appointment of an independent board and an audit committee).
· Potential for return on investment. Because of the value differential which we believe exists between public and private companies as a result of the liquidity premium, we seek to make investments that create the potential for a 2x return on our investment once the company is publicly traded and assuming our expected investment horizon of up to three years.
In addition, we may also consider a number of other factors outside of our core criteria in evaluating a portfolio company investment opportunity. Some of the factors we may consider include: (i) whether we believe there is a proven demand for the company’s products or services that address large market opportunities, (ii) whether the company has developed defendable market positions within its respective markets and is well positioned to capitalize on growth opportunities, (iii) whether the company has an experienced management team with public company experience, and (iv) whether the company is at or near profitability or is demonstrating a clear path to generating profitability on an EBITDA or cash flow from operations basis.
Our Target Industries
While we focus on micro-cap and small-cap companies across a broad range of growth industries that we believe are being transformed by technological, economic and social forces, we intend to focus our investments in the following industries, or in companies that support companies in these industries:
· Technology. We classify “technology” companies as those that manufacture and/or market products based on communications and networking infrastructure, equipment and products (including LANS, WANS, routers, telephones, switchboards, and exchanges), electronic equipment, instruments, electronic components and electronic equipment (including analytical, electronic test and measurement instruments, electronic components, connection devices, equipment not classified elsewhere, and distributors of technology hardware and equipment), providers of commercial electronic data processing and/or business process outsourcing services such as back-office automation, manufacturers and marketers of consumer electronics and other technology-based products, and providers or developers of analytics, testing and diagnostics in the life sciences.
· Internet and software. We classify “Internet and software” companies as those companies developing and marketing Internet software and/or providing Internet services including mobile applications, cloud computing, online databases and interactive services, database construction, Internet design services, retail goods or services, commercial and business-to-business services, and wholesale and distribution services, and application, systems, and home entertainment software companies engaged in developing and producing software designed for specialized applications for the business or consumer market.
28
· Cleantech. We classify “cleantech” companies as those that seek to improve performance, productivity or efficiency, and to reduce environmental impact, waste, cost, energy consumption or raw materials, with particular focus on energy generation (solar, wind, advanced biofuels, hydro), energy storage (batteries, utility scale storage, fuel cells), energy efficiency (building materials, windows, lighting), energy management software and systems, energy infrastructure (grid hardware and smart metering), and waste recycling and repurposing.
Because certain industry segments require specialized knowledge, we typically do not consider investments in real estate, construction, and mining and exploration. While we invest primarily in U.S. companies, we may invest on an opportunistic basis in certain non-U.S. companies that otherwise meet our investment criteria, although in no event will the aggregate value of our non-U.S. investments exceed 30% of the aggregate value of our total assets. We also typically avoid investments in companies whose principal place of business and executive management is located in China due to the unique due diligence risks currently associated with these types of companies.
Diversification
Beyond our regulated investment company (“RIC”) diversification requirements (see “Taxation and Regulatory Requirements” below), we do not have fixed guidelines for portfolio diversification and, as a result, our investments could be concentrated in relatively few industry sectors, companies or geographic areas. Further, we also expect that all or a substantial portion of our portfolio may be invested in illiquid securities.
Based on current level of our assets, we expect that the size of our individual portfolio company investments will range from approximately $3 to $5 million, but we may invest more than this amount in certain opportunistic situations. We expect that most of our portfolio company investments will represent about 5% of our total assets at the time of investment. However, based on our investment adviser’s assessment of each portfolio company’s relative quality, fundamentals and valuation, we may make opportunistic portfolio company investments that could represent up to 25% of our total assets at the time of investment.
We do not choose specific investments based on a strategy of industry diversification and do not intend to rebalance our portfolio if one of our portfolio company investments increases in value relative to the remaining portion of the portfolio. As a result, our portfolio may be more vulnerable to events affecting a single economic sector, industry or portfolio company and, therefore, subject to greater potential volatility than a company that follows a more diversified strategy.
As of September 30, 2011, our portfolio company investments by value were allocated among our industry classifications as set forth in the table below.
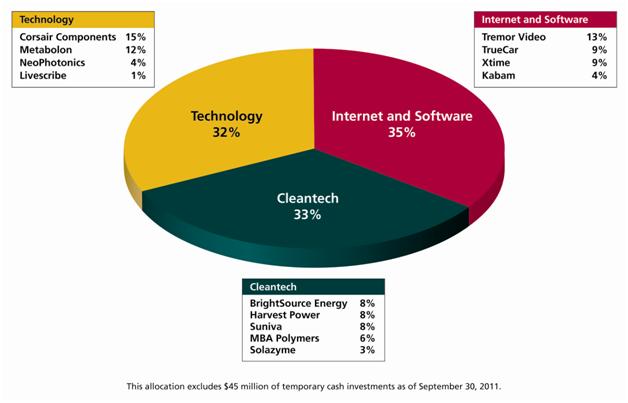
As of September 30, 2011, our portfolio consisted entirely of equity securities. Our two publicly traded portfolio companies, NeoPhotonics Corporation (“NeoPhotonics”) and Solazyme, Inc. (“Solazyme”) represented by value approximately 6.5% of our total portfolio at September 30, 2011. Our shares in NeoPhotonics are freely tradable, while our shares in Solazyme remain subject to a lockup agreement which expires in November 2011. The remaining 93.5% of our portfolio at September 30, 2011 consists of restricted securities which are illiquid.
With our focus on later-stage, pre-IPO companies based in the U.S., venture-backed private companies headquartered in California (which received nearly 43% of all venture capital investments in 2010) will likely continue to comprise a large portion of our portfolio. As of September 30, 2011, we held investments in nine portfolio companies headquartered in California which represented by value approximately 59.3% of our total portfolio. We believe that many of the California-based portfolio companies that we may invest in will have significant operations and customers outside of California.
Further, as a business development company, we may invest up to 30% of our assets in foreign investments, but currently we do not classify any portfolio company investments as foreign investments.
29
Our Investment Process
Investment Sourcing
The primary sources of our investment opportunities are from our relationships with venture capital firms and investment banks, secondary markets that specialize in the trading of private company securities, and our direct outreach to private companies.
· Venture capital firms. We believe that a majority of our investment opportunities will come from venture capital firms with existing portfolio companies seeking later stage, pre-IPO financing. We have positioned ourselves to be a source of financing that can, if requested, establish the price and other terms for a private company’s final private financing round where existing institutional investors, who are also likely to have board seats, prefer to have a new investor lead the financing round. For financing rounds of up to approximately $50 million, our targeted $3 to $5 million investment size is attractive to existing institutional investors who prefer a smaller and less dilutive final private round to strengthen the balance sheet. In addition, by not seeking out board seats, observation rights or other control features, we allow the private company’s existing management and board to focus on executing its business strategy. We will, however, make available managerial assistance to our portfolio companies upon request.
· Investment banks and private secondary markets. We also expect to source our investment opportunities from either investment banks or private secondary markets that are focused on emerging growth companies that meet our investment criteria. We have developed, and expect to continue building relationships with national and regional investment banking firms that are recognized as leaders in these sectors. We expect our investment banking relationships to source both direct investments in prospective portfolio companies as well as a growing number of secondary transactions from selling stockholders in companies meeting our investment criteria.
We also intend to utilize private secondary markets to acquire equity investments in privately-held companies that meet our investment criteria. These private secondary markets have emerged as an alternative to traditional public equity exchanges to provide liquidity principally to the stockholders of venture capital-backed, private companies. While these private secondary markets have more limited transaction volume than public exchanges, they may provide us with access to blocks of shares from current or former management and early stage investors that are interested in selling privately. While such block sales of shares may be restricted by contractual transfer restrictions and company policies, which may impose strict limits on transfer, we believe that our profile as a dedicated pre-IPO investor with a history of making later stage investments in securities of venture capital-backed companies affords us a favorable position when seeking approval for a purchase of shares subject to such limitations.
One limitation to private secondary market transactions is the difficulty in accessing financial information on the portfolio company in whose securities we intend to invest. For this reason, we intend to focus on transactions where we will have access to management, as well as financial data and other information about the private company. This management access is important to assure the flow of the company’s financial and other information to us both before and after our investment.
· Direct outreach to private companies. We also expect to source investment opportunities from our direct outreach to private companies. We have implemented a proactive marketing program to communicate with our investment adviser’s established referral network and with companies that meet our investment criteria. We also maintain and continually update a database of emerging growth, venture capital-backed, private companies that we believe currently satisfy, or will satisfy within the next year, our investment criteria. Our database has been compiled from opportunities identified by our referral network, from publicly available information, and from acquired sources.
Portfolio Company Review and Approval
Once we identify those private companies that we believe warrant more in-depth analysis, we utilize an investment review and approval process focused on the following factors:
|
|
·
|
Qualification. We obtain information from the company’s management and/or placement agent and conduct a preliminary evaluation of the opportunity with primary focus on understanding the business, historical and projected financial information, industry, competition and valuation to ascertain whether we have interest in pursuing the investment.
|
30
|
|
·
|
Analysis. Assuming our preliminary evaluation warrants further analysis, we will conduct further research on the company’s prospects and industry, participate in additional discussions with the company’s management, placement agent and existing investors, and prepare an internal investment memorandum which discusses our evaluation findings and recommendations, together with an internal valuation analysis outlining our acceptable valuation ranges for an investment.
|
|
|
·
|
Term Sheet. In situations where we are able to act as a lead investor, we negotiate a term sheet with the prospective company which, among other things, will establish the pricing and structure of our investment, consistent with the parameters set by our investment adviser’s Investment Committee.
|
|
|
·
|
Approval. Once an acceptable term sheet has been negotiated, or we have confirmed the terms of an investment where we are not the lead investor, our investment adviser’s Investment Committee reviews the investment pricing and structure, the internal investment memorandum and valuation analysis and, when appropriate, approves the investment subject to completion of satisfactory due diligence.
|
|
|
·
|
Due Diligence. Prior to closing an investment, we conduct further due diligence with a focus on verifying or validating the primary considerations used by our investment adviser’s Investment Committee in approving the investment.
|
|
|
·
|
Closing. The consummation of each investment will depend upon satisfactory completion of our due diligence investigation, our confirmation and acceptance of the investment pricing and structure, and our review and acceptance of definitive agreements.
|
Portfolio Company Investment Structure
Based on current level of our assets, we expect that the size of our individual portfolio company investments will range from approximately $3 to $5 million, but we may invest more than this amount in certain opportunistic situations. Our portfolio company investments are typically in the form of convertible preferred securities that are convertible into common stock, common stock, warrants exercisable into common or preferred stock, or structured as a loan that is convertible into common stock. We may also invest in debentures that are convertible into common stock, however, as of September 30, 2011, none of our investments have been convertible debenture investments.
In those investment opportunities where we are the lead investor or are directly negotiating terms with the selling stockholders, we may attempt to structure our preferred stock investments to provide a special conversion feature so that, upon an IPO, we would receive common stock having a value at the time of the IPO equal to 2x our original purchase price. If we are acting as a lead investor in a secondary transaction involving common stock, we may attempt to structure the deal with escrowed shares, contingent warrants or options, or other price adjustments to potentially provide us with similar economics. Even in cases where we are the lead investor, there is no assurance that we will be successful in negotiating these favorable, structured terms in each of our investments.
Where we are not the lead investor in a pre-IPO financing round or unable to negotiate terms directly with selling stockholders in a secondary transaction, the price and terms of the investment have generally already been established by the issuer and/or its placement agent or by the selling stockholder group and/or its adviser. In these deals, we typically we will not have the favorable, structured terms that we may be able to negotiate as the lead investor, although some variation may be included in certain investments.
Our convertible preferred equity investments typically pay fixed or adjustable rate dividends to us and will generally have a “preference” over common equity in the payment of dividends and the liquidation of a portfolio company's assets. This preference means that a portfolio company must pay dividends on preferred equity before paying any dividends on its common equity. However, in order to be payable, dividends on such preferred equity must be declared by the portfolio company's board of directors. In the event dividends on our preferred stock investments are non-cumulative, which is typically the case, if the board of directors of our portfolio companies does not declare a preferred dividend for a specific period, we will not be entitled to a preferred dividend for such period. We do not expect the board of directors of our portfolio companies to declare preferred dividends since these companies typically prefer to retain profits, if any, in their business. Accordingly, we do not expect to generate dividend income on our preferred stock investments. Cumulative dividend payments on preferred equity means dividends will accumulate even if not declared by the board of directors or otherwise made payable. In such a case, all accumulated dividends must typically be paid before any dividend on the common equity can be paid. However, there is no assurance that any dividends will be paid by a portfolio company even in the case of cumulative preferred dividends and, in most cases, the payment of any accumulated preferred dividends is likely to be deferred until conversion and, if paid, may be paid in shares of the issuer’s preferred or common stock.
31
As of September 30, 2011, we have made a total of 13 portfolio company investments, of which 11 have been structured as convertible preferred stock and the remaining two investments structured as common stock. Only one of our current preferred stock investments has cumulative dividends with the other preferred stock investments having non-cumulative dividends. Other than our investment in the common stock of Corsair Components, Inc., which we purchased from a group of current and former management, all of our investments have been direct investments in the portfolio company.
Our Investment Horizon
In general, we seek to invest in micro-cap and small-cap companies that we believe will be able to file a registration statement with the SEC for an IPO within approximately 12 months after our investment, and complete an IPO and obtain an exchange listing within approximately 18 months after the closing of our investment. After the IPO is completed, we typically will be subject to a lockup restriction which prohibits us from selling our investment during the customary 180 day period following the IPO. Once this lockup restriction expires, we expect to sell our shares in the portfolio company in the public markets over the following 12 months. However, we have the discretion to hold our position to the extent we believe the portfolio company is not being appropriately valued in the public markets or is adversely affected by market or industry cyclicality. Accordingly, we anticipate our typical investment horizon for portfolio investments will be up three years, however we have the discretion to hold securities for a longer period.
We can provide no assurance, however, that the micro-cap and small-cap companies in which we invest will be able to successfully complete an IPO, or that they will be successful in obtaining an exchange listing within the expected timeframe, if at all. In such cases, our expected portfolio company investment horizon may exceed three years, and we may take other steps to exit the investment including the use of secondary marketplaces that specialize in the trading of private company securities. A private secondary market may give us an alternative means of exiting our private company investments, as well as increased visibility from trading on a marketplace, in the event a portfolio company’s IPO is delayed due to market conditions or is no longer a viable exit strategy. Although we expect that some of our equity investments may trade on private secondary markets, as a general rule we expect that the securities we hold will be less liquid than larger publicly traded securities. In addition, while some of our portfolio companies may trade on private secondary markets, we can provide no assurance that these private trading markets will continue or remain active, or that we will be able to sell our positions in any portfolio company at the time we desire to do so and at the price we anticipate.
While these private secondary markets may provide us with a potential source of qualified buyers, in the event that we choose to liquidate a portfolio company investment privately, our shares will typically be subject to legal or other restrictions on resale that may prevent us from using trading platforms or selling our securities.
Since we do not seek to control any of our portfolio companies, or have a board seat, we generally do not expect to have input as to when, or if, our portfolio companies choose to pursue an IPO. In certain cases, our portfolio companies may choose to delay the pursuit of an IPO because of either adverse conditions in their particular industry or the IPO and equity markets generally. In other cases, our portfolio companies may be performing poorly or not achieving the milestones that an investment bank would require to underwrite an IPO. In such cases, our portfolio companies may need to raise additional capital, which may cause dilution to, or adversely affect, our ownership interests, or we may have to make additional follow-on investments pro rata with other investors in order to preserve our rights and preferences of our initial investment.
In certain situations, our portfolio companies may abandon the pursuit of an IPO altogether, either because the completion of an IPO is no longer a realistic possibility, or, alternatively, because another company seeks to acquire our portfolio company. If a portfolio company has abandoned plans to pursue an IPO and we are not able to liquidate our shares privately, we may seek to have the portfolio company consider a sale or merger with a strategic buyer as a possible alternative to an IPO or pursue a “dual” strategic sale and IPO exit strategy.
Portfolio Company Monitoring
As part of our portfolio company investment, we attempt to negotiate information rights that give us access to the company’s quarterly and annual financial statements as well as the company’s annual budget. Although we do not have a control position through our ownership or board seats, we attempt to have dialogue, on at least a quarterly basis, with our private portfolio company management teams to review the company’s business prospects, financial results, and exit strategy plans. We monitor the financial trends of each portfolio company to assess the performance of individual companies as well as to evaluate overall portfolio quality and risk. We also monitor our portfolio for compliance with the diversification requirements for purposes of maintaining our status as a business development company under the 1940 Act and a RIC for tax purposes.
32
We are also available to provide managerial assistance, if requested, to our portfolio companies. We expect that this managerial assistance will likely involve consulting and advice on the going public process and public capital markets. As a business development company, we are required to offer, and in some cases provide and be paid for, such managerial assistance.
Disposition of Investments in Publicly Traded Portfolio Companies
We are typically prohibited from exiting investments in our publicly traded portfolio company until the expiration of the customary post-IPO lockup agreement. These agreements, which we are required to enter into as part of our initial investment, prohibit us and other significant existing investors from selling stock in the portfolio company or hedging such securities during the customary 180 days following an IPO. We may dispose of these securities at our discretion at any time following the lockup period based on our business judgment. However, we will have no ability to mitigate the high volatility that is a typical characteristic of IPO aftermarket trading and is driven by such factors as overall market conditions, the industry conditions for the particular sector in which the portfolio company operates, the portfolio company’s performance, the relative size of the public float, and the potential selling activities of other pre-IPO investors and possibly management.
For our portfolio company investments where the lockup period following the IPO has expired and the stock becomes freely tradable, we typically do not begin selling automatically upon expiration of the lockup period. We expect to sell our positions over a period of time, typically during the 12 months following the expiration of our lockup, although we may sell more rapidly or in one or more block transactions. Factors that we may consider include, but are not limited to, the following:
· The target price determined by our investment adviser based on its business judgment and what it believes to be the portfolio company’s intrinsic value.
· The application of public company multiples and our proprietary analysis to a variety of operating metrics for each portfolio company. The primary operating metrics that we typically consider are revenue, EBITDA and net income.
· Other factors that may be adversely or favorably affecting a particular portfolio company’s stock price, including overall market conditions, industry cyclicality, or issues specific to the portfolio company.
We do not typically intend to purchase stock in any of our portfolio company’s IPOs or in the secondary market and, in the event we elect to do so, we are subject to certain regulatory restrictions as a business development company. However, under certain circumstances, we may consider making additional open market purchases of an existing portfolio company’s stock, which will increase our position in the company.
Because the portfolio company securities that we acquire are typically illiquid until an IPO or sale of the company, we generally cannot predict the regularity and time periods between dispositions of our portfolio company investments and the realizations of capital gains, if any, from such dispositions. Dispositions of our portfolio company investments are discretionary and based on our business judgment. Since we do not expect to generate current income from our portfolio company investments, our annual operating expenses will be financed from our capital base during periods of time between realizations of capital gains on our investments. Accordingly, our future growth will be financed through reinvestment of the proceeds we realize from the sale of our portfolio company investments after we pay our annual operating expenses, any incentive fees earned by our investment adviser, and any distributions of realized net capital gains to our stockholders.
Current Business Environment
Beginning in the fall of 2008, the global economy entered a financial crisis and recession. Volatile capital and credit markets, declining business and consumer confidence and increased unemployment precipitated a continuing economic slowdown. Although there have been signs of recovery in many regions, economic weakness could continue or worsen. For example, the current U.S. debt ceiling and budget deficit concerns, together with signs of deteriorating sovereign debt conditions in Europe, have increased the possibility of credit-rating downgrades and economic slowdowns. Although U.S. lawmakers passed legislation to raise the federal debt ceiling, Standard & Poor’s Ratings Services lowered its long-term sovereign credit rating on the United States from “AAA” to “AA+” on August 5, 2011. The impact of this or any further downgrades to the U.S. government’s sovereign credit rating, or its perceived creditworthiness, and the impact of the current crisis in Europe with respect to the ability of certain European Union countries to continue to service their sovereign debt obligations is inherently unpredictable and could adversely effect the U.S. and global financial markets and economic conditions. There can be no assurance that governmental or other measures to aid economic recovery will be effective.
Continued adverse economic conditions could have a material adverse effect on our business, financial condition and results of operations. Continued global economic uncertainty could also result in investors becoming more risk-averse, which in turn could reduce the amount of growth capital available to our portfolio companies from both existing and new investors, could adversely affect their operating performance, and could delay liquidity paths (i.e., IPO or strategic sale) for our portfolio companies.
33
Portfolio Companies
Two of our portfolio companies, BrightSource Energy, Inc. and Corsair Components, Inc., are currently in registration with the SEC to complete their respective IPOs. We believe that both of these companies are well positioned to benefit from the market becoming more favorable to IPOs. However, there can be no assurances that these companies will complete their IPOs in a timely manner or at all.
In addition, two of our portfolio companies have completed IPOs – NeoPhotonics and Solazyme. The lockup restriction on our NeoPhotonics securities expired in August 2011, and we have not disposed of any of our NeoPhotonics securities to date. Solazyme’s lockup restriction will expire in November 2011.
NeoPhotonics priced its IPO at $11.00 per share and listed on the New York Stock Exchange on February 2, 2011. We own 160,000 shares at a cost basis of $6.25 per share (a 43% discount to the IPO price), for a total investment amount of $1 million. As of September 30, 2011, our investment in NeoPhotonics is fair valued at $1,100,000, based on a market price of $6.88 per share. While NeoPhotonics is currently trading below our sale price target, the stock is still close to our cost basis. NeoPhotonics’ stock has continued to suffer both from industry issues as well as the company’s recent announcement that it would report revenue and earnings below its previous guidance.
Solazyme completed its IPO at $18.00 per share and listed on Nasdaq on May 27, 2011. We own 112,927 shares at a cost basis of $8.86 per share (a 51% discount to the IPO price), for a total investment of $999,991. Our lockup period expires at the end of November 2011. As of September 30, 2011, our investment in Solazyme is fair valued at $977,000, based on a market price of $9.61 per share, reduced by a 10% discount for lack of marketability we applied for the lockup restriction. Although we believe that the performance of Solazyme has been positive and that the company has met all of its stated milestones thus far, we believe the market price of this company reflects the inherent risks and uncertainties of the cleantech sector, and the inherent difficulties in evaluating early stage businesses where the achievement of significant revenue and earnings are usually many years in the future. Additionally, the cleantech industry as a whole has been adversely impacted by the recent bankruptcy filing by solar panel manufacturer Solyndra which had previously received a substantial U.S. government loan guarantee, the global uncertainty about continued government subsidies to support these emerging technologies, and the continued challenges to find cost effective cleantech solutions.
Taxation and Regulatory Requirements
RIC Requirements
We have satisfied the requirements to qualify as a RIC and have elected to be treated as a RIC under Subchapter M of the Code effective for our 2010 tax year. In future years, if we do not meet the criteria to qualify as a RIC, we will be taxed as a regular corporation under Subchapter C of the Code.
As a RIC, we generally will not have to pay corporate-level federal income taxes on any ordinary income or realized capital gains that we distribute to our stockholders as dividends. To continue to qualify as a RIC, we must, among other things, meet certain source of income and asset diversification requirements. In addition, in order to obtain the federal income tax benefits allowable to RICs, we must distribute to our stockholders, for each taxable year, at least 90% of our investment company taxable income (which is generally our net ordinary income plus the excess, if any, of realized net short-term capital gains over realized net long-term capital losses).
Since we do not expect to generate any current income from our portfolio company investments, it is unlikely that we will generate any investment company taxable income that will need to be distributed to maintain RIC status. However, the RIC diversification requirements may affect our ability to pursue additional business opportunities or strategies that, if we were to determine we should pursue, could diminish the desirability of or impede our ability to qualify as a RIC.
In order to avoid a 4% non-deductible federal excise tax imposed on RICs, we must also distribute during each calendar year an amount at least equal to the sum of: (i) 98% of our ordinary income for the calendar year, (ii) 98.2% of our capital gains in excess of capital losses for the one-year period ending on October 31 of the calendar year, and (iii) any ordinary income and net capital gains for preceding years that were not distributed during such years. We will not be subject to this excise tax on amounts on which we are required to pay corporate income tax (such as retained realized net capital gains). We currently intend to make sufficient distributions (including deemed distributions of retained realized net capital gains) each taxable year to avoid the payment of these excise taxes.
34
Investment Company Act of 1940
We have elected to be regulated as a business development company under the 1940 Act. The 1940 Act requires that a majority of our directors be persons other than “interested persons,” as that term is defined in the 1940 Act. In addition, the 1940 Act provides that we may not change the nature of our business so as to cease to be, or to withdraw our election as, a business development company without the approval of a “majority of our outstanding voting securities,” within the meaning of the 1940 Act.
Qualifying assets. Under the 1940 Act, a business development company may not acquire any asset other than assets of the type listed in Section 55(a) of the 1940 Act, which are referred to here as “qualifying assets,” unless, at the time the acquisition is made, qualifying assets represent at least 70% of the company’s total assets (the “70% test”). The principal categories of qualifying assets relevant to our business are any of the following:
(i) Securities purchased in transactions not involving any public offering from the issuer of such securities, which issuer (subject to certain limited exceptions) is an Eligible Portfolio Company, or from any person who is, or has been during the preceding 13 months, an affiliated person of an Eligible Portfolio Company, or from any other person, subject to such rules as may be prescribed by the SEC. An Eligible Portfolio Company is defined in the 1940 Act as any issuer which:
(a) is organized under the laws of, and has its principal place of business in, the United States;
(b) is not an investment company (other than a small business investment company wholly-owned by the business development company) or a company that would be an investment company but for certain exclusions under the 1940 Act; and
(c) satisfies any of the following:
(1) does not have any class of securities listed on a national securities exchange;
(2) is controlled by a business development company or a group of companies including a business development company and the business development company has an affiliated person who is a director of the eligible portfolio company;
(3) is a small and solvent company having total assets of not more than $4 million and capital and surplus of not less than $2 million; or
(4) has a class of securities listed on a national securities exchange, but has an aggregate market value of outstanding voting and non-voting common equity of less than $250 million during the 60 days prior to acquisition by the business development company.
(ii) Securities of any Eligible Portfolio Company which we control.
(iii) Securities purchased in a private transaction from a U.S. issuer that is not an investment company or from an affiliated person of the issuer, or in transactions incident thereto, if the issuer is in bankruptcy and subject to reorganization or if the issuer, immediately prior to the purchase of its securities was unable to meet its obligations as they came due without material assistance other than conventional lending or financing arrangements.
(iv) Securities of an Eligible Portfolio Company purchased from any person in a private transaction if there is no ready market for such securities and we already own 60% of the outstanding equity of the Eligible Portfolio Company.
(v) Securities received in exchange for or distributed on or with respect to securities described in (i) through (iv) above, or pursuant to the exercise of warrants or rights relating to such securities.
(vi) Cash, cash equivalents, certificates of deposit, U.S. government securities or high-quality debt securities maturing in one year or less from the time of investment.
In addition, a business development company must have been organized and have its principal place of business in the United States and must be operated for the purpose of making investments in the types of securities described in (i), (ii) or (iii) above.
35
Managerial assistance to portfolio companies. In general, in order to count portfolio securities as qualifying assets for the purpose of the 70% test, we must either control the issuer of the securities or must offer to make available to the issuer of the securities (other than small and solvent companies described above) significant managerial assistance; except that, where we purchase such securities in conjunction with one or more other persons acting together, one of the other persons in the group may make available such managerial assistance. Making available managerial assistance means, among other things, any arrangement whereby the business development company, through its directors, officers or employees, offers to provide, and, if requested to, provides significant guidance and counsel concerning the management, operations or business objectives and policies of a portfolio company.
Senior securities. We are permitted, under specified conditions, to issue multiple classes of debt and one class of stock senior to our common stock if our asset coverage, as defined in the 1940 Act, is at least equal to 200% immediately after each such issuance. In addition, while any senior securities remain outstanding, we must make provisions to prohibit any distribution to our stockholders or the repurchase of such securities or shares unless we meet the applicable asset coverage ratios at the time of the distribution or repurchase. We may also borrow amounts up to 5% of the value of our total assets for temporary or emergency purposes without regard to asset coverage.
We do not intend to borrow funds in the foreseeable future to finance the purchase of our investment in portfolio companies. However, in the event we do borrow funds to make investments, we are exposed to the risks of leverage, which may be considered a speculative investment technique. Borrowings, also known as leverage, magnify the potential for gain and loss on amounts invested and therefore increase the risks associated with investing in our securities. In addition, the costs associated with our borrowings, including any increase in the management fee payable to our investment adviser will be borne by our common stockholders.
Proxy voting policies and procedures. We vote proxies relating to our portfolio securities in the best interest of our stockholders. We review on a case-by-case basis each proposal submitted to a stockholder vote to determine its impact on the portfolio securities held by us. Although we generally vote against proposals that may have a negative impact on our portfolio securities, we may vote for such a proposal if there exists compelling long-term reasons to do so.
Our proxy voting decisions are made by our investment adviser’s senior investment professionals. To ensure that our vote is not the product of a conflict of interest, we require that: (i) anyone involved in the decision making process disclose to our Chief Compliance Officer any potential conflict that he is aware of and any contact that he has had with any interested party regarding a proxy vote; and (ii) employees involved in the decision making process or vote administration are prohibited from revealing how we intend to vote on a proposal in order to reduce any attempted influence from interested parties.
Stockholders may obtain information regarding how we voted proxies with respect to our portfolio securities by making a written request for proxy voting information to: Chief Compliance Officer, Keating Capital, Inc., 5251 DTC Parkway, Suite 1100, Greenwood Village, Colorado 80111.
Temporary investments. Pending investment in other types of “qualifying assets,” as described above, our investments may consist of cash, cash equivalents, certificates of deposit, U.S. government securities or high-quality debt securities maturing in one year or less.
Code of ethics. We and our investment adviser have each adopted a code of ethics pursuant to Rule 17j-1 under the 1940 Act and Rule 204A-1 under the Advisers Act, respectively, that establishes procedures for personal investments and restricts certain transactions by our personnel. Our codes of ethics generally do not permit investments by our employees in securities that may be purchased or held by us. You may read and copy these codes of ethics at the SEC’s Public Reference Room in Washington, DC. You may obtain information on the operation of the Public Reference Room by calling the SEC at (202) 551-8090. In addition, each code of ethics is available on the SEC’s website atwww.sec.gov. You may also obtain copies of the codes of ethics, after paying a duplicating fee, by electronic request at the following Email address: publicinfo@sec.gov, or by writing the SEC’s Public Reference Section, 100 F Street, N.E., Washington, DC 20549. You may also obtain a copy of our code of ethics on our website atwww.keatingcapital.com.
Nasdaq Listing
We currently satisfy the listing requirements for the Nasdaq Capital Market and have obtained preliminary approval to list our shares, subject to a number of conditions which we believe we can satisfy. Unlike a traditional initial public offering – where there is a simultaneous capital raise and exchange listing – we have purposely decoupled these two events. Our initial public offering was the continuous public offering that concluded on June 30, 2011, and which raised $86.8 million. Our public listing is not expected to be accompanied by any type of capital raise. The timing of the listing is a procedural step coordinated solely with Nasdaq and therefore does not in any way depend on the cooperation of the capital markets. We have reserved the ticker symbol KIPO, and we expect to obtain such listing by the end of 2011.
36
Once our common stock is approved for trading on Nasdaq, competing market makers will make markets in our common stock based on the aggregate supply and demand for our shares. As a result, we anticipate that trading volume in our shares may initially be lower than had we pursued a traditional initial public offering. Over time, and based on our anticipated business plan, we expect that trading volume in our shares will increase. Shares of closed-end investment companies, including business development companies, frequently trade at a discount to their net asset value. The market price of our common stock may be at a price equal to, above or below our net asset value per share.
We are not generally able to issue and sell our common stock at a price below net asset value per share. We may, however, issue new shares of our common stock at a price below the current net asset value of the common stock, if our Board determines that such issuance is in our best interests and our stockholders have approved the practice of making such sales.
Investment Portfolio Activity and Composition
During the three months ended September 30, 2011, we made $16,356,418 of investments in six private companies, consisting of preferred stock, common stock, and warrants to acquire preferred stock and common stock. During the nine months ended September 30, 2011, we made $27,756,430 of investments in 11 private companies, consisting of preferred stock, common stock, and warrants to acquire preferred stock and common stock.
The following table details the composition of our investment portfolio by security, at cost and fair value as of September 30, 2011.
|
September 30, 2011
|
||||||||||||||||||||||||
|
Unrealized
|
||||||||||||||||||||||||
|
Investment
|
Cost
|
Appreciation
|
||||||||||||||||||||||
|
Portfolio Company
|
Date
|
Investment Description
|
Shares
|
(Per Share)
|
Cost
|
Fair Value
|
(Depreciation)
|
|||||||||||||||||
|
Private Portfolio Companies:
|
||||||||||||||||||||||||
|
Livescribe, Inc.
|
7/1/2010
|
Series C Convertible Preferred Stock
|
1,000,000 | $ | 0.47 | $ | 471,295 | $ | 257,000 | $ | (214,295 | ) | ||||||||||||
|
7/1/2010
|
Series C Convertible Preferred Stock Warrants
|
125,000 | 0.23 | 29,205 | 6,229 | (22,976 | ) | |||||||||||||||||
|
7/8/2011
|
Series C-1 Convertible Preferrred Stock
|
54,906 | 0.47 | 25,925 | 14,001 | (11,924 | ) | |||||||||||||||||
|
7/8/2011
|
Series C-1 Convertible Preferred Stock Warrants
|
6,863 | 0.23 | 1,556 | 426 | (1,130 | ) | |||||||||||||||||
|
MBA Polymers, Inc.
|
10/15/2010
|
Series G Convertible Preferred Stock
|
1,100,000 | 1.00 | 1,100,000 | 1,100,000 | - | |||||||||||||||||
|
2/22/2011
|
Series G Convertible Preferred Stock
|
900,000 | 1.00 | 900,000 | 900,000 | - | ||||||||||||||||||
|
Harvest Power, Inc.
|
3/8/2011
|
Series B Convertible Preferred Stock
|
580,496 | 4.31 | 2,499,999 | 2,499,999 | - | |||||||||||||||||
|
Suniva, Inc.
|
3/31/2011
|
Series D Convertible Preferred Stock
|
197,942 | 12.63 | 2,500,007 | 2,500,007 | - | |||||||||||||||||
|
Xtime, Inc.
|
6/14/2011
|
Series F Convertible Preferred Stock
|
1,573,234 | 1.91 | 3,000,000 | 3,000,000 | - | |||||||||||||||||
|
8/25/2011
|
Common Stock Warrants
|
22581 | - | - | 9,156 | 9,156 | ||||||||||||||||||
|
Metabolon, Inc.
|
8/25/2011
|
Series D Convertible Preferred Stock
|
2,229,021 | 1.79 | 4,000,000 | 4,000,000 | - | |||||||||||||||||
|
Kabam, Inc.
|
8/29/2011
|
Series D Convertible Preferred Stock
|
1,046,017 | 1.27 | 1,328,860 | 1,328,860 | - | |||||||||||||||||
|
Tremor Video, Inc.
|
9/6/2011
|
Series F Convertible Preferred Stock
|
642,994 | 6.22 | 4,000,001 | 4,000,001 | - | |||||||||||||||||
|
TrueCar, Inc.
|
9/26/2011
|
Common Stock
|
566,037 | 5.30 | 2,999,996 | 2,999,996 | - | |||||||||||||||||
| Private Portfolio Companies That Have Filed for an IPO: | ||||||||||||||||||||||||
|
BrightSource Energy, Inc.
|
3/1/2011
|
Series E Convertible Preferred Stock
|
288,531 | 8.66 | 2,500,006 | 2,500,006 | - | |||||||||||||||||
|
Corsair Components, Inc.
|
7/6/2011
|
Common Stock
|
3,200,000 | 1.07 | 3,411,080 | 4,096,000 | 684,920 | |||||||||||||||||
|
7/6/2011
|
Common Stock Warrants
|
800,000 | 0.74 | 589,000 | 630,000 | 41,000 | ||||||||||||||||||
|
Publicly-Traded Portfolio Companies:
|
||||||||||||||||||||||||
|
NeoPhotonics Corporation
|
1/25/2010
|
Common Stock
|
160,000 | 6.25 | 1,000,000 | 1,101,000 | 101,000 | |||||||||||||||||
|
Solazyme, Inc.
|
7/16/2010
|
Common Stock
|
112,927 | 8.86 | 999,991 | 977,000 | (22,991 | ) | ||||||||||||||||
|
Total
|
$ | 31,356,921 | $ | 31,919,681 | $ | 562,760 | ||||||||||||||||||
NeoPhotonics Corporation. On January 25, 2010, we completed a $1 million investment in the Series X convertible preferred stock of NeoPhotonics Corporation (“NeoPhotonics”). Our investment in NeoPhotonics was part of a $46 million Series X preferred stock offering. NeoPhotonics, headquartered in San Jose, California, is a developer and manufacturer of photonic integrated circuit based components, modules and subsystems for use in telecommunications networks.
37
NeoPhotonics completed an initial public offering on February 2, 2011 selling 7,500,000 shares of common stock at a price of $11.00 per share. NeoPhotonics is listed on the New York Stock Exchange under the ticker symbol NPTN. Immediately prior to the initial public offering, our NeoPhotonics Series X preferred stock converted into 160,000 shares of NeoPhotonics common stock. The shares of NeoPhotonics common stock we received upon conversion were subject to a 180 day lockup provision which expired in August 2011. At September 30, 2011, our common stock investment in NeoPhotonics was valued at $1,101,000, including $101,000 in unrealized appreciation based upon NeoPhotonics’ closing market price of $6.88 per share.
Livescribe, Inc. On July 1, 2010, we completed a $500,500 investment in the Series C convertible preferred stock and warrants of Livescribe Inc. (“Livescribe”). Our investment in Livescribe was part of a $39 million Series C preferred stock offering. Livescribe, a private company headquartered in Oakland, California, is a developer and marketer of a mobile, paper-based computing platform consisting of smartpens, dot paper, smartpen applications, accessories, desktop software, an online community and development tools. Livescribe’s smartpens are currently available from consumer electronics retailers in the U.S. and in several international markets.
For financial reporting purposes, our investment in Livescribe’s Series C convertible preferred stock was assigned a cost of $471,295 and the warrants were assigned a cost of $29,205 based on the fair value of the warrants as of the initial investment date calculated using the Black-Scholes option pricing model. At September 30, 2011, our Series C convertible preferred stock investment in Livescribe was valued at $257,000, including $214,295 in unrealized depreciation based upon a fair value determination made in good faith by our Board of Directors. At September 30, 2011, our Series C convertible preferred stock warrants in Livescribe were valued at $6,229, including $22,976 in unrealized depreciation based upon a fair value determination made in good faith by our Board of Directors.
On July 8, 2011, we completed a $27,481 investment in the Series C-1 convertible preferred stock and warrants of Livescribe as part of a $4.5 million Series C-1 preferred stock offering to Livescribe’s existing Series C preferred stock investors. We have also committed to make an additional investment of $22,900 in the Series C-1 convertible preferred stock and warrants of Livescribe as part of a second closing that will occur no later than April 30, 2012. We have received notice that this second closing is expected to occur on or about November 9, 2012.
For financial reporting purposes, our investment in Livescribe’s Series C-1 convertible preferred stock was assigned a cost of $25,925, and the warrants were assigned a cost of $1,556 based on the fair value of the warrants as of the initial investment date calculated using the Black-Scholes option pricing model. At September 30, 2011, our Series C-1 convertible preferred stock investment in Livescribe was valued at $14,001, including $11,924 in unrealized depreciation based upon a fair value determination made in good faith by our Board of Directors. At September 30, 2011, our Series C-1 convertible preferred stock warrants in Livescribe were valued at $426, including $1,130 in unrealized depreciation based upon a fair value determination made in good faith by our Board of Directors.
Solazyme, Inc. On July 16, 2010, we completed a $999,991 investment in the Series D convertible preferred stock of Solazyme, Inc. (“Solazyme”). Our investment in Solazyme was part of a $60 million Series D preferred stock offering. Solazyme is a renewable oils and green bioproducts company based in South San Francisco, California. Founded in 2003, Solazyme is considered a leader in the development and commercialization of algal oil and bioproducts for the fuels and chemicals, nutrition, and skin and personal care markets. Solazyme’s unique, proprietary technology allows algae, when fed sugars and plant byproducts, to produce oil and biomaterials in industrial fermentation facilities.
Solazyme completed an initial public offering on May 27, 2011 selling 10,975,000 shares of common stock at a price of $18.00 per share. Solazyme is listed on the Nasdaq Global Market under the ticker symbol SZYM. Immediately prior to the initial public offering, our Solazyme Series D preferred stock converted into 112,927 shares of Solazyme common stock. The shares of Solazyme common stock we received upon conversion are subject to a 180 day lockup provision which expires in November 2011. At September 30, 2011, our common stock investment in Solazyme was valued at $977,000, including $22,991 in unrealized depreciation based upon a fair value determination made in good faith by our Board of Directors.
MBA Polymers, Inc. On October 15, 2010, we completed a $1,100,000 investment in the Series G convertible preferred stock of MBA Polymers, Inc. (“MBA Polymers”). Our investment in MBA Polymers was part of a $25 million Series G convertible preferred stock offering. On February 22, 2011, we made an additional investment of $900,000 in MBA Polymers’ Series G convertible preferred stock. Our additional investment was part of an aggregate additional Series G preferred stock offering of approximately $14.6 million. MBA Polymers, a private company headquartered in Richmond, California, is a global manufacturer of recycled plastics sourced from end of life durable goods, such as computers, electronics, appliances and automobiles. MBA Polymers’ patented recycling technology allows it to sort, clean, purify and process reusable plastic materials. These recycled plastics are then sold as “drop-in” green replacements for virgin plastic to original equipment manufacturers and other customers who desire a cost-competitive and/or greener alternative to virgin plastics. At September 30, 2011, our Series G convertible preferred stock investment in MBA Polymers was valued at $2,000,000, our original cost, based upon a fair value determination made in good faith by our Board of Directors.
38
BrightSource Energy, Inc. On March 1, 2011, we completed a $2,500,006 investment in the Series E convertible preferred stock of BrightSource Energy, Inc. (“BrightSource”), which BrightSource included as part of its February 28, 2011 closing. Our investment in BrightSource was part of a $200 million Series E preferred stock offering. BrightSource, headquartered in Oakland, California, is a developer of utility scale solar thermal plants which generate solar energy for utility and industrial companies using its proprietary solar thermal tower technology. This technology allows BrightSource to employ a low-impact environmental design that mounts mirrors on individual poles placed directly into the ground, so that the solar field can be built around the natural contours of the land and avoid areas of sensitive vegetation. Competing solar technologies generally require extensive land grading and concrete pads. BrightSource’s technology also uses an air-cooling system to convert steam back into water in a closed-loop cycle and, in the process, conserve desert water. On April 22, 2011, BrightSource filed a registration statement on Form S-1 to go public through a $250 million initial public offering of its common stock. BrightSource filed amendment No. 4 to its registration statement on October 12, 2011. In the event of a qualifying initial public offering, the Series E convertible preferred stock would be automatically converted into shares of BrightSource’s common stock. Upon conversion, the common stock we would be issued would be subject to a 180 day lockup period following the completion of the initial public offering. We can give no assurances that BrightSource will ever complete an initial public offering, and even if completed, when it may be completed and at what price and under what terms. At September 30, 2011, our Series E convertible preferred stock investment in BrightSource was valued at $2,500,006, our original cost, based upon a fair value determination made in good faith by our Board of Directors.
Harvest Power, Inc. On March 9, 2011, we completed a $2,499,999 investment in Series B convertible preferred stock of Harvest Power, Inc. (“Harvest Power”). Our investment in Harvest Power was part of a $66 million Series B preferred stock offering. Founded in 2008 and headquartered in Waltham, Massachusetts, Harvest Power acquires, owns and operates organic waste facilities that convert organic waste, such as food scraps and yard debris, into compost, mulch and renewable energy. Harvest Power’s recycling operations reduce the amount of organic waste that needs to be landfilled or incinerated. Its existing operating facilities are located in California, Pennsylvania, and British Columbia, Canada. Harvest Power enters into multi-year contracts with municipalities and waste haulers who pay a tipping fee to Harvest Power to accept organic waste at its facilities. At September 30, 2011, our Series B convertible preferred stock investment in Harvest Power was valued at $2,499,999, our original cost, based upon a fair value determination made in good faith by our Board of Directors.
Suniva, Inc. On March 31, 2011, we completed a $2,500,007 investment in the Series D convertible preferred stock of Suniva, Inc. (“Suniva”). Our investment in Suniva was part of a $106 million Series D preferred stock offering. Founded in 2007 and headquartered in Norcross, Georgia, Suniva is a manufacturer of high-efficiency solar photovoltaic cells and modules focused on delivering high-power solar energy products. At its headquarters in Norcross, Georgia, Suniva has 170 megawatts of solar cell production capacity and a state-of-the-art research and development facility. At September 30, 2011, our Series D convertible preferred stock investment in Suniva was valued at $2,500,007, our original cost, based upon a fair value determination made in good faith by our Board of Directors.
Xtime, Inc. On June 14, 2011, we completed a $3,000,000 investment in the Series F convertible preferred stock of Xtime, Inc. (“Xtime”). Our investment in Xtime was part of a $5 million Series F preferred stock offering in which we were the lead investor. Founded in 1999 and headquartered in Redwood Shores, California, Xtime is a software as a service provider of Web scheduling and CRM solutions for automotive service departments. Xtime has enrolled over 3,000 dealerships since the launch of its ServiceCRM™ platform, which automates and integrates all Xtime products into a unified solution for fixed operations (consisting of service, parts, and body shop). At September 30, 2011, our Series F convertible preferred stock investment in Xtime was valued at $3,000,000, our original cost, based upon a fair value determination made in good faith by our Board of Directors.
In August 2011, Xtime completed the final closing of the $5 million Series F convertible preferred stock round. As part of the final closing, Xtime’s existing investors who invested more than their pro rata share in the Series F convertible preferred round (based on amounts they had invested in Xtime’s prior preferred stock rounds), received warrants to acquire shares of Xtime’s common stock at an exercise price of $0.01 per share. In order to preserve our post-money, fully diluted ownership interest in Xtime, we also received warrants to acquire 22,581 shares of Xtime common stock on the same terms as the warrants issued to existing investors. In the event Xtime completes a qualifying initial public offering, the number of warrants will be reduced by 50%. At September 30, 2011, our common stock warrants in Xtime were valued at $9,156, including $9,156 in unrealized appreciation based upon a fair value determination made in good faith by our Board of Directors.
Corsair Components, Inc. On July 6, 2011, we completed a $4,000,080 investment in the common stock and warrants of Corsair Components, Inc. (“Corsair”) as part of a private purchase transaction with certain founders and current and former management employees of Corsair (the “Sellers”). Corsair is a private company headquartered in Freemont, California and is a designer and supplier of high-performance components to the personal computer, or PC, gaming hardware market. Corsair had previously filed a registration statement on Form S-1 on April 23, 2010 for an initial public offering of its common stock. Corsair filed amendment No. 6 to its registration statement on July 22, 2011. In the event of an initial public offering, the common stock held by us would be subject to a 180 day lockup period following the completion of the initial public offering.
39
Pursuant to the common stock and warrant purchase agreement governing the private purchase transaction with the Sellers, we purchased 3,200,000 shares of Corsair common stock at price of $1.25 per share and 800,000 common stock warrants at a price of $0.0001 per warrant. The warrants grant us the right to purchase from the Sellers up to 800,000 shares of Corsair common stock at an exercise price of $0.01 per share. The warrants expire on the earlier of: (i) the consummation of an initial public offering (“IPO”) by Corsair at an offering price of at least $2.50 per share of common stock, (ii) upon a sale of Corsair which results in holders of Corsair common stock receiving net sales proceeds of at least $2.50 per share, or (iii) July 6, 2016.
The warrants are exercisable only upon: (i) Corsair completing an IPO of its common stock at an offering price of less than $2.50 per share, (ii) a sale of Corsair which results in holders of Corsair common stock receiving net sales proceeds of less than $2.50 per share, and (iii) if Corsair does not complete an IPO or sale prior to July 6, 2016, the warrants will be deemed to have been automatically exercised on such date. If the warrants become exercisable as a result of an IPO or sale of Corsair, the number of warrants will be proportionately decreased from 800,000 to the extent that the IPO price or net sale proceeds, as the case may be, exceeds $2.00 per share but is less than $$2.50 per share, and the number of warrants will be reduced to zero if the IPO price or net sale proceeds, as the case may be, equals or exceeds $2.50 per share. Accordingly, if the warrants become exercisable as a result of an IPO or sale, we will be entitled to receive the full 800,000 warrants only if the IPO price or net sale proceeds, as the case may be, is $2.00 per share or less.
To estimate the fair value of warrants as of the initial investment date, the common stock and warrants were considered components of a portfolio of securities purchased for $4,000,080. However, since the number of common shares underlying the warrants is variable (ranging from zero to 800,000) based on whether an IPO or sale of Corsair exceeds $2.00 per share, the fair value of the warrants was derived using an option pricing model within the framework of a Monte Carlo numerical-based analysis, which takes into consideration the variability in the number of common shares underlying the warrants based on a range of IPO or sale prices for Corsair.
For financial reporting purposes, our investment in Corsair common stock was assigned a cost of $3,411,080 and the warrants were assigned a cost of $589,000 based on the fair value of the warrants as of the initial investment. At September 30, 2011, our common stock investment in Corsair was valued at $4,096,000, including $684,920 in unrealized appreciation based upon a fair value determination made in good faith by our Board of Directors. At September 30, 2011, our common stock warrants in Corsair were valued at $630,000, including $41,000 in unrealized appreciation based upon a fair value determination made in good faith by our Board of Directors.
Metabolon, Inc. On August 25, 2011, we completed a $4,000,000 investment in the Series D convertible preferred stock of Metabolon, Inc. (“Metabolon”). Our investment in Metabolon was part of a $13 million Series D preferred stock offering. Founded in 2000 and headquartered in Research Triangle Park, North Carolina, Metabolon is a molecular diagnostics and services company offering a novel metabolic profiling technology that uses advanced bioinformatics and data analytics software to identify, quantify, and analyze biochemical processes occurring within cells. Metabolon’s end-to-end profiling service is used by leading academic institutions and pharmaceutical, biotechnology, agriculture, and consumer products companies to develop more efficacious drugs, diagnostic tests, and consumer and agricultural products. Metabolon is utilizing biomarkers identified by its technology in the development of molecular diagnostic tests intended to detect and measure the aggression and stage of diseases such as diabetes and cancer. At September 30, 2011, our Series D convertible preferred stock investment in Metabolon was valued at $4,000,000, our original cost, based upon a fair value determination made in good faith by our Board of Directors.
Kabam, Inc. On August 29, 2011, we completed a $1,328,860 investment in the Series D convertible preferred stock of Kabam, Inc. (“Kabam”). Our investment in Kabam was part of an $86 million Series D preferred stock offering. Founded in 2006 and headquartered in Redwood City, California, Kabam is a leader in the next wave of Internet-based social gaming by combining the immersion of massively multiplayer games with the connectivity and interaction of social games. Kabam’s games for Facebook and other media sites have been widely recognized for their depth of play and social interaction, receiving the “Readers’ Choice Facebook Game of 2010” award from IGN Entertainment (a division of News Corporation that provides media content, digital distribution and gaming technology). At September 30, 2011, our Series D convertible preferred stock investment in Kabam was valued at $1,328,860, our original cost, based upon a fair value determination made in good faith by our Board of Directors.
Tremor Video, Inc. On September 6, 2011, we completed a $4,000,001 investment in the Series F convertible preferred stock of Tremor Video, Inc. (“Tremor Video”). Our investment in Tremor Video was part of a $37 million Series F preferred stock offering. Founded in 2005 and headquartered in New York City, Tremor Video is an online video technology and advertising company that provides video advertising solutions to Fortune 1000 brand advertisers and top tier publishers of Web videos. Tremor Video places video advertisements before or next to online videos or other content for brand advertisers such as Procter & Gamble, Mars, Microsoft, Sprint Nextel, and Walt Disney. Tremor Video’s award-winning SE2 technology provides advertisers with tools to target and engage customers, measure campaign effectiveness and ensure brand safety by scanning and categorizing each video stream before an advertisement is placed. Tremor Video’s network of third-party publishers of online video content benefit from a full suite of products and services to monetize streaming video and maximize their return on investment. At September 30, 2011, our Series F convertible preferred stock investment in Tremor Video was valued at $4,000,001, our original cost, based upon a fair value determination made in good faith by our Board of Directors.
40
TrueCar, Inc. On September 26, 2011, we completed a $2,999,996 investment in the common stock of TrueCar, Inc. (“TrueCar”). Our investment in TrueCar was part of a $50 million common stock offering. Founded in 2005 and based in Santa Monica, California, TrueCar is an online research and pricing tool for consumers interested in buying a new or used vehicle whereby a consumer can research any make and model and see a histogram of actual transaction prices for that vehicle in a specific geographic area. Through TrueCar’s platform, consumers also have access to average prices paid, recent sales data, monthly price trends and vehicle pricing details, which show dealer cost, and factory invoice, as well as customer and dealer incentives being offered. At September 30, 2011, our common stock investment in TrueCar was valued at $2,999,996, our original cost, based upon a fair value determination made in good faith by our Board of Directors.
The following table summarizes the composition of our investment portfolio, excluding short-term investments in certificates of deposit, by type of security at cost and fair value as of September 30, 2011 and December 31, 2010.
|
September 30, 2011
|
December 31, 2010
|
|||||||||||||||||||||||
|
Percentage
|
Percentage
|
|||||||||||||||||||||||
|
Investment Type
|
Cost
|
Fair Value
|
of Portfolio
|
Cost
|
Fair Value
|
of Portfolio
|
||||||||||||||||||
|
Private Portfolio Companies:
|
||||||||||||||||||||||||
|
Preferred Stock
|
$ | 22,326,093 | $ | 22,099,874 | 69.24 | % | $ | 3,571,286 | $ | 4,149,991 | 99.34 | % | ||||||||||||
|
Preferred Stock Warrants
|
30,761 | 6,655 | 0.02 | % | 29,205 | 27,616 | 0.66 | % | ||||||||||||||||
|
Common Stock
|
6,411,076 | 7,095,996 | 22.23 | % | - | - | - | |||||||||||||||||
|
Common Stock Warrants
|
589,000 | 639,156 | 2.00 | % | - | - | - | |||||||||||||||||
|
Publicly-Traded Portfolio Companies:
|
||||||||||||||||||||||||
|
Common Stock
|
1,999,991 | 2,078,000 | 6.51 | % | - | - | - | |||||||||||||||||
|
Total
|
$ | 31,356,921 | $ | 31,919,681 | 100.00 | % | $ | 3,600,491 | $ | 4,177,607 | 100.00 | % | ||||||||||||
The following table summarizes the composition of our investment portfolio, excluding short-term investments in certificates of deposit, by industry classification at cost and fair value as of September 30, 2011 and December 31, 2010.
|
September 30, 2011
|
December 31, 2010
|
|||||||||||||||||||||||
|
Percentage
|
Percentage
|
|||||||||||||||||||||||
|
Industry Classification
|
Cost
|
Fair Value
|
of Portfolio
|
Cost
|
Fair Value
|
of Portfolio
|
||||||||||||||||||
|
Internet & Software
|
$ | 11,328,857 | $ | 11,338,013 | 35.52 | % | $ | - | $ | - | - | |||||||||||||
|
Cleantech
|
10,500,003 | 10,477,012 | 32.82 | % | 2,099,991 | 2,099,991 | 50.27 | % | ||||||||||||||||
|
Technology
|
9,528,061 | 10,104,656 | 31.66 | % | 1,500,500 | 2,077,616 | 49.73 | % | ||||||||||||||||
|
Total
|
$ | 31,356,921 | $ | 31,919,681 | 100.0 | % | $ | 3,600,491 | $ | 4,177,607 | 100.00 | % | ||||||||||||
The following table summarizes the composition of our investment portfolio, excluding short-term investments in certificates of deposit, by geographic region of the United States at cost and fair value as of September 30, 2011 and December 31, 2010. The geographic composition is determined by the location of the corporate headquarters of the portfolio company.
|
September 30, 2011
|
December 31, 2010
|
|||||||||||||||||||||||
|
Percentage
|
Percentage
|
|||||||||||||||||||||||
|
Geographic Location
|
Cost
|
Fair Value
|
of Portfolio
|
Cost
|
Fair Value
|
of Portfolio
|
||||||||||||||||||
|
West
|
$ | 18,356,914 | $ | 18,919,674 | 59.28 | % | $ | 3,600,491 | $ | 4,177,607 | 100.00 | % | ||||||||||||
|
Northeast
|
6,500,000 | 6,500,000 | 20.36 | % | - | - | - | |||||||||||||||||
|
Southeast
|
6,500,007 | 6,500,007 | 20.36 | % | - | - | - | |||||||||||||||||
|
Total
|
$ | 31,356,921 | $ | 31,919,681 | 100.00 | % | $ | 3,600,491 | $ | 4,177,607 | 100.00 | % | ||||||||||||
41
Results of Operations
The principal measure of our financial performance is the net increase (decrease) in our net assets resulting from operations, which includes net investment income (loss), net realized gain (loss) on investments and net unrealized appreciation (depreciation) on investments. Net investment income (loss) is the difference between our income from interest, dividends, fees and other investment income and our operating expenses. Net realized gain (loss), if any, is the difference between the net proceeds of sales of portfolio company securities and their stated cost. Net unrealized appreciation (depreciation) from investments is the net change in the fair value of our investment portfolio.
Set forth below are the results of operations for the three and nine months ended September 30, 2011 and 2010.
Investment Income
We have generated, and expect to continue to generate, limited investment income from our temporary investments in high-quality debt investments that mature in one year or less. Our primary source of investment income will be generated from net capital gains realized on the disposition of our portfolio company investments, which typically will occur after the portfolio company completes an IPO and any contractual lockup period has expired. Because the portfolio company securities that we acquire are typically illiquid until an IPO or sale of the company, we generally cannot predict the regularity and time periods between dispositions of our portfolio company investments and the realizations of capital gains, if any, from such dispositions. Dispositions of our portfolio company investments are discretionary and based on our business judgment.
Three months ended September 30, 2011 and 2010. For the three months ended September 30, 2011 and 2010, we earned interest income from certificates of deposit and money market investments of $6,382 and $12,428, respectively. For the three months September 30, 2011 and 2010, no other investment income was recorded.
Nine months ended September 30, 2011 and 2010. For the nine months ended September 30, 2011 and 2010, we earned interest income from certificates of deposit and money market investments of $49,660 and $26,047, respectively. For the nine months ended September 30, 2011 and 2010, $0 and $10,000, respectively, of other investment income was recorded. The $10,000 of other income recorded during the nine months ended September 30, 2010 represents a non-refundable due diligence fee received from a prospective portfolio company in December 2009, which was initially recorded as deferred income and was subsequently recognized as income when the proposed investment transaction failed to close in February 2010.
Operating Expenses
Our primary operating expenses include the payment of: (i) investment advisory fees to our Investment Adviser, Keating Investments, (ii) our allocable portion of overhead and other expenses incurred by Keating Investments, as our administrator, in performing its administrative obligations under the Investment Advisory and Administrative Services Agreement, and (iii) other operating expenses as detailed below. Our investment advisory fee compensates our Investment Adviser for its work in identifying, evaluating, negotiating, closing, monitoring and servicing our investments. See “Business – Investment Advisory and Administrative Services Agreement.” We bear all other expenses of our operations and transactions, including, without limitation:
|
|
·
|
Costs of calculating our net asset value, including the cost of any third-party valuation services;
|
|
|
·
|
Costs of effecting sales and repurchases of shares of our common stock and other securities;
|
|
|
·
|
Fees payable to third parties relating to, or associated with, making investments, including fees and expenses associated with performing due diligence reviews of prospective investments;
|
|
|
·
|
Costs related to organization and offerings;
|
|
|
·
|
Transfer agent and custodial fees;
|
|
|
·
|
Fees and expenses associated with marketing efforts;
|
|
|
·
|
Federal and state registration fees;
|
|
|
·
|
Any stock exchange listing fees;
|
|
|
·
|
Applicable federal, state and local taxes;
|
42
|
|
·
|
Independent directors’ fees and expenses;
|
|
|
·
|
Brokerage commissions;
|
|
|
·
|
Costs of proxy statements, stockholders’ reports and notices;
|
|
|
·
|
Fidelity bond, directors and officers/errors and omissions liability insurance and other insurance premiums;
|
|
|
·
|
Direct costs such as printing, mailing, and long distance telephone;
|
|
|
·
|
Fees and expenses associated with independent audits and outside legal costs;
|
|
|
·
|
Costs associated with our reporting and compliance obligations under the 1940 Act, Sarbanes-Oxley Act, and applicable federal and state securities laws; and
|
|
|
·
|
All other expenses incurred by either Keating Investments or us in connection with administering our business, including payments under the Investment Advisory and Administrative Services Agreement that will be based upon our allocable portion of overhead and other expenses incurred by Keating Investments in performing its obligations under the Investment Advisory and Administrative Services Agreement, including our allocable portion of the compensation of our Chief Financial Officer and Chief Compliance Officer, and their respective staff.
|
Three months ended September 30, 2011 and 2010. Operating expenses for the three months ended September 30, 2011 and 2010 were $589,596 and $426,614, respectively, an increase of $162,982 compared to the prior period. A summary of the items comprising the increase in operating expenses of $162,982 for the three months ended September 30, 2011, compared to the three months ended September 30, 2010, is set forth below:
|
Three Months Ended
|
||||||||||||
|
September 30,
|
September 30,
|
Increase /
|
||||||||||
|
2011
|
2010
|
(Decrease)
|
||||||||||
|
Operating Expenses
|
||||||||||||
|
Base management fees
|
$ | 389,007 | $ | 59,709 | $ | 329,298 | ||||||
|
Incentive fees
|
(155,391 | ) | - | (155,391 | ) | |||||||
|
Administrative expenses allocated from Investment Adviser
|
96,757 | 112,921 | (16,164 | ) | ||||||||
|
Legal and professional fees
|
89,337 | 45,063 | 44,274 | |||||||||
|
Directors' fees
|
31,289 | 25,250 | 6,039 | |||||||||
|
Stock transfer agent fees
|
40,555 | 48,362 | (7,807 | ) | ||||||||
|
Printing and fulfillment expenses
|
23,444 | 26,757 | (3,313 | ) | ||||||||
|
Postage and delivery expenses
|
7,201 | 19,310 | (12,109 | ) | ||||||||
|
Stock issuance expenses
|
1,625 | 8,747 | (7,122 | ) | ||||||||
|
General and administrative expenses
|
65,772 | 80,495 | (14,723 | ) | ||||||||
|
Total Operating Expenses
|
$ | 589,596 | $ | 426,614 | $ | 162,982 | ||||||
|
|
·
|
The increase of $329,298 in base management fees for the three months ended September 30, 2011 compared to the three months ended September 30, 2010 was the result of an increase in total assets on which the base management fee is calculated. The increase in our total assets was primarily the result of additional net proceeds received from the sale of common stock in our continuous public offering.
|
|
|
·
|
The decrease of $155,391 in incentive fees for the three months ended September 30, 2011 compared to the three months ended September 30, 2010 was the result of recording a reversal of previously accrued incentive fees based on the $776,954 of net unrealized depreciation on our portfolio company investments that was recorded during the three months ended September 30, 2011.
|
|
|
·
|
The decrease of $16,164 in administrative expenses allocated from our Investment Adviser for the three months ended September 30, 2011 compared to the three months ended September 30, 2010 was primarily the result of a reduction in the allocation to us of expenses associated with the management and coordination of our continuous public offering which concluded on June 30, 2011.
|
43
|
|
·
|
The increase of $44,274 in legal and professional fees for the three months ended September 30, 2011 compared to the three months ended September 30, 2010 was primarily the result of: (i) an increase in audit and audit related expenses associated with the quarterly reviews of our 2011 quarterly financial statements in comparison to the quarterly reviews of our 2010 quarterly financial statements, and (ii) fees paid for public relations consulting services and website development and search engine optimization consulting services during the three months ended September 30, 2011 that were not incurred during the three months ended September 30, 2010.
|
|
|
·
|
The decreases of: (i) $7,807 in stock transfer agent fees, (ii) $3,313 in printing and fulfillment expenses, (iii) $12,109 in postage and delivery expenses, (iv) $7,122 in stock issuance expenses, and (v) $14,723 in general and administrative expenses during the three months ended September 30, 2011 compared to the three months ended September 30, 2010 were primarily the result of the foregoing expenses associated with our continuous public offering declining following the conclusion of our continuous public offering on June 30, 2011.
|
Nine months ended September 30, 2011 and 2010. For the nine months ended September 30, 2011 and 2010, operating expenses were $2,615,907 and $1,263,624, respectively, an increase of $1,352,283 compared to the prior period. During the nine months ended September 30, 2011, we incurred additional postage and shipping, printing and fulfillment, travel and entertainment, and other marketing related expenses associated with our continuous public offering, which concluded on June 30, 2011. However, with the conclusion of the continuous public offering, we expect these expenses to decline.
We are also focused on continuing to build and enhance our stockholder communications, investor relations and brand marketing programs as we prepare for the expected listing of our shares on the Nasdaq Capital Market by the end of 2011. We believe it is important to develop these programs now as they will be the foundation of our aftermarket support initiatives once our shares become eligible for trading. While some of these expenses may be one-time in nature, the majority of these expenses will continue, and may increase over time, as we attempt to develop interest in the Company and an active trading market for our shares.
A summary of the items comprising the increase in operating expenses of $1,352,283 for the nine months ended September 30, 2011, compared to the nine months ended September 30, 2010, is set forth below:
|
Nine Months Ended
|
||||||||||||
|
September 30,
|
September 30,
|
Increase /
|
||||||||||
|
2011
|
2010
|
(Decrease)
|
||||||||||
|
Operating Expenses
|
||||||||||||
|
Base management fees
|
$ | 764,375 | $ | 128,245 | $ | 636,130 | ||||||
|
Incentive fees
|
(2,871 | ) | - | (2,871 | ) | |||||||
|
Administrative expenses allocated from Investment Adviser
|
330,263 | 284,761 | 45,502 | |||||||||
|
Legal and professional fees
|
357,135 | 244,580 | 112,555 | |||||||||
|
Directors' fees
|
90,289 | 82,750 | 7,539 | |||||||||
|
Stock transfer agent fees
|
163,215 | 142,642 | 20,573 | |||||||||
|
Printing and fulfillment expenses
|
152,583 | 48,938 | 103,645 | |||||||||
|
Postage and delivery expenses
|
136,696 | 43,627 | 93,069 | |||||||||
|
Stock issuance expenses
|
114,388 | 115,940 | (1,552 | ) | ||||||||
|
General and administrative expenses
|
509,834 | 172,141 | 337,693 | |||||||||
|
Total Operating Expenses
|
$ | 2,615,907 | $ | 1,263,624 | $ | 1,352,283 | ||||||
|
|
·
|
The increase of $636,130 in base management fees for the nine months ended September 30, 2011 compared to the nine months ended September 30, 2010 was the result of an increase in total assets on which the base management fee is calculated. The increase in our total assets was primarily the result of additional net proceeds received from the sale of common stock in our continuous public offering.
|
|
|
·
|
The decrease of $2,871 in incentive fees for the nine months ended September 30, 2011 compared to the nine months ended September 30, 2010 was the result of recording a reversal of previously accrued incentive fees based on the $14,356 of net unrealized depreciation on our portfolio company investments that was recorded during the nine months ended September 30, 2011. During the nine months ended September 30, 2010, we did not record an incentive fee on the $577,364 of net unrealized appreciation on our portfolio company investments based on an interpretation of accounting rules then in effect.
|
|
|
·
|
The increase of $45,502 in administrative expenses allocated from our Investment Adviser for the nine months ended September 30, 2011 compared to the nine months ended September 30, 2010 was primarily the result of the allocation to us of additional expenses associated with the management, coordination and administration of outreach activities associated with our continuous public offering which concluded on June 30, 2011.
|
44
|
|
·
|
The increase of $112,555 in legal and professional fees for the nine months ended September 30, 2011 compared to the nine months ended September 30, 2010 was primarily the result of: (i) an increase in audit and audit related expenses associated with the audit of our December 31, 2010 financial statements (services rendered and expenses incurred during Q1 2011) in comparison to the audit of our December 31, 2009 financial statements (services rendered and expenses incurred during Q1 2010), (ii) an increase in audit and audit related expenses associated with the quarterly reviews of our 2011 quarterly financial statements in comparison to the quarterly reviews of our 2010 quarterly financial statements, (iii) an increase in fees paid to a third-party valuation firm engaged to review preliminary portfolio company investment valuations prepared by the senior investment professionals of our Investment Adviser, and (iv) fees paid for public relations consulting services and website development services during the nine months ended September 30, 2011 that were not incurred during the nine months ended September 30, 2010.
|
|
|
·
|
The increases of: (i) $20,573 in stock transfer agent fees, (ii) $103,645 in printing and fulfillment expenses, and (iii) $93,069 in postage and delivery expenses during the nine months ended September 30, 2011 compared to the nine months ended September 30, 2010 were primarily the result of an increase in the printing and production volume and related mailing of investor and marketing materials associated with our continuous public offering, where these foregoing expenses declined following the conclusion of our continuous public offering on June 30, 2011.
|
|
|
·
|
The increase of $337,693 in general and administrative expenses for the nine months ended September 30, 2011 compared to the nine months ended September 30, 2010 was primarily the result of an increase in travel and travel-related expenses associated with our continuous public offering, which expenses declined following the conclusion of our continuous public offering on June 30, 2011.
|
Net Investment Loss
Three months ended September 30, 2011 and 2010. For the three months ended September 30, 2011 and 2010, our net investment loss totaled $583,214 and $414,186, respectively. The increase of $169,028 in net investment loss for the three months ended September 30, 2011 compared to the three months ended September 30, 2010 is primarily attributable to an increase in operating expenses resulting from increases in base management fees and legal and professional fees, offset by the reversal of previously accrued incentive fees and decreases in administrative expenses allocated from our Investment Adviser, and decreases in stock transfer agent fees, printing and fulfillment expenses, postage and delivery expenses, stock issuance expenses, and general and administrative expenses resulting from the conclusion of our continuous public offering on June 30, 2011.
Nine months ended September 30, 2011 and 2010. For the nine months ended September 30, 2011 and 2010, our net investment loss totaled $2,566,247 and $1,227,577, respectively. The increase of $1,338,670 in net investment loss for the nine months ended September 30, 2011 compared to the nine months ended September 30, 2010 is primarily attributable to an increase in operating expenses resulting from: (i) an increase in base management fees and administrative expenses allocated from our Investment Adviser, (ii) an increase in professional fees including audit fees and fees paid to a third-party valuation firm, (iii) an increase in printing and fulfillment expenses and postage and delivery expenses, all of which were primarily associated with our continuous public offering, and (iv) an increase in travel-related expenses associated with our continuous public offering, which concluded on June 30, 2011.
Net Change in Unrealized Appreciation (Depreciation) on Investments
Three months ended September 30, 2011 and 2010. For the three months ended September 30, 2011 and 2010, the net change in unrealized appreciation (depreciation) on investments totaled $(776,954) and $27,364, respectively. The following table summarizes the cost and fair value of our individual portfolio company investments as of June 30, 2011 and September 30, 2011, and the change in unrealized appreciation (depreciation) on each individual portfolio company investment comprising the net change in unrealized (depreciation) on investments of $(776,954) for the three months ended September 30, 2011.
45
|
June 30, 2011
|
September 30, 2011
|
|||||||||||||||||||||||||||
|
Change In
|
||||||||||||||||||||||||||||
|
Unrealized
|
Unrealized
|
Unrealized
|
||||||||||||||||||||||||||
|
Appreciation
|
Appreciation
|
Appreciation
|
||||||||||||||||||||||||||
|
Portfolio Company
|
Cost
|
Fair Value
|
(Depreciation)
|
Cost
|
Fair Value
|
(Depreciation)
|
(Depreciation)
|
|||||||||||||||||||||
|
Private Portfolio Companies:
|
||||||||||||||||||||||||||||
|
Livescribe, Inc.
|
$ | 500,500 | $ | 509,205 | $ | 8,705 | $ | 527,981 | $ | 277,656 | $ | (250,325 | ) | $ | (259,030 | ) | ||||||||||||
|
MBA Polymers, Inc.
|
2,000,000 | 2,000,000 | - | 2,000,000 | 2,000,000 | - | - | |||||||||||||||||||||
|
BrightSource Energy, Inc.
|
2,500,006 | 2,500,006 | - | 2,500,006 | 2,500,006 | - | - | |||||||||||||||||||||
|
Harvest Power, Inc.
|
2,499,999 | 2,499,999 | - | 2,499,999 | 2,499,999 | - | - | |||||||||||||||||||||
|
Suniva, Inc.
|
2,500,007 | 2,500,007 | - | 2,500,007 | 2,500,007 | - | - | |||||||||||||||||||||
|
Xtime, Inc.
|
3,000,000 | 3,000,000 | - | 3,000,000 | 3,009,156 | 9,156 | 9,156 | |||||||||||||||||||||
|
Corsair Components, Inc.
|
- | - | - | 4,000,080 | 4,726,000 | 725,920 | 725,920 | |||||||||||||||||||||
|
Metabolon, Inc.
|
- | - | - | 4,000,000 | 4,000,000 | - | - | |||||||||||||||||||||
|
Kabam, Inc.
|
- | - | - | 1,328,860 | 1,328,860 | - | - | |||||||||||||||||||||
|
Tremor Video, Inc.
|
- | - | - | 4,000,001 | 4,000,001 | - | - | |||||||||||||||||||||
|
TrueCar, Inc.
|
- | - | - | 2,999,996 | 2,999,996 | - | - | |||||||||||||||||||||
| - | ||||||||||||||||||||||||||||
|
Publicly-Traded Portfolio Companies:
|
- | |||||||||||||||||||||||||||
|
NeoPhotonics Corporation
|
1,000,000 | 996,000 | (4,000 | ) | 1,000,000 | 1,101,000 | 101,000 | 105,000 | ||||||||||||||||||||
|
Solazyme, Inc.
|
999,991 | 2,335,000 | 1,335,009 | 999,991 | 977,000 | (22,991 | ) | (1,358,000 | ) | |||||||||||||||||||
|
Total
|
$ | 15,000,503 | $ | 16,340,217 | $ | 1,339,714 | $ | 31,356,921 | $ | 31,919,681 | $ | 562,760 | $ | (776,954 | ) | |||||||||||||
The primary factor driving the net change in unrealized appreciation (depreciation) on our portfolio company investments in NeoPhotonics and Solazyme during the three months ended September 30, 2011 was the change in market prices for these publicly traded portfolio companies. The increase in the unrealized depreciation on our investment in Livescribe during the three months ended September 30, 2011 was primarily the result of deterioration in Livescribe’s operating performance compared to projections. The increase in the unrealized appreciation on our investment in Corsair during the three months ended September 30, 2011 resulted from our market-based determination of the fair value of the common stock and warrants using principally comparable public company metrics.
The net change in unrealized appreciation on investments for the three months ended September 30, 2010 was the result of $27,364 in unrealized appreciation on our preferred stock investment in Livescribe.
Nine months ended September 30, 2011 and 2010. For the nine months ended September 30, 2011 and 2010, the net change in unrealized appreciation (depreciation) on investments totaled $(14,356) and $577,364, respectively. The following table summarizes the cost and fair value of our individual portfolio company investments as of December 31, 2010 and September 30, 2011, and the change in unrealized appreciation (depreciation) on each individual portfolio company investment comprising the net change in unrealized (depreciation) on investments of $(14,356) for the nine months ended September 30, 2011.
|
December 31, 2010
|
September 30, 2011
|
|||||||||||||||||||||||||||
|
Change In
|
||||||||||||||||||||||||||||
|
Unrealized
|
Unrealized
|
Unrealized
|
||||||||||||||||||||||||||
|
Appreciation
|
Appreciation
|
Appreciation
|
||||||||||||||||||||||||||
|
Portfolio Company
|
Cost
|
Fair Value
|
(Depreciation)
|
Cost
|
Fair Value
|
(Depreciation)
|
(Depreciation)
|
|||||||||||||||||||||
|
Private Portfolio Companies:
|
||||||||||||||||||||||||||||
|
Livescribe, Inc.
|
$ | 500,500 | $ | 527,616 | $ | 27,116 | $ | 527,981 | $ | 277,656 | $ | (250,325 | ) | $ | (277,441 | ) | ||||||||||||
|
MBA Polymers, Inc.
|
1,100,000 | 1,100,000 | - | 2,000,000 | 2,000,000 | - | - | |||||||||||||||||||||
|
BrightSource Energy, Inc.
|
- | - | - | 2,500,006 | 2,500,006 | - | - | |||||||||||||||||||||
|
Harvest Power, Inc.
|
- | - | - | 2,499,999 | 2,499,999 | - | - | |||||||||||||||||||||
|
Suniva, Inc.
|
- | - | - | 2,500,007 | 2,500,007 | - | - | |||||||||||||||||||||
|
Xtime, Inc.
|
- | - | - | 3,000,000 | 3,009,156 | 9,156 | 9,156 | |||||||||||||||||||||
|
Corsair Components, Inc.
|
- | - | - | 4,000,080 | 4,726,000 | 725,920 | 725,920 | |||||||||||||||||||||
|
Metabolon, Inc.
|
- | - | - | 4,000,000 | 4,000,000 | - | - | |||||||||||||||||||||
|
Kabam, Inc.
|
- | - | - | 1,328,860 | 1,328,860 | - | - | |||||||||||||||||||||
|
Tremor Video, Inc.
|
- | - | - | 4,000,001 | 4,000,001 | - | - | |||||||||||||||||||||
|
TrueCar, Inc.
|
- | - | - | 2,999,996 | 2,999,996 | - | - | |||||||||||||||||||||
| - | ||||||||||||||||||||||||||||
|
Publicly-Traded Portfolio Companies:
|
- | |||||||||||||||||||||||||||
|
NeoPhotonics Corporation (1)
|
1,000,000 | 1,550,000 | 550,000 | 1,000,000 | 1,101,000 | 101,000 | (449,000 | ) | ||||||||||||||||||||
|
Solazyme, Inc. (1)
|
999,991 | 999,991 | - | 999,991 | 977,000 | (22,991 | ) | (22,991 | ) | |||||||||||||||||||
|
Total
|
$ | 3,600,491 | $ | 4,177,607 | $ | 577,116 | $ | 31,356,921 | $ | 31,919,681 | $ | 562,760 | $ | (14,356 | ) | |||||||||||||
|
(1)
|
NeoPhotonics and Solazyme were considered private portfolio companies as of December 31, 2010 as NeoPhotonics and Solazyme did not complete their initial public offerings until February 22, 2011 and May 27, 2011, respectively.
|
46
The primary factor driving the net change in unrealized (depreciation) on our portfolio company investments in NeoPhotonics and Solazyme during the nine months ended September 30, 2011 was the change in market prices for these publicly traded portfolio companies. The increase in the unrealized depreciation on our investment in Livescribe during the three months ended September 30, 2011 was primarily the result of deterioration in Livescribe’s operating performance compared to projections. The increase in the unrealized appreciation on our investment in Corsair during the three months ended September 30, 2011 resulted from our market-based determination of the fair value of the common stock and warrants using principally comparable public company metrics.
The net change in unrealized appreciation on investments for the nine months ended September 30, 2010 was the result of: (i) $550,000 in unrealized appreciation on our preferred stock investment (which was converted into common stock in February 2011) in NeoPhotonics, and (ii) $27,364 in unrealized appreciation on our preferred stock investment in Livescribe.
Upon sale of any of our portfolio company investments, the value that is ultimately realized could be different from the aggregate fair value currently reflected in our financial statements, and this difference could be material.
Net Decrease in Net Assets Resulting From Operations
Three months ended September 30, 2011 and 2010. For the three months ended September 30, 2011, the net decrease in our net assets resulting from operations was $1,360,168, or $0.15 per weighted average outstanding common share, which includes $776,954 in net unrealized depreciation on investments recorded during such period. For the three months ended September 30, 2010, the net decrease in our net assets resulting from operations was $386,822, or $0.26 per weighted average outstanding common share, which includes $27,364 in net unrealized appreciation on investments recorded during such period.
Nine months ended September 30, 2011 and 2010. For the nine months ended September 30, 2011, the net decrease in our net assets resulting from operations was $2,580,603, or $0.42 per weighted average outstanding common share, which includes $14,356 in net unrealized depreciation on investments recorded during such period. For the nine months ended September 30, 2010, the net decrease in our net assets resulting from operations was $650,213, or $0.59 per weighted average outstanding common share, which includes $577,364 in net unrealized appreciation on investments recorded during such period.
Financial Condition, Liquidity and Capital Resources
On June 11, 2009, we commenced our continuous public offering pursuant to which we intended to sell from time-to-time up to 10 million shares of our common stock at an initial offering price of $10.00 per share, adjusted for volume discounts and commission waivers. Our continuous public offering concluded on June 30, 2011.
During the year ended December 31, 2010, we sold 2,290,399 shares of common stock in our continuous public offering at an average price of approximately $9.96 per share, resulting in gross proceeds of $22,809,653 and net proceeds of $20,613,587, after payment of $2,196,066 in dealer manager fees and commissions.
During the nine months ended September 30, 2011, we sold 6,423,306 shares of common stock at an average price of $9.96 per share, resulting in gross proceeds of $63,990,347 and net proceeds of $57,809,753, after payment of $6,180,594 in dealer manager fees and commissions.
On a cumulative basis under the continuous public offering, we sold 8,713,705 shares of common stock at an average price of $9.96 per share, resulting in gross proceeds of $86,800,000 and net proceeds of $78,423,340, after payment of $8,376,660 in dealer manager fees and commissions. Included in the continuous public offering were 564 shares of common stock issued to our Investment Adviser at a price of $10.00 per share and for total gross proceeds of $5,640.
On February 11, 2011, our Board of Directors declared a special cash distribution of $0.13 cents per share. The distribution was paid on February 17, 2011 to our stockholders of record as of February 15, 2011. As of the record date, there were 3,437,212 shares of common stock outstanding resulting in a cash distribution totaling $446,837. This special cash distribution was based on the unrealized appreciation we had previously recorded on our NeoPhotonics investment and, as such, will be initially treated as a return of capital to our stockholders. However, in the event we are able to sell all or a portion of our NeoPhotonics common shares, or any of our other portfolio company investments with a holding period of at least one year at the time of sale, at a gain during 2011 after the expiration of our 180 day lockup period, all or a portion of this special distribution may be reclassified at year end as a capital gain distribution to our stockholders. We provide no assurance that we will be able to sell all or any portion of our NeoPhotonics common shares during 2011 and, even if such shares are sold, there is no assurance that we will be able to realize a gain on such sale.
47
Prior to investing in equity securities of portfolio companies, we will continue to invest the net proceeds from our continuous public offering primarily in cash, cash equivalents including money market funds, U.S. government securities and other high-quality investments that mature in one year or less from the date of investment, which we expect will earn only nominal yields. Since we will generate current income on our portfolio company investments, our ability to make distributions will be based on our ability to invest our capital in suitable portfolio companies in a timely manner and to sell our interests in these portfolio companies at a gain after they become public.
Because the portfolio company securities that we acquire are typically illiquid until an IPO or sale of the company, we generally cannot predict the regularity and time periods between dispositions of our portfolio company investments and the realizations of capital gains, if any, from such dispositions. Dispositions of our portfolio company investments are discretionary and based on our business judgment. Since we do not expect to generate current income from our portfolio company investments, our annual operating expenses will be financed from our capital base during periods of time between realizations of capital gains on our investments. Accordingly, our future growth will be financed through reinvestment of the proceeds we realize from the sale of our portfolio company investments after we pay our annual operating expenses, any incentive fees earned by our investment adviser, and any distributions of realized net capital gains to our stockholders.
As of September 30, 2011, we had cash resources of $45,082,822 and no indebtedness, other than accounts payable and accrued expenses incurred in the ordinary course of business, of $77,660, base management fees and administrative expenses payable to Keating Investments of $162,304, and accrued incentives fees of $112,552 payable to Keating Investments based on the unrealized appreciation of our portfolio company investments.
As of September 30, 2011, our cash resources included $45,069,165 invested in a money market fund that invests primarily in U.S. Treasury securities, U.S. Government agency securities, and repurchase agreements fully-collateralized by such securities. Our money market fund investment has been classified as a component of Cash and Cash Equivalents in the Statement of Assets and Liabilities as of September 30, 2011. The remainder of our cash resources of $13,657 as of September 30, 2011 was held in bank depository accounts.
Distribution Policy
Distributions to stockholders will be payable only when and as declared by our Board of Directors and will be paid out of assets legally available for distribution. All distributions will be paid at the discretion of our Board of Directors and will depend on our realized net capital gains, our financial condition, maintenance of our RIC status, compliance with applicable business development company regulations and such other factors as our Board of Directors may deem relevant from time to time.
There can be no assurance that we will pay distributions to our stockholders in the future, and any distributions we do pay to stockholders will typically be paid from net realized gains, if any, from the disposition of our portfolio company investments. In certain limited cases, distributions may represent a return of capital. No distributions will be paid from current income since we do not expect to earn any current income on our portfolio company investments.
We will have substantial fluctuations in our distribution payments to stockholders, since we expect to have an average holding period for our portfolio company investments of up to three years. Our ability to pay distributions will be based on our ability to invest our capital in securities of suitable portfolio companies in a timely manner, our portfolio companies achieving a liquidity event through either an IPO or sale of the company, and our ability to dispose of our positions at a gain following the liquidity event. We can give no assurance that we will be able to realize any gains from the sale of our portfolio company investments.
Distributions paid during the year that exceed our net ordinary income and realized net capital gains will constitute a return of capital; however, we will not make any distributions representing a return of capital which would result in a total return of capital in excess of 10% of our total offering proceeds (i.e., the total gross proceeds received from the sale of our common stock). Distributions in excess of our net ordinary income and realized net capital gains would be treated first as a return of capital to the extent of the stockholder’s tax basis, and any remaining distributions would be treated as a capital gain. Distributions representing a return of capital will not reduce the number of shares of common stock that our stockholders own in us, but reduces the amount of funds we have for investment in targeted assets.
In the event we have realized net capital gains, we currently intend to distribute the amount of the realized net capital gain, reduced by any incentive fees payable to our investment adviser, to our stockholders at least annually. However, we may in the future decide to retain some or all of our realized net capital gains to finance the payment of our annual operating expenses and allow us to maintain our capital base for future investments. In the event we retain some or all of our realized net capital gains, including amounts retained to pay incentive fees to our investment adviser or our annual operating expenses, we will likely designate the retained amount as a deemed distribution to stockholders. In such case, among other consequences, we will pay corporate-level tax on the retained amount, each U.S. stockholder will be required to include its share of the deemed distribution in income as if it had been actually distributed to the U.S. stockholder, and the U.S. stockholder will be entitled to claim a credit or refund equal to its allocable share of the corporate-level tax we pay on the retained realized net capital gain. See “Taxation and Regulatory” below.
48
The determination of the tax attributes of our distributions will be made annually as of the end of our fiscal year based upon our net ordinary income and realized net capital gains for the full year and distributions paid for the full year. Therefore, a quarterly determination of the tax attributes of distributions made during the year may not be representative of the tax attributes of our distributions for a full year. Each year in which distributions are paid to our stockholders, a statement on Form 1099-DIV identifying the sources of our distributions will be mailed to our stockholders. If we had determined the tax attributes of our $446,837 of distributions year-to-date as of September 30, 2011, the entire amount of such distributions would be considered a return of capital since we did not generate any net ordinary income or realized net capital gains during the nine months ended September 30, 2011. However, actual determinations of the tax attributes of our distributions, including determinations of return of capital, are made annually as of the end of our fiscal year, based upon our net ordinary income and realized net capital gains for the full year.
We have adopted a dividend reinvestment plan that provides for reinvestment of our dividends and other distributions on behalf of our stockholders, unless a stockholder elects to receive cash. As a result, if our Board of Directors authorizes, and we declare, a cash distribution, then our stockholders who have not opted out of our dividend reinvestment plan will have their cash distributions automatically reinvested in additional shares of our common stock, rather than receiving the cash distributions. However, until our shares are listed on the Nasdaq Capital Market, our Board of Directors may determine that any distribution we may declare will not be available for reinvestment under the dividend reinvestment plan. Once our common stock becomes listed on the Nasdaq Capital Market, which we expect will occur by the end of 2011, all stockholders participating in the dividend reinvestment plan will have any cash distributions that may be paid in the future automatically reinvested in our common shares.
Contractual Obligations
We have entered into a contract under which we have material future commitments, the Investment Advisory and Administrative Services Agreement, pursuant to which Keating Investments has agreed to serve as our Investment Adviser and to furnish us with certain administrative services necessary to conduct our day-to-day operations. This agreement is terminable by either party upon proper notice. We pay Keating Investments a fee for its investment advisory services under the Investment Advisory and Administrative Services Agreement consisting of two components; (i) a base management fee, and (ii) an incentive fee. We also reimburse Keating Investments for our allocable portion of overhead and other administrative expenses incurred by it in performing its administrative obligations under the Investment Advisory and Administrative Services Agreement, including an allocable portion of the compensation of our Chief Financial Officer and Chief Compliance Officer, and their respective staff.
If the Investment Advisory and Administrative Services Agreement is terminated, our costs under a new agreement that we may enter into may increase. In addition, we will likely incur significant time and expense in locating alternative parties to provide the services we expect to receive under the Investment Advisory and Administrative Services Agreement. Any new Investment Advisory and Administrative Services Agreement would also be subject to approval by our stockholders.
The Investment Advisory and Administrative Services Agreement was initially approved by our Board of Directors and our sole stockholder on July 28, 2008. An amended and restated version of the Investment Advisory and Administrative Services Agreement, which is presently in effect, was approved by our Board of Directors on April 17, 2009, and by our stockholders on May 14, 2009. Unless earlier terminated as described below, our current Investment Advisory and Administrative Services Agreement will remain in effect for a period of two years from the date it was approved by our Board of Directors and will remain in effect from year to year thereafter if approved annually by (i) the vote of our Board of Directors, or by the vote of a majority of our outstanding voting securities, and (ii) the vote of a majority of our directors who are not interested persons. An affirmative vote of the holders of a majority of our outstanding voting securities is also necessary in order to make material amendments to the Investment Advisory and Administrative Services Agreement. Our Board of Directors (including the independent directors) approved the renewal of the Investment Advisory and Administrative Services Agreement for an additional year at its meeting held on April 12, 2011.
Off-Balance Sheet Arrangements
As of September 30, 2011, we have no off-balance sheet arrangements.
Related Parties
We have a number of business relationships with affiliated or related parties. We have entered into the Investment Advisory and Administrative Services Agreement with Keating Investments. Timothy J. Keating, our President, Chief Executive Officer and Chairman of the Board of Directors, is the managing member and majority owner of Keating Investments. Ranjit P. Mankekar, our Chief Financial Officer, Treasurer and a member of our Board of Directors, is also an executive officer of Keating Investments. Frederic M. Schweiger our Chief Operating Officer, Chief Compliance Officer and Secretary, is also an executive officer and member of Keating Investments. Kyle L. Rogers, our Chief Investment Officer, is also an executive officer and member of Keating Investments. We have also entered into a license agreement with Keating Investments, pursuant to which Keating Investments has granted us a non-exclusive license to use the name “Keating.” In addition, pursuant to the terms of the Investment Advisory and Administrative Services Agreement, Keating Investments provides us with certain administrative services necessary to conduct our day-to-day operations.
49
Our Investment Adviser’s senior investment professionals, Messrs. Keating, Mankekar, Schweiger and Rogers, and the additional administrative personnel currently retained by Keating Investments, are expected to devote a majority of their business time to our operations. Currently, these senior investment professionals do not serve as principals of other investment funds affiliated with Keating Investments; however, they may do so in the future. If they do, persons and entities may in the future manage investment funds with investment objectives similar to ours. In addition, our current executive officers and directors, serve or may serve as officers, directors or principals of entities that operate in the same or related line of business as we do, including investment funds managed by our affiliates. Accordingly, we may not be given the opportunity to participate in certain investments made by investment funds managed by advisers affiliated with Keating Investments. In the event that Keating Investments or its affiliates provide investment advisory services to other entities, we expect that our management and our independent directors will attempt to resolve any conflicts in a fair and equitable manner taking into account factors that would include the investment objective, amount of assets under management and available for investment in new portfolio companies, portfolio composition and return expectations of us and any other entity, and other factors deemed appropriate. However, in the event such conflicts do arise in the future, Keating Investments intends to allocate investment opportunities in a fair and equitable manner consistent with our investment objective and strategies so that we are not disadvantaged in relation to any other affiliate or client of Keating Investments.
We rely on Keating Investments to manage our day-to-day activities and to implement our investment strategy. Keating Investments may in the future provide similar investment advisory services to other entities in addition to us. As a result of these activities, Keating Investments, its employees and certain of its affiliates will have conflicts of interest in allocating their management time, services, and functions among us and any other business ventures in which they or any of their key personnel, as applicable, may become involved. In such case, Keating Investments and its employees may devote only as much of their time to our business as Keating Investments and its employees, in their judgment, determine is reasonably required, which may be substantially less than their full time. This could result in actions that are more favorable to other affiliated entities than to us. In the event that Keating Investments provides investment advisory services to other entities, we intend to have our independent directors review our Investment Adviser’s performance periodically, but not less than annually, to assure that Keating Investments is fulfilling its obligations to us under the Investment Advisory and Administrative Services Agreement, that any conflicts are handled in a fair and equitable manner and that Keating Investments has sufficient personnel to discharge fully its responsibilities to all activities in which they are involved.
As a business development company, we may be limited in our ability to invest in any portfolio company in which any fund or other client managed by Keating Investments, or any of its affiliates has an investment. We may also be limited in our ability to co-invest in a portfolio company with Keating Investments or one or more of its affiliates. Subject to obtaining exemptive relief from the SEC, we intend to co-invest with any such investment entity to the extent permitted by the 1940 Act, or the rules and regulations thereunder.
In addition, we have adopted a formal Code of Ethics that governs the conduct of our officers and directors. Our officers and directors also remain subject to the fiduciary obligations imposed by both the 1940 Act and applicable state corporate law. Finally, we pay Keating Investments our allocable portion of overhead and other expenses incurred by Keating Investments in performing its administrative obligations under the Investment Advisory and Administrative Services Agreement, which creates conflicts of interest that our Board of Directors must monitor.
Information concerning related party transactions is included in the financial statements and related notes, appearing elsewhere in this quarterly report on Form 10-Q.
Critical Accounting Policies
The preparation of financial statements and related disclosures in conformity with accounting principles generally accepted in the United States of America requires management to make estimates and assumptions that affect the reported amounts of assets and liabilities, disclosure of contingent assets and liabilities at the date of the financial statements, and revenues and expenses during the periods reported. Actual results could materially differ from those estimates. We have identified the following items as critical accounting policies.
Valuation of portfolio investments. The most significant estimate inherent in the preparation of our financial statements is the valuation of our portfolio investments and the related amounts of unrealized appreciation and depreciation. As of September 30, 2011 and December 31, 2010, 41.59% and 18.60%, respectively, of our net assets represented investments in portfolio companies valued at fair value. Value, as defined in Section 2(a)(41) of the 1940 Act, is: (i) the market price for those securities for which a market quotation is readily available, and (ii) for all other securities and assets, fair value is as determined in good faith by our Board of Directors.
50
Accounting Standards Codification Topic 820, “Fair Value Measurement and Disclosures,” (“ASC 820”) defines fair value as the price that would be received to sell an asset or paid to transfer a liability in an orderly transaction between market participants at the measurement date (exit price). In accordance with ASC 820, the Company uses a three-tier fair value hierarchy, which prioritizes the inputs used in measuring fair value as follows:
|
|
·
|
Level 1: Observable inputs such as unadjusted quoted prices in active markets;
|
|
|
·
|
Level 2: Includes inputs such as quoted prices for similar securities in active markets and quoted prices for identical securities where there is little or no activity in the market; and
|
|
|
·
|
Level 3: Unobservable inputs for which little or no market data exists, therefore requiring an entity to develop its own assumptions.
|
As of September 30, 2011, all of our investments in portfolio companies were determined to be Level 3 assets, except for our investment in the common stock of NeoPhotonics, which was determined to be a Level 1 asset following the expiration of a 180 day lockup provision in August of 2011.
Determining fair value requires that judgment be applied to the specific facts and circumstances of each portfolio investment while employing a consistently applied valuation process for the types of investments we make. We are required to specifically value each individual investment on a quarterly basis.
The 1940 Act requires periodic valuation of each portfolio investment to determine our net asset value. Under the 1940 Act, unrestricted securities with readily available market quotations in an active market are valued at the current market price; all other assets must be valued at fair value as determined in good faith by or under the direction of the Board of Directors.
Our equity investments for which market quotations are readily available are generally valued at the most recently available closing market prices. However, equity investments for which market quotations are readily available, but which are subject to lockup provisions restricting the resale of such investments for a specified period of time, are valued at a discount to the most recently available closing market prices.
With respect to investments for which market quotations are not readily available, the Company’s Board of Directors undertakes a multi-step valuation process each quarter, as described below:
|
|
·
|
The Company’s quarterly valuation process begins with each portfolio company investment being initially valued by Keating Investments’ senior investment professionals responsible for the portfolio investment;
|
|
|
·
|
Third-party valuation firms engaged by the Company’s Board of Directors review these preliminary valuations at such times as determined by the Company’s Board of Directors, provided, however, that a review will be conducted by a third-party valuation firm for each new portfolio company investment made during a calendar quarter, at such time as the valuation for a specific portfolio company investment is increased, and at least once every twelve months;
|
|
|
·
|
The Company’s Valuation Committee reviews the preliminary valuations, and the Company’s Investment Adviser and the third-party valuation firms respond and supplement the preliminary valuation to reflect any comments provided by the Valuation Committee; and
|
|
|
·
|
The Company’s Board of Directors discusses the valuations and determines, in good faith, the fair value of each investment in the Company’s portfolio for which market quotations are not readily available based on the input of the Company’s Investment Adviser, the third-party valuation firms, and the Company’s Valuation Committee.
|
The fair values of our equity investments for which market quotations are not readily available (including investments in convertible preferred stock) are determined based on various factors. To determine the fair value of a portfolio company, we analyze the portfolio company’s historical and projected financial results, industry valuation benchmarks and public market comparables, and other factors. We also consider other events, including private mergers and acquisitions, the transaction in which we acquired our securities, public offering or subsequent equity sales. In addition, we consider the trends of the portfolio company’s basic financial metrics from the time of our original investment until the measurement date, with material improvement of these metrics indicating a possible increase in fair value, while material deterioration of these metrics may indicate a possible reduction in fair value. The fair values of our portfolio company securities are generally discounted for lack of marketability or when the securities are illiquid, such as when there are restrictions on resale or the lack of an established trading market.
51
The fair value of common and preferred stock warrants is generally determined by using the Black-Scholes option pricing model or, in cases of certain “structured” warrants where our ability to exercise may be contingent or be subject to certain performance metrics, an option pricing model based on large numbers of simulations that takes into account these special terms.
Because there is initially no public market for the equity securities of the private companies in which we invest, the valuation of these investments is estimated in good faith by our Board of Directors. We have engaged two third-party valuation firms to review the valuation of our portfolio company investments from time to time as determined by our Board.
In the absence of a readily ascertainable market value, the estimated value of our portfolio of equity securities may differ significantly from the value that would be placed on the portfolio if a ready market for the equity securities existed. Changes in valuation of these equity securities are recorded in our Statement of Operations as “Net change in unrealized appreciation (depreciation) on investments.” Changes in valuation of any of our investments in privately held companies from one period to another may be volatile.
Determination of fair values involves subjective judgments and estimates. Accordingly, this critical accounting policy expresses the uncertainty with respect to the possible effect of such valuations, and any change in such valuations, on our financial statements.
Federal Income Taxes. We have satisfied the requirements to qualify as a RIC and have elected to be treated as a RIC under Subchapter M of the Code effective for our 2010 tax year. In future years, if we do not meet the criteria to qualify as a RIC, we will be taxed as a regular corporation under Subchapter C of the Code. We intend to operate so as to continue to qualify to be taxed as a RIC and, as such, to not be subject to federal income tax on the portion of our net ordinary income and realized net capital gains distributed to stockholders. To qualify for RIC tax treatment, we are required to annually distribute at least 90% of our investment company taxable income.
Because federal income tax regulations differ from accounting principles generally accepted in the United States of America, distributions in accordance with tax regulations may differ from net investment income and realized gains recognized for financial reporting purposes. Differences may be permanent or temporary. Permanent differences are reclassified among capital accounts in the financial statements to reflect their tax character. Temporary differences arise when certain items of income, expense, gain or loss are recognized at some time in the future. Differences in classification may also result from the treatment of short-term gains as ordinary income for tax purposes.
52
|
Quantitative and Qualitative Disclosures about Market Risk.
|
Our business activities contain elements of risk. We consider the primary types of market risk attributable to us to be valuation risk and interest rate risk.
Valuation Risk. Value, as defined in Section 2(a)(41) of the 1940 Act, is (i) the market price for those securities for which market quotations are readily available and (ii) fair value as determined in good faith by, or under the direction of, the Board of Directors for all other assets. (See Note 3, Valuation of Investments, included in “Item 1. Financial Statements.”)
Because there is initially no public market for the equity securities of the private companies in which we invest, the valuation of these investments is estimated in good faith by our Board of Directors, in accordance with our valuation procedures. In the absence of a readily ascertainable market value, the estimated value of our portfolio of equity securities may differ significantly from the value that would be placed on the portfolio if a ready market for the equity securities existed. Changes in valuation of these equity securities are recorded in our Statement of Operations as “Net change in unrealized appreciation (depreciation) on investments.” Changes in valuation of any of our investments in privately held companies from one period to another may be volatile.
Interest Rate Risk. As a significant portion of the net proceeds from our continuous public offering have been invested in money market funds, pending subsequent investment in suitable portfolio companies in accordance with our investment objective, we have market risk exposure relating to fluctuations in interest rates.
As of September 30, 2011, $45,069,165 was invested in a money market fund at an effective annualized interest rate of approximately 0.05%. Assuming no other changes to our holdings as of September 30, 2011, a one percentage point increase in the underlying interest rate payable on our money market fund investments as of September 30, 2011 would result in an increase of approximately $113,000 in the amount of interest or dividend income we would earn from our money market fund investments for the following 90-day period.
We have not engaged in any hedging activities since our inception and we do not expect to engage in any hedging activities with respect to the market risks to which we are exposed.
|
Controls and Procedures.
|
As of September 30, 2011 (the end of the period covered by this report), we, including our Chief Executive Officer and Chief Financial Officer, evaluated the effectiveness of the design and operation of our disclosure controls and procedures (as defined in Rule 13a-15(e) of the 1934 Act). Based on that evaluation, our management, including our Chief Executive Officer and Chief Financial Officer, concluded that our disclosure controls and procedures were effective and provided reasonable assurance that information required to be disclosed in our periodic SEC filings is recorded, processed, summarized and reported within the time periods specified in the SEC’s rules and forms, and that such information is accumulated and communicated to our management, including our Chief Executive Officer and Chief Financial Officer, as appropriate, to allow timely decisions regarding required disclosure. However, in evaluating the disclosure controls and procedures, management recognized that any controls and procedures, no matter how well designed and operated can provide only reasonable assurance of achieving the desired control objectives, and management necessarily was required to apply its judgment in evaluating the cost-benefit relationship of possible controls and procedures.
Management has not identified any change in our internal control over financial reporting that occurred during the third quarter of 2011 that has materially affected, or is reasonably likely to materially affect, our internal control over financial reporting.
53
|
Legal Proceedings.
|
We are not currently subject to any material legal proceedings, nor, to our knowledge, is any material legal proceeding threatened against us. From time to time, we may be a party to certain legal proceedings in the ordinary course of business, including proceedings relating to the enforcement of our rights under contracts with our portfolio companies. While the outcome of these legal proceedings cannot be predicted with certainty, we do not expect that these proceedings will have a material effect upon our financial condition or results of operations.
|
Risk Factors.
|
Except as described below, there have been no material changes during the three and nine months ended September 30, 2011 to the risk factors discussed in Item 1A. Risk Factors in our Annual Report on Form 10-K for the year ended December 31, 2010.
The downgrade in the U.S. credit rating could materially adversely impact our business, financial condition and results of operations.
On August 5, 2011, Standard & Poor's Rating Services (“S&P”) downgraded the U.S. credit rating from its top rank of AAA to AA+. The downgrade of the U.S. credit rating could have a material adverse effect on the financial markets and economic conditions in the United States and throughout the world. Additionally, austerity measures necessary to reduce the deficit could result in a slowing economy in the near term.
In addition, adverse market and economic conditions that could occur due to a downgrade of the U.S. credit rating on the United States' debt could result in increasing borrowing costs, a falling dollar, less stable financial markets and slowing or negative economic growth in the near term. These events could adversely affect our business in a variety ways, including, but not limited to, adversely impacting our portfolio companies’ ability to obtain financing, or obtaining financing but at significantly higher costs or lower valuations than the preceding financing rounds. Market disruptions could also delay the timing of going public by our private portfolio companies and affect the value of our publicly traded portfolio companies, which as of September 30, 2011, accounted for 6.5% percent of our investment portfolio and 2.7% of our total assets. If any of these events were to occur, it could materially adversely affect our business, financial condition and results of operations.
In addition to the downgrade of the U.S. credit rating, on August 8, 2011, S&P downgraded the credit ratings of Fannie Mae, Freddie Mac, and other entities linked to long-term U.S. debt. A significant portion of our portfolio consists of money market funds that invest in U.S. Treasuries and other U.S. Government agency-backed securities. These money market funds could be adversely affected by these recent credit downgrades.
Our investments in technology companies are subject to many risks, including volatility, intense competition, shortened product life cycles and periodic downturn.
We have invested and will continue investing in technology companies, many of which may have narrow product lines and small market shares, which tend to render them more vulnerable to competitors’ actions and market conditions, as well as to general economic downturns. The revenues, income (or losses), and valuations of technology-related companies can and often do fluctuate suddenly and dramatically. In addition, technology-related markets are generally characterized by abrupt business cycles and intense competition. Therefore, our portfolio companies may face considerably more risk of loss than do companies in other industry sectors.
Because of rapid technological change, the selling prices of products and services provided by technology-related companies have historically decreased over their productive lives. As a result, the selling prices of products and services offered by technology-related companies may decrease over time, which could adversely affect their operating results, their ability to meet obligations under their debt securities and the value of their equity securities. This could, in turn, materially adversely affect the value of the technology-related companies in our portfolio.
54
Our investments in the clean technology industry are subject to many risks, including volatility, intense competition, unproven technologies and periodic downturns.
Our investments in clean technology, or cleantech, companies are subject to substantial operational risks, such as underestimated cost projections, unanticipated operation and maintenance expenses, loss of government subsidies, and inability to deliver cost-effective alternative energy solutions compared to traditional energy products. In addition, energy companies employ a variety of means of increasing cash flow, including increasing utilization of existing facilities, expanding operations through new construction or acquisitions, or securing additional long-term contracts. Thus, some energy companies may be subject to construction risk, acquisition risk or other risks arising from their specific business strategies. Furthermore, production levels for solar, wind and other renewable energies may be dependent upon adequate sunlight, wind, or biogas production, which can vary from market to market and period to period, resulting in volatility in production levels and profitability. In addition, our cleantech companies may have narrow product lines and small market shares, which tend to render them more vulnerable to competitors’ actions and market conditions, as well as to general economic downturns. The revenues, income (or losses) and valuations of clean technology companies can and often do fluctuate suddenly and dramatically and the markets in which clean technology companies operate are generally characterized by abrupt business cycles and intense competition. Demand for clean technology and renewable energy is also influenced by the available supply and prices for other energy products, such as coal, oil and natural gases. A change in prices in these energy products could reduce demand for alternative energy. There is particular uncertainty about whether agreements providing incentives for reductions in greenhouse gas emissions, such as the Kyoto Protocol, will continue and whether countries around the world will enact or maintain legislation that provides incentives for reductions in greenhouse gas emissions, without which such investments in clean technology dependent portfolio companies may not be economical or financing for such projects may become unavailable. As a result, these portfolio company investments face considerable risk, including the risk that favorable regulatory regimes expire or are adversely modified. This could, in turn, materially adversely affect the value of the clean technology companies in our portfolio.
Our investments in Internet and software companies are subject to many risks, including regulatory concerns, litigation risks and intense competition.
Our investments in Internet and software companies are subject to substantial risks. For example, our portfolio companies face intense competition since their businesses are rapidly evolving and intensely competitive, and are subject to changing technology, shifting user needs, and frequent introductions of new products and services. Internet and software companies have many competitors in different industries, including general purpose search engines, vertical search engines and e-commerce sites, social networking sites, traditional media companies, and providers of online products and services. Potential competitors to our portfolio companies in the Internet and software industries range from large and established companies to emerging start-ups. Further, such companies are subject to laws that were adopted prior to the advent of the Internet and related technologies and, as a result, do not contemplate or address the unique issues of the Internet and related technologies. The laws that do reference the Internet are being interpreted by the courts, but their applicability and scope remain uncertain. For example, the laws relating to the liability of providers of online services are currently unsettled both within the U.S. and abroad. Claims have been threatened and filed under both U.S. and foreign laws for defamation, invasion of privacy and other tort claims, unlawful activity, copyright and trademark infringement, or other theories based on the nature and content of the materials searched and the ads posted by a company’s users, a company’s products and services, or content generated by a company’s users. Further, the growth of Internet and software companies into a variety of new fields implicate a variety of new regulatory issues and may subject such companies to increased regulatory scrutiny, particularly in the U.S. and Europe. As a result, these portfolio company investments face considerable risk. This could, in turn, materially adversely affect the value of the Internet and software companies in our portfolio.
|
Unregistered Sales of Equity Securities and Use of Proceeds.
|
We did not engage in any unregistered sales of equity securities during the three months ended September 30, 2011.
|
Defaults upon Senior Securities.
|
Not applicable.
|
Reserved
|
55
|
Other Information.
|
Resignation of Ranjit P. Mankekar as Director, Chief Financial Officer and Treasurer
At our Board of Directors (the “Board”) meeting held on November 4, 2011, Ranjit P. Mankekar submitted his resignation as a director effective November 4, 2011 and as our Chief Financial Officer and Treasurer effective November 16, 2011. His resignation was accepted by our Board. Mr. Mankekar’s resignation was a personal decision and was not the result of any disagreement with us on any matters relating to our operations, policies or practices.
In connection with his resignation, the Board approved a separation payment arrangement with Mr. Mankekar under which we have agreed to pay Mr. Mankekar a separation payment equal to $8,000 per month (prorated for any partial month) for the period commencing on November 16, 2011 and continuing until April 30, 2012 (“Benefit Period”), payable in bi-monthly installments. As consideration for the separation payment, Mr. Mankekar will be required to assist in the transition of the Company’s financial reporting and related matters to the newly appointed Chief Financial Officer during the Benefit Period. In addition, Mr. Mankekar has agreed to release the Company and any of its affiliates from any and all claims relating to his employment and/or activities with or on behalf of the Company or any of its affiliates.
Appointment of Frederic M. Schweiger as Director
Our Board of Directors at its November 4, 2011 meeting appointed Frederic M. Schweiger to serve as a director of the Company effective November 4, 2011 and until the 2012 Annual Meeting of Stockholders or until his successor is duly elected and qualified. Mr. Schweiger currently serves as our Chief Operating Officer and Chief Compliance Officer. Mr. Schweiger also is the Chief Operating Officer and Chief Compliance Officer of our investment adviser, Keating Investments, LLC (“Keating Investments”), and serves as a member of our investment adviser’s investment committee. Accordingly, Mr. Schweiger is an “interested person” of the Company as such term is defined in Section 2(a)(19) under the Investment Company Act of 1940, as amended (the “1940 Act”).
Biographical and other information in satisfaction of the disclosures required by Items 401(b) and 401(e) of Regulation S-K with respect to Mr. Schweiger is included in the Proxy Statement for our 2011 Annual Stockholders’ Meeting which was filed with the U.S. Securities and Exchange Commission on April 20, 2011, and such information is included herein by reference.
Mr. Schweiger is qualified to serve on our Board because he has over 25 years of experience as a chief financial officer, general counsel or consultant advising private and public companies on a wide range of financial, accounting, strategic, operational and regulatory matters. Mr. Schweiger also has negotiated, evaluated and structured numerous corporate acquisitions, divestitures and financings. Mr. Schweiger’s knowledge of the going public process, public company reporting requirements, and other regulations impacting public companies and the capital formation process will also be a valuable contribution to our Board.
Appointment of Stephen M. Hills As Chief Financial Officer and Treasurer
Our Board of Directors at its November 4, 2011 meeting also appointed Stephen M. Hills, age 30, to serve as the Company’s Chief Financial Officer and Treasurer, replacing Mr. Mankekar, effective November 16, 2011.
Biographical and other information for Mr. Hills is set forth below.
Prior to joining us, Mr. Hills served as Director of Valuation Services with Arcstone Partners, a valuation services and investment research firm based in Denver, Colorado, from April 2011 through November 2011. From 2008 to 2011, Mr. Hills served as Manager of External Reporting and Manager of Technical Accounting with Molson Coors Brewing Company, a NYSE-traded global brewing company. Mr. Hills began his career at PricewaterhouseCoopers, where he worked in the audit practice in New York from 2003 to 2005 and the Transaction Services practice in New York and Chicago from 2005 to 2008, attaining the position of Manager. Mr. Hills is a Certified Public Accountant and a 2003 cum laude graduate of Villanova University with a B.S. in Accountancy.
None of our executive officers, including Mr. Hills, receive direct compensation from us. The compensation of our Chief Financial Officer is paid by Keating Investments, subject to reimbursement by us of our allocable portion of such compensation for services rendered him to us. The allocation ratio with respect to compensation of our Chief Financial Officer is dependent upon the amount of time he devotes to matters on behalf of us and Keating Investments, respectively.
56
|
Exhibits.
|
|
3.1
|
Amended and Restated Articles of Incorporation (Incorporated by reference to Post-Effective Amendment No. 1 to the Registrant’s Registration Statement on Form N-2 (File No. 333-157217), filed on April 21, 2010)
|
|
3.2
|
Articles of Amendment to Amended and Restated Articles of Incorporation (Incorporated by reference to Post-Effective Amendment No. 3 to the Registrant’s Registration Statement on Form N-2 (File No. 333-157217), filed on May 27, 2010)
|
|
3.3
|
Amended and Restated Bylaws (Incorporated by reference to the Registrant’s Current Report on Form 8-K (File No. 0-53504), filed on April 23, 2009)
|
|
3.4
|
Amendment to Bylaws dated August 5, 2010 (Incorporated by reference to the Registrant’s Current Report on Form 8-K (File No. 0-53504), filed on August 9, 2010)
|
|
3.5
|
Amendment to Bylaws dated October 22, 2010 (Incorporated by reference to the Registrant’s Current Report on Form 8-K (File No. 0-53504), filed on October 26, 2010)
|
|
3.6
|
Amended and Restated Dividend Reinvestment Plan (Incorporated by reference to the Registrant’s Quarterly Report on Form 10-Q (File No. 0-53504), filed on August 12, 2011)
|
|
4.1
|
Form of Share Certificate (Incorporated by reference to the Registrant’s Annual Report on Form 10-K (File No. 0-53504), filed on March 9, 2009)
|
|
10.1
|
Form of Amended and Restated Investment Advisory and Administrative Services Agreement (Incorporated by reference to Amendment No. 1 to the Registrant’s Registration Statement on Form N-2 (File No. 333-157217), filed on May 1, 2009)
|
|
10.2
|
License Agreement between the Company and Keating Investments, LLC (Incorporated by reference to the Registrant’s Registration Statement on Form 10 (File No. 0-53504), filed on November 20, 2008)
|
|
10.3
|
Form of Indemnification Agreement for Directors (Incorporated by reference to Amendment No. 2 to the Registrant’s Registration Statement on Form N-2 (File No. 333-157217), filed on June 5, 2009)
|
|
10.4
|
Custody Agreement between the Company and Steele Street Bank & Trust (Incorporated by reference to the Registrant’s Registration Statement on Form 10 (File No. 0-53504), filed on November 20, 2008)
|
|
11
|
Computation of Per Share Earnings (included in the notes to the unaudited financial statements contained in this report)
|
|
31.1*
|
Certification of Chief Executive Officer pursuant to Rule 13a-14 of the Securities Exchange Act of 1934, as amended.
|
|
31.2*
|
Certification of Chief Financial Officer pursuant to Rule 13a-14 of the Securities Exchange Act of 1934, as amended.
|
|
32.1*
|
Certification of Chief Executive Officer pursuant to Section 906 of The Sarbanes-Oxley Act of 2002.
|
|
32.2*
|
Certification of Chief Financial Officer pursuant to Section 906 of The Sarbanes-Oxley Act of 2002.
|
|
*
|
Filed herewith.
|
57
Pursuant to the requirements of Section 13 or 15(d) of the Securities Exchange Act of 1934, the Registrant has duly caused the report to be signed on its behalf by the undersigned, thereunto duly authorized.
|
Date: November 8, 2011
|
KEATING CAPITAL, INC.
|
|||||
|
By:
|
/s/ Timothy J. Keating
|
|||||
|
Timothy J. Keating
President and Chief Executive Officer
(Principal Executive Officer)
|
||||||
|
By:
|
/s/ Ranjit P. Mankekar
|
|||||
|
Ranjit P. Mankekar
Chief Financial Officer and Treasurer
(Principal Accounting and Financial Officer)
|
||||||
58