Attached files
| file | filename |
|---|---|
| 8-K - KEATING CAPITAL, INC. 8-K - CROSSROADS LIQUIDATING TRUST | a50373412.htm |
| EX-99.1 - EXHIBIT 99.1 - CROSSROADS LIQUIDATING TRUST | a50373412_ex991.htm |
Exhibit 99.2
Buy Privately, Sell Publicly, Capture the Difference™ August 2012 Investor Presentation Nasdaq: KIPO www.KeatingCapital.com
2 Disclaimer Keating Capital, Inc. (“Keating Capital”) is a Maryland corporation that has elected to be regulated as a business development company under the Investment Company Act of 1940, as amended. Keating Investments, LLC (“Keating Investments”) is an SEC registered investment adviser and acts as an investment adviser and receives base management and/or incentive fees from Keating Capital. Keating Investments and Keating Capital operate under the generic name of Keating. This presentation is a general communication of Keating and is not intended to be a solicitation to purchase or sell any security. This presentation may contain certain forward-looking statements, including statements with regard to the future performance of Keating Capital. These forward-looking statements are subject to the inherent uncertainties in predicting future results and conditions. Certain factors that could cause actual results to differ materially are included in Keating Capital’s Form 10-K and Form 10-Q, and other SEC filings, and include uncertainties of economic, competitive, and market conditions, and future business decisions all of which are difficult or impossible to predict accurately, and many of which are beyond the control of Keating Capital. Although Keating Capital believes that the assumptions underlying the forward-looking statements included herein are reasonable, any of the assumptions could be inaccurate and therefore there can be no assurance that the forward-looking statements included herein will prove to be accurate. Except as required by the federal securities laws, Keating Capital undertakes no obligation to revise or update this presentation (including the slides presented) or any forward-looking statements contained herein, whether as a result of new information, future events or otherwise. Buy Privately, Sell Publicly, Capture the DifferenceTM KEATING CAPITAL
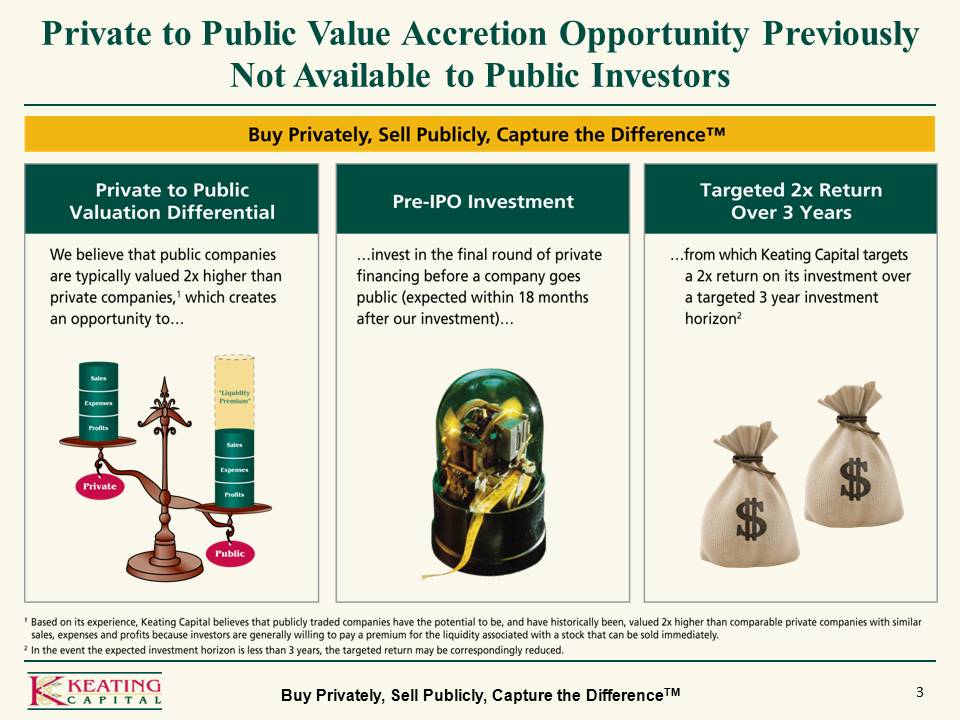
3 Private to Public Value Accretion Opportunity Previously Not Available to Public Investors Buy Privately, Sell Publicly, Capture the DifferenceTM Private to Public Valuation Differential Pre-IPO Investment Targeted 2x Return Over 3 Years We believe that public companies are typically valued 2x higher than private companies, 1 which creates an opportunity to Sales Expenses Profits Private Liquidity Premium Public invest in the final round of private financing before a company goes public (expected within 18 months after our investment)… from which Keating Capital targets a 2x return on its investment over a targeted 3 year investment horizon 2 1 Based on its experience, Keating Capital believes that publicly traded companies have the potential to be, and have historically been, valued 2x higher than comparable private companies with similar sales, expenses and profits because investors are generally willing to pay a premium for the liquidity associated with a stock that can be sold immediately. In the event the expected investment horizon is less than 3 years, the targeted return may be correspondingly reduced.
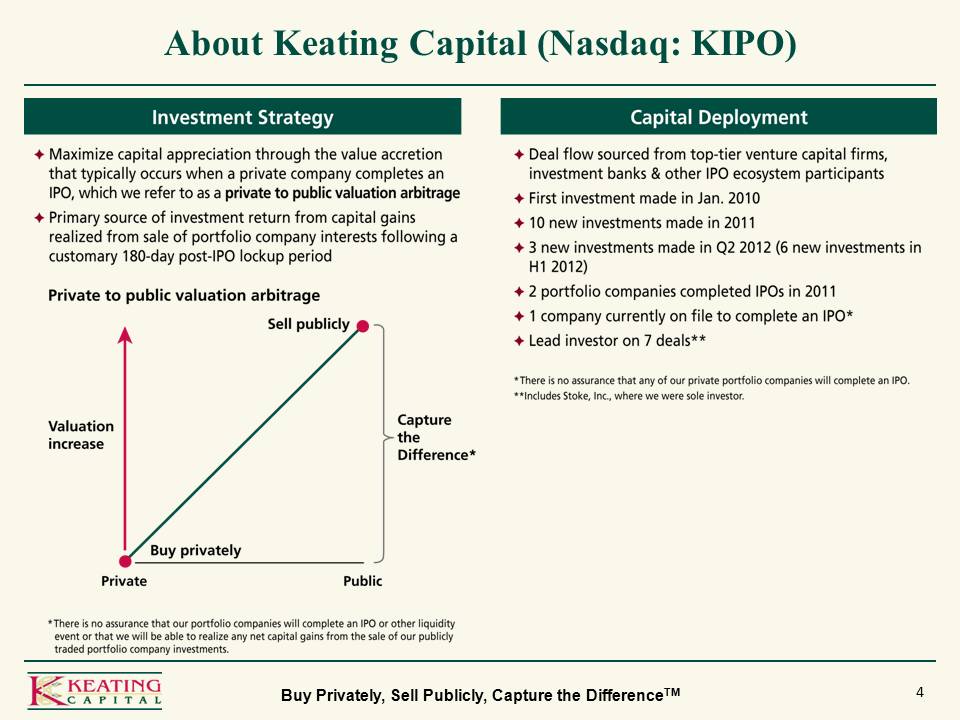
4 About Keating Capital (Nasdaq: KIPO) Buy Privately, Sell Publicly, Capture the DifferenceTM Investment Strategy Capital Deployment Maximize capital appreciation through the value accretion that typically occures when a private company completes an IPO, which we refer to as a private to public valuation arbitrage Primary sources of investment return from capital gains realized from sale of portfolio company interests following a customary 180-day post-IPO lockup period Private to public valuation arbitrage Sell publicly Capture the Difference* Buy privately Private Public Valuation increase There is no assurance that our portfolio companies will complete an IPO or other liquidity event or that we will be able to realize any net capital gains from the sale of our publicly traded portfolio company investments. Deal flow sources from top-tier venture capital firms, investment banks & other IPO ecosystem participants First investment made in Jan. 2010 10 new investments made in 2011 3 new investments made in Q2 2012 (6 new investments in H1 2012) 2 portfolio companies completed IPOs in 2011 1 company currently on file to complete an IPO* Lead investor on 7 deals** *There is no assurance that any of our private portfolio companies will complete an IPO. Includes Stoke, Inc., where we were sole investor.
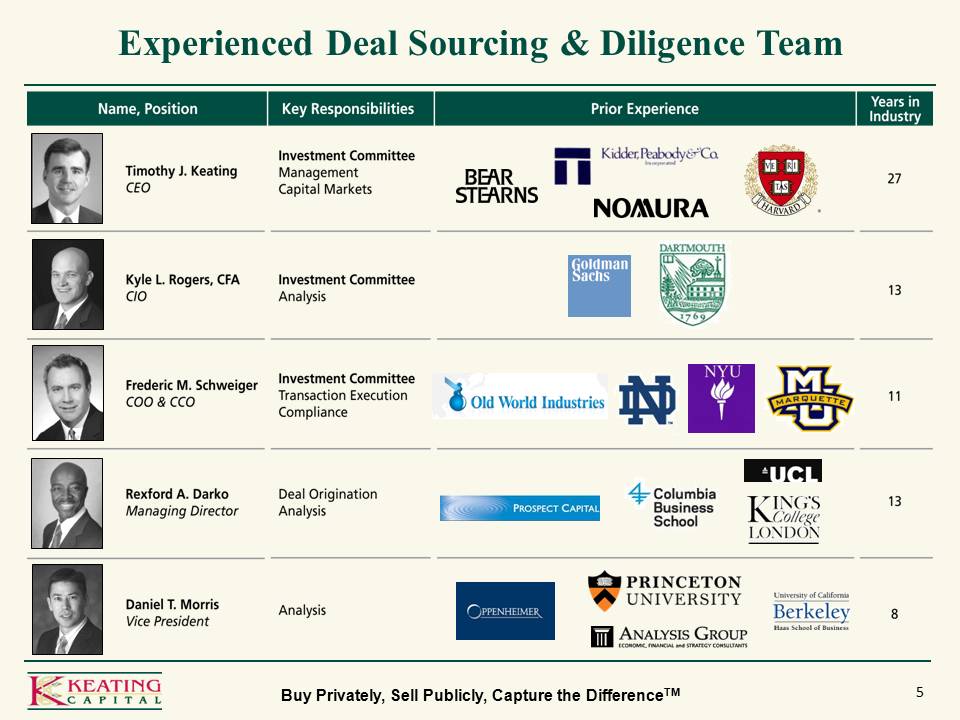
5 Experienced Deal Sourcing & Diligence Team Buy Privately, Sell Publicly, Capture the DifferenceTM Name, Position Key Responsibilities Prior Experience Years in Industry Timothy J. Keating CEO Investment Committee Management Capital Markets 27 Kyle L. Rogers, CFA CIO Investment Committee Analysis 13 Frederic M. Schweiger COO & CCO Investment Committee Transaction Execution Compliance 11 Rexford A. Darko Managing Director Deal Origination Analysis 13 Daniel T. Morris Vice President Analysis 8
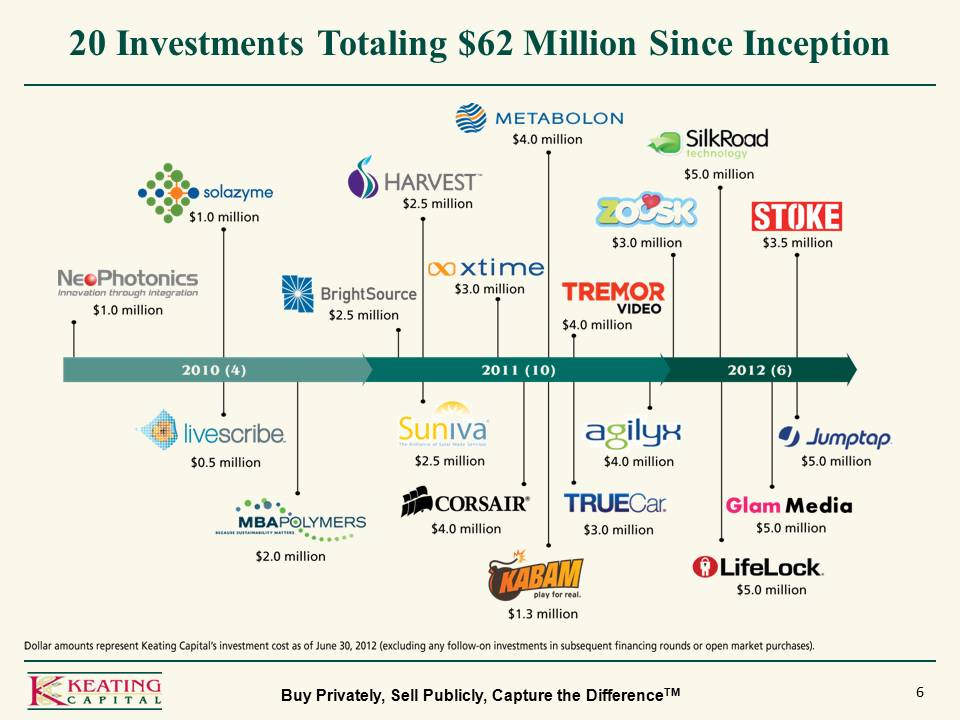
6 20 Investments Totaling $62 Million Since Inception Buy Privately, Sell Publicly, Capture the DifferenceTM Dollar amounts represent Keating Capital’s investment cost as of June 30, 2012 (excluding any follow-on investments in subsequent financing rounds or open market purchases). Agilyx Harvest Power BrightSource MBA Polymers Solazyme* Suniva 5% 3% 2% Technology Corsair Metabolon Stoke NeoPhotonics* Livescribe 7% 1% < Internet & Software Jumptap Glam Media LifeLock SilkRoad Tremor Video Xtime TrueCar Zoosk Kabam 4% $1.0 million $2.5 million $3.0 million $4.0 million $5.0 million $3.5 million $0.5 million $5.0 million $2.0 million $1.3 million
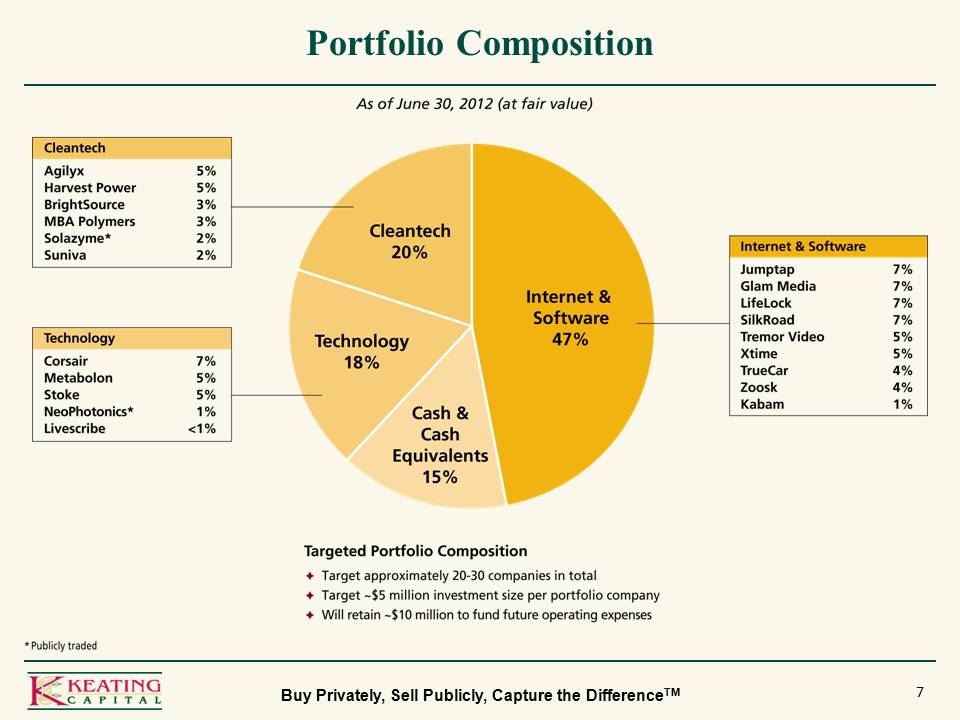
7 Portfolio Composition Buy Privately, Sell Publicly, Capture the DifferenceTM As of June 30, 2012 (at fair value) Cleantech 20% Technology 18% Internet & Software 47% Cash & Cash Equivalents 15% Targeted Portfolio Composition Target approximately 20-30 companies in total Target ~ $5 million investment size per portfolio company Will retain ~ $10 million to fund future operating expenses Agilyx Harvest Power BrightSource MBA Polymers Solazyme* Suniva 5% 3% 2% Technology Corsair Metabolon Stoke NeoPhotonics* Livescribe 7% 1% < Internet & Software Jumptap Glam Media LifeLock SilkRoad Tremor Video Xtime TrueCar Zoosk Kabam 4%
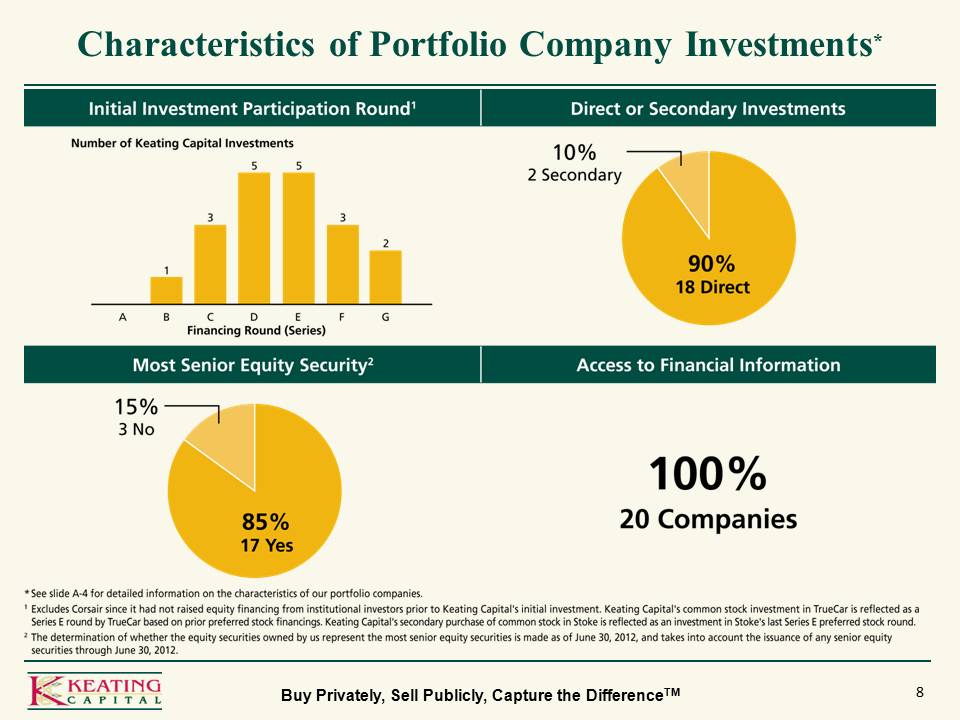
8 Characteristics of Portfolio Company Investments* Buy Privately, Sell Publicly, Capture the DifferenceTM Initial Investment Participation Round1 Direct or Secondary Investments Most Senior Equity Security 2 Access to Financial Information Number of Keating Capital Investments 10% 2 Secondary 90% 18 Direct A B C D E F G 1 3 5 2 Financing Round (Series) 15% 3 No 85% 17 Yes 100% 20 Companies *See slide A-4 for detailed information on the characteristics of our portfolio companies. Excludes Corsair since it had not raised equity financing from institutional investors prior to Keating Capital’s initial investment. Keating Capital’s common stock investment in TrueCar is reflected as a Series E round by TrueCar based on prior preferred stock financings. Keating Capital’s secondary purchase of common stock in Stoke is reflected as an investment in Stoke’s last Series E preferred stock round. The determination of whether the equity securities owned by us represent the most senior equity securities is made as of June 30, 2012, and takes into account the issuance of any senior equity securities through June 30, 2012
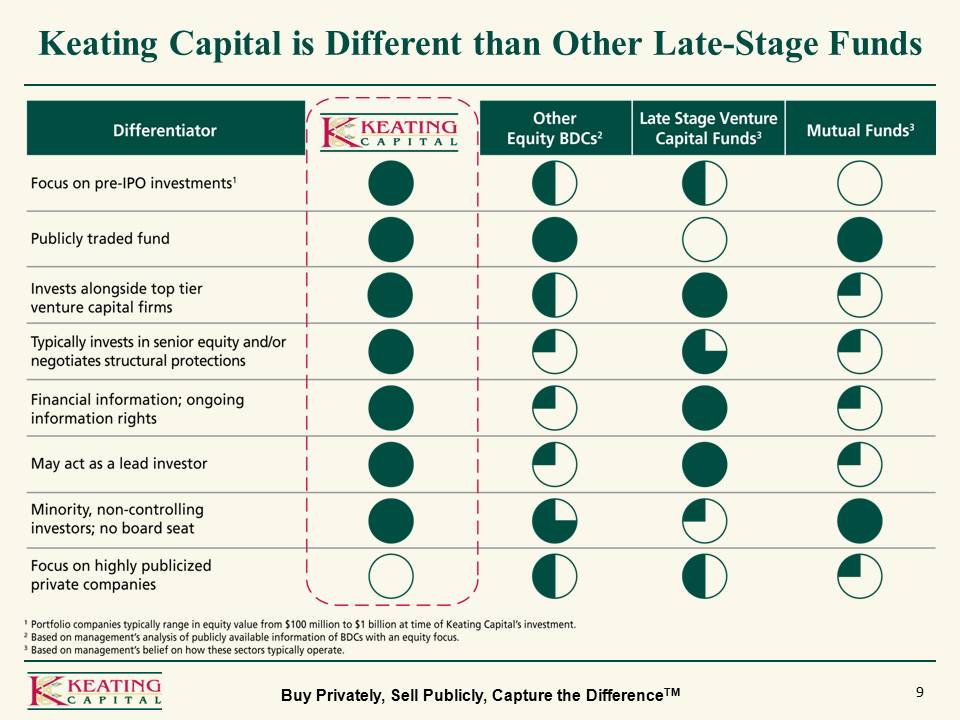
9 Keating Capital is Different than Other Late-Stage FundsBuy Privately, Sell Publicly, Capture the DifferenceTM Differentiator KEATING CAPITAL Other Equity BDCs2 Late Stage Venture Capital Funds3 Mutual Funds3 Focus on pre-IPO investments1 Publicly traded fund Invests alongside top tier venture capital firms Typically invests in senior equity and/or negotiates structural protections Financial information; ongoing information rights May act as a lead investor Minority, non-controlling investors; no board seat Focus on highly publicized private companies Portfolio companies typically range in equity value from $100 million to $1 billion at time of Keating Capital’s investment. Based on management’s analysis of publicly available information of BDCs with an equity focus. Based on management’s belief on how these sectors typically operate.
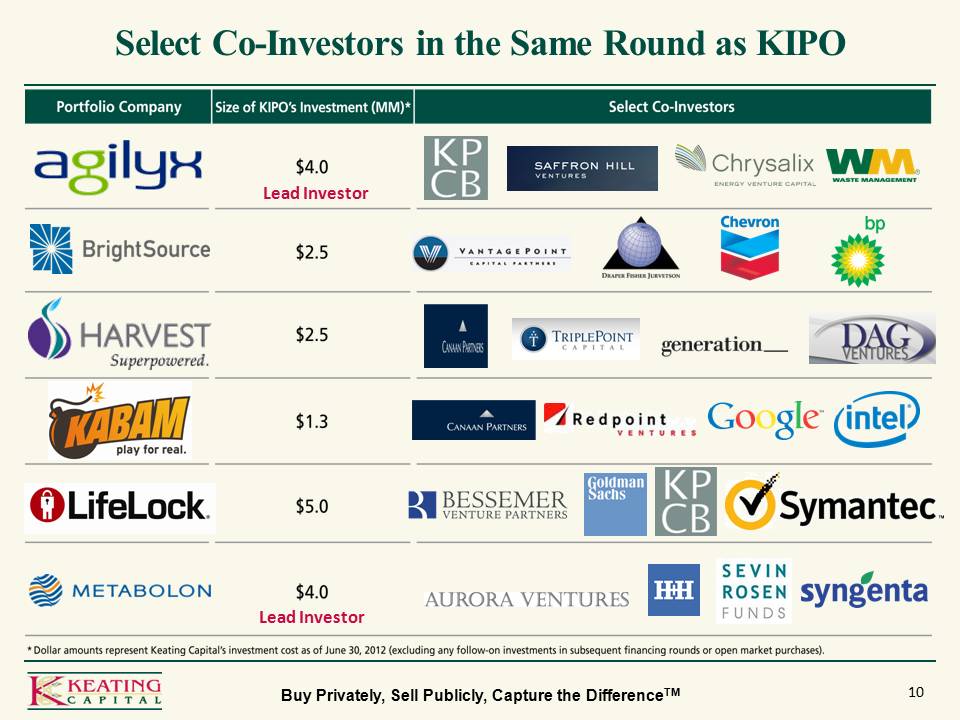
10 Select Co-Investors in the Same Round as KIPO Lead Investor Lead Investor Buy Privately, Sell Publicly, Capture the DifferenceTM Agilyx Harvest Power BrightSource MBA Polymers Solazyme* Suniva 5% 3% 2% Technology Corsair Metabolon Stoke NeoPhotonics* Livescribe 7% 1% < Internet & Software Jumptap Glam Media LifeLock SilkRoad Tremor Video Xtime TrueCar Zoosk Kabam 4% $1.0 million $2.5 million $3.0 million $4.0 million $5.0 million $3.5 million $0.5 million $5.0 million $2.0 million $1.3 million Dollar amounts represent Keating Capital’s investment cost as of June 30, 2012 (excluding any follow-on investments in subsequent financing rounds or open market purchases).
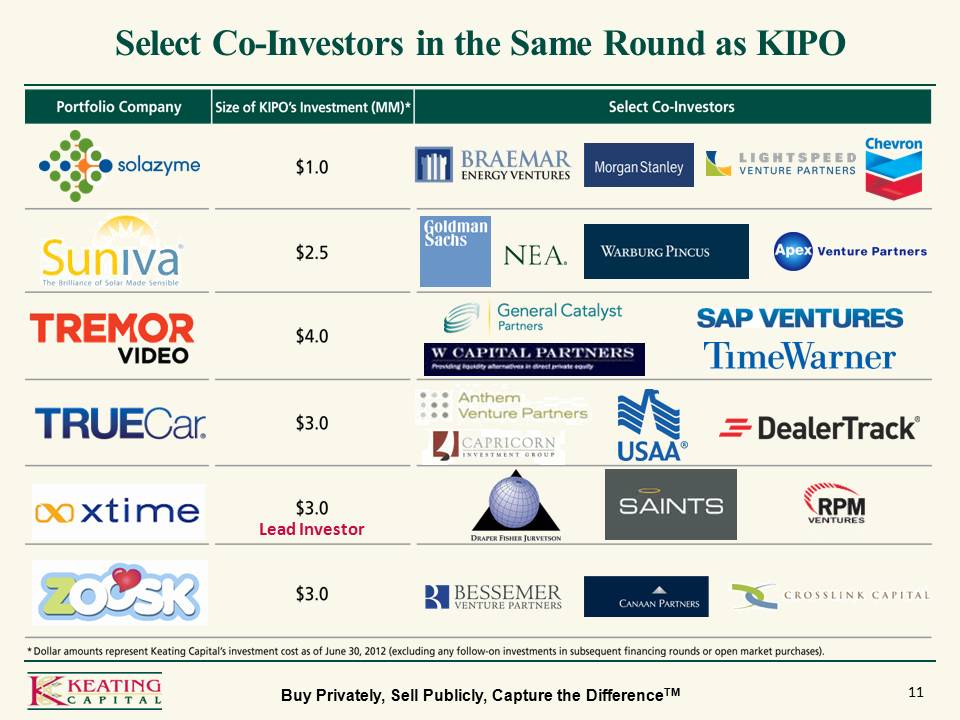
11 Select Co-Investors in the Same Round as KIPO Lead Investor Buy Privately, Sell Publicly, Capture the DifferenceTM Agilyx Harvest Power BrightSource MBA Polymers Solazyme* Suniva 5% 3% 2% Technology Corsair Metabolon Stoke NeoPhotonics* Livescribe 7% 1% < Internet & Software Jumptap Glam Media LifeLock SilkRoad Tremor Video Xtime TrueCar Zoosk Kabam 4% $1.0 million $2.5 million $3.0 million $4.0 million $5.0 million $3.5 million $0.5 million $5.0 million $2.0 million $1.3 million Dollar amounts represent Keating Capital’s investment cost as of June 30, 2012 (excluding any follow-on investments in subsequent financing rounds or open market purchases).
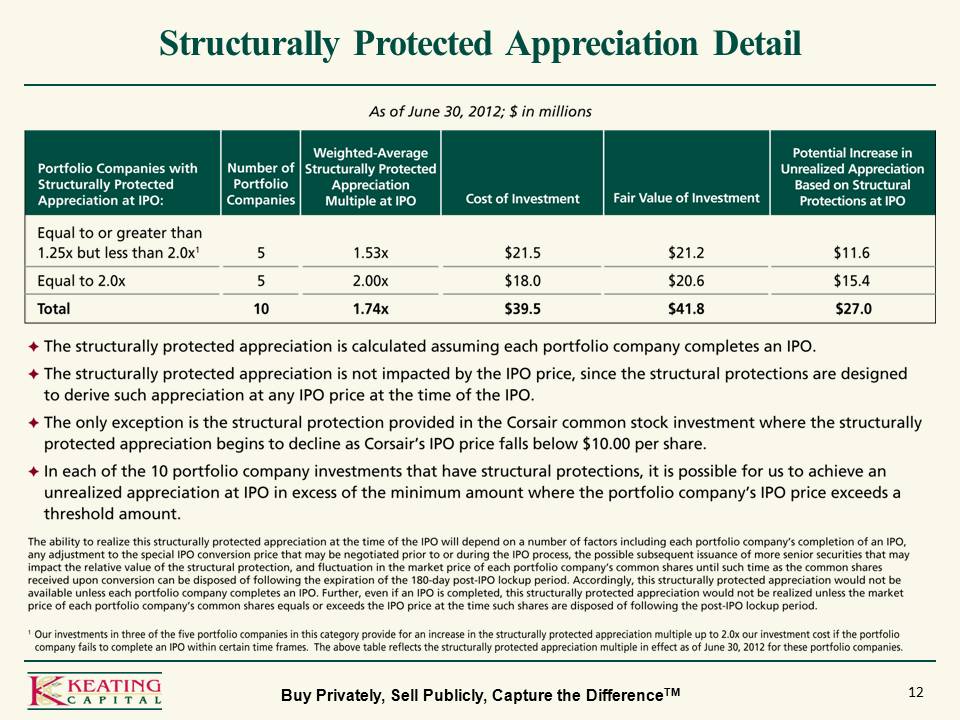
12 Structurally Protected Appreciation Detail Buy Privately, Sell Publicly, Capture the DifferenceTM As of June 30, 2012; $ in millions Portfolio Companies with Structurally Protected Appreciation at IPO: Number of Portfolio Companies Weighted-Average Structurally Protected Appreciation Multiple at IPO Cost of Investment Fair Value of Investment Potential Increase in Unrealized Appreciation Based on Structural Protections at IPO Equal to or greater than 1.25x but less than 2.0x1 Equal to 2.0x Total 5 10 1.53x 2.00x 1.74x $21.5 $18.0 $39.5 $21.2 $20.6 $41.8 $11.6 $15.4 $27.2 The structurally protected appreciation is calculated assuming each portfolio company completes an IPO. The structurally protected appreciation is not impacted by the IPO price, since the structural protections are designed to derive such appreciation at any IPO price at the time of the IPO. The only exception is the structural protection provided in the Corsair common stock investment where the structurally protected appreciation begins to decline as Corsair’s IPO price falls below $10.00 per share. In each of the 10 portfolio company investments that have structural protections, it is possible for us to achieve an unrealized appreciation at IPO in excess of the minimum amount where the portfolio company’s IPO price exceeds a threshold amount. The ability to realize this structurally protected appreciation at the time of the IPO will depend on a number of factors including each portfolio company’s completion of an IPO, any adjustments to the special IPO conversion price that may be negotiatied prior to or during the IPO process, the possible subsequent issuance of more senior securities that may impact the relative value of the structural protection, and fluctuation in the market price of each portfolio company’s common shares until such time as the common shares received upon conversion can be disposed of following the expiration of the 180-day post-IPO lockup period. Accordingly, this structurally protected appreciationg would not be realized unless the market price of each portfolio company’s common shares equals or exceeds the IPO price at the time such shares are disposed of following the post-IPO lockup period. 1 Our investments in three of the five portfolio companies in this category provide for an increase int eh structurally protected appreciation multiple in effect as of June 30, 2012 for these portfolio companies.
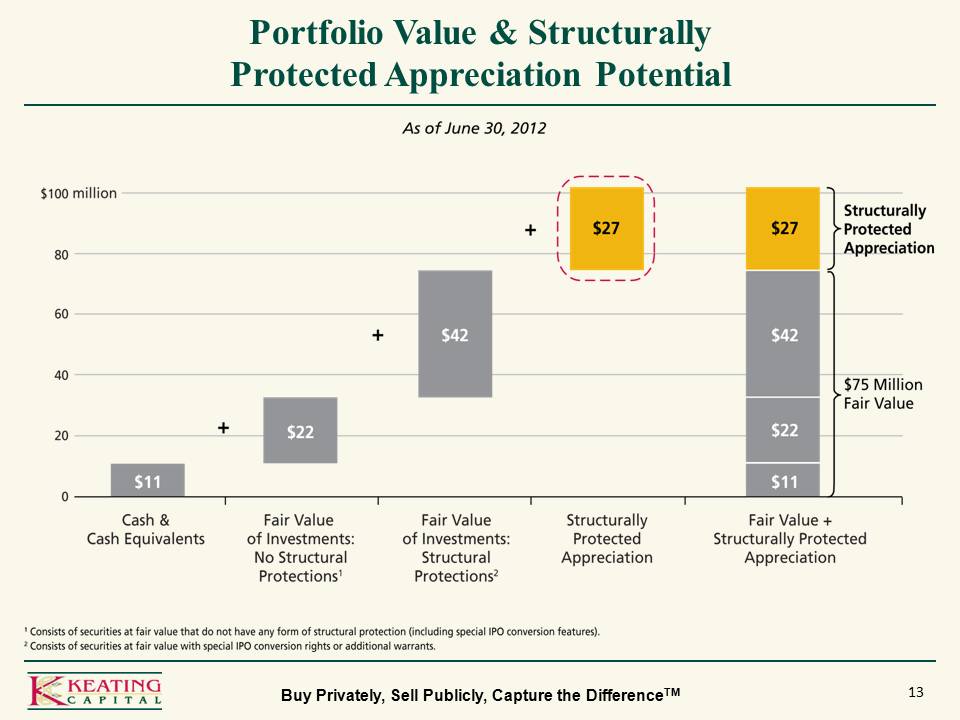
13 Portfolio Value & Structurally Protected Appreciation Potential Buy Privately, Sell Publicly, Capture the DifferenceTM As of June 30, 2012 $100 million 80 60 40 20 0$11 $22 $42 $27 Cash & Cash Equivalents Fair Value of Investments: No structural Protections1 Structurally Protected Appreciation Fair Value + Structurally Protected Appreciation $75 Million Fair Value Consists of securites at fair value that do not have any form of structural protection (including special IPO conversion features). Consists of securites at fair value with special IPO conversion rights or additional warrants.
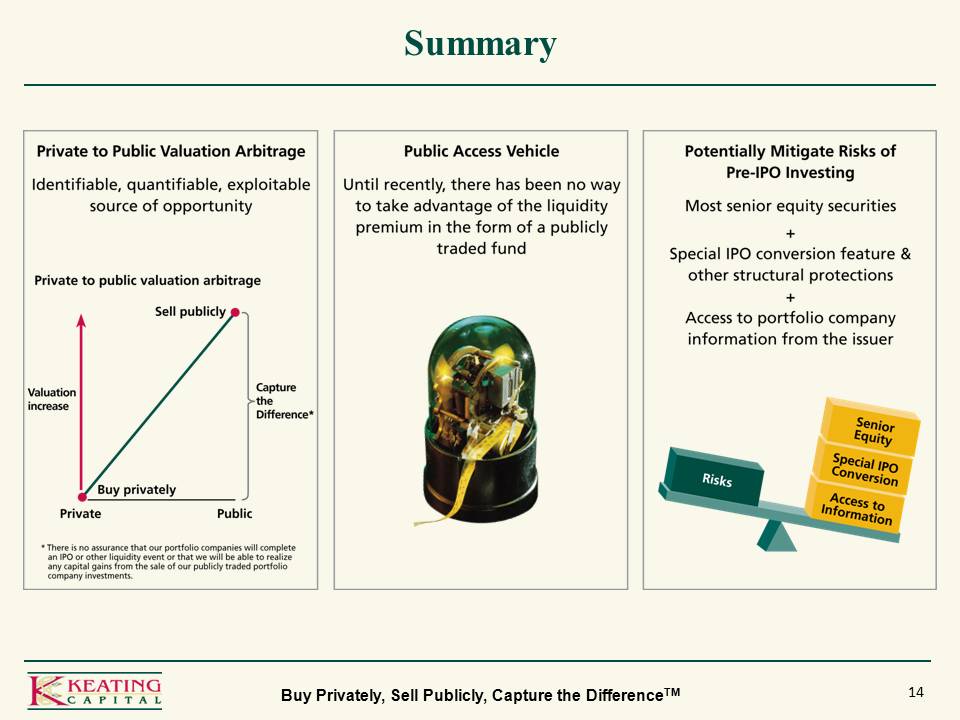
14 Summary Buy Privately, Sell Publicly, Capture the DifferenceTMPrivate to Public Valuation Arbitrage Identifiable, quatifiable, exploitable source of opportunity Sell publicly Capture the Difference Public Private Buy privately Valuation increase There is no assurance that our portfolio companies will complete an IPO or other liquidity event of that we will be able to realize any capital gains from the sale of our publicly traded portfolio company investments. Public Access Vehicle Until recently, there has been no way to take advantage of the liquidity premium in the form of a publicly traded fund Potentially Mitigate Risks of Pre-IPO Investing Most senior equity securities + Special IPO conversion feature & other structural protections + Access to portfolio company information from the issuer Senior Equity Special IPO Converion Access to Information Risks
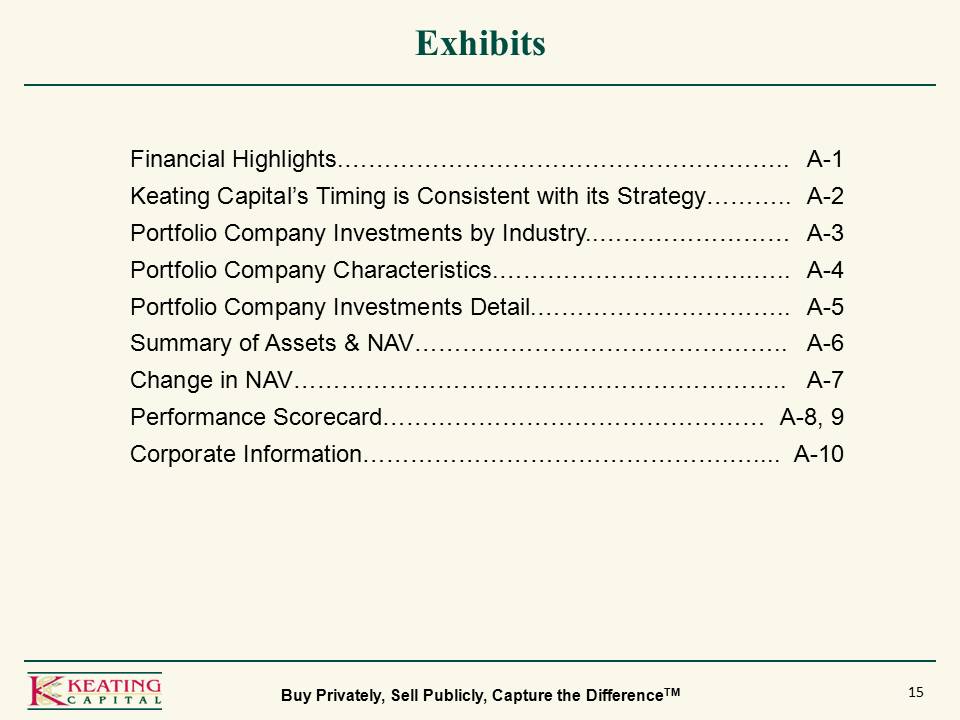
15 Exhibits Financial Highlights A-1 Keating Capital’s Timing is Consistent with its Strategy A-2 Portfolio Company Investments by Industry A-3 Portfolio Company Characteristics A-4 Portfolio Company Investments Detail A-5 Summary of Assets & NAV A-6 Change in NAVA-7 Performance Scorecard A-8, 9 Corporate Information A-10 Buy Privately, Sell Publicly, Capture the DifferenceTM
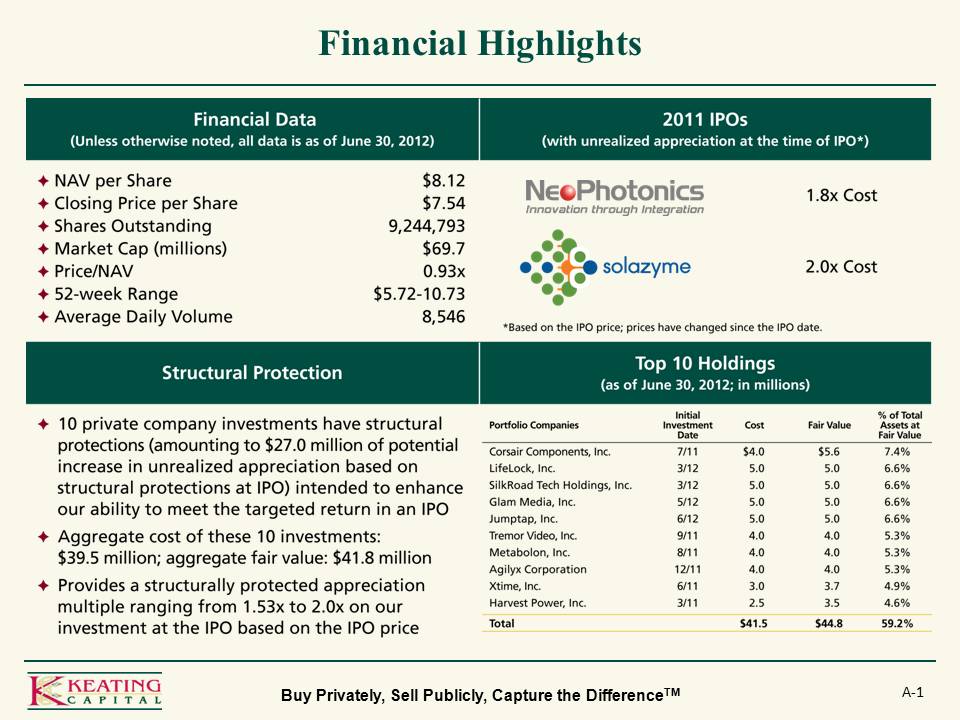
Financial Highlights Buy Privately, Sell Publicly, Capture the DifferenceTM A-1 Financial Date (Unless otherwise noted, all date is as of June 30, 2012) NAV per Share Closing Price per Share Shares Outstanding Market Cap (millions) Price/NAW 52-week Range Average Daily Volume $8.12 $7.54 9,244,793 $69.7 0.93x $5.72-10.73 8,546 NeoPhotonics Solazyme 1.8x Cost 2.0x Cost *Based on the IPO price; prices have changed since the IPO date. Structural Protection 10 private company investments have structural protections (amounting to $27.0 million of potential increase in unrealized appreciation based on structual protections at IPO) intended to enhance our ability to meet the targeted return in an IPO Aggregate cost of these 10 investments: $39.5 million; aggregrate fair value: $41.8 million Provides a structurally protected appreciation multiple ranging from 1.53x to 2.0x on our investment at the IPO based on the IPO price Top 10 Holdings (as of June 30, 2012; in millions) Agilyx Harvest Power BrightSource MBA Polymers Solazyme* Suniva 5% 3% 2% Technology Corsair Metabolon Stoke NeoPhotonics* Livescribe 7% 1% < Internet & Software Jumptap Glam Media LifeLock SilkRoad Tremor Video Xtime TrueCar Zoosk Kabam 4% $1.0 million $2.5 million $3.0 million $4.0 million $5.0 million $3.5 million $0.5 million $5.0 million $2.0 million $1.3 million Dollar amounts represent Keating Capital’s investment cost as of June 30, 2012 (excluding any follow-on investments in subsequent financing rounds or open market purchases). Initial Investment Date Cost Fair Value % of Total Assets at Fair Value 7-11 3-12 5-12 6-12 9-11 8-11 12-11 6-11 3-11 $41.5 $5.6 3.7 $44.8 7.4% 6.6% 5.3% 4.9% 4.6% 59.2%
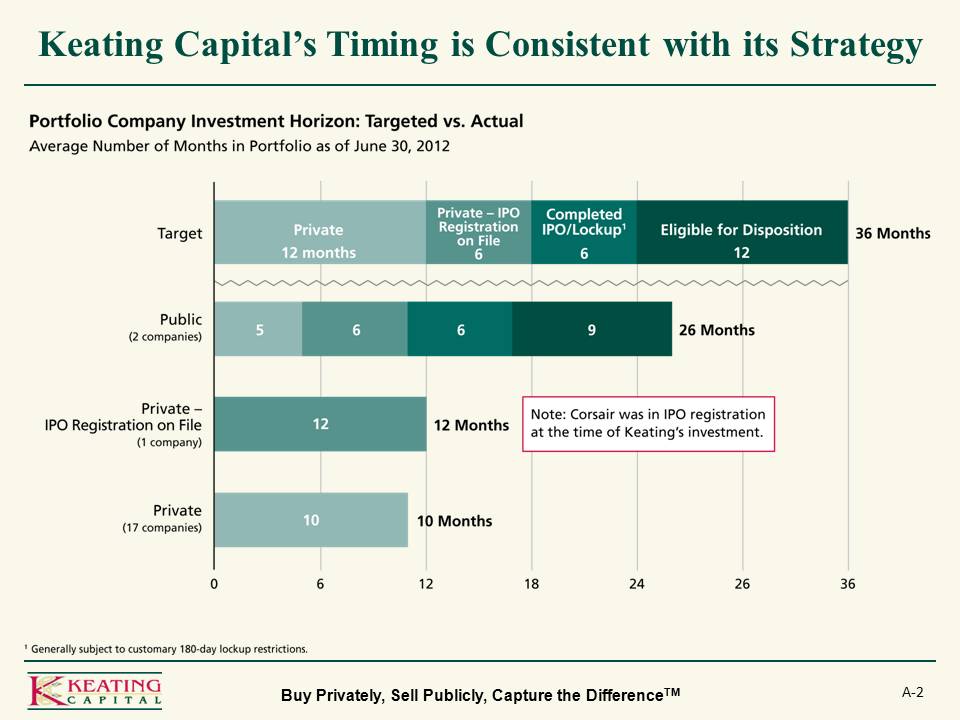
A‐2 Keating Capital’s Timing is Consistent with its Strategy Buy Privately, Sell Publicly, Capture the DifferenceTM Portfolio Company Investment Horizon: Target vs. Actual Average Number of Months in Portfolio as of June 30, 2012 Target Public (2 companies) Private – IPO Registration on File (1 company) Private (17 companies) 12 Months 10 Months 0 6 12 18 24 26 36 5 6 9 10 26 Months 36 Months Private Completed IPO/Lockup1 Eligible for Dispositions Generally subject to customary 180-day lockup restrictions.
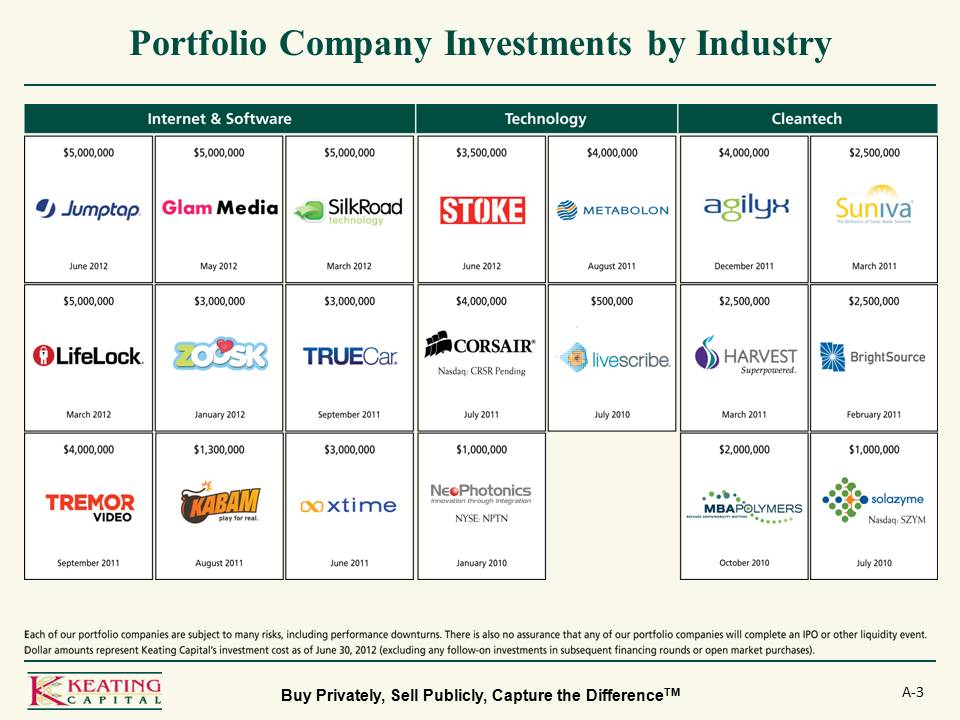
A‐3 Portfolio Company Investments by Industry Buy Privately, Sell Publicly, Capture the DifferenceTM Agilyx Harvest Power BrightSource MBA Polymers Solazyme* Suniva 5% 3% 2% Technology Corsair Metabolon Stoke NeoPhotonics* Livescribe 7% 1% < Internet & Software Jumptap Glam Media LifeLock SilkRoad Tremor Video Xtime TrueCar Zoosk Kabam 4% $1.0 million $2.5 million $3.0 million $4.0 million $5.0 million $3.5 million $0.5 million $5.0 million $2.0 million $1.3 million Dollar amounts represent Keating Capital’s investment cost as of June 30, 2012 (excluding any follow-on investments in subsequent financing rounds or open market purchases). Initial Investment Date Cost Fair Value % of Total Assets at Fair Value 7-11 3-12 5-12 6-12 9-11 8-11 12-11 6-11 3-11 $41.5 $5.6 3.7 $44.8 7.4% 6.6% 5.3% 4.9% 4.6% 59.2% $5,000,000 $3,500,000 $4,000,000 $2,500,000$3,000,000 $500,000$1,300,000 $1,000,000 $2,000,000 June May March August December March January Septermber July March February 2011 2010 2012 Each of our portfolio companies are subject o many risks, including performance downturns. There is also no assurance that any of our portfolio companies will complete an IPO or other liquidity event. Dollar amounts represent Keating Capital’s investment cost as of June 30,2012 (excluding any follow-on investments in subseuquent financing rounds or open market purchases). A-3
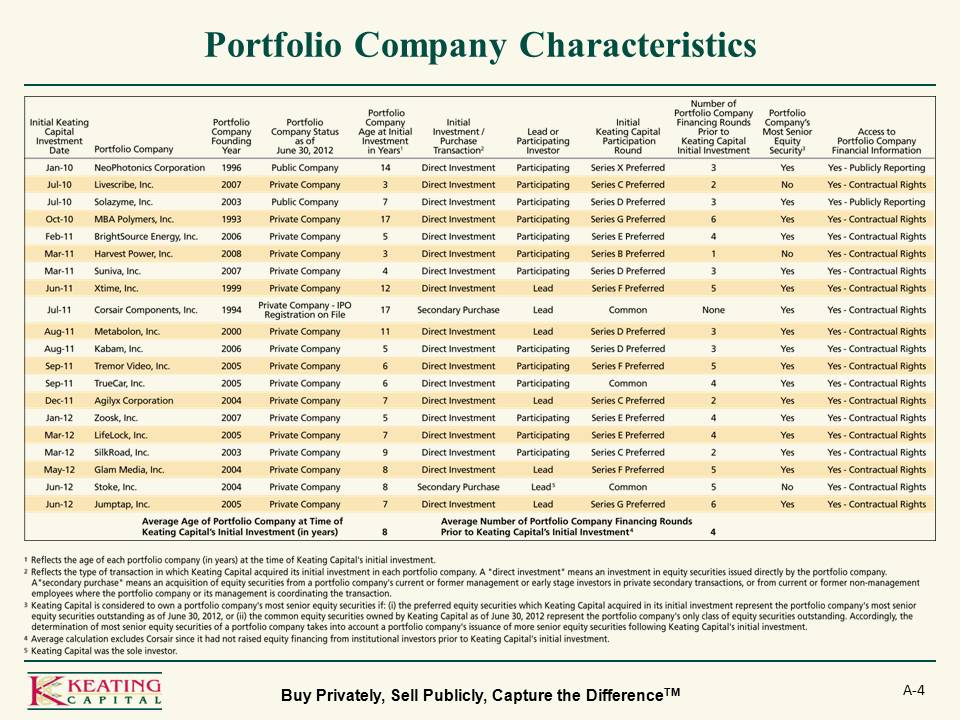
A‐4 Portfolio Company Characteristics Buy Privately, Sell Publicly, Capture the DifferenceTM Agilyx Harvest Power BrightSource MBA Polymers Solazyme* Suniva 5% 3% 2% Technology Corsair Metabolon Stoke NeoPhotonics* Livescribe 7% 1% < Internet & Software Jumptap Glam Media LifeLock SilkRoad Tremor Video Xtime TrueCar Zoosk Kabam Initial Keating Capital Investment Date Jan-10 Jul-10 Oct-10 Feb-11 Mar-11 Jun-11 Jul-11 Aug-11 Sep-11 Dec-11 Jan-12 Mar-12 May-12 Jun-12 Portfolio Company Founding Year Portfolio Company Status as of June 30, 2012 Age at Initial Investment in Years1 Initial Investment/Purchase Transaction2 Lead or Participating Investor Initial Keating Capital Participation Round Number of Portfolio Company Financing Rounds Prior to Keating Capital Initial Investments Most Senior Equity Security3 Access to Portfolio Company Financial Information Public Company Privat4e Company IPO Registration on File Average Age of Portfolio Company at Time of Keating Capital’s Initial Investment (in years) 14 3 7 17 5 3 4 12 11 5 6 9 8 Direct Investment Secondary Purchase Average Number of Portfolio Company Financing Rounds Prior to Keating Capital’s Initial Investment4 Yes No Yes – Publicly Reporting Yes – Contractual Rights Reflects the age of each portfolio company (in years) at the time of Keating Capital’s initial investment. Reflects the type of transaction in which Keating Capital acquired its initial investment in each portfolio company. A “direct investment” mans an investment in equity securities issued directly by the portfolio company. A “secondary purchase” means an acquisition of equity securities from a portfolio company’s current of former management or early stage investors in private secondary transactions, or from current of former non-management employees where the portfolio company or its management is coordinating the transaction. Keating Capital was the sole investor. Average calculation excludes Corsair since it had not raised equity financing from institutional investors prior to Keating Capital’s intial investment.
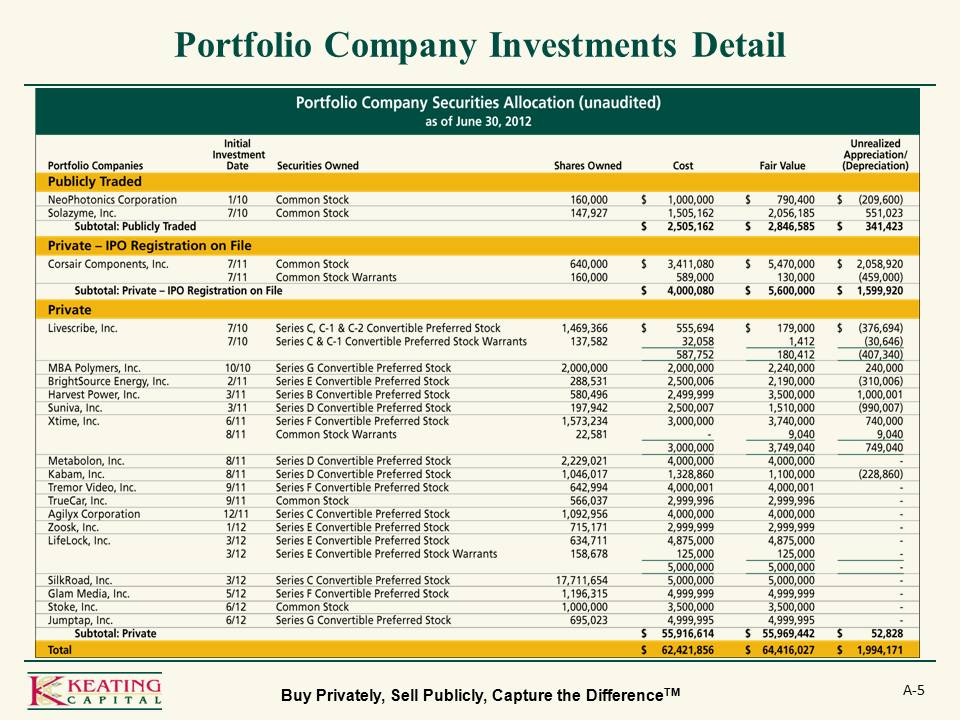
Agilyx Harvest Power BrightSource MBA Polymers Solazyme* Suniva 5% 3% 2% Technology Corsair Metabolon Stoke NeoPhotonics* Livescribe 7% 1% < Internet & Software Jumptap Glam Media LifeLock SilkRoad Tremor Video Xtime TrueCar Zoosk Kabam Common Stock Warrants Series C C-1 C-2 Convertible Preferred Stock Series G Series E Series B Series D Series F 160,000 147,927 640,000 1,469,366 137,582 2,000,000 ,288,531 580,496 197,942 1,573,234 22,581 2,229,021 1,046,017 642,994 566,038 1,092,956 715,171 634,711 158,678 17,711,654 1,196,315 1,000,000 695,023 1,505,162 2,505162 3,411,080 589,000 4,000080 555694 3058 587752 2000000 2500006 2499999 2500007 3000000 4000000 1328860 4000001 2999996 2999999 4875000 125000 3500000 4999995 55916614 62421856 790400 2056185 2846585 5470000 130000 5600000 179000 1412 180412 2240000 2190000 1510000 3500000 1510000 3740000 9040 3749040 1100000 4875000 125000 55969442 64415027 (209600) 551023 341423 2058920 459000 1599920 376694 30646 407340 240000 310006 1000001 990007 710000 9040 749 040 228860 – 52828 1994171Subtotal: {rovate Tpta; Publicly Traded Private – IPO Registration on FIle
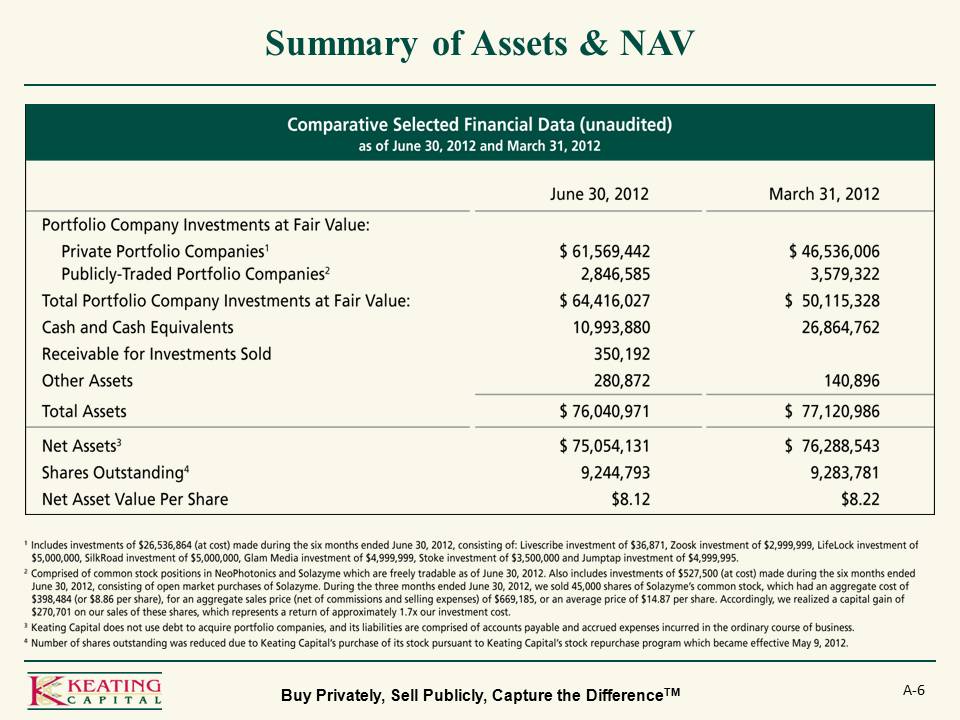
A‐6 Summary of Assets & NAV Buy Privately, Sell Publicly, Capture the DifferenceTM Comparative Selected Financial Data (unaudited) as of June 30, 2012 and March 31, 2012 Portfolio Company Investments at Fair Value: Private Portfolio Companies1 Publicly-Traded Portfolio Companies2 Total Portfolio Company Investments at Fair Value: Cash and Cash Equivalents Receivable for Investments Sold Other Assets Total Assets Net Assets3 Shares Outstanding4 Value Per Share $61,569,442 2,846,585 64,415,027 10,993,880,350,192,280,872,76,040,971,75,054,131,9,244,493 8.12 46,536,006 3,579,322 50,115,328 26,864,762 140,896 77,120,986 76,288,543 9,283,781 8.22 Includes investments of $26,536,864 (at cost) made during the six months ended June 30, 2012, consisting of: Livescribe investment of 36,871, Zoosk Investment of 2,999,999, LifeLock investment o 5,000,000 SilkRoad Glam Media 4,999,999 Stoke 3,500,000 and Jumptap Comprised of common stock positions in NeoPhotonics and Solazyme which are freely tradable as Also includes investments of 527,500 consisting of open market purchases during the three months ended we sold 45,000 shares which had an aggregrate cost of 398,484 (or $8.86 per share) for an aggregate sales price (net of commissions and selling expenses of 669,185 or an average price of 14.87 accordingly we realized a capital gain of 270,701 on our sales of these shares which represents a return of approximately 1.7x ourinvestment cost. Keating Capital does not use debt to acquire portfolio companies, and its liabilities are comprised of accounts paayable and accrued expenses incurred in the ordinary course of business. Number of shares outstanding was reduced due to Keating Capital’s purchase of its stock pursuant to Keating Capital’s stock repurcahse program which becase efective May 9, 2012.
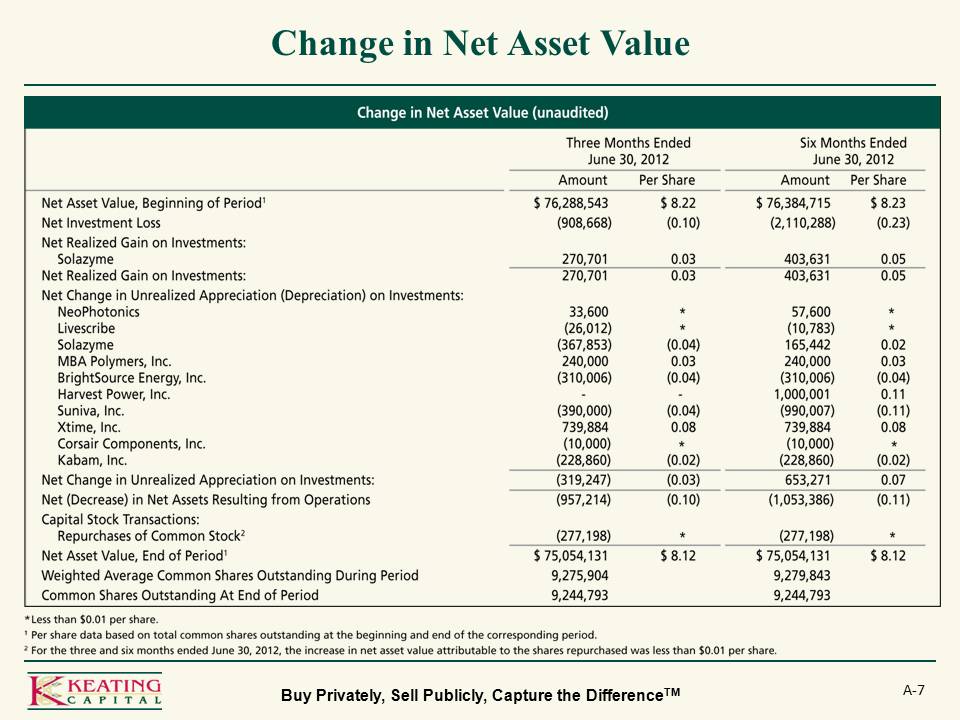
A‐7 Change in Net Asset Value Buy Privately, Sell Publicly, Capture the DifferenceTM Agilyx Harvest Power BrightSource MBA Polymers Solazyme* Suniva 5% 3% 2% Technology Corsair Metabolon Stoke NeoPhotonics* Livescribe 7% 1% < Internet & Software Jumptap Glam Media LifeLock SilkRoad Tremor Video Xtime TrueCar Zoosk Kabam 76288543 908668 270701 33600 2012 367853 240000 310006 390000 739884 10000 228860 319247 957214 277198 75054131 9275904 9244793 8.22 0.10 0.03 0.04 0.08 0.02 0.10 8.12 8.23 0.23 0.05 0.11 0.08 76384715 2110288 403631 57600 10783 165442 240000 310006 1000001 990007 739884 10000 228860 653 271 4053836 277198 75054131 9279843 9244793 Less than $0.01 per share. Per share date based on total common shres outstanding at the beginning and end of the corresponding period. For the three and six months ended June 30, 2012, theincrease in net asset value attributable to the shares repurchase was less thatn per share. Net Asset Value, Beginning of Period1 Net Investment Loss Net Realized Gain on Investments: Net Change in Unrealized Appreciation (Depreciation) on Investments Reuslting from Operations Capital Stock Transactions Repurchases of Common Stock End of Period Weighted Average Common Shares Outstanding During Period Common Shares Outstanding At End of Period
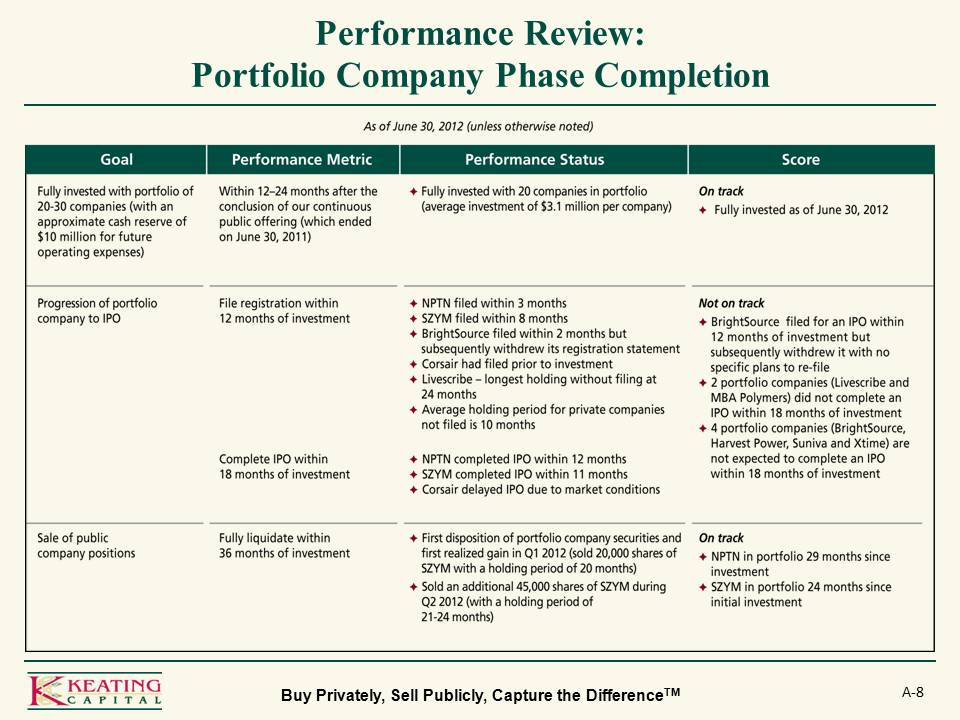
A‐8 Performance Review: Portfolio Company Phase Completion Buy Privately, Sell Publicly, Capture the DifferenceTM Goal Performance Metric Status Score On track Not on track Fully invested with portfolio of 20-30 companies with an approximate cash reserve of $10 million for future operating expenses Progression of portfolio company to IPO File registration within 12 months of investment Complete IPO within 18 months of investment Fully liquidate within 36 months of investment Sale of public company positions $3.1 milion per company BrightSource filed for an IPO within 12 months of investment but subsequently withdrew it with no specific plans to re-file 2 portfolio companies Livescribe and MBA Polymers did not complete and IPON within 18 months of investment 4 portfolio companies BrightSource, Harvest Power, Suniva and Xtime are not expected to complete an IPO within NPTN in portfolio 29 months since investment SZYM 24 months since initial investment NPTN completed IPO within 12 months SZYM completed IPO within 11 months Corsair delayed due to market conditions 3 months 8 months longest holding without filing at 24 months Average holding period for private companies not filed is 10 months First disposition of portfolio companuy securities and first realized gain in Q1 2012 sold 20,000 shares of with a holding period of 20 months Sold an additional 45,000 shares during Q2 2012 with a holding period of 21-24 months
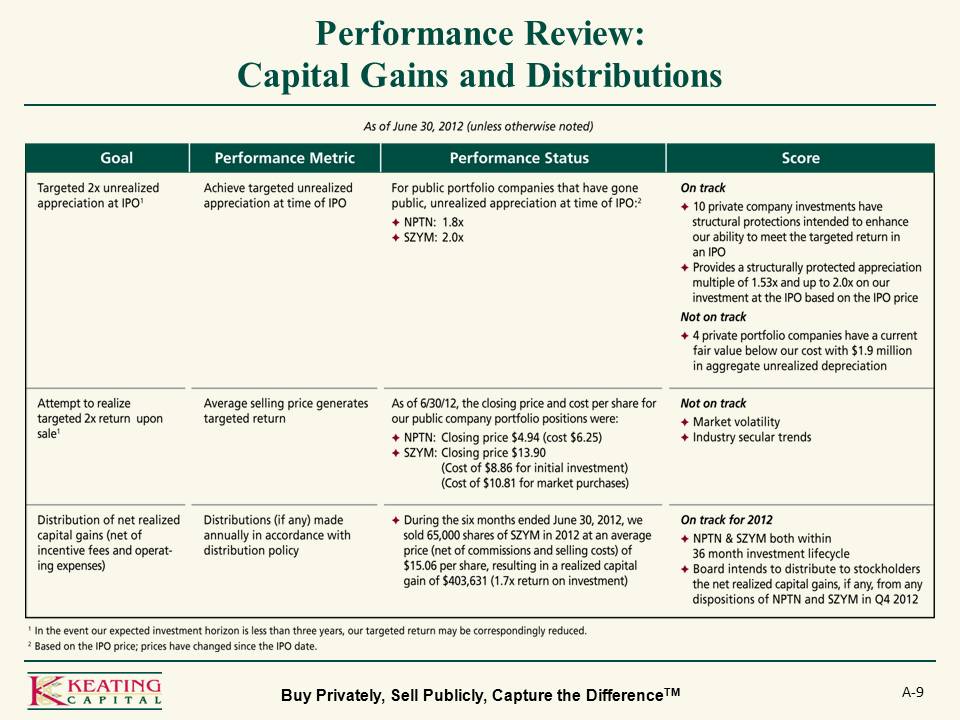
Performance Review: Capital Gains and Distributions Buy Privately, Sell Publicly, Capture the DifferenceTM A-9 Goal Performance Metric Performance Status Score Targeted 2x unrealized appreciation at IPO1 Achieve targeted at time of For public portfolio companies that have gone public, NPTN: 1.8x SZYM: 2.0x On track Not on track 10 private company investments have structural protections intended to enhance our ability to meet multiple of 1.53x and up to 2.0x on our 4 private portfolio companies have a current fair value below our cost with $1.9 million depreciation Market volatility Industry secular trends Attempt to realize targeted 2x return upon sale1 Average selling price generates Distribution of net realiozed capital gains (net of incentive fees and operating expenses) (if any) made annually in addordance with policy During the six months we sold 65,000 shares in 2012 (net commissions and selling costs) of $15.06 per share, resulting in a realized capital gain of $403,631 (1.7x return on investment) both within 36 month investment lifecycle Board intends to distribute to stockholders the net realized capital gains, if any, from any dispositiongs of in Q4 2012 Closing price $4.94 cost of $6.25 $13.90 $8.86 for initial investment cost of $10.81 for market purchases
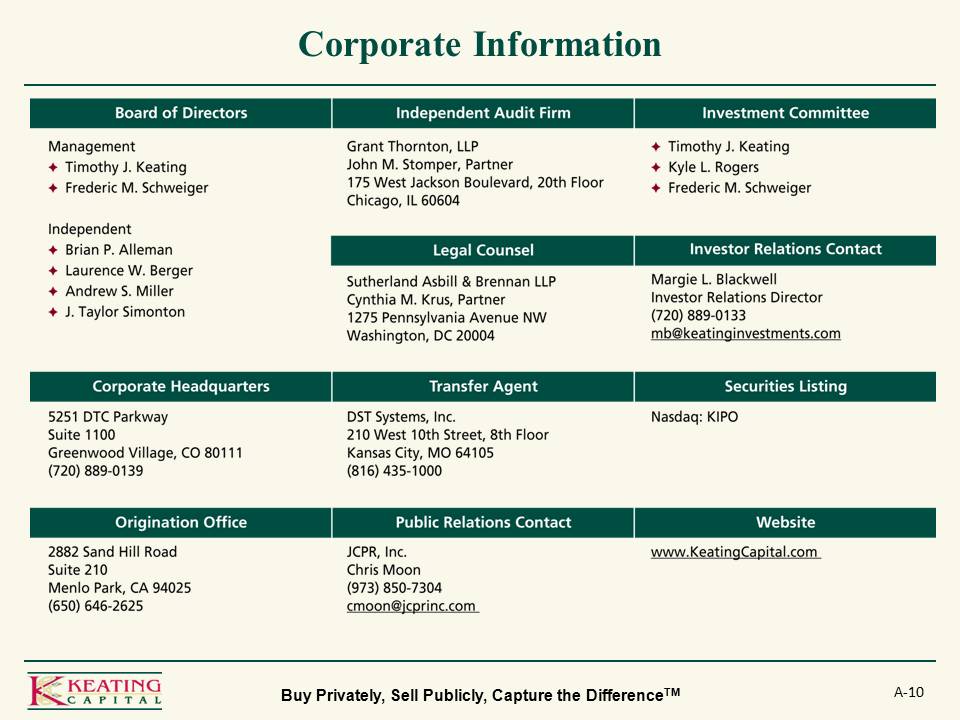
A-10 Corporate Information Buy Privately, Sell Publicly, Capture the DifferenceTM Board of Directors Independent Audit Firm Investment Committee Investor Relations Contact Legal Counsel Corporate Headquarters Transfer Agent Securities Listing Public Relations Website Origination Office www.KeatingCapital.com JCPR, Inc. Chris Moon (973) 850-7304 cmoon@jcprinc.com 2882 Sand Hill Road Suite 210 Menlo Park, CA 94025 (650) 646-2625 5251 DTC Parkway Suite 1100 Greenwood Viallage, CO 80111 (720) 889-01239 DST Systems, Inc. 210 West 10th Street, 8th Floor Kansas City, MO 64105 (816) 435-1000 Nasdaq: KIPO Sutherland Asbill & Brennan LLP Cynthia M. Krus, Partner 1275 Pennsylvania Avenue NW Washington, DC 20004 Margie L. Blackwell Investor Relations Director (720) 889-0133 mb@keatinginvestments.com Timothy J. Keating Kyle L. Rogers Frederic M. Schweiger Grant Thornton, LLP John M. Stomper, 175 West Jackson Boulevard, 20th Floor Chicago, IL 606045 Management Brian P. Alleman Laurence W. Berger Andrew S. Miller J. Taylor Simonton