Attached files
| file | filename |
|---|---|
| 8-K - FORM 8-K INVESTOR PRESENTATION 07.25.12 - TCF FINANCIAL CORP | 8-K_IP07252012.htm |
|
Exhibit 99.1 |
|
|
|
TCF
Financial Corporation |
|
1 |
|
|

|
|
|
Table of Contents |
|
2 |


|
|
|
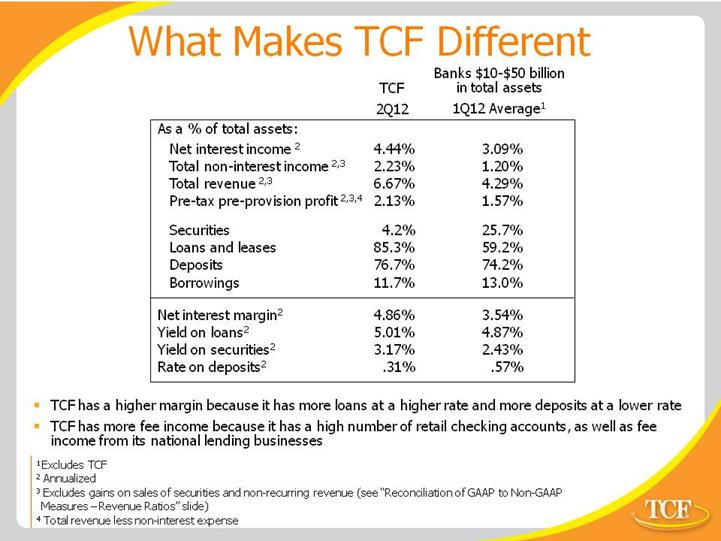
What Makes TCF Different |
|
5 |
|
|
|
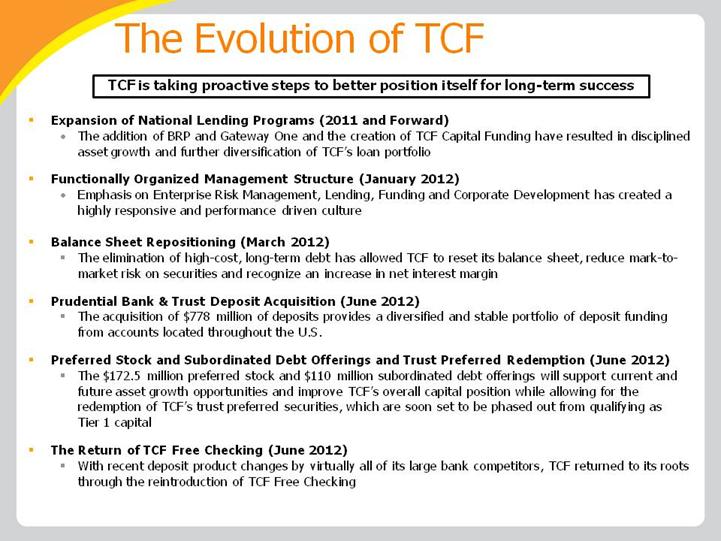
The Evolution of TCF |
|
6 |
|
|
|
|
|
Revenues & Expenses |
|
7 |

|
|
|
|
|
Diversified Core Revenue Base1 |
|
8 |

|
|
|
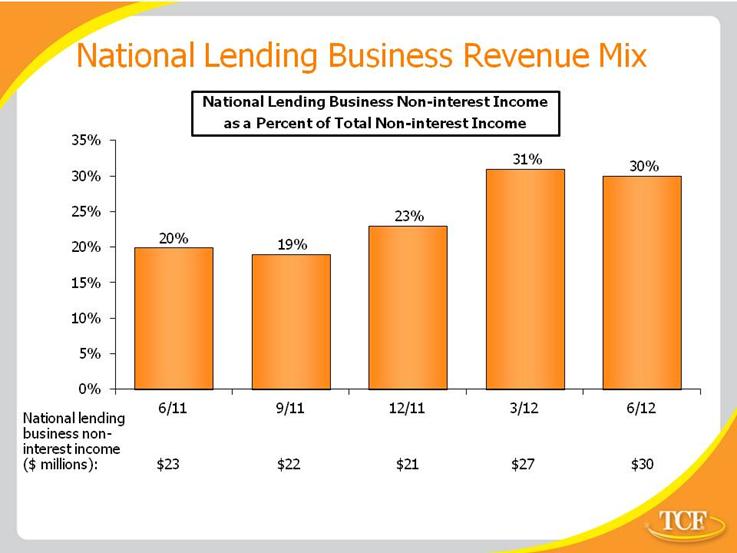
National Lending Business Revenue Mix |
|
9 |
|
|
|
|
|
Gains on sales of auto loans and other
revenue |
|
10 |

|
|
|
|
|
Core Operating Expenses 1 |
|
11 |

|
|
|
|
|
Credit Quality |
|
12 |

|
|
|
|
|
Credit Quality Summary |
|
13 |

|
|
|
|
|
Credit Quality Trends |
|
14 |

|
|
|
|
|
Credit Quality Trends (continued) |
|
15 |

|
|
|
|
|
Consumer Real Estate TDRs |
|
16 |

|
|
|
|
|
Consumer Real Estate TDR Process |
|
17 |

|
|
|
|
|
Capital |
|
18 |

|
|
|
Capital Ratios – Holding Company |
|
19 |

|
|
|
Balance Sheet Growth |
|
20 |
|
|
|
Strong Deposit Franchise |
|
21 |

|
|
|
Loan & Lease Balances |
|
22 |

|
|
|
Loan & Lease Geographic
Diversification |
|
23 |

|
|
|
Leasing & Equipment Finance |
|
24 |

|
|
|
TCF Inventory Finance |
|
25 |

|
|
|
Auto Finance |
|
26 |

|
|
|
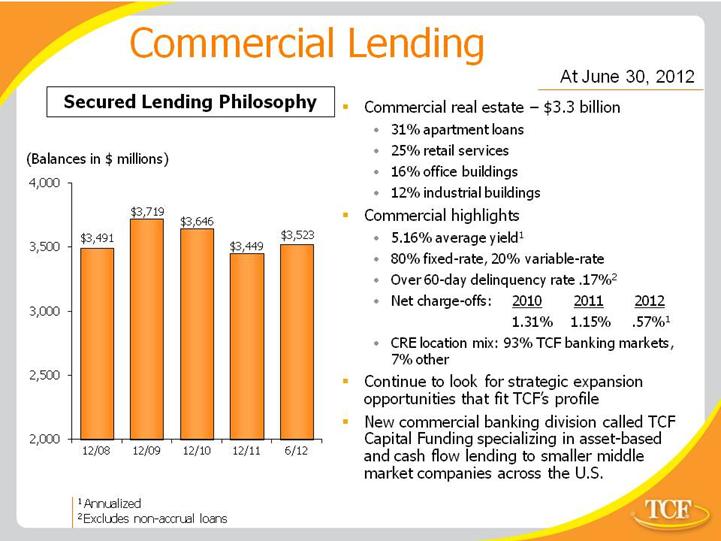
Commercial Lending |
|
27 |
|
|
|
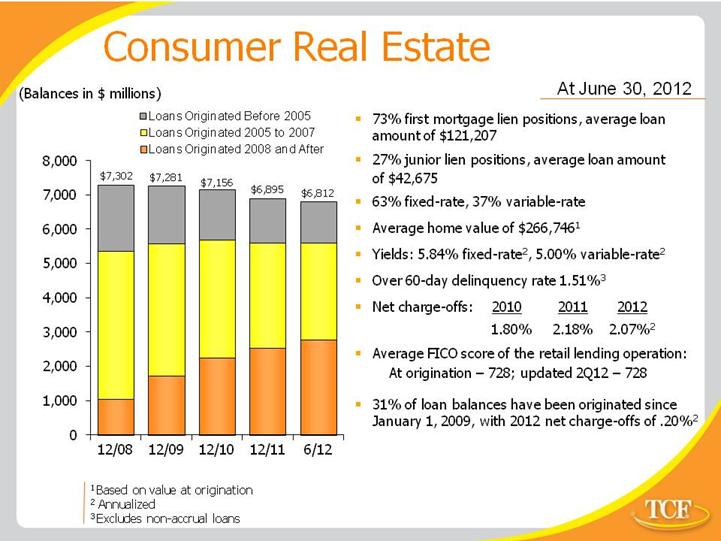
Consumer Real Estate |
|
28 |
|
|
|
Appendix |
|
29 |

|
|
|
Cautionary Statements for Purposes of the Safe
Harbor Provisions of the Securities Litigation Reform Act
|
|
30
|


|
|
|
Reconciliation of GAAP to Non-GAAP Measures
–Tangible Realized Common Equity1 |
|
32 |

|
|
|
Reconciliation of GAAP to Non-GAAP Measures
–Revenue Ratios |
|
33 |

|
|
|
Reconciliation of GAAP to Non-GAAP Measures
–Core Operating Expenses |
|
34 |

|
|
|
Reconciliation of GAAP to Non-GAAP Measures
–Total Tier 1 Common Capital Ratio1 |
|
35 |

|
|
|
Source References & Footnotes |
|
36 |
