UNITED STATES
SECURITIES AND EXCHANGE COMMISSION
Washington, D.C. 20549
Form 10-K/A
Amendment No. 1
ANNUAL REPORT PURSUANT TO SECTION 13 OR 15(d)
OF THE SECURITIES
EXCHANGE ACT OF 1934
For the fiscal year ended December 31, 2011
Commission file number 1-10351
Potash
Corporation of Saskatchewan Inc.
(Exact name of the registrant as specified in its charter)
|
|
|
| Canada |
|
N/A |
| (State or other jurisdiction of
incorporation or organization) |
|
(I.R.S. employer identification no.) |
Suite 500, 122 – 1st Avenue South
Saskatoon, Saskatchewan, Canada S7K 7G3
306-933-8500
(Address and telephone number of the registrant’s principal executive offices)
Securities registered pursuant to Section 12(b) of the Act:
|
|
|
| Title of each class |
|
Name of exchange on which registered |
| Common Shares, No Par Value |
|
New York Stock Exchange |
The Common Shares are also listed on the Toronto Stock Exchange in Canada
Securities registered pursuant to Section 12(g) of the Act: None
Indicate by check mark if the registrant is a well-known seasoned issuer, as defined in Rule 405 of the Securities Act. Yes x No ¨
Indicate by
check mark if the registrant is not required to file reports pursuant to Section 13 or Section 15(d) of the Act. Yes ¨ No x
Indicate by check mark whether the registrant (1) has filed all reports required to be filed
by Section 13 or 15(d) of the Securities Exchange Act of 1934 during the preceding 12 months (or for such shorter period that the registrant was required to file such reports), and (2) has been subject to such filing
requirements for the past 90 days. Yes x No ¨
Indicate by check mark whether the registrant has submitted electronically and posted on its corporate Web site, if any, every Interactive Data File
required to be submitted and posted pursuant to Rule 405 of Regulation S-T during the preceding 12 months (or such shorter period that the registrant was required to submit and post such files). Yes ¨ No ¨
Indicate by
check mark if disclosure of delinquent filers pursuant to Item 405 of Regulation S-K is not contained herein, and will not be contained, to the best of the registrant’s knowledge, in definitive proxy or information statements
incorporated by reference in Part III of this Form 10-K or any amendment to this Form 10-K. x
Indicate by check mark whether the registrant is a large accelerated filer, an accelerated filer, a non-accelerated filer, or a smaller reporting company. See the definitions of “large accelerated
filer,” “accelerated filer” and “smaller reporting company” in Rule 12b-2 of the Exchange Act. (Check one):
|
|
|
|
|
|
|
| Large accelerated filer |
|
x |
|
Accelerated filer |
|
¨ |
|
|
|
|
| Non-accelerated filer |
|
¨ |
|
Smaller reporting company |
|
¨ |
Indicate by check mark whether the registrant is a shell company (as defined in Rule 12b-2 of the
Act). Yes ¨ No x
At June 30, 2011, the aggregate market value of the 851,961,075 Common Shares held by non-affiliates of the registrant was approximately $48,553,261,671.44. At February 21, 2012, the registrant
had 858,745,947 Common Shares outstanding.
EXPLANATORY NOTE
Potash Corporation of Saskatchewan Inc. (the “Corporation”) is filing this Amendment No. 1 on Form 10-K/A (this “Amendment”) to amend the Corporation’s Annual Form 10-K for
the year ended December 31, 2011, as filed with the Securities and Exchange Commission on February 27, 2012 (the “Form 10-K”). This Amendment is being filed solely to revise the report of the Company’s independent registered
chartered accountants contained in Item 8 of the Form 10-K, which inadvertently omitted the reference to the International Accounting Standards Board as the issuer of the International Financial Reporting Standards. No other changes have been
made to the Form 10-K. This Amendment speaks as of the original filing date of the Form 10-K, does not reflect events that may have occurred subsequent to the original filing date, and does not modify or update in any way the other disclosures made
in the Form 10-K.
Part II
Item 8. Financial Statements and Supplementary Data
Management’s Responsibility
Management’s Report on Financial Statements
The
accompanying consolidated financial statements and related financial information are the responsibility of PotashCorp management. They have been prepared in accordance with International Financial Reporting Standards as issued by the International
Accounting Standards Board and include amounts based on estimates and judgments. Financial information included elsewhere in this report is consistent with the consolidated financial statements.
Our independent registered chartered accountants, Deloitte & Touche LLP, provide an audit of the consolidated financial statements, as reflected in
their report for 2011.
The consolidated financial statements are approved by the Board of Directors on the recommendation of the audit
committee.
The audit committee of the Board of Directors is composed entirely of independent directors. PotashCorp’s interim condensed
consolidated financial statements and Management’s Discussion and Analysis (“MD&A”) are discussed and analyzed by the audit committee with management and the independent registered chartered accountants before such information is
approved by the committee and submitted to securities commissions or other regulatory authorities. The annual consolidated financial statements and MD&A are also analyzed by the audit committee together with management and the independent
registered chartered accountants and are approved by the Board of Directors.
In addition, the audit committee has the duty to review critical
accounting policies and significant estimates and judgments underlying the consolidated financial statements as presented by management, and to approve the fees of the independent registered chartered accountants.
Deloitte & Touche LLP, the independent registered chartered accountants, have full and independent access to the audit committee to discuss their
audit and related matters.
Management’s report on internal control over financial reporting
Management is responsible for establishing and maintaining an adequate system of internal control over financial reporting. During the past year, we have
directed efforts to improve our internal control over financial reporting. Internal control over financial reporting is a process designed to provide reasonable assurance regarding the reliability of financial reporting and the preparation of
consolidated financial statements for external reporting purposes in accordance with International Financial Reporting Standards as issued by the International Accounting Standards Board. Because of its inherent limitations, internal control over
financial reporting may not prevent or detect misstatements. Management has assessed the effectiveness of the company’s internal control over financial reporting based on the framework in Internal Control – Integrated Framework issued by
the Committee of Sponsoring Organizations of the Treadway Commission (COSO) and concluded that the company’s internal control over financial reporting was effective as of December 31, 2011. The effectiveness of the company’s internal
control over financial reporting as of December 31, 2011 has been audited by Deloitte & Touche LLP , as reflected in their report for 2011.
|
|
|
|

W. Doyle
President and Chief Executive Officer
February 21, 2012 |
|

W. Brownlee Executive Vice President and Chief Financial Officer |
II-1
Report of Independent Registered Chartered Accountants
To the Board of Directors and Shareholders of Potash Corporation of
Saskatchewan Inc.
We have audited the internal control over financial reporting of Potash Corporation of Saskatchewan Inc. and subsidiaries
(the “Company”) as of December 31, 2011, based on the criteria established in Internal Control — Integrated Framework issued by the Committee of Sponsoring Organizations of the Treadway Commission. The Company’s
management is responsible for maintaining effective internal control over financial reporting and for its assessment of the effectiveness of internal control over financial reporting, included in the accompanying Management’s Report on Internal
Control Over Financial Reporting. Our responsibility is to express an opinion on the Company’s internal control over financial reporting based on our audit.
We conducted our audit in accordance with the standards of the Public Company Accounting Oversight Board (United States). Those standards require that we plan and perform the audit to obtain reasonable
assurance about whether effective internal control over financial reporting was maintained in all material respects. Our audit included obtaining an understanding of internal control over financial reporting, assessing the risk that a material
weakness exists, testing and evaluating the design and operating effectiveness of internal control based on the assessed risk, and performing such other procedures as we considered necessary in the circumstances. We believe that our audit provides a
reasonable basis for our opinion.
A company’s internal control over financial reporting is a process designed by, or under the supervision
of, the company’s principal executive and principal financial officers, or persons performing similar functions, and effected by the company’s board of directors, management, and other personnel to provide reasonable assurance regarding
the reliability of financial reporting and the preparation of financial statements for external purposes in accordance with generally accepted accounting principles. A company’s internal control over financial reporting includes those policies
and procedures that (1) pertain to the maintenance of records that, in reasonable detail, accurately and fairly reflect the transactions and dispositions of the assets of the company; (2) provide reasonable assurance that transactions are recorded
as necessary to permit preparation of financial statements in accordance with generally accepted accounting principles, and that receipts and expenditures of the company are being made only in accordance with authorizations of management and
directors of the company; and (3) provide reasonable assurance regarding prevention or timely detection of unauthorized acquisition, use, or disposition of the company’s assets that could have a material effect on the financial statements.
Because of the inherent limitations of internal control over financial reporting, including the possibility of collusion or improper management
override of controls, material misstatements due to error or fraud may not be prevented or detected on a timely basis. Also, projections of any evaluation of the effectiveness of the internal control over financial reporting to future periods are
subject to the risk that the controls may become inadequate because of changes in conditions, or that the degree of compliance with the policies or procedures may deteriorate.
In our opinion, the Company maintained, in all material respects, effective internal control over financial reporting as of December 31, 2011, based on the criteria established in Internal Control
— Integrated Framework issued by the Committee of Sponsoring Organizations of the Treadway Commission.
We have also audited, in
accordance with the standards of the Public Company Accounting Oversight Board (United States), the consolidated financial statements as of and for the year ended December 31, 2011 of the Company and our report dated February 21, 2012 expressed an
unqualified opinion on those consolidated financial statements.

Independent Registered Chartered Accountants
Saskatoon, Canada
February 21, 2012
II-2
Report of Independent Registered Chartered Accountants
To The Board of Directors and Shareholders of Potash Corporation of Saskatchewan Inc.
We have audited the accompanying consolidated statements of financial position of Potash Corporation of Saskatchewan Inc. and subsidiaries (the
“Company”) as of December 31, 2011, December 31, 2010 and January 1, 2010, and the related consolidated statements of income, comprehensive income, changes in equity, and cash flow for each of the two years in the period ended December 31,
2011. These financial statements are the responsibility of the Company’s management. Our responsibility is to express an opinion on these financial statements based on our audits.
We conducted our audits in accordance with the standards of the Public Company Accounting Oversight Board (United States). Those standards require that we plan and perform the audit to obtain reasonable
assurance about whether the financial statements are free of material misstatement. An audit includes examining, on a test basis, evidence supporting the amounts and disclosures in the financial statements. An audit also includes assessing the
accounting principles used and significant estimates made by management, as well as evaluating the overall financial statement presentation. We believe that our audits provide a reasonable basis for our opinion.
In our opinion, such consolidated financial statements present fairly, in all material respects, the financial position of Potash Corporation of Saskatchewan
Inc. and subsidiaries as of December 31, 2011, December 31, 2010 and January 1, 2010, and the results of their operations and their cash flows for each of the two years in the period ended December 31, 2011, in conformity with International
Financial Reporting Standards, as issued by the International Accounting Standards Board.
We have also audited, in accordance with the
standards of the Public Company Accounting Oversight Board (United States), the Company’s internal control over financial reporting as of December 31, 2011, based on the criteria established in Internal Control — Integrated
Framework issued by the Committee of Sponsoring Organizations of the Treadway Commission and our report dated February 21, 2012 expressed an unqualified opinion on the Company’s internal control over financial reporting.

Independent Registered Chartered Accountants
Saskatoon, Canada
February 21, 2012
II-3
Consolidated Financial Statements
Consolidated Statements of Financial Position
|
|
|
|
|
|
|
|
|
|
|
|
|
|
|
| As at |
|
|
|
In millions of US dollars |
|
| Notes |
|
|
|
December 31,
2011 |
|
|
December 31,
2010 |
|
|
January 1,
2010 |
|
|
|
Assets |
|
|
|
|
|
|
|
|
|
|
|
|
|
|
Current assets |
|
|
|
|
|
|
|
|
|
|
|
|
|
|
Cash and cash equivalents |
|
$ |
430 |
|
|
$ |
412 |
|
|
$ |
385 |
|
| Note 3 |
|
Receivables |
|
|
1,195 |
|
|
|
1,059 |
|
|
|
1,214 |
|
| Note 4 |
|
Inventories |
|
|
731 |
|
|
|
570 |
|
|
|
624 |
|
| |
|
Prepaid expenses and other current assets |
|
|
52 |
|
|
|
54 |
|
|
|
69 |
|
|
|
|
|
|
2,408 |
|
|
|
2,095 |
|
|
|
2,292 |
|
|
|
Non-current assets |
|
|
|
|
|
|
|
|
|
|
|
|
| Note 5 |
|
Property, plant and equipment |
|
|
9,922 |
|
|
|
8,141 |
|
|
|
6,444 |
|
| Note 6 |
|
Investments in equity-accounted investees |
|
|
1,187 |
|
|
|
1,051 |
|
|
|
955 |
|
| Note 6 |
|
Available-for-sale investments |
|
|
2,265 |
|
|
|
3,842 |
|
|
|
2,760 |
|
| Note 7 |
|
Other assets |
|
|
360 |
|
|
|
303 |
|
|
|
274 |
|
| Note 8 |
|
Intangible assets |
|
|
115 |
|
|
|
115 |
|
|
|
117 |
|
| |
|
Total Assets |
|
$ |
16,257 |
|
|
$ |
15,547 |
|
|
$ |
12,842 |
|
|
|
Liabilities |
|
|
|
|
|
|
|
|
|
|
|
|
|
|
Current liabilities |
|
|
|
|
|
|
|
|
|
|
|
|
| Note 9, 12 |
|
Short-term debt and current portion of long-term debt |
|
$ |
832 |
|
|
$ |
1,871 |
|
|
$ |
729 |
|
| Note 10 |
|
Payables and accrued charges |
|
|
1,295 |
|
|
|
1,198 |
|
|
|
817 |
|
| Note 11 |
|
Current portion of derivative instrument liabilities |
|
|
67 |
|
|
|
75 |
|
|
|
52 |
|
|
|
|
|
|
2,194 |
|
|
|
3,144 |
|
|
|
1,598 |
|
|
|
Non-current liabilities |
|
|
|
|
|
|
|
|
|
|
|
|
| Note 12 |
|
Long-term debt |
|
|
3,705 |
|
|
|
3,707 |
|
|
|
3,319 |
|
| Note 11 |
|
Derivative instrument liabilities |
|
|
204 |
|
|
|
204 |
|
|
|
123 |
|
| Note 21 |
|
Deferred income tax liabilities |
|
|
1,052 |
|
|
|
737 |
|
|
|
643 |
|
| Note 13 |
|
Pension and other post-retirement benefit liabilities |
|
|
552 |
|
|
|
468 |
|
|
|
455 |
|
| Note 14 |
|
Asset retirement obligations and accrued environmental costs |
|
|
615 |
|
|
|
455 |
|
|
|
300 |
|
| |
|
Other non-current liabilities and deferred credits |
|
|
88 |
|
|
|
147 |
|
|
|
99 |
|
| |
|
Total Liabilities |
|
|
8,410 |
|
|
|
8,862 |
|
|
|
6,537 |
|
|
|
Shareholders’ Equity |
|
|
|
|
|
|
|
|
|
|
|
|
| Note 15 |
|
Share capital |
|
|
1,483 |
|
|
|
1,431 |
|
|
|
1,430 |
|
|
|
Contributed surplus |
|
|
291 |
|
|
|
308 |
|
|
|
273 |
|
|
|
Accumulated other comprehensive income |
|
|
816 |
|
|
|
2,394 |
|
|
|
1,798 |
|
| |
|
Retained earnings |
|
|
5,257 |
|
|
|
2,552 |
|
|
|
2,804 |
|
| |
|
Total Shareholders’ Equity |
|
|
7,847 |
|
|
|
6,685 |
|
|
|
6,305 |
|
| |
|
Total Liabilities and Shareholders’ Equity |
|
$ |
16,257 |
|
|
$ |
15,547 |
|
|
$ |
12,842 |
|
| Note 26 |
|
Commitments |
|
|
|
|
|
|
|
|
|
|
|
|
| Note 27 |
|
Contingencies and Other Matters |
|
|
|
|
|
|
|
|
|
|
|
|
| Note 28 |
|
Guarantees |
|
|
|
|
|
|
|
|
|
|
|
|
(See Notes to the Consolidated Financial Statements)
Approved by the Board of Directors,
|
|
|
|

|
|

|
| Director |
|
Director |
II-4
Consolidated Statements of Income
|
|
|
|
|
|
|
|
|
|
|
|
|
| For the years ended December 31 |
|
In millions of US dollars except per-share amounts |
|
| Notes |
|
|
|
|
|
2011 |
|
|
2010 |
|
| Note 16 |
|
Sales |
|
|
|
$ |
8,715 |
|
|
$ |
6,539 |
|
|
|
Freight, transportation and distribution |
|
|
|
|
(496 |
) |
|
|
(488 |
) |
| Note 17 |
|
Cost of goods sold |
|
|
|
|
(3,933 |
) |
|
|
(3,361 |
) |
| |
|
Gross Margin |
|
|
|
|
4,286 |
|
|
|
2,690 |
|
|
|
|
|
|
| Note 17 |
|
Selling and administrative expenses |
|
|
|
|
(217 |
) |
|
|
(228 |
) |
| Note 18 |
|
Provincial mining and other taxes |
|
|
|
|
(147 |
) |
|
|
(77 |
) |
|
|
Share of earnings of equity-accounted investees |
|
|
|
|
261 |
|
|
|
174 |
|
|
|
Dividend income |
|
|
|
|
136 |
|
|
|
163 |
|
| Note 19 |
|
Other expenses |
|
|
|
|
(13 |
) |
|
|
(125 |
) |
|
|
|
|
|
|
|
Operating Income |
|
|
|
|
4,306 |
|
|
|
2,597 |
|
|
|
|
|
|
| Note 20 |
|
Finance Costs |
|
|
|
|
(159 |
) |
|
|
(121 |
) |
|
|
|
|
|
|
|
Income Before Income Taxes |
|
|
|
|
4,147 |
|
|
|
2,476 |
|
|
|
|
|
|
| Note 21 |
|
Income Taxes |
|
|
|
|
(1,066 |
) |
|
|
(701 |
) |
|
|
|
|
|
| |
|
Net Income |
|
|
|
$ |
3,081 |
|
|
$ |
1,775 |
|
|
|
|
|
|
| Note 22 |
|
Net Income per Share – Basic |
|
|
|
$ |
3.60 |
|
|
$ |
2.00 |
|
|
|
|
|
|
| Note 22 |
|
Net Income per Share – Diluted |
|
|
|
$ |
3.51 |
|
|
$ |
1.95 |
|
|
|
|
|
|
| |
|
Dividends Declared per Share |
|
|
|
$ |
0.28 |
|
|
$ |
0.13 |
|
(See Notes to the Consolidated Financial Statements)
II-5
Consolidated Statements of Comprehensive Income
|
|
|
|
|
|
|
|
|
| For the years ended December 31 |
|
In millions of US dollars |
|
| (Net of related income taxes) |
|
2011 |
|
|
2010 |
|
| Net Income |
|
$ |
3,081 |
|
|
$ |
1,775 |
|
| Other comprehensive (loss) income |
|
|
|
|
|
|
|
|
| Net (decrease) increase in net unrealized gains on available-for-sale investments 1 |
|
|
(1,581 |
) |
|
|
663 |
|
| Net actuarial losses on defined benefit plans 2 |
|
|
(136 |
) |
|
|
(25 |
) |
| Net losses on derivatives designated as cash flow hedges 3 |
|
|
(38 |
) |
|
|
(119 |
) |
| Reclassification to income of net losses on cash flow hedges 4 |
|
|
47 |
|
|
|
53 |
|
| Other |
|
|
(6 |
) |
|
|
(1 |
) |
| Other Comprehensive (Loss) Income |
|
$ |
(1,714 |
) |
|
$ |
571 |
|
| Comprehensive Income |
|
$ |
1,367 |
|
|
$ |
2,346 |
|
| 1 |
Available-for-sale investments are comprised of shares in Israel Chemicals Ltd. and Sinofert Holdings Limited. |
| 2 |
Net of income taxes of $75 (2010 – $11). |
| 3 |
Cash flow hedges are comprised of natural gas derivative instruments and are net of income taxes of $24 (2010 – $72). |
| 4 |
Net of income taxes of $(29) (2010 – $(32)). |
(See Notes to the Consolidated Financial Statements)
II-6
Consolidated Statements of Cash Flow
|
|
|
|
|
|
|
|
|
|
|
|
|
|
|
|
|
| For the years ended December 31 |
|
In millions of US dollars |
|
| |
|
|
|
|
2011 |
|
|
|
|
|
2010 |
|
| Operating Activities |
|
|
|
|
|
|
|
|
|
|
|
|
|
|
|
|
| Net income |
|
|
|
|
|
$ |
3,081 |
|
|
|
|
|
|
$ |
1,775 |
|
| Adjustments to reconcile net income to cash provided by operating activities |
|
|
|
|
|
|
|
|
|
|
|
|
|
|
|
|
| Depreciation and amortization |
|
|
489 |
|
|
|
|
|
|
|
449 |
|
|
|
|
|
| Share-based compensation |
|
|
24 |
|
|
|
|
|
|
|
24 |
|
|
|
|
|
| Realized excess tax benefit related to share-based compensation |
|
|
29 |
|
|
|
|
|
|
|
45 |
|
|
|
|
|
| Provision for deferred income tax |
|
|
337 |
|
|
|
|
|
|
|
177 |
|
|
|
|
|
| Undistributed earnings of equity-accounted investees |
|
|
(133 |
) |
|
|
|
|
|
|
(96 |
) |
|
|
|
|
| Pension and other post-retirement benefits |
|
|
(122 |
) |
|
|
|
|
|
|
(24 |
) |
|
|
|
|
| Asset retirement obligations and accrued environmental costs |
|
|
39 |
|
|
|
|
|
|
|
77 |
|
|
|
|
|
| Other long-term liabilities and miscellaneous |
|
|
(40 |
) |
|
|
|
|
|
|
82 |
|
|
|
|
|
|
|
|
|
|
|
|
|
|
|
|
|
|
|
|
|
|
| Subtotal of adjustments |
|
|
|
|
|
|
623 |
|
|
|
|
|
|
|
734 |
|
| Changes in non-cash operating working capital |
|
|
|
|
|
|
|
|
|
|
|
|
|
|
|
|
| Receivables |
|
|
(155 |
) |
|
|
|
|
|
|
256 |
|
|
|
|
|
| Inventories |
|
|
(146 |
) |
|
|
|
|
|
|
66 |
|
|
|
|
|
| Prepaid expenses and other current assets |
|
|
(1 |
) |
|
|
|
|
|
|
(6 |
) |
|
|
|
|
| Payables and accrued charges |
|
|
83 |
|
|
|
|
|
|
|
306 |
|
|
|
|
|
|
|
|
|
|
|
|
|
|
|
|
|
|
|
|
|
|
| Subtotal of changes in non-cash operating working capital |
|
|
|
|
|
|
(219 |
) |
|
|
|
|
|
|
622 |
|
| Cash provided by operating activities |
|
|
|
|
|
|
3,485 |
|
|
|
|
|
|
|
3,131 |
|
| Investing Activities |
|
|
|
|
|
|
|
|
|
|
|
|
|
|
|
|
| Additions to property, plant and equipment |
|
|
|
|
|
|
(2,176 |
) |
|
|
|
|
|
|
(2,079 |
) |
| Purchase of long-term investments |
|
|
|
|
|
|
(3 |
) |
|
|
|
|
|
|
(422 |
) |
| Other assets and intangible assets |
|
|
|
|
|
|
(72 |
) |
|
|
|
|
|
|
(71 |
) |
| Cash used in investing activities |
|
|
|
|
|
|
(2,251 |
) |
|
|
|
|
|
|
(2,572 |
) |
| Cash before financing activities |
|
|
|
|
|
|
1,234 |
|
|
|
|
|
|
|
559 |
|
| Financing Activities |
|
|
|
|
|
|
|
|
|
|
|
|
|
|
|
|
| Proceeds from long-term debt obligations |
|
|
|
|
|
|
– |
|
|
|
|
|
|
|
1,794 |
|
| Repayment of and finance costs on long-term debt obligations |
|
|
|
|
|
|
(607 |
) |
|
|
|
|
|
|
(810 |
) |
| (Repayments of) proceeds from short-term debt obligations |
|
|
|
|
|
|
(445 |
) |
|
|
|
|
|
|
547 |
|
| Dividends |
|
|
|
|
|
|
(208 |
) |
|
|
|
|
|
|
(119 |
) |
| Repurchase of common shares |
|
|
|
|
|
|
– |
|
|
|
|
|
|
|
(2,000 |
) |
| Issuance of common shares |
|
|
|
|
|
|
44 |
|
|
|
|
|
|
|
56 |
|
| Cash used in financing activities |
|
|
|
|
|
|
(1,216 |
) |
|
|
|
|
|
|
(532 |
) |
| Increase in Cash and Cash Equivalents |
|
|
|
|
|
|
18 |
|
|
|
|
|
|
|
27 |
|
| Cash and Cash Equivalents, Beginning of Year |
|
|
|
|
|
|
412 |
|
|
|
|
|
|
|
385 |
|
| Cash and Cash Equivalents, End of Year |
|
|
|
|
|
$ |
430 |
|
|
|
|
|
|
$ |
412 |
|
| Cash and cash equivalents comprised of: |
|
|
|
|
|
|
|
|
|
|
|
|
|
|
|
|
| Cash |
|
|
|
|
|
$ |
46 |
|
|
|
|
|
|
$ |
115 |
|
| Short-term investments |
|
|
|
|
|
|
384 |
|
|
|
|
|
|
|
297 |
|
| |
|
|
|
|
|
$ |
430 |
|
|
|
|
|
|
$ |
412 |
|
| Supplemental cash flow disclosure |
|
|
|
|
|
|
|
|
|
|
|
|
|
|
|
|
| Interest paid |
|
|
|
|
|
$ |
233 |
|
|
|
|
|
|
$ |
212 |
|
| Income taxes paid (recovered) |
|
|
|
|
|
$ |
623 |
|
|
|
|
|
|
$ |
(45 |
) |
(See Notes to the Consolidated Financial Statements)
II-7
Consolidated Statements of Changes in Equity
|
|
|
|
|
|
|
|
|
|
|
|
|
|
|
|
|
|
|
|
|
|
|
|
|
|
|
|
|
|
|
|
|
|
|
|
|
| In millions of US dollars |
|
|
|
| |
|
Equity Attributable to Common Shareholders
1 |
|
| |
|
|
|
|
|
|
|
Accumulated Other Comprehensive Income |
|
|
|
|
|
|
|
| |
|
Share
Capital |
|
|
Contributed
Surplus |
|
|
Net
unrealized
gains
on
available-for- sale
investments |
|
|
Net
unrealized
losses on
derivatives
designated as
cash flow
hedges |
|
|
Net
actuarial
losses on
defined
benefit
plans |
|
|
Other |
|
|
Total
Accumulated
Other
Comprehensive
Income |
|
|
Retained
Earnings |
|
|
Total
Equity |
|
| Balance – December 31, 2010 |
|
$ |
1,431 |
|
|
$ |
308 |
|
|
$ |
2,563 |
|
|
$ |
(177 |
) |
|
$ |
– |
2 |
|
$ |
8 |
|
|
$ |
2,394 |
|
|
$ |
2,552 |
|
|
$ |
6,685 |
|
| Net income |
|
|
– |
|
|
|
– |
|
|
|
– |
|
|
|
– |
|
|
|
– |
|
|
|
– |
|
|
|
– |
|
|
|
3,081 |
|
|
|
3,081 |
|
| Other comprehensive (loss) income |
|
|
– |
|
|
|
– |
|
|
|
(1,581 |
) |
|
|
9 |
|
|
|
(136 |
) |
|
|
(6 |
) |
|
|
(1,714 |
) |
|
|
– |
|
|
|
(1,714 |
) |
| Effect of share-based compensation |
|
|
– |
|
|
|
(9 |
) |
|
|
– |
|
|
|
– |
|
|
|
– |
|
|
|
– |
|
|
|
– |
|
|
|
– |
|
|
|
(9 |
) |
| Dividends declared |
|
|
– |
|
|
|
– |
|
|
|
– |
|
|
|
– |
|
|
|
– |
|
|
|
– |
|
|
|
– |
|
|
|
(240 |
) |
|
|
(240 |
) |
| Issuance of common shares |
|
|
52 |
|
|
|
(8 |
) |
|
|
– |
|
|
|
– |
|
|
|
– |
|
|
|
– |
|
|
|
– |
|
|
|
– |
|
|
|
44 |
|
| Transfer of actuarial losses on defined benefit plans |
|
|
– |
|
|
|
– |
|
|
|
– |
|
|
|
– |
|
|
|
136 |
|
|
|
– |
|
|
|
136 |
|
|
|
(136 |
) |
|
|
– |
|
| Balance – December 31, 2011 |
|
$ |
1,483 |
|
|
$ |
291 |
|
|
$ |
982 |
|
|
$ |
(168 |
) |
|
$ |
– |
2 |
|
$ |
2 |
|
|
$ |
816 |
|
|
$ |
5,257 |
|
|
$ |
7,847 |
|
| 1 |
All equity transactions are attributable to common shareholders. |
| 2 |
Any amounts incurred during a period are closed out to retained earnings at each period-end. Therefore, no balance exists in the reserve at beginning or end of
period. |
|
|
|
|
|
|
|
|
|
|
|
|
|
|
|
|
|
|
|
|
|
|
|
|
|
|
|
|
|
|
|
|
|
|
|
|
|
| |
|
Equity Attributable to Common Shareholders
1 |
|
| |
|
|
|
|
|
|
|
Accumulated Other Comprehensive Income |
|
|
|
|
|
|
|
| |
|
Share
Capital |
|
|
Contributed
Surplus |
|
|
Unrealized
gains on
available-for-
sale
investments |
|
|
Net
unrealized
losses on
derivatives
designated as
cash flow
hedges |
|
|
Net
actuarial
losses on
defined
benefit
plans |
|
|
Other |
|
|
Total
Accumulated
Other
Comprehensive
Income |
|
|
Retained
Earnings |
|
|
Total
Equity |
|
| Balance – January 1, 2010 |
|
$ |
1,430 |
|
|
$ |
273 |
|
|
$ |
1,900 |
|
|
$ |
(111 |
) |
|
$ |
– |
2 |
|
$ |
9 |
|
|
$ |
1,798 |
|
|
$ |
2,804 |
|
|
$ |
6,305 |
|
| Net income |
|
|
– |
|
|
|
– |
|
|
|
– |
|
|
|
– |
|
|
|
– |
|
|
|
– |
|
|
|
– |
|
|
|
1,775 |
|
|
|
1,775 |
|
| Other comprehensive income (loss) |
|
|
– |
|
|
|
– |
|
|
|
663 |
|
|
|
(66 |
) |
|
|
(25 |
) |
|
|
(1 |
) |
|
|
571 |
|
|
|
– |
|
|
|
571 |
|
| Share repurchase |
|
|
(69 |
) |
|
|
(47 |
) |
|
|
– |
|
|
|
– |
|
|
|
– |
|
|
|
– |
|
|
|
– |
|
|
|
(1,884 |
) |
|
|
(2,000 |
) |
| Effect of share-based compensation |
|
|
– |
|
|
|
96 |
|
|
|
– |
|
|
|
– |
|
|
|
– |
|
|
|
– |
|
|
|
– |
|
|
|
– |
|
|
|
96 |
|
| Dividends declared |
|
|
– |
|
|
|
– |
|
|
|
– |
|
|
|
– |
|
|
|
– |
|
|
|
– |
|
|
|
– |
|
|
|
(118 |
) |
|
|
(118 |
) |
| Issuance of common shares |
|
|
70 |
|
|
|
(14 |
) |
|
|
– |
|
|
|
– |
|
|
|
– |
|
|
|
– |
|
|
|
– |
|
|
|
– |
|
|
|
56 |
|
| Transfer of actuarial losses on defined benefit plans |
|
|
– |
|
|
|
– |
|
|
|
– |
|
|
|
– |
|
|
|
25 |
|
|
|
– |
|
|
|
25 |
|
|
|
(25 |
) |
|
|
– |
|
| Balance – December 31, 2010 |
|
$ |
1,431 |
|
|
$ |
308 |
|
|
$ |
2,563 |
|
|
$ |
(177 |
) |
|
$ |
– |
2 |
|
$ |
8 |
|
|
$ |
2,394 |
|
|
$ |
2,552 |
|
|
$ |
6,685 |
|
| 1 |
All equity transactions are attributable to common shareholders. |
| 2 |
Any amounts incurred during a period are closed out to retained earnings at each period-end. Therefore, no balance exists in the reserve at beginning or end of
period. |
(See Notes to the Consolidated Financial Statements)
II-8
|
|
|
| |
|
In millions of US dollars except as otherwise
noted |
|
|
|
|
|
| NOTE 1 |
|
|
|
DESCRIPTION OF BUSINESS |
With its subsidiaries, Potash Corporation of Saskatchewan Inc. (“PCS”) – together known as
“PotashCorp” or “the company” except to the extent the context otherwise requires – forms an integrated fertilizer and related industrial and feed products company. The company has producing assets in the following
locations:
| – |
|
five mines and mills and mining rights to potash reserves at a sixth location (expires December 31, 2012), all in the province of Saskatchewan
|
| – |
|
one mine and mill in the province of New Brunswick |
| – |
|
a mine and processing plants in the state of North Carolina |
| – |
|
a mine and two processing plants in the state of Florida |
| – |
|
a processing plant in the state of Louisiana |
| – |
|
phosphate feed plants in the states of Nebraska, Illinois, Missouri, North Carolina and Florida |
| – |
|
an industrial phosphoric acid plant in the state of Ohio |
| – |
|
three plants, one located in each of the states of Georgia, Louisiana and Ohio |
| – |
|
large-scale operations in Trinidad
|
In North America, the company leases or owns 207 terminal and warehouse facilities, some of which have
multi-product capability, for a total of 270 distribution points, and services customers with a fleet of approximately 9,950 railcars. In the offshore market, it leases one warehouse in China and one in Malaysia and has ownership in a joint venture
which leases a dry bulk fertilizer port terminal in Brazil. PotashCorp sells potash from its Saskatchewan mines for use outside North America exclusively to Canpotex Limited (“Canpotex”). A potash export, sales and marketing company owned
in equal shares by the three producers in Saskatchewan (including the company), Canpotex resells potash to offshore customers. PCS Sales (Canada) Inc. and PCS Sales (USA), Inc., wholly owned subsidiaries of PCS, execute marketing and sales for the
company’s potash, phosphate and nitrogen products in North America and offshore marketing and sales for the company’s New Brunswick potash. Phosphate Chemicals Export Association, Inc. (“PhosChem”), a phosphate export association
established under United States law, is the principal vehicle through which the company executes offshore marketing and sales for its phosphate fertilizers. PCS Sales (USA), Inc. generally handles offshore marketing and sales for the company’s
nitrogen products.
|
|
|
|
|
| NOTE 2 |
|
|
|
BASIS OF PRESENTATION |
The company previously prepared its financial statements in accordance with Canadian generally accepted
accounting principles (“Canadian GAAP”) as set out in the Handbook of the Canadian Institute of Chartered Accountants (“CICA Handbook”). In 2010, the CICA Handbook was revised to incorporate International Financial Reporting
Standards (“IFRS”), and required publicly accountable enterprises to apply these standards effective for years beginning on or after January 1, 2011, with early adoption permitted. Accordingly, these consolidated financial statements
are in accordance with IFRS, as issued by the International Accounting Standards Board (“IASB”). In these consolidated financial statements, the term “Canadian GAAP” refers to Canadian GAAP before the company’s adoption of
IFRS.
These consolidated financial statements have been prepared in accordance with IFRS and First-Time Adoption of International Financial
Reporting Standards (“IFRS 1”). Subject to certain transition elections disclosed in Note 30, the company has consistently applied the same accounting policies in its opening IFRS statement of financial position as at January 1,
2010 and throughout all periods presented, as if these policies had always been in effect. Note 30 describes the impact of the transition to IFRS on the company’s
reported financial position and financial performance, including the nature and effect of significant changes in accounting policies from those used in its Canadian GAAP consolidated financial
statements as at January 1, 2010 and December 31, 2010, and for the year ended December 31, 2010.
The company is a foreign private
issuer in the US that voluntarily files its consolidated financial statements with the Securities and Exchange Commission (the “SEC”) on US domestic filer forms. In connection with the company’s transition to IFRS, it is permitted to
file two years of financial statements presented in accordance with IFRS, instead of three, in the company’s audited consolidated financial statements. In addition, the company is permitted to file with the SEC its audited consolidated
financial statements under IFRS without a reconciliation to US generally accepted accounting principles (“US GAAP”). As a result, the company no longer prepares a reconciliation of its results to US GAAP. It is possible that certain of the
company’s accounting policies could be different from US GAAP.
These consolidated financial statements were authorized by the Board of
Directors for issue on February 21, 2012.
II-9
|
|
|
| |
|
In millions of US dollars except as otherwise
noted |
NOTE 2 Basis of Presentation continued
These consolidated financial statements were prepared under the historical cost convention, except for certain
items not carried at historical cost as discussed in the applicable accounting policies.
Significant Accounting Policies
Principles of consolidation
Subsidiaries are all entities (including special purpose entities) over which the company has the power to govern the financial and operating policies so as to obtain benefits from its activities that
generally accompany an equity interest controlling more than one-half of the voting rights. The existence and effect of potential voting rights that are currently exercisable or convertible are considered when assessing whether the company controls
another entity. Subsidiaries are fully consolidated from the date on which control is transferred to the company. They are deconsolidated from the date that control ceases. Principal (wholly owned) operating subsidiaries are:
| Ÿ |
|
PCS Sales (Canada) Inc. |
| |
– |
|
PCS Joint Venture, Ltd. (“PCS Joint Venture”) |
| Ÿ |
|
PCS Phosphate Company, Inc. (“PCS Phosphate”) |
| |
– |
|
PCS Purified Phosphates |
| Ÿ |
|
White Springs Agricultural Chemicals, Inc. (“White Springs”) |
| Ÿ |
|
PCS Nitrogen Fertilizer, L.P. |
| Ÿ |
|
PCS Nitrogen Ohio, L.P. |
| Ÿ |
|
PCS Nitrogen Trinidad Limited |
| Ÿ |
|
PCS Cassidy Lake Company |
All
significant intercompany balances and transactions are eliminated.
|
| Foreign currency transactions |
Items included in the consolidated financial statements of the company and each of its subsidiaries are measured using the
currency of the primary economic environment in which the individual entity operates (“the functional currency”). The consolidated financial statements are presented in United States dollars (“US dollars”), which is the
functional currency of the company and the majority of its subsidiaries.
Foreign currency transactions, including Canadian, Trinidadian and
Chilean currency operating transactions, are generally translated to US dollars at the average exchange rate for the previous month. Monetary assets and liabilities are translated at period-end exchange rates. Foreign exchange gains and losses
resulting from the settlement of such transactions, and from the translation at period-end exchange rates of monetary assets and liabilities denominated in foreign currencies, are recognized in net income in the period in which they arise. Foreign
exchange gains and losses are presented in the statements of income within other income or other expenses as applicable.
Translation differences on non-monetary assets and liabilities carried at fair value are recognized as part of
changes in fair value. Translation differences on non-monetary financial assets such as investments in equity securities classified as available-for-sale are included in other comprehensive income (“OCI”).
Cash equivalents
Highly liquid
investments with a maturity of three months or less from the date of purchase are considered to be cash equivalents.
The company has classified freight and other transportation and distribution costs incurred relating to product inventory
stored at warehouse and terminal facilities as prepaid expenses.
Long-lived asset impairment
Assets that have an indefinite useful life (i.e., goodwill) are not subject to amortization and are tested at least annually for impairment (typically in
April), or more frequently if events or circumstances indicate there may be an impairment. At the end of each reporting period, the company reviews the carrying amounts of both its long-lived assets to be held and used and its identifiable
intangible assets with finite lives to determine whether there is any indication that they have suffered an impairment loss. For assessing impairment, assets are grouped at the lowest levels for which there are separately identifiable cash
flows (this can be at the asset or cash-generating unit level). A cash-generating unit is the smallest identifiable group of assets that generates cash inflows which are largely independent of the cash inflows from other assets or groups of assets.
If an indication of impairment exists, the recoverable amount of the asset is estimated in order to determine the extent of the impairment loss (if any). An impairment loss is recognized as the amount by which the asset’s carrying amount
exceeds its recoverable amount. If the recoverable amount of the cash-generating unit is less than its carrying amount, the impairment loss is allocated first to reduce the carrying amount of any goodwill allocated to the unit and then to the
other assets of the unit pro rata on the basis of the carrying amount of each asset in the unit. The recoverable amount is the higher of an asset’s fair value less costs to sell and value in use. In assessing value in use, the estimated
future cash flows are discounted to their present value using a pre-tax discount rate that reflects current market assessments of the time value of money and the risks specific to the asset for which the estimates of future cash flows have not been
adjusted. Non-financial assets, other than goodwill, that previously suffered an impairment loss are reviewed for possible reversal of the impairment at each reporting date.
II-10
|
|
|
| |
|
In millions of US dollars except as otherwise
noted |
NOTE 2 Basis of Presentation continued
|
| Additional accounting policies
To facilitate a better understanding of our consolidated financial statements, we have disclosed our significant accounting policies (with the exception of
those identified above) throughout the following notes, with the related financial disclosures by major caption: |
|
| Accounting Estimates and Judgments |
Certain of the company’s policies involve accounting estimates and judgments because they require the company to make
subjective or complex judgments about matters that are inherently uncertain and because of the likelihood that materially different amounts could be reported under different conditions or using different assumptions.
The following section discusses the accounting estimates, judgments and assumptions that the company has made and how they affect the amounts reported in
the consolidated financial statements.
In the normal course of business, the company may enter into arrangements that are created to accomplish a narrow and
well-defined objective. Any such
special purpose entities (“SPE”) must be consolidated when the substance of the relationship between the company and the SPE indicates that the SPE is controlled by the company.
Assessing the substance of such a relationship involves considerable judgment. In addition to the general indicators of control, such as the company’s proportion of voting rights, power to govern the financial and operating policies of the
entity and power to appoint or remove the majority of the board of directors, the company considers several additional factors to determine whether in substance it controls the SPE, even in cases where it controls less than half of the voting rights
or owns little or none of the SPE’s equity.
|
| Long-lived asset impairment |
The impairment process begins with the identification of the appropriate asset or cash-generating unit for purposes of
impairment testing. Identification and measurement of any impairment are based on the asset’s recoverable amount, which is the higher of its fair value less costs to sell and its value in use. Value in use is generally based on an estimate of
discounted future cash flows. Judgment is required in determining the appropriate discount rate. Assumptions must also be made about future sales, margins and market conditions over the long-term life of the assets or cash-generating units.
The company cannot predict if an event that triggers impairment will occur, when it will occur or how it will affect reported asset amounts.
Although estimates are reasonable and consistent with current conditions, internal planning and expected future operations, such estimates are subject to significant uncertainties and judgments. As a result, it is reasonably possible that the
amounts reported for asset impairments could be different if different assumptions were used or if market and other conditions were to change. The changes could result in non-cash charges that could materially affect the company’s consolidated
financial statements.
Restructuring charges
Plant shutdowns, sales of business units or other corporate restructurings trigger incremental costs to the company (i.e., expenses for employee termination, contract termination and other exit costs).
Because such activities are complex processes that can take several months to complete, they involve making and reassessing estimates.
II-11
|
|
|
| |
|
In millions of US dollars except as otherwise
noted |
NOTE 2 Basis of Presentation continued
|
| Additional accounting estimates and judgments
To facilitate a better understanding of the company’s consolidated financial
statements, it has disclosed its significant accounting estimates and judgments (with the exception of those identified above) throughout the following notes with the related financial disclosures by major caption: |
|
| Recent Accounting
Pronouncements |
The following new standards and amendments or interpretations to existing standards have been published and are mandatory for
periods beginning on or after January 1, 2011, or later:
|
| IFRS 9, Financial Instruments |
In November 2009, the IASB issued guidance on the classification and measurement of financial assets. Under IFRS 9, financial
assets will generally be measured initially at fair value plus particular transaction costs, and subsequently at either amortized cost or fair value. In October 2010, the IASB issued additions to IFRS 9 relating to accounting for financial
liabilities. Under the new requirements, an entity choosing to measure a financial liability at fair value will present the portion of any change in its fair value due to changes in the entity’s own credit risk in OCI, rather than within net
income. In December 2011, the IASB issued amendments which modify the requirements for transition from International Accounting Standard (“IAS”) 39 to IFRS 9. The modifications introduce new disclosure requirements and eliminate the
requirement to restate prior periods. The standard is to be applied prospectively and will be effective for periods commencing on or after January 1, 2015, with earlier application permitted. The company is reviewing the standard to determine
the potential impact, if any, on its consolidated financial statements.
Amendments to IFRIC 14, Prepayments of a Minimum Funding
Requirement
In November 2009, the International Financial Reporting Interpretations Committee (“IFRIC”) issued amendments to IFRIC 14
relating to the prepayments
of a minimum funding requirement for an employee defined benefit plan. The amendments apply when an entity is subject to minimum funding requirements and makes early contributions to cover those
requirements. The amendments permit treating the benefit of such an early payment as an asset. The amendment must be applied from the beginning of the first comparative period presented in the first financial statements in which it is applied.
The amendments became effective for periods commencing on or after January 1, 2011. The company has applied these amendments, which had no effect on these consolidated financial statements.
Amendments to IFRS 7, Financial Instruments: Disclosures
In May 2010, the IASB issued amendments to IFRS 7 as part of its annual improvements process. The amendments addressed various requirements relating to the disclosure of financial instruments and became
effective for annual periods commencing on or after January 1, 2011. The company has applied these amendments by providing the appropriate disclosures in Note 24 to these consolidated financial statements.
|
| Amendments to IFRS 7, Financial Instruments: Disclosures – Transfers of Financial Assets |
In October 2010, the IASB issued amendments to IFRS 7. The amendments require additional disclosures to assist users of
financial statements in evaluating the risk exposures relating to transfers of financial assets that are not derecognized or for which the entity has a continuing involvement. The amendments became effective for annual periods beginning on or after
July 1, 2011. The company does not typically retain any continuing involvement in financial assets once transferred and the application of these amendments had no effect on these consolidated financial statements.
IFRS 10, Consolidated Financial Statements
In May 2011, the IASB issued guidance establishing principles for the presentation and preparation of consolidated financial statements when an entity controls one or more other entities. IFRS 10 (which
supersedes IAS 27 and Standing Interpretations Committee (“SIC”) 12) builds on existing principles by identifying the concept of control as the determining factor in whether an entity should be included within the consolidated financial
statements of the parent company. The standard provides additional guidance to help determine control where this is difficult to assess. It is to be applied retrospectively, in most circumstances, and will be effective for annual periods commencing
on or after January 1, 2013, with earlier application permitted. The company is reviewing the standard to determine the potential impact, if any, on its consolidated financial statements.
II-12
|
|
|
| |
|
In millions of US dollars except as otherwise
noted |
NOTE 2 Basis of Presentation continued
|
| IFRS 11, Joint Arrangements |
In May 2011, the IASB issued guidance establishing principles for financial reporting by parties to a joint arrangement. IFRS
11 (which supersedes IAS 31 and SIC 13) requires a party to a joint arrangement to determine the type of arrangement, either a joint operation or a joint venture, by assessing its rights and obligations arising from the arrangement. The existing
policy choice of proportionate consolidation for jointly controlled entities has been eliminated and under IFRS 11, equity accounting is mandatory for participants in joint ventures. The standard is to be applied prospectively and will be effective
for annual periods commencing on or after January 1, 2013, with earlier application permitted. The company is reviewing the standard to determine the potential impact, if any, on its consolidated financial statements.
IFRS 12, Disclosure of Interests in Other Entities
In May 2011, the IASB issued guidance relating to the disclosure requirements of interests in other entities. IFRS 12 is a new and comprehensive standard on
disclosure requirements for all forms of interest in other entities, including subsidiaries, joint arrangements, associates and unconsolidated structured entities. The standard is to be applied prospectively and will be effective for annual periods
commencing on or after January 1, 2013, with earlier application permitted. The company is reviewing the standard to determine the potential impact, if any, on its consolidated financial statements.
|
| IFRS 13, Fair Value Measurement |
In May 2011, the IASB issued guidance establishing a single source for fair value measurement. IFRS 13 defines fair value,
sets out a framework for measuring it and introduces consistent requirements for disclosures on fair value measurements. It does not determine when an asset, a liability or an entity’s own equity instrument is measured at fair value.
Rather, the measurement and disclosure requirements of IFRS 13 apply when another standard requires or permits the item to be measured at fair value, with limited exceptions. The standard is to be applied prospectively and will be effective
for annual periods commencing on or after January 1, 2013, with earlier application permitted. The company is reviewing the standard to determine the potential impact, if any, on its consolidated financial statements.
Amendments to IAS 1, Presentation of Financial Statements
In June 2011, the IASB issued amendments to IAS 1 requiring items within OCI that may be reclassified to the profit or loss section of the income statement
to be grouped together. The amendments are to be applied retrospectively and will be effective for annual periods commencing on or after July 1, 2012, with earlier application permitted. The company is reviewing these amendments to determine
the potential impact, if any, on its consolidated financial statements.
|
| Amendments to IAS 19, Employee
Benefits |
In June 2011, the IASB issued amendments to IAS 19 relating to the recognition and measurement of post-employment defined
benefit expense and termination benefits, and to the disclosures for all employee benefits. The amendments will require remeasurements (actuarial gains and losses and the actual return on plan assets) to be recognized immediately in other
comprehensive income and all service cost and interest income (expense) to be recognized immediately in net income. Interest income (expense) will be calculated by applying the discount rate to the net defined benefit asset (liability). The
amendments are to be applied retrospectively, except for changes to the carrying value of assets that include capitalized employee benefit costs, which are to be applied prospectively. The amendments will be effective for annual periods commencing
on or after January 1, 2013, with earlier application permitted. The company is reviewing these amendments to determine the potential impact, if any, on its consolidated financial statements.
Amendments to IAS 32, Offsetting Financial Assets and Financial
Liabilities and IFRS 7, Disclosures
In December 2011, the IASB issued amendments to IAS 32 and IFRS 7 as part of its offsetting project. The
amendments clarify certain items regarding offsetting financial assets and financial liabilities and also address common disclosure requirements. The amendments are to be applied retrospectively and will be effective for annual periods commencing on
or after January 1, 2013 for IFRS 7 and January 1, 2014 for IAS 32, with earlier application permitted. If IAS 32 is early adopted, the disclosures required by the amendments to IFRS 7 must be provided. The company is reviewing
these amendments to determine the potential impact, if any, on its consolidated financial statements.
IFRIC 20, Stripping Costs in the Production Phase of a Surface Mine
In October
2011, the IFRIC issued IFRIC 20 clarifying the requirements for accounting for stripping costs in the production phase of a surface mine. This interpretation clarifies when production stripping should lead to the recognition of an asset and how
that asset should be measured, both initially and in subsequent periods. The interpretation will be effective for annual periods commencing on or after January 1, 2013, with earlier application permitted. The company is reviewing this
interpretation to determine the potential impact, if any, on its consolidated financial statements.
II-13
|
|
|
| |
|
In millions of US dollars except as otherwise
noted |
Accounting Policies
Trade receivables are recognized initially at fair value and subsequently measured at
amortized cost less provision for impairment of trade accounts receivable. Such a provision is established when there is reasonable expectation that the company will not be able to collect all amounts due. The carrying amount of the trade
receivables is reduced through the use of the provision for impairment account, and the amount of any increase in the provision for impairment is recognized in the consolidated statements of income. When a trade receivable is uncollectible, it is
written off against the provision for impairment account for trade accounts receivable. Subsequent recoveries of amounts previously written off are credited to the consolidated statements of income.
Supporting Information
|
|
|
|
|
|
|
|
|
|
|
|
|
| |
|
December 31, |
|
|
December 31, |
|
|
January 1, |
|
| |
|
2011 |
|
|
2010 |
|
|
2010 |
|
| Trade accounts – Canpotex (Note 29) |
|
$ |
291 |
|
|
$ |
298 |
|
|
$ |
164 |
|
| – Other |
|
|
609 |
|
|
|
448 |
|
|
|
264 |
|
| Less provision for impairment of trade accounts receivable |
|
|
(8 |
) |
|
|
(8 |
) |
|
|
(8 |
) |
|
|
|
892 |
|
|
|
738 |
|
|
|
420 |
|
| Margin deposits on derivative instruments |
|
|
189 |
|
|
|
198 |
|
|
|
109 |
|
| Income taxes receivable (Note 21) |
|
|
21 |
|
|
|
46 |
|
|
|
363 |
|
| Provincial mining and other taxes receivable |
|
|
44 |
|
|
|
– |
|
|
|
235 |
|
| Other non-trade accounts |
|
|
49 |
|
|
|
77 |
|
|
|
87 |
|
| |
|
$ |
1,195 |
|
|
$ |
1,059 |
|
|
$ |
1,214 |
|
Inventories of finished products, intermediate products, raw materials, and materials and supplies are valued at the lower of
cost and net realizable value. Costs, allocated to inventory using the weighted average cost method, include direct acquisition costs, direct costs related to the units of production and a systematic allocation of fixed and variable production
overhead, as applicable. Net realizable value for finished products, intermediate products and raw materials is generally considered to be the selling price of the finished product in the ordinary course of business less the estimated costs of
completion and estimated costs to make the sale. In certain circumstances, particularly pertaining to the company’s materials and supplies inventories, replacement cost is considered to be the best available measure of net realizable value.
Inventory is reviewed monthly to ensure the carrying value does not exceed net realizable value. If so, a writedown is recognized. The writedown may be reversed if the circumstances which caused it no longer exist.
II-14
|
|
|
| |
|
In millions of US dollars except as otherwise
noted |
NOTE 4 Inventories continued
Supporting Information
|
|
|
|
|
|
|
|
|
|
|
|
|
| |
|
December 31, |
|
|
December 31, |
|
|
January 1, |
|
| |
|
2011 |
|
|
2010 |
|
|
2010 |
|
| Finished products |
|
$ |
395 |
|
|
$ |
255 |
|
|
$ |
303 |
|
| Intermediate products |
|
|
98 |
|
|
|
127 |
|
|
|
159 |
|
| Raw materials |
|
|
91 |
|
|
|
65 |
|
|
|
51 |
|
| Materials and supplies |
|
|
147 |
|
|
|
123 |
|
|
|
111 |
|
| |
|
$ |
731 |
|
|
$ |
570 |
|
|
$ |
624 |
|
| Items affecting cost of goods sold |
|
|
|
2011 |
|
|
|
2010 |
|
| Expensed inventories |
|
|
$ |
3,653 |
|
|
$ |
3,087 |
|
| Reserves, reversals and writedowns of inventories |
|
|
|
8 |
|
|
|
5 |
|
| |
|
|
$ |
3,661 |
|
|
$ |
3,092 |
|
|
|
|
|
|
| NOTE 5 |
|
|
|
PROPERTY, PLANT AND EQUIPMENT |
Property, plant and equipment (which include certain mine development costs, pre-stripping costs and assets under
construction) are carried at cost (which includes all expenditures directly attributable to bringing the asset to the location and installing it in working condition for its intended use) less accumulated depreciation less any recognized impairment
loss. The cost of property, plant and equipment is reduced by the amount of related investment tax credits to which the company is entitled. Costs of additions, betterments, renewals and borrowings during construction are capitalized. Borrowing
costs directly attributable to the acquisition, construction or production of assets that necessarily take a substantial period of time to ready for their intended use are added to the cost of those assets, until such time as the assets are
substantially ready for their intended use. The capitalization rate is based on the weighted average interest rate on all of the company’s outstanding third-party debt. All other borrowing costs are charged through finance costs in the period
in which they are incurred. Each part of an item of property, plant and equipment with a cost that is significant in relation to the item’s total cost is depreciated separately. When the cost of replacing part of an item of property, plant and
equipment is capitalized, the carrying amount of the replaced part is derecognized. The cost of major inspections and overhauls is capitalized and depreciated over the period until the next major inspection or overhaul. Maintenance and repair
expenditures that do not improve or extend productive life are expensed in the period incurred.
Any gain or loss arising on the disposal or
retirement of an item of property, plant and equipment is determined as the difference between the sale proceeds and the carrying amount of the asset, and is recognized in operating income.
|
| Accounting Estimates and Judgments |
Determination of which costs are directly attributable (e.g., labor, overhead) is a matter of judgment. Capitalization of
costs ceases when an item is substantially complete and in the location and condition necessary for it to be capable of operating in the manner intended by management. Determining when an asset, or a portion thereof, meets these criteria requires
consideration of the circumstances and the industry in which it is to be operated, normally predetermined by management with reference to such factors as productive capacity. This determination is a matter of judgment that can be complex and subject
to differing interpretations and views, particularly when significant capital projects contain multiple phases over an extended period of time.
Certain mining and milling assets are depreciated using the units-of-production method based on the shorter of estimates of reserves or service lives.
Pre-stripping costs are depreciated on a units-of-production basis over the ore mined from the mineable acreage stripped. Land is not depreciated. Other asset classes are depreciated on a straight-line basis as follows: land improvements 5 to
40 years, buildings and improvements 4 to 40 years and machinery and equipment (comprised primarily of plant equipment) 20 to 40 years.
Depreciation of assets under construction commences when the assets are ready for their intended use and is subject to management judgment. Their residual
values and useful lives are reviewed, and adjusted if appropriate, at the end of each reporting period. Changes in the expected useful life or the expected pattern of consumption of future economic benefits embodied in the asset are accounted for by
changing the depreciation period or method, as appropriate, and are treated as changes in accounting estimates.
II-15
|
|
|
| |
|
In millions of US dollars except as otherwise
noted |
NOTE 5 Property, Plant and Equipment continued
The company assesses its existing assets and depreciable lives in connection with the review of mine and
plant operating plans at the end of each reporting period. When it is determined that assigned asset lives do not reflect the expected remaining period of benefit, prospective changes are made to their depreciable lives. Uncertainties are inherent
in estimating reserve quantities, particularly as they relate to assumptions regarding future prices, the geology of the company’s mines, the mining methods used and the related costs incurred to develop and mine the company’s reserves.
Changes in these assumptions could result in material adjustments to reserve estimates, which could result in changes to units-of-production depreciation expense in future periods, particularly if reserve estimates are reduced.
Supporting Information
|
|
|
|
|
|
|
|
|
|
|
|
|
|
|
|
|
|
|
|
|
|
|
|
|
| |
|
Land and
Improvements |
|
|
Buildings and
Improvements |
|
|
Machinery
and
Equipment |
|
|
Mine
Development
Costs |
|
|
Assets Under
Construction |
|
|
Total |
|
| Carrying amount – December 31, 2010 |
|
$ |
332 |
|
|
$ |
1,248 |
|
|
$ |
4,331 |
|
|
$ |
260 |
|
|
$ |
1,970 |
|
|
$ |
8,141 |
|
| Investment tax credits |
|
|
– |
|
|
|
– |
|
|
|
(31 |
) |
|
|
– |
|
|
|
(41 |
) |
|
|
(72 |
) |
| Additions |
|
|
– |
|
|
|
2 |
|
|
|
40 |
|
|
|
141 |
|
|
|
2,202 |
|
|
|
2,385 |
|
| Disposals |
|
|
– |
|
|
|
(10 |
) |
|
|
(1 |
) |
|
|
(1 |
) |
|
|
– |
|
|
|
(12 |
) |
| Transfers |
|
|
82 |
|
|
|
842 |
|
|
|
824 |
|
|
|
136 |
|
|
|
(1,884 |
) |
|
|
– |
|
| Depreciation |
|
|
(12 |
) |
|
|
(43 |
) |
|
|
(384 |
) |
|
|
(81 |
) |
|
|
– |
|
|
|
(520 |
) |
| Carrying amount – December 31, 2011 |
|
$ |
402 |
|
|
$ |
2,039 |
|
|
$ |
4,779 |
|
|
$ |
455 |
|
|
$ |
2,247 |
|
|
$ |
9,922 |
|
| Balance at December 31, 2011 comprised of: |
|
|
|
|
|
|
|
|
|
|
|
|
|
|
|
|
|
|
|
|
|
|
|
|
| Cost |
|
$ |
499 |
|
|
$ |
2,345 |
|
|
$ |
7,657 |
|
|
$ |
827 |
|
|
$ |
2,247 |
|
|
$ |
13,575 |
|
| Accumulated depreciation |
|
|
(97 |
) |
|
|
(306 |
) |
|
|
(2,878 |
) |
|
|
(372 |
) |
|
|
– |
|
|
|
(3,653 |
) |
| Carrying amount |
|
$ |
402 |
|
|
$ |
2,039 |
|
|
$ |
4,779 |
|
|
$ |
455 |
|
|
$ |
2,247 |
|
|
$ |
9,922 |
|
| Carrying amount – January 1, 2010 |
|
$ |
280 |
|
|
$ |
676 |
|
|
$ |
3,233 |
|
|
$ |
168 |
|
|
$ |
2,087 |
|
|
$ |
6,444 |
|
| Investment tax credits |
|
|
– |
|
|
|
– |
|
|
|
– |
|
|
|
– |
|
|
|
(36 |
) |
|
|
(36 |
) |
| Impairment losses |
|
|
– |
|
|
|
– |
|
|
|
(2 |
) |
|
|
– |
|
|
|
– |
|
|
|
(2 |
) |
| Additions |
|
|
2 |
|
|
|
12 |
|
|
|
156 |
|
|
|
82 |
|
|
|
1,962 |
|
|
|
2,214 |
|
| Disposals |
|
|
– |
|
|
|
(3 |
) |
|
|
(22 |
) |
|
|
– |
|
|
|
– |
|
|
|
(25 |
) |
| Transfers |
|
|
59 |
|
|
|
595 |
|
|
|
1,322 |
|
|
|
67 |
|
|
|
(2,043 |
) |
|
|
– |
|
| Depreciation |
|
|
(9 |
) |
|
|
(32 |
) |
|
|
(356 |
) |
|
|
(57 |
) |
|
|
– |
|
|
|
(454 |
) |
| Carrying amount – December 31, 2010 |
|
$ |
332 |
|
|
$ |
1,248 |
|
|
$ |
4,331 |
|
|
$ |
260 |
|
|
$ |
1,970 |
|
|
$ |
8,141 |
|
| Balance at December 31, 2010 comprised of: |
|
|
|
|
|
|
|
|
|
|
|
|
|
|
|
|
|
|
|
|
|
|
|
|
| Cost |
|
$ |
417 |
|
|
$ |
1,513 |
|
|
$ |
6,864 |
|
|
$ |
548 |
|
|
$ |
1,970 |
|
|
$ |
11,312 |
|
| Accumulated depreciation |
|
|
(85 |
) |
|
|
(265 |
) |
|
|
(2,533 |
) |
|
|
(288 |
) |
|
|
– |
|
|
|
(3,171 |
) |
| Carrying amount |
|
$ |
332 |
|
|
$ |
1,248 |
|
|
$ |
4,331 |
|
|
$ |
260 |
|
|
$ |
1,970 |
|
|
$ |
8,141 |
|
| Balance at January 1, 2010 comprised of: |
|
|
|
|
|
|
|
|
|
|
|
|
|
|
|
|
|
|
|
|
|
|
|
|
| Cost |
|
$ |
356 |
|
|
$ |
911 |
|
|
$ |
5,540 |
|
|
$ |
400 |
|
|
$ |
2,087 |
|
|
$ |
9,294 |
|
| Accumulated depreciation |
|
|
(76 |
) |
|
|
(235 |
) |
|
|
(2,307 |
) |
|
|
(232 |
) |
|
|
– |
|
|
|
(2,850 |
) |
| Carrying amount |
|
$ |
280 |
|
|
$ |
676 |
|
|
$ |
3,233 |
|
|
$ |
168 |
|
|
$ |
2,087 |
|
|
$ |
6,444 |
|
II-16
|
|
|
| |
|
In millions of US dollars except as otherwise
noted |
NOTE 5 Property, Plant and Equipment continued
Depreciation of property, plant and equipment included in cost of goods sold and in selling and administrative
expenses was $478 in 2011 (2010 – $441). Depreciation of property, plant and equipment included in the cost of property, plant and equipment and inventory was $42 in 2011 (2010 – $13).
Acquiring or constructing property, plant and equipment by incurring a liability does not result in a cash outflow for the company until the liability is
paid. In the period the related liability is incurred, the change in operating accounts payable on the consolidated statements of cash flow is typically reduced by such amount. In the period the liability is paid, the amount is reflected as a cash
outflow for investing activities. The applicable net change in accounts payable that was reclassified (to) from investing activities to (from) operating activities on the consolidated statements of cash flow in 2011 was $(3) (2010 – $14).
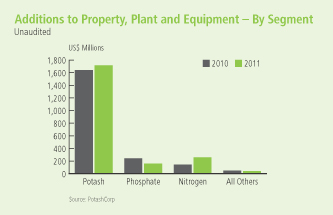
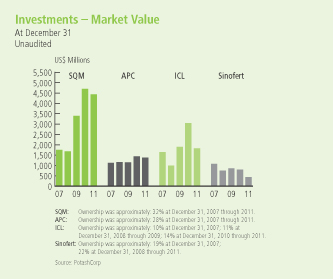
Investments in Equity-Accounted Investees
Investments in which the company exercises significant influence (but does not control) are accounted for using the equity
method. Such investees that are not jointly controlled entities are referred to as associates. The company’s interests in jointly controlled entities are also accounted for using the equity method.
These associates and jointly controlled entities follow similar accounting principles and policies to PotashCorp. The proportionate share of any net income or losses from investments accounted
for using the equity method, and any gain or loss on disposal, are recorded in net income. The company’s share of its associates’ post-acquisition movements in OCI is recognized in the company’s OCI. The cumulative post-acquisition
movements in net income and in OCI are adjusted against the carrying amount of the investment. Dividends received from associates reduce the value of the company’s investment. An impairment test is performed when there is objective evidence of
impairment, such as significant adverse changes in the environment in which the equity-accounted investee operates or a significant or prolonged decline in the fair value of the investment below its cost. An impairment loss is recorded when the
recoverable amount becomes lower than the carrying amount, recoverable amount being the higher of value in use and fair value less costs to sell. Impairment losses are reversed if the recoverable amount subsequently exceeds the carrying amount.
|
| Accounting Estimates and
Judgments |
Significant influence is the power to participate in the financial and operating policy decisions of the investee but is
not control or joint control over those policies. Judgment is necessary in determining when significant influence exists.
The company’s
22 percent ownership of Sinofert Holdings Limited (“Sinofert”) does not constitute significant influence and its investment is therefore accounted for as an available-for-sale investment.
II-17
|
|
|
| |
|
In millions of US dollars except as otherwise
noted |
NOTE 6 Investments continued
Supporting
Information
|
|
|
|
|
|
|
|
|
|
|
|
|
| |
|
December 31,
2011 |
|
|
December 31,
2010 |
|
|
January 1,
2010 |
|
| Sociedad Quimica y Minera de Chile S.A. (“SQM”) – 32 percent ownership; quoted market value of
$4,429 |
|
$ |
728 |
|
|
$ |
649 |
|
|
$ |
587 |
|
| Arab Potash Company Ltd. (“APC”) – 28 percent ownership; quoted market value of $1,383 |
|
|
433 |
|
|
|
382 |
|
|
|
349 |
|
| Other |
|
|
26 |
|
|
|
20 |
|
|
|
19 |
|
| |
|
$ |
1,187 |
|
|
$ |
1,051 |
|
|
$ |
955 |
|
Summarized financial information of the company’s associates (SQM, APC, Canpotex and others) is as follows:
|
|
|
|
|
|
|
|
|
|
|
|
|
| |
|
December 31,
2011 |
|
|
December 31,
2010 |
|
|
January 1,
2010 |
|
| Current assets |
|
$ |
3,661 |
|
|
$ |
3,067 |
|
|
$ |
2,629 |
|
| Non-current assets |
|
|
2,799 |
|
|
|
2,464 |
|
|
|
2,265 |
|
| Current liabilities |
|
|
1,663 |
|
|
|
1,355 |
|
|
|
1,174 |
|
| Non-current liabilities |
|
|
1,453 |
|
|
|
1,305 |
|
|
|
1,210 |
|
| Non-controlling interest |
|
|
52 |
|
|
|
48 |
|
|
|
46 |
|
|
|
|
| |
|
|
2011 |
|
|
2010 |
|
| Sales |
|
|
$ |
7,609 |
|
|
$ |
5,642 |
|
| Gross profit |
|
|
|
1,458 |
|
|
|
1,029 |
|
| Income from continuing operations and net income |
|
|
|
989 |
|
|
|
625 |
|
Dividends received from these investments in 2011 were $128 (2010 – $79).
Available-for-Sale Investments
Accounting Policies
The fair value of investments designated as available-for-sale is recorded in the
consolidated statements of financial position, with unrealized gains and losses, net of related income taxes, recorded in accumulated other comprehensive income (“AOCI”). The cost of investments sold is based on the weighted average
method. Realized gains and losses on these investments are removed from AOCI and recorded in net income. The company assesses at the end of each reporting period whether there is objective evidence of impairment. A significant or prolonged decline
in the fair value of the investment below its cost would be evidence that the assets are impaired. If objective evidence of impairment were to exist, the impaired amount (i.e., the unrealized loss) would be recognized in net income; any subsequent
reversals would be recognized in OCI and would not flow back into net income. See Note 24 for a description of how the company determines fair value for its investments.
Accounting Estimates and Judgments
The determination of when an investment is impaired requires significant judgment. In
making this judgment, the company evaluates, among other factors, the duration and extent to which the fair value of the investment is less than its cost.
At December 31, 2011, the company assessed whether there was objective evidence that its investment in Sinofert was impaired. The fair value of this investment, recorded in the consolidated statements
of financial position, was $439 compared to the cost of $579. Factors considered in assessing impairment included the length of time and extent to which fair value had been below cost, and current financial and market conditions specific to
Sinofert. The company concluded that objective evidence of impairment did not exist as at December 31, 2011 and, as a result, the unrealized holding loss of $140 was included in AOCI. Impairment will be assessed again in future reporting
periods if the fair value of the company’s investment in Sinofert is below cost.
II-18
|
|
|
| |
|
In millions of US dollars except as otherwise
noted |
NOTE 6 Investments continued
Supporting Information
|
|
|
|
|
|
|
|
|
|
|
|
|
| |
|
December 31,
2011 |
|
|
December 31,
2010 |
|
|
January 1,
2010 |
|
| Israel Chemicals Ltd. (“ICL”) – 14 percent ownership |
|
$ |
1,826 |
|
|
$ |
3,046 |
|
|
$ |
1,896 |
|
| Sinofert – 22 percent ownership |
|
|
439 |
|
|
|
796 |
|
|
|
864 |
|
| |
|
$ |
2,265 |
|
|
$ |
3,842 |
|
|
$ |
2,760 |
|
In 2011, the company purchased additional shares in Sinofert for cash consideration of $4, of which $3 was settled during the
year. The company’s ownership percentage remained at approximately 22 percent.
Accounting Estimates and Judgments
The costs of certain ammonia catalysts are capitalized to other assets
and are amortized, net of residual value, on a straight-line basis over their estimated useful lives of 3 to 10 years.
Upfront lease costs are
capitalized to other assets and amortized over the life of the leases on a straight-line basis, the latest of which extends through 2038.
Supporting Information
|
|
|
|
|
|
|
|
|
|
|
|
|
| |
|
December 31,
2011 |
|
|
December 31,
2010 |
|
|
January 1,
2010 |
|
| Long-term income taxes receivable (Note 21) |
|
$ |
117 |
|
|
$ |
122 |
|
|
$ |
78 |
|
| Investment tax credits receivable |
|
|
111 |
|
|
|
41 |
|
|
|
46 |
|
| Ammonia catalysts – net of accumulated amortization of $27 (December 31, 2010 – $17; January 1, 2010
– $9) |
|
|
37 |
|
|
|
37 |
|
|
|
44 |
|
| Accrued pension benefit asset (Note 13) |
|
|
20 |
|
|
|
26 |
|
|
|
29 |
|
| Upfront lease costs – net of accumulated amortization of $7 (December 31, 2010 – $6; January 1, 2010
– $4) |
|
|
20 |
|
|
|
21 |
|
|
|
23 |
|
| Deferred income tax assets (Note 21) |
|
|
19 |
|
|
|
38 |
|
|
|
31 |
|
| Derivative instrument assets (Note 11) |
|
|
6 |
|
|
|
– |
|
|
|
3 |
|
| Other – net of accumulated amortization of $15 (December 31, 2010 – $11;
January 1, 2010 – $6) |
|
|
30 |
|
|
|
18 |
|
|
|
20 |
|
| |
|
$ |
360 |
|
|
$ |
303 |
|
|
$ |
274 |
|
Amortization of other assets included in cost of goods sold and in selling and administrative expenses was $9
(2010 – $5).
II-19
|
|
|
| |
|
In millions of US dollars except as otherwise
noted |
Accounting Policies
Intangible assets are recorded initially at cost and relate primarily to production and
technology rights, contractual customer relationships, computer software and goodwill. Internally generated intangible assets relate to computer software and other developed projects. An intangible asset is recognized when it is probable that
the expected future economic benefits attributable to the asset will flow to the company and the cost of the asset can be measured reliably.
Costs associated with maintaining computer software programs are recognized as an expense as incurred. Development costs that are directly attributable to the design and testing of identifiable and unique
software products controlled by the company are recognized as intangible assets when the following criteria are met:
| Ÿ |
|
It is technically feasible to complete the software product so that it will be available for use; |
| Ÿ |
|
Management intends to complete the software product and use or sell it; |
| Ÿ |
|
The software product can be used or sold; |
| Ÿ |
|
It can be demonstrated how the software product will generate probable future economic benefits; |
| Ÿ |
|
Adequate technical, financial and other resources to complete the development and to use or sell the software product are available; and
|
| Ÿ |
|
The expenditure attributable to the software product during its development can be reliably measured. |
Directly attributable costs that are capitalized as part of the software product include applicable employee costs. Development costs previously recognized
as an expense are not recognized as an asset in a subsequent period.
Amortization expense is recognized in net income in the expense category
consistent with the function of the intangible asset. The assets’ useful lives are
reviewed, and adjusted if appropriate, at the end of each reporting period. Changes in the expected useful life or the expected pattern of consumption of future economic benefits embodied in the
asset are accounted for by changing the amortization period or method, as appropriate, and are treated as changes in accounting estimates.
All
business combinations are accounted for using the purchase method. Identifiable intangible assets are recognized separately from goodwill. Goodwill is carried at cost, is no longer amortized and represents the excess of the cost of an acquisition
over the fair value of the company’s share of the net identifiable assets of the acquired subsidiary or equity method investee at the date of acquisition. Separately recognized goodwill is carried at cost less accumulated amortization and
impairment losses. Gains and losses on the disposal of an entity include the carrying amount of goodwill relating to the entity sold.
Accounting Estimates and Judgments
An intangible asset is defined as being identifiable, able to bring future economic benefits to the company and controlled by it. An asset meets the
identifiability criterion when it is separable or arises from contractual rights. Judgment is necessary to determine whether expenditures made by the company on non-tangible items represent intangible assets eligible for capitalization. Finite-lived
intangible assets are accounted for at cost and are amortized on a straight-line basis over their estimated useful lives.
Goodwill is
allocated to cash-generating units or groups of cash-generating units for the purpose of impairment testing based on the level at which it is monitored by management, and not at a level higher than an operating segment. The allocation is made
to those cash-generating units or groups of cash-generating units that are expected to benefit from the business combination in which the goodwill arose.
II-20
|
|
|
| |
|
In millions of US dollars except as otherwise
noted |
NOTE 8 Intangible Assets continued
|
| Supporting Information
Goodwill is the
only intangible asset with an indefinite useful life recognized by the company. All other intangible assets have finite useful lives. |
|
|
|
|
|
|
|
|
|
|
|
|
|
| |
|
Goodwill 1 |
|
|
Other |
|
|
Total |
|
| Carrying amount – December 31, 2010 |
|
$ |
97 |
|
|
$ |
18 |
|
|
$ |
115 |
|
| Additions |
|
|
– |
|
|
|
2 |
|
|
|
2 |
|
| Amortization |
|
|
– |
|
|
|
(2 |
) |
|
|
(2 |
) |
| Carrying amount – December 31, 2011 |
|
$ |
97 |
|
|
$ |
18 |
|
|
$ |
115 |
|
| Balance at December 31, 2011 comprised of: |
|
|
|
|
|
|
|
|
|
|
|
|
| Cost |
|
$ |
104 |
|
|
$ |
55 |
|
|
$ |
159 |
|
| Accumulated amortization |
|
|
(7 |
) |
|
|
(37 |
) |
|
|
(44 |
) |
| Carrying amount |
|
$ |
97 |
|
|
$ |
18 |
|
|
$ |
115 |
|
| Carrying amount – January 1, 2010 |
|
$ |
97 |
|
|
$ |
20 |
|
|
$ |
117 |
|
| Additions |
|
|
– |
|
|
|
1 |
|
|
|
1 |
|
| Amortization |
|
|
– |
|
|
|
(3 |
) |
|
|
(3 |
) |
| Carrying amount – December 31, 2010 |
|
$ |
97 |
|
|
$ |
18 |
|
|
$ |
115 |
|
| Balance at December 31, 2010 comprised of: |
|
|
|
|
|
|
|
|
|
|
|
|
| Cost |
|
$ |
104 |
|
|
$ |
53 |
|
|
$ |
157 |
|
| Accumulated amortization |
|
|
(7 |
) |
|
|
(35 |
) |
|
|
(42 |
) |
| Carrying amount |
|
$ |
97 |
|
|
$ |
18 |
|
|
$ |
115 |
|
| Balance at January 1, 2010 comprised of: |
|
|
|
|
|
|
|
|
|
|
|
|
| Cost |
|
$ |
104 |
|
|
$ |
51 |
|
|
$ |
155 |
|
| Accumulated amortization |
|
|
(7 |
) |
|
|
(31 |
) |
|
|
(38 |
) |
| Carrying amount |
|
$ |
97 |
|
|
$ |
20 |
|
|
$ |
117 |
|
| 1 |
The company’s aggregate carrying amount of goodwill is $97 (December 31,
2010 – $97; January 1, 2010 – $97), representing 1.2 percent of shareholders’ equity at December 31, 2011 (December 31, 2010 – 1.5 percent; January 1, 2010 – 1.5 percent). Substantially all of the
company’s recorded goodwill relates to the nitrogen segment. |
|
|
|
|
|
|
|
|
|
|
|
|
|
| |
|
December 31,
2011 |
|
|
December 31,
2010 |
|
|
January 1,
2010 |
|
| Commercial paper |
|
$ |
829 |
|
|
$ |
1,274 |
|
|
$ |
727 |
|
The amount available under the commercial paper program is limited to the availability of backup funds under the credit
facilities.
The company has a $75 unsecured line of credit available for short-term financing. Net of letters of credit of $23 and direct
borrowings of $NIL, $52 was available at December 31, 2011 (December 31, 2010 – $66; January 1, 2010 – $42). The line of credit is available through August 2012.
The line of credit is subject to financial tests and other covenants. The principal covenants require a
debt-to-capital ratio of less than or equal to 0.60:1, a long-term-debt-to-EBITDA (as defined in the agreement to be earnings before interest, income taxes, provincial mining and other taxes, depreciation, amortization and other non-cash expenses,
and unrealized gains and losses in respect of hedging instruments) ratio of less than or equal to 3.5:1 and debt of subsidiaries not to exceed $650. The line of credit is subject to other customary covenants and events of default, including an event
of default for non-payment of other debt in excess of CDN $40. Non-compliance with such covenants could result in accelerated payment of amounts due under the line of credit, and its termination. The company was in compliance with the
above-mentioned covenants at December 31, 2011.
II-21
|
|
|
| |
|
In millions of US dollars except as otherwise
noted |
|
|
|
|
|
| NOTE 10 |
|
|
|
PAYABLES AND ACCRUED CHARGES |
|
|
|
|
|
|
|
|
|
|
|
|
|
| |
|
December 31,
2011 |
|
|
December 31,
2010 |
|
|
January 1,
2010 |
|
| Trade accounts |
|
$ |
578 |
|
|
$ |
592 |
|
|
$ |
509 |
|
| Income taxes (Note 21) |
|
|
271 |
|
|
|
167 |
|
|
|
17 |
|
| Accrued compensation |
|
|
111 |
|
|
|
120 |
|
|
|
45 |
|
| Deferred revenue |
|
|
67 |
|
|
|
53 |
|
|
|
34 |
|
| Dividends |
|
|
60 |
|
|
|
28 |
|
|
|
30 |
|
| Accrued interest |
|
|
42 |
|
|
|
49 |
|
|
|
48 |
|
| Other taxes |
|
|
34 |
|
|
|
47 |
|
|
|
9 |
|
| Current portion of asset retirement obligations and accrued environmental costs (Note 14) |
|
|
26 |
|
|
|
26 |
|
|
|
40 |
|
| Accrued deferred share units |
|
|
25 |
|
|
|
30 |
|
|
|
20 |
|
| Current portion of pension and other post-retirement benefits (Note 13) |
|
|
8 |
|
|
|
9 |
|
|
|
8 |
|
| Other payables and other accrued charges |
|
|
73 |
|
|
|
77 |
|
|
|
57 |
|
| |
|
$ |
1,295 |
|
|
$ |
1,198 |
|
|
$ |
817 |
|
|
|
|
|
|
| NOTE 11 |
|
|
|
DERIVATIVE INSTRUMENTS |
Accounting Policies
Derivative financial instruments are used by the company to manage its exposure to
commodity price, exchange rate and interest rate fluctuations. The company recognizes its derivative instruments at fair value on the consolidated statements of financial position where appropriate. Contracts to buy or sell a non-financial item that
can be settled net in cash or another financial instrument, or by exchanging financial instruments, as if the contracts were financial instruments (except contracts that were entered into and continue to be held for the purpose of the receipt
or delivery of a non-financial item in accordance with expected purchase, sale or usage requirements), are accounted for as derivative financial instruments.
The accounting for changes in the fair value (i.e., gains or losses) of a derivative instrument depends on whether it has been designated and qualifies as part of a hedging relationship. For instruments
designated as fair value hedges, the effective portion of the change in the fair value of the derivative is offset in net income against the change in fair value, attributed to the risk being hedged, of the underlying hedged asset, liability or
firm commitment. For cash flow hedges, the effective portion of the change in the fair value of the derivative is accumulated in OCI until the variability in cash flows being hedged is recognized in net income in future accounting periods.
Ineffective portions of hedges are recorded in net income in the current period. The change in fair value of derivative instruments not designated as hedges is recorded in net income in the current period.
The company’s policy is not to use derivative instruments for trading or speculative purposes, although it may choose not to designate an economic
hedging relationship as an accounting hedge. The company formally documents all relationships between hedging instruments and hedged items,
as well as its risk management objective and strategy for undertaking the hedge transaction. This process includes linking derivatives to specific assets and liabilities or to specific firm
commitments or forecast transactions. The company also assesses, both at the hedge’s inception and on an ongoing basis, whether the derivatives used in hedging transactions are expected to be or were, as appropriate, highly effective in
offsetting changes in fair values of hedged items. Hedge effectiveness related to the company’s natural gas hedges is assessed on a prospective and retrospective basis using regression analyses.
A hedging relationship may be terminated because the hedge ceases to be effective, the underlying asset or liability being hedged is derecognized, or the
derivative instrument is no longer designated as a hedging instrument. In such instances, the difference between the fair value and the accrued value of the hedging derivatives upon termination is deferred and recognized in net income on the same
basis that gains, losses, revenue and expenses of the previously hedged item are recognized. If a cash flow hedging relationship is terminated because it is no longer probable that the anticipated transaction will occur, then the net gain or loss
accumulated in OCI is recognized in current period net income.
Accounting Estimates and Judgments
Most derivative instruments are recorded on the statements of financial position at fair value and must be remeasured at each reporting date; changes in the fair value are recorded in either net income or
OCI. Uncertainties, estimates and use of judgment inherent in applying the standards include the assessment of contracts as derivative instruments and for embedded derivatives, application of hedge accounting and valuation of derivatives
at fair value (discussed further in Note 24).
II-22
|
|
|
| |
|
In millions of US dollars except as otherwise
noted |
NOTE 11 Derivative Instruments continued
In determining whether a contract represents a derivative or contains an embedded derivative, the most
significant area where judgment has been applied pertains to the determination as to whether the contract can be settled net, one of the criteria in determining whether a contract for a non-financial asset is considered a derivative and accounted
for as such. Judgment is also applied in determining whether an embedded derivative is closely related to the host contract, in which case bifurcation and separate accounting are not necessary.
To obtain and maintain hedge accounting for its natural gas derivative instruments, the company must be able to establish that the hedging instrument is
effective at offsetting the risk of the hedged item both retrospectively and prospectively, and ensure documentation meets stringent requirements. The process to test effectiveness requires the application of judgment and estimation, including
determining the number of data points to test to ensure adequate and appropriate measurement to confirm or dispel hedge effectiveness and valuation of data within effectiveness tests where external existing data available do not perfectly match
the company’s circumstances. Judgment and estimation are also used to assess credit risk separately in the company’s hedge effectiveness testing.
Supporting Information
Significant recent derivatives included the following:
| Ÿ |
|
Natural gas futures, swaps and option agreements to manage the cost of natural gas, generally designated as cash flow hedges of anticipated
transactions. The portion of gain or loss on derivative instruments designated as cash flow hedges that is deferred in AOCI is reclassified into cost of goods sold when the product containing the hedged item impacts earnings. Any hedge
ineffectiveness is recorded in cost of goods sold in the current period. |
| Ÿ |
|
Foreign currency forward contracts for the primary purpose of limiting exposure to exchange rate fluctuations relating to expenditures denominated in
currencies other than the US dollar and foreign currency swap contracts to limit exposure to exchange rate fluctuations relating to Canadian dollar-denominated commercial paper. These contracts are not designated as hedging instruments for
accounting purposes. Accordingly, they are recorded at fair value with changes in fair value recognized through other income or other expenses, as applicable, in net income. |
|
|
|
|
|
|
|
|
|
|
|
|
|
| |
|
December 31, 2011 |
|
| |
|
Assets |
|
|
Liabilities |
|
|
Net |
|
| Natural gas hedging derivatives |
|
$ |
6 |
|
|
$ |
271 |
|
|
$ |
(265 |
) |
| Foreign currency derivatives |
|
|
4 |
|
|
|
– |
|
|
|
4 |
|
| Total |
|
|
10 |
|
|
|
271 |
|
|
|
(261 |
) |
| Less current portion |
|
|
(4 |
) |
|
|
(67 |
) |
|
|
63 |
|
| Long-term portion |
|
$ |
6 |
|
|
$ |
204 |
|
|
$ |
(198 |
) |
|
|
|
|
|
|
|
|
|
|
|
|
|
| |
|
December 31, 2010 |
|
| |
|
Assets |
|
|
Liabilities |
|
|
Net |
|
| Natural gas hedging derivatives |
|
$ |
– |
|
|
$ |
279 |
|
|
$ |
(279 |
) |
| Foreign currency derivatives |
|
|
5 |
|
|
|
– |
|
|
|
5 |
|
| Total |
|
|
5 |
|
|
|
279 |
|
|
|
(274 |
) |
| Less current portion |
|
|
(5 |
) |
|
|
(75 |
) |
|
|
70 |
|
| Long-term portion |
|
$ |
– |
|
|
$ |
204 |
|
|
$ |
(204 |
) |
|
|
|
|
|
|
|
|
|
|
|
|
|
| |
|
January 1, 2010 |
|
| |
|
Assets |
|
|
Liabilities |
|
|
Net |
|
| Natural gas hedging derivatives |
|
$ |
4 |
|
|
$ |
175 |
|
|
$ |
(171) |
|
| Foreign currency derivatives |
|
|
5 |
|
|
|
– |
|
|
|
5 |
|
| Total |
|
|
9 |
|
|
|
175 |
|
|
|
(166) |
|
| Less current portion |
|
|
(6) |
|
|
|
(52) |
|
|
|
46 |
|
| Long-term portion |
|
$ |
3 |
|
|
$ |
123 |
|
|
$ |
(120) |
|
As at December 31, 2011, the company had natural gas derivatives qualifying for hedge accounting in the form of swaps,
which represented a notional amount of 40 million MMBtu with maturities in 2012 through 2019. At December 31, 2010, the notional amount of swaps was 103 million MMBtu with maturities in 2011 through 2019. At January 1, 2010, the
notional amount of swaps was 123 million MMBtu with maturities in 2010 through 2019.
As at December 31, 2011, the company had
entered into foreign currency forward contracts to sell US dollars and receive Canadian dollars in the notional amount of $160 (December 31, 2010 – $170, January 1, 2010 – $140) at an average exchange rate of 1.0437 (December 31, 2010
– 1.0170, January 1, 2010 – 1.0681) per US dollar with maturities in 2012. At December 31, 2011, the company had no foreign currency swaps to sell US dollars and receive Canadian dollars (notional amount at December 31,
2010 – $69, January 1, 2010 – $263; average exchange rate at December 31, 2010 – 1.0174, January 1, 2010 – 1.0551 per US dollar).
For the year ended December 31, 2011, losses before taxes of $62 were recognized in OCI (2010 – $191). For the year ended December 31, 2011, losses before taxes of $76 (2010 –
$85) were reclassified from AOCI and recognized in cost of goods sold excluding ineffectiveness, which changed these losses by $NIL in both years. Of the losses before taxes at December 31, 2011, approximately $68
(2010 – $76) will be reclassified to cost of goods sold within the next 12 months. See Note 24 for a description of how the company determined fair value for its derivative instruments.
II-23
|
|
|
| |
|
In millions of US dollars except as otherwise
noted |
Accounting Policy
Issue costs of long-term debt obligations and gains and losses on interest rate swaps
qualifying for hedge accounting are capitalized to long-term obligations and are amortized to expense over the term of the related liability using the effective interest method.
Supporting Information
|
|
|
|
|
|
|
|
|
|
|
|
|
| |
|
December 31,
2011 |
|
|
December 31,
2010 |
|
|
January 1,
2010 |
|
| Senior notes 1 |
|
|
|
|
|
|
|
|
|
|
|
|
| 7.750% notes due May 31, 2011 |
|
$ |
– |
|
|
$ |
600 |
|
|
$ |
600 |
|
| 4.875% notes due March 1, 2013 |
|
|
250 |
|
|
|
250 |
|
|
|
250 |
|
| 5.250% notes due May 15, 2014 |
|
|
500 |
|
|
|
500 |
|
|
|
500 |
|
| 3.750% notes due September 30, 2015 |
|
|
500 |
|
|
|
500 |
|
|
|
500 |
|
| 3.250% notes due December 1, 2017 |
|
|
500 |
|
|
|
500 |
|
|
|
– |
|
| 6.500% notes due May 15, 2019 |
|
|
500 |
|
|
|
500 |
|
|
|
500 |
|
| 4.875% notes due March 30, 2020 |
|
|
500 |
|
|
|
500 |
|
|
|
500 |
|
| 5.875% notes due December 1, 2036 |
|
|
500 |
|
|
|
500 |
|
|
|
500 |
|
| 5.625% notes due December 1, 2040 |
|
|
500 |
|
|
|
500 |
|
|
|
– |
|
| Other |
|
|
7 |
|
|
|
7 |
|
|
|
8 |
|
|
|
|
3,757 |
|
|
|
4,357 |
|
|
|
3,358 |
|
| Less net unamortized debt costs |
|
|
(49 |
) |
|
|
(54 |
) |
|
|
(42 |
) |
| Add unamortized interest rate swap gains |
|
|
– |
|
|
|
1 |
|
|
|
2 |
|
|
|
|
3,708 |
|
|
|
4,304 |
|
|
|
3,318 |
|
| Less current maturities |
|
|
(7 |
) |
|
|
(602 |
) |
|
|
(2 |
) |
| Add current portion of amortization |
|
|
4 |
|
|
|
5 |
|
|
|
3 |
|
| |
|
$ |
3,705 |
|
|
$ |
3,707 |
|
|
$ |
3,319 |
|
| 1 |
Each series of senior notes is unsecured and has no sinking fund requirements prior to maturity. Each series is redeemable, in whole or in part, at the
company’s option, at any time prior to maturity for a price not less than the principal amount of the notes to be redeemed, plus accrued and unpaid interest. Under certain conditions related to a change in control, the company is required to
make an offer to purchase all, or any part, of the senior notes other than those maturing in 2013 at 101 percent of the principal amount of the notes repurchased, plus accrued and unpaid interest. |
The company has two long-term revolving credit facilities that provide for unsecured borrowings: a $750 credit
facility that matures on May 31, 2013 and a $2,750 credit facility that matures on December 11, 2016. No borrowings were outstanding under these credit facilities at December 31, 2011, December 31, 2010 or January 1,
2010. These credit facilities also backstop the company’s commercial paper program and the availability of borrowings is reduced by the amount of commercial paper outstanding (December 31, 2011 – $829; December 31, 2010 – $1,272;
January 1, 2010 – $725). During the year ended December 31, 2011, the company borrowed and repaid $NIL (2010 – $810) under its long-term credit facilities. Interest rates on borrowings under its credit facilities in 2010 ranged
from 0.60 percent to 3.75 percent.
Other long-term debt in the above table includes a net financial liability of $6 (December 31, 2010
– $6; January 1, 2010 – $6) pursuant to back-to-back loan arrangements involving certain financial assets and financial liabilities.
The company has presented financial assets of $505 and financial liabilities of $511 on a net basis related to these arrangements because a legal right to set-off exists, and it intends to settle
with the same party on a net basis.
The senior notes are not subject to any financial test covenants but are subject to certain customary
covenants (including limitations on liens and on sale and leaseback transactions) and events of default, including an event of default for acceleration of other debt in excess of $50. Principal covenants and events of default under the $750 credit
facility are the same as those under the line of credit described in Note 9 with the addition of a minimum tangible net worth covenant in an amount greater than or equal to $1,250.
Principal covenants and events of default under the $2,750 credit facility are as follows: a debt-to-capital ratio of less than or equal to 0.60:1, a long-term-debt-to-EBITDA (as defined in the agreement to
be earnings before interest, income taxes, provincial mining and other taxes, depreciation, amortization
II-24
|
|
|
| |
|
In millions of US dollars except as otherwise
noted |
NOTE 12 Long-Term Debt continued
and other non-cash expenses, and unrealized gains and losses in respect of hedging instruments) ratio of less than or equal to 3.5:1, debt of subsidiaries not to exceed $1,000 and a $300
permitted lien basket. The credit facility is subject to other customary covenants and events of default, including an event of default for non-payment of other debt in excess of CDN $100. Non-compliance with such covenants could result in
accelerated payment of amounts due under the credit facility, and its termination. The back-to-back loan arrangements are not subject to any financial test covenants but are subject to certain customary covenants and events of default, including,
for other long-term debt, an event of default for non-payment of other debt in excess of $25. Non-compliance with such covenants could result in accelerated
payment of the related debt. The company was in compliance with the above-mentioned covenants at December 31, 2011.
Long-term debt obligations at December 31, 2011 will mature as follows:
|
|
|
|
|
| 2012 |
|
$ |
7 |
|
| 2013 |
|
|
250 |
|
| 2014 |
|
|
500 |
|
| 2015 |
|
|
500 |
|
| 2016 |
|
|
– |
|
| Subsequent years |
|
|
2,500 |
|
| |
|
$ |
3,757 |
|
|
|
|
|
|
| NOTE 13 |
|
|
|
PENSION AND OTHER POST-RETIREMENT BENEFITS |
Accounting Policies
The company offers a number of benefit plans that provide pension and other
post-retirement benefits to qualified employees: defined benefit pension plans, supplemental pension plans, defined contribution plans and health, disability, dental and life insurance plans.
Defined benefit plans
The company accrues its obligations under employee benefit plans and the related costs,
net of plan assets and unvested prior service costs. The cost of pensions and other retirement benefits earned by employees generally is actuarially determined using the projected unit credit method and management’s best estimate of expected
plan investment performance, salary escalation, retirement ages of employees and expected health-care costs. Actuaries perform valuations on a regular basis to determine the actuarial present value of the accrued pension and other post-employment
benefits. For the purpose of calculating the expected return on plan assets, such assets are valued at fair value. Prior service costs from plan amendments are deferred and amortized on a straight-line basis over the average period until the
benefits become vested. However, to the extent that benefits are already vested, such prior service costs are recognized immediately.
Actuarial gains (losses) arise from the difference between the actual rate of return on plan assets for a period and the expected long-term rate of return on
plan assets for that period, or from changes in actuarial assumptions used to determine the defined benefit obligation. The company’s policy is to recognize in OCI all actuarial gains (losses) for defined benefit plans immediately in the period
in which they arise.
When the restructuring of a benefit plan simultaneously gives rise to both a curtailment and a settlement of obligation, the
curtailment is accounted for prior to the settlement.
Pension and other post-employment benefit expense includes, as applicable, the net of management’s best
estimate of the cost of benefits provided, interest cost of projected benefits, expected return on plan assets, prior service costs and the effect of any curtailments or settlements.
Defined contribution plans
Defined contribution plan costs are recognized in net income for services rendered by
employees during the period.
Accounting Estimates and
Judgments
The company sponsors plans that provide pension and other
post-retirement benefits for most of its employees. The calculation of employee benefit plan expenses and obligations depends on assumptions such as discount rates, expected rates of return on assets, health-care cost trend rates, projected salary
increases, retirement age, mortality and termination rates. These assumptions are determined by management and are reviewed annually by the company’s independent actuaries.
The company’s discount rate assumption reflects the weighted average interest rate at which the pension and other post-retirement liabilities could be effectively settled at the measurement date. The
rate varies by country. The company determines the discount rate using a yield curve approach. Based on the respective plans’ demographics, expected future pension benefits and medical claims payments are measured and discounted to determine
the present value of the expected future cash flows. The cash flows are discounted using yields on high-quality AA-rated non-callable bonds with cash flows of similar timing where there is a deep market for such bonds. Where the company does not
believe there is a deep market for such bonds (such as for terms in excess of 10 years in Canada), the cash flows are discounted using a yield curve derived from yields on provincial bonds rated AA or better to which a spread adjustment is added to
reflect the additional risk of corporate bonds.
II-25
|
|
|
| |
|
In millions of US dollars except as otherwise
noted |
NOTE 13 Pension and Other Post-Retirement Benefits continued
The resulting rates are used by the company to determine the final discount rate. The rate selected for the December 31, 2011 measurement date will be used to determine expense for fiscal
2012 unless significant market fluctuations require an update during 2012, at which time a new rate will be selected.
The expected long-term rate
of return on assets is determined using a building block approach. The expected real rate of return for each individual asset class is determined based on expected future performance. These rates are weighted based on the current asset portfolio. A
separate determination is made of the underlying impact of expenses, inflation, rebalancing, diversification and the actively managed portfolio premium. The resulting total expected asset return is compared to the historical returns achieved by the
portfolio. Based on these input items, the company selects a final rate.
|
| The assumptions used to determine the benefit obligation and expense for the company’s significant plans were as follows (weighted average as of
December 31): |
|
|
|
|
|
|
|
|
|
|
|
|
|
|
|
|
|
| |
|
Pension |
|
|
Other |
|
| |
|
2011 |
|
|
2010 |
|
|
2011 |
|
|
2010 |
|
| Discount rate – obligation, % |
|
|
4.60 |
|
|
|
5.45 |
|
|
|
4.60 |
|
|
|
5.45 |
|
| Discount rate – expense, % |
|
|
5.45
|
1 |
|
|
5.85 |
|
|
|
5.45
|
1 |
|
|
5.85 |
|
| Long-term rate of return on assets, % |
|
|
7.00 |
|
|
|
7.00 |
|
|
|
n/a |
|
|
|
n/a |
|
| Rate of increase in compensation levels, % |
|
|
4.00 |
|
|
|
4.00 |
|
|
|
n/a |
|
|
|
n/a |
|
| 1 |
Discount rate changed from 5.45 percent to 4.75 percent, effective October 1, 2011, as a result of significant market fluctuations that had occurred
since the prior year-end. |
Assumptions regarding future mortality experience are set based on actuarial advice in accordance with
published statistics and experience in each country.
The average remaining service period of the active employees covered by the company’s
pension plans is 12.4 years (2010 – 11.6 years). The average remaining service period of the active employees covered by the company’s other benefit plans is 12.9 years (2010 – 12.1 years).
The assumed health-care cost trend rate for the company’s significant retiree medical plan is 6 percent. Effective January 1, 2004, the largest
retiree medical plan limits the company’s share of annual medical cost increases to 75 percent of the first 6 percent of total medical inflation for recent and future non-union retirees. Any cost increases in excess of this
amount are funded by retiree contributions.
Sensitivity of
Assumptions
Sensitivity to changes in key assumptions for the
company’s pension and other post-retirement benefit plans would have been as follows:
|
|
|
|
|
|
|
|
|
|
|
|
|
|
|
|
|
| |
|
2011 |
|
|
2010 |
|
| |
|
Benefit
Obligation |
|
|
Expense
in
Income
Before Income
Taxes |
|
|
Benefit
Obligation |
|
|
Expense
in
Income
Before Income
Taxes |
|
| As reported |
|
$ |
1,417 |
|
|
|
|
|
|
$ |
1,191 |
|
|
|
|
|
| Discount rate |
|
|
|
|
|
|
|
|
|
|
|
|
|
|
|
|
| Impact of 1.0 percentage point decrease |
|
|
232 |
|
|
$ |
8 |
|
|
|
179 |
|
|
$ |
1 |
|
| Impact of 1.0 percentage point increase |
|
|
(183 |
) |
|
|
(7 |
) |
|
|
(149 |
) |
|
|
(4 |
) |
| Expected long-term rate of return |
|
|
|
|
|
|
|
|
|
|
|
|
|
|
|
|
| Impact of 1.0 percentage point decrease |
|
|
n/a |
|
|
|
7 |
|
|
|
n/a |
|
|
|
7 |
|
| Impact of 1.0 percentage point increase |
|
|
n/a |
|
|
|
(7 |
) |
|
|
n/a |
|
|
|
(5 |
) |
| Rate of compensation increase |
|
|
|
|
|
|
|
|
|
|
|
|
|
|
|
|
| Impact of 1.0 percentage point decrease |
|
|
(24 |
) |
|
|
(3 |
) |
|
|
(19 |
) |
|
|
(1 |
) |
| Impact of 1.0 percentage point increase |
|
|
27 |
|
|
|
3 |
|
|
|
21 |
|
|
|
1 |
|
| Medical cost trend rate |
|
|
|
|
|
|
|
|
|
|
|
|
|
|
|
|
| Impact of 1.0 percentage point decrease |
|
|
(32 |
) |
|
|
(3 |
) |
|
|
(38 |
) |
|
|
(4 |
) |
| Impact of 1.0 percentage point increase |
|
|
14 |
|
|
|
4 |
|
|
|
17 |
|
|
|
5 |
|
II-26
|
|
|
| |
|
In millions of US dollars except as otherwise
noted |
NOTE 13 Pension and Other Post-Retirement Benefits continued
The above sensitivities are hypothetical and should be used with caution. Changes in amounts based on a
1.0 percentage point variation in assumptions generally cannot be extrapolated because the relationship of the change in assumption to the change in amounts may not be linear. The sensitivities have been calculated independently of changes
in other key variables. Changes in one factor may result in changes in another, which could amplify or reduce certain sensitivities.
Supporting Information
Substantially all employees of the company are
participants in either a defined contribution or a defined benefit pension plan. Benefits are based on a combination of years of service and/or compensation levels, depending on the plan.
The company has established a supplemental defined benefit retirement income plan for senior management that is unfunded, non-contributory and provides a
supplementary pension benefit. It is provided for by charges to earnings sufficient to meet the projected benefit obligation.
United States
Substantially all employees of the company are participants in either a defined contribution or a defined benefit pension plan. Benefits are based on a combination of years of service and compensation
levels, depending on the plan. Contributions to the US plans are made to meet or exceed minimum funding requirements of the Employee Retirement Income Security Act of 1974 (“ERISA”) and associated Internal Revenue Service regulations and
procedures.
Trinidad
Substantially all employees of the company are participants in both a defined
contribution and a defined benefit pension plan. Benefits are based on a combination of years of service and compensation levels, depending on the plan.
Other post-retirement plans
The company provides contributory health-care plans and non-contributory life insurance benefits for certain retired employees. These plans contain certain
cost-sharing features such as deductibles and coinsurance, and are unfunded, with benefits subject to change.
Defined benefit plans
The components of total expense recognized in the consolidated statements of income for
the company’s pension and other post-retirement benefit plans, computed actuarially, were as follows:
|
|
|
|
|
|
|
|
|
|
|
|
|
|
|
|
|
|
|
|
|
|
|
|
|
|
|
|
|
|
|
|
|
|
|
| |
|
Pension |
|
|
|
|
Other |
|
|
|
|
Total |
|
| |
|
2011 |
|
|
|
|
2010 |
|
|
|
|
2011 |
|
|
|
|
2010 |
|
|
|
|
2011 |
|
|
|
|
2010 |
|
| Current service cost for benefits earned during the year |
|
$ |
24 |
|
|
|
|
$ |
20 |
|
|
|
|
$ |
8 |
|
|
|
|
$ |
7 |
|
|
|
|
$ |
32 |
|
|
|
|
$ |
27 |
|
| Interest cost on benefit obligations |
|
|
49 |
|
|
|
|
|
47 |
|
|
|
|
|
16 |
|
|
|
|
|
16 |
|
|
|
|
|
65 |
|
|
|
|
|
63 |
|
| Expected return on plan assets |
|
|
(53 |
) |
|
|
|
|
(47 |
) |
|
|
|
|
– |
|
|
|
|
|
– |
|
|
|
|
|
(53 |
) |
|
|
|
|
(47 |
) |
| Prior service costs |
|
|
4 |
|
|
|
|
|
– |
|
|
|
|
|
(1 |
) |
|
|
|
|
(1 |
) |
|
|
|
|
3 |
|
|
|
|
|
(1 |
) |
| Plan settlements |
|
|
– |
|
|
|
|
|
(1 |
) |
|
|
|
|
– |
|
|
|
|
|
– |
|
|
|
|
|
– |
|
|
|
|
|
(1 |
) |
| Total expense recognized in net income |
|
$ |
24 |
|
|
|
|
$ |
19 |
|
|
|
|
$ |
23 |
|
|
|
|
$ |
22 |
|
|
|
|
$ |
47 |
|
|
|
|
$ |
41 |
|
Of the total expense recognized in net income, $38 (2010 – $33) was included in cost of goods sold and $9
(2010 – $8) in selling and administrative expenses.
(Gains) losses relating to the company’s pension and other post-retirement benefit
plans recognized in OCI in the consolidated statements of comprehensive income were as follows:
|
|
|
|
|
|
|
|
|
|
|
|
|
|
|
|
|
|
|
|
|
|
|
|
|
|
|
|
|
|
|
|
|
|
|
| |
|
Pension |
|
|
|
|
Other |
|
|
|
|
Total |
|
| |
|
2011 |
|
|
|
|
2010 |
|
|
|
|
2011 |
|
|
|
|
2010 |
|
|
|
|
2011 |
|
|
|
|
2010 |
|
| Actuarial loss on benefit obligations |
|
$ |
116 |
|
|
|
|
$ |
66 |
|
|
|
|
$ |
53 |
|
|
|
|
$ |
7 |
|
|
|
|
$ |
169 |
|
|
|
|
$ |
73 |
|
| Actuarial loss (gain) on plan assets |
|
|
42 |
|
|
|
|
|
(37 |
) |
|
|
|
|
– |
|
|
|
|
|
– |
|
|
|
|
|
42 |
|
|
|
|
|
(37 |
) |
| Total loss recognized in OCI |
|
$ |
158 |
|
|
|
|
$ |
29 |
|
|
|
|
$ |
53 |
|
|
|
|
$ |
7 |
|
|
|
|
$ |
211 |
|
|
|
|
$ |
36 |
|
The cumulative amount of actuarial losses recognized in OCI since the company’s adoption of IFRS on January 1, 2010
was $247 at December 31, 2011 (December 31, 2010 – $36; January 1, 2010 – $NIL).
II-27
|
|
|
| |
|
In millions of US dollars except as otherwise
noted |
NOTE 13 Pension and Other Post-Retirement Benefits continued
The change in benefit obligations and the change in plan assets for the above pension and other
post-retirement plans were as follows:
|
|
|
|
|
|
|
|
|
|
|
|
|
|
|
|
|
|
|
|
|
|
|
|
|
|
|
|
|
|
|
|
|
|
|
|
|
| |
|
|
|
|
Pension |
|
|
|
|
|
|
|
|
Other |
|
|
|
|
|
|
|
|
Total |
|
|
|
|
| |
|
Dec 31,
2011 |
|
|
Dec 31,
2010 |
|
|
Jan 1,
2010 |
|
|
Dec 31,
2011 |
|
|
Dec 31,
2010 |
|
|
Jan 1,
2010 |
|
|
Dec 31,
2011 |
|
|
Dec 31,
2010 |
|
|
Jan 1,
2010 |
|
| Change in benefit obligations |
|
|
|
|
|
|
|
|
|
|
|
|
|
|
|
|
|
|
|
|
|
|
|
|
|
|
|
|
|
|
|
|
|
|
|
|
| Balance, beginning of year |
|
$ |
893 |
|
|
$ |
792 |
|
|
|
|
|
|
$ |
298 |
|
|
$ |
276 |
|
|
|
|
|
|
$ |
1,191 |
|
|
$ |
1,068 |
|
|
|
|
|
| Current service cost |
|
|
24 |
|
|
|
20 |
|
|
|
|
|
|
|
8 |
|
|
|
7 |
|
|
|
|
|
|
|
32 |
|
|
|
27 |
|
|
|
|
|
| Interest cost |
|
|
49 |
|
|
|
47 |
|
|
|
|
|
|
|
16 |
|
|
|
16 |
|
|
|
|
|
|
|
65 |
|
|
|
63 |
|
|
|
|
|
| Actuarial loss |
|
|
116 |
|
|
|
66 |
|
|
|
|
|
|
|
53 |
|
|
|
7 |
|
|
|
|
|
|
|
169 |
|
|
|
73 |
|
|
|
|
|
| Foreign exchange rate changes |
|
|
1 |
|
|
|
4 |
|
|
|
|
|
|
|
(1 |
) |
|
|
2 |
|
|
|
|
|
|
|
– |
|
|
|
6 |
|
|
|
|
|
| Contributions by plan participants |
|
|
– |
|
|
|
– |
|
|
|
|
|
|
|
4 |
|
|
|
– |
|
|
|
|
|
|
|
4 |
|
|
|
– |
|
|
|
|
|
| Benefits paid |
|
|
(38 |
) |
|
|
(35 |
) |
|
|
|
|
|
|
(12 |
) |
|
|
(9 |
) |
|
|
|
|
|
|
(50 |
) |
|
|
(44 |
) |
|
|
|
|
| Prior service costs |
|
|
6 |
|
|
|
– |
|
|
|
|
|
|
|
– |
|
|
|
(1 |
) |
|
|
|
|
|
|
6 |
|
|
|
(1 |
) |
|
|
|
|
| Plan settlements |
|
|
– |
|
|
|
(1 |
) |
|
|
|
|
|
|
– |
|
|
|
– |
|
|
|
|
|
|
|
– |
|
|
|
(1 |
) |
|
|
|
|
| Balance, end of year |
|
|
1,051 |
|
|
|
893 |
|
|
$ |
792 |
|
|
|
366 |
|
|
|
298 |
|
|
$ |
276 |
|
|
|
1,417 |
|
|
|
1,191 |
|
|
$ |
1,068 |
|
| Change in plan assets |
|
|
|
|
|
|
|
|
|
|
|
|
|
|
|
|
|
|
|
|
|
|
|
|
|
|
|
|
|
|
|
|
|
|
|
|
| Fair value, beginning of year |
|
|
753 |
|
|
|
649 |
|
|
|
|
|
|
|
– |
|
|
|
– |
|
|
|
|
|
|
|
753 |
|
|
|
649 |
|
|
|
|
|
| Expected return on plan assets |
|
|
53 |
|
|
|
47 |
|
|
|
|
|
|
|
– |
|
|
|
– |
|
|
|
|
|
|
|
53 |
|
|
|
47 |
|
|
|
|
|
| Actuarial (loss) gain |
|
|
(42 |
) |
|
|
37 |
|
|
|
|
|
|
|
– |
|
|
|
– |
|
|
|
|
|
|
|
(42 |
) |
|
|
37 |
|
|
|
|
|
| Foreign exchange rate changes |
|
|
2 |
|
|
|
2 |
|
|
|
|
|
|
|
– |
|
|
|
– |
|
|
|
|
|
|
|
2 |
|
|
|
2 |
|
|
|
|
|
| Contributions by plan participants |
|
|
– |
|
|
|
– |
|
|
|
|
|
|
|
4 |
|
|
|
– |
|
|
|
|
|
|
|
4 |
|
|
|
– |
|
|
|
|
|
| Employer contributions |
|
|
159 |
|
|
|
54 |
|
|
|
|
|
|
|
8 |
|
|
|
9 |
|
|
|
|
|
|
|
167 |
|
|
|
63 |
|
|
|
|
|
| Benefits paid |
|
|
(38 |
) |
|
|
(35 |
) |
|
|
|
|
|
|
(12 |
) |
|
|
(9 |
) |
|
|
|
|
|
|
(50 |
) |
|
|
(44 |
) |
|
|
|
|
| Plan settlements |
|
|
– |
|
|
|
(1 |
) |
|
|
|
|
|
|
– |
|
|
|
– |
|
|
|
|
|
|
|
– |
|
|
|
(1 |
) |
|
|
|
|
| Fair value, end of year |
|
|
887 |
|
|
|
753 |
|
|
|
649 |
|
|
|
– |
|
|
|
– |
|
|
|
– |
|
|
|
887 |
|
|
|
753 |
|
|
|
649 |
|
| Funded status |
|
|
(164 |
) |
|
|
(140 |
) |
|
|
(143 |
) |
|
|
(366 |
) |
|
|
(298 |
) |
|
|
(276 |
) |
|
|
(530 |
) |
|
|
(438 |
) |
|
|
(419 |
) |
| Unvested prior service costs not recognized in statements of financial
position |
|
|
2 |
|
|
|
– |
|
|
|
– |
|
|
|
(12 |
) |
|
|
(13 |
) |
|
|
(15 |
) |
|
|
(10 |
) |
|
|
(13 |
) |
|
|
(15 |
) |
| Pension and other post-retirement benefit liabilities |
|
$ |
(162 |
) |
|
$ |
(140 |
) |
|
$ |
|
(143) |
|
$ |
(378 |
) |
|
$ |
(311 |
) |
|
$ |
|
(291) |
|
$ |
(540 |
) |
|
$ |
(451 |
) |
|
$ |
(434 |
) |
| Balance comprised of: |
|
|
|
|
|
|
|
|
|
|
|
|
|
|
|
|
|
|
|
|
|
|
|
|
|
|
|
|
|
|
|
|
|
|
|
|
| Non-current assets |
|
|
|
|
|
|
|
|
|
|
|
|
|
|
|
|
|
|
|
|
|
|
|
|
|
|
|
|
|
|
|
|
|
|
|
|
| Other assets (Note 7) |
|
$ |
20 |
|
|
$ |
26 |
|
|
$ |
29 |
|
|
$ |
– |
|
|
$ |
– |
|
|
$ |
– |
|
|
$ |
20 |
|
|
$ |
26 |
|
|
$ |
29 |
|
| Current liabilities |
|
|
|
|
|
|
|
|
|
|
|
|
|
|
|
|
|
|
|
|
|
|
|
|
|
|
|
|
|
|
|
|
|
|
|
|
| Payables and accrued charges (Note 10) |
|
|
– |
|
|
|
– |
|
|
|
– |
|
|
|
(8 |
) |
|
|
(9 |
) |
|
|
(8 |
) |
|
|
(8 |
) |
|
|
(9 |
) |
|
|
(8 |
) |
| Non-current liabilities |
|
|
|
|
|
|
|
|
|
|
|
|
|
|
|
|
|
|
|
|
|
|
|
|
|
|
|
|
|
|
|
|
|
|
|
|
| Pension and other post-retirement benefit liabilities |
|
|
(182 |
) |
|
|
(166 |
) |
|
|
(172 |
) |
|
|
(370 |
) |
|
|
(302 |
) |
|
|
(283 |
) |
|
|
(552 |
) |
|
|
(468 |
) |
|
|
(455 |
) |
| Pension and other post-retirement benefit liabilities |
|
$ |
(162 |
) |
|
$ |
(140 |
) |
|
$ |
|
(143) |
|
$ |
(378 |
) |
|
$ |
(311 |
) |
|
$ |
|
(291) |
|
$ |
(540 |
) |
|
$ |
(451 |
) |
|
$ |
(434 |
) |
|
| The present value of funded and unfunded benefit obligations was as follows:
|
|
| |
|
|
|
|
Pension |
|
|
|
|
|
|
|
|
Other |
|
|
|
|
|
|
|
|
Total |
|
|
|
|
| |
|
Dec 31,
2011 |
|
|
Dec 31,
2010 |
|
|
Jan 1,
2010 |
|
|
Dec 31,
2011 |
|
|
Dec 31,
2010 |
|
|
Jan 1,
2010 |
|
|
Dec 31,
2011 |
|
|
Dec 31,
2010 |
|
|
Jan 1,
2010 |
|
| Present value of wholly or partly funded benefit obligations |
|
$ |
993 |
|
|
$ |
838 |
|
|
$ |
745 |
|
|
$ |
– |
|
|
$ |
– |
|
|
$ |
– |
|
|
$ |
993 |
|
|
$ |
838 |
|
|
$ |
745 |
|
| Present value of unfunded benefit obligations |
|
|
58 |
|
|
|
55 |
|
|
|
47 |
|
|
|
366 |
|
|
|
298 |
|
|
|
276 |
|
|
|
424 |
|
|
|
353 |
|
|
|
323 |
|
Letters of credit secured certain of the Canadian unfunded defined benefit plan liabilities as at December 31, 2011 and
2010, and January 1, 2010.
II-28
|
|
|
| |
|
In millions of US dollars except as otherwise
noted |
NOTE 13 Pension and Other Post-Retirement Benefits continued
Plan assets
Approximate asset allocations, by asset category, of the company’s significant pension plans were as follows at December 31:
|
|
|
|
|
|
|
|
|
|
|
|
|
| Asset Category |
|
Target |
|
|
2011 |
|
|
2010 |
|
| Equity securities |
|
|
65% |
|
|
|
49% |
|
|
|
63% |
|
| Debt securities |
|
|
35% |
|
|
|
51% |
|
|
|
37% |
|
| Total |
|
|
100% |
|
|
|
100% |
|
|
|
100% |
|
The company employs a total return on investment approach whereby a mix of equities and fixed income investments is used to
maximize the long-term return of plan assets for a prudent level of risk. Risk tolerance is established through careful consideration of plan liabilities, plan funded status and corporate financial condition. The investment portfolio contains a
diversified blend of equity and fixed income investments.
Furthermore, equity investments are diversified across US and non-US stocks, as well as
growth, value and small and large capitalizations. US equities are also diversified across actively managed and passively invested portfolios. Other assets such as private equity, real estate and hedge funds are not used at this time. Investment
risk is measured and monitored on an ongoing basis through quarterly investment portfolio reviews, annual liability measurements and periodic asset/liability studies. The investment strategy in Trinidad is largely dictated by local investment
restrictions (maximum of 50 percent in equities and 20 percent foreign) and asset availability since the local equity market is small and there is little secondary market activity in debt securities.
Defined contribution plans
All of the company’s Canadian salaried employees and certain hourly employees
participate in the PCS Inc. Savings Plan and may make voluntary contributions. The company contribution provides a minimum of 3 percent (to a maximum of 6 percent) of salary based on company performance. Its contributions in 2011 were
$8 (2010 – $7).
Certain of the company’s Canadian employees participate in the contributory PCS Inc. Pension Plan. The
member contributes to the plan at the rate of 5.5 percent of his/her earnings, or such other percentage amount as may be established by a collective agreement, and the company contributes for each
member at the same rate. The member may also elect to make voluntary additional contributions. The company’s contributions in 2011 were $11 (2010 – $9).
All of the company’s US employees may participate in defined contribution savings plans, which are subject to US federal tax limitations and provide for
voluntary employee salary deduction contributions. The company contribution provides a minimum of 0 percent (to a maximum of 6 percent) of salary depending on employee contributions and company performance. Its 2011 contributions were $8
(2010 – $7).
Certain of the company’s Trinidad employees participate in a defined contribution plan. The company
contributes to the plan at the rate of 4 percent of the earnings of a participating employee. Its contributions in 2011 were $1 (2010 – $1).
Cash payments
Total cash payments for pensions and other post-retirement benefits for 2011, consisting of cash contributed by the company to its funded pension plans, cash payments directly to beneficiaries for its
unfunded other benefit plans and cash contributed to its defined contribution plans, were $195 (2010 – $87). Approximately $85 is expected to be contributed by the company to all pension and post-retirement plans during 2012.
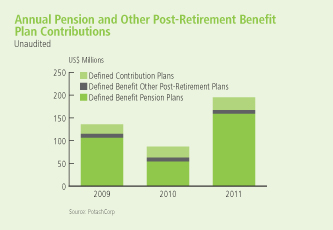
II-29
|
|
|
| |
|
In millions of US dollars except as otherwise
noted |
|
|
|
|
|
| NOTE 14 |
|
|
|
PROVISIONS FOR ASSET RETIREMENT, ENVIRONMENTAL AND OTHER OBLIGATIONS |
Accounting Policies
Provisions are recognized when: the company has a present legal or constructive
obligation as a result of past events; it is probable that an outflow of resources will be required to settle the obligation; and the amount has been reliably estimated. Provisions are not recognized for costs that need to be incurred to operate in
the future or expected future operating losses.
Provisions are measured at the present value of the expenditures expected to be required to
settle the obligation, using a pre-tax risk-free discount rate that reflects current market assessments of the time value of money and the risks specific to the obligation.
Environmental costs that relate to current operations are expensed or capitalized, as appropriate. Environmental costs may be capitalized if they extend the life of the property, increase its capacity,
mitigate or prevent contamination from future operations, or relate to legal or constructive asset retirement obligations. Costs that relate to existing conditions caused by past operations and that do not contribute to current or future revenue
generation are expensed. Provisions for estimated costs are recorded when environmental remedial efforts are likely and the costs can be reasonably estimated. In determining the provisions, the company uses the most current information available,
including similar past experiences, available technology, regulations in effect, the timing of remediation and cost-sharing arrangements.
The
company recognizes provisions for decommissioning obligations (also known as asset retirement obligations) primarily related to mining and mineral activities. The major categories of asset retirement obligations are reclamation and restoration costs
at the company’s potash and phosphate mining operations, including management of materials generated by mining and mineral processing, such as various mine tailings and gypsum; land reclamation and revegetation programs; decommissioning of
underground and surface operating facilities; general cleanup activities aimed at returning the areas to an environmentally acceptable condition; and post-closure care and maintenance.
The present value of a liability for a decommissioning obligation is recognized in the period in which it is incurred if a reasonable estimate of present
value can be made. The associated costs are: capitalized as part of the carrying amount of any related long-lived asset and then amortized over its estimated remaining useful life; capitalized as part of inventory; or expensed in the period. The
best estimate of the amount required to settle the obligation is reviewed at the end of each reporting period and updated to reflect changes in the discount and foreign exchange rates and the amount or timing of the
underlying cash flows. When there is a change in the best estimate, an adjustment is recorded against the carrying value of the provision and any related asset, and the effect is then recognized
in net income over the remaining life of the asset. The increase in the provision due to the passage of time is recognized as a finance cost. A gain or loss may be incurred upon settlement of the liability.
Accounting Estimates and Judgments
The company has recorded provisions relating to asset retirement obligations,
environmental and other matters. Most of these costs will not be settled for a number of years, therefore requiring the company to make estimates over a long period. Environmental laws and regulations and interpretations by regulatory authorities
could change or circumstances affecting the company’s operations could change, either of which could result in significant changes to its current plans. The recorded provisions are based on the company’s best estimate of costs required to
settle the obligations, taking into account the nature, extent and timing of current and proposed reclamation and closure techniques in view of present environmental laws and regulations. It is reasonably possible that the ultimate costs could
change in the future and that changes to these estimates could have a material effect on the company’s consolidated financial statements.
The estimation of asset retirement obligation costs depends on the development of environmentally acceptable closure and post-closure plans. In some cases,
this may require significant research and development to identify preferred methods for such plans that are economically sound and that, in most cases, may not be implemented for several decades. The company uses appropriate technical resources,
including outside consultants, to develop specific site closure and post-closure plans in accordance with the requirements of the various jurisdictions in which it operates. Other than certain land reclamation programs, settlement of the obligations
is typically correlated with mine life estimates. Cash flow payments are expected to occur principally over the next 80 years for the company’s phosphate operations. Payments relating to most potash operations are not expected to occur until
after that time.
Other environmental obligations generally relate to regulatory compliance, environmental management practices associated with
ongoing operations other than mining, site assessment, and remediation of environmental contamination related to the activities of the company and its predecessors, including waste disposal practices and ownership and operation of real property and
facilities.
II-30
|
|
|
| |
|
In millions of US dollars except as otherwise
noted |
NOTE 14 Provisions for Asset Retirement, Environmental and Other Obligations continued
Sensitivity of Assumptions
Sensitivity of asset retirement obligations to changes in the discount rate and
inflation rate on the recorded liability as at December 31, 2011 is as follows:
|
|
|
|
|
|
|
|
|
|
|
|
|
|
|
|
|
|
|
|
|
|
|
|
|
| |
|
Undiscounted |
|
|
Discounted |
|
|
Discount Rate |
|
|
Inflation Rate |
|
| |
|
Cash Flows |
|
|
Cash Flows |
|
|
+0.5% |
|
|
-0.5% |
|
|
+0.5% |
|
|
-0.5% |
|
| Potash obligation 1 |
|
$ |
1,030 |
2 |
|
$ |
28 |
|
|
|
$ (3 |
) |
|
$ |
5 |
|
|
|
$ 6 |
|
|
|
$ (3 |
) |
| Phosphate obligation |
|
|
1,768 |
|
|
|
587 |
|
|
|
(61 |
) |
|
|
82 |
|
|
|
82 |
|
|
|
(62 |
) |
| Nitrogen obligation |
|
|
62 |
|
|
|
2 |
|
|
|
– |
|
|
|
1 |
|
|
|
1 |
|
|
|
– |
|
| 1 |
Stated in Canadian dollars. |
| 2 |
Represents total undiscounted cash flows in the first year of decommissioning. Excludes subsequent years of tailings dissolution and final
decommissioning, which takes an additional 55-264 years. |
Supporting Information
Following is a reconciliation of asset retirement, environmental restoration and other obligations:
|
|
|
|
|
|
|
|
|
|
|
|
|
|
|
|
|
|
|
|
|
| |
|
Asset
Retirement
Obligations |
|
|
Environmental
Restoration
Obligations |
|
|
Subtotal |
|
|
Constructive
Obligation for
Donations |
|
|
Total |
|
| Balance – December 31, 2010 |
|
$ |
456 |
|
|
$ |
25 |
|
|
$ |
481 |
|
|
$ |
5 |
|
|
$ |
486 |
|
| Charged (credited) to income: |
|
|
|
|
|
|
|
|
|
|
|
|
|
|
|
|
|
|
|
|
| New obligations |
|
|
28 |
|
|
|
– |
|
|
|
28 |
|
|
|
10 |
|
|
|
38 |
|
| Change in discount rate |
|
|
38 |
|
|
|
– |
|
|
|
38 |
|
|
|
– |
|
|
|
38 |
|
| Change in other estimates |
|
|
(15 |
) |
|
|
14 |
|
|
|
(1 |
) |
|
|
– |
|
|
|
(1 |
) |
| Unwinding of discount |
|
|
16 |
|
|
|
– |
|
|
|
16 |
|
|
|
– |
|
|
|
16 |
|
| Capitalized to property, plant and equipment |
|
|
|
|
|
|
|
|
|
|
|
|
|
|
|
|
|
|
|
|
| Change in discount rate |
|
|
102 |
|
|
|
– |
|
|
|
102 |
|
|
|
– |
|
|
|
102 |
|
| Change in other estimates |
|
|
20 |
|
|
|
– |
|
|
|
20 |
|
|
|
– |
|
|
|
20 |
|
| Settled during period |
|
|
(27 |
) |
|
|
(15 |
) |
|
|
(42 |
) |
|
|
(2 |
) |
|
|
(44 |
) |
| Exchange differences |
|
|
(1 |
) |
|
|
– |
|
|
|
(1 |
) |
|
|
– |
|
|
|
(1 |
) |
| Balance – December 31, 2011 |
|
$ |
617 |
|
|
$ |
24 |
|
|
$ |
641 |
|
|
$ |
13 |
|
|
$ |
654 |
|
|
|
|
|
|
|
| Balance at December 31, 2011 comprised of: |
|
|
|
|
|
|
|
|
|
|
|
|
|
|
|
|
|
|
|
|
|
|
|
|
|
|
| Current liabilities |
|
|
|
|
|
|
|
|
|
|
|
|
|
|
|
|
|
|
|
|
| Payables and accrued charges (Note 10) |
|
$ |
19 |
|
|
$ |
7 |
|
|
$ |
26 |
|
|
$ |
13 |
|
|
$ |
39 |
|
| Non-current liabilities |
|
|
|
|
|
|
|
|
|
|
|
|
|
|
|
|
|
|
|
|
| Asset retirement obligations and accrued environmental costs |
|
|
598 |
|
|
|
17 |
|
|
|
615 |
|
|
|
– |
|
|
|
615 |
|
| |
|
$ |
617 |
|
|
$ |
24 |
|
|
$ |
641 |
|
|
$ |
13 |
|
|
$ |
654 |
|
II-31
|
|
|
| |
|
In millions of US dollars except as otherwise
noted |
NOTE 14 Provisions for Asset Retirement, Environmental and Other Obligations continued
|
|
|
|
|
|
|
|
|
|
|
|
|
|
|
|
|
|
|
|
|
| |
|
Asset
Retirement
Obligations |
|
|
Environmental
Restoration
Obligations |
|
|
Subtotal |
|
|
Constructive
Obligation
for
Donations |
|
|
Total |
|
| Balance – January 1, 2010 |
|
$ |
309 |
|
|
$ |
31 |
|
|
$ |
340 |
|
|
$ |
2 |
|
|
$ |
342 |
|
| Charged to income: |
|
|
|
|
|
|
|
|
|
|
|
|
|
|
|
|
|
|
|
|
| New obligations |
|
|
5 |
|
|
|
3 |
|
|
|
8 |
|
|
|
5 |
|
|
|
13 |
|
| Change in discount rate |
|
|
37 |
|
|
|
– |
|
|
|
37 |
|
|
|
– |
|
|
|
37 |
|
| Change in other estimates |
|
|
9 |
|
|
|
– |
|
|
|
9 |
|
|
|
– |
|
|
|
9 |
|
| Unwinding of discount |
|
|
11 |
|
|
|
– |
|
|
|
11 |
|
|
|
– |
|
|
|
11 |
|
| Capitalized to property, plant and equipment |
|
|
|
|
|
|
|
|
|
|
|
|
|
|
|
|
|
|
|
|
| Change in discount rate |
|
|
21 |
|
|
|
– |
|
|
|
21 |
|
|
|
– |
|
|
|
21 |
|
| Change in other estimates |
|
|
86 |
|
|
|
– |
|
|
|
86 |
|
|
|
– |
|
|
|
86 |
|
| Settled during period |
|
|
(24 |
) |
|
|
(9 |
) |
|
|
(33 |
) |
|
|
(2 |
) |
|
|
(35 |
) |
| Exchange differences |
|
|
2 |
|
|
|
– |
|
|
|
2 |
|
|
|
– |
|
|
|
2 |
|
| Balance – December 31, 2010 |
|
$ |
456 |
|
|
$ |
25 |
|
|
$ |
481 |
|
|
$ |
5 |
|
|
$ |
486 |
|
|
|
|
|
|
|
| Balance at December 31, 2010 comprised of: |
|
|
|
|
|
|
|
|
|
|
|
|
|
|
|
|
|
|
|
|
|
|
|
|
|
|
| Current liabilities |
|
|
|
|
|
|
|
|
|
|
|
|
|
|
|
|
|
|
|
|
| Payables and accrued charges (Note 10) |
|
$ |
17 |
|
|
$ |
9 |
|
|
$ |
26 |
|
|
$ |
5 |
|
|
$ |
31 |
|
| Non-current liabilities |
|
|
|
|
|
|
|
|
|
|
|
|
|
|
|
|
|
|
|
|
| Asset retirement obligations and accrued environmental costs |
|
|
439 |
|
|
|
16 |
|
|
|
455 |
|
|
|
– |
|
|
|
455 |
|
| |
|
$ |
456 |
|
|
$ |
25 |
|
|
$ |
481 |
|
|
$ |
5 |
|
|
$ |
486 |
|
|
|
|
|
|
|
| Balance at January 1, 2010 comprised of: |
|
|
|
|
|
|
|
|
|
|
|
|
|
|
|
|
|
|
|
|
|
|
|
|
|
|
| Current liabilities |
|
|
|
|
|
|
|
|
|
|
|
|
|
|
|
|
|
|
|
|
| Payables and accrued charges (Note 10) |
|
$ |
22 |
|
|
$ |
18 |
|
|
$ |
40 |
|
|
$ |
2 |
|
|
$ |
42 |
|
| Non-current liabilities |
|
|
|
|
|
|
|
|
|
|
|
|
|
|
|
|
|
|
|
|
| Asset retirement obligations and accrued environmental costs |
|
|
287 |
|
|
|
13 |
|
|
|
300 |
|
|
|
– |
|
|
|
300 |
|
| |
|
$ |
309 |
|
|
$ |
31 |
|
|
$ |
340 |
|
|
$ |
2 |
|
|
$ |
342 |
|
The estimated cash flows required to settle the asset retirement obligations have been discounted at a
risk-free rate, specific to the timing of cash flows and the jurisdiction of the obligation. The rate for phosphate operations ranged from 0.97 percent to 2.86 percent at December 31, 2011 (December 31, 2010 – 1.97 percent to 4.34
percent; January 1, 2010 – 2.56 percent to 4.63 percent). The rate for potash operations primarily was 6 percent at December 31, 2011 (December 31, 2010 – 6 percent; January 1, 2010 – 7 percent).
Environmental operating and capital expenditures
Our operations are subject to numerous environmental requirements under federal,
provincial, state and local laws and regulations of Canada, the United States, and Trinidad and Tobago. These laws and regulations govern matters
such as air emissions, wastewater discharges, land use and reclamation and solid and hazardous waste management. Many of these laws, regulations and permit requirements are becoming increasingly
stringent, and the cost of compliance with these requirements can be expected to rise over time.
The company’s operating expenses, other
than costs associated with asset retirement obligations, relating to compliance with environmental laws and regulations governing ongoing operations for 2011 were $131 (2010 – $134).
The company routinely undertakes environmental capital projects. In 2011, capital expenditures of $67 (2010 – $60) were incurred to meet
pollution prevention and control objectives and $2 (2010 – $1) were incurred to meet other environmental objectives.
II-32
|
|
|
| |
|
In millions of US dollars except as otherwise
noted |
Authorized
The company is authorized to issue an unlimited number of common shares without par
value and an unlimited number of first preferred shares. The common shares are not redeemable or convertible. The first preferred shares may be issued in one or more series with rights and conditions to be determined by the Board of Directors. No
first preferred shares have been issued.
Issued
|
|
|
|
|
|
|
|
|
| |
|
Number of
Common Shares |
|
|
Consideration |
|
| Balance, January 1, 2010 |
|
|
887,926,650 |
|
|
$ |
1,430 |
|
| Issued under option plans |
|
|
7,339,116 |
|
|
|
68 |
|
| Issued for dividend reinvestment plan |
|
|
46,947 |
|
|
|
2 |
|
| Repurchased |
|
|
(42,190,020 |
) |
|
|
(69 |
) |
| Balance, December 31, 2010 |
|
|
853,122,693 |
|
|
$ |
1,431 |
|
| Issued under option plans |
|
|
5,490,335 |
|
|
|
48 |
|
| Issued for dividend reinvestment plan |
|
|
89,963 |
|
|
|
4 |
|
| Balance, December 31, 2011 |
|
|
858,702,991 |
|
|
$ |
1,483 |
|
|
|
|
|
|
| NOTE 16 |
|
|
|
SEGMENT INFORMATION |
Accounting Policies
Inter-segment sales are made under terms that approximate market value. The accounting
policies of the segments are the same as those described in Note 2 and other relevant notes and are measured in a manner consistent with that of the financial statements.
Sales revenue is recognized when the product is shipped, the sales price and costs incurred or to be incurred can be measured reliably, and collectibility is probable. Revenue is recorded based on the FOB
mine, plant, warehouse or terminal price, except for certain vessel sales or specific product sales that are shipped on a delivered basis. Transportation costs are recovered from the
customer through sales pricing. Revenue is measured at the fair value of the consideration received or receivable, taking into account the amount of any trade discounts and volume rebates
allowed.
The company’s operating segments have been
determined based on reports reviewed by the Chief Executive Officer, its chief operating decision maker, that are used to make strategic decisions. The company has three reportable operating segments: potash, phosphate and nitrogen. These operating
segments are differentiated by the chemical nutrient contained in the product that each produces.
|
|
|
|
|
|
|
|
|
|
|
|
|
|
|
|
|
|
|
|
|
| 2011 |
|
|
|
|
|
|
|
|
|
|
|
|
|
|
|
|
|
|
|
|
| |
|
Potash |
|
|
Phosphate |
|
|
Nitrogen |
|
|
All Others |
|
|
Consolidated |
|
| Sales |
|
$ |
3,983 |
|
|
$ |
2,478 |
|
|
$ |
2,254 |
|
|
$ |
– |
|
|
$ |
8,715 |
|
| Freight, transportation and distribution |
|
|
(244 |
) |
|
|
(166 |
) |
|
|
(86 |
) |
|
|
– |
|
|
|
(496 |
) |
| Net sales – third party |
|
|
3,739 |
|
|
|
2,312 |
|
|
|
2,168 |
|
|
|
– |
|
|
|
|
|
| Cost of goods sold |
|
|
(1,017 |
) |
|
|
(1,664 |
) |
|
|
(1,252 |
) |
|
|
– |
|
|
|
(3,933 |
) |
| Gross margin |
|
|
2,722 |
|
|
|
648 |
|
|
|
916 |
|
|
|
– |
|
|
|
4,286 |
|
| Depreciation and amortization |
|
|
(142 |
) |
|
|
(207 |
) |
|
|
(132 |
) |
|
|
(8 |
) |
|
|
(489 |
) |
| Inter-segment sales |
|
|
– |
|
|
|
– |
|
|
|
187 |
|
|
|
– |
|
|
|
– |
|
| Cash flows for additions to property, plant and equipment |
|
|
1,717 |
|
|
|
159 |
|
|
|
260 |
|
|
|
40 |
|
|
|
2,176 |
|
II-33
|
|
|
| |
|
In millions of US dollars except as otherwise
noted |
NOTE 16 Segment Information continued
|
|
|
|
|
|
|
|
|
|
|
|
|
|
|
|
|
|
|
|
|
| 2010 |
|
|
|
|
|
|
|
|
|
|
|
|
|
|
|
| |
|
Potash |
|
|
Phosphate |
|
|
Nitrogen |
|
|
All Others |
|
|
Consolidated |
|
| Sales |
|
$ |
3,001 |
|
|
$ |
1,822 |
|
|
$ |
1,716 |
|
|
$ |
– |
|
|
$ |
6,539 |
|
| Freight, transportation and distribution |
|
|
(259 |
) |
|
|
(144 |
) |
|
|
(85 |
) |
|
|
– |
|
|
|
(488 |
) |
| Net sales – third party |
|
|
2,742 |
|
|
|
1,678 |
|
|
|
1,631 |
|
|
|
– |
|
|
|
|
|
| Cost of goods sold |
|
|
(926 |
) |
|
|
(1,332 |
) |
|
|
(1,103 |
) |
|
|
– |
|
|
|
(3,361 |
) |
| Gross margin |
|
|
1,816 |
|
|
|
346 |
|
|
|
528 |
|
|
|
– |
|
|
|
2,690 |
|
| Depreciation and amortization |
|
|
(125 |
) |
|
|
(197 |
) |
|
|
(119 |
) |
|
|
(8 |
) |
|
|
(449 |
) |
| Inter-segment sales |
|
|
– |
|
|
|
– |
|
|
|
119 |
|
|
|
– |
|
|
|
– |
|
| Cash flows for additions to property, plant and equipment |
|
|
1,643 |
|
|
|
242 |
|
|
|
144 |
|
|
|
50 |
|
|
|
2,079 |
|
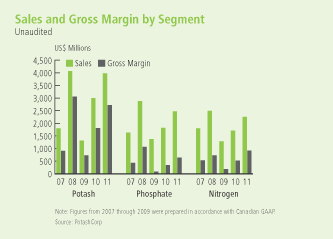
As described in Note 1, Canpotex and PhosChem execute offshore marketing, sales and distribution functions for certain of
the company’s products. Financial information by geographic area is summarized in the following table:
|
|
|
|
|
|
|
|
|
|
|
|
|
|
|
|
|
|
|
|
|
| 2011 |
|
Country of Origin |
|
| |
|
Canada |
|
|
United States |
|
|
Trinidad |
|
|
Other |
|
|
Consolidated |
|
| Sales to customers outside the company |
|
|
|
|
|
|
|
|
|
|
|
|
|
|
|
|
|
|
|
|
| Canada |
|
$ |
142 |
|
|
$ |
183 |
|
|
$ |
– |
|
|
$ |
– |
|
|
$ |
325 |
|
| United States |
|
|
1,580 |
|
|
|
2,576 |
|
|
|
819 |
|
|
|
– |
|
|
|
4,975 |
|
| Canpotex (Canpotex’s 2011 sales volumes were made to: Latin America 26%, India 9%, China 17%, other Asian countries 43%, other
countries 5%) |
|
|
1,956 |
|
|
|
– |
|
|
|
– |
|
|
|
– |
|
|
|
1,956 |
|
| PhosChem (PhosChem’s 2011 sales volumes were made to: India 54%, Latin America 27%, China NIL%, other countries 11%, other
Asian countries 8%) |
|
|
– |
|
|
|
563 |
|
|
|
– |
|
|
|
– |
|
|
|
563 |
|
| Mexico |
|
|
19 |
|
|
|
114 |
|
|
|
14 |
|
|
|
– |
|
|
|
147 |
|
| Brazil |
|
|
160 |
|
|
|
50 |
|
|
|
9 |
|
|
|
– |
|
|
|
219 |
|
| Colombia |
|
|
42 |
|
|
|
8 |
|
|
|
80 |
|
|
|
– |
|
|
|
130 |
|
| Other Latin America |
|
|
84 |
|
|
|
42 |
|
|
|
242 |
|
|
|
– |
|
|
|
368 |
|
| Other |
|
|
– |
|
|
|
23 |
|
|
|
9 |
|
|
|
– |
|
|
|
32 |
|
| |
|
$ |
3,983 |
|
|
$ |
3,559 |
|
|
$ |
1,173 |
|
|
$ |
– |
|
|
$ |
8,715 |
|
| Non-current assets 1 |
|
$ |
6,783 |
|
|
$ |
2,775 |
|
|
$ |
660 |
|
|
$ |
23 |
|
|
$ |
10,241 |
|
| 1 |
Includes non-current assets other than financial instruments, deferred tax assets and post-employment benefit assets. |
II-34
|
|
|
| |
|
In millions of US dollars except as otherwise
noted |
NOTE 16 Segment Information continued
|
|
|
|
|
|
|
|
|
|
|
|
|
|
|
|
|
|
|
|
|
| 2010 |
|
Country of Origin |
|
| |
|
Canada |
|
|
United States |
|
|
Trinidad |
|
|
Other |
|
|
Consolidated |
|
| Sales to customers outside the company |
|
|
|
|
|
|
|
|
|
|
|
|
|
|
|
|
|
|
|
|
| Canada |
|
$ |
138 |
|
|
$ |
103 |
|
|
$ |
– |
|
|
$ |
– |
|
|
$ |
241 |
|
| United States |
|
|
1,315 |
|
|
|
2,074 |
|
|
|
638 |
|
|
|
– |
|
|
|
4,027 |
|
| Canpotex (Canpotex’s 2010 sales volumes were made to: Latin America 25%, India 14%, China 14%, other Asian countries 41%, other
countries 6%) |
|
|
1,273 |
|
|
|
– |
|
|
|
– |
|
|
|
– |
|
|
|
1,273 |
|
| PhosChem (PhosChem’s 2010 sales volumes were made to: India 58%, Latin America 20%, China 2%, other countries 11%, other Asian
countries 9%) |
|
|
– |
|
|
|
396 |
|
|
|
– |
|
|
|
– |
|
|
|
396 |
|
| Mexico |
|
|
19 |
|
|
|
75 |
|
|
|
2 |
|
|
|
– |
|
|
|
96 |
|
| Brazil |
|
|
134 |
|
|
|
34 |
|
|
|
– |
|
|
|
– |
|
|
|
168 |
|
| Colombia |
|
|
38 |
|
|
|
13 |
|
|
|
70 |
|
|
|
– |
|
|
|
121 |
|
| Other Latin America |
|
|
79 |
|
|
|
37 |
|
|
|
66 |
|
|
|
– |
|
|
|
182 |
|
| Other |
|
|
5 |
|
|
|
22 |
|
|
|
8 |
|
|
|
– |
|
|
|
35 |
|
| |
|
$ |
3,001 |
|
|
$ |
2,754 |
|
|
$ |
784 |
|
|
$ |
– |
|
|
$ |
6,539 |
|
| Non-current assets 1 |
|
$ |
5,246 |
|
|
$ |
2,575 |
|
|
$ |
633 |
|
|
$ |
– |
|
|
$ |
8,454 |
|
| 1 |
Includes non-current assets other than financial instruments, deferred tax assets and post-employment benefit assets. |
|
|
|
|
|
| NOTE 17 |
|
|
|
NATURE OF EXPENSES |
|
|
|
|
|
Accounting Policies
The primary components of cost of goods sold are labor, employee benefits, services, raw materials (including
inbound freight and purchasing and receiving costs), operating supplies, energy costs, royalties, property and miscellaneous taxes, and depreciation and amortization.
The primary components of selling and administrative expenses are compensation, other employee benefits,
supplies, communications, travel, professional services, and depreciation and amortization.
|
|
|
|
|
|
|
|
|
|
|
|
|
| 2011 |
|
Cost of
Goods Sold |
|
|
Selling and
Administrative
Expenses |
|
|
Total |
|
| Employee costs |
|
$ |
611 |
|
|
$ |
98 |
|
|
$ |
709 |
|
| Depreciation and amortization |
|
|
483 |
|
|
|
6 |
|
|
|
489 |
|
| Other |
|
|
2,839 |
|
|
|
113 |
|
|
|
2,952 |
|
| Total |
|
$ |
3,933 |
|
|
$ |
217 |
|
|
$ |
4,150 |
|
|
|
|
|
|
|
|
|
|
|
|
|
|
| 2010 |
|
Cost of
Goods Sold |
|
|
Selling and
Administrative
Expenses |
|
|
Total |
|
| Employee costs |
|
$ |
604 |
|
|
$ |
128 |
|
|
$ |
732 |
|
| Depreciation and amortization |
|
|
441 |
|
|
|
8 |
|
|
|
449 |
|
| Other |
|
|
2,316 |
|
|
|
92 |
|
|
|
2,408 |
|
| Total |
|
$ |
3,361 |
|
|
$ |
228 |
|
|
$ |
3,589 |
|
II-35
|
|
|
| |
|
In millions of US dollars except as otherwise
noted |
|
|
|
|
|
| NOTE 18 |
|
|
|
PROVINCIAL MINING AND OTHER TAXES |
|
|
|
|
|
|
|
|
|
| |
|
2011 |
|
|
2010 |
|
| Saskatchewan resource surcharge and other |
|
$ |
108 |
|
|
$ |
77 |
|
| Potash Production Tax |
|
|
39 |
|
|
|
– |
|
| |
|
$ |
147 |
|
|
$ |
77 |
|
|
|
|
|
|
|
|
|
|
| |
|
2011 |
|
|
2010 |
|
| Foreign exchange (gain) loss |
|
$ |
(7 |
) |
|
$ |
17 |
|
| Takeover response costs |
|
|
2 |
|
|
|
73 |
|
| Other |
|
|
18 |
|
|
|
35 |
|
| |
|
$ |
13 |
|
|
$ |
125 |
|
Included in takeover response costs are financial advisory, legal and other fees incurred relating to PotashCorp’s
response to an unsolicited offer made in August 2010 to purchase all of its outstanding common shares. The offer was withdrawn in November 2010.
|
|
|
|
|
|
|
|
|
| |
|
2011 |
|
|
2010 |
|
| Interest expense on |
|
|
|
|
|
|
|
|
| Short-term debt |
|
$ |
8 |
|
|
$ |
8 |
|
| Long-term debt |
|
|
227 |
|
|
|
217 |
|
| Unwinding of discount on asset retirement obligations (Note 14) |
|
|
16 |
|
|
|
11 |
|
| Borrowing costs capitalized to property, plant and equipment |
|
|
(84 |
) |
|
|
(107 |
) |
| Interest income |
|
|
(8 |
) |
|
|
(8 |
) |
| |
|
$ |
159 |
|
|
$ |
121 |
|
Borrowing costs capitalized to property, plant and equipment during the year were calculated by applying a capitalization
rate of 4.4 percent in 2011 (2010 – 5.0 percent) to expenditures on qualifying assets.
II-36
|
|
|
| |
|
In millions of US dollars except as otherwise
noted |
Accounting Policies
Taxation on earnings comprises current and deferred income tax. Taxation is recognized
in the statements of income except to the extent that it relates to items recognized in OCI or contributed surplus, in which case the tax is recognized in OCI or contributed surplus as applicable.
Current income tax is generally the expected tax payable on the taxable income for the year calculated using rates enacted or substantively enacted at the
statements of financial position date in the countries where the company’s subsidiaries and equity-accounted investees operate and generate taxable income. It includes any adjustment to income tax payable or recoverable in respect of previous
years. The realized and unrealized excess tax benefit from share-based payment arrangements is recognized in contributed surplus as either current tax (realized amounts) or deferred tax (unrealized amounts).
Uncertain income tax positions are accounted for using the standards applicable to current income tax liabilities and assets; i.e., both liabilities
and assets are recorded when probable and measured at the amount expected to be paid to (recovered from) the taxation authorities using the company’s best estimate of the amount.
Deferred income tax is recognized using the liability method, based on temporary differences between consolidated financial statements carrying amounts of
assets and liabilities and their respective income tax bases. Deferred income tax is determined using tax rates that have been enacted or substantively enacted by the statement of financial position date and are expected to apply when the
related deferred income tax asset is realized or the deferred income tax liability is settled. The tax effect of certain temporary differences is not recognized, principally with respect to temporary differences relating to investments in
subsidiaries, jointly controlled entities and equity-accounted investees where the company is able to control the reversal of the temporary difference and that difference is not expected to reverse in the foreseeable future. Deferred income tax is
not accounted for if it arises from initial recognition of an asset or liability in a transaction other than a business combination that at the time of the transaction affects neither accounting nor taxable profit or loss. The amount of deferred
income tax recognized is based on the expected manner and timing of realization or settlement of the carrying amount of assets and liabilities. Deferred income tax assets are recognized only to the extent that it is probable that future taxable
profit will be available against which the temporary differences can be utilized. Deferred income tax
assets are reviewed at each statement of financial position date and amended to the extent that it is no longer probable that the related tax benefit will be realized.
Current income tax assets and liabilities are offset when the company has a legally enforceable right to offset the recognized amounts and
intends either to settle on a net basis, or to realize the asset and settle the liability simultaneously. Normally, the company would only have a legally enforceable right to set off a current tax asset against a current tax liability when they
relate to income taxes levied by the same taxation authority and the authority permits the company to make or receive a single net payment. Deferred income tax assets and liabilities are offset when the company has a legally enforceable right to set
off current tax assets against current tax liabilities and the deferred tax assets and liabilities relate to income taxes levied by the same taxation authority on either: (1) the same taxable entity; or (2) different taxable entities which
intend either to settle current tax liabilities and assets on a net basis, or to realize the assets and settle the liabilities simultaneously in each future period in which significant amounts of deferred tax liabilities or assets are expected to be
settled or recovered.
Accounting Estimates and Judgments
The company operates in a specialized industry and in several tax
jurisdictions. As a result, its income is subject to various rates of taxation. The breadth of its operations and the global complexity of tax regulations require assessments of uncertainties and judgments in estimating the taxes the company
will ultimately pay. The final taxes paid are dependent upon many factors, including negotiations with taxing authorities in various jurisdictions, outcomes of tax litigation and resolution of disputes arising from federal, provincial, state and
local tax audits. The resolution of these uncertainties and the associated final taxes may result in adjustments to the company’s tax assets and tax liabilities.
The company estimates deferred income taxes based upon temporary differences between the assets and liabilities that it reports in its consolidated financial statements and the tax bases of its assets and
liabilities as determined under applicable tax laws. The amount of deferred tax assets recognized is generally limited to the extent that it is probable that taxable profit will be available against which the related deductible temporary differences
can be utilized. Therefore, the amount of the deferred income tax asset recognized and considered realizable could be reduced if projected income is not achieved.
II-37
|
|
|
| |
|
In millions of US dollars except as otherwise
noted |
NOTE 21 Income Taxes continued
Supporting Information
|
| Income taxes in net income
The provision for income taxes differs from the amount that would have resulted from applying the Canadian statutory income tax rates to income before income
taxes as follows: |
|
|
|
|
|
|
|
|
|
| |
|
2011 |
|
|
2010 |
|
| Income before income taxes: |
|
|
|
|
|
|
|
|
| Canada |
|
$ |
2,355 |
|
|
$ |
1,274 |
|
| United States |
|
|
957 |
|
|
|
562 |
|
| Trinidad |
|
|
430 |
|
|
|
285 |
|
| Other |
|
|
405 |
|
|
|
355 |
|
| |
|
$ |
4,147 |
|
|
$ |
2,476 |
|
| Canadian federal and provincial statutory income tax rate |
|
|
28.31% |
|
|
|
29.94% |
|
| Income tax at statutory rates |
|
$ |
1,174 |
|
|
$ |
741 |
|
| Adjusted for the effect of: |
|
|
|
|
|
|
|
|
| Non-taxable income |
|
|
(106 |
) |
|
|
(95 |
) |
| Production-related deductions |
|
|
(68 |
) |
|
|
(35 |
) |
| Tax rate differential on temporary differences |
|
|
(20 |
) |
|
|
(18 |
) |
| Income tax recoveries in a foreign jurisdiction |
|
|
(14 |
) |
|
|
– |
|
| Additional tax deductions |
|
|
(12 |
) |
|
|
(12 |
) |
| Impact of foreign tax rates |
|
|
82 |
|
|
|
35 |
|
| Adjustment to prior years’ deferred taxes |
|
|
26 |
|
|
|
9 |
|
| Share-based compensation |
|
|
11 |
|
|
|
3 |
|
| Withholding taxes |
|
|
2 |
|
|
|
11 |
|
| Prior year provision to income tax returns filed |
|
|
1 |
|
|
|
36 |
|
| Other |
|
|
(10 |
) |
|
|
26 |
|
| Income tax expense included in net income |
|
$ |
1,066 |
|
|
$ |
701 |
|
The decrease in the Canadian federal and provincial statutory income tax rate from 2010 to 2011 was the result
of legislated decreases in federal and New Brunswick income tax rates.
Total income tax expense, included in net income, was comprised of the
following:
|
|
|
|
|
|
|
|
|
| |
|
2011 |
|
|
2010 |
|
| Current income tax: |
|
|
|
|
|
|
|
|
| Current income tax on profits for the year |
|
$ |
794 |
|
|
$ |
434 |
|
| Adjustments in respect of prior years |
|
|
(65 |
) |
|
|
90 |
|
| Total current income tax expense |
|
|
729 |
|
|
|
524 |
|
| Deferred income tax: |
|
|
|
|
|
|
|
|
| Origination and reversal of temporary differences |
|
|
271 |
|
|
|
205 |
|
| Adjustments in respect of prior years |
|
|
52 |
|
|
|
(28 |
) |
| Impact of tax rate changes |
|
|
7 |
|
|
|
– |
|
| Impact of a writedown of a deferred tax asset |
|
|
7 |
|
|
|
– |
|
| Total deferred income tax expense |
|
|
337 |
|
|
|
177 |
|
| Income tax expense included in net income |
|
$ |
1,066 |
|
|
$ |
701 |
|
Income taxes in contributed surplus
The income taxes charged (credited) to contributed surplus were:
|
|
|
|
|
|
|
|
|
| |
|
2011 |
|
|
2010 |
|
| Share-based compensation excess tax benefit: |
|
|
|
|
|
|
|
|
| Current income tax (realized) |
|
$ |
(29 |
) |
|
$ |
(45 |
) |
| Deferred income tax (unrealized) |
|
|
62 |
|
|
|
(27 |
) |
| Total income tax charged (credited) to contributed
surplus |
|
$ |
33 |
|
|
$ |
(72 |
) |
Income tax balances
Income tax balances within the consolidated statements of financial position
were comprised of the following:
|
|
|
|
|
|
|
|
|
|
|
|
|
|
|
| Income Tax Assets (Liabilities) |
|
Statements of Financial Position Location |
|
Dec 31,
2011 |
|
|
Dec 31,
2010 |
|
|
Jan 1,
2010 |
|
| Current income tax assets: |
|
|
|
|
|
|
|
|
|
|
|
|
|
|
| Current |
|
Receivables (Note 3) |
|
$ |
21 |
|
|
$ |
46 |
|
|
$ |
363 |
|
| Non-current |
|
Other assets (Note 7) |
|
|
117 |
|
|
|
122 |
|
|
|
78 |
|
| Deferred income tax assets |
|
Other assets (Note 7) |
|
|
19 |
|
|
|
38 |
|
|
|
31 |
|
| Total income tax assets |
|
|
|
$ |
157 |
|
|
$ |
206 |
|
|
$ |
472 |
|
| Current income tax liabilities: |
|
|
|
|
|
|
|
|
|
|
|
|
|
|
| Current |
|
Payables and accrued charges (Note 10) |
|
$ |
(271 |
) |
|
$ |
(167 |
) |
|
$ |
(17 |
) |
| Non-current |
|
Other non-current liabilities and deferred credits |
|
|
(85 |
) |
|
|
(142 |
) |
|
|
(95 |
) |
| Deferred income tax liabilities |
|
Deferred income tax liabilities |
|
|
(1,052 |
) |
|
|
(737 |
) |
|
|
(643 |
) |
| Total income tax liabilities |
|
|
|
$ |
(1,408 |
) |
|
$ |
(1,046 |
) |
|
$ |
(755 |
) |
II-38
|
|
|
| |
|
In millions of US dollars except as otherwise
noted |
NOTE 21 Income Taxes continued
Deferred income taxes
In respect of each type of temporary difference, unused tax loss and unused tax credit,
the amounts of deferred tax assets and liabilities recognized in the statements of financial position and the amount of the deferred tax recovery or expense recognized in net income were:
|
|
|
|
|
|
|
|
|
|
|
|
|
|
|
|
|
|
|
|
|
| |
|
Deferred Income Tax Assets (Liabilities) |
|
|
Deferred Tax
Recovery (Expense)
Recognized in Net Income |
|
| |
|
Dec 31,
2011 |
|
|
Dec 31,
2010 |
|
|
Jan 1,
2010 |
|
|
2011 |
|
|
2010 |
|
| Deferred income tax assets: |
|
|
|
|
|
|
|
|
|
|
|
|
|
|
|
|
|
|
|
|
| Tax loss and other carryforwards |
|
$ |
58 |
|
|
$ |
94 |
|
|
$ |
72 |
|
|
$ |
(35 |
) |
|
$ |
22 |
|
| Asset retirement obligations and accrued environmental costs |
|
|
124 |
|
|
|
95 |
|
|
|
53 |
|
|
|
29 |
|
|
|
42 |
|
| Derivative instrument liabilities |
|
|
101 |
|
|
|
106 |
|
|
|
66 |
|
|
|
– |
|
|
|
– |
|
| Inventories |
|
|
57 |
|
|
|
39 |
|
|
|
60 |
|
|
|
18 |
|
|
|
(21 |
) |
| Post-retirement benefits and share-based compensation |
|
|
275 |
|
|
|
315 |
|
|
|
284 |
|
|
|
(53 |
) |
|
|
(7 |
) |
| Other assets |
|
|
20 |
|
|
|
30 |
|
|
|
20 |
|
|
|
(8 |
) |
|
|
6 |
|
| Deferred income tax liabilities: |
|
|
|
|
|
|
|
|
|
|
|
|
|
|
|
|
|
|
|
|
| Property, plant and equipment |
|
|
(1,632 |
) |
|
|
(1,321 |
) |
|
|
(1,109 |
) |
|
|
(311 |
) |
|
|
(212 |
) |
| Investments in equity-accounted investees |
|
|
(21 |
) |
|
|
(18 |
) |
|
|
(15 |
) |
|
|
(4 |
) |
|
|
(3 |
) |
| Long-term debt |
|
|
(7 |
) |
|
|
(29 |
) |
|
|
(29 |
) |
|
|
22 |
|
|
|
– |
|
| Other liabilities |
|
|
(8 |
) |
|
|
(10 |
) |
|
|
(14 |
) |
|
|
5 |
|
|
|
(4 |
) |
| |
|
$ |
(1,033 |
) |
|
$ |
(699 |
) |
|
$ |
(612 |
) |
|
$ |
(337 |
) |
|
$ |
(177 |
) |
Reconciliation of net deferred income tax liabilities:
|
|
|
|
|
|
|
|
|
| |
|
2011 |
|
|
2010 |
|
| January 1 |
|
$ |
(699 |
) |
|
$ |
(612 |
) |
| Income tax charge recognized in the statements of income |
|
|
(337 |
) |
|
|
(177 |
) |
| Income tax (charge) credit recognized in contributed surplus |
|
|
(62 |
) |
|
|
27 |
|
| Income tax credit recognized in OCI |
|
|
70 |
|
|
|
51 |
|
| Foreign exchange and other |
|
|
(5 |
) |
|
|
12 |
|
| December 31 |
|
$ |
(1,033 |
) |
|
$ |
(699 |
) |
Amounts and expiry dates of unused tax losses and unused tax credits as at December 31, 2011 were:
|
|
|
|
|
|
|
|
|
| |
|
Amount |
|
|
Expiry Date |
|
| Unused tax losses |
|
|
|
|
|
|
|
|
| Operating |
|
$ |
203 |
|
|
|
None |
|
| Capital |
|
$ |
362 |
|
|
|
None |
|
| Unused tax credits |
|
|
|
|
|
|
|
|
| Investment tax credits |
|
$ |
54 |
|
|
|
2012-2019 |
|
| Alternative minimum tax |
|
$ |
14 |
|
|
|
None |
|
The unused tax losses and credits with no expiry dates can be carried forward indefinitely.
Deferred tax assets are recognized for tax loss carryforwards to the extent that the realization of the related tax benefit through future taxable
profits is probable. At December 31, 2011, the company had $343 of tax losses and deductible temporary differences for which it did not recognize deferred tax assets.
The company has determined that it is probable that all recognized deferred income tax assets will be realized through a combination of future reversals of temporary differences and taxable income.
The aggregate amount of temporary differences associated with investments in subsidiaries and equity-accounted investees, for which deferred tax
liabilities have not been recognized, as at December 31, 2011 was $4,361 (December 31, 2010 – $5,098; January 1, 2010 – $3,776).
II-39
|
|
|
| |
|
In millions of US dollars except as otherwise
noted |
|
|
|
|
|
| NOTE 22 |
|
|
|
NET INCOME PER SHARE |
|
|
|
|
|
|
|
|
|
| |
|
2011 |
|
|
2010 |
|
| Basic net income per share 1 |
|
|
|
|
|
|
|
|
| Net income available to common shareholders |
|
$ |
3,081 |
|
|
$ |
1,775 |
|
| Weighted average number of common shares |
|
|
855,677,000 |
|
|
|
886,371,000 |
|
| Basic net income per share |
|
$ |
3.60 |
|
|
$ |
2.00 |
|
| Diluted net income per share 1 |
|
|
|
|
|
|
|
|
| Net income available to common shareholders |
|
$ |
3,081 |
|
|
$ |
1,775 |
|
| Weighted average number of common shares |
|
|
855,677,000 |
|
|
|
886,371,000 |
|
| Dilutive effect of stock options |
|
|
20,960,000 |
|
|
|
24,722,000 |
|
| Weighted average number of diluted common shares |
|
|
876,637,000 |
|
|
|
911,093,000 |
|
| Diluted net income per share |
|
$ |
3.51 |
|
|
$ |
1.95 |
|
| 1 |
Net income per share calculations are based on dollar and share amounts each rounded to the nearest thousand. |
Diluted net income per share is calculated based on the weighted average number of shares issued and
outstanding during the year, incorporating the following adjustments. The denominator is: (1) increased by the total of the additional common shares that would have been issued assuming exercise of all stock options with exercise prices at or
below the average market price for the year; and (2) decreased by the number of shares that the company could have repurchased if it had used the assumed proceeds from the exercise of stock options to repurchase them on the open market at the
average share price for the year. For performance-based stock option plans, the number of contingently issuable common shares included in the calculation is based on the number of shares, if any, that would be issuable if the end of the reporting
period were the end of the performance period and the effect were dilutive.
Excluded from the calculation of diluted net income per share were
weighted average options outstanding of 2,519,300 relating to the 2011 and 2008 Performance Option Plans (2010 – 1,441,050 relating to the 2008 Performance Option Plan) as the options’ exercise prices were greater than the average
market price of common shares for the year.
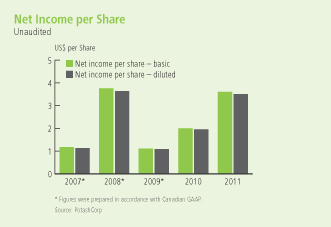
|
|
|
|
|
| NOTE 23 |
|
|
|
SHARE-BASED COMPENSATION |
Accounting Policies
Grants under the company’s share-based compensation plans are accounted for in
accordance with the fair value-based method of accounting. For stock option plans that will settle through the issuance of equity, the fair value of stock options is determined on their grant date using a valuation model and recorded as compensation
expense over the period that the stock options vest, with a corresponding increase to contributed surplus. Forfeitures are estimated throughout the vesting period based on past experience and future expectations, and adjusted upon actual
option vesting. When stock options are exercised, the proceeds, together with the amount recorded in contributed surplus, are recorded in share capital.
Share-based plans that are likely to settle in cash or other assets are accounted for as liabilities based on
the fair value of the awards each period. The compensation expense is accrued over the vesting period of the award. Fluctuations in the fair value of the award will result in a change to the accrued compensation expense, which is recognized in the
period in which the fluctuation occurs.
Accounting
Estimates and Judgments
Determining the fair value of equity-settled
share-based compensation awards at the grant date requires judgment, including estimating the expected term of stock options, the expected volatility of the company’s stock and expected
II-40
|
|
|
| |
|
In millions of US dollars except as otherwise
noted |
NOTE 23 Share-Based Compensation continued
dividends. In addition, judgment is required to estimate the number of share-based awards expected to be forfeited.
The company uses the Black-Scholes-Merton option-pricing model to estimate the fair value of options granted under its stock option plans as of each grant date. This pricing model requires judgment, which
includes making assumptions about the expected dividends, volatility of the company’s stock price, estimate of risk-free interest rates and the expected life of the options. The expected dividend on the company’s stock was based on the
annualized dividend rate as of the date of grant. Expected volatility was based on historical volatility of the company’s stock over a period commensurate with the expected life of the stock option. The risk-free interest rate for the expected
life of the option was based, as applicable, on the implied yield available on zero-coupon government issues with an equivalent remaining term at the time of the grant. Historical data were used to estimate the expected life of the option.
The company uses a Monte Carlo simulation model to estimate the fair value of its cash-settled
performance unit incentive plan liability at each reporting period within the performance period. This requires judgment, including making assumptions about the volatility of the company’s stock price and the DAXglobal Agribusiness Index
with dividends, as well as the correlation between those two amounts, over the three-year plan cycle.
For those awards with performance
conditions that determine the number of options or units to which its employees will be entitled, measurement of compensation cost is based on the company’s best estimate of the outcome of the performance conditions. If actual results
differ significantly from these estimates, stock-based compensation expense and results of operations could be impacted.
Supporting Information
The company has 11 stock-based compensation plans (nine stock option
plans, the deferred share unit plan and the performance unit incentive plan), which are described below. The total compensation cost charged against earnings for those plans in 2011 was $18 (2010 – $48).
Stock option plans
|
|
|
|
|
|
|
| Plan |
|
Options Outstanding |
|
Vesting Period |
|
Settlement |
| Directors Plan |
|
81,000 |
|
2 Years |
|
Shares |
| Officers and Employees Plan |
|
6,736,638 |
|
2 Years |
|
Shares |
| 2005 Performance Option Plan |
|
5,539,810 |
|
3 Years |
|
Shares |
| 2006 Performance Option Plan |
|
5,421,400 |
|
3 Years |
|
Shares |
| 2007 Performance Option Plan |
|
4,167,776 |
|
3 Years |
|
Shares |
| 2008 Performance Option Plan |
|
1,384,200 |
|
3 Years |
|
Shares |
| 2009 Performance Option Plan |
|
1,875,450 |
|
3 Years |
|
Shares |
| 2010 Performance Option Plan |
|
1,307,700 |
|
3 Years |
|
Shares |
| 2011 Performance Option Plan |
|
1,135,100 |
|
3 Years |
|
Shares |
Under the terms of the plans, no additional options are issuable pursuant to the plans.
Under the stock option plans, the exercise price is not less than the quoted market closing price of the company’s common shares on the last trading day
immediately preceding the date of the grant, and an option’s maximum term is 10 years. The key design difference between the Performance Option Plans and the Directors Plan and Officers and Employees Plan is the performance-based vesting
feature. In general, options granted under the Performance Option Plans will vest, if at all, according to a schedule based on the three-year average excess of the company’s consolidated cash flow return on investment over the weighted average
cost of capital. One-half of the options granted in a year under the Directors Plan and Officers and Employees Plan vested one year
from the date of the grant based on service, with the other half vesting the following year.
Prior to a Performance Option Plan award vesting, assumptions regarding vesting are made during the first three years based on the relevant actual and/or
forecast financial results. Changes to vesting assumptions are reflected in earnings immediately. As of December 31, 2011, the 2009, 2010 and 2011 Performance Option Plans are expected to vest at 100 percent.
The company issues new common shares to satisfy stock option exercises. Options granted to Canadian participants are granted with an exercise price in
Canadian dollars.
II-41
|
|
|
| |
|
In millions of US dollars except as otherwise
noted |
NOTE 23 Share-Based Compensation continued
A summary of the status of the plans as of December 31, 2011 and 2010 and changes during the years
ending on those dates is presented as follows:
Number of shares subject
to option
|
|
|
|
|
|
|
|
|
|
|
|
|
|
|
|
|
| |
|
Performance Option Plans |
|
|
Officers, Employees and Directors Plans |
|
| |
|
2011 |
|
|
2010 |
|
|
2011 |
|
|
2010 |
|
| Outstanding, beginning of year |
|
|
21,472,080 |
|
|
|
22,804,755 |
|
|
|
10,649,229 |
|
|
|
15,323,520 |
|
| Granted |
|
|
1,144,100 |
|
|
|
1,334,100 |
|
|
|
– |
|
|
|
– |
|
| Exercised |
|
|
(1,658,744 |
) |
|
|
(2,664,825 |
) |
|
|
(3,831,591 |
) |
|
|
(4,674,291 |
) |
| Forfeited |
|
|
(126,000 |
) |
|
|
(1,950 |
) |
|
|
– |
|
|
|
– |
|
| Expired |
|
|
– |
|
|
|
– |
|
|
|
– |
|
|
|
– |
|
| Outstanding, end of year |
|
|
20,831,436 |
|
|
|
21,472,080 |
|
|
|
6,817,638 |
|
|
|
10,649,229 |
|
Weighted average exercise price
|
|
|
|
|
|
|
|
|
|
|
|
|
|
|
|
|
| |
|
Performance Option Plans |
|
|
Officers, Employees and Directors Plans |
|
| |
|
2011 |
|
|
2010 |
|
|
2011 |
|
|
2010 |
|
| Outstanding, beginning of year |
|
$ |
20.40 |
|
|
$ |
18.52 |
|
|
$ |
4.63 |
|
|
$ |
4.41 |
|
| Granted |
|
|
52.26 |
|
|
|
33.82 |
|
|
|
– |
|
|
|
– |
|
| Exercised |
|
|
12.61 |
|
|
|
13.62 |
|
|
|
4.56 |
|
|
|
4.20 |
|
| Forfeited |
|
|
49.43 |
|
|
|
64.62 |
|
|
|
– |
|
|
|
– |
|
| Expired |
|
|
– |
|
|
|
– |
|
|
|
– |
|
|
|
– |
|
| Outstanding, end of year |
|
$ |
22.40 |
|
|
$ |
20.40 |
|
|
$ |
4.64 |
|
|
$ |
4.63 |
|
The aggregate grant-date fair value of all options granted during the year was $27 (2010 – $21). The average share
price during the year was $53.02 per share (2010 – $40.12 per share).
The following table summarizes information about stock options
outstanding at December 31, 2011:
|
|
|
|
|
|
|
|
|
|
|
|
|
|
|
|
|
|
|
| |
|
Options Outstanding |
|
|
Options Exercisable |
|
| Range of Exercise Prices |
|
Number |
|
|
Weighted Average
Remaining Life in Years |
|
Weighted Average
Exercise Price |
|
|
Number |
|
|
Weighted Average
Exercise Price |
|
| Officers and Employees and Directors Plans |
|
|
|
|
|
|
|
|
|
|
|
|
| $3.60 to $4.70 |
|
|
4,360,127 |
|
|
1 |
|
$ |
4.05 |
|
|
|
4,360,127 |
|
|
$ |
4.05 |
|
| $4.71 to $5.90 |
|
|
2,457,511 |
|
|
1 |
|
$ |
5.68 |
|
|
|
2,457,511 |
|
|
$ |
5.68 |
|
| |
|
|
6,817,638 |
|
|
1 |
|
$ |
4.64 |
|
|
|
6,817,638 |
|
|
$ |
4.64 |
|
| Performance Option Plans |
|
|
|
|
|
|
|
|
|
|
|
|
|
|
|
|
|
|
| $9.00 to $14.00 |
|
|
10,961,210 |
|
|
4 |
|
$ |
10.97 |
|
|
|
10,961,210 |
|
|
$ |
10.97 |
|
| $20.00 to $25.00 |
|
|
4,167,776 |
|
|
5 |
|
$ |
21.45 |
|
|
|
4,167,776 |
|
|
$ |
21.45 |
|
| $30.00 to $40.00 |
|
|
3,183,150 |
|
|
8 |
|
$ |
33.71 |
|
|
|
– |
|
|
$ |
– |
|
| $49.00 to $70.00 |
|
|
2,519,300 |
|
|
8 |
|
$ |
59.37 |
|
|
|
1,384,200 |
|
|
$ |
66.02 |
|
| |
|
|
20,831,436 |
|
|
5 |
|
$ |
22.40 |
|
|
|
16,513,186 |
|
|
$ |
18.23 |
|
| |
|
|
27,649,074 |
|
|
4 |
|
$ |
18.02 |
|
|
|
23,330,824 |
|
|
$ |
14.26 |
|
The foregoing options have expiry dates ranging from November 2012 to May 2021.
II-42
|
|
|
| |
|
In millions of US dollars except as otherwise
noted |
NOTE 23 Share-Based Compensation continued
The following weighted average assumptions were used in arriving at the grant-date fair values associated
with stock options for which compensation cost was recognized during 2011 and 2010:
|
|
|
|
|
|
|
|
|
|
|
|
|
|
|
|
|
| |
|
Year of Grant |
|
| |
|
2011 |
|
|
2010 |
|
|
2009 |
|
|
2008 |
|
| Exercise price |
|
$ |
52.26 |
|
|
$ |
33.82 |
|
|
$ |
31.96 |
|
|
$ |
66.02 |
|
| Expected dividend per share |
|
$ |
0.28 |
|
|
$ |
0.13 |
|
|
$ |
0.13 |
|
|
$ |
0.13 |
|
| Expected volatility |
|
|
52% |
|
|
|
50% |
|
|
|
48% |
|
|
|
34% |
|
| Risk-free interest rate |
|
|
2.29% |
|
|
|
2.61% |
|
|
|
2.53% |
|
|
|
3.30% |
|
| Expected life of options in years |
|
|
5.5 |
|
|
|
5.9 |
|
|
|
5.9 |
|
|
|
5.8 |
|
The compensation cost charged against income for the company’s stock option plans in 2011 was $24 (2010 – $24).
Other plans
The company offers a deferred share unit plan to non-employee directors, which allows each to choose to
receive, in the form of deferred share units (“DSUs”), all or a percentage of the director’s fees, which would otherwise be payable in cash. The plan also provides for discretionary grants of additional DSUs by the Board, a practice
the Board discontinued on January 24, 2007 in connection with an increase in the annual retainer. Each DSU fully vests upon award, but is distributed only when the director has ceased to be a member of the Board. Vested units are settled in
cash based on the common share price at that time. As of December 31, 2011, the total number of DSUs held by participating directors was 594,030 (2010 – 573,260).
Further information and a summary of the status of outstanding DSUs is presented below:
|
|
|
|
|
|
|
|
|
|
|
|
|
| |
|
December 31,
2011 |
|
|
December 31,
2010 |
|
|
January 1,
2010 |
|
| Total (recovery) expense recognized |
|
$ |
(5 |
) |
|
$ |
10 |
|
|
$ |
n/a |
|
| Cash used to settle DSUs |
|
|
– |
|
|
|
– |
|
|
|
n/a |
|
| Fair value and intrinsic value of closing liability |
|
|
25 |
|
|
|
30 |
|
|
|
20 |
|
The company offered a performance unit incentive plan to senior executives and other key employees. The performance
objectives under the plan were designed to further align the interests of executives and key employees with those of shareholders by linking the vesting of awards to the total return to shareholders over the three-year performance period ending
December 31,
2011. Total shareholder return measures the capital appreciation in the company’s common shares, including dividends paid over the performance period. Vesting of one-half of the awards was
based on increases in the total shareholder return over the three-year performance period. Vesting of the remaining one-half of the awards was based on the extent to which the total shareholder return matched or exceeded that of the common shares of
a pre-defined peer group index. Vested units were settled in cash based on the common share price generally at the end of the performance period. Compensation expense for this plan was recorded over the three-year performance cycle of the plan. The
amount of compensation expense was adjusted each period over the cycle to reflect the current fair value of common shares and the number of shares estimated to vest in accordance with the vesting schedule based upon estimated total shareholder
return, and such return compared to the company’s peer group.
Further information and a summary of the status of the performance unit
incentive plan units are presented below:
|
|
|
|
|
|
|
|
|
|
|
|
|
| |
|
December 31,
2011 |
|
|
December 31,
2010 |
|
|
January 1,
2010 |
|
| Total (recovery) expense recognized |
|
$ |
(1 |
) |
|
$ |
17 |
|
|
$ |
n/a |
|
| Cash used to settle units |
|
|
4 |
|
|
|
– |
|
|
|
n/a |
|
| Fair value of closing liability |
|
|
18 |
|
|
|
22 |
|
|
|
6 |
|
| Intrinsic value of closing liability |
|
|
18 |
|
|
|
23 |
|
|
|
9 |
|
II-43
|
|
|
| |
|
In millions of US dollars except as otherwise
noted |
|
|
|
|
|
| NOTE 24 |
|
|
|
FINANCIAL INSTRUMENTS AND RELATED RISK MANAGEMENT |
Accounting Policies
Financial assets and financial liabilities are recognized initially at fair value,
normally being the transaction price plus directly attributable transaction costs. Transaction costs related to financial assets or financial liabilities at fair value through profit or loss are recognized immediately in net income. Regular way
purchases and sales of financial assets are accounted for on the trade date.
Accounting Estimates and Judgments
All financial instruments (assets and liabilities) are recorded on the statements of financial position, some at fair value. Those recorded at fair value must be remeasured at each reporting date and changes
in the fair value are recorded in either net income or OCI. Uncertainties, estimates and use of judgment inherent in applying the standards include valuation of financial instruments at fair value.
A number of the company’s financial instruments are recorded on the statements of financial position at fair value, as described in Notes 6 and 11. Fair
value represents point-in-time estimates that may change in subsequent reporting periods due to market conditions or other factors. Estimated fair values are designed to approximate amounts at which the financial instruments could be exchanged in a
current transaction between willing parties. Multiple methods exist by which fair value can be determined, which can cause values (or a range of reasonable values) to differ. There is no universal model that can be broadly applied to all items being
valued. Further, assumptions underlying the valuations may require estimation of costs/prices over time, discount rates, inflation rates, defaults and other relevant variables.
IFRS require the use of a three-level hierarchy for disclosing fair values for instruments measured at fair value on a recurring basis. Judgment and estimation are required to determine in which category of
the hierarchy items should be included. When the inputs used to measure fair value fall within more than one level of the hierarchy, the level within which the fair value measurement is categorized is based on the company’s assessment of the
lowest level input that is the most significant to the fair value measurement.
Supporting Information
Financial risks
The company is exposed in varying degrees to a variety of financial risks from its use
of financial instruments: credit risk, liquidity risk and market risk. The source of risk exposure and how each is managed are outlined below.
Credit risk
The
company is exposed to credit risk on its cash and cash equivalents, receivables (excluding taxes) and derivative instrument assets. The exposure to credit risk is represented by the carrying amount of each class of financial assets, including
derivative financial instruments, recorded in the consolidated statements of financial position.
The company manages its credit risk on cash and
cash equivalents and derivative instrument assets through policies guiding:
| Ÿ |
|
Acceptable minimum counterparty credit ratings relating to the natural gas and foreign currency derivative instrument assets, and cash and
cash equivalents; |
| Ÿ |
|
Daily counterparty settlement on natural gas derivative instruments based on prescribed credit thresholds; and |
| Ÿ |
|
Exposure thresholds by counterparty on cash and cash equivalents. |
Derivative instrument assets are comprised of natural gas hedging derivatives and foreign currency derivatives. At December 31, 2011, the company held no cash margin deposits as collateral relating to
these derivative financial instruments. All of the counterparties to the contracts comprising the derivative financial instruments in an asset position are of investment grade quality.
The company seeks to manage the credit risk relating to its trade receivables through a credit management program. Credit approval policies and procedures are in place to guide the granting of credit to new
customers as well as the continued extension of credit for existing customers. Existing customer accounts are reviewed every 12-18 months. Credit is extended to international customers based upon an evaluation of both customer and country risk. The
company uses credit agency reports, where available, and an assessment of other relevant information such as current financial statements and/or credit references before assigning credit limits to customers. Those that fail to meet specified
benchmark creditworthiness may transact with the company on a prepayment basis or provide another form of credit support that it approves.
II-44
|
|
|
| |
|
In millions of US dollars except as otherwise
noted |
NOTE 24 Financial Instruments and Related Risk Management continued
The company does not hold any collateral as security. If appropriate, it may request guarantees or standby
letters of credit to mitigate credit risk on trade receivables. It also obtains export insurance from Export Development Canada (covering 90 percent of each balance) for international potash sales from its New Brunswick operation, and from the
Foreign Credit Insurance Association (covering 90 percent of each balance) for international sales from the US and Trinidad. A total of $121 in receivables at December 31, 2011 was covered, representing 99 percent of offshore receivables, which
was unchanged from January 1 and December 31, 2010. Canpotex also obtains export insurance from Export Development Canada for its receivables (covering nearly 100 percent of most balances).
The credit period on sales is generally 15 days for fertilizer customers, 30 days for industrial and feed customers and up to 180 days for select export
sales customers. Interest at 1.5 percent per month is charged on balances remaining unpaid at the end of the sale terms. Historically, the company has experienced minimal customer defaults and, as a result, it considers the credit quality of the
trade receivables at December 31, 2011 that are not past due to be high. There were no amounts past due or impaired relating to the non-trade receivables. There were no significant amounts impaired relating to the trade receivables. The aging
of trade receivables that were past due but not impaired was as follows:
|
|
|
|
|
|
|
|
|
|
|
|
|
| |
|
December 31,
2011 |
|
|
December 31,
2010 |
|
|
January 1,
2010 |
|
| 1-30 days |
|
$ |
43 |
|
|
$ |
33 |
|
|
$ |
20 |
|
| 31-60 days |
|
|
– |
|
|
|
1 |
|
|
|
1 |
|
| Greater than 60 days |
|
|
1 |
|
|
|
1 |
|
|
|
1 |
|
| |
|
$ |
44 |
|
|
$ |
35 |
|
|
$ |
22 |
|
Liquidity risk
Liquidity risk arises from the company’s general funding needs and in the
management of its assets, liabilities and optimal capital structure. It manages its liquidity risk to maintain sufficient liquid financial resources to fund its operations and meet its commitments and obligations in a cost-effective manner. In
managing its liquidity risk, the company has access to a range of funding options. It has established an external borrowing policy with the following objectives:
| Ÿ |
|
Maintain an optimal capital structure; |
| Ÿ |
|
Maintain a credit rating that provides ease of access to the debt capital and commercial paper markets; |
| Ÿ |
|
Maintain a sufficient short-term credit availability; and |
| Ÿ |
|
Maintain long-term relationships with lenders.
|
The table below outlines the company’s available debt facilities as of December 31, 2011:
|
|
|
|
|
|
|
|
|
|
|
|
|
| |
|
Total
Amount |
|
|
Amount
Outstanding
and Committed |
|
|
Amount
Available |
|
| Credit facilities 1 |
|
$ |
3,500 |
|
|
$ |
829 |
|
|
$ |
2,671 |
|
| Line of credit |
|
|
75 |
|
|
|
23
|
2
|
|
|
52 |
|
| 1 |
The amount available under the commercial paper program is limited to the availability of backup funds under the credit facilities. Included in the amount
outstanding and committed is $829 of commercial paper. Per the terms of the agreements, the commercial paper outstanding and committed, as applicable, is based on the US dollar balance or equivalent thereof in lawful money of other currencies at the
time of issue; therefore, subsequent changes in the exchange rate applicable to Canadian dollar-denominated commercial paper have no impact on this balance. |
| 2 |
Letters of credit as discussed in Note 9. |
The company has an uncommitted $30 letter of credit facility. At December 31, 2011, $28 (2010 – $27) was outstanding under this facility.
Certain derivative instruments of the company contain provisions that require its debt to maintain specified credit ratings from two of the major credit rating agencies. If the debt were to fall below the
specified ratings, the company would be in violation of these provisions, and the counterparties to the derivative instruments could request immediate payment or demand immediate and ongoing full overnight collateralization on derivative instruments
in net liability positions. The aggregate fair value of all derivative instruments with credit risk-related contingent features that were in a liability position on December 31, 2011 was $269, for which the company has posted collateral of $188
in the normal course of business. If the credit risk-related contingent features underlying these agreements had been triggered on December 31, 2011, the company would have been required to post an additional $79 of collateral to its
counterparties.
II-45
|
|
|
| |
|
In millions of US dollars except as otherwise
noted |
NOTE 24 Financial Instruments and Related Risk Management continued
The table below presents a maturity analysis of the company’s financial liabilities and gross settled
derivative contracts based on the expected cash flows from the date of the consolidated statements of financial position to the contractual maturity date. The amounts are the contractual undiscounted cash flows.
|
|
|
|
|
|
|
|
|
|
|
|
|
|
|
|
|
|
|
|
|
|
|
|
|
| |
|
Carrying Amount
of Liability (Asset)
at December 31,
2011 |
|
|
Contractual
Cash Flows |
|
|
Within 1
Year |
|
|
1 to 3 Years |
|
|
3 to 5 Years |
|
|
Over 5 Years |
|
| Short-term debt obligations 1 |
|
$ |
829 |
|
|
$ |
829 |
|
|
$ |
829 |
|
|
$ |
– |
|
|
$ |
– |
|
|
$ |
– |
|
| Payables and accrued charges 2 |
|
|
842 |
|
|
|
842 |
|
|
|
842 |
|
|
|
– |
|
|
|
– |
|
|
|
– |
|
| Long-term debt obligations 1 |
|
|
3,757 |
|
|
|
6,023 |
|
|
|
198 |
|
|
|
1,098 |
|
|
|
781 |
|
|
|
3,946 |
|
| Foreign currency derivatives |
|
|
(4 |
) |
|
|
|
|
|
|
|
|
|
|
|
|
|
|
|
|
|
|
|
|
| Outflow |
|
|
|
|
|
|
160 |
|
|
|
160 |
|
|
|
– |
|
|
|
– |
|
|
|
– |
|
| Inflow |
|
|
|
|
|
|
(164 |
) |
|
|
(164 |
) |
|
|
– |
|
|
|
– |
|
|
|
– |
|
| Natural gas derivatives 3 |
|
|
265 |
|
|
|
277 |
|
|
|
66 |
|
|
|
87 |
|
|
|
77 |
|
|
|
47 |
|
| |
|
$ |
5,689 |
|
|
$ |
7,967 |
|
|
$ |
1,931 |
|
|
$ |
1,185 |
|
|
$ |
858 |
|
|
$ |
3,993 |
|
| 1 |
Contractual cash flows include contractual interest payments related to debt obligations. Interest rates on variable rate debt are based on prevailing
rates at December 31, 2011. |
| 2 |
Excludes taxes, accrued interest, deferred revenues and current portions of asset retirement obligations and accrued environmental costs and pension and
other post-retirement benefits. |
| 3 |
Natural gas derivatives are subject to master netting agreements. Each counterparty has margin requirements that may require the company to post
collateral against liability balances. |
Market risk
Market risk is the risk that financial instrument fair values will fluctuate due to changes in market prices. The market risks to which the company is exposed are foreign exchange risk, interest rate risk
and price risk (related to commodity and equity securities).
Foreign
exchange risk
The company is exposed to foreign exchange risk primarily
relating to operating and capital expenditures, resource taxes, dividends and commercial paper denominated in currencies other than the US dollar, primarily the Canadian dollar. To manage foreign exchange risk related to these non-US dollar
expenditures, the company may enter into foreign currency derivatives. Its treasury risk management policies allow such exposures to be hedged within certain prescribed limits for both forecast operating and approved capital expenditures.
The foreign currency derivatives are not currently designated as hedging instruments for accounting purposes.
The company has certain
available-for-sale investments listed on foreign stock exchanges and denominated in currencies other than the US dollar for which it is exposed to foreign exchange risk. These investments are held for long-term strategic purposes.
II-46
|
|
|
| |
|
In millions of US dollars except as otherwise
noted |
NOTE 24 Financial Instruments and Related Risk Management continued
The following table shows the company’s significant exposure to exchange risk and the pre-tax effects
on income and OCI of reasonably possible changes in the relevant foreign currency. The company has no significant foreign currency exposure related to cash and cash equivalents and receivables. This analysis assumes that price decreases related to
investments in ICL and Sinofert would not represent an impairment and all other variables remain constant.
|
|
|
|
|
|
|
|
|
|
|
|
|
|
|
|
|
|
|
|
|
| |
|
|
|
|
Foreign Exchange Risk |
|
| |
|
Carrying Amount
of Asset (Liability) |
|
|
5%
increase in US$ |
|
|
5%
decrease in US$ |
|
| |
|
|
Income |
|
|
OCI |
|
|
Income |
|
|
OCI |
|
| December 31, 2011 |
|
|
|
|
|
|
|
|
|
|
|
|
|
|
|
|
|
|
|
|
| Available-for-sale investments |
|
|
|
|
|
|
|
|
|
|
|
|
|
|
|
|
|
|
|
|
| ICL (New Israeli shekels) |
|
$ |
1,826 |
|
|
$ |
– |
|
|
$ |
(91 |
) |
|
$ |
– |
|
|
$ |
91 |
|
| Sinofert (Hong Kong dollars) |
|
|
439 |
|
|
|
– |
|
|
|
(22 |
) |
|
|
– |
|
|
|
22 |
|
| Payables (CDN) |
|
|
(180 |
) |
|
|
9 |
|
|
|
– |
|
|
|
(9 |
) |
|
|
– |
|
| Foreign currency derivatives |
|
|
4 |
|
|
|
(8 |
) |
|
|
– |
|
|
|
8 |
|
|
|
– |
|
|
|
|
|
|
|
| December 31, 2010 |
|
|
|
|
|
|
|
|
|
|
|
|
|
|
|
|
|
|
|
|
| Available-for-sale investments |
|
|
|
|
|
|
|
|
|
|
|
|
|
|
|
|
|
|
|
|
| ICL (New Israeli shekels) |
|
$ |
3,046 |
|
|
$ |
– |
|
|
$ |
(152 |
) |
|
$ |
– |
|
|
$ |
152 |
|
| Sinofert (Hong Kong dollars) |
|
|
796 |
|
|
|
– |
|
|
|
(40 |
) |
|
|
– |
|
|
|
40 |
|
| Short-term debt (CDN) |
|
|
(69 |
) |
|
|
3 |
|
|
|
– |
|
|
|
(3 |
) |
|
|
– |
|
| Payables (CDN) |
|
|
(205 |
) |
|
|
10 |
|
|
|
– |
|
|
|
(10 |
) |
|
|
– |
|
| Foreign currency derivatives |
|
|
5 |
|
|
|
(12 |
) |
|
|
– |
|
|
|
12 |
|
|
|
– |
|
|
|
|
|
|
|
| January 1, 2010 |
|
|
|
|
|
|
|
|
|
|
|
|
|
|
|
|
|
|
|
|
| Available-for-sale investments |
|
|
|
|
|
|
|
|
|
|
|
|
|
|
|
|
|
|
|
|
| ICL (New Israeli shekels) |
|
$ |
1,896 |
|
|
$ |
– |
|
|
$ |
(95 |
) |
|
$ |
– |
|
|
$ |
95 |
|
| Sinofert (Hong Kong dollars) |
|
|
864 |
|
|
|
– |
|
|
|
(43 |
) |
|
|
– |
|
|
|
43 |
|
| Short-term debt (CDN) |
|
|
(263 |
) |
|
|
13 |
|
|
|
– |
|
|
|
(13 |
) |
|
|
– |
|
| Payables (CDN) |
|
|
(167 |
) |
|
|
8 |
|
|
|
– |
|
|
|
(8 |
) |
|
|
– |
|
| Foreign currency derivatives |
|
|
5 |
|
|
|
(20 |
) |
|
|
– |
|
|
|
20 |
|
|
|
– |
|
Interest rate risk
Fluctuations in interest rates impact the future cash flows and fair values of various financial instruments. With respect to its debt portfolio, the company
addresses interest rate risk by using a diversified portfolio of fixed and floating rate instruments. This exposure is also managed by aligning current and long-term assets with demand and fixed-term debt and by monitoring the effects of market
changes in interest rates. Interest rate swaps can be and have been used by the company to further manage its interest rate exposure.
The company
is also exposed to changes in interest rates related to its investments in marketable securities. These securities are included in cash and cash equivalents, and the company’s primary objective is to ensure the security of principal amounts
invested and provide for an adequate degree of liquidity, while achieving a satisfactory return. Its treasury risk management policies specify various investment parameters, including eligible types of investment,
maximum maturity dates, maximum exposure by counterparty and minimum credit ratings.
The
company had no significant exposure to interest rate risk at December 31, 2011, December 31, 2010 and January 1, 2010. The only financial assets bearing any variable interest rate exposure are cash and cash equivalents. As for
financial liabilities, the company has only an insignificant exposure related to a long-term loan that is subject to variable rates. Short-term debt, related to commercial paper, is excluded from interest rate risk as the interest rates are fixed
for the stated period of the debt. The company would only be exposed to variable interest rate risk on the issuance of new commercial paper. It does not measure any fixed-rate debt at fair value. Therefore, changes in interest rates will not affect
income or OCI as there is no change in the carrying value of fixed-rate debt and interest payments are fixed. This analysis assumes all other variables remain constant.
II-47
|
|
|
| |
|
In millions of US dollars except as otherwise
noted |
NOTE 24 Financial Instruments and Related Risk Management continued
Price risk
The company is exposed to commodity price risk resulting from its natural gas
requirements. Its natural gas strategy is based on diversification for its total gas requirements (which represent the forecast consumption of natural gas volumes by its manufacturing and mining facilities). Its objective is to acquire a reliable
supply of natural gas feedstock and fuel on a location-adjusted, cost-competitive basis in a manner that minimizes volatility without undue risk. Its exchange-traded available-for-sale securities also expose the company to equity securities price
risk.
The following table shows the company’s exposure to price risk and the pre-tax effects on net income and OCI of reasonably possible
changes in the relevant commodity or securities prices. This analysis assumes that price decreases related to investments in ICL and Sinofert would not represent an impairment and all other variables remain constant.
|
|
|
|
|
|
|
|
|
|
|
|
|
|
|
|
|
|
|
|
|
|
|
|
|
|
|
|
|
|
|
|
|
|
|
|
|
| |
|
|
|
|
Price Risk |
|
| |
|
Carrying Amount of
Asset (Liability) |
|
|
Effect of 10% decrease in prices
on OCI |
|
|
Effect of 10% increase in prices
on OCI |
|
| |
|
Dec 31,
2011 |
|
|
Dec 31,
2010 |
|
|
Jan 1,
2010 |
|
|
Dec 31,
2011 |
|
|
Dec 31,
2010 |
|
|
Jan 1,
2010 |
|
|
Dec 31,
2011 |
|
|
Dec 31,
2010 |
|
|
Jan 1,
2010 |
|
| Natural gas derivatives |
|
$ |
(265 |
) |
|
$ |
(279 |
) |
|
$ |
(171 |
) |
|
$ |
(14 |
) |
|
$ |
(50 |
) |
|
$ |
(73 |
) |
|
$ |
15 |
|
|
$ |
50 |
|
|
$ |
73 |
|
| Investments in ICL and Sinofert |
|
|
2,265 |
|
|
|
3,842 |
|
|
|
2,760 |
|
|
|
(227 |
) |
|
|
(384 |
) |
|
|
(276 |
) |
|
|
227 |
|
|
|
384 |
|
|
|
276 |
|
The sensitivity analyses included in the tables above should be used with caution as the changes are hypothetical and not
predictive of future performance. The sensitivities are calculated with reference to period-end balances and will change due to fluctuations in the balances throughout the year. In addition, for the purpose of the sensitivity analyses, the effect of
a variation in a particular assumption on the fair value of the financial instrument was calculated independently of any change in another assumption. Actual changes in one factor may contribute to changes in another factor, which may magnify or
counteract the effect on the fair value of the financial instrument.
Fair value
Presented below is a comparison of the fair value of certain financial instruments to their carrying values.
|
|
|
|
|
|
|
|
|
|
|
|
|
|
|
|
|
|
|
|
|
|
|
|
|
| |
|
December 31, 2011 |
|
|
December 31, 2010 |
|
|
January 1, 2010 |
|
| |
|
Carrying Amount
of Liability |
|
|
Fair Value of
Liability |
|
|
Carrying Amount
of Liability |
|
|
Fair Value of
Liability |
|
|
Carrying Amount
of Liability |
|
|
Fair Value of
Liability |
|
| Long-term debt senior notes |
|
$ |
3,750 |
|
|
$ |
4,271 |
|
|
$ |
4,350 |
|
|
$ |
4,525 |
|
|
$ |
3,350 |
|
|
$ |
3,506 |
|
Due to their short-term nature, the fair value of cash and cash equivalents, receivables, short-term debt, and
payables and accrued charges was assumed to approximate carrying value. The company’s derivative instruments and investments in ICL and Sinofert were carried at fair value. The fair value of the company’s senior notes at December 31,
2011 reflected the yield valuation based on observed market prices, which ranged from 1.14 percent to 4.44 percent (December 31, 2010 – 1.08 percent to 5.66 percent, January 1, 2010 – 1.73 percent to 5.83 percent). The fair value
of the company’s other long-term debt instruments approximated carrying value.
Estimated fair values for financial instruments are designed
to approximate amounts at which the instruments could be exchanged in a current arm’s-length transaction between knowledgeable willing parties. The fair value of derivative instruments traded in active markets (such as natural gas futures and
exchange-traded options) was based on the quoted market prices at the reporting date.
The
fair value of derivative instruments that are not traded in an active market (such as natural gas swaps, over-the-counter option contracts and foreign currency derivatives) was determined by using valuation techniques. The company used a variety of
methods and made assumptions that were based on market conditions existing at each reporting date. Natural gas swap valuations were based on a discounted cash flow model. The inputs used in the model included contractual cash flows based on prices
for natural gas futures contracts, fixed prices and notional volumes specified by the swap contracts, the time value of money, liquidity risk, the company’s own credit risk (related to instruments in a liability position) and counterparty
credit risk (related to instruments in an asset position). Certain of the futures contract prices were
II-48
|
|
|
| |
|
In millions of US dollars except as otherwise
noted |
NOTE 24 Financial Instruments and Related Risk Management continued
supported by prices quoted in an active market and others were not based on observable market data. Interest rates used to discount estimated cash flows in 2011 were between 0.62 percent and 5.21
percent (December 31, 2010 – between 0.47 percent and 4.31 percent, January 1, 2010 – between 0.23 percent and 4.67 percent) depending on the settlement date. Over-the-counter option contracts were valued based on quoted market
prices for similar instruments where available or an option valuation model. The fair value of foreign currency derivatives was determined using quoted forward exchange rates at the statements of financial position dates.
Fair value of investments designated as available-for-sale was based on the closing bid price of the common shares as of the statements of financial position
dates.
The company’s fair value hierarchy prioritizes the inputs to valuation techniques used to measure fair
value. The three levels of the fair value hierarchy are:
| Level 1 |
|
Values based on unadjusted quoted prices in active markets that are accessible at the measurement date for identical assets or liabilities
|
| Level 2 |
|
Values based on quoted prices in markets that are not active or model inputs that are observable either directly or indirectly for substantially the full term of
the asset or liability |
| Level 3 |
|
Values based on prices or valuation techniques that require inputs which are both unobservable and significant to the overall fair value measurement.
|
The following table presents the
company’s fair value hierarchy for those financial assets and financial liabilities carried at fair value.
|
|
|
|
|
|
|
|
|
|
|
|
|
|
|
|
|
| |
|
|
|
|
Fair Value Measurements at Reporting Date Using: |
|
| Description |
|
Carrying Amount of
Asset (Liability) |
|
|
Quoted Prices in
Active Markets for
Identical Assets
(Level 1) 1 |
|
|
Significant Other
Observable Inputs
(Level 2) 1,2 |
|
|
Significant
Unobservable
Inputs
(Level 3) 2 |
|
| December 31, 2011 |
|
|
|
|
|
|
|
|
|
|
|
|
|
|
|
|
| Derivative instrument assets |
|
|
|
|
|
|
|
|
|
|
|
|
|
|
|
|
| Natural gas derivatives |
|
$ |
6 |
|
|
$ |
– |
|
|
$ |
– |
|
|
$ |
6
|
|
| Foreign currency derivatives |
|
|
4 |
|
|
|
– |
|
|
|
4 |
|
|
|
– |
|
| Investments in ICL and Sinofert |
|
|
2,265 |
|
|
|
2,265 |
|
|
|
– |
|
|
|
– |
|
| Derivative instrument liabilities |
|
|
|
|
|
|
|
|
|
|
|
|
|
|
|
|
| Natural gas derivatives |
|
|
(271 |
) |
|
|
– |
|
|
|
(36 |
) |
|
|
(235
|
) |
|
|
|
|
|
| December 31, 2010 |
|
|
|
|
|
|
|
|
|
|
|
|
|
|
|
|
| Derivative instrument assets |
|
|
|
|
|
|
|
|
|
|
|
|
|
|
|
|
| Foreign currency derivatives |
|
$ |
5 |
|
|
$ |
– |
|
|
$ |
5 |
|
|
$ |
– |
|
| Investments in ICL and Sinofert |
|
|
3,842 |
|
|
|
3,842 |
|
|
|
– |
|
|
|
– |
|
| Derivative instrument liabilities |
|
|
|
|
|
|
|
|
|
|
|
|
|
|
|
|
| Natural gas derivatives |
|
|
(279 |
) |
|
|
– |
|
|
|
(55 |
) |
|
|
(224 |
) |
|
|
|
|
|
| January 1, 2010 |
|
|
|
|
|
|
|
|
|
|
|
|
|
|
|
|
| Derivative instrument assets |
|
|
|
|
|
|
|
|
|
|
|
|
|
|
|
|
| Natural gas derivatives |
|
$ |
4 |
|
|
$ |
– |
|
|
$ |
1 |
|
|
$ |
3 |
|
| Foreign currency derivatives |
|
|
5 |
|
|
|
– |
|
|
|
5 |
|
|
|
– |
|
| Investments in ICL and Sinofert |
|
|
2,760 |
|
|
|
2,760 |
|
|
|
– |
|
|
|
– |
|
| Derivative instrument liabilities |
|
|
|
|
|
|
|
|
|
|
|
|
|
|
|
|
| Natural gas derivatives |
|
|
(175 |
) |
|
|
– |
|
|
|
(53 |
) |
|
|
(122 |
) |
| 1 |
During 2011 and 2010, there were no transfers between Level 1 and Level 2. |
| 2 |
During 2011 and 2010, there were no transfers into Level 3 and $(3) (2010 – $11) of (gains) losses was transferred out of Level 3 into Level 2 as
(due to the passage of time) the terms of certain natural gas derivatives now mature within 36 months. Our policy is to recognize transfers at the end of the reporting period. |
II-49
|
|
|
| |
|
In millions of US dollars except as otherwise
noted |
NOTE 24 Financial Instruments and Related Risk Management continued
Fair value measurements using
significant unobservable inputs (Level 3)
|
|
|
|
|
|
|
|
|
| |
|
Natural Gas Derivatives |
|
| |
|
2011 |
|
|
2010 |
|
| Balance, beginning of year |
|
$ |
(224 |
) |
|
$ |
(119 |
) |
| Total losses (realized and unrealized) before income taxes |
|
|
|
|
|
|
|
|
| Included in net income (cost of goods sold) |
|
|
(25 |
) |
|
|
(36 |
) |
| Included in other comprehensive income |
|
|
(13 |
) |
|
|
(126 |
) |
| Purchases |
|
|
– |
|
|
|
– |
|
| Sales |
|
|
– |
|
|
|
– |
|
| Issues |
|
|
– |
|
|
|
– |
|
| Settlements |
|
|
36 |
|
|
|
46 |
|
| Transfers of (gains) losses out of Level 3 |
|
|
(3 |
) |
|
|
11 |
|
| Balance, end of year |
|
$ |
(229 |
) |
|
$ |
(224 |
) |
|
|
|
|
|
| NOTE 25 |
|
|
|
CAPITAL MANAGEMENT |
The company’s objectives when managing its capital are to maintain financial flexibility while managing
its cost of, and optimizing its access to, capital. In order to achieve these objectives, its strategy, which was unchanged from 2010, was to maintain its investment grade credit rating. The company monitors its capital structure and, based on
changes in economic conditions, may adjust the structure by adjusting the amount of dividends paid to shareholders, repurchase of shares, issuance of new shares or issuance of new debt.
The company uses a combination of short-term and long-term debt to finance its operations. It typically pays floating rates of interest on short-term debt and credit facilities, and fixed rates on senior
notes.
Net debt and adjusted shareholders’ equity are included as components of the company’s capital structure. The calculation of net
debt, adjusted shareholders’ equity and adjusted capital is set out in the following table:
|
|
|
|
|
|
|
|
|
| |
|
2011 |
|
|
2010 |
|
| Short-term debt obligations |
|
$ |
829 |
|
|
$ |
1,274 |
|
| Current portion of long-term debt obligations |
|
|
7 |
|
|
|
602 |
|
| Long-term debt obligations |
|
|
3,750 |
|
|
|
3,755 |
|
| Deferred debt costs and swap gains |
|
|
(49 |
) |
|
|
(53 |
) |
| Total debt |
|
|
4,537 |
|
|
|
5,578 |
|
| Less: cash and cash equivalents |
|
|
(430 |
) |
|
|
(412 |
) |
| Net debt |
|
|
4,107 |
|
|
|
5,166 |
|
| Total shareholders’ equity |
|
|
7,847 |
|
|
|
6,685 |
|
| Less: accumulated other comprehensive income |
|
|
(816 |
) |
|
|
(2,394 |
) |
| Adjusted shareholders’ equity |
|
|
7,031 |
|
|
|
4,291 |
|
| Adjusted capital 1 |
|
$ |
11,138 |
|
|
$ |
9,457 |
|
| 1 |
Adjusted capital = (total debt – cash and cash equivalents) + (total shareholders’ equity – accumulated other comprehensive income).
|
The company monitors capital on the basis of a number of factors, including the ratios of: net income before
finance costs, income taxes, depreciation and amortization and takeover response costs (“adjusted EBITDA”) to finance costs before unwinding of discount on asset retirement obligations and borrowing costs capitalized to property, plant and
equipment (“adjusted finance costs”); net debt to adjusted EBITDA; net debt to adjusted capital; and fixed-rate debt obligations as a percentage of total debt obligations.
|
|
|
|
|
|
|
|
|
| |
|
2011 |
|
|
2010 |
|
| Components of ratios |
|
|
|
|
|
|
|
|
| Adjusted EBITDA |
|
$ |
4,797 |
|
|
$ |
3,119 |
|
| Net debt |
|
$ |
4,107 |
|
|
$ |
5,166 |
|
| Adjusted finance costs |
|
$ |
227 |
|
|
$ |
217 |
|
| Adjusted capital |
|
$ |
11,138 |
|
|
$ |
9,457 |
|
| Ratios |
|
|
|
|
|
|
|
|
| Adjusted EBITDA to adjusted finance costs 1 |
|
|
21.1 |
|
|
|
14.4 |
|
| Net debt to adjusted EBITDA 2 |
|
|
0.86 |
|
|
|
1.66 |
|
| Net debt to adjusted capital 3 |
|
|
36.9% |
|
|
|
54.6% |
|
| Fixed-rate debt obligations as a percentage of total debt obligations 4 |
|
|
81.7% |
|
|
|
77.2% |
|
| 1 |
Adjusted EBITDA to adjusted finance costs = adjusted EBITDA / adjusted finance costs. |
| 2 |
Net debt to adjusted EBITDA = (total debt – cash and cash equivalents) / adjusted EBITDA. |
| 3 |
Net debt to adjusted capital = (total debt – cash and cash equivalents) / (total debt – cash and cash equivalents + total shareholders’
equity – accumulated other comprehensive income). |
| 4 |
Fixed-rate debt obligations as a percentage of total debt obligations is determined by dividing fixed-rate debt obligations by total debt obligations.
|
II-50
|
|
|
| |
|
In millions of US dollars except as otherwise
noted |
NOTE 25 Capital Management continued
|
|
|
|
|
|
|
|
|
| |
|
2011 |
|
|
2010 |
|
| Net income |
|
$ |
3,081 |
|
|
$ |
1,775 |
|
| Finance costs |
|
|
159 |
|
|
|
121 |
|
| Income taxes |
|
|
1,066 |
|
|
|
701 |
|
| Depreciation and amortization |
|
|
489 |
|
|
|
449 |
|
| Takeover response costs |
|
|
2 |
|
|
|
73 |
|
| Adjusted EBITDA |
|
$ |
4,797 |
|
|
$ |
3,119 |
|
|
|
|
|
|
|
|
|
|
| |
|
2011 |
|
|
2010 |
|
| Finance costs |
|
$ |
159 |
|
|
$ |
121 |
|
| Unwinding of discount on asset retirement obligations |
|
|
(16 |
) |
|
|
(11 |
) |
| Borrowing costs capitalized to property, plant and equipment |
|
|
84 |
|
|
|
107 |
|
| Adjusted finance costs |
|
$ |
227 |
|
|
$ |
217 |
|
Accounting Policies
Leases entered into are classified as either finance or operating leases. Leases that
transfer substantially all of the risks and rewards of ownership of property to the company are accounted for as finance leases. They are capitalized at the commencement of the lease at the lower of the fair value of the leased property and the
present value of the minimum lease payments. Property acquired under a finance lease is depreciated over the shorter of the period of expected use on the same basis as other similar property, plant and equipment and the lease term.
Leases in which a significant portion of the risks and rewards of ownership are retained by the lessor are classified as operating leases. Rental payments
under operating leases are expensed to net income on a straight-line basis over the period of the lease.
Accounting Estimates and Judgments
The company is party to various leases, including leases for railcars and vessels. Judgment is required in considering a number of factors to ensure that leases to which the company is party are classified
appropriately as operating or financing. Such factors include whether the lease term is for the major part of the asset’s economic life and whether the present value of minimum lease payments amounts to substantially all of the fair value of
the leased asset.
Substantially all of the leases to which the company is party have been classified as operating leases.
|
| Supporting Information
Lease commitments |
The company has various long-term operating lease
agreements for land, buildings, port facilities, equipment, ocean-going transportation vessels and railcars, the latest of which expires in 2038. The majority of lease agreements
are renewable at the end of the lease period at market rates. Rental expenses for operating leases for the years ended December 31, 2011 and 2010 were $88, and $82,
respectively.
Purchase commitments
The company has entered into long-term natural gas contracts with the National Gas
Company of Trinidad and Tobago Limited, the latest of which expires in 2018. The contracts provide for prices that vary primarily with ammonia market prices, escalating floor prices and minimum purchase quantities. The commitments included in the
table below are based on floor prices and minimum purchase quantities.
Agreements for the purchase of sulfur for use in the production of
phosphoric acid provide for minimum purchase quantities, and certain prices are based on market rates at the time of delivery. The commitments included in the following table are based on expected contract prices.
Capital commitments
The company has various long-term contractual commitments related to the acquisition of
property, plant and equipment, the latest of which expires in 2014. The commitments included in the following table are based on expected contract prices.
Other commitments
Other commitments consist principally of pipeline capacity, throughput and various rail and vessel freight contracts, the latest of which expires in 2018,
and mineral lease commitments, the latest of which expires in 2032.
II-51
|
|
|
| |
|
In millions of US dollars except as otherwise
noted |
NOTE 26 Commitments continued
Minimum future commitments under these contractual arrangements are shown below.
|
|
|
|
|
|
|
|
|
|
|
|
|
|
|
|
|
|
|
|
|
| |
|
Operating
Leases |
|
|
Purchase
Commitments |
|
|
Capital
Commitments |
|
|
Other
Commitments |
|
|
Total |
|
| Within 1 year |
|
|
$ 90 |
|
|
|
$ 426 |
|
|
|
$ 393 |
|
|
|
$ 29 |
|
|
|
$ 938 |
|
| 1 to 3 years |
|
|
160 |
|
|
|
226 |
|
|
|
82 |
|
|
|
26 |
|
|
|
494 |
|
| 3 to 5 years |
|
|
115 |
|
|
|
98 |
|
|
|
– |
|
|
|
8 |
|
|
|
221 |
|
| Over 5 years |
|
|
143 |
|
|
|
91 |
|
|
|
– |
|
|
|
16 |
|
|
|
250 |
|
| Total |
|
|
$ 508 |
|
|
|
$ 841 |
|
|
|
$ 475 |
|
|
|
$ 79 |
|
|
|
$ 1,903 |
|
|
|
|
|
|
| NOTE 27 |
|
|
|
CONTINGENCIES AND OTHER MATTERS |
Accounting Estimates and Judgments
The company is exposed to possible losses and gains related to environmental matters and
other various claims and lawsuits pending for and against it in the ordinary course of business. Prediction of the outcome of such uncertain events (i.e., being virtually certain, probable, remote or undeterminable), determination of
whether recognition or disclosure in the consolidated financial statements is required and estimation of potential financial effects are matters for judgment. Where no amounts are recognized, such amounts are contingent and disclosure may be
appropriate. While the amount disclosed in the consolidated financial statements may not be material, the potential for large liabilities exists and therefore these estimates could have a material impact on the company’s consolidated financial
statements.
Supporting Information
PCS is a shareholder in Canpotex, which markets
Saskatchewan potash offshore. Should any operating losses or other liabilities be incurred by Canpotex, the shareholders have contractually agreed to reimburse it in proportion to each shareholder’s productive capacity. Through
December 31, 2011, there were no such operating losses or other liabilities.
Mining risk
As is
typical with others in the industry, the company is unable to acquire insurance for underground assets.
Legal and other matters
Significant environmental site assessment and/or remediation matters of note include the following:
| Ÿ |
|
The company, along with other parties, has been notified by the US Environmental Protection Agency (“USEPA”) of potential liability under the US
Comprehensive Environmental Response, Compensation and Liability Act
|
| |
|
of 1980 (“CERCLA”) with respect to certain soil and groundwater conditions at a site in Lakeland, Florida that includes a former PCS Joint Venture fertilizer blending facility and
certain surrounding properties. A Record of Decision (“ROD”) issued in September 2007 provides for a remedy that requires excavation of impacted soils and interim treatment of groundwater. The total remedy cost is estimated in the ROD to
be $9. In September 2010, the USEPA approved the Remedial Design Report to address the soil contamination. While subject to final construction inspection by the USEPA, the soil remediation has been performed. Although PCS Joint Venture sold the
Lakeland property in July 2006, PCS Joint Venture has retained the above-described remediation responsibilities and has indemnified the third-party purchaser for the costs of remediation and certain related items. |
| Ÿ |
|
The USEPA has identified PCS Nitrogen, Inc. (“PCS Nitrogen”) as a potentially responsible party with respect to a former fertilizer blending
operation in Charleston, South Carolina known as the Planters Property or Columbia Nitrogen site, formerly owned by a company from which PCS Nitrogen acquired certain other assets. The USEPA has requested reimbursement of $3 of previously
incurred response costs and the performance or financing of future site investigation and response activities from PCS Nitrogen and other named potentially responsible parties. The current owner of the Planters Property filed a complaint against PCS
Nitrogen in the United States District Court for the District of South Carolina seeking environmental response costs. The district court allocated 30 percent of the liability for response costs at the site to PCS Nitrogen, as well as a
proportional share of any costs that cannot be recovered from another responsible party. PCS Nitrogen has filed a notice of appeal to the United States Court of Appeals for the Fourth Circuit. The ultimate amount of liability for PCS Nitrogen, if
any, depends upon the final outcome of the litigation, the amount needed for remedial activities, the ability of other parties to pay and the availability of insurance. |
| Ÿ |
|
PCS Phosphate has agreed to participate, on a non-joint and several basis, with parties to an Administrative Settlement Agreement with the USEPA
|
II-52
|
|
|
| |
|
In millions of US dollars except as otherwise
noted |
NOTE 27 Contingencies and Other Matters continued
| |
|
(“Settling Parties”) in a removal action and the payment of certain other costs associated with PCB soil contamination at the Ward Superfund Site in Raleigh, North Carolina
(“Site”), including reimbursement of past USEPA costs. The removal activities commenced in August 2007 and are estimated to cost $75. The Settling Parties have initiated CERCLA contribution litigation against PCS Phosphate and more than
100 other entities. PCS Phosphate filed crossclaims and counterclaims seeking cost recovery. In addition to the removal action at the Site, the USEPA has investigated sediments downstream in what is called “Operable Unit 1.” In September
2008, the USEPA issued a final remedy for Operable Unit 1, with an estimated cost of $6. The USEPA issued a Unilateral Administrative Order (“UAO”) dated September 29, 2011 to a number of entities, requiring them to implement the
remedy for Operable Unit 1. PCS Phosphate did not receive the UAO. At this time, the company is unable to evaluate the extent of any exposure that it may have for the matters addressed in the UAO and contribution litigation.
|
| Ÿ |
|
Pursuant to the 1996 Corrective Action Consent Order (the “Order”) executed between PCS Nitrogen Fertilizer, L.P., formerly known as Arcadian
Fertilizer, L.P. (“PCS Nitrogen Fertilizer”) and the Georgia Department of Natural Resources, Environmental Protection Division (“GEPD”) in conjunction with PCS Nitrogen Fertilizer’s purchase of real property located in
Augusta, Georgia from the entity from which PCS Nitrogen Fertilizer previously leased such property, PCS Nitrogen Fertilizer agreed to perform certain activities to investigate and, if necessary, implement corrective measures for substances in soil
and groundwater. The investigation has proceeded and various corrective measures for substances in groundwater have been proposed to and, in part, approved by GEPD. PCS Nitrogen Fertilizer will implement the approved corrective measures for
substances in groundwater, but until GEPD approves the investigation results and a final corrective action plan, PCS Nitrogen Fertilizer is unable to estimate with reasonable certainty the total cost of its corrective action obligations under the
Order. |
| Ÿ |
|
In December 2009, during a routine inspection of a gypsum stack at the White Springs, Florida facility, a sinkhole was discovered that resulted in the
loss of approximately 82 million gallons of water from the stack. The company is sampling production and monitoring wells on its property and drinking water wells on neighboring property to assess impacts. It incurred costs of $17 to address
the sinkhole between the time of discovery through completion of remediation in July 2011. In December 2010, the company entered into a consent order with the Florida Department of Environmental Protection (“FDEP”) pursuant to which the
company agreed to, among other things, remediate the sinkhole and perform additional monitoring of the groundwater quality and hydrogeologic conditions related to the sinkhole collapse. The company submitted, and FDEP is reviewing, the Remedial
Summary Report for the sinkhole remediation. The company also entered into an order on consent with the USEPA. In May 2011, the USEPA and the company’s Board of Directors approved the company’s proposal to implement
|
| |
|
certain mitigation measures to meet the goals of the USEPA order on consent. The company remeasured the ARO for the White Springs gypsum stacks to account for the measures identified in the
proposal. This resulted in a $39 increase to the ARO, of which $33 was capitalized as an addition to the related long-lived asset and $6 was expensed in 2011. |
The company is also engaged in ongoing site assessment and/or remediation activities at several other facilities and sites, and anticipated costs associated with these matters are added to accrued
environmental costs in the manner previously described in Note 14. Based on current information, the company does not believe that its future obligations with respect to these facilities and sites are reasonably likely to have a material adverse
effect on its consolidated financial position or results of operations.
Other significant matters of note include the following:
| Ÿ |
|
The USEPA has an ongoing initiative to evaluate implementation within the phosphate industry of a particular exemption for mineral processing wastes under
the hazardous waste program. In connection with this industry-wide initiative, the USEPA conducted inspections at numerous phosphate operations and notified the company of alleged violations of the US Resource Conservation and Recovery Act
(“RCRA”) at its plants in Aurora, North Carolina; Geismar, Louisiana; and White Springs, Florida. The company has entered into RCRA 3013 Administrative Orders on Consent and has performed certain site assessment activities at all three
plants. At this time, it does not know the scope of corrective action, if any, that may be required. The company continues to participate in settlement discussions with the USEPA but is uncertain if any resolution will be possible without
litigation, or, if litigation occurs, what the outcome would be. At this time, it is unable to evaluate the extent of any exposure it may have in these matters. |
| Ÿ |
|
The USEPA has begun an initiative to evaluate compliance with the Clean Air Act at sulfuric acid and nitric acid plants. In connection with this
industry-wide initiative, it has sent requests for information to numerous facilities, including the company’s plants in Augusta, Georgia; Aurora, North Carolina; Geismar, Louisiana; Lima, Ohio; and White Springs, Florida. The USEPA has
notified the company of various alleged violations of the Clean Air Act at its Geismar, Louisiana plant. The government has demanded process changes and penalties that would cost approximately $34, but the company denies that it has any liability
for the Geismar, Louisiana matter. Although it is proceeding with planning and permitting for the process changes demanded by the government, the company is uncertain if any resolution will be possible without litigation, or, if litigation occurs,
what the outcome would be. In July 2010, without alleging any specific violation of the Clean Air Act, the USEPA requested that the company meet and demonstrate compliance with the Clean Air Act for specified projects undertaken at the White
Springs, Florida sulfuric acid plants. The company participated in such meeting but, at this time, is unable to evaluate if it has any exposure.
|
II-53
|
|
|
| |
|
In millions of US dollars except as otherwise
noted |
NOTE 27 Contingencies and Other Matters continued
| Ÿ |
|
Significant portions of the company’s phosphate reserves in Aurora, North Carolina are located in wetlands. Under the Clean Water Act, the company
must obtain a permit from the US Army Corps of Engineers (the “Corps”) before mining in the wetlands. In January 2009, the Division of Water Quality of the North Carolina Department of Natural Resources issued a certification under
Section 401 of the Clean Water Act that mining of phosphate in excess of 30 years from lands owned or controlled by the company, including some wetlands, would not degrade water quality. Thereafter, in June 2009, the Corps issued the company a
permit that will allow it to mine the phosphate deposits identified in the Section 401 certification. USEPA decided not to seek additional review of the permit. In March 2009, four environmental organizations (Pamlico-Tar River Foundation,
North Carolina Coastal Federation, Environmental Defense Fund and Sierra Club, collectively, the “petitioners”), filed a Petition for a Contested Case Hearing before the North Carolina Office of Administrative Hearings
(“OAH”), challenging the Section 401 certification. The company has intervened in this proceeding. Cross motions for summary judgment by the petitioners and the company have been filed, briefed and argued. The OAH has not issued a
decision on them. At this time, the company is unable to evaluate the extent of any exposure that it may have in this matter. |
| Ÿ |
|
There is no certainty as to the scope or timing of any final, effective requirements to control greenhouse gas emissions in the US or Canada. Canada has
withdrawn from participation in the Kyoto Protocol, and the Canadian government previously announced its intention to coordinate greenhouse gas policies with the US. Although the US Congress has not passed any greenhouse gas emission control laws,
the USEPA has adopted several rules to control such emissions using authority under existing environmental laws. In January 2011, the USEPA began phasing in requirements for projects that result in a significant increase in greenhouse gas emissions
at the company’s plants to obtain permits incorporating the “best available control technology.” The company is not aware of any projects at its facilities that would be subject to these requirements. Some Canadian provinces and
US states are considering the adoption of greenhouse gas emission control requirements. In Saskatchewan, provincial regulations pursuant to the Management and Reduction of Greenhouse Gases Act, which impose a type of carbon tax to achieve a goal of
a 20 percent reduction in greenhouse gas emissions by 2020 compared to 2006 levels, may become effective in 2012. The company is monitoring these developments, and, except as indicated above, their effect on its operations cannot be determined
with certainty at this time. |
| Ÿ |
|
In December 2010, the USEPA issued a final rule to restrict nutrient concentrations in surface waters in Florida to levels below those currently permitted
at the company’s White Springs, Florida plant. While these revised nutrient criteria are to become part of Florida’s water quality standards on
|
| |
|
March 6, 2012, USEPA has proposed to extend the effective date until June 4, 2012 to allow the State of Florida to develop its own rulemaking for numeric nutrient criteria. The State of
Florida has adopted rules, subject to approval by USEPA, that could substitute for the federal rules. Projected capital costs resulting from the rule could be in excess of $100 for White Springs, and there is no guarantee that controls can be
implemented that are capable of achieving compliance with the revised nutrient standards under all flow conditions. This estimate assumes that the rule survives court challenges and that none of the site-specific mechanisms for relief from the
revised nutrient criteria are available to the plant. Various judicial challenges to both the state and federal rules have been filed, including one lawsuit against the federal rule by The Fertilizer Institute (“TFI”) and White Springs. In
June 2011, TFI, White Springs and additional parties filed a Motion for Summary Judgment seeking, among other things, to vacate the USEPA rule. In September 2011, the USEPA filed its Motion for Summary Judgment seeking to uphold its rule. On
February 18, 2012, the United States District Court for the Northern District of Florida (“District Court”) ruled on the summary judgment motions and upheld the USEPA numeric nutrient criteria for Florida’s lakes and springs but
rejected the criteria for Florida’s streams and rivers as arbitrary and capricious. The company is evaluating the District Court’s decision and continues to monitor the administrative challenges to the state rule. The state rule has been
submitted to USEPA for approval. The prospects for implementation of either the federal or the state rule and the availability of the site-specific relief mechanisms under either rule are uncertain. |
| Ÿ |
|
The company, having been unable to agree with Mosaic Potash Esterhazy Limited Partnership (“Mosaic”) on the remaining amount of potash that
it is entitled to receive from Mosaic pursuant to the mining and processing agreement in respect of its rights at the Esterhazy mine, issued a Statement of Claim in the Saskatchewan Court of Queen’s Bench (“Court”) against Mosaic
in May 2009 and the claim was amended in January 2010. In the Amended Statement of Claim, the company asserted that it has the right under the mining and processing agreement to receive potash from Mosaic until at least 2012 and potentially much
later, and sought an order from the Court declaring the amount of potash which it has the right to receive. Mosaic, in its Statement of Defence, asserted that at a delivery rate of 1.24 million tons of product per year, the company’s
entitlement to receive potash under the mining and processing agreement would terminate August 30, 2010. |
In addition, at the time of filing its Statement of Defence, Mosaic commenced a counterclaim against the company, asserting that it had breached the mining and processing agreement due to its refusal to
take delivery of potash product under the agreement based on an event of force majeure.
II-54
|
|
|
| |
|
In millions of US dollars except as otherwise
noted |
NOTE 27 Contingencies and Other Matters continued
On December 7, 2011, the company and Mosaic entered into a settlement agreement to end the
litigation. Under the settlement, Mosaic will deliver the balance of potash tonnes owed to the company for the 2011 and 2012 calendar years and the mining and processing agreement will terminate on December 31, 2012. As part of the settlement the
company had the right to elect (and has elected) to receive 10 percent of the tonnes to be delivered in 2012 in the first quarter of 2013, and the parties also agreed that on December 31, 2012 the Canpotex Esterhazy productive capacity shall be
reallocated from the company to Mosaic. Further, it was agreed that Mosaic’s counterclaim for damages arising from the company’s declaration of force majeure in April 2009 would be dismissed. By Consent Judgment issued December 16, 2011,
the claim and counterclaim were dismissed with prejudice and without costs.
| Ÿ |
|
In September and October 2008, the company and PCS Sales (USA), Inc. were named as defendants in eight very similar antitrust complaints filed in federal
courts. Other potash producers are also defendants in these cases. Each of the separate complaints alleges conspiracy to fix potash prices, to divide markets, to restrict supply and to fraudulently conceal the conspiracy, all in violation of Section
1 of the Sherman Act. |
Five of the eight complaints were brought by plaintiffs who claim to have purchased
potash directly from at least one of the defendants during the period between July 1, 2003 and the present (collectively, the “Direct Purchaser Plaintiffs”). All five Direct Purchaser Plaintiffs purport to sue on behalf of a class of
persons who purchased potash in the United States directly from a defendant. The Direct Purchaser Plaintiffs, seek unspecified treble damages, injunctive relief, attorneys’ fees, costs and pre- and post-judgment interest.
The other three complaints were brought by plaintiffs who claim to be indirect purchasers of potash (collectively, the “Indirect
Purchaser Plaintiffs”). The Indirect Purchaser Plaintiffs, purport to sue on behalf of all persons who purchased potash indirectly in the United States. In addition to the Sherman Act claim described above, the Indirect Purchaser Plaintiffs
also assert claims for violation of various state antitrust laws; violations of various state consumer protection statutes; and for unjust enrichment. The Indirect Purchaser Plaintiffs seek injunctive relief, unspecified damages, treble damages
where allowed, costs, fees and pre- and post-judgment interest.
All eight lawsuits have been consolidated into a Multidistrict
Litigation proceeding, or MDL, for coordinated pretrial proceedings in the United States District Court for the Northern District of Illinois (“District Court”). In June 2009, PCS, along with other defendants, filed a motion to dismiss the
Indirect Purchaser Plaintiffs’ amended consolidated complaint and a motion to dismiss the Direct Purchaser Plaintiffs amended consolidated complaint. In November 2009, the District Court granted in part and denied in
part the defendants’ motion to dismiss the Indirect Purchasers’ amended consolidated complaint. Specifically, the District Court dismissed the Indirect Purchasers
Plaintiffs’ federal claim and all state law claims except those arising out of the state antitrust laws of Michigan and Kansas and the plaintiffs’ Iowa unjust enrichment claim. On that same day, the District Court denied, in its
entirety, the defendants’ motion to dismiss the Direct Purchaser Plaintiffs’ amended consolidated complaint. The District Court certified the issues for interlocutory appeal and the US Court of Appeals for the Seventh Circuit
(“Seventh Circuit”) accepted the defendants’ petition. In September 2011, a two-judge panel from the Seventh Circuit vacated the trial court’s order denying the defendants’ Motion to Dismiss and remanded the case to the
trial court with instructions to dismiss the Plaintiffs’ Amended Complaint. In October 2011, the plaintiffs filed a Petition for Rehearing En Banc with the Seventh Circuit. In December 2011, the Seventh Circuit granted plaintiff’s Petition
for Rehearing En Banc and vacated the panel’s opinion and judgment that were issued in September 2011. Oral argument before the full Seventh Circuit occurred on February 8, 2012 and the parties are awaiting a decision. The Seventh Circuit has
stayed the District Court proceedings pending the appeal.
The company and PCS Sales (USA), Inc. believe each of these eight
private antitrust lawsuits is without merit and intend to defend them vigorously.
In addition, various other claims and lawsuits are pending
against the company in the ordinary course of business. While it is not possible to determine the ultimate outcome of such actions at this time, and inherent uncertainties exist in predicting such outcomes, the company believes that the ultimate
resolution of such actions is not reasonably likely to have a material adverse effect on its consolidated financial position or results of operations.
The breadth of the company’s operations and the global complexity of tax regulations require assessments of uncertainties and judgments in estimating the taxes it will ultimately pay. The final taxes
paid are dependent upon many factors, including negotiations with taxing authorities in various jurisdictions, outcomes of tax litigation and resolution of disputes arising from federal,
provincial, state and local tax audits. The resolution of these uncertainties and the associated final taxes may result in adjustments to the company’s tax assets and tax liabilities.
The company owns facilities that have been either permanently or indefinitely shut down. It expects to incur nominal annual expenditures for site security
and other maintenance costs at some of these facilities. Should the facilities be dismantled, certain other shutdown-related costs may be incurred. Such costs are not expected to have a material adverse effect on the company’s consolidated
financial position or results of operations and would be recognized and recorded in the period in which they are incurred.
II-55
|
|
|
| |
|
In millions of US dollars except as otherwise
noted |
In the normal course of operations, the company provides indemnifications, which are often standard
contractual terms, to counterparties in transactions such as purchase and sale contracts, service agreements, director/officer contracts and leasing transactions. These indemnification agreements may require the company to compensate the
counterparties for costs incurred as a result of various events, including environmental liabilities and changes in (or in the interpretation of) laws and regulations, or as a result of litigation claims or statutory sanctions
that may be suffered by the counterparty as a consequence of the transaction. The terms of these indemnification agreements will vary based upon the contract, the nature of which prevents the company from making a reasonable estimate of the maximum
potential amount that it could be required to pay to counterparties. Historically, the company has not made any significant payments under such indemnifications and no amounts have been accrued in the accompanying consolidated financial statements
with respect to these indemnification guarantees (apart from any appropriate accruals relating to the underlying potential liabilities).
The
company enters into agreements in the normal course of business that may contain features which meet the definition of a guarantee. Various debt obligations (such as overdrafts, lines of credit with counterparties for derivatives and
back-to-back loan arrangements) and other commitments (such as railcar leases) related to certain subsidiaries and investees have been directly guaranteed by the company under such agreements with third parties. It would be required to perform on
these guarantees in the event of default by the guaranteed parties. No material loss is anticipated by reason of such agreements and guarantees. At December 31, 2011, the maximum potential amount of future (undiscounted) payments under
significant guarantees provided to third parties approximated $598. It is unlikely that these guarantees will be drawn upon and, since the maximum potential amount of future payments does not consider the possibility of recovery under recourse or
collateral provisions, this amount is not indicative of future cash requirements or the company’s expected losses from these arrangements. At December 31, 2011, no subsidiary balances subject to guarantees were outstanding in connection
with the company’s cash management facilities, and it had no liabilities recorded for other obligations other than subsidiary bank borrowings of approximately $6, which are reflected in other long-term debt in Note 12.
The company has guaranteed the gypsum stack capping, closure and post-closure obligations of White Springs and PCS Nitrogen in Florida and Louisiana,
respectively, pursuant to the financial assurance regulatory requirements in
those states. It has guaranteed the performance of certain remediation obligations of PCS Joint Venture and PCS Nitrogen at the Lakeland, Florida and Augusta, Georgia sites, respectively. The
USEPA has announced that it plans to adopt rules requiring financial assurance from a variety of mining operations, including phosphate rock mining. It is too early in the rulemaking process to determine what the impact, if any, on the
company’s facilities will be when these rules are issued.
The environmental regulations of the Province of Saskatchewan require each potash
mine to have decommissioning and reclamation plans, and financial assurances for these plans, approved by the responsible provincial minister. The Minister of the Environment for Saskatchewan (“MOE”) has approved the
plans previously submitted by the company, which had provided a CDN $2 irrevocable letter of credit and a payment of CDN $3 into the agreed-upon trust fund. Under the regulations, the decommissioning and reclamation plans and financial
assurances are to be reviewed at least once every five years, or as required by the MOE. The next scheduled review was to be completed by June 30, 2011. The company submitted its decommissioning and reclamation plans and its financial
assurances proposal in May 2011 and is awaiting a response. The MOE has advised that it considers the company in compliance with the regulations until the review is finalized and a response is provided. The MOE had previously indicated that it would
be seeking an increase of the amount paid into the trust fund by the company for this submission. Based on current information, the company does not believe that its financial assurance requirements or future obligations with respect to this matter
are reasonably likely to have a material impact on its consolidated financial position or results of operations.
The company has met its
financial assurance responsibilities as of December 31, 2011. Costs associated with the retirement of long-lived tangible assets have been accrued in the accompanying consolidated financial statements to the extent that a legal or constructive
liability to retire such assets exists.
During the period, the company entered into various other commercial letters of credit in the normal
course of operations. As at December 31, 2011, $51 of letters of credit were outstanding.
The company expects that it will be able to
satisfy all applicable credit support requirements without disrupting normal business operations.
II-56
|
|
|
| |
|
In millions of US dollars except as otherwise
noted |
|
|
|
|
|
| NOTE 29 |
|
|
|
RELATED PARTY TRANSACTIONS |
Accounting Policies
A person or entity is related to the company, and therefore considered a related party,
if any of the following conditions exist: an entity is an associate or joint venture; a person is a member of key management personnel (and their families); a post-employment benefit plan is for the benefit of employees; or a person has significant
influence.
Key management personnel are the company’s directors and executive officers as disclosed in its 2011 and 2010 Annual Reports on
10-K, as applicable.
Sale of goods
Goods were sold to the following related parties:
|
|
|
|
|
|
|
|
|
| |
|
2011 |
|
|
2010 |
|
| Canpotex |
|
$ |
1,956 |
|
|
$ |
1,273 |
|
| Key management personnel (and their families) |
|
|
34 |
|
|
|
32 |
|
| |
|
$ |
1,990 |
|
|
$ |
1,305 |
|
The company sells potash from its Saskatchewan mines for use outside Canada and the US exclusively to Canpotex. Sales to all
related parties are at prevailing market prices and are settled on normal trade terms.
The receivables outstanding from related parties arise from sale transactions described above. They are
unsecured in nature and bear no interest. There are no provisions held against receivables from related parties. Receivables from Canpotex are shown in Note 3.
Key management personnel compensation
|
|
|
|
|
|
|
|
|
| |
|
2011 |
|
|
2010 |
|
| Salaries and other short-term benefits |
|
$ |
12 |
|
|
$ |
11 |
|
| Share-based payments |
|
|
5 |
|
|
|
16 |
|
| Post-employment benefits |
|
|
4 |
|
|
|
5 |
|
| Termination benefits |
|
|
2 |
|
|
|
– |
|
| |
|
$ |
23 |
|
|
$ |
32 |
|
Transactions with post-employment
benefit plans
Disclosures related to the company’s post-employment
benefit plans are shown in Note 13.
|
|
|
|
|
| NOTE 30 |
|
|
|
TRANSITION TO IFRS |
The company adopted IFRS on January 1, 2011 with effect from January 1, 2010. Its financial
statements for the year ending December 31, 2011 are the first annual consolidated financial statements that comply with IFRS.
Initial Elections Upon Adoption
Most adjustments required on transition to IFRS were made retrospectively against opening retained earnings as of the date of the first comparative
statements of financial position presented (i.e., January 1, 2010). IFRS 1 provides entities adopting IFRS for the first time with a number of optional exemptions and mandatory exceptions, in certain areas, to the general requirement for full
retrospective application of IFRS. The most significant IFRS 1 exemptions applied to the company upon adoption are summarized below.
IFRS 1 exemption options
Choice: The company may elect, on transition to
IFRS, to either restate all past business combinations in accordance with IFRS 3, “Business Combinations,” or apply an elective exemption from applying IFRS 3 to past business combinations.
Policy selection: The company elected to apply the exemption such that transactions entered into prior
to the transition date were not restated. Specific requirements, such as maintaining the classification of the acquirer and the acquiree, recognizing or derecognizing certain acquired assets or liabilities as required under IFRS and remeasuring
certain assets and liabilities at fair value, were met.
Transition impact: None.
Expected future impact: None.
Property, Plant and Equipment
Choice: The company may elect to report items of property, plant and equipment in its opening statement of financial position on the transition date
at a deemed cost instead of the actual cost that would be determined under IFRS. The deemed cost of an item may be either its fair value at the date of transition to IFRS or an amount determined by a previous revaluation under Canadian GAAP (as long
as that amount was close to its fair value, cost or adjusted cost). The exemption can be applied on an asset-by-asset basis.
Policy
selection: The company elected to use the fair values of a number of previously impaired items of property, plant and equipment (with a total
II-57
|
|
|
| |
|
In millions of US dollars except as otherwise
noted |
NOTE 30 Transition to IFRS continued
carrying amount of zero) as their deemed costs. The aggregate of the fair values for these particular assets was zero. Therefore, no adjustment resulted on transition to IFRS due to this
election.
Transition impact: None.
Expected future impact: None.
Share-Based Payments
Choice: The company may elect not to apply IFRS 2, “Share-based Payment,” to equity instruments granted on or before November 7, 2002 or which vested before its date of transition to
IFRS. It may also elect not to apply IFRS 2 to liabilities arising from share-based payment transactions which settled before the date of transition to IFRS.
Policy selection: The company elected not to apply IFRS 2 to equity instruments granted on or before November 7, 2002 or which vested before its date of transition to IFRS. It also elected not to
apply IFRS 2 to liabilities arising from share-based payment transactions which settled before the date of transition to IFRS.
Transition
impact: None.
Expected future impact: None.
Employee Benefits
Choice: The company may elect to recognize all cumulative actuarial gains and losses through opening retained earnings at the date of transition to IFRS. Actuarial gains and losses would have to be
recalculated under IFRS from the inception of each defined benefit plan if the exemption is not taken. The company’s choice must be applied to all defined benefit plans consistently.
Policy selection: The company used this exemption. As it adopted an ongoing policy of recognizing all actuarial gains and losses immediately in OCI, all cumulative actuarial gains and losses were
recognized at the date of transition to IFRS.
Transition impact: See Employee Benefits under “Changes in Accounting Policies.”
Expected future impact: See Employee Benefits under “Changes in Accounting Policies.”
Foreign Exchange
Choice: On transition, cumulative translation gains or losses in AOCI can be
reclassified to retained earnings at the company’s election. If not elected, all cumulative translation differences must be recalculated under IFRS from inception.
Policy selection: The company elected to recalculate the cumulative foreign exchange translation gains or losses in AOCI under IFRS retrospectively.
Transition impact: None.
Expected future impact: None.
Decommissioning Liabilities
Choice: In accounting for changes in obligations to dismantle, remove and restore items of property, plant and equipment (asset retirement
obligations), the guidance in IFRS requires changes in such obligations to be added to or deducted from the cost of the asset to which they relate. The adjusted depreciable amount of the asset is then depreciated prospectively over its remaining
useful life. Rather than recalculating the effect of all such changes throughout the life of the obligation, the company may elect to measure the liability and the related depreciation effects at the date of transition to IFRS.
Policy selection: The company elected to measure asset retirement obligations and the related depreciation effects at the date of transition to IFRS.
Transition impact: See Provisions under “Changes in Accounting Policies.”
Expected future impact: See Provisions under “Changes in Accounting Policies.”
Oil and Gas Properties
Choice: For a first-time adopter that has previously employed the full cost
method of accounting for oil and natural gas exploration and development expenditures, IFRS 1 provides an exemption which allows entities to measure those assets at the transition date at amounts determined under the entity’s previous GAAP.
Policy selection: The company elected to measure its oil and gas assets at their Canadian GAAP carrying value at the date of transition to
IFRS.
Transition impact: None.
Expected future impact: None.
IFRS 1 mandatory exceptions
IFRS 1 prohibits retrospective application of some aspects of other IFRS. As a result, the following mandatory exceptions from full retrospective application
of IFRS were applied and relevant on transition to IFRS:
| Ÿ |
|
The company’s estimates in accordance with IFRS at the date of transition to IFRS were consistent with estimates made for the same date in accordance
with Canadian GAAP (after adjustments to reflect any difference in accounting policies). |
| Ÿ |
|
The company did not reflect in its opening IFRS statements of financial position a hedging relationship of a type that did not qualify for hedge
accounting in accordance with IFRS. No transactions entered into before the date of transition to IFRS were retrospectively designated as hedges.
|
II-58
|
|
|
| |
|
In millions of US dollars except as otherwise
noted |
NOTE 30 Transition to IFRS continued
Changes in Accounting Policies
The key areas where accounting policies differ or where accounting policy decisions were
necessary that impact the company’s consolidated financial statements are set out in the following table. Note that this does not include transition policy choices made under IFRS 1, described above, although their impact is included below.
|
|
|
Accounting
Policy Area |
|
Impact of Policy Adoption |
| (a) Impairment of Assets |
|
Choices: There are no policy choices available under IFRS.
Differences from previous Canadian GAAP: IAS 36, “Impairment of
Assets,” uses a one-step approach for both testing for and measurement of impairment, with asset carrying values compared directly with the higher of fair value less costs to sell and value in use (which uses discounted future cash flows).
Canadian GAAP generally used a two-step approach to impairment testing, first comparing asset carrying values with undiscounted future cash flows to determine whether impairment exists, and then measuring any impairment by comparing asset carrying
values with fair values. This difference may potentially result in more impairments where carrying values of assets were previously supported under Canadian GAAP on an undiscounted cash flow basis, but could not be supported on a discounted cash
flow basis. In addition, IAS 36 requires the reversal of any previous
impairment losses (to the amounts the assets would now be carried at had depreciation continued) where circumstances have changed such that the impairments have been reduced. Canadian GAAP prohibited reversal of impairment losses.
Transition impact: The company identified certain assets for which impairment
losses had been previously recognized, but which were no longer impaired. The previously recognized impairment losses were reversed on transition to IFRS, which resulted in an increase in the carrying amount of property, plant and equipment at
December 31, 2010 of $9 (January 1, 2010 – $10). Net income for 2010 decreased by $1. The company also identified items which were regarded as impaired under IFRS, but not under Canadian GAAP. As a result, equity at December 31, 2010 decreased
by $4 (January 1, 2010 – $2). Net income for 2010 decreased by $2.
Expected future impact: Dependent upon future circumstances, as described above. |
| (b) Employee Benefits |
|
Choices: Under IAS 19, “Employee Benefits,” actuarial gains and losses are
permitted to be recognized directly in OCI rather than through net income. Policy selection: Actuarial gains and losses will be recognized in OCI.
Differences from previous Canadian GAAP: IAS 19 requires the past service cost element of defined benefit plans to be expensed on an accelerated
basis, with vested past service costs expensed immediately and unvested past service costs recognized on a straight-line basis until the benefits become vested. Under Canadian GAAP, past service costs were generally amortized on a straight-line
basis over the average remaining service period of active employees expected under the plan. Under Canadian GAAP, certain gains and losses which were unrecognized at the time of adopting the current Canadian accounting standard were permitted to be amortized over a period under transitional
provisions of the current standards. Those amounts must be recognized on transition to IFRS. Transition impact: Equity at December 31, 2010 was reduced by $365 (January 1, 2010 – $352). Net income for 2010 increased by $24.
Expected future impact: The effect of actuarial gains and losses will no longer
affect net income under the company’s accounting policy choice. Shareholders’ equity is expected to be subject to greater variability as the effects of actuarial gains and losses will be recognized immediately, rather than being deferred
and amortized over a period of time. |
II-59
|
|
|
| |
|
In millions of US dollars except as otherwise
noted |
NOTE 30 Transition to IFRS continued
|
|
|
Accounting
Policy Area |
|
Impact of Policy Adoption |
| (c) Share-Based Payments |
|
Choices: There are no policy choices available under IFRS.
Differences from previous Canadian GAAP: IFRS 2, “Share-Based
Payments,” requires that cash-settled share-based payments to employees be measured (both initially and at each reporting date) based on fair value of the awards. Canadian GAAP required that such payments be measured based on the intrinsic
value of the awards. This difference impacted the accounting measurement of some of the company’s cash-settled employee incentive plans, such as its performance unit incentive plan.
IFRS 2 requires an estimate of compensation cost to be recognized in relation to
performance options for which service has commenced but which have not yet been granted. The compensation cost recognized is trued up once options have been granted. Under Canadian GAAP, compensation cost was first recognized when the options were
granted. This will create a timing difference between IFRS and Canadian GAAP in terms of when compensation cost relating to employee service provided in the first quarter of the year is recognized. In relation to stock option costs in 2010, net
income decreased in the first quarter and increased in the second quarter by $13. Net income and equity for annual periods are not affected.
Transition impact: In relation to the company’s cash-settled share-based payments, equity at December 31, 2010 increased by $1 (January 1, 2010
– $3). Net income for 2010 decreased by $2. Expected future
impact: Any future significant difference between the fair value and intrinsic value of outstanding units under the company’s performance unit incentive plan will result in different measurements under IFRS and Canadian GAAP in any
particular year; however, this will be a timing difference only. The total future compensation expense relating to these awards will be the same under IFRS and Canadian GAAP over the duration of each incentive plan cycle. In relation to stock option
cost, a timing difference will exist between IFRS and Canadian GAAP, whereby net income under IFRS will decrease in the first quarter and increase in the second quarter of each year by offsetting amounts. Net income and equity for annual periods
will not be affected. |
| (d) Provisions (including Asset Retirement
Obligations) |
|
Choices: There are no policy choices available under IFRS.
Differences from previous Canadian GAAP: IAS 37, “Provisions, Contingent
Liabilities and Contingent Assets,” requires a provision to be recognized when: there is a present obligation (legal or constructive) as a result of a past transaction or event; it is probable that an outflow of resources will be required to
settle the obligation; and a reliable estimate can be made of the obligation. “Probable” in this context means more likely than not. Under Canadian GAAP, constructive obligations were recognized only if required by a specific standard, and
the criterion for recognition in the financial statements was “likely,” which is a higher threshold than “probable.” Therefore, there may be some contingent liabilities not recognized under Canadian GAAP which would require a
provision under IFRS. Other differences between IFRS and Canadian GAAP exist
in relation to the measurement of provisions, such as the methodology for determining the best estimate where there is a range of equally possible outcomes (IFRS uses the mid-point of the range whereas Canadian GAAP used the low end), and the
requirement under IFRS for provisions to be discounted where material. In
relation to asset retirement obligations, measurement under IFRS is based on management’s best estimate, while measurement under Canadian GAAP was based on the fair value of the obligation (which takes market assumptions into account). Under
IFRS, the full asset retirement obligation is remeasured each period using the current discount rate. Under Canadian GAAP, cash flow estimates associated with asset retirement obligations were discounted using historical discount rates. Changes in
the discount rate alone did not result in a remeasurement of the liability. Changes in estimates that decreased the liability were discounted using the discount rate applied upon initial recognition of the liability. When changes in estimates
increased the liability, the additional liability was discounted using the current discount rate. IFRS require the company’s asset retirement obligations to be discounted using a risk-free rate. Under Canadian GAAP, asset retirement obligations were discounted using a credit-adjusted risk-free
rate. |
II-60
|
|
|
| |
|
In millions of US dollars except as otherwise
noted |
NOTE 30 Transition to IFRS continued
|
|
|
Accounting
Policy Area |
|
Impact of Policy Adoption |
|
|
Under IFRS, the increase in the measurement of an asset retirement obligation due to the passage of time (unwinding of the discount) is
classified as a finance expense. Under Canadian GAAP, this amount was classified as an operating expense. Transition impact: Equity at December 31, 2010 was reduced by $84 (January 1, 2010 – $68). Net income for 2010 decreased by $16. |
|
|
| |
|
Expected future impact: Measurement of provisions may fluctuate more under IFRS and a change in the discount rate will have a more
significant impact on the obligation as well as the company’s assets and expenses. As well, provisions may be recognized earlier under IFRS than under Canadian GAAP. |
| (e) Income Taxes |
|
Choices: Where exchange rate differences on deferred income tax liabilities or assets are recognized in the statements of income, such differences may be classified as either
foreign exchange gains/losses or deferred tax expense/income under IFRS. |
|
|
|
|
Policy selection: Exchange rate differences on deferred income tax liabilities or assets will be classified as foreign exchange gains/losses. This is consistent with the
company’s accounting policy under Canadian GAAP. |
|
|
|
|
Differences from previous Canadian GAAP, transition impact and expected future impact of each: Under IFRS, the guidance in IAS 12, “Income Taxes,” was used to
determine the benefit to be received in relation to uncertain tax positions. This differs from the methodology used under Canadian GAAP. Equity at December 31, 2010 was increased by $48 (January 1, 2010 – $36). Net income for 2010 increased by
$12. Impacts in future periods will depend on the particular circumstances existing in those periods. |
|
|
|
|
Under IFRS, deferred tax assets recognized in relation to share-based payment arrangements (for example, the company’s employee stock option plans in the US) are adjusted each
period to reflect the amount of future tax deductions that the company expects to receive in excess of stock-based compensation recorded in the consolidated financial statements based on the current market price of the shares. The benefit of such
amounts is recognized in contributed surplus and never impacts net income. Under the company’s Canadian GAAP policy, tax deductions for its employee stock option plan in the US were recognized as reductions to tax expense, within net income, in
the period that the deduction was allowed. This difference resulted in a decrease to net income in 2010 of $45. Equity at December 31, 2010 increased by $143 (January 1, 2010 – $116). In future periods, current tax expense will be higher and
the balance of the company’s deferred tax liability is expected to be more volatile under IFRS. |
|
|
|
|
Under IFRS, deferred tax assets associated with share-based compensation that are recorded in the consolidated financial statements as an expense in the current or previous period
should be reviewed at each statement of financial position date and amended to the extent that it is no longer probable that the related tax benefit will be realized. Under Canadian GAAP, this income tax benefit was calculated without estimating the
income tax effects of anticipated share-based payment transactions. This difference resulted in an increase to net income of $1. Equity at December 31, 2010 decreased by $7 (January 1, 2010 – $8). In future periods, the balance in the
company’s deferred tax liability is expected to be more volatile under IFRS. |
|
|
|
|
Under IFRS, adjustments relating to a change in tax rates are recognized in the same category of comprehensive income in which the original amounts were recognized. Under Canadian
GAAP, such adjustments were recognized in net income, regardless of the category in which the original amounts were recognized. In addition, adjustments to foreign exchange gains on deferred income tax liabilities originally recognized in OCI will
be recorded in OCI under IFRS, but were recorded in net income under Canadian GAAP. In combination, these differences resulted in $150 related to an internal restructuring that occurred in 2009 being re-categorized at the date of transition to IFRS
from retained earnings to AOCI. There will be no future impacts resulting from this item. |
|
|
| |
|
Under IFRS, deferred income taxes are classified as long-term. Under Canadian GAAP, future income taxes were separated between current and
long-term on the statements of financial position. This resulted in a decrease in 2010 of $28 (January 1, 2010 – $18) in current assets and non-current liabilities on the statements of financial position. This classification difference will
continue to exist in future periods; however, the size and direction of the difference will depend on circumstances existing in those periods. |
II-61
|
|
|
| |
|
In millions of US dollars except as otherwise
noted |
NOTE 30 Transition to IFRS continued
|
|
|
Accounting
Policy Area |
|
Impact of Policy Adoption |
| |
|
Under IFRS, unrealized profits resulting from intragroup transactions are eliminated from the carrying amount of assets, but no equivalent
adjustment is made for tax purposes. The difference between the tax rates of the two entities will impact net income. This differs from Canadian GAAP, where the current tax payable in relation to such profits was recorded as a current asset until
the transaction was realized by the group. As a result, equity at December 31, 2010 increased by $6 (January 1, 2010 – $20) and 2010 net income decreased by $14. In future periods, the tax impact of intragroup transactions will be
recognized earlier under IFRS; however, the size and direction of the difference will depend on circumstances existing in those periods. |
| (f) Consolidation |
|
Choices: There are no policy choices available under IFRS. |
|
|
|
|
Differences from previous Canadian GAAP: The IFRS approach to consolidation is principles-based whereby consolidation is required for all entities which are controlled.
Unlike the Canadian GAAP two-step model, which first required consideration as to whether an entity was a Variable Interest Entity, the IFRS guidance on consolidation is a single-step model – the control model. IFRS do bring in the concepts of
risk and rewards where the existence of control is not apparent, although not in the same rules-based manner as under Canadian GAAP. |
|
|
|
|
Transition impact: None. |
|
|
| |
|
Expected future impact: None. |
| (g) Property, Plant and Equipment |
|
Choices: Either a historical cost model or a revaluation model can be used to value property, plant and equipment.
Policy selection: The company valued property, plant and equipment using the
historical cost model. Differences from previous Canadian GAAP: Under
IFRS, where part of an item of property, plant and equipment has a cost that is significant in relation to the cost of the item as a whole, it must be depreciated separately from the remainder of the item. Canadian GAAP was similar in this respect;
however, the componentization concept was not often applied to the same extent due to practicality and/or materiality. |
|
|
|
|
Under IFRS, the cost of major overhauls on items of property, plant and equipment is capitalized as a component of the related item of property, plant and equipment and depreciated
over the period until the next major overhaul. Under Canadian GAAP, these costs were expensed in the year incurred. |
|
|
|
|
Transition impact: Equity at December 31, 2010 increased by $52 (January 1, 2010 – $18). Net income for 2010 increased by $34. |
|
|
| |
|
Expected future impact: The cost of future replacement of components of property, plant and equipment (including the cost of major
overhauls) will be capitalized and depreciated over several years rather than being expensed in the year incurred. This will result in a difference in timing between IFRS and Canadian GAAP in terms of when such costs are recognized as
expenses. |
| (h) Inventories |
|
Choices: Either first-in, first-out (“FIFO”) or weighted average can be used to value inventories. |
|
|
|
|
Policy selection: The weighted average method was used to value inventories. |
|
|
|
|
Differences from previous Canadian GAAP: None, as it relates to annual periods. |
|
|
| |
|
Under IFRS, at interim periods, price, efficiency, spending and volume variances of a manufacturing entity are recognized in income to the
same extent that those variances are recognized in income at financial year-end. Deferral of variances that are expected to be absorbed by year-end is not appropriate because it could result in reporting inventory at the interim date at more or less
than its portion of the actual cost of manufacture. Under Canadian GAAP, variances that were planned and expected to be absorbed by the end of the year were ordinarily deferred at the end of an interim period. Net income and equity for annual
periods are not affected. |
II-62
|
|
|
| |
|
In millions of US dollars except as otherwise
noted |
NOTE 30 Transition to IFRS continued
|
|
|
Accounting
Policy Area |
|
Impact of Policy Adoption |
|
|
Transition impact: None as it relates to annual periods. |
|
|
| |
|
Expected future impact: None, as it relates to annual periods. Manufacturing cost variances that were deferred at interim periods will
no longer be deferred. This will result in a difference in timing during the year between IFRS and Canadian GAAP in terms of when such costs are recognized as expenses. |
| (i) Borrowing Costs |
|
Choices: There are no policy choices available under IFRS.
Differences from previous Canadian GAAP: Under IFRS, borrowing costs are
capitalized to assets which take a substantial time to develop or construct using a capitalization rate based on the weighted average interest rate on all of the company’s outstanding third-party debt. Under the company’s Canadian GAAP
policy, the interest capitalization rate was based only on the weighted average interest rate on third-party long-term debt.
Transition impact: Equity at December 31, 2010 was reduced by $25 (January 1, 2010 – $14). Net income for 2010 decreased by $11.
Expected future impact: There will be an ongoing difference
based on the difference in capitalization rates. |
| (j) Financial Instruments |
|
Choices: Trade date or settlement date can be used.
Policy selection: The company recognized regular-way purchases and sales of
financial assets at the trade date. Differences from previous
Canadian GAAP: None. Transition impact: None.
Expected future impact: None. |
| (k) Definition of a Derivative |
|
Choices: There are no policy choices available under IFRS.
Differences from previous Canadian GAAP: Derivatives usually have a notional
amount (i.e., an amount of currency, a number of shares or other number of units specified in the contract). Under IFRS, the definition of a derivative does not specifically require an instrument to have a notional amount, and the lack of a notional
amount does not result in an exemption from treatment of the contract as a derivative. Under Canadian GAAP, when the quantity of a non-financial asset or liability to be purchased or sold was not specified and was not otherwise determinable (e.g.,
by reference to anticipated quantities to be used in the calculation of penalty amounts in the event of non-performance), the contract was not accounted for as a derivative since the standard setters concluded its fair value would not be reliably
determinable. As a result, a notional amount was also required implicitly for such a contract to meet the definition of a derivative under Canadian GAAP. Whereas under Canadian GAAP such an instrument would not be accounted for as a derivative,
under IFRS it is necessary to analyze all other features to determine whether the contract is a derivative. If so, it is necessary to determine a reasonable estimation of what a notional amount could be, and measure the instrument at fair value as a
derivative or embedded derivative based on such. Transition
impact: None. Expected future impact: More contracts may
be categorized as derivatives (either assets or liabilities) than under Canadian GAAP. |
II-63
|
|
|
| |
|
In millions of US dollars except as otherwise
noted |
NOTE 30 Transition to IFRS continued
|
|
|
Accounting
Policy Area |
|
Impact of Policy Adoption |
| (l) Embedded Derivatives |
|
Choices: There are no policy choices available under IFRS.
Differences from previous Canadian GAAP: For transitional purposes under Canadian
GAAP, the company elected to record embedded derivatives only for contracts entered into or substantively modified on or after January 1, 2003. This transitional option does not exist under IFRS and therefore additional potential embedded
derivatives were considered within contracts previously not reviewed in this context to conclude whether bifurcation and recording will be necessary.
Transition impact: None.
Expected future impact: None. |
| (m) Hedge
Accounting for Interest Rate Swaps |
|
Choices: There are no policy choices available under IFRS.
Differences from previous Canadian GAAP: Under Canadian GAAP, a short-cut method
for assessing hedge effectiveness was permitted if the critical terms of the hedged item and hedging instrument matched. This method is not permitted under IFRS. The company had certain deferred amounts related to the previous use of this method
under Canadian GAAP pertaining to interest rate swaps. However, because the previously designated hedging relationship was of a type that would have qualified for hedge accounting under IFRS, the provisions of IFRS 1 allow the company to discontinue
hedge accounting prospectively. Because hedge accounting had already been discontinued prospectively under Canadian GAAP, no adjustment was necessary as a result of adopting IFRS.
Transition impact: None.
Expected future impact: None. |
| (n) Statements of
Cash Flow |
|
Choices: Either the direct or indirect method may be presented. Dividends paid, interest
paid, interest received and dividends received can be presented as operating, investing or financing activities. Policy selection: The company used the indirect method. Dividends paid were presented as financing activities. Interest and dividends received were presented as operating activities. Interest paid was
presented as operating activities except where it had been capitalized to property, plant and equipment, in which case it was presented as investing activities.
Differences from previous Canadian GAAP: None.
Transition impact: None.
Expected future impact: None. |
| (o) Investments |
|
Choices: Jointly controlled entities may be accounted for by using either proportionate
consolidation or the equity method. Policy selection: The
equity method was used to account for joint ventures. Differences
from previous Canadian GAAP: Under Canadian GAAP, joint ventures were accounted for using proportionate consolidation. Certain of the company’s equity-accounted investees adopted IFRS earlier than PotashCorp, resulting in certain IFRS 1
elections being made, particularly related to use of fair value as deemed cost on certain items of property, plant and equipment and related to the use of the business combinations exemption. As a result, the company recognized its share of such
elections as an adjustment to its opening retained earnings and its investments in equity-accounted investees. Transition impact: Equity at December 31, 2010 was reduced by $45 (January 1, 2010 – $45). Net income for 2010 was unaffected.
Expected future impact: One joint venture will be accounted for using the equity
method, rather than the proportionate consolidation method. The impact is expected to be minimal. |
II-64
|
|
|
| |
|
In millions of US dollars except as otherwise
noted |
NOTE 30 Transition to IFRS continued
Reconciliations from Canadian GAAP to IFRS
Reconciliation of Net Income
|
|
|
|
|
| |
|
2010 |
|
| Net Income – Canadian GAAP |
|
$ |
1,806 |
|
| IFRS adjustments to net income: |
|
|
|
|
| Policy choices |
|
|
|
|
| Employee benefits – Actuarial gains and losses (b) |
|
|
26 |
|
| Other |
|
|
|
|
| Provisions – Changes in asset retirement obligations (d) |
|
|
(13 |
) |
| Property, plant and equipment (g) |
|
|
34 |
|
| Borrowing costs
(i
) |
|
|
(11 |
) |
| Employee benefits – Past service costs (b) |
|
|
(2 |
) |
| Impairment of assets (a) |
|
|
(3 |
) |
| Constructive obligations (d) |
|
|
(3 |
) |
| Share-based payments (c) |
|
|
(2 |
) |
| Income taxes – Tax effect of above differences |
|
|
(10 |
) |
| Income tax-related differences (e) |
|
|
(47 |
) |
| Net Income – IFRS |
|
$ |
1,775 |
|
References above relate to items described in the Changes in Accounting Policies table.
Reconciliation of Shareholders’ Equity
|
|
|
|
|
|
|
|
|
| |
|
December 31,
2010 |
|
|
January 1,
2010 |
|
| Shareholders’ Equity – Canadian GAAP |
|
$ |
6,804 |
|
|
$ |
6,440 |
|
| IFRS adjustments to shareholders’ equity: |
|
|
|
|
|
|
|
|
| Policy choices |
|
|
|
|
|
|
|
|
| Employee benefits – Actuarial gains and losses (b) |
|
|
(375 |
) |
|
|
(365 |
) |
| Other |
|
|
|
|
|
|
|
|
| Provisions – Changes in asset retirement obligations (d) |
|
|
(79 |
) |
|
|
(66 |
) |
| Property, plant and equipment (g) |
|
|
52 |
|
|
|
18 |
|
|
Investments
(o) |
|
|
(45 |
) |
|
|
(45 |
) |
| Borrowing costs
(i
) |
|
|
(25 |
) |
|
|
(14 |
) |
| Employee benefits – Past service costs and Canadian GAAP transition
amounts (b) |
|
|
10 |
|
|
|
13 |
|
| Impairment of assets (a) |
|
|
5 |
|
|
|
8 |
|
| Constructive obligations (d) |
|
|
(5 |
) |
|
|
(2 |
) |
| Share-based payments (c) |
|
|
1 |
|
|
|
3 |
|
| Income taxes – Tax effect of above differences |
|
|
154 |
|
|
|
152 |
|
| Income tax-related differences (e) |
|
|
188 |
|
|
|
163 |
|
| Shareholders’ Equity – IFRS |
|
$ |
6,685 |
|
|
$ |
6,305 |
|
References above relate to items described in the Changes in Accounting Policies table.
II-65
|
|
|
| |
|
In millions of US dollars except as otherwise
noted |
NOTE 30 Transition to IFRS continued
Reconciliation of
Comprehensive Income
|
|
|
|
|
| |
|
2010 |
|
| Comprehensive Income – Canadian GAAP |
|
$ |
2,402 |
|
| IFRS adjustments to comprehensive income: |
|
|
|
|
| Policy choices |
|
|
|
|
| Employee benefits – Actuarial gains and losses (b) |
|
|
(36 |
) |
| Tax effect of employee benefits – Actuarial gains and losses |
|
|
11 |
|
| Other |
|
|
|
|
| Differences in net income |
|
|
(31 |
) |
| Comprehensive Income – IFRS |
|
$ |
2,346 |
|
References above relate to items described in the Changes in Accounting Policies table.
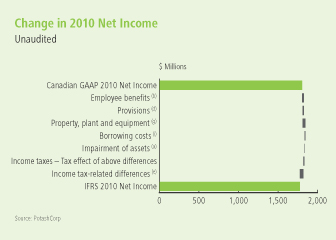
II-66
|
|
|
| |
|
In millions of US dollars except as otherwise
noted |
NOTE 30 Transition to IFRS continued
Adjusted Financial Statements
The following tables show the adjustments to the company’s consolidated statements
of financial position and consolidated statements of income.
Adjustments to Consolidated Statement of Financial Position – as at December 31, 2010
|
|
|
|
|
|
|
|
|
|
|
|
|
|
|
|
|
|
|
|
|
| Canadian GAAP Accounts |
|
Canadian
GAAP |
|
|
IFRS
Adjust-
ments |
|
|
Ref-
erence |
|
IFRS
Reclass-
ifications |
|
|
IFRS |
|
|
IFRS Accounts |
| Assets |
|
|
|
|
|
|
|
|
|
|
|
|
|
|
|
|
|
|
|
Assets |
| Current assets |
|
|
|
|
|
|
|
|
|
|
|
|
|
|
|
|
|
|
|
Current assets |
| Cash and cash equivalents |
|
$ |
412 |
|
|
$ |
– |
|
|
|
|
$ |
– |
|
|
$ |
412 |
|
|
Cash and cash equivalents |
| Receivables |
|
|
1,044 |
|
|
|
15 |
|
|
(e) |
|
|
– |
|
|
|
1,059 |
|
|
Receivables |
| Inventories |
|
|
570 |
|
|
|
– |
|
|
|
|
|
– |
|
|
|
570 |
|
|
Inventories |
| Prepaid expenses and other current assets |
|
|
114 |
|
|
|
(60 |
) |
|
(e) |
|
|
– |
|
|
|
54 |
|
|
Prepaid expenses and other current assets |
|
|
|
2,140 |
|
|
|
(45 |
) |
|
|
|
|
– |
|
|
|
2,095 |
|
|
|
|
|
|
|
|
|
|
|
|
|
|
|
|
|
|
|
|
|
|
|
Non-current assets |
| Property, plant and equipment |
|
|
8,063 |
|
|
|
78 |
|
|
(a,d,g,i) |
|
|
– |
|
|
|
8,141 |
|
|
Property, plant and equipment |
| Investments |
|
|
4,938 |
|
|
|
(45 |
) |
|
(o) |
|
|
(4,893 |
) |
|
|
– |
|
|
|
|
|
|
– |
|
|
|
– |
|
|
|
|
|
1,051 |
|
|
|
1,051 |
|
|
Investments in equity-accounted investees |
|
|
|
– |
|
|
|
– |
|
|
|
|
|
3,842 |
|
|
|
3,842 |
|
|
Available-for-sale investments |
| Other assets |
|
|
363 |
|
|
|
(60 |
) |
|
(b,e) |
|
|
– |
|
|
|
303 |
|
|
Other assets |
| Intangible assets |
|
|
18 |
|
|
|
– |
|
|
|
|
|
97 |
|
|
|
115 |
|
|
Intangible assets |
| Goodwill |
|
|
97 |
|
|
|
– |
|
|
|
|
|
(97 |
) |
|
|
– |
|
|
|
| |
|
$ |
15,619 |
|
|
$ |
(72 |
) |
|
|
|
$ |
– |
|
|
$ |
15,547 |
|
|
Total Assets |
| Liabilities |
|
|
|
|
|
|
|
|
|
|
|
|
|
|
|
|
|
|
|
Liabilities |
| Current liabilities |
|
|
|
|
|
|
|
|
|
|
|
|
|
|
|
|
|
|
|
Current liabilities |
| Short-term debt and current portion of long-term debt |
|
$ |
1,871 |
|
|
$ |
– |
|
|
|
|
$ |
– |
|
|
$ |
1,871 |
|
|
Short-term debt and current portion of long-term debt |
| Payables and accrued charges |
|
|
1,246 |
|
|
|
(48 |
) |
|
(c,d,e) |
|
|
– |
|
|
|
1,198 |
|
|
Payables and accrued charges |
| Current portion of derivative instrument liabilities |
|
|
75 |
|
|
|
– |
|
|
|
|
|
– |
|
|
|
75 |
|
|
Current portion of derivative instrument liabilities |
|
|
|
3,192 |
|
|
|
(48 |
) |
|
|
|
|
– |
|
|
|
3,144 |
|
|
|
|
|
|
|
|
|
|
|
|
|
|
|
|
|
|
|
|
|
|
|
Non-current liabilities |
| Long-term debt |
|
|
3,707 |
|
|
|
– |
|
|
|
|
|
– |
|
|
|
3,707 |
|
|
Long-term debt |
| Derivative instrument liabilities |
|
|
204 |
|
|
|
– |
|
|
|
|
|
– |
|
|
|
204 |
|
|
Derivative instrument liabilities |
| Future income tax liabilities |
|
|
1,078 |
|
|
|
(341 |
) |
|
(e) |
|
|
– |
|
|
|
737 |
|
|
Deferred income tax liabilities |
| Accrued pension and other post-retirement benefits |
|
|
299 |
|
|
|
169 |
|
|
(b) |
|
|
– |
|
|
|
468 |
|
|
Pension and other post-retirement benefit liabilities |
| Accrued environmental costs and asset retirement obligations |
|
|
330 |
|
|
|
125 |
|
|
(d) |
|
|
– |
|
|
|
455 |
|
|
Asset retirement obligations and accrued environmental costs |
| Other non-current liabilities and deferred credits |
|
|
5 |
|
|
|
142 |
|
|
(e) |
|
|
– |
|
|
|
147 |
|
|
Other non-current liabilities and deferred credits |
| |
|
|
8,815 |
|
|
|
47 |
|
|
|
|
|
– |
|
|
|
8,862 |
|
|
Total Liabilities |
| Shareholders’ Equity |
|
|
|
|
|
|
|
|
|
|
|
|
|
|
|
|
|
|
|
Shareholders’ Equity |
| Share capital |
|
|
1,431 |
|
|
|
– |
|
|
|
|
|
– |
|
|
|
1,431 |
|
|
Share capital |
| Contributed surplus |
|
|
160 |
|
|
|
148 |
|
|
(e) |
|
|
– |
|
|
|
308 |
|
|
Contributed surplus |
| Accumulated other comprehensive income |
|
|
2,244 |
|
|
|
150 |
|
|
(e) |
|
|
– |
|
|
|
2,394 |
|
|
Accumulated other comprehensive income |
| Retained earnings |
|
|
2,969 |
|
|
|
(417 |
) |
|
|
|
|
– |
|
|
|
2,552 |
|
|
Retained earnings |
| |
|
|
6,804 |
|
|
|
(119 |
) |
|
|
|
|
– |
|
|
|
6,685 |
|
|
Total Shareholders’ Equity |
| |
|
$ |
15,619 |
|
|
$ |
(72 |
) |
|
|
|
$ |
– |
|
|
$ |
15,547 |
|
|
Total Liabilities and Shareholders’ Equity |
References above relate to items described in the Changes in Accounting Policies table.
II-67
|
|
|
| |
|
In millions of US dollars except as otherwise
noted |
NOTE 30 Transition to IFRS continued
Adjustments to
Consolidated Statement of Financial Position – as at January 1, 2010
|
|
|
|
|
|
|
|
|
|
|
|
|
|
|
|
|
|
|
|
|
| Canadian GAAP Accounts |
|
Canadian
GAAP |
|
|
IFRS
Adjust-
ments |
|
|
Ref-
erence |
|
IFRS
Reclass-
ifications |
|
|
IFRS |
|
|
IFRS Accounts |
| Assets |
|
|
|
|
|
|
|
|
|
|
|
|
|
|
|
|
|
|
|
Assets |
| Current assets |
|
|
|
|
|
|
|
|
|
|
|
|
|
|
|
|
|
|
|
Current assets |
| Cash and cash equivalents |
|
$ |
385 |
|
|
$ |
– |
|
|
|
|
$ |
– |
|
|
$ |
385 |
|
|
Cash and cash equivalents |
| Receivables |
|
|
1,138 |
|
|
|
76 |
|
|
(e) |
|
|
– |
|
|
|
1,214 |
|
|
Receivables |
| Inventories |
|
|
624 |
|
|
|
– |
|
|
|
|
|
– |
|
|
|
624 |
|
|
Inventories |
| Prepaid expenses and other current assets |
|
|
125 |
|
|
|
(56 |
) |
|
(e) |
|
|
– |
|
|
|
69 |
|
|
Prepaid expenses and other current assets |
|
|
|
2,272 |
|
|
|
20 |
|
|
|
|
|
– |
|
|
|
2,292 |
|
|
|
|
|
|
|
|
|
|
|
|
|
|
|
|
|
|
|
|
|
|
|
Non-current assets |
| Property, plant and equipment |
|
|
6,413 |
|
|
|
31 |
|
|
(a,d,g,i) |
|
|
– |
|
|
|
6,444 |
|
|
Property, plant and equipment |
| Investments |
|
|
3,760 |
|
|
|
(45 |
) |
|
(o) |
|
|
(3,715 |
) |
|
|
– |
|
|
|
|
|
|
|
|
|
|
|
|
|
|
|
|
955 |
|
|
|
955 |
|
|
Investments in equity-accounted investees |
|
|
|
– |
|
|
|
– |
|
|
|
|
|
2,760 |
|
|
|
2,760 |
|
|
Available-for-sale investments |
| Other assets |
|
|
360 |
|
|
|
(86 |
) |
|
(b,e) |
|
|
– |
|
|
|
274 |
|
|
Other assets |
| Intangible assets |
|
|
20 |
|
|
|
– |
|
|
|
|
|
97 |
|
|
|
117 |
|
|
Intangible assets |
| Goodwill |
|
|
97 |
|
|
|
– |
|
|
|
|
|
(97 |
) |
|
|
– |
|
|
|
| |
|
$ |
12,922 |
|
|
$ |
(80 |
) |
|
|
|
$ |
– |
|
|
$ |
12,842 |
|
|
Total Assets |
| Liabilities |
|
|
|
|
|
|
|
|
|
|
|
|
|
|
|
|
|
|
|
Liabilities |
| Current liabilities |
|
|
|
|
|
|
|
|
|
|
|
|
|
|
|
|
|
|
|
Current liabilities |
| Short-term debt and current portion of long-term debt |
|
$ |
729 |
|
|
$ |
– |
|
|
|
|
$ |
– |
|
|
$ |
729 |
|
|
Short-term debt and current portion of long-term debt |
| Payables and accrued charges |
|
|
796 |
|
|
|
21 |
|
|
(c,d,e) |
|
|
– |
|
|
|
817 |
|
|
Payables and accrued charges |
| Current portion of derivative instrument liabilities |
|
|
52 |
|
|
|
– |
|
|
|
|
|
– |
|
|
|
52 |
|
|
Current portion of derivative instrument liabilities |
|
|
|
1,577 |
|
|
|
21 |
|
|
|
|
|
– |
|
|
|
1,598 |
|
|
|
|
|
|
|
|
|
|
|
|
|
|
|
|
|
|
|
|
|
|
|
Non-current liabilities |
| Long-term debt |
|
|
3,319 |
|
|
|
– |
|
|
|
|
|
– |
|
|
|
3,319 |
|
|
Long-term debt |
| Derivative instrument liabilities |
|
|
123 |
|
|
|
– |
|
|
|
|
|
– |
|
|
|
123 |
|
|
Derivative instrument liabilities |
| Future income tax liabilities |
|
|
963 |
|
|
|
(320 |
) |
|
(e) |
|
|
– |
|
|
|
643 |
|
|
Deferred income tax liabilities |
| Accrued pension and other post-retirement benefits |
|
|
281 |
|
|
|
174 |
|
|
(b) |
|
|
– |
|
|
|
455 |
|
|
Pension and other post-retirement benefit liabilities |
| Accrued environmental costs and asset retirement obligations |
|
|
215 |
|
|
|
85 |
|
|
(d) |
|
|
– |
|
|
|
300 |
|
|
Asset retirement obligations and accrued environmental costs |
| Other non-current liabilities and deferred credits |
|
|
4 |
|
|
|
95 |
|
|
(e) |
|
|
– |
|
|
|
99 |
|
|
Other non-current liabilities and deferred credits |
| |
|
|
6,482 |
|
|
|
55 |
|
|
|
|
|
– |
|
|
|
6,537 |
|
|
Total Liabilities |
| Shareholders’ Equity |
|
|
|
|
|
|
|
|
|
|
|
|
|
|
|
|
|
|
|
Shareholders’ Equity |
| Share capital |
|
|
1,430 |
|
|
|
– |
|
|
|
|
|
– |
|
|
|
1,430 |
|
|
Share capital |
| Contributed surplus |
|
|
150 |
|
|
|
123 |
|
|
(e) |
|
|
– |
|
|
|
273 |
|
|
Contributed surplus |
| Accumulated other comprehensive income |
|
|
1,649 |
|
|
|
149 |
|
|
(e) |
|
|
– |
|
|
|
1,798 |
|
|
Accumulated other comprehensive income |
| Retained earnings |
|
|
3,211 |
|
|
|
(407 |
) |
|
|
|
|
– |
|
|
|
2,804 |
|
|
Retained earnings |
| |
|
|
6,440 |
|
|
|
(135 |
) |
|
|
|
|
– |
|
|
|
6,305 |
|
|
Total Shareholders’ Equity |
| |
|
$ |
12,922 |
|
|
$ |
(80 |
) |
|
|
|
$ |
– |
|
|
$ |
12,842 |
|
|
Total Liabilities and Shareholders’ Equity |
References above relate to items described in the Changes in Accounting Policies table.
II-68
|
|
|
| |
|
In millions of US dollars except as otherwise
noted |
NOTE 30 Transition to IFRS continued
Adjustments to Consolidated Statement of Income – Year Ended December 31, 2010
|
|
|
|
|
|
|
|
|
|
|
|
|
|
|
|
|
|
|
|
|
| Canadian GAAP Accounts |
|
Canadian
GAAP |
|
|
IFRS
Adjust-
ments |
|
|
Ref-
erence |
|
IFRS
Reclass-
ifications |
|
|
IFRS |
|
|
IFRS Accounts |
| Sales |
|
$ |
6,539 |
|
|
$ |
– |
|
|
|
|
$ |
– |
|
|
$ |
6,539 |
|
|
Sales |
| Freight |
|
|
(336 |
) |
|
|
– |
|
|
|
|
|
(152 |
) |
|
|
(488 |
) |
|
Freight, transportation and distribution |
| Transportation and distribution |
|
|
(152 |
) |
|
|
– |
|
|
|
|
|
152 |
|
|
|
– |
|
|
|
| Cost of goods sold |
|
|
(3,426 |
) |
|
|
65 |
|
|
(a,b,c,d,g,i) |
|
|
– |
|
|
|
(3,361 |
) |
|
Cost of goods sold |
| Gross Margin |
|
|
2,625 |
|
|
|
65 |
|
|
|
|
|
– |
|
|
|
2,690 |
|
|
Gross Margin |
| Selling and administrative |
|
|
(228 |
) |
|
|
– |
|
|
(b,c,d) |
|
|
– |
|
|
|
(228 |
) |
|
Selling and administrative expenses |
| Provincial mining and other taxes |
|
|
(77 |
) |
|
|
– |
|
|
|
|
|
– |
|
|
|
(77 |
) |
|
Provincial mining and other taxes |
| Foreign exchange loss |
|
|
(17 |
) |
|
|
– |
|
|
|
|
|
17 |
|
|
|
– |
|
|
|
|
|
|
– |
|
|
|
|
|
|
|
|
|
174 |
|
|
|
174 |
|
|
Share of earnings of equity-accounted investees |
|
|
|
– |
|
|
|
– |
|
|
|
|
|
163 |
|
|
|
163 |
|
|
Dividend income |
| Other income |
|
|
245 |
|
|
|
(16 |
) |
|
(a,g) |
|
|
(354 |
) |
|
|
(125 |
) |
|
Other expenses |
| Operating Income |
|
|
2,548 |
|
|
|
49 |
|
|
|
|
|
– |
|
|
|
2,597 |
|
|
Operating Income |
| Interest Expense |
|
|
(99 |
) |
|
|
(22 |
) |
|
(d,i) |
|
|
– |
|
|
|
(121 |
) |
|
Finance Costs |
| Income Before Income Taxes |
|
|
2,449 |
|
|
|
27 |
|
|
|
|
|
– |
|
|
|
2,476 |
|
|
Income Before Income Taxes |
| Income Taxes |
|
|
(643 |
) |
|
|
(58 |
) |
|
(e) |
|
|
– |
|
|
|
(701 |
) |
|
Income Taxes |
| Net Income |
|
$ |
1,806 |
|
|
$ |
(31 |
) |
|
|
|
$ |
– |
|
|
$ |
1,775 |
|
|
Net Income |
| Net Income per Share |
|
|
|
|
|
|
|
|
|
|
|
|
|
|
|
|
|
|
|
Net Income per Share |
| Basic |
|
$ |
2.04 |
|
|
$ |
(0.04 |
) |
|
|
|
$ |
– |
|
|
$ |
2.00 |
|
|
Basic |
| Diluted |
|
$ |
1.98 |
|
|
$ |
(0.03 |
) |
|
|
|
$ |
– |
|
|
$ |
1.95 |
|
|
Diluted |
| Dividends per Share |
|
$ |
0.13 |
|
|
$ |
– |
|
|
|
|
$ |
– |
|
|
$ |
0.13 |
|
|
Dividends Declared per Share |
References above relate to items described in the Changes in Accounting Policies table.
II-69
Part IV
Item 15. Exhibits and Financial Statement Schedules
List of Documents Filed as Part of this Report
1. Consolidated Financial Statements in
Annual Report
2. Schedules
Schedules not listed are omitted because the required information is inapplicable or is presented in the consolidated financial statements.
REPORT OF INDEPENDENT REGISTERED CHARTERED ACCOUNTANTS
To the Board of Directors and Shareholders of
Potash Corporation of Saskatchewan Inc.
We have audited the consolidated financial statements of Potash Corporation of Saskatchewan Inc. and
subsidiaries (the “Company”) as of December 31, 2011 and 2010, and for each of the two years in the period ended December 31, 2011, and the Company’s internal control over financial reporting as of December 31, 2011,
and have issued our reports thereon, dated February 21, 2012; such consolidated financial statements and reports are included in your Form 10-K/A and are incorporated herein by reference. Our audits also included the consolidated financial
statement schedule of the Company listed in Item 15. This consolidated financial statement schedule is the responsibility of the Company’s management. Our responsibility is to express an opinion based on our audits. In our opinion, such
consolidated financial statement schedule, when considered in relation to the basic consolidated financial statements taken as a whole, presents fairly, in all material respects, the information set forth therein.
|
| /s/ Deloitte & Touche LLP |
|
| Independent Registered Chartered Accountants |
| Saskatoon, Canada |
|
| February 21, 2012 |
IV-1
Potash Corporation of Saskatchewan Inc.
Schedule II — Valuation and Qualifying Accounts
(in millions of US dollars)
(audited)
|
|
|
|
|
|
|
|
|
|
|
|
|
|
|
|
|
|
|
| Description |
|
Balance at
Beginning of
Year |
|
|
Additions
Charged to
Costs and
Expenses |
|
|
Deductions |
|
|
|
|
Balance at
End of Year |
|
| Allowance for doubtful trade accounts receivable |
|
|
|
|
|
|
|
|
|
|
|
|
|
|
|
|
|
|
| 2011 |
|
|
8 |
|
|
|
— |
|
|
|
— |
|
|
|
|
|
8 |
|
| 2010 |
|
|
8 |
|
|
|
— |
|
|
|
— |
|
|
|
|
|
8 |
|
|
2009(1) |
|
|
8 |
|
|
|
1 |
|
|
|
1 |
|
|
|
|
|
8 |
|
| Allowance for inventory valuation |
|
|
|
|
|
|
|
|
|
|
|
|
|
|
|
|
|
|
| 2011 |
|
|
9 |
|
|
|
7 |
|
|
|
5 |
|
|
|
|
|
11 |
|
| 2010 |
|
|
17 |
|
|
|
2 |
|
|
|
10 |
|
|
|
|
|
9 |
|
| 2009(1) |
|
|
97 |
|
|
|
5 |
|
|
|
85 |
|
|
|
|
|
17 |
|
| (1) |
As the Company adopted IFRS with effect from January 1, 2010, amounts for 2009 were prepared under Canadian GAAP. |
3. Exhibits
|
|
|
|
|
|
|
|
|
|
|
| |
|
|
|
Incorporated By Reference |
Exhibit
Number |
|
Description of Document |
|
Form |
|
Filing Date/Period
End Date |
|
|
Exhibit Number
(if different) |
| 3(a) |
|
Articles of Continuance of the registrant dated May 15, 2002. |
|
10-Q |
|
|
6/30/2002 |
|
|
|
| 3(b) |
|
Bylaws of the registrant effective May 15, 2002. |
|
10-Q |
|
|
6/30/2002 |
|
|
|
| 4(a) |
|
Term Credit Agreement between The Bank of Nova Scotia and other financial institutions and the registrant dated September 25, 2001. |
|
10-Q |
|
|
9/30/2001 |
|
|
|
| 4(b) |
|
Syndicated Term Credit Facility Amending Agreement between The Bank of Nova Scotia and other financial institutions and the registrant dated as of September 23, 2003. |
|
10-Q |
|
|
9/30/2003 |
|
|
|
| 4(c) |
|
Syndicated Term Credit Facility Second Amending Agreement between The Bank of Nova Scotia and other financial institutions and the registrant dated as of September 21,
2004. |
|
8-K |
|
|
9/24/2004 |
|
|
|
| 4(d) |
|
Syndicated Term Credit Facility Third Amending Agreement between The Bank of Nova Scotia and other financial institutions and the registrant dated as of September 20, 2005. |
|
8-K |
|
|
9/22/2005 |
|
|
4(a) |
| 4(e) |
|
Syndicated Term Credit Facility Fourth Amending Agreement between The Bank of Nova Scotia and other financial institutions and the registrant dated as of September 27,
2006. |
|
10-Q |
|
|
9/30/2006 |
|
|
|
| 4(f) |
|
Syndicated Term Credit Facility Fifth Amending Agreement between the Bank of Nova Scotia and other financial institutions and the registrant dated as of October 19, 2007. |
|
8-K |
|
|
10/22/2007 |
|
|
4(a) |
| 4(g) |
|
Indenture dated as of February 27, 2003, between the registrant and The Bank of Nova Scotia Trust Company of New York. |
|
10-K |
|
|
12/31/2002 |
|
|
4(c) |
| 4(h) |
|
Form of Note relating to the registrant’s offering of $250,000,000 principal amount of 4.875% Notes due March 1, 2013. |
|
8-K |
|
|
2/28/2003 |
|
|
4 |
| 4(i) |
|
Form of Note relating to the registrant’s offering of $500,000,000 principal amount of 5.875% Notes due December 1, 2036. |
|
8-K |
|
|
11/30/2006 |
|
|
4(a) |
| 4(j) |
|
Form of Note relating to the registrant’s offering of $500,000,000 principal amount of 5.25% Notes due May 15, 2014. |
|
8-K |
|
|
5/1/2009 |
|
|
4(a) |
IV-2
|
|
|
|
|
|
|
|
|
|
|
| |
|
|
|
Incorporated By Reference |
Exhibit
Number |
|
Description of Document |
|
Form |
|
Filing Date/Period
End Date |
|
|
Exhibit Number
(if different) |
| 4(k) |
|
Form of Note relating to the registrant’s offering of $500,000,000 principal amount of 6.50% Notes due May 15, 2019. |
|
8-K |
|
|
5/1/2009 |
|
|
4(b) |
| 4(l) |
|
Form of Note relating to the registrant’s offering of $500,000,000 principal amount of 3.75% Notes due September 30, 2015. |
|
8-K |
|
|
9/25/2009 |
|
|
4(a) |
| 4(m) |
|
Form of Note relating to the registrant’s offering of $500,000,000 principal amount of 4.875% Notes due March 30, 2020. |
|
8-K |
|
|
9/25/2009 |
|
|
4(b) |
| 4(n) |
|
Revolving Term Credit Facility Agreement between the Bank of Nova Scotia and other financial institutions and the registrant dated December 11, 2009. |
|
8-K |
|
|
12/15/2009 |
|
|
4(a) |
| 4(o) |
|
Revolving Term Credit Facility First amending Agreement between the Bank of Nova Scotia and other financial institutions and the registrant dated September 23, 2011. |
|
8-K |
|
|
9/26/2011 |
|
|
4(a) |
| 4(p) |
|
Form of Note relating to the registrant’s offering of $500,000,000 principal amount of 3.25% Notes due December 1, 2017. |
|
8-K |
|
|
11/29/2010 |
|
|
4(a) |
| 4(q) |
|
Form of Note relating to the registrant’s offering of $500,000,000 principal amount of 5.625% Notes due December 1, 2040. |
|
8-K |
|
|
11/29/2010 |
|
|
4(b) |
The registrant hereby undertakes to file with the Securities and Exchange Commission, upon request, copies of
any constituent instruments defining the rights of holders of long-term debt of the registrant or its subsidiaries that have not been filed herewith because the amounts represented thereby are less than 10% of the total assets of the
registrant and its subsidiaries on a consolidated basis.
|
|
|
|
|
|
|
|
|
|
|
| |
|
|
|
Incorporated By Reference |
Exhibit
Number |
|
Description of Document |
|
Form |
|
Filing Date/Period
End Date |
|
|
Exhibit Number
(if different) |
| 10(a) |
|
Sixth Voting Agreement dated April 22, 1978, between Central Canada Potash, Division of Noranda, Inc., Cominco Ltd., International Minerals and Chemical Corporation (Canada)
Limited, PCS Sales and Texasgulf Inc. |
|
F-1
(File No.
33-31303) |
|
|
9/28/1989 |
|
|
10(f) |
| 10(b) |
|
Canpotex Limited Shareholders Seventh Memorandum of Agreement effective April 21, 1978, between Central Canada Potash, Division of Noranda Inc., Cominco Ltd., International
Minerals and Chemical Corporation (Canada) Limited, PCS Sales, Texasgulf Inc. and Canpotex Limited as amended by Canpotex S&P amending agreement dated November 4, 1987. |
|
F-1
(File No.
33-31303) |
|
|
9/28/1989 |
|
|
10(g) |
| 10(c) |
|
Producer Agreement dated April 21, 1978, between Canpotex Limited and PCS Sales. |
|
F-1
(File No.
33-31303) |
|
|
9/28/1989 |
|
|
10(h) |
| 10(d) |
|
Canpotex/PCS Amending Agreement, dated as of October 1, 1992. |
|
10-K |
|
|
12/31/1995 |
|
|
10(f) |
| 10(e) |
|
Canpotex PCA Collateral Withdrawing/PCS Amending Agreement, dated as of October 7, 1993. |
|
10-K |
|
|
12/31/1995 |
|
|
10(g) |
| 10(f) |
|
Canpotex Producer Agreement amending agreement dated as of July 1, 2002. |
|
10-Q |
|
|
6/30/2004 |
|
|
10(g) |
| 10(g) |
|
Esterhazy Restated Mining and Processing Agreement dated January 31, 1978, between International Minerals & Chemical Corporation (Canada) Limited and the registrant’s
predecessor. |
|
F-1
(File No.
33-31303) |
|
|
9/28/1989 |
|
|
10(e) |
| 10(h) |
|
Agreement dated December 21, 1990, between International Minerals & Chemical Corporation (Canada) Limited and the registrant, amending the Esterhazy Restated Mining and
Processing Agreement dated January 31, 1978. |
|
10-K |
|
|
12/31/1990 |
|
|
10(p) |
| 10(i) |
|
Agreement effective August 27, 1998, between International Minerals & Chemical (Canada) Global Limited and the registrant, amending the Esterhazy Restated Mining and
Processing Agreement dated January 31, 1978 (as amended). |
|
10-K |
|
|
12/31/1998 |
|
|
10(l) |
IV-3
|
|
|
|
|
|
|
|
|
|
|
| |
|
|
|
Incorporated By Reference |
Exhibit
Number |
|
Description of Document |
|
Form |
|
Filing Date/Period End
Date |
|
|
Exhibit Number
(if different) |
| 10(j) |
|
Agreement effective August 31, 1998, among International Minerals & Chemical (Canada) Global Limited, International Minerals & Chemical (Canada) Limited Partnership and
the registrant assigning the interest in the Esterhazy Restated Mining and Processing Agreement dated January 31, 1978 (as amended) held by International Minerals & Chemical (Canada) Global Limited to International Minerals & Chemical
(Canada) Limited Partnership. |
|
10-K |
|
|
12/31/1998 |
|
|
10(m) |
| 10(k) |
|
Potash Corporation of Saskatchewan Inc. Stock Option Plan — Directors, as amended. |
|
10-K |
|
|
12/31/2006 |
|
|
10(l) |
| 10(l) |
|
Potash Corporation of Saskatchewan Inc. Stock Option Plan — Officers and Employees, as amended. |
|
10-K |
|
|
12/31/2006 |
|
|
10(m) |
| 10(m) |
|
Short-Term Incentive Plan of the registrant effective January 1, 2000, as amended. |
|
10-K |
|
|
12/31/2011 |
|
|
|
| 10(n) |
|
Resolution and Forms of Agreement for Supplemental Executive Retirement Income Plan, for officers and key employees of the registrant. |
|
10-K |
|
|
12/31/1995 |
|
|
10(o) |
| 10(o) |
|
Amending Resolution and revised forms of agreement regarding Supplemental Retirement Income Plan of the registrant. |
|
10-Q |
|
|
6/30/1996 |
|
|
10(x) |
| 10(p) |
|
Amended and restated Supplemental Executive Retirement Income Plan of the registrant and text of amendment to existing supplemental income plan agreements. |
|
10-Q |
|
|
9/30/2000 |
|
|
10(mm) |
| 10(q) |
|
Amendment, dated February 23, 2009, to the amended and restated Supplemental Executive Retirement Income Plan. |
|
10-K |
|
|
12/31/2008 |
|
|
10(r) |
| 10(r) |
|
Amendment, dated December 29, 2010, to the amended and restated Supplemental Executive Retirement Income Plan. |
|
10-K |
|
|
12/31/2010 |
|
|
|
| 10(s) |
|
Form of Letter of amendment to existing supplemental income plan agreements of the registrant. |
|
10-K |
|
|
12/31/2002 |
|
|
10(cc) |
| 10(t) |
|
Amended and restated agreement dated February 20, 2007, between the registrant and William J. Doyle concerning the Supplemental Executive Retirement Income Plan. |
|
10-K |
|
|
12/31/2006 |
|
|
10(s) |
| 10(u) |
|
Amendment, dated December 24, 2008, to the amended and restated agreement, dated February 20, 2007, between the registrant and William J. Doyle concerning the Supplemental Executive
Retirement Income Plan. |
|
10-K |
|
|
12/31/2008 |
|
|
10(u) |
| 10(v) |
|
Amendment, dated February 23, 2009, to the amended and restated agreement, dated February 20, 2007, between the registrant and William J. Doyle concerning the Supplemental Executive
Retirement Income Plan. |
|
10-K |
|
|
12/31/2008 |
|
|
10(v) |
| 10(w) |
|
Amendment, dated February 23, 2009, to the amended and restated agreement, dated August 2, 1996, between the registrant and Wayne R. Brownlee concerning the Supplemental
Executive Retirement Income Plan. |
|
10-K |
|
|
12/31/2008 |
|
|
10(w) |
| 10(x) |
|
Amendment, dated February 23, 2009, to the amended and restated agreement, dated August 2, 1996, between the registrant and Garth W. Moore concerning the Supplemental Executive
Retirement Income Plan. |
|
10-K |
|
|
12/31/2008 |
|
|
10(x) |
| 10(y) |
|
Amendment, dated December 29, 2010, to the amended and restated agreement, dated February 20, 2007, between the registrant and William J. Doyle concerning the Supplemental Executive
Retirement Income Plan. |
|
10-K |
|
|
12/31/2010 |
|
|
10(y) |
| 10(z) |
|
Amendment, dated December 29, 2010, to the amended and restated agreement, dated August 2, 1996, between the registrant and Wayne R. Brownlee concerning the Supplemental Executive
Retirement Income Plan. |
|
10-K |
|
|
12/31/2010 |
|
|
10(z) |
| 10(aa) |
|
Amendment, dated December 29, 2010, to the amended and restated agreement, dated August 2, 1996, between the registrant and Garth W. Moore concerning the Supplemental Executive
Retirement Income Plan. |
|
10-K |
|
|
12/31/2010 |
|
|
10(aa) |
| 10(bb) |
|
Supplemental Retirement Agreement dated December 24, 2008, between the registrant and Stephen F. Dowdle. |
|
10-K |
|
|
12/31/2011 |
|
|
|
| 10(cc) |
|
Supplemental Retirement Benefits Plan for U.S. Executives dated effective January 1, 1999. |
|
10-Q |
|
|
6/30/2002 |
|
|
10(aa) |
IV-4
|
|
|
|
|
|
|
|
|
|
|
| |
|
|
|
Incorporated By Reference |
Exhibit
Number |
|
Description of Document |
|
Form |
|
Filing Date/Period End
Date |
|
|
Exhibit Number
(if different) |
| 10(dd) |
|
Amendment No. 1, dated December 24, 2008, to the Supplemental Retirement Plan for U.S. Executives. |
|
10-K |
|
|
12/31/2008 |
|
|
10(z) |
| 10(ee) |
|
Amendment No. 2, dated February 23, 2009, to the Supplemental Retirement Plan for U.S. Executives. |
|
10-K |
|
|
12/31/2008 |
|
|
10(aa) |
| 10(ff) |
|
Forms of Agreement dated December 30, 1994, between the registrant and certain officers of the registrant. |
|
10-K |
|
|
12/31/1995 |
|
|
10(p) |
| 10(gg) |
|
Amendment, dated December 31, 2010, to the Agreement, dated December 30, 1994 between the registrant and William J. Doyle. |
|
10-K |
|
|
12/31/2010 |
|
|
10(ee) |
| 10(hh) |
|
Form of Agreement of Indemnification dated August 8, 1995, between the registrant and certain officers and directors of the registrant. |
|
10-K |
|
|
12/31/1995 |
|
|
10(q) |
| 10(ii) |
|
Resolution and Form of Agreement of Indemnification dated January 24, 2001. |
|
10-K |
|
|
12/31/2000 |
|
|
|
| 10(jj) |
|
Resolution and Form of Agreement of Indemnification — July 21, 2004. |
|
10-Q |
|
|
6/30/2004 |
|
|
10(ii) |
| 10(kk) |
|
Chief Executive Officer Medical and Dental Benefits. |
|
10-K |
|
|
12/31/2010 |
|
|
10(jj) |
| 10(ll) |
|
Deferred Share Unit Plan for Non-Employee Directors, as amended. |
|
10-Q |
|
|
3/31/2008 |
|
|
10(bb) |
| 10(mm) |
|
U.S. Participant Addendum No. 1 to the Deferred Share Unit Plan for Non-Employee Directors. |
|
10-K |
|
|
12/31/2008 |
|
|
10(jj) |
| 10(nn) |
|
Potash Corporation of Saskatchewan Inc. 2005 Performance Option Plan and Form of Option Agreement, as amended. |
|
10-K |
|
|
12/31/2006 |
|
|
10(cc) |
| 10(oo) |
|
Potash Corporation of Saskatchewan Inc. 2006 Performance Option Plan and Form of Option Agreement, as amended. |
|
10-K |
|
|
12/31/2006 |
|
|
10(dd) |
| 10(pp) |
|
Potash Corporation of Saskatchewan Inc. 2007 Performance Option Plan and Form of Option Agreement. |
|
10-Q |
|
|
3/31/2007 |
|
|
10(ee) |
| 10(qq) |
|
Potash Corporation of Saskatchewan Inc. 2008 Performance Option Plan and Form of Option Agreement. |
|
10-Q |
|
|
3/31/2008 |
|
|
10(ff) |
| 10(rr) |
|
Potash Corporation of Saskatchewan Inc. 2009 Performance Option Plan and Form of Option Agreement. |
|
10-Q |
|
|
3/31/2009 |
|
|
10(mm) |
| 10(ss) |
|
Potash Corporation of Saskatchewan Inc. 2010 Performance Option Plan and Form of Option Agreement. |
|
8-K |
|
|
5/7/2010 |
|
|
10.1 |
| 10(tt) |
|
Potash corporation of Saskatchewan Inc. 2011 Performance Option Plan and Form of Option Agreement. |
|
8-K |
|
|
5/13/2011 |
|
|
10(a) |
| 10(uu) |
|
Medium-Term Incentive Plan of the registrant effective January 1, 2012. |
|
10-K |
|
|
12/31/2011 |
|
|
|
| 11 |
|
Statement re Computation of Per Share Earnings. |
|
10-K |
|
|
12/31/2011 |
|
|
|
| 12 |
|
Computation of Ratio of Earnings to Fixed Charges. |
|
10-K |
|
|
12/31/2011 |
|
|
|
| 13 |
|
2011 Annual Report. The 2011 Annual Report, except for those portions that are expressly incorporated by reference, is furnished for the information of the Commission and is not to
be deemed “filed” as part of or otherwise form part of this filing. |
|
10-K |
|
|
12/31/2011 |
|
|
|
| 21 |
|
Subsidiaries of the registrant. |
|
10-K |
|
|
12/31/2011 |
|
|
|
| 23 |
|
Consent of Deloitte & Touche LLP. |
|
|
|
|
|
|
|
|
| 31(a) |
|
Certification pursuant to Section 302 of the Sarbanes-Oxley Act of 2002. |
|
|
|
|
|
|
|
|
| 31(b) |
|
Certification pursuant to Section 302 of the Sarbanes-Oxley Act of 2002. |
|
|
|
|
|
|
|
|
| 32 |
|
Certification pursuant to Section 906 of the Sarbanes-Oxley Act of 2002. |
|
|
|
|
|
|
|
|
| 95 |
|
Information concerning mine safety violations or other regulatory matters required by Section 1503(a) of the Dodd-Frank Wall Street Reform and Consumer Protection Act. |
|
10-K |
|
|
12/31/2011 |
|
|
|
| 99(a) |
|
2012 Notice of Meeting, Proxy Circular and Form of Proxy. The 2012 Notice of Meeting, Proxy Circular and Form of Proxy, except for those portions thereof that are expressly
incorporated by reference, are furnished for the information of the Commission and are not to be deemed “filed” as part of or otherwise form part of this filing. |
|
10-K |
|
|
12/31/2011 |
|
|
|
| 99(b) |
|
2011 Summary Annual Report. The 2011 Summary Annual Report is furnished for the information of the Commission and is not to be deemed
“filed” as part of or otherwise form part of this filing. |
|
10-K |
|
|
12/31/2011 |
|
|
|
IV-5
Signatures
Pursuant to the requirements of Section 13 or 15(d) of the Securities Exchange Act of 1934, the registrant has duly caused this report to be
signed on its behalf by the undersigned, thereunto duly authorized.
|
|
|
| POTASH CORPORATION OF SASKATCHEWAN INC. |
|
|
| By: |
|
/s/ WILLIAM J. DOYLE |
|
|
William J. Doyle President and Chief
Executive Officer July 5, 2012 |
EXHIBIT INDEX
|
|
|
|
|
|
|
|
|
|
|
| |
|
|
|
Incorporated By Reference |
Exhibit
Number |
|
Description of Document |
|
Form |
|
Filing Date/Period
End Date |
|
|
Exhibit Number
(if different) |
| 3(a) |
|
Articles of Continuance of the registrant dated May 15, 2002. |
|
10-Q |
|
|
6/30/2002 |
|
|
|
| 3(b) |
|
Bylaws of the registrant effective May 15, 2002. |
|
10-Q |
|
|
6/30/2002 |
|
|
|
| 4(a) |
|
Term Credit Agreement between The Bank of Nova Scotia and other financial institutions and the registrant dated September 25, 2001. |
|
10-Q |
|
|
9/30/2001 |
|
|
|
| 4(b) |
|
Syndicated Term Credit Facility Amending Agreement between The Bank of Nova Scotia and other financial institutions and the registrant dated as of September 23, 2003. |
|
10-Q |
|
|
9/30/2003 |
|
|
|
| 4(c) |
|
Syndicated Term Credit Facility Second Amending Agreement between The Bank of Nova Scotia and other financial institutions and the registrant dated as of September 21,
2004. |
|
8-K |
|
|
9/24/2004 |
|
|
|
| 4(d) |
|
Syndicated Term Credit Facility Third Amending Agreement between The Bank of Nova Scotia and other financial institutions and the registrant dated as of September 20, 2005. |
|
8-K |
|
|
9/22/2005 |
|
|
4(a) |
| 4(e) |
|
Syndicated Term Credit Facility Fourth Amending Agreement between The Bank of Nova Scotia and other financial institutions and the registrant dated as of September 27,
2006. |
|
10-Q |
|
|
9/30/2006 |
|
|
|
| 4(f) |
|
Syndicated Term Credit Facility Fifth Amending Agreement between the Bank of Nova Scotia and other financial institutions and the registrant dated as of October 19, 2007. |
|
8-K |
|
|
10/22/2007 |
|
|
4(a) |
| 4(g) |
|
Indenture dated as of February 27, 2003, between the registrant and The Bank of Nova Scotia Trust Company of New York. |
|
10-K |
|
|
12/31/2002 |
|
|
4(c) |
| 4(h) |
|
Form of Note relating to the registrant’s offering of $250,000,000 principal amount of 4.875% Notes due March 1, 2013. |
|
8-K |
|
|
2/28/2003 |
|
|
4 |
| 4(i) |
|
Form of Note relating to the registrant’s offering of $500,000,000 principal amount of 5.875% Notes due December 1, 2036. |
|
8-K |
|
|
11/30/2006 |
|
|
4(a) |
| 4(j) |
|
Form of Note relating to the registrant’s offering of $500,000,000 principal amount of 5.25% Notes due May 15, 2014. |
|
8-K |
|
|
5/1/2009 |
|
|
4(a) |
|
|
|
|
|
|
|
|
|
|
|
| |
|
|
|
Incorporated By Reference |
Exhibit
Number |
|
Description of Document |
|
Form |
|
Filing Date/Period
End Date |
|
|
Exhibit Number
(if different) |
| 4(k) |
|
Form of Note relating to the registrant’s offering of $500,000,000 principal amount of 6.50% Notes due May 15, 2019. |
|
8-K |
|
|
5/1/2009 |
|
|
4(b) |
| 4(l) |
|
Form of Note relating to the registrant’s offering of $500,000,000 principal amount of 3.75% Notes due September 30, 2015. |
|
8-K |
|
|
9/25/2009 |
|
|
4(a) |
| 4(m) |
|
Form of Note relating to the registrant’s offering of $500,000,000 principal amount of 4.875% Notes due March 30, 2020. |
|
8-K |
|
|
9/25/2009 |
|
|
4(b) |
| 4(n) |
|
Revolving Term Credit Facility Agreement between the Bank of Nova Scotia and other financial institutions and the registrant dated December 11, 2009. |
|
8-K |
|
|
12/15/2009 |
|
|
4(a) |
| 4(o) |
|
Revolving Term Credit Facility First amending Agreement between the Bank of Nova Scotia and other financial institutions and the registrant dated September 23, 2011. |
|
8-K |
|
|
9/26/2011 |
|
|
4(a) |
| 4(p) |
|
Form of Note relating to the registrant’s offering of $500,000,000 principal amount of 3.25% Notes due December 1, 2017. |
|
8-K |
|
|
11/29/2010 |
|
|
4(a) |
| 4(q) |
|
Form of Note relating to the registrant’s offering of $500,000,000 principal amount of 5.625% Notes due December 1, 2040. |
|
8-K |
|
|
11/29/2010 |
|
|
4(b) |
The registrant hereby undertakes to file with the Securities and Exchange Commission, upon request, copies of
any constituent instruments defining the rights of holders of long-term debt of the registrant or its subsidiaries that have not been filed herewith because the amounts represented thereby are less than 10% of the total assets of the
registrant and its subsidiaries on a consolidated basis.
|
|
|
|
|
|
|
|
|
|
|
| |
|
|
|
Incorporated By Reference |
Exhibit
Number |
|
Description of Document |
|
Form |
|
Filing Date/Period
End Date |
|
|
Exhibit Number
(if different) |
| 10(a) |
|
Sixth Voting Agreement dated April 22, 1978, between Central Canada Potash, Division of Noranda, Inc., Cominco Ltd., International Minerals and Chemical Corporation (Canada)
Limited, PCS Sales and Texasgulf Inc. |
|
F-1
(File No.
33-31303) |
|
|
9/28/1989 |
|
|
10(f) |
| 10(b) |
|
Canpotex Limited Shareholders Seventh Memorandum of Agreement effective April 21, 1978, between Central Canada Potash, Division of Noranda Inc., Cominco Ltd., International
Minerals and Chemical Corporation (Canada) Limited, PCS Sales, Texasgulf Inc. and Canpotex Limited as amended by Canpotex S&P amending agreement dated November 4, 1987. |
|
F-1
(File No.
33-31303) |
|
|
9/28/1989 |
|
|
10(g) |
| 10(c) |
|
Producer Agreement dated April 21, 1978, between Canpotex Limited and PCS Sales. |
|
F-1
(File No.
33-31303) |
|
|
9/28/1989 |
|
|
10(h) |
| 10(d) |
|
Canpotex/PCS Amending Agreement, dated as of October 1, 1992. |
|
10-K |
|
|
12/31/1995 |
|
|
10(f) |
| 10(e) |
|
Canpotex PCA Collateral Withdrawing/PCS Amending Agreement, dated as of October 7, 1993. |
|
10-K |
|
|
12/31/1995 |
|
|
10(g) |
| 10(f) |
|
Canpotex Producer Agreement amending agreement dated as of July 1, 2002. |
|
10-Q |
|
|
6/30/2004 |
|
|
10(g) |
| 10(g) |
|
Esterhazy Restated Mining and Processing Agreement dated January 31, 1978, between International Minerals & Chemical Corporation (Canada) Limited and the registrant’s
predecessor. |
|
F-1
(File No.
33-31303) |
|
|
9/28/1989 |
|
|
10(e) |
| 10(h) |
|
Agreement dated December 21, 1990, between International Minerals & Chemical Corporation (Canada) Limited and the registrant, amending the Esterhazy Restated Mining and
Processing Agreement dated January 31, 1978. |
|
10-K |
|
|
12/31/1990 |
|
|
10(p) |
| 10(i) |
|
Agreement effective August 27, 1998, between International Minerals & Chemical (Canada) Global Limited and the registrant, amending the Esterhazy Restated Mining and
Processing Agreement dated January 31, 1978 (as amended). |
|
10-K |
|
|
12/31/1998 |
|
|
10(l) |
|
|
|
|
|
|
|
|
|
|
|
| |
|
|
|
Incorporated By Reference |
Exhibit
Number |
|
Description of Document |
|
Form |
|
Filing Date/Period End
Date |
|
|
Exhibit Number
(if different) |
| 10(j) |
|
Agreement effective August 31, 1998, among International Minerals & Chemical (Canada) Global Limited, International Minerals & Chemical (Canada) Limited Partnership and
the registrant assigning the interest in the Esterhazy Restated Mining and Processing Agreement dated January 31, 1978 (as amended) held by International Minerals & Chemical (Canada) Global Limited to International Minerals & Chemical
(Canada) Limited Partnership. |
|
10-K |
|
|
12/31/1998 |
|
|
10(m) |
| 10(k) |
|
Potash Corporation of Saskatchewan Inc. Stock Option Plan — Directors, as amended. |
|
10-K |
|
|
12/31/2006 |
|
|
10(l) |
| 10(l) |
|
Potash Corporation of Saskatchewan Inc. Stock Option Plan — Officers and Employees, as amended. |
|
10-K |
|
|
12/31/2006 |
|
|
10(m) |
| 10(m) |
|
Short-Term Incentive Plan of the registrant effective January 1, 2000, as amended. |
|
10-K |
|
|
12/31/2011 |
|
|
|
| 10(n) |
|
Resolution and Forms of Agreement for Supplemental Executive Retirement Income Plan, for officers and key employees of the registrant. |
|
10-K |
|
|
12/31/1995 |
|
|
10(o) |
| 10(o) |
|
Amending Resolution and revised forms of agreement regarding Supplemental Retirement Income Plan of the registrant. |
|
10-Q |
|
|
6/30/1996 |
|
|
10(x) |
| 10(p) |
|
Amended and restated Supplemental Executive Retirement Income Plan of the registrant and text of amendment to existing supplemental income plan agreements. |
|
10-Q |
|
|
9/30/2000 |
|
|
10(mm) |
| 10(q) |
|
Amendment, dated February 23, 2009, to the amended and restated Supplemental Executive Retirement Income Plan. |
|
10-K |
|
|
12/31/2008 |
|
|
10(r) |
| 10(r) |
|
Amendment, dated December 29, 2010, to the amended and restated Supplemental Executive Retirement Income Plan. |
|
10-K |
|
|
12/31/2010 |
|
|
|
| 10(s) |
|
Form of Letter of amendment to existing supplemental income plan agreements of the registrant. |
|
10-K |
|
|
12/31/2002 |
|
|
10(cc) |
| 10(t) |
|
Amended and restated agreement dated February 20, 2007, between the registrant and William J. Doyle concerning the Supplemental Executive Retirement Income Plan. |
|
10-K |
|
|
12/31/2006 |
|
|
10(s) |
| 10(u) |
|
Amendment, dated December 24, 2008, to the amended and restated agreement, dated February 20, 2007, between the registrant and William J. Doyle concerning the Supplemental Executive
Retirement Income Plan. |
|
10-K |
|
|
12/31/2008 |
|
|
10(u) |
| 10(v) |
|
Amendment, dated February 23, 2009, to the amended and restated agreement, dated February 20, 2007, between the registrant and William J. Doyle concerning the Supplemental Executive
Retirement Income Plan. |
|
10-K |
|
|
12/31/2008 |
|
|
10(v) |
| 10(w) |
|
Amendment, dated February 23, 2009, to the amended and restated agreement, dated August 2, 1996, between the registrant and Wayne R. Brownlee concerning the Supplemental
Executive Retirement Income Plan. |
|
10-K |
|
|
12/31/2008 |
|
|
10(w) |
| 10(x) |
|
Amendment, dated February 23, 2009, to the amended and restated agreement, dated August 2, 1996, between the registrant and Garth W. Moore concerning the Supplemental Executive
Retirement Income Plan. |
|
10-K |
|
|
12/31/2008 |
|
|
10(x) |
| 10(y) |
|
Amendment, dated December 29, 2010, to the amended and restated agreement, dated February 20, 2007, between the registrant and William J. Doyle concerning the Supplemental Executive
Retirement Income Plan. |
|
10-K |
|
|
12/31/2010 |
|
|
10(y) |
| 10(z) |
|
Amendment, dated December 29, 2010, to the amended and restated agreement, dated August 2, 1996, between the registrant and Wayne R. Brownlee concerning the Supplemental Executive
Retirement Income Plan. |
|
10-K |
|
|
12/31/2010 |
|
|
10(z) |
| 10(aa) |
|
Amendment, dated December 29, 2010, to the amended and restated agreement, dated August 2, 1996, between the registrant and Garth W. Moore concerning the Supplemental Executive
Retirement Income Plan. |
|
10-K |
|
|
12/31/2010 |
|
|
10(aa) |
| 10(bb) |
|
Supplemental Retirement Agreement dated December 24, 2008, between the registrant and Stephen F. Dowdle. |
|
10-K |
|
|
12/31/2011 |
|
|
|
| 10(cc) |
|
Supplemental Retirement Benefits Plan for U.S. Executives dated effective January 1, 1999. |
|
10-Q |
|
|
6/30/2002 |
|
|
10(aa) |
|
|
|
|
|
|
|
|
|
|
|
| |
|
|
|
Incorporated By Reference |
Exhibit
Number |
|
Description of Document |
|
Form |
|
Filing Date/Period End
Date |
|
|
Exhibit Number
(if different) |
| 10(dd) |
|
Amendment No. 1, dated December 24, 2008, to the Supplemental Retirement Plan for U.S. Executives. |
|
10-K |
|
|
12/31/2008 |
|
|
10(z) |
| 10(ee) |
|
Amendment No. 2, dated February 23, 2009, to the Supplemental Retirement Plan for U.S. Executives. |
|
10-K |
|
|
12/31/2008 |
|
|
10(aa) |
| 10(ff) |
|
Forms of Agreement dated December 30, 1994, between the registrant and certain officers of the registrant. |
|
10-K |
|
|
12/31/1995 |
|
|
10(p) |
| 10(gg) |
|
Amendment, dated December 31, 2010, to the Agreement, dated December 30, 1994 between the registrant and William J. Doyle. |
|
10-K |
|
|
12/31/2010 |
|
|
10(ee) |
| 10(hh) |
|
Form of Agreement of Indemnification dated August 8, 1995, between the registrant and certain officers and directors of the registrant. |
|
10-K |
|
|
12/31/1995 |
|
|
10(q) |
| 10(ii) |
|
Resolution and Form of Agreement of Indemnification dated January 24, 2001. |
|
10-K |
|
|
12/31/2000 |
|
|
|
| 10(jj) |
|
Resolution and Form of Agreement of Indemnification — July 21, 2004. |
|
10-Q |
|
|
6/30/2004 |
|
|
10(ii) |
| 10(kk) |
|
Chief Executive Officer Medical and Dental Benefits. |
|
10-K |
|
|
12/31/2010 |
|
|
10(jj) |
| 10(ll) |
|
Deferred Share Unit Plan for Non-Employee Directors, as amended. |
|
10-Q |
|
|
3/31/2008 |
|
|
10(bb) |
| 10(mm) |
|
U.S. Participant Addendum No. 1 to the Deferred Share Unit Plan for Non-Employee Directors. |
|
10-K |
|
|
12/31/2008 |
|
|
10(jj) |
| 10(nn) |
|
Potash Corporation of Saskatchewan Inc. 2005 Performance Option Plan and Form of Option Agreement, as amended. |
|
10-K |
|
|
12/31/2006 |
|
|
10(cc) |
| 10(oo) |
|
Potash Corporation of Saskatchewan Inc. 2006 Performance Option Plan and Form of Option Agreement, as amended. |
|
10-K |
|
|
12/31/2006 |
|
|
10(dd) |
| 10(pp) |
|
Potash Corporation of Saskatchewan Inc. 2007 Performance Option Plan and Form of Option Agreement. |
|
10-Q |
|
|
3/31/2007 |
|
|
10(ee) |
| 10(qq) |
|
Potash Corporation of Saskatchewan Inc. 2008 Performance Option Plan and Form of Option Agreement. |
|
10-Q |
|
|
3/31/2008 |
|
|
10(ff) |
| 10(rr) |
|
Potash Corporation of Saskatchewan Inc. 2009 Performance Option Plan and Form of Option Agreement. |
|
10-Q |
|
|
3/31/2009 |
|
|
10(mm) |
| 10(ss) |
|
Potash Corporation of Saskatchewan Inc. 2010 Performance Option Plan and Form of Option Agreement. |
|
8-K |
|
|
5/7/2010 |
|
|
10.1 |
| 10(tt) |
|
Potash corporation of Saskatchewan Inc. 2011 Performance Option Plan and Form of Option Agreement. |
|
8-K |
|
|
5/13/2011 |
|
|
10(a) |
| 10(uu) |
|
Medium-Term Incentive Plan of the registrant effective January 1, 2012. |
|
10-K |
|
|
12/31/2011 |
|
|
|
| 11 |
|
Statement re Computation of Per Share Earnings. |
|
10-K |
|
|
12/31/2011 |
|
|
|
| 12 |
|
Computation of Ratio of Earnings to Fixed Charges. |
|
10-K |
|
|
12/31/2011 |
|
|
|
| 13 |
|
2011 Annual Report. The 2011 Annual Report, except for those portions that are expressly incorporated by reference, is furnished for the information of the Commission and is not to
be deemed “filed” as part of or otherwise form part of this filing. |
|
10-K |
|
|
12/31/2011 |
|
|
|
| 21 |
|
Subsidiaries of the registrant. |
|
10-K |
|
|
12/31/2011 |
|
|
|
| 23 |
|
Consent of Deloitte & Touche LLP. |
|
|
|
|
|
|
|
|
| 31(a) |
|
Certification pursuant to Section 302 of the Sarbanes-Oxley Act of 2002. |
|
|
|
|
|
|
|
|
| 31(b) |
|
Certification pursuant to Section 302 of the Sarbanes-Oxley Act of 2002. |
|
|
|
|
|
|
|
|
| 32 |
|
Certification pursuant to Section 906 of the Sarbanes-Oxley Act of 2002. |
|
|
|
|
|
|
|
|
| 95 |
|
Information concerning mine safety violations or other regulatory matters required by Section 1503(a) of the Dodd-Frank Wall Street Reform and Consumer Protection Act. |
|
10-K |
|
|
12/31/2011 |
|
|
|
| 99(a) |
|
2012 Notice of Meeting, Proxy Circular and Form of Proxy. The 2012 Notice of Meeting, Proxy Circular and Form of Proxy, except for those portions thereof that are expressly
incorporated by reference, are furnished for the information of the Commission and are not to be deemed “filed” as part of or otherwise form part of this filing. |
|
10-K |
|
|
12/31/2011 |
|
|
|
| 99(b) |
|
2011 Summary Annual Report. The 2011 Summary Annual Report is furnished for the information of the Commission and is not to be deemed
“filed” as part of or otherwise form part of this filing. |
|
10-K |
|
|
12/31/2011 |
|
|
|