Attached files
| file | filename |
|---|---|
| EXCEL - IDEA: XBRL DOCUMENT - Roadrunner Transportation Systems, Inc. | Financial_Report.xls |
| EX-21.1 - EX-21.1 - Roadrunner Transportation Systems, Inc. | d309108dex211.htm |
| EX-23.1 - EX-23.1 - Roadrunner Transportation Systems, Inc. | d309108dex231.htm |
| EX-31.1 - EX-31.1 - Roadrunner Transportation Systems, Inc. | d309108dex311.htm |
| EX-32.1 - EX-32.1 - Roadrunner Transportation Systems, Inc. | d309108dex321.htm |
| EX-31.2 - EX-31.2 - Roadrunner Transportation Systems, Inc. | d309108dex312.htm |
| EX-32.2 - EX-32.2 - Roadrunner Transportation Systems, Inc. | d309108dex322.htm |
UNITED STATES
SECURITIES AND EXCHANGE COMMISSION
Washington, D.C. 20549
Form 10-K
ANNUAL REPORT PURSUANT TO SECTION 13 OR 15(d)
OF THE SECURITIES EXCHANGE ACT OF 1934
For the Fiscal Year Ended December 31, 2011
Commission File Number 001-34734
ROADRUNNER TRANSPORTATION SYSTEMS, INC.
(Exact Name of Registrant as Specified in Its Charter)
| Delaware | 20-2454942 | |
| (State or Other Jurisdiction of Incorporation or Organization) |
(I.R.S. Employer Identification No.) | |
| 4900 S. Pennsylvania Ave. Cudahy, Wisconsin |
53110 | |
| (Address of Principal Executive Offices) | (Zip Code) | |
(414) 615-1500
(Registrant’s telephone number, including area code)
Securities registered pursuant to Section 12(b) of the Act:
| Title of Each Class |
Name of Each Exchange on Which Registered | |
| Common Stock, par value $.01 per share | The New York Stock Exchange |
Indicate by check mark if the registrant is a well-known seasoned issuer, as defined in Rule 405 of the Securities Act. Yes ¨ No x
Indicate by check mark if the registrant is not required to file reports pursuant to Section 13 or Section 15(d) of the Act. Yes ¨ No x
Indicate by check mark whether the registrant (1) has filed all reports required to be filed by Section 13 or 15(d) of the Securities Exchange Act of 1934 during the preceding 12 months (or for such shorter period that the registrant was required to file such reports), and (2) has been subject to such filing requirements for the past 90 days. Yes x No ¨
Indicate by check mark whether the registrant has submitted electronically and posted on its corporate Web site, if any, every Interactive Data File required to be submitted and posted pursuant to Rule 405 of Regulation S-T (§ 232.405 of this chapter) during the preceding 12 months (or for such shorter period that the registrant was required to submit and post such files). Yes x No ¨
Indicate by check mark if disclosure of delinquent filers pursuant to Item 405 of Regulation S-K is not contained herein, and will not be contained to the best of registrant’s knowledge, in definitive proxy or information statements incorporated by reference in Part III of this Form 10-K or any amendment to this Form 10-K. x
Indicate by check mark whether the registrant is a large accelerated filer, an accelerated filer, a non-accelerated filer, or a smaller reporting company. See the definitions of “large accelerated filer,” “accelerated filer” and “smaller reporting company” in Rule 12b-2 of the Exchange Act. (Check one):
| Large accelerated filer |
¨ |
Accelerated filer |
x | |||
| Non-accelerated filer |
¨ (Do not check if a smaller reporting company) |
Smaller reporting company |
¨ | |||
Indicate by check mark whether the registrant is a shell company (as defined in Rule 12b-2 of the Act). Yes ¨ No x
The aggregate market value of Common Stock held by nonaffiliates of the registrant (12,782,961 shares), based on the closing price of the registrant’s Common Stock as reported on the New York Stock Exchange on June 30, 2011 of $15.08, was $192,767,051. For purposes of this computation, all officers, directors, and 10% beneficial owners of the registrant are deemed to be affiliates. Such determination should not be deemed to be an admission that such officers, directors, or 10% beneficial owners are, in fact, affiliates of the registrant.
As of March 12, 2012, there were outstanding 30,782,641 shares of the registrant’s Common Stock, par value $.01 per share.
Documents Incorporated by Reference
Portions of the registrant’s definitive Proxy Statement for the 2012 Annual Meeting of Stockholders are incorporated by reference into Part III of this Form 10-K.
ROADRUNNER TRANSPORTATION SYSTEMS, INC.
ANNUAL REPORT ON FORM 10-K
| ITEM 1. |
1 | |||||
| ITEM 1A. |
12 | |||||
| ITEM 1B. |
16 | |||||
| ITEM 2. |
16 | |||||
| ITEM 3. |
17 | |||||
| ITEM 4. |
17 | |||||
| ITEM 5. |
17 | |||||
| ITEM 6. |
19 | |||||
| ITEM 7. |
MANAGEMENT’S DISCUSSION AND ANALYSIS OF FINANCIAL CONDITION AND RESULTS OF OPERATIONS |
21 | ||||
| ITEM 7A. |
30 | |||||
| ITEM 8. |
30 | |||||
| ITEM 9. |
CHANGES IN AND DISAGREEMENTS WITH ACCOUNTANTS ON ACCOUNTING AND FINANCIAL DISCLOSURE |
30 | ||||
| ITEM 9A. |
30 | |||||
| ITEM 9B. |
31 | |||||
| ITEM 10. |
32 | |||||
| ITEM 11. |
32 | |||||
| ITEM 12. |
SECURITY OWNERSHIP OF CERTAIN BENEFICIAL OWNERS AND MANAGEMENT AND RELATED STOCKHOLDER MATTERS |
32 | ||||
| ITEM 13. |
CERTAIN RELATIONSHIPS AND RELATED TRANSACTIONS, AND DIRECTOR INDEPENDENCE |
32 | ||||
| ITEM 14. |
33 | |||||
| ITEM 15. |
33 | |||||
Statement Regarding Forward-Looking Statements
This report on Form 10-K contains forward-looking statements regarding future events or our future financial and operational performance. Forward-looking statements include statements regarding markets for our services; trends in revenues, margins, and estimated expenses; liquidity and anticipated cash needs and availability; and any statement that contains the words “anticipate,” “believe,” “plan,” “forecast,” “foresee,” “estimate,” “project,” “expect,” “seek,” “target,” “intend,” “goal” and other similar expressions. The forward-looking statements included in this report reflect our current expectations and beliefs, and we do not undertake publicly to update or revise these statements, even if experience or future changes make it clear that any projected results expressed in this annual report or future quarterly reports, press releases or company statements will not be realized. In addition, the inclusion of any statement in this report does not constitute an admission by us that the events or circumstances described in such statement are material. Furthermore, we wish to caution and advise readers that these statements are based on assumptions that may not materialize and may involve risks and uncertainties, many of which are beyond our control, that could cause actual events or performance to differ materially from those contained or implied in these forward-looking statements. These risks and uncertainties include the business and economic risks described in Item 1A, “Risk Factors.”
Unless otherwise indicated or unless the context requires otherwise, all references in this document to “RRTS,” “our company,” “we,” “us,” “our,” and similar names refer to Roadrunner Transportation Systems, Inc. and its subsidiaries.
| ITEM 1. | BUSINESS |
Overview
We are a leading asset-light transportation and logistics service provider offering a full suite of solutions, including customized and expedited less-than-truckload, truckload and logistics, transportation management solutions, intermodal solutions (transporting a shipment by more than one mode, primarily via rail and truck), and domestic and international air. We utilize a broad third-party network of transportation providers, comprised of independent contractors (ICs) and purchased power providers, to serve a diverse customer base in terms of end market focus and annual freight expenditures. ICs are individuals or small teams that own or lease their own over-the-road transportation equipment and provide us with dedicated freight capacity. Purchased power providers are unrelated asset-based over-the-road transportation companies that provide us with freight capacity under non-exclusive contractual arrangements. Although we service large national accounts, we primarily focus on small to mid-size shippers, which we believe represent an expansive and underserved market. Our business model is highly scalable and flexible, featuring a variable cost structure that requires minimal investment in transportation equipment and facilities, thereby enhancing free cash flow generation and returns on our invested capital and assets.
We have three operating segments:
Less-than-Truckload. Our less-than-truckload (LTL) business involves the pickup, consolidation, linehaul, deconsolidation, and delivery of LTL shipments throughout the United States and into Mexico, Puerto Rico, and Canada. With a network of 20 LTL service centers and over 200 third-party delivery agents, we employ a point-to-point LTL model that we believe serves as a competitive advantage over the traditional hub and spoke LTL model in terms of faster transit times, lower incidence of damage, and reduced fuel consumption. Our LTL segment also includes domestic and international air transportation services.
Truckload and Logistics. Within our truckload and logistics (TL) business, we arrange the pickup, delivery, and inventory management of TL freight through our network of 24 TL service centers, four consolidation/warehousing facilities, 11 company dispatch offices, and 76 independent brokerage agents primarily located throughout the Eastern United States and Canada. We offer temperature-controlled, dry van, intermodal drayage, and flatbed services and specialize in the transport of refrigerated foods, poultry, and beverages. We believe this specialization provides consistent shipping volume year-over-year.
Transportation Management Solutions. Within our transportation management solutions (TMS) business, we offer a “one-stop” transportation and logistics solution, including access to the most cost-effective and time-sensitive modes of transportation within our broad network. Specifically, our TMS offering includes pricing, contract management, transportation mode and carrier selection, freight tracking, freight bill payment and audit, cost reporting and analysis, and dispatch. Our customized TMS offering is designed to allow our customers to reduce operating costs, redirect resources to core competencies, improve supply chain efficiency, and enhance customer service.
Our Industry
Over-the-Road Freight
The over-the-road freight sector includes both private fleets and “for-hire” carriers (ICs and purchased power providers). According to the American Trucking Associations (ATA), the U.S. freight sector represented revenue of approximately $694 billion in 2010 and accounted for approximately 81% of domestic freight transportation spend. The ATA estimates that U.S. freight transportation will increase to over $1.2 trillion by 2022. Private fleets consist of tractors and trailers owned and operated by shippers that move their own goods and, according to the ATA, accounted for revenue of approximately $268 billion in 2010. For-hire carriers transport freight belonging to others, including LTL and TL freight, and accounted for revenue of approximately $296 billion in 2010, according to the ATA.
LTL carriers specialize in consolidating shipments from multiple shippers into truckload quantities for delivery to multiple destinations. LTL carriers are traditionally divided into two categories — national and regional. National carriers typically focus on two-day or longer service across distances greater than 1,000 miles and often operate without time-definite delivery, while regional carriers typically offer time-definite delivery in less than two days. According to the ATA, the U.S. LTL market generated revenue of approximately $40.4 billion in 2010.
1
TL carriers dedicate an entire trailer to one shipper from origin to destination and are categorized by the type of equipment they use to haul a shipper’s freight, such as temperature-controlled, dry van, tank, or flatbed trailers. According to the ATA, excluding private fleets, revenue in the U.S. TL segment was approximately $255.2 billion in 2010.
Third-Party Logistics
Third-party logistics (3PL) providers offer TMS and distribution services including the movement and storage of freight and the assembly of inventory. The U.S. 3PL sector revenue increased from $45.3 billion in 1999 to $127.3 billion in 2010 (and experienced growth each year during such period other than from 2008 to 2009), according to Armstrong & Associates, a leading supply chain market research firm. In addition, only 10.5% of logistics expenditures by U.S. businesses were outsourced in 2010, according to Armstrong & Associates. We believe that the market penetration of 3PL providers will expand in the future as companies increasingly redirect their resources to core competencies and outsource their transportation and logistics requirements as they realize the cost-effectiveness of 3PL providers.
Factors Important to Our Business
Our success principally depends on our ability to generate revenues through our network of sales personnel and independent brokerage agents and to deliver freight in all modes safely, on time, and cost-effectively through a suite of solutions tailored to the needs of each customer. Customer shipping demand, over-the-road freight tonnage levels, and equipment capacity ultimately drive increases or decreases in our revenues. Our ability to operate profitably and generate cash is also impacted by purchased transportation costs, fuel costs, pricing dynamics, customer mix, and our ability to manage costs effectively.
Agent Network and Sales Personnel. While many national asset-based LTL providers are encumbered by the fixed overhead costs associated with owning or leasing most or all of their de-consolidation and delivery facilities, we maintain our variable cost structure through the extensive use of delivery agents. We have a network of over 200 LTL delivery agents that provide cost-effective delivery coverage throughout North America. In addition to our agent network, we market and sell our LTL services through a sales force of over 90 people, consisting of account executives, sales managers, inside sales representatives, and commission sales representatives. In our TL business, we arrange the pickup and delivery of freight either through our 97 dispatchers in 11 offices or through our network of 76 independent brokerage agents. Brokerage agents complement our network of dispatch offices by bringing pre-existing customer relationships, new customer prospects, and/or access to new geographic markets. Furthermore, brokerage agents typically provide immediate revenue and do not require us to invest in incremental overhead. Brokerage agents own or lease their own office space and pay for other costs associated with running their operation. In our TMS business, we have over 60 salespeople and commissioned sales agents. We also utilize our LTL sales force to cross-sell our TMS services.
Tonnage Levels and Capacity. Competition intensifies in the transportation industry as tonnage levels decrease and equipment capacity increases. Our ability to maintain or grow existing tonnage levels is impacted by overall economic conditions, shipping demand, and over-the-road freight capacity in North America, as well as by our ability to compete effectively in terms of pricing, safety, and on-time delivery. We do business with a broad base of third-party carriers, which include ICs and purchased power providers, which reduces the impact of tightening capacity on our business.
Purchased Transportation Costs. Purchased transportation costs within our LTL business represent amounts we pay to ICs or purchased power providers and are generally contractually agreed-upon rates. Purchased transportation costs within our TL business are typically based on negotiated rates for each load hauled. We pay commissions to each brokerage agent based on a percentage of margin generated. Within our TMS business, purchased transportation costs include payments made to our purchased power providers, which are generally contractually agreed-upon rates. Purchased transportation costs are the largest component of our cost structure. Our purchased transportation costs typically increase or decrease in proportion to revenues.
Fuel. The transportation industry is dependent upon the availability of adequate fuel supplies and the price of fuel. Fuel prices have fluctuated dramatically over recent years. The weekly per gallon price of diesel fuel ranged from a low of $2.02 in 2009 to a high of $4.12 in May 2011, according to the U.S. Energy Information Administration. Within our LTL business, our ICs and purchased power providers pass along the cost of diesel fuel to us, and we in turn attempt to pass along some or all of these costs to our customers through fuel surcharge revenue programs. Although revenues from fuel surcharges generally offset increases in fuel costs, other operating costs have been, and may continue to be, impacted by fluctuating fuel prices. The total impact of higher energy prices on other nonfuel-related expenses is difficult to ascertain. We cannot predict future fuel price fluctuations, the impact of higher energy prices on other cost elements, recoverability of higher fuel costs through fuel surcharges, and the effect of fuel surcharges on our overall rate structure or the total price that we will receive from our customers. Depending on the changes in the fuel rates and the impact on costs in other fuel- and energy-related areas, our operating margins could be impacted. Within our TL and TMS businesses, we pass fuel costs through to our customers. As a result, our operating income in these businesses is less impacted by changes in fuel prices.
2
Pricing. The pricing environment in the transportation industry also impacts our operating performance. Within our LTL business, we typically generate revenues by charging our customers a rate based on shipment weight, distance hauled, and commodity type. This amount is typically comprised of a base rate, a fuel surcharge, and any applicable service fees. Our LTL pricing is typically measured by billed revenue per hundredweight, often referred to as “yield.” Our LTL pricing is dictated primarily by factors such as shipment size, shipment frequency and consistency, length of haul, freight density, and customer and geographic mix. Within our TL business, we typically charge a flat rate negotiated on each load hauled. Pricing within our TL business generally has fewer influential factors than pricing within our LTL business, but is also typically driven by shipment frequency and consistency, length of haul, and customer and geographic mix. Within our TMS business, we typically charge a variable rate on each shipment, in addition to transaction or service fees appropriate for the solution we have provided to meet a specific customer’s needs. Since we offer both LTL and TL shipping as part of our TMS offering, pricing within our TMS segment is impacted by similar factors. The pricing environment for all of our operations generally becomes more competitive during periods of lower industry tonnage levels and increased capacity within the over-the-road freight sector.
Our Strategy
Our goal is to be the leading asset-light transportation and logistics service provider in North America. Our strategy includes continuing to:
Gain New Customers. In 2011, we continued to expand our customer base, and we will continue to pursue greater market share in the LTL, TL, and TMS markets. Our expansive geographic reach and broad service offering provides us with the ability to add new customers seeking à la carte or “one-stop” transportation and logistics solutions. We also believe the pool of potential new customers will grow as the benefits of third-party TMS continue to be embraced.
Increase Penetration with Existing Customers. With our comprehensive service offering and large network, we have substantial cross-selling opportunities and the potential to capture a greater share of each customer’s annual transportation and logistics expenditures. We believe that macroeconomic factors will provide us with opportunities to further penetrate existing customers. During the recent economic downturn, existing customers generally reduced their number of shipments and pounds per shipment. In 2011, we experienced increased revenue driven by greater shipment volume, change in freight mix, pricing initiatives, and the addition of new customers.
Pursue Selective Acquisitions. The transportation and logistics industry is highly fragmented, consisting of many smaller, regional service providers covering particular shipping lanes and providing niche services. We built our LTL, TL, and TMS platforms in part by successfully completing and integrating a number of acquisitions. We intend to continue to pursue acquisitions that will complement our existing suite of services and extend our geographic reach. Our LTL delivery agents also present an opportunity for growth via acquisition. If we decide to offer outbound LTL service from a new strategic location, we could potentially acquire one of our delivery agents. With a scalable, asset-light business model, we believe we can execute our acquisition strategy with minimal investment in additional infrastructure and overhead.
Expand Truckload Capacity. During 2011, TL pricing gradually escalated. This occurred as a result of reduced truckload capacity in the over-the-road freight sector, coupled with increased shipping demand. While this pricing escalation increased revenues in our TL business, it had an adverse impact on linehaul costs in our LTL business. In order to mitigate this impact, we implemented initiatives to expand our truckload capacity, such as increasing and expanding utilization of our ICs on lanes most impacted by rising rates, and expanding the number of purchased power providers in our carrier base. We will continue efforts to recruit and retain additional ICs and expand our carrier base in order to reduce the impact of potential further tightening of industry truckload capacity. In addition, while we plan to maintain minimum asset intensity, we may consider investing in transportation equipment to service select lanes with consistent density if we believe we can achieve an attractive return on investment.
Continue Generating Free Cash Flows. Our scalable business model and minimal capital expenditures (as a percentage of our revenues) enhance our ability to generate strong free cash flows. We believe an escalation in shipment and tonnage levels as well as continued expansion of our customer base will drive increased revenues and greater density throughout our network, thereby positively affecting our free cash flow generation.
Our Services
We are a leading asset-light transportation services provider offering a full suite of customized transportation solutions with a primary focus on serving the specialized needs of small to mid-size shippers. Because we generally do not own the transportation equipment used to transport our customers’ freight (we own minimal transportation equipment), we are able to focus solely on providing quality service rather than on asset utilization. Our customers generally communicate their freight needs to one of our transportation specialists on a shipment-by-shipment basis via telephone, fax, Internet, e-mail, or electronic data interchange. We leverage a diverse group of third-party carriers to provide scalable capacity and reliable service to our extensive customer base in North America.
3
Less-than-Truckload
Based on our industry knowledge, we believe we are the largest asset-light provider of LTL transportation services in North America in terms of revenue. We provide LTL service originating from points within approximately 150 miles of our service centers to most destinations throughout the United States and into Mexico, Puerto Rico, and Canada. Within the United States, we offer national, long-haul service (1,000 miles or greater), inter-regional service (between 500 and 1,000 miles), and regional service (500 miles or less). We serve a diverse group of customers within a variety of industries, including retail, industrial, paper goods, manufacturing, food and beverage, health care, chemicals, computer hardware, and general commodities.
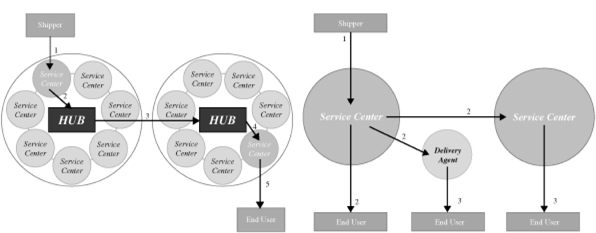
As the diagram below illustrates, we utilize a point-to-point LTL model that is differentiated from the traditional, asset-based hub and spoke LTL model. Our model does not require intermediate handling at a break-bulk hub (a large terminal where freight is offloaded, sorted, and reloaded), which we believe represents a competitive advantage in terms of timeliness, lower incidence of damage, and reduced fuel consumption. For example, we can transport LTL freight from Cleveland, Ohio to Los Angeles, California without stopping at a break-bulk hub, while the same shipment traveling through a traditional hub and spoke LTL model would likely be unloaded and reloaded at break-bulk hubs in, for example, Akron, Ohio and Adelanto, California prior to reaching its destination.
Representative Asset-Based
National Hub and Spoke LTL Model versus
Asset-light National Point-to-Point LTL Model
| Asset-Based National Hub and Spoke LTL Model |
Asset-light National Point-to-Point LTL Model | |
| Shipper to End User |
Shipper to End User | |
| • 5 different trucks |
• 2 to 3 different trucks | |
| • 5 different drivers |
• 2 to 3 different drivers | |
| • 4 service centers |
• 1 to 2 service centers | |
| • 10 handlings (loading/unloading) |
• 4 to 6 handlings (loading/unloading) | |
| • Standard 5 days |
• 3 to 5 days | |
We believe our model allows us to offer LTL average transit times more comparable to that of deferred air freight service than to standard national LTL service, yet more cost-effective. Key aspects of our LTL service offering include the following:
| • | Pickup. In order to stay as close as possible to our customers, we prefer to handle customer pickups whenever cost-effective. We generally pick up freight within 150 miles of one of our service centers, utilizing primarily city ICs. Although we generally do not own the tractors or other powered transportation equipment used to transport our customers’ freight, we own or lease trailers for use in local city pickup and delivery (not for linehaul or our other LTL operations). In 2011, we picked up approximately 82% of our customers’ LTL shipments. The remainder was handled by agents with whom we generally have long-standing relationships. |
| • | Consolidation at Service Centers. Key to our model is a network of 20 LTL service centers, as illustrated by the map below, that we lease in strategic markets throughout the United States. At these service centers, numerous smaller LTL shipments are unloaded, consolidated into truckload shipments, and loaded onto a linehaul unit scheduled for a destination city. In order to continuously emphasize optimal load building and enhance operating margins, dock managers review every load before it is dispatched from one of our service centers. |
4
| • | Linehaul. Linehaul is the longest leg of the LTL shipment process. In dispatching a load, a linehaul coordinator at one of our service centers uses our technology system to optimize cost-efficiency and service by assigning the load to the appropriate third-party transportation provider, either an IC or purchased power provider. In 2011, ICs handled approximately 47% of our linehaul shipments. As industry-wide freight capacity tightens with an anticipated market rebound, we believe our recruitment and retention efforts will allow us to increase IC utilization in order to maintain service and cost stability. |
| • | De-consolidation and Delivery. Within our unique model, linehaul shipments are transported to our service centers, delivery agents, or direct to end users without stopping at a break-bulk hub, as is often necessary under the traditional, asset-based hub and spoke LTL model. This generally reduces physical handling and damage claims, and reduces delivery times by one to three days on average. In 2011, we delivered approximately 23% of LTL shipments through our service centers, 76% through our delivery agents, and 1% direct to end users. |
| • | Benefits of a Delivery Agent Network. While many national asset-based LTL providers are encumbered by the fixed overhead associated with owning or leasing most or all of their de-consolidation and delivery facilities, we maintain our variable cost structure through the extensive use of delivery agents. |
As the “LTL Service Center and Delivery Agent Network” map illustrates, we use over 200 LTL delivery agents to complement our service center footprint and to provide cost-effective full state, national, and North American delivery coverage. Delivery agents also enhance our ability to handle special needs of the final consignee, such as scheduled deliveries and specialized delivery equipment.
We believe a sustained recovery in the over-the-road freight sector would provide greater freight density and increased shipping volumes, thereby allowing us to build full trailer loads more quickly and deliver freight faster under our point-to-point model. We believe this will further distinguish our LTL service offering as even more comparable in speed to deferred air freight service, leading to enhanced market share and improved operating margins.
LTL Service Center and Delivery Agent Network
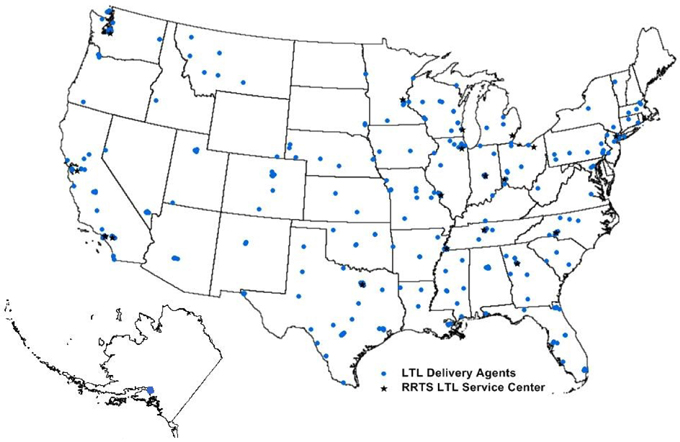
5
Truckload and Logistics
We are a leading TL business operation in North America in terms of revenue. We provide a comprehensive range of TL solutions for our customers by leveraging our broad base of third-party carriers who operate temperature-controlled, dry van, and/or flatbed capacity. Although we specialize in the transport of refrigerated foods, poultry, and beverages, we also provide a variety of TL transportation solutions for dry goods ranging from paper products to steel, as well as flatbed service for larger industrial load requirements. Our intermodal capabilities, which are included in our TL segment, include drayage, which is the transport of freight between ocean ports or rail ramps and shipping docks. We arrange the pickup and delivery of TL freight either through our 24 TL service centers, four consolidation/warehousing facilities, 11 company dispatch offices (operated by our employees) or through our network of 76 independent brokerage agents. Our dispatch offices and brokerage agents are located primarily throughout the Eastern United States and Canada, as illustrated on the map below.
TL Dispatcher and Agent Network
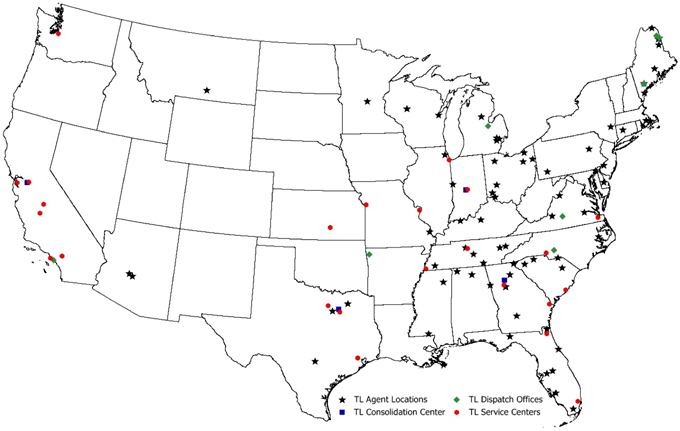
Company Dispatchers. Our 97 company brokers, whom we refer to as dispatchers, not only engage in the routing and selection of our transportation providers, but also serve as our internal TL sales force, responsible for managing existing customer relationships and generating new customer relationships. Because the performance of these individuals is essential to our success, we offer attractive incentive-based compensation packages that we believe keep our dispatchers motivated, focused, and service-oriented.
Dispatch Office Expansion. We have traditionally expanded our dispatch operations based upon the needs of our customers. Going forward, we plan to open new dispatch offices, particularly in geographic areas where we lack coverage of the local freight market. Importantly, opening a new dispatch office requires only a modest amount of capital — it usually involves leasing a small amount of office space and purchasing communication and information technology equipment. Typically the largest investment required is in working capital as we generate revenue from new customers. While the majority of growth within our dispatch operations has been organic, we will continue to evaluate selective acquisitions that would allow us to quickly penetrate new customers and geographic markets.
Independent Brokerage Agents. In addition to our dispatchers, we also maintain a network of independent brokerage agents that have partnered with us for a number of years. Brokerage agents complement our network of dispatch offices by bringing pre-existing customer relationships, new customer prospects, and/or access to new geographic markets. Furthermore, they typically provide immediate revenue and do not require us to invest in incremental overhead. Brokerage agents own or lease their own office space and pay for their own communications equipment, insurance, and any other costs associated with running their operation. We only invest in the working capital required to execute our quick pay strategy and generally pay a commission to our brokerage agents ranging from 40-70% of the margin we earn on a TL shipment. Similar to our dispatchers, our brokerage agents engage in the routing and selection of transportation providers for our customer base and perform sales and customer service functions on our behalf.
6
Brokerage Agent Expansion. We believe we offer brokerage agents a very attractive partnership opportunity. We offer access to our reliable network of over 580 ICs and broad base of purchased power providers and invest in the working capital required to pay these carriers promptly and assume collection responsibility. We believe this has contributed to our reputation for quality and reliable service, as well as to the consistent growth of our brokerage agent network. During 2011, we expanded our TL brokerage agent network to 76 agents. Additionally, 23 of our brokerage agents each generated more than $1 million in revenue in 2011. We believe our increased development efforts and attractive value proposition will allow us to further expand our brokerage agent network and enhance the growth of our TL business.
Transportation Management Solutions
Our TMS offering is designed to provide comprehensive or à la carte 3PL services. We provide the necessary operational expertise, information technology capabilities, and relationships with third-party transportation providers to meet the unique needs of our customers. For customers that use the most comprehensive service plans, we complement their internal logistics and transportation management personnel and operations, enabling them to redirect resources to core competencies, reduce internal transportation management personnel costs and, in many cases, achieve substantial annual freight savings. Key aspects of our TMS capabilities include the following:
| • | Procurement. After an in-depth consultation and analysis with our customer to identify cost savings opportunities, we develop an estimate of our customer’s potential savings and cultivate a plan for implementation. If necessary, we manage a targeted bid process based on a customer’s traffic lanes, shipment volumes, and product characteristics, and negotiate rates with reputable carriers. In addition to a cost-efficient rate, the customer receives a summary of projected savings as well as our carrier recommendation. |
| • | Shipment Planning. Utilizing our technology systems and an expansive multi-modal network of third-party transportation providers, we determine the appropriate mode of transportation and select the ideal provider. In addition, we provide load optimization services based on freight patterns and consolidation opportunities. We also provide rating and routing services, either on-site with one of our transportation specialists, off-site through our centralized call center, or online through our website. Finally, we offer merge-in-transit coordination to synchronize the arrival and pre-consolidation of high-value components integral to a customer’s production process, enabling them to achieve reduced cycle times, lower inventory holding costs, and improved supply chain visibility. |
| • | Shipment Execution. Our transportation specialists are adept at managing time-critical shipments. Our technology system prompts a specialist to hold less time-sensitive shipments until other complementary freight can be found to complete the shipping process in the most cost-effective manner. We maintain constant communication with third-party transportation providers from dispatch through final delivery. As a result, our expedited services are capable of meeting virtually any customer transit or delivery requirement. Finally, we provide the ability to track and trace shipments either online or by phone through one of our transportation specialists. |
| • | Audit and Payment Services. We capture and consolidate our customers’ entire shipping activity and offer weekly electronic billing. We also provide freight bill audit and payment services designed to eliminate excessive or incorrect charges from our customers’ bills. |
| • | Performance Reporting and Improvement Analysis. Customers utilizing our web reporting system have the ability to query freight bills, develop customized reports online, and access data to assist in financial and operational reporting and planning. Our specialists are also actively driving process improvement, continuously using our technology to identify incremental savings opportunities and efficiencies for our customers. |
With a broad TMS offering, we believe we can accommodate a shipper’s unique needs with any combination of services along our entire spectrum, and cater to their preferred means of shipment processing and communication.
We believe our comprehensive service approach and focus on building long-term customer relationships lead to greater retention of existing business compared to a more short-term gain sharing model employed by many 3PL providers. We believe our approach is more sustainable in the event freight capacity tightens and it becomes more difficult for 3PL providers employing the gain sharing model to generate substantial incremental savings for shippers after the first year of implementation. Before becoming fully operational with a customer, we conduct thorough feasibility and cost savings analyses and collaborate with the customer to create a project scope and timeline with measurable milestones. We believe this approach enables us to identify any potential issues, ensure a smooth integration process, and set the stage for long-term customer satisfaction. Within our TMS operation, we have consistently met customer implementation deadlines and achieved anticipated levels of freight savings.
7
Capacity
We offer scalable capacity and reliable service to our extensive customer base in North America through a diverse third-party network of transportation providers. Our various transportation modes include LTL, TL and intermodal, and domestic and international air. No single carrier accounted for more than 3% of our 2011 purchased transportation costs. We ensure that each carrier is properly licensed and we regularly monitor their capacity, reliability, and pricing trends. Enhanced visibility provided by our technology systems allows us to leverage the competitive dynamics within our network to renegotiate freight rates and provide our customers with more cost-effective transportation solutions while enhancing our operating margins.
We continuously focus on building and enhancing our relationships with reliable transportation providers to ensure that we not only secure competitive rates, but that we also gain access to consistent capacity, especially during peak shipping seasons. Because we own minimal transportation equipment used to deliver our customers’ freight, these relationships are critical to our success. We typically pay our third-party carriers either a contracted per mile rate or the cost of a shipment less our contractually agreed-upon commission, and generally pay within seven to ten days from the delivery of a shipment. We pay our third-party carriers promptly in order to drive loyalty and reliable capacity.
Our third-party network of transportation providers can be divided into the following groups:
Independent Contractors. ICs are a key part of our long-term strategy to maintain service and provide cost stability. In selecting our ICs, we adhere to specific screening guidelines in terms of safety records, length of driving experience, and personnel evaluations. In the event of tightening of over-the-road freight capacity, we believe we are well positioned to increase our utilization of ICs as a cost-effective and reliable solution.
To enhance our relationship with our ICs, we offer per mile rates that we believe are highly competitive and often above prevailing market rates. In addition, we focus on keeping our ICs fully utilized in order to limit the number of “empty” miles they drive. We regularly communicate with our ICs and seek new ways to enhance their quality of life. We believe our efforts increase IC retention which, in our opinion, ultimately leads to better service for our customers.
Purchased Power Providers. In addition to our large base of ICs, we have access to a broad base of purchased power providers. We have established relationships with carriers of all sizes, including large national trucking companies and small to mid-size regional fleets. With the exception of safety incentives, purchased power providers are generally paid under a similar structure as ICs within our LTL and TL businesses. In contrast to contracts established with our ICs, however, we do not cover the cost of liability insurance for our purchased power providers.
Delivery Agents. For the de-consolidation and delivery stages of our LTL shipment process, our network of 20 LTL service centers is complemented by over 200 delivery agents. The use of delivery agents is also a key part of our long-term strategy to maintain a variable cost, scalable operating model with minimal overhead.
Intermodal Capabilities. We maintain intermodal capability within our TL segment and through relationships with third-party carriers who rent capacity on Class 1 railroads throughout North America. Intermodal transportation rates are typically negotiated between us and the capacity provider on a customer-specific basis.
Domestic/International Air Carriers. We operate under an exclusive arrangement with ICAT Logistics, a third-party provider, to provide domestic/international air freight services to our customers. Under our arrangement, ICAT Logistics is responsible for all services, and we receive a commission based on a percentage of the total bill. In 2011, our domestic/international air freight services represented less than 1% of our LTL revenues.
Customers
Our goal is to establish long-term customer relationships and achieve year-over-year growth in recurring business by providing reliable, timely, and cost-effective transportation and logistics solutions. While we possess the scale, operational expertise, and capabilities to serve shippers of all sizes, we focus primarily on small to mid-size shippers, which we believe represent a large and underserved market. We serve an extensive customer base within a variety of end markets, with no customer accounting for more than 3% of 2011 revenue and no industry sector accounting for more than 20% of 2011 revenue. Our growth was primarily driven by our sales team and a focus on shippers seeking to reduce their exposure to asset-based logistics providers. We believe this reduces our exposure to a decline in shipping demand from any customer and a cyclical downturn within any end market.
8
Sales and Marketing
In addition to our 76 independent brokerage agents, we currently market and sell our transportation and logistics solutions through over 120 sales personnel located throughout the United States and Canada. We are focused on actively expanding our sales force to new geographic markets where we lack a strong presence. Our objective is to leverage our collective, national sales force to sell our full suite of transportation services. We believe this will allow us to capture a greater share of a shipper’s annual transportation and logistics expenditures.
Our sales force can be categorized by primary service offering:
| • | Less-than-Truckload. Our LTL sales force of over 90 people consists of account executives, sales managers, inside sales representatives, and commission sales agents. |
| • | Truckload and Logistics. We have 97 dispatchers and 76 independent brokerage agents located primarily in the Eastern United States and Canada. We believe that this decentralized structure enables our salespeople to better serve our customers by developing an understanding of local and regional market conditions, as well as the specific transportation and logistics issues facing individual customers. Our dispatchers and brokerage agents seek additional business from existing customers and pursue new customers based on this knowledge and an understanding of the value proposition we can provide. |
| • | Transportation Management Solutions. We have over 60 TMS salespeople and commissioned sales agents. We also utilize our LTL sales force to enhance the market reach and penetration of our TMS offering and to capitalize on the opportunity to cross-sell a broader menu of services to new and existing customers. |
Competition
We compete in the North American transportation and logistics services sector. Our marketplace is extremely competitive and highly fragmented. We compete with a large number of other asset-light logistics companies, asset-based carriers, integrated logistics companies, and third-party freight brokers, many of whom have larger customer bases and more resources than we do.
In our markets, we compete with global asset-based integrated logistics companies such as FedEx Corporation and United Parcel Service, Inc., against whom we compete in all of our service lines; asset-based freight haulers, such as Arkansas Best Corporation, Con-Way, Inc., Old Dominion Freight Line Inc., and YRC Worldwide, Inc., against whom we compete in our core LTL and TL service offerings; non-asset based and asset-light freight brokerage companies, such as C.H. Robinson Worldwide, Inc. and Landstar System, Inc., against whom we compete in our core LTL and TL service offerings; third-party logistics providers that offer comprehensive TMS, such as Schneider Logistics, Inc., and Transplace, Inc., against whom we compete in our TMS offering; and smaller, niche transportation and logistics companies that provide services within a specific geographic region or end market.
We believe we compete favorably by offering shippers attractive transportation and logistics solutions designed to deliver the optimal combination of cost and service. To that end, we believe our most significant competitive advantages include:
| • | our comprehensive suite of transportation and logistics services, which allow us to offer à la carte or a “one-stop” value proposition to shippers of varying sizes and accommodate their diverse needs and preferred means of processing and communication; |
| • | our asset-light, variable cost business model, which allows us to generate strong free cash flows and focus greater attention on providing optimal customer service than on maintaining high levels of asset utilization; |
| • | our focus on an expansive market of small to mid-size shippers who often lack the internal resources necessary to manage complex transportation and logistics requirements and whose freight volumes may not garner the same level of attention and customer service from many of our larger competitors; |
| • | our technology systems, which allow us to provide scalable capacity and high levels of customer service across a variety of transportation modes; and |
| • | our knowledgeable management team with experience leading high-growth logistics companies and/or business units, which allows us to benefit from a collective entrepreneurial culture focused on growth. |
Seasonality
Our operations are subject to seasonal trends that have been common in the North American over-the-road freight sector for many years. Our results of operations for the quarter ending in March are on average lower than the quarters ending in June, September, and December. Typically, this pattern has been the result of factors such as inclement weather, national holidays, customer demand, and economic conditions.
Technology
We believe the continued development and innovation of our technology systems is important to providing our customers with the most cost-effective, timely, and reliable transportation and logistics solutions. Our objective is to allow our customers and vendors to easily do business with us via the Internet. Our customers have the ability, through a paperless process, to receive immediate pricing, place orders, track shipments, process remittance, receive updates on arising issues, and review historical shipping data through a variety of reports over the Internet.
9
Our LTL operation utilizes a web-based system with customized software applications to support every aspect of our LTL model and manage our broad carrier base from pickup through final delivery. Our corporate headquarters and service centers are completely integrated, allowing real-time data to flow between locations. Additionally, we make extensive use of electronic data interchange, or EDI, to allow our service centers to communicate electronically with our carriers’ and customers’ internal systems. We offer our EDI-capable customers a paperless process, including document imaging and shipment tracking and tracing. As part of our ongoing initiative to enhance our information technology capabilities, our LTL operation has developed a proprietary carrier selection tool used to characterize carriers based on total cost to maximize usage of the lowest available linehaul rates.
Our TL operation uses a customized technology system to broker our customers’ freight. Our software enhances our ability to track our third-party drivers, tractors, and trailers, which provides customers with visibility into their supply chains. Additionally, our systems allow us to operate as a paperless operation through electronic order entry, resource planning, and dispatch.
We continuously enhance our TMS technology system and have integrated other proven transportation management software packages with the goal of providing customers with broad-based, highly competitive solutions. Through an extensive use of database configuration and integration techniques, hardware and software applications, communication mediums, and security devices, we are able to design a customized solution to address each customer’s unique shipping needs and preferred method of processing. Our web-based technology allows us to process and service customer orders, track shipments in real time, select optimal modes of transportation, execute customer billing, provide carrier rates, establish customer specific profiles, and retain critical information for analysis. We use this system to maximize supply chain efficiency through mode, carrier, and route optimization.
Employees
As of December 31, 2011, we employed 1,848 personnel, which included 21 management personnel, 122 sales and marketing personnel, 1,253 operations and other personnel, and 452 dock personnel. None of our employees are covered by a collective bargaining agreement and we consider relations with our employees to be good.
Regulation
The federal government has substantially deregulated the provision of ground transportation and logistics services via the enactment of the Motor Carrier Act of 1980, the Trucking Industry Regulatory Reform Act of 1994, the Federal Aviation Administration Authorization Act of 1994, and the ICC Termination Act of 1995. Prices and services are now largely free of regulatory controls, although states have the right to require compliance with safety and insurance requirements, and interstate motor carriers remain subject to regulatory controls imposed by the Department of Transportation (DOT) and its agencies, such as the Federal Motor Carrier Safety Administration (FMCSA). Motor carrier, freight forwarding, and freight brokerage operations are subject to safety, insurance, and bonding requirements prescribed by the DOT and various state agencies. Any air freight business is subject to commercial standards set forth by the International Air Transport Association and federal regulations issued by the Transportation Security Administration.
We are also subject to various environmental and safety requirements, including those governing the handling, disposal, and release of hazardous materials, which we may be asked to transport in the course of our operations. If hazardous materials are released into the environment while being transported, we may be required to participate in, or may have liability for response costs and the remediation of such a release. In such case, we also may be subject to claims for personal injury, property damage, and damage to natural resources. Our business is also subject to changes in legislation and regulations, which can affect our operations and those of our competitors. For example, new laws and initiatives to reduce and mitigate the effects of greenhouse gas emissions could significantly impact the transportation industry. Future environmental laws in this area could adversely affect our ICs’ costs and practices and our operations.
We are also subject to the Comprehensive Safety Analysis 2010 (CSA), which is a new FMCSA safety program designed to improve large truck and bus safety and ultimately reduce crashes. CSA is an enforcement and compliance model that involves evaluations of individual motor carriers for a 24-month period involving safety-based roadside inspection violations, out-of service violations, and safety performance in the following categories: unsafe driving, fatigued driving (hours-of-service rules), driver fitness, controlled substances/alcohol, vehicle maintenance, cargo-related, and crash indicator. The evaluations are then used by the FMCSA to select carriers for audit and other interventions.
We are also subject to regulations to combat terrorism that the Department of Homeland Security (including Customs and Border Protection agencies) and other agencies impose.
10
We believe that we are in compliance with current laws and regulations. Our failure to maintain compliance could result in substantial fines or revocation of our permits or licenses.
Insurance
We insure our ICs against third-party claims for accidents or damaged shipments and we bear the risk of such claims. We maintain insurance for vehicle liability, general liability, and cargo damage claims. We maintain an aggregate of $40.0 million of vehicle liability and general liability insurance. The vehicle liability insurance has a $500,000 deductible. We carry aggregate insurance against the first $1.0 million of cargo claims, with a $100,000 deductible. Because we maintain insurance for our ICs, if our insurance does not cover all or any portion of the claim amount, we may be forced to bear the financial loss. We attempt to mitigate this risk by carefully selecting carriers with quality control procedures and safety ratings.
In addition to vehicle liability, general liability, and cargo claim coverage, our insurance policies also cover other standard industry risks related to workers’ compensation and other property and casualty risks. We believe our insurance coverage is comparable in terms and amount of coverage to other companies in our industry. We establish insurance reserves for anticipated losses and expenses and periodically evaluate and adjust the reserves to reflect our experience.
Executive Officers
The following table sets forth certain information regarding our executive officers as of December 31, 2011:
| Mark A. DiBlasi |
56 | President, Chief Executive Officer, and Director | ||||
| Peter R. Armbruster |
53 | Vice President — Finance, Chief Financial Officer, Treasurer, and Secretary | ||||
| Brian J. van Helden |
43 | President — Truckload and Logistics | ||||
| Scott L. Dobak |
49 | President — Less-than-Truckload |
Mark A. DiBlasi has served as our President and Chief Executive Officer since January 2006. Mr. DiBlasi has served as a director of our company since July 2006. Prior to joining our company, Mr. DiBlasi served as Vice President — Southern Division for FedEx Ground, Inc., a division of FedEx Corporation, from July 2002 to January 2006. Mr. DiBlasi was responsible for all operational matters of the $1.2 billion-revenue Southern Division, which represented one-fourth of FedEx Ground, Inc.’s total operations. From February 1995 to June 2002, Mr. DiBlasi served as the Managing Director of two different regions within the FedEx Ground, Inc. operation network. From August 1979 to January 1995, Mr. DiBlasi held various positions in operations, sales, and terminal management at Roadway Express before culminating as the Chicago Breakbulk Manager.
Peter R. Armbruster has served as our Vice President — Finance, Chief Financial Officer, Treasurer, and Secretary since December 2005. From March 2005 to December 2005, Mr. Armbruster served as our Vice President — Finance. Mr. Armbruster held various executive positions at Dawes Transport from August 1990 to March 2005. Prior to joining Dawes Transport, Mr. Armbruster was with Ernst & Young LLP from June 1981 to July 1990, where he most recently served as Senior Manager.
Brian J. van Helden has served as our President — Truckload and Logistics since June 2011 and previously served as the Vice President — Operations from April 2007 to May 2011. Prior to joining our company, Mr. van Helden held various leadership positions over ten years with FedEx Ground, Inc. while most recently serving as a Regional Managing Director for FedEx Ground, Inc., a division of FedEx Corporation, from July 2003 to April 2007, where he was responsible for operational matters in the Midwest and New England. Prior to that, Mr. van Helden held various operations positions with UPS and Roadway Express.
Scott L. Dobak has served as our President — Less-than-Truckload since June 2011 and previously served as the Vice President — Sales and Marketing from January 2007 to May 2011. Prior to joining our company, Mr. Dobak served as Vice President — Corporate Sales for Yellow Transportation, Inc. where he was responsible for the $1.5 billion-revenue Corporate Sales Division from December 2000 to January 2007. Mr. Dobak was the Regional Vice President of Sales and Marketing — Chicago from July 1997 to December 2000 with Yellow Transportation, Inc. Prior to that, Mr. Dobak served as an Area General Manager for Yellow Transportation, Inc. from January 1995 to July 1997.
11
Available Information
Our website is www.rrts.com. Through our website, we make available free of charge all of our Securities and Exchange Commission (SEC) filings, including our annual reports on Form 10-K, our proxy statements, our quarterly reports on Form 10-Q, and our current reports on Form 8-K as well as Form 3, Form 4, and Form 5 Reports for our directors, officers, and principal stockholders, together with amendments to those reports. These reports are available as soon as reasonably practicable after their electronic filing with the SEC. Our website also includes corporate governance information, including our Code of Conduct, our Code of Ethics for the CEO and Senior Financial Officers, and our Board Committee Charters. Information included on our website is not incorporated by reference into this report.
| ITEM 1A. | RISK FACTORS |
You should carefully consider the following factors, together with all the other information included in this report, in evaluating our company and our business. Various factors exist that could cause our actual results to differ materially from those projected in any forward-looking statement. In addition to the factors discussed elsewhere in this report, we believe the following are some of the important risk factors that could materially affect our business, financial condition, or results of operations:
A decrease in levels of capacity in the over-the-road freight sector could have an adverse impact on our business.
Based on our research, we believe the over-the-road freight sector has experienced levels of excess capacity. The current operating environment in the over-the-road freight sector resulting from the economic downturn, fluctuating fuel costs, industry-specific regulations such as CSA and hours-of-service rules, and other economic factors are causing a tightening of capacity in the sector generally, and in our carrier network specifically, which could have an adverse impact on our ability to execute our business strategy and on our business.
One or more significant claims, our failure to adequately reserve for such claims, or the cost of maintaining our insurance for such claims, could have an adverse effect on our results of operations.
We use the services of thousands of transportation companies and their drivers in connection with our transportation operations. From time to time, these drivers are involved in accidents and goods carried by these drivers are lost or damaged, and the carriers may not have adequate insurance coverage. Such accidents usually result in equipment damage and, unfortunately, can also result in injuries or death. Although these drivers are not our employees and all of these drivers are ICs or work for third-party carriers, from time to time claims may be asserted against us for their actions or for our actions in retaining them. Claims against us may exceed the amount of our insurance coverage, or may not be covered by insurance at all. A material increase in the frequency or severity of accidents, claims for lost or damaged goods, liability claims, or workers’ compensation claims, or unfavorable resolutions of any such claims, could adversely affect our results of operations to the extent claims are not covered by our insurance or such losses exceed our reserves. Significant increases in insurance costs or the inability to purchase insurance as a result of these claims could also reduce our profitability and have an adverse effect on our results of operations.
Fluctuations in the price or availability of fuel, a prolonged continuation in the upward trend of fuel prices, and limitations on our ability to collect LTL fuel surcharges may adversely affect our results of operations.
We are subject to risks associated with fuel charges from our ICs and purchased power providers in our LTL and TL businesses. The tractors operated by our ICs and purchased power providers require large amounts of diesel fuel, and the availability and price of diesel fuel are subject to political, economic, and market factors that are outside of our control. The weekly per-gallon price of diesel fuel has been on an upward trend since 2009. The weekly per-gallon price of diesel fuel ranged from a low of $2.02 in 2009 to a high of $4.12 in May 2011, according to the U.S. Energy Information Administration. Our ICs and purchased power providers pass along the cost of diesel fuel to us, and we in turn attempt to pass along some or all of these costs to our customers through fuel surcharge revenue programs. There can be no assurance that our fuel surcharge revenue programs will be effective in the future. Market pressures may limit our ability to assess our fuel surcharges. At the request of our customers, we have at times temporarily capped the fuel surcharges at a fixed percentage pursuant to contractual arrangements that vary by customer. Currently, less than 1% of our customers have contractual arrangements with varying levels of capped fuel surcharges. If fuel surcharge revenue programs, base freight rate increases, or other cost-recovery mechanisms do not offset our exposure to rising fuel costs, our results of operations could be adversely affected.
12
A significant or prolonged economic downturn in the over-the-road freight sector, or a substantial downturn in our customers’ business, could adversely affect our revenue and results of operations.
The over-the-road freight sector has historically experienced cyclical fluctuations in financial results due to, among other things, economic recession, downturns in business cycles, increasing costs and taxes, fluctuations in energy prices, price increases by carriers, changes in regulatory standards, license and registration fees, interest rate fluctuations, and other economic factors beyond our control. All of these factors could increase the operating costs of a vehicle and impact capacity levels in the over-the-road freight sector. Carriers may charge higher prices to cover higher operating expenses, and our operating income may decrease if we are unable to pass through to our customers the full amount of higher purchased transportation costs. Additionally, economic conditions may adversely affect our customers, their need for our services, or their ability to pay for our services. If the current economic downturn causes a reduction in the volume of freight shipped by our customers, our results of operations could be adversely affected.
We operate in a highly competitive industry and, if we are unable to adequately address factors that may adversely affect our revenue and costs, our business could suffer.
Competition in the transportation services industry is intense. Increased competition may lead to revenue reductions, reduced profit margins, or a loss of market share, any one of which could harm our business. There are many factors that could impair our ability to maintain our current profitability, including the following:
| • | competition with other transportation services companies, some of which have a broader coverage network, a wider range of services, and greater capital resources than we do; |
| • | reduction by our competitors of their freight rates to gain business, especially during times of declining growth rates in the economy, which reductions may limit our ability to maintain or increase freight rates, maintain our operating margins, or maintain significant growth in our business; |
| • | solicitation by shippers of bids from multiple carriers for their shipping needs and the resulting depression of freight rates or loss of business to competitors; |
| • | development of a technology system similar to ours by a competitor with sufficient financial resources and comparable experience in the transportation services industry; and |
| • | establishment by our competitors of cooperative relationships to increase their ability to address shipper needs. |
If we are unable to expand the number of our sales representatives and brokerage agents, or if a significant number of our existing sales representatives and brokerage agents leave us, our ability to increase our revenue could be negatively impacted.
Our ability to expand our business will depend, in part, on our ability to attract additional sales representatives and brokerage agents. Competition for qualified sales representatives and brokerage agents can be intense, and we may be unable to attract such persons. Any difficulties we experience in expanding the number of our sales representatives and brokerage agents could have a negative impact on our ability to expand our customer base, increase our revenue, and continue our growth.
In addition, we must retain our current sales representatives and brokerage agents and properly incentivize them to obtain new customers and maintain existing customer relationships. If a significant number of our sales representatives and brokerage agents leave us, our revenue could be negatively impacted. A significant increase in the turnover rate among our current sales representatives and brokerage agents could also increase our recruiting costs and decrease our operating efficiency.
We may not be able to successfully execute our acquisition strategy, and any acquisitions that we undertake could be difficult to integrate, disrupt our business, dilute stockholder value, and adversely affect our results of operations.
We plan to increase our revenue and expand our service offerings in the market regions that we serve through the acquisition of complementary businesses. In the future, suitable acquisition candidates may not be available at purchase prices that are attractive to us. Further, if we make any future acquisitions, we could incur additional debt or assume contingent liabilities.
Strategic acquisitions involve numerous risks, including the following:
| • | failure of the acquired company to achieve anticipated revenues, earnings, or cash flows; |
| • | assumption of liabilities that were not disclosed to us or that exceed our estimates; |
| • | problems integrating the purchased operations with our own, which could result in substantial costs and delays or other operational, technical, or financial problems; |
| • | potential compliance issues with regard to acquired companies that did not have adequate internal controls; |
| • | diversion of management’s attention or other resources from our existing business; |
| • | risks associated with entering markets in which we have limited prior experience; and |
| • | potential loss of key employees and customers of the acquired company. |
13
Our reliance on ICs to provide transportation services to our customers could limit our expansion.
Our transportation services are conducted in part by ICs, who are generally responsible for paying for their own equipment, fuel, and other operating costs. Our ICs are responsible for providing the tractors and trailers they use related to our business. Certain factors such as increases in fuel costs, insurance costs, and the cost of new and used tractors, reduced financing sources available to ICs for the purchase of equipment, or the impact of CSA and hours-of-service rules could create a difficult operating environment for ICs. Turnover and bankruptcy among ICs in the over-the-road freight sector often limit the pool of qualified ICs and increase the competition among carriers for their services. If we are required to increase the amounts paid to ICs in order to obtain their services, our results of operations could be adversely affected to the extent increased expenses are not offset by higher freight rates. Additionally, our agreements with our ICs are terminable by either party upon short notice and without penalty. Consequently, we regularly need to recruit qualified ICs to replace those who have left our pool. If we are unable to retain our existing ICs or recruit new ICs, our results of operations and ability to expand our business could be adversely affected.
Our executive officers and key personnel are important to our business, and these officers and personnel may not remain with us in the future.
We depend substantially on the efforts and abilities of our senior management. Our success will depend, in part, on our ability to retain our current management team and to attract and retain qualified personnel in the future. Competition for senior management is intense, and we may not be able to retain our management team or attract additional qualified personnel. The loss of a member of senior management would require our remaining executive officers to divert immediate and substantial attention to fulfilling the duties of the departing executive and to seeking a replacement. The inability to adequately fill vacancies in our senior executive positions on a timely basis could negatively affect our ability to implement our business strategy, which could adversely impact our results of operations.
Our third-party carriers must meet our needs and expectations, and those of our customers, and their inability to do so could adversely affect our results of operations.
Our business depends to a large extent on our ability to provide consistent, high quality, technology-enabled transportation and logistics solutions. We generally do not own or control the transportation assets that deliver our customers’ freight, and we generally do not employ the people directly involved in delivering the freight. We rely on third parties to provide less-than-truckload, truckload and intermodal brokerage, and domestic and international air services and to report certain information to us, including information relating to delivery status and freight claims. This reliance could cause delays in providing our customers with timely delivery of freight, important service data, and in the financial reporting of certain events, including recognizing revenue and recording claims. If we are unable to secure sufficient transportation services to meet our customer commitments, or if any of the third parties we rely on do not meet our needs or expectations, or those of our customers, our results of operations could be adversely affected, and our customers could switch to our competitors temporarily or permanently.
The cost of compliance with, liability for violations of, or modifications to existing or future governmental regulations could adversely affect our business and results of operations.
Our operations are subject to certain federal, state, and local regulatory requirements. These regulations and requirements are subject to change based on new legislation and regulatory initiatives, which could affect the economics of the transportation industry by requiring changes in operating practices or influencing the demand for, and the cost of providing, transportation services. The DOT and its agencies, such as the FMCSA, and various state and local agencies exercise broad powers over our business, generally governing such activities as engaging in motor carrier operations, freight forwarding, and freight brokerage operations, as well as regulating safety. As a motor carrier authorized by the DOT, we must comply with the safety and fitness regulations promulgated by the DOT, including those relating to drug and alcohol testing, driver qualification, and hours-of-service requirements. There also are regulations specifically relating to the trucking industry, including testing and specifications of equipment, product handling requirements, and hazardous material requirements. In addition, we must comply with certain safety, insurance, and bonding requirements promulgated by the DOT and various state agencies. Compliance with existing, new, or more stringent measures could disrupt or impede the timing of our deliveries and our ability to satisfy the needs of our customers. In addition, we may experience an increase in operating costs, such as security costs, as a result of governmental regulations that have been and will be adopted in response to terrorist activities and potential terrorist activities. The cost of compliance with existing or future measures could adversely affect our results of operations. Further, we could become subject to liabilities as a result of a failure to comply with applicable regulations.
14
Our operations are subject to various environmental laws and regulations, the violation of which could result in substantial fines or penalties.
From time to time, we arrange for the movement of hazardous materials at the request of our customers. As a result, we are subject to various environmental laws and regulations relating to the handling, transport, and disposal of hazardous materials. If our customers or carriers are involved in an accident involving hazardous materials, or if we are found to be in violation of applicable laws or regulations, we could be subject to substantial fines or penalties, remediation costs, or civil and criminal liability, any of which could have an adverse effect on our business and results of operations. In addition, current and future laws and regulations relating to carbon emissions and the effects of global warming can be expected to have a significant impact on the transportation sector generally and the operations and profitability of some of our carriers in particular, which could adversely affect our business and results of operations.
If our ICs are deemed by regulators to be employees, our business and results of operations could be adversely affected.
Tax and other regulatory authorities have in the past sought to assert that ICs in the trucking industry are employees rather than ICs. There can be no assurance that these authorities will not successfully assert this position against us or that tax and other laws that currently consider these persons ICs will not change. If our ICs are determined to be our employees, we would incur additional exposure under federal and state tax, workers’ compensation, unemployment benefits, labor, employment, and tort laws, including for prior periods, as well as potential liability for employee benefits and tax withholdings. Our business model relies on the fact that our ICs are ICs and not deemed to be our employees, and exposure to any of the above factors could have an adverse effect on our business and results of operations.
Our financial results may be adversely impacted by potential future changes in accounting practices.
Future changes in accounting standards or practices, and related legal and regulatory interpretations of those changes, may adversely impact public companies in general, the transportation industry, or our operations specifically. New accounting standards or requirements, such as a conversion from U.S. generally accepted accounting principles to International Financial Reporting Standards, could change the way we record revenues, expenses, assets, and/or liabilities or could be costly to implement. These types of regulations could have a negative impact on our financial position, liquidity, results of operations, and/or access to capital.
If we are unable to maintain and enhance our technology systems, demand for our services and our revenue could decrease.
Our TMS business relies on our technology systems to track and store externally and internally generated market data, analyze the capabilities of our carrier network, and recommend cost-effective carriers in the appropriate transportation mode. To keep pace with changing technologies and customer demands in the future, we must correctly interpret and address market trends and enhance the features and functionality of our technology systems in response to these trends. We may be unable to implement the appropriate features and functionality of our technology systems in a timely and cost-effective manner, which could result in decreased demand for our services and a corresponding decrease in our revenue.
In addition, we have become increasingly reliant on our technology systems for our operations as well as providing services to our customers. Although we have implemented redundant systems and network security measures, our technology systems remain susceptible to outages, computer viruses, break-ins, and similar disruptions. Such an event could inhibit our ability to provide services to our customers and the ability of our customers to access our systems. In addition, there could be a loss of confidential information, corruption of data, and damage to our brand. This may result in a reduction in demand for our services or the loss of customers that could have a negative impact on our financial condition and results of operations.
Seasonal sales fluctuations and weather conditions could have an adverse impact on our results of operations.
The transportation industry is subject to seasonal sales fluctuations as shipments generally are lower during and after the winter holiday season. The productivity of our carriers historically decreases during the winter season because companies have the tendency to reduce their shipments during that time and inclement weather can impede operations. At the same time, our operating expenses could increase because harsh weather can lead to increased accident frequency rates and increased claims. If we were to experience lower-than-expected revenue during any such period, our expenses may not be offset, which could have an adverse impact on our results of operations.
15
Terrorist attacks, anti-terrorism measures, and war could have broad detrimental effects on our business operations.
As a result of the potential for terrorist attacks, federal, state, and municipal authorities have implemented and continue to follow various security measures, including checkpoints and travel restrictions on large trucks. Such measures may reduce the productivity of our ICs or increase the costs associated with their operations, which we could be forced to bear. For example, security measures imposed at bridges, tunnels, border crossings, and other points on key trucking routes may cause delays and increase the non-driving time of our ICs, which could have an adverse effect on our results of operations. War, risk of war, or a terrorist attack also may have an adverse effect on the economy. A decline in economic activity could adversely affect our revenues or restrict our future growth. Instability in the financial markets as a result of terrorism or war also could impact our ability to raise capital. In addition, the insurance premiums charged for some or all of the coverage currently maintained by us could increase dramatically or such coverage could be unavailable in the future.
If we fail to maintain adequate internal control over financial reporting in accordance with Section 404 of Sarbanes-Oxley, it could result in inaccurate financial reporting, sanctions, or securities litigation, or could otherwise harm our business.
As a public company, we are required to comply with the standards adopted by the Public Company Accounting Oversight Board in compliance with the requirements of Section 404 of Sarbanes-Oxley regarding internal control over financial reporting. Compliance with Section 404 requires dedicated internal resources and a significant amount of time and effort. We may experience higher than anticipated operating expenses, as well as increased independent auditor fees as we continue our compliance efforts on new acquisitions. We are required to be fully compliant under Section 404 for each acquisition in the following year after the acquisition occurred, and at that time our management will be required to deliver a report that assesses the effectiveness of our internal control over financial reporting, and we will be required to deliver an attestation report of our auditors on our management’s assessment of our internal controls. Completing documentation of our internal control system and financial processes, remediation of control deficiencies, and management testing of internal controls will require substantial effort by us. We cannot assure you that we will be able to complete the required management assessment by our reporting deadline. Failure to implement these changes in a timely, effective, or efficient manner could harm our operations, financial reporting, or financial results, and could result in our being unable to obtain an unqualified report on internal controls from our independent auditors.
Our TL business derives a portion of its revenues from inventory management, the loss of which could have a negative impact on our financial condition, results of operations, and cash flows.
A portion of our TL business is involved with inventory and freight management for customers whose products are shipped to a limited number of big box retailers. Should these big box retailers change their supply chain practices and direct our customers to deliver product via another source, such change could have a negative impact on our TL business until such time as the business can be replaced.
Our ability to raise capital in the future may be limited, and our failure to raise capital when needed could prevent us from achieving our growth objectives.
We may in the future be required to raise capital through public or private financing or other arrangements. Such financing may not be available on acceptable terms, or at all, and our failure to raise capital when needed could harm our business. Additional equity financing may dilute the interests of our stockholders, and debt financing, if available, may involve restrictive covenants and could reduce our profitability. If we cannot raise funds on acceptable terms, we may not be able to grow our business or respond to competitive pressures.
The market value of our common stock may fluctuate and could be substantially affected by various factors.
The price of our common stock on the New York Stock Exchange constantly changes. We expect that the market price of our common stock will continue to fluctuate. Our share price may fluctuate as a result of a variety of factors, many of which are beyond our control. These factors include, among others:
| • | Actual or anticipated variations in earnings, financial or operating performance or liquidity; |
| • | Changes in analysts’ recommendations or projections; |
| • | Failure to meet analysts’ projections; |
| • | General economic and capital market conditions; |
| • | Announcements of developments related to our business; |
| • | Operating and stock performance of other companies deemed to be peers; |
| • | Actions by government regulators; |
| • | News reports of trends, concerns, and other issues related to us or our industry, including changes in regulations; and |
| • | Other factors described in this “Risk Factors” section. |
Our common stock price may fluctuate significantly in the future, and these fluctuations may be unrelated to our performance. General market price declines or market volatility in the future could adversely affect the price of our common stock, and the current market price of our common stock may not be indicative of future market prices.
| ITEM 1B. | UNRESOLVED STAFF COMMENTS |
None
| ITEM 2. | PROPERTIES |
Our corporate, LTL, and TL headquarters, where senior management resides, is located in Cudahy, Wisconsin, where we lease 28,824 square feet of space. The primary functions performed at this location are accounting, treasury, marketing, human resources, linehaul support, claims, safety and information technology support. We lease 24,000 square feet of space in Hudson, Ohio, which houses our TMS headquarters.
We lease 17 of our 20 service centers for our LTL business throughout the United States, each of which is interactively connected. Each service center manages and is responsible for the freight that originates in its service area. The typical service center is configured to perform cross-dock and limited short-term warehouse operations. Our TL business leases one office for operations in Maine, eight of its 11 company dispatch offices throughout the Northeast region of the United States and Canada, 24 TL service centers throughout the Unites States, and four consolidation/warehousing facilities throughout the United States. In addition, our TMS business leases two service centers throughout the Northeast region of the United States.
We believe that our current facilities are in good working order and are capable of supporting our operations for the foreseeable future; however, we will continue to evaluate leasing additional space as needed to accommodate our growth.
16
| ITEM 3. | LEGAL PROCEEDINGS |
From time to time, we are involved in litigation and proceedings in the ordinary course of our business. We are not currently involved in any legal proceeding that we believe would have a material adverse effect on our business or financial condition.
| ITEM 4. | MINE SAFETY DISCLOSURES |
Not applicable
| ITEM 5. | MARKET FOR THE REGISTRANT’S COMMON EQUITY, RELATED STOCKHOLDER MATTERS, AND ISSUER PURCHASES OF EQUITY SECURITIES |
Market Information on Common Stock
Our common stock has been trading on the New York Stock Exchange under the symbol “RRTS” since May 13, 2010. Prior to that time, there was no public market for our stock. The following table sets forth, for the periods indicated, the high and low sales prices of our common stock as quoted on the New York Stock Exchange.
| High | Low | |||||||
| Fiscal 2011: |
||||||||
| First quarter |
$ | 15.07 | $ | 12.74 | ||||
| Second quarter |
$ | 15.70 | $ | 13.22 | ||||
| Third quarter |
$ | 16.75 | $ | 12.48 | ||||
| Fourth quarter |
$ | 17.40 | $ | 12.66 | ||||
| Fiscal 2010: |
||||||||
| First quarter |
N/A | N/A | ||||||
| Second quarter |
$ | 14.47 | $ | 13.25 | ||||
| Third quarter |
$ | 15.05 | $ | 10.67 | ||||
| Fourth quarter |
$ | 14.89 | $ | 10.34 | ||||
Stockholders
As of March 12, 2012, there were approximately 20 holders of record of our common stock. On March 12, 2012, the closing sale price of our common stock on the New York Stock Exchange was $17.82 per share.
Dividends
We have never declared or paid cash dividends on our common stock. We currently plan to retain any earnings to finance the growth of our business rather than to pay cash dividends. Payments of any cash dividends in the future will depend on our financial condition, results of operations, and capital requirements, as well as other factors deemed relevant by our board of directors. Our current debt agreements prohibit us from paying dividends without the consent of our lenders.
Performance Graph
The following line graph compares cumulative total shareholder returns for the period from May 13, 2010 through December 31, 2011 for (1) our common stock; (2) the Nasdaq Composite Index; and (3) the Nasdaq Transportation Index. The graph assumes an investment of $100 on May 13, 2010, which is the first day on which our stock was listed on the New York Stock Exchange. The calculations of cumulative stockholder return on the Nasdaq Composite Index and the Nasdaq Transportation Index include reinvestment of dividends. The calculation of cumulative stockholder return on our common stock does not include reinvestment of dividends because we did not pay any dividends during the measurement period. The historical performance shown is not necessarily indicative of future performance.
17
The performance graph shall not be deemed “filed” for purposes of Section 18 of the Securities Exchange Act of 1934, as amended (Exchange Act), or otherwise subject to the liability of that section. The performance graph will not be deemed incorporated by reference into any filing of our company under the Exchange Act or the Securities Act of 1933, as amended (Securities Act).
COMPARISON OF 20 MONTH CUMULATIVE TOTAL RETURN*
Among Roadrunner Transportation Systems Inc., the NASDAQ Composite Index
and the NASDAQ Transportation Index
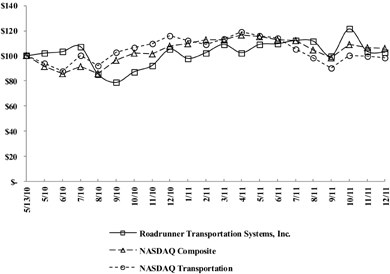
| * | $100 invested on May 13, 2010 in stock or April 30, 2010 in index, including reinvestment of dividends. Fiscal year ending December 31. |
18
| ITEM 6. | SELECTED FINANCIAL DATA |
The following presents selected financial data for each fiscal year in the five-year period ended December 31, 2011. As our past operating results are not necessarily indicative of our future operating results, and since the consolidated statement of operations includes the results of operations of our acquired companies since the date of their acquisition, you should read the selected financial data below in conjunction with Item 7. “Management’s Discussion and Analysis of Financial Condition and Results of Operations,” and our consolidated financial statements and related notes contained elsewhere in this report, including Note 2 thereto.
| Year Ended December 31, | ||||||||||||||||||||
| 2011 | 2010 | 2009 | 2008(1) | 2007 | ||||||||||||||||
| (In thousands, except per share amounts) | ||||||||||||||||||||
| Consolidated Statement of Operations Data: |
||||||||||||||||||||
| Revenues |
$ | 843,627 | $ | 632,018 | $ | 483,322 | $ | 565,907 | $ | 538,007 | ||||||||||
| Purchased transportation costs |
620,343 | 494,045 | 378,858 | 453,953 | 425,568 | |||||||||||||||
| Personnel and related benefits |
87,178 | 61,853 | 52,621 | 58,282 | 55,354 | |||||||||||||||
| Other operating expenses |
83,625 | 41,168 | 33,988 | 39,099 | 37,311 | |||||||||||||||
| Depreciation and amortization |
4,978 | 3,114 | 2,967 | 2,465 | 1,840 | |||||||||||||||
| Acquisition transaction expenses |
1,368 | 569 | 1,148 | — | — | |||||||||||||||
| Restructuring and IPO related expenses |
— | 1,500 | — | 3,416 | — | |||||||||||||||
|
|
|
|
|
|
|
|
|
|
|
|||||||||||
| Operating income |
46,135 | 29,769 | 13,740 | 8,692 | 17,934 | |||||||||||||||
| Interest on long-term debt |
4,135 | 7,954 | 13,226 | 12,969 | 13,937 | |||||||||||||||
| Dividends on preferred stock subject to mandatory redemption |
200 | 200 | 200 | 200 | 160 | |||||||||||||||
| Loss on early extinguishment of debt |
— | 15,916 | — | — | 1,608 | |||||||||||||||
|
|
|
|
|
|
|
|
|
|
|
|||||||||||
| Income (loss) before provision (benefit)for income taxes |
41,800 | 5,699 | 314 | (4,477 | ) | 2,229 | ||||||||||||||
| Provision (benefit) for income taxes |
15,929 | 2,108 | 337 | (1,139 | ) | 1,294 | ||||||||||||||
|
|
|
|
|
|
|
|
|
|
|
|||||||||||
| Net income (loss) |
25,871 | 3,591 | (23 | ) | (3,338 | ) | 935 | |||||||||||||
| Accretion of Series B preferred stock |
— | 765 | 1,950 | — | — | |||||||||||||||
|
|
|
|
|
|
|
|
|
|
|
|||||||||||
| Net income (loss) available to common stockholders |
$ | 25,871 | $ | 2,826 | $ | (1,973 | ) | $ | (3,338 | ) | $ | 935 | ||||||||
|
|
|
|
|
|
|
|
|
|
|
|||||||||||
| Earnings (loss) per share available to common stockholders: |
||||||||||||||||||||
| Basic |
$ | 0.85 | $ | 0.11 | $ | (0.11 | ) | $ | (0.20 | ) | $ | 0.06 | ||||||||
| Diluted |
0.82 | 0.11 | (0.11 | ) | (0.20 | ) | 0.06 | |||||||||||||
| Weighted average common stock outstanding: |
||||||||||||||||||||
| Basic |
30,432 | 25,779 | 17,656 | 17,061 | 15,114 | |||||||||||||||
| Diluted |
31,545 | 26,777 | 17,656 | 17,061 | 15,134 | |||||||||||||||
| Consolidated Balance Sheet Data (at end of period): |
||||||||||||||||||||
| Total assets |
$ | 543,353 | $ | 348,297 | $ | 333,281 | $ | 285,883 | $ | 255,880 | ||||||||||
| Total debt (including current maturities) |
136,500 | 20,500 | 138,935 | 106,254 | 102,420 | |||||||||||||||
| Series A preferred stock subject to mandatory redemption |
5,000 | 5,000 | 5,000 | 5,000 | 5,000 | |||||||||||||||
| Redeemable common stock |
— | — | 1,740 | 1,740 | 1,765 | |||||||||||||||
| Total stockholders’ investment |
295,953 | 265,689 | 139,643 | 129,987 | 103,870 | |||||||||||||||
| Other Data: |
||||||||||||||||||||
| EBITDA(2) |
$ | 51,113 | $ | 16,967 | $ | 16,707 | $ | 11,157 | $ | 18,166 | ||||||||||
| Capital expenditures |
10,105 | 2,500 | 2,292 | 1,168 | 1,867 | |||||||||||||||
| Working capital — current assets less current liabilities (end of period) |
42,820 | 42,383 | 18,038 | 12,537 | 15,539 | |||||||||||||||
| Net cash provided by operating activities |
32,992 | 2,110 | 778 | 802 | 12,470 | |||||||||||||||
| Net cash used in investing activities |
(140,358 | ) | (1,080 | ) | (34,216 | ) | (27,208 | ) | (3,187 | ) | ||||||||||
| Net cash provided by (used in) financing activities |
109,685 | (2,210 | ) | 34,214 | 27,006 | (11,535 | ) | |||||||||||||
19
| (1) | On February 29, 2008, our controlling stockholder acquired all the outstanding capital stock of a group of TMS companies collectively referred to as GTS. On May 18, 2010, we acquired GTS by way of merger simultaneous with the consummation of our IPO. As such, because we were under common control with GTS as of February 29, 2008, the consolidated statements of operations, consolidated balance sheet, and other data for the periods presented include the results of GTS from February 29, 2008. |
| (2) | EBITDA represents earning before interest, taxes, depreciation, and amortization. Our management uses EBITDA as a supplement measure in evaluating our operating performance and when determining executive incentive compensation. Our management believes EBITDA is useful to investors in evaluating our performance compared to other companies in our industry because it assists in analyzing and benchmarking the performance and value of a business. The calculation of EBITDA eliminates the effects of financing, income taxes, and the accounting effects of capital spending. These items may vary for different companies for reason unrelated to the overall operating performance of a company’s business. EBITDA is not a financial measure presented in accordance with U.S. generally accepted accounting principles, or GAAP. Although our management uses EBITDA as a financial measure to assess the performance of our business compared to that of others in our industry, EBITDA has limitations as an analytical tool, and you should not consider it in isolation, or as a substitute for analysis of our results as reported under GAAP. |
The following is a reconciliation of EBITDA:
| Year Ended December 31, | ||||||||||||||||||||
| 2011 | 2010 | 2009 | 2008 | 2007 | ||||||||||||||||
| (In thousands) | ||||||||||||||||||||
| Net income (loss) |
$ | 25,871 | $ | 3,591 | $ | (23 | ) | $ | (3,338 | ) | $ | 935 | ||||||||
| Plus: Provision (benefit) for income taxes |
15,929 | 2,108 | 337 | (1,139 | ) | 1,294 | ||||||||||||||
| Plus: Total interest expense |
4,335 | 8,154 | 13,426 | 13,169 | 14,097 | |||||||||||||||
| Plus: Depreciation and amortization |
4,978 | 3,114 | 2,967 | 2,465 | 1,840 | |||||||||||||||
|
|
|
|
|
|
|
|
|
|
|
|||||||||||
| EBITDA |
$ | 51,113 | $ | 16,967 | $ | 16,707 | $ | 11,157 | $ | 18,166 | ||||||||||
|
|
|
|
|
|
|
|
|
|
|
|||||||||||
The following expenses have not been added to net income (loss) in the calculation of EBITDA above:
| 2011 | 2010 | 2009 | 2008 | 2007 | ||||||||||||||||
| (In thousands) | ||||||||||||||||||||
| Loss on early extinguishment of debt |
$ | — | $ | 15,916 | $ | — | $ | — | $ | 1,608 | ||||||||||
| Restructuring and IPO related expenses |
— | 1,500 | — | 3,416 | — | |||||||||||||||
| Acquisition transaction expenses |
1,368 | 569 | 1,148 | — | — | |||||||||||||||
20
| ITEM 7. | MANAGEMENT’S DISCUSSION AND ANALYSIS OF FINANCIAL CONDITION AND RESULTS OF OPERATIONS |
This financial review presents our operating results for each of our three most recent fiscal years and our financial condition at December 31, 2011. You should read the following discussion and analysis in conjunction with our financial statements and related notes contained elsewhere in this report. This discussion contains forward-looking statements that involve risks, uncertainties, and assumptions. Our actual results may differ materially from those anticipated in these forward-looking statements as a result of a variety of factors, including those set forth under Item 1A. “Risk Factors.”
Overview
We are a leading asset-light transportation and logistics service provider offering a full suite of solutions, including customized and expedited LTL, TL, TMS, intermodal solutions (transporting a shipment by more than one mode, primarily via rail and truck), and domestic and international air. We utilize a broad third-party network of transportation providers, comprised of ICs and purchased power providers, to serve a diverse customer base in terms of end market focus and annual freight expenditures. Although we service large national accounts, we primarily focus on small to mid-size shippers, which we believe represent an expansive and underserved market. Our business model is highly scalable and flexible, featuring a variable cost structure that requires minimal investment in transportation equipment and facilities, thereby enhancing free cash flow generation and returns on our invested capital and assets.
We have three operating segments:
Less-than-Truckload. Our LTL business involves the pickup, consolidation, linehaul, deconsolidation, and delivery of LTL shipments throughout the United States and into Mexico, Puerto Rico, and Canada. With a network of LTL 20 service centers and over 200 third-party delivery agents, we employ a point-to-point LTL model that we believe serves as a competitive advantage over the traditional hub and spoke LTL model in terms of faster transit times, lower incidence of damage, and reduced fuel consumption. Our LTL segment also includes domestic and international air transportation services.
Truckload and Logistics. Within our TL business, we arrange the pickup, delivery, and inventory management of TL freight through our network of 24 TL service centers, four consolidation/warehousing facilities, 11 company dispatch offices, and 76 independent brokerage agents primarily located throughout the eastern United States and Canada. We offer temperature-controlled, dry van, intermodal drayage, and flatbed services and specialize in the transport of refrigerated foods, poultry, and beverages. We believe this specialization provides consistent shipping volume year-over-year.
Transportation Management Solutions. Within our TMS business, we offer a “one-stop” transportation and logistics solution, including access to the most cost-effective and time-sensitive modes of transportation within our broad network. Specifically, our TMS offering includes pricing, contract management, transportation mode and carrier selection, freight tracking, freight bill payment and audit, cost reporting and analysis, and dispatch. Our customized TMS offering is designed to allow our customers to reduce operating costs, redirect resources to core competencies, improve supply chain efficiency, and enhance customer service.
Recent Acquisitions
In February 2011, we acquired all of the outstanding stock of Morgan Southern, Inc. for the purpose of expanding our intermodal presence within our TL segment. Headquartered in Georgia, Morgan Southern provides primarily intermodal transportation and related services. Morgan Southern employs city drivers and leases equipment to make city deliveries along with the utilization of ICs. See note 2 to our consolidated financial statements included in this report.
In May 2011, we acquired all of the outstanding stock of Bruenger Trucking Company for the purpose of expanding our truckload presence within our TL segment. Headquartered in Kansas, Bruenger provides primarily temperature controlled truckload and related services. Bruenger employs drivers along with the utilization of ICs. See note 2 to our consolidated financial statements included in this report.
In August 2011, we acquired all the outstanding stock of James Brooks Company, Inc. and C.A.L. Transport, Inc., collectively James Brooks, for the purpose of expanding our market presence within our TL segment. All operations of James Brooks have been fully integrated with Morgan Southern. See note 2 to our consolidated financial statements included in this report.
In August 2011, we acquired all the outstanding stock of Prime Logistics Corporation for the purpose of expanding our market presence and service offerings in within our TL segment. Headquartered in Indiana, Prime provides cost effective national distribution programs that assist vendors through warehousing, packaging, and multi-vendor consolidation. See note 2 to our consolidated financial statements included in this report.
21
Critical Accounting Policies and Estimates
The preparation of financial statements in conformity with accounting principles generally accepted in the United States requires that we make estimates and assumptions. In certain circumstances, those estimates and assumptions can affect amounts reported in the accompanying consolidated financial statements and related footnotes. In preparing our financial statements, we have made our best estimates and judgments of certain amounts included in the financial statements, giving due consideration to materiality. We base our estimates on historical experience and on various other assumptions that we believe to be reasonable. Application of the accounting policies described below involves the exercise of judgment and use of assumptions as to future uncertainties and, as a result, actual results could differ from these estimates. The following is a brief discussion of our critical accounting policies and estimates.
Goodwill and Other Intangibles
Goodwill represents the excess of purchase price over the estimated fair value assigned to the net tangible and identifiable intangible assets of a business acquired. Goodwill is tested for impairment at least annually using a two-step process that begins with an estimation of the fair value at the “reporting unit” level. We have four reporting units for our three operating segments. We have one reporting unit for our LTL and TMS segments and two reporting units for our TL segment as this is the lowest level for which discrete financial information is prepared and regularly reviewed by management. The impairment test for goodwill involves comparing the fair value of a reporting unit to its carrying amount, including goodwill. If the carrying amount of the reporting unit exceeds its fair value, a second step is required to measure the goodwill impairment loss. The second step includes hypothetically valuing all the tangible and intangible assets of the reporting unit as if the reporting unit had been acquired in a business combination. Then, the implied fair value of the reporting unit’s goodwill is compared to the carrying amount of that goodwill. If the carrying amount of the reporting unit’s goodwill exceeds the implied fair value of the goodwill, we recognize an impairment loss in an amount equal to the excess, not to exceed the carrying amount. For purposes of our impairment test, the fair value of our reporting units are calculated based upon an average of an income fair value approach and market fair value approach.
Other intangible assets recorded consist of definite-lived customer lists. We evaluate our other intangible assets for impairment when current facts or circumstances indicate that the carrying value of the assets to be held and used may not be recoverable.
Revenue Recognition
LTL revenue is recorded when all of the following have occurred: an agreement of sale exists; pricing is fixed or determinable; and collection of revenue is reasonably assured. We use a percentage of completion method to recognize revenue, which results in an allocation of revenue between reporting periods based on the distinctive phases of each LTL transaction completed in each reporting period, with expenses recognized as incurred. Management believes that this is the most appropriate method for LTL revenue recognition based on the multiple distinct phases of a typical LTL transaction, which is in contrast to the single phase of a typical TL transaction.
TL revenue is recorded when all of the following have occurred: an agreement of sale exists; pricing is fixed or determinable; delivery has occurred; and our obligation to fulfill a transaction is complete and collection of revenue is reasonably assured. This occurs when we complete the delivery of a shipment or the service has been fulfilled.
TMS transportation revenue and related transportation costs are recognized when the shipment has been delivered by a third-party carrier. Fee for services revenue is recognized when the services have been rendered. At the time of delivery or rendering of services, as applicable, our obligation to fulfill a transaction is complete and collection of revenue is reasonably assured. We offer volume discounts to certain customers. Revenue is reduced as discounts are earned.
We typically recognize revenue on a gross basis, as opposed to a net basis, because we bear the risks and benefits associated with revenue-generated activities by, among other things, (1) acting as a principal in the transaction, (2) establishing prices, (3) managing all aspects of the shipping process, and (4) taking the risk of loss for collection, delivery, and returns. Certain TMS transactions to provide specific services are recorded at the net amount charged to the client due to the following factors: (A) we do not have latitude in establishing pricing, and (B) we do not bear the risk of loss for delivery and returns; these items are the risk of the carrier.
Results of Operations
The following table sets forth, for the periods indicated, summary LTL, TL, TMS, corporate, and consolidated statement of operations data. Such revenue data for our LTL, TL, and TMS business segments are expressed as a percentage of consolidated revenues. Other statement of operations data for our LTL, TL, and TMS business segments are expressed as a percentage of segment revenues. Total statement of operations data are expressed as a percentage of consolidated revenues.
22
| Year Ended December 31, | ||||||||||||||||||||||||
| 2011 | 2010 | 2009 | ||||||||||||||||||||||
| (Dollars in thousands) | ||||||||||||||||||||||||
| Revenues: |
||||||||||||||||||||||||
| LTL |
$ | 466,823 | 55.3 | % | $ | 409,914 | 64.9 | % | $ | 316,119 | 65.4 | % | ||||||||||||
| TL |
301,279 | 35.7 | % | 158,724 | 25.1 | % | 134,815 | 27.9 | % | |||||||||||||||
| TMS |
79,188 | 9.4 | % | 65,902 | 10.4 | % | 34,472 | 7.1 | % | |||||||||||||||
| Eliminations |
(3,663 | ) | (0.4 | )% | (2,522 | ) | (0.4 | )% | (2,084 | ) | (0.4 | )% | ||||||||||||
|
|
|
|
|
|
|
|
|
|
|
|
|
|||||||||||||
| Total |
843,627 | 100.0 | % | 632,018 | 100.0 | % | 483,322 | 100.0 | % | |||||||||||||||
| Purchased transportation costs: |
||||||||||||||||||||||||
| LTL |
352,890 | 75.6 | % | 307,721 | 75.1 | % | 235,602 | 74.5 | % | |||||||||||||||
| TL |
212,439 | 70.5 | % | 140,380 | 88.4 | % | 119,050 | 88.3 | % | |||||||||||||||
| TMS |
58,677 | 74.1 | % | 48,466 | 73.5 | % | 26,290 | 76.3 | % | |||||||||||||||
| Eliminations |
(3,663 | ) | (0.4 | )% | (2,522 | ) | (0.4 | )% | (2,084 | ) | (0.4 | )% | ||||||||||||
|
|
|
|
|
|
|
|
|
|
|
|
|
|||||||||||||
| Total |
620,343 | 73.5 | % | 494,045 | 78.2 | % | 378,858 | 78.4 | % | |||||||||||||||
| Net revenues:(1) |
||||||||||||||||||||||||
| LTL |
113,933 | 24.4 | % | 102,193 | 24.9 | % | 80,517 | 25.5 | % | |||||||||||||||
| TL |
88,840 | 29.5 | % | 18,344 | 11.6 | % | 15,765 | 11.7 | % | |||||||||||||||
| TMS |
20,511 | 25.9 | % | 17,436 | 26.5 | % | 8,182 | 23.7 | % | |||||||||||||||
|
|
|
|
|
|
|
|
|
|
|
|
|
|||||||||||||
| Total |
223,284 | 26.5 | % | 137,973 | 21.8 | % | 104,464 | 21.6 | % | |||||||||||||||
| Other operating expenses:(2) |
||||||||||||||||||||||||
| LTL |
87,890 | 18.8 | % | 78,856 | 19.2 | % | 69,047 | 21.8 | % | |||||||||||||||
| TL |
66,228 | 22.0 | % | 11,141 | 7.0 | % | 10,771 | 8.0 | % | |||||||||||||||
| TMS |
12,222 | 15.4 | % | 11,458 | 17.4 | % | 5,829 | 16.9 | % | |||||||||||||||
| Corporate |
5,831 | 0.7 | % | 3,635 | 0.6 | % | 2,110 | 0.4 | % | |||||||||||||||
|
|
|
|
|
|
|
|
|
|
|
|
|
|||||||||||||
| Total |
172,171 | 20.4 | % | 105,090 | 16.6 | % | 87,757 | 18.2 | % | |||||||||||||||
| Depreciation and amortization: |
||||||||||||||||||||||||
| LTL |
1,718 | 0.4 | % | 1,676 | 0.4 | % | 1,716 | 0.5 | % | |||||||||||||||
| TL |
2,572 | 0.9 | % | 744 | 0.5 | % | 656 | 0.5 | % | |||||||||||||||
| TMS |
688 | 0.9 | % | 694 | 1.1 | % | 595 | 1.7 | % | |||||||||||||||
|
|
|
|
|
|
|
|
|
|
|
|
|
|||||||||||||
| Total |
4,978 | 0.6 | % | 3,114 | 0.5 | % | 2,967 | 0.6 | % | |||||||||||||||
| Operating income: |
||||||||||||||||||||||||
| LTL |
24,325 | 5.2 | % | 21,661 | 5.3 | % | 9,754 | 3.1 | % | |||||||||||||||
| TL |
20,040 | 6.7 | % | 6,459 | 4.1 | % | 4,338 | 3.2 | % | |||||||||||||||
| TMS |
7,601 | 9.6 | % | 5,284 | 8.0 | % | 1,758 | 5.1 | % | |||||||||||||||
| Corporate |
(5,831 | ) | (0.7 | )% | (3,635 | ) | (0.6 | )% | (2,110 | ) | (0.4 | )% | ||||||||||||
|
|
|
|
|
|
|
|
|
|
|
|
|
|||||||||||||
| Total |
46,135 | 5.5 | % | 29,769 | 4.7 | % | 13,740 | 2.8 | % | |||||||||||||||
| Total interest expense |
4,335 | 0.5 | % | 8,154 | 1.3 | % | 13,426 | 2.8 | % | |||||||||||||||
| Loss on early extinguishment of debt |
— | 0.0 | % | 15,916 | 2.5 | % | — | 0.0 | % | |||||||||||||||
|
|
|
|
|
|
|
|
|
|
|
|
|
|||||||||||||
| Income before provision for income taxes |
41,800 | 5.0 | % | 5,699 | 0.9 | % | 314 | 0.1 | % | |||||||||||||||
| Provision for income taxes |
15,929 | 1.9 | % | 2,108 | 0.3 | % | 337 | 0.1 | % | |||||||||||||||
|
|
|
|
|
|
|
|
|
|
|
|
|
|||||||||||||
| Net income (loss) |
25,871 | 3.1 | % | 3,591 | 0.6 | % | (23 | ) | 0.0 | % | ||||||||||||||
|
|
|
|
|
|
|
|
|
|
|
|
|
|||||||||||||
| Accretion of Series B preferred stock |
— | 0.0 | % | 765 | 0.1 | % | 1,950 | 0.4 | % | |||||||||||||||
|
|
|
|
|
|
|
|
|
|
|
|
|
|||||||||||||
| Net income (loss) available to common stockholders |
$ | 25,871 | 3.1 | % | $ | 2,826 | 0.4 | % | $ | (1,973 | ) | (0.4 | %) | |||||||||||
|
|
|
|
|
|
|
|
|
|
|
|
|
|||||||||||||
| (1) | Reflects revenues less purchased transportation costs. |
| (2) | Reflects the sum of personnel and related benefits, other operating expenses, acquisition transaction expenses, and restructuring and IPO related expenses. |
23
Year Ended December 31, 2011 Compared to Year Ended December 31, 2010
Revenues
Consolidated revenues increased by $211.6 million, or 33.5%, to $843.6 million in 2011 from $632.0 million in 2010, approximately half of which was attributable to the impact of recent TL acquisitions.
LTL revenues increased by $56.9 million, or 13.9%, to $466.8 million in 2011 from $409.9 million in 2010. This reflects year-over-year LTL tonnage growth of 4.3%, driven by a 4.8% increase in the number of LTL shipments, slightly offset by a 0.4% decline in weight per shipment. Our LTL tonnage increase was driven by new customer growth. In addition to growth in tonnage and shipments, our revenue per hundredweight including fuel surcharges increased during the year by 9.5%. This reflects increased fuel prices year-over-year and an increase in revenue per hundredweight excluding fuel of 3.9%, which resulted from stabilization in the LTL pricing environment, our yield improvement initiatives, and a change in freight mix that provided an increased revenue per hundredweight. Our yield improvement initiatives include, but are not limited to, surcharges in certain geographic locations and renegotiations of accounts that have fuel caps or waivers in effect.
TL revenues increased by $142.6 million, or 89.8%, to $301.3 million in 2011 from $158.7 million 2010. This growth was primarily driven by (i) the acquisitions of Morgan Southern, Bruenger, James Brooks, and Prime, (ii) 18.8% organic growth due to a 5.1% increase in the number of loads, (iii) a year-over-year increase in revenue per load of 12.3%, and (iv) the continued expansion of our TL agent network. Our 2011 TL acquisitions contributed revenues of $112.8 million.
TMS revenues increased by $13.3 million, or 20.2%, to $79.2 million in 2011 from $65.9 million in 2010, primarily as a result of new and existing customer growth.
Purchased Transportation Costs
Purchased transportation costs increased by $126.3 million, or 25.6%, to $620.3 million in 2011 from $494.0 million in 2010.
LTL purchased transportation costs increased by $45.2 million, or 14.7%, to $352.9 million in 2011 from $307.7 million in 2010, and increased as a percentage of LTL revenues to 75.6% from 75.1%. This increase was primarily the result of rising fuel costs in 2011. Excluding fuel surcharges, our average linehaul cost per mile increased to $1.24 in 2011 from $1.22 in 2010. This increase was mitigated by our yield improvement initiatives and linehaul cost reduction initiatives that included the utilization of our ICs on lanes most impacted by rising rates.
TL purchased transportation costs increased by $72.0 million, or 51.3%, to $212.4 million in 2011 from $140.4 million in 2010, primarily as a result of our 2011 TL acquisitions. TL purchased transportation costs as a percentage of TL revenues decreased to 70.5% in 2011 from 88.4% in 2010, primarily due to Morgan Southern and Bruenger drivers and leased equipment expenses being included in other operating expenses. Our other TL businesses typically use ICs rather than employee drivers and do not lease equipment. Additionally, increases in market pricing and increased utilization of our TL agent network reduced the percentage of purchased transportation costs to TL revenues.
TMS purchased transportation costs increased by $10.2 million, or 21.1%, to $58.7 million in 2011 from $48.5 million in 2010. TMS purchased transportation costs as a percentage of TMS revenues increased to 74.1% from 73.5%, primarily as a result of increased fuel prices and increased carrier costs.
Other Operating Expenses
Other operating expenses, which reflect the sum of the personnel and related benefits, other operating expenses, acquisition transaction expenses, and IPO related expenses line items shown in our consolidated statements of operations, increased by $67.1 million, or 63.8%, to $172.2 million in 2011 from $105.1 million in 2010.
Within our LTL business, other operating expenses increased by $9.0 million, or 11.5%, to $87.9 million in 2011 from $78.9 million in 2010, primarily as a result of increased insurance costs, increased dock labor costs associated with the 4.8% increase in shipment count, and expanded infrastructure costs to support new business initiatives. As a percentage of LTL revenues, this represented a decrease to 18.8% from 19.2%, primarily due to implementing operating initiatives to reduce the amount of labor cost per shipment to reduce the overall percentage of costs from 2010 to 2011.
Within our TL business, other operating expenses increased by $55.1 million to $66.2 million in 2011 from $11.1 million in 2010. As a percentage of TL revenues, this represented an increase to 22.0% from 7.0%, primarily a result of Morgan Southern and Bruenger drivers and leased equipment expenses being included in other operating expenses.
24
Within our TMS business, other operating expenses increased by $0.7 million, or 6.7%, to $12.2 million in 2011 from $11.5 million in 2010. TMS other operating expenses, as a percentage of TMS revenues, decreased to 15.4% in 2011 from 17.4% in 2010.
Other operating expenses that were not allocated to our LTL, TL, or TMS businesses increased to $5.8 million in 2011 from $3.6 million in 2010. This increase was primarily a result of $1.4 million of incremental public company costs and $0.8 million of additional acquisition expenses incurred in 2011.
Depreciation and Amortization
Depreciation and amortization was $5.0 million in 2011 and $3.1 million in 2010, reflecting increases in property, plant, and equipment. Within our LTL business, depreciation and amortization was $1.7 million during both 2011 and 2010. Depreciation and amortization within our TL business was $2.6 million during 2011 and $0.7 million during 2010. Within our TMS business, depreciation and amortization was $0.7 million during both 2011 and 2010.
Operating Income
Operating income increased by $16.3 million, or 55.0%, to $46.1 million in 2011 from $29.8 million in 2010, primarily as a result of the factors above. As a percentage of revenues, operating income increased to 5.5% in 2011 from 4.7% in 2010.
Within our LTL business, operating income increased by $2.6 million, or 12.3%, to $24.3 million from $21.7 million, and decreased as a percentage of LTL revenues to 5.2% from 5.3%, primarily as a result of the factors above.
Within our TL business, operating income increased by $13.5 million, or 210.3%, to $20.0 million from $6.5 million, and also increased as a percentage of TL revenues to 6.7% from 4.1%, primarily as a result of the factors above.
Within our TMS business, operating income increased by $2.3 million, or 43.8%, to $7.6 million from $5.3 million, and also increased as a percentage of TMS revenues to 9.6% from 8.0%, primarily as a result of the factors above.
Interest Expense
Interest expense decreased by $3.9 million, or 46.8%, to $4.3 million in 2011 from $8.2 million in 2010, primarily attributable to the reduction of our outstanding indebtedness resulting from the application of the net proceeds from our IPO, partially offset by interest expense attributable to the borrowings we incurred to finance our Morgan Southern, Bruenger, James Brooks, and Prime acquisitions.
Loss on Early Extinguishment of Debt
In connection with the reduction of our outstanding indebtedness as a result of our IPO in 2010 and our entering into a new credit agreement in 2010, we incurred a one-time loss on early extinguishment of debt of $15.9 million in 2010 that we did not incur in 2011. This charge consisted of (i) $10.6 million of prepayment penalties, (ii) the payment of $2.6 million of unaccreted discount on our junior subordinated notes, (iii) the non-cash write-off of $2.2 million of deferred debt issuance costs, and (iv) the payment of legal and other miscellaneous fees of $0.5 million.
Income Tax
Income tax provision was $15.9 million in 2011 compared to $2.1 million in 2010. The effective tax rate was 38.1% in 2011 compared to 37.0% in 2010. The effective income tax rate varies from the federal statutory rate of 35.0% primarily due to state and Canadian income taxes as well as the impact of items causing permanent differences.
Net Income Available to Common Stockholders
Net income available to common stockholders was $25.9 million in 2011 compared to $2.8 million in 2010. Net income available to common stockholders during 2010 was impacted by $0.8 million of accretion of Series B preferred stock dividends. Upon completion of our IPO, our shares of Series B preferred stock were converted into shares of our common stock and such accretion was eliminated as of the date of conversion.
25
Year Ended December 31, 2010 Compared to Year Ended December 31, 2009
Revenues
Consolidated revenues increased by $148.7 million, or 30.8%, to $632.0 million in 2010 from $483.3 million in 2009.
LTL revenues increased by $93.8 million, or 29.7%, to $409.9 million in 2010 from $316.1 million in 2009. This reflects year-over-year LTL tonnage growth of 21.3%, driven by a 22.1% increase in the number of LTL shipments, slightly offset by a 0.6% decline in weight per shipment. Our LTL tonnage increase was driven by new customer growth and the Bullet acquisition. In addition to growth in tonnage and shipments, our revenue per hundredweight including fuel surcharges increased during the year by 7.0%. This reflects increased fuel prices year-over-year and an increase in revenue per hundredweight excluding fuel of 3.6%, which resulted from the stabilization in the LTL pricing environment, our yield improvement initiatives, and a change in freight mix that provided an increased revenue per hundredweight.
TL revenues increased by $23.9 million, or 17.7%, to $158.7 million during 2010 from $134.8 million in 2009, primarily driven by a 5.4% increase in the number of loads, a year-over-year increase in revenue per load of 11.7%, and the expansion of our TL agent network.
TMS revenues increased by $31.4 million, or 91.2%, to $65.9 million in 2010 from $34.5 million in 2009, primarily as a result of the addition of new customers, as well as the acquisition of Mesca and GNTS during the second half of 2009 and Alpha during the first quarter of 2010, which are reflected in our results from their respective acquisition dates.
Purchased Transportation Costs
Purchased transportation costs increased by $115.1 million, or 30.4%, to $494.0 million in 2010 from $378.9 million in 2009.
LTL purchased transportation costs increased by $72.1 million, or 30.6%, to $307.7 million in 2010 from $235.6 million in 2009, and increased as a percentage of LTL revenues to 75.1% from 74.5%. This increase was primarily the result of tighter capacity in the truckload market, which caused an increase in rates paid to our third-party linehaul carriers, as well as rising fuel costs. Excluding fuel surcharges, our average linehaul cost per mile increased to $1.22 in 2010 from $1.18 in 2009. This increase was partially offset by our yield improvement initiatives and linehaul cost reduction initiatives that included the utilization of our ICs on lanes most impacted by rising rates.
TL purchased transportation costs increased by $21.3 million, or 17.9%, to $140.4 million in 2010 from $119.1 million in 2009, and increased slightly as a percentage of TL revenues to 88.4% from 88.3%, primarily due to rising truckload rates not yet passed on to contract customers, expansion of our TL agent network, and payment of related commissions to new agents.
TMS purchased transportation costs increased by $22.2 million, or 84.4%, to $48.5 million in 2010 from $26.3 million in 2009. This primarily resulted from recent acquisitions, which expanded the TMS offering to include a broader range of services. TMS purchased transportation costs as a percentage of TMS revenues decreased to 73.5% from 76.3%, primarily as a result of the acquisitions of Mesca, GNTS, and Alpha, which provide higher margin services.
Other Operating Expenses
Other operating expenses, which reflect the sum of the personnel and related benefits, other operating expenses, acquisition transaction expenses, and IPO related expenses line items shown in our consolidated statements of operations, increased by $17.3 million, or 19.8%, to $105.1 million in 2010 from $87.8 million in 2009.
Within our LTL business, other operating expenses increased by $9.9 million, or 14.2%, to $78.9 million in 2010 from $69.0 million in 2009, primarily as a result of the Bullet acquisition and increased dock costs related to revenue growth. Due to our scalable operating model and targeted cost reduction initiatives, LTL other operating expenses as a percentage of LTL revenues decreased to 19.2% in 2010 from 21.8% in 2009.
Within our TL business, other operating expenses increased by $0.3 million, or 3.4%, to $11.1 million in 2010 from $10.8 million in 2009. As a percentage of TL revenues, this represents a decrease to 7.0% from 8.0% and is primarily due to increases in market pricing and tonnage, as well as continued expansion of our TL agent network because price per ton increased and we were able to service more tonnage without adding additional costs.
Within our TMS business, other operating expenses increased by $5.7 million, or 96.6%, to $11.5 million in 2010 from $5.8 million in 2009, primarily as a result of the Mesca, GNTS, and Alpha acquisitions. As a percentage of TMS revenues, this represented an increase to 17.4% from 16.9%.
26
Other operating expenses that were not allocated to our LTL, TL, or TMS businesses increased to $3.6 million in 2010 from $2.1 million in 2009. The $3.6 million incurred during 2010 resulted from $1.5 million of IPO costs with the remaining $2.1 million representing corporate salaries, stock-based compensation expense, acquisition transaction expenses and management termination fees. The $2.1 million incurred during in 2009 primarily represents acquisition transaction expenses and stock-based compensation expense.
Depreciation and Amortization
Depreciation and amortization was $3.1 million in 2010 and $3.0 million in 2009, reflecting increases in property, plant, and equipment. Within our LTL business, depreciation and amortization was $1.7 million during both 2010 and 2009. Depreciation and amortization within our TL business was $0.7 million during both 2010 and 2009. Within our TMS business, depreciation and amortization was $0.7 million in 2010 and $0.6 million in 2009.
Operating Income
Operating income increased by $16.1 million, or 116.7%, to $29.8 million in 2010 from $13.7 million in 2009. As a percentage of revenues, operating income increased to 4.7% in 2010 from 2.8% in 2009.
Within our LTL business, operating income increased by $11.9 million, or 122.1%, to $21.7 million from $9.8 million, and also increased as a percentage of LTL revenues to 5.3% from 3.1%.
Within our TL business, operating income increased by $2.2 million, or 48.9%, to $6.5 million from $4.3 million, and also increased as a percentage of TL revenues to 4.1% from 3.2%.
Within our TMS business, operating income increased by $3.5 million, or 200.6%, to $5.3 million from $1.8 million, and also increased as a percentage of TMS revenues to 8.0% from 5.1%.
Interest Expense
Interest expense decreased by $5.2 million, or 39.3%, to $8.2 million in 2010 from $13.4 million in 2009, primarily attributable to the reduction of our outstanding indebtedness resulting from the application of the net proceeds from our IPO, partially offset by interest expense attributable to the Bullet, Mesca, GNTS, and Alpha acquisitions.
Loss on Early Extinguishment of Debt
In connection with the reduction of our outstanding indebtedness as a result of our IPO and our entering into a new credit agreement, we incurred a one-time loss on early extinguishment of debt of $15.9 million in 2010. This charge consisted of (i) $10.6 million of prepayment penalties, (ii) the payment of $2.6 million of unaccreted discount on our junior subordinated notes, (iii) the non-cash write-off of $2.2 million of deferred debt issuance costs, and (iv) the payment of legal and other miscellaneous fees of $0.5 million.
Income Tax
Income tax provision was $2.1 million in 2010 compared to $0.3 million in 2009. The effective tax rate was 37.0% in 2010 compared to 107.3% in 2009. The effective income tax rate varies from the federal statutory rate of 34.0% primarily due to state and Canadian income taxes as well as the impact of items causing permanent differences.
Net Income (Loss) Available to Common Stockholders
Net income available to common stockholders was $2.8 million in 2010 compared to a net loss of $2.0 million in 2009. Net income available to common stockholders during 2010 was impacted by $0.8 million of accretion of Series B preferred stock dividends compared to an impact of $2.0 million in 2009. Upon completion of our IPO, our shares of Series B preferred stock were converted into shares of our common stock and such accretion was eliminated as of the date of conversion.
Liquidity and Capital Resources
Historically, our primary sources of cash have been cash flows from operations, borrowings under our revolving credit facility, sale of securities, and equity contributions. Our primary cash needs are to fund normal working capital requirements, finance capital expenditures, and repay our indebtedness. As of December 31, 2011, we had $3.3 million in cash and cash equivalents, $93.2 million of availability under our credit facility, and $39.5 million in net working capital. As we continue to execute on our acquisition strategy, additional financing may be necessary within the next 12 months.
27
Although we can provide no assurances, amounts available under our credit facility, net cash provided by operating activities, and available cash and cash equivalents should be adequate to finance working capital and planned capital expenditures for at least the next 12 months. Thereafter, we may find it necessary to obtain additional equity or debt financing as we continue to execute our business strategy.
Our credit facility consists of a $140.0 million term loan, a revolving credit facility up to a maximum aggregate amount of $100.0 million, of which up to $10.0 million may be used for Swing Line Loans (as defined in our credit agreement) and up to $15.0 million may be used for letters of credit. The credit facility matures on August 31, 2016.
Advances under our credit facility bear interest at either (a) the Eurocurrency Rate (as defined in the credit agreement), plus an applicable margin in the range of 2.5% to 4.0%, or (b) the Base Rate (as defined in our credit agreement), plus an applicable margin in the range of 2.5% to 3.5%.
Our credit agreement requires us to meet financial tests, including a minimum fixed charge coverage ratio and a maximum cash flow leverage ratio. In addition, our credit agreement contains negative covenants limiting, among other things, additional indebtedness, capital expenditures, transactions with affiliates, additional liens, sales of assets, dividends, investments and advances, prepayments of debt, mergers and acquisitions, and other matters customarily restricted in such agreements. Our credit agreement also contains customary events of default, including payment defaults, breaches of representations and warranties, covenant defaults, events of bankruptcy and insolvency, failure of any guaranty or security document supporting the credit agreement to be in full force and effect, and a change of control of our business. As of December 31, 2011, we were in compliance with all debt covenants.
Cash Flows
A summary of operating, investing, and financing activities are shown in the following table (in thousands):
| 2011 | 2010 | 2009 | ||||||||||
| Net cash provided by (used in): |
||||||||||||
| Operating activities |
$ | 33,164 | $ | 2,110 | $ | 778 | ||||||
| Investing activities |
(140,530 | ) | (1,080 | ) | (34,216 | ) | ||||||
| Financing activities |
109,685 | (2,210 | ) | 34,214 | ||||||||
|
|
|
|
|
|
|
|||||||
| Net change in cash and cash equivalents |
$ | 2,319 | $ | (1,180 | ) | $ | 776 | |||||
|
|
|
|
|
|
|
|||||||
Cash Flows from Operating Activities
Cash provided by operating activities primarily consists of net income adjusted for certain non-cash items, including depreciation and amortization, deferred interest, share-based compensation, provision for bad debts, deferred taxes and the effect of changes in working capital and other activities.
The difference between our $25.9 million 2011 net income and the $33.2 million cash provided by operating activities during 2011 was primarily attributable to a $14.6 million increase in our accounts receivable, a $5.5 million increase in prepaid expenses and other assets, partially offset by a $8.4 million increase in accounts payable, a $2.4 million decrease in accrued expenses and other liabilities, and a variety of non-cash charges, including $14.5 million of deferred income taxes and $5.6 million of depreciation and amortization.
Cash Flows from Investing Activities
Cash used in investing activities was $140.5 million during 2011, which primarily reflects $131.3 million used for business acquisitions and $10.1 million of capital expenditures used to support our operations and the proceeds from the sale of equipment of $0.9 million.
Cash Flows from Financing Activities
Cash provided by financing activities was $109.7 million during 2011, which primarily reflects net borrowings of $116.0 million under our credit facility, proceeds from the issuance of common stock of $0.9 million, payments of debt issuance costs of $4.2 million, payments of contingent earnouts of $2.6 million, and payments of $0.4 million for capital leases.
28
Quarterly Results of Operations
The following table presents unaudited consolidated statement of operations data for each of the eight quarters in the period ended December 31, 2011. We believe that all necessary adjustments have been included to fairly present the quarterly information when read in conjunction with our annual consolidated financial statements and related notes. The operating results for any quarter are not necessarily indicative of the results for any subsequent quarter.
| First | Second | Third | Fourth | |||||||||||||
| Quarter | Quarter | Quarter | Quarter | |||||||||||||
| (In thousands, except per share data) | ||||||||||||||||
| Year Ended December 31, 2011: |
||||||||||||||||
| Total revenues |
$ | 171,158 | $ | 208,271 | $ | 226,193 | $ | 238,005 | ||||||||
| Net revenues (total revenues less purchased transportation costs) |
40,791 | 51,873 | 60,672 | 69,948 | ||||||||||||
| Income before income taxes |
7,096 | 11,986 | 11,572 | 11,146 | ||||||||||||
| Net income available to common stockholders |
4,400 | 7,431 | 7,175 | 6,865 | ||||||||||||
| Earnings per share: |
||||||||||||||||
| Basic |
$ | 0.15 | $ | 0.25 | $ | 0.23 | $ | 0.22 | ||||||||
| Diluted |
0.14 | 0.24 | 0.23 | 0.22 | ||||||||||||
| Year ended December 31, 2010:(1) |
||||||||||||||||
| Total revenues |
$ | 142,762 | $ | 159,770 | $ | 163,690 | $ | 165,796 | ||||||||
| Net revenues (total revenues less purchased transportation costs) |
32,095 | 35,334 | 35,061 | 35,483 | ||||||||||||
| Income (loss) before income taxes |
2,488 | (10,581 | ) | 7,375 | 6,417 | |||||||||||
| Net income (loss) available to common stockholders |
942 | (6,377 | ) | 4,384 | 3,877 | |||||||||||
| Earnings (loss) per share: |
||||||||||||||||
| Basic |
$ | 0.05 | $ | (0.25 | ) | $ | 0.15 | $ | 0.13 | |||||||
| Diluted |
0.05 | (0.25 | ) | 0.14 | 0.12 | |||||||||||
| (1) | On February 29, 2008, our controlling stockholder acquired all the outstanding capital stock of GTS. On May 18, 2010, we acquired GTS by way of merger simultaneous with the consummation of our IPO. As such, because we were under common control with GTS as of February 29, 2008, the consolidated statements of operations, consolidated balance sheet, and other data for the periods presented include the results of GTS from February 29, 2008. |
Contractual Obligations and Commercial Commitments
The following table sets forth a summary of our material contractual obligations and commercial commitments as of December 31, 2011 (in thousands):
| Payments Due by Period | ||||||||||||||||||||
| Less Than | More Than | |||||||||||||||||||
| Total | 1 Year | 1-3 Years | 3-5 Years | 5 Years | ||||||||||||||||
| Long-term debt |
$ | 136,500 | $ | 14,000 | $ | 28,000 | $ | 94,500 | $ | — | ||||||||||
| Interest expense |
23,332 | 5,892 | 9,898 | 7,542 | — | |||||||||||||||
| Capital leases |
2,710 | 460 | 576 | 578 | 1,096 | |||||||||||||||
| Operating leases |
94,803 | 15,815 | 27,138 | 23,225 | 28,625 | |||||||||||||||
| Preferred stock subject to mandatory redemption |
5,142 | 5,142 | — | — | — | |||||||||||||||
|
|
|
|
|
|
|
|
|
|
|
|||||||||||
| Total |
$ | 262,487 | $ | 41,309 | $ | 65,612 | $ | 125,845 | $ | 29,721 | ||||||||||
|
|
|
|
|
|
|
|
|
|
|
|||||||||||
29
Off-Balance Sheet Arrangements
We do not have any transactions, arrangements, or other relationships with unconsolidated entities that are reasonably likely to materially affect our financial condition, changes in financial condition, revenues or expenses, results of operations, liquidity, or capital resources. We have no special purpose or limited purpose entities that provide off-balance sheet financing, liquidity, or market or credit risk support; engage in leasing, hedging, or research and development services; or have other relationships that expose us to liability that is not reflected in the financial statements. However, as of December 31, 2011, we had outstanding letters of credit totaling $6.8 million.
Seasonality
Our operations are subject to seasonal trends that have been common in the North American over-the-road freight sector for many years. Our results of operations for the quarter ending in March are on average lower than the quarters ending in June, September, and December. Typically, this pattern has been the result of factors such as inclement weather, national holidays, customer demand, and economic conditions. In 2011, however, the impact of seasonality was less apparent than previous years due to our organic growth and acquisitions.
Effects of Inflation
Based on our analysis of the periods presented, we believe that inflation has not had a material effect on our operating results as inflationary increases in fuel and labor costs have generally been offset through fuel surcharges and price increases.
| ITEM 7A. | QUANTITATIVE AND QUALITATIVE DISCLOSURES ABOUT MARKET RISK |
Commodity Risk
In our LTL, TL, and TMS businesses, our primary market risk centers on fluctuations in fuel prices, which can affect our profitability. Diesel fuel prices fluctuate significantly due to economic, political, and other factors beyond our control. Our ICs and purchased power providers pass along the cost of diesel fuel to us, and we in turn attempt to pass along some or all of these costs to our customers through fuel surcharge revenue programs. There can be no assurance that our fuel surcharge revenue programs will be effective in the future. Market pressures may limit our ability to pass along our fuel surcharges.
Interest Rate Risk
We have exposure to changes in interest rates on our revolving credit facility. The interest rate on our revolving credit facility fluctuates based on the prime rate or LIBOR plus an applicable margin. Assuming our $100.0 million revolving credit facility was fully drawn, a 1.0% increase in the borrowing rate would increase our annual interest expense by $1.0 million. We do not use derivative financial instruments for speculative trading purposes and are not engaged in any interest rate swap agreements.
| ITEM 8. | FINANCIAL STATEMENTS AND SUPPLEMENTARY DATA |
Reference is made to the financial statements, the reports of our independent registered public accounting firm, and the notes thereto commencing at page F-1 of this report, which financial statements, reports, and notes are incorporated herein by reference. For the Quarterly Results of Operations, see Item 7. “Management’s Discussion and Analysis of Financial Condition and Results of Operations.”
| ITEM 9. | CHANGES IN AND DISAGREEMENTS WITH ACCOUNTANTS ON ACCOUNTING AND FINANCIAL DISCLOSURE |
Not applicable.
| ITEM 9A. | CONTROLS AND PROCEDURES |
Evaluation of Disclosure Controls and Procedures
Our management, with the participation of our Chief Executive Officer and Chief Financial Officer, conducted an evaluation of the effectiveness of the design and operation of our disclosure controls and procedures (as defined in Rules 13a-15(e) and 15d-15(e) under the Exchange Act). Based on this evaluation, our Chief Executive Officer and Chief Financial Officer concluded that, as of December 31, 2011, our disclosure controls and procedures were effective to ensure that information required to be disclosed by us in the reports we file or submit under the Exchange Act is (i) recorded, processed, summarized, and reported within the time periods specified in the SEC rules and forms, and (ii) is accumulated and communicated to our management, including our Chief Executive Officer and Chief Financial Officer, as appropriate to allow timely decisions regarding required disclosure.
30
Management’s Report on Internal Control Over Financial Reporting
Our management is responsible for establishing and maintaining adequate internal control over financial reporting (as defined in Rule 13a-15(f) under the Exchange Act) to provide reasonable assurance regarding the reliability of our financial reporting and the preparation of financial statements for external purposes in accordance with generally accepted accounting principles.
Due to its inherent limitations, internal control over financial reporting may not prevent or detect misstatements. Also, projections of any evaluation of effectiveness to future periods are subject to the risk that controls may become inadequate due to changes in conditions, or that the degree of compliance with the policies or procedures may deteriorate.
Under the supervision and with the participation of our management, including our Chief Executive Officer and Chief Financial Officer, we conducted an evaluation of the effectiveness of our internal control over financial reporting using the criteria set forth by the Committee of Sponsoring Organizations of the Treadway Commission in Internal Control—Integrated Framework. As allowed by the SEC guidance, management excluded from its assessment the following subsidiaries which were all acquired in 2011: Morgan Southern, Inc., which constituted 6.3% and 1.2% of total assets and net assets, respectively, as of December 31, 2011 and 7.5% and 12.6% of revenues and net income, respectively, for the year then ended; Bruenger Trucking Company, which constituted 3.7% and 0.5% of total assets and net assets, respectively, as of December 31, 2011 and 1.8% and 5.3% of revenues and net income, respectively, for the year then ended; James Brooks Company, Inc. and C.A.L. Transport, Inc., collectively James Brooks, which constituted 0% of total assets and net assets as of December 31, 2011 and 0.4% and 0.7% of revenues and net income, respectively, for the year then ended; and Prime Logistics Corporation, which constituted 21.0% and 1.1% of total assets and net assets, respectively, as of December 31, 2011 and 3.5% and 12.4% of revenues and net income, respectively, for the year then ended. Based on our evaluation, our management concluded that our internal control over financial reporting was effective as of December 31, 2011.
Deloitte & Touche, LLP, an independent registered public accounting firm, has audited the Consolidated Financial Statements included in this Annual Report on Form 10-K and, as part of its audit, has issued an attestation report, included herein, on the effectiveness of our internal control over financial reporting.
Changes in Internal Control Over Financial Reporting
There was no change in our internal control over financial reporting during our most recent fiscal quarter that has materially affected, or is reasonably likely to materially affect, our internal control over financial reporting.
Inherent Limitations on Effectiveness of Controls
Our management, including our Chief Executive Officer and Chief Financial Officer, does not expect that our disclosure controls and procedures or our internal controls over financial reporting will prevent all error and all fraud. A control system, no matter how well conceived and operated, can provide only reasonable, not absolute, assurance that the objectives of the control system are met. Further, the design of a control system must reflect the fact that there are resource constraints, and the benefits of controls must be considered relative to their costs. Because of the inherent limitations in all control systems, no evaluation of controls can provide absolute assurance that all control issues, misstatements, errors, and instances of fraud, if any, within our company have been or will be prevented or detected. These inherent limitations include the realities that judgments in decision-making can be faulty and that breakdowns can occur because of simple error or mistake. Controls also can be circumvented by the individual acts of some persons, by collusion of two or more people, or by management override of the controls. The design of any system of controls is based in part on certain assumptions about the likelihood of future events, and there can be no assurance that any design will succeed in achieving its stated goals under all potential future conditions. Projections of any evaluation of controls effectiveness to future periods are subject to risks. Over time, internal controls may become inadequate as a result of changes in conditions, or through the deterioration of the degree of compliance with policies or procedures.
| ITEM 9B. | OTHER INFORMATION |
Not applicable
31
| ITEM 10. | DIRECTORS, EXECUTIVE OFFICERS, AND CORPORATE GOVERNANCE |
The information required by this Item relating to our directors and corporate governance is incorporated herein by reference to the definitive Proxy Statement to be filed pursuant to Regulation 14A of the Exchange Act for our 2012 Annual Meeting of Stockholders. The information required by this Item relating to our executive officers is included under the caption “Executive Officers” within Item 1.
| ITEM 11. | EXECUTIVE COMPENSATION |
The information required by this Item is incorporated herein by reference to the definitive Proxy Statement to be filed pursuant to Regulation 14A of the Exchange Act for our 2012 Annual Meeting of Stockholders.
| ITEM 12. | SECURITY OWNERSHIP OF CERTAIN BENEFICIAL OWNERS AND MANAGEMENT AND RELATED STOCKHOLDER MATTERS |
The information required by this Item is incorporated herein by reference to the definitive Proxy Statement to be filed pursuant to Regulation 14A of the Exchange Act for our 2012 Annual Meeting of Stockholders.
| ITEM 13. | CERTAIN RELATIONSHIPS AND RELATED TRANSACTIONS, AND DIRECTOR INDEPENDENCE |
The information required by this Item is incorporated herein by reference to the definitive Proxy Statement to be filed pursuant to Regulation 14A of the Exchange Act for our 2012 Annual Meeting of Stockholders.
32
| ITEM 14. | PRINCIPAL ACCOUNTANT FEES AND SERVICES |
The information required by this Item is incorporated herein by reference to the definitive Proxy Statement to be filed pursuant to Regulation 14A of the Exchange Act for our 2012 Annual Meeting of Stockholders.
| ITEM 15. | EXHIBITS AND FINANCIAL STATEMENT SCHEDULES |
(a) Financial Statements and Financial Statement Schedules
(1) Financial Statements are listed in the Index to Consolidated Financial Statements on page F-1 of this report.
(2) Other schedules are omitted because they are not applicable, not required, or because required information is included in the consolidated financial statements or notes thereto.
(b) Exhibits
| Exhibit Number |
Exhibit | |
| 3.1 | Amended and Restated Certificate of Incorporation(1) | |
| 3.2 | Second Amended and Restated Bylaws(1) | |
| 4.1 | Second Amended and Restated Stockholders’ Agreement, dated as of March 14, 2007, by and among the Registrant and the stockholders named therein(2) | |
| 4.19 | Form of Indenture(5) | |
| 10.10 | Employment Letter Agreement, by and between the Registrant and Mark A. DiBlasi(3) | |
| 10.11 | Employment Letter Agreement, by and between the Registrant and Peter R. Armbruster(3) | |
| 10.12 | Employment Letter Agreement, by and between the Registrant and Brian J. van Helden(4) | |
| 10.13 | Employment Letter Agreement, by and between the Registrant and Scott L. Dobak(4) | |
| 10.14 | 2010 Incentive Compensation Plan(1) | |
| 10.15 | Form of Indemnification Agreement(1) | |
| 10.16 | Agreement and Plan of Merger, dated as of May 7, 2010, by and among the Registrant; GTS Transportation Logistics, Inc.; and Group Transportation Services Holdings, Inc.(1) | |
| 10.17 | Amended and Restated Advisory Agreement, dated September 12, 2011, by and between the Registrant and HCI Equity Management, L.P.(9) | |
| 10.20 | Form of Restricted Stock Unit Agreement(6) | |
| 10.21 | Agreement and Plan of Merger, dated as of August 23, 2011, by and among the Registrant; Prime Acquisition Corp., Prime Logistics Corp., and the other parties named therein(7) | |
| 10.22 | Second Amended and Restated Credit Agreement, dated August 31, 2011, among the Registrant, U.S. Bank National Association, a national banking association, the Lenders (as defined therein) and the other parties thereto(8) | |
| 21.1 | List of Subsidiaries | |
| 23.1 | Consent of Independent Registered Public Accounting Firm | |
| 31.1 | Certification of Chief Executive Officer pursuant to Exchange Act Rules 13a-14(a) and 15d-14(a) | |
| 31.2 | Certification of Chief Financial Officer pursuant to Exchange Act Rules 13a-14(a) and 15d-14(a) | |
| 32.1 | Section 1350 Certification of Chief Executive Officer | |
| 32.2 | Section 1350 Certification of Chief Financial Officer | |
| 101.INS* | XBRL Instance Document(10) | |
| 101.SCH* | XBRL Taxonomy Extension Schema Document(10) | |
| 101.CAL* | XBRL Taxonomy Extension Calculation Linkbase Document(10) | |
| 101.LAB* | XBRL Taxonomy Extension Label Linkbase Document(10) | |
| 101.PRE* | XBRL Taxonomy Extension Presentation Linkbase Document(10) | |
| (1) | Incorporated by reference to the registrant’s registration statement on Form S-1 (Registration No. 333-152504) as filed with the SEC on May 7, 2010. |
| (2) | Incorporated by reference to the registrant’s registration statement on Form S-1 (Registration No. 333-152504) as filed with the SEC on September 11, 2008. |
| (3) | Incorporated by reference to the registrant’s registration statement on Form S-1 (Registration No. 333-152504) as filed with the SEC on March 4, 2010. |
| (4) | Incorporated by reference to the registrant’s registration statement on Form S-1 (Registration No. 333-152504) as filed with the SEC on April 5, 2010. |
| (5) | Incorporated by reference to the registrant’s registration statement on Form S-3 (Registration No. 333-176225) as filed with the SEC on August 10, 2011. |
| (6) | Incorporated by reference to the registrant’s Current Report on Form 8-K as filed with the SEC on March 7, 2011. |
| (7) | Incorporated by reference to the registrant’s Current Report on Form 8-K as filed with the SEC on August 26, 2011. |
| (8) | Incorporated by reference to the registrant’s Current Report on Form 8-K as filed with the SEC on September 6, 2011. |
| (9) | Incorporated by reference to the registrant’s Quarterly Report on Form 10-Q as filed with the SEC on November 14, 2011. |
| (10) | Filed herewith |
| * | Pursuant to Rule 406 of Regulation S-T, these interactive date files are deemed not filed or part of a registration statement or prospectus for purposes of Sections 11 or 12 of the Securities Act of 1933, as amended, are deemed not filed for purposes of Section 18 of the Exchange Act and otherwise not subject to liability under those sections. |
33
SIGNATURES
Pursuant to the requirements of Section 13 or 15(d) of the Securities Exchange Act of 1934, the registrant has duly caused this report to be signed on its behalf by the undersigned, thereunto duly authorized.
| ROADRUNNER TRANSPORTATION SYSTEMS, INC. | ||||||
| By: | /s/ Mark A. DiBlasi | |||||
| Mark A. DiBlasi | ||||||
| President and Chief Executive Officer | ||||||
Date: March 15, 2012
Pursuant to the requirements of the Securities Exchange Act of 1934, this report has been signed below by the following persons on behalf of the registrant and in the capacities and on the dates indicated.
| Signature | Title |
Date | ||
| /s/ Mark A. DiBlasi |
President, Chief Executive Officer |
March 15, 2012 | ||
| Mark A. DiBlasi |
(Principal Executive Officer) , and Director |
|||
| /s/ Peter R. Armbruster |
Vice President — Finance, Chief Financial Officer, |
March 15, 2012 | ||
| Peter R. Armbruster |
Treasurer, and Secretary (Principal Financial Officer and Principal Accounting Officer) |
|||
| /s/ Scott D. Rued |
Chairman of the Board |
March 15, 2012 | ||
| Scott D. Rued |
||||
| /s/ Christopher L. Doerr |
Director |
March 15, 2012 | ||
| Christopher L. Doerr |
||||
| /s/ Ivor J. Evans |
Director |
March 15, 2012 | ||
| Ivor J. Evans |
||||
| /s/ Mark R. Holden |
Director |
March 15, 2012 | ||
| Mark R. Holden |
||||
| /s/ James D. Staley |
Director |
March 15, 2012 | ||
| James D. Staley |
||||
| /s/ William S. Urkiel |
Director |
March 15, 2012 | ||
| William S. Urkiel |
||||
| /s/ Chad M. Utrup |
Director |
March 15, 2012 | ||
| Chad M. Utrup |
||||
| /s/ Judith A. Vijums |
Director |
March 15, 2012 | ||
| Judith A. Vijums |
||||
34
INDEX TO FINANCIAL STATEMENTS
ROADRUNNER TRANSPORTATION SYSTEMS, INC.
AND SUBSIDIARIES
| F-2 | ||||
| F-5 | ||||
| F-6 | ||||
| F-7 | ||||
| F-8 | ||||
| F-9 | ||||
F-1
REPORT OF INDEPENDENT REGISTERED PUBLIC ACCOUNTING FIRM
To the Board of Directors and Stockholders of
Roadrunner Transportation Systems, Inc. and subsidiaries
Cudahy, Wisconsin
We have audited the accompanying consolidated balance sheets of Roadrunner Transportation Systems, Inc. and subsidiaries (the “Company”) as of December 31, 2011 and 2010, and the related consolidated statements of operations, stockholders' investment, and cash flows for each of the three years in the period ended December 31, 2011. These financial statements are the responsibility of the Company's management. Our responsibility is to express an opinion on these financial statements based on our audits.
We conducted our audits in accordance with the standards of the Public Company Accounting Oversight Board (United States). Those standards require that we plan and perform the audit to obtain reasonable assurance about whether the financial statements are free of material misstatement. An audit includes examining, on a test basis, evidence supporting the amounts and disclosures in the financial statements. An audit also includes assessing the accounting principles used and significant estimates made by management, as well as evaluating the overall financial statement presentation. We believe that our audits provide a reasonable basis for our opinion.
In our opinion, such consolidated financial statements present fairly, in all material respects, the financial position of Roadrunner Transportation Systems, Inc. and subsidiaries as of December 31, 2011 and 2010, and the results of their operations and their cash flows for each of the three years in the period ended December 31, 2011, in conformity with accounting principles generally accepted in the United States of America.
We have also audited, in accordance with the standards of the Public Company Accounting Oversight Board (United States), the Company's internal control over financial reporting as of December 31, 2011 based on the criteria established in Internal Control—Integrated Framework issued by the Committee of Sponsoring Organizations of the Treadway Commission and our report dated March 14, 2012 expressed an unqualified opinion on the Company's internal control over financial reporting.
/s/ DELOITTE & TOUCHE LLP
Minneapolis, Minnesota
March 15, 2012
F-2
Report of Independent Registered Public Accounting Firm on Internal Control Over Financial Reporting
To the Board of Directors and Stockholders of
Roadrunner Transportation Systems, Inc. and subsidiaries
Cudahy, Wisconsin
We have audited the internal control over financial reporting of Roadrunner Transportation Systems, Inc. and subsidiaries (the “Company”) as of December 31, 2011, based on criteria established in Internal Control — Integrated Framework issued by the Committee of Sponsoring Organizations of the Treadway Commission. As described in Management’s Report on Internal Control Over Financial Reporting, management excluded from its assessment the internal control over financial reporting at the following subsidiaries which were acquired in 2011: Morgan Southern, Inc., which constituted 6.3% and 1.2% of total assets and net assets, respectively, as of December 31, 2011 and 7.5% and 12.6% of revenues and net income, respectively, for the year then ended; Bruenger Trucking Company, which constituted 3.7% and 0.5% of total assets and net assets, respectively, as of December 31, 2011 and 1.8% and 5.3% of revenues and net income, respectively, for the year then ended; James Brooks Company, Inc. and C.A.L. Transport, Inc., collectively James Brooks, which constituted 0.4% and 0.7% of revenues and net income, respectively, for the year ended December 31, 2011; and Prime Logistics Corporation, which constituted 21% and 1.1% of total assets and net assets, respectively, as of December 31, 2011 and 3.5% and 12.4% of revenues and net income, respectively, for the year then ended. Accordingly, our audit did not include the internal control over financial reporting at these entities. The Company's management is responsible for maintaining effective internal control over financial reporting and for its assessment of the effectiveness of internal control over financial reporting included in the accompanying Management’s Report on Internal Control Over Financial Reporting. Our responsibility is to express an opinion on the Company's internal control over financial reporting based on our audit.
We conducted our audit in accordance with the standards of the Public Company Accounting Oversight Board (United States). Those standards require that we plan and perform the audit to obtain reasonable assurance about whether effective internal control over financial reporting was maintained in all material respects. Our audit included obtaining an understanding of internal control over financial reporting, assessing the risk that a material weakness exists, testing and evaluating the design and operating effectiveness of internal control based on the assessed risk, and performing such other procedures as we considered necessary in the circumstances. We believe that our audit provides a reasonable basis for our opinion.
A company’s internal control over financial reporting is a process designed by, or under the supervision of, the company's principal executive and principal financial officers, or persons performing similar functions, and effected by the company's board of directors, management, and other personnel to provide reasonable assurance regarding the reliability of financial reporting and the preparation of financial statements for external purposes in accordance with generally accepted accounting principles. A company's internal control over financial reporting includes those policies and procedures that (1) pertain to the maintenance of records that, in reasonable detail, accurately and fairly reflect the transactions and dispositions of the assets of the company; (2) provide reasonable assurance that transactions are recorded as necessary to permit preparation of financial statements in accordance with generally accepted accounting principles, and that receipts and expenditures of the company are being made only in accordance with authorizations of management and directors of the company; and (3) provide reasonable assurance regarding prevention or timely detection of unauthorized acquisition, use, or disposition of the company's assets that could have a material effect on the financial statements.
Because of the inherent limitations of internal control over financial reporting, including the possibility of collusion or improper management override of controls, material misstatements due to error or fraud may not be prevented or detected on a timely basis. Also, projections of any evaluation of the effectiveness of the internal control over financial reporting to future periods are subject to the risk that the controls may become inadequate because of changes in conditions, or that the degree of compliance with the policies or procedures may deteriorate.
In our opinion, the Company maintained, in all material respects, effective internal control over financial reporting as of December 31, 2011, based on the criteria established in Internal Control — Integrated Framework issued by the Committee of Sponsoring Organizations of the Treadway Commission.
F-3
We have also audited, in accordance with the standards of the Public Company Accounting Oversight Board (United States), the consolidated financial statements as of and for the year ended December 31, 2011 of the Company and our report dated March 14, 2012 expressed an unqualified opinion on those financial statements.
/s/ DELOITTE & TOUCHE LLP
Minneapolis, Minnesota
March 15, 2012
F-4
ROADRUNNER TRANSPORTATION SYSTEMS, INC.
| December 31, | ||||||||
| 2011 | 2010 | |||||||
| (In thousands) | ||||||||
| ASSETS | ||||||||
| CURRENT ASSETS: |
||||||||
| Cash and cash equivalents |
$ | 3,315 | $ | 996 | ||||
| Accounts receivable, net |
102,358 | 73,222 | ||||||
| Deferred income taxes |
9,472 | 6,367 | ||||||
| Prepaid expenses and other current assets |
16,400 | 10,414 | ||||||
|
|
|
|
|
|||||
| Total current assets |
131,545 | 90,999 | ||||||
|
|
|
|
|
|||||
| PROPERTY AND EQUIPMENT, NET |
28,447 | 6,894 | ||||||
| OTHER ASSETS: |
||||||||
| Goodwill |
364,347 | 246,888 | ||||||
| Intangible assets, net |
10,381 | 1,224 | ||||||
| Other noncurrent assets |
8,633 | 2,292 | ||||||
|
|
|
|
|
|||||
| Total other assets |
383,361 | 250,404 | ||||||
|
|
|
|
|
|||||
| TOTAL ASSETS |
$ | 543,353 | $ | 348,297 | ||||
|
|
|
|
|
|||||
| LIABILITIES AND STOCKHOLDERS’ INVESTMENT | ||||||||
| CURRENT LIABILITIES: |
||||||||
| Current maturities of long-term debt |
$ | 14,000 | $ | — | ||||
| Accounts payable |
50,245 | 37,241 | ||||||
| Accrued expenses and other liabilities |
19,480 | 11,375 | ||||||
| Preferred stock subject to mandatory redemption |
5,000 | — | ||||||
|
|
|
|
|
|||||
| Total current liabilities |
88,725 | 48,616 | ||||||
| LONG-TERM DEBT, net of current maturities |
122,500 | 20,500 | ||||||
| OTHER LONG-TERM LIABILITIES |
36,175 | 8,492 | ||||||
| PREFERRED STOCK SUBJECT TO MANDATORY REDEMPTION |
— | 5,000 | ||||||
|
|
|
|
|
|||||
| Total liabilities |
247,400 | 82,608 | ||||||
|
|
|
|
|
|||||
| COMMITMENTS AND CONTINGENCIES (NOTE 12) |
||||||||
| STOCKHOLDERS’ INVESTMENT: |
||||||||
| Common stock $.01 par value; 100,000 shares authorized; 30,707 and 30,147 shares issued and outstanding |
307 | 301 | ||||||
| Additional paid-in capital |
266,475 | 262,088 | ||||||
| Retained earnings |
29,171 | 3,300 | ||||||
|
|
|
|
|
|||||
| Total stockholders’ investment |
295,953 | 265,689 | ||||||
|
|
|
|
|
|||||
| TOTAL LIABILITIES AND STOCKHOLDERS’ INVESTMENT |
$ | 543,353 | $ | 348,297 | ||||
|
|
|
|
|
|||||
See accompanying notes to consolidated financial statements.
F-5
ROADRUNNER TRANSPORTATION SYSTEMS, INC.
CONSOLIDATED STATEMENTS OF OPERATIONS
| Year Ended December 31, | ||||||||||||
| 2011 | 2010 | 2009 | ||||||||||
| (In thousands, except per share amounts) | ||||||||||||
| Revenues |
$ | 843,627 | $ | 632,018 | $ | 483,322 | ||||||
| Operating expenses: |
||||||||||||
| Purchased transportation costs |
620,343 | 494,045 | 378,858 | |||||||||
| Personnel and related benefits |
87,178 | 61,853 | 52,621 | |||||||||
| Other operating expenses |
83,625 | 41,168 | 33,988 | |||||||||
| Depreciation and amortization |
4,978 | 3,114 | 2,967 | |||||||||
| Acquisition transaction expenses |
1,368 | 569 | 1,148 | |||||||||
| Restructuring and IPO related expenses |
— | 1,500 | — | |||||||||
|
|
|
|
|
|
|
|||||||
| Total operating expenses |
797,492 | 602,249 | 469,582 | |||||||||
|
|
|
|
|
|
|
|||||||
| Operating income |
46,135 | 29,769 | 13,740 | |||||||||
| Interest expense: |
||||||||||||
| Interest on long-term debt |
4,135 | 7,954 | 13,226 | |||||||||
| Dividends on preferred stock subject to mandatory redemption |
200 | 200 | 200 | |||||||||
|
|
|
|
|
|
|
|||||||
| Total interest expense |
4,335 | 8,154 | 13,426 | |||||||||
| Loss on early extinguishment of debt |
— | 15,916 | — | |||||||||
|
|
|
|
|
|
|
|||||||
| Income before provision for income taxes |
41,800 | 5,699 | 314 | |||||||||
| Provision for income taxes |
15,929 | 2,108 | 337 | |||||||||
|
|
|
|
|
|
|
|||||||
| Net income (loss) |
25,871 | 3,591 | (23 | ) | ||||||||
| Accretion of Series B preferred stock |
— | 765 | 1,950 | |||||||||
|
|
|
|
|
|
|
|||||||
| Net income (loss) available to common stockholders |
$ | 25,871 | $ | 2,826 | $ | (1,973 | ) | |||||
|
|
|
|
|
|
|
|||||||
| Earnings (loss) per share available to common stockholders: |
||||||||||||
| Basic |
$ | 0.85 | $ | 0.11 | $ | (0.11 | ) | |||||
|
|
|
|
|
|
|
|||||||
| Diluted |
$ | 0.82 | $ | 0.11 | $ | (0.11 | ) | |||||
|
|
|
|
|
|
|
|||||||
| Weighted average common stock outstanding: |
||||||||||||
| Basic |
30,432 | 25,779 | 17,656 | |||||||||
|
|
|
|
|
|
|
|||||||
| Diluted |
31,545 | 26,777 | 17,656 | |||||||||
|
|
|
|
|
|
|
|||||||
See accompanying notes to consolidated financial statements.
F-6
ROADRUNNER TRANSPORTATION SYSTEMS, INC.
CONSOLIDATED STATEMENTS OF STOCKHOLDERS’ INVESTMENT
| Series B Convertible | Additional | Retained | Total | |||||||||||||||||||||||||||||||||||||||||
| Preferred Stock | Common Stock | Class A Common Stock | Class B Common Stock | Paid-In | Earnings | Stockholders’ | ||||||||||||||||||||||||||||||||||||||
| Shares | Amount | Shares | Amount | Shares | Amount | Shares | Amount | Capital | (Deficit) | Investment | ||||||||||||||||||||||||||||||||||
| (In thousands, except per share amounts) | ||||||||||||||||||||||||||||||||||||||||||||
| BALANCE, January 1, 2009 |
1,791,768 | $ | 12,000 | 2,358,932 | $ | 24 | 14,567,522 | $ | 147 | 282,502 | $ | 3 | $ | 118,081 | $ | (268 | ) | $ | 129,987 | |||||||||||||||||||||||||
|
|
|
|
|
|
|
|
|
|
|
|
|
|
|
|
|
|
|
|
|
|
|
|||||||||||||||||||||||
| Accretion of Series B preferred stock (15% per annum) |
1,950 | (1,950 | ) | — | ||||||||||||||||||||||||||||||||||||||||
| Issuance of Common Stock |
732,645 | 7 | 5,158 | 5,165 | ||||||||||||||||||||||||||||||||||||||||
| Issuance of warrants |
3,000 | 3,000 | ||||||||||||||||||||||||||||||||||||||||||
| Share-based compensation |
714 | 714 | ||||||||||||||||||||||||||||||||||||||||||
| Forgiveness of payable to affiliates |
800 | 800 | ||||||||||||||||||||||||||||||||||||||||||
| Net loss |
(23 | ) | (23 | ) | ||||||||||||||||||||||||||||||||||||||||
|
|
|
|
|
|
|
|
|
|
|
|
|
|
|
|
|
|
|
|
|
|
|
|||||||||||||||||||||||
| BALANCE, December 31, 2009 |
1,791,768 | $ | 13,950 | 3,091,577 | $ | 31 | 14,567,522 | $ | 147 | 282,502 | $ | 3 | $ | 125,803 | $ | (291 | ) | $ | 139,643 | |||||||||||||||||||||||||
|
|
|
|
|
|
|
|
|
|
|
|
|
|
|
|
|
|
|
|
|
|
|
|||||||||||||||||||||||
| Accretion of Series B preferred stock (15% per annum) |
765 | (765 | ) | — | ||||||||||||||||||||||||||||||||||||||||
| Issuance of Common Stock |
10,002,707 | 98 | 121,875 | 121,973 | ||||||||||||||||||||||||||||||||||||||||
| Conversion of Series B Convertible Preferred Stock to Common Stock |
(1,791,768 | ) | (14,715 | ) | 2,202,497 | 22 | 14,693 | — | ||||||||||||||||||||||||||||||||||||
| Conversion of Class A Common Stock to Common Stock |
14,567,522 | 147 | (14,567,522 | ) | (147 | ) | — | |||||||||||||||||||||||||||||||||||||
| Conversion of Class B Common Stock to Common Stock |
282,502 | 3 | (282,502 | ) | (3 | ) | — | |||||||||||||||||||||||||||||||||||||
| Share-based compensation |
482 | 482 | ||||||||||||||||||||||||||||||||||||||||||
| Net income |
3,591 | 3,591 | ||||||||||||||||||||||||||||||||||||||||||
|
|
|
|
|
|
|
|
|
|
|
|
|
|
|
|
|
|
|
|
|
|
|
|||||||||||||||||||||||
| BALANCE, December 31, 2010 |
— | $ | — | 30,146,805 | $ | 301 | — | $ | — | — | $ | — | $ | 262,088 | $ | 3,300 | $ | 265,689 | ||||||||||||||||||||||||||
|
|
|
|
|
|
|
|
|
|
|
|
|
|
|
|
|
|
|
|
|
|
|
|||||||||||||||||||||||
| Issuance of Common Stock |
560,976 | 6 | 3,863 | 3,869 | ||||||||||||||||||||||||||||||||||||||||
| Share-based compensation |
524 | 524 | ||||||||||||||||||||||||||||||||||||||||||
| Net income |
25,871 | 25,871 | ||||||||||||||||||||||||||||||||||||||||||
|
|
|
|
|
|
|
|
|
|
|
|
|
|
|
|
|
|
|
|
|
|
|
|||||||||||||||||||||||
| BALANCE, December 31, 2011 |
— | $ | — | 30,707,781 | $ | 307 | — | $ | — | — | $ | — | $ | 266,475 | $ | 29,171 | $ | 295,953 | ||||||||||||||||||||||||||
|
|
|
|
|
|
|
|
|
|
|
|
|
|
|
|
|
|
|
|
|
|
|
|||||||||||||||||||||||
See accompanying notes to consolidated financial statements.
F-7
ROADRUNNER TRANSPORTATION SYSTEMS, INC.
CONSOLIDATED STATEMENTS OF CASH FLOWS
| Year Ended December 31, | ||||||||||||
| 2011 | 2010 | 2009 | ||||||||||
| (In thousands) | ||||||||||||
| CASH FLOWS FROM OPERATING ACTIVITIES: |
||||||||||||
| Net income (loss) |
$ | 25,871 | $ | 3,591 | $ | (23 | ) | |||||
| Adjustments to reconcile net income (loss) to net cash provided by operating activities: |
||||||||||||
| Depreciation and amortization |
5,628 | 3,817 | 3,681 | |||||||||
| Gain on disposal of buildings and equipment |
(362 | ) | (207 | ) | (35 | ) | ||||||
| Loss on early extinguishment of debt |
— | 2,224 | — | |||||||||
| Deferred interest |
— | 2,728 | 2,771 | |||||||||
| Share-based compensation |
524 | 482 | 714 | |||||||||
| Provision for bad debts |
1,186 | 938 | 1,186 | |||||||||
| Deferred tax provision |
14,491 | (1,777 | ) | (80 | ) | |||||||
| Changes in (net of acquisitions): |
||||||||||||
| Accounts receivable |
(14,656 | ) | (15,967 | ) | (3,998 | ) | ||||||
| Prepaid expenses and other assets |
(5,521 | ) | (1,166 | ) | (1,305 | ) | ||||||
| Accounts payable |
8,356 | 5,659 | (669 | ) | ||||||||
| Accrued expenses and other liabilities |
(2,353 | ) | 1,788 | (1,464 | ) | |||||||
|
|
|
|
|
|
|
|||||||
| Net cash provided by operating activities |
33,164 | 2,110 | 778 | |||||||||
|
|
|
|
|
|
|
|||||||
| CASH FLOWS FROM INVESTING ACTIVITIES: |
||||||||||||
| Restricted cash |
— | 4,066 | 934 | |||||||||
| Acquisition of business, net of cash acquired |
(131,290 | ) | (2,910 | ) | (32,957 | ) | ||||||
| Capital expenditures |
(10,105 | ) | (2,500 | ) | (2,292 | ) | ||||||
| Proceeds from sale of buildings and equipment |
865 | 264 | 99 | |||||||||
|
|
|
|
|
|
|
|||||||
| Net cash used in investing activities |
(140,530 | ) | (1,080 | ) | (34,216 | ) | ||||||
|
|
|
|
|
|
|
|||||||
| CASH FLOWS FROM FINANCING ACTIVITIES: |
||||||||||||
| Borrowings under revolving credit facilities |
124,081 | 88,557 | 74,225 | |||||||||
| Payments under revolving credit facilities |
(144,581 | ) | (103,839 | ) | (66,865 | ) | ||||||
| Long-term debt borrowings |
140,000 | 1,184 | 29,000 | |||||||||
| Long-term debt payments |
(3,500 | ) | (107,213 | ) | (6,475 | ) | ||||||
| Debt issuance cost |
(4,183 | ) | (758 | ) | (825 | ) | ||||||
| Payments of contingent earnouts |
(2,553 | ) | — | — | ||||||||
| Proceeds from issuance of common stock (net of issuance costs) |
869 | 120,232 | 5,165 | |||||||||
| Reduction of capital lease obligation |
(448 | ) | (373 | ) | (11 | ) | ||||||
|
|
|
|
|
|
|
|||||||
| Net cash provided by (used in) financing activities |
109,685 | (2,210 | ) | 34,214 | ||||||||
|
|
|
|
|
|
|
|||||||
| NET INCREASE (DECREASE) IN CASH AND CASH EQUIVALENTS |
2,319 | (1,180 | ) | 776 | ||||||||
| CASH AND CASH EQUIVALENTS: |
||||||||||||
| Beginning of period |
996 | 2,176 | 1,400 | |||||||||
|
|
|
|
|
|
|
|||||||
| End of period |
$ | 3,315 | $ | 996 | $ | 2,176 | ||||||
|
|
|
|
|
|
|
|||||||
| SUPPLEMENTAL CASH FLOWS INFORMATION: |
||||||||||||
| Cash paid for interest |
$ | 3,517 | $ | 9,153 | $ | 10,972 | ||||||
| Cash paid for income taxes (net of refunds) |
$ | 1,127 | $ | 321 | $ | 470 | ||||||
| Noncash issuance of common stock for acquisition |
$ | 3,000 | $ | — | $ | — | ||||||
| Noncash Series B convertible preferred stock dividend |
$ | — | $ | 765 | $ | 1,950 | ||||||
| Noncash forgiveness of payable to affiliates |
$ | — | $ | — | $ | 800 | ||||||
| Noncash notes and warrants issued for acquisition of business (face amount) |
$ | — | $ | — | $ | 3,000 | ||||||
See accompanying notes to consolidated financial statements.
F-8
Roadrunner Transportation Systems, Inc. and Subsidiaries
Notes to Consolidated Financial Statements
1. Organization, Nature of Business and Significant Accounting Policies
Nature of Business
Roadrunner Transportation Systems, Inc. (the “Company”) is headquartered in Cudahy, Wisconsin and has three operating segments, less-than-truckload (“LTL”), truckload and logistics (“TL”) and transportation management solutions (“TMS”). Within its LTL business, the Company operates 20 LTL service centers throughout the United States, complemented by relationships with over 200 delivery agents. Within its TL business, the Company operates a network of 24 TL service centers, four consolidation/warehousing facilities, and 11 dispatch offices and is augmented by 76 independent brokerage agents. The Company operates its TMS business from three service centers throughout the United States. From pickup to delivery, the Company leverages relationships with a diverse group of third-party carriers to provide scalable capacity and reliable, customized service to customers in North America. The Company operates primarily in the United States.
On February 29, 2008, HCI Equity Partners III, L.P. (“HCI III”), through an indirect majority-owned subsidiary, GTS Acquisition Sub, Inc. (“GTS”), acquired all of the outstanding capital stock of Group Transportation Services, Inc. and all of the outstanding membership units of GTS Direct, LLC (the “Transaction”). HCI III is an affiliate of Thayer Equity Investors V, L.P., the controlling shareholder of the Company. GTS was formed on February 12, 2008 and there were no substantive operations from date of inception until the Transaction on February 29, 2008. On May 18, 2010, GTS merged with the Company (the “GTS Merger”).
Principles of Consolidation
The consolidated financial statements include the accounts of the Company and its subsidiaries. As of December 31, 2011, all subsidiaries were 100% owned. Transfers of net assets or exchanges of equity interests between entities under common control do not constitute business combinations. Because the Company and GTS had the same control group immediately before and after the GTS Merger, the GTS Merger has been accounted for as a combination of entities under common control on a historical cost basis in a manner similar to a pooling of interests. Accordingly, the accompanying consolidated financial statements include the results of operations of GTS for all periods presented. All intercompany balances and transactions have been eliminated in consolidation.
Use of Estimates
The preparation of financial statements in conformity with accounting principles generally accepted in the United States (“GAAP”) requires management to make estimates and assumptions that affect the reported amounts of assets and liabilities and disclosure of contingent assets and liabilities at the date of the financial statements and the reported amounts of revenue and expenses during the reporting period. Actual results could differ from those estimates.
Segment Reporting
The Company determines its operating segments based on the information utilized by the chief operating decision maker, the Company’s Chief Executive Officer, to allocate resources and assess performance. Based on this information, the Company has determined that it has three operating segments, which are also reportable segments: LTL, TL and TMS.
Cash and Cash Equivalents
Cash equivalents are defined as short-term investments that have an original maturity of three months or less at the date of purchase and are readily convertible into cash. The Company maintains cash in several banks and, at times, the balances may exceed federally insured limits. The Company does not believe it is exposed to any material credit risk on cash. As of December 31, 2011 and 2010, approximately $13.0 million and $12.3 million, respectively, of checks drawn in excess of book balances were classified as accounts payable in the accompanying consolidated balance sheets. Cash equivalents consist of overnight investments in an interest bearing sweep account.
Accounts Receivable
Accounts receivable represent trade receivables from customers and are stated net of an allowance for doubtful accounts and pricing allowances of approximately $1.5 million as of December 31, 2011 and 2010, respectively. Management estimates the portion of accounts receivable that will not be collected and accounts are written off when they are determined to be uncollectible. Accounts receivable are uncollateralized and are generally due 30 days from the invoice date.
F-9
Roadrunner Transportation Systems, Inc. and Subsidiaries
Notes to Consolidated Financial Statements — (Continued)
Valuation and Qualifying Accounts
The Company provides reserves for accounts receivable. The rollforward of the allowance for doubtful accounts is as follows (in thousands):
| Year Ended December 31, | ||||||||||||
| 2011 | 2010 | 2009 | ||||||||||
| Beginning balance |
$ | 1,524 | $ | 1,200 | $ | 899 | ||||||
| Acquisitions |
— | 14 | 79 | |||||||||
| Provision, charged to expense |
1,186 | 938 | 1,186 | |||||||||
| Write-offs, less recoveries |
(1,249 | ) | (628 | ) | (964 | ) | ||||||
|
|
|
|
|
|
|
|||||||
| Ending balance |
$ | 1,461 | $ | 1,524 | $ | 1,200 | ||||||
|
|
|
|
|
|
|
|||||||
Property and Equipment
Property and equipment are stated at cost. Maintenance and repair costs are charged to expense as incurred. For financial reporting purposes, depreciation is calculated using the straight-line method over the following estimated useful lives:
| Buildings and leasehold improvements |
5-15 years | |||
| Furniture and fixtures |
5 years | |||
| Equipment |
5-15 years |
Accelerated depreciation methods are used for tax reporting purposes.
Property and equipment and other long-lived assets are reviewed periodically for possible impairment. The Company evaluates whether current facts or circumstances indicate that the carrying value of the assets to be held and used may not be recoverable. If such circumstances are determined to exist, an estimate of undiscounted future cash flows produced by the long-lived asset, or the appropriate grouping of assets, is compared to the carrying value to determine whether impairment exists. If an asset is determined to be impaired, the loss is measured based on quoted market prices in active markets, if available. If quoted market prices are not available, the estimate of fair value is based on various valuation techniques, including discounted value of estimated future cash flows. The Company reports an asset to be disposed of at the lower of its carrying value or its estimated net realizable value.
Goodwill and Other Intangibles
Goodwill and other intangible assets result from business acquisitions. The Company accounts for business acquisitions by assigning the purchase price to tangible and intangible assets and liabilities. Assets acquired and liabilities assumed are recorded at their fair values and the excess of the purchase price over amounts assigned is recorded as goodwill.
Goodwill is tested for impairment at least annually on July 1st using a two-step process that begins with an estimation of the fair value at the “reporting unit” level. The Company has four reporting units as this is the lowest level for which discrete financial information is prepared and regularly reviewed by management. The impairment test for goodwill involves comparing the fair value of a reporting unit to its carrying amount, including goodwill. If the carrying amount of the reporting unit exceeds its fair value, a second step is required to measure the goodwill impairment loss. The second step includes hypothetically valuing all the tangible and intangible assets of the reporting unit as if the reporting unit had been acquired in a business combination. Then, the implied fair value of the reporting unit’s goodwill is compared to the carrying amount of that goodwill. If the carrying amount of the reporting unit’s goodwill exceeds the implied fair value of the goodwill, the Company recognizes an impairment loss in an amount equal to the excess, not to exceed the carrying amount. For purposes of the Company’s impairment test, the fair value of its reporting units are calculated based upon an average of an income fair value approach and market fair value approach. Based on these tests, the Company concluded that the fair value for all reporting units is substantially in excess of the respective reporting unit’s carrying value. Accordingly, no goodwill impairments were identified in 2011, 2010 or 2009.
Other intangible assets recorded consist of definite lived customer relationships. The Company evaluates its other intangible assets for impairment when current facts or circumstances indicate that the carrying value of the assets to be held and used may not be recoverable. No indicators of impairment were identified in 2011, 2010 or 2009. See Note 4 for additional information on our goodwill and intangible assets.
F-10
Roadrunner Transportation Systems, Inc. and Subsidiaries
Notes to Consolidated Financial Statements — (Continued)
Debt Issue Costs
Debt issue costs represent costs incurred in connection with the financing agreements described in Note 6. The debt issue costs aggregate to $4.5 million and $0.8 million at December 31, 2011 and 2010, respectively, and have been classified in the consolidated balance sheets as other noncurrent assets. Such costs are being amortized over the expected maturity of the financing agreements using the effective interest rate method.
Stock-Based Compensation
The Company’s share based payment awards are comprised of stock options and restricted stock units. Cost for the Company’s stock options and restricted stock units is measured at fair value and is recognized over the vesting period of the award.
Income Taxes
Deferred income tax assets and liabilities are computed annually for differences between the financial statement and tax bases of assets and liabilities that will result in taxable or deductible amounts in the future based on enacted tax laws and rates applicable to the periods in which the differences are expected to affect taxable income. The provision (benefit) for income taxes is the tax payable or refundable for the period plus or minus the change during the period in deferred tax assets and liabilities.
Fair Value of Financial Instruments
Fair values of cash, accounts receivable, and accounts payable approximate cost. The estimated fair value of long-term debt has been determined using market information and valuation methodologies, primarily discounted cash flow analysis. These estimates require considerable judgment in interpreting market data, and changes in assumptions or estimation methods could significantly affect the fair value estimates. The estimated fair value of the senior debt approximates its carrying value at December 31, 2011 and 2010, respectively.
Revenue Recognition
LTL revenue is recorded when all of the following have occurred: an agreement of sale exists; pricing is fixed or determinable; and collection of revenue is reasonably assured. The Company uses a percentage of completion method to recognize revenue as the various stages of the sales transaction are completed.
TL revenue is recorded when all of the following have occurred: an agreement of sale exists; pricing is fixed or determinable; delivery has occurred; and the Company’s obligation to fulfill a transaction is complete and collection of revenue is reasonably assured. This occurs when the Company completes the delivery of a shipment or the service has been fulfilled.
TMS revenue is recorded when the shipment has been delivered by a third-party carrier. Fee for services revenue is recognized when the services have been rendered. At the time of delivery or rendering of services, as applicable, the Company’s obligation to fulfill a transaction is complete and collection of revenue is reasonably assured. The Company offers volume discounts to certain customers. Revenue is reduced as discounts are earned.
The Company typically recognizes revenue on a gross basis, as opposed to a net basis, because it bears the risks and benefits associated with revenue-generated activities by, among other things, (1) acting as a principal in the transaction, (2) establishing prices, (3) managing all aspects of the shipping process and (4) taking the risk of loss for collection, delivery and returns. Certain TMS transactions to provide specific services are recorded at the net amount charged to the client due to the following factors: (A) the Company does not have latitude in establishing pricing and (B) the Company does not bear the risk of loss for delivery and returns; these items are the risk of the carrier.
Insurance
The Company uses a combination of purchased insurance and self-insurance programs to provide for the cost of vehicle liability, cargo damage and workers’ compensation claims. The portion of self-insurance accruals which is included in accrued expenses and other liabilities relates primarily to vehicle liability and cargo damage claims. The Company periodically evaluates the level of insurance coverage and adjusts insurance levels based on risk tolerance and premium expense.
F-11
Roadrunner Transportation Systems, Inc. and Subsidiaries
Notes to Consolidated Financial Statements — (Continued)
The measurement and classification of self-insured costs requires the consideration of historical cost experience, demographic and severity factors, and judgments about the current and expected levels of cost per claim and retention levels. These methods provide estimates of the liability associated with claims incurred as of the balance sheet date, including claims not reported. The Company believes these methods are appropriate for measuring these highly judgmental self-insurance accruals. However, the use of any estimation method is sensitive to the assumptions and factors described above, based on the magnitude of claims and the length of time from incurrence of the claims to ultimate settlement. Accordingly, changes in these assumptions and factors can materially affect actual costs paid to settle the claims and those amounts may be different than estimates.
2. Acquisitions
On September 15, 2009, through GTS, the Company acquired all of the outstanding membership interests of Mesca Freight Services, LLC (Mesca) for purposes of expanding its current market presence and service offerings in the TMS segment. Mesca operates as an asset-light, third-party logistics provider in Maine. Total consideration was $9.1 million, including $1.8 million of cash acquired. A working capital adjustment in the amount of $0.1 million was paid by GTS in 2010. The acquisition price and related financing fees of approximately $0.1 million were financed with proceeds from the issuance of common stock by GTS of $4.2 million and borrowings under a credit facility of $4.4 million. GTS incurred $0.6 million of transaction expenses related to this acquisition.
In addition to cash paid at closing, the Mesca purchase agreement called for contingent consideration in the form of an earnout. The former owners of Mesca were entitled to receive a payment equal to the amount by which Mesca’s earnings before income taxes, depreciation and amortization, as defined in the purchase agreement, exceeded $1.6 million for the years ending December 31, 2010 and 2011. Approximately $2.4 million was included in TMS goodwill related the to the earnout. The Company paid $3.1 million as of December 31, 2011 related to the earnout and has no further commitments due under the Mesca purchase agreement.
On December 7, 2009, through GTS, the Company acquired all of the outstanding stock of Great Northern Transportation Services, Inc. (GNTS) for purposes of expanding its current market presence and service offerings in the TMS segment. GNTS is an agent of Mesca and operates in New Hampshire. Total consideration was $1.7 million, including $0.2 million of cash acquired. The acquisition price was financed with proceeds from the issuance of common stock by GTS of $0.9 million and borrowings under a credit facility of $0.9 million. GTS incurred $0.2 million of transaction expenses related to this acquisition.
In addition to cash paid at closing, the GNTS purchase agreement called for contingent consideration in the form of an earnout. The former owner of GNTS is entitled to receive a payment equal to the amount by which GNTS’ earnings before income taxes, depreciation and amortization, as defined in the purchase agreement, exceeds $0.6 million for the years ending December 31, 2010 and 2011. Approximately $0.2 million has been included in TMS goodwill related to the earnout. The Company paid $0.1 million as of December 31, 2011 related to the earnout.
On December 11, 2009, the Company acquired certain assets of Bullet Freight Systems, Inc. (Bullet) for purposes of expanding its market presence and service offerings in the LTL segment. Total consideration was $27.2 million. The acquisition price and related financing fees of approximately $1.1 million were financed with borrowings under credit facilities of $8.8 million and the issuance of $19.5 million face value of junior subordinated notes, including $3.0 million issued to the selling shareholders. In conjunction with the issuance of the junior subordinated notes, the Company issued warrants with a fair value of $3.0 million. The Company incurred $0.5 million of transaction expenses related to this acquisition.
On February 12, 2010, through GTS, the Company acquired all the outstanding stock of Alpha Freight Systems, Inc. (Alpha) for purposes of expanding its current market presence and service offerings in the TMS segment. Total consideration was $2.0 million, including $0.1 million of cash acquired. The acquisition price was financed with proceeds from the issuance of common stock by GTS of $1.0 million and borrowings under a credit facility of $1.2 million. GTS incurred $0.3 million of transaction expenses related to this acquisition.
On February 4, 2011, the Company acquired all the outstanding stock of Morgan Southern Inc. (Morgan Southern) for the purpose of expanding its current market presence and service offerings in the TL segment. Total consideration paid was $19.4 million after a working capital adjustment. The acquisition price was financed with borrowings under the Company’s credit facility discussed in Note 6. The Company incurred $0.3 million of transaction expenses related to this acquisition.
F-12
Roadrunner Transportation Systems, Inc. and Subsidiaries
Notes to Consolidated Financial Statements — (Continued)
On June 1, 2011, the Company acquired all the outstanding stock of Bruenger Trucking Company (Bruenger) for the purpose of expanding its current market presence in the TL segment. Total consideration paid was $10.6 million after a working capital adjustment. The acquisition price was financed with borrowings under the Company’s amended and restated credit facility discussed in Note 6. The Company incurred $0.1 million of transaction expenses related to this acquisition.
The Bruenger purchase agreement calls for contingent consideration in the form of an earnout capped at $3.0 million. The former owners of Bruenger are entitled to receive a payment equal to the amount by which Bruenger’s annual operating income, as defined in the purchase agreement, exceeds $1.1 million for the six months ending December 31, 2011 and $2.1 million for the years ending December 31, 2012, 2013 and 2014. Approximately $2.6 million has been included in TL goodwill related to the earnout.
On August 1, 2011, the Company acquired all the outstanding stock of James Brooks Company, Inc. and C.A.L, Transport, Inc. (collectively, James Brooks), for the purpose of expanding its market presence in the TL segment. Total consideration paid was $7.6 million. The acquisition price was financed with borrowings under the Company’s amended and restated credit facility discussed in Note 6. The Company incurred $0.1 million of transaction expenses related to this acquisition.
On August 31, 2011, the Company acquired all the outstanding stock of Prime Logistics Corporation (Prime) for the purpose of expanding its current market presence in the TL segment. Total consideration paid was $96.8 million after a working capital adjustment. The acquisition price was financed with $3.0 million of the Company’s stock and the remainder was financed with borrowings under the Company’s amended and restated credit facility discussed in Note 6. The Company incurred $0.5 million of transaction expenses related to this acquisition.
The following is a summary of the allocation of the purchase price paid to the fair value of the net assets for our acquisitions since January 1, 2009 (in thousands):
| Morgan | ||||||||||||||||||||||||||||||||
| Southern | Bruenger | James Brooks | Prime Distribution | |||||||||||||||||||||||||||||
| Mesca | GNTS | Bullet | Alpha | (Preliminary) | (Preliminary) | (Preliminary) | (Preliminary) | |||||||||||||||||||||||||
| Accounts receivable |
$ | 1,895 | $ | 706 | $ | 3,940 | $ | 519 | $ | 4,854 | $ | 1,948 | $ | 777 | $ | 8,149 | ||||||||||||||||
| Other current assets |
69 | — | — | 8 | 842 | 718 | 36 | 496 | ||||||||||||||||||||||||
| Property and equipment |
170 | — | 170 | 25 | 1,041 | 11,234 | 319 | 3,996 | ||||||||||||||||||||||||
| Goodwill |
8,986 | 1,643 | 26,068 | 1,869 | 15,019 | 4,182 | 7,334 | 90,924 | ||||||||||||||||||||||||
| Customer relationship intangible assets |
246 | — | 800 | — | 500 | — | — | 9,400 | ||||||||||||||||||||||||
| Other noncurrent assets |
1 | 1 | 46 | — | 356 | 300 | 161 | 100 | ||||||||||||||||||||||||
| Accounts payable and other liabilities |
(4,010 | ) | (819 | ) | (3,819 | ) | (511 | ) | (3,256 | ) | (7,772 | ) | (1,065 | ) | (16,303 | ) | ||||||||||||||||
|
|
|
|
|
|
|
|
|
|
|
|
|
|
|
|
|
|||||||||||||||||
| Total |
$ | 7,357 | $ | 1,531 | $ | 27,205 | $ | 1,910 | $ | 19,356 | $ | 10,610 | $ | 7,562 | $ | 96,762 | ||||||||||||||||
|
|
|
|
|
|
|
|
|
|
|
|
|
|
|
|
|
|||||||||||||||||
The goodwill for each acquisition is a result of acquiring and retaining their existing workforces and expected synergies from integrating their operations into the Company. The goodwill from the Mesca and Alpha acquisitions will be deductible for tax purposes while the remaining goodwill will not be deductible for tax purposes. Purchase accounting is considered preliminary for the indicated Companies with respect to deferred taxes, certain accruals for liabilities, and goodwill as final information was not available as of December 31, 2011. The changes from the previous recorded opening balances relate primarily to fair value measurement changes in customer relationship intangible assets and changes in acquired deferred tax assets and liabilities.
On an unaudited pro forma basis, assuming the Bullet acquisition had closed on January 1, 2009, Bullet would have contributed revenues to the Company of $48.0 million for the period ended December 10, 2009. The impact of Bullet to the Company’s net income during these periods would not have been material. Morgan Southern contributed to the Company $63.3 million of revenues and $2 million of net income since the acquisition on February 4, 2011. On an unaudited pro forma basis, assuming the Morgan Southern acquisition had closed January 1, 2010, Morgan Southern would have contributed revenue to the Company of $58.0 million for the year ended December 31, 2010, and $4.7 million for the period from January 1, 2011 to February 3, 2011. The impact of Morgan Southern to the Company’s net income would not be material. Prime contributed to the Company $29.9 million of revenues and $1.4 million of net income since the acquisition on August 31, 2011. On an unaudited pro forma basis, assuming the Prime acquisition had closed January 1, 2010, Prime would have contributed revenue to the Company of $67.5 million for the year ended December 31, 2010, and $50.5 million for the period from January 1, 2011 to August 30, 2011 and this would have positively impacted net income by $2.0 million and $3.0 million during those same periods. The Company’s results of operations were not materially impacted by the acquisitions of MESCA, GNTS, Alpha, Bruenger or James Brooks, individually or in aggregate. The results of operations and financial condition of these acquisitions have been included in our consolidated financial statements since their acquisition dates
F-13
Roadrunner Transportation Systems, Inc. and Subsidiaries
Notes to Consolidated Financial Statements — (Continued)
3. Property and Equipment
Property and equipment consisted of the following at December 31 (in thousands):
| 2011 | 2010 | |||||||
| Land and improvements |
$ | 232 | $ | 47 | ||||
| Building and leasehold improvements |
4,363 | 2,439 | ||||||
| Furniture and fixtures |
9,363 | 5,742 | ||||||
| Equipment |
27,792 | 8,031 | ||||||
|
|
|
|
|
|||||
| Gross property and equipment |
41,750 | 16,259 | ||||||
| Less: Accumulated depreciation |
(13,303 | ) | (9,365 | ) | ||||
|
|
|
|
|
|||||
| Property and equipment, net |
$ | 28,447 | $ | 6,894 | ||||
|
|
|
|
|
|||||
Depreciation expense for the years ended December 31, 2011, 2010 and 2009 was $4.2 million, $2.5 million and $2.5 million, respectively.
Capital Leases
The Company has a building and certain equipment classified as capital leases. The recorded value of the building and the equipment is included in property and equipment, net as of December 31 as follows (in thousands):
| 2011 | 2010 | |||||||
| Building and equipment |
$ | 2,241 | $ | 2,099 | ||||
| Less: Accumulated amortization |
(942 | ) | (620 | ) | ||||
|
|
|
|
|
|||||
| Total |
$ | 1,299 | $ | 1,479 | ||||
|
|
|
|
|
|||||
The following is a schedule of future minimum lease payments under the capital leases with the present value of the net minimum lease payments as of December 31, 2011 (in thousands):
| Amount | ||||
| Year Ending: |
||||
| 2012 |
$ | 460 | ||
| 2013 |
293 | |||
| 2014 |
283 | |||
| 2015 |
285 | |||
| 2016 |
293 | |||
| Thereafter |
1,096 | |||
|
|
|
|||
| Total minimum lease payments |
2,710 | |||
| Less: amount representing interest |
(1,345 | ) | ||
|
|
|
|||
| Present value of net minimum lease payments(1) |
$ | 1,365 | ||
|
|
|
|||
| (1) | Reflected in the consolidated balance sheets as current other liabilities and other long-term liabilities of $0.3 million and $1.1 million, respectively. |
4. Goodwill and Intangible Assets
Goodwill represents the excess of the purchase price of all acquisitions over the estimated fair value of the net assets acquired. The Company completes an impairment test of goodwill annually. This impairment test did not result in any impairment losses. There is no goodwill impairment for any of the periods presented in our financial statements.
F-14
Roadrunner Transportation Systems, Inc. and Subsidiaries
Notes to Consolidated Financial Statements — (Continued)
The following is a rollforward of goodwill from December 31, 2009 to December 31, 2011 by reportable segment (in thousands):
| LTL | TL | TMS | Total | |||||||||||||
| Goodwill balance as of December 31, 2009 |
$ | 185,058 | $ | 25,776 | $ | 33,837 | $ | 244,671 | ||||||||
| Acquisition of Alpha |
— | — | 1,869 | 1,869 | ||||||||||||
| Adjustment to the Bullet acquisition |
348 | — | — | 348 | ||||||||||||
|
|
|
|
|
|
|
|
|
|||||||||
| Goodwill balance as of December 31, 2010 |
185,406 | 25,776 | 35,706 | 246,888 | ||||||||||||
| Acquisition of Morgan Southern |
— | 15,019 | — | 15,019 | ||||||||||||
| Acquisition of Bruenger |
— | 4,182 | — | 4,182 | ||||||||||||
| Acquisition of James Brooks |
— | 7,334 | — | 7,334 | ||||||||||||
| Acquisition of Prime |
— | 90,924 | — | 90,924 | ||||||||||||
|
|
|
|
|
|
|
|
|
|||||||||
| Goodwill balance as of December 31, 2011 |
$ | 185,406 | $ | 143,235 | $ | 35,706 | $ | 364,347 | ||||||||
|
|
|
|
|
|
|
|
|
|||||||||
Intangible assets consist of customer relationships acquired from business acquisitions. Intangible assets at December 31, 2011 and 2010 are as follows (in thousands):
| 2011 | 2010 | |||||||||||||||||||||||
| Gross | Net | Gross | Net | |||||||||||||||||||||
| Carrying | Accumulated | Carrying | Carrying | Accumulated | Carrying | |||||||||||||||||||
| Amount | Amortization | Value | Amount | Amortization | Value | |||||||||||||||||||
| TL |
$ | 11,700 | $ | 2,005 | $ | 9,695 | $ | 1,800 | $ | 1,530 | $ | 270 | ||||||||||||
| LTL |
800 | 320 | 480 | 800 | 160 | 640 | ||||||||||||||||||
| TMS |
546 | 340 | 206 | 546 | 232 | 314 | ||||||||||||||||||
|
|
|
|
|
|
|
|
|
|
|
|
|
|||||||||||||
| Total customer relationships |
$ | 13,046 | $ | 2,665 | $ | 10,381 | $ | 3,146 | $ | 1,922 | $ | 1,224 | ||||||||||||
|
|
|
|
|
|
|
|
|
|
|
|
|
|||||||||||||
The customer relationships intangible assets are amortized over their five-year to ten-year useful lives. Amortization expense for the years ended December 31, 2011, 2010 and 2009 was $0.7 million, $0.6 million and $0.4 million respectively. Estimated amortization expense for each of the next five years based on the intangible assets at December 31, 2011, is as follows (in thousands):
| Amount | ||||
| 2012 |
$ | 1,557 | ||
| 2013 |
1,508 | |||
| 2014 |
1,485 | |||
| 2015 |
1,288 | |||
| 2016 |
1,196 | |||
| Therafter |
3,347 | |||
|
|
|
|||
| Total |
$ | 10,381 | ||
|
|
|
|||
5. Fair Value Measurement
Accounting guidance on fair value measurements for certain financial assets and liabilities requires that assets and liabilities carried at fair value be classified and disclosed in one of the following three categories:
Level 1 — Quoted market prices in active markets for identical assets or liabilities.
Level 2 — Observable market-based inputs or unobservable inputs that are corroborated by market data.
Level 3 — Unobservable inputs reflecting the reporting entity’s own assumptions or external inputs from inactive markets.
A financial asset or liability’s classification within the hierarchy is determined based on the lowest level of input that is significant to the fair value measurement.
F-15
Roadrunner Transportation Systems, Inc. and Subsidiaries
Notes to Consolidated Financial Statements — (Continued)
The following table presents information, as of December 31, 2011 and 2010, about the Company’s financial liabilities, the contingent purchase price related to acquisitions that are measured at fair value on a recurring basis, according to the valuation techniques the Company used to determine their fair values (in thousands):
| December 31, 2010 | ||||||||||||
| Level 1 | Level 2 | Level 3 | ||||||||||
| Contingent purchase price related to acquisitions |
$ | — | $ | — | $ | 2,977 | ||||||
|
|
|
|
|
|
|
|||||||
| Total liabilities at fair value |
$ | — | $ | — | $ | 2,977 | ||||||
|
|
|
|
|
|
|
|||||||
| December 31, 2011 | ||||||||||||
| Level 1 | Level 2 | Level 3 | ||||||||||
| Contingent purchase price related to acquisitions |
$ | — | $ | — | $ | 3,015 | ||||||
|
|
|
|
|
|
|
|||||||
| Total liabilities at fair value |
$ | — | $ | — | $ | 3,015 | ||||||
|
|
|
|
|
|
|
|||||||
In measuring the fair value of the contingent payment liability, the Company used an income approach that considers the expected future earnings of the acquired businesses and the resulting contingent payments, discounted at a risk-adjusted rate.
The table below sets forth a reconciliation of the Company’s beginning and ending Level 3 financial liability balance year ended December 31, 2011 (in thousands):
| Balance as of December 31, 2009 |
$ | 2,705 | ||
| Adjustment to contingent purchase obligation |
272 | |||
|
|
|
|||
| Balance as of December 31, 2010 |
2,977 | |||
| Acquisition of Bruenger |
2,581 | |||
| Payment of contingent purchase obligations for TMS |
(3,212 | ) | ||
| Adjustment to contingent purchase obligation |
669 | |||
|
|
|
|||
| Balance as of December 31, 2011 |
$ | 3,015 | ||
|
|
|
6. Long-Term Debt and Interest Rate Caps
Long-Term Debt
Long-term debt consisted of the following at December 31 (in thousands):
| 2011 | 2010 | |||||||
| Senior debt: |
||||||||
| Revolving credit facility |
$ | — | $ | 20,500 | ||||
| Term loans |
136,500 | — | ||||||
|
|
|
|
|
|||||
| Total debt |
136,500 | 20,500 | ||||||
| Less: Current maturities |
(14,000 | ) | — | |||||
|
|
|
|
|
|||||
| Total long-term debt, net of current maturities |
$ | 122,500 | $ | 20,500 | ||||
|
|
|
|
|
|||||
In connection with the Company’s initial public offering (IPO), the Company entered into a credit agreement on May 18, 2010 with U.S. Bank National Association (U.S. Bank). The credit agreement included a $55 million revolving credit facility. On May 31, 2011, in connection with the Company’s acquisition of Bruenger, the Company entered into an amended and restated credit agreement with U.S. Bank and the other lenders, which maintained the $55 million revolving credit facility and also included a $30.0 million term loan. On August 31, 2011, in connection with the Company’s acquisition of Prime, the Company entered into a second amended and restated credit agreement with U.S. Bank and other lenders, which increased the revolving credit facility to $100.0 million and the term loan to $140.0 million. The credit facility matures in 2016. Principal on the term loan is due in quarterly installments of $3.5 million per quarter until 2016. The second amended and restated credit agreement is collateralized by all assets of the Company and the revolving credit facility is subject to a borrowing base equal to 85% of the Company’s eligible receivables. The second amended and restated credit agreement contains certain financial covenants, including a minimum fixed charge coverage ratio and a maximum cash flow leverage ratio. As of December 31, 2011, the Company was in compliance with all covenants contained in the credit agreement. Borrowings under the credit agreement bear interest at either (a) the Eurocurrency Rate (as defined in the credit agreement), plus an applicable margin in the range of 3.0% to 4.5%, or (b) the Base Rate (as defined in the credit agreement), plus an applicable margin in the range of 2.5% to 3.5%. The revolving credit facility also provides for the issuance of up to $15.0 million in letters of credit. As of December 31, 2011, the Company had outstanding letters of credit totaling $6.8 million. Total availability under the revolving credit facility was $93.2 million as of December 31, 2011. At December 31, 2011, the average interest rate on the credit agreement was 4.3%.
F-16
Roadrunner Transportation Systems, Inc. and Subsidiaries
Notes to Consolidated Financial Statements — (Continued)
7. Stockholders’ Investment
Common Stock
On May 7, 2010, the Company effected a 149.314-for-one stock split of all outstanding shares of its Class A common stock, Class B common stock, Series B preferred stock and related warrants. The consolidated financial statements were retrospectively restated to reflect this stock split. In addition, in connection with the IPO all shares of common stock, Class A common stock, Class B common stock and Series B preferred stock were converted into a single class of new common stock. The Company’s preferred stock subject to mandatory redemption were not included in the stock split.
Common stock has voting rights — one vote for each share of common stock. Class A common stock had voting rights and Class B common stock did not have voting rights. All classes of common stock participate equally in earnings and dividends. All common stock is subject to a Shareholders’ Agreement which includes restrictions on transferability and “piggyback” registration rights. Such agreement provides that if, at any time after an initial public offering, the Company files a registration statement under the Securities Act of 1933, as amended, for any underwritten sale of shares of any of the Company’s equity securities, the stockholders may request that the Company include in such registration the shares of common stock held by them on the same terms and conditions as the securities otherwise being sold in such registration.
In addition to piggyback registration rights discussed above, certain of the Company’s stockholders have demand registration rights. In March 2007, the Company entered into a second amended and restated stockholders’ agreement, pursuant to which certain of the Company’s stockholders were granted Form S-3 registration rights. The second amended and restated stockholders’ agreement provides that, any time after the Company is eligible to register its common stock on a Form S-3 registration statement under the Securities Act, certain of the Company’s stockholders may request registration under the Securities Act of all or any portion of their shares of common stock. These stockholders are limited to a total of two of such registrations. In addition, if the Company proposes to file a registration statement under the Securities Act for any underwritten sale of shares of any of its securities, stockholders party to the second amended and restated stockholders’ agreement may request that the Company include in such registration the shares of common stock held by them on the same terms and conditions as the securities otherwise being sold in such registration.
The Shareholder’s Agreement defines certain circumstances, including a change in control, whereby all stockholders are obligated to sell their common stock on the same terms as Thayer Equity Investors V, L.P., the majority shareholder of the Company and an affiliate of HCI Equity Management L.P. (HCI).
Warrants to Acquire Common Stock
In connection with a business combination entered in 2007, the Company issued to existing Sargent Transportation Group, Inc. stockholders warrants to acquire 2,269,263 shares of Class A common stock at an exercise price of $13.39 per share. The warrants are exercisable at the option of the holder any time prior to March 13, 2017.
On December 11, 2009, in connection with financing of the Bullet acquisition, the Company issued warrants to acquire 1,746,971 shares of Class A common stock at an exercise price of $8.37 per share. The warrants are exercisable at the option of the holder any time prior to December 11, 2017. The $3.0 million fair value of the warrants at the date of issuance has been reflected as a component of additional paid-in capital in stockholders’ investment in the accompanying consolidated balance sheets. Certain holders exercised 268,765 and 554,328 warrants during the years ended December 31, 2010 and 2011, respectively.
F-17
Roadrunner Transportation Systems, Inc. and Subsidiaries
Notes to Consolidated Financial Statements — (Continued)
8. Preferred Stock
Series A Redeemable Preferred Stock
In March 2007, the Company issued and had outstanding 5,000 shares of non-voting Series A Preferred Stock (Series A Preferred Stock), which are mandatorily redeemable by the Company at $1,000 per share, in cash, on November 30, 2012. The Series A Preferred Stock receives cash dividends annually on April 30 at an annual rate equal to $40 per share, and if such dividends are not paid when due, such annual dividend rate shall increase to $60 per share and continue to accrue without interest until such delinquent payments are made. At December 31, 2011 and December 31, 2010, $142,000 is recorded as a current liability, respectively. The holders of the Series A Preferred Stock are restricted from transferring such shares and the Company has a first refusal right and may elect to repurchase the shares prior to the mandatory November 30, 2012 redemption. Upon liquidation and certain transactions treated as liquidations, as defined in the Company’s Certificate of Incorporation, the Series A Preferred Stock has liquidation preferences over the Company’s common stock. The number of issued and outstanding shares of Series A Preferred Stock, the $1,000 per share repurchase price, and the annual cash dividends are all subject to equitable adjustment whenever there is a stock split, stock dividend, combination, recapitalization, reclassification or other similar event. As long as there is Series A Preferred Stock outstanding, no dividends may be declared or paid on common stock of the Company.
9. Stock-Based Compensation
In 2010, the Company adopted its 2010 Incentive Compensation Plan (the “2010 Plan”), which allows for the issuance of 2,500,000 shares of common stock. The 2010 Plan provides for the grant of stock options, restricted stock units and other awards to our employees and directors.
During 2011, the Company granted 78,787 restricted stock units that vest ratably over a four year service period. Compensation expense for restricted stock units is based on fair market value at the grant date. Restricted stock units are amortized on a straight-line basis over the vesting period. As of December 31, 2011, there were approximately 75,922 restricted stock units outstanding, of which none were vested.
The Company previously maintained a Key Employee Equity Plan (“Equity Plan”), a stock-based compensation plan that permitted the grant of stock options to Company employees and directors. Stock options under the Equity Plan were granted with an exercise price equal to or in excess of the fair value of the Company’s stock on the date of grant. Such options vest ratably over a two or four year service period and are exercisable ten years from the date of grant, but only to the extent vested as specified in each option agreement.
GTS previously maintained a Key Employee Equity Plan (“GTS Plan”), which permitted the grant of stock options to employees and directors. Stock options under the GTS Plan were granted with an exercise price equal to or in excess of the fair value of the GTS’ stock on the date of grant. Such options vest ratably over a two or four year service period and are exercisable ten years from the date of grant, but only to the extent vested as specified in each option agreement. In connection with the Company’s merger with GTS effective upon the IPO, all options granted pursuant to the GTS Plan outstanding at the effective time of the merger became options to purchase shares of the Company’s common stock.
No options were granted by GTS or by the Company in 2011. Stock-based compensation expense was $0.5 million, $0.5 million, and $0.7 million for the years ended December 31, 2011, 2010, and 2009, respectively. The related estimated income tax benefit recognized in the accompanying consolidated statements of operations, net of estimated forfeitures, was $0.2 million, $0.2 million and $0.4 million, respectively.
F-18
Roadrunner Transportation Systems, Inc. and Subsidiaries
Notes to Consolidated Financial Statements — (Continued)
The Company uses the Black-Scholes valuation model to value the grants. Prior to the Company’s IPO, one input in the Black Scholes model, fair value of grant date stock price, was determined using a discounted cash flow method because the Company’s stock was privately held at the time the options were granted; thus, it was not practical to determine the Company’s share price volatility. Accordingly, the Company used the historical share price volatility of publicly traded companies within the transportation and logistics sector as a surrogate for the expected volatility of the Company’s stock. The Company currently plans to retain any earnings to finance the growth of its business rather than to pay cash dividends. As such, a zero dividend yield has been assumed in the Company’s Black-Scholes valuation model. The expected life of the options represents the expected time that the options granted will remain outstanding. The risk-free rate used to calculate each option valuation is based on the U.S. Treasury rate at the time of option grants for a note with similar lifespan. The specific assumptions used to determine the weighted average fair value of stock options granted were as follows:
| Year Ended December 31, | ||||||||||
| 2011 | 2010 | 2009 | ||||||||
| Risk free interest rate |
— | — | 2.6% – 3.1% | |||||||
| Dividend yield |
— | — | — | |||||||
| Expected volatility |
— | — | 36.5% – 42.2% | |||||||
| Expected life (years) |
— | — | 6 | |||||||
| Weighted average fair value of stock options granted |
— | — | $1.64 | |||||||
A summary of the option activity under the equity plans for the year ended December 31, 2011, 2010 and 2009, respectively, is as follows:
| Shares | Weighted Average Exercise Price |
Weighted Average Remaining Contractual Term (Years) |
Aggregate Intrinsic Value |
|||||||||||||
| (In thousands) | ||||||||||||||||
| Outstanding at December 31, 2008 |
1,906,518 | $ | 10.84 | 7.6 | $ | — | ||||||||||
|
|
|
|
|
|
|
|
|
|||||||||
| Granted |
159,767 | 12.36 | ||||||||||||||
| Exercised |
— | — | ||||||||||||||
| Forfeited |
(7,466 | ) | 6.70 | |||||||||||||
|
|
|
|
|
|
|
|
|
|||||||||
| Outstanding at December 31, 2009 |
2,058,819 | $ | 10.98 | 6.8 | $ | — | ||||||||||
|
|
|
|
|
|
|
|
|
|||||||||
| Granted |
— | — | ||||||||||||||
| Exercised |
(90,834 | ) | 7.08 | |||||||||||||
| Forfeited |
(24,500 | ) | 10.57 | |||||||||||||
|
|
|
|
|
|
|
|
|
|||||||||
| Outstanding at December 31, 2010 |
1,943,485 | $ | 11.16 | 5.8 | $ | 6,414 | ||||||||||
|
|
|
|
|
|
|
|
|
|||||||||
| Granted |
— | — | ||||||||||||||
| Exercised |
(114,634 | ) | 7.34 | |||||||||||||
| Forfeited |
(17,315 | ) | 9.89 | |||||||||||||
|
|
|
|
|
|
|
|
|
|||||||||
| Outstanding at December 31, 2011 |
1,811,536 | $ | 11.41 | 4.8 | $ | 4,927 | ||||||||||
|
|
|
|
|
|
|
|
|
|||||||||
There were 1,684,140, 1,638,623, and 1,345,394 options exercisable at December 31, 2011, 2010, and 2009, respectively. At December 31, 2011, for exercisable options, the weighted-average exercise price was $11.34, the weighted average remaining contractual term was 4.8 years and the estimated aggregate intrinsic value was $2.72 per share. All granted options are non-qualified options. The amount of options vested or expected to vest as of December 31, 2011 does not differ significantly from the amount outstanding.
As of December 31, 2011, there was $0.1 million of total unrecognized compensation cost related to non-vested options granted under the Equity Plan. This cost is expected to be recognized over a period extending four years from each grant date.
10. Earnings (Loss) Per Share
Basic earnings (loss) per common share is calculated by dividing net income (loss) available to common stockholders by the weighted average number of common stock outstanding during the period. Diluted earnings per share in 2009 did not assume this same exercise of stock options and conversion of warrants as they were deemed anti-dilutive due to the net loss available to common stockholders. In 2010 and 2011, diluted earnings per share is calculated by dividing net income by the weighted average common stock outstanding plus stock equivalents that would arise from the assumed exercise of stock options and conversion of warrants using the treasury stock method. There is no difference, for any of the periods presented, in the amount of net income (loss) available to common stockholders used in the computation of basic and diluted earnings per share.
F-19
Roadrunner Transportation Systems, Inc. and Subsidiaries
Notes to Consolidated Financial Statements — (Continued)
The following table reconciles basic weighted average stock outstanding to diluted weighted average stock outstanding (in thousands):
| Year Ended December 31, | ||||||||||||
| 2011 | 2010 | 2009 | ||||||||||
| Basic weighted average stock outstanding |
30,432 | 25,779 | 17,656 | |||||||||
| Effect of dilutive securities: |
||||||||||||
| Employee stock options |
396 | 453 | — | |||||||||
| Restricted stock units |
28 | — | — | |||||||||
| Warrants |
689 | 545 | — | |||||||||
|
|
|
|
|
|
|
|||||||
| Dilutive weighted average stock outstanding |
31,545 | 26,777 | 17,656 | |||||||||
|
|
|
|
|
|
|
|||||||
The Company had additional stock options and warrants outstanding of 308,698, 3,122,836 and 4,869,807 as of December 31, 2011, 2010 and 2009, respectively. These shares were not included in the computation of diluted earnings per share because they were not assumed to be exercised under the treasury stock method or were anti-dilutive.
11. Income Taxes
The components of the Company’s provision for income taxes were as follows (in thousands):
| Year Ended December 31, | ||||||||||||
| 2011 | 2010 | 2009 | ||||||||||
| Current: |
||||||||||||
| Federal |
$ | — | $ | — | $ | (61 | ) | |||||
| Foreign, state and local |
1,438 | 331 | 478 | |||||||||
| Deferred: |
||||||||||||
| Federal |
13,640 | 1,859 | 32 | |||||||||
| Foreign, state and local |
851 | (82 | ) | (112 | ) | |||||||
|
|
|
|
|
|
|
|||||||
| Provision for income taxes |
$ | 15,929 | $ | 2,108 | $ | 337 | ||||||
|
|
|
|
|
|
|
|||||||
The Company’s income tax provision varied from the amounts calculated by applying the U.S. statutory income tax rate to the pretax income as shown in the following reconciliations (in thousands):
| 2011 | 2010 | 2009 | ||||||||||
| Statutory federal rate |
$ | 14,641 | $ | 1,938 | $ | 108 | ||||||
| Meals and entertainment |
129 | 114 | 78 | |||||||||
| State income taxes — net of federal benefit |
1,344 | 195 | 185 | |||||||||
| Tax credit |
(109 | ) | (85 | ) | (195 | ) | ||||||
| Canadian income taxes |
(40 | ) | 50 | 2 | ||||||||
| Preferred dividend |
70 | 68 | 68 | |||||||||
| Other |
(106 | ) | (172 | ) | 91 | |||||||
|
|
|
|
|
|
|
|||||||
| Total |
$ | 15,929 | $ | 337 | $ | (1,139 | ) | |||||
|
|
|
|
|
|
|
|||||||
F-20
Roadrunner Transportation Systems, Inc. and Subsidiaries
Notes to Consolidated Financial Statements — (Continued)
The tax rate effects of temporary differences that give rise to significant elements of deferred tax assets and deferred tax liabilities at December 31, 2011 and 2010 are as follows (in thousands):
| 2011 | 2010 | |||||||
| Current deferred income tax assets: |
||||||||
| Net operating losses |
$ | 7,130 | $ | 5,100 | ||||
| Accounts receivable |
849 | 605 | ||||||
| Accounts payable and accrued expenses |
1,493 | 662 | ||||||
|
|
|
|
|
|||||
| Total |
$ | 9,472 | $ | 6,367 | ||||
|
|
|
|
|
|||||
| Noncurrent deferred income tax assets (liabilities): |
||||||||
| Net operating losses |
$ | 645 | $ | 10,513 | ||||
| Goodwill |
(23,054 | ) | (15,758 | ) | ||||
| PP&E |
(7,441 | ) | — | |||||
| Deferred Compensation |
1,193 | 551 | ||||||
| Other, net |
2,491 | — | ||||||
|
|
|
|
|
|||||
| Total |
$ | (26,166 | ) | $ | (4,694 | ) | ||
|
|
|
|
|
|||||
The net noncurrent deferred income tax liability of $26.2 million and $4.7 million is classified in the consolidated balance sheets as a component of other long-term liabilities at December 31, 2011 and 2010, respectively.
At December 31, 2011, the Company had $19.4 million of gross federal net operating losses which are available to reduce federal income taxes in future years and expire in the years 2025 through 2030.
There were no unrecognized tax benefits recorded as of December 31, 2011 and 2010. It is the Company’s policy to recognize interest and penalties related to unrecognized tax benefits within the income tax expense line in the accompanying consolidated statements of operations. No income tax related interest or penalties were included in accrued income taxes as of December 31, 2011 or 2010. The Company is subject to federal and state tax examinations for all tax years subsequent to December 31, 2006. Although the pre-2007 years are no longer subject to examinations by the Internal Revenue Service (IRS) and various state taxing authorities, net operating loss carryforwards generated in those years may still be adjusted upon examination by the IRS or state taxing authorities if they have been or will be used in a future period.
12. Commitments and Contingencies
Employee Benefit Plans
The Company sponsors defined contribution profit sharing plans for substantially all employees of the Company and its subsidiaries. The Company provides matching contributions on some of these plans. Total expense under these plans was $0.2 million, $0.2 million, and $1.2 million for the years ended December 31, 2011, 2010 and 2009, respectively.
Operating Leases
The Company leases terminals and office space under noncancelable operating leases expiring on various dates through 2020. The Company incurred rent expense from operating leases of $13.5 million, $9.3 million and $8.3 million for the years ended December 31, 2011, 2010 and 2009, respectively.
Aggregate future minimum lease payments under noncancelable operating leases with an initial term in excess of one year were as follows as of December 31, 2011 (in thousands):
| Year Ending |
Amount | |||
| 2012 |
$ | 15,815 | ||
| 2013 |
13,766 | |||
| 2014 |
13,372 | |||
| 2015 |
13,160 | |||
| 2016 |
10,065 | |||
| Thereafter |
28,625 | |||
F-21
Roadrunner Transportation Systems, Inc. and Subsidiaries
Notes to Consolidated Financial Statements — (Continued)
Contingencies
In the ordinary course of business, the Company is a defendant in several property and other claims. In the aggregate, the Company does not believe any of these claims will have a material impact on its consolidated financial statements. The Company maintains liability insurance coverage for claims in excess of $500,000 per occurrence and cargo coverage for claims in excess of $100,000 per occurrence. Management believes it has adequate insurance to cover losses in excess of the deductible amount. As of December 31, 2011 and 2010, the Company had reserves for estimated uninsured losses of $4.3 million and $2.6 million, respectively.
13. Related Party Transactions
Thayer | Hidden Creek Management, L.P. (THC Management), an affiliate of GTS’ largest stockholder, earned management fees of $0.2 million during 2009. Additionally, GTS paid THC Management $0.3 million in 2009 in conjunction with the acquisitions of GTS, Mesca and GNTS and related debt financing.
In 2010, the Company paid $3.5 million in aggregate to THC Management and EOS Management for the termination of the management agreement of GTS and the IPO of the Company and related debt refinancing.
On September 12, 2011, the Company amended its advisory agreement with HCI, formerly Thayer | Hidden Creek Management, L.P., to pay them a transaction fee for each acquisition and an annual advisory fee of $0.1 million. During 2011, the Company paid $0.7 million in aggregate to HCI for services performed in conjunction with acquisitions and debt financing.
As part of the 2007 acquisition of Big Rock Transportation, Inc., Midwest Carriers, Inc., Sargent Trucking, Inc., B&J Transportation, Inc., and Smith Truck Brokers, Inc. (collectively, Sargent), the Company was required to pay an earnout to the former Sargent owners. At December 31, 2011, $0.8 million was classified as a short-term liability and at December 31, 2010, $0.8 million was classified as a long-term liability related to the amounts earned in 2006 and 2007. The Company’s obligation to make further contingent payments to the former Sargent owners terminated as of December 31, 2009.
As part of the Bullet acquisition in 2009, the Company issued eight-year warrants exercisable for an aggregate of 268,765 shares of Class A common stock payable to the former Bullet owners. These warrants were exercised in July of 2010. Additionally, certain existing stockholders and their affiliates also received eight-year warrants exercisable for an aggregate of 1,388,620 shares of Class A common stock payable to existing stockholders and their affiliates. During 2011, certain stockholders exercised 554,328 of these warrants while 834,292 were still outstanding as of December 31, 2011.
14. Segment Reporting
The Company determines its operating segments based on the information utilized by the chief operating decision maker, the Company’s Chief Executive Officer, to allocate resources and assess performance. Based on this information, the Company has determined that it has three operating segments, which are also reportable segments: LTL, TL and TMS.
These reportable segments are strategic business units through which the Company offers different services. The Company evaluates the performance of the segments primarily based on their respective revenues and operating income. Accordingly, interest expense and other non-operating items are not reported in segment results. In addition, the Company has disclosed a corporate segment, which is not an operating segment and includes IPO related expenses, acquisition transaction expenses, corporate salaries and stock-based compensation expense.
F-22
Roadrunner Transportation Systems, Inc. and Subsidiaries
Notes to Consolidated Financial Statements — (Continued)
The following table reflects certain financial data of the Company’s reportable segments (in thousands):
| 2011 | 2010 | 2009 | ||||||||||
| Revenues: |
||||||||||||
| LTL |
$ | 466,823 | $ | 409,914 | $ | 316,119 | ||||||
| TL |
301,279 | 158,724 | 134,815 | |||||||||
| TMS |
79,188 | 65,902 | 34,472 | |||||||||
| Eliminations |
(3,663 | ) | (2,522 | ) | (2,084 | ) | ||||||
|
|
|
|
|
|
|
|||||||
| Total |
$ | 843,627 | $ | 632,018 | $ | 483,322 | ||||||
|
|
|
|
|
|
|
|||||||
| Operating Income: |
||||||||||||
| LTL |
$ | 24,325 | $ | 21,661 | $ | 9,754 | ||||||
| TL |
20,040 | 6,459 | 4,338 | |||||||||
| TMS |
7,601 | 5,284 | 1,758 | |||||||||
| Corporate |
(5,831 | ) | (3,635 | ) | (2,110 | ) | ||||||
|
|
|
|
|
|
|
|||||||
| Total operating income |
$ | 46,135 | $ | 29,769 | $ | 13,740 | ||||||
| Interest expense |
4,335 | 8,154 | 13,426 | |||||||||
| Loss on early extinguishment of debt |
— | 15,916 | — | |||||||||
|
|
|
|
|
|
|
|||||||
| Income before provision for income taxes |
$ | 41,800 | $ | 5,699 | $ | 314 | ||||||
|
|
|
|
|
|
|
|||||||
| Depreciation and Amortization: |
||||||||||||
| LTL |
$ | 1,718 | $ | 1,676 | $ | 1,716 | ||||||
| TL |
2,572 | 744 | 656 | |||||||||
| TMS |
688 | 694 | 595 | |||||||||
|
|
|
|
|
|
|
|||||||
| Total |
$ | 4,978 | $ | 3,114 | $ | 2,967 | ||||||
|
|
|
|
|
|
|
|||||||
| Capital Expenditures: |
||||||||||||
| LTL |
$ | 4,817 | $ | 1,323 | $ | 1,840 | ||||||
| TL |
4,296 | 987 | 406 | |||||||||
| TMS |
992 | 190 | 46 | |||||||||
|
|
|
|
|
|
|
|||||||
| Total |
$ | 10,105 | $ | 2,500 | $ | 2,292 | ||||||
|
|
|
|
|
|
|
|||||||
| December 31, | ||||||||||||
| 2011 | 2010 | 2009 | ||||||||||
| Total Assets: |
||||||||||||
| LTL |
$ | 397,372 | $ | 259,706 | $ | 245,508 | ||||||
| TL |
221,899 | 49,533 | 45,967 | |||||||||
| TMS |
46,290 | 44,905 | 42,520 | |||||||||
| Corp. |
— | — | — | |||||||||
| Eliminations |
(122,208 | ) | (5,847 | ) | (714 | ) | ||||||
|
|
|
|
|
|
|
|||||||
| Total |
$ | 543,353 | $ | 348,297 | $ | 348,297 | ||||||
|
|
|
|
|
|
|
|||||||
15. Subsequent Event
The Company has evaluated subsequent events through the date of this report and determined that there were no material subsequent events that have occurred though that date.
F-23