Attached files
| file | filename |
|---|---|
| EX-10.41 - EXHIBIT 10.41 - Roadrunner Transportation Systems, Inc. | exhibit1041employmentagr.htm |
| EX-32.2 - EXHIBIT 32.2 - Roadrunner Transportation Systems, Inc. | rrts-20171231xex322.htm |
| EX-32.1 - EXHIBIT 32.1 - Roadrunner Transportation Systems, Inc. | rrts-20171231xex321.htm |
| EX-31.2 - EXHIBIT 31.2 - Roadrunner Transportation Systems, Inc. | rrts-20171231xex312.htm |
| EX-31.1 - EXHIBIT 31.1 - Roadrunner Transportation Systems, Inc. | rrts-20171231xex311.htm |
| EX-21.1 - EXHIBIT 21.1 - Roadrunner Transportation Systems, Inc. | rrts-20171231xex211.htm |
| EX-10.42 - EXHIBIT 10.42 - Roadrunner Transportation Systems, Inc. | exhibit1042employmentagr.htm |
| EX-10.40 - EX 10.40 - Roadrunner Transportation Systems, Inc. | exhibit1040employmentlet.htm |
SECURITIES AND EXCHANGE COMMISSION
Washington, D.C. 20549
Form 10-K
ANNUAL REPORT PURSUANT TO SECTION 13 OR 15(d)
OF THE SECURITIES EXCHANGE ACT OF 1934
For the Fiscal Year Ended December 31, 2017
Commission File Number 001-34734
ROADRUNNER TRANSPORTATION SYSTEMS, INC.
(Exact Name of Registrant as Specified in Its Charter)
Delaware | 20-2454942 | |
(State or Other Jurisdiction of Incorporation or Organization) | (I.R.S. Employer Identification No.) | |
1431 Opus Place, Suite 530 Downers Grove, Illinois | 60515 | |
(Address of Principal Executive Offices) | (Zip Code) | |
(414) 615-1500
(Registrant’s telephone number, including area code)
Securities registered pursuant to Section 12(b) of the Act:
Title of Each Class | Name of Each Exchange on Which Registered | |
Common Stock, par value $.01 per share | The New York Stock Exchange | |
Indicate by check mark if the registrant is a well-known seasoned issuer, as defined in Rule 405 of the Securities Act. Yes o No x
Indicate by check mark if the registrant is not required to file reports pursuant to Section 13 or Section 15(d) of the Act. Yes o No x
Indicate by check mark whether the registrant (1) has filed all reports required to be filed by Section 13 or 15(d) of the Securities Exchange Act of 1934 during the preceding 12 months (or for such shorter period that the registrant was required to file such reports), and (2) has been subject to such filing requirements for the past 90 days. Yes o No x
Indicate by check mark whether the registrant has submitted electronically and posted on its corporate Web site, if any, every Interactive Data File required to be submitted and posted pursuant to Rule 405 of Regulation S-T (§ 232.405 of this chapter) during the preceding 12 months (or for such shorter period that the registrant was required to submit and post such files). Yes x No o
Indicate by check mark if disclosure of delinquent filers pursuant to Item 405 of Regulation S-K (§ 229.405 of this chapter) is not contained herein, and will not be contained, to the best of registrant’s knowledge, in definitive proxy or information statements incorporated by reference in Part III of this Form 10-K or any amendment to this Form 10-K. o
Indicate by check mark whether the registrant is a large accelerated filer, an accelerated filer, a non-accelerated filer, a smaller reporting company, or an emerging growth company. See the definitions of “large accelerated filer,” “accelerated filer,” “smaller reporting company,” and “emerging growth company” in Rule 12b-2 of the Exchange Act. (Check one):
Large accelerated filer | o | Accelerated filer | x | |||
Non-accelerated filer | o (Do not check if a smaller reporting company) | Smaller reporting company | o | |||
Emerging growth company | o | |||||
If an emerging growth company, indicate by check mark if the registrant has elected not to use the extended transition period for complying with any new or revised financial accounting standards provided pursuant to Section 13(a) of the Exchange Act. o
Indicate by check mark whether the registrant is a shell company (as defined in Rule 12b-2 of the Act). Yes o No ý
As of June 30, 2017, the last business day of the registrant’s most recently completed second fiscal quarter, the aggregate market value of the registrant’s voting common stock held by non-affiliates of the registrant was approximately $195.8 million based on the closing price of such stock as reported on The New York Stock Exchange on such date.
As of June 7, 2018, there were outstanding 38,507,230 shares of the registrant’s Common Stock, par value $.01 per share.
1
ROADRUNNER TRANSPORTATION SYSTEMS, INC.
ANNUAL REPORT ON FORM 10-K
TABLE OF CONTENTS
PART I | ||
ITEM 1. | BUSINESS | |
ITEM 1A. | RISK FACTORS | |
ITEM 1B. | UNRESOLVED STAFF COMMENTS | |
ITEM 2. | PROPERTIES | |
ITEM 3. | LEGAL PROCEEDINGS | |
ITEM 4. | MINE SAFETY DISCLOSURES | |
PART II | ||
ITEM 5. | MARKET FOR REGISTRANT’S COMMON EQUITY, RELATED STOCKHOLDER MATTERS AND ISSUER PURCHASES OF EQUITY SECURITIES | |
ITEM 6. | SELECTED FINANCIAL DATA | |
ITEM 7. | MANAGEMENT’S DISCUSSION AND ANALYSIS OF FINANCIAL CONDITION AND RESULTS OF OPERATIONS | |
ITEM 7A. | QUANTITATIVE AND QUALITATIVE DISCLOSURES ABOUT MARKET RISK | |
ITEM 8. | FINANCIAL STATEMENTS AND SUPPLEMENTARY DATA | |
ITEM 9. | CHANGES IN AND DISAGREEMENTS WITH ACCOUNTANTS ON ACCOUNTING AND FINANCIAL DISCLOSURE | |
ITEM 9A. | CONTROLS AND PROCEDURES | |
ITEM 9B. | OTHER INFORMATION | |
PART III | ||
ITEM 10. | DIRECTORS, EXECUTIVE OFFICERS AND CORPORATE GOVERNANCE | |
ITEM 11. | EXECUTIVE COMPENSATION | |
ITEM 12. | SECURITY OWNERSHIP OF CERTAIN BENEFICIAL OWNERS AND MANAGEMENT AND RELATED STOCKHOLDER MATTERS | |
ITEM 13. | CERTAIN RELATIONSHIPS AND RELATED TRANSACTIONS, AND DIRECTOR INDEPENDENCE | |
ITEM 14. | PRINCIPAL ACCOUNTANT FEES AND SERVICES | |
PART IV | ||
ITEM 15. | EXHIBITS AND FINANCIAL STATEMENT SCHEDULES | |
ITEM 16. | FORM 10-K SUMMARY | |
SPECIAL NOTE REGARDING FORWARD-LOOKING STATEMENTS
This Annual Report on Form 10-K (“Form 10-K”) contains forward-looking statements within the meaning of Section 27A of the Securities Act of 1933, as amended (the “Securities Act”), and Section 21E of the Securities Exchange Act of 1934, as amended (the “Exchange Act”). All statements, other than statements of historical fact, contained in this Form 10-K are forward-looking statements, including, but not limited to, statements regarding our strategy, prospects, plans, objectives, future operations, future revenue and earnings, projected margins and expenses, markets for our services, potential acquisitions or strategic alliances, financial position, and liquidity and anticipated cash needs and availability. The words “anticipates,” “believes,” “estimates,” “expects,” “intends,” “may,” “plans,” “projects,” “will,” “would,” and similar expressions or the negatives thereof are intended to identify forward-looking statements. However, not all forward-looking statements contain these identifying words. These forward-looking statements represent our current reasonable expectations and involve known and unknown risks, uncertainties and other factors that may cause our actual results, performance and achievements, or industry results, to be materially different from any future results, performance or achievements expressed or implied by such forward-looking statements. We cannot guarantee the accuracy of the forward-looking statements, and you should be aware that results and events could differ materially and adversely from those contained in the forward-looking statements due to a number of factors including, but not limited to, those described in the section entitled “Risk Factors” included in this Form 10-K. Furthermore, such forward-looking statements speak only as of the date of this Form 10-K. Except as required by law, we do not undertake publicly to update or revise these statements, even if experience or future changes make it clear that any projected results expressed in this Form 10-K or future quarterly reports, press releases or company statements will not be realized. In addition, the inclusion of any statement in this Form 10-K does not constitute an admission by us that the events or circumstances described in such statement are material. We qualify all of our forward-looking statements by these cautionary statements. In addition, the industry in which we operate is subject to a high degree of uncertainty and risk due to a variety of factors including those described in the section entitled “Risk Factors.” These and other factors could cause our results to differ materially from those expressed in this Form 10-K.
Unless otherwise indicated, information contained in this Form 10-K concerning our industry and the markets in which we operate, including our general expectations and market position, market opportunity, and market size, is based on information from various sources, on assumptions that we have made that are based on those data and other similar sources, and on our knowledge of the markets for our services. This information includes a number of assumptions and limitations, and you are cautioned not to give undue weight to such information. In addition, projections, assumptions, and estimates of our future performance and the future performance of the industry in which we operate are necessarily subject to a high degree of uncertainty and risk due to a variety of factors, including those described in the section entitled “Risk Factors” and elsewhere in this Form 10-K. These and other factors could cause results to differ materially from those expressed in the estimates made by third parties and by us.
Unless otherwise indicated or unless the context requires otherwise, all references in this document to “RRTS,” “our company,” “we,” “us,” “our,” and similar names refer to Roadrunner Transportation Systems, Inc. and, where appropriate, its subsidiaries.
“Roadrunner Transportation Systems,” our logo, and other trade names, trademarks, and service marks of Roadrunner Transportation Systems appearing in this Form 10-K are the property of Roadrunner Transportation Systems. Other trade names, trademarks, and service marks appearing in this Form 10-K are the property of their respective holders.
PART I
ITEM 1. | BUSINESS |
Overview
We are a leading asset-right transportation and asset-light logistics service provider offering a full suite of solutions. Our Truckload Logistics (“TL”) and Less-than-Truckload (“LTL”) segments offer solutions including less-than-truckload, air and ground domestic and cross-border expedite, dry van and temperature controlled truckload logistics, and intermodal services. Our Ascent Global Logistics (“Ascent”) segment offers domestic freight management, retail consolidation, international freight forwarding, and customs brokerage.
We have three segments:
Truckload Logistics. Within our TL business, we arrange the pickup and delivery of truckload, intermodal, and ground and air expedited freight through our 41 TL service centers, over 40 company brokers, and over 60 independent brokerage agents located throughout the United States, Mexico, and Canada. We offer temperature-controlled, dry van, intermodal drayage, and flatbed services and specialize in the transport of automotive parts, refrigerated foods, poultry, and beverages. Our on-demand ground and air expedited services feature proprietary bid technology supported by our fleets of ground and air assets. We believe this array of services and specialization provides our customers with full-service options and provides us with more consistent shipping volume in any given year.
Less-than-Truckload. Our LTL businesses involve the pickup, consolidation, linehaul, deconsolidation, and delivery of LTL shipments throughout the United States and parts of Canada. With 41 LTL service centers and over 180 third-party delivery agents, we are designed to provide customers with high reliability at an economical cost. We generally employ a point-to-point LTL model that we believe serves as a competitive advantage over the traditional hub and spoke LTL.
Ascent Global Logistics. Within our Ascent business, we offer a full portfolio of domestic and international transportation and logistics solutions, including access to cost-effective and time-sensitive modes of transportation within our broad network. Specifically, our Ascent offering includes pricing, contract management, transportation mode and carrier selection, freight tracking, freight bill payment and audit, cost reporting and analysis, dispatch, and freight consolidation and warehousing. Our customized Ascent offering is designed to allow our customers to reduce operating costs, redirect resources to core competencies, improve supply chain efficiency, and enhance customer service. Our Ascent business also includes domestic and international air and ocean transportation services and customs brokerage.
Our Industry
Over-the-Road Freight
The over-the-road freight sector includes both private fleets (company drivers) and “for-hire” carriers (independent contractors (“ICs”) and purchased power providers). According to the American Trucking Associations (“ATA”), the U.S. freight sector represented revenue of approximately $900.6 billion in 2017 and accounted for approximately 80% of domestic freight transportation spend. The ATA estimates that U.S. freight transportation will increase to over $1.6 trillion by 2028. Private fleets consist of tractors and trailers owned and operated by shippers that move their own goods and, according to the ATA, accounted for revenue of approximately $327.7 billion in 2016. For-hire carriers transport TL and LTL freight belonging to others and, according to the ATA, accounted for revenue of approximately $391.5 billion in 2017.
TL carriers dedicate an entire trailer to one shipper from origin to destination and are categorized by the type of equipment they use to haul a shipper’s freight, such as temperature-controlled, dry van, tank, or flatbed trailers. According to the ATA, excluding private fleets, revenue in the U.S. TL market was approximately $333.3 billion in 2017.
LTL carriers specialize in consolidating shipments from multiple shippers into truckload quantities for delivery to multiple destinations. LTL carriers are traditionally divided into two categories — national and regional. National carriers typically focus on two-day or longer service across distances greater than 1,000 miles and often operate without time-definite delivery, while regional carriers typically offer time-definite delivery in less than two days. According to the ATA, the U.S. LTL market generated revenue of approximately $58.2 billion in 2017.
1
On Demand Air Charter
On demand air charter is the segment of the air cargo industry focused on the time critical movement of goods that requires the timely launch of an aircraft to move freight. These critical movements of freight are typically necessary to prevent a disruption in the supply chain due to lack of components. There are approximately 50 certified airlines providing this on demand service in North America and Mexico. The primary users of on-demand air charter services are auto manufacturers, component manufactures, and other heavy equipment makers or just-in-time manufacturers.
Third-Party Logistics
Third-party logistics (“3PL”) providers offer transportation management solutions and distribution services, including the movement and storage of freight and the assembly of inventory. The U.S. 3PL sector revenue increased from approximately $89.4 billion in 2004 to approximately $166.8 billion in 2016 (and experienced growth each year during such period other than from 2008 to 2009), according to Armstrong & Associates, Inc., a leading supply chain market research firm. In addition, only 11.0% of logistics expenditures by U.S. businesses were outsourced in 2016, according to Armstrong & Associates. We believe that the market penetration of 3PL providers will expand in the future as companies increasingly redirect their resources to core competencies and outsource their transportation and logistics requirements as they realize the cost-effectiveness of 3PL providers.
Factors Important to Our Business
Our success principally depends on our ability to generate revenues through our network of sales personnel, proprietary bid technology, and independent brokerage agents and to deliver freight in all modes safely, on time, and cost-effectively through a suite of solutions tailored to the needs of each customer. Customer ground and air shipping demand, over-the-road freight tonnage levels, events leading to ground and air expedited shipping requirements, and equipment capacity ultimately drive increases or decreases in our revenues. Our ability to operate profitably and generate cash is also impacted by purchased transportation costs, personnel and related benefits costs, fuel costs, pricing dynamics, customer mix, and our ability to manage costs effectively.
Agent Network and Sales Personnel. In our TL business, we arrange the pickup and delivery of ground and air freight either through our growing sales force of company brokers and salespeople or through our network of over 60 independent brokerage agents. Brokerage agents, who focus primarily on truckload shipments, complement our company sales force by bringing pre-existing customer relationships, new customer prospects, and/or access to new geographic markets. Furthermore, brokerage agents typically provide immediate revenue and do not require us to invest in incremental overhead. Brokerage agents own or lease their own office space and pay for other costs associated with running their operations. We market and sell the vast majority of our mission critical air charter and ground expedite services based on pre-existing relationships established by our management teams and direct sales force.
In our LTL business, we market and sell our LTL services through a sales force of over 80 people, consisting of account executives, sales managers, inside sales representatives, and commissioned sales representatives.
In our Ascent business, we have over 40 salespeople and commissioned sales representatives.
Tonnage Levels and Capacity. Competition intensifies in the transportation industry as tonnage levels decrease and equipment capacity increases. Our ability to maintain or grow existing tonnage levels is impacted by overall economic conditions, shipping demand, over-the-road freight capacity in North America, and capacity in domestic air freight, as well as by our ability to compete effectively in terms of pricing, safety, and on-time delivery. We do business with a broad base of third-party carriers, including ICs and purchased power providers, together with a blend of our own ground and air capacity, which reduces the impact of tightening capacity on our business.
Purchased Transportation Costs. Purchased transportation costs within our TL business are generally based either on negotiated rates for each load hauled or spot market rates for ground and air services. Purchased transportation costs within our LTL business represent amounts we pay to ICs or purchased power providers and consist of a combination of contractually agreed-upon and spot market rates. Within our Ascent business, purchased transportation costs represent payments made to our purchased power providers, which are generally contractually agreed-upon rates. Purchased transportation costs are the largest component of our cost structure. Our purchased transportation costs typically increase or decrease in proportion to revenues.
Personnel and Related Benefits. Personnel and related benefits costs are a large component of our overall cost structure. We employ approximately 1,400 company drivers who are paid either per mile or at an hourly rate. In addition, we employ over 900 dock workers and over 2,000 operations and other administrative personnel to support our day-to-day business activities. Personnel and related benefits costs could vary significantly as we may be required to adjust staffing levels to match our business needs.
Fuel. The transportation industry is dependent upon the availability of adequate fuel supplies and the price of fuel. Fuel prices have fluctuated dramatically over recent years. Within our TL and Ascent businesses, we generally pass fuel costs through to our
2
customers. As a result, our operating income in these businesses is less impacted by rises in fuel prices. Within our LTL business, our ICs and purchased power providers pass along the cost of diesel fuel to us, and we in turn attempt to pass along some or all of these costs to our customers through fuel surcharge revenue programs. Although revenues from fuel surcharges generally offset increases in fuel costs, other operating costs have been, and may continue to be, impacted by fluctuating fuel prices. The total impact of higher energy prices on other nonfuel-related expenses is difficult to ascertain. We cannot predict future fuel price fluctuations, the impact of higher energy prices on other cost elements, recoverability of higher fuel costs through fuel surcharges, and the effect of fuel surcharges on our overall rate structure or the total price that we will receive from our customers. Depending on the changes in the fuel rates and the impact on costs in other fuel- and energy-related areas, our operating margins could be impacted.
Pricing. The pricing environment in the transportation industry also impacts our operating performance. Within our TL business, we typically charge a flat rate negotiated on each load hauled. Pricing within our TL business is typically driven by shipment frequency and consistency, length of haul, and customer and geographic mix, but generally has fewer influential factors than pricing within our LTL business. Within our LTL business, we typically generate revenues by charging our customers a rate based on shipment weight, distance hauled, and commodity type. This amount is comprised of a base rate, a fuel surcharge, and any applicable service fees. Our LTL pricing is dictated primarily by factors such as shipment size, shipment frequency and consistency, length of haul, freight density, and customer and geographic mix. Within our Ascent business, we typically charge a variable rate on each shipment in addition to transaction or service fees appropriate for the solution we have provided to meet a specific customer’s needs. Since we offer both TL and LTL shipping as part of our Ascent offering, pricing within our Ascent business is impacted by similar factors. The pricing environment for all of our operations generally becomes more competitive during periods of lower industry tonnage levels and/or increased capacity within the over-the-road freight sector. In addition, when we provide international freight forwarding services in our Ascent business, we also contract with airlines, ocean carriers, and agents as needed. The international shipping markets are very dynamic and we must therefore adjust rates regularly based on market conditions.
Our Strategy
Our goal is to be the leading asset-right transportation and asset-light logistics service provider in North America. Our strategy includes continuing to:
Generate Free Cash Flows. Our scalable business model and low capital expenditures (as a percentage of our revenues) enhance our ability to generate strong free cash flows and returns on our invested capital and assets.
Gain New Customers. We continue to expand our customer base, and we will continue to pursue increased market share in the TL, LTL, and Ascent markets. Our expansive geographic reach and broad service offering provides us with the ability to add new customers seeking transportation and logistics solutions. We also believe the pool of potential new customers will grow as the benefits of third-party transportation management solutions continue to be embraced.
Increase Penetration with Existing Customers. With our comprehensive service offering and large global network, we have substantial cross-selling opportunities and the potential to capture a greater share of existing customer’s annual transportation and logistics expenditures.
Increased Levels of Integration. We adopted a long-term brand and go-to-market service offering plan in the fourth quarter of 2016. Over the next three years, in order to implement this plan we expect to increase the level of integration within each of our three segments in order to improve our ability to serve customers. For example, in November of 2016, we re-branded our Roadrunner LTL business as Roadrunner Freight and in January of 2017, we re-branded our Global Solutions business as Ascent Global Logistics. These are first steps in the implementation of our long-term brand and go-to-market service offering plan.
Our Services
We are a leading asset-right transportation and asset-light logistics service provider offering a full suite of solutions. In each of our service offerings, we utilize a blend of company-owned and third-party owned equipment to provide the most cost-effective service for our customers. Because of this blend, we are able to focus primarily on providing quality service rather than on asset utilization. Our customers generally communicate their freight needs to one of our transportation specialists on a shipment-by-shipment basis via telephone, fax, Internet, e-mail, or electronic data interchange (“EDI”). We leverage a diverse group of third-party carriers and ICs to provide scalable capacity and reliable service to our extensive customer base in North America.
3
Truckload Logistics
We provide a comprehensive range of TL solutions for our customers by leveraging our company drivers, ICs, and a broad base of third-party carriers who operate dry van, temperature-controlled, and/or flatbed capacity. We arrange the pickup and delivery of TL freight through our 41 TL service centers, over 40 company brokers, and over 60 independent brokerage agents located throughout the United States, Mexico, and Canada. We provide a variety of transportation solutions for dry goods ranging from paper products to steel, refrigerated foods like meat, poultry and beverages, as well as flatbed service for larger industrial load requirements. Our intermodal capabilities include drayage, which is the transport of freight between ocean ports or rail ramps and shipping docks. We also have a strong presence in TL expedited services for our customers with just-in-time and time critical transportation needs. Expedited offerings include ground and air cargo services which are spot bid by qualified and certified ground or air cargo asset-based carriers including our fleet of over 800 trucks and 11 cargo jets. In addition to our spot bid model for expedited offerings, we also offer direct services utilizing our trucks. In either case, we track all shipments using our proprietary technology and our dedicated service team. This hybrid solution provides a unique business model ensuring customers a competitive price, expanded coverage and on-time delivery.
Company Brokers and Salespeople. We have over 40 company brokers that not only engage in the routing and selection of our transportation providers, but also supplement our internal TL sales force. Internal sales personnel and company brokers are responsible for managing existing customer relationships and generating new customer relationships. Because the performance of these individuals is essential to our success, we offer attractive incentive-based compensation packages that we believe keep our brokers and sales force motivated, focused, and service-oriented.
Independent Brokerage Agents. We also maintain a network of independent brokerage agents, who primarily focus on truckload shipments, which complement our network of company brokers by bringing pre-existing customer relationships, new customer prospects, and/or access to new geographic markets. Furthermore, they typically provide immediate revenue and do not require us to invest in incremental overhead. Brokerage agents own or lease their own office space and pay for their own communications equipment, insurance, and any other costs associated with running their operation. We only invest in the working capital required to execute our quick pay strategy and generally pay a commission to our brokerage agents ranging from 40-75% of the margin we earn on a TL shipment. Similar to company brokers, our brokerage agents engage in the routing and selection of transportation providers for our customer base and perform sales and customer service functions on our behalf.
Brokerage Agents. We believe we offer brokerage agents a very attractive partnership opportunity. We offer access to our reliable network of purchased power providers and we invest in the working capital required to pay these carriers promptly and assume collection responsibility. As of December 31, 2017, our TL brokerage agent network consisted of over 60 agents. Additionally, 22 of our brokerage agents generated more than $1 million in revenue in 2017. We believe our increased development efforts and attractive value proposition will allow us to further expand our brokerage agent network and enhance the growth of our TL business.
Less-than-Truckload
Based on our industry knowledge, we believe we are one of the largest asset-light provider of LTL transportation services in North America in terms of revenue. We provide LTL service originating from points within approximately 150 miles of our service centers to most destinations throughout the United States and parts of Canada. Within the United States, we offer national, long-haul service (1,000 miles or greater), inter-regional service (between 500 and 1,000 miles), and regional service (500 miles or less). We serve a diverse group of customers within a variety of industries, including retail, industrial, paper goods, manufacturing, food and beverage, health care, chemicals, computer hardware, and general commodities.
We use over 180 third-party LTL delivery agents to complement our service center footprint and to provide cost-effective full state, national, and North American delivery coverage. Delivery agents also enhance our ability to handle special needs of the final consignee, such as scheduled deliveries and specialized delivery equipment.
We generally utilize a point-to-point LTL model that is differentiated from the traditional, asset-based hub and spoke LTL model. Our model does not require intermediate handling at a break-bulk hub (a large terminal where freight is offloaded, sorted, and reloaded), which we believe represents a competitive advantage.
Key aspects of our LTL service offering include the following:
• | Pickup. In order to stay as close as possible to our customers, we prefer to directly pick up freight whenever cost-effective. We generally directly pick up freight within 150 miles of one of our service centers, primarily utilizing local ICs. Although we generally do not own the tractors or other powered transportation equipment used to transport our customers’ freight, we own or lease trailers for use in local city pickup and delivery. In 2017, we picked up approximately 79% of our customers’ LTL shipments. The remainder was handled by agents with whom we generally have long-standing relationships. |
4
• | Consolidation at Service Centers. Key to our model are our 41 LTL service centers that we lease in strategic markets throughout the United States. At these service centers, numerous smaller LTL shipments are unloaded, consolidated into truckload shipments, and loaded onto a linehaul unit scheduled for a destination city. In order to continuously emphasize optimal load building and enhance operating margins, dock managers review every load before it is dispatched from one of our service centers. |
• | Linehaul. Linehaul is the longest leg of the LTL shipment process. In dispatching a load, a linehaul coordinator uses our technology system to optimize cost-efficiency and service by assigning the load to the appropriate IC, company driver, or purchased power. In 2017, approximately 55% of our linehaul shipments were handled by over 460 ICs with the remainder shipped via company driver, purchased power, or rail. |
• | De-consolidation and Delivery. Within our unique model, linehaul shipments are transported to our service centers, delivery agents, or direct to end users without stopping at a break-bulk hub, as is often necessary under the traditional, asset-based hub and spoke LTL model. This generally reduces physical handling and damage claims. In 2017, we delivered approximately 36% of LTL shipments through our service centers and approximately 64% through our delivery agents. |
• | Benefits of a Delivery Agent Network. While many national asset-based LTL providers are encumbered by the fixed overhead associated with owning or leasing most or all of their de-consolidation and delivery facilities, we maintain our variable cost structure through the extensive use of delivery agents. |
Ascent Global Logistics
Ascent provides domestic freight management, international freight forwarding, and retail consolidation services. We provide the necessary operational expertise, information technology capabilities, and relationships with third-party transportation providers to meet the unique needs of our customers. For customers that require the most comprehensive service plans, we complement their internal logistics and transportation management personnel and operations, enabling them to redirect resources to core competencies, reduce internal transportation management personnel costs, and, in many cases, achieve substantial annual freight savings. Key aspects of our Ascent capabilities include the following:
• | Procurement. After an in-depth consultation and analysis with our customer to identify cost savings opportunities, we develop an estimate of our customer’s potential savings and design a plan for implementation. If necessary, we manage a targeted bid process based on the customer’s traffic lanes, shipment volumes, and product characteristics, and negotiate rates with reputable carriers. In addition to a cost-efficient rate, the customer receives a summary of projected savings as well as our carrier recommendation. |
• | Shipment Planning. Utilizing our technology systems and an expansive multi-modal network of third-party transportation providers, we determine the appropriate mode of transportation and select the ideal provider. In addition, we provide load optimization services based on freight patterns and consolidation opportunities. We also provide rating and routing services, either on-site with one of our transportation specialists, off-site through our centralized call center, or online through our website. Finally, we offer merge-in-transit coordination to synchronize the arrival and pre-consolidation of high-value components integral to a customer’s production process, enabling them to achieve reduced cycle times, lower inventory holding costs, and improved supply chain visibility. |
• | Customs Brokerage Services. We provide customs brokerage services to clients importing goods. Our team of highly knowledgeable professionals assist importers in meeting all requirements governing imports by maintaining a detailed knowledge of all customs regulations, tariff schedules, proper classifications, dutiable values, quotas, and other admissibility requirements with other government agency requirements such as the U.S. Food and Drug Administration (“FDA”), Environmental Protection Agency, U.S. Department of Agriculture (“USDA”), and U.S. Fish and Wildlife Services (“FWS”) . We submit all required documentation and make appropriate payments to the Bureau of Customs and Border Protection (“CBP”) on behalf of our clients and charge them a fee for this service. We also can provide foreign-trade zone entries/withdrawals and facilitate all in-bond entry types. In addition to processing documents for import clearance and payment of duties, our knowledgeable staff can assist with customs compliance issues, provide information on C-TPAT certification, assist with import bonds, and provide duty drawback services. |
• | International Freight Forwarding. We provide comprehensive air (import/export) and ocean (import/export) freight forwarding solutions. For customers requiring ocean freight solutions, we are an Ocean Transportation Intermediary acting as either an ocean freight forwarder (arranging ocean shipments on our client’s behalf on their ocean contracts) or a non-vessel-operating common carrier (moving shipments on our ocean carrier contracts). We provide full-container-load, less-than-container-load, charters, bulk, refrigerated service, or other unique solutions based on our customers' requirements. For customers requiring air freight solutions, we can provide express, standard and deferred air freight service. We arrange airport-to-airport, airport-to-door, door-to-airport, or door-to-door shipments. We are well-versed in the many technical |
5
aspects of government regulations, state and commerce department licensing requirements, foreign government forms, transportation documents, and international collection and banking procedures. We are an authorized International Air Transport Association (“IATA”) agent and also an Indirect Air Carrier authorized by the Transportation Security Administration (“TSA”). We also provide clients a robust Order Management Solution that includes Vendor Compliance/Education, Purchase Order Management, Regulatory Compliance Management, Origin Logistics, Transportation Management (Origin/Destination), and Global Information Management.
• | Shipment Execution. Our transportation specialists are adept at managing all types of shipments (FTL, LTL, partial truckload, expedited, and specialized). With our technology and large carrier base, we are able to provide our clients with route, rate, and mode optimization to reduce their costs and meet their pickup and delivery requirements. We also provide the ability to track and trace shipments either online or by phone through one of our transportation specialists. |
• | Audit and Payment Services. We capture and consolidate our customers’ entire shipping activity and offer weekly electronic billing. We also provide freight bill audit and payment services designed to eliminate excessive or incorrect charges from our customers’ bills. |
• | Performance Reporting and Improvement Analysis. Customers utilizing our web reporting system have the ability to review freight bills, develop customized reports online, and access data to assist in financial and operational reporting and planning. Our specialists are also actively driving process improvement by continuously using our technology to identify incremental savings opportunities and efficiencies for our customers. |
• | Retail Consolidation Solutions. We have five company-operated facilities with 2.5 million square feet of warehousing space strategically located in the United States. All of our facilities are authorized Food Grade Warehouses with both dry and refrigerated storage. We have “Superior” ratings with the American Institute of Bakers and are cGMP Certified. Retail suppliers ship their inventory to our warehouses for storage. Supplier orders are received and consolidated with other supplier orders based on the retailer's order write. Consolidated orders are then moved by full truckload to the retailer within the On Time in Full (OTIF) requirements. By having access to multiple locations to hold inventory and moving orders by truckload versus less-than-truckload, suppliers are able to shorten lead times, reduce their outbound miles, significantly lower their transportation costs, reduce damage, and increase their fill rates thereby improving their ability to meet retailers on shelf availability requirements. We operate best in class warehouse management system and transportation management system, which also provides customers with complete online visibility to inventory and receiving/shipping historical activity, along with customized reporting capabilities. We also have an experienced service assurance team that helps clients improve retail compliance conducting detailed forensic analysis into OTIF looking at root causes to any failures- late, early or unfilled. The team monitors all agreed upon key performance indicators and creates trend analysis by customer, pool, carrier and lane; reviewing all opportunities for improvement. |
With a broad Ascent offering, we believe we can accommodate a shipper’s unique needs with any combination of services along our entire spectrum, and cater to their preferred means of shipment processing and communication.
We believe our comprehensive service approach and focus on building long-term customer relationships lead to greater retention of existing business compared to a more short-term gain sharing model employed by many 3PL providers. Before becoming fully operational with a customer, we conduct thorough feasibility and cost savings analyses and collaborate with the customer to create a project scope and timeline with measurable milestones. We believe this approach enables us to identify any potential issues, ensure a smooth integration process, and set the stage for long-term customer satisfaction. Within our Ascent operation, we have consistently met customer implementation deadlines and achieved anticipated levels of freight savings.
Capacity
We offer scalable capacity and reliable service to our extensive customer base in North America through a diverse third-party network of transportation providers and company drivers and pilots. Our various transportation modes include TL, LTL, intermodal, and domestic and international air. No single third-party carrier accounted for more than 1% of our 2017 purchased transportation costs. We ensure that each carrier is properly licensed and we regularly monitor each carrier's capacity, reliability, and pricing trends. Enhanced visibility provided by our technology systems allows us to leverage the competitive dynamics within our network to renegotiate freight rates and provide our customers with more cost-effective transportation solutions while enhancing our operating margins.
We continuously focus on building and enhancing our relationships with reliable transportation providers to ensure that we not only secure competitive rates, but that we also gain access to consistent capacity. These relationships are critical to our success based on our asset-right transportation and asset-light logistics service provider business model. We typically pay our third-party carriers either a contracted per mile rate or the cost of a shipment less our contractually agreed-upon commission, and generally pay
6
within seven to ten days from the date the shipment is delivered. We pay our third-party carriers promptly in order to drive loyalty and reliable capacity.
Our network of transportation providers can be divided into the following groups:
Independent Contractors. ICs are a key part of our long-term strategy to maintain service and provide cost stability. As of December 31, 2017, we had over 2,000 ICs, which consisted of over 1,600 linehaul, truckload, and intermodal services ICs and over 400 local delivery ICs. In selecting our ICs, we adhere to specific screening guidelines in terms of safety records, length of driving experience, and evaluations. In the event of tightening of over-the-road freight capacity, we believe we are well positioned to increase our utilization of ICs as a cost-effective and reliable solution.
To enhance our relationship with our ICs, we offer per mile rates that we believe are highly competitive and often above prevailing market rates. In addition, we focus on keeping our ICs fully utilized in order to limit the number of “empty” miles they drive. We regularly communicate with our ICs and seek new ways to enhance their quality of life. We believe our efforts increase IC retention, which we believe ultimately leads to better service for our customers.
Purchased Power Providers. In addition to our large base of ICs, we have access to a broad base of purchased power providers. We have established relationships with carriers of all sizes, including large national trucking companies and small to mid-size regional fleets. With the exception of safety incentives, purchased power providers are generally paid under a similar structure as ICs within our LTL and TL businesses. In contrast to contracts established with our ICs, however, we do not cover the cost of liability insurance for our purchased power providers.
Company Drivers. We employ approximately 1,400 drivers across our businesses.
Delivery Agents. For the de-consolidation and delivery stages of our LTL shipment process, our 41 LTL service centers are complemented by over 180 third-party delivery agents. The use of delivery agents is also a key part of our long-term strategy to maintain a variable cost and scalable operating model with minimal overhead.
Intermodal Capabilities. We maintain intermodal capability within our TL segment and through relationships with third-party carriers who rent capacity on Class 1 railroads throughout North America. Intermodal transportation rates are typically negotiated between us and the capacity provider on a customer-specific basis.
Flight Operations. We support air freight services, including expedited delivery, with 11 cargo jets, 61 flight operations personnel, including pilots, ground crew, and flight coordinators, and a network of third party air cargo providers.
Ground Expedite. We utilize proprietary bid technology supported by our logistics personnel and our network of over-the-road ICs and purchased power providers.
Customers
Our goal is to establish long-term customer relationships and achieve year-over-year growth in recurring business by providing reliable, timely, and cost-effective transportation and logistics solutions. We possess the scale, operational expertise, and capabilities to serve shippers of all sizes. We serve an extensive customer base within a variety of end markets, with one direct customer, General Motors, accounting for approximately 12% of our 2017 revenue. Our diverse customer base reduces our exposure to a decline in shipping demand from any one customer and a cyclical downturn within any particular end market.
Sales and Marketing
We currently market and sell our transportation and logistics solutions through sales personnel located throughout the United States. We are focused on actively expanding our sales force to new geographic markets where we lack a strong presence.
As of December 31, 2017, our sales force extends into each service offering as follows:
• | Truckload Logistics. We have over 40 company brokers and over 60 independent brokerage agents located throughout the United States, Mexico, and Canada. Additionally, we have a sales team consisting of both sales managers and inside sales representatives. We believe that this sales structure enables our salespeople to better serve our customers by developing an understanding of local and regional market conditions, as well as the specific transportation and logistics issues facing individual customers. Our brokers, brokerage agents, and sales team seek additional business from existing customers and pursue new customers based on this knowledge and an understanding of the value proposition we can provide. |
• | Less-than-Truckload. Our LTL sales team of over 80 people consists of account executives, sales managers, inside sales representatives, and commissioned sales representatives. |
• | Ascent Global Logistics. We have over 40 Ascent salespeople, commissioned sales representatives, and agents. |
7
Competition
We compete in the North American transportation and logistics services sector. Our marketplace is extremely competitive and highly fragmented. We compete with a large number of other asset-light logistics companies, asset-based carriers, integrated logistics companies, and third-party freight brokers, many of whom have larger customer bases and more resources than we do.
In our markets, we compete with global asset-based integrated logistics companies such as FedEx Corporation, United Parcel Service, Inc., and XPO Logistics, Inc., against whom we compete in all of our service lines; asset-based freight haulers, such as Arkansas Best Corporation, Old Dominion Freight Line Inc., and YRC Worldwide, Inc., against whom we compete in our core TL and LTL service offerings; non-asset based and asset-light freight brokerage companies, such as C.H. Robinson Worldwide, Inc., Echo Global Logistics, Inc., and Landstar System, Inc., against whom we compete in all of our service offerings; 3PL providers that offer comprehensive transportation management solutions, such as Schneider Logistics, Inc. and Transplace, Inc., against whom we compete in our Ascent offering; and smaller, niche transportation and logistics companies that provide services within a specific geographic region or end market. In our international freight forwarding business, we compete with a large number of service providers. Depending on the trade lane and solution, these competitors include large multi-national providers, such as Expeditors International of Washington, Inc., Kuehne & Nagel International AG / ADR, and DHL Global Supply Chain; regional providers, such as Mallory Alexander International Logistics and Laufer Group International; and local or niche providers. As a result, our focus remains on continuing to provide our customers with exceptional service.
We believe we compete favorably by offering shippers attractive transportation and logistics solutions designed to deliver the optimal combination of cost and service. To that end, we believe our most significant competitive advantages include:
• | our comprehensive suite of transportation and logistics services, which allows us to offer à la carte or a full portfolio value proposition to shippers of varying sizes and to accommodate their diverse needs and preferred means of processing and communication; |
• | our asset-right transportation and asset-light logistics service provider, variable cost business model, which allows us to generate strong free cash flows and focus greater attention on providing optimal customer service than on asset utilization; |
• | our technology systems, which allow us to provide scalable capacity and a high level of customer service across a variety of transportation modes; and |
• | our knowledgeable management team with experience leading high-growth logistics companies and/or business units, which allows us to benefit from a collective entrepreneurial culture focused on growth. |
Seasonality
Our operations are subject to seasonal trends that have been common in the North American over-the-road freight sector for many years. Our results of operations for the quarter ending in March are on average lower than the quarters ending in June, September, and December. Typically, this pattern has been the result of factors such as inclement weather, national holidays, customer demand, and economic conditions.
Technology
We believe the continued development and innovation of our technology systems is important to providing our customers with the most cost-effective, timely, and reliable transportation and logistics solutions. Our objective is to allow our customers and vendors to easily do business with us via technology. Our customers have the ability, through a paperless process, to receive immediate pricing, place orders, track shipments, process remittance, receive updates, and review historical shipping data through a variety of reports over the Internet. We provide flexibility for customers and vendors by utilizing multiple technologies, including web, mobile, workflow and EDI.
Our TL operation uses technology to broker our customers’ freight. Our software enhances our ability to track our third-party drivers, tractors, and trailers, which provides customers with visibility into their supply chains. Additionally, our systems allow us to operate as a paperless operation through electronic order entry, resource planning, and dispatch. Our TL operations also utilize spot bid technology to manage expedited customers' logistics needs.
Our LTL operation utilizes a web-based system with our transportation management applications. Additionally, we make use of EDI to allow our service centers to communicate electronically with our carriers’ and customers’ internal systems. We offer our customers a paperless process, including document imaging and shipment tracking and tracing.
Our Ascent operation uses a variety of software applications and systems customized to meet the unique needs of our customers. We continuously enhance our applications and systems to help improve our productivity, increase customer visibility, and improve collaboration with our service providers, all while offering customizable content for our customers. Our web-based technology
8
approach allows our Ascent operation to process and service customer orders, track shipments in real time, select optimal modes of transportation, execute customer billing, provide carrier rates, establish customer-specific profiles, and retain critical information for analysis while providing a company branded solution. We utilize this approach to maximize supply chain efficiency through mode, carrier, and route optimization.
Employees
As of December 31, 2017, we employed approximately 4,600 full-time and part-time personnel, which included drivers, pilots, and warehouse, dock and maintenance workers as well as personnel in our management, sales and marketing, brokerage, logistics, customer service, operations, finance, information technology and human resources functions. None of our employees are covered by a collective bargaining agreement and we consider relations with our employees to be good.
Regulation
The federal government substantially deregulated the provision of ground transportation and logistics services via the enactment of the Motor Carrier Act of 1980, the Trucking Industry Regulatory Reform Act of 1994, the Federal Aviation Administration Authorization Act of 1994, and the ICC Termination Act of 1995. Prices and services are now largely free of regulatory controls, although states have the right to require compliance with safety and insurance requirements, and interstate motor carriers remain subject to regulatory controls imposed by the U.S. Department of Transportation (“DOT”) and its agencies, such as the Federal Motor Carrier Safety Administration (“FMCSA”). Motor carrier, freight forwarding, and freight brokerage operations are subject to safety, insurance, and bonding requirements prescribed by the DOT and various state agencies. Any air freight business is subject to commercial standards set forth by the IATA and federal regulations issued by the TSA.
We are also subject to the Compliance, Safety, and Accountability Program (“CSA”), which is the FMCSA safety program designed to improve large truck and bus safety and ultimately reduce crashes. CSA is an enforcement and compliance model that involves assessments of a motor carrier's on-road performance and investigation results for a 24-month period using roadside stops and inspections, resulting in safety performance in the following categories: unsafe driving; hours-of-service compliance; driver fitness; controlled substances/alcohol; vehicle maintenance; hazardous material compliance; and crash indicator. The evaluations are then used by the FMCSA to select carriers for audit and other interventions.
As part of our 2014 acquisition of Active Aero, we acquired USA Jet Airlines (“USA Jet”), which holds certificates of public convenience and necessity issued by the DOT pursuant to 49 U.S.C. § 41102 and an air carrier certificate granted by the Federal Aviation Administration (“FAA”) pursuant to Part 119 of the federal aviation regulations. The DOT, the FAA, and the U.S. Department of Homeland Security (“DHS”), through the TSA, have regulatory authority over USA Jet’s air transportation services. The Federal Aviation Act of 1958, as amended, is the statutory basis for DOT and the FAA authority and the Aviation and Transportation Security Act of 2001, as amended, is the basis for TSA aviation security authority.
The FAA’s authority relates primarily to operational aspects of air transportation, including aircraft standards and maintenance, as well as personnel and ground facilities, which may from time to time affect the ability of USA Jet to operate its aircraft in the most efficient manner. The air carrier certificate granted to USA Jet by the FAA remains in effect so long as we meet the safety and operational requirements of the applicable FAA regulations.
The DOT’s authority relates primarily to economic licensing aspects of air transportation. The DOT’s jurisdiction extends to authorized types of operations and aviation route authority and to other regulatory matters, including the transfer of route authority between carriers. USA Jet holds various certificates issued by the DOT, including a domestic certificate authorizing USA Jet to engage in U.S. air transportation and a foreign certificate authorizing international air transportation of property. In addition, USA Jet is subject to non-U.S. government regulation of aviation rights involving non-U.S. jurisdictions, and non-U.S. customs regulation.
The TSA has responsibility for aviation security. The TSA continues to require USA Jet to comply with a Full All-Cargo Aircraft Operator Standard Security Program and the Twelve-Five Standard Security Program, which contain evolving and strict security requirements. These requirements are not static, but change periodically as the result of regulatory and legislative requirements, imposing additional security costs and creating a level of uncertainty for our operations.
We are also subject to various environmental and safety requirements, including those governing the handling, disposal, and release of hazardous materials, which we may be asked to transport in the course of our operations. If hazardous materials are released into the environment while being transported, we may be required to participate in, or may have liability for response costs and the remediation of such a release. In such a case, we also may be subject to claims for personal injury, property damage, and damage to natural resources. Our business is also subject to changes in legislation and regulations, which can affect our operations and those of our competitors. For example, new laws and initiatives to reduce and mitigate the effects of greenhouse gas emissions could significantly impact the transportation industry. Future environmental laws in this area could adversely affect our ICs’ costs and practices and, consequently, our operations.
9
We are also subject to regulations to combat terrorism that the DHS and other agencies impose.
The international freight forwarding and customs brokerage services provided by our Ascent business are regulated by a variety of regulatory agencies and bodies including, but not limited to: the U.S. Federal Maritime Commission (“FMC”), the Bureau of Customs and Border Protection (“CBP”) and the TSA within the DHS (customs brokerage and security issues); the IATA; the DOT; the U.S. Food and Drug Administration (“FDA”); the U.S. Department of Agriculture (“USDA”); the U.S. Fish and Wildlife Service (“FWS”); the Bureau of Alcohol, Tobacco Products and Firearms (“BATF”); the U.S. Census Bureau; and other agencies or world governing bodies regulating international trade and compliance. Regulations and requirements must be strictly adhered to and can change periodically. Additionally, our Ascent business manages customer activities in numerous countries. As such, there may be risk associated with sudden fluctuations in currency, changes in economic policy, political unrest, changes to tariffs and trade policies/restrictions that are all outside of our control. Compliance with these changes may have a material impact on our operations and may increase our costs to service our customers.
Insurance
We insure our ICs and company drivers against third-party claims for accidents or damaged shipments and we bear the risk of such claims. We maintain insurance for auto liability, general liability, and cargo damage claims. We maintain an aggregate of $100 million of auto liability and general liability insurance. We maintain auto liability insurance coverage for claims in excess of $1.0 million per occurrence and cargo coverage for claims in excess of $100,000 per occurrence. Because we maintain insurance for our ICs, if our insurance does not cover all or any portion of the claim amount, we may be forced to bear the financial loss. We attempt to mitigate this risk by carefully selecting carriers with quality control procedures and safety ratings.
In addition to auto liability, general liability, and cargo claim coverage, our insurance policies also cover other standard industry risks related to workers’ compensation and other property and casualty risks. We are self-insured up to $1.0 million per claim for workers compensation. We believe our insurance coverage is comparable in terms and amount of coverage to other companies in our industry. We establish insurance reserves for anticipated losses and expenses and periodically evaluate and adjust the reserves to reflect our experience.
Financial Information About Segments
See Note 15 “Segment Reporting” to the consolidated financial statements in this Form 10-K for financial information about our segments.
2018 Developments
Series E-1 Preferred Stock Investment Agreement and Related Issuances
On March 1, 2018, we entered into the Series E-1 Preferred Stock Investment Agreement (the “Series E-1 Investment Agreement”) with affiliates of Elliott Management Corporation (“Elliott”), pursuant to which we agreed to issue and sell to Elliott from time to time until July 30, 2018, an aggregate of up to 54,750 shares of a newly created class of preferred stock designated as Series E-1 Cumulative Redeemable Preferred Stock, par value $0.01 per share (“Series E-1 Preferred Stock”), at a purchase price of $1,000 per share for the first 17,500 shares of Series E-1 Preferred Stock, $960 per share for the next 18,228 shares of Series E-1 Preferred Stock, and $920 per share for the final 19,022 shares of Series E-1 Preferred Stock. On March 1, 2018, the parties held an initial closing pursuant to which we issued and sold to Elliott 17,500 shares of Series E-1 Preferred Stock for an aggregate purchase price of $17.5 million. The proceeds of the sale of such shares of Series E-1 Preferred Stock were used to provide working capital to support our current operations and future growth and to repay a portion of the indebtedness under our Asset-Based Lending (“ABL”) facility with BMO Harris Bank, N.A. and certain other lenders dated July 21, 2017 (as amended, the “ABL Facility”) as required by the credit agreement governing that facility.
On April 24, 2018, pursuant to the Series E-1 Investment Agreement, we issued and sold to Elliott an additional 18,228 shares of Series E-1 Preferred Stock for an aggregate purchase price of $17.5 million. The proceeds of the sale of such shares of Series E-1 Preferred Stock were used to provide working capital to support our current operations and future growth and to repay a portion of the indebtedness under our ABL Facility as required by the credit agreement governing that facility.
See Note 16 “Subsequent Events” to the consolidated financial statements in this Form 10-K for more information.
10
Available Information
Our principal executive offices are located at 1431 Opus Place, Suite 530, Downers Grove, Illinois 60515, and our telephone number is (414) 615-1500. Our website address is www.rrts.com. The information on our website is not incorporated by reference into this Form 10-K or in any other report or document we file with the Securities and Exchange Commission (“SEC”).
We file reports with the SEC, including Annual Reports on Form 10-K, Quarterly Reports on Form 10-Q, Current Reports on Form 8-K, and any other filings required by the SEC. Through our website, we make available free of charge our Annual Reports on Form 10-K, Quarterly Reports on Form 10-Q, Current Reports on Form 8-K, and all amendments to those reports, as soon as reasonably practicable after we electronically file such material with, or furnish it to, the SEC.
The public may read and copy any materials we file with, or furnish to, the SEC at the SEC's Public Reference Room at 100 F Street, NE, Washington, DC 20549. The public may obtain information on the operation of the Public Reference Room by calling the SEC at 1-800-SEC-0330. The SEC maintains an Internet site (www.sec.gov) that contains reports, proxy and information statements, and other information regarding issuers that file electronically with the SEC.
11
ITEM 1A. | RISK FACTORS |
You should carefully consider the risk factors set forth below as well as the other information contained in this Form 10-K, including our consolidated financial statements and related notes. Any of the following risks could materially and adversely affect our business, financial condition, or results of operations. In such a case, you may lose all or part of your investment. The risks described below are not the only risks facing us. Additional risks and uncertainties not currently known to us or those we currently view to be immaterial may also materially adversely affect our business, financial condition, or results of operations.
We have identified material weaknesses in our internal control over financial reporting which could, if not remediated, adversely affect our ability to report our financial condition and results of operations in a timely and accurate manner, investor confidence in our company, and the value of our common stock.
Our management is responsible for establishing and maintaining adequate internal control over financial reporting as defined in Rules 13a-15(f) and 15d-15(f) under the Exchange Act and based upon the criteria established in Internal Control - Integrated Framework (2013) issued by the Committee of Sponsoring Organizations of the Treadway Commission (the “COSO framework”). Our internal control over financial reporting is a process designed to provide reasonable assurance regarding the reliability of our financial reporting and preparation of our financial statements for external purposes in accordance with generally accepted accounting principles (“GAAP”). Management is also responsible for reporting on the effectiveness of internal control over financial reporting.
We did not maintain an effective control environment based on the criteria established in the COSO framework. We have identified deficiencies in the principles associated with the control environment of the COSO framework. Specifically, these control deficiencies constitute material weaknesses, either individually or in the aggregate, relating to: (i) our commitment to integrity and ethical values, (ii) the ability of our board of directors to effectively exercise oversight of the development and performance of internal control, as a result of failure to communicate relevant information within our organization and, in some cases, withholding information, (iii) appropriate organizational structure, reporting lines, and authority and responsibilities in pursuit of objectives, (iv) our commitment to attract, develop, and retain competent individuals, and (v) holding individuals accountable for their internal control related responsibilities. These material weaknesses resulted in material accounting errors.
We did not maintain an effective control environment to enable the identification and mitigation of risks of material accounting errors, based on the contributing factors to material weakness in the control environment, including:
• | The tone from former executive management was insufficient to create the proper environment for effective internal control over financial reporting and to ensure that (i) there were adequate processes for oversight, (ii) there was accountability for the performance of internal control over financial reporting responsibilities, (iii) identified issues and concerns were raised to appropriate levels within our organization, (iv) corrective activities were appropriately applied, prioritized, and implemented in a timely manner, and (v) relevant information was communicated within our organization and not withheld from our independent directors, our Audit Committee, and our independent auditors. |
• | In certain operating companies and at our corporate headquarters there were inconsistent accounting systems, policies, and procedures. Additionally, in certain locations we did not attract, develop, and retain competent management, accounting, financial reporting, internal audit, and information systems personnel or resources to ensure that internal control responsibilities were performed and that information systems were aligned with internal control objectives. |
• | Our oversight processes and procedures that guide individuals in applying internal control over financial reporting were not adequate in preventing or detecting material accounting errors, or omissions due to inadequate information and, in certain instances, management override of internal controls, including recording improper accounting entries, recording accounting entries that were inconsistent with information known by management at the time, not communicating relevant information within our organization and, in some cases, withholding information from our independent directors, our Audit Committee, and our independent auditors. |
Additionally, we have identified control deficiencies that constituted material weaknesses in the principles associated with the risk assessment, control activities, information and communication and monitoring activities components of the COSO framework. Refer to Item 9A. “Controls and Procedures” of this Form 10-K for more information.
As a result of such material weaknesses, our management concluded that our disclosure controls and procedures and internal control over financial reporting were not effective as of December 31, 2017.
A “material weakness” is a deficiency, or a combination of deficiencies, in internal control over financial reporting, such that there is a reasonable possibility that a material misstatement of our annual or interim consolidated financial statements will not be prevented or detected on a timely basis. We are actively engaged in developing and implementing a remediation plan designed to address these material weaknesses, but our remediation efforts are not complete and are ongoing. Although we are working to remedy the ineffectiveness of our internal control over financial reporting, there can be no assurance as to when the remediation
12
plan will be fully developed, when it will be fully implemented, or the aggregate cost of implementation. Until our remediation plan is fully implemented, our management will continue to devote significant time and attention to these efforts. If we do not complete our remediation in a timely fashion, or at all, or if our remediation plan is inadequate, there will continue to be an increased risk that we will be unable to timely file future periodic reports with the SEC and that our future consolidated financial statements could contain errors that will be undetected. If we are unable to report our results in a timely and accurate manner, we may not be able to comply with the applicable covenants in our financing arrangements, and may be required to seek additional amendments or waivers under these financing arrangements, which could adversely impact our liquidity and financial condition. Further and continued determinations that there are material weaknesses in the effectiveness of our internal control over financial reporting could reduce our ability to obtain financing or could increase the cost of any financing we obtain and require additional expenditures of both money and our management’s time to comply with applicable requirements.
Any failure to implement or maintain required new or improved controls, or any difficulties we encounter in their implementation, could result in additional material weaknesses or material misstatements in our consolidated financial statements. Any new misstatement could result in a further restatement of our consolidated financial statements, cause us to fail to meet our reporting obligations, reduce our ability to obtain financing, or cause investors to lose confidence in our reported financial information, leading to a decline in our stock price. We cannot assure you that we will not discover additional weaknesses in our internal control over financial reporting.
Further, we may be the subject of negative publicity focusing on the restatement of our previously issued financial results and related matters, and may be adversely impacted by negative reactions from our stockholders, creditors, or others with which we do business. This negative publicity may impact our ability to attract and retain customers, employees, drivers, and vendors. The occurrence of any of the foregoing could harm our business and reputation and cause the price of our securities to decline.
The restatement of our previously issued financial results has resulted in private litigation, derivative lawsuits, and government agency investigations and actions, and could result in additional litigation, government agency investigations, and enforcement actions.
Following our press release on January 30, 2017, three putative class actions were filed in the United States District Court for the Eastern District of Wisconsin against us and our former officers, Mark A. DiBlasi and Peter R. Armbruster. On May 19, 2017, the Court consolidated the actions under the caption In re Roadrunner Transportation Systems, Inc. Securities Litigation (Case No. 17-cv-00144), and appointed Public Employees’ Retirement System as lead plaintiff. On March 12, 2018, the lead plaintiff filed a Consolidated Amended Complaint (“CAC”) on behalf of a class of persons who purchased our common stock between March 14, 2013 and January 30, 2017, inclusive. The CAC alleges (i) we and Messrs. DiBlasi and Armbruster violated Section 10(b) of the Exchange Act and Rule 10b-5, and (ii) Messrs. DiBlasi and Armbruster, our former Chairman Scott Rued, HCI Equity Partners, L.L.C., and HCI Equity Management, L.P. violated Section 20(a) of the Exchange Act, by making or causing to be made materially false or misleading statements, or failing to disclose material facts, regarding (a) the accuracy of our financial statements; (b) our true earnings and expenses; (c) the effectiveness of our disclosure controls and controls over financial reporting; (d) the true nature and depth of financial risk associated with our tractor lease guaranty program; (e) our leverage ratios and compliance with its credit facilities; and (f) the value of the goodwill we carried on our balance sheet. The CAC seeks certification as a class action, compensatory damages, and attorney’s fees and costs. The parties are currently engaged in mediation.
On May 25, 2017, Richard Flanagan filed a complaint alleging derivative claims on our behalf in the Circuit Court of Milwaukee County, State of Wisconsin (Case No. 17-cv-004401) against Scott Rued, Mark DiBlasi, Christopher Doerr, John Kennedy, III, Brian Murray, James Staley, Curtis Stoelting, William Urkiel, Judith Vijums, Michael Ward, Chad Utrup, Ivor Evans, Peter Armbruster, and Brian van Helden. Count I of the Complaint alleges the Director Defendants breached their fiduciary duties by “knowingly failing to ensure that we implemented and maintained adequate internal controls over its accounting and financial reporting functions,” and seeks unspecified damages. Count II of the Complaint alleges the Officer Defendants DiBlasi, Armbruster, and van Helden received substantial performance-based compensation and bonuses for fiscal year 2014 that should be disgorged. The action has been stayed by agreement pending a decision on an anticipated motion to dismiss the Amended Complaint filed in the securities class action described above. The parties are currently engaged in mediation.
On June 28, 2017, Jesse Kent filed a complaint alleging derivative claims on our behalf and class action claims in the United States District Court for the Eastern District of Wisconsin. On December 22, 2017, Chester County Employees Retirement Fund filed a Complaint alleging derivative claims on our behalf in the United States District Court for the Eastern District of Wisconsin. On March 21, 2018, the Court entered an order consolidating the Kent and Chester County actions under the caption In re Roadrunner Transportation Systems, Inc. Stockholder Derivative Litigation (Case No. 17-cv-00893). On March 28, 2018, Plaintiffs filed their Verified Consolidated Shareholder Derivative Complaint alleging claims on our behalf against Peter Armbruster, Mark DiBlasi, Scott Dobak, Christopher Doerr, Ivor Evans, Brian van Helden, John Kennedy III, Ralph Kittle, Brian Murray, Scott Rued, James Staley, Curtis Stoelting, William Urkiel, Chad Utrup, Judith Vijums, and Michael Ward. Count I alleges that several of the Defendants violated Section 14(a) of the Exchange Act and Rule 14a-9 based upon alleged misrepresentations and omissions in
13
several of our proxy statements. Count II alleges that all the Defendants breached their fiduciary duty. Count III alleges that all the Defendants wasted corporate assets. Count IV alleges that certain of the Defendants were unjustly enriched. The Complaint seeks monetary damages, improvements to our corporate governance and internal procedures, an accounting from Defendants of the damages allegedly caused by them and the improper amounts the Defendants allegedly obtained, and punitive damages. The parties are currently engaged in mediation.
In addition, subsequent to our announcement that certain previously filed financial statements should not be relied upon, we were contacted by the SEC, FINRA, and the Department of Justice. The Department of Justice and Division of Enforcement of the SEC have commenced investigations into the events giving rise to the restatement. We have received formal requests for documents and other information. In addition, in June 2018 two of our former employees were indicted on charges of conspiracy, securities fraud, and wire fraud as part of the ongoing DOJ and SEC investigation. We are cooperating fully with the joint DOJ and SEC investigation.
We cannot predict the outcome of these matters, or whether any other actions or proceedings will be filed against us in the future, and the cost of defending such actions or proceedings could be material. Furthermore, defending such actions or proceedings could divert our management and key personnel from our business operations. If we are found liable in any actions or proceedings, we may have to pay substantial damages or change the way we conduct our business, either of which may have a material adverse effect on our business, operating results, financial condition, and prospects. There may also be negative publicity associated with litigation or regulatory proceedings that could harm our business and reputation and cause the price of our securities to decline.
The restatement of our previously issued financial statements was time-consuming and expensive and could expose us to additional risks that could adversely affect our financial position, results of operations, and cash flows.
As described in Amendment No. 1 to our Annual Report on Form 10-K/A for the year ended December 31, 2015, Amendment No. 1 to our Quarterly Reports on Form 10-Q/A for the quarters ended March 31, 2016, June 30, 2016, and September 30, 2016, and Note 15 “Restatement of Previously Issued Financial Statements” to the consolidated financial statements in our Annual Report on Form 10-K for the year ended December 31, 2016, we restated our previously issued consolidated financial statements for the years ended December 31, 2015, 2014, and 2013, and each of the quarters ended March 31, 2016, June 30, 2016, and September 30, 2016, as well as the quarters in the years ended December 31, 2015 and 2014. The restatement was time-consuming and expensive and could expose us to a number of additional risks that could adversely affect our financial position, results of operations, and cash flows.
In particular, we have incurred significant expense, including audit, legal, consulting, and other professional fees, as well as fees related to amendments to our prior senior credit facility, the Investment Agreement, dated May 1, 2017, with Elliott (“Investment Agreement”), and our ABL Facility, in connection with the restatement of our previously issued consolidated financial statements and the ongoing remediation of material weaknesses in our internal control over financial reporting. We have taken a number of steps, including both adding internal personnel and hiring outside consultants, and intend to continue to take appropriate and reasonable steps to strengthen our accounting function and reduce the risk of additional misstatements in our financial statements. For more details about our remediation plan, see Item 9A. “Controls and Procedures.” To the extent these steps are not successful, we may have to incur additional time and expense. Our management’s attention has also been, and may further be, diverted from the operation of our business in connection with the restatement and ongoing remediation of material weaknesses in our internal controls.
We are also subject to claims, investigations, and proceedings arising out of the errors in our previously issued financial statements, including securities class action litigation, derivative lawsuits, and government agency investigations.
One or more significant claims or the cost of maintaining our insurance could have an adverse effect on our results of operations.
We employ approximately 1,400 drivers and use the services of thousands of ICs and transportation companies and their drivers in connection with our transportation operations. We also provide air freight services with our fleet of 11 cargo jets. From time to time, these drivers or pilots are, or may be, involved in accidents which may cause injuries and in which goods carried by them are lost or damaged. Such accidents usually result in equipment damage and, unfortunately, can also result in injuries or death. Our involvement in the transportation of certain goods, including, but not limited to, hazardous materials, could also increase our exposure in the event of an accident resulting in injuries or contamination. The resulting types and/or amounts of damages may under any of these circumstances be excluded by or exceed the amount of our insurance coverage or the insurance coverage maintained by the contracted carrier. Although most of these drivers are ICs or work for third-party carriers, from time to time claims may be asserted against us for their actions or for our actions in retaining them. Claims against us may exceed the amount of our insurance coverage, or may not be covered by insurance at all. A material increase in the frequency or severity of accidents, claims for lost or damaged goods, liability claims, workers' compensation claims, or unfavorable resolutions of any such claims could adversely affect our results of operations to the extent claims are not covered by our insurance or such losses exceed our reserves. Significant increases in insurance costs or the inability to purchase insurance as a result of these claims could also reduce
14
our profitability and have an adverse effect on our results of operations. The timing of the incurrence of these costs could also significantly and adversely impact our operating results compared to prior periods.
Increased insurance premium costs could have an adverse effect on our results of operations.
Insurance carriers may increase premiums for transportation companies generally. We could also experience additional increases in our insurance premiums in the future if our claims experience worsens. If our insurance or claims expense increases and we are unable to offset the increase with higher freight rates, our results of operations could be adversely affected. Furthermore, we may not be able to maintain or obtain sufficient or desired levels of insurance at reasonable rates. In some instances, certain insurance could become unavailable or available only for reduced amounts of coverage. If we were to incur a significant liability for which we were not fully insured, it could have an adverse effect on our results of operations and financial position.
The cost of compliance with, liability for violations of, or modifications to existing or future governmental laws and regulations could adversely affect our business and results of operations.
Our operations are regulated and licensed by various federal and state agencies in the United States and similar governmental agencies in foreign countries in which we operate. These regulatory agencies have authority and oversight of domestic and international transportation services and related activities, licensure, motor carrier operations, safety and security, and other matters. We must comply with various insurance and surety bond requirements to act in the capacities for which we are licensed. Our subsidiaries and ICs must also comply with applicable regulations and requirements of such agencies.
Through our subsidiaries, we hold various licenses required to carry out our domestic and international services. These licenses permit us to provide services as a motor carrier, property broker, air carrier, indirect air carrier, ocean transportation intermediary, non-vessel operating common carrier, freight forwarder, and ocean freight forwarder. We also are subject to regulations and requirements promulgated by, among others, the DOT, FMCSA, DHS, CBP, TSA, FMC, IATA, FDA, USDA, FWS, BATF, FAA and various other international, domestic, state, and local agencies and port authorities. Our failure to maintain our required licenses, or to comply with applicable regulations, could materially and adversely affect our business, results of operations, or financial condition. See the section entitled “Regulation” in Item 1 of this Form 10-K for more information.
In addition, DHS regulations applicable to our customers who import goods into the United States and our contracted ocean carriers may impact our ability to provide and/or receive services with and from these parties. Enforcement measures related to violations of these regulations can slow and/or prevent the delivery of shipments, which may negatively impact our operations.
We incur significant costs to operate our business and monitor our compliance with applicable laws and regulations. The regulatory requirements governing our operations are subject to change based on new legislation and regulatory initiatives, which could affect the economics of the transportation industry by requiring changes in operating practices or influencing the demand for, and the cost of providing, transportation services. We cannot predict what impact future regulations may have on our business. Compliance with existing, new, or more stringent measures could disrupt or impede the timing of our deliveries and our ability to satisfy the needs of our customers. In addition, we may experience an increase in operating costs, such as security costs, as a result of governmental regulations that have been and will be adopted in response to terrorist activities and potential terrorist activities. The cost of compliance with existing or future measures could adversely affect our results of operations. Further, we could become subject to liabilities as a result of a failure to comply with applicable regulations.
On December 22, 2017, the Tax Cuts and Jobs Act (the “Tax Reform Act”) was signed into United States law, and most changes became effective as of January 1, 2018. Although we expect that, as a result of the reduction in the corporate income tax rates from 35% to 21% and other changes to law, the Tax Reform Act will be financially and cash flow beneficial to us, we are continuing to review the provisions of the Tax Reform Act and have not yet fully determined the effect they will have on us.
Jeffrey Cox and David Chidester filed a Complaint against certain of our subsidiaries in state court in California in a post-acquisition dispute. The Complaint alleges contract, statutory and tort based claims arising out of the Stock Purchase Agreement, dated November 2, 2012, between the defendants, as buyers, and the plaintiffs, as sellers, for the purchase of the shares of Central Cal Transportation, Inc. and Double C Transportation, Inc. (the “Central Cal Agreement”). The plaintiffs claim that a contingent purchase obligation payment is due and owing pursuant to the Central Cal Agreement, and that defendants have furnished fraudulent calculations to the plaintiffs to avoid payment. The plaintiffs also claim violations of California’s Labor Code related to the plaintiffs’ respective employment with Central Cal Transportation, LLC. On October 27, 2017, the state court granted our motion to compel arbitration of all non-employment claims alleged in the Complaint. The plaintiffs are now required to comply with the dispute resolution process outlined in the Central Cal Agreement, and submit the dispute to a Settlement Accountant. In February 2018, Plaintiff David Chidester agreed to dismiss his employment-related claims from the Los Angeles Superior Court matter, while Plaintiff Jeffrey Cox transferred his employment claims from Los Angeles Superior Court to the related employment case pending in the Eastern District of California. The parties are proceeding with discovery.
15
In addition to the legal proceeding described above, we are a defendant in various purported class-action lawsuits alleging violations of various California labor laws and one purported class-action lawsuit alleging violations of the Illinois Wage Payment and Collection Act. Additionally, the California Division of Labor Standards and Enforcement has brought administrative actions against us alleging that we violated various California labor laws. In 2017 and 2018, we reached settlement agreements on a number of these labor related lawsuits and administrative actions. As of December 31, 2017, and December 31, 2016, we recorded a reserve for settlements, litigation, and defense costs related to these labor matters and post-acquisition disputes of approximately $13.2 million and $10.4 million, respectively, which are recorded in accrued expenses and other current liabilities.
Our operations are subject to various environmental laws and regulations, the violation of which could result in substantial fines or penalties.
From time to time, we arrange for the movement of hazardous materials at the request of our customers. As a result, we are subject to various environmental laws and regulations relating to the handling, transport, and disposal of hazardous materials. If our customers or carriers are involved in an accident involving hazardous materials, or if we are found to be in violation of applicable laws or regulations, we could be subject to substantial fines or penalties, remediation costs, or civil and criminal liability, any of which could have an adverse effect on our business and results of operations. In addition, current and future laws and regulations relating to carbon emissions and the effects of global warming can be expected to have a significant impact on the transportation sector generally and the operations and profitability of some of our carriers in particular, which could adversely affect our business and results of operations.
A decrease in levels of capacity in the over-the-road freight sector could have an adverse impact on our business.
The current operating environment in the over-the-road freight sector resulting from fluctuating fuel costs, industry-specific regulations (such as the CSA and hours-of-service rules and the changes implemented under Moving Ahead for Progress in the 21st Century (“MAP-21”)), a shortage of qualified drivers, and other economic factors are causing a tightening of capacity in the sector generally, and in our carrier network specifically, which could have an adverse impact on our ability to execute our business strategy and on our business.
We have not successfully managed, and may not in the future manage, our growth or operations.
We have grown substantially, including by expanding our internal resources, making acquisitions, and entering into new markets. We have experienced, and may in the future experience, difficulties and higher-than-expected expenses in executing this strategy as a result of unfamiliarity with new markets, change in revenue and business models, and entering into new geographic areas. For example, as described in Part II, Item 9A. “Controls and Procedures” of this Form 10-K, based on the Audit Committee Investigation, current management determined that there were deficiencies in the design and/or execution of internal controls that constituted material weaknesses, with one of the contributing factors being the increased size and complexity of our company arising from the acquisition of 25 non-public companies between February 2011 and September 2015.
Our growth has placed, and will in the future place, a significant strain on our management and our operational and financial resources. We need to continually improve existing procedures and controls as well as implement new transaction processing, operational and financial systems, and procedures and controls to expand, train, and manage our employee base. Our working capital needs have increased substantially as our operations have grown. Failure to manage growth effectively, or obtain necessary working capital, has in the past had, and could in the future have, a material adverse effect on our business, results of operations, financial position, and cash flows.
Our outstanding debt and preferred stock could adversely affect our business and limit our ability to expand our business or respond to changes, and we may be unable to generate sufficient cash flow to satisfy our debt service and preferred stock obligations.
As of December 31, 2017, we had debt of $202.9 million and preferred stock of $263.3 million, which is classified as a liability on the consolidated financial statements. See Note 5 “Debt” and Note 6 “Preferred Stock” to the consolidated financial statements in this Form 10-K for further information. On March 1, 2018, we entered into the Series E-1 Investment Agreement with Elliott, pursuant to which we agreed to issue and sell to Elliott from time to time until July 30, 2018, an aggregate of up to 54,750 shares of Series E-1 Preferred Stock at a purchase price of $1,000 per share for the first 17,500 shares of Series E-1 Preferred Stock, $960 per share for the next 18,228 shares of Series E-1 Preferred Stock, and $920 per share for the final 19,022 shares of Series E-1 Preferred Stock. On March 1, 2018, the parties held an initial closing pursuant to which we issued and sold to Elliott 17,500 shares of Series E-1 Preferred Stock for an aggregate purchase price of $17.5 million. On April 24, 2018, the parties held a closing pursuant to the Series E-1 Investment Agreement, pursuant to which we issued and sold to Elliott 18,228 shares of Series E-1 Preferred Stock for an aggregate purchase price of approximately $17.5 million. See Note 16 “Subsequent Events” to the consolidated financial statements in this Form 10-K for further information. We may incur additional indebtedness in the future, including any additional borrowings available under the ABL Facility, and we may issue additional shares of preferred stock, including additional shares of Series E-1 Preferred Stock under the Series E-1 Investment Agreement. Any substantial debt or outstanding preferred stock and
16
the fact that a substantial portion of our cash flow from operating activities could be needed to make payments on our debt or outstanding preferred stock could have adverse consequences, including the following:
• | reducing the availability of our cash flow for our operations, capital expenditures, future business opportunities, and other purposes; |
• | limiting our flexibility in planning for, or reacting to, changes in our business and the industries in which we operate, which would place us at a competitive disadvantage compared to our competitors that may have less debt or outstanding preferred stock; |
• | limiting our ability to borrow additional funds; and |
• | increasing our vulnerability to general adverse economic and industry conditions. |
Our ability to borrow any funds needed to operate and expand our business will depend in part on our ability to generate cash. Our ability to generate cash is subject to the performance of our business as well as general economic, financial, competitive, legislative, regulatory, and other factors that are beyond our control. If our business does not generate sufficient cash flow from operating activities or if future borrowings are not available to us under our ABL Facility or otherwise in amounts sufficient to enable us to fund our liquidity needs, our operating results, financial condition, and ability to maintain or expand our business may be adversely affected. Moreover, our inability to make scheduled payments on our debt or preferred stock obligations in the future would require us to refinance all or a portion of our debt and/or preferred stock on or before maturity, sell assets, delay capital expenditures, or seek additional equity.
We have had, and may have in the future, difficulties integrating acquired companies.
For acquisitions, success is also dependent upon efficiently integrating the acquired business into our existing operations. We are required to integrate these businesses into our internal control environment, which may present challenges that are different than those presented by organic growth and that may be difficult to manage. For example, as described in Part II, Item 9A. “Controls and Procedures” of this Form 10-K, based on the Audit Committee Investigation, current management determined that there were deficiencies in the design and/or execution of internal controls that constituted material weaknesses, with one of the contributing factors being the increased size and complexity of our company arising from the acquisition of 25 non-public companies between February 2011 and September 2015. The possible difficulties of integration include, among others: retention of customers and key employees; unanticipated issues in the assimilation and consolidation of information, communications, and other systems; inefficiencies and difficulties that arise because of unfamiliarity with potentially new geographic areas and new assets and the businesses associated with them; consolidation of corporate and administrative infrastructures; the diversion of management's attention from ongoing business concerns; the effect on internal controls and compliance with the regulatory requirements under the Sarbanes-Oxley Act of 2002; and unanticipated issues, expenses, and liabilities. The diversion of management's attention from our current operations to the acquired operations and any difficulties encountered in combining operations has prevented us, and could in the future prevent us, from realizing the full benefits anticipated to result from the acquisitions and has adversely impacted, and could in the future adversely impact, our results of operations and financial condition. Also, following an acquisition, we may discover previously unknown liabilities associated with the acquired business for which we have no recourse under applicable indemnification provisions. If we are unable to successfully integrate and grow these acquisitions and to realize contemplated revenue synergies and cost savings, our business, prospects, results of operations, financial position, and cash flows could be materially and adversely affected.
Any acquisitions that we undertake could be difficult to integrate, disrupt our business, dilute stockholder value, and adversely affect our results of operations.
We may increase our revenue and expand our offerings in the market regions that we serve through the acquisition of complementary businesses. We cannot guarantee that we will be able to identify suitable acquisitions or investment candidates. Even if we identify suitable candidates, we cannot guarantee that we will make acquisitions or investments on commercially acceptable terms, if at all. In addition, we may incur debt or be required to issue equity securities to pay for future acquisitions or investments. The issuance of any equity securities could be dilutive to our stockholders.
Strategic acquisitions involve numerous risks, including the following:
• | failure of the acquired company to achieve anticipated revenues, earnings, or cash flows; |
• | assumption of liabilities that were not disclosed to us or that exceed our estimates; |
• | problems integrating the purchased operations with our own, which could result in substantial costs and delays or other operational, technical, or financial problems; |
17
• | potential compliance issues with regard to acquired companies that did not have adequate internal controls; |
• | diversion of management's attention or other resources from our existing business; |
• | risks associated with entering markets in which we have limited prior experience; and |
• | potential loss of key employees and customers of the acquired company. |
Our ABL Facility contains financial and other restrictive covenants with which we may be unable to comply. A default under these financing arrangements could cause a material adverse effect on our liquidity, financial condition, and results of operations.
The loans outstanding under our ABL Facility are secured by a first priority lien on certain real property owned by our domestic subsidiaries and substantially all of our and our domestic subsidiaries' tangible and intangible personal property, including a pledge of the capital stock of certain of our direct and indirect subsidiaries. Our ABL Facility contains conditions, representations and warranties, events of default, and indemnification provisions that are customary for financings of this type, including, but not limited to, a minimum fixed charge coverage ratio, and limitations on incurrence of debt, investments, liens on assets, transactions with affiliates, mergers, consolidations, and purchases and sales of assets.
If we incur defaults under the terms of this facility and fail to obtain appropriate amendments to or waivers under the applicable financing arrangement, our borrowings against the facility could be immediately declared due and payable. If we fail to pay the amount due, the lenders could proceed against the collateral by which our loans are secured, our borrowing capacity may be limited, or the facility could be terminated. If acceleration of outstanding borrowings occurs or if the facilities are terminated, we may have difficulty borrowing additional funds sufficient to refinance the accelerated debt or entering into new credit or debt arrangements, and, if available, the terms of the financing may not be acceptable. A default under our ABL Facility could have a material adverse effect on our liquidity and financial condition.
Fluctuations in the price or availability of fuel and limitations on our ability to collect fuel surcharges may adversely affect our results of operations.
We are subject to risks associated with fuel charges from our ICs, purchased power providers, and aircraft in our TL and LTL businesses. The availability and price of fuel are subject to political, economic, and market factors that are outside of our control. Fuel prices have fluctuated dramatically over recent years. Over time we have been able to mitigate the impact of the fluctuations through our fuel surcharges which are closely linked to the market price for fuel. There can be no assurance that our fuel surcharge revenue programs will be effective in the future. Market pressures may limit our ability to assess our fuel surcharges. At the request of our customers, we have at times temporarily capped the fuel surcharges at a fixed percentage pursuant to contractual arrangements that vary by customer. Currently, a minimal number of our customers have contractual arrangements with varying levels of capped fuel surcharges. If fuel surcharge revenue programs, base freight rate increases, or other cost-recovery mechanisms do not offset our exposure to rising fuel costs, our results of operations could be adversely affected.
A significant or prolonged economic downturn in the transportation industry, or a substantial downturn in our customers' business, could adversely affect our revenue and results of operations.
The transportation industry has historically experienced cyclical fluctuations in financial results due to, among other things, economic recession, downturns in business cycles, increasing costs and taxes, fluctuations in energy prices, price increases by carriers, changes in regulatory standards, license and registration fees, interest rate fluctuations, and other economic factors beyond our control. All of these factors could increase the operating costs of a vehicle and impact capacity levels in the transportation industry. Our ICs or purchased power providers may charge higher prices to cover higher operating expenses, and our operating income may decrease if we are unable to pass through to our customers the full amount of higher purchased transportation costs. Additionally, economic conditions may adversely affect our customers, their need for our services, or their ability to pay for our services.
We operate in a highly competitive industry and, if we are unable to adequately address factors that may adversely affect our revenue and costs, our business could suffer.
Competition in the transportation services industry is intense. We face significant competition in local, regional, national, and international markets. Increased competition may lead to revenue reductions, reduced profit margins, or a loss of market share, any one of which could harm our business. There are many factors that could impair our ability to maintain our current profitability, including the following:
• | competition with other transportation services companies, some of which have a broader coverage network, a wider range of services, and greater capital resources than we do; |
18
• | reduction by our competitors of their freight rates to gain business, especially during times of declining growth rates in the economy, which reductions may limit our ability to maintain or increase freight rates, maintain our operating margins, or maintain significant growth in our business; |
• | solicitation by shippers of bids from multiple carriers for their shipping needs and the resulting depression of freight rates or loss of business to competitors; |
• | development of a technology system similar to ours by a competitor with sufficient financial resources and comparable experience in the transportation services industry; and |
• | establishment by our competitors of cooperative relationships to increase their ability to address shipper needs. |
We have experienced significant recent turnover in our executive leadership team. If we fail to effectively integrate and retain these new executives, we may not be able to accomplish our growth strategy and our financial performance may suffer.
Since the beginning of 2017, we have experienced significant turnover in our senior management ranks, including the appointment of our new Chief Executive Officer and President and Chief Operating Officer and the hiring of our new Chief Financial Officer. In April 2017, Curtis W. Stoelting was appointed our Chief Executive Officer and Michael L. Gettle was appointed our President and Chief Operating Officer. In May 2017, Terence R. Rogers was appointed our Chief Financial Officer. In addition, during 2017 we hired Scott B. Cousins as Chief Information Officer, a new President of our Roadrunner Freight business, and a new Senior Vice President of Human Resources. We also hired a new Corporate Controller, Vice President of Finance and Treasurer, and Director of Internal Audit. This lack of management continuity could adversely affect our ability to successfully execute our growth strategy, as well as result in operational and administrative inefficiencies and added costs, and may make recruiting for future management positions more difficult.
In addition, we must successfully integrate any new management personnel into our organization in order to achieve our operating objectives, and changes in other key management positions may affect our financial performance and results of operations while new management becomes familiar with our business. Accordingly, our future financial performance will depend to a significant extent on our ability to motivate and retain key management personnel. Competition for senior management is intense, and we may not be able to retain our management team or attract additional qualified personnel. The loss of a member of senior management would require our remaining executive officers to divert immediate and substantial attention to fulfilling the duties of the departing executive and to seeking a replacement. The inability to adequately fill vacancies in our senior executive positions on a timely basis could negatively affect our ability to implement our business strategy, which could adversely impact our results of operations.
Our business will be adversely impacted if we fail to develop, implement, maintain, upgrade, enhance, protect, and integrate our information technology systems.
We rely heavily on our information technology systems to efficiently run our business, and they are a key component of our customer-facing and internal growth strategy. In general, we expect our customers to continue to demand more sophisticated, fully integrated information systems from their transportation and logistics providers. To keep pace with changing technologies and customer demands, we must correctly interpret and address market trends and enhance the features and functionality of our technology systems in response to these trends. This process of continuous enhancement may lead to significant ongoing technology development costs which will continue to increase if we pursue new acquisitions of companies and their current systems. In addition, we may fail to accurately determine the needs of our customers or trends in the transportation services and logistics industries or we may fail to design and implement the appropriate responsive features and functionality for our technology systems in a timely and cost-effective manner. Any such failures could result in decreased demand for our services and a corresponding decrease in our revenues.
We must maintain and enhance the reliability and speed of our information technology systems to remain competitive and effectively handle higher volumes of freight through our network and the various service modes we offer. If our information technology systems are unable to manage additional volume for our operations as our business grows, or if such systems are not suited to manage the various service modes we offer, our service levels and operating efficiency could decline. In addition, if we fail to hire and retain qualified personnel to implement, protect, and maintain our information technology systems or if we fail to upgrade our systems to meet our customers’ demands, our business and results of operations could be harmed. This could result in a loss of customers or a decline in the volume of freight we receive from customers.
A failure of our information technology infrastructure or a breach of our information security systems, networks or processes may materially adversely affect our business.
The efficient operation of our business depends on our information technology systems. We rely on our information technology systems to effectively manage our sales and marketing, accounting and financial and legal and compliance functions,
19
communications, supply chain, order entry, and fulfillment and other business processes. We also rely on third parties and virtualized infrastructure to operate and support our information technology systems. Despite testing, external and internal risks, such as malware, code anomalies, “Acts of God,” data leakage, and human error pose a direct threat to the stability or effectiveness of our information technology systems and operations. The failure of our information technology systems to perform as we anticipate has in the past, and could in the future, adversely affect our business through transaction errors, billing and invoicing errors, internal recordkeeping and reporting errors, processing inefficiencies and loss of sales, receivables collection and customers, in each case, which could result in harm to our reputation and have an ongoing adverse impact on our business, results of operations and financial condition, including after the underlying failures have been remedied.
We may also be subject to cybersecurity attacks and other intentional hacking. Any failure to identify and address such defects or errors or prevent a cyber-attack could result in service interruptions, operational difficulties, loss of revenues or market share, liability to our customers or others, the diversion of corporate resources, injury to our reputation and increased service and maintenance costs. Addressing such issues could prove to be impossible or very costly and responding to resulting claims or liability could similarly involve substantial cost. In addition, recently, there has also been heightened regulatory and enforcement focus on data protection in the U.S. and abroad, and failure to comply with applicable U.S. or foreign data protection regulations or other data protection standards may expose us to litigation, fines, sanctions or other penalties, which could harm our reputation and adversely impact our business, results of operations and financial condition.
We have invested and continue to invest in technology security initiatives, information technology risk management and disaster recovery plans. The development and maintenance of these measures is costly and requires ongoing monitoring and updating as technologies change and efforts to overcome security measures become increasingly more sophisticated. Despite our efforts, we are not fully insulated from data breaches, technology disruptions or data loss, which could adversely impact our competitiveness and results of operations.
Our reliance on ICs to provide transportation services to our customers could impact our operations and ability to expand.
Our transportation services are conducted in part by ICs, who are generally responsible for paying for their own equipment, fuel, and other operating costs. Our ICs are responsible for providing the tractors and generally the trailers they use related to our business. Certain factors such as increases in fuel costs, insurance costs and the cost of new and used tractors, reduced financing sources available to ICs for the purchase of equipment, or the impact of CSA and hours-of-service rules could create a difficult operating environment for ICs. Turnover and bankruptcy among ICs in the over-the-road freight sector often limit the pool of qualified ICs and increase the competition among carriers for their services. If we are required to increase the amounts paid to ICs in order to obtain their services, our results of operations could be adversely affected to the extent increased expenses are not offset by higher freight rates. Additionally, our agreements with our ICs are terminable by either party upon short notice and without penalty. Consequently, we regularly need to recruit qualified ICs to replace those who have left our pool. If we are unable to retain our existing ICs or recruit new ICs, our results of operations and ability to expand our business could be adversely affected.
Our third-party carriers must meet our needs and expectations, and those of our customers, and their inability to do so could adversely affect our results of operations.
Our business depends to a large extent on our ability to provide consistent, high quality, technology-enabled transportation and logistics solutions. We generally do not own or control the transportation assets that deliver our customers' freight, and we generally do not employ the people directly involved in delivering the freight. We rely on third parties to provide less-than-truckload, truckload and intermodal brokerage, and domestic and international air services and to report certain information to us, including information relating to delivery status and freight claims. This reliance could cause delays in providing our customers with timely delivery of freight and important service data, as well as in the financial reporting of certain events, including recognizing revenue and recording claims. Carrier bankruptcy may also disrupt our business by delaying movement of the cargo, creating an inability to get access to equipment, and increasing our rates. If we are unable to secure sufficient transportation services to meet our customer commitments, or if any of the third parties we rely on do not meet our needs or expectations, or those of our customers, our results of operations could be adversely affected, and our customers could switch to our competitors temporarily or permanently.
If our ICs are deemed to be employees, our business and results of operations could be adversely affected.
We are a defendant in various purported class-action lawsuits alleging violations of various labor laws. We are a defendant in a number of purported class-action lawsuits alleging violations of various California labor laws and one purported class-action lawsuit alleging violations of the Illinois Wage Payment and Collection Act. Additionally, the California Division of Labor Standards and Enforcement has brought administrative actions against us alleging that we violated various California labor laws. In 2017 and 2018, we reached settlement agreements on a number of these labor related lawsuits and administrative actions. As of December 31, 2017, and December 31, 2016, we recorded a reserve for settlements, litigation, and defense costs related to these labor matters and post-acquisition disputes of approximately $13.2 million and $10.4 million, respectively, which are recorded in accrued expenses and other current liabilities.
20
In addition, tax and other regulatory authorities have in the past sought to assert that independent contractors in the trucking industry are employees rather than independent contractors. There can be no assurance that these authorities will not successfully assert this position against us or that tax and other laws that currently consider these persons ICs will not change. If our ICs are determined to be our employees, we would incur additional exposure under federal and state tax, workers' compensation, unemployment benefits, labor, employment, and tort laws, including for prior periods, as well as potential liability for employee benefits, tax withholdings, and penalties and interest. Our business model relies on the fact that our ICs are independent contractors and not deemed to be our employees, and exposure to any of the above factors could have an adverse effect on our business and results of operations.
California continues to present potential reclassification exposure to our company’s operations in that state, especially in light of the recent California Supreme Court decision in Dynamix Operations West, Inc. v. Lee, which found that the defendant’s independent contractors were properly classified as employees using the ABC test. Under the ABC test, a worker is presumed to be an employee unless the business proves that (A) the worker is free from the control and direction of the hirer in connection with the performance of the work, both under the contract for the performance of such work and in fact; (B) the worker performs work that is outside the usual course of the hiring entity’s business; and (C) the worker is customarily engaged in an independently established trade, occupation, or business of the same nature as the work performed for the hiring entity. However, as noted by the Court in Dynamix, any reclassification analysis under the ABC test is subject to the unique facts of each case and thus does not necessarily mean that our contractors in California would be reclassified as employees under California law.
If California interprets individual owner-operators to be in the same business as motor carriers, the individual owner-operators under lease to our companies would be considered employees for purposes of claims governed by wage order number 9, including minimum wage, overtime, meal and rest breaks, and wage statements. We have approximately 300 non-employee drivers in California that may be impacted by this interpretation.
Our financial results may be adversely impacted by potential future changes in accounting practices.
Future changes in accounting standards or practices, and related legal and regulatory interpretations of those changes, may adversely impact public companies in general, the transportation industry, or our operations specifically. New accounting standards or requirements could change the way we record revenues, expenses, assets, and/or liabilities or could be costly to implement. These types of regulations could have a negative impact on our financial position, liquidity, results of operations, and/or access to capital.
Seasonal sales fluctuations and weather conditions could have an adverse impact on our results of operations.
The transportation industry is subject to seasonal sales fluctuations as shipments are generally lower during and after the winter holiday season. The productivity of our carriers historically decreases during the winter season because companies have the tendency to reduce their shipments during that time and inclement weather can impede operations. At the same time, our operating expenses could increase because harsh weather can lead to increased accident frequency rates and increased claims, as well as reduced commodity production (i.e. poultry, beef, fruit, produce). These commodities and other products we transport are also subject to disease, crop failure, reduction in production quantities or adjustments to automotive model changeovers. Any of the fluctuations could have an adverse effect on our revenues. If we were to experience lower-than-expected revenue during any such period, our expenses may not be offset, which could have an adverse impact on our results of operations.
Terrorist attacks, anti-terrorism measures, and war could have broad detrimental effects on our business operations.
As a result of the potential for terrorist attacks, federal, state, and municipal authorities have implemented and continue to follow various security measures, including checkpoints and travel restrictions on large trucks. Such measures may reduce the productivity of our ICs or increase the costs associated with their operations, which we could be forced to bear. For example, security measures imposed at bridges, tunnels, border crossings, and other points on key trucking routes may cause delays and increase the non-driving time of our ICs, which could have an adverse effect on our results of operations. War, risk of war, or a terrorist attack also may have an adverse effect on the economy. A decline in economic activity could adversely affect our revenues or restrict our future growth. Instability in the financial markets as a result of terrorism or war also could impact our ability to raise capital. In addition, the insurance premiums charged for some or all of the coverage currently maintained by us could increase dramatically or such coverage could be unavailable in the future.
Our Ascent business derives a portion of its revenues from inventory management, the loss of which could have a negative impact on our financial condition, results of operations, and cash flows.
A portion of our Ascent business is involved with inventory and freight management for customers whose products are shipped to a limited number of big box retailers. Should these big box retailers change their supply chain practices and direct our customers to deliver product via another source, such change could have a negative impact on our Ascent business.
21
Our international operations subject us to operational and financial risks.
We provide transportation and logistics services to and from international locations and are, therefore, subject to risks of international business, including, but not limited to, the following:
• | changes in tariffs, trade restrictions, trade agreements, and taxations; |
• | difficulties in managing or overseeing foreign operations and agents; |
• | limitations on the repatriation of funds because of foreign exchange controls; |
• | different liability standards; and |
• | intellectual property laws of countries which do not protect our rights in our intellectual property, including, but not limited to, our proprietary information systems, to the same extent as the laws of the United States. |
We are also subject to compliance with the Foreign Corrupt Practices Act (“FCPA”). Failure to comply with the FCPA and local regulations in the conduct of our international business operations may result in legal claims against us.
The occurrence or consequences of any of these factors may restrict our ability to operate in the affected region and/or decrease the profitability of our operations in that region.
As we expand our business in foreign countries, we will be exposed to increased risk of loss from foreign currency fluctuations and exchange controls as well as longer accounts receivable payment cycles. We have limited control over these risks, and if we do not correctly anticipate changes in international economic and political conditions, we may not alter our business practices in time to avoid adverse effects.
Our ability to raise capital in the future may be limited, and our failure to raise capital when needed could prevent us from achieving our growth objectives.
We may in the future be required to raise capital through public or private financing or other arrangements. Such financing may not be available on acceptable terms, or at all, and our failure to raise capital when needed could harm our business. Additional equity financing may dilute the interests of our stockholders, and debt financing, if available, may involve restrictive covenants and could reduce our profitability. If we cannot raise funds on acceptable terms, we may not be able to grow our business or respond to competitive pressures.
Our total assets include goodwill, intangibles and other long-lived assets. If we determine that these items have become impaired in the future, our earnings could be adversely affected.
As of December 31, 2017, we had recorded goodwill of $264.8 million and other intangible assets, net of accumulated amortization, of $49.6 million. Goodwill represents the excess of purchase price over the estimated fair value assigned to the net tangible and identifiable intangible assets of a business acquired. Goodwill is evaluated for impairment annually or more frequently, if indicators of impairment exist. If the impairment evaluations for goodwill indicate the carrying amount exceeds the estimated fair value, an impairment loss is recognized in an amount equal to that excess. Our annual impairment evaluations of goodwill are performed at least annually as of July 1 and periodically if indicators or impairment are present.
We have four reporting units for our three segments: one reporting unit for our TL segment; one reporting unit for our LTL segment; and two reporting units for our Ascent segment, which are the Ascent reporting unit and the Warehousing & Consolidation reporting unit. We conducted our goodwill impairment analysis for each of our four reporting units at July 1, 2017 and determined that no impairment had occurred, as each reporting unit's fair value exceeded the carrying value.
As a result of the first step of our goodwill impairment analysis as of July 1, 2016, we determined that the fair value of the Ascent reporting unit exceeded its carrying value by 8.4%; thus, no impairment was indicated for this reporting unit. However, resulting from a combination of the weakened environment, the inability to meet forecast results, and the lower share price, we determined that the fair value of the TL, LTL, and Warehousing & Consolidation reporting units were less than their respective carrying values, requiring us to perform the second step of the goodwill impairment analysis for the TL, LTL, and Warehousing & Consolidation reporting units. We completed the second step of the goodwill impairment analysis and recorded in the third quarter of 2016 non-cash goodwill impairment charges of $157.5 million, $197.3 million, and $17.2 million for the TL, LTL, and Warehousing & Consolidation reporting units, respectively.
On September 15, 2017, we completed the sale of our wholly owned subsidiary Unitrans, Inc. (“Unitrans”). The sale of Unitrans, which was included in the Ascent reporting unit, resulted in an incremental impairment analysis on the remaining net assets of the Ascent reporting unit. We evaluated the remaining carrying value of the Ascent reporting unit and compared it to the
22
fair value of the remaining businesses in the Ascent reporting unit. As a result of this evaluation, we determined the carrying value exceeded the fair value and recorded a $4.4 million impairment charge in the third quarter of 2017.
In addition, throughout the year we may update our assumptions used in the calculation of the fair value of each reporting unit. Changes to our forecasts or the discount rate and/or growth rate assumptions based on current market conditions could affect the fair value of the reporting units and result in an indication of impairment for one or more of our reporting units. If we determine that our goodwill and intangible assets in any reporting units have become impaired in the future, our results of operations could be adversely affected.
If we are unable to expand the number of our sales representatives, or if a significant number of our existing sales representatives leave us, our ability to increase our revenue could be negatively impacted.
Our ability to expand our business will depend, in part, on our ability to attract additional sales representatives and brokerage agents. Competition for qualified sales representatives can be intense, and we may be unable to attract such persons. Any difficulties we experience in expanding the number of our sales representatives could have a negative impact on our ability to expand our customer base, increase our revenue, and continue our growth.
In addition, we must retain our current sales representatives and properly incentivize them to obtain new customers and maintain existing customer relationships. If a significant number of our sales representatives leave us, our revenue could be negatively impacted. A significant increase in the turnover rate among our current sales representatives could also increase our recruiting costs and decrease our operating efficiency.
Changes in our relationships with our significant customers, including the loss or reduction in business from one or more of them, could have an adverse impact on us.
We had one direct customer that accounted for approximately 12% of our 2017 and 2016 revenue. Our contractual relationships with customers generally are terminable at will by the customers on short notice and do not require the customer to provide any minimum commitment. Our customers could choose to divert all or a portion of their business with us to one of our competitors, demand rate reductions for our services, require us to assume greater liability that increases our costs, or develop their own logistics capabilities. Failure to retain our existing customers or enter into relationships with new customers could materially impact the growth in our business and the ability to meet our current and long-term financial forecasts.
The market value of our common stock may fluctuate and could be substantially affected by various factors.
The price of our common stock on the New York Stock Exchange (“NYSE”) constantly changes. We expect that the market price of our common stock will continue to fluctuate. Our share price may fluctuate as a result of a variety of factors, many of which are beyond our control. These factors include, among others:
• | actual or anticipated variations in earnings, financial or operating performance, or liquidity; |
• | changes in analysts' recommendations or projections; |
• | failure to meet analysts' projections; |
• | general economic and capital market conditions; |
• | announcements of developments related to our business; |
• | operating and stock performance of other companies deemed to be peers; |
• | actions by government regulators; |
• | news reports of trends, concerns, and other issues related to us or our industry, including changes in regulations; and |
• | other factors described in this “Risk Factors” section. |
Our common stock price may fluctuate significantly in the future, and these fluctuations may be unrelated to our performance. General market price declines or market volatility in the future could adversely affect the price of our common stock, and the current market price of our common stock may not be indicative of future market prices.
The NYSE could commence procedures to delist our common stock, in which case the market price of our shares might decline and become more volatile and our stockholders’ ability to trade in our stock could be adversely affected.
As a result of our failure to timely file our Form 10-K for the year ended December 31, 2017 with the SEC, as previously disclosed, we received a notice from the NYSE informing us that we were not in compliance with the NYSE’s continued listing
23
requirements under the timely filing criteria set forth in Section 802.01E of the NYSE Listed Company Manual and that we were subject to the procedures set forth in the NYSE’s listing standards related to late filings. Under the NYSE rules, we were provided with six months from April 3, 2018 to file the delinquent Annual Report on Form 10-K. In the event that we did not file the delinquent 2017 Annual Report on Form 10-K and the required 2018 Quarterly Reports on Form 10-Q by the end of that six-month period, we could receive up to an additional six-month extension at the discretion of the NYSE. While we are filing this Form 10-K, our Quarterly Report on Form 10-Q for the quarter ended March 31, 2018 has not been filed and we remain subject to the procedures set forth in the NYSE’s listing standards related to late filings and subject to the risk of delisting.
The continued listing of our common stock on the NYSE is also subject to our compliance with a number of quantitative listing standards, including that the average closing price of our common stock does not fall below $1.00 per share over a period of 30 consecutive trading days. On June 7, 2018, the closing price of our common stock as reported on the NYSE was $2.31 per share. If, however, the average closing price of our common stock falls below $1.00 per share over a period of 30 consecutive trading days, the NYSE may initiate procedures to suspend and delist our common stock.
If our common stock were delisted, there could be no assurance whether or when it would again be listed for trading on NYSE or any other exchange. Further, the market price of our shares might decline and become more volatile, and our stockholders may find that their ability to trade in our stock would be adversely affected. Furthermore, institutions whose charters do not allow them to hold securities in unlisted companies might sell our shares, perhaps very promptly, which could have a further adverse effect on the price of our stock.
In addition, if our common stock were delisted and we were unable to get our common stock listed for trading within one year, a Triggering Event (as defined in the Certificates of Designations for our Preferred Stock) would occur and, among other things, the dividend rate on certain series of our Preferred Stock would increase by 3.0%. See Note 6 “Preferred Stock” to the consolidated financial statements in this Form 10-K for further information.
Elliott may exercise influence over us, including through their ability to nominate and elect up to two (2) members of our board of directors.
Although the holders of our preferred stock will generally not be entitled to vote on any matters submitted to a vote of our stockholders, so long as any shares of our preferred stock are outstanding, we may not take certain actions without the prior approval of the holders of shares of our preferred stock representing a majority of the aggregate liquidation value of all of the shares of preferred stock (the “Preferred Requisite Vote”), voting as a separate class, including, among other matters:
• | amending, altering, repealing, or otherwise modifying any provision of our certificate of incorporation, certificate of designations or bylaws in a manner that would alter or change the terms or the powers, preferences, rights, or privileges of our preferred stock; |
• | declaring, paying, or setting aside for payment any dividends or distributions upon any junior securities; |
• | repurchasing, redeeming, or otherwise acquiring any junior securities or parity securities (other than for certain ordinary course purposes) for any consideration or paying any moneys or making available for a sinking fund for the redemption of any shares of such junior securities or parity securities; |
• | authorizing, creating, increasing the authorized amount of, or issuing any class or series of senior securities or parity securities, including any securities convertible into, or exchangeable or exercisable for, any senior securities or parity securities; |
• | amending, restating, supplementing, modifying, or replacing any debt agreement or other financing agreement which would restrict the minimum cash dividend payments contemplated by the certificates of designations for the Preferred Stock; or |
• | subject to various exceptions, incurring any indebtedness. |
Elliott may have interests that diverge from, or even conflict with, those of our other stockholders. For example, Elliott and its affiliates may have an interest in directly or indirectly pursuing acquisitions, divestitures, financings, or other transactions that, in their judgment, could enhance their other equity investments, even though such transactions might involve risks to us. Elliott and its affiliates are in the business of making or advising on investments in companies, including businesses that may directly or indirectly compete with certain portions of our business. They may also pursue acquisition opportunities that may be complementary to our business, and, as a result, those acquisition opportunities may not be available to us.
In addition, the terms of the Investment Agreement grant Elliott certain rights to designate directors to serve on our board of directors. For so long as (x) any shares of our Series B Preferred Stock or Series C Preferred Stock are issued and outstanding and (y) Elliott hold shares of Preferred Stock collectively representing a majority of the liquidation value of the Preferred Stock, the
24
holders of our Preferred Stock have the exclusive right, acting with the Preferred Requisite Vote, to nominate and elect two (2) individuals selected by the holders of Preferred Stock, or to require that our board of directors to fill two (2) vacancies in the board of directors with individuals selected by the holders of our Preferred Stock, to serve as, respectively, a Class II director and a Class III director of our company (the “Preferred Stock Directors”). Following the redemption of all shares of our Series B Preferred Stock and Series C Preferred Stock, and until such time as all shares of Series D Preferred Stock are redeemed, for so long as Elliott holds at least 5.0% of the equity value of our company, the holders of Preferred Stock have the exclusive right acting with the Preferred Requisite Vote, to (i) nominate and elect one (1) Preferred Stock Director, and (ii) designate one (1) individual to act as an observer to our board of directors. Until such time as all shares of Series B Preferred Stock has been redeemed, we will, upon the request of the holders of Preferred Stock, acting with the Preferred Requisite Vote, cause each of our Compensation Committee and Nominating and Corporate Governance Committee to include one Preferred Stock Director, in each case, to the extent permitted under applicable requirements of the NYSE or applicable law.
In addition, in the event of any Triggering Event (as defined in the Certificates of Designations for our Preferred Stock), subject to applicable rules of the NYSE, including, without limitation, independent director requirements, the number of directors constituting our board of directors will be increased such that the number of vacancies on our board of directors resulting from such increase (the “Triggering Event Vacancies”), together with the Preferred Stock Directors (to the extent then serving on our board of directors), constitutes a majority of the board of directors. The holders of Preferred Stock will have the right, acting with the Preferred Requisite Vote, to nominate and elect individuals selected by the holders of Preferred Stock to fill such Triggering Event Vacancies and thereby serve as directors of our company, or to require our board of directors to act to fill such Triggering Event Vacancies with individuals selected by such holders of Preferred Stock, to serve as directors of our company, and the size of our board of directors will be increased as needed. Each such director so elected is referred to as a “Triggering Event Director.” When a Triggering Event is no longer continuing, then the right of the holders of Preferred Stock to elect the Triggering Event Directors will cease, the terms of office of the Triggering Event Directors will immediately terminate, and the number of directors constituting our board of directors will be reduced accordingly.
Our Preferred Stock has rights, preferences, and privileges that are not held by, and are preferential to, the rights of our common stockholders, which could adversely affect our liquidity and financial condition, and may result in the interests of Elliott differing from those of our common stockholders.
As the holder of certain series of our Preferred Stock, Elliott has the right to receive a liquidation preference entitling them to be paid out of our assets available for distribution to stockholders before any payment may be made to holders of our common stock. In addition, dividends on certain series of our Preferred Stock accrue and are cumulative as a percentage of the liquidation value of such series of Preferred Stock. The holders of our Preferred Stock also have certain redemption rights, including upon certain change in control events involving us, which, if exercised, could require us to repurchase all of the outstanding shares of Preferred Stock at 100% or more of the stated value of the shares, plus all accrued but unpaid dividends. See Note 6 “Preferred Stock” to the consolidated financial statements in this on Form 10-K for further information.
These dividend and redemption obligations could impact our liquidity and reduce the amount of cash flows available for working capital, capital expenditures, growth opportunities, acquisitions, and other general corporate purposes. Our obligations to the holders of our Preferred Stock could also limit our ability to obtain additional financing or increase our borrowing costs, which could have an adverse effect on our financial condition. The preferential rights could also result in divergent interests between Elliott and the holders of our common stock.
Our current principal stockholders continue to have significant influence over us, and they could delay or deter a change of control or other business combination or otherwise cause us to take action with which you might not agree.
Investment funds affiliated with HCI Equity Partners (“HCI”) together owned approximately 20.3% of our outstanding common stock as of May 1, 2018. In addition, as of May 1, 2018 Elliott owned approximately 8.6% of our outstanding common stock and, as described above, the terms of the Investment Agreement grant Elliott certain rights to designate directors to serve on our board of directors.
As a result, these stockholders will have significant influence over the election of our board of directors and our decision to enter into any corporate transaction and may have the ability to delay or deter any transaction that requires the approval of stockholders, regardless of whether or not other stockholders believe that such a transaction is in their own best interests. Such concentration of voting power could have the effect of delaying or deterring a change of control or other business combination that might otherwise be beneficial to our stockholders or could limit the price that some investors might be willing to pay in the future for shares of our common stock. The interests of these stockholders may not always coincide with our interests as a company or the interests of our other stockholders.
25
Provisions in our certificate of incorporation, our bylaws, and Delaware law could make it more difficult for a third party to acquire us, discourage a takeover, and adversely affect existing stockholders.
Our certificate of incorporation, our bylaws, and the Delaware General Corporation Law contain provisions that may make it more difficult or delay attempts by others to obtain control of our company, even when these attempts may be in the best interests of our stockholders. These include provisions limiting the stockholders' powers to remove directors or take action by written consent instead of at a stockholders' meeting. Our certificate of incorporation also authorizes our board of directors, without stockholder approval, to issue one or more series of preferred stock, which could have voting and conversion rights that adversely affect or dilute the voting power of the holders of common stock. On May 2, 2017, we issued shares of our preferred stock to affiliates of Elliott pursuant to the Investment Agreement. See Note 6 “Preferred Stock” to the consolidated financial statements in this Form 10-K for further information. On March 1, and April 24, 2018 we issued additional shares of our preferred stock to affiliates of Elliott pursuant to the Series E-1 Investment Agreement. See Note 16 “Subsequent Events” to the consolidated financial statements in this Form 10-K for further information. In addition, our certificate of incorporation provides for our board to be divided into three classes, serving staggered terms. The classified board provision could have the effect of discouraging a potential acquirer from making a tender offer or otherwise attempting to obtain control of us. Delaware law also imposes conditions on the voting of “control shares” and on certain business combination transactions with “interested stockholders.”
These provisions and others that could be adopted in the future could deter unsolicited takeovers or delay or prevent changes in our control or management, including transactions in which stockholders might otherwise receive a premium for their shares over then-current market prices. These provisions may also limit the ability of stockholders to approve transactions that they may deem to be in their best interests.
ITEM 1B. | UNRESOLVED STAFF COMMENTS |
None.
ITEM 2. | PROPERTIES |
We lease space for our corporate headquarters in Downers Grove, Illinois, which provides our executive management team and LTL management teams a central location for easier travel to both customers and geographically dispersed business locations. We also lease space in Cudahy, Wisconsin to house key business and support functions.
For our TL business, we own three and lease nine company dispatch offices and lease nine cross-dock and drop yard locations throughout the United States and Canada. We own six and lease 32 TL service centers, and own four and lease six warehouses throughout the United States. For our LTL business, we own 13 and lease 28 service centers throughout the United States. Each service center manages and is responsible for the freight that originates and delivers in its service area, and the typical service center is configured to perform origin consolidation and cross-dock functions. For our Ascent business, we lease 11 office locations to support our international freight forwarding and domestic 3PL business. We also lease five distribution facilities used to support our warehousing and consolidation business.
We believe that our current facilities are in good working order and are capable of supporting our operations for the foreseeable future; however, we will continue to evaluate leasing additional space as needed to accommodate our growth.
ITEM 3. | LEGAL PROCEEDINGS |
In the ordinary course of business, we are a defendant in several legal proceedings arising out of the conduct of our business. These proceedings include claims for property damage or personal injury incurred in connection with our services. Although there can be no assurance as to the ultimate disposition of these proceedings, we do not believe, based upon the information available at this time, that these property damage or personal injury claims, in the aggregate, will have a material impact on our consolidated financial statements. We maintain an aggregate of $100 million of auto liability and general liability insurance. We maintain auto liability insurance coverage for claims in excess of $1.0 million per occurrence and cargo coverage for claims in excess of $100,000 per occurrence. We are self-insured up to $1.0 million per claim for workers compensation. We believe we have adequate insurance to cover losses in excess of our self-insured and deductible amounts. As of December 31, 2017 and 2016, we had reserves for estimated uninsured losses of $28.4 million and $21.5 million, respectively, included in accrued expenses and other current liabilities on the consolidated balance sheets.
Jeffrey Cox and David Chidester filed a Complaint against certain of our subsidiaries in state court in California in a post-acquisition dispute. The Complaint alleges contract, statutory and tort based claims arising out of the Stock Purchase Agreement, dated November 2, 2012, between the defendants, as buyers, and the plaintiffs, as sellers, for the purchase of the shares of Central Cal Transportation, Inc. and Double C Transportation, Inc. (the “Central Cal Agreement”). The plaintiffs claim that a contingent purchase obligation payment is due and owing pursuant to the Central Cal Agreement, and that defendants have furnished fraudulent calculations to the plaintiffs to avoid payment. The plaintiffs also claim violations of California’s Labor Code related to the plaintiffs’ respective employment with Central Cal Transportation, LLC. On October 27, 2017, the state court granted our motion to compel arbitration of all non-employment claims alleged in the Complaint. The plaintiffs are now required to comply with the dispute resolution process outlined in the Central Cal Agreement, and submit the dispute to a Settlement Accountant. In February 2018, Plaintiff David Chidester agreed to dismiss his employment-related claims from the Los Angeles Superior Court matter, while Plaintiff
26
Jeffrey Cox transferred his employment claims from Los Angeles Superior Court to the related employment case pending in the Eastern District of California. The parties are proceeding with discovery.
In addition to the legal proceeding described above, we are a defendant in various purported class-action lawsuits alleging violations of various California labor laws and one purported class-action lawsuit alleging violations of the Illinois Wage Payment and Collection Act. Additionally, the California Division of Labor Standards and Enforcement has brought administrative actions against us alleging that we violated various California labor laws. In 2017 and 2018, we reached settlement agreements on a number of these labor related lawsuits and administrative actions. As of December 31, 2017 and December 31, 2016, we recorded a reserve for settlements, litigation, and defense costs related to these labor matters and post-acquisition disputes of approximately $13.2 million and $10.4 million, respectively, which are recorded in accrued expenses and other current liabilities.
Following our press release on January 30, 2017, three putative class actions were filed in the United States District Court for the Eastern District of Wisconsin against us and our former officers, Mark A. DiBlasi and Peter R. Armbruster. On May 19, 2017, the Court consolidated the actions under the caption In re Roadrunner Transportation Systems, Inc. Securities Litigation (Case No. 17-cv-00144), and appointed Public Employees’ Retirement System as lead plaintiff. On March 12, 2018, the lead plaintiff filed a Consolidated Amended Complaint (“CAC”) on behalf of a class of persons who purchased our common stock between March 14, 2013 and January 30, 2017, inclusive. The CAC alleges (i) we and Messrs. DiBlasi and Armbruster violated Section 10(b) of the Exchange Act and Rule 10b-5, and (ii) Messrs. DiBlasi and Armbruster, our former Chairman Scott Rued, HCI Equity Partners, L.L.C., and HCI Equity Management, L.P. violated Section 20(a) of the Exchange Act, by making or causing to be made materially false or misleading statements, or failing to disclose material facts, regarding (a) the accuracy of our financial statements; (b) our true earnings and expenses; (c) the effectiveness of our disclosure controls and controls over financial reporting; (d) the true nature and depth of financial risk associated with our tractor lease guaranty program; (e) our leverage ratios and compliance with its credit facilities; and (f) the value of the goodwill we carried on our balance sheet. The CAC seeks certification as a class action, compensatory damages, and attorney’s fees and costs. The parties are currently engaged in mediation.
On May 25, 2017, Richard Flanagan filed a complaint alleging derivative claims on our behalf in the Circuit Court of Milwaukee County, State of Wisconsin (Case No. 17-cv-004401) against Scott Rued, Mark DiBlasi, Christopher Doerr, John Kennedy, III, Brian Murray, James Staley, Curtis Stoelting, William Urkiel, Judith Vijums, Michael Ward, Chad Utrup, Ivor Evans, Peter Armbruster, and Brian van Helden. Count I of the Complaint alleges the Director Defendants breached their fiduciary duties by “knowingly failing to ensure that we implemented and maintained adequate internal controls over its accounting and financial reporting functions,” and seeks unspecified damages. Count II of the Complaint alleges the Officer Defendants DiBlasi, Armbruster, and van Helden received substantial performance-based compensation and bonuses for fiscal year 2014 that should be disgorged. The action has been stayed by agreement pending a decision on an anticipated motion to dismiss the Amended Complaint filed in the securities class action described above. The parties are currently engaged in mediation.
On June 28, 2017, Jesse Kent filed a complaint alleging derivative claims on our behalf and class action claims in the United States District Court for the Eastern District of Wisconsin. On December 22, 2017, Chester County Employees Retirement Fund filed a Complaint alleging derivative claims on our behalf in the United States District Court for the Eastern District of Wisconsin. On March 21, 2018, the Court entered an order consolidating the Kent and Chester County actions under the caption In re Roadrunner Transportation Systems, Inc. Stockholder Derivative Litigation (Case No. 17-cv-00893). On March 28, 2018, Plaintiffs filed their Verified Consolidated Shareholder Derivative Complaint alleging claims on our behalf against Peter Armbruster, Mark DiBlasi, Scott Dobak, Christopher Doerr, Ivor Evans, Brian van Helden, John Kennedy III, Ralph Kittle, Brian Murray, Scott Rued, James Staley, Curtis Stoelting, William Urkiel, Chad Utrup, Judith Vijums, and Michael Ward. Count I alleges that several of the Defendants violated Section 14(a) of the Exchange Act and Rule 14a-9 based upon alleged misrepresentations and omissions in several of our proxy statements. Count II alleges that all the Defendants breached their fiduciary duty. Count III alleges that all the Defendants wasted corporate assets. Count IV alleges that certain of the Defendants were unjustly enriched. The Complaint seeks monetary damages, improvements to our corporate governance and internal procedures, an accounting from Defendants of the damages allegedly caused by them and the improper amounts the Defendants allegedly obtained, and punitive damages. The parties are currently engaged in mediation.
In addition, subsequent to our announcement that certain previously filed financial statements should not be relied upon, we were contacted by the SEC, FINRA, and the Department of Justice. The Department of Justice and Division of Enforcement of the SEC have commenced investigations into the events giving rise to the restatement. We have received formal requests for documents and other information. In addition, in June 2018 two of our former employees were indicted on charges of conspiracy, securities fraud, and wire fraud as part of the ongoing DOJ and SEC investigation. We are cooperating fully with the joint DOJ and SEC investigation.
Given the status of the matters above, we are unable to reasonably estimate the potential costs or range or costs at this time.
27
ITEM 4. | MINE SAFETY DISCLOSURES |
Not applicable.
28
PART II
ITEM 5. | MARKET FOR REGISTRANT’S COMMON EQUITY, RELATED STOCKHOLDER MATTERS AND ISSUER PURCHASES OF EQUITY SECURITIES |
Market Information on Common Stock
Our common stock has been trading on the NYSE under the symbol “RRTS” since May 13, 2010. Prior to that time, there was no public market for our common stock. The following table sets forth, for the periods indicated, the high and low sales prices of our common stock as quoted on the NYSE.
High | Low | ||||||
Fiscal 2017: | |||||||
First quarter | $ | 11.88 | $ | 6.05 | |||
Second quarter | $ | 7.98 | $ | 6.06 | |||
Third quarter | $ | 9.56 | $ | 6.50 | |||
Fourth quarter | $ | 9.75 | $ | 7.56 | |||
Fiscal 2016: | |||||||
First quarter | $ | 13.67 | $ | 6.39 | |||
Second quarter | $ | 12.82 | $ | 6.67 | |||
Third quarter | $ | 9.15 | $ | 6.86 | |||
Fourth quarter | $ | 11.83 | $ | 6.99 | |||
Fiscal 2015: | |||||||
First quarter | $ | 26.73 | $ | 20.20 | |||
Second quarter | $ | 28.51 | $ | 23.43 | |||
Third quarter | $ | 26.95 | $ | 18.24 | |||
Fourth quarter | $ | 19.22 | $ | 8.91 | |||
Stockholders
As of June 7, 2018, there were 127 holders of record of our common stock and the closing price of our common stock as reported on the NYSE was $2.31 per share.
Dividends
We have never declared or paid cash dividends on our common stock. We currently plan to retain any earnings to finance the growth of our business rather than to pay cash dividends on our common stock. Payments of any cash dividends on our common stock in the future will depend on our financial condition, results of operations, and capital requirements, as well as other factors deemed relevant by our board of directors. Our ABL Facility restricts us from paying dividends on our common stock unless certain payment conditions are satisfied. The Investment Agreement prohibits us from paying dividends on our common stock without the consent of Elliott.
Equity Compensation Plan Information
For equity compensation plan information, refer to Item 12 in Part III of this Form 10-K.
Performance Graph
The following line graph compares cumulative total shareholder returns for the period from December 31, 2012 through December 31, 2017 for (1) our common stock; (2) the Nasdaq Composite Index; and (3) the Nasdaq Transportation Index. The graph assumes an investment of $100 on December 31, 2012. The calculations of cumulative stockholder return on the Nasdaq Composite Index and the Nasdaq Transportation Index include reinvestment of dividends. The calculation of cumulative stockholder return on our common stock does not include reinvestment of dividends because we did not pay any dividends during the measurement period. The historical performance shown is not necessarily indicative of future performance.
29
The performance graph shall not be deemed “soliciting material” or to be “filed” with the SEC for purposes of Section 18 of the Exchange Act or otherwise subject to the liability of that section. The performance graph shall not be deemed to be incorporated by reference into any filing of our company under the Exchange Act or the Securities Act.
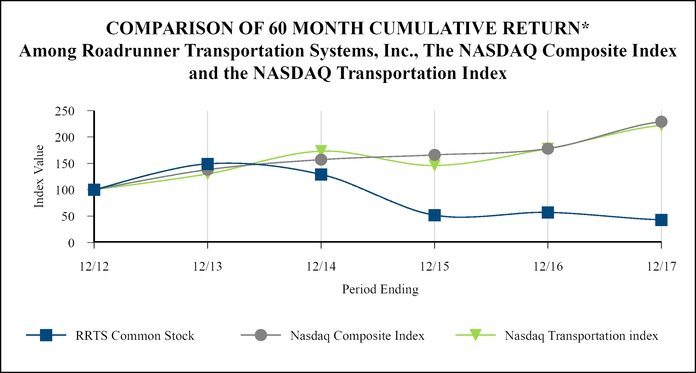
* | $100 invested on December 31, 2012 in stock or in index, including reinvestment of dividends. |
30
ITEM 6. | SELECTED FINANCIAL DATA |
The following tables present selected financial data for each fiscal year in the five-year period ended December 31, 2017. The selected financial data below should be read in conjunction with Item 7. “Management’s Discussion and Analysis of Financial Condition and Results of Operations,” and our consolidated financial statements and related notes contained elsewhere in this Form 10-K, including Note 3 “Acquisitions and Divestitures” thereto. The consolidated statement of operations data includes the results of operations of our acquired companies since the date of their acquisition and our divested companies through the date of divestiture.
We have derived the consolidated statements of operations and other data for the years ended December 31, 2017, 2016, and 2015 and the consolidated balance sheet data as of December 31, 2017 and 2016 from our audited consolidated financial statements included elsewhere in this Form 10-K. We have derived the consolidated statements of operations data and other data for the years ended December 31, 2014 and 2013 and the consolidated balance sheet data as of December 31, 2015, 2014, and 2013 from our Annual Report on Form 10-K for the year ended December 31, 2016. Our historical results are not necessarily indicative of the results that should be expected in the future and the selected financial data is not intended to replace the consolidated financial statements and related notes included elsewhere in this Form 10-K.
CONSOLIDATED STATEMENTS OF OPERATIONS DATA
(In thousands, except per share amounts) | Year Ended December 31, | ||||||||||||||||||
2017 | 2016 | 2015 | 2014 | 2013 | |||||||||||||||
Consolidated Statement of Operations Data: | |||||||||||||||||||
Revenues | $ | 2,091,291 | $ | 2,033,200 | $ | 1,992,166 | $ | 1,872,470 | $ | 1,361,410 | |||||||||
Purchased transportation costs | 1,430,378 | 1,364,055 | 1,310,396 | 1,294,724 | 944,275 | ||||||||||||||
Personnel and related benefits | 296,925 | 286,134 | 263,254 | 213,661 | 151,935 | ||||||||||||||
Other operating expenses | 393,731 | 374,979 | 323,955 | 271,210 | 170,053 | ||||||||||||||
Depreciation and amortization | 37,747 | 38,145 | 31,626 | 24,254 | 15,444 | ||||||||||||||
Impairment charges | 4,402 | 373,661 | — | — | — | ||||||||||||||
Gain on sale of Unitrans | (35,440 | ) | — | — | — | — | |||||||||||||
Acquisition transaction expenses | — | — | 564 | 2,305 | 851 | ||||||||||||||
Operating (loss) income | (36,452 | ) | (403,774 | ) | 62,371 | 66,316 | 78,852 | ||||||||||||
Interest on debt | 14,345 | 22,827 | 19,439 | 13,363 | 7,883 | ||||||||||||||
Interest on preferred stock | 49,704 | — | — | — | — | ||||||||||||||
Loss on debt extinguishment | 15,876 | — | — | — | — | ||||||||||||||
(Loss) income before provision for income taxes | (116,377 | ) | (426,601 | ) | 42,932 | 52,953 | 70,969 | ||||||||||||
(Benefit from) provision for income taxes | (25,191 | ) | (66,281 | ) | 17,312 | 20,243 | 25,049 | ||||||||||||
Net (loss) income | $ | (91,186 | ) | $ | (360,320 | ) | $ | 25,620 | $ | 32,710 | $ | 45,920 | |||||||
(Loss) earnings per share: | |||||||||||||||||||
Basic | $ | (2.37 | ) | $ | (9.40 | ) | $ | 0.67 | $ | 0.86 | $ | 1.27 | |||||||
Diluted | $ | (2.37 | ) | $ | (9.40 | ) | $ | 0.65 | $ | 0.83 | $ | 1.21 | |||||||
Weighted average common stock outstanding: | |||||||||||||||||||
Basic | 38,405 | 38,318 | 38,179 | 37,852 | 36,133 | ||||||||||||||
Diluted | 38,405 | 38,318 | 39,180 | 39,259 | 37,913 | ||||||||||||||
31
CONSOLIDATED BALANCE SHEET DATA
(in thousands) | December 31, | ||||||||||||||||||
2017 | 2016 | 2015 | 2014 | 2013 | |||||||||||||||
Total assets | $ | 876,043 | $ | 933,554 | $ | 1,307,753 | $ | 1,250,638 | $ | 859,492 | |||||||||
Adjusted working capital (1) | 123,469 | 138,692 | 153,626 | 155,950 | 98,255 | ||||||||||||||
Total debt (including current maturities) | 199,410 | 445,589 | 432,830 | 423,945 | 187,165 | ||||||||||||||
Preferred stock | 263,317 | — | — | — | — | ||||||||||||||
Capital lease obligation | 9,565 | 6,245 | 12,464 | 1,730 | 1,934 | ||||||||||||||
Total stockholders’ investment | 110,847 | 197,468 | 556,439 | 524,287 | 485,141 | ||||||||||||||
(1) Adjusted working capital, calculated as current assets less current liabilities, excluding current maturities of debt and short-term capital lease obligations, is not a financial measure presented in accordance with GAAP. The following is a reconciliation of Adjusted working capital from current assets:
(in thousands) | Year Ended December 31, | ||||||||||||||||||
2017 | 2016 | 2015 | 2014 | 2013 | |||||||||||||||
Current assets | $ | 398,386 | $ | 374,487 | $ | 346,564 | $ | 349,139 | $ | 211,115 | |||||||||
Less: Current liabilities | 287,264 | 684,037 | 630,918 | 617,367 | 124,001 | ||||||||||||||
Plus: Short-term capital lease obligation | 2,397 | 2,653 | 5,150 | 233 | 203 | ||||||||||||||
Plus: Current maturities of debt | 9,950 | 445,589 | 432,830 | 423,945 | 10,938 | ||||||||||||||
Adjusted working capital | $ | 123,469 | $ | 138,692 | $ | 153,626 | $ | 155,950 | $ | 98,255 | |||||||||
ADJUSTED EBITDA
The following is a reconciliation of Adjusted EBITDA from net (loss) income:
Year Ended December 31, | |||||||||||||||||||
(In thousands) | 2017 | 2016 | 2015 | 2014 | 2013 | ||||||||||||||
Net (loss) income | $ | (91,186 | ) | $ | (360,320 | ) | $ | 25,620 | $ | 32,710 | $ | 45,920 | |||||||
Plus: Total interest expense | 64,049 | 22,827 | 19,439 | 13,363 | 7,883 | ||||||||||||||
Plus: (Benefit from) provision for income taxes | (25,191 | ) | (66,281 | ) | 17,312 | 20,243 | 25,049 | ||||||||||||
Plus: Depreciation and amortization | 37,747 | 38,145 | 31,626 | 24,254 | 15,444 | ||||||||||||||
Plus: Impairment charges | 4,402 | 373,661 | — | — | — | ||||||||||||||
Plus: Long-term incentive compensation expenses | 2,450 | 2,232 | 2,500 | 2,255 | 1,503 | ||||||||||||||
Plus: Gain on sale of Unitrans | (35,440 | ) | — | — | — | — | |||||||||||||
Plus: Loss on debt extinguishments | 15,876 | — | — | — | — | ||||||||||||||
Plus: Restructuring and restatement costs | 32,321 | — | — | — | — | ||||||||||||||
Plus: Adjustments for contingent purchase obligation | — | (2,458 | ) | (2,931 | ) | (1,722 | ) | (10,443 | ) | ||||||||||
Adjusted EBITDA(1) | $ | 5,028 | $ | 7,806 | $ | 93,566 | $ | 91,103 | $ | 85,356 | |||||||||
(1) EBITDA represents earnings before interest, taxes, depreciation and amortization. We use Adjusted EBITDA, which excludes impairment and other non-cash gains and losses, long-term incentive compensation expenses, losses from debt extinguishments, restructuring and restatement costs associated with legal matters, including our internal investigation, SEC compliance and debt restructuring costs, and adjustments to contingent purchase obligation, as a supplemental measure in evaluating our operating performance and when determining executive incentive compensation. We believe Adjusted EBITDA is useful to investors in evaluating our performance compared to other companies in our industry because it assists in analyzing and benchmarking the performance and value of a business. The calculation of Adjusted EBITDA eliminates the effects of financing, income taxes, impairments, and the accounting effects of capital spending. These items may vary for different companies for reasons unrelated to the overall operating performance of a company’s business. Adjusted EBITDA is not a financial measure presented in accordance with GAAP. Although our management uses Adjusted EBITDA as a financial measure to assess the performance of our business compared to that of others in our industry, Adjusted EBITDA has limitations as an analytical tool, and you should not consider it in isolation, or as a substitute for analysis of our results as reported under GAAP. Some of these limitations are:
32
• | Adjusted EBITDA does not reflect our cash expenditures, future requirements for capital expenditures, or contractual commitments; |
• | Adjusted EBITDA does not reflect changes in, or cash requirements for, our working capital needs; |
• | Adjusted EBITDA does not reflect the significant interest expense or the cash requirements necessary to service interest or principal payments on our debt or dividend payments on our preferred stock; |
• | Although depreciation and amortization are non-cash charges, the assets being depreciated and amortized will often have to be replaced in the future and Adjusted EBITDA does not reflect any cash requirements for such replacements; and |
• | Other companies in our industry may calculate Adjusted EBITDA differently than we do, limiting its usefulness as a comparative measure. |
Because of these limitations, Adjusted EBITDA should not be considered a measure of discretionary cash available to us to invest in the growth of our business. We compensate for these limitations by relying primarily on our results of operations under GAAP. See the consolidated statements of operations included in our consolidated financial statements included elsewhere in this Form 10-K.
33
ITEM 7. | MANAGEMENT’S DISCUSSION AND ANALYSIS OF FINANCIAL CONDITION AND RESULTS OF OPERATIONS |
This discussion and analysis presents our operating results for each of our three most recent fiscal years and our financial condition as of December 31, 2017. You should read the following discussion and analysis in conjunction with “Selected Financial Data” and our consolidated financial statements and related notes contained elsewhere in this Form 10-K. This discussion and analysis of our financial condition and results of operations also contains forward-looking statements that involve risks, uncertainties, and assumptions. Our actual results may differ materially from those anticipated in these forward-looking statements as a result of a variety of factors, including those set forth under Item 1A. “Risk Factors.”
Overview
We are a leading asset-right transportation and asset-light logistics service provider offering a full suite of solutions. Our TL and LTL segments offer solutions including less-than-truckload, air and ground domestic and cross-border expedite, dry van and temperature controlled truckload logistics, and intermodal services. Our Ascent segment offers domestic freight management, retail consolidation, international freight forwarding, and customs brokerage. We utilize both company drivers and a broad third-party network of transportation providers, comprised of ICs and purchased power providers, to serve a diverse customer base in terms of end-market focus and annual freight expenditures.
We have three segments:
Truckload Logistics. Within our TL business, we arrange the pickup and delivery of truckload, intermodal, and ground and air expedited freight through 41 TL service centers, 40 company brokers, and over 60 independent brokerage agents located throughout the United States, Mexico, and Canada. We offer temperature-controlled, dry van, intermodal drayage, and flatbed services and specialize in the transport of automotive parts, refrigerated foods, poultry, and beverages. Our on-demand ground and air expedited services feature proprietary bid technology supported by our fleets of ground and air assets. We believe this array of services and specialization provides our customers with full-service options and provides us with more consistent shipping volumes in any given year.
Less-than-Truckload. Our LTL business involves the pickup, consolidation, linehaul, deconsolidation, and delivery of LTL shipments throughout the United States and parts of Canada. With 41 LTL service centers and over 180 third-party delivery agents, we are designed to provide customers with high reliability at an economical cost. We generally employ a point-to-point LTL model that we believe serves as a competitive advantage over the traditional hub and spoke LTL model in terms of lower incidence of damage and reduced fuel consumption.
Ascent Global Logistics. Within our Ascent business, we offer a full portfolio of domestic and international transportation and logistics solution, including access to cost-effective and time-sensitive modes of transportation within our broad network. Specifically, our Ascent offering includes pricing, contract management, transportation mode and carrier selection, freight tracking, freight bill payment and audit, cost reporting and analysis, dispatch, and freight consolidation and warehousing. Our customized Ascent offering is designed to allow our customers to reduce operating costs, redirect resources to core competencies, improve supply chain efficiency, and enhance customer service. Our Ascent business also includes domestic and international air and ocean transportation services and customs brokerage.
Critical Accounting Policies and Estimates
The preparation of financial statements in conformity with GAAP requires that we make estimates and assumptions. In certain circumstances, those estimates and assumptions can affect amounts reported in the accompanying consolidated financial statements and notes. In preparing our financial statements, we have made our best estimates and judgments of certain amounts included in the financial statements, giving due consideration to materiality. We base our estimates on historical experience and on various other assumptions that we believe to be reasonable. Application of the accounting policies described below involves the exercise of judgment and use of assumptions as to future uncertainties and, as a result, actual results could differ from these estimates. The following is a brief discussion of our critical accounting policies and estimates.
34
Goodwill and Other Intangibles
Goodwill represents the excess of the purchase price of all acquisitions over the estimated fair value of the net assets acquired. We evaluate goodwill and intangible assets for impairment at least annually on July 1st or more frequently whenever events or changes in circumstances indicate that the asset may be impaired, or in the case of goodwill, the fair value of the reporting unit is below its carrying amount. The analysis of potential impairment of goodwill requires us to compare the estimated fair value at each of its reporting units to its carrying amount, including goodwill. If the carrying amount of the reporting unit exceeds the estimated fair value of the reporting unit, a non-cash goodwill impairment loss is recognized as an impairment charge for the amount by which the carrying amount exceeds the reporting unit's fair value; however, the loss recognized should not exceed the total amount of goodwill allocated to that reporting unit.
For purposes of the impairment analysis, the fair value of our reporting units is estimated based upon an average of the market approach and the income approach, both of which incorporate numerous assumptions and estimates such as company forecasts, discount rates and growth rates, among others. The determination of the fair value of the reporting units and the allocation of that value to individual assets and liabilities within those reporting units requires us to make significant estimates and assumptions. These estimates and assumptions primarily include, but are not limited to, the selection of appropriate peer group companies, control premiums appropriate for acquisitions in the industries in which we compete, the discount rate, terminal growth rates, and forecasts of revenue, operating income, and capital expenditures. Although we believe our estimates of fair value are reasonable, actual financial results could differ from those estimates due to the inherent uncertainty involved in making such estimates. Changes in assumptions concerning future financial results or other underlying assumptions could have a significant impact on either the fair value of the reporting units, the amount of the goodwill impairment charge, or both. Future declines in the overall market value of our stock may also result in a conclusion that the fair value of one or more reporting units has declined below its carrying value.
We have four reporting units for our three segments: one reporting unit for our TL segment; one reporting unit for our LTL segment; and two reporting units for our Ascent segment, which are the Ascent reporting unit and the Warehousing & Consolidation reporting unit. We conducted our goodwill impairment analysis for each of the four reporting units at July 1, 2017 and determined that no impairment had occurred, as each reporting unit's fair value exceeded the carrying value.
The sale of Unitrans, which was included in the Ascent reporting unit, resulted in an incremental impairment analysis on the remaining net assets of the Ascent reporting unit. We evaluated the remaining carrying value of the Ascent reporting unit and compared it to the fair value of the remaining businesses in the Ascent reporting unit. As a result of this evaluation, we determined the carrying value exceeded the fair value and recorded a $4.4 million impairment charge in the third quarter of 2017.
As a result of the first step of our goodwill impairment analysis as of July 1, 2016, we determined that the fair value of the Ascent reporting unit exceeded its carrying value by 8.4%; thus, no impairment was indicated for this reporting unit. However, resulting from a combination of the weakened environment, the inability to meet forecast results, and the lower share price, we determined that the fair value of the TL, LTL, and Warehousing & Consolidation reporting units were less than their respective carrying values, requiring us to perform the second step of the goodwill impairment analysis for our TL, LTL, and Warehousing & Consolidation reporting units. We completed the second step of the goodwill impairment analysis for our TL, LTL, and Warehousing & Consolidation reporting units and recorded in the third quarter of 2016 non-cash goodwill impairment charges of $157.5 million, $197.3 million, and $17.2 million for our TL, LTL, and Warehousing & Consolidation reporting units, respectively. No goodwill impairment charges were recorded in 2015.
Other intangible assets recorded consist primarily of definite lived customer relationships. We evaluate our other intangible assets for impairment when current facts or circumstances indicate that the carrying value of the assets to be held and used may not be recoverable. Indicators of impairment were identified in connection with the shut-down of one of our business operations and as a result, $1.6 million of non-cash impairment charges were recorded in the fourth quarter of 2016. There were also indicators of impairment with certain other business operations in the fourth quarter. Accordingly, we performed the required impairment analysis, but no impairment was identified.
Revenue Recognition
TL revenue is recorded when all of the following have occurred: an agreement of sale exists; pricing is fixed or determinable; delivery has occurred; and our obligation to fulfill a transaction is complete and collection of revenue is reasonably assured. This occurs when we complete the delivery of a shipment or the service has been fulfilled.
LTL revenue is recorded when all of the following have occurred: an agreement of sale exists; pricing is fixed or determinable; and collection of revenue is reasonably assured. We use a percentage of services completed method to recognize revenue, which results in an allocation of revenue between reporting periods based on the distinctive phases of each LTL transaction completed in each reporting period, with expenses recognized as incurred. We believe that this is the most appropriate method for LTL revenue
35
recognition based on the multiple distinct phases of a typical LTL transaction, which is in contrast to the single phase of a typical TL transaction.
Ascent revenue is generally recorded when the shipment has been delivered by a third-party carrier. Fees for services revenue is recognized when the services have been rendered. At the time of delivery or rendering of services, as applicable, our obligation to fulfill a transaction is complete and collection of revenue is reasonably assured. We offer volume discounts to certain customers. Revenue is reduced as discounts are earned. In some instances, we perform multiple services. Typically, separate fees are quoted and recognized as revenue when services are rendered. Occasionally, customers request an all-inclusive “door-to-door” fee for a set of services and revenue is allocated to each element of the service package and recognized as each service is completed.
We typically recognize revenue on a gross basis, as opposed to a net basis, because we bear the risks and benefits associated with revenue-generated activities by, among other things, (1) acting as a principal in the transaction, (2) establishing prices, (3) managing all aspects of the shipping process, and (4) taking the risk of loss for collection, delivery, and returns. Certain Ascent transactions to provide specific services are recorded at the net amount charged to the client due to the following factors: (A) we do not have latitude in establishing pricing, and (B) we do not bear the risk of loss for delivery and returns; these items are the risk of the carrier.
Self-Insurance Accruals
We use a combination of purchased insurance and self-insurance programs to provide for the cost of auto liability, cargo damage, workers’ compensation claims, and benefits paid under employee health care programs. Insurance reserves are established for estimates of the loss that we will ultimately incur on reported claims, as well as estimates of claims that have been incurred but not yet reported. Recorded balances are based on reserve levels, which incorporate historical loss experience and judgments about the present and expected levels of cost per claim. We believe our estimated reserves for such claims are adequate, but actual experience in claim frequency and/or severity could materially differ from our estimates and affect our results of operations. We have engaged a third-party actuary to review our incurred but not yet reported reserves and development factors to ensure they are appropriate.
A number of factors can affect the actual cost of a claim, including the length of time the claim remains open, trends in health care costs, accident frequency and severity, and the results of related litigation. Furthermore, claims may emerge in future years for events that occurred in a prior year at a rate that differs from previous projections. All of these factors can result in revisions to prior projections and produce a material difference between estimated and actual costs.
Accounts Receivable and Related Reserves
Accounts receivable are uncollateralized customer obligations due under normal trade terms. We extend credit to certain customers in the ordinary course of business based on the customer's credit history. The carrying amount of accounts receivable is reduced by an allowance for doubtful accounts that reflects management's best estimate of amounts that will not be collected. The allowance is based on historical loss experience and any specific risks identified in customer collection matters. Accounts receivable are charged off against the allowance for doubtful accounts when it is determined that the receivable is uncollectible.
Preferred Stock
We have elected to measure our preferred stock at fair value pursuant to ASC 820, Fair Value Measurement. The fair value of the preferred stock is the estimated amount that would be paid to redeem the liability in an orderly transaction between market participants at the measurement date. We calculate the fair value of:
• | the Series B Preferred Stock using a lattice model that takes into consideration our call right on the instrument based on simulated future interest rates; |
• | the Series C Preferred Stock using a lattice model that takes into consideration the future redemption value on the instrument, which is tied to our stock price; |
• | the Series D Preferred Stock using a static discounted cash flow approach, where the expected redemption value of the instrument is based on the value of our stock as of the measurement date grown at the risk-free rate; |
• | the Series E Preferred Stock via application of both (i) a static discounted cash flow approach and (ii) a lattice model that takes into consideration our call right on this instrument based on simulated future interest rates; and |
• | the Series F Preferred Stock using a static discounted cash flow approach that assumes the Series F will be fully redeemed in 2017. |
These valuations are considered to be Level 3 fair value measurements as the significant inputs are unobservable and require significant management judgment or estimation. Considerable judgment is required in interpreting market data to develop the estimates
36
of fair value. Accordingly, our estimates are not necessarily indicative of the amounts that we, or holders of the instruments, could realize in a current market exchange. Significant assumptions used in the fair value models include: the estimates of the redemption dates; credit spreads; dividend payments; and the market price of our common stock. The use of different assumptions and/or estimation methodologies could have a material effect on the estimated fair values.
Sale of Unitrans
On September 15, 2017, we completed the sale of Unitrans. We received net proceeds of $88.5 million and recognized a gain of $35.4 million. Proceeds from the sale were used primarily to redeem a portion of the Series E Preferred Stock and to provide funding for operations. The results of operations and financial condition of Unitrans have been included in our consolidated financial statements within our Ascent segment until the date of sale.
37
Results of Operations
The following table sets forth, for the periods indicated, summary TL, LTL, Ascent, corporate, and consolidated statement of operations data. Such revenue data for our TL, LTL, and Ascent segments is expressed as a percentage of consolidated revenues. Other statement of operations data for our TL, LTL, and Ascent segments is expressed as a percentage of segment revenues. Total statement of operations and corporate and eliminations data is expressed as a percentage of consolidated revenues.
(Dollars in thousands) | Year Ended December 31, | |||||||||||||||||||
2017 | 2016 | 2015 | ||||||||||||||||||
Revenues: | ||||||||||||||||||||
TL | $ | 1,304,833 | 62.4 | % | $ | 1,246,798 | 61.3 | % | $ | 1,128,390 | 56.6 | % | ||||||||
LTL | 463,519 | 22.1 | % | 461,540 | 22.7 | % | 515,328 | 25.9 | % | |||||||||||
Ascent | 328,318 | 15.7 | % | 335,510 | 16.5 | % | 377,137 | 18.9 | % | |||||||||||
Eliminations | (5,379 | ) | (0.3 | )% | (10,648 | ) | (0.5 | )% | (28,689 | ) | (1.4 | )% | ||||||||
Total | 2,091,291 | 100.0 | % | 2,033,200 | 100.0 | % | 1,992,166 | 100.0 | % | |||||||||||
Purchased transportation costs: | ||||||||||||||||||||
TL | 879,663 | 67.4 | % | 826,224 | 66.3 | % | 716,518 | 63.5 | % | |||||||||||
LTL | 331,177 | 71.4 | % | 320,439 | 69.4 | % | 357,124 | 69.3 | % | |||||||||||
Ascent | 224,909 | 68.5 | % | 228,040 | 68.0 | % | 265,443 | 70.4 | % | |||||||||||
Eliminations | (5,371 | ) | (0.3 | )% | (10,648 | ) | (0.5 | )% | (28,689 | ) | (1.4 | )% | ||||||||
Total | 1,430,378 | 68.4 | % | 1,364,055 | 67.1 | % | 1,310,396 | 65.8 | % | |||||||||||
Other operating expenses (1): | ||||||||||||||||||||
TL | 391,777 | 30.0 | % | 397,934 | 31.9 | % | 340,568 | 30.2 | % | |||||||||||
LTL | 154,372 | 33.3 | % | 143,337 | 31.1 | % | 139,965 | 27.2 | % | |||||||||||
Ascent | 72,722 | 22.1 | % | 77,158 | 23.0 | % | 78,523 | 20.8 | % | |||||||||||
Corporate | 36,345 | 1.7 | % | 42,684 | 2.1 | % | 28,717 | 1.4 | % | |||||||||||
Total | 655,216 | 31.3 | % | 661,113 | 32.5 | % | 587,773 | 29.5 | % | |||||||||||
Depreciation and amortization: | ||||||||||||||||||||
TL | 26,912 | 2.1 | % | 27,622 | 2.2 | % | 22,587 | 2.0 | % | |||||||||||
LTL | 4,353 | 0.9 | % | 4,052 | 0.9 | % | 2,801 | 0.5 | % | |||||||||||
Ascent | 4,588 | 1.4 | % | 4,938 | 1.5 | % | 4,903 | 1.3 | % | |||||||||||
Corporate | 1,894 | 0.1 | % | 1,533 | 0.1 | % | 1,335 | 0.1 | % | |||||||||||
Total | 37,747 | 1.8 | % | 38,145 | 1.9 | % | 31,626 | 1.6 | % | |||||||||||
Impairment charges: | ||||||||||||||||||||
TL | — | — | % | 159,118 | 12.8 | % | — | — | % | |||||||||||
LTL | — | — | % | 197,312 | 42.8 | % | — | — | % | |||||||||||
Ascent | 4,402 | 1.3 | % | 17,231 | 5.1 | % | — | — | % | |||||||||||
Corporate | — | — | % | — | — | % | — | — | % | |||||||||||
Total | 4,402 | 0.2 | % | 373,661 | 18.4 | % | — | — | % | |||||||||||
Operating (loss) income: | ||||||||||||||||||||
TL | 6,481 | 0.5 | % | (164,100 | ) | (13.2 | )% | 48,717 | 4.3 | % | ||||||||||
LTL | (26,383 | ) | (5.7 | )% | (203,600 | ) | (44.1 | )% | 15,438 | 3.0 | % | |||||||||
Ascent | 21,697 | 6.6 | % | 8,143 | 2.4 | % | 28,268 | 7.5 | % | |||||||||||
Corporate | (38,247 | ) | (1.8 | )% | (44,217 | ) | (2.2 | )% | (30,052 | ) | (1.5 | )% | ||||||||
Total | (36,452 | ) | (1.7 | )% | (403,774 | ) | (19.9 | )% | 62,371 | 3.1 | % | |||||||||
Total interest expense | 64,049 | 3.1 | % | 22,827 | 1.1 | % | 19,439 | 1.0 | % | |||||||||||
Loss on early extinguishment of debt | 15,876 | 0.8 | % | — | — | % | — | — | % | |||||||||||
(Loss) income before income taxes | (116,377 | ) | (5.6 | )% | (426,601 | ) | (21.0 | )% | 42,932 | 2.2 | % | |||||||||
(Benefit from) provision for income taxes | (25,191 | ) | (1.2 | )% | (66,281 | ) | (3.3 | )% | 17,312 | 0.9 | % | |||||||||
Net (loss) income | $ | (91,186 | ) | (4.4 | )% | $ | (360,320 | ) | (17.7 | )% | $ | 25,620 | 1.3 | % | ||||||
(1) Reflects the sum of personnel and related benefits, other operating expenses, the gain from sale of Unitrans and acquisition transaction expenses.
38
Year Ended December 31, 2017 Compared to Year Ended December 31, 2016
Revenues
Consolidated revenues increased by $58.1 million, or 2.9%, to $2,091.3 million in 2017 from $2,033.2 million in 2016, primarily due to an increase in revenues in our TL and LTL segments, which were partially offset by a decrease in revenues in our Ascent segment.
TL revenues increased by $58.0 million, or 4.7%, to $1,304.8 million in 2017 from $1,246.8 million in 2016, primarily due to an increase in ground and air expedited freight, partially offset by lower revenues from temperature control and intermodal customers.
LTL revenues increased by $2.0 million, or 0.4%, to $463.5 million in 2017 from $461.5 million in 2016. LTL revenues were favorably impacted by revenue from new customers, partially offset by lower volumes across our customer base.
Ascent revenues decreased by $7.2 million, or 2.1%, to $328.3 million in 2017 from $335.5 million in 2016. The decrease was primarily due to the absence of revenue in the fourth quarter of 2017 associated with Unitrans, which was sold in the third quarter of 2017, partially offset by an increase in revenue from international freight forwarding customers.
Purchased Transportation Costs
Consolidated purchased transportation costs increased by $66.3 million, or 4.9%, to $1,430.4 million in 2017 from $1,364.1 million in 2016, primarily driven by higher revenues. Purchased transportation costs as a percent of revenue increased to 68.4% in 2017 from 67.1% in 2016.
TL purchased transportation costs increased by $53.5 million, or 6.5%, to $879.7 million in 2017 from $826.2 million in 2016, primarily due to an increase in ground and air expedited freight costs. TL purchased transportation costs as a percentage of TL revenues increased to 67.4% in 2017 from 66.3% in 2016.
LTL purchased transportation costs increased by $10.8 million, or 3.4%, to $331.2 million in 2017 from $320.4 million in 2016. The increase was due to higher spot prices, which negatively impacted linehaul expense, partially offset by lower volumes. LTL purchased transportation costs as a percentage of LTL revenues increased to 71.4% in 2017 from 69.4% in 2016.
Ascent purchased transportation costs decreased by $3.1 million, or 1.4%, to $224.9 million in 2017 from $228.0 million in 2016, and increased as a percentage of Ascent revenues to 68.5% in 2017 from 68.0% in 2016. The decrease was primarily due to the absence of purchased transportation cost in the fourth quarter of 2017 associated with Unitrans, which was sold in the third quarter of 2017, partially offset by higher volumes and market rates in international freight forwarding.
Other Operating Expenses
Consolidated other operating expenses, which reflect the sum of personnel and related benefits, other operating expenses, and the gain from the sale of Unitrans shown in our consolidated statements of operations, decreased by $5.9 million, or 0.9%, to $655.2 million in 2017 from $661.1 million in 2016.
Within our TL business, other operating expenses decreased by $6.1 million, or 1.5%, to $391.8 million in 2017 from $397.9 million in 2016, primarily due to a decrease in bad debt expense of $7.0 million, a decrease in losses on sales of fixed assets of $4.1 million, lower salaries and benefits of $2.4 million, and lower equipment lease costs of $1.8 million, partially offset by increased fuel costs of $10.7 million. As a percentage of TL revenues, other operating expenses decreased to 30.0% in 2017 from 31.9% in 2016.
Within our LTL business, other operating expenses increased by $11.1 million, or 7.7%, to $154.4 million in 2017 from $143.3 million in 2016, primarily due to increased bad debt expense of $3.4 million, salaries and benefits of $2.9 million, and equipment lease and maintenance costs of $1.7 million. As a percentage of LTL revenues, other operating expenses increased to 33.3% in 2017 from 31.1% in 2016.
Within our Ascent business, other operating expenses decreased $4.5 million, or 5.7%, to $72.7 million in 2017 from $77.2 million in 2016, primarily due to the absence of other operating expenses in the fourth quarter of 2017 associated with Unitrans, which was sold in the third quarter of 2017. As a percentage of Ascent revenues, other operating expenses decreased to 22.1% in 2017 from 23.0% in 2016.
Other operating expenses that were not allocated to our TL, LTL, or Ascent businesses decreased $6.4 million, or 14.9%, to $36.3 million in 2017 from $42.7 million in 2016, primarily due to a $35.4 million gain on the sale of Unitrans in September 2017 and lower equipment lease expense of $13.7 million, partially offset by restructuring and restatement costs of $32.3 million incurred in 2017 associated with legal, consulting and accounting matters, including internal and external investigations, SEC and accounting compliance, and restructuring, increased insurance reserves of $5.7 million, and increased salaries and benefits of $4.1 million.
39
Depreciation and Amortization
Consolidated depreciation and amortization decreased to $37.7 million in 2017 from $38.1 million in 2016, due to decreases in property, plant and equipment attributable to lower capital expenditures in recent years and the absence of depreciation expense in the fourth quarter of 2017 associated with Unitrans, which was sold in the third quarter of 2017.
Goodwill and Other Intangible Impairment
In 2017 and 2016, we recorded total impairment charges of $4.4 million and $373.7 million, respectively. The impairment charge recognized in 2017 was attributable to our Ascent reporting unit and was the result of evaluating the remaining carrying value of goodwill for the Ascent reporting unit after the sale of Unitrans. As a result of this evaluation, we determined the remaining carrying value exceeded the fair value and recorded a $4.4 million non-cash goodwill impairment charge in the third quarter of 2017. As a result of goodwill impairment analysis performed during 2016, non-cash goodwill impairment charges of $157.5 million, $197.3 million, and $17.2 million were recognized for our TL, LTL, and Warehousing & Consolidation reporting units, respectively.
Other intangible assets consist primarily of definite lived customer relationships. Indicators of impairment were identified in connection with the shut-down of one of our business operations, and as a result, a non-cash impairment charge for the customer relationship intangible of $1.6 million was recorded in 2016 for our TL segment.
Operating (Loss) Income
Consolidated operating results improved to an operating loss of $36.5 million in 2017 from an operating loss of $403.8 million in 2016. Operating loss in 2017 included a $35.4 million gain on the sale of Unitrans and impairment charges of $4.4 million, while the operating loss in 2016 included impairment charges of $373.7 million.
Within our TL business, operating results improved to operating income of $6.5 million in 2017 from an operating loss of $164.1 million in 2016. TL operating loss in 2016 included impairment charges of $159.1 million.
Within our LTL business, operating results improved to an operating loss of $26.4 million in 2017 from an operating loss of $203.6 million in 2016. LTL operating loss in 2016 included impairment charges of $197.3 million.
Within our Ascent business, operating income increased to $21.7 million in 2017 from $8.1 million in 2016. Ascent operating income in 2016 included impairment charges of $17.2 million.
Interest Expense
Interest expense increased to $64.0 million in 2017 from $22.8 million in 2016, primarily as a result of the change in fair value of the preferred stock of $18.4 million and $16.1 million of preferred stock issuance costs. We account for the preferred stock issued in May 2017 at fair value and changes in fair value are recorded in interest expense.
Income Tax
Income tax benefit was $25.2 million in 2017 compared to $66.3 million in 2016. The effective tax rate was 21.6% in 2017 compared to 15.5% in 2016. The effective income tax rate varies from the federal statutory rate of 35.0% primarily due to state income taxes as well as the impact of items causing permanent differences. Significant permanent differences for 2017 include non-deductible interest expense associated with the preferred stock, non-deductible preferred stock issuance costs, non-deductible loss on partial redemption of preferred stock, and basis difference related to the sale of Unitrans. A one-time tax benefit was recorded in 2017 as a result of recalculating the carrying value of our deferred tax assets and liabilities to reflect the reduced 21% U.S. federal corporate tax rate effective January 1, 2018 pursuant to the Tax Reform Act. Additionally, goodwill impairment charges are primarily non-deductible and affected the effective income tax rate and benefit from income taxes for both 2017 and 2016.
Net Loss
Net loss was $91.2 million in 2017 and $360.3 million in 2016 resulting from the factors described above. In addition to the items previously discussed, net loss in 2017 was also impacted by a $15.9 million loss from debt extinguishment associated with the repayment of our prior senior credit facility and the payment of early redemption premiums on our preferred stock.
40
Year Ended December 31, 2016 Compared to Year Ended December 31, 2015
Revenues
Consolidated revenues increased by $41.0 million, or 2.1%, to $2,033.2 million in 2016 from $1,992.2 million in 2015, primarily due to an increase in ground and air expedited freight revenues in our TL segments, which were partially offset by a decrease in revenues in our LTL and Ascent segments.
TL revenues increased by $118.4 million, or 10.5%, to $1,246.8 million in 2016 from $1,128.4 million in 2015, primarily due to an increase of $197.5 million in ground and air expedited freight and incremental revenue of $20.8 million due the 2015 acquisition of Stagecoach. These increases were partially offset by decreased volumes, continued softness in the spot market, and lower fuel surcharge revenue.
LTL revenues decreased by $53.8 million, or 10.4%, to $461.5 million in 2016 from $515.3 million in 2015. LTL revenues were impacted year-over-year by a drop in fuel prices that resulted in a $16.3 million, or 25.3%, decrease in fuel surcharge revenue and a 12.4% decrease in LTL tonnage, primarily due to weak freight demand and changes in freight mix. These decreases were partially offset by a 4.2% increase in revenue per hundredweight, excluding fuel surcharges, primarily driven by improved pricing and positive freight mix changes resulting from our pricing initiatives.
Ascent revenues decreased by $41.6 million, or 11.0%, to $335.5 million in 2016 from $377.1 million in 2015, primarily due to a decrease in domestic freight management business and lower volumes and rates in international freight forwarding, partially offset by an increase of $3.9 million in our warehousing and consolidation business.
Purchased Transportation Costs
Purchased transportation costs increased by $53.7 million, or 4.1%, to $1,364.1 million in 2016 from $1,310.4 million in 2015. Purchased transportation costs as a percent of revenue decreased to 67.1% in 2016 from 65.8% in 2015.
TL purchased transportation costs increased by $109.7 million, or 15.3%, to $826.2 million in 2016 from $716.5 million in 2015, primarily due to an increase of $180.4 million in ground and air expedited freight. This increase was partially offset by decreases in volumes and weakened demand. TL purchased transportation costs as a percentage of TL revenues increased to 66.3% in 2016 from 63.5% in 2015.
LTL purchased transportation costs decreased by $36.7 million, or 10.3%, to $320.4 million in 2016 from $357.1 million in 2015. This decrease was primarily the result of lower volume. LTL purchased transportation costs as a percentage of LTL revenues increased to 69.4% in 2016 from 69.3% in 2015. Excluding fuel surcharges, our average linehaul cost per mile remained flat at $1.25 in 2016 and 2015.
Ascent purchased transportation costs decreased by $37.4 million, or 14.1%, to $228.0 million in 2016 from $265.4 million in 2015, and decreased as a percentage of Ascent revenues to 68.0% in 2016 from 70.4% in 2015. The decreases were primarily due to the lower volumes and market rates in our international freight forwarding and domestic freight management business.
Other Operating Expenses
Other operating expenses, which reflect the sum of personnel and related benefits, other operating expenses, and acquisition transaction expenses shown in our consolidated statements of operations, increased by $73.3 million, or 12.5%, to $661.1 million in 2016 from $587.8 million in 2015.
Within our TL business, other operating expenses increased by $57.4 million, or 16.8%, to $397.9 million in 2016 from $340.6 million in 2015, primarily due to $14.8 million of incremental costs associated with Stagecoach, which was acquired in the third quarter of 2015, increased equipment lease expense of $10.3 million, increased insurance expense of $10.0 million, increased maintenance costs of $7.5 million, and increased salaries and benefits of $5.1 million. As a percentage of TL revenues, other operating expenses increased to 31.9% in 2016 from 30.2% in 2015.
Within our LTL business, other operating expenses increased by $3.3 million, or 2.4%, to $143.3 million in 2016 from $140.0 million in 2015, primarily as a result of increased insurance and claims expense of $2.8 million, increased building maintenance and rent expense of $2.8 million, and increased professional and outside services expense of $2.1 million, partially offset by lower equipment maintenance expense of $2.7 million and lower employee compensation costs of $2.0 million. As a percentage of LTL revenues, other operating expenses increased to 31.1% in 2016 from 27.2% in 2015.
Within our Ascent business, other operating expenses decreased by $1.3 million, or 1.7% to $77.2 million in 2016 from $78.5 million in 2015. As a percentage of Ascent revenues, other operating expenses increased to 23.0% in 2016 from 20.8% in 2015.
41
Other operating expenses that were not allocated to our TL, LTL, or Ascent businesses increased $14.0 million, or 48.6%, to $42.7 million in 2016 from $28.7 million in 2015, primarily due to increased lease purchase guarantee expenses of $7.0 million and $10.4 million of legal expenses for the settlement, litigation and defense of pending lawsuits, which were partially offset by decreased insurance reserves of $3.8 million.
Depreciation and Amortization
Depreciation and amortization increased to $38.1 million in 2016 from $31.6 million in 2015, reflecting increases in property, plant, and equipment attributable to our acquisitions and continued revenue growth, as well as increased amortization of customer relationship intangibles of $0.2 million in connection with our 2015 acquisition of Stagecoach.
Goodwill and Other Intangible Impairment
During 2016, we recorded total impairment charges of $373.7 million resulting from a combination of the weakened environment, the inability to meet forecast results, and our lower share price. No impairment charges were recorded during 2015.
As a result of goodwill impairment analysis performed during 2016, non-cash goodwill impairment charges of $157.5 million, $197.3 million, and $17.2 million were recognized for our TL, LTL, and Warehousing & Consolidation reporting units, respectively.
Other intangible assets consist primarily of definite lived customer relationships. Indicators of impairment were identified in connection with the shut-down of one of our business operations, and as a result, a non-cash impairment charge for the customer relationship intangible of $1.6 million was recorded in 2016.
Operating (Loss) Income
Operating results decreased to an operating loss of $403.8 million in 2016 from operating income of $62.4 million in 2015. Operating loss in 2016 included impairment charges of $373.7 million. Excluding the impairment charges, operating loss was $30.1 million in 2016, which was a decrease in operating results of $92.5 million, or 148.3%, from operating income of $62.4 million in 2015.
Within our TL business, operating results decreased to an operating loss of $164.1 million in 2016 from operating income of $48.7 million in 2015. Operating loss in our TL business in 2016 included impairment charges of $159.1 million. Excluding the impairment charges, the operating loss was $5.0 million, which was a decrease in operating results of $53.7 million, or 110.2%, from $48.7 million in 2015.
Within our LTL business, operating results decreased to an operating loss of $203.6 million in 2016 from operating income of $15.4 million in 2015. Operating loss in our LTL business in 2016 included impairment charges of $197.3 million. Excluding the impairment charges, the operating loss in our LTL business was $6.3 million in 2017, which was a decrease in operating results of $21.7 million, or 140.7%, from operating income of $15.4 million in 2015.
Within our Ascent business, operating income decreased to $8.1 million in 2016 from operating income of $28.3 million in 2015. Operating income in our Ascent business in 2016 included impairment charges of $17.2 million. Excluding the impairment charges, operating income in our Ascent business was $25.4 million, which was a decrease of $2.9 million, or 10.2%, from $28.3 million in 2015. Operating income, excluding impairment charges, as a percentage of Ascent revenues increased slightly to 7.6% in 2016 from 7.5% in 2015.
Other operating loss that was not allocated to TL, LTL, or Ascent businesses increased $14.2 million, or 47.1%, to $44.2 million in 2016 from $30.1 million in 2015.
Interest Expense
Interest expense increased to $22.8 million in 2016 from $19.4 million in 2015, primarily as a result of the increased debt related to our 2015 acquisition of Stagecoach, as well as the increased interest rate year-over-year.
Income Tax
Income tax benefit was $66.3 million in 2016 compared with income tax provision of $17.3 million in 2015. The effective tax rate was 15.5% in 2016 compared to 40.3% in 2015. The non-deductible goodwill impairment charges incurred during 2016 decreased the overall benefit we received during 2016, which lowered our effective tax rate. The effective income tax rate varies from the federal statutory rate of 35.0% primarily due to state income taxes as well as the impact of items causing permanent differences.
Net (Loss) Income
Net loss was $360.3 million in 2016 and net income was $25.6 million in 2015 resulting from the factors described above.
42
Liquidity and Capital Resources
Our primary sources of cash have been borrowings under our credit facilities, the issuance of preferred stock, cash flows from operations, and proceeds from the sale of our common stock. Our primary cash needs are and have been to fund normal working capital requirements, repay our indebtedness and finance capital expenditures. As of December 31, 2017, we had $25.7 million in cash and cash equivalents.
On May 1, 2017, we entered into the Investment Agreement with Elliott, pursuant to which we issued and sold shares of our preferred stock and issued warrants for an aggregate purchase price of $540.5 million. The proceeds from the sale of the preferred stock were used to pay off and terminate our prior senior credit facility and to provide working capital to support our current operations and future growth.
Certain terms of the preferred stock are as follows:
Series B | Series C | Series D | Series E | Series F | |
Shares at $0.01 Par Value at Issuance | 155,000 | 55,000 | 100 | 90,000 | 240,500 |
Shares Outstanding at December 31, 2017 | 155,000 | 55,000 | 100 | 37,500 | — |
Price / Share | $1,000 | $1,000 | $1.00 | $1,000 | $1,000 |
Dividend Rate | Adjusted LIBOR + 3.00% + Additional Rate (4.75-12.50%) based on leverage. Additional 3.00% upon certain triggering events. | Adjusted LIBOR + 3.00% + Additional Rate (4.75-12.50%) based on leverage. Additional 3.00% upon certain triggering events. | Right to participate equally and ratably in all cash dividends paid on common stock. | Adjusted LIBOR + 5.25% + Additional Rate (8.50%). Additional 3.00% upon certain triggering events. | Adjusted LIBOR + 6.25% at closing. Additional 3.00% upon certain triggering events. |
Dividend Rate at December 31, 2017 | 16.737% | 16.737% | n/a | 14.987% | n/a |
Redemption Term | 8 Years | 8 Years | 8 Years | 6 Years | 6 Years |
Redemption Rights | From Closing Date: 12-24 months: 105% 24-36 months: 103% | 65% premium (subject to stock movement) | From Closing Date: 0-12 months: 106.5% 12-24 months: 103.5% | (a) Refinancing Date: 101.0% upon redemption with New ABL Facility (b) From Closing Date: Refinancing Date-12 months: 106.5% 12-24 months: 103.5% | |
Redemption rights are at our option or, upon a change in control, at the option of the holder. The holders of Series C Preferred Stock and Series D Preferred Stock have the right to participate equally and ratably with holders of common stock in all cash dividends paid on shares of common stock.
At each preferred stock dividend payment date, we have the option to pay the accrued dividends in cash or to defer them. Deferred dividends accrue dividend expense consistent with the underlying shares of preferred stock.
On March 1, 2018, we entered into the Series E-1 Investment Agreement with Elliott, pursuant to which we agreed to issue and sell to Elliott from time to time until July 30, 2018, an aggregate of up to 54,750 shares of Series E-1 Preferred Stock at a purchase price of $1,000 per share for the first 17,500 shares of Series E-1 Preferred Stock, $960 per share for the next 18,228 shares of Series E-1 Preferred Stock, and $920 per share for the final 19,022 shares of Series E-1 Preferred Stock. On March 1, 2018, the parties held an initial closing pursuant to which we issued and sold to Elliott 17,500 shares of Series E-1 Preferred Stock for an aggregate purchase price of $17.5 million. On April 24, 2018, the parties held a closing pursuant to the Series E-1 Investment Agreement, pursuant to which we issued and sold to Elliott 18,228 shares of Series E-1 Preferred Stock for an aggregate purchase price of approximately $17.5 million. See Note 16 “Subsequent Events” to the consolidated financial statements in this Form 10-K for further information.
43
On July 21, 2017, we entered into the ABL Facility. We used the initial proceeds from the ABL Facility for working capital purposes and to redeem all of the outstanding shares of our Series F Preferred Stock. The ABL Facility matures on July 21, 2022.
The ABL Facility consists of a:
• | $200.0 million asset-based revolving line of credit, of which $20.0 million may be used for swing line loans and $30.0 million may be used for letters of credit; |
• | $56.8 million term loan facility; and |
• | $35.0 million asset-based facility available to finance future capital expenditures, which was subsequently terminated before being utilized. |
We initially borrowed $141.7 million under the revolving line of credit and $56.8 million under the term loan facility.
See Note 5, Debt, and Note 6, Preferred Stock, to our consolidated financial statements in this Form 10-K for additional information regarding the ABL Facility and preferred stock, respectively. We do not believe that the limitations imposed by the terms of our debt agreement or preferred stock investment agreements have any significant impact on our liquidity, financial condition or results of operations. We believe that these resources will be sufficient to meet our working capital, debt service, and capital investment obligations for the foreseeable future.
Cash Flows
A summary of operating, investing, and financing activities are shown in the following table (in thousands):
Year Ended December 31, | |||||||||||
2017 | 2016 | 2015 | |||||||||
Net cash (used in) provided by: | |||||||||||
Operating activities | $ | (45,552 | ) | $ | 28,854 | $ | 69,389 | ||||
Investing activities | 77,631 | (9,593 | ) | (76,671 | ) | ||||||
Financing activities | (35,890 | ) | 2,322 | 4,403 | |||||||
Net change in cash and cash equivalents | $ | (3,811 | ) | $ | 21,583 | $ | (2,879 | ) | |||
Cash Flows from Operating Activities
Cash used in operating activities was $45.6 million during 2017. The difference between our $91.2 million net loss and the $45.6 million of cash used in operating activities during 2017 was primarily attributable to $38.9 million of depreciation and amortization expense, the change in the fair value of our preferred stock of $18.4 million, and an impairment charge of $4.4 million, partially offset by a deferred tax benefit of $27.1 million. The remainder is primarily attributable to changes in working capital.
Cash Flows from Investing Activities
Cash provided by investing activities was $77.6 million during 2017, which reflects $88.5 million of proceeds from the sale of Unitrans, which was partially offset by $14.5 million of capital expenditures used to support our operations. These capital expenditures were partially offset by the proceeds from the sale of equipment of $3.6 million. We expect capital expenditures in fiscal 2018 to be between $30.0 million and $40.0 million.
Cash Flows from Financing Activities
Cash used in financing activities was $35.9 million during 2017, which primarily reflects issuance costs from debt and preferred stock of $20.8 million, debt extinguishment costs of $11.0 million, and a reduction of a capital lease obligation of $3.7 million.
44
Quarterly Results of Operations
The following table presents unaudited consolidated statement of operations data for each of the four quarters ended December 31, 2017 and 2016. We believe that all necessary adjustments have been included to fairly present the quarterly information when read in conjunction with our annual consolidated financial statements and related notes. The operating results for any quarter are not necessarily indicative of the results for any subsequent quarter.
(In thousands, except per share data) | First Quarter | Second Quarter | Third Quarter | Fourth Quarter | |||||||||||
2017: | |||||||||||||||
Total revenues | $ | 478,920 | $ | 530,579 | $ | 521,433 | $ | 560,359 | |||||||
Net revenues (total revenues less purchased transportation costs) | 162,635 | 172,147 | 162,953 | 163,178 | |||||||||||
Total interest expense | 6,525 | 28,355 | 10,502 | 18,667 | |||||||||||
Loss before income taxes | (24,435 | ) | (45,675 | ) | (5,265 | ) | (41,002 | ) | |||||||
Net loss available to common stockholders | (19,943 | ) | (37,863 | ) | (10,053 | ) | (23,327 | ) | |||||||
Loss per share: | |||||||||||||||
Basic | $ | (0.52 | ) | $ | (0.99 | ) | $ | (0.26 | ) | $ | (0.61 | ) | |||
Diluted | $ | (0.52 | ) | $ | (0.99 | ) | $ | (0.26 | ) | $ | (0.61 | ) | |||
2016: | |||||||||||||||
Total revenues | $ | 466,546 | $ | 483,417 | $ | 532,009 | $ | 551,228 | |||||||
Net revenues (total revenues less purchased transportation costs) | 158,507 | 167,756 | 173,738 | 169,144 | |||||||||||
Total interest expense | 5,608 | 5,695 | 5,757 | 5,767 | |||||||||||
Income (loss) before income taxes | 1,468 | (4,469 | ) | (366,548 | ) | (57,052 | ) | ||||||||
Net income (loss) available to common stockholders | 900 | (2,739 | ) | (319,618 | ) | (38,863 | ) | ||||||||
Earnings (loss) per share: | |||||||||||||||
Basic | $ | 0.02 | $ | (0.07 | ) | $ | (8.34 | ) | $ | (1.01 | ) | ||||
Diluted | $ | 0.02 | $ | (0.07 | ) | $ | (8.34 | ) | $ | (1.01 | ) | ||||
As previously discussed, our operating results in the third quarter of 2017 and 2016 include impairment charges of $4.4 million and $372.1 million, respectively. Also included in operating results in the third quarter of 2017 is the gain from the sale of Unitrans of $35.4 million.
Contractual Obligations and Commercial Commitments
The following table sets forth a summary of our material contractual obligations and commercial commitments as of December 31, 2017 (in thousands):
Payments Due by Period | |||||||||||||||||||
Total | Less Than 1 Year | 1-3 Years | 3-5 Years | More Than 5 Years | |||||||||||||||
Debt | $ | 202,894 | $ | 9,950 | $ | 19,905 | $ | 173,039 | $ | — | |||||||||
Preferred stock (1) | 263,317 | — | — | — | 263,317 | ||||||||||||||
Capital leases | 10,177 | 2,809 | 5,314 | 2,054 | — | ||||||||||||||
Operating leases | 174,218 | 51,490 | 65,293 | 34,150 | 23,285 | ||||||||||||||
Total | $ | 650,606 | $ | 64,249 | $ | 90,512 | $ | 209,243 | $ | 286,602 | |||||||||
(1) Our preferred stock contains certain redemption premiums that could increase the amount to redeem the shares beyond the stated fair value.
45
Off-Balance Sheet Arrangements
We do not have any transactions, arrangements, or other relationships with unconsolidated entities that are reasonably likely to materially affect our financial condition, changes in financial condition, revenues or expenses, results of operations, liquidity, or capital resources. We have no special purpose or limited purpose entities that provide off-balance sheet financing, liquidity, or market or credit risk support; engage in leasing, hedging, or research and development services; or have other relationships that expose us to liability that is not reflected in the financial statements. However, we provide a guarantee for a portion of the value of certain IC leased tractors. The potential maximum exposure under these lease guarantees was approximately $10.6 million as of December 31, 2017.
Seasonality
Our operations are subject to seasonal trends that have been common in the North American over-the-road freight sector for many years. Our results of operations for the quarter ending in March are on average lower than the quarters ending in June, September, and December. Typically, this pattern has been the result of factors such as inclement weather, national holidays, customer demand, and economic conditions.
Effects of Inflation
Based on our analysis of the periods presented, we believe that inflation has not had a material effect on our operating results as inflationary increases in fuel and labor costs have generally been offset through fuel surcharges and price increases.
ITEM 7A. | QUANTITATIVE AND QUALITATIVE DISCLOSURES ABOUT MARKET RISK |
Commodity Risk
Our primary market risk centers on fluctuations in fuel prices, which can affect our profitability. Diesel fuel prices fluctuate significantly due to economic, political, and other factors beyond our control. Our ICs and purchased power providers pass along the cost of diesel fuel to us, and we in turn attempt to pass along some or all of these costs to our customers through fuel surcharge revenue programs. There can be no assurance that our fuel surcharge revenue programs will be effective in the future. Market pressures may limit our ability to pass along our fuel surcharges. We do not use derivative financial instruments for speculative trading purposes.
Interest Rate Risk
We have exposure to changes in interest rates on our preferred stock and ABL facility. The interest rates on our preferred stock and ABL Facility fluctuate based on LIBOR plus an applicable margin. A 1.0% increase in the borrowing rate would increase our annual interest expense by $4.7 million. We do not use derivative financial instruments for hedging or speculative trading purposes and are not engaged in any interest rate swap agreements.
ITEM 8. | FINANCIAL STATEMENTS AND SUPPLEMENTARY DATA |
Reference is made to the financial statements, the notes thereto, and the report of our independent registered public accounting firm commencing at page F-1 of this Form 10-K, which financial statements, notes, and report are incorporated herein by reference. For the Quarterly Results of Operations, see Item 7. “Management’s Discussion and Analysis of Financial Condition and Results of Operations.”
ITEM 9. | CHANGES IN AND DISAGREEMENTS WITH ACCOUNTANTS ON ACCOUNTING AND FINANCIAL DISCLOSURE |
Not applicable.
46
ITEM 9A. | CONTROLS AND PROCEDURES |
Background
As previously disclosed in our Annual Report on Form 10-K for the year ended December 31, 2016, during 2017, an independent internal investigation was undertaken by the Audit Committee of our Board of Directors (the “Audit Committee”), with assistance from outside counsel and outside consultants to provide forensic and investigative support (the “Audit Committee Investigation”) that included detailed reviews of financial records at operating companies and our corporate headquarters. Based on the Audit Committee Investigation, along with matters identified by the company’s management and internal audit function, management determined that there were deficiencies in the design and/or execution of internal controls that constituted material weaknesses.
Evaluation of Disclosure Controls and Procedures
In connection with the filing of this Form 10-K for the year ended December 31, 2017, our Chief Executive Officer (“CEO”), serving as our Principal Executive Officer, and our Chief Financial Officer (“CFO”), serving as our Principal Financial Officer and Principal Accounting Officer, conducted an evaluation of the effectiveness of the design and operation of our disclosure controls and procedures (as defined in Rules 13a-15(e) and 15d-15(e) under the Exchange Act. As a result of this evaluation, our CEO and CFO concluded that those material weaknesses previously identified in Item 9A. “Controls and Procedures” of our Annual Report on Form 10-K for the year ended December 31, 2016 were still present as of December 31, 2017 (the “Evaluation Date”). Based on those material weaknesses, and the evaluation of our disclosure controls and procedures, our CEO and CFO concluded that our disclosure controls and procedures were not effective as of the Evaluation Date.
Notwithstanding the identified material weaknesses, management believes that the consolidated financial statements and unaudited interim financial information included in this Form 10-K fairly present in all material respects our financial condition, results of operations, and cash flows as of and for the periods presented based on a number of factors including, but not limited to, (a) substantial resources expended (including the use of internal audit personnel and external consultants) in response to the findings of material weaknesses, (b) internal reviews to identify material accounting errors, and (c) the commencement of certain remediation actions, as discussed further below.
Management's Report on Internal Control Over Financial Reporting
Management, including our CEO and CFO, is responsible for establishing and maintaining adequate internal control over financial reporting (as defined in Rules 13a-15(f) and 15d-15(f) under the Exchange Act and based upon the criteria established in Internal Control-Integrated Framework (2013) issued by the Committee of Sponsoring Organizations of the Treadway Commission (the “COSO framework”). Our internal control over financial reporting is a process designed to provide reasonable assurance regarding the reliability of our financial reporting and the preparation of our financial statements for external purposes in accordance with GAAP.
An effective internal control system, no matter how well designed, has inherent limitations, including the possibility of human error or overriding of controls, and therefore can provide only reasonable assurance with respect to reliable financial reporting. Because of its inherent limitations, our internal control over financial reporting may not prevent or detect all misstatements, including the possibility of human error, the circumvention or overriding of controls, or fraud. Effective internal controls can provide only reasonable assurance with respect to the preparation and fair presentation of financial statements.
A material weakness is a deficiency, or a combination of deficiencies, in internal control over financial reporting, such that a reasonable possibility exists that a material misstatement of our annual or interim financial statements would not be prevented or detected on a timely basis.
Under the supervision and with the participation of our management, including our Chief Executive Officer and Chief Financial Officer, we have conducted an evaluation of the effectiveness of our internal control over financial reporting based on the COSO framework. Based on evaluation under these criteria, management determined, based upon the existence of the material weaknesses described below, that we did not maintain effective internal control over financial reporting as of the Evaluation Date.
47
Control Environment
We did not maintain an effective control environment based on the criteria established in the COSO framework. We have identified deficiencies in the principles associated with the control environment of the COSO framework. Specifically, these control deficiencies constitute material weaknesses, either individually or in the aggregate, relating to: (i) our commitment to integrity and ethical values, (ii) the ability of our board of directors to effectively exercise oversight of the development and performance of internal control, as a result of failure to communicate relevant information within our organization and, in some cases, withholding information, (iii) appropriate organizational structure, reporting lines, and authority and responsibilities in pursuit of objectives, (iv) our commitment to attract, develop, and retain competent individuals, and (v) holding individuals accountable for their internal control related responsibilities.
We did not maintain an effective control environment to enable the identification and mitigation of risks of material accounting errors based on the contributing factors to material weakness in the control environment, including:
• | The tone from former executive management was insufficient to create the proper environment for effective internal control over financial reporting and to ensure that (i) there were adequate processes for oversight, (ii) there was accountability for the performance of internal control over financial reporting responsibilities, (iii) identified issues and concerns were raised to appropriate levels within our organization, (iv) corrective activities were appropriately applied, prioritized, and implemented in a timely manner, and (v) relevant information was communicated within our organization and not withheld from our independent directors, our Audit Committee, and our independent auditors. |
• | In certain operating companies and at our corporate headquarters there were inconsistent accounting systems, policies and procedures. Additionally, in certain locations we did not attract, develop, and retain competent management, accounting, financial reporting, internal audit, and information systems personnel or resources to ensure that internal control responsibilities were performed and that information systems were aligned with internal control objectives. |
• | Our oversight processes and procedures that guide individuals in applying internal control over financial reporting were not adequate in preventing or detecting material accounting errors, or omissions due to inadequate information and, in certain instances, management override of internal controls, including recording improper accounting entries, recording accounting entries that were inconsistent with information known by management at the time, not communicating relevant information within our organization and, in some cases, withholding information from our independent directors, our Audit Committee, and our independent auditors. |
Risk Assessment
We did not design and implement an effective risk assessment based on the criteria established in the COSO framework. We have identified deficiencies in the principles associated with the risk assessment component of the COSO framework. Specifically, these control deficiencies constitute material weaknesses, either individually or in the aggregate, relating to: (i) identifying, assessing, and communicating appropriate objectives, (ii) identifying and analyzing risks to achieve these objectives, (iii) contemplating fraud risks, and (iv) identifying and assessing changes in the business that could impact our system of internal controls.
Control Activities
We did not design and implement effective control activities based on the criteria established in the COSO framework. We have identified deficiencies in the principles associated with the control activities component of the COSO framework. Specifically, these control deficiencies constitute material weaknesses, either individually or in the aggregate, relating to: (i) selecting and developing control activities and information technology that contribute to the mitigation of risks and support achievement of objectives and (ii) deploying control activities through policies that establish what is expected and procedures that put policies into action.
Deficiencies in control activities contributed to material accounting errors or the potential for there to have been material accounting errors in substantially all financial statements account balances and disclosures.
Information and Communication
We did not generate and provide quality information and communication based on the criteria established in the COSO framework. We have identified deficiencies in the principles associated with the information and communication component of the COSO framework. Specifically, these control deficiencies constitute material weaknesses, either individually or in the aggregate, relating to: (i) obtaining, generating, and using relevant quality information to support the function of internal control, and (ii) communicating accurate information internally and externally, including providing information pursuant to objectives, responsibilities, and functions of internal control.
48
Monitoring Activities
We did not design and implement effective monitoring activities based on the criteria established in the COSO framework. We have identified deficiencies in the principles associated with the monitoring component of the COSO framework. Specifically, these control deficiencies constitute material weaknesses, either individually or in the aggregate, relating to: (i) selecting, developing, and performing ongoing evaluation to ascertain whether the components of internal controls are present and functioning, and (ii) evaluating and communicating internal control deficiencies in a timely manner to those parties responsible for taking corrective action.
The following were contributing factors to the material weaknesses in monitoring activities:
• | Internal audit staffing levels were insufficient to keep pace with the size and complexity of our business structure and organization, which limited our ability to effectively monitor internal controls. |
• | Failure to effectively communicate relevant information and internal control deficiencies to our Audit Committee for appropriate oversight, monitoring and enforcement of corrective action. |
• | Not communicating relevant information within our organization and, in some cases, withholding information from our independent directors, our Audit Committee, and our independent auditors. |
Deloitte & Touche LLP, our independent registered public accounting firm, has audited the effectiveness of our internal control over financial reporting as of December 31, 2017. Deloitte & Touche LLP's opinion, as stated in their report which appears on page 52 of this Form 10-K, is consistent with management's report on internal control over financial reporting as set forth above.
Changes in Internal Control Over Financial Reporting
There were no changes during the quarter ended December 31, 2017 in our internal control over financial reporting that have materially affected, or are reasonably likely to materially affect, our internal control over financial reporting.
Remediation Plan and Status
Our remediation efforts are ongoing and we will continue our initiatives to implement and document policies, procedures, and internal controls. Remediation of the identified material weaknesses and strengthening our internal control environment will require a substantial effort throughout 2018 and beyond, as necessary. We will test the ongoing operating effectiveness of the new and existing controls in future periods. The material weaknesses cannot be considered completely remediated until the applicable controls have operated for a sufficient period of time and management has concluded, through testing, that these controls are operating effectively.
While we believe the steps taken to date and those planned for implementation will improve the effectiveness of our internal control over financial reporting, we have not completed all remediation efforts identified herein. Accordingly, as we continue to monitor the effectiveness of our internal control over financial reporting in the areas affected by the material weaknesses described above, we have and will continue to perform additional procedures prescribed by management, including the use of manual mitigating control procedures and employing any additional tools and resources deemed necessary, to ensure that our consolidated financial statements are fairly stated in all material respects. The following remediation activities highlight our commitment to remediating our identified material weaknesses:
Control Environment
We have undertaken steps to address material weaknesses in the control environment. Executive management team changes, including our Chief Executive Officer, President and Chief Operating Officer, General Counsel and Chief Compliance Officer, Chief Financial Officer, Vice President and Corporate Controller, Vice President of Finance and Treasurer, Chief Information Officer, and the Chief Audit Executive, and the Vice President of Human Resources are committed to implementing and maintaining an effective control environment that will drive a high level of ethical standards and integrity over internal control over financial reporting. Our Audit Committee, our Board of Directors, and management have emphasized and continue to emphasize the importance of internal control over financial reporting, as well as the integrity of our financial statements. Our new executive management team has enhanced compliance with ethical standards by, among other things, updating our corporate governance policies, and improving communication practices among employees with internal control over financial reporting responsibilities as follows:
• | Executive management has taken, and is continuing to take, steps to ensure a proper, consistent tone is communicated throughout our organization, with distinct emphasis on the expectation that previously identified control deficiencies will be remediated through the implementation of uniform accounting and internal control policies and procedures with the proper oversight that promotes strict compliance with GAAP and regulatory requirements. We also have an internal ethics |
49
task force that is responsible for reviewing compliance matters. Clear and transparent communication with respect to compliance and ethical values continue to emphasize our commitment to ethics and compliance.
• | We have hired new finance team members with the appropriate experience, certifications, education, and training for key financial reporting and accounting positions. The addition of skilled personnel allows us to select and develop appropriate policies, procedures, and controls to strengthen our control environment. Additionally, executive management has reassigned trusted, experienced financial reporting and accounting personnel to areas within our company that will benefit most from their expertise. |
• | Executive management continues to evaluate the resources required to right-size our accounting and financial reporting, internal audit, and information technology functions. Evaluation of the effectiveness of these personnel and appropriateness of reporting lines across the company is ongoing. |
• | We have enhanced our compliance practices, including the update and distribution of our code of conduct, whistleblower, and ethics policies, which will require periodic acknowledgment by all employees. Our quarterly sub-certification process includes executives, finance and operations personnel from our corporate headquarters and operating companies. |
Risk Assessment
We performed detailed reviews of financial records at our corporate headquarters and the operating company level for the purpose of identifying and correcting accounting errors. We will continue to enhance risk assessment procedures and conduct a comprehensive risk assessment to enhance overall compliance. The result of this effort is expected to enable us to effectively identify, develop, and implement controls and procedures to address risks. Our Chief Information Officer continues to assess our information technology control environment and adequacy of personnel, including responding to information technology risks appropriately.
Control Activities
We continue to redesign and implement common internal control activities. We continue to establish policies and procedures and enhance corporate oversight over process-level controls and structures to ensure that there is appropriate assignment of authority, responsibility, and accountability to enable remediating our material weaknesses.
Information and Communication
We continue to take steps to enhance our practices as it relates to information and communication, including the hiring of a number of new senior finance and information technology executives, and reorganization and centralization of our information technology department, and purchase of a consolidation software solution.
Monitoring Activities
In addition to the items noted above, as we continue to evaluate, remediate, and improve our internal control over financial reporting, executive management may elect to implement additional measures to address control deficiencies or may determine that the remediation efforts described above require modification. Executive management, in consultation with and at the direction of our Audit Committee, will continue to assess the control environment and the above-mentioned efforts to remediate the underlying causes of the identified material weaknesses, including through the following:
• | We have increased and will continue to increase internal audit, finance, accounting, and information technology staffing levels to sufficiently address the size, scope, and complexity of our organization. |
• | We have developed effective communication plans relating to, among other things, identification of deficiencies and recommendations for corrective actions. These plans will apply to all parties responsible for remediation. |
50
Inherent Limitations on Effectiveness of Controls
Management, including our CEO and CFO, does not expect that our disclosure controls and procedures or our internal control over financial reporting will prevent all errors and all fraud. A control system, no matter how well conceived and operated, can provide only reasonable, not absolute, assurance that the objectives of the control system are met. Further, the design of a control system must reflect the fact that there are resource constraints, and the benefits of controls must be considered relative to their costs. Because of the inherent limitations in all control systems, no evaluation of controls can provide absolute assurance that all control issues, misstatements, errors, and instances of fraud, if any, within our organization have been or will be prevented or detected. These inherent limitations include the realities that judgments in decision-making can be faulty and that breakdowns can occur because of simple error or mistake. Controls also can be circumvented by the individual acts of some persons, by collusion of two or more people, or by management override of the controls. The design of any system of controls is based in part on certain assumptions about the likelihood of future events, and there can be no assurance that any design will succeed in achieving its stated goals under all potential future conditions. Projections of any evaluation of controls effectiveness to future periods are subject to risks. Over time, internal controls may become inadequate as a result of changes in conditions, or through the deterioration of the degree of compliance with policies or procedures.
51
REPORT OF INDEPENDENT REGISTERED PUBLIC ACCOUNTING FIRM
To the Board of Directors and Stockholders of
Roadrunner Transportation Systems, Inc. and subsidiaries
Downers Grove, Illinois
Opinion on Internal Control over Financial Reporting
We have audited the internal control over financial reporting of Roadrunner Transportation Systems, Inc. and subsidiaries (the “Company”) as of December 31, 2017, based on criteria established in Internal Control - Integrated Framework (2013) issued by the Committee of Sponsoring Organizations of the Treadway Commission (COSO). In our opinion, because of the effect of the material weaknesses identified below on the achievement of the objectives of the control criteria, the Company has not maintained effective internal control over financial reporting as of December 31, 2017, based on criteria established in Internal Control - Integrated Framework (2013) issued by COSO.
We have also audited, in accordance with the standards of the Public Company Accounting Oversight Board (United States) (PCAOB), the consolidated financial statements as of and for the year ended December 31, 2017, of the Company and our report dated June 19, 2018, expressed an unqualified opinion on those financial statements.
Basis for Opinion
The Company’s management is responsible for maintaining effective internal control over financial reporting and for its assessment of the effectiveness of internal control over financial reporting, included in the accompanying Management’s Report on Internal Control Over Financial Reporting. Our responsibility is to express an opinion on the Company’s internal control over financial reporting based on our audit. We are a public accounting firm registered with the PCAOB and are required to be independent with respect to the Company in accordance with the U.S. federal securities laws and the applicable rules and regulations of the Securities and Exchange Commission and the PCAOB.
We conducted our audit in accordance with the standards of the PCAOB. Those standards require that we plan and perform the audit to obtain reasonable assurance about whether effective internal control over financial reporting was maintained in all material respects. Our audit included obtaining an understanding of internal control over financial reporting, assessing the risk that a material weakness exists, testing and evaluating the design and operating effectiveness of internal control based on the assessed risk, and performing such other procedures as we considered necessary in the circumstances. We believe that our audit provides a reasonable basis for our opinion.
Definition and Limitations of Internal Control over Financial Reporting
A company’s internal control over financial reporting is a process designed to provide reasonable assurance regarding the reliability of financial reporting and the preparation of financial statements for external purposes in accordance with generally accepted accounting principles. A company’s internal control over financial reporting includes those policies and procedures that (1) pertain to the maintenance of records that, in reasonable detail, accurately and fairly reflect the transactions and dispositions of the assets of the company; (2) provide reasonable assurance that transactions are recorded as necessary to permit preparation of financial statements in accordance with generally accepted accounting principles, and that receipts and expenditures of the company are being made only in accordance with authorizations of management and directors of the company; and (3) provide reasonable assurance regarding prevention or timely detection of unauthorized acquisition, use, or disposition of the company’s assets that could have a material effect on the financial statements.
Because of its inherent limitations, internal control over financial reporting may not prevent or detect misstatements. Also, projections of any evaluation of effectiveness to future periods are subject to the risk that controls may become inadequate because of changes in conditions, or that the degree of compliance with the policies or procedures may deteriorate.
Material Weaknesses
A material weakness is a deficiency, or a combination of deficiencies, in internal control over financial reporting, such that there is a reasonable possibility that a material misstatement of the company’s annual or interim financial statements will not be prevented or detected on a timely basis. The following material weaknesses have been identified and included in management's assessment:
52
Control Environment - control deficiencies constituting material weaknesses, either individually or in the aggregate, relating to: (i) commitment to integrity and ethical values, (ii) the ability of the board of directors to effectively exercise oversight of the development and performance of internal control, as a result of failure to communicate relevant information within the organization and, in some cases, withholding information, (iii) appropriate organizational structure, reporting lines, and authority and responsibilities in pursuit of objectives, (iv) commitment to attract, develop, and retain competent individuals, and (v) holding individuals accountable for their internal control related responsibilities.
Risk Assessment - control deficiencies constituting material weaknesses, either individually or in the aggregate, relating to: (i) identifying, assessing, and communicating appropriate objectives, (ii) identifying and analyzing risks to achieve these objectives, (iii) contemplating fraud risks, and (iv) identifying and assessing changes in the business that could impact the system of internal controls.
Control Activities - control deficiencies constituting material weaknesses, either individually or in the aggregate, relating to: (i) selecting and developing control activities and information technology that contribute to the mitigation of risks and support achievement of objectives and (ii) deploying control activities through policies that establish what is expected and procedures that put policies into action.
Information and Communication - control deficiencies constituting material weaknesses, either individually or in the aggregate, relating to: (i) obtaining, generating, and using relevant quality information to support the function of internal control, and (ii) communicating accurate information internally and externally, including providing information pursuant to objectives, responsibilities, and functions of internal control.
Monitoring - control deficiencies constituting material weaknesses, either individually or in the aggregate, relating to: (i) selecting, developing, and performing ongoing evaluation to ascertain whether the components of internal controls are present and functioning, and (ii) evaluating and communicating internal control deficiencies in a timely manner to those parties responsible for taking corrective action.
These material weaknesses were considered in determining the nature, timing, and extent of audit tests applied in our audit of the consolidated financial statements as of and for the year ended December 31, 2017, of the Company, and this report does not affect our report on such financial statements.
/s/ Deloitte & Touche LLP
Chicago, Illinois
June 19, 2018
53
ITEM 9B. | OTHER INFORMATION |
Not applicable.
54
PART III
ITEM 10. | DIRECTORS, EXECUTIVE OFFICERS AND CORPORATE GOVERNANCE |
Directors
The following table, together with the accompanying text, sets forth the names and certain other information as of May 1, 2018 for each of our directors.
Name | Age | Position(s) Held | ||
James D. Staley(1)(6)(7) | 68 | Chairman of the Board | ||
Curtis W. Stoelting | 58 | Chief Executive Officer and Director | ||
Michael L. Gettle(2) | 58 | President, Chief Operating Officer, Secretary, and Director | ||
Scott L. Dobak(3)(6)(7) | 55 | Director | ||
Christopher L. Doerr(6)(7) | 68 | Director | ||
John G. Kennedy, III(5)(7) | 57 | Director | ||
Ralph (“Cody”) W. Kittle III(4) | 28 | Director | ||
Brian C. Murray(5) | 52 | Director | ||
William S. Urkiel(5)(6) | 72 | Director | ||
Michael P. Ward(6) | 58 | Director | ||
(1) Mr. Staley was appointed Chairman of our board of directors on November 14, 2017.
(2) Mr. Gettle was elected to our board of directors on April 17, 2018.
(3) Mr. Dobak was elected to our board of directors on June 6, 2017.
(4) Mr. Kittle was elected to our board of directors on June 6, 2017.
(5) Member of the audit committee.
(6) Member of the compensation committee.
(7) Member of the nominating/corporate governance committee.
James D. Staley has served as the chairman of our board of directors since November 2017 and has been a director of our company since October 2010. Mr. Staley previously served as the lead independent director of our board of directors from December 2016 to November 2017. Mr. Staley is presently retired. From 2004 through December 2007, Mr. Staley served in various capacities for YRC Worldwide, Inc. (NASDAQ: YRCW) and its subsidiaries, one of the world's largest transportation services providers, including as President and Chief Executive Officer of Roadway Group and YRC Regional Transportation. Prior to that, Mr. Staley served for over 30 years in various capacities for Roadway Express, including President and Chief Operating Officer. Mr. Staley currently serves as the Lead Director and on the audit, compensation, and nominating and corporate governance committees of Douglas Dynamics, Inc. (NYSE: PLOW), a designer, manufacturer, and seller of snow and ice control equipment for light trucks. Mr. Staley was nominated to our board of directors because of his executive and operational experience with a public company in the transportation industry, and his experience on other public company boards of directors.
Curtis W. Stoelting has served as our Chief Executive Officer since April 2017 and has been a director of our company since January 2016. Mr. Stoelting previously served as our principal financial officer and principal accounting officer from April 2017 until March 2018 and our President and Chief Operating Officer from January 2016 until April 2017. Prior to joining our company, Mr. Stoelting served as the Chief Executive Officer and a director of TOMY International (formerly RC2 Corporation) from January 2003 to March 2013. RC2 Corporation (NASDAQ: RCRC) was acquired by TOMY Company, Ltd. in April 2011. Mr. Stoelting previously served as RC2’s Chief Operating Officer from 2000 to 2003, Executive Vice President from 1998 to 2000 and Chief Financial Officer from 1994 to 1998. Prior to that, Mr. Stoelting was with Arthur Andersen for 12 years. Mr. Stoelting currently serves on the Board of Directors and Compensation Committee of Regal-Beloit Corporation (NYSE: RBC), a publicly traded manufacturer of commercial, industrial, and HVAC electric motors, electric generators and controls, and mechanical motion control products. Mr. Stoelting was nominated to our board of directors because of his role as our chief executive officer, which enables him to provide the board with insight based on his day-to-day interactions with our company, and because of his operational expertise. As a management representative on our board of directors, Mr. Stoelting provides an insider's perspective in board discussions about the business and strategic direction of our company.
Michael L. Gettle has served as our President, Chief Operating Officer, and Secretary since April 2017 and has been a director of our company since April 2018. Mr. Gettle previously served as our Executive Vice President from May 2016 until April 2017. Prior to joining our company, Mr. Gettle served as Amercias Chief Executive Officer of TNS, a division of British multinational WPP plc from January 2013 to May 2016 and as Global Chief Financial Officer and Chief Operating Officer from October 2008 to December 2012. Prior to that time, Mr. Gettle served as the Executive Vice President and Chief Financial Officer of Millward Brown
55
from 1992 to October 2008. Prior to joining Millward Brown Mr. Gettle served in various positions with Arthur Andersen LLP for nine years. Mr. Gettle was nominated to our board of directors because of his role as our president and chief operating officer, which enables him to provide the board with insight based on his day-to-day interactions with our company, and because of his operational expertise. As a management representative on our board of directors, Mr. Gettle provides an insider's perspective in board discussions about the business and strategic direction of our company.
Scott L. Dobak has served as a director of our company since June 2017. Mr. Dobak currently serves as the Chief Executive Officer of Dicom Transportation Group, where he has been employed since January 2014. Prior to that, Mr. Dobak served in various leadership roles with our company from January 2007 to December 2013, most recently serving as our President - Less-than-Truckload and Transportation Management Solutions. Mr. Dobak was nominated to our board of directors in connection with the Investment Agreement and because of his proven business acumen, his executive and operational experience in the transportation industry, and his familiarity with our business.
Christopher L. Doerr has served as a director of our company since October 2010. Mr. Doerr is currently the sole member of Passage Partners, LLC, a private investment company. Mr. Doerr served as Co-Chief Executive Officer of Sterling Aviation Holdings, Inc., an aircraft management and charter company, from 2004 to 2014. From 2009 to 2011, Mr. Doerr served as Executive Chairman and Chief Executive Officer of Karl’s Rental, Inc., a global manufacturer and supplier of portable event structures and related equipment. Prior to that, Mr. Doerr served as President and Co-Chief Executive Officer of Leeson Electric Corporation from 1986 to 2001. Mr. Doerr currently serves on the board of directors and compensation committee of Regal Beloit Corporation (NYSE: RBC), a publicly traded manufacturer of commercial, industrial, and HVAC electric motors, electric generators and controls, and mechanical motion control products. Mr. Doerr was nominated to our board of directors because of his proven business acumen and executive and operational experience, having served as the chief executive officer of several companies, and because of his experience on other public company boards of directors.
John G. Kennedy, III has served as a director of our company since December 2012. Mr. Kennedy served as Senior Advisor and Managing Director and Head of Capital Markets at Tudor, Pickering, Holt & Co. Securities, Inc., an integrated energy investment and merchant bank, from 2010 until 2017. Mr. Kennedy currently serves as a Manager for TMX Finance LLC. Mr. Kennedy has more than 30 years of experience in investment banking. Mr. Kennedy served as a Managing Director of Deutsche Bank’s investment banking group and served as a Managing Director of Donaldson, Lufkin & Jenrette until its sale to Credit Suisse First Boston. Mr. Kennedy has served or currently serves as trustee or director of various private companies, foundations, and not-for-profit institutions. Mr. Kennedy was nominated to our board of directors because of his proven business acumen and his extensive banking and capital markets experience.
Ralph (“Cody”) W. Kittle III has served as a director of our company since June 2017. Mr. Kittle currently serves as an investment professional with Elliott Management Corporation, where he has been employed since August 2014. Prior to that, Mr. Kittle served as an associate at Wind Point Partners, a private equity firm based in Chicago, and in Investment Banking at J.P. Morgan, where he focused on mergers and acquisitions in the industrial and consumer industries. Mr. Kittle was nominated to our board of directors in connection with the Investment Agreement and because of his significant business and investment experience across a wide range of industries, including in the transportation and logistics sectors, as well as experience with financial and operational matters for businesses.
Brian C. Murray has served as a director of our company since August 2015. Effective June 1, 2018, Mr. Murray was appointed the Chief Executive Officer of Ryan Companies US, Inc., a national firm providing real estate services including architecture and engineering, development, construction, capital markets and real estate management. Previously, Mr. Murray served as Chief Financial Officer of Ryan Companies since November 2009 and as Chief Operating Officer of Ryan Companies since May 2014. Prior to joining Ryan Companies, Mr. Murray held various positions with UnitedHealth Group, Inc., most recently serving as the Chief Financial Officer of its Specialized Care Services division. Mr. Murray was nominated to our board of directors because of his expertise with accounting and audit matters, his deep understanding of financial reporting rules and regulations, and his experience with executive functions as a chief financial officer.
William S. Urkiel has served as a director of our company since May 2010. Mr. Urkiel currently serves on the board of directors and audit committee of Crown Holdings, Inc. (NYSE: CCK), where he has been a director since December 2004. Mr. Urkiel served as a director of Suntron Corporation from August 2006 until June 2013. From May 1999 until January 2005, Mr. Urkiel served as Senior Vice President and Chief Financial Officer of IKON Office Solutions. From February 1995 until April 1999, Mr. Urkiel served as the Corporate Controller and Chief Financial Officer at AMP Incorporated. Prior to 1999, Mr. Urkiel held various financial management positions at IBM Corporation. Mr. Urkiel was nominated to our board of directors because of his financial and accounting expertise evidenced by his position as chief financial officer of multiple companies, his knowledge of corporate finance, accounting principles, and audit procedures, as well as his corporate governance experience.
Michael P. Ward has served as a director of our company since February 2016. Mr. Ward currently serves as the Managing Director of Research at Seaport Global Securities, where he has been employed since 2016. Prior to that time, Mr. Ward served as
56
a Managing Director at Sterne Agee CRT between 2011 and 2016 and as the President of Ward Transportation Research, a small independent research boutique which specialized in the automotive and airline sectors, from 2005 to 2011. Prior to that time, Mr. Ward worked for major Wall Street brokerage firms for 10 years, including Kidder, Peabody & Co., PaineWebber, and Salomon Smith Barney. Mr. Ward was nominated to our board of directors because of his proven business acumen and his extensive experience as a sell-side analyst following the auto and auto parts sectors.
Executive Officers
The following table, together with the accompanying text, sets forth the names and certain other information as of May 1, 2018 for each of our executive officers.
Name | Age | Position(s) Held | ||
Curtis W. Stoelting | 58 | Chief Executive Officer and Director | ||
Michael L. Gettle | 58 | President, Chief Operating Officer, Secretary, and Director | ||
Terence R. Rogers | 59 | Executive Vice President and Chief Financial Officer | ||
Scott B. Cousins | 50 | Chief Information Officer | ||
Robert M. Milane | 65 | General Counsel and Chief Compliance Officer | ||
Frank L. Hurst | 44 | President - Roadrunner Freight | ||
William R. Goodgion | 52 | President - Ascent Global Logistics | ||
Patrick K. McKay | 50 | Senior Vice President - Enterprise Fleet Services | ||
Craig T. Paulson | 46 | Senior Vice President - Human Resources | ||
Curtis W. Stoelting’s biography is set forth under the heading “Directors” above.
Michael L. Gettle’s biography is set forth under the heading “Directors” above.
Terence R. Rogers has served as our Executive Vice President and Chief Financial Officer since May 2017. Prior to joining our company, Mr. Rogers served as the Chief Financial Officer of The Heico Companies, LLC, the parent company for a diversified portfolio of over 35 businesses, from April 2012 to February 2017. Prior to that time, Mr. Rogers served in various financial positions with Ryerson Inc., a leading distributor and value-added processor of industrial metals, from December 1994 to April 2012, most recently as Chief Financial Officer.
Scott B. Cousins has served as our Chief Information Officer since January 2017. Prior to joining our company, Mr. Cousins served as the Chief Information Officer of KeHE from 2007 to 2017 and NCH Marketing Services from 2005 to 2007. Prior to that time, Mr. Cousins served as Senior Vice President of Information Technology at IndyMac Bank from 2004 to 2005. Prior to joining IndyMac Bank, Mr. Cousins was an Associate Partner at Accenture for 14 years.
Robert M. Milane has served as our Chief Compliance Officer since April 2017 and as our General Counsel since November 2015. Mr. Milane has also served as our Executive Vice President of Risk Management since November 2015. Mr. Milane served as our Vice President of Risk Management from June 2014 to October 2015. Prior to joining our company, Mr. Milane served as Managing Director for Risk Management at FedEx Ground from 1999 to 2010 and as Assistant Vice President of Risk Management for Canal Insurance from 2011 to 2013.
Frank L. Hurst has served as our President - Roadrunner Freight since June 2017. Mr. Hurst previously served as our Senior Vice President of Sales and Marketing of Roadrunner Freight from January 2017 to June 2017. Prior to joining our company, Mr. Hurst served as VP/GM for North American Corporation, a distributor of packaging products, equipment, and service based in Glenview, Illinois, from January 2014 to December 2016. From August 2012 to December 2013, Mr. Hurst served as Executive Vice President for Vitran Express, where he was responsible for the turnaround, sale, and transition of the US LTL operation. Prior to joining Vitran Express, Mr. Hurst spent 16 years at FedEx Freight, where he was most recently served as VP - Divisional Operations from July 2007 to August 2012.
William R. Goodgion has served as our President - Ascent Global Logistics since April 2015. Prior to joining our company, Mr. Goodgion served as Managing Director - Operations (Central Region) for FedEx Trade Networks Transport & Brokerage, Inc., a subsidiary of FedEx Corporation, from December 2014 through April 2015, and as Managing Director - Global Distribution & Surface Transportation for FedEx Trade Networks Transport & Brokerage, Inc. from March 2000 through April 2015.
Patrick K. McKay has served as our Senior Vice President - Enterprise Fleet Services since February 2017 and was previously our President - Truckload Logistics from July 2014 until February 2017 and our President - Truckload Services from March 2012
57
to July 2014. Prior to joining our company, Mr. McKay served as a General Manager - Operations for the van truckload division of Schneider National, Inc. from 2008 to 2012. Prior to that, Mr. McKay held various leadership positions with FedEx Ground, Inc. from 1992 to 2008, most recently serving as a Division Managing Director.
Craig T. Paulson has served as our Senior Vice President - Human Resources since October 2017. Prior to joining our company, Mr. Paulson served as the Director of Human Resources of Generac Corporation since June 2016. Prior to that time, Mr. Paulson served as Vice President of Human Resources - Pump Solutions Group of Dover Corporation from January 2015 to September 2015 and as Vice President of Human Resources - Waukesha Bearings Corporation of Dover Corporation from August 2011 to January 2015. Prior to joining Dover Corporation, Mr. Paulson served in various human resources roles for 11 years.
There are no family relationships among any of our directors or executive officers.
Section 16(a) Beneficial Ownership Reporting Compliance
Section 16(a) of the Securities Exchange Act of 1934, as amended (the “Exchange Act”) requires our directors, executive officers, and persons who own more than 10% of a registered class of our securities to file with the SEC initial reports of ownership and reports of changes in ownership. Directors, executive officers, and greater than 10% stockholders are required by SEC regulations to furnish us with copies of all Section 16(a) forms they file.
Based solely upon our review of the copies of such forms that we received during the year ended December 31, 2017, and written representations that no other reports were required, we believe that each person who at any time during such year was a director, executive officer, or beneficial owner of more than 10% of our common stock complied with all Section 16(a) filing requirements during the year ended December 31, 2017, except that (i) the Form 3 filed by Mr. Cousins on February 8, 2017 was late; (ii) the Form 4 filed by Mr. Goodgion on May 9, 2017 was late; (iii) the Form 4 filed by Mr. Hurst on February 5, 2018 was late; (iv) the Form 4 filed by Mr. Rogers on May 25, 2017 was late; and (v) the Form 3 filed by Mr. Milane on March 23, 2018 was late.
Code of Ethics
Our board of directors has adopted a code of business conduct and ethics and a code of ethics for our chief executive officer and senior financial officers. We post on our website, at www.rrts.com, our code of business conduct and ethics, our code of ethics for our chief executive officer and senior financial officers, and any amendments or waivers thereto. These documents are also available in print to any stockholder requesting a copy in writing from our corporate secretary at 1431 Opus Place, Suite 530, Downers Grove, Illinois 60515.
Director Recommendation Process
There have been no material changes to the procedures by which security holders may recommend nominees to our board as described in our Definitive Proxy Statement filed with the SEC on April 4, 2016.
Audit Committee
Our board of directors has a separately-designated standing audit committee. The current members of our audit committee are Messrs. Murray (chairman), Kennedy, and Urkiel, each of whom satisfies the independence requirements under the NYSE listing standards and Rule 10A-3(b)(1) of the Exchange Act. Our board of directors has determined that Mr. Murray is an “audit committee financial expert” within the meaning of SEC regulations. Each member of our audit committee can read and understand fundamental financial statements in accordance with audit committee requirements. In arriving at this determination, our board of directors has examined each audit committee member’s professional experience and the nature of their employment in the corporate finance sector.
58
ITEM 11. | EXECUTIVE COMPENSATION |
Compensation Discussion and Analysis
This Compensation Discussion and Analysis provides an overview of our executive compensation program, together with a description of the material factors underlying the decisions that resulted in the compensation paid to our named executive officers.
Named Executive Officers and Recent Changes in Executive Officers
Our executive officers whose 2017 compensation is discussed in this Compensation Discussion and Analysis, who we refer to as our named executive officers, are:
• | Curtis W. Stoelting, our Chief Executive Officer and, with respect to 2017, our principal financial officer; |
• | Michael L. Gettle, our President and Chief Operating Officer; |
• | Terence R. Rogers, our Chief Financial Officer; |
• | Scott B. Cousins, our Chief Information Officer; |
• | Mark A. DiBlasi, our former Chief Executive Officer and President; and |
• | Peter R. Armbruster, our former Chief Financial Officer. |
In January 2016, Mr. Stoelting was appointed our President and Chief Operating Officer. In April 2017, Mr. Stoelting was appointed our Chief Executive Officer, Principal Financial Officer, and Principal Accounting Officer and Michael L. Gettle was appointed our President, Chief Operating Officer, and Secretary.
In January 2017, Scott B. Cousins was appointed our Chief Information Officer. In April 2017, Robert M. Milane was appointed as our General Counsel and Chief Compliance Officer. In May 2017, Terence R. Rogers was appointed our Executive Vice President and Chief Financial Officer, but he did not serve as our principal financial officer until 2018. In June 2017, Frank L. Hurst was appointed the President of our Roadrunner Freight business unit. In October 2017, Craig T. Paulson was appointed our Senior Vice President of Human Resources.
Executive Summary
For 2017, our compensation committee continued to:
• | use both our compensation peer group and certain composite compensation survey data as the primary tools for evaluating executive compensation; |
• | increase the base salaries of certain executive officers in light of its assessment of competitive market conditions and to reflect their responsibilities as executives of a public company of our size; |
• | tie a substantial portion of our annual incentive bonus plan for our executive officers to our consolidated earnings before interest and taxes (referred to as EBIT) to support collaboration within our senior management team and reward our executive officers for company-wide performance; |
• | use performance-based restricted stock unit awards (referred to as PRSUs) as an integral component of our long-term incentive program in order to strengthen our pay-for-performance alignment and directly incorporate revenue and earnings before interest, tax, depreciation and amortization expense (referred to as EBITDA) objectives; |
• | use a mix of short-term and long-term incentives to both motivate near-term performance and keep our executive officers focused on longer-term goals that drive stockholder value; |
• | provide that the mix of full value equity awards is weighted more toward PRSUs than time-based restricted stock unit awards (referred to as RSUs); and |
• | calculate the number of shares of our common stock subject to PRSUs and RSUs by using a 20-day trailing average closing sale price, thereby mitigating the effects of our stock price volatility. |
In February 2018, our compensation committee determined to:
• | maintain the 2018 base salaries of each of our named executive officers at current levels; |
• | increase the target annual incentive bonus opportunity for each currently employed named executive officer by 300 basis points; |
• | in a change from historic practice, enter into employment agreements with executive officers and key business leaders; |
59
• | use our adjusted EBITDA (adjusted to exclude annual incentive bonus expense, impairment charges, gains or losses from dispositions of businesses, other long-term incentive compensation expense, loss on debt extinguishments, restructuring and restatements costs and contingent purchase price adjustments, as well as all non-recurring charges agreed to by our Compensation Committee on a quarterly case-by-case basis) as the financial metric objective for both our annual incentive bonus and PRSU programs; and |
• | defer our annual equity awards until after our 2017 financial statements are available to the public. |
Compensation Philosophy and Objectives
Our executive compensation philosophy is to structure our pay at levels that enable us to attract, motivate, and retain highly qualified executives and key employees and reward the creation of stockholder value. We seek to provide executive compensation packages that are competitive with comparable companies and reward the achievement of short-term and long-term performance goals.
Like most companies, we use a combination of fixed and variable compensation programs to reward and incentivize strong performance, as well as to align the interests of our executives with those of our stockholders. Our compensation philosophy is to target total compensation at approximately the 50th percentile of comparable companies, with higher comparable levels of pay based on higher level of company and individual performance. However, our compensation committee’s decisions on target compensation for specific individuals have also been influenced by a variety of additional factors, including but not limited to market conditions, our company’s recent financial performance and operational challenges, and individual performance, including scope of duties within our organizational structure, institutional knowledge, position readiness, internal pay equity, and/or level of difficulty in recruiting a replacement executive.
Our pay mix consists primarily of base salary, annual performance-based cash incentives, time-based equity incentives, and performance-based equity incentives. We have no guaranteed bonuses, no pension plans or other executive retirement plans except our 401(k) plan available to all of our employees, no significant tax gross-up arrangements, and no material executive perquisites such as company-paid personal travel, financial planning assistance, or car allowances. Total compensation levels reflect corporate positions, responsibilities, and achievement of goals. Accordingly, compensation levels may vary significantly from year to year and among our various executive officers.
We believe that we have closely linked executive officer pay to performance primarily through two components of our compensation system. In 2015, we added a performance-based element to our long-term equity incentive program through the award of PRSUs. For 2017, we also continued to use an annual cash incentive program that was based on our company-wide EBIT before all non-recurring charges approved by our compensation committee.
An important principle driving our executive compensation programs is our belief that it benefits our stockholders for the target total direct compensation opportunities of our executive officers to be tied to our company’s current and long-term performance. As a result, at-risk pay is expected to comprise an increasingly significant portion of our executive compensation, particularly for our most senior executive officers.
Role of the Compensation Committee
Our compensation committee is responsible for, among other things:
• | the review and approval of our compensation philosophy; |
• | the review of all executive compensation plans and structures, including that of our executive officers and other members of management; |
• | the approval (or, for certain determinations relating to our chief executive officer, recommendation to our board of directors) of individual compensation for our executive officers and other members of management; |
• | the approval of annual and long-term incentive performance metrics, as well as payouts thereunder; and |
• | the review of other executive benefit plans, including perquisites. |
Our compensation committee also analyzes the reasonableness of our overall executive compensation packages. Our compensation committee has a formal written charter that delineates its responsibilities, a full copy of which is posted on our website at www.rrts.com.
While our chief executive officer and other executive officers may attend meetings of our compensation committee from time to time, the ultimate decisions regarding executive officer compensation are made solely by the members of our compensation committee or, for certain determinations relating to our chief executive officer, our board of directors. These decisions are based
60
not only on our compensation committee’s deliberations, but also from input requested from outside advisors, including in some years our compensation committee’s outside compensation consultant, with respect to, among other things, market data analyses. The final decisions relating to our chief executive officer’s compensation have historically been based on recommendations of our compensation committee and included discussions with and approval by all of our non-employee directors without the presence of management. Our compensation committee typically discusses proposals for our chief executive officer’s compensation with him but the final decisions regarding his compensation are made when he is not present. Decisions regarding the compensation of our other executive officers have historically been based on recommendations of our compensation committee, after considering recommendations from our chief executive officer (or, in the case of compensation determinations made in February 2017, our then president and chief operating officer Mr. Stoelting).
Compensation-Setting Process
Overall compensation levels for our executive officers are generally determined based on our compensation committee’s evaluation of the following factors:
• | the individual’s duties and responsibilities within our company; |
• | the individual’s experience and expertise; |
• | compensation levels for similar positions in our industry; |
• | performance of the individual and our company as a whole; and |
• | the levels of compensation necessary to recruit new executive officers. |
Each year our compensation committee, after consultation with our senior management, establishes performance targets for our annual incentive bonus plan and our PRSU Program that requires the achievement of specified target financial results. Each year our compensation committee also determines performance-based compensation by assessing prior year actual financial results against these pre-established financial targets. In addition, our compensation committee’s decisions on target compensation for specific individuals have also been and will continue to be influenced by a variety of additional factors such as internal pay equity, the executive officer’s ability to impact strategic goals, the length of service with our company, and the level of difficulty in recruiting a replacement executive. Ultimately, the amount of compensation awarded to our executives is determined based on our performance and what our compensation committee believes is in the best interest of our stockholders.
Role of Compensation Consultant
Our compensation committee typically engages the services of an outside compensation consultant to provide independent analysis and advice in connection with making executive compensation decisions.
In mid-2015, our compensation committee engaged Compensia, Inc. (referred to as Compensia) to provide the committee with an executive compensation assessment for 2016. The chairman of our compensation committee, in consultation with other committee members, defined the scope of Compensia’s 2016 engagement and related responsibilities. These responsibilities included, among other things, advising on issues of executive compensation and equity compensation structure, assisting with the identification of relevant peer companies, and assisting in the preparation of compensation disclosure for inclusion in our SEC filings.
Our compensation committee determined not to engage Compensia or any other compensation consultant to assist with its 2017 executive compensation analyses and determinations. This decision was primarily based on the company’s poor financial performance in late 2016 and the committee’s belief that it would not be appropriate to adjust the compensation of our senior executive officers in light of those results.
Subsequently, in mid-2017, our compensation committee engaged Compensia to provide the committee with executive and director compensation assessments for 2018.
Compensia did not perform any consulting or advisory services for our management team in 2017 and has not been retained to perform any consulting or advisory services for our management team in 2018.
Role of Management in Setting Compensation
Our senior human resources executive and members of our finance team have historically worked with our chief executive officer to
• | formulate recommended changes to our executive compensation plans and arrangements; |
61
• | formulate recommendations for financial metrics and related target levels to be achieved under those plans and arrangements; |
• | prepare analyses of financial data and other briefing materials to assist our compensation; |
• | committee in making its decisions; and |
• | ultimately, to implement the decisions of our compensation committee. |
Historically, our chief executive officer has been actively engaged in setting compensation for our other executive officers through a variety of means, including recommending for compensation committee approval the financial goals and the annual variable pay amounts for such other executive officers. For 2017, Mr. Stoelting, our then president and chief operating officer, had primary responsibility for these activities. Our chief executive officer and president are generally subject to the same financial performance metrics and related target levels as our other executive officers.
Compensation Structure
Although the final structure may vary from year to year and individual to individual, our compensation committee utilizes three main components for executive officer compensation:
• | Base Salary - fixed pay that takes into account an individual’s duties and responsibilities, experience, expertise, and individual potential and performance. |
• | Annual Incentive Bonus - variable cash compensation that takes into account our financial performance during a particular year. |
• | Long-Term Incentives - stock-based awards consisting of PRSUs, RSUs and, in certain situations, time-based stock options, all of which reflect the performance of our common stock, encourage retention, and align executive officer and stockholder interests. |
Pay Mix
In determining the allocation among base salary, annual incentive bonus opportunity, and long-term incentive compensation, our compensation committee considers the following factors:
• | our short-term and long-term business objectives; |
• | competitive trends within our industry; and |
• | the importance of creating a performance-based environment that ties a significant portion of each executive officer’s compensation to the achievement of performance targets and corporate objectives. |
When considering a proposed compensation package for an executive officer, our compensation committee considers the compensation package as a whole, including each element of total compensation. For example, before determining officer compensation for 2017, our compensation committee reviewed, for each executive officer, each element of compensation paid in 2016, including base salary, the 2016 annual incentive bonus earned, and the value of equity awards made in prior years. Our compensation committee and management use this information to assess the overall effect and long-term implications of compensation decisions, rather than viewing individual decisions in isolation. We have no pre-established policy for allocating between either cash and non-cash or short-term or long-term compensation.
Our compensation committee believes that the particular elements of compensation identified above produce a well-balanced mix of cash versus stock-based compensation, retention value, and “at-risk” compensation that collectively provide each executive officer with both short-term and long-term performance incentives. Base salary provides the executive officer with a measure of security as to the minimum level of compensation he or she will receive while the annual and long-term incentive compensation elements motivate the executive officer to focus on the financial and operational metrics that will produce a high level of company performance over both the annual and long term. Our compensation committee believes that this approach should lead to increases in stockholder value, provide an appropriate reward for our executive officers, and reduce the risk of loss of executive officers to competitors.
While each of the elements of our compensation program is intended to motivate and encourage all executive officers to drive performance and achieve superior results for our stockholders, there is a different emphasis on the three primary elements based on an executive officer’s position and ability to impact our financial results. Historically, the percentage of performance-based pay, or “at-risk” pay, has increased with job responsibility. This is intended to offer an opportunity for increased compensation in the event
62
of successful performance, matched with the prospect of reduced compensation when performance falls short of established financial goals.
For 2017, compensation for our named executive officers (other than Messrs. DiBlasi and Armbruster, who were terminated from their former positions as executive officers effective April 30, 2017 and March 29, 2017, respectively) had been structured so that more than half the compensation consisted of equity awards and an annual incentive bonus opportunity that would be performance-based and dependent on our 2017 financial results, with the other portion comprising base salary.
While the annual incentive bonus program for our executive officers is based primarily on our company-wide performance, such compensation program is also designed to provide payments to certain executive officers who lead our business units based on a combination of consolidated company and business unit results. For example, a portion of the 2017 annual cash incentive opportunity for the president of our Ascent business unit was based on the performance of that business unit, for which he is primarily responsible. We believe this blended program design motivates business units to work together to achieve greater returns for our stockholders. In any one year, because we are comprised of different business units, executive officers leading high-performing business units may receive significantly more compensation than executive officers leading business units that do not perform well.
Compensation Peer Group
As discussed above, our compensation committee did not engage a compensation consultant to assist with its 2017 executive compensation decisions, and did not use peer group or other benchmarking information.
Compensation-Related Risk Considerations
Our compensation committee believes that our annual incentive bonus and long-term incentive compensation programs provide incentives to create long-term stockholder value. Several elements of these programs are also designed to discourage behavior that leads to inappropriate or excessive risk-taking:
• | Our compensation committee believes that EBIT (which shall mean our consolidated net income, calculated in accordance with GAAP, plus, to the extent deducted in calculating such net income, all charges for or with respect to interest and income taxes and all non-recurring charges agreed to by our Compensation Committee), the financial metric used in 2017 to determine the amount of each executive officer’s annual incentive bonus, is a measure that drives long-term stockholder value. Moreover, our compensation committee attempts to set performance ranges for this metric that encourage success without encouraging excessive risk taking to achieve short-term results. In addition, the overall annual incentive bonus for each of our executive officers never exceeds 150% of their base salaries, no matter how much our financial performance exceeds the performance ranges established at the beginning of the year. |
• | Our 2017 annual incentive plan continued to provide that our executive officers would receive payments if our company achieved 80% of the target EBIT. Our compensation committee believes that this relatively low threshold discourages our executive officers from taking excessive risk to achieve performance at a higher percentage of the pre-established target level. |
• | Our compensation committee believes that EBITDA, the financial metric used in our 2017 PRSU program, is also a measure that drives long-term stockholder value. Moreover, our compensation committee attempts to set performance ranges for this metric that encourage success without encouraging excessive risk taking to achieve short-term results. |
• | Our PRSUs and RSUs are earned and vest, respectively, over four-year periods, encouraging our executive officers to look to long-term appreciation in equity values. |
• | Our 2017 time-based stock options granted to Messrs. Stoelting, Gettle, Rogers, and Cousins vest over a four-year period, encouraging them to look to long-term appreciation in equity values. |
Individual Executive Officer Compensation
Base Salary. Base salaries for our newly hired or appointed executive officers are generally set based on the position within our company, competitive salary levels for comparable positions at other companies, and the executive’s experience. Base salaries of our executive officers are reviewed each year by our compensation committee, and adjustments to base salaries are based on factors such as the overall performance of our company, new roles and responsibilities assumed by the executive, the performance of the executive officer’s area of responsibility, the executive officer’s impact on strategic goals, the length of service with our company, and revisions to our compensation philosophy. However, there is no specific weighting applied to any one factor in setting or adjusting base salaries, and the process ultimately relies on the subjective exercise of our compensation committee’s judgment.
63
Although salaries have historically been targeted at the 25th to 50th percentile of our peer group and relevant compensation survey data, our compensation committee has also taken into account historical compensation, internal parity with other executives, potential as a key contributor, and special recruiting situations.
Base Salaries for 2017. Base salary deliberations for 2017 were conducted from November 2016 through February 2017. Mr. Stoelting, who was then serving as our president and chief operating officer, met with Mr. DiBlasi (our then chief executive officer), Mr. Staley (our then lead independent director), and Mr. Rued (the then chairman of our board of directors) regarding the compensation of our executive officers. Following these discussions, Mr. Staley met with the other members of our compensation committee to discuss the base salary recommendations of Messrs. Stoelting, Staley, and Rued.
For 2017, our compensation committee considered potential future changes in our senior management team as well as the other factors discussed in “Compensation-Setting Process” above and, in connection therewith, determined to maintain the base salaries for each of Messrs. DiBlasi and Armbruster at their current levels, and increased the base salaries for Messrs. Stoelting and Gettle. The 2017 changes in base salary for Messrs. Stoelting and Gettle became effective on May 1, 2017. A summary of the base salary changes made for 2017 is outlined below for each of our named executive officers:
Base Salary | |||||||||||
Name | 2016 | 2017 | Y/Y Change | ||||||||
Curtis W. Stoelting | $ | 450,000 | $ | 510,000 | (1) | 13.3 | % | ||||
Michael L. Gettle | $ | 450,000 | (2) | $ | 510,000 | (3) | 13.3 | % | |||
Terence R. Rogers | $ | — | $ | 400,000 | (4) | — | % | ||||
Scott B. Cousins | $ | — | $ | 300,000 | (5) | — | % | ||||
Mark A. DiBlasi | $ | 538,000 | $ | 538,000 | — | % | |||||
Peter R. Armbruster | $ | 332,000 | $ | 332,000 | — | % | |||||
(1) Increased to $571,000 in connection with Mr. Stoelting’s April 30, 2017 appointment as our chief executive officer.
(2) Increased from $425,000 effective as of December 1, 2016.
(3) Increased to $571,000 in connection with Mr. Gettle's April 30, 2017 appointment as our president and chief operating officer.
(4) Mr. Rogers joined our company and was appointed chief financial officer in May 2017.
(5) Mr. Cousins joined our company and was appointed chief information officer in January 2017.
Annual Incentive Bonus Plan. In addition to base salary, our compensation committee believes that annual performance-based cash bonuses play an important role in providing incentives to our executive officers to achieve near-term performance goals.
Our compensation committee has historically believed that EBIT is a good indicator of our financial performance relative to competitors given the market in which we compete, and is also a metric that management can easily track and communicate to employees throughout the performance period. Each executive officer has a target annual incentive bonus opportunity, expressed as a percentage of base salary, with the ability to earn above or below that target based on our company’s actual performance.
When determining the EBIT target for our annual incentive bonus plan, our chief executive officer typically submits to our compensation committee the initial recommendation for the target based upon our company’s annual board-approved budget, as well as the target annual incentive bonus opportunity for each executive officer, and these recommendations are reviewed and discussed by our compensation committee. The major factors used in setting one or more target levels for a particular year are the results for the most recently-completed year and the budget for the current year, as well as general economic and market conditions. Our compensation committee sets the final EBIT target levels during our first quarter, typically at levels our compensation committee believes are challenging, but reasonable, for our company to achieve.
After our financial statements are available each year, our compensation committee determines the level of achievement for the specified EBIT target (after making any appropriate adjustments to such goal for the effects of corporate and economic factors that were not anticipated in establishing the performance measure) and awards credit for the achievement of a percentage of the target. Final determinations as to annual incentive bonus awards are then based on that percentage. If earned, actual bonuses are generally paid to our executive officers early in the second quarter of the subsequent fiscal year.
2017 Annual Incentive Bonus Plan. Our compensation committee determined that the 2017 annual incentive bonus plan for our executive officers would be based on a company-wide EBIT target that was consistent with our board-approved 2017 budget. For 2017, our compensation committee established a target annual incentive bonus opportunity for each executive officer, expressed as a percentage of base salary, with the ability to earn above or below that target based on our company's actual performance. Mr. DiBlasi did not participate in our 2017 annual incentive bonus plan.
64
The following table lists the 2017 base salaries and the 2017 annual incentive bonus plan levels for each of our named executive officers (other than Mr. DiBlasi):
Annual Incentive Bonus Plan Levels as % of Base Salary | ||||||||||||||||
Name | 2017 Base Salary | 80% of Target(1) | 90% of Target | 100% of Target | 150% of Target(2) | |||||||||||
Curtis W. Stoelting | $ | 571,000 | 30 | % | 60 | % | 90 | % | 150 | % | ||||||
Michael L. Gettle | $ | 571,000 | 30 | % | 60 | % | 90 | % | 150 | % | ||||||
Terence R. Rogers | $ | 400,000 | 28 | % | 51.5 | % | 75 | % | 137.5 | % | ||||||
Scott B. Cousins | $ | 300,000 | 25 | % | 30 | % | 50 | % | 95 | % | ||||||
Peter R. Armbruster | $ | 332,000 | 25 | % | 42.5 | % | 60 | % | 110 | % | ||||||
(1) | Represents the annual incentive bonus award (expressed as a percentage of 2017 base salary) that the named executive officer is eligible to receive if we achieved 80% of the company-wide EBIT target. No bonus awards would be payable if our actual EBIT was less than 80% of the target level. |
(2) Represents the maximum potential bonus award.
For 2017, our company-wide EBIT was less than 80% of the pre-established target. Accordingly, no annual incentive bonus awards were made to our named executive officers for 2017.
Long-Term Incentives. We believe that providing long-term incentive compensation opportunities in the form of equity awards as a significant portion of our executive officers’ total compensation packages aligns their interests with the interests of our stockholders and with our long-term success. By compensating our executive officers with our equity, they receive a stake in our company’s financial future, and the gains realized in the long term depend on their ability to drive our financial performance. Equity awards are also a useful vehicle for attracting and retaining executive talent in a competitive market.
Our compensation committee develops its equity award decisions based on its judgment as to whether the total compensation packages provided to our executive officers, including prior equity awards and the level of outstanding vested and unvested equity awards then held by each executive officer, are sufficient to retain, motivate, and adequately reward them. In addition, our compensation committee considers the accounting costs that will be reflected in our financial statements when establishing the form of equity to be granted and the size of the awards as well as the potential dilution associated with the equity awards.
We grant equity awards under our 2010 Incentive Compensation Plan (the "2010 Plan"), which was adopted by our board of directors and approved by our stockholders and permits the grant of stock options, stock appreciation rights, restricted shares, RSUs, performance shares, and other stock-based awards to our officers, directors, employees, and consultants.
Our compensation committee may adjust the mix of equity award types or approve different awards as part of future long-term incentive awards. Awards made in connection with a new, extended, or expanded employment relationship may involve a different mix of PRSUs, time-based RSUs, stock options, or other equity-related awards depending on our compensation committee’s assessment of the total compensation package being offered.
Stock Options. Stock options represent the right to purchase shares of our common stock at a specified exercise price for a specified period of time. The stock options vest and become exercisable in installments as determined by our compensation committee. Although our long-term equity incentives have in recent years consisted primarily of PRSUs and RSUs, we continue to grant stock options to certain of our executive officers on a selective basis. As described more fully below, in 2017 our compensation committee granted time-based stock options to Messrs. Stoelting, Gettle, Rogers, and Cousins.
Restricted Stock Unit Awards. RSUs represent the right to receive one share of our common stock for each RSU upon the settlement date, which is the date on which certain conditions, such as continued employment with us for a pre-established period of time, are satisfied. RSU awards reflect both increases and decreases in the market prices of our common stock from the grant-date market prices and thus tie compensation more closely to changes in stockholder value at all levels compared to stock options, whose intrinsic value changes only when the market price of our common stock increases above the exercise price. RSUs also have retention value even during periods in which the market price of our common stock does not appreciate, which supports continuity in the senior management team. In addition, RSUs allow our compensation committee to deliver equivalent value with use of fewer authorized shares than stock option awards.
Shares of our stock are issued to RSU holders as the awards vest. The vesting schedule for RSUs granted to our executive officers and other employees provides that each award vests in four equal annual installments. Recipients of RSU awards generally must remain employed by us on a continuous basis through the end of the relevant vesting period in order to receive any shares of
65
our common stock covered by that award, except that recipients may be entitled to accelerated delivery of a portion of their unvested RSUs in the case of the recipient’s death or disability, or upon a change in control of our company.
Performance RSU Awards. In 2015, our compensation committee added a performance-based element to our long-term incentive compensation program (referred to as the PRSU Program) in order to strengthen the alignment of pay-for-performance. Under the PRSU Program, PRSUs were granted to eligible employees, including our executive officers, in 2017 (other than to Mr. DiBlasi). PRSU awards are intended to reward recipients to the extent we achieve specific pre-established financial performance goals.
Under the PRSU Program, a target number of PRSUs are awarded at the beginning of each one-year performance period. Under the PRSU Program, financial performance goals are set at the beginning of each year, and performance is reviewed at the end of that year. The number of PRSUs ultimately earned will range from zero to 1.5 times the target number depending on our performance during the period. Each PRSU is equal in value to one share of our common stock, and the PRSUs earned vest in four equal installments of 25% on the date our compensation committee certifies the performance results and on March 1 of each of the next three succeeding years. Recipients of PRSU awards generally must remain employed by us on a continuous basis through the end of the relevant vesting period in order to receive any shares of our common stock covered by the PRSU award, except that recipients may be entitled to accelerated delivery of a portion of unvested PRSUs in the case of the recipient’s death or disability, or upon a change in control.
Under our PRSU Program for 2017, our compensation committee once again selected company-wide EBITDA as the financial performance metric. The calculation of EBITDA excluded non-cash compensation expense attributable to the PRSU Program, acquisition transaction expenses, the results of any acquisitions made during the year, and all non-recurring changes approved by our compensation committee. The percentage to be applied to each recipient’s target number of PRSUs ranged from zero to 150%, based upon the extent to which the actual EBITDA is achieved:
Percentage of Target EBITDA Achieved | Percentage of PRSUs Earned | ||
Less Than 89.5% | — | % | |
89.5% | 50.0 | % | |
94.7% | 75.0 | % | |
100.0% | 100.0 | % | |
104.1% | 125.0 | % | |
108.3% or more | 150.0 | % | |
Our adjusted EBITDA for the year ended December 31, 2017 did not meet the minimum performance level under the PRSU Program for 2017. Accordingly, none of the PRSUs awarded under the PRSU Program for 2017 were earned.
2017 Equity Awards. For 2017, our compensation committee determined that the equity awards to be granted to our executive officers would consist of a combination of time-based RSUs and PRSUs, as well as time-based stock options for Messrs. Stoelting, Gettle, Rogers, and Cousins. The following table sets forth the time-based RSUs and target number of PRSUs granted to our named executive officers (other than Mr. DiBlasi, who did not receive any equity awards in 2017, and other than Mr. Rogers, who received only stock options awards in 2017) on February 28, 2017:
Name | Dollar Value of RSUs | Number of RSUs(1) | Target Dollar Value of PRSUs | Target Number of PRSUs(1) | ||||||||||
Curtis W. Stoelting | $ | 166,667 | 23,070 | $ | 333,333 | 46,139 | ||||||||
Michael L. Gettle | $ | 166,667 | 23,070 | $ | 333,333 | 46,139 | ||||||||
Scott B. Cousins | $ | 40,000 | 5,357 | $ | 80,000 | 11,073 | ||||||||
Peter R. Armbruster | $ | 75,000 | 10,381 | $ | 150,000 | 20,763 | ||||||||
(1) The number of RSUs and the target number of PRSUs awarded were calculated using a dollar value per share of $7.22, which was the 20-day trailing average closing sales price for our common stock as of February 28, 2017, the date our compensation committee approved the 2017 awards. On February 28, 2017, the closing price for our common stock was $7.54.
For 2017, our compensation committee also granted stock options to Messrs. Stoelting, Gettle, Rogers, and Cousins to provide additional long-term incentives. On February 28, 2017, the committee granted Messrs. Stoelting, Gettle, and Cousins seven-year non-qualified stock options to purchase 167,000, 167,000, and 65,000 shares of our common stock, respectively, each with an exercise price equal to $7.54 per share (the fair market value of our common stock on the grant date), subject to vesting over four years, with 25% vesting on each annual anniversary of the grant date. On May 22, 2017, and pursuant to our employment agreement with Mr.
66
Rogers, the committee granted Mr. Rogers a seven-year, non-qualified stock option to purchase 165,000 shares of our common stock at a per share exercise price of $6.30 (the fair market value of our common stock on the grant date), subject to vesting over four years, with 25% vesting on each annual anniversary of the grant date.
Other Compensation Elements
Pension and Nonqualified Deferred Compensation. None of our executive officers participate in or have account balances in nonqualified defined contribution plans or other nonqualified deferred compensation plans maintained by us.
Other Compensation. All of our executive officers are eligible to participate in our employee benefit plans, including medical, dental, life insurance, and Section 401(k) plans. These plans are available to all of our employees and do not discriminate in favor of executive officers. It is generally our policy to not extend significant perquisites to our executive officers that are not broadly available to our other employees. In designing these compensation elements, we seek to provide an overall level of benefits that is competitive with that offered by companies in the markets in which we operate based upon our general understanding of industry practice. These benefits are not considered by our compensation committee in determining the compensation of our executive officers.
Employment Agreements. Historically, we did not maintain employment contracts with our executive officers or other employees. However, in recent periods we have used employment agreements with various executive officers. For example, we entered into employment agreements with Messrs. Stoelting and Gettle upon joining our company, which were subsequently amended and restated in connection with their April 30, 2017 appointments as our chief executive officer and chief operating officer, respectively. Those restated agreements, as well as our employment agreements with Messrs. Rogers, Hurst, and Paulson, each of whom was hired and appointed as an executive officer in 2017, are described below under “Executive Compensation - Employment and Other Agreements” below.
Severance Payments due Upon Termination of Employment and/or a Change in Control. We currently provide for the accelerated vesting of outstanding and unvested equity awards in connection with any “change in control” of our company. Our compensation committee believes that for our executive officers, accelerated vesting of equity awards in the event of a change in control is generally appropriate because in some change in control situations, equity of the target company is cancelled, making immediate acceleration necessary in order to preserve the value of the award. In addition, we rely primarily on equity awards to provide our executive officers with the opportunity to accumulate substantial resources to fund their retirement income, and our compensation committee believes that a change in control event is an appropriate liquidation point for awards designed for such purpose.
In addition, Messrs. Stoelting, Gettle, Rogers, Cousins, Hurst, and Paulson are, and Messrs. DiBlasi and Armbruster were, eligible to receive cash severance payments in certain circumstances related to involuntary terminations of employment. These payments are intended to provide a level of transition assistance in the event of an involuntary termination of employment. Our compensation committee believes these provisions are fair and reasonable based on its understanding of market practices among industry competitors and within the broader environment of similarly sized businesses.
We believe these post-employment severance payments and benefits are an essential element of our compensation package for our executive officers and assist us in recruiting and retaining talented individuals. In addition, we believe that it is more equitable to offer severance payments based on a standard formula determined as a multiple of base pay because severance often serves as a bridge when employment is involuntarily terminated, and should therefore not be affected by other, longer-term compensation arrangements. As a result, other compensation decisions are not generally based on the existence of this severance protection. For a detailed description of the post-employment compensation of our named executive officers, see “Potential Payments Upon Termination of Employment or Change in Control” below.
Prohibitions on Hedging and Pledging of Shares. Among other things, our insider trading policy prohibits our executive officers from engaging in put, call, derivative, or short sale transactions, as well as pledging our securities as collateral for a loan.
Stock Ownership Guidelines. We do not currently maintain stock ownership guidelines for our executive officers.
Compensation Recovery (“Clawback”) Policy. We do not currently maintain a formal compensation recovery “clawback” policy or practice regarding the adjustment or recovery of awards or payments if the relevant performance measures upon which they are based are restated or otherwise adjusted in a manner that would reduce the size of an award or payment. However, in connection with the adoption of rules under the Dodd-Frank Act, our compensation committee expects that in the future it will establish mechanisms to recover incentive compensation in the event of a financial restatement or similar event.
67
Approval Process for Equity Awards
Our executive officers and other employees receive long-term equity awards pursuant to the terms of the 2010 Plan. Our compensation committee administers the 2010 Plan and establishes the rules for all awards granted thereunder, including grant guidelines, vesting schedules, and other provisions. Our compensation committee reviews these rules from time to time and considers, among other things, the interests of our stockholders, market conditions, information provided by the compensation committee’s compensation consultant and our legal advisor, performance objectives, and recommendations made by our chief executive officer.
Our compensation committee reviews awards for all employees. Our compensation committee has established a process in which it reviews the recommendations of our chief executive officer for our executive officers (other than himself) and other employees, modifies the proposed grants in certain circumstances, and approves the awards effective as of the date of its approval.
We have no practice of timing the grant of equity awards to coordinate with the release of material non-public information, and we have not timed the release of material non-public information for the purpose of affecting the value of named executive officer compensation. In addition, our practice of calculating the number of shares of our common stock subject to equity awards based on the 20-day trailing average closing sale price of our common stock mitigates the effects of both our stock price volatility and the impact of grant timing.
In August 2013, our compensation committee created an employee RSU committee and appointed Mr. DiBlasi as the committee’s sole member. In August 2017, Mr. Stoelting replaced Mr. DiBlasi as the committee’s sole member. The employee RSU committee has the authority to grant RSUs pursuant to the 2010 Plan solely to newly hired non-executive officer employees of our company (other than “Covered Employees” as defined in the 2010 Plan) as follows:
• | the specified dollar value of any individual award of RSUs by the committee shall not exceed $50,000; |
• | the specific number of RSUs to be granted by the committee shall be calculated using the 20-day trailing average closing sales price for our common stock on the NYSE during the 20 trading days immediately prior to the grant date; |
• | all awards of RSUs by the committee shall have standard terms, including vesting; and |
• | the committee shall promptly following the end of each calendar quarter provide our compensation committee with a report regarding the grants made by the committee during the prior quarter. |
Impact of Tax and Accounting
As a general matter, our compensation committee takes into account the various tax and accounting implications of the compensation vehicles employed by us. While structuring compensation programs to result in more favorable tax and financial reporting treatment is a general objective, our compensation committee balances this goal with other business needs that may be inconsistent with obtaining the most favorable tax and accounting treatment for each component of compensation.
Deductibility. Under Section 162(m) of the Code, the federal income tax deduction for compensation paid to certain executive officers of publicly-held companies is limited to $1 million per officer per fiscal year. Prior to the Tax Reform Act, that limitation did not apply if the compensation met certain qualifying performance based requirements. As a result of the Tax Reform Act, however, that performance-based exception is generally no longer available. As a result, more of our executive compensation will likely not be tax deductible, although the impact of the loss of this tax benefit may be partially offset by the lower corporate income tax rate applicable under the Tax Reform Act. Although our compensation committee considers the impact of Section 162(m) of the Code as well as other tax and accounting consequences when developing and implementing our executive compensation programs, the compensation committee retains the flexibility to design and administer compensation programs that are in the best interests of our company and its stockholders.
Additional Tax Implications. Section 409A of the Code imposes additional income taxes on executive officers and others for certain types of deferred compensation that do not comply with Section 409A. We attempt, in good faith, to structure compensation so that it either conforms with the requirements of or qualifies for an exception under Section 409A. Sections 280G and 4999 of the Code impose an excise tax on payments to executive officers who hold significant equity interests and certain other service providers of payments and benefits received in connection with a change in control of our company that exceed the levels specified in the Section 280G rules. Our executive officers may receive the amounts shown in the section entitled “Executive Compensation-Potential Payments Upon Termination or Change in Control” as change of control payments and benefits that could trigger this excise tax. We do not offer our executive officers, as part of their change of control benefits, any gross ups or other payments related to this excise tax under Section 4999 of the Code.
Accounting Considerations. When determining the size of long-term incentive awards to our executive officers and employees, our compensation committee examines the accounting cost associated with such awards. Under Financial Accounting Standards
68
Board Accounting Standards Codification (ASC) Topic 718, “Compensation - Stock Compensation,” grants of stock options, PRSUs, and RSUs result in an accounting charge for us equal to the grant date fair value of those securities. For stock options, the accounting cost is calculated using the Black Scholes option pricing model. The cost is then amortized over the requisite vesting period. For time-based RSUs, the accounting cost is generally equal to the fair market value of the underlying shares of common stock on the date of the award. The cost is then amortized over the requisite service period. For PRSUs, the accounting cost is generally equal to the fair market value of the underlying shares of common stock on the date of the award that are expected to vest under the performance criteria. Adjustments to the accounting cost are made each quarter based on re-evaluations of expected vesting under the performance criteria.
Compensation Committee Interlocks and Insider Participation
In 2017, Messrs. Urkiel, Dobak, Doerr, Staley, and Ward served as members of our compensation committee. During such fiscal year, none of these individuals had any relationship requiring disclosure under Item 404 of Regulation S-K.
None of Messrs. Urkiel, Doerr, Staley or Ward has, at any time, been an officer or employee of our company. Mr. Dobak served in various leadership roles with our company from January 2007 to December 2015, most recently as our President - Less-than-Truckload and Transportation Management Solutions. During 2017, none of our executive officers served on the compensation committee or board of directors of any entity whose executive officers serve as a member of our board of directors or compensation committee.
69
Compensation Committee Report
Our compensation committee has reviewed and discussed with management the Compensation Discussion and Analysis included in this Form 10-K. Based on such review and discussion, the compensation committee recommended to our board of directors, and our board of directors approved, that our Compensation Discussion and Analysis be included in this Form 10-K for the year ended December 31, 2017 for filing with the SEC.
William S. Urkiel, Chairman
Scott L. Dobak
Christopher L. Doerr
James D. Staley
Michael P. Ward
Fiscal Year 2017 Summary Compensation Table
The following table sets forth compensation information for our named executive officers.
Name and Principal Position | Year | Salary | Bonus | Stock Awards (1) | Option Awards(2) | Non-Equity Incentive Plan Compensation (3) | All Other Compensation(4) | Total | |||||||||||||||||||||||
Curtis W. Stoelting | 2017 | $ | 529,115 | $ | — | $ | 521,836 | $ | 552,672 | $ | — | $ | 5,966 | $ | 1,609,589 | ||||||||||||||||
Chief Executive Officer(5) | 2016 | $ | 432,692 | $ | — | $ | — | $ | 595,600 | $ | — | $ | 4,749 | $ | 1,033,041 | ||||||||||||||||
Michael L. Gettle | 2017 | $ | 528,154 | $ | — | $ | 521,836 | $ | 552,672 | $ | — | $ | 8,874 | $ | 1,611,536 | ||||||||||||||||
President, Chief Operating Officer, and Secretary (6) | |||||||||||||||||||||||||||||||
Terence R. Rogers | 2017 | $ | 246,154 | $ | — | $ | — | $ | 452,100 | $ | — | $ | 327 | $ | 698,581 | ||||||||||||||||
Executive Vice President and Chief Financial Officer(7) | |||||||||||||||||||||||||||||||
Scott B. Cousins | 2017 | $ | 288,462 | $ | 50,000 | (9 | ) | $ | 125,239 | $ | 215,112 | $ | — | $ | 2,016 | $ | 680,829 | ||||||||||||||
Chief Information Officer (8) | |||||||||||||||||||||||||||||||
Mark A. DiBlasi | 2017 | $ | 475,923 | (11) | $ | — | $ | — | $ | — | $ | — | $ | 7,284 | $ | 483,207 | |||||||||||||||
Former Chief Executive Officer and President(10) | 2016 | $ | 537,154 | $ | — | $ | — | $ | 405,300 | $ | — | $ | 9,138 | $ | 951,592 | ||||||||||||||||
2015 | $ | 543,885 | $ | — | $ | 661,534 | $ | — | $ | — | $ | 8,754 | $ | 1,214,173 | |||||||||||||||||
Peter R. Armbruster | 2017 | $ | 293,692 | (13) | $ | — | $ | 234,826 | $ | — | $ | — | $ | 8,785 | $ | 537,303 | |||||||||||||||
Former Chief Financial Officer, Treasurer, and Secretary(12) | 2016 | $ | 331,462 | $ | — | $ | 322,302 | $ | — | $ | — | $ | 8,724 | $ | 662,488 | ||||||||||||||||
2015 | $ | 335,192 | $ | — | $ | 441,040 | $ | — | $ | — | $ | 8,754 | $ | 784,986 | |||||||||||||||||
(1) | Amounts reflect the grant date fair value of stock awards. The grant date fair value is calculated in accordance with ASC Topic 718, “Compensation - Stock Compensation.” The fair value of time-vest RSUs is based on the closing market price of our common stock on the date of grant. The fair value of PRSUs is based on the closing market price of our common stock on the date of grant and was calculated based on the probable achievement of the performance goals as determined at the date of grant, which was determined to be the target level of performance. Pursuant to SEC rules, the amounts shown exclude the impact of estimated forfeitures related to service-based vesting conditions. For a discussion of valuation assumptions, see Note 9 to our 2017 consolidated financial |
70
statements included in this Form 10-K. These amounts reflect our accounting expense for these awards and do not correspond to the actual value that will be recognized by the named executive officers with respect to these awards.
The table below reflects the target number of PRSUs granted under the PRSU Program to our named executive officers (other than Messrs. DiBlasi and Rogers) for 2017, the grant date fair value of the target PRSUs reflected in the table above for fiscal 2017, and the actual number of PRSUs earned under the PRSU Program for 2017. Since our financial performance did not meet the threshold financial performance level under the PRSU Program for 2017, none of the PRSUs awarded under the PRSU Program for 2017, including to our named executive officers, were earned. See “Compensation Discussion and Analysis - Individual Executive Officer Compensation - Performance RSU Awards”.
Target Number of PRSUs | Probable Grant Date Fair Value | Number of Earned PRSUs | |||||||
Curtis W. Stoelting | 46,139 | $ | 347,888 | — | |||||
Michael L. Gettle | 46,139 | $ | 347,888 | — | |||||
Scott B. Cousins | 11,073 | $ | 83,490 | — | |||||
Peter R. Armbruster | 20,763 | $ | 156,553 | — | |||||
(2) Amounts reflect the grant date fair value of option awards. The grant date fair value is calculated in accordance with ASC Topic 718, “Compensation - Stock Compensation.” For a discussion of valuation assumptions, see Note 9 to our 2017 consolidated financial statements included in this Form 10-K. These amounts reflect our accounting expense for these awards and do not correspond to the actual value that will be recognized by the named executive officers with respect to these awards.
(3) Amounts for fiscal 2017, 2016, and 2015 reflect that we did not meet the threshold level of financial performance under our 2017, 2016 and 2015 cash incentive plans; accordingly, our named executive officers did not receive any payout under those plans. For a description of our 2017 cash incentive plan, see “Compensation Discussion and Analysis - Individual Executive Officer Compensation - 2017 Annual Incentive Bonus Plan.”
(4) | Amounts for 2017, 2016, and 2015 reflect matching contributions under our 401(k) plan and a gross-up tax reimbursement to cover taxes on term life insurance premiums computed in accordance with Internal Revenue Service guidelines. Our executive officers participate in our medical and disability insurance plans in the same manner as our other employees and do not receive any perquisites. |
(5) | Mr. Stoelting was appointed our Chief Executive Officer, Principal Financial Officer, and Principal Accounting Officer in April 2017. Mr. Stoelting previously served as our Principal Financial Officer and Principal Accounting Officer from April 2017 until March 2018 and our President and Chief Operating Officer from January 2016 until April 2017. |
(6) | Mr. Gettle was appointed our President, Chief Operating Officer, and Secretary in April 2017. Mr. Gettle previously served as our Executive Vice President from May 2016 until April 2017. |
(7) | Mr. Rogers was appointed our Executive Vice President and Chief Financial Officer in May 2017. |
(8) | Mr. Cousins was appointed our Chief Information Officer in January 2017. |
(9) | Represents a signing bonus received in January 2017. |
(10) Mr. DiBlasi served as our Chief Executive Officer from January 2006 until April 2017 and as our President from January 2006 to January 2016. Mr. DiBlasi’s employment was terminated effective April 30, 2017.
(11) | Includes $333,402 of severance payments made to Mr. DiBlasi following the termination of his employment. |
(12) Mr. Armbruster served as our Chief Financial Officer, Treasurer, and Secretary from December 2005 until March 2017. Mr Armbruster’s employment was terminated effective March 29, 2017.
(13) | Includes $239,998 of severance payments made to Mr. Armbruster following the termination of his employment. |
Employment and Other Agreements
Historically, we did not have written employment agreements with our executive officers. We have, however, provided employment letter agreements to our executive officers, which provided them with the right to participate in our incentive compensation plans and the right to participate in all insurance, retirement, and other fringe benefit plans as may from time to time be provided to our executives. The employment letter agreement with Mr. Cousins also contains, and the employment letter agreements with Messrs. DiBlasi and Armbruster also contained, severance benefits. Recently, however, we have entered into employment agreements with certain of our new executive officers, which are described below. For a discussion of the severance benefits provided to our named executive officers, see “Executive Compensation - Potential Payments Upon Termination or Change of Control.”
On April 30, 2017, in connection with our appointment of Mr. Stoelting as our Chief Executive Officer, we entered into a second amended and restated employment agreement with Mr. Stoelting. Pursuant to the terms of the employment agreement, Mr. Stoelting will receive an annual base salary of $571,000. Mr. Stoelting is also eligible to earn bonus compensation under our bonus plan and is entitled to participate in and receive all benefits under our employee benefit programs. The employment agreement provides that, in the event we terminate Mr. Stoelting’s employment without “cause” (as such term is defined in the employment agreement) or Mr. Stoelting terminates his employment for “good reason” (as such term is defined in the employment agreement), we will continue to pay Mr. Stoelting his base salary for the 18-month period following the date of such termination, and we will pay Mr. Stoelting a lump sum amount equal to 18 times the monthly COBRA premium that would be necessary to permit him to continue group insurance coverage under our plans for an 18-month period. If, however, we terminate Mr. Stoelting’s employment without “cause” (as such term is defined in the employment agreement) or Mr. Stoelting terminates his employment for “good reason” (as such term is defined in the employment agreement) during the two year period immediately following a “change in
71
control” (as such term is defined in the 2010 Plan), then in lieu of the payments described in the preceding sentence, we will continue to pay Mr. Stoelting his base salary for the 24-month period following the date of such termination, we will pay Mr. Stoelting a lump sum amount equal to two times Mr. Stoelting’s bonus, based on the target established under our bonus plan, payable during the year in which the termination of employment occurs, and we will pay Mr. Stoelting a lump sum amount equal to 24 times the monthly COBRA premium that would be necessary to permit him to continue group insurance coverage under our plans for an 24-month period. Mr. Stoelting must execute a general release in order to receive any severance benefits.
On April 30, 2017, in connection with our appointment of Mr. Gettle as our President and Chief Operating Officer, we entered into a second amended and restated employment agreement with Mr. Gettle. Pursuant to the terms of the employment agreement, Mr. Gettle will receive an annual base salary of $571,000. Mr. Gettle is also eligible to earn bonus compensation under our bonus plan and is entitled to participate in and receive all benefits under our employee benefit programs. The employment agreement provides that, in the event we terminate Mr. Gettle’s employment without “cause” (as such term is defined in the employment agreement) or Mr. Gettle terminates his employment for “good reason” (as such term is defined in the employment agreement), we will continue to pay Mr. Gettle his base salary for the 18-month period following the date of such termination, and we will pay Mr. Gettle a lump sum amount equal to 18 times the monthly COBRA premium that would be necessary to permit him to continue group insurance coverage under our plans for an 18-month period. If, however, we terminate Mr. Gettle’s employment without “cause” (as such term is defined in the employment agreement) or Mr. Gettle terminates his employment for “good reason” (as such term is defined in the employment agreement) during the two year period immediately following a “change in control” (as such term is defined in the 2010 Plan), then in lieu of the payments described in the preceding sentence, we will continue to pay Mr. Gettle his base salary for the 24-month period following the date of such termination, we will pay Mr. Gettle a lump sum amount equal to two times Mr. Gettle’s bonus, based on the target established under our bonus plan, payable during the year in which the termination of employment occurs, and we will pay Mr. Gettle a lump sum amount equal to 24 times the monthly COBRA premium that would be necessary to permit him to continue group insurance coverage under our plans for an 24-month period. Mr. Gettle must execute a general release in order to receive any severance benefits.
On May 22, 2017, in connection with our appointment of Mr. Rogers as our Executive Vice President and Chief Financial Officer, we entered into an employment agreement with Mr. Rogers. Pursuant to the terms of the employment agreement, Mr. Rogers will receive an annual base salary of $400,000. Mr. Rogers is also eligible to earn bonus compensation under our bonus plan and is entitled to participate in and receive all benefits under our employee benefit programs. The employment agreement provides that, in the event we terminate Mr. Rogers’ employment without “cause” (as such term is defined in the employment agreement) or Mr. Rogers terminates his employment for “good reason” (as such term is defined in the employment agreement), we will continue to pay Mr. Rogers his base salary for the 12-month period following the date of such termination, and we will pay Mr. Rogers a lump sum amount equal to 12 times the monthly COBRA premium that would be necessary to permit him to continue group insurance coverage under our plans for a 12-month period. If, however, we terminate Mr. Rogers’ employment without “cause” (as such term is defined in the employment agreement) or Mr. Rogers terminates his employment for “good reason” (as such term is defined in the employment agreement) during the two year period immediately following a “change in control” (as such term is defined in the 2010 Plan), then in lieu of the payments described in the preceding sentence, we will continue to pay Mr. Rogers his base salary for the 18-month period following the date of such termination, we will pay Mr. Rogers a lump sum amount equal to one and one-half times Mr. Rogers’ bonus, based on the target established under our bonus plan, payable during the year in which the termination of employment occurs, and we will pay Mr. Rogers a lump sum amount equal to 18 times the monthly COBRA premium that would be necessary to permit him to continue group insurance coverage under our plans for an 18-month period. Mr. Rogers must execute a general release in order to receive any severance benefits.
On July 31, 2017, in connection with our appointment of Mr. Hurst as our President - Roadrunner Freight, we entered into an employment agreement with Mr. Hurst. Pursuant to the terms of the employment agreement, Mr. Hurst will receive an annual base salary of $295,000. Mr. Hurst is also eligible to earn bonus compensation under our bonus plan and is entitled to participate in and receive all benefits under our employee benefit programs. The employment agreement provides that, in the event we terminate Mr. Hurst’s employment without “cause” (as such term is defined in the employment agreement) or Mr. Hurst terminates his employment for “good reason” (as such term is defined in the employment agreement), we will continue to pay Mr. Hurst his base salary for the 12-month period following the date of such termination, and we will pay Mr. Hurst a lump sum amount equal to 12 times the monthly COBRA premium that would be necessary to permit him to continue group insurance coverage under our plans for a 12-month period. Mr. Hurst must execute a general release in order to receive any severance benefits.
On October 4, 2017, in connection with our appointment of Mr. Paulson as our Senior Vice President - Human Resources, we entered into an employment agreement with Mr. Paulson. Pursuant to the terms of the employment agreement, Mr. Paulson will receive an annual base salary of $200,000. Mr. Paulson is also eligible to earn bonus compensation under our bonus plan and is entitled to participate in and receive all benefits under our employee benefit programs. The employment agreement provides that, in the event we terminate Mr. Paulson’s employment without “cause” (as such term is defined in the employment agreement) or Mr. Paulson terminates his employment for “good reason” (as such term is defined in the employment agreement), we will continue to pay Mr. Paulson his base salary for the nine-month period following the date of such termination, and we will pay Mr. Paulson a
72
lump sum amount equal to nine times the monthly COBRA premium that would be necessary to permit him to continue group insurance coverage under our plans for a nine-month period. Mr. Paulson must execute a general release in order to receive any severance benefits.
Fiscal Year 2017 Grants of Plan-Based Awards
The following table provides information with respect to grants of plan-based awards to our named executive officers during the fiscal year ended December 31, 2017.
Estimated Future Payouts Under Non-Equity Incentive Plan Awards (1) | Estimated Future Payouts Under Equity Incentive Plan Awards(2) | All Other Stock Awards: Number of Shares of Stock or Units(3) | All Other Option Awards: Number of Securities Underlying Options | Exercise or Base Price of Option Awards | Grant Date Fair Value of Stock and Option Awards(4) | |||||||||||||||||||||||
Name | Grant Date | Threshold | Target | Maximum | Threshold | Target | Maximum | |||||||||||||||||||||
Curtis W. Stoelting | $ | 171,300 | $ | 513,900 | $ | 856,500 | ||||||||||||||||||||||
2/28/2017 | 23,070 | 46,139 | 69,209 | $ | 347,888 | |||||||||||||||||||||||
2/28/2017 | 23,070 | $ | 173,948 | |||||||||||||||||||||||||
2/28/2017 | 167,000(5) | $ | 7.54 | $ | 552,672 | |||||||||||||||||||||||
Michael L. Gettle | $ | 171,300 | $ | 513,900 | $ | 856,500 | ||||||||||||||||||||||
2/28/2017 | 23,070 | 46,139 | 69,209 | $ | 347,888 | |||||||||||||||||||||||
2/28/2017 | 23,070 | $ | 173,948 | |||||||||||||||||||||||||
2/28/2017 | 167,000(5) | $ | 7.54 | $ | 552,672 | |||||||||||||||||||||||
Terence R. Rogers | $ | 112,000 | $ | 300,000 | $ | 550,000 | ||||||||||||||||||||||
5/22/2017 | 165,000(6) | $ | 6.30 | $ | 452,100 | |||||||||||||||||||||||
Scott B. Cousins | $ | 45,000 | $ | 150,000 | $ | 285,000 | ||||||||||||||||||||||
2/28/2017 | 5,537 | 11,073 | 16,610 | $ | 83,490 | |||||||||||||||||||||||
2/28/2017 | 5,537 | $ | 41,749 | |||||||||||||||||||||||||
2/28/2017 | 65,000(5) | $ | 7.54 | $ | 215,112 | |||||||||||||||||||||||
Peter R. Armbruster (7) | $ | 83,000 | $ | 199,200 | $ | 365,200 | ||||||||||||||||||||||
2/28/2017 | 10,381 | 20,763 | 31,144 | $ | 156,553 | |||||||||||||||||||||||
2/28/2017 | 10,381 | $ | 78,273 | |||||||||||||||||||||||||
(1) | Amounts reflect the threshold, target and maximum amounts that could have been paid to the named executive officer under our 2017 cash incentive plan. For fiscal 2017, we did not meet the threshold level of financial performance under our 2017 cash incentive plan; accordingly, our named executive officers did not receive any payout under that plan. For a description of our 2017 cash incentive plan, see “Compensation Discussion and Analysis - Individual Executive Officer Compensation - 2017 Annual Incentive Bonus Plan.” |
(2) | Amounts reflect the threshold, target, and maximum number of shares of our common stock subject to PRSUs granted to our named executive officers under the PRSU Program for 2017. Our financial performance did not exceed the threshold financial performance level under the PRSU Program for 2017. Accordingly, none of the PRSUs awarded under the PRSU Program for 2017, including to our named executive officers, were earned. See “Compensation Discussion and Analysis - Individual Executive Officer Compensation - 2017 Equity Awards.” |
(3) | Such RSUs vest 25% on each of March 1, 2018, 2019, 2020, and 2021. |
(4) | Amounts reflect the grant date fair value of stock and option awards. The grant date fair value is calculated in accordance with ASC Topic 718, “Compensation - Stock Compensation.” See footnotes 1 and 2 of the Fiscal Year 2017 Summary Compensation Table above. |
(5) | 25% of the shares underlying this stock option vest on each of February 28, 2018, 2019, 2020, and 2021. |
(6) | 25% of the shares underlying this stock option vest on each of May 22, 2018, 2019, 2020, and 2021. |
(7) | Mr. Armbruster served as our Chief Financial Officer, Treasurer, and Secretary from December 2005 until March 2017. Mr. Armbruster’s employment was terminated effective March 29, 2017. |
73
Outstanding Equity Awards at Fiscal Year-End 2017
The following table sets forth the outstanding equity awards held by our named executive officers as of December 31, 2017.
Option Awards | Stock Awards | ||||||||||||||||
Number of Securities Underlying Unexercised Options | Option Exercise Price | Option Expiration Date | Number of Shares or Units of Stock that Have Not Vested | Market Value of Shares or Units of Stock that Have Not Vested(1) | |||||||||||||
Name | Exercisable | Unexercisable | |||||||||||||||
Curtis W. Stoelting | 30,000 | 120,000(2) | $ | 7.11 | 1/18/2023 | ||||||||||||
30,000 | 120,000 (2) | $ | 14.22 | 1/18/2023 | |||||||||||||
— | 167,000 (3) | $ | 7.54 | 2/28/2024 | |||||||||||||
23,070(4) | $ | 177,870 | |||||||||||||||
Michael L. Gettle | 20,000 | 80,000(5) | $ | 7.64 | 5/18/2023 | ||||||||||||
— | 167,000(3) | $ | 7.54 | 2/28/2024 | |||||||||||||
23,070(4) | $ | 177,870 | |||||||||||||||
Terence R. Rogers | — | 165,000(6) | $ | 6.30 | 5/22/2024 | ||||||||||||
Scott B. Cousins | — | 65,000(3) | $ | 7.54 | 2/28/2024 | ||||||||||||
5,537(4) | $ | 42,690 | |||||||||||||||
Mark A. DiBlasi(7) | 41,667 | 83,333(8) | $ | 7.11 | 1/18/2020 | ||||||||||||
41,667 | 83,333(8) | $ | 14.22 | 1/18/2020 | |||||||||||||
4,165(9) | $ | 32,112 | |||||||||||||||
(1) Based on the closing price of our common stock on December 31, 2017.
(2) 20% of the total number of shares underlying this stock option vest on each of January 18, 2017, 2018, 2019, 2020, and 2021.
(3) 25% of the shares underlying this stock option vest on each of February 28, 2018, 2019, 2020, and 2021.
(4) | Such RSUs vest 25% on each of March 1, 2018, 2019, 2020, and 2021. |
(5) | 20% of the total number of shares underlying this stock option vest on each of May 18, 2017, 2018, 2019, 2020, and 2021. |
(6) 25% of the shares underlying this stock option vest on each of May 22, 2018, 2019, 2020, and 2021.
(7) | Mr. DiBlasi served as our Chief Executive Officer from January 2006 until April 2017 and as our President from January 2006 to January 2016. Mr. DiBlasi’s employment was terminated effective April 30, 2017. |
(8) | One-third of the total number of shares underlying this stock option vest on each of January 18, 2017, 2018, and 2019. |
(9) | Such RSUs vest on March 1, 2018. |
Option Exercises and Stock Vested in Fiscal Year 2017
The following table sets forth information concerning the value realized by each of our named executive officers upon the exercise of stock options and the vesting of stock awards during 2017.
Option Awards | Stock Awards | ||||||||||
Name | Number of Shares Acquired on Exercise | Value Realized on Exercise | Number of Shares Acquired on Vesting | Value Realized on Vesting(1) | |||||||
Curtis W. Stoelting | — | $ | — | ||||||||
Michael L. Gettle | — | $ | — | ||||||||
Terence R. Rogers | — | $ | — | ||||||||
Scott B. Cousins | — | $ | — | ||||||||
Mark A. DiBlasi | 8,726 | $ | 67,190 | ||||||||
Peter R. Armbruster | 7,689 | $ | 59,205 | ||||||||
(1) The value realized equals the fair market value of our common stock on the date of vesting multiplied by the number of shares released on vest date.
74
Pension Benefits
We do not offer any defined benefit pension plans for any of our employees. We have a 401(k) plan in which our employees may participate. In 2017, no discretionary contributions to our 401(k) plan were made on behalf of our executive officers.
Nonqualified Deferred Compensation and Retirement Plans
We do not offer any deferred compensation plans, defined benefit pension plans, or supplemental retirement plans for our executive officers.
401(k) Plan
We sponsor a defined contribution profit sharing plan for our full-time employees, which is intended to qualify as a tax qualified plan under Section 401 of the Code. The plan provides that each participant may contribute up to 100% of his or her pre-tax compensation, up to the statutory limit. The plan permits us to make discretionary contributions of up to an additional 50% of each participant’s contributions not to exceed 4% of his or her pre-tax compensation, up to the statutory limit, which generally vest over three years. We match 50% of each participant’s contributions up to the first 6% contributed.
Potential Payments Upon Termination or Change in Control
As described above, the employment agreements with Messrs. Stoelting, Gettle, Rogers, Hurst, and Paulson provide for severance benefits upon certain terminations of employment, including following a change in control. See “Employment and Other Agreements.” In addition, the employment letter agreement with Mr. Cousins provides for, and the employment letter agreements with Messrs. DiBlasi and Armbruster provided for severance benefits upon certain terminations of employment. Pursuant to the employment letter agreement with Mr. Cousins, if Mr. Cousins (i) is terminated for any reason other than for cause or (ii) is terminated because of a change of control, in each case during the first three years of his employment, he is entitled to receive a severance payment equal to 12 months of his base pay. Our obligation to pay severance benefits is subject to Mr. Cousins' execution and delivery to us of a release. Pursuant to the employment letter agreements with Messrs. DiBlasi and Armbruster, if Messrs. DiBlasi and Armbruster (i) was terminated for any reason other than for cause, (ii) terminated his employment voluntarily for good reason, or (iii) was terminated without cause during the one-year period following a change of control, he was entitled to receive his current base salary for a period of 12 months in accordance with our normal payroll practices and would be eligible to receive all benefits under all benefit plans and programs provided by us (including medical and group life plans and programs) for the same period. Our obligation to pay severance benefits was subject to Messrs. DiBlasi’s or Armbruster’s compliance with any confidentiality, non-competition, and non-solicitation agreements with us, as well as Messrs. DiBlasi’s or Armbruster’s execution and delivery to us of a release. The definitions of “change of control,” “cause,” and “good reason” and the descriptions of the payments and benefits can be found in the employment letter agreements, which we have filed with the SEC. The arrangements reflected in these agreements are designed to encourage the officers’ full attention and dedication to our company currently and, in the event of termination following a change of control, provide these officers with individual financial security.
In addition, in the event of a change in control (as defined in the 2010 Plan), all outstanding and unvested stock options, RSUs, and earned PRSUs, as well as the target number of PRSUs if the change in control occurs before the “Performance Determination Date” (as defined in the PRSU Award Agreement, a form of which has been filed with the SEC) with respect to such PRSUs, including those held by our named executive officers, will immediately vest as of the date of the change in control.
The tables below provide certain information regarding potential payments and other benefits that would be payable to our named executive officers upon any termination of employment or a change of control of our company. The tables below assume that the termination or change of control event occurred on December 31, 2017.
Curtis W. Stoelting
Executive Benefits | Termination without Cause or for Good Reason | Termination without Cause or for Good Reason within 24 Months Following a Change of Control | Change in Control | ||||||||||
Cash-based Severance | $ | 856,500 | $ | 1,142,000 | $ | — | |||||||
Health and Welfare Benefits | $ | 119 | $ | 158 | $ | — | |||||||
Bonus | $ | — | $ | 1,027,800 | $ | — | |||||||
Equity Treatment | $ | — | $ | — | $ | 651,991 | (1) | ||||||
(1) The amounts shown represent the market value of unvested stock options and RSUs and the target number of PRSUs granted during 2017 that would become fully vested upon a change in control and is based on the closing price of our common stock on December 31, 2017.
75
Michael L. Gettle
Executive Benefits | Termination without Cause or for Good Reason | Termination without Cause or for Good Reason within 24 Months Following a Change of Control | Change in Control | ||||||||||
Cash-based Severance | $ | 856,500 | $ | 1,142,000 | $ | — | |||||||
Health and Welfare Benefits | $ | 35,503 | $ | 47,337 | $ | — | |||||||
Bonus | $ | — | $ | 1,027,800 | $ | — | |||||||
Equity Treatment | $ | — | $ | — | $ | 568,991 | (1) | ||||||
(1) The amounts shown represent the market value of unvested stock options and RSUs and the target number of PRSUs granted during 2017 that would become fully vested upon a change in control and is based on the closing price of our common stock on December 31, 2017.
Terence R. Rogers
Executive Benefits | Termination without Cause or for Good Reason | Termination without Cause or for Good Reason within 24 Months Following a Change of Control | Change in Control | ||||||||||
Cash-based Severance | $ | 400,000 | $ | 600,000 | $ | — | |||||||
Health and Welfare Benefits | $ | — | $ | — | $ | — | |||||||
Bonus | $ | — | $ | 450,000 | $ | — | |||||||
Equity Treatment | $ | — | $ | — | $ | 232,650 | (1) | ||||||
(1) The amounts shown represent the market value of unvested stock options that would become fully vested upon a change in control and is based on the closing price of our common stock on December 31, 2017.
Scott B. Cousins
Executive Benefits | Termination without Cause or Because of a Change in Control | Change in Control | |||||||
Cash-based Severance | $ | 300,000 | $ | — | |||||
Health and Welfare Benefits | $ | — | $ | — | |||||
Equity Treatment | $ | — | $ | 568,991 | (1) | ||||
(1) The amounts shown represent the market value of unvested stock options and RSUs and the target number of PRSUs granted during 2017 that would become fully vested upon a change in control and is based on the closing price of our common stock on December 31, 2017.
Director Compensation
We use a combination of cash and share-based incentive compensation to attract and retain qualified candidates to serve on our board of directors. In setting director compensation, we consider the amount of time that directors spend fulfilling their duties as a director, including committee assignments.
We seek to provide director compensation packages that are customary for boards of directors for similarly situated companies. For fiscal 2017, we paid each independent director an annual cash retainer of $35,000, payable quarterly. Payments to directors are prorated for service provided for partial years. In addition, for fiscal 2017, our lead independent director received an annual cash retainer of $20,000, the chairman of our audit committee received an annual cash retainer of $7,500, the chairman of our compensation committee received an annual cash retainer of $5,000, and the chairman of our nominating/corporate governance committee received an annual cash retainer of $3,000.
In February 2017, each of our independent directors received a grant of 7,613 RSUs having a value on the grant date of $55,000 based upon the 20-day trailing average closing sales price for our common stock as of the grant date. Each RSU is equal in value to one share of our common stock, and the RSUs vest 25% each year over four years. Each independent director generally must remain a member of our board of directors through the end of the relevant vesting period in order to receive any amount of the RSUs covered by that award, except that recipients may be entitled to accelerated delivery of a portion of unvested RSUs in the case of the recipient’s death or disability, or upon a change in control.
76
We also reimburse each director for travel and related expenses incurred in connection with attendance at board and committee meetings.
Our non-independent directors are not compensated for service as directors.
Director Summary Compensation Table for Fiscal 2017
The following table sets forth the compensation earned by our independent directors in respect of their services as a director or committee chair during fiscal 2017.
Name | Fees Earned or Paid in Cash | Stock Awards(1) | Total | |||||||||
Scott L. Dobak(2) | $ | 8,750 | $ | 39,410 | $ | 48,160 | ||||||
Christopher L. Doerr | $ | 35,000 | $ | 57,402 | $ | 92,402 | ||||||
John G. Kennedy, III | $ | 35,000 | $ | 57,402 | $ | 92,402 | ||||||
Brian C. Murray | $ | 42,500 | $ | 57,402 | $ | 99,902 | ||||||
James D. Staley | $ | 58,000 | $ | 57,402 | $ | 115,402 | ||||||
William S. Urkiel | $ | 40,000 | $ | 57,402 | $ | 97,402 | ||||||
Michael P. Ward | $ | 35,000 | $ | 57,402 | $ | 92,402 | ||||||
(1) | Amounts reflect the fair value of RSUs at the date of grant. The value is calculated in accordance with ASC Topic 718, “Compensation - Stock Compensation.” The fair value of an RSU is based on the closing market price of our common stock on the date of grant. Pursuant to SEC rules, the amounts shown exclude the impact of estimated forfeitures related to service-based vesting conditions. For a discussion of valuation assumptions, see Note 9 to our 2017 consolidated financial statements included in this Form 10-K. These amounts reflect our accounting expense for these awards and do not correspond to the actual value that will be recognized by the directors with respect to these awards. The table below provides information with respect to the outstanding stock awards held by each of our independent directors as of December 31, 2017. |
(2) | Mr. Dobak was elected to our board of directors in June 2017. |
The following table lists all outstanding stock awards held by our independent directors as of December 31, 2017:
Name | Stock Awards | |
Scott L. Dobak | 5,590 | |
Christopher L. Doerr | 14,640 | |
John G. Kennedy, III | 14,640 | |
Brian C. Murray | 12,917 | |
James D. Staley | 14,640 | |
William S. Urkiel | 14,640 | |
Michael P. Ward | 12,917 | |
CEO Pay Ratio Disclosure
As required by SEC rules, we are providing the following information about the relationship of the annual total compensation of our CEO to that of our median employee. The pay ratio and annual total compensation amount disclosed in this section are reasonable estimates that have been calculated using methodologies and assumptions permitted by SEC rules.
Median Employee Determination
We identified our median employee by calculating the 2017 cash compensation for all employees, excluding the CEO, who were employed by us on December 31, 2017. This included 4,391 employees, and included all full-time, part-time and seasonal employees that had been employed by us for at least one month. The calculation included employees who were active on December 31, 2017 but not employed for all of 2017 and the calculation did not annualize their compensation. In accordance with SEC rules, we excluded all non-U.S. employees who were active on December 31, 2017, which represented less than 5% of our total U.S. and non- U.S. workforce. Cash compensation included all earnings paid to each employee during the calendar year, including base salary and wages, bonuses and incentive payments, commissions, company 401(k) matching contributions, overtime and holiday or PTO pay.
Annual Compensation of Median Employee Using Summary Compensation Table Methodology
After identifying the median employee as described above, we calculated annual total compensation for this employee using the same methodology we use for our CEO in the 2017 Summary Compensation Table. This compensation calculation includes base
77
salary and wages, bonuses and incentive payments, commissions, company 401(k) matching contributions, overtime and holiday or PTO pay, equity awards, and a gross-up tax reimbursement to cover taxes on term life insurance premiums. The compensation for our median employee was $41,390 and the compensation for the CEO was $1,609,589.
2017 Pay Ratio
Based on the above information, the ratio of the annual total compensation of our CEO to the median employee is 39:1. The pay ratio reported by other companies may not be comparable to the pay ratio reported above, due to variances in business mix, proportion of seasonal and part-time employees and distribution of employees across geographies. We seek to attract, incentivize and retain our employees through a combination of competitive base pay, bonus opportunities, 401(k) contributions, and other benefits.
ITEM 12. | SECURITY OWNERSHIP OF CERTAIN BENEFICIAL OWNERS AND MANAGEMENT AND RELATED STOCKHOLDER MATTERS |
Equity Compensation Plan Information
The following table sets forth information with respect to our common stock that may be issued upon the exercise of stock options, warrants, and rights under our incentive compensation plans as of December 31, 2017.
Plan Category | (a) Number of Securities to be Issued Upon Exercise of Outstanding Options, Warrants, and Rights(1) | (b) Weighted Average Exercise Price of Outstanding Options, Warrants, and Rights(2) | (c) Number of Securities Remaining Available for Future Issuance Under Equity Compensation Plans (Excluding Securities Reflected in Column (a))(3) | |||||||
Equity Compensation Plans Approved by Stockholders | 1,607,620 | $ | 10.34 | 558,498 | ||||||
Equity Compensation Plans Not Approved by Stockholders | — | — | — | |||||||
Total | 1,607,620 | $ | 10.34 | 558,498 | ||||||
(1) Includes 358,087 shares issuable upon the vesting and delivery of RSUs granted under the 2010 Plan and 1,214,000 shares issuable upon the exercise of outstanding stock options granted under our 2010 Plan, and 35,533 shares issuable upon the exercise of outstanding stock options granted under our previously maintained key employee equity plan, which we have discontinued.
(2) The weighted average exercise price does not take into account the 358,087 shares issuable upon the vesting and delivery of outstanding RSUs.
(3) Under the 2010 Plan, we have reserved 2,500,000 shares of common stock for issuance pursuant to awards granted under such plan.
2010 Incentive Compensation Plan
The purpose of the 2010 Plan is to assist our company and our subsidiaries and other designated affiliates, which we refer to as Related Entities, in attracting, motivating, retaining, and rewarding high-quality executives and other employees, officers, directors, consultants, and other persons who provide services to our company or our Related Entities by enabling such persons to acquire or increase a proprietary interest in our company in order to strengthen the mutuality of interests between such persons and our stockholders, and providing such persons with annual and long-term performance incentives to expend their maximum efforts in the creation of stockholder value. The 2010 Plan was intended to qualify certain compensation awarded under the 2010 Plan for tax deductibility under Section 162(m) of the Code to the extent deemed appropriate by the plan administrator, although as a result of the Tax Reform Act, this provision of the Code has been repealed; as a result, for years after 2017, compensation for certain of our executive officers will not be deductible to the extent it exceeds $1 million per officer.
Eligibility
Officers, directors, employees, and consultants of our company and our Related Entities, as determined by the plan administrator (described below), are eligible to participate in the 2010 Plan, which we refer to each as an Eligible Person.
78
Shares Available for Awards; Annual Per-Person Limitations
Subject to certain adjustments as described in the 2010 Plan, a total of 2,500,000 shares of our common stock were initially reserved for issuance as awards under the 2010 Plan. As of December 31, 2017, a total of 333,882 shares had been issued under the 2010 Plan, 1,607,620 shares were subject to outstanding awards under the 2010 Plan, and 558,498 shares were available for the future grant of awards under the 2010 Plan.
If any shares of our common stock subject to an award under the 2010 Plan are forfeited, repurchased by our company, expire, or otherwise terminate without issuance of such shares, or any award is settled for cash or otherwise does not result in the issuance of all or a portion of the shares subject to such award, the shares will, to the extent of such forfeiture, repurchase, expiration, termination, cash settlement, or non-issuance, again be available for awards under the 2010 Plan. In the event that any option or other award is exercised by the withholding of shares from the award by our company, or withholding tax liabilities arising from such option or other award are satisfied by the withholding of shares from the award by our company, then only the net number of shares actually issued to the participant, excluding the shares withheld, will be counted as issued for purposes of determining the maximum number of shares available for grant under the 2010 Plan.
Administration
Our board of directors has the authority to administer the 2010 Plan as the plan administrator. However, our board of directors has the authority to delegate its authority as plan administrator to one or more committees, including its compensation committee. Subject to the terms of the 2010 Plan, the plan administrator determines which of the Eligible Persons will be granted awards, when and how each award will be granted, what type or combination of types of awards will be granted, the provisions of each award granted (which need not be identical), including the time or times when a person will be permitted to receive shares or cash pursuant to an award, and the number of shares or amount of cash with respect to which an award will be granted to each such person. In addition, the plan administrator may construe, interpret, and make all determinations under the 2010 Plan and awards granted under it, and establish, amend, and revoke rules and regulations for the 2010 Plan’s administration. The plan administrator may, with the consent of any adversely affected participant, (i) reduce the exercise price of any outstanding award under the 2010 Plan, (ii) cancel any outstanding award and grant a new award and/or cash or other valuable consideration in substitution thereof, or (iii) perform any other action that is treated as a repricing under generally accepted accounting principles.
Stock Options and Stock Appreciation Rights
Each stock option and stock appreciation right award granted pursuant to the 2010 Plan must be set forth in an award agreement. The plan administrator determines the terms of the stock options and stock appreciation rights granted under the 2010 Plan, including the exercise price in the case of a stock option, the grant price in the case of a stock appreciation right, the vesting schedule, the maximum term of the stock option or stock appreciation right, and the period of time the stock option or stock appreciation right remains exercisable after the participant’s termination of service. The exercise price of a stock option, however, may not be less than the fair market value of the stock on its grant date. All stock options granted under the 2010 Plan are nonstatutory stock options. Stock appreciation rights may be either freestanding or in tandem with other awards.
Restricted Stock Awards
Restricted stock awards must be granted pursuant to an award agreement. The plan administrator determines the terms of the restricted stock award, including the restrictions on transferability, risk of forfeiture and other restrictions, if any, for the restricted stock, and the vesting schedule, if any, for the restricted stock award. Except to the extent restricted under the terms of the 2010 Plan and any award agreement relating to the restricted stock award, a participant granted restricted stock will have all of the rights of a stockholder, including the right to vote the restricted stock and the right to receive dividends thereon (subject to any mandatory reinvestment or other requirement imposed by the plan administrator).
Stock Units
Stock unit awards must be granted pursuant to an award agreement. The plan administrator determines the terms of the stock unit award, including any restrictions (which may include a risk of forfeiture) as the plan administrator may impose, if any, which restrictions may lapse at the expiration of the time period or at earlier specified times (including based on achievement of performance goals and/or future service requirements), separately or in combination, in installments or otherwise, as the plan administrator may determine. A stock unit award may be satisfied by delivery of shares of common stock, cash equal to the fair market value of the specified number of shares of common stock covered by the stock unit award, or a combination thereof, as determined by the plan administrator at the date of grant or thereafter. Prior to satisfaction of an award of stock units, an award of stock units carries no voting or dividend or other rights associated with share ownership.
79
Bonus Stock and Awards in Lieu of Obligations
The plan administrator is authorized to grant shares of our common stock as a bonus, or to grant shares of our common stock or other awards in lieu of our obligations to pay cash or deliver other property under the 2010 Plan or under other plans or compensatory arrangements, subject to such terms as determined by the plan administrator and subject to certain limitations under the 2010 Plan.
Dividend Equivalents
The plan administrator is authorized to grant dividend equivalents to receive cash, shares of our common stock, other awards, or other property equal in value to dividends paid with respect to a specified number of shares of our common stock, or other periodic payments. Dividend equivalents may be awarded on a free-standing basis or in connection with another award. The terms of an award of dividend equivalents will be set forth in a written award agreement which will contain provisions determined by the plan administrator and not inconsistent with the 2010 Plan. The plan administrator may provide that dividend equivalents will be paid or distributed when accrued or will be deemed to have been reinvested in additional shares of our common stock, awards, or other investment vehicles, and subject to such restrictions on transferability and risks of forfeiture, as the plan administrator may specify.
Other Stock-Based Awards
The plan administrator is authorized, subject to limitations under applicable law, to grant such other awards that may be denominated or payable in, valued in whole or in part by reference to, or otherwise based on, or related to, shares of our common stock, as deemed by the plan administrator to be consistent with the purposes of the 2010 Plan, including, without limitation, convertible or exchangeable debt securities, other rights convertible or exchangeable into shares of our common stock, purchase rights for shares of our common stock, awards with value and payment contingent upon our performance or any other factors designated by the plan administrator, and awards valued by reference to the book value of our common stock or the value of securities of or the performance of specified Related Entities or business units. The plan administrator will determine the terms and conditions of such awards, which will be set forth in a written award agreement. Cash awards, as an element of or supplement to any other award under the 2010 Plan, may also be granted under the 2010 Plan.
Performance Awards
Performance awards are payable in cash, shares of our common stock, other property, or other awards, on terms and conditions established by the plan administrator. The performance criteria to be achieved during any performance period and the length of the performance period will be determined by the plan administrator upon the grant of each performance award. Except as provided in the 2010 Plan or as may be provided in an award agreement, performance awards will be distributed only after the end of the relevant performance period.
Other Terms of Awards
Awards granted under the 2010 Plan may, in the discretion of the plan administrator, be granted either alone or in addition to, in tandem with, or in substitution or exchange for, any other award or any award granted under another plan of our company, any Related Entity, or any business entity to be acquired by our company or a Related Entity, or any other right of a participant to receive payment from our company or any Related Entity. In addition, awards may be granted in lieu of cash compensation, including in lieu of cash amounts payable under other plans of our company or any Related Entity.
Subject to the terms of the 2010 Plan and any applicable award agreement, payments to be made by our company or a Related Entity upon the exercise of an option or other award or settlement of an award may be made in such forms as the plan administrator determines, including, without limitation, cash, other awards, or other property, and may be made in a single payment or transfer, in installments, or on a deferred basis. Except as may be prohibited by Section 409A of the Code, the settlement of any award may be accelerated in the discretion of the plan administrator or upon occurrence of one or more specified events. Installment or deferred payments may be required by the plan administrator (subject to certain provisions of the 2010 Plan) or permitted at the election of the participant on terms and conditions established by the plan administrator.
Except as provided in an award agreement, a participant may not assign, sell, transfer, or otherwise encumber or subject to any lien any award or other right or interest granted under the 2010 Plan, in whole or in part, other than by will or by operation of the laws of descent and distribution, and such awards or rights that may be exercisable will be exercised during the lifetime of the participant only by the participant or his or her guardian or legal representative. Notwithstanding the foregoing, the plan administrator, in its sole discretion, may permit the transfer of an option as follows: (i) by gift to certain members of the participant’s immediate family (as set forth in the 2010 Plan) or (ii) by transfer by instrument to a trust providing that the option is to be passed to beneficiaries upon death of the participant.
80
Change in Control; Corporate Transaction
The plan administrator may, in its discretion, accelerate the vesting, exercisability, lapsing of restrictions, or expiration of deferral of any award, including upon a “change in control,” as defined in the 2010 Plan. In addition, the plan administrator may provide in an award agreement that the performance goals relating to any award will be deemed to have been met upon the occurrence of any change in control.
In the event of a “corporate transaction,” as defined in the 2010 Plan, any surviving corporation or acquiring corporation, which we refer to as a successor corporation, may either (i) assume any or all awards outstanding under the 2010 Plan; (ii) continue any or all awards outstanding under the 2010 Plan; or (iii) substitute similar stock awards for outstanding awards. In the event that any successor corporation does not assume or continue any or all such outstanding awards or substitute similar stock awards for such outstanding awards, then with respect to awards that have been not assumed, continued, or substituted, then such awards will terminate if not exercised (if applicable) at or prior to such effective time (contingent upon the effectiveness of the corporate transaction).
In the event that the successor corporation in a corporate transaction refuses to assume, continue, or substitute for an award, then the award will fully vest and be exercisable (if applicable) as to all of the shares of our common stock subject to such award, including shares of our common stock as to which such award would not otherwise be vested or, if applicable, exercisable.
The plan administrator, in its discretion and without the consent of any participant, may (but is not obligated to) either (i) accelerate the vesting of any awards (and, if applicable, the time at which such awards may be exercised) in full or as to some percentage of the award to a date prior to the effective time of such corporate transaction as the plan administrator will determine (contingent upon the effectiveness of the corporate transaction) or (ii) provide for a cash payment in exchange for the termination of an award or any portion thereof where such cash payment is equal to the fair market value of the shares of our common stock that the participant would receive if the award were fully vested and exercised (if applicable) as of such date (less any applicable exercise price).
Adjustments
In the event that any dividend or other distribution (whether in the form of cash, shares of our common stock, or other property), recapitalization, forward or reverse split, reorganization, merger, consolidation, spin-off, combination, repurchase, share exchange, liquidation, dissolution, or other similar corporate transaction or event affects our common stock and/or such other securities of our company or any other issuer, then the plan administrator will, to avoid anti-dilution or other enlargement or loss of value to awards, equitably adjust (i) the number and kind of shares of our common stock reserved for issuance in connection with awards granted thereafter, (ii) the number and kind of shares of common stock by which annual per-person award limitations are measured, (iii) the number and kind of shares of our common stock subject to or deliverable in respect of outstanding awards, (iv) the exercise price, grant price, or purchase price relating to any award and/or make provision for payment of cash or other property in respect of any outstanding award, and (v) any other aspect of any award that the plan administrator determines to be appropriate.
In addition, the plan administrator is authorized to make adjustments in the terms and conditions of, and the criteria included in, awards (including awards subject to performance goals) in recognition of unusual or nonrecurring events affecting our company, any Related Entity, or any business unit, or the financial statements of our company or any Related Entity, or in response to changes in applicable laws, regulations, accounting principles, tax rates and regulations or business conditions or in view of the plan administrator’s assessment of the business strategy of our company, any Related Entity, or business unit thereof, performance of comparable organizations, economic and business conditions, personal performance of a participant, and any other circumstances deemed relevant.
Amendment and Termination
Our board of directors may amend, alter, suspend, discontinue, or terminate the 2010 Plan, or any committee’s authority to grant awards under the 2010 Plan, without the consent of stockholders or participants. Any amendment or alteration to the 2010 Plan will be subject to the approval of our company’s stockholders if such stockholder approval is deemed necessary and advisable by our board of directors. However, without the consent of an affected participant, no such amendment, alteration, suspension, discontinuance, or termination of the 2010 Plan may materially and adversely affect the rights of such participant under any previously granted and outstanding award. The plan administrator may waive any conditions or rights under, or amend, alter, suspend, discontinue, or terminate any award theretofore granted and any award agreement relating thereto, except as otherwise provided in the 2010 Plan; provided that, without the consent of an affected participant, no such action may materially and adversely affect the rights of such participant under such award. The 2010 Plan will terminate no later than ten years from the date of the later of (i) the 2010 Plan’s effective date and (ii) the date an increase in the number of shares reserved for issuance under the 2010 Plan is approved by our board of directors (so long as such increase is also approved by our stockholders).
81
Security Ownership of Certain Beneficial Owners and Management
The following table sets forth information regarding the beneficial ownership of our common stock as of May 1, 2018 by the following:
• | each of our named executive officers and directors; |
• | all of our executive officers and directors as a group; and |
• | each person, or group of affiliated persons, who is known by us to beneficially own more than five percent of our common stock. |
Beneficial ownership is determined according to the rules of the SEC and generally means that a person has beneficial ownership of a security if he, she, or it possesses sole or shared voting or investment power of that security, including options and warrants that are currently exercisable or exercisable within 60 days of May 1, 2018 and RSUs that are currently vested or will be vested within 60 days of May 1, 2018. Shares issuable pursuant to options, warrants, and RSUs are deemed outstanding for computing the percentage of the person holding such options, warrants, or RSUs but are not deemed outstanding for computing the percentage of any other person. Except as indicated by the footnotes below, we believe, based on the information furnished to us, that the persons named in the table below have sole voting and investment power with respect to all shares of common stock shown that they beneficially own, subject to community property laws where applicable. The information does not necessarily indicate beneficial ownership for any other purpose. Our calculation of the percentage of beneficial ownership is based on 38,506,336 shares of common stock outstanding as of May 1, 2018.
Except as otherwise indicated, the address of each person listed in the table is c/o Roadrunner Transportation Systems, Inc., 1431 Opus Place, Suite 530, Downers Grove, Illinois 60515.
Shares Beneficially Owned | ||||||
Name of Beneficial Owner | Number | Percent | ||||
Named Executive Officers and Directors: | ||||||
Curtis W. Stoelting(1) | 215,221 | * | ||||
Michael L. Gettle (2) | 87,517 | * | ||||
Terence R. Rogers(3) | 41,250 | * | ||||
Scott B. Cousins(4) | 17,155 | * | ||||
Mark A. DiBlasi (5) | 226,348 | * | ||||
Peter R. Armbruster | 75,059 | * | ||||
Scott L. Dobak | 1,398 | * | ||||
Christopher L. Doerr | 20,820 | * | ||||
John G. Kennedy, III | 15,335 | * | ||||
Ralph (“Cody”) W. Kittle III | — | * | ||||
Brian C. Murray | 10,439 | * | ||||
James D. Staley | 16,520 | * | ||||
William S. Urkiel (6) | 24,020 | * | ||||
Michael P. Ward | 5,439 | * | ||||
All executive officers and directors as a group (17 persons) (7) | 483,056 | 1.2 | % | |||
5% Stockholders: | ||||||
Elliott Reporting Entities(8) | 3,690,055 | 9.5 | % | |||
HCI Reporting Entities(9) | 7,801,625 | 20.3 | % | |||
Barclays Reporting Entities(10) | 4,361,348 | 11.3 | % | |||
BlackRock, Inc.(11) | 3,903,766 | 10.1 | % | |||
Dimensional Fund Advisors LP(12) | 2,107,891 | 5.5 | % | |||
FMR Reporting Entities (13) | 4,996,917 | 13.0 | % | |||
The Vanguard Group (14) | 1,858,600 | 4.8 | % | |||
* Represents beneficial ownership of less than 1% of our outstanding common stock.
82
(1) | Includes 161,750 shares of common stock issuable pursuant to stock options exercisable within 60 days of May 1, 2018. |
(2) | Includes 81,750 shares of common stock issuable pursuant to stock options exercisable within 60 days of May 1, 2018. |
(3) | Includes 41,250 shares of common stock issuable pursuant to stock options exercisable within 60 days of May 1, 2018. |
(4) | Includes 16,250 shares of common stock issuable pursuant to stock options exercisable within 60 days of May 1, 2018. |
(5) | Includes 166,666 shares of common stock issuable pursuant to stock options exercisable within 60 days of May 1, 2018. |
(6) | Includes 8,000 shares held by Mr. Urkiel’s trust. |
(7) | Includes (i) 301,000 shares of common stock issuable pursuant to stock options exercisable within 60 days of May 1, 2018 and (ii) 749 shares of common stock issuable upon the delivery of shares underlying RSUs that will be vested within 60 days of May 1, 2018. |
(8) | Represents shares of our common stock held by Elliott Associates, L.P., or “Elliott,” Elliott International, L.P., or “Elliott International,” and Elliott International Capital Advisors Inc., or “EICA,” and collectively with Elliott and Elliott International, the “Elliott Reporting Entities.” Elliott has sole voting power and sole dispositive power with regard to 1,059,356 shares, and Elliott International and EICA each have shared voting power and shared dispositive power with regard to 2,251,127 shares. Such information is as reported on Schedule 13D filed by the Elliott Reporting Entities with the SEC on April 3, 2017 (as amended on May 4, 2017). Also includes 379,572 shares of common stock issuable upon the exercise of outstanding warrants held by Elliott and Brockdale Investments LP. The Elliott Reporting Entities also own shares of our preferred stock. See the Schedule 13D/A filed by the Elliott Reporting Entities on May 4, 2017. The address for each of the Elliott Reporting Entities is 40 West 57th Street, New York, New York 10019. |
(9) | Represents shares held by Thayer Equity Investors V, L.P.; TC Roadrunner-Dawes Holdings, L.L.C.; TC Sargent Holdings, L.L.C.; HCI Equity Partners III, L.P.; and HCI Co-Investors III, L.P., all of which are affiliates and referred to collectively as the “HCI Entities.” Scott D. Rued, a former director of our company, is a Managing Partner of HCI Equity Partners, L.L.C., which is an affiliate of the HCI Entities. Accordingly, Mr. Rued may be deemed to beneficially own the shares held by the HCI Entities. Mr. Rued disclaims beneficial ownership of any such shares in which he does not have a pecuniary interest. The address of each of the HCI Entities is c/o HCI Equity Partners, 1730 Pennsylvania Avenue, N.W., Suite 525, Washington, D.C. 20006. |
(10) | Represents shares of our common stock held by Barclays PLC, or “Barclays,” Barclays Bank PLC, or “Barclays Bank,” Barclays Capital Inc., or “Barclays Capital,” and Barclays Capital Securities Limited, or “Barclays Capital Securities,” and collectively with Barclays, Barclays Bank, and Barclays Capital, the “Barclays Reporting Entities.” Barclays has sole voting power and sole dispositive power with regard to 2,180,674 shares, Barclays Bank has sole voting power and sole dispositive power with regard to 118,138 shares, Barclays Capital has sole voting power and sole dispositive power with regard to 36 shares, and Barclays Capital Securities has sole voting power and sole dispositive power with regard to 2,062,500 shares. Such information is as reported on Schedule 13G filed by the Barclays Reporting Persons with the SEC on February 14, 2018. The address for Barclays and Barclays Banks is 1 Churchill Place, London, E14 5HP, England, the address for Barclays Capital is 745 Seventh Avenue, New York, New York 10019, and the address for Barclays Capital Securities is 5 The North Colonnade, Canary Wharf, London, E14 4BB, England. |
(11) | Represents shares of our common stock held by BlackRock, Inc. and certain of its affiliates, referred to as BlackRock. BlackRock has sole voting power over 3,835,287 shares and sole dispositive power over 3,903,766 shares. Such information is as reported on Schedule 13G/A filed by BlackRock with the SEC on January 19, 2018. The address for BlackRock is 55 East 52nd Street, New York, New York 10055. |
(12) | Represents shares of our common stock held by Dimensional Fund Advisors LP, referred to as Dimensional. Dimensional has sole voting power over 1,987,910 shares and sole dispositive power over 2,107,891 shares. Such information is as reported on Schedule 13G/A filed by Dimensional with the SEC on February 9, 2018. The address for Dimensional is Building One, 6300 Bee Cave Road, Austin, Texas, 78746. |
(13) | Represents shares of our common stock held by FMR LLC and certain of its affiliates, referred to as “FMR.” FMR has sole voting power over 730,530 shares and sole dispositive power over 4,996,917 shares. Such information is as reported on Schedule 13G/A filed by FMR with the SEC on February 13, 2018. The address for FMR is 245 Summer Street, Boston, Massachusetts 02210. |
(14) | Represents shares of our common stock held by The Vanguard Group and certain of its affiliates, referred to as “Vanguard.” Vanguard has sole voting power over 32,675 shares, shared voting power over 579 shares, sole dispositive power over 1,826,446 shares, and shared dispositive power over 32,154 shares. Such information is as reported on Schedule 13G/A filed by Vanguard with the SEC on February 9, 2018. The address for Vanguard is 100 Vanguard Blvd., Malvern, Pennsylvania 19355. |
ITEM 13. | CERTAIN RELATIONSHIPS AND RELATED TRANSACTIONS, AND DIRECTOR INDEPENDENCE |
Certain Relationships and Related Party Transactions
Other than as set forth below, there were no transactions or series of similar transactions since January 1, 2017 to which we were or are a party that involved an amount exceeding $120,000 and in which any of our directors, executive officers, holders of more than 5% of any class of our voting securities, or any member of the immediate family of any of the foregoing persons, had or will have a direct or indirect material interest.
Management and Consulting Agreement
Upon consummation of our May 2010 initial public offering, we entered into an advisory agreement with HCI Equity Management, L.P. (formerly Thayer | Hidden Creek Management, L.P.), which advisory agreement was amended and restated on September 12, 2011, pursuant to which HCI Equity Management provided advisory services to us. These services included identification, support, negotiation, and analysis of acquisitions and dispositions and support, negotiation, and analysis of financing alternatives. In exchange for such services, HCI Equity Management was reimbursed for its expenses and could be paid a transaction fee in connection with the consummation of each acquisition or divestiture by us or our subsidiaries, excluding certain specified transactions, and in connection with any public or private debt offering by us or our subsidiaries negotiated by HCI Equity Management. The amount of any such fee was determined through good faith negotiations between our board of directors and HCI Equity Management. On May 2, 2017, we and HCI Equity Management entered into a termination agreement, pursuant to which we and HCI Equity Management agreed to terminate the advisory agreement.
83
Preferred Stock Investment Agreement
On May 1, 2017, we entered into the Investment Agreement with Elliott, pursuant to which we issued and sold to Elliott, for an aggregate purchase price of $540,500,100, (a) 155,000 shares of a Series B Preferred Stock at a purchase price of $1,000 per share; (b) 55,000 shares of Series C Preferred Stock at a purchase price of $1,000 per share; (c) 100 shares of Series D Preferred Stock at a purchase price of $1.00 per share; (d) 90,000 shares of Series E Preferred Stock at a purchase price of $1,000 per share; and (e) 240,500 shares of Series F Preferred Stock at a purchase price of $1,000 per share. We consummated the transactions described above on May 2, 2017. The proceeds of the sale of the Preferred Stock were used to pay off and terminate our senior credit facility and to provide working capital to support our operations and future growth.
We made certain customary representations and warranties in the Investment Agreement and agreed to certain covenants, including agreeing to use reasonable best efforts to enter into, within 90 days following the closing date, an asset based lending facility (the “New ABL Facility”) (the earlier of (i) the date of such entry and (ii) the expiration of such 90-day period, the “Refinancing Date”). We agreed to use the proceeds from the New ABL Facility, if any, to redeem the outstanding shares of Series F Preferred Stock and, if and to the extent sufficient proceeds were available, shares of Series E Preferred Stock. From the closing date until the Refinancing Date, we agreed to pay Elliott a daily payment in an amount equal to $33,333.33 per calendar day (which amount accrued daily and was payable monthly in arrears). On July 21, 2017, we entered into the ABL Facility (which was deemed to be the “New ABL Facility” under the Investment Agreement) and used the initial proceeds from the ABL Facility for working capital purposes and to redeem all of the outstanding shares of the Series F Preferred Stock issued to Elliott.
On September 15, 2017, we closed the sale of Unitrans, Inc. for cash consideration of $95,000,000. We used a portion of the proceeds from the sale to redeem 52,500 shares of Series E Preferred Stock issued to Elliott.
Series E-1 Preferred Stock Investment Agreement
On March 1, 2018, we entered into the Series E-1 Investment Agreement with Elliott, pursuant to which we agreed to issue and sell to Elliott, and Elliott agreed to purchase from us, on the terms and subject to the conditions set forth in the Series E-1 Investment Agreement, from time to time until July 30, 2018, an aggregate of up to 54,750 shares of Series E-1 Preferred Stock, at a purchase price of $1,000 per share for the first 17,500 shares of Series E-1 Preferred Stock, $960 per share for the next 18,228 shares of Series E-1 Preferred Stock, and $920 per share for the final 19,022 shares of Series E-1 Preferred Stock. On March 1, 2018, the parties held an initial closing pursuant to which we issued and sold to Elliott 17,500 shares of Series E-1 Preferred Stock for an aggregate purchase price of $17.5 million. On April 24, 2018, the parties held a closing pursuant to the Series E-1 Investment Agreement, pursuant to which we issued and sold to Elliott 18,228 shares of Series E-1 Preferred Stock for an aggregate purchase price of approximately $17.5 million.
Warrant Agreement
In connection with the issuance of the Preferred Stock pursuant to the Investment Agreement, we and Elliott entered into a Warrant Agreement, pursuant to which we issued to Elliott eight-year warrants to purchase an aggregate of 379,572 shares of our common stock at an exercise price of $0.01 per share.
Stockholders’ Agreement
In connection with the issuance of the Preferred Stock pursuant to the Investment Agreement, we and Elliott entered into the Stockholders’ Agreement, pursuant to which Elliott was granted certain preemptive rights and other rights. Subject to customary exceptions, each Eligible Elliott Party (as defined in the Stockholders’ Agreement) shall have the right to purchase their pro rata percentage of subsequent issuances of equity securities offered by us in any non-public offering. In connection with the issuance of Series E-1 Preferred Stock pursuant to the Series E-1 Investment Agreement, we and Elliott entered into an Amendment No. 1 to Stockholders’ Agreement, pursuant to which the parties amended certain terms of the Stockholders’ Agreement.
Registration Rights Agreement
In connection with the issuance of the Preferred Stock pursuant to the Investment Agreement, we, Elliott, and investment funds affiliated with HCI entered into the Registration Rights Agreement, pursuant to which we granted certain demand and piggyback registration rights.
Related Party Transaction Policies and Procedures
It is the responsibility of our board of directors, with the assistance of our audit committee, to review and approve related party transactions. It is our management’s responsibility to bring such related party transactions to the attention of our board of directors. From time to time our nominating/corporate governance committee, in accordance with its charter, will also review potential conflict of interest transactions involving members of our board of directors and our executive officers.
84
Independence of Directors
Our common stock is listed on the NYSE. Under the rules of the NYSE, independent directors must comprise a majority of a listed company’s board of directors.
Our board of directors has undertaken a review of its composition, the composition of its committees, and the independence of each director. Based upon all of the relevant facts and circumstances, including information requested from and provided by each director concerning his or her background, employment, and affiliations, including family relationships, our board of directors has affirmatively determined that each of Messrs. Dobak, Doerr, Kennedy, Murray, Staley, Urkiel, and Ward is “independent” as that term is defined under the applicable rules and regulations of the SEC and the listing requirements and rules of the NYSE. Accordingly, a majority of our directors are independent, as required under applicable NYSE rules. Our board of directors found that none of these directors had a material or other disqualifying relationship with our company. In making this determination, our board of directors considered the current and prior relationships that each non-employee director has with our company and all other facts and circumstances our board of directors deemed relevant in determining their independence, including each non-employee director’s beneficial ownership of our capital stock. Messrs. Stoelting and Gettle are not considered independent directors as a result of their positions as executive officers of our company. Mr. Kittle is not considered “independent” as a result of his relationship with Elliott, which holds approximately 8.6% of our outstanding common stock and all of our Preferred Stock, and to whom we paid $2.7 million in 2017 pursuant to the Investment Agreement.
ITEM 14. | PRINCIPAL ACCOUNTANT FEES AND SERVICES |
Independent Registered Public Accounting Firm Fees
The following is a summary of fees for audit and other professional services performed by Deloitte & Touche LLP (referred to as “D&T”) during the fiscal years ended December 31, 2017 and 2016:
2017(1) | 2016 | ||||||
Audit fees | $ | 5,479,442 | $ | 1,800,000 | |||
Audit-related fees | 225,000 | 23,700 | |||||
Tax fees | 1,109,364 | 548,126 | |||||
Total | $ | 6,813,806 | $ | 2,371,826 | |||
(1) 2017 fees reported include additional audit fees, audit-related services and tax fees related to the restatement of prior periods that concluded in January 2018.
Audit Fees
This category includes fees for the audit of our annual consolidated financial statements, for reviews of our quarterly financial statements, and for services that are normally provided by the independent registered public accounting firm in connection with statutory and regulatory filings or engagements. For 2017, audit fees consisted of additional fees associated with the restatement of prior periods that did not conclude until January 2018.
Audit-Related Fees
This category consists of fees for assurance and related services provided by the independent registered public accounting firm that are reasonably related to the performance of the audit or review of our consolidated financial statements and are not included under “Audit Fees” above. For 2017, audit related fees consisted primarily of advisory services in connection with Unitrans standalone audit procedures. For 2016, audit related fees consisted of advisory services in connection with an SEC comment letter received.
Tax Fees
This category consists of tax services provided by the independent registered public accounting firm with respect to tax compliance, tax advice, and tax planning. For 2017, tax fees consisted of costs associated with additional consulting projects and the filing of amended returns due to the restatement of prior periods.
All Other Fees
This category consists of fees paid for products and services that would not otherwise be included in any of the categories listed above. There were no such fees during the fiscal years ended December 31, 2017 and 2016.
Pre-Approval Policies and Procedures for Independent Registered Public Accounting Firm Fees
85
As set forth in its charter, the audit committee is responsible for pre-approving all audit, audit related, tax, and other services to be performed by the independent registered public accounting firm. Any pre-approved services that involve fees or costs exceeding pre-approved levels will also require specific pre-approval by the audit committee. Unless otherwise specified by the audit committee in pre-approving a service, the pre-approval will be effective for the 12-month period following pre-approval. The audit committee will not approve any non-audit services prohibited by applicable SEC regulations or any services in connection with a transaction initially recommended by the independent registered public accounting firm. The audit committee may delegate to the audit committee chair or any one or more members of the audit committee the authority to grant pre-approvals of permissible audit and non-audit services, provided that such pre-approvals by a member who has exercised such delegation must be reported to the full audit committee at the next scheduled meeting. All of the audit services provided by D&T described in the table above for 2017 were approved by our audit committee pursuant to our audit committee’s pre-approval policies.
86
PART IV
ITEM 15. | EXHIBITS AND FINANCIAL STATEMENT SCHEDULES |
(a) Financial Statements and Financial Statement Schedules
(1) Financial Statements are listed in the Index to Consolidated Financial Statements on page F-1 of this Form 10-K.
(2) Other schedules are omitted because they are not applicable, not required, or because required information is included in the consolidated financial statements or notes thereto.
(b) Exhibits
Exhibit Number | Exhibit | ||
2.1 | |||
2.2 | |||
3.1 | |||
3.2 | |||
3.3 | |||
3.4 | |||
3.5 | |||
3.6 | |||
3.7 | |||
4.1 | |||
4.2 | |||
4.3 | |||
4.4 | |||
10.1 | |||
10.14* | |||
10.15* | |||
10.20* | |||
10.26* | |||
10.28 | |||
87
10.28(A) | |||
10.28(B) | |||
10.30* | |||
10.31 | |||
10.32 | |||
10.33 | |||
10.33(A) | |||
10.36* | |||
10.37* | |||
10.38* | |||
10.39* | |||
10.40* | |||
10.41* | |||
10.42* | |||
21.1 | |||
24.1 | Power of Attorney (included on the signature page of this Form 10-K) | ||
31.1 | |||
31.2 | |||
32.1 | |||
32.2 | |||
101.INS | XBRL Instance Document | ||
101.SCH | XBRL Taxonomy Extension Schema Document | ||
101.CAL | XBRL Taxonomy Extension Calculation Linkbase Document | ||
101.DEF | XBRL Taxonomy Extension Definition Linkbase Document | ||
101.LAB | XBRL Taxonomy Extension Label Linkbase Document | ||
101.PRE | XBRL Taxonomy Extension Presentation Linkbase Document | ||
(1) | Incorporated by reference to the registrant's Current Report on Form 8-K filed with the SEC on August 11, 2014. |
(2) | Incorporated by reference to the registrant's Current Report on Form 8-K filed with the SEC on August 21, 2017. |
(3) | Incorporated by reference to the registrant’s Registration Statement on Form S-1 (Registration No. 333-152504) as filed with the SEC on May 7, 2010. |
(4) | Incorporated by reference to the registrant's Current Report on Form 8-K filed with the SEC on May 4, 2017. |
(5) | Incorporated by reference to the registrant’s Registration Statement on Form S-1 (Registration No. 333-152504) as filed with the SEC on September 11, 2008. |
88
(6) | Incorporated by reference to the registrant’s Current Report on Form 8-K as filed with the SEC on March 7, 2011. |
(7) | Incorporated by reference to the registrant's Current Report on Form 8-K as filed with the SEC on February 24, 2015. |
(8) | Incorporated by reference to the registrant's Current Report on Form 8-K as filed with the SEC on September 28, 2015. |
(9) Incorporated by reference to the registrant's Current Report on Form 8-K as filed with the SEC on June 23, 2016.
(10) Incorporated by reference to the registrant's Current Report on Form 8-K as filed with the SEC on November 17, 2016.
(11) Incorporated by reference to the registrant's Quarterly Report on Form 10-Q as filed with the SEC on May 10, 2016.
(12) Incorporated by reference to the registrant’s Form 8-K which was filed with the SEC on March 6, 2017.
(13) Incorporated by reference to the registrant’s Form 8-K which was filed with the SEC on April 3, 2017.
(14) Incorporated by reference to the registrant's Current Report on Form 8-K filed with the SEC on July 27, 2017.
(15) Incorporated by reference to the registrant's Current Report on Form 8-K filed with the SEC on December 18, 2017.
(16) Incorporated by reference to the registrant's Quarterly Report on Form 10-Q for the quarterly period ended June 30, 2017 as filed with the SEC on March 30, 2018.
* | Indicates management contract or compensation plan or agreement. |
ITEM 16. | FORM 10-K SUMMARY |
None.
89
SIGNATURES
Pursuant to the requirements of Section 13 or 15(d) of the Securities Exchange Act of 1934, the registrant has duly caused this report to be signed on its behalf by the undersigned, thereunto duly authorized.
ROADRUNNER TRANSPORTATION SYSTEMS, INC. | |||
Date: June 19, 2018 | By: | /s/ Terence R. Rogers | |
Terence R. Rogers | |||
Executive Vice President and Chief Financial Officer | |||
90
POWER OF ATTORNEY
KNOW ALL PERSONS BY THESE PRESENTS, that each person whose signature appears below hereby constitutes and appoints Curtis W. Stoelting and Terence R. Rogers, and each of them, as his or her true and lawful attorney-in-fact and agent, with full power of substitution and resubstitution, for him or her and in his or her name, place, and stead, in any and all capacities, to sign any and all amendments to this Form 10-K, and to file the same, with all exhibits thereto, and other documents in connection therewith, with the Securities and Exchange Commission, granting unto said attorney-in-fact and agent, full power and authority to do and perform each and every act and thing required and necessary to be done in connection therewith, as fully to all intents and purposes as he or she might or could do in person, hereby ratifying and confirming all that said attorney-in-fact and agent, or his substitute or substitutes, may lawfully do or cause to be done by virtue hereof.
Pursuant to the requirements of the Securities Exchange Act of 1934, this report has been signed below by the following persons on behalf of the registrant and in the capacities and on the dates indicated.
Signature | Title | Date | ||
/s/ Curtis W. Stoelting | Chief Executive Officer and Director | June 19, 2018 | ||
Curtis W. Stoelting | (Principal Executive Officer) | |||
/s/ Terence R. Rogers | Executive Vice President and Chief Financial Officer | June 19, 2018 | ||
Terence R. Rogers | (Principal Financial Officer and Principal Accounting Officer) | |||
/s/ Michael L. Gettle | President, Chief Operating Officer, and Director | June 19, 2018 | ||
Michael L. Gettle | ||||
/s/ James D. Staley | Chairman of the Board | June 19, 2018 | ||
James D. Staley | ||||
/s/ Scott L. Dobak | Director | June 19, 2018 | ||
Scott L. Dobak | ||||
/s/ Christopher L. Doerr | Director | June 19, 2018 | ||
Christopher L. Doerr | ||||
/s/ John G. Kennedy, III | Director | June 19, 2018 | ||
John G. Kennedy, III | ||||
/s/ Ralph W. Kittle III | Director | June 19, 2018 | ||
Ralph W. Kittle III | ||||
/s/ Brian C. Murray | Director | June 19, 2018 | ||
Brian C. Murray | ||||
/s/ William S. Urkiel | Director | June 19, 2018 | ||
William S. Urkiel | ||||
/s/ Michael P. Ward | Director | June 19, 2018 | ||
Michael P. Ward | ||||
91
INDEX TO FINANCIAL STATEMENTS
ROADRUNNER TRANSPORTATION SYSTEMS, INC.
AND SUBSIDIARIES
F-1
REPORT OF INDEPENDENT REGISTERED PUBLIC ACCOUNTING FIRM
To the stockholders and the Board of Directors of Roadrunner Transportation Systems, Inc.
Opinion on the Financial Statements
We have audited the accompanying consolidated balance sheets of Roadrunner Transportation Systems, Inc. and subsidiaries (the "Company") as of December 31, 2017 and 2016, the related consolidated statements of operations, stockholders’ investment, and cash flows, for each of the three years in the period ended December 31, 2017, and the related notes (collectively referred to as the "financial statements"). In our opinion, the financial statements present fairly, in all material respects, the financial position of the Company as of December 31, 2017 and 2016, and the results of its operations and its cash flows for each of the three years in the period ended December 31, 2017, in conformity with accounting principles generally accepted in the United States of America.
We have also audited, in accordance with the standards of the Public Company Accounting Oversight Board (United States) (PCAOB), the Company's internal control over financial reporting as of December 31, 2017, based on criteria established in Internal Control - Integrated Framework (2013) issued by the Committee of Sponsoring Organizations of the Treadway Commission and our report dated June 19, 2018, expressed an adverse opinion on the Company's internal control over financial reporting because of material weaknesses.
Basis for Opinion
These financial statements are the responsibility of the Company's management. Our responsibility is to express an opinion on the Company's financial statements based on our audits. We are a public accounting firm registered with the PCAOB and are required to be independent with respect to the Company in accordance with the U.S. federal securities laws and the applicable rules and regulations of the Securities and Exchange Commission and the PCAOB.
We conducted our audits in accordance with the standards of the PCAOB. Those standards require that we plan and perform the audit to obtain reasonable assurance about whether the financial statements are free of material misstatement, whether due to error or fraud. Our audits included performing procedures to assess the risks of material misstatement of the financial statements, whether due to error or fraud, and performing procedures that respond to those risks. Such procedures included examining, on a test basis, evidence regarding the amounts and disclosures in the financial statements. Our audits also included evaluating the accounting principles used and significant estimates made by management, as well as evaluating the overall presentation of the financial statements. We believe that our audits provide a reasonable basis for our opinion.
/s/ Deloitte & Touche LLP
Chicago, Illinois
June 19, 2018
We have served as the Company's auditor since 2006.
F-2
ROADRUNNER TRANSPORTATION SYSTEMS, INC.
CONSOLIDATED BALANCE SHEETS
December 31, | |||||||
(In thousands, except par value) | 2017 | 2016 | |||||
ASSETS | |||||||
Current assets: | |||||||
Cash and cash equivalents | $ | 25,702 | $ | 29,513 | |||
Accounts receivable, net of allowances of $10,891 and $18,573, respectively | 321,629 | 272,924 | |||||
Income tax receivable | 14,749 | 40,766 | |||||
Prepaid expenses and other current assets | 36,306 | 31,284 | |||||
Total current assets | 398,386 | 374,487 | |||||
Property and equipment, net of accumulated depreciation of $107,037 and $88,453, respectively | 159,547 | 171,857 | |||||
Other assets: | |||||||
Goodwill | 264,826 | 312,541 | |||||
Intangible assets, net | 49,648 | 65,549 | |||||
Other noncurrent assets | 3,636 | 9,120 | |||||
Total other assets | 318,110 | 387,210 | |||||
Total assets | $ | 876,043 | $ | 933,554 | |||
LIABILITIES AND STOCKHOLDERS’ INVESTMENT | |||||||
Current liabilities: | |||||||
Current maturities of debt | $ | 9,950 | $ | 445,589 | |||
Accounts payable | 171,905 | 149,067 | |||||
Accrued expenses and other current liabilities | 105,409 | 89,381 | |||||
Total current liabilities | 287,264 | 684,037 | |||||
Deferred tax liabilities | 14,282 | 44,174 | |||||
Other long-term liabilities | 10,873 | 7,875 | |||||
Long-term debt, net of current maturities | 189,460 | — | |||||
Preferred stock | 263,317 | — | |||||
Total liabilities | 765,196 | 736,086 | |||||
Commitments and contingencies (Note 13) | |||||||
Stockholders' investment: | |||||||
Common stock $.01 par value; 105,000 shares authorized; 38,423 and 38,341 shares issued and outstanding, respectively | 384 | 383 | |||||
Additional paid-in capital | 403,166 | 398,602 | |||||
Retained deficit | (292,703 | ) | (201,517 | ) | |||
Total stockholders’ investment | 110,847 | 197,468 | |||||
Total liabilities and stockholders' investment | $ | 876,043 | $ | 933,554 | |||
See accompanying notes to consolidated financial statements.
F-3
ROADRUNNER TRANSPORTATION SYSTEMS, INC.
CONSOLIDATED STATEMENTS OF OPERATIONS
Year Ended December 31, | |||||||||||
(In thousands, except per share amounts) | 2017 | 2016 | 2015 | ||||||||
Revenues | $ | 2,091,291 | $ | 2,033,200 | $ | 1,992,166 | |||||
Operating expenses: | |||||||||||
Purchased transportation costs | 1,430,378 | 1,364,055 | 1,310,396 | ||||||||
Personnel and related benefits | 296,925 | 286,134 | 263,254 | ||||||||
Other operating expenses | 393,731 | 374,979 | 323,955 | ||||||||
Depreciation and amortization | 37,747 | 38,145 | 31,626 | ||||||||
Gain from sale of Unitrans | (35,440 | ) | — | — | |||||||
Impairment charges | 4,402 | 373,661 | — | ||||||||
Acquisition transaction expenses | — | — | 564 | ||||||||
Total operating expenses | 2,127,743 | 2,436,974 | 1,929,795 | ||||||||
Operating (loss) income | (36,452 | ) | (403,774 | ) | 62,371 | ||||||
Interest expense | |||||||||||
Interest expense - preferred stock | 49,704 | — | — | ||||||||
Interest expense - debt | 14,345 | 22,827 | 19,439 | ||||||||
Total interest expense | 64,049 | 22,827 | 19,439 | ||||||||
Loss from debt extinguishment | 15,876 | — | — | ||||||||
(Loss) income before income taxes | (116,377 | ) | (426,601 | ) | 42,932 | ||||||
(Benefit from) provision for income taxes | (25,191 | ) | (66,281 | ) | 17,312 | ||||||
Net (loss) income | $ | (91,186 | ) | $ | (360,320 | ) | $ | 25,620 | |||
(Loss) earnings per share: | |||||||||||
Basic | $ | (2.37 | ) | $ | (9.40 | ) | $ | 0.67 | |||
Diluted | $ | (2.37 | ) | $ | (9.40 | ) | $ | 0.65 | |||
Weighted average common stock outstanding: | |||||||||||
Basic | 38,405 | 38,318 | 38,179 | ||||||||
Diluted | 38,405 | 38,318 | 39,180 | ||||||||
See accompanying notes to consolidated financial statements.
F-4
ROADRUNNER TRANSPORTATION SYSTEMS, INC.
CONSOLIDATED STATEMENTS OF STOCKHOLDERS’ INVESTMENT
Common Stock | ||||||||||||||||||
(In thousands, except shares) | Shares | Amount | Additional Paid-In Capital | Retained Earnings (Deficit) | Total Stockholders' Investment | |||||||||||||
BALANCE, January 1, 2015 | 37,925,164 | $ | 379 | $ | 390,725 | $ | 133,183 | $ | 524,287 | |||||||||
Issuance of common stock, net of issuance costs | 265,734 | 3 | 4,008 | — | 4,011 | |||||||||||||
Issuance of restricted stock units, net of taxes paid | 74,971 | 1 | (930 | ) | — | (929 | ) | |||||||||||
Issuance costs from secondary stock offering | — | — | (225 | ) | — | (225 | ) | |||||||||||
Share-based compensation | — | — | 2,500 | — | 2,500 | |||||||||||||
Excess tax benefit on share-based compensation | — | — | 1,175 | — | 1,175 | |||||||||||||
Net income | — | — | 25,620 | 25,620 | ||||||||||||||
BALANCE, December 31, 2015 | 38,265,869 | $ | 383 | $ | 397,253 | $ | 158,803 | $ | 556,439 | |||||||||
Issuance of restricted stock units, net of taxes paid | 74,738 | — | (303 | ) | — | (303 | ) | |||||||||||
Issuance costs from secondary stock offering | — | — | (33 | ) | — | (33 | ) | |||||||||||
Share-based compensation | — | — | 2,232 | — | 2,232 | |||||||||||||
Excess tax benefit on share-based compensation | — | — | (547 | ) | — | (547 | ) | |||||||||||
Net loss | — | — | — | (360,320 | ) | (360,320 | ) | |||||||||||
BALANCE, December 31, 2016 | 38,340,607 | $ | 383 | $ | 398,602 | $ | (201,517 | ) | $ | 197,468 | ||||||||
Issuance of restricted stock units, net of taxes paid | 82,499 | 1 | (240 | ) | — | (239 | ) | |||||||||||
Share-based compensation | — | — | 2,233 | — | 2,233 | |||||||||||||
Issuance of warrants | — | — | 2,571 | — | 2,571 | |||||||||||||
Net loss | — | — | — | (91,186 | ) | (91,186 | ) | |||||||||||
BALANCE, December 31, 2017 | 38,423,106 | $ | 384 | $ | 403,166 | $ | (292,703 | ) | $ | 110,847 | ||||||||
See accompanying notes to consolidated financial statements.
F-5
ROADRUNNER TRANSPORTATION SYSTEMS, INC.
CONSOLIDATED STATEMENTS OF CASH FLOWS
(In thousands) | Year Ended December 31, | ||||||||||
2017 | 2016 | 2015 | |||||||||
Cash flows from operating activities: | |||||||||||
Net (loss) income | $ | (91,186 | ) | $ | (360,320 | ) | $ | 25,620 | |||
Adjustments to reconcile net (loss) income to net cash (used in) provided by operating activities: | |||||||||||
Depreciation and amortization | 38,880 | 40,720 | 33,911 | ||||||||
Loss on disposal of property and equipment | 1,637 | 4,144 | 1,300 | ||||||||
Gain on sale of business | (35,440 | ) | (5,416 | ) | — | ||||||
Share-based compensation | 2,233 | 2,232 | 2,500 | ||||||||
Change in fair value of preferred stock | 18,387 | — | — | ||||||||
Amortization of preferred stock issuance costs | 16,112 | — | — | ||||||||
Loss from debt extinguishment | 15,876 | — | — | ||||||||
Adjustments to contingent purchase obligations | — | (2,458 | ) | (2,931 | ) | ||||||
Provision for bad debts | 5,964 | 5,127 | 4,816 | ||||||||
Deferred tax (benefit) provision | (27,066 | ) | (43,441 | ) | 2,754 | ||||||
Impairment charges | 4,402 | 373,661 | — | ||||||||
Changes in (net of acquisitions): | |||||||||||
Accounts receivable | (70,171 | ) | (18,020 | ) | 19,041 | ||||||
Income taxes receivable | 26,017 | (20,103 | ) | (7,020 | ) | ||||||
Prepaid expenses and other assets | (753 | ) | 8,152 | (6,028 | ) | ||||||
Accounts payable | 28,960 | 32,901 | (11,929 | ) | |||||||
Accrued expenses and other liabilities | 20,596 | 11,675 | 7,355 | ||||||||
Net cash (used in) provided by operating activities | (45,552 | ) | 28,854 | 69,389 | |||||||
Cash flows from investing activities: | |||||||||||
Acquisition of business, net of cash acquired | — | — | (32,765 | ) | |||||||
Capital expenditures | (14,517 | ) | (17,573 | ) | (49,984 | ) | |||||
Proceeds from sale of property and equipment | 3,636 | 6,980 | 6,078 | ||||||||
Proceeds from sale of business | 88,512 | 1,000 | — | ||||||||
Net cash provided by (used in) investing activities | 77,631 | (9,593 | ) | (76,671 | ) | ||||||
Cash flows from financing activities: | |||||||||||
Borrowings under revolving credit facilities | 264,405 | 292,124 | 183,852 | ||||||||
Payments under revolving credit facilities | (290,068 | ) | (262,573 | ) | (275,703 | ) | |||||
Debt borrowings | 56,927 | — | 110,000 | ||||||||
Debt payments | (278,819 | ) | (18,500 | ) | (8,750 | ) | |||||
Debt issuance cost | (4,672 | ) | (871 | ) | (2,798 | ) | |||||
Cash collateralization of letters of credit | (175 | ) | — | — | |||||||
Payment of debt extinguishment costs | (10,960 | ) | — | — | |||||||
Payments of contingent purchase obligations | — | (2,455 | ) | (3,317 | ) | ||||||
Preferred stock issuance costs | (16,112 | ) | — | — | |||||||
Proceeds from issuance of preferred stocks and warrants | 540,500 | — | — | ||||||||
Preferred stock payments | (293,000 | ) | — | — | |||||||
Proceeds from issuance of common stock, net of issuance costs | — | — | 3,786 | ||||||||
Issuance of restricted stock units, net of taxes paid | (239 | ) | (303 | ) | (929 | ) | |||||
Reduction of capital lease obligation | (3,677 | ) | (5,100 | ) | (1,738 | ) | |||||
Net cash (used in) provided by financing activities | (35,890 | ) | 2,322 | 4,403 | |||||||
Net (decrease) increase in cash and cash equivalents | (3,811 | ) | 21,583 | (2,879 | ) | ||||||
Cash and cash equivalents: | |||||||||||
Beginning of period | 29,513 | 7,930 | 10,809 | ||||||||
End of period | $ | 25,702 | $ | 29,513 | $ | 7,930 | |||||
Supplemental cash flow information: | |||||||||||
Cash paid for interest | $ | 28,129 | $ | 19,473 | $ | 16,725 | |||||
Cash (refunds from) paid for income taxes, net | $ | (25,254 | ) | $ | (3,943 | ) | $ | 20,812 | |||
Non-cash sale of business | $ | — | $ | 3,860 | $ | — | |||||
Non-cash capital leases and other obligations to acquire assets | $ | 7,193 | $ | — | $ | 12,417 | |||||
Non-cash contingent purchase obligation | $ | — | $ | — | $ | 4,114 | |||||
See accompanying notes to consolidated financial statements.
F-6
Roadrunner Transportation Systems, Inc. and Subsidiaries
Notes to Consolidated Financial Statements
1. Organization, Nature of Business and Significant Accounting Policies
Nature of Business
Roadrunner Transportation Systems, Inc. (the “Company”) is headquartered in Downers Grove, Illinois and has the following three segments: Truckload Logistics (“TL”), Less-than-Truckload (“LTL”), and Ascent Global Logistics (“Ascent”). Within its TL business, the Company operates a network of TL service centers and company dispatch offices which are augmented by independent brokerage agents. Within its LTL business, the Company operates LTL service centers throughout the United States, complemented by relationships with numerous delivery agents. Within its Ascent business, the Company operates service centers, dispatch offices, and freight consolidation and inventory management centers throughout the United States. From pickup to delivery, the Company leverages relationships with a diverse group of third-party carriers to provide scalable capacity and reliable, customized service to its customers, including domestic and international air and ocean transportation services. The Company operates primarily in the United States.
Principles of Consolidation
The accompanying audited consolidated financial statements have been prepared pursuant to the rules and regulations of the United States Securities and Exchange Commission (“SEC”). All intercompany balances and transactions have been eliminated in consolidation. In the Company's opinion, these financial statements include all adjustments, consisting only of normal recurring adjustments, necessary for a fair presentation of the operations for the periods presented.
The Company owns 37.5% of Central Minnesota Logistics, Inc. (“CML”), which operates as one of the Company's brokerage agents. CML is accounted for under the equity method and is insignificant to the consolidated financial statements. The Company records its investment in CML in other noncurrent assets and recognizes its share of the net income and loss of CML.
Change in Accounting Principle
On January 1, 2017, the Company adopted Accounting Standards Update (“ASU”) No. 2016-09, Compensation - Stock Compensation (Topic 718), Improvements to Share-Based Payment Accounting. The Company prospectively recognizes any excess tax benefits or tax deficiencies through the consolidated statements of operations and also offsets excess tax benefits and/or tax deficiencies against taxes payable. Also, the Company adopted the classification of the excess tax benefit on a retrospective basis and did not present excess tax benefits and/or tax deficiencies as financing activities within the consolidated statements of cash flows for either period presented. Tax deficiency on share-based compensation was $0.5 million for the year ended December 31, 2016 and the excess tax benefit was $1.2 million for the year ended December 31, 2015. The Company has elected to recognize forfeitures as they occur.
Use of Estimates
The preparation of financial statements, in conformity with accounting principles generally accepted in the United States (“GAAP”), requires management to make estimates and assumptions that affect the reported amounts of assets and liabilities and disclosure of contingent assets and liabilities at the date of the financial statements and the reported amounts of revenue and expenses during the reporting period. Actual results could differ from those estimates.
Cash and Cash Equivalents
Cash equivalents are defined as short-term investments that have an original maturity of three months or less at the date of purchase and are readily convertible into cash. The Company maintains cash in several banks and, at times, the balances may exceed federally insured limits.
Accounts Receivable and Related Reserves
Accounts receivable represent trade receivables from customers and are stated net of an allowance for doubtful accounts of approximately $10.9 million and $18.6 million as of December 31, 2017 and 2016, respectively. Management estimates the portion of accounts receivable that will not be collected and accounts are written off when they are determined to be uncollectible. Accounts receivable are uncollateralized and are generally due 30 to 60 days from the invoice date.
F-7
Roadrunner Transportation Systems, Inc. and Subsidiaries
Notes to Consolidated Financial Statements — (Continued)
The rollforward of the allowance for doubtful accounts is as follows (in thousands):
Year Ended December 31, | |||||||||||
2017 | 2016 | 2015 | |||||||||
Beginning balance | $ | 18,573 | $ | 14,026 | $ | 10,775 | |||||
Divestiture of Unitrans | (91 | ) | — | — | |||||||
Provision, charged to expense | 5,964 | 5,127 | 4,816 | ||||||||
Write-offs, less recoveries | (13,555 | ) | (580 | ) | (1,565 | ) | |||||
Ending balance | $ | 10,891 | $ | 18,573 | $ | 14,026 | |||||
Property and Equipment
Property and equipment are stated at cost. Maintenance and repair costs are charged to expense as incurred. For financial reporting purposes, depreciation is calculated using the straight-line method over the following estimated useful lives:
Buildings and leasehold improvements | 5-40 years |
Computer equipment and software | 3-10 years |
Office equipment, furniture, and fixtures | 3-10 years |
Dock, warehouse, and other equipment | 5-7 years |
Tractors and trailers | 3-15 years |
Aircraft fleet and spare parts | 3-8 years |
Leasehold improvements are amortized over the shorter of their useful lives or the remaining lease term. Accelerated depreciation methods are used for tax reporting purposes.
Property and equipment and other long-lived assets are reviewed periodically for possible impairment. The Company evaluates whether current facts or circumstances indicate that the carrying value of the assets to be held and used may not be recoverable. If such circumstances are determined to exist, an estimate of undiscounted future cash flows produced by the long-lived asset, or the appropriate grouping of assets, is compared to the carrying value to determine whether impairment exists. If an asset is determined to be impaired, the loss is measured and recorded based on quoted market prices in active markets, if available. If quoted market prices are not available, the estimate of fair value is based on various valuation techniques, including discounted value of estimated future cash flows. The Company reports an asset to be disposed of at the lower of its carrying value or its fair value less the cost to sell.
Costs incurred to develop software for internal use are capitalized and amortized over the estimated useful life of the software. Costs related to maintenance of internal-use software are expensed as incurred.
Spare Parts for Aircraft Fleet
Spare parts for aircraft fleet are categorized into several categories: rotables, repairables, expendables, and materials and supplies. Rotable and repairable spare parts for aircraft fleet are typically significant in value, can be repaired and re-used, and generally have an expected useful life consistent with the aircraft fleet these parts support. Rotables and repairables for aircraft fleet are recorded at cost and depreciated over the lesser of the life of the aircraft or spare part. The cost of repairing these aircraft fleet parts is expensed as incurred. Expendables and materials and supplies are expensed when purchased.
Goodwill and Other Intangibles
Goodwill represents the excess of the purchase price of all acquisitions over the estimated fair value of the net assets acquired. The Company evaluates goodwill and intangible assets for impairment at least annually on July 1st or more frequently whenever events or changes in circumstances indicate that the asset may be impaired, or in the case of goodwill, the fair value of the reporting unit is below its carrying amount. The analysis of potential impairment of goodwill requires the Company to compare the estimated fair value at each of its reporting units to its carrying amount, including goodwill. If the carrying amount of the reporting unit exceeds the estimated fair value of the reporting unit, a non-cash goodwill impairment charge is recognized for the amount by which the carrying amount exceeds the reporting unit's fair value; however, the loss recognized should not exceed the total amount of goodwill allocated to that reporting unit. Prior to 2017, the analysis of potential impairment of goodwill required a two-step
F-8
Roadrunner Transportation Systems, Inc. and Subsidiaries
Notes to Consolidated Financial Statements — (Continued)
approach, the first of which was to compare the estimated fair value at each of the reporting units to its carrying amount, including goodwill. If the carrying amount of a reporting unit exceeded its fair value, a second step was required to measure the goodwill impairment loss. The second step included valuing all the tangible and intangible assets of the reporting unit as if the reporting unit had been acquired in a business combination. Then, the implied fair value of the reporting unit's goodwill was compared to the carrying amount of that goodwill. If the carrying amount of the reporting unit's goodwill exceeded the implied fair value of the goodwill, a non-cash goodwill impairment loss was recognized in an amount equal to the excess, not to exceed the carrying amount. See Note 4 for more information on how the Company analyzes the valuation of its goodwill and the results of that valuation.
Intangible assets consist primarily of definite lived customer relationships. The customer relationships intangible assets are amortized over their estimated five to 12 year useful lives. The Company evaluates its intangible assets for impairment when current facts or circumstances indicate that the carrying value of the assets to be held and used may not be recoverable. See Note 4 for additional information on the Company's intangible assets.
Fair Value Measurement
The estimated fair value of the Company's debt approximated its carrying value as of December 31, 2017 and 2016 as the debt facilities as of such dates bore interest based on prevailing variable market rates and as such were categorized as a Level 2 in the fair value hierarchy as defined in Note 7.
The Company has elected to measure the value of its preferred stock using the fair value method. The fair value of the preferred stock is the estimated amount that would be paid to redeem the liability in an orderly transaction between market participants at the measurement date. The significant inputs used to determine the fair value are unobservable and require significant management judgment or estimation and as such were categorized as a Level 3 in the fair value hierarchy. See Note 7 for more information on how the Company determines the fair value of its preferred stock.
Issuance Costs
Debt issuance costs represent costs incurred in connection with the issuance of the Company's debt. Issuance costs associated with the Company's debt are capitalized and amortized over the expected maturity of the financing agreements using the effective interest rate method. Unamortized debt issuance costs have been classified as a reduction to debt in the consolidated balance sheets.
Issuance costs incurred in connection with the issuance of the Company's preferred stock have been expensed as incurred and are reflected in interest expense - preferred stock.
Share-Based Compensation
The Company’s share-based payment awards are comprised of stock options, restricted stock units, and performance restricted stock units. The cost for the Company’s stock options is measured at fair value using the Black-Scholes option pricing model. The cost for restricted stock units and performance restricted stock units is measured using the stock price at the grant date. The cost is recognized over the vesting period of the award, which is typically four years. The amount of costs recognized for performance restricted stock units over the vesting period is dependent on the Company meeting the pre-established financial performance goals.
Income Taxes
The Company accounts for income taxes under the asset and liability method, which requires the recognition of deferred tax assets and liabilities for the expected future tax consequences of events that have been included in the financial statements. Under this method, the Company determines deferred tax assets and liabilities on the basis of the differences between the financial statement and tax bases of assets and liabilities by using enacted tax rates in effect for the year in which the differences are expected to reverse. The effect of a change in tax rates on deferred tax assets and liabilities is recognized in income in the period that includes the enactment date. The U.S. federal tax rate reduction from 35% to 21% (pursuant to the Tax Cuts and Jobs Act enacted on December 22, 2017) was recognized in (benefit from) provision for income taxes in 2017.
The Company recognizes deferred tax assets to the extent that it believes that these assets are more likely than not to be realized. In making such a determination, the Company considers all available positive and negative evidence, including future reversals of existing taxable temporary differences, projected future taxable income, tax-planning strategies, and results of recent operations. If the Company determines that it would be able to realize its deferred tax assets in the future in excess of their net
F-9
Roadrunner Transportation Systems, Inc. and Subsidiaries
Notes to Consolidated Financial Statements — (Continued)
recorded amount, the Company would make an adjustment to the deferred tax asset valuation allowance, which would reduce the provision for income taxes.
The Company records uncertain tax positions in accordance with ASC 740 on the basis of a two-step process in which (1) the Company determines whether it is more likely than not that the tax positions will be sustained on the basis of the technical merits of the position, and (2) for those tax positions that meet the more-likely-than-not recognition threshold, the Company recognizes the largest amount of tax benefit that is more than 50 percent likely to be realized upon ultimate settlement with the related tax authority.
Revenue Recognition
TL revenue is recorded when all of the following have occurred: an agreement of sale exists; pricing is fixed or determinable; delivery has occurred; and the Company’s obligation to fulfill a transaction is complete and collection of revenue is reasonably assured. This occurs when the Company completes the delivery of a shipment or the service has been fulfilled.
LTL revenue is recorded when all of the following have occurred: an agreement of sale exists; pricing is fixed or determinable; and collection of revenue is reasonably assured. The Company uses a percentage of services completed method to recognize revenue, which results in an allocation of revenue between reporting periods based on the distinctive phases of each LTL transaction completed in each reporting period, with expenses recognized as incurred. The Company believes that this is the most appropriate method for LTL revenue recognition based on the multiple distinct phases of a typical LTL transaction, which is in contrast to the single phase of a typical TL transaction.
Ascent revenue is recorded when the shipment has been delivered by a third-party carrier. Fees for services revenue is recognized when the services have been rendered. At the time of delivery or rendering of services, as applicable, the Company’s obligation to fulfill a transaction is complete and collection of revenue is reasonably assured. The Company offers volume discounts to certain customers. Revenue is reduced as discounts are earned. In some instances, the Company performs multiple services. Typically separate fees are quoted and recognized as revenue when services are rendered. Occasionally, customers request an all-inclusive “door-to-door” fee for a set of services and revenue is allocated to the elements and recognized as each service is completed.
The Company typically recognizes revenue on a gross basis, as opposed to a net basis, because it bears the risks and benefits associated with revenue-generated activities by, among other things, (1) acting as a principal in the transaction, (2) establishing prices, (3) managing all aspects of the shipping process, and (4) taking the risk of loss for collection, delivery, and returns. Certain Ascent transactions to provide specific services are recorded at the net amount charged to the client due to the following factors: (A) the Company does not have latitude in establishing pricing and (B) the Company does not bear the risk of loss for delivery and returns; these items are the risk of the carrier.
Insurance
The Company uses a combination of purchased insurance and self-insurance programs to provide for the cost of auto liability, general liability, cargo damage, workers’ compensation claims, and benefits paid under employee health care programs. Insurance reserves are established for estimates of the loss that the Company will ultimately incur on reported claims, as well as estimates of claims that have been incurred but not yet reported.
The measurement and classification of self-insured costs requires the consideration of historical cost experience, demographic and severity factors, and judgments about the current and expected levels of cost per claim and retention levels. These methods provide estimates of the liability associated with claims incurred as of the balance sheet date, including claims not reported. The Company believes these methods are appropriate for measuring these self-insurance accruals.
Lease Purchase Guarantee
In connection with leases of certain equipment used exclusively for the Company, the Company has a guarantee to perform in the event of default by the driver. The Company estimates the costs associated with the guarantee by estimating the default rate at the inception of the lease. The Company records the liability and a corresponding asset, which is subsequently amortized over the life of the lease.
New Accounting Pronouncements
In May 2014, the Financial Accounting Standards Board (“FASB”) issued ASU No. 2014-09 (“ASU 2014-09”), which was updated in August 2015 by ASU No. 2015-14, Revenue from Contracts with Customers (Topic 606). The core principle of the
F-10
Roadrunner Transportation Systems, Inc. and Subsidiaries
Notes to Consolidated Financial Statements — (Continued)
guidance is that an entity should recognize revenue to depict the transfer of promised goods or services to customers in an amount that reflects the consideration to which the entity expects to be entitled in exchange for those goods or services. In March 2016, the FASB issued ASU No. 2016-08 (“ASU 2016-08”), Revenue from Contracts with Customers - Principal versus Agent Considerations (Reporting Revenue Gross versus Net). Under ASU 2016-08, when another party is involved in providing goods or services to a customer, an entity is required to determine whether the nature of its promise is to provide the specified good or service (that is, the entity is a principal) or to arrange for that good or service to be provided by another party. When the principal entity satisfies a performance obligation, the entity recognizes revenue in the gross amount. When an entity that is an agent satisfies the performance obligation, that entity recognizes revenue in the amount of any fee or commission to which it expects to be entitled. Both ASU 2014-09 and ASU 2016-08 will be effective for the Company in 2018. The Company adopted the new revenue standard on January 1, 2018 and assessed all potential impacts of this standard. The Company determined key factors from the five-step process to recognize revenue as prescribed by the new standard that may be applicable to each of the Company's operating businesses that roll up into its three segments. Significant customers and contracts from each business unit were identified and the Company substantially completed the review of these contracts. Evaluation of the provisions of these contracts, and the comparison of historical accounting policies and practices to the requirements of the new standard (including the related qualitative disclosures regarding the potential impact of the effects of the accounting policies the Company expects to apply and a comparison to the Company's current revenue recognition policies), is in process. The Company will complete its process before filing its Form 10-Q for the quarter ended March 31, 2018. The Company's work to date indicates that certain transactions with customers may require a change in the timing of when revenue and related expense is recognized. The Company expects that the adoption of Topic 606 will have an impact of approximately $1 million on its consolidated financial statements. The standard allows for either a full retrospective or a modified retrospective adoption approach. The Company has elected the modified retrospective method which will require a cumulative adjustment to retained earnings instead of retrospectively adjusting prior periods.
In February 2016, the FASB issued ASU No. 2016-02, Leases (Topic 842) (“ASU 2016-02”), which will be effective for the Company in 2019. For financing leases, a lessee is required to: (1) recognize a right-of-use asset and a lease liability, initially measured at the present value of the lease payments; (2) recognize interest on the lease liability separately from amortization of the right-of-use asset; and (3) classify repayments of the principal portion of the lease liability within financing activities and payments of interest on the lease liability and variable lease payments within operating activities in the statement of cash flows. For operating leases, a lessee is required to: (1) recognize the right-to-use asset and a lease liability, initially measured at the present value of the lease payments; (2) recognize a single lease cost, calculated so that the cost of the lease is allocated over the lease term generally on a straight-line basis; and (3) classify all cash payments within operating activities in the statement of cash flows. For leases with a term of 12 months or less, a lessee is permitted to make an accounting policy election by class of underlying assets not to recognize lease assets and lease liabilities. If a lessee makes this election, it should recognize lease expense for such leases generally on a straight-line basis over the lease term. The Company is in the process of evaluating the guidance in ASU 2016-02 and will determine the total impact of the new guidance based on the current lease arrangements that are expected to remain in place. The Company expects adoption of this guidance will have a material impact on the Company's consolidated balance sheet given the Company will be required to record operating leases with lease terms greater than 12 months within assets and liabilities on the consolidated balance sheets. The Company has not yet determined how it will account for leases with terms of 12 months or less.
In August 2016, the FASB issued ASU No. 2016-15, Statement of Cash Flows (Topic 230) (“ASU 2016-15”), which will be effective for the Company in 2018. ASU 2016-15 provides guidance on specific cash flow issues, including but not limited to, debt prepayment or debt extinguishment costs, contingent consideration payments made after a business combination, proceeds from the settlement of insurance claims, and distributions received from equity method investees. ASU 2016-15 provides guidance on how to account for the cash inflows and/or outflows in the statement of cash flows. The Company early adopted ASU 2016-15 effective December 31, 2017 as it had no impact on the Company's consolidated financial statements.
In October 2016, the FASB issued ASU No. 2016-16, Income Taxes (Topic 740) Intra-Entity Transfers of Assets Other than Inventory (“ASU 2016-16”), which will be effective for the Company in 2018. GAAP currently prohibits the recognition of current and deferred income taxes for intra-entity asset transfers other than inventory (e.g. property and equipment) until the asset has been sold to an outside party. Under ASU 2016-16, the FASB decided that an entity should recognize the income tax consequences of an intra-entity transfer of an asset when the transfer occurs. ASU 2016-16 does not include any new disclosure requirements; however, existing disclosure around the rate reconciliations and types of temporary differences and/or carryforward that give rise to a significant portion of deferred income taxes may be applicable. The Company is in the process of evaluating the guidance for ASU 2016-16 and has not yet quantified the potential impact on the Company’s consolidated financial statements.
F-11
Roadrunner Transportation Systems, Inc. and Subsidiaries
Notes to Consolidated Financial Statements — (Continued)
In January 2017, the FASB issued ASU No. 2017-04, Intangibles - Goodwill and Other (Topic 350), Simplifying the Test for Goodwill Impairment (“ASU 2017-04”), which will be effective for the Company in 2020, but early adoption is permitted for interim and annual goodwill impairment tests performed on testing dates after January 1, 2017. ASU 2017-04 eliminates step two from the goodwill impairment test and instead requires an entity to recognize an impairment charge for the amount by which the carrying amount exceeds the reporting unit's fair value; however, the loss recognized should not exceed the total amount of goodwill allocated to that reporting unit. Additionally, an entity should consider income tax effects from any tax deductible goodwill on the carrying amount of the reporting unit when measuring the goodwill impairment loss, if applicable. ASU 2017-04 reduces the amount of time and money spent determining the implied fair value of goodwill, which would allow the Company to more quickly evaluate and identify a recognized impairment. The Company early adopted this ASU and applied it to its goodwill impairment analysis as of July 1, 2017.
2. Property and Equipment
Property and equipment consisted of the following as of December 31 (in thousands):
2017 | 2016 | ||||||
Land | $ | 3,785 | $ | 3,189 | |||
Buildings and leasehold improvements | 18,625 | 18,520 | |||||
Computer equipment and software | 55,793 | 47,313 | |||||
Office equipment, furniture, and fixtures | 5,035 | 6,250 | |||||
Dock, warehouse, and other equipment | 9,259 | 8,852 | |||||
Tractors and trailers | 144,260 | 147,015 | |||||
Aircraft fleet and rotable spare parts | 29,827 | 29,171 | |||||
Property and equipment, gross | 266,584 | 260,310 | |||||
Less: Accumulated depreciation | (107,037 | ) | (88,453 | ) | |||
Property and equipment, net | $ | 159,547 | $ | 171,857 | |||
As of December 31, 2017, $10.9 million of assets not yet placed into service have been included in the line items above. Property and equipment Depreciation expense was $28.5 million, $29.6 million, and $23.2 million for the years ended December 31, 2017, 2016, and 2015, respectively.
3. Acquisitions and Divestitures
On July 28, 2015, the Company acquired all of the outstanding partnership interests of Stagecoach Cartage and Distribution LP (“Stagecoach”) for the purpose of expanding its presence within the TL segment. Cash consideration paid was $32.3 million. The acquisition was financed with borrowings under the Company's credit facility. The Stagecoach purchase agreement called for contingent consideration in the form of a contingent purchase obligation capped at $5.0 million. The former owners of Stagecoach were entitled to receive a payment equal to the amount by which Stagecoach's operating income before depreciation and amortization, as defined in the purchase agreement, exceeded $7.0 million for the twelve month periods ending July 31, 2016, 2017, 2018, and 2019. Approximately $4.1 million was recorded as a contingent purchase obligation on the opening balance sheet. The Company paid $1.7 million of the contingent purchase obligation in the fourth quarter of 2016. Based on future expected earnings, the Company did not expect to pay any additional contingent purchase obligation and recorded an adjustment to write-off the remaining contingent purchase obligation in 2016. In December 2017, the Company and the former owners of Stagecoach signed an agreement releasing the Company from any further obligation under the contingent purchase obligation. The results of operations and financial condition of Stagecoach have been included in the Company's consolidated financial statements since its acquisition date. The acquisition of Stagecoach is considered immaterial.
On September 15, 2017, the Company completed the sale of its wholly-owned subsidiary Unitrans, Inc. (“Unitrans”). The Company received net proceeds of $88.5 million and recognized a gain of $35.4 million. Proceeds from the sale were used primarily to redeem a portion of the Series E Preferred Stock and to provide funding for operations. The results of operations and financial condition of Unitrans have been included in the Company's consolidated financial statements within the Company's Ascent segment until the date of sale. The divestiture of Unitrans did not meet the criteria for being classified as a discontinued operation and, accordingly, its results are presented within continuing operations. Unitrans contributed $5.8 million, $8.0 million and $8.6 million of income before taxes for the years ended December 31, 2017, 2016 and 2015, respectively.
F-12
Roadrunner Transportation Systems, Inc. and Subsidiaries
Notes to Consolidated Financial Statements — (Continued)
4. Goodwill and Intangible Assets
Goodwill represents the excess of the purchase price of all acquisitions over the estimated fair value of the net assets acquired. The Company evaluates goodwill and intangible assets for impairment at least annually on July 1st or more frequently whenever events or changes in circumstances indicate that the asset may be impaired, or in the case of goodwill, the fair value of the reporting unit is below its carrying amount. The analysis of potential impairment of goodwill requires the Company to compare the estimated fair value at each of its reporting units to its carrying amount, including goodwill. If the carrying amount of the reporting unit exceeds the estimated fair value of the reporting unit, a non-cash goodwill impairment loss is recognized as an impairment charge for the amount by which the carrying amount exceeds the reporting unit's fair value; however, the loss recognized should not exceed the total amount of goodwill allocated to that reporting unit.
For purposes of the impairment analysis, the fair value of the Company’s reporting units is estimated based upon an average of the market approach and the income approach, both of which incorporate numerous assumptions and estimates such as company forecasts, discount rates and growth rates, among others. The determination of the fair value of the reporting units and the allocation of that value to individual assets and liabilities within those reporting units requires the Company to make significant estimates and assumptions. These estimates and assumptions primarily include, but are not limited to, the selection of appropriate peer group companies, control premiums appropriate for acquisitions in the industries in which the Company competes, the discount rate, terminal growth rates, and forecasts of revenue, operating income, and capital expenditures. Although the Company believes its estimates of fair value are reasonable, actual financial results could differ from those estimates due to the inherent uncertainty involved in making such estimates. Changes in assumptions concerning future financial results or other underlying assumptions could have a significant impact on either the fair value of the reporting units, the amount of the goodwill impairment charge, or both. Future declines in the overall market value of the Company's stock may also result in a conclusion that the fair value of one or more reporting units has declined below its carrying value.
The Company has four reporting units for its three segments: one reporting unit for its TL segment; one reporting unit for its LTL segment; and two reporting units for its Ascent segment, which are the Ascent reporting unit and the Warehousing & Consolidation reporting unit. The Company conducted its goodwill impairment analysis for each of its four reporting units at July 1, 2017 and determined that no impairment had occurred, as each reporting unit's fair value exceeded the carrying value.
The sale of Unitrans, which was included in the Ascent reporting unit, reduced the Ascent reporting unit's goodwill and gross carrying amount of intangible asset balances by $42.8 million and $12.0 million, respectively, resulting in an incremental impairment analysis on the remaining net assets of the Ascent reporting unit. The Company evaluated the remaining carrying value of the Ascent reporting unit and compared it to the fair value of the remaining businesses in the Ascent reporting unit. As a result of this evaluation, the Company determined the carrying value exceeded the fair value and recorded a $4.4 million impairment charge in the third quarter of 2017.
As a result of the first step of the Company's goodwill impairment analysis as of July 1, 2016, the Company determined that the fair value of the Ascent reporting unit exceeded its carrying value by 8.4%; thus, no impairment was indicated for this reporting unit. However, resulting from a combination of the weakened environment, the inability to meet forecast results, and the lower share price, the Company determined that the fair value of the TL, LTL, and Warehousing & Consolidation reporting units were less than their respective carrying values, requiring the Company to perform the second step of the goodwill impairment analysis for its TL, LTL, and Warehousing & Consolidation reporting units. The Company completed the second step of the goodwill impairment analysis for its TL, LTL, and Warehousing & Consolidation reporting units and recorded in the third quarter of 2016 non-cash goodwill impairment charges of $157.5 million, $197.3 million, and $17.2 million for its TL, LTL, and Warehousing & Consolidation reporting units, respectively. No goodwill impairment charges were recorded in 2015.
F-13
Roadrunner Transportation Systems, Inc. and Subsidiaries
Notes to Consolidated Financial Statements — (Continued)
The following is a rollforward of goodwill from December 31, 2015 to December 31, 2017 by segment (in thousands):
TL | LTL | Ascent | Total | ||||||||||||
Goodwill balance as of December 31, 2015 | $ | 254,940 | $ | 197,312 | $ | 230,558 | $ | 682,810 | |||||||
Adjustments to goodwill for purchase accounting | 1,812 | — | — | 1,812 | |||||||||||
Goodwill impairment charges | (157,538 | ) | (197,312 | ) | (17,231 | ) | (372,081 | ) | |||||||
Goodwill balance as of December 31, 2016 | $ | 99,214 | $ | — | $ | 213,327 | $ | 312,541 | |||||||
Adjustments to goodwill for purchase accounting | (470 | ) | — | — | (470 | ) | |||||||||
Adjustments to goodwill for sale of Unitrans | — | — | (42,843 | ) | (42,843 | ) | |||||||||
Goodwill impairment charges | — | — | (4,402 | ) | (4,402 | ) | |||||||||
Goodwill balance as of December 31, 2017 | $ | 98,744 | $ | — | $ | 166,082 | $ | 264,826 | |||||||
The following is a breakdown of the Company's accumulated goodwill impairment losses from January 1, 2016 to December 31, 2017 by segment (in thousands):
TL | LTL | Ascent | Total | ||||||||||||
Balance as of January 1, 2016 | $ | — | $ | — | $ | — | $ | — | |||||||
Impairment charges in 2016 | 157,538 | 197,312 | 17,231 | 372,081 | |||||||||||
Impairment charges in 2017 | — | — | 4,402 | 4,402 | |||||||||||
Balance as of December 31, 2017 | $ | 157,538 | $ | 197,312 | $ | 21,633 | $ | 376,483 | |||||||
Intangible assets consist primarily of customer relationships acquired from business acquisitions. Intangible assets were as follows as of December 31 (in thousands):
2017 | 2016 | ||||||||||||||||||||||
Gross Carrying Amount | Accumulated Amortization | Net Carrying Value | Gross Carrying Amount | Accumulated Amortization | Net Carrying Value | ||||||||||||||||||
TL | $ | 55,733 | $ | (18,907 | ) | $ | 36,826 | $ | 54,973 | $ | (13,606 | ) | $ | 41,367 | |||||||||
LTL | 2,498 | (1,748 | ) | 750 | 1,358 | (1,083 | ) | 275 | |||||||||||||||
Ascent | 26,427 | (14,355 | ) | 12,072 | 38,427 | (14,520 | ) | 23,907 | |||||||||||||||
Total intangible assets | $ | 84,658 | $ | (35,010 | ) | $ | 49,648 | $ | 94,758 | $ | (29,209 | ) | $ | 65,549 | |||||||||
Amortization expense was $9.2 million, $8.6 million, and $8.4 million for the years ended December 31, 2017, 2016, and 2015, respectively. In the fourth quarter of 2016, the Company decided to shut down one of its TL business operations due to the significant decline in volume resulting from the loss of a significant customer. The Company reviewed the customer relationship intangible associated with the business operation, considered the decline in volumes, determined the customer relationship intangible was impaired, and recorded an impairment charge of $1.6 million in 2016. The Company identified indicators of impairment with certain other business operations and performed the required impairment analysis, but no impairment was identified.
F-14
Roadrunner Transportation Systems, Inc. and Subsidiaries
Notes to Consolidated Financial Statements — (Continued)
Estimated amortization expense for each of the next five years based on intangible assets as of December 31, 2017 is as follows (in thousands):
Amount | ||||
Year Ending: | ||||
2018 | $ | 7,123 | ||
2019 | 6,819 | |||
2020 | 6,447 | |||
2021 | 6,265 | |||
2022 | 5,525 | |||
Thereafter | 17,469 | |||
Total | $ | 49,648 | ||
F-15
Roadrunner Transportation Systems, Inc. and Subsidiaries
Notes to Consolidated Financial Statements — (Continued)
5. Debt
The Company's debt consisted of the following at December 31 (in thousands):
2017 | 2016 | ||||||
ABL Facility: | |||||||
Revolving credit facility | $ | 147,037 | $ | — | |||
Term loan | 55,858 | — | |||||
Total ABL Facility | $ | 202,895 | $ | — | |||
Senior debt: | |||||||
Revolving credit facility | $ | — | $ | 172,700 | |||
Term loans | — | 277,750 | |||||
Total senior debt | $ | — | $ | 450,450 | |||
Less: Debt issuance costs and discount | (3,485 | ) | (4,861 | ) | |||
Total debt, net of debt issuance costs and discount | 199,410 | 445,589 | |||||
Less: Current maturities | (9,950 | ) | (445,589 | ) | |||
Total debt, net of current maturities | $ | 189,460 | $ | — | |||
Maturities for each of the next five years based on debt as of December 31, 2017 are as follows (in thousands)
Amount | ||||
Year Ending: | ||||
2018 | $ | 9,950 | ||
2019 | 9,952 | |||
2020 | 9,954 | |||
2021 | 9,955 | |||
2022 | 163,084 | |||
Total | $ | 202,895 | ||
ABL Facility
On July 21, 2017, the Company entered into the Asset-Based Lending (“ABL”) Facility with BMO Harris Bank, N.A. and certain other lenders (the “ABL Facility”). The Company used the initial proceeds from the ABL Facility for working capital purposes and to redeem all of the outstanding shares of its Series F Preferred Stock. The ABL Facility matures on July 21, 2022.
The ABL Facility consists of a:
• | $200.0 million asset-based revolving line of credit, of which $20.0 million may be used for swing line loans and $30.0 million may be used for letters of credit; |
• | $56.8 million term loan facility; and |
• | $35.0 million asset-based facility available to finance future capital expenditures, which was subsequently terminated before being utilized. |
F-16
Roadrunner Transportation Systems, Inc. and Subsidiaries
Notes to Consolidated Financial Statements — (Continued)
The Company initially borrowed $141.7 million under the revolving line of credit and $56.8 million under the term loan facility. Principal on the term loan facility is due in quarterly installments commencing on March 31, 2018. Borrowings under the ABL Facility are secured by substantially all of the assets of the Company. Borrowings under the ABL Facility bear interest at either the (a) LIBOR Rate (as defined in the credit agreement) plus an applicable margin in the range of 1.5% to 2.25%, or (b) the Base Rate (as defined in the credit agreement) plus an applicable margin in the range of 0.5% to 1.25%. The ABL Facility contains a minimum fixed charge coverage ratio financial covenant that must be maintained when excess availability falls below a specified amount. The ABL Facility also provides for the issuance of up to $30.0 million in letters of credit. As of December 31, 2017, the Company had outstanding letters of credit totaling $17.4 million. In addition, the ABL Facility contains negative covenants limiting, among other things, additional indebtedness, transactions with affiliates, additional liens, sales of assets, dividends, investments and advances, prepayments of debt, mergers and acquisitions, and other matters customarily restricted. The ABL Facility also contains customary events of default, including payment defaults, breaches of representations and warranties, covenant defaults, events of bankruptcy and insolvency, failure of any guaranty or security document supporting the credit agreement to be in full force and effect, and a change of control of the Company's business.
On December 15, 2017, the Company entered into a First Amendment to the ABL Facility. Pursuant to the First Amendment the ABL Facility was amended to (i) reduce the maximum borrowing amount under the revolving line of credit by $15.0 million and (ii) terminate the asset-based facility available to finance future capital expenditures.
On January 30, 2018, the Company entered into a Second Amendment to the ABL Facility and on March 14, 2018, the Company entered into a Third Amendment to the ABL Facility. See Note 16 for additional information regarding both Amendments to the ABL Facility.
Senior Debt
On September 24, 2015, the Company entered into a sixth amended and restated credit agreement (the “credit agreement”) with U.S. Bank and other lenders, which increased the revolving credit facility to $400.0 million and the term loan to $300.0 million. The credit facility had a maturity date of July 9, 2019. Principal on the term loan was due in quarterly installments of $3.8 million. On June 17, 2016, the Company entered into a Consent, Waiver, and First Amendment (the “Amendment”) to the credit agreement. Pursuant to the Amendment, the Company, among other things, reduced the revolving line of credit under the senior credit facility from a maximum aggregate amount of $400.0 million to $300.0 million. The Company further reduced the revolving line of credit under the senior credit facility to $250.0 million pursuant to a Waiver entered into on November 14, 2016.
The credit agreement was collateralized by all assets of the Company and contained certain financial covenants, including a maximum cash flow leverage ratio and a minimum fixed charge coverage ratio. The Company was not in compliance with its debt covenants for the year ended December 31, 2016 and, accordingly, the Company's senior debt was classified as current on its consolidated balance sheets.
The senior debt was paid off with the proceeds from the issuance of preferred stock on May 2, 2017. See Note 6 for further information on the Company's issuance of preferred stock. In connection with the pay-off of the senior debt, the Company recorded a loss from debt extinguishment of $9.8 million.
F-17
Roadrunner Transportation Systems, Inc. and Subsidiaries
Notes to Consolidated Financial Statements — (Continued)
Capital Lease Obligations
The Company has a building and certain equipment classified as capital leases. As of December 31, 2017, the gross property and equipment value of capital lease assets was $14.1 million. The following is a schedule of future minimum lease payments under the capital leases with the present value of the net minimum lease payments as of December 31, 2017 (in thousands):
Amount | ||||
Year Ending: | ||||
2018 | $ | 2,809 | ||
2019 | 3,417 | |||
2020 | 1,897 | |||
2021 | 1,896 | |||
2022 | 158 | |||
Total minimum lease payments | 10,177 | |||
Less: amount representing interest | (612 | ) | ||
Present value of net minimum lease payments(1) | $ | 9,565 | ||
(1) | Reflected in the consolidated balance sheets as $2.4 million of accrued expenses and other current liabilities and $7.2 million of other long-term liabilities. |
6. Preferred Stock
Preferred stock as of December 31 consisted of the following (in thousands):
2017 | 2016 | ||||||
Preferred stock: | |||||||
Series B Preferred | $ | 146,649 | $ | — | |||
Series C Preferred | 76,096 | — | |||||
Series D Preferred | 6,672 | — | |||||
Series E Preferred | 33,900 | — | |||||
Total Preferred stock | $ | 263,317 | $ | — | |||
Preferred Stock
On May 1, 2017, the Company entered into an Investment Agreement (“Investment Agreement”), which closed on May 2, 2017, with affiliates of Elliott Management Corporation (“Elliott”) , pursuant to which the Company issued and sold shares of its preferred stock and issued warrants to Elliott for an aggregate purchase price of $540.5 million. The proceeds of the sale of the preferred stock were used to pay off and terminate the Company’s senior credit facility and to provide working capital to support the Company’s operations and future growth.
The Company made certain customary representations and warranties and agreed to certain covenants, including agreeing to use reasonable best efforts to enter into, within 90 days following the closing date, an asset based lending facility (the earlier of (i) the date of such entry and (ii) the expiration of such 90 day period, the “Refinancing Date”).
From the closing date until the Refinancing Date, the Company agreed to pay Elliott a daily payment in an amount equal to $33,333.33 per calendar day (which amount accrued daily and was payable monthly in arrears). On July 21, 2017, the Company entered into the ABL Facility (which was deemed to be the “New ABL Facility” under the Investment Agreement) and used the initial proceeds from the ABL Facility for working capital purposes and to redeem all of the outstanding shares of the Series F Preferred Stock.
The preferred stock is mandatorily redeemable and, as such, is presented as a liability on the consolidated balance sheets. The Company has elected to measure the value of its preferred stock using the fair value method. Under the fair value method, issuance costs are expensed as incurred. The Company incurred $16.1 million of issuance costs associated with the preferred stock
F-18
Roadrunner Transportation Systems, Inc. and Subsidiaries
Notes to Consolidated Financial Statements — (Continued)
for the year ended December 31, 2017, which are reflected in interest expense - preferred stock. The fair value of the preferred stock increased by $18.4 million during the year ended December 31, 2017, which is reflected in interest expense - preferred stock.
In connection with the repurchase of the Series F Preferred Stock and repurchase of a portion of the Series E Preferred Stock, the Company recorded a loss of $6.1 million reported in loss from debt extinguishment.
On March 1, 2018, the Company entered into the Series E-1 Preferred Stock Investment Agreement (the “Series E-1 Investment Agreement”) with Elliott, pursuant to which the Company agreed to issue and sell to Elliott from time to time until July 30, 2018, an aggregate of up to 54,750 shares of a newly created class of preferred stock designated as Series E-1 Cumulative Redeemable Preferred Stock, par value $0.01 per share (“Series E-1 Preferred Stock”), at a purchase price of $1,000 per share for the first 17,500 shares of Series E-1 Preferred Stock, $960 per share for the next 18,228 shares of Series E-1 Preferred Stock, and $920 per share for the final 19,022 shares of Series E-1 Preferred Stock. On March 1, 2018, the parties held an initial closing pursuant to which the Company issued and sold to Elliott 17,500 shares of Series E-1 Preferred Stock for an aggregate purchase price of $17.5 million. On April 24, 2018, the parties held a closing pursuant to the Series E-1 Investment Agreement, pursuant to which the Company issued and sold to Elliott 18,228 shares of Series E-1 Preferred Stock for an aggregate purchase price of approximately $17.5 million. See Note 16 for additional information regarding the Series E-1 Investment Agreement and related issuances.
Certain Terms of the Preferred Stock
Series B | Series C | Series D | Series E | Series F | |
Shares at $0.01 Par Value at Issuance | 155,000 | 55,000 | 100 | 90,000 | 240,500 |
Shares Outstanding at December 31, 2017 | 155,000 | 55,000 | 100 | 37,500 | — |
Price / Share | $1,000 | $1,000 | $1.00 | $1,000 | $1,000 |
Dividend Rate | Adjusted LIBOR + 3.00% + Additional Rate (4.75-12.50%) based on leverage. Additional 3.00% upon certain triggering events. | Adjusted LIBOR + 3.00% + Additional Rate (4.75-12.50%) based on leverage. Additional 3.00% upon certain triggering events. | Right to participate equally and ratably in all cash dividends paid on common stock. | Adjusted LIBOR + 5.25% + Additional Rate (8.50%). Additional 3.00% upon certain triggering events. | Adjusted LIBOR + 6.25% at closing. Additional 3.00% upon certain triggering events. |
Dividend Rate at December 31, 2017 | 16.737% | 16.737% | n/a | 14.987% | n/a |
Redemption Term | 8 Years | 8 Years | 8 Years | 6 Years | 6 Years |
Redemption Rights | From Closing Date: 12-24 months: 105% 24-36 months: 103% | 65% premium (subject to stock movement) | From Closing Date: 0-12 months: 106.5% 12-24 months: 103.5% | (a) Refinancing Date: 101.0% upon redemption with New ABL Facility (b) From Closing Date: Refinancing Date-12 months: 106.5% 12-24 months: 103.5% | |
Redemption rights are at the option of the Company or, upon a change in control, at the option of the holder. The holders of Series C Preferred Stock and Series D Preferred Stock have the right to participate equally and ratably with holders of common stock in all cash dividends paid on shares of common stock.
F-19
Roadrunner Transportation Systems, Inc. and Subsidiaries
Notes to Consolidated Financial Statements — (Continued)
At each preferred stock dividend payment date, the Company has the option to pay the accrued dividends in cash or to defer them. Deferred dividends earn dividend income consistent with the underlying shares of preferred stock.
Other Terms of the Preferred Stock
Voting. The holders of preferred stock will generally not be entitled to vote on any matters submitted to a vote of the stockholders of the Company. So long as any shares of preferred stock are outstanding, the Company may not take certain actions without the prior approval of the holders of shares of preferred stock representing a majority of the aggregate liquidation value of all of the shares of preferred stock (the “Preferred Requisite Vote”), voting as a separate class.
Board of Directors. For so long as (a) any shares of Series B Preferred Stock or Series C Preferred Stock are issued and outstanding and (b) Elliott hold shares of preferred stock collectively representing a majority of the liquidation value of the preferred stock, the holders of preferred stock shall have the exclusive right, acting with the Preferred Requisite Vote, to nominate and elect two (2) individuals selected by the holders of preferred stock, or to require the Company’s Board of Directors to fill two (2) vacancies in the Board of Directors with individuals selected by the holders of preferred stock, to serve as, respectively, a Class II director and a Class III director of the Company (the “Preferred Stock Directors”).
Following the redemption of all shares of Series B Preferred Stock and Series C Preferred Stock, and until such time as all shares of Series D Preferred Stock are redeemed, for so long as Elliott holds at least 5.0% of the equity value of the Company, the holders of preferred stock shall have the exclusive right acting with the Preferred Requisite Vote, to (i) nominate and elect one (1) Preferred Stock Director, and (ii) designate one individual to act as an observer to the Board of Directors.
In the event of any Triggering Event (as defined in the Certificates of Designations), subject to applicable rules of the New York Stock Exchange, including, without limitation, independent director requirements, the number of directors constituting the Board of Directors shall be increased such that the number of vacancies on the Board of Directors resulting from such increase (the “Triggering Event Vacancies”), together with the Preferred Stock Directors (to the extent then serving on the Board of Directors), constitutes a majority of the Board of Directors. The holders of preferred stock shall have the right, acting with the Preferred Requisite Vote, to nominate and elect individuals selected by the holders of preferred stock to fill such Triggering Event Vacancies and thereby serve as directors of the Company, or to require the Board of Directors to act to fill such Triggering Event Vacancies with individuals selected by such holders of preferred stock, to serve as directors of the Company, and the size of the Board of Directors shall be increased as needed. Each such director so elected is referred to as a “Triggering Event Director”. When a Triggering Event is no longer continuing, then the right of the holders of preferred stock to elect the Triggering Event Directors will cease, the terms of office of the Triggering Event Directors will immediately terminate and the number of directors constituting the Board of Directors will be reduced accordingly. The holders of preferred stock have other rights in the event of a Triggering Event, as described in the Certificate of Designations.
Warrant Agreement
In connection with the issuance of the preferred stock pursuant to the Investment Agreement, the Company and Elliott entered into a Warrant Agreement (the “Warrant Agreement”), pursuant to which the Company issued to Elliott eight year warrants (the “Warrants”) to purchase an aggregate of 379,572 shares of the Company's common stock at an exercise price of $0.01 per share.
Stockholders’ Agreement
In connection with the issuance of the preferred stock pursuant to the Investment Agreement, the Company and Elliott entered into a Stockholders’ Agreement (the “Stockholders’ Agreement”), pursuant to which Elliott was granted certain preemptive rights and other rights.
Subject to customary exceptions, each Eligible Elliott Party (as defined in the Stockholders’ Agreement) shall have the right to purchase their pro rata percentage of subsequent issuances of equity securities offered by the Company in any non-public offering.
Registration Rights Agreement
In connection with the issuance of the preferred stock pursuant to the Investment Agreement, the Company, Elliott, and investment funds affiliated with HCI Equity Management L.P. (“HCI”) entered into a Registration Rights Agreement (the “Registration Rights Agreement”), pursuant to which the Company granted certain demand and piggyback registration rights.
F-20
Roadrunner Transportation Systems, Inc. and Subsidiaries
Notes to Consolidated Financial Statements — (Continued)
7. Fair Value Measurement
Accounting guidance on fair value measurements for certain financial assets and liabilities requires that assets and liabilities carried at fair value be classified and disclosed in one of the following three categories:
Level 1 — Quoted market prices in active markets for identical assets or liabilities.
Level 2 — Observable market-based inputs or unobservable inputs that are corroborated by market data.
Level 3 — Unobservable inputs reflecting the reporting entity’s own assumptions or external inputs from inactive markets.
A financial asset or liability’s classification within the hierarchy is determined based on the lowest level of input that is significant to the fair value measurement.
The Company has elected to measure its preferred stock using the fair value method. The fair value of the preferred stock is the estimated amount that would be paid to redeem the liability in an orderly transaction between market participants at the measurement date. The Company calculates the fair value of:
• | the Series B Preferred Stock using a lattice model that takes into consideration the Company's call right on the instrument based on simulated future interest rates; |
• | the Series C Preferred stock using a lattice model that takes into consideration the future redemption value on the instrument, which is tied to the Company's stock price; |
• | the Series D Preferred Stock using a static discounted cash flow approach, where the expected redemption value of the instrument is based on the value of the Company's stock as of the measurement date grown at the risk-free rate; |
• | the Series E Preferred Stock via application of both (i) a static discounted cash flow approach and (ii) a lattice model that takes into consideration the Company's call right on this instrument based on simulated future interest rates; and |
• | the Series F Preferred Stock using a static discounted cash flow approach that assumes the Series F Preferred Stock will be fully redeemed in 2017. |
These valuations are considered to be Level 3 fair value measurements as the significant inputs are unobservable and require significant management judgment or estimation. Considerable judgment is required in interpreting market data to develop the estimates of fair value. Accordingly, the Company’s estimates are not necessarily indicative of the amounts that the Company, or holders of the instruments, could realize in a current market exchange. Significant assumptions used in the fair value models include: the estimates of the redemption dates; credit spreads; dividend payments; and the market price of the Company’s common stock. The use of different assumptions and/or estimation methodologies could have a material effect on the estimated fair values.
The table below sets forth a reconciliation of the Company’s beginning and ending Level 3 preferred stock liability balance for the year ended December 31, 2017.
2017 | |||
Balance, beginning of period | $ | — | |
Issuance of preferred stock at fair value | 537,930 | ||
Redemption of preferred stock | (293,000 | ) | |
Change in fair value of preferred stock (1) | 18,387 | ||
Balance, end of period | $ | 263,317 | |
(1)Change in fair value of preferred stock is reported in interest expense - preferred stock.
Certain of the Company’s acquisitions contained contingent purchase obligations as described in Note 3. The contingent purchase obligation related to acquisitions was measured at fair value on a recurring basis, according to the valuation techniques the Company used to determine fair value. These valuations were considered to be Level 3 fair value measurements as the significant inputs were unobservable and required significant management judgment or estimation. Changes to the fair value were recognized
F-21
Roadrunner Transportation Systems, Inc. and Subsidiaries
Notes to Consolidated Financial Statements — (Continued)
as income or expense within other operating expenses. In measuring the fair value of the contingent purchase obligation, the Company used an income approach that considers the expected future earnings of the acquired businesses, for the varying performance periods, based on historical performance and the resulting contingent payments, discounted at a risk-adjusted rate. There were no remaining contingent purchase obligations as of December 31, 2016 and 2017.
The table below sets forth a reconciliation of the Company’s beginning and ending Level 3 contingent purchase obligations liability balance for the years ended December 31 (in thousands):
2016 | 2015 | ||||||
Balance, beginning of period | $ | 4,913 | $ | 6,842 | |||
Contingent purchase obligation recorded on the opening balance sheet | — | 4,114 | |||||
Payment of contingent purchase obligations | (2,455 | ) | (3,317 | ) | |||
Interest expense | — | 205 | |||||
Adjustments to contingent purchase obligations (1) | (2,458 | ) | (2,931 | ) | |||
Balance, end of period | $ | — | $ | 4,913 | |||
(1) | Adjustments to contingent purchase obligations are reported in other operating expenses. |
8. Stockholders’ Investment
Common Stock
The Company's common stock has voting rights — one vote for each share of common stock. In March 2007, the Company entered into a second amended and restated stockholders’ agreement (the “Stockholders' Agreement”). The Stockholders' Agreement provided that, any time after the Company was eligible to register its common stock on a Form S-3 registration statement under the Securities Act, certain of the Company’s stockholders, including entities affiliated with HCI Equity Partners, L.L.C. (the “HCI Stockholders”), could request registration under the Securities Act of all or any portion of their shares of common stock. These stockholders were limited to a total of two of such registrations. In addition, if the Company proposed to file a registration statement under the Securities Act for any underwritten sale of shares of any of its securities, certain of the Company's stockholders could request that the Company include in such registration the shares of common stock held by them on the same terms and conditions as the securities otherwise being sold in such registration. In connection with the closing of the transactions contemplated by the Investment Agreement, the Company, affiliates of Elliott, and the HCI Stockholders entered into a Registration Rights Agreement that, with respect to the HCI Stockholders, amended and restated the Stockholders’ Agreements. See Note 6 for additional information regarding the Investment Agreement.
In August 2015, in a secondary offering, the HCI Stockholders sold 2.0 million shares of common stock. The Company did not issue any shares in the offering and did not receive any proceeds from the sale of the shares; however, the Company incurred costs of $0.2 million.
Warrants to Acquire Common Stock
On May 1, 2017, in connection with the issuance of preferred stock pursuant to the Investment Agreement, the Company issued 8-year warrants to purchase an aggregate of 379,572 shares of common stock, at an exercise price of $0.01 per share. The value of the warrants was determined to be $2.6 million based upon the Black-Scholes option pricing model. The warrants were classified as an equity contract and reflected in additional paid-in capital.
9. Share-Based Compensation
The Company's 2010 Incentive Compensation Plan (the “2010 Plan”) allows for the issuance of 2,500,000 shares of common stock and provides for the grant of stock options, restricted stock units, performance restricted stock units, and other awards to the Company's employees and directors.
In 2015, the Company added performance restricted stock units to its share-based compensation plan. Under this program, performance restricted stock units are awarded to eligible employees based on pre-established financial performance goals. No performance restricted stock unit awards were earned as of December 31, 2017 or 2016.
F-22
Roadrunner Transportation Systems, Inc. and Subsidiaries
Notes to Consolidated Financial Statements — (Continued)
The Company awards restricted stock units to certain key employees and independent directors. The restricted stock units vest ratably over a four year service period from the grant date. Restricted stock units are valued based on the market price on the date of the grant and are amortized on a straight-line basis over the vesting period. Compensation expense for restricted stock units is based on fair market value at the grant date.
The following table summarizes the nonvested restricted stock units as of December 31, 2017 and 2016:
Number of Restricted Stock Units | Weighted Average Grant Date Fair Value | Weighted Average Remaining Contractual Term (Years) | |||||||
Nonvested as of December 31, 2015 | 208,775 | $ | 23.75 | 1.7 | |||||
Granted | 190,179 | 11.12 | |||||||
Vested | (104,886 | ) | 22.05 | ||||||
Forfeitures | (19,304 | ) | 20.04 | ||||||
Nonvested as of December 31, 2016 | 274,764 | $ | 15.67 | 1.8 | |||||
Granted | 271,279 | 7.59 | |||||||
Vested | (113,956 | ) | 16.73 | ||||||
Forfeitures | (74,000 | ) | 10.35 | ||||||
Nonvested as of December 31, 2017 | 358,087 | $ | 9.96 | 2.7 | |||||
Unrecognized share-based compensation expense for restricted stock units was $2.5 million and $2.8 million as of December 31, 2017 and 2016, respectively.
The Company previously maintained a Key Employee Equity Plan (“Equity Plan”), a stock-based compensation plan that permitted the grant of stock options to Company employees and directors. Stock options under the Equity Plan were granted with an exercise price equal to or in excess of the fair value of the Company’s stock on the date of grant. Such options vested ratably over a two or four year service period and were exercisable ten years from the date of grant, but only to the extent vested as specified in each option agreement. The Company no longer issues awards under this plan.
Group Transportation Services (“GTS”) previously maintained a Key Employee Equity Plan (“GTS Plan”), which permitted the grant of stock options to employees and directors. Stock options under the GTS Plan were granted with an exercise price equal to or in excess of the fair value of GTS’ stock on the date of grant. Such options vested ratably over a two or four year service period and were exercisable ten years from the date of grant, but only to the extent vested as specified in each option agreement. In connection with the Company’s merger with GTS effective upon the IPO, all options granted pursuant to the GTS Plan outstanding at the effective time of the merger became options to purchase shares of the Company’s common stock. The Company no longer issues awards under this plan.
Under the 2010 Plan, the Company may award stock options to certain key employees. The stock options vest ratably over a three to five year service period and are exercisable four to seven years from the date of grant, but only to the extent vested as specified in each option agreement. Stock options awarded are valued based upon the Black-Scholes option pricing model and the Company recognizes this value as stock compensation expense over the periods in which the options vest. Use of the Black Scholes option-pricing model requires that the Company make certain assumptions, including expected volatility, risk-free interest rate, expected dividend yield, and the expected life of the options. The Company granted stock options to purchase 564,000 and 650,000 shares in 2017 and 2016, respectively.
F-23
Roadrunner Transportation Systems, Inc. and Subsidiaries
Notes to Consolidated Financial Statements — (Continued)
Stock option fair value assumptions for the stock options granted during the year ended December 31, 2017 and 2016 are as follows:
2017 | 2016 | |||
Option life (years) | 7 years | 4 to 7 years | ||
Risk free interest rate | 1.8% to 2.2% | 1.3% to 1.8% | ||
Dividend yield | — | — | ||
Expected volatility | 47.8% to 48.0% | 40.8% to 46.9% | ||
Expected life (years) | 5 years | 3 to 5 years | ||
Weighted average fair value of stock options granted | $3.14 | $2.04 | ||
A summary of the option activity for the years ended December 31, 2017 and 2016 is as follows:
Shares | Weighted Average Exercise Price | Weighted Average Remaining Contractual Term (Years) | ||||||
Outstanding as of December 31, 2015 | 289,367 | $ | 14.77 | 0.7 | ||||
Granted | 650,000 | 10.20 | ||||||
Exercised | — | — | ||||||
Outstanding as of December 31, 2016 | 745,259 | $ | 12.34 | 4.4 | ||||
Granted | 564,000 | $ | 7.18 | |||||
Forfeited | (59,726 | ) | 13.39 | |||||
Outstanding as of December 31, 2017 | 1,249,533 | $ | 10.34 | 4.9 | ||||
Unrecognized stock compensation expense for stock options was $2.1 million and $1.0 million as of December 31, 2017 and 2016, respectively.
All outstanding options are non-qualified options. There were 198,867, 95,259, and 289,367 options exercisable as of December 31, 2017, 2016, and 2015, respectively. As of December 31, 2017, for exercisable options, the weighted-average exercise price was $10.34, the weighted average remaining contractual term was approximately five years and there was no estimated aggregate intrinsic value per share. As of December 31, 2017, 1,050,666 options were unvested.
Stock-based compensation expense for restricted stock units and stock options was $2.2 million, $2.2 million, and $2.5 million for the years ended December 31, 2017, 2016, and 2015, respectively. The related estimated income tax benefit recognized in the accompanying consolidated statements of operations, net of estimated forfeitures, was $0.9 million for each of the years ended December 31, 2017, 2016, and 2015. Following the adoption of ASU 2016-09, the Company recorded tax deficiencies on vested shares of $0.4 million in benefit from income taxes for the year ended December 31, 2017. Prior to January 1, 2017, tax deficiencies and excess tax benefits on vested shares was reported through additional paid-in capital.
10. Earnings Per Share
Basic (loss) earnings per common share is calculated by dividing net loss or net income by the weighted average number of common stock outstanding during the period. Diluted (loss) earnings per share is calculated by dividing net income or net loss by the weighted average common stock outstanding plus stock equivalents that would arise from the assumed exercise of stock options and conversion of warrants using the treasury stock method.
F-24
Roadrunner Transportation Systems, Inc. and Subsidiaries
Notes to Consolidated Financial Statements — (Continued)
The Company had stock options and warrants outstanding of 1,629,105 and 3,037,447 as of December 31, 2017 and 2016, respectively, that were not included in the computation of diluted earnings (loss) per share because they were not assumed to be exercised under the treasury stock method or because they were anti-dilutive. All restricted stock units were anti-dilutive for the years ended December 31, 2017 and December 31, 2016. As of December 31, 2015, all stock options and warrants were included in the computation of diluted earnings (loss) per share. The following table reconciles basic weighted average common stock outstanding to diluted weighted average common stock outstanding (in thousands):
Year Ended December 31, | ||||||||
2017 | 2016 | 2015 | ||||||
Basic weighted average common stock outstanding | 38,405 | 38,318 | 38,179 | |||||
Effect of dilutive securities: | ||||||||
Stock Options | — | — | 72 | |||||
Warrants | — | — | 885 | |||||
Restricted Stock Units | — | — | 44 | |||||
Diluted weighted average common stock outstanding | 38,405 | 38,318 | 39,180 | |||||
11. Income Taxes
The components of the Company’s (benefit from) provision for income taxes were as follows (in thousands):
Year Ended December 31, | |||||||||||
2017 | 2016 | 2015 | |||||||||
Current: | |||||||||||
Federal | $ | — | $ | (23,500 | ) | $ | 10,931 | ||||
State, local, and foreign | 1,875 | 660 | 3,627 | ||||||||
Deferred: | |||||||||||
Federal | (27,118 | ) | (39,695 | ) | 1,874 | ||||||
State, local, and foreign | 52 | (3,746 | ) | 880 | |||||||
(Benefit from) provision for income taxes | $ | (25,191 | ) | $ | (66,281 | ) | $ | 17,312 | |||
The Company’s (benefit from) provision for income taxes varied from the amounts calculated by applying the U.S. statutory income tax rate to the pretax (loss) income as shown in the following reconciliations (in thousands):
Year Ended December 31, | |||||||||||
2017 | 2016 | 2015 | |||||||||
Statutory federal rate | $ | (40,732 | ) | $ | (149,310 | ) | $ | 15,026 | |||
Interest expense - preferred stock | 20,459 | — | — | ||||||||
State income taxes — net of federal benefit | (1,465 | ) | (5,368 | ) | 1,294 | ||||||
Gain on sale of Unitrans | (1,161 | ) | — | — | |||||||
Goodwill impairment | 1,020 | 86,776 | — | ||||||||
Effect of change in U.S. statutory income tax rate | (7,413 | ) | — | — | |||||||
Change in valuation allowance | 1,989 | 1,624 | 99 | ||||||||
Other | 2,112 | (3 | ) | 893 | |||||||
Total | $ | (25,191 | ) | $ | (66,281 | ) | $ | 17,312 | |||
The Company recorded assets for refundable current federal and state income taxes of $14.7 million and $40.8 million as of December 31, 2017 and 2016, respectively. These are classified as income tax receivable.
F-25
Roadrunner Transportation Systems, Inc. and Subsidiaries
Notes to Consolidated Financial Statements — (Continued)
The tax rate effects of temporary differences that give rise to significant elements of deferred tax assets and deferred tax liabilities as of December 31 were as follows (in thousands):
2017 | 2016 | ||||||
Deferred income tax assets: | |||||||
Accounts receivable | $ | 2,694 | $ | 7,140 | |||
Accrued expenses and other current liabilities | 13,103 | 18,823 | |||||
Net operating losses and other tax carryforwards | 18,715 | 3,358 | |||||
Other, net | 51 | 746 | |||||
Total | $ | 34,563 | $ | 30,067 | |||
Valuation allowance | (3,942 | ) | (1,953 | ) | |||
Total, net of valuation allowance | $ | 30,621 | $ | 28,114 | |||
Deferred income tax liabilities: | |||||||
Prepaid expenses and other current assets | $ | (2,906 | ) | $ | (6,572 | ) | |
Goodwill and intangible assets | (11,685 | ) | (20,005 | ) | |||
Property and equipment | (30,312 | ) | (45,711 | ) | |||
Total | $ | (44,903 | ) | $ | (72,288 | ) | |
Net deferred tax liabilities | $ | (14,282 | ) | $ | (44,174 | ) | |
The net noncurrent deferred income tax liability of $14.3 million as of December 31, 2017 and $44.2 million as of December 31, 2016 (net of current deferred tax assets and related valuation allowance) is classified as deferred tax liabilities.
Management assesses the available positive and negative evidence to estimate whether sufficient future taxable income will be generated to permit use of the existing deferred tax assets, including through reversals of existing cumulative temporary differences. A significant piece of objective evidence evaluated was the cumulative loss incurred over the three-year period ended December 31, 2017 (for consolidated federal and state income tax returns). Similarly, cumulative losses over the three years ended December 31, 2017 and December 31, 2016 were considered for separate company state and local tax returns filed by certain subsidiaries. Such objective evidence limits the ability to consider other subjective evidence, such as the Company's projections for future growth. On the basis of the Company's evaluation, the Company has recorded a valuation allowance of $3.9 million and $2.0 million as of December 31, 2017 and 2016, respectively, primarily related to state net operating loss carryforwards and other deferred tax assets that will not “more likely than not” be realized in the future. No valuation allowance has been recorded against the federal net operating loss carryforward deferred tax asset.
Federal net operating loss carryforwards (some of which are subject to annual Section 382 limitations) expire between 2030 and 2037. State net operating loss carryforwards expire between 2019 and 2037.
F-26
Roadrunner Transportation Systems, Inc. and Subsidiaries
Notes to Consolidated Financial Statements — (Continued)
The change to the Company's gross unrecognized tax benefits for the years ended December 31 is reconciled as follows (in thousands):
2017 | 2016 | ||||||
Balance as of January 1 | $ | 737 | $ | — | |||
Additions based on current year tax positions | — | — | |||||
Additions for prior years' tax positions | 574 | 737 | |||||
Reductions for prior years' tax positions | — | — | |||||
Settlements with taxing authorities | — | — | |||||
Lapse of statute of limitations | — | — | |||||
Balance as of December 31 | $ | 1,311 | $ | 737 | |||
Depending on specific facts, the above amounts may be reflected in the consolidated balance sheets either (a) as a reduction to income tax receivable; (b) as a reduction to net operating loss deferred tax assets, which are presented netted against deferred tax liabilities; or (c) within other long-term liabilities. The entire amount of unrecognized tax benefits would affect the effective tax rate. Interest and penalties related to uncertain tax benefits were $0.3 million and $0.1 million for 2017 and 2016, respectively, and are included within the (benefit from) provision for income taxes. Accrued interest and penalties were $0.4 million and $0.1 million as of December 31, 2017 and 2016, respectively.
The Company is subject to federal and state tax examinations for all tax years subsequent to December 31, 2012. The Internal Revenue Service (“IRS”) is currently reviewing the Company's 2013 federal tax return amendment and 2014-2016 federal tax returns. The Company has extended the federal period of limitations to assess tax for the 2014 and 2015 tax years through March 31, 2020. Although pre-2013 years are generally no longer subject to examinations by the IRS and various state taxing authorities, certain state net operating loss carryforwards generated in those years may still be adjusted upon examination by the IRS or state taxing authorities if they were used after 2012 or will be used in a future period.
On December 22, 2017, the Tax Cuts and Jobs Act was signed into law, and most changes are effective as of January 1, 2018. The law includes various provisions that will affect corporations, including a reduction of the corporate income tax rate from a 35% maximum rate to a 21% flat rate, enhanced “bonus depreciation” for capital equipment purchases, limitations on interest expense deductions, changes to net operating loss carryback and carryforward rules, and changes to U.S. taxation of foreign profits. The corporate tax rate reduction resulted in a $7.4 million discrete tax benefit during the year ended December 31, 2017 as a result of recalculating the carrying value of the Company's deferred tax assets and liabilities. Additionally, the Company reduced its net operating loss deferred tax asset by $0.4 million as a result of the one-time deemed repatriation of foreign subsidiary earnings.
12. Guarantees
The Company provides a guarantee for a portion of the value of certain independent contractors' (“IC”) leased tractors. The guarantees expire at various dates through 2021. The potential maximum exposure under these lease guarantees was approximately $10.6 million as of December 31, 2017. Upon an IC default, the Company has the option to purchase the tractor or return the tractor to the leasing company if the residual value is greater than the Company’s guarantee. Alternatively, the Company can contract another IC to assume the lease. The Company estimated the fair value of its liability under this on-going guarantee to be $1.4 million and $1.6 million as of December 31, 2017 and 2016, respectively, and it is included in accrued expenses and other current liabilities.
In the fourth quarter of 2016, the Company began to offer a lease purchase program that did not include a guarantee, and offered newer equipment under factory warranty that was more cost effective. ICs began electing the newer lease purchase program over the legacy lease guarantee programs which led to an increase in unseated legacy tractors. In late 2016, management committed to a plan to divest of these older assets and recorded a loss reserve of $8.9 million as of December 31, 2016. The loss reserve for the guarantee and reconditioning costs associated with the planned divestiture was $1.8 million as of December 31, 2017, which is included in accrued expenses and other current liabilities.
The Company paid $9.0 million and $9.3 million under these lease guarantees during the year ended December 31, 2017 and 2016, respectively.
F-27
13. Commitments and Contingencies
Employee Benefit Plans
The Company sponsors defined contribution profit sharing plans for substantially all employees of the Company and its subsidiaries. The Company provides matching contributions on some of these plans. Total expense under these plans was $2.5 million, $2.4 million, and $2.8 million for the years ended December 31, 2017, 2016, and 2015, respectively.
Operating Leases
The Company leases terminals, office space, trucks, trailers, and other equipment under noncancelable operating leases expiring on various dates through 2027. The Company incurred rent expense from operating leases of $83.4 million, $72.8 million, and $66.6 million for the years ended December 31, 2017, 2016, and 2015, respectively.
Aggregate future minimum lease payments under noncancelable operating leases with an initial term in excess of one year were as follows as of December 31, 2017 (in thousands):
Year Ending: | Amount | |||
2018 | $ | 51,490 | ||
2019 | 38,558 | |||
2020 | 26,735 | |||
2021 | 17,948 | |||
2022 | 16,202 | |||
Thereafter | 23,285 | |||
Total | $ | 174,218 | ||
Contingencies
In the ordinary course of business, the Company is a defendant in several legal proceedings arising out of the conduct of its business. These proceedings include claims for property damage or personal injury incurred in connection with the Company’s services. Although there can be no assurance as to the ultimate disposition of these proceedings, the Company does not believe, based upon the information available at this time, that these property damage or personal injury claims, in the aggregate, will have a material impact on its consolidated financial statements. The Company maintains an aggregate of $100 million of auto liability and general liability insurance. The Company maintains auto liability insurance coverage for claims in excess of $1.0 million per occurrence and cargo coverage for claims in excess of $100,000 per occurrence. The Company is self-insured up to $1.0 million per claim for workers compensation. The Company believes it has adequate insurance to cover losses in excess of the self-insured and deductible amounts. As of December 31, 2017 and 2016, the Company had reserves for estimated uninsured losses of $28.4 million and $21.5 million, respectively, included in accrued expenses and other current liabilities.
Jeffrey Cox and David Chidester filed a Complaint against certain of the Company’s subsidiaries in state court in California in a post-acquisition dispute. The Complaint alleges contract, statutory and tort based claims arising out of the Stock Purchase Agreement, dated November 2, 2012, between the defendants, as buyers, and the plaintiffs, as sellers, for the purchase of the shares of Central Cal Transportation, Inc. and Double C Transportation, Inc. (the “Central Cal Agreement”). The plaintiffs claim that a contingent purchase obligation payment is due and owing pursuant to the Central Cal Agreement, and that defendants have furnished fraudulent calculations to the plaintiffs to avoid payment. The plaintiffs also claim violations of California’s Labor Code related to the plaintiffs’ respective employment with Central Cal Transportation, LLC. On October 27, 2017, the state court granted the Company’s motion to compel arbitration of all non-employment claims alleged in the Complaint. The plaintiffs are now required to comply with the dispute resolution process outlined in the Central Cal Agreement, and submit the dispute to a Settlement Accountant. In February 2018, Plaintiff David Chidester agreed to dismiss his employment-related claims from the Los Angeles Superior Court matter, while Plaintiff Jeffrey Cox transferred his employment claims from Los Angeles Superior Court to the related employment case pending in the Eastern District of California. The parties are proceeding with discovery.
In addition to the legal proceeding described above, the Company is a defendant in various purported class-action lawsuits alleging violations of various California labor laws and one purported class-action lawsuit alleging violations of the Illinois Wage Payment and Collection Act. Additionally, the California Division of Labor Standards and Enforcement has brought administrative actions against the Company alleging that the Company violated various California labor laws. In 2017 and 2018, the Company reached settlement agreements on a number of these labor related lawsuits and administrative actions. As of December 31, 2017
F-28
and December 31, 2016, the Company recorded a reserve for settlements, litigation, and defense costs related to these labor matters and post-acquisition disputes of approximately $13.2 million and $10.4 million, respectively, which are recorded in accrued expenses and other current liabilities.
Following the Company's press release on January 30, 2017, three putative class actions were filed in the United States District Court for the Eastern District of Wisconsin against the Company and its former officers, Mark A. DiBlasi and Peter R. Armbruster. On May 19, 2017, the Court consolidated the actions under the caption In re Roadrunner Transportation Systems, Inc. Securities Litigation (Case No. 17-cv-00144), and appointed Public Employees’ Retirement System as lead plaintiff. On March 12, 2018, the lead plaintiff filed a Consolidated Amended Complaint (“CAC”) on behalf of a class of persons who purchased the Company’s common stock between March 14, 2013 and January 30, 2017, inclusive. The CAC alleges (i) the Company and Messrs. DiBlasi and Armbruster violated Section 10(b) of the Exchange Act and Rule 10b-5, and (ii) Messrs. DiBlasi and Armbruster, the Company’s former Chairman Scott Rued, HCI Equity Partners, L.L.C., and HCI Equity Management, L.P. violated Section 20(a) of the Exchange Act, by making or causing to be made materially false or misleading statements, or failing to disclose material facts, regarding (a) the accuracy of the Company’s financial statements; (b) the Company’s true earnings and expenses; (c) the effectiveness of the Company’s disclosure controls and controls over financial reporting; (d) the true nature and depth of financial risk associated with the Company’s tractor lease guaranty program; (e) the Company’s leverage ratios and compliance with its credit facilities; and (f) the value of the goodwill the Company carried on its balance sheet. The CAC seeks certification as a class action, compensatory damages, and attorney’s fees and costs. The parties are currently engaged in mediation.
On May 25, 2017, Richard Flanagan filed a complaint alleging derivative claims on the Company's behalf in the Circuit Court of Milwaukee County, State of Wisconsin (Case No. 17-cv-004401) against Scott Rued, Mark DiBlasi, Christopher Doerr, John Kennedy, III, Brian Murray, James Staley, Curtis Stoelting, William Urkiel, Judith Vijums, Michael Ward, Chad Utrup, Ivor Evans, Peter Armbruster, and Brian van Helden. Count I of the Complaint alleges the Director Defendants breached their fiduciary duties by “knowingly failing to ensure that the Company implemented and maintained adequate internal controls over its accounting and financial reporting functions,” and seeks unspecified damages. Count II of the Complaint alleges the Officer Defendants DiBlasi, Armbruster, and van Helden received substantial performance-based compensation and bonuses for fiscal year 2014 that should be disgorged. The action has been stayed by agreement pending a decision on an anticipated motion to dismiss the Amended Complaint filed in the securities class action described above. The parties are currently engaged in mediation.
On June 28, 2017, Jesse Kent filed a complaint alleging derivative claims on the Company's behalf and class action claims in the United States District Court for the Eastern District of Wisconsin. On December 22, 2017, Chester County Employees Retirement Fund filed a Complaint alleging derivative claims on the Company's behalf in the United States District Court for the Eastern District of Wisconsin. On March 21, 2018, the Court entered an order consolidating the Kent and Chester County actions under the caption In re Roadrunner Transportation Systems, Inc. Stockholder Derivative Litigation (Case No. 17-cv-00893). On March 28, 2018, Plaintiffs filed their Verified Consolidated Shareholder Derivative Complaint alleging claims on behalf of the Company against Peter Armbruster, Mark DiBlasi, Scott Dobak, Christopher Doerr, Ivor Evans, Brian van Helden, John Kennedy III, Ralph Kittle, Brian Murray, Scott Rued, James Staley, Curtis Stoelting, William Urkiel, Chad Utrup, Judith Vijums, and Michael Ward. Count I alleges that several of the Defendants violated Section 14(a) of the Exchange Act and Rule 14a-9 based upon alleged misrepresentations and omissions in several of the Company’s proxy statements. Count II alleges that all the Defendants breached their fiduciary duty. Count III alleges that all the Defendants wasted corporate assets. Count IV alleges that certain of the Defendants were unjustly enriched. The Complaint seeks monetary damages, improvements to the Company’s corporate governance and internal procedures, an accounting from Defendants of the damages allegedly caused by them and the improper amounts the Defendants allegedly obtained, and punitive damages. The parties are currently engaged in mediation.
In addition, subsequent to the Company's announcement that certain previously filed financial statements should not be relied upon, the Company was contacted by the SEC, FINRA, and the Department of Justice. The Department of Justice and Division of Enforcement of the SEC have commenced investigations into the events giving rise to the restatement. The Company has received formal requests for documents and other information. In addition, in June 2018 two of the Company's former employees were indicted on charges of conspiracy, securities fraud, and wire fraud as part of the ongoing DOJ and SEC investigation. The Company is cooperating fully with the joint DOJ and SEC investigation.
Given the status of the matters above, the Company is unable to reasonably estimate the potential costs or range or costs at this time.
14. Related Party Transactions
F-29
Roadrunner Transportation Systems, Inc. and Subsidiaries
Notes to Consolidated Financial Statements — (Continued)
The Company had an advisory agreement with HCI to pay transaction fees and an annual advisory fee of $0.1 million. The Company owed $0.1 million to HCI for advisory services and travel expenses for the year ended December 31, 2016 and paid an aggregate of $0.2 million to HCI for services performed in connection with the sixth amended and restated credit agreement, advisory fees, and travel expenses during the year ended December 31, 2016. On May 2, 2017, the Company and HCI entered into a Termination Agreement in which HCI waived the Company’s payment of any and all unpaid fees and expenses accrued under the advisory agreement through May 2, 2017.
The Investment Agreement with Elliott required the Company to pay Elliott a daily payment in an amount equal to $33,333.33 per calendar day from the closing date until the Refinancing Date. The Company paid $2.7 million under this agreement for the year ended December 31, 2017.
The Company, as part of the $293.0 million redemption of its Series F Preferred Stock ($240.5 million) and a portion of its Series E Preferred Stock ($52.5 million), paid to Elliott $6.0 million in early redemption premiums for the year ended December 31, 2017. The Company also paid to Elliot $15.2 million in dividends on its preferred stock.
One of the Company's operating companies contracts with certain purchased transportation providers that are owned by employees of that operating company. The Company paid an aggregate of $13.6 million and $8.3 million to these carriers during the years ended December 31, 2017 and 2016, respectively.
The Company has a number of facility leases with related parties and paid an aggregate of $3.2 million and $3.7 million under these leases during the years ended December 31, 2017 and 2016, respectively.
The Company owns 37.5% of CML which operates as one of the Company's brokerage agents. The Company paid CML broker commissions of $2.7 million and $2.2 million during the years ended December 31, 2017 and 2016, respectively.
The Company has a jet fuel purchase agreement with a related party and paid an aggregate of $1.8 million under this agreement during the year ended December 31, 2017.
During 2016, the Company entered into and completed a sale leaseback transaction to sell a combined office and warehouse facility to an entity controlled by a former owner and current manager of an operating company for a total sale price of $3.5 million.
The Company leases certain equipment through leasing companies owned by related parties and paid an aggregate of $1.5 million and $0.9 million during the years ended December 31, 2017 and 2016, respectively.
15. Segment Reporting
The Company determines its segments based on the information utilized by the chief operating decision maker, the Company’s Chief Executive Officer, to allocate resources and assess performance. Based on this information, the Company has determined that it has three segments: TL, LTL, and Ascent.
These segments are strategic business units through which the Company offers different services. The Company evaluates the performance of the segments primarily based on their respective revenues and operating results. Accordingly, interest expense and other non-operating items are not reported in segment results. In addition, the Company has disclosed corporate, which is not a segment and primarily includes legal expenses, lease purchase guarantee reserve expenses, acquisition transaction expenses, corporate salaries, and share-based compensation expense.
One direct customer, General Motors, accounted for approximately 12% of revenue, or approximately $245.4 million and $252.1 million, within the Company's TL segment, for the years ended December 31, 2017 and 2016. No single direct customer accounted for more than 10% of revenue for the year ended December 31, 2015.
F-30
Roadrunner Transportation Systems, Inc. and Subsidiaries
Notes to Consolidated Financial Statements — (Continued)
The following table reflects certain financial data of the Company’s segments (in thousands):
Year Ended December 31, | |||||||||||
2017 | 2016 | 2015 | |||||||||
Revenues: | |||||||||||
TL | $ | 1,304,833 | $ | 1,246,798 | $ | 1,128,390 | |||||
LTL | 463,519 | 461,540 | 515,328 | ||||||||
Ascent | 328,318 | 335,510 | 377,137 | ||||||||
Eliminations | (5,379 | ) | (10,648 | ) | (28,689 | ) | |||||
Total | $ | 2,091,291 | $ | 2,033,200 | $ | 1,992,166 | |||||
Impairment charges: | |||||||||||
TL | $ | — | $ | 159,118 | $ | — | |||||
LTL | — | 197,312 | — | ||||||||
Ascent | 4,402 | 17,231 | — | ||||||||
Total | $ | 4,402 | $ | 373,661 | $ | — | |||||
Operating (loss) income: | |||||||||||
TL | $ | 6,481 | $ | (164,100 | ) | $ | 48,717 | ||||
LTL | (26,383 | ) | (203,600 | ) | 15,438 | ||||||
Ascent | 21,697 | 8,143 | 28,268 | ||||||||
Corporate(1) | (38,247 | ) | (44,217 | ) | (30,052 | ) | |||||
Total | (36,452 | ) | (403,774 | ) | 62,371 | ||||||
Interest expense | 64,049 | 22,827 | 19,439 | ||||||||
Loss on early extinguishment of debt | 15,876 | — | — | ||||||||
(Loss) income before income taxes | $ | (116,377 | ) | $ | (426,601 | ) | $ | 42,932 | |||
Depreciation and amortization: | |||||||||||
TL | $ | 26,912 | $ | 27,622 | $ | 22,587 | |||||
LTL | 4,353 | 4,052 | 2,801 | ||||||||
Ascent | 4,588 | 4,938 | 4,903 | ||||||||
Corporate | 1,894 | 1,533 | 1,335 | ||||||||
Total | $ | 37,747 | $ | 38,145 | $ | 31,626 | |||||
Capital expenditures: | |||||||||||
TL | $ | 12,415 | $ | 9,630 | $ | 48,527 | |||||
LTL | 1,641 | 4,051 | 11,367 | ||||||||
Ascent | 815 | 3,813 | 429 | ||||||||
Corporate | 6,839 | 79 | 2,078 | ||||||||
Total | $ | 21,710 | $ | 17,573 | $ | 62,401 | |||||
(1) Gain from sale of Unitrans of $35.4 million is included within Corporate for the year ended December 31, 2017.
F-31
Roadrunner Transportation Systems, Inc. and Subsidiaries
Notes to Consolidated Financial Statements — (Continued)
December 31, | |||||||||||
2017 | 2016 | 2015 | |||||||||
Total assets: | |||||||||||
TL | $ | 506,009 | $ | 498,330 | $ | 656,491 | |||||
LTL | 79,065 | 129,899 | 330,203 | ||||||||
Ascent | 226,944 | 302,164 | 317,453 | ||||||||
Corporate | 65,193 | 4,189 | 8,057 | ||||||||
Eliminations (1) | (1,168 | ) | (1,028 | ) | (4,451 | ) | |||||
Total | $ | 876,043 | $ | 933,554 | $ | 1,307,753 | |||||
(1) Eliminations represents intercompany trade receivable balances between the three segments.
16. Subsequent Events
ABL Facility Amendments
On January 30, 2018, the Company entered into a Second Amendment to the ABL Facility. Pursuant to the Second Amendment the ABL Facility was further amended to, among other things: (i) permit the Company to enter into an investment agreement with Elliott providing for the issuance of up to $52.5 million of preferred stock; and (ii) increase the applicable margin related to the term loan facility to LIBOR Rate plus 2.25% or Base Rate plus 1.25%.
On March 14, 2018, the Company entered into a Third Amendment to the ABL Facility. Pursuant to the Third Amendment the ABL Facility was further amended to, among other things: (i) extend the date for delivery of the Company's consolidated financial statements for the first three quarters of 2017 (unaudited) until April 30, 2018; (ii) extend the date for delivery of the Company's consolidated financial statements for fiscal year 2017 (audited) until June 30, 2018; (iii) expand the permitted amount of capital leases and purchase money indebtedness from $35.0 million to $60.0 million; (iv) require us to pay for a new appraisal to be conducted by the administrative agent for the equipment pledged for the term loan within 60 days; (v) establish an additional availability reserve; and (vi) impose certain collateral reporting requirements.
Series E-1 Investment Agreement and related issuances
On March 1, 2018, the Company entered into the Series E-1 Investment Agreement with Elliott, pursuant to which the Company agreed to issue and sell to Elliott from time to time until July 30, 2018, an aggregate of up to 54,750 shares of a newly created class of Series E-1 Preferred Stock at a purchase price of $1,000 per share for the first 17,500 shares of Series E-1 Preferred Stock, $960 per share for the next 18,228 shares of Series E-1 Preferred Stock, and $920 per share for the final 19,022 shares of Series E-1 Preferred Stock. On March 1, 2018, the parties held an initial closing pursuant to which the Company issued and sold to Elliott 17,500 shares of Series E-1 Preferred Stock for an aggregate purchase price of $17.5 million. The proceeds of the sale of such shares of Series E-1 Preferred Stock were used to provide working capital to support the Company’s operations and future growth and to repay a portion of the indebtedness under our ABL Facility as required by the credit agreement governing that facility. On April 24, 2018, pursuant to the Series E-1 Investment Agreement with Elliott, the Company issued and sold to Elliott an additional 18,228 shares of Series E-1 Preferred Stock for an aggregate purchase price of $17.5 million. The proceeds of the sale of such shares of Series E-1 Preferred Stock were used to provide working capital to support the Company’s operations and future growth and to repay a portion of the indebtedness under the ABL Facility as required by the credit agreement governing that facility. Certain terms of the Series E-1 Preferred Stock are as follows:
Rank. The Series E-1 Preferred Stock, with respect to payment of dividends, redemption payments, rights (including as to the distribution of assets) upon liquidation, dissolution or winding up of the affairs of the Company, or otherwise, ranks (i) senior and prior to the Company’s common stock and other junior securities, and (ii) on parity with the Series B Preferred Stock, Series C Preferred Stock, Series D Preferred Stock, and the Series E Preferred Stock.
Liquidation Value. Each share of Series E-1 Preferred Stock has an initial liquidation preference equal to $1,000 per share, plus accrued and unpaid dividends on such share (the “Series E-1 Liquidation Value”).
Dividends. Dividends are cumulative from May 2, 2017, which was the date of the Company’s original issuance of shares of preferred stock to Elliott (such date, the “Original Issuance Date”), as a percentage of the Series E-1 Liquidation Value
F-32
Roadrunner Transportation Systems, Inc. and Subsidiaries
Notes to Consolidated Financial Statements — (Continued)
as and when declared by the Company’s Board of Directors and accrue and compound if not paid in cash. Dividends accrue daily and compound quarterly, subject to any adjustments for Triggering Events (as defined in the Series E-1 Certificate of Designations). The annual dividend rate for the shares of Series E-1 Preferred Stock is equal to the sum of (i) Adjusted LIBOR (as defined in the Series E-1 Certificate of Designations), plus (ii) 5.25% per annum, plus (iii) an additional rate of 8.5%. The dividend rate increases by 3.0% per annum above the rates described in the preceding sentence upon and during any Triggering Events. Holders of shares of Series E-1 Preferred Stock are not entitled to participate in dividends or distributions of any nature paid on or in respect of the Common Stock.
Redemption at Maturity. On the sixth anniversary of the Original Issuance Date, the Company will have the obligation to redeem all outstanding shares of Series E-1 Preferred Stock for cash at the Series E-1 Liquidation Value.
Optional Redemption. The Company may redeem the shares of Series E-1 Preferred Stock at any time. The redemption of shares of Series E-1 Preferred Stock shall be at a purchase price per share, payable in cash, equal to (i) in the case of a an optional redemption effected on or after the 24 month anniversary of the Original Issuance Date, the Series E-1 Liquidation Value, (ii) in the case of an optional redemption effected on or after the 12 month anniversary of the Original Issuance Date and prior to the 24 month anniversary of the Original Issuance Date, 103.5% of the Series E-1 Liquidation Value and (iii) in the case of an optional redemption effected prior to the 12 month anniversary of the Original Issuance Closing Date, 106.5% of the Series E-1 Liquidation Value.
Change of Control. Upon the occurrence of a Change of Control (as defined in the Series E-1 Certificate of Designations), the holders of Series E-1 Preferred Stock may require redemption by the Company of the Series E-1 Preferred Stock at a purchase price per share, payable in cash, equal to either (i) 106.5% of the Series E-1 Liquidation Value if the Change of Control occurs prior to the 24 month anniversary of the Original Issuance Date, or (ii) the Series E-1 Liquidation Value if the Change of Control occurs after the 24 month anniversary of the Original Issuance Date.
Voting. The holders of Series E-1 Preferred Stock will generally not be entitled to vote on any matters submitted to a vote of the stockholders of the Company. So long as any shares of Series E-1 Preferred Stock are outstanding, the Company may not take certain actions without the prior approval of the Preferred Requisite Vote, voting as a separate class.
F-33