Attached files
| file | filename |
|---|---|
| 8-K - 8-K - TCF FINANCIAL CORP | a12-7018_18k.htm |
| EX-99.1 - EX-99.1 - TCF FINANCIAL CORP | a12-7018_1ex99d1.htm |
Exhibit 99.2
|
|
Balance Sheet Repositioning Investor Presentation |
|
|
Index Overview of Transaction Backdrop for transaction / evolution of TCF Transaction details Transaction rationale / impact 1Q12 Mid-Quarter Update Conclusion Questions and Answers |
|
|
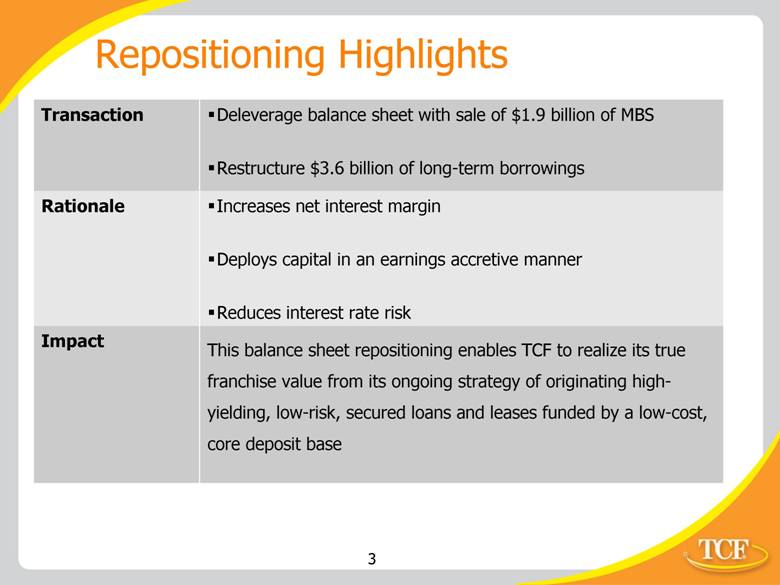
Repositioning Highlights Transaction Deleverage balance sheet with sale of $1.9 billion of MBS Restructure $3.6 billion of long-term borrowings Rationale Increases net interest margin Reduces interest rate risk Impact This balance sheet repositioning enables TCF to realize its true franchise value from its ongoing strategy of originating high-yielding, low-risk, secured loans and leases funded by a low-cost, core deposit base Deploys capital in an earnings accretive manner |
|
|
Evolution of TCF and Shifting Backdrop Asset growth as part of TCF’s evolution is primarily coming from: Inventory Finance Auto Finance Leasing and Equipment Finance Interest rate environment Federal Reserve expects interest rates to remain at the current low levels through at least 2014 Long-term, fixed-rate debt originated at market rates prior to the economic crisis and the sustained drop in interest rates Rates on long-term borrowings were significantly above current market rates Revenue Focused on growth and quality of net interest income and net interest margin Increased pressure on banking fee revenue |

|
|
Variable Rate and Short Duration Assets Driving Growth Strategy Previous Strategy Focused on loans and investments secured by real estate assets with longer durations (residential loans, commercial loans and mortgage-backed securities) Reliance on long-term, fixed-rate debt was appropriate Current Strategy Growth in nationally-oriented specialty finance assets with: Variable rates – Inventory Finance Short duration, fixed rates Leasing and Equipment Finance Auto Finance A more flexible funding structure significantly increases TCF’s ability to maximize net interest income and net interest margin |
|
|
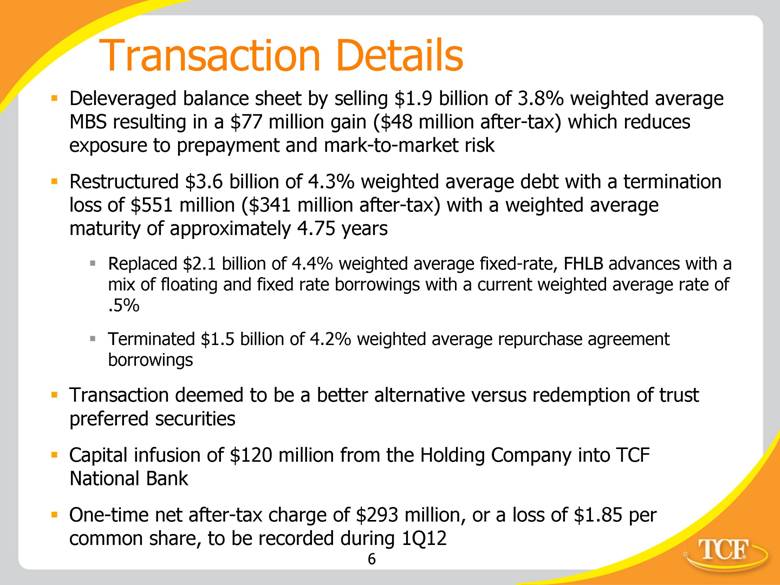
Transaction Details Deleveraged balance sheet by selling $1.9 billion of 3.8% weighted average weighted average weighted average weighted average weighted average MBS resulting in a $77 million gain ($48 million after-tax) which reduces exposure to prepayment and mark-to-market risk Restructured $3.6 billion of 4.3% debt with a termination loss of $551 million ($341 million after-tax) with a weighted average maturity of approximately 4.75 years Replaced $2.1 billion of 4.4% fixed-rate, FHLB advances with a mix of floating and fixed rate borrowings with a current rate of .5% Terminated $1.5 billion of 4.2% repurchase agreement borrowings Transaction deemed to be a better alternative versus redemption of trust preferred securities Capital infusion of $120 million from the Holding Company into TCF National Bank One-time net after-tax charge of $293 million, or a loss of $1.85 per common share, to be recorded during 1Q12 |
|
|
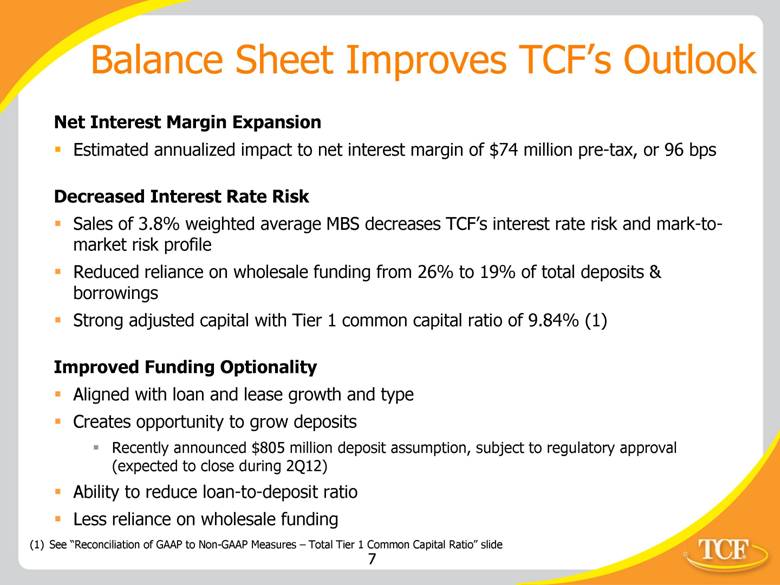
Balance Sheet Improves TCF’s Outlook Net Interest Margin Expansion Estimated annualized impact to net interest margin of $74 million pre-tax, or 96 bps Decreased Interest Rate Risk Sales of 3.8% weighted average MBS decreases TCF’s interest rate risk and mark-to-market risk profile Reduced reliance on wholesale funding from 26% to 19% of total deposits & borrowings Strong adjusted capital with Tier 1 common capital ratio of 9.84% Improved Funding Optionality Aligned with loan and lease growth and type Creates opportunity to grow deposits Recently announced $805 million deposit assumption, subject to regulatory approval (expected to close during 2Q12) Ability to reduce loan-to-deposit ratio Less reliance on wholesale funding (1) (1) See "Reconciliation of Non-GAAP Measures - Total Tier 1 Common Capital Ratio" slide |
|
|
Variable and Short-term Long-Term Fixed-Rate 100% Down 33% 34% 66% 12/31/2011 12/31/11 Adjusted 4Q11 4Q11 Adjusted 12/31/2011 12/31/11 Adjusted Total Assets Annualized. Adjusted data reflects normalized annual run-rate as if the transaction Occurred at the beginning of 4Q11 Transaction Improves Balance Sheet Flexibility Increased flexibility around Wholesale funding Deleveraging of Balance Sheet $4.4 $2.9 $19.0 $17.0 Wholesale Borrowings as a % of total deposits & borrowings 12/31/11: 26% Adjusted: 19% ($ Billions) $1.9 $1.0 Rate 4.26% 1.39% Increased forward earning potential (1) 3.92% 4.83% Interest Margin % Down 11% Asset and liability liquidity levels remain strong Annualized Margin Benefit Deleverage of Balance Sheet $(69) Repurchase Agreement Debt Termination 63 FHLB Advance Termination 91 FHLB Advance New Issuance (11) Net Margin Improvement 74 Potential Sub-debt Issuance (9) Normalized Annual Run Rate $65 ($ Millions) (2) In anticipation of 2012 balance sheet growth (impact shown is annualized) (2) |

|
|
Capital Ratios Remain Strong (1) Includes net after-tax cost of the transaction and assumes that the reduction in average assets included the impact of the deleveraged balance sheet for the entire period (2) The well-capitalized requirements are determined by the Federal Reserve for TCF and by the OCC for TCF Bank pursuant to the FDIC Improvement Act of 1991 (3) See “Reconciliation of GAAP to Non-GAAP Measures – Tangible Realized Common Equity” slide (4) See “Reconciliation of GAAP to Non-GAAP Measures – Total Tier 1 Common Capital Ratio” slide Dec. 31, 2011 Dec. 31, 2011 Adjusted (1) Well-Capitalized (2) TCF Financial Corporation TCF National Bank Dec. 31, 2011 Dec. 31, 2011 Adjusted (1) Well-Capitalized (2) Tangible Realized Common Eq. / TA (3) 8.42 % 7.67 % Tier 1 Common (4) 11.74 % 9.84 % Tier 1 Leverage 9.15 % 8.45 % Tier 1 Risk-Based Capital 12.67 % 10.80 % 6.00 % Total Risk-Based Capital 14.80 % 12.96 % 10.00 % Tier 1 Leverage 8.33 % 8.25 % 5.00 % Tier 1 Risk-Based Capital 11.53 % 10.54 % 6.00 % Total Risk-Based Capital 13.67 % 12.71 % 10.00 % |

|
|
1Q12 Mid-Quarter Update Loan and Lease Growth Inventory Finance Expected 1Q12 growth of approximately $800 million on ending balances Auto Finance December 2011 (one month only) loan originations of $33 million 1Q12 originations expected to exceed $150 million Leasing and Equipment Finance 1Q12 loan originations expected to increase approximately 15 percent year-over-year Banking Fees Update Expect continued pressure on fees due to first quarter seasonality, customer behavior changes and negative momentum of changes to the account structure implemented in 4Q11 March 2012 rollout of customer choice checking account structure expected to result in less account attrition and allow for continued account growth over the long-term Credit Quality As previously mentioned, credit costs will remain elevated during the first half of 2012 |
|
|
Conclusion Provides funding flexibility needed to optimize current asset growth and diversification strategy Better positions TCF for today’s interest rate outlook Increases future earnings potential Maintains strong capital ratios Reduces interest rate risk tied to longer duration, fixed-rate securities The resulting balance sheet better positions TCF and its stockholders for long-term success |
|
|
Appendix |
|
|
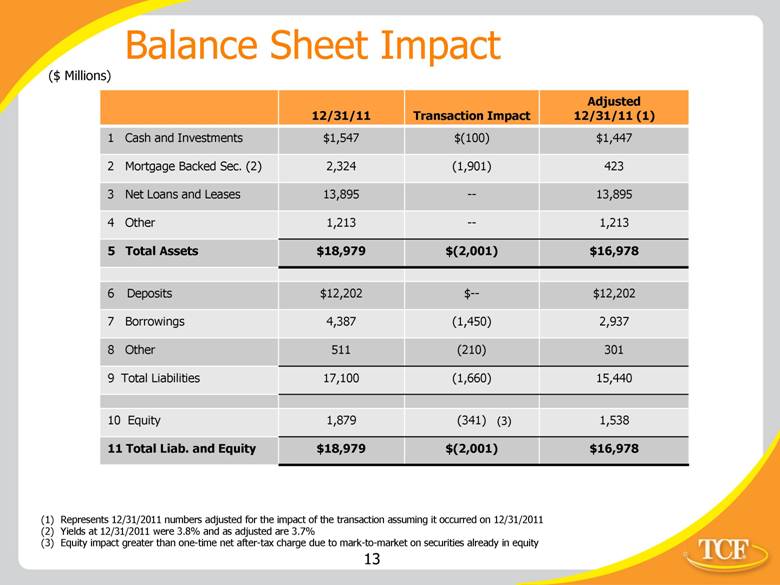
12/31/11 Transaction Impact Adjusted 12/31/11 (1) 1 Cash and Investments $1,547 $(100) $1,447 2 Mortgage Backed Sec. (2) 2,324 (1,901) 423 3 Net Loans and Leases 13,895 -- 13,895 4 Other 1,213 -- 1,213 5 Total Assets $18,979 $(2,001) $16,978 6 Deposits $12,202 $-- $12,202 7 Borrowings 4,387 (1,450) 2,937 8 Other 511 (210) 301 9 Total Liabilities 17,100 (1,660) 15,440 10 Equity 1,879 (341) 1,538 11 Total Liab. and Equity $18,979 $(2,001) $16,978 Represents 12/31/2011 numbers adjusted for the impact of the transaction assuming it occurred on 12/31/2011 Yields at 12/31/2011 were 3.8% and as adjusted are 3.7% Equity impact greater than one-time net after-tax charge due to mark-to-market on securities already in equity ($ Millions) Balance Sheet Impact (3) |
|
|
Cost of Borrowings December 31, 2011 Impact of Transaction Adjusted Adjusted Year of Weighted Debt New With New Weighted Maturity Amount Rate Termination Borrowings Borrowings Rate 1 Variable-rate FHLB advances 2013 $ - - $ - $ 280,000 $ 280,000 0.40% 2 2014 - - - 448,000 448,000 0.45% 4 2015 - - - 125,000 125,000 0.46% 4 Subtotal $ - - - $ 853,000 $ 853,000 0.43% 5 Fixed-rate FHLB advances and repurchase agreements 2013 400,000 0.97% - - 400,000 0.97% 6 2015 900,000 4.18% (900,000) - - - 7 2016 1,100,000 4.49% (1,100,000) 297,000 297,000 1.12% 8 2017 1,250,000 4.60% (1,250,000) - - - 9 2018 300,000 3.51% (300,000) - - - 10 Subtotal – fixed-rate advances and repurchase agreements 3,950,000 4.02% (3,550,000) 297,000 697,000 1.03% 11 Total – advances and repurchase agreements 3,950,000 4.02% (3,550,000) 1,150,000 1,150,000 0.70% 12 Subordinated bank notes 2014 71,020 2.21% - - 71,020 2.21% 13 2015 50,000 2.14% - - 50,000 2.14% 14 2016 74,661 5.63% - - 74,661 5.63% 15 Subtotal 195,681 3.49% - - 195,681 3.49% 16 Junior subordinated notes (trust preferred) 2068 114,236 12.83% - - 114,236 12.83% 17 Discounted lease rentals 121,747 5.25% - - 121,747 5.25% 18 Total long-term borrowings 4,381,664 4.26% (3,550,000) 1,150,000 1,981,664 1.96% 19 Short-term borrowings 6,416 0.10% - 950,000 956,416 0.29% 20 Total wholesale debt 4,388,080 4.26% (3,550,000) 2,100,000 2,938,080 1.42% |
|
|
(1) In contrast to GAAP-basis measures, tangible realized common equity excludes the effect of goodwill, other intangibles and accumulated other comprehensive income (loss). Management reviews tangible realized common equity as an ongoing measure and has included this information because of current interest in the industry. The methodology for calculating tangible realized common equity may vary between companies. Reconciliation of GAAP to Non-GAAP Measures – Tangible Realized Common Equity (1) Computation of total equity to total assets: Total equity $ 1,878,627 $ 1,537,447 Total assets $ 18,979,388 $ 16,978,153 Total equity to total assets 9.90 % 9.05 % Computation of tangible realized common equity to tangible assets Total equity $ 1,878,627 $ 1,537,447 Less: Non-controlling interest in subsidiaries 10,494 10,494 Total TCF stockholders’ equity 1,868,133 1,526,953 Less: Goodwill 225,640 225,640 Customer based intangibles 7,134 7,134 Accumulated other comprehensive income 56,826 9,145 Tangible realized common equity $ 1,578,533 $ 1,285,034 Total assets $ 18,979,388 $ 16,978,153 Less: Goodwill 225,640 225,640 Customer based intangibles 7,134 7,134 Tangible assets $ 18,746,614 $ 16,745,379 Total tangible realized common equity to tangible assets 8.42 % 7.67 % ($000s) Adjusted Dec. 31, 2011 |
|
|
Adjusted Total Tier 1 risk-based capital ratio: Total tier 1 capital $ 1,706,926 $ 1,413,427 Total risk-weighted assets $ 13,475,330 $ 13,090,580 Total tier 1 risk-based capital ratio 12.67 % 10.80 % Computation of tier 1 common capital ratio: Total tier 1 capital $ 1,706,926 $ 1,413,427 Less: Qualifying trust preferred securities 115,000 115,000 Qualifying non-controlling interest in subsidiaries 10,494 10,494 Preferred stock -- -- Total tier 1 common capital 1,581,432 1,287,933 Total risk-weighted assets $ 13,475,330 $ 13,090,580 Total tier 1 common capital ratio 11.74 % 9.84 % ($000s) Dec. 31, 2011 Reconciliation of GAAP to Non-GAAP Measures – Total Tier 1 Common Capital Ratio (1) (1) In contrast to GAAP-basis measures, the total tier 1 common capital ratio excludes the effect of qualifying trust preferred securities and qualifying non-controlling interest in subsidiaries. Management reviews the total tier 1 common capital ratio as an on-going measure and has included this information because of current interest in the industry. The methodology for calculating total tier 1 common capital may vary between companies. |
|
|
Cautionary Statement Any statements contained in this release regarding the outlook for TCF’s businesses and their respective markets, such as projections of future earnings performance, statements of TCF’s plans and objectives, forecasts of market trends and other matters, are forward-looking statements based on TCF’s assumptions and beliefs. Such statements may be identified by such words or phrases as “will likely result,” “are expected to,” “will continue,” “outlook,” “will benefit,” “is anticipated,” “estimate,” “project,” “management believes” or similar expressions. These forward-looking statements are subject to certain risks and uncertainties that could cause actual results to differ materially from those discussed in such statements and no assurance can be given that the results in any forward-looking statement will be achieved. For these statements, TCF claims the protection of the safe harbor for forward-looking statements contained in the Private Securities Litigation Reform Act of 1995. Any forward-looking statement speaks only as of the date on which it is made, and we disclaim any obligation to subsequently revise any forward-looking statement to reflect events or circumstances after such date or to reflect the occurrence of anticipated or unanticipated events. Certain factors could cause TCF’s future results to differ materially from those expressed or implied in any forward-looking statements contained in this release. These factors include the factors discussed in Part I, Item 1A of TCF’s 2011 Annual Report on Form 10-K under the heading “Risk Factors” and any other cautionary statements, written or oral, which may be made or referred to in connection with any such forward-looking statements. Since it is not possible to foresee all such factors, these factors should not be considered as complete or exhaustive. |