Attached files
| file | filename |
|---|---|
| 8-K - FORM 8-K - Knight-Swift Transportation Holdings Inc. | d287669d8k.htm |
Exhibit 99.1

January 25, 2011
Dear Fellow Stockholders,
We are pleased to announce that Swift Transportation Company (NYSE: SWFT) realized adjusted diluted earnings per share, or Adjusted EPS, of $0.29 for the fourth quarter ended December 31, 2011 (based on a diluted share count of 139.5 million), compared to $0.28 per share in the same quarter of 2010 (based on a diluted share count of 72.9 million). Diluted earnings (loss) per share for the fourth quarter of 2011 and 2010, in accordance with GAAP, was $0.26 per share and ($0.66) per share, respectively.
Adjusted EPS for the full year ending December 31, 2011 was $0.79 per share (based on a diluted share count of 139.7 million), compared to $0.02 per share in 2010 (based on a diluted share count of 63.3 million). Diluted earnings (loss) per share, in accordance with GAAP, for the full year ending December 31, 2011 and 2010 was $0.65 and ($1.98) respectively.
A reconciliation of GAAP results to non-GAAP results, as adjusted to exclude certain non-cash or special items, is provided in the schedules following this letter.
Fourth Quarter Results
A summary of our key results for the fourth quarter is shown below:
| Three Months Ended December 31, | ||||||||||||
| 2011 | 2010 | 2009 | ||||||||||
| Unaudited | ||||||||||||
| ($ in millions, except per share data) | ||||||||||||
| Operating Revenue |
$ | 860.7 | $ | 780.4 | $ | 668.3 | ||||||
| Net Revenue1 |
$ | 695.3 | $ | 661.6 | $ | 581.6 | ||||||
| Operating Ratio |
88.7 | % | 90.2 | % | 93.0 | % | ||||||
| Adjusted Operating Ratio |
85.5 | % | 84.3 | % | 90.4 | % | ||||||
| EBITDA |
$ | 153.0 | $ | 37.0 | $ | 110.6 | ||||||
| Adjusted EBITDA |
$ | 154.3 | $ | 155.4 | $ | 114.4 | ||||||
| Diluted EPS |
$ | 0.26 | $ | (0.66 | ) | $ | (5.94 | ) | ||||
| Adjusted EPS |
$ | 0.29 | $ | 0.28 | $ | (0.16 | ) | |||||
| 1 | Net Revenue is operating revenue, excluding fuel surcharge revenue |
Note: To provide a more accurate comparison of our results against our competitors and to align our Adjusted Operating Ratio calculation with our Adjusted EPS definition, we have modified the Adjusted Operating Ratio shown above to exclude the intangible amortization expense associated with our 2007 going private transaction. We have adjusted the prior quarters and full years for 2010 and 2009 presented throughout this letter to reflect the revised definition. The detailed calculation for Adjusted Operating Ratio is included in the schedules following this letter. This revised definition will be reflected in all future financial reports and presentations, including any historical comparative periods in such reports and presentations. Additionally, we completed our initial public offering (IPO) and balance sheet recapitalization in the fourth quarter of 2010, which impacted the comparability of certain items. The reconciliations included at the end of this letter highlight these items and the discussion to follow has been adjusted to exclude certain of these items.
|
|

We are pleased that our organization delivered another strong quarter. During the fourth quarter of 2011, total revenue increased 10.3% to $860.7 million and Net Revenue increased 5.1% to $695.3 million compared to the same quarter of 2010. As we have seen in recent years, the macro consumer buying patterns combined with shippers’ supply chain management, which historically contributed to the fourth quarter “peak” season, continue to evolve. As a result, fourth quarter volumes are more evenly disbursed, rather than peaking early in the quarter.
Our Adjusted Operating Ratio for the fourth quarter of 2011 remained strong at 85.5%. The continued execution of our strategies and adherence to discipline have enabled us to realize an Adjusted Operating Ratio of less than 90% for five of the last six quarters, a trend we will strive to build on. Our fourth quarter Adjusted EBITDA of $154.3 million nearly matched our record Adjusted EBITDA of $155.4 million in the fourth quarter of 2010. These favorable results were primarily driven by year over year improvements in pricing and deadhead, partially offset by increases in health care and maintenance costs as well as an increase in insurance and claims expense as discussed below. These trends and others are explained throughout the remainder of this letter.
Fourth Quarter Trucking Revenue and Metrics
A summary of our year over year trends for the fourth quarter associated with our truckload service offerings are as follows:
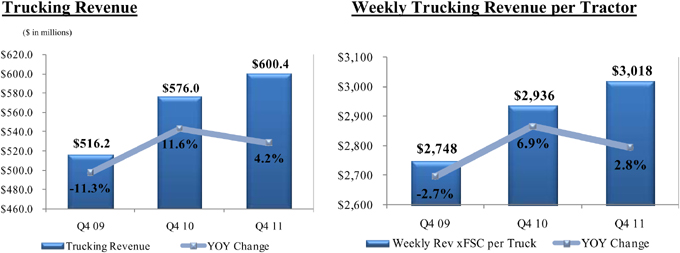
Trucking Revenue, which excludes fuel surcharge revenue, increased 4.2% to $600.4 million in the fourth quarter of 2011 compared to the same quarter in 2010, but more importantly, our Weekly Trucking Revenue per Tractor of $3,018 exceeded $3,000 for the third quarter in a row. This improvement was driven by a 4.1% increase in our revenue per loaded mile, excluding fuel surcharges, partially offset by a slight decrease in utilization as measured by loaded miles per truck per week resulting from a shift in business mix from over-the-road linehaul service to dedicated regional service as discussed in more detail below.
|
|
2 |
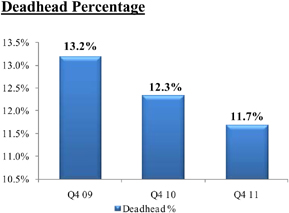
Another key statistic that directly impacts profitability is deadhead percentage, which represents the percent of total miles driven without revenue generating freight being transported. The adjacent chart illustrates our continued improvement in this measure. We achieved 11.7% deadhead for the fourth quarter of 2011, which represents a 60 bps and 150 bps reduction from the fourth quarter of 2010 and 2009, respectively. We reference some of the key drivers to our deadhead improvement in our full year results discussion to follow.
Finally, the sequential trends of our average operational truck counts are shown below:
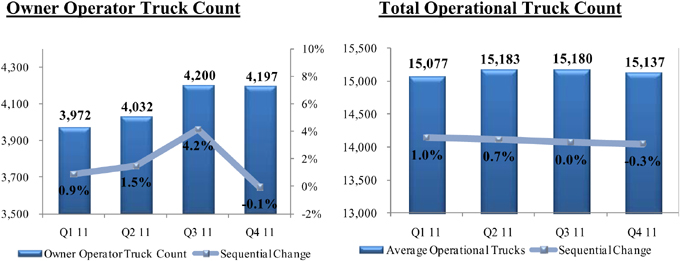
Our average owner operator truck count in the fourth quarter remained essentially flat with the third quarter of 2011 at approximately 4,200 trucks. Total operational truck count dipped slightly due to a planned temporary reduction in the fleet, which began in late December 2011 and is expected to continue through the first two months of 2012, before growing again in March if justified by demand. The current reduction is designed to coincide with the soft seasonal demand patterns we traditionally experience in the first quarter. Given the flexibility we have with our fleet, we have the ability to modify the first quarter truck reduction based on freight volumes. We anticipate the reduction to be in the range of 2% – 5% from the fourth quarter average operational truck count. For the full year of 2012, we are currently expecting a slow, steady growth environment similar to 2011. As we have stated in the past, growing our owner operator fleet remains a priority, and we will continue our efforts to attract and retain owner operators in the U.S. This growth will be partially offset through reductions in the domestic company fleet. Additionally, we expect to grow our Mexico fleet by approximately 50 company trucks. We continue to seek opportunities to add volume through improved productivity of our existing assets, rather than adding a significant number of trucks as we streamline our internal processes to more effectively utilize our drivers’ available hours and actively manage our freight network. Given this opportunity and our expectations for demand, we expect the company fleet of trucks to remain relatively consistent with 2011 levels after the temporary reduction in the first quarter.
|
|
3 |
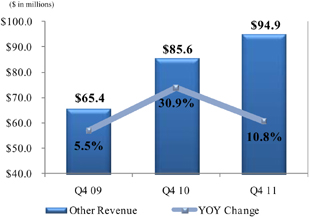
Fourth Quarter Other Revenue
Other Revenue includes revenue generated by our intermodal and brokerage lines of business, as well as revenue generated by our subsidiaries offering services to owner operators, including shop maintenance, tractor leasing, and insurance. In the fourth quarter of 2011, Other Revenue increased 10.8% compared to the same quarter in 2010.
Our intermodal business is a combination of two different service offerings, container on flat car (COFC) and trailer on flat car (TOFC). Our COFC revenue continues its momentum with 18.5% growth in the fourth quarter of 2011 compared to the fourth quarter of 2010 and sequential growth of 12.2%. As we discussed on our second quarter earnings conference call, we made a conscious decision to reduce our TOFC business earlier this year, in order to remove underperforming lanes, and add new TOFC business throughout the year. As a result of our efforts we are pleased to report that TOFC revenue increased 6.0% when compared to the fourth quarter of 2010, and grew sequentially 84.2% from the third quarter of 2011. The TOFC offering still remains a very small portion of our Other Revenue.
Finally, similar to 2010, we were successful in providing additional services to our customers to meet their fourth quarter demand needs, which generated incremental revenue in the fourth quarter compared to the third quarter in both 2010 and 2011.
Fourth Quarter Operating Expenses
The table below highlights some of our cost categories for the fourth quarter of 2011 compared to the fourth quarter of 2010 and the third quarter of 2011, showing each as a percent of Net Revenue, which excludes fuel surcharge revenue. Fuel surcharge revenue can be volatile and is primarily dependent upon the cost of fuel and not specifically related to our non-fuel operational expenses. Therefore, we believe that Net Revenue is a better measure for analyzing our expenses and operating metrics.
|
|
4 |
| Adjusted | YOY | QOQ | ||||||||||||||||||||||
| Q4 ’11 | Q4 ’10 | Variance1 | ($ in millions) | Q4 ’11 | Q3 ’11 | Variance1 | ||||||||||||||||||
| $ | 860.7 | $ | 780.4 | 10.3 | % | Total Revenue | $ | 860.7 | $ | 863.8 | -0.4 | % | ||||||||||||
| (165.4 | ) | (118.8 | ) | 39.2 | % | Less: Fuel Surcharge Revenue | (165.4 | ) | (172.5 | ) | -4.1 | % | ||||||||||||
|
|
|
|
|
|
|
|
|
|||||||||||||||||
| $ | 695.3 | $ | 661.6 | 5.1 | % | Net Revenue | $ | 695.3 | $ | 691.3 | 0.6 | % | ||||||||||||
|
|
|
|
|
|
|
|
|
|
|
|
|
|||||||||||||
| $ | 194.8 | $ | 189.3 | -2.9 | % | Salaries, Wages & Benefits2 | $ | 194.8 | $ | 197.0 | 1.1 | % | ||||||||||||
| 28.0 | % | 28.6 | % | 60 | bps | % of Net Revenue | 28.0 | % | 28.5 | % | 48 | bps | ||||||||||||
| $ | 60.5 | $ | 56.8 | -6.6 | % | Operating Supplies & Expenses | $ | 60.5 | $ | 61.8 | 2.0 | % | ||||||||||||
| 8.7 | % | 8.6 | % | -12 | bps | % of Net Revenue | 8.7 | % | 8.9 | % | 23 | bps | ||||||||||||
| $ | 23.2 | $ | 14.8 | -56.6 | % | Insurance & Claims | $ | 23.2 | $ | 21.3 | -9.3 | % | ||||||||||||
| 3.3 | % | 2.2 | % | -110 | bps | % of Net Revenue | 3.3 | % | 3.1 | % | -27 | bps | ||||||||||||
| $ | 6.4 | $ | 6.1 | -5.3 | % | Communcation & Utilities | $ | 6.4 | $ | 6.8 | 6.4 | % | ||||||||||||
| 0.9 | % | 0.9 | % | 0 | bps | % of Net Revenue | 0.9 | % | 1.0 | % | 7 | bps | ||||||||||||
| $ | 14.8 | $ | 14.9 | 0.8 | % | Operating Taxes & Licenses | $ | 14.8 | $ | 16.5 | 10.2 | % | ||||||||||||
| 2.1 | % | 2.3 | % | 13 | bps | % of Net Revenue | 2.1 | % | 2.4 | % | 25 | bps | ||||||||||||
| 1 | Positive numbers represent favorable variances, negative numbers represent unfavorable variances |
| 2 | Actual salaries, wages, and benefits in accordance with GAAP for the fourth quarter ending December 31, 2010 was $211.9 million. Excluding the one-time non-cash equity compensation charge of $22.6 million related to stock options vesting upon our IPO, adjusted salaries, wages and benefits was $189.3 million for the three months ended December 31, 2010 |
Salaries, wages, and employee benefits for the fourth quarter ending December 31, 2010 have been adjusted to exclude the $22.6 million one-time non-cash equity compensation charge related to stock options that vested upon our IPO. Excluding this charge, salaries wages and benefits increased $5.5 million, or 2.9%, to $194.8 million during the fourth quarter ending December 31, 2011 compared to $189.3 for the fourth quarter ending December 31, 2010. The year over year increase in expense was primarily driven by increases in our health care costs and our non-driving personnel, which were partially offset by a reduction in company driver pay associated with the increase in the percentage of miles driven by owner operators. This percentage increase resulted in a 220 basis point reduction in the total miles driven by company drivers. Sequentially, salaries, wages and benefits decreased from $197.0 million to $194.8 million due to a decrease in the number of miles driven by company drivers associated with the shift between company drivers and owner operators discussed above and a reduction in workers compensation expense, partially offset by an increase in health care costs.
Operating supplies and expenses increased $3.7 million from the fourth quarter of 2010 driven by increases in equipment maintenance expense and higher tire prices. These increases were partially offset by a decrease in general operating expenses. Sequentially, operating supplies and expenses were down slightly due to a $1.7 million decrease in tire costs after the warm summer weather subsided.
Insurance and claims expense in the fourth quarter of 2011 increased $8.4 million from the fourth quarter of 2010 and was 3.3% of Net Revenue. In both the fourth quarter 2011 and the fourth quarter of 2010, we experienced favorable actuarial adjustments related to the prior year loss layers as the development of claims from the prior years was better than the actuarial models had previously projected. In addition, during the fourth quarter of 2010, we had a large favorable adjustment in the then-current year loss layer as our experience related to the actual crash frequency and severity trends for 2010 improved from what was previously projected throughout the year and were incorporated into the actuarial models. For 2011, the loss projection for the current year loss layer incorporated the last several years of favorable trends. As a result, we did not experience a significant, favorable actuarial adjustment in the fourth quarter of 2011.
|
|
5 |
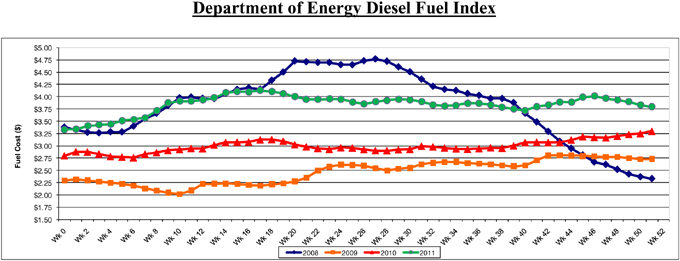
Fuel Expense
Fuel expense for the fourth quarter 2011 was $153.0 million or an increase of 17.7% over the fourth quarter of 2010. We collect fuel surcharge revenue from our customers to help mitigate the increases in fuel prices, as measured through the Department of Energy (D.O.E.) Diesel Fuel Index. We utilize a portion of our fuel surcharge revenue to reimburse owner operators and other third parties, such as the railroads, who also must pay for fuel. To evaluate the effectiveness of our fuel surcharges, we deduct the portion we pay to third parties, and then subtract the remaining company-related fuel surcharge revenue from our fuel expense. This calculation is shown below:
| Q4 ’11 | Q4 ’10 | ($ in millions, except D.O.E Diesel Fuel Index) | Q4 ’11 | Q3 ’11 | ||||||||||||
| $ | 153.0 | $ | 130.0 | Fuel Expense | $ | 153.0 | $ | 159.7 | ||||||||
| 17.8 | % | 16.7 | % | % of Total Revenue | 17.8 | % | 18.5 | % | ||||||||
| $ | 165.4 | $ | 118.8 | Fuel Surcharge Revenue (FSR) | $ | 165.4 | $ | 172.5 | ||||||||
| (67.0 | ) | (43.3 | ) | Less: FSR Reimbursed to Third Parties | (67.0 | ) | (68.0 | ) | ||||||||
|
|
|
|
|
|
|
|
|
|||||||||
| $ | 98.5 | $ | 75.5 | Company Fuel Surcharge Revenue | $ | 98.5 | $ | 104.5 | ||||||||
|
|
|
|
|
|
|
|
|
|||||||||
| $ | 153.0 | $ | 130.0 | Fuel Expense | $ | 153.0 | $ | 159.7 | ||||||||
| (98.5 | ) | (75.5 | ) | Less: Company FSR | (98.5 | ) | (104.5 | ) | ||||||||
|
|
|
|
|
|
|
|
|
|||||||||
| $ | 54.6 | $ | 54.5 | Net Fuel Expense | $ | 54.6 | $ | 55.2 | ||||||||
|
|
|
|
|
|
|
|
|
|||||||||
| 7.8 | % | 8.2 | % | % of Net Revenue | 7.8 | % | 8.0 | % | ||||||||
| $ | 3.868 | $ | 3.144 | Average D.O.E. Diesel Fuel Index | $ | 3.868 | $ | 3.867 | ||||||||
| 23.0 | % | 14.7 | % | Year over Year % Change | 23.0 | % | 31.5 | % | ||||||||
As a result of our fuel surcharge program and relatively stable fuel prices during the second half of 2011, our Net Fuel Expense was $54.6 million for the fourth quarter of 2011, remaining essentially flat from the fourth quarter of 2010 and the third quarter of 2011. As a percentage of Net Revenue, Net Fuel Expense improved from 8.2% during the fourth quarter of 2010, and 8.0% in the third quarter of 2011, to 7.8% during the fourth quarter of 2011. Historical fuel prices are shown in the graph below:
|
|
6 |
Purchased Transportation
Purchased transportation includes payments to owner operators, railroads and other third parties we use for intermodal drayage and other brokered business. In the fourth quarter of 2011, this expense increased $38.1 million over the fourth quarter of 2010. A portion of the payments made to our partners is for fuel reimbursements; this portion represents $23.7 million of the year over year increase reflecting the increase in diesel prices discussed above.
| Q4 ’11 | Q4 ’10 | ($ in millions) | Q4 ’11 | Q3 ’11 | ||||||||||||
| $ | 237.0 | $ | 198.9 | Purchased Transportation | $ | 237.0 | $ | 234.7 | ||||||||
| 27.5 | % | 25.5 | % | % of Total Revenue | 27.5 | % | 27.2 | % | ||||||||
| (67.0 | ) | (43.3 | ) | Less: FSR Reimbursed to Third Parties | (67.0 | ) | (68.0 | ) | ||||||||
| $ | 170.0 | $ | 155.6 | Net Purchased Transportation | $ | 170.0 | $ | 166.7 | ||||||||
| 24.4 | % | 23.5 | % | % of Net Revenue | 24.4 | % | 24.1 | % | ||||||||
Excluding fuel reimbursements, Net Purchased Transportation increased $14.4 million year over year as a result of an increase in miles driven by owner operators and an increase in intermodal volumes. As a percent of Net Revenue, Net Purchased Transportation increased by 90 bps year over year. This was due to an increase in owner operator and intermodal miles, partially offset by the 4.0% increase in trucking revenue per loaded mile. Sequentially, Net Purchased Transportation increased $3.3 million, or from 24.1% of Net Revenue to 24.4%. This increase was due to the increase in the percentage of total miles driven by owner operators as well as the sequential growth in the intermodal business discussed above.
Rental Expense and Depreciation & Amortization of Property and Equipment
Due to fluctuations in the amount of tractors leased versus owned, we combine our rental expense with depreciation and amortization of property and equipment for analytical purposes as shown in the table below:
|
|
7 |
| Q4 11 | Q4 ’10 | ($ in millions) | Q4 ’11 | Q3 ’11 | ||||||||||||
| $ | 20.9 | $ | 19.0 | Rental Expense | $ | 20.9 | $ | 23.7 | ||||||||
| 3.0 | % | 2.9 | % | % of Net Revenue | 3.0 | % | 3.4 | % | ||||||||
| $ | 51.2 | $ | 49.8 | Depreciation & Amortization of Property and Equipment | $ | 51.2 | $ | 51.1 | ||||||||
| 7.4 | % | 7.5 | % | % of Net Revenue | 7.4 | % | 7.4 | % | ||||||||
| $ | 72.1 | $ | 68.8 | Combined Rental Expense and Depreciation | $ | 72.1 | $ | 74.8 | ||||||||
| 10.4 | % | 10.4 | % | % of Net Revenue | 10.4 | % | 10.8 | % | ||||||||
Combined rental and depreciation expense in the fourth quarter of 2011 increased $3.3 million to $72.1 million from the fourth quarter of 2010 but has remained flat as a percent of Net Revenue at 10.4%. The dollar increase is primarily due to the growth in owner operators, who finance their equipment through our Interstate Equipment Leasing (“IEL”) subsidiary, growth in trailers and intermodal containers, and an increase in the cost of new equipment.
As mentioned earlier, total truck count has decreased slightly from the third quarter of 2011 due to the planned reduction of trucks to match the traditionally soft seasonal first quarter freight demand. Total equipment counts are shown below:
| 12/31/2011 | 9/30/2011 | 12/31/2010 | ||||||||||
| Tractors: |
||||||||||||
| Company |
||||||||||||
| Owned |
6,799 | 6,432 | 6,844 | |||||||||
| Leased - operating leases |
2,611 | 2,837 | 2,331 | |||||||||
| Leased - capital leases |
2,457 | 2,562 | 3,048 | |||||||||
|
|
|
|
|
|
|
|||||||
| Total company tractors |
11,867 | 11,831 | 12,223 | |||||||||
|
|
|
|
|
|
|
|||||||
| Owner-operator |
||||||||||||
| Financed through the Company |
3,016 | 3,092 | 2,813 | |||||||||
| Other |
1,019 | 1,222 | 1,054 | |||||||||
|
|
|
|
|
|
|
|||||||
| Total owner-operator tractors |
4,035 | 4,314 | 3,867 | |||||||||
|
|
|
|
|
|
|
|||||||
| Total tractors |
15,902 | 16,145 | 16,090 | |||||||||
|
|
|
|
|
|
|
|||||||
| Trailers |
50,555 | 49,935 | 48,992 | |||||||||
|
|
|
|
|
|
|
|||||||
| Containers |
6,210 | 5,873 | 4,842 | |||||||||
|
|
|
|
|
|
|
|||||||
Gain on Disposal of Property and Equipment
Gain on disposal of property and equipment was $2.6 million in the fourth quarter of 2011 compared to $3.3 million in the fourth quarter of 2010. We disposed of a large volume of equipment in the fourth quarter and much of this equipment was not covered by trade agreements with the manufacturers. We had previously expected this figure to be in the $1-$2 million range, but given the strength of the used truck market, we were able to dispose of more uncovered trucks than previously expected. Additionally, we disposed of numerous older trailers during the fourth quarter, which also contributed to the larger than anticipated gain on sale.
|
|
8 |
Taxes
Our effective tax rate, in accordance with GAAP, for the fourth quarter of 2011 was 38.2%, which was lower than previously estimated due to changes in effective state tax rates. As a reminder, we use a tax rate of 39.0% for our Adjusted EPS calculations. This is our expected effective tax rate after the full amortization of certain deferred tax assets primarily related to terminated interest rate swaps that will be completed in August 2012.
Full Year Results
A summary of our key results for the full year, which include record Adjusted Operating Ratio and EBITDA, in 2011 is shown below:
| Full Year Ended December 31, | ||||||||||||
| 2011 | 2010 | 2009 | ||||||||||
| Unaudited | ||||||||||||
| ($ in millions, except per share data) | ||||||||||||
| Operating Revenue |
$ | 3,333.9 | $ | 2,929.7 | $ | 2,571.4 | ||||||
| Net Revenue1 |
$ | 2,679.8 | $ | 2,500.6 | $ | 2,296.0 | ||||||
| Operating Ratio |
90.8 | % | 91.7 | % | 94.9 | % | ||||||
| Adjusted Operating Ratio |
87.9 | % | 88.3 | % | 93.0 | % | ||||||
| EBITDA |
$ | 530.4 | $ | 378.1 | $ | 398.9 | ||||||
| Adjusted EBITDA |
$ | 537.2 | $ | 497.7 | $ | 405.9 | ||||||
| Diluted EPS |
$ | 0.65 | $ | (1.98 | ) | $ | (7.25 | ) | ||||
| Adjusted EPS |
$ | 0.79 | $ | 0.02 | $ | (0.73 | ) | |||||
| 1 | Net Revenue is operating revenue, excluding fuel surcharge revenue |
Challenging economic conditions in 2011 including the European debt crisis, the domestic debt ceiling debate, adverse weather in the first quarter, the slow housing recovery, high unemployment, increasing fuel costs and other factors significantly slowed the economic turnaround many were predicting this time last year. In spite of these headwinds, we made progress on our goals to improve our financial performance and reduce our debt while providing best in class transportation solutions to our customers. Our operating revenue grew 13.8% to $3.3 billion. Excluding fuel surcharges, Net Revenue increased 7.2% driven by 7.5% growth in trucking revenue and 4.8% growth in other revenues. We are also encouraged by the favorable year over year operational trends we have experienced thus far in 2012. Volumes are improving, operating metrics are favorable, and our driver pipeline continues to be full.
Our Adjusted Operating Ratio of 87.9% for the full year ended December 31, 2011 represents the fourth consecutive year we have improved this metric. Our Adjusted EBITDA of $537.2 million represents the highest annual Adjusted EBITDA in the history of Swift. These favorable results were primarily driven by year over year improvements in volume and pricing partially offset by increases in fuel, maintenance, insurance and claims, and healthcare costs. In addition, the recapitalization of our balance sheet in December 2010 helped us to significantly reduce our interest expense year over year, which contributed to the improvement in our 2011 earnings.
|
|
9 |
We appreciate our organization’s continued dedication to providing excellent service to our customers. In 2011, we again received numerous Carrier of the Year awards, a demonstration of our customers’ recognition of our partnership and the value of our suite of services. As we have stated in the past, trust is one of our guiding principles. We recognize the importance of delivering results in order to earn that trust from our customers, our employees, and our stockholders. We remain committed to further utilizing our strategic focus teams, continuous improvement initiatives, and disciplined processes in order to execute and deliver these results.
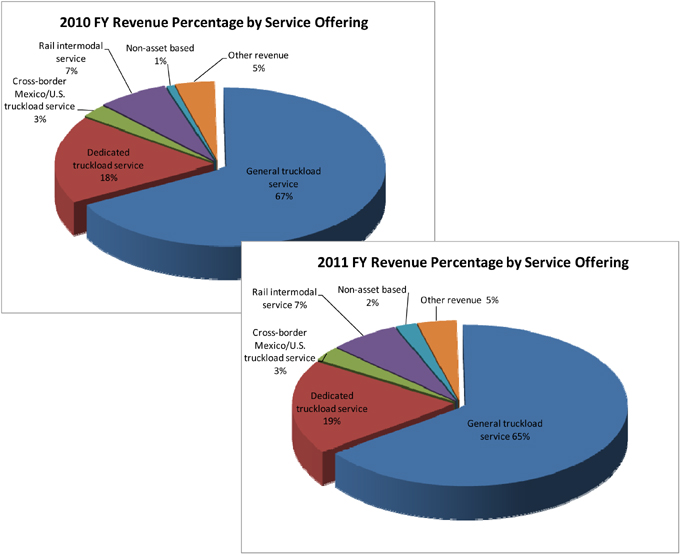
Full Year Revenue by Service Offering
As we have discussed throughout the year, one of our strategies is to grow by cross-selling our entire suite of services. Our over-the-road linehaul business continues to be our core, but we strive to complement this service by developing creative solutions for our customers that include a variety of transportation services. The charts below highlight our revenue by service offering for 2011 and 2010.
|
|
10 |
Not only did our Net Revenue grow by 7.2% in total, but we were also successful in increasing the percentage of our business attributed to our Non-asset Based and Dedicated Services. To put it in perspective, the one percent increase in our Dedicated Service Offering represents an approximate 15% year over year increase in revenue for that service, while our Non-asset based brokerage and freight logistics service has increased approximately 180% year over year.
Full Year Trucking Revenue and Metrics
A summary of our year over year trends associated with our truckload service offerings are as follows:
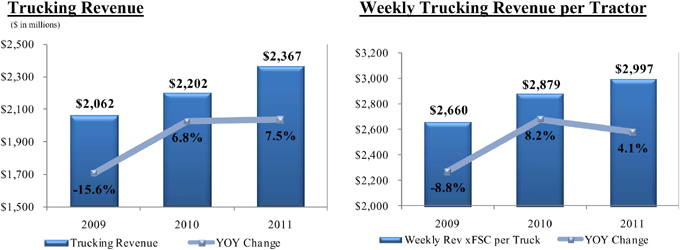
Trucking revenue increased 7.5% to $2.4 billion for the year ending December 31, 2011 compared to 2010. This growth resulted from a 3.2% increase in loaded miles, while pricing improvements and changes in freight mix generated a 4.1% increase in our average rate per loaded mile excluding fuel surcharges for the year. Weekly trucking revenue per tractor has steadily improved each of the past three years to end 2011 at an average of $2,997, which is a 4.1% improvement over 2010. Our utilization, as measured by loaded miles per truck per week, was flat for 2011 when compared to 2010. Though we achieved a 20 mile per truck per week utilization improvement in our general over-the-road service, this improvement was masked by the change in our mix of services as the growth in dedicated, Mexico, and dray operations, which typically have lower utilization, offset the line haul advances.
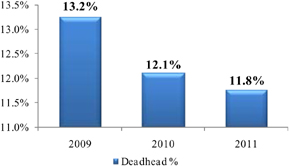
Deadhead Percentage
We have continued to improve in our deadhead percentage, recording 11.8% deadhead for the year ending December 31, 2011 which is a 30 bps and 140 bps reduction from the years 2010 and 2009, respectively. We have actively managed deadhead throughout the year by appointing network engineers that focus their team on loading trucks where they land and minimizing unpaid repositioning. Our network engineers are continuing to develop tools and processes which we hope will enable future improvements.
|
|
11 |
Finally, the year over year trends of our average operational truck counts are shown below:
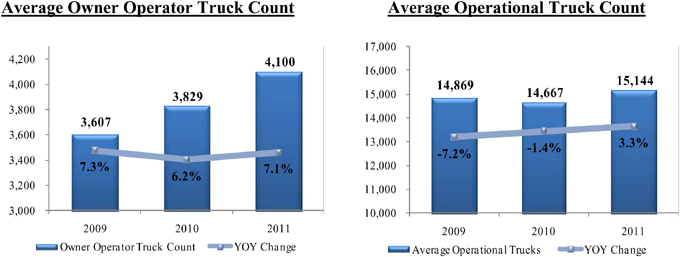
As evidenced by the 7.1% year over year increase in our Average Owner Operator truck count, we continue to have success with attracting owner operators. Our average operational truck count, which includes the owner operators, increased year over year by 3.3%. However, most of this growth occurred throughout 2010, as our total operational fleet grew from 14,390 in January 2010 to 15,069 in December 2010. From January to December of 2011, our total operational fleet was essentially flat, as owner operator growth was offset by our reductions in the company fleet.
Full Year Other Revenue
Other Revenue for the year ended December 31, 2011 increased 4.8% compared to 2010.
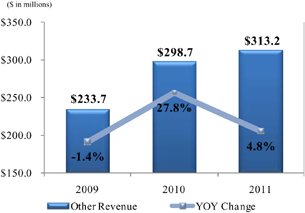
Our container on flat car revenue excluding fuel surcharges continued its momentum with 18.0% growth in 2011 compared to 2010. As discussed previously, we intentionally removed underperforming lanes in our trailer on flat car (TOFC) business earlier this year, resulting in a 51% reduction on a year over year basis; however, while this offering still remains a very small portion of our Other Revenue, it has grown sequentially in the third and fourth quarters of 2011. We have developed new tools to provide increased visibility on intermodal opportunities with our sales force and have additional tools, training and incentives planned for continued growth and penetration of the intermodal market. We plan to continue to add containers based on demand to service our customers in 2012 and beyond.
|
|
12 |
Full Year Operating Expenses
| Adjusted | YOY | ||||||||||||||
| ($ in millions) | FY ’11 | FY ’10 | Variance1 | ||||||||||||
| Total Revenue |
$ | 3,333.9 | $ | 2,929.7 | 13.8% | ||||||||||
| Less: Fuel Surcharge Revenue |
(654.1 | ) | (429.2 | ) | 52.4% | ||||||||||
|
|
|
|
|
||||||||||||
| Net Revenue |
$ | 2,679.8 | $ | 2,500.6 | 7.2% | ||||||||||
|
|
|
|
|
|
|
||||||||||
| Salaries, Wages & Benefits2 |
$ | 789.9 | $ | 741.4 | -6.5% | ||||||||||
| % of Net Revenue |
29.5% | 29.6% | 17bps | ||||||||||||
| Operating Supplies & Expenses |
$ | 238.2 | $ | 218.0 | -9.3% | ||||||||||
| % of Net Revenue |
8.9% | 8.7% | -17bps | ||||||||||||
| Insurance & Claims |
$ | 95.1 | $ | 87.4 | -8.8% | ||||||||||
| % of Net Revenue |
3.5% | 3.5% | -5bps | ||||||||||||
| Communcation & Utilities |
$ | 26.0 | $ | 25.0 | -3.9% | ||||||||||
| % of Net Revenue |
1.0% | 1.0% | 3bps | ||||||||||||
| Operating Taxes & Licenses |
$ | 61.9 | $ | 56.2 | -10.2% | ||||||||||
| % of Net Revenue |
2.3% | 2.2% | -6bps | ||||||||||||
| 1 | Positive numbers represent favorable variances, negative numbers represent unfavorable variances |
| 2 | Actual salaries, wages, and benefits in accordance with GAAP for the year ending December 31, 2010 was $764.0 million Excluding the one-time non-cash equity compensation charge of $22.6 million related to stock options vesting upon our IPO, adjusted salaries, wages and benefits was $741.4 million for the year ended December 31, 2010 |
Salaries, wages, and employee benefits shown here for 2010 have been adjusted for the $22.6 million one-time non-cash equity compensation charge related to stock options that vested upon the IPO. Excluding this charge, salaries, wages and benefits increased $48.5 million or 6.5% to $789.9 million in 2011. As a result, salaries, wages and benefits as a percent of Net Revenue were essentially flat on a year over year basis at 29.5%. Total driver wages increased year over year as a result of a 2.3% increase in miles driven by company drivers. During 2011, we recognized $6.8 million in recurring non-cash stock compensation expense related to stock options. Additionally, we experienced an increase in our health care costs and other employee benefits and increased our non-driving support personnel to support the business growth during the year.
Operating supplies and expenses increased $20.2 million in 2011 compared to 2010, due primarily to an increase in both tractor and trailer maintenance resulting from increased tire and parts pricing in 2011 as well as an increase in the age of both our tractor and trailer fleets in 2011. We anticipate the average age of our tractor fleet will decrease in 2012 as we are expecting to have a heavier replacement cycle.
Insurance and claims expense increased $7.7 million from 2010, but as a percentage of Net Revenue, has been relatively flat since 2009 at 3.5%. Our continued focus on safety and our innovative safety equipment and training has helped lead to a reduction in both accident frequency and severity over the past several years. This, combined with our effective claims
|
|
13 |
management processes has enabled us to realize reductions in our prior year claim reserves as the claims progress and closeout more favorably than previously estimated. In 2012, we expect insurance and claims as a percentage of Net Revenue to be in the range of 3.8% to 4.0%, assuming no significant adjustments for prior years.
Fuel Expense
Fuel expense for the year was $631.6 million, which represents a 34.8% increase over 2010.
Excluding fuel surcharge revenue collected to offset company fuel expense, our net fuel expense was $230.4 million in 2011 as shown in the table to the left, which is an increase of $35.2 million, or 80 bps as a percent of Net Revenue, compared to 2010. This increase was primarily due to the 28.4% increase in average fuel prices year over year, as seen in the D.O.E. Index chart below, resulting in less effective fuel recovery.
| ($ in millions, except D.O.E Diesel Fuel Index) | FY’ 11 | FY’ 10 | ||||||
| Fuel Expense |
$ | 631.6 | $ | 468.5 | ||||
| % of Total Revenue |
18.9 | % | 16.0 | % | ||||
| Fuel Surcharge Revenue (FSR) |
$ | 654.1 | $ | 429.2 | ||||
| Less: FSR Reimbursed to Third Parties |
(252.9 | ) | (155.9 | ) | ||||
|
|
|
|
|
|||||
| Company Fuel Surcharge Revenue |
$ | 401.2 | $ | 273.3 | ||||
|
|
|
|
|
|||||
| Fuel Expense |
$ | 631.6 | $ | 468.5 | ||||
| Less: Company FSR |
(401.2 | ) | (273.3 | ) | ||||
|
|
|
|
|
|||||
| Net Fuel Expense |
$ | 230.4 | $ | 195.2 | ||||
|
|
|
|
|
|||||
| % of Net Revenue |
8.6 | % | 7.8 | % | ||||
| Average D.O.E. Diesel Fuel Index |
$ | 3.840 | $ | 2.992 | ||||
| Year over Year % Change |
28.4 | % | 36.9 | % | ||||
Purchased Transportation
Purchased transportation increased $118.1 million from 2010 to 2011 of which $97 million is due to increased fuel reimbursements made to owner operator and rail carriers.
| ($ in millions) | FY’ 11 | FY’ 10 | ||||||
| Purchased Transportation |
$ | 889.4 | $ | 771.3 | ||||
| % of Total Revenue |
26.7 | % | 26.3 | % | ||||
| Less: FSR Reimbursed to Third Parties |
(252.9 | ) | (155.9 | ) | ||||
| Net Purchased Transportation |
$ | 636.5 | $ | 615.4 | ||||
| % of Net Revenue |
23.8 | % | 24.6 | % | ||||
Excluding fuel reimbursements, Net Purchased Transportation increased $21.1 million year over year as a result of an increase in miles driven by owner operators and our growing intermodal service offering. Despite the year over year increase in the expense, our Net Purchase Transportation as a percent of Net Revenue decreased by 80 bps year over year as a result of the 4.0% increase in trucking revenue per loaded mile.
|
|
14 |
Rental Expense and Depreciation & Amortization of Property and Equipment
Due to fluctuations in the amount of tractors leased versus owned, we combine our rental expense with depreciation and amortization of property and equipment for analytical purposes as shown in the table below:
| Adjusted | ||||||||
| ($ in millions) | FY’ 11 | FY’ 10 | ||||||
| Rental Expense |
$ | 81.8 | $ | 76.5 | ||||
| % of Net Revenue |
3.1 | % | 3.1 | % | ||||
| Depreciation & Amortization of Property and Equipment1 |
$ | 204.2 | $ | 198.9 | ||||
| % of Net Revenue |
7.6 | % | 8.0 | % | ||||
| Combined Rental Expense and Depreciation |
$ | 286.0 | $ | 275.4 | ||||
| % of Net Revenue |
10.7 | % | 11.0 | % | ||||
| 1 | Depreciation and amortization of property and equipment for the year ended December 31, 2010 was adjusted to exclude $7.4 million for the change in estimates regarding salvage value and useful lives for approximately 7,000 dry van trailers |
In the first quarter of 2010, management revised estimates regarding the salvage value and useful lives for approximately 7,000 dry van trailers resulting in incremental depreciation expense of $7.4 million. Excluding the impact of the incremental depreciation expense, the adjusted combined rental and depreciation expense was $275.4 million for the full year 2010. Combined rental and depreciation expense in 2011 increased from the adjusted results in 2010 by $10.6 million to $286.0. This increase is primarily due to the growth in owner operators who finance their equipment through our IEL subsidiary, growth in trailers and intermodal containers, and an increase in the cost of new equipment.
Gain on Disposal of Property and Equipment
Gain on disposal of property and equipment was essentially flat on a year over year basis at $8.5 million in 2011 compared to $8.3 million in 2010. Gains in 2011 and 2010 have been higher than typical because the used equipment market has been exceptionally strong and we have disposed of equipment that was not covered by trade agreements with the manufacturers. The strength of the used equipment market is difficult to predict, and although our trade/sale plans fluctuate, at this point we do not expect the gains in 2012 to continue at this level.
Taxes
Our effective tax rate, in accordance with GAAP, for the full year 2011 was 39.2%. As discussed in previous quarterly earnings releases, we expected a higher effective tax rate for 2011 due to the amortization of previous losses from accumulated other comprehensive income
|
|
15 |
(loss) to income (for book purposes) related to our previous interest rate swaps that were terminated in December 2010. This increase however was offset by a favorable change in unrecognized tax benefits resulting from the successful conclusion of federal and state tax audits during the year as well as a change in the effective state tax rates during the fourth quarter of 2011.
For 2012, we expect the full year effective tax rate, in accordance with GAAP, to be approximately 37%. This tax rate is lower due to internal restructuring completed in the first quarter of 2012 which was anticipated as part of the December 2010 recapitalization and IPO. It is also anticipated that the first quarter effective tax rate will be significantly lower due to the magnified impact of this restructuring benefit on only one quarter’s earnings. The effective tax rate for the remainder of the year is expected to increase such that the full year average will be 37%. For Adjusted EPS calculation purposes, we will continue to use a normalized tax rate of 39%.
Cash Flow, Balance Sheet & Debt Update
For the full year of 2011, we generated $323.9 million of cash from operations compared to $58.4 million in 2010. This healthy cash flow enabled us to make a $60 million voluntary prepayment to the Term Loan on January 3, 2012, which followed a $75 million voluntary prepayment made on September 29, 2011. These payments demonstrate our commitment to reduce our leverage. This brings the total amount of Term Loan prepayments made from January 2011 to January 2012 to $195.6 million. A comparison of our debt balances is shown below:
| December 31, 2011 | December 31, 2011 | ($ in millions) | December 31, 2010 | December 31, 2010 | ||||||||||||
| Carrying Value 1 | Face Value | Type of Debt |
Carrying Value 1 | Face Value | ||||||||||||
| 180 | 180 | A/R Securitization | 172 | 172 | ||||||||||||
| 926 | 934 | Term Loan | 1,059 | 1,070 | ||||||||||||
| 491 | 500 | Fixed Rate Notes - 2018 | 490 | 500 | ||||||||||||
| 16 | 16 | Fixed Rate Notes - 2017 | 16 | 16 | ||||||||||||
| — | — | Floating Rate Notes | 11 | 11 | ||||||||||||
| 149 | 149 | Capital Leases | 195 | 195 | ||||||||||||
| 8 | 8 | Other | 3 | 3 | ||||||||||||
|
|
|
|
|
|
|
|
|
|||||||||
| 1,769 | 1,787 | Total Debt | 1,946 | 1,966 | ||||||||||||
|
|
|
|
|
|
|
|
|
|||||||||
| (82) | (82 | ) | Less: Unrestricted Cash | (47 | ) | (47 | ) | |||||||||
|
|
|
|
|
|
|
|
|
|||||||||
| 1,687 | 1,705 | Net Debt | 1,898 | 1,919 | ||||||||||||
|
|
|
|
|
|
|
|
|
|||||||||
| 1 | Carrying value on balance sheet is net of OID |
|
|
16 |
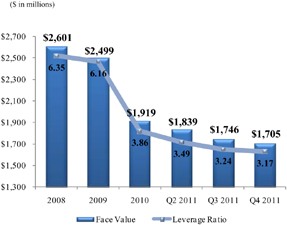
Net Debt and Leverage Ratio
As we have stated previously, our goal is to continue to reduce our leverage ratio through EBITDA growth and debt repayments. By December 31, 2011 we had reduced our leverage ratio by 17.9% to 3.17 from 3.86 at December 31, 2010. Furthermore, we continue to maintain compliance with the financial covenants in our credit agreement as of December 31, 2011.
Capital Expenditures
Net cash capital expenditures were $51.3 million in the fourth quarter of 2011, reflecting gross cash capital expenditures of $71.5 million and $20.2 million of proceeds from the sale of equipment. Additionally, we acquired $77.9 million of equipment with capital and operating leases, of which approximately $19.3 million was equipment for owner operators financed through our IEL subsidiary. These additions were used to help replace equipment with original values of $135.6 million whose leases terminated in the quarter, as well as prepare for additional leases that will expire in the first quarter of 2012.
| ($ Millions) | Q4 2011 | FY 2011 | FY 2010 | |||||||||
| Net Cash Capital Expenditures |
$ | 51.3 | $ | 172.5 | $ | 126.1 | ||||||
| Addback: Proceeds from Sales |
$ | 20.2 | $ | 67.1 | $ | 38.5 | ||||||
|
|
|
|
|
|
|
|||||||
| Gross Cash Capital Expenditures |
$ | 71.5 | $ | 239.6 | $ | 164.6 | ||||||
|
|
|
|
|
|
|
|||||||
| Capital Leases |
$ | 9.9 | $ | 10.6 | $ | 66.6 | ||||||
| Operating Leases |
$ | 68.0 | $ | 264.9 | $ | 7.8 | ||||||
|
|
|
|
|
|
|
|||||||
| Gross Investment in Equipment & Facilities |
$ | 149.4 | $ | 515.1 | $ | 239.0 | ||||||
|
|
|
|
|
|
|
|||||||
Original Value of Expired Leases
| ($ Millions) | Q4 2011 | FY 2011 | FY 2010 | |||||||||
| Capital Leases |
$ | 21.3 | $ | 69.0 | $ | — | ||||||
| Operating Leases |
$ | 114.3 | $ | 159.7 | $ | 22.8 | ||||||
|
|
|
|
|
|
|
|||||||
| Total |
$ | 135.6 | $ | 228.7 | $ | 22.8 | ||||||
|
|
|
|
|
|
|
|||||||
For 2012, we are expecting to have a heavier replacement cycle for both tractors and trailers and therefore expect our net cash capital expenditures to be approximately $250 million. We have ample flexibility with our trade cycle and purchase agreements and could alter our current plans if economic or other conditions warrant.
|
|
17 |
Liquidity Summary
| ($ millions) | 12/31/2011 | 12/31/2010 | ||||||
| Unrestricted Cash |
$ | 82.1 | $ | 47.5 | ||||
| Total Revolver Commitment |
$ | 400.0 | $ | 400.0 | ||||
| Less: Amount Drawn |
$ | — | $ | — | ||||
| Amounts under LOC |
$ | (167.5 | ) | $ | (153.2 | ) | ||
|
|
|
|
|
|||||
| Available Under Revolver |
$ | 232.5 | $ | 246.8 | ||||
|
|
|
|
|
|||||
| Total Available under AR Facility |
$ | 249.8 | $ | 174.0 | ||||
| Less: Amount Drawn |
$ | (180.0 | ) | $ | (171.5 | ) | ||
|
|
|
|
|
|||||
| Available Under AR Facility |
$ | 69.8 | $ | 2.5 | ||||
|
|
|
|
|
|||||
| Total Liquidity |
$ | 384.4 | $ | 296.8 | ||||
|
|
|
|
|
|||||
| Restricted Cash |
$ | 71.7 | $ | 84.6 | ||||
|
|
|
|
|
|||||
| Total Liquidity Including Restricted Cash |
$ | 456.1 | $ | 381.4 | ||||
|
|
|
|
|
|||||
Our liquidity position at December 31, 2011 remains healthy with a total of $456.1 million available to us including $82.1 million of unrestricted cash and $71.7 million of cash restricted in our captive insurance companies that is reserved for the future payment of claims incurred to date. Our $400 million revolving credit facility was undrawn, and we had $167.5 million of letters of credit outstanding primarily for insurance collateral purposes, leaving $232.5 million available. Additionally, we had $69.8 million available on our accounts receivable securitization facility.
Summary
In summary, given the overall economic environment, we are pleased with the results for 2011 as we continue to make progress on our goals. We will continue to focus on providing Best in Class service and solutions to our customers, improving the utilization of our resources, streamlining our processes, and improving the return on our assets. We believe we have the best people in the industry and are grateful for the effort, innovation and focus our dedicated employees bring to work every day. We maintain our quest to become Best in Class in everything we do including generating returns for you, our stockholders.
Sincerely,
| Jerry Moyes |
Richard Stocking | Ginnie Henkels | ||
| Chief Executive Officer |
Chief Operating Officer | Chief Financial Officer |
|
|
18 |
Conference Call Q&A Session
Swift Transportation management will host a webcast Q&A session at 12:30 p.m. Eastern Time on Thursday, January 26th to answer questions about the Company’s financial results. Please email your questions to Investor_Relations@swifttrans.com prior to 2:00 p.m. Eastern time on Wednesday, January 25th.
Participants may access the call using the following dial-in numbers:
U.S./Canada: (866) 379-9391
International/Local: (706) 634-0901
Conference ID: 43395820
The live webcast, letter to stockholders, transcript of the Q&A, and the replay of the earnings Q&A session can be accessed via our investor relations website at ir.swifttrans.com.
IR Contact:
Jason Bates
Vice President Finance &
Investor Relations Officer
623.907.7335
Forward Looking Statements & Use of Non-GAAP Measures
This letter contains statements that may constitute forward-looking statements, which are based on information currently available, usually identified by words such as “anticipates,” “believes,” “estimates”, “plans,” “projects,” “expects,” “intends,” “will,” “could,” “may,” or similar expressions which speak only as of the date the statement was made. Such forward-looking statements are made pursuant to the safe harbor provisions of the Private Securities Litigation Reform Act of 1995. Such statements include, but are not limited to, statements concerning: trends relating to our operations, leverage, revenue, expenses, effective tax rate for the full year 2012, fleet size and composition between company and owner operator trucks, profitability and related metrics; estimated capital expenditures and related average age of our fleet; our plans to expand our Mexico fleet; our strategy to grow volumes through utilization of existing equipment and driver resources; our plans to grow our intermodal fleet; and our intentions to use excess cash flows to repay debt. Such forward-looking statements are inherently uncertain, are based upon the current beliefs, assumptions and expectations of Company management and current market conditions, which are subject to significant risks and uncertainties as set forth in the Risk Factor Section of our Annual Report Form 10-K. As to the Company’s business and financial performance, the following factors, among others, could cause actual results to differ materially from those in forward-looking statements: the amount and velocity of changes in fuel prices and our ability to recover fuel prices through our fuel surcharge program; the direction and duration of any trends, in pricing and volumes; assumptions regarding demand; any future recessionary economic cycles and downturns in customers’ business cycles, particularly in market segments and industries in which we have a significant concentration of customers; increasing competition from trucking, rail, intermodal, and brokerage competitors; a significant reduction in, or termination of, our trucking services by a key customer; our ability to sustain cost savings realized as part of our recent cost reduction initiatives; our ability to achieve our strategy of growing our revenue; our history of net losses; volatility in the price or availability of fuel; increases in new equipment prices or replacement costs; our significant ongoing capital
|
|
19 |
requirements; the regulatory environment in which we operate, including existing regulations and changes in existing regulations, or violations by us of existing or future regulations; the costs of environmental and safety compliance and/or the imposition of liabilities under environmental and safety laws and regulations; difficulties in driver recruitment and retention; increases in driver compensation to the extent not offset by increases in freight rates; potential volatility or decrease in the amount of earnings as a result of our claims exposure through our wholly-owned captive insurance companies; risks relating to our captive insurance companies; uncertainties associated with our operations in Mexico; our ability to attract and maintain relationships with owner operators; the possible re-classification of our owner operators as employees; adverse results from litigation; our ability to retain or replace key personnel; conflicts of interest or potential litigation that may arise from other businesses owned by Jerry Moyes; potential failure in computer or communications systems; our labor relations; our ability to execute or integrate any future acquisitions successfully; seasonal factors such as harsh weather conditions that increase operating costs; goodwill impairment; compliance with federal securities laws; and our ability to service our outstanding indebtedness, including compliance with our indebtedness covenants, and the impact such indebtedness may have on the way we operate our business. You should understand that many important factors, in addition to those listed above and in our filings with the SEC, could impact us financially. As a result of these and other factors, actual results may differ from those set forth in the forward-looking statements and the prices of the Company’s securities may fluctuate dramatically. The Company makes no commitment, and disclaims any duty, to update or revise any forward-looking statements to reflect future events, new information or changes in these expectations. In addition to our GAAP results, this presentation also includes certain non-GAAP financial measures as defined by the SEC. The calculation of each measure, including a reconciliation to the most closely related GAAP measure and the reasons management believes each non-GAAP measure is useful, are included in the attached schedules.
|
|
20 |
CONSOLIDATED STATEMENTS OF OPERATIONS (UNAUDITED)
THREE MONTHS AND YEAR ENDED DECEMBER 31, 2011 AND 2010
| Three Months Ended December 31, |
Year Ended December 31, |
|||||||||||||||
| 2011 | 2010 | 2011 | 2010 | |||||||||||||
| (Unaudited) | ||||||||||||||||
| (Amounts in thousands, except per share data) | ||||||||||||||||
| Operating revenue |
$ | 860,723 | $ | 780,427 | $ | 3,333,908 | $ | 2,929,723 | ||||||||
|
|
|
|
|
|
|
|
|
|||||||||
| Operating expenses: |
||||||||||||||||
| Salaries, wages and employee benefits |
194,810 | 211,942 | 789,888 | 763,962 | ||||||||||||
| Operating supplies and expenses |
60,542 | 56,815 | 238,206 | 217,965 | ||||||||||||
| Fuel |
153,015 | 130,029 | 631,552 | 468,504 | ||||||||||||
| Purchased transportation |
236,972 | 198,932 | 889,432 | 771,333 | ||||||||||||
| Rental expense |
20,943 | 18,957 | 81,841 | 76,540 | ||||||||||||
| Insurance and claims |
23,224 | 14,827 | 95,077 | 87,411 | ||||||||||||
| Depreciation and amortization of property and equipment |
51,204 | 49,830 | 204,173 | 206,279 | ||||||||||||
| Amortization of intangibles |
4,405 | 4,840 | 18,258 | 20,472 | ||||||||||||
| Impairments |
— | — | — | 1,274 | ||||||||||||
| Gain on disposal of property and equipment |
(2,573 | ) | (3,274 | ) | (8,474 | ) | (8,287 | ) | ||||||||
| Communication and utilities |
6,385 | 6,065 | 25,999 | 25,027 | ||||||||||||
| Operating taxes and licenses |
14,776 | 14,891 | 61,943 | 56,188 | ||||||||||||
|
|
|
|
|
|
|
|
|
|||||||||
| Total operating expenses |
763,703 | 703,854 | 3,027,895 | 2,686,668 | ||||||||||||
|
|
|
|
|
|
|
|
|
|||||||||
| Operating income |
97,020 | 76,573 | 306,013 | 243,055 | ||||||||||||
|
|
|
|
|
|
|
|
|
|||||||||
| Other (income) expenses: |
||||||||||||||||
| Interest expense |
35,212 | 61,670 | 145,973 | 251,129 | ||||||||||||
| Derivative interest expense |
2,990 | 11,430 | 15,057 | 70,399 | ||||||||||||
| Interest income |
(400 | ) | (579 | ) | (1,900 | ) | (1,379 | ) | ||||||||
| Loss on debt extinguishment |
— | 95,461 | — | 95,461 | ||||||||||||
| Other |
(394 | ) | (1,258 | ) | (1,949 | ) | (3,710 | ) | ||||||||
|
|
|
|
|
|
|
|
|
|||||||||
| Total other (income) expenses, net |
37,408 | 166,724 | 157,181 | 411,900 | ||||||||||||
|
|
|
|
|
|
|
|
|
|||||||||
| Income (loss) before income taxes |
59,612 | (90,151 | ) | 148,832 | (168,845 | ) | ||||||||||
| Income tax expense (benefit) |
22,800 | (41,837 | ) | 58,282 | (43,432 | ) | ||||||||||
|
|
|
|
|
|
|
|
|
|||||||||
| Net income (loss) |
$ | 36,812 | $ | (48,314 | ) | $ | 90,550 | $ | (125,413 | ) | ||||||
|
|
|
|
|
|
|
|
|
|||||||||
| Basic earnings (loss) per share |
$ | 0.26 | $ | (0.66 | ) | $ | 0.65 | $ | (1.98 | ) | ||||||
|
|
|
|
|
|
|
|
|
|||||||||
| Diluted earnings (loss) per share |
$ | 0.26 | $ | (0.66 | ) | $ | 0.65 | $ | (1.98 | ) | ||||||
|
|
|
|
|
|
|
|
|
|||||||||
| Shares used in per share calculations |
||||||||||||||||
| Basic |
139,499 | 72,864 | 139,155 | 63,339 | ||||||||||||
|
|
|
|
|
|
|
|
|
|||||||||
| Diluted |
139,528 | 72,864 | 139,663 | 63,339 | ||||||||||||
|
|
|
|
|
|
|
|
|
|||||||||
|
|
21 |
ADJUSTED EPS RECONCILIATION (UNAUDITED) (a)
THREE MONTHS AND YEAR ENDED DECEMBER 31, 2011, 2010 AND 2009
| Three Months Ended December 31, |
Year Ended December 31, |
|||||||||||||||||||||||
| 2011 | 2010 | 2009 | 2011 | 2010 | 2009 | |||||||||||||||||||
| Diluted earnings (loss) per share |
$ | 0.26 | $ | (0.66 | ) | $ | (5.94 | ) | $ | 0.65 | $ | (1.98 | ) | $ | (7.25 | ) | ||||||||
| Adjusted for: |
||||||||||||||||||||||||
| Income tax expense (benefit) |
0.16 | (0.57 | ) | 5.34 | 0.42 | (0.69 | ) | 5.43 | ||||||||||||||||
|
|
|
|
|
|
|
|
|
|
|
|
|
|||||||||||||
| Income (loss) before income taxes |
0.43 | (1.24 | ) | (0.60 | ) | 1.07 | (2.67 | ) | (1.82 | ) | ||||||||||||||
|
|
|
|
|
|
|
|
|
|
|
|
|
|||||||||||||
| Non-cash impairments(b) |
— | — | — | — | 0.02 | 0.01 | ||||||||||||||||||
| Acceleration of non-cash stock options(c) |
— | 0.31 | — | — | 0.36 | — | ||||||||||||||||||
| Loss on debt extinguishment |
— | 1.31 | — | — | 1.51 | — | ||||||||||||||||||
| Other special non-cash items(d) |
— | — | — | — | 0.12 | — | ||||||||||||||||||
| Mark-to-market adjustment of interest rate swaps(e) |
— | 0.01 | 0.18 | — | 0.39 | 0.13 | ||||||||||||||||||
| Amortization of certain intangibles (f) |
0.03 | 0.06 | 0.09 | 0.12 | 0.30 | 0.37 | ||||||||||||||||||
| Amortization of unrealized losses on interest rate swaps(g) |
0.02 | — | — | 0.11 | — | — | ||||||||||||||||||
| Excludable transaction costs (h) |
— | — | 0.06 | — | — | 0.11 | ||||||||||||||||||
|
|
|
|
|
|
|
|
|
|
|
|
|
|||||||||||||
| Adjusted income (loss) before income taxes |
0.48 | 0.46 | (0.26 | ) | 1.30 | 0.03 | (1.20 | ) | ||||||||||||||||
| Provision for income tax (benefit) expense at normalized effective rate |
0.19 | 0.18 | (0.10 | ) | 0.51 | 0.01 | (0.47 | ) | ||||||||||||||||
|
|
|
|
|
|
|
|
|
|
|
|
|
|||||||||||||
| Adjusted EPS |
$ | 0.29 | $ | 0.28 | $ | (0.16 | ) | $ | 0.79 | $ | 0.02 | $ | (0.73 | ) | ||||||||||
|
|
|
|
|
|
|
|
|
|
|
|
|
|||||||||||||
| (a) | We define Adjusted EPS as (1) income (loss) before income taxes plus (i) amortization of the intangibles from our 2007 going-private transaction, (ii) non-cash impairments, (iii) other special non-cash items, (iv) excludable transaction costs, (v) the mark-to-market adjustment on our interest rate swaps that is recognized in the statement of operations in a given period, and (vi) the amortization of previous losses recorded in accumulated other comprehensive income related to the interest rate swaps we terminated upon our IPO and refinancing transactions in December 2010; (2) reduced by income taxes at 39%, our normalized effective tax rate; (3) divided by weighted average diluted shares outstanding. We believe the presentation of financial results excluding the impact of the items noted above provides a consistent basis for comparing our results from period to period and to those of our peers due to the non-comparable nature of the intangibles from our going-private transaction, the historical volatility of the interest rate derivative agreements and the non-operating nature of the impairment charges, transaction costs and other adjustment items. Adjusted EPS is not presented in accordance with GAAP and should be considered in addition to, not as a substitute for, or superior to, measures of financial performance in accordance with GAAP. The numbers reflected in the above table are calculated on a per share basis and may not foot due to rounding. |
| (b) | Revenue equipment with a carrying amount of $3.6 million was written down to its fair value of $2.3 million, resulting in a pre-tax impairment charge of $1.3 million in the first quarter of 2010 and non-operating real estate properties held and used with a carrying amount of $2.1 million were written down to their fair value of $1.6 million, resulting in a pre-tax impairment charge of $0.5 million in the first quarter of 2009. |
| (c) | In the fourth quarter of 2010, we incurred a $22.6 million one-time non-cash equity compensation charge for certain stock options that vested upon our IPO. |
| (d) | Incremental pre-tax depreciation expense of $7.4 million reflecting management’s revised estimates regarding salvage value and useful lives for approximately 7,000 dry van trailers, which management decided during the first quarter of 2010 to scrap over the next few years. |
| (e) | Mark-to-market adjustment of interest rate swaps of $1.1 million and $11.1 in the three months ended December 31, 2010 and 2009, respectively, and $24.5 million and $7.7 million for the year ended December 31, 2010 and 2009, respectively, reflects the portion of the change in fair value of these financial instruments which was recorded in earnings and excludes any portion recorded in accumulated other comprehensive income under cash flow hedge accounting. |
| (f) | Amortization of certain intangibles reflects the non-cash amortization expense of $4.1 million, $4.5 million and $5.3 million for the three months ended December 31, 2011, 2010 and 2009, respectively, and $17.1 million, $19.3 million and $22.0 million for the year ended December 31, 2011, 2010 and 2009, respectively, relating to certain intangible assets identified in the 2007 going-private transaction through which Swift Corporation acquired Swift Transportation Co. |
| (g) | Amortization of unrealized losses on interest rate swaps reflects the non-cash amortization expense of $3.0 million and $15.1 million for the three months and year ended December 31, 2011, respectively, included in derivative interest expense in the consolidated statements of operations and is comprised of previous losses recorded in accumulated other comprehensive income related to the interest rate swaps we terminated upon our IPO and concurrent refinancing transactions in December 2010. Such losses were incurred in prior periods when hedge accounting applied to the swaps and are being expensed in relation to the hedged interest payments through the original maturity of the swaps in August 2012. |
| (h) | Excludable transactions costs include $3.9 million of pre-tax transactions costs in the three months ended December 31, 2009 related to an amendment of our previous senior credit facility and the concurrent senior secured notes amendment and $2.6 million of pre-tax transaction costs during the third quarter of 2009 related to our cancelled bond offering. |
|
|
22 |
ADJUSTED OPERATING INCOME AND OPERATING RATIO RECONCILIATION (UNAUDITED) (a)
THREE MONTHS AND YEAR ENDED DECEMBER 31, 2011, 2010 AND 2009
| Three Months Ended December 31, |
Year Ended December 31, |
|||||||||||||||||||||||
| 2011 | 2010 | 2009 | 2011 | 2010 | 2009 | |||||||||||||||||||
| (Amounts in thousands) | ||||||||||||||||||||||||
| Operating revenue |
$ | 860,723 | $ | 780,427 | $ | 668,302 | $ | 3,333,908 | $ | 2,929,723 | $ | 2,571,353 | ||||||||||||
| Less: Fuel surcharge revenue |
165,449 | 118,816 | 86,705 | 654,119 | 429,155 | 275,373 | ||||||||||||||||||
|
|
|
|
|
|
|
|
|
|
|
|
|
|||||||||||||
| Net Revenue |
695,274 | 661,611 | 581,597 | 2,679,789 | 2,500,568 | 2,295,980 | ||||||||||||||||||
|
|
|
|
|
|
|
|
|
|
|
|
|
|||||||||||||
| Operating expense |
763,703 | 703,854 | 621,409 | 3,027,895 | 2,686,668 | 2,439,352 | ||||||||||||||||||
| Adjusted for: |
||||||||||||||||||||||||
| Fuel surcharge revenue |
(165,449 | ) | (118,816 | ) | (86,705 | ) | (654,119 | ) | (429,155 | ) | (275,373 | ) | ||||||||||||
| Amortization of certain intangibles (b) |
(4,113 | ) | (4,548 | ) | (5,312 | ) | (17,092 | ) | (19,305 | ) | (22,026 | ) | ||||||||||||
| Non-cash impairments (c) |
— | — | — | — | (1,274 | ) | (515 | ) | ||||||||||||||||
| Other items (d) |
— | — | — | — | (7,382 | ) | — | |||||||||||||||||
| Excludable transaction costs (e) |
— | — | (3,876 | ) | — | — | (6,477 | ) | ||||||||||||||||
| Acceleration on non-cash stock options(f) |
(22,605 | ) | — | — | (22,605 | ) | — | |||||||||||||||||
|
|
|
|
|
|
|
|
|
|
|
|
|
|||||||||||||
| Adjusted operating expense |
594,141 | 557,885 | 525,516 | 2,356,684 | 2,206,947 | 2,134,961 | ||||||||||||||||||
|
|
|
|
|
|
|
|
|
|
|
|
|
|||||||||||||
| Adjusted operating income |
$ | 101,133 | $ | 103,726 | $ | 56,081 | $ | 323,105 | $ | 293,621 | $ | 161,019 | ||||||||||||
|
|
|
|
|
|
|
|
|
|
|
|
|
|||||||||||||
| Adjusted Operating Ratio |
85.5 | % | 84.3 | % | 90.4 | % | 87.9 | % | 88.3 | % | 93.0 | % | ||||||||||||
| Operating Ratio |
88.7 | % | 90.2 | % | 93.0 | % | 90.8 | % | 91.7 | % | 94.9 | % | ||||||||||||
| (a) | We define Adjusted Operating Ratio as (a) total operating expenses, less (i) fuel surcharge revenue, (ii) amortization of the intangibles from our 2007 going-private transaction, (iii) non-cash impairment charges, (iv) certain other items, and (v) excludable transaction costs, as a percentage of (b) total revenue excluding fuel surcharge revenue. For the year ended December 31, 2011, we revised the calculation of Adjusted Operating Ratio to eliminate the impact of the non-cash amortization of the intangibles from our 2007 going-private transaction to be consistent with the calculation of our Adjusted EPS. The prior quarterly and annual results for 2010 and 2009 presented above have been revised to reflect the revised definition. We believe fuel surcharge is sometimes volatile and eliminating the impact of this source of revenue (by netting fuel surcharge revenue against fuel expense) affords a more consistent basis for comparing our results of operations. We also believe excluding impairments, the non-comparable nature of the intangibles from our going-private transaction and other special items enhances the comparability of our performance from period to period. Adjusted Operating Ratio is not a recognized measure under GAAP. Adjusted Operating Ratio should be considered in addition to, not as a substitute for, or superior to, measures of financial performance in accordance with GAAP. |
| (b) | Amortization of certain intangibles reflects the non-cash amortization expense of $4.1 million, $4.5 million and $5.3 million for the three months ended December 31, 2011, 2010 and 2009, respectively, and $17.1 million, $19.3 million and $22.0 million for the year ended December 31, 2011, 2010 and 2009, respectively, relating to certain intangible assets identified in the 2007 going-private transaction through which Swift Corporation acquired Swift Transportation Co. |
| (c) | Revenue equipment with a carrying amount of $3.6 million was written down to its fair value of $2.3 million, resulting in a pre-tax impairment charge of $1.3 million in the first quarter of 2010 and non-operating real estate properties held and used with a carrying amount of $2.1 million were written down to their fair value of $1.6 million, resulting in a pre-tax impairment charge of $0.5 million in the first quarter of 2009. |
| (d) | Incremental pre-tax depreciation expense of $7.4 million reflecting management’s revised estimates regarding salvage value and useful lives for approximately 7,000 dry van trailers, which management decided during the first quarter of 2010 to scrap over the next few years. |
| (e) | Excludable transactions costs include $3.9 million of pre-tax transactions costs in the three months ended December 31, 2009 related to an amendment of our previous senior credit facility and the concurrent senior secured notes amendment and $2.6 million of pre-tax transaction costs during the third quarter of 2009 related to our cancelled bond offering. |
| (f) | In the fourth quarter of 2010, we incurred a $22.6 million one-time non-cash equity compensation charge for certain stock options that vested upon our IPO. |
|
|
23 |
ADJUSTED EARNINGS BEFORE INTEREST, TAXES, DEPRECIATION AND AMORTIZATION (UNAUDITED) (a)
THREE MONTHS AND YEAR ENDED DECEMBER 31, 2011, 2010 AND 2009
| Three Months
Ended December 31, |
Year
Ended December 31, |
|||||||||||||||||||||||
| 2011 | 2010 | 2009 | 2011 | 2010 | 2009 | |||||||||||||||||||
| (Amounts in thousands) | ||||||||||||||||||||||||
| Net income (loss) |
$ | 36,812 | $ | (48,314 | ) | $ | (357,131 | ) | $ | 90,550 | $ | (125,413 | ) | $ | (435,645 | ) | ||||||||
| Adjusted for: |
||||||||||||||||||||||||
| Depreciation and amortization of property and equipment |
51,204 | 49,830 | 54,450 | 204,173 | 206,279 | 230,339 | ||||||||||||||||||
| Amortization of intangibles |
4,405 | 4,840 | 5,603 | 18,258 | 20,472 | 23,192 | ||||||||||||||||||
| Interest expense |
35,212 | 61,670 | 62,171 | 145,973 | 251,129 | 200,512 | ||||||||||||||||||
| Derivative interest expense |
2,990 | 11,430 | 24,941 | 15,057 | 70,399 | 55,634 | ||||||||||||||||||
| Interest income |
(400 | ) | (579 | ) | (444 | ) | (1,900 | ) | (1,379 | ) | (1,814 | ) | ||||||||||||
| Income tax expense (benefit) |
22,800 | (41,837 | ) | 320,976 | 58,282 | (43,432 | ) | 326,650 | ||||||||||||||||
|
|
|
|
|
|
|
|
|
|
|
|
|
|||||||||||||
| Earnings before interest, taxes, depreciation and amortization (EBITDA) |
$ | 153,023 | $ | 37,040 | $ | 110,566 | $ | 530,393 | $ | 378,055 | $ | 398,868 | ||||||||||||
|
|
|
|
|
|
|
|
|
|
|
|
|
|||||||||||||
| Non-cash equity compensation (b) |
1,261 | 22,883 | — | 6,785 | 22,883 | — | ||||||||||||||||||
| Loss on debt extinguishment |
95,461 | — | — | 95,461 | — | |||||||||||||||||||
| Non-cash impairments (c) |
— | — | — | — | 1,274 | 515 | ||||||||||||||||||
| Excludable transaction costs (d) |
— | — | 3,876 | — | — | 6,477 | ||||||||||||||||||
|
|
|
|
|
|
|
|
|
|
|
|
|
|||||||||||||
| Adjusted earnings before interest, taxes, depreciation and amortization (Adjusted EBITDA) |
$ | 154,284 | $ | 155,384 | $ | 114,442 | $ | 537,178 | $ | 497,673 | $ | 405,860 | ||||||||||||
|
|
|
|
|
|
|
|
|
|
|
|
|
|||||||||||||
| (a) | We define Adjusted EBITDA as net income (loss) plus (i) depreciation and amortization, (ii) interest and derivative interest expense, including other fees and charges associated with indebtedness, net of interest income, (iii) income tax expense (benefit), (iv) non-cash equity compensation expense, (v) non-cash impairments, (vi) other special non-cash items, and (vii) excludable transaction costs. We believe that Adjusted EBITDA is a relevant measure for estimating the cash generated by our operations that would be available to cover capital expenditures, taxes, interest and other investments and that it enhances an investor’s understanding of our financial performance. We use Adjusted EBITDA for business planning purposes and in measuring our performance relative to that of our competitors. Our method of computing Adjusted EBITDA is consistent with that used in our senior secured credit agreement for covenant compliance purposes and may differ from similarly titled measures of other companies. Adjusted EBITDA is not a recognized measure under GAAP. Adjusted EBITDA should be considered in addition to, not as a substitute for or superior to, net income, cash flow from operations, operating income or any other performance measures derived in accordance with GAAP as measures of operating performance or operating cash flows as a measure of liquidity. |
| (b) | Represents recurring non-cash equity compensation expense following our IPO, on a pre-tax basis. In accordance with the terms of our senior credit agreement, this expense is added back in the calculation of Adjusted EBITDA for covenant compliance purposes. |
| (c) | Revenue equipment with a carrying amount of $3.6 million was written down to its fair value of $2.3 million, resulting in a pre-tax impairment charge of $1.3 million in the first quarter of 2010 and non-operating real estate properties held and used with a carrying amount of $2.1 million were written down to their fair value of $1.6 million, resulting in a pre-tax impairment charge of $0.5 million in the first quarter of 2009. |
| (d) | Excludable transactions costs include $3.9 million of pre-tax transactions costs in the three months ended December 31, 2009 related to an amendment of our previous senior credit facility and the concurrent senior secured notes amendment and $2.6 million of pre-tax transaction costs during the third quarter of 2009 related to our cancelled bond offering. |
|
|
24 |
OPERATING STATISTICS (UNAUDITED)
| Three Months Ended December 31, |
Year
Ended December 31, |
|||||||||||||||
| 2011 | 2010 | 2011 | 2010 | |||||||||||||
| Trucking revenue (1,2) |
$ | 600,389 | $ | 576,012 | $ | 2,366,604 | 2,201,684 | |||||||||
| Weekly trucking revenue per tractor (2) |
$ | 3,018 | $ | 2,936 | 2,997 | 2,879 | ||||||||||
| Deadhead miles percentage |
11.7 | % | 12.3 | % | 11.8 | % | 12.1 | % | ||||||||
| Average loaded length of haul (miles) |
412 | 436 | 424 | 439 | ||||||||||||
| Average tractors available for dispatch Company |
10,940 | 10,991 | 11,044 | 10,838 | ||||||||||||
| Owner Operator |
4,197 | 3,936 | 4,100 | 3,829 | ||||||||||||
|
|
|
|
|
|
|
|
|
|||||||||
| Total |
15,137 | 14,927 | 15,144 | 14,667 | ||||||||||||
|
|
|
|
|
|
|
|
|
|||||||||
Notes to Operating Statistics:
| (1) | In thousands. |
| (2) | Excludes fuel surcharge, rail, third party carrier, leasing, and other shop and miscellaneous revenue. |
|
|
25 |
SELECTED CONSOLIDATED BALANCE SHEET DATA (UNAUDITED)
AS OF DECEMBER 31, 2011 AND 2010
| December 31, 2011 | December 31, 2010 | |||||||
| (Amounts in thousands) | ||||||||
| Cash and cash equivalents |
$ | 82,084 | $ | 47,494 | ||||
| Restricted cash |
71,724 | 84,568 | ||||||
| Accounts receivable, net |
324,035 | 276,879 | ||||||
| Property and equipment, net |
1,299,997 | 1,339,638 | ||||||
| Intangible assets, net |
350,486 | 368,744 | ||||||
| Goodwill |
253,256 | 253,256 | ||||||
| Other assets |
257,083 | 197,316 | ||||||
|
|
|
|
|
|||||
| Total assets |
$ | 2,638,665 | $ | 2,567,895 | ||||
|
|
|
|
|
|||||
| Total debt and capital lease obligations (1) |
1,589,443 | 1,774,100 | ||||||
| Securitization of accounts receivable |
180,000 | 171,500 | ||||||
| Other liabilities |
783,033 | 705,466 | ||||||
|
|
|
|
|
|||||
| Total liabilities |
2,552,476 | 2,651,066 | ||||||
|
|
|
|
|
|||||
| Stockholders’ equity (deficit) |
86,189 | (83,171 | ) | |||||
|
|
|
|
|
|||||
| Total liabilities and stockholders’ equity (deficit) |
$ | 2,638,665 | $ | 2,567,895 | ||||
|
|
|
|
|
|||||
Notes to Selected Consolidated Balance Sheet Data:
| (1) | Total debt and capital lease obligations as of December 31, 2011 includes $925.5 million net carrying value of senior secured first lien term loan, $491.3 million net carrying value of senior second priority secured notes, $15.6 million of unsecured fixed rate notes, and $157.0 million of other secured indebtedness and capital lease obligations. Total debt and capital lease obligations as of December 31, 2010 includes $1,059.4 million net carrying value of senior secured first lien term loan, $490.0 million net carrying value of senior second priority secured notes, $11.0 million of unsecured floating rate notes, $15.6 million of unsecured fixed rate notes, and $198.1 million of other secured indebtedness and capital lease obligations. |
|
|
26 |
SELECTED CONSOLIDATED CASH FLOW DATA (UNAUDITED)
YEARS ENDED DECEMBER 31, 2011 AND 2010
| Year Ended December 31, | ||||||||
| 2011 | 2010 | |||||||
| (Amounts in thousands) | ||||||||
| Net income (loss) |
$ | 90,550 | $ | (125,413 | ) | |||
| Adjustments to reconcile net income (loss) to net cash provided by operating activities |
294,604 | 314,507 | ||||||
| (Decrease) in cash resulting from changes in Accounts receivable, inventories, other assets, accounts payable, accrued liabilities and other liabilities |
(61,257 | ) | (130,655 | ) | ||||
|
|
|
|
|
|||||
| Net cash provided by operating activities |
$ | 323,897 | $ | 58,439 | ||||
|
|
|
|
|
|||||
| Capital expenditures, net of disposal proceeds |
$ | (172,467 | ) | $ | (126,107 | ) | ||
| Decrease (increase) in restricted cash |
12,843 | (59,699 | ) | |||||
| Other investing activities |
9,388 | 7,285 | ||||||
|
|
|
|
|
|||||
| Net cash used in investing activities |
$ | (150,236 | ) | $ | (178,521 | ) | ||
|
|
|
|
|
|||||
| Proceeds from issuance of common stock, net of fees and costs of issuance(1) |
$ | 62,994 | $ | — | ||||
| Proceeds from refinancing transactions, net of fees and costs of issuance(2) |
— | 2,249,924 | ||||||
| Repayment of then-existing credit facility and notes(2) |
— | (2,171,040 | ) | |||||
| Repayment of long term debt and capital lease obligations |
(206,692 | ) | (49,766 | ) | ||||
| Net change in accounts receivable securitization obligation |
8,500 | 23,500 | ||||||
| Other financing activities |
(3,873 | ) | (904 | ) | ||||
|
|
|
|
|
|||||
| Net cash (used in) provided by financing activities |
$ | (139,071 | ) | $ | 51,714 | |||
|
|
|
|
|
|||||
| Net increase (decrease) in cash and cash equivalents |
34,590 | (68,368 | ) | |||||
| Cash and cash equivalents at beginning of year |
47,494 | 115,862 | ||||||
|
|
|
|
|
|||||
| Cash and cash equivalents at end of year |
$ | 82,084 | $ | 47,494 | ||||
|
|
|
|
|
|||||
Notes to Selected Consolidated Cash Flow Data:
| (1) | On January 20, 2011, we issued an additional 6,050,000 shares of our Class A common stock to the underwriters of our IPO at the IPO price of $11.00 per share, less the underwriters’ discount, and received proceeds of $63.2 million in cash, prior to expenses of such issuance, pursuant to the over-allotment option in the underwriting agreement. Of these proceeds, $60.0 million were used in January 2011 to pay down the first lien term loan and $3.2 million were used in February 2011 to pay down our prior accounts receivable securitization facility. |
| (2) | As part of our IPO and refinancing transactions in December 2010, we used $66.4 million of the proceeds to terminate and settle our remaining interest rate swap agreements, which payment is included in cash flows from operating activities. |
|
|
27 |