Attached files
UNITED STATES
SECURITIES AND EXCHANGE COMMISSION
Washington, D.C. 20549
_____________________________________________________________________
FORM 10-Q
_____________________________________________________________________
ý QUARTERLY REPORT PURSUANT TO SECTION 13 OR 15(d) OF THE SECURITIES EXCHANGE ACT OF 1934
For the quarterly period ended September 30, 2016
or
o TRANSITION REPORT PURSUANT TO SECTION 13 OR 15(d) OF THE SECURITIES EXCHANGE ACT OF 1934
For the transition period from to
Commission File Number: 001-35007
_____________________________________________________________________

Swift Transportation Company
(Exact name of registrant as specified in its charter)
_____________________________________________________________________
Delaware | 20-5589597 | |
(State or other jurisdiction of incorporation or organization) | (I.R.S. Employer Identification No.) | |
2200 South 75th Avenue
Phoenix, AZ 85043
(Address of principal executive offices and zip code)
(602) 269-9700
(Registrant’s telephone number, including area code)
N/A
(Former name, former address and former fiscal year, if changed since last report)
______________________________________________________________________
Indicate by check mark whether the registrant: (1) has filed all reports required to be filed by Section 13 or 15(d) of the Securities Exchange Act of 1934 during the preceding 12 months (or for such shorter period that the registrant was required to file such reports), and (2) has been subject to such filing requirements for the past 90 days. Yes ý No o
Indicate by check mark whether the registrant has submitted electronically and posted on its corporate Web site, if any, every Interactive Data File required to be submitted and posted pursuant to Rule 405 of Regulation S-T (§232.405 of this chapter) during the preceding 12 months (or for such shorter period that the registrant was required to submit and post such files). Yes ý No o
Indicate by check mark whether the registrant is a large accelerated filer, an accelerated filer, a non-accelerated filer, or a smaller reporting company. See the definitions of "large accelerated filer," "accelerated filer" and "smaller reporting company" in Rule 12b-2 of the Exchange Act.
Large accelerated filer | ý | Accelerated filer | o | |||
Non-accelerated filer | o (Do not check if a smaller reporting company) | Smaller reporting company | o | |||
Indicate by check mark whether the registrant is a shell company (as defined in Rule 12b-2 of the Exchange Act). Yes o No ý
The number of outstanding shares of the registrant’s Class A common stock as of October 25, 2016 was 82,629,985 and the number of outstanding shares of the registrant’s Class B common stock as of October 25, 2016 was 49,741,938.
QUARTERLY REPORT ON FORM 10-Q | |
TABLE OF CONTENTS | |
PART I FINANCIAL INFORMATION | PAGE |
PART II OTHER INFORMATION | |
2
QUARTERLY REPORT ON FORM 10-Q | ||
GLOSSARY OF TERMS | ||
The following glossary provides definitions for certain acronyms and terms used in this Quarterly Report on Form 10-Q. These acronyms and terms are specific to our company, commonly used in our industry, or are otherwise frequently used throughout our document. | ||
Term | Definition | |
Swift/the Company/Management/We/Us/Our | Unless otherwise indicated or the context otherwise requires, these terms represent Swift Transportation Company and its subsidiaries. Swift Transportation Company is the holding company for Swift Transportation Co., LLC (a Delaware limited liability company) and Interstate Equipment Leasing, LLC. | |
2007 Transactions | In April 2007, Jerry Moyes and his wife contributed their ownership of all of the issued and outstanding shares of IEL to Swift Corporation in exchange for additional Swift Corporation shares. In May 2007, the Moyes Affiliates (defined below), contributed their shares of Swift Transportation Co., Inc. common stock to Swift Corporation in exchange for additional Swift Corporation shares. Swift Corporation then completed its acquisition of Swift Transportation Co., Inc. through a merger on May 10, 2007, thereby acquiring the remaining outstanding shares of Swift Transportation Co., Inc. common stock. Upon completion of the 2007 Transactions, Swift Transportation Co., Inc. became a wholly-owned subsidiary of Swift Corporation. At the close of the market on May 10, 2007, the common stock of Swift Transportation Co., Inc. ceased trading on NASDAQ. | |
2010 METS | Mandatory Common Exchange Securities issued by Jerry Moyes and the Moyes Affiliates in 2010. | |
2013 RSA | Second Amended and Restated Receivables Sale Agreement, entered into in 2013 by SRCII (defined below), with unrelated financial entities, "The Purchasers." The 2013 RSA was later replaced by the 2015 RSA. | |
2015 RSA | Third Amendment to Amended and Restated Receivables Sale Agreement, entered into in 2015 by SRCII (defined below), with unrelated financial entities, "The Purchasers" | |
2014 Agreement | The Company's Third Amended and Restated Credit Agreement, replaced by the 2015 Agreement | |
2015 Agreement | The Company's Fourth Amended and Restated Credit Agreement | |
AOCI | Accumulated Other Comprehensive Income (Loss) | |
ASC | Accounting Standards Codification | |
ASU | Accounting Standards Update | |
Board | Swift's Board of Directors | |
COFC | Container on Flat Car | |
CSA | Compliance Safety Accountability | |
Deadhead | Tractor movement without hauling freight (unpaid miles driven) | |
DLC | Deferred Loan Cost | |
DOE | United States Department of Energy | |
EBITDA | Earnings Before Interest, Taxes, Depreciation, and Amortization (a non-GAAP measure) | |
EPS | Earnings Per Share | |
FASB | Financial Accounting Standards Board | |
FLSA | Fair Labor Standards Act | |
GAAP | United States Generally Accepted Accounting Principles | |
IEL | Interstate Equipment Leasing, LLC (formerly Interstate Equipment Leasing, Inc.) | |
IPO | Initial Public Offering | |
3
GLOSSARY OF TERMS — CONTINUED | ||
The following glossary provides definitions for certain acronyms and terms used in this Quarterly Report on Form 10-Q. These acronyms and terms are specific to our company, commonly used in our industry, or are otherwise frequently used throughout our document. | ||
Term | Definition | |
LIBOR | London InterBank Offered Rate | |
Moyes Affiliates | Jerry Moyes, The Jerry and Vickie Moyes Family Trust dated December 11, 1987, and various Moyes children’s trusts | |
NASDAQ | National Association of Securities Dealers Automated Quotations | |
New Revolver | Revolving line of credit under the 2015 Agreement | |
New Term Loan A | The Company's first lien term loan A under the 2015 Agreement | |
NLRB | National Labor Relations Board | |
OID | Original Issue Discount | |
Old Revolver | Revolving line of credit under the 2014 Agreement | |
Old Term Loan A | The Company's first lien term loan A under the 2014 Agreement | |
QTD | Quarter-to-date, or three months ended | |
Revenue xFSR | Revenue, Excluding Fuel Surcharge Revenue | |
SEC | United States Securities and Exchange Commission | |
SRCII | Swift Receivables Company II, LLC | |
The Purchasers | Unrelated financial entities in the 2013 RSA and 2015 RSA, which were accounts receivable securitization agreements entered into by SRCII | |
Term Loan B | The Company's first lien term loan B under the 2014 Agreement | |
TOFC | Trailer on Flat Car | |
VPF | Variable Prepaid Forward (contract) | |
YTD | Year-to-date, or nine months ended | |
4
PART I FINANCIAL INFORMATION | ||||
ITEM 1. | FINANCIAL STATEMENTS |
CONSOLIDATED BALANCE SHEETS
(UNAUDITED)
September 30, 2016 | December 31, 2015 | ||||||
(In thousands, except share data) | |||||||
ASSETS | |||||||
Current assets: | |||||||
Cash and cash equivalents | $ | 71,258 | $ | 107,590 | |||
Cash and cash equivalents – restricted | 59,487 | 55,241 | |||||
Restricted investments, held to maturity, amortized cost | 22,864 | 23,215 | |||||
Accounts receivable, net | 403,895 | 422,421 | |||||
Income tax refund receivable | 9,987 | 11,664 | |||||
Inventories and supplies | 16,264 | 18,426 | |||||
Assets held for sale | 11,830 | 9,084 | |||||
Prepaid taxes, licenses, insurance, and other | 50,669 | 48,149 | |||||
Current portion of notes receivable | 7,668 | 9,817 | |||||
Total current assets | 653,922 | 705,607 | |||||
Property and equipment, at cost: | |||||||
Revenue and service equipment | 2,233,507 | 2,278,618 | |||||
Land | 131,693 | 131,693 | |||||
Facilities and improvements | 278,291 | 269,769 | |||||
Furniture and office equipment | 110,996 | 99,519 | |||||
Total property and equipment | 2,754,487 | 2,779,599 | |||||
Less: accumulated depreciation and amortization | (1,200,613 | ) | (1,128,499 | ) | |||
Net property and equipment | 1,553,874 | 1,651,100 | |||||
Other assets | 22,664 | 26,585 | |||||
Intangible assets, net | 270,508 | 283,119 | |||||
Goodwill | 253,256 | 253,256 | |||||
Total assets | $ | 2,754,224 | $ | 2,919,667 | |||
LIABILITIES AND STOCKHOLDERS’ EQUITY | |||||||
Current liabilities: | |||||||
Accounts payable | $ | 138,087 | $ | 121,827 | |||
Accrued liabilities | 132,918 | 97,313 | |||||
Current portion of claims accruals | 78,478 | 84,429 | |||||
Current portion of long-term debt | 799 | 35,514 | |||||
Current portion of capital lease obligations | 71,988 | 59,794 | |||||
Total current liabilities | 422,270 | 398,877 | |||||
Revolving line of credit | 50,000 | 200,000 | |||||
Long-term debt, less current portion | 593,263 | 643,663 | |||||
Capital lease obligations, less current portion | 176,871 | 222,001 | |||||
Claims accruals, less current portion | 155,317 | 149,281 | |||||
Deferred income taxes | 438,369 | 463,832 | |||||
Accounts receivable securitization | 299,196 | 223,927 | |||||
Other liabilities | 6,699 | 959 | |||||
Total liabilities | 2,141,985 | 2,302,540 | |||||
Commitments and Contingencies (Notes 9 and 10) | |||||||
Stockholders’ equity: | |||||||
Preferred stock, par value $0.01 per share; authorized 10,000,000 shares; none issued | — | — | |||||
Class A common stock, par value $0.01 per share; authorized 500,000,000 shares; 82,615,248 and 87,808,801 shares issued and outstanding as of September 30, 2016 and December 31, 2015, respectively | 826 | 878 | |||||
Class B common stock, par value $0.01 per share; authorized 250,000,000 shares; 49,741,938 and 50,991,938 shares issued and outstanding as of September 30, 2016 and December 31, 2015, respectively | 497 | 510 | |||||
Additional paid-in capital | 690,317 | 754,589 | |||||
Accumulated deficit | (79,503 | ) | (139,033 | ) | |||
Accumulated other comprehensive income | — | 81 | |||||
Noncontrolling interest | 102 | 102 | |||||
Total stockholders’ equity | 612,239 | 617,127 | |||||
Total liabilities and stockholders’ equity | $ | 2,754,224 | $ | 2,919,667 | |||
See accompanying notes to consolidated financial statements.
5
CONSOLIDATED INCOME STATEMENTS
(UNAUDITED)
Three Months Ended September 30, | Nine Months Ended September 30, | ||||||||||||||
2016 | 2015 | 2016 | 2015 | ||||||||||||
(In thousands, except per share data) | |||||||||||||||
Operating revenue: | |||||||||||||||
Revenue, excluding fuel surcharge revenue | $ | 929,732 | $ | 954,974 | $ | 2,772,054 | $ | 2,785,737 | |||||||
Fuel surcharge revenue | 83,494 | 109,999 | 220,849 | 353,784 | |||||||||||
Operating revenue | 1,013,226 | 1,064,973 | 2,992,903 | 3,139,521 | |||||||||||
Operating expenses: | |||||||||||||||
Salaries, wages, and employee benefits | 293,098 | 283,767 | 868,831 | 821,747 | |||||||||||
Operating supplies and expenses | 113,750 | 102,719 | 291,185 | 288,070 | |||||||||||
Fuel | 90,464 | 103,023 | 252,822 | 326,598 | |||||||||||
Purchased transportation | 280,041 | 299,866 | 830,952 | 883,354 | |||||||||||
Rental expense | 57,004 | 59,088 | 170,326 | 180,909 | |||||||||||
Insurance and claims | 47,372 | 52,877 | 140,888 | 139,390 | |||||||||||
Depreciation and amortization of property and equipment | 67,245 | 66,852 | 198,884 | 184,194 | |||||||||||
Amortization of intangibles | 4,204 | 4,204 | 12,611 | 12,611 | |||||||||||
Gain on disposal of property and equipment | (5,620 | ) | (9,825 | ) | (16,909 | ) | (23,987 | ) | |||||||
Communication and utilities | 7,130 | 8,236 | 20,977 | 23,134 | |||||||||||
Operating taxes and licenses | 18,685 | 19,245 | 55,795 | 55,104 | |||||||||||
Total operating expenses | 973,373 | 990,052 | 2,826,362 | 2,891,124 | |||||||||||
Operating income | 39,853 | 74,921 | 166,541 | 248,397 | |||||||||||
Other expenses (income): | |||||||||||||||
Interest expense | 7,384 | 9,130 | 23,545 | 29,627 | |||||||||||
Derivative interest expense | — | 68 | — | 3,972 | |||||||||||
Interest income | (624 | ) | (647 | ) | (2,011 | ) | (1,825 | ) | |||||||
Loss on debt extinguishment | — | 9,567 | — | 9,567 | |||||||||||
Non-cash impairments of non-operating assets | — | — | — | 1,480 | |||||||||||
Legal settlements and reserves | — | — | 3,000 | 6,000 | |||||||||||
Other income, net | (1,223 | ) | (752 | ) | (3,093 | ) | (2,341 | ) | |||||||
Total other expenses (income), net | 5,537 | 17,366 | 21,441 | 46,480 | |||||||||||
Income before income taxes | 34,316 | 57,555 | 145,100 | 201,917 | |||||||||||
Income tax expense | 10,292 | 21,274 | 46,275 | 76,842 | |||||||||||
Net income | $ | 24,024 | $ | 36,281 | $ | 98,825 | $ | 125,075 | |||||||
Basic earnings per share | $ | 0.18 | $ | 0.25 | $ | 0.73 | $ | 0.88 | |||||||
Diluted earnings per share | $ | 0.18 | $ | 0.25 | $ | 0.73 | $ | 0.87 | |||||||
Shares used in per share calculations: | |||||||||||||||
Basic | 132,930 | 142,801 | 134,622 | 142,535 | |||||||||||
Diluted | 134,462 | 144,132 | 136,227 | 144,238 | |||||||||||
See accompanying notes to consolidated financial statements.
6
CONSOLIDATED STATEMENTS OF COMPREHENSIVE INCOME
(UNAUDITED)
Three Months Ended September 30, | Nine Months Ended September 30, | ||||||||||||||
2016 | 2015 | 2016 | 2015 | ||||||||||||
(In thousands) | |||||||||||||||
Net income | $ | 24,024 | $ | 36,281 | $ | 98,825 | $ | 125,075 | |||||||
Accumulated losses on derivatives reclassified to derivative interest expense | — | 69 | — | 3,886 | |||||||||||
Other | — | — | (81 | ) | — | ||||||||||
Other comprehensive income (loss) before income taxes | — | 69 | (81 | ) | 3,886 | ||||||||||
Income tax effect of items within other comprehensive income (loss) | — | — | — | (1,469 | ) | ||||||||||
Other comprehensive income (loss), net of income taxes | — | 69 | (81 | ) | 2,417 | ||||||||||
Total comprehensive income | $ | 24,024 | $ | 36,350 | $ | 98,744 | $ | 127,492 | |||||||
See accompanying notes to consolidated financial statements.
7
CONSOLIDATED STATEMENT OF STOCKHOLDERS' EQUITY
(UNAUDITED)
Class A Common Stock | Class B Common Stock | Additional Paid-in Capital | Accumulated Deficit | Accumulated Other Comprehensive Income | Noncontrolling Interest | Total Stockholders’ Equity | |||||||||||||||||||||||||||
Shares | Par Value | Shares | Par Value | ||||||||||||||||||||||||||||||
(In thousands, except share data) | |||||||||||||||||||||||||||||||||
Balances, December 31, 2015 | 87,808,801 | $ | 878 | 50,991,938 | $ | 510 | $ | 754,589 | $ | (139,033 | ) | $ | 81 | $ | 102 | $ | 617,127 | ||||||||||||||||
Common stock issued under stock plans | 785,416 | 8 | 5,167 | 5,175 | |||||||||||||||||||||||||||||
Stock-based compensation expense | 4,691 | 4,691 | |||||||||||||||||||||||||||||||
Excess tax benefit from stock-based compensation | 547 | 547 | |||||||||||||||||||||||||||||||
Shares issued under employee stock purchase plan | 63,941 | — | 955 | 955 | |||||||||||||||||||||||||||||
Repurchase and cancellation of Class A common stock | (7,292,910 | ) | (73 | ) | (75,632 | ) | (39,295 | ) | (115,000 | ) | |||||||||||||||||||||||
Conversion of Class B common stock to Class A common stock | 1,250,000 | 13 | (1,250,000 | ) | (13 | ) | — | ||||||||||||||||||||||||||
Net income | 98,825 | 98,825 | |||||||||||||||||||||||||||||||
Other comprehensive income (loss), net of income taxes | (81 | ) | (81 | ) | |||||||||||||||||||||||||||||
Balances, September 30, 2016 | 82,615,248 | $ | 826 | 49,741,938 | $ | 497 | $ | 690,317 | $ | (79,503 | ) | $ | — | $ | 102 | $ | 612,239 | ||||||||||||||||
See accompanying notes to consolidated financial statements.
8
CONSOLIDATED STATEMENTS OF CASH FLOWS
(UNAUDITED)
Nine Months Ended September 30, | |||||||
2016 | 2015 | ||||||
(In thousands) | |||||||
Cash flows from operating activities: | |||||||
Net income | $ | 98,825 | $ | 125,075 | |||
Adjustments to reconcile net income to net cash provided by operating activities: | |||||||
Depreciation and amortization of property, equipment, and intangibles | 211,495 | 196,805 | |||||
Amortization of debt issuance costs, original issue discount, and other | 996 | 5,574 | |||||
Gain on disposal of property and equipment, less write-off of totaled tractors | (14,797 | ) | (21,974 | ) | |||
Impairments | — | 1,480 | |||||
Deferred income taxes | (25,670 | ) | (8,106 | ) | |||
Provision for (reduction of) losses on accounts receivable | (2,626 | ) | 5,348 | ||||
Non-cash loss on debt extinguishment and write-offs of deferred financing costs and original issue discount | — | 9,567 | |||||
Stock-based compensation expense | 4,691 | 4,618 | |||||
Excess tax benefit from stock-based compensation | (547 | ) | (2,200 | ) | |||
Income effect of mark-to-market adjustment of interest rate swaps | — | 87 | |||||
Increase (decrease) in cash resulting from changes in: | |||||||
Accounts receivable | 21,152 | 25,328 | |||||
Inventories and supplies | 2,162 | (102 | ) | ||||
Prepaid expenses and other current assets | (843 | ) | (1,197 | ) | |||
Other assets | 2,682 | 6,583 | |||||
Accounts payable, and accrued and other liabilities | 31,313 | 10,336 | |||||
Net cash provided by operating activities | 328,833 | 357,222 | |||||
Cash flows from investing activities: | |||||||
Increase in cash and cash equivalents – restricted | (4,246 | ) | (12,832 | ) | |||
Proceeds from maturities of investments | 23,869 | 23,965 | |||||
Purchases of investments | (23,737 | ) | (22,710 | ) | |||
Proceeds from sale of property and equipment | 96,228 | 76,545 | |||||
Capital expenditures | (141,269 | ) | (260,858 | ) | |||
Payments received on notes receivable | 4,763 | 3,137 | |||||
Expenditures on assets held for sale | (24,784 | ) | (19,777 | ) | |||
Payments received on assets held for sale | 18,459 | 8,019 | |||||
Payments received on equipment sale receivables | — | 293 | |||||
Net cash used in investing activities | (50,717 | ) | (204,218 | ) | |||
Cash flows from financing activities: | |||||||
Repayment of long-term debt and capital leases | (131,125 | ) | (954,561 | ) | |||
Proceeds from long-term debt | — | 684,504 | |||||
Net (repayments) borrowings on revolving line of credit | (150,000 | ) | 143,000 | ||||
Borrowings under accounts receivable securitization | 100,000 | 65,000 | |||||
Repayment of accounts receivable securitization | (25,000 | ) | (149,000 | ) | |||
Payment of deferred loan costs | — | (3,240 | ) | ||||
Proceeds from common stock issued | 6,130 | 7,667 | |||||
Repurchases of Class A common stock | (115,000 | ) | — | ||||
Excess tax benefit from stock-based compensation | 547 | 2,200 | |||||
Net cash used in financing activities | (314,448 | ) | (204,430 | ) | |||
Net decrease in cash and cash equivalents | (36,332 | ) | (51,426 | ) | |||
Cash and cash equivalents at beginning of period | 107,590 | 105,132 | |||||
Cash and cash equivalents at end of period | $ | 71,258 | $ | 53,706 | |||
See accompanying notes to consolidated financial statements.
9
CONSOLIDATED STATEMENTS OF CASH FLOWS — CONTINUED
(UNAUDITED)
Nine Months Ended September 30, | |||||||
2016 | 2015 | ||||||
(In thousands) | |||||||
Supplemental disclosures of cash flow information: | |||||||
Cash paid during the period for: | |||||||
Interest | $ | 22,818 | $ | 37,254 | |||
Income taxes | 67,058 | 77,335 | |||||
Non-cash investing activities: | |||||||
Equipment purchase accrual | $ | 29,813 | $ | 11,801 | |||
Notes receivable from sale of assets | 1,416 | 5,618 | |||||
Equipment sales receivables | — | 5 | |||||
Non-cash financing activities: | |||||||
Capital lease additions | $ | 12,811 | $ | 142,937 | |||
Accrued deferred loan costs | — | 250 | |||||
See accompanying notes to consolidated financial statements.
10
Notes to Consolidated Financial Statements (Unaudited) |
Note 1 — Introduction and Basis of Presentation
Certain acronyms and terms used throughout this Quarterly Report on Form 10-Q are specific to our company, commonly used in our industry, or are otherwise frequently used throughout our document. Definitions for these acronyms and terms are provided in the "Glossary of Terms," available in the front of this document.
Description of Business
Swift is a transportation solutions provider, headquartered in Phoenix, Arizona. As of September 30, 2016, the Company's fleet of revenue equipment included 19,157 tractors (comprised of 14,380 company tractors and 4,777 owner-operator tractors), 62,727 trailers, and 9,131 intermodal containers. The Company’s four reportable segments are Truckload, Dedicated, Swift Refrigerated, and Intermodal.
Seasonality
In the truckload industry, results of operations generally show a seasonal pattern. As customers ramp up for the year-end holiday season, the late third quarter and fourth quarter have historically been the Company's strongest volume periods. As customers reduce shipments after the winter holiday season, the first quarter has historically been a lower-volume quarter than the other three quarters. In recent years, the macro consumer buying patterns combined with shippers’ supply chain management, which historically contributed to the fourth quarter "peak" season, continued to evolve. As a result, the Company's fourth quarter 2015, 2014, and 2013 volumes were more evenly distributed throughout the quarter, rather than peaking early in the quarter. In the eastern and mid-western United States, and to a lesser extent in the western United States, the Company's equipment utilization typically declines and operating expenses generally increase during the winter season. This tends to be attributed to declines in fuel efficiency from engine idling and increases in accident frequency, claims, and equipment repairs from severe weather. The Company's revenue is directly related to shippers' available working days. As such, curtailed operations and vacation shutdowns around the holidays may affect the Company's revenue. From time to time, the Company also suffers short-term impacts from severe weather and similar events, such as tornadoes, hurricanes, blizzards, ice storms, floods, fires, earthquakes, and explosions that could add volatility to, or harm, the Company's results of operations.
Basis of Presentation
The consolidated financial statements and footnotes included in this Quarterly Report on Form 10-Q should be read in conjunction with the consolidated financial statements and footnotes included in the Company's Annual Report on Form 10-K for the year ended December 31, 2015. The consolidated financial statements include the accounts of Swift Transportation Company and its wholly-owned subsidiaries. In management's opinion, these consolidated financial statements were prepared in accordance with GAAP and include all adjustments necessary for the fair presentation of the periods presented.
Change in Accounting Estimate
In August 2016, the Company decreased the estimated residual values of a certain group of its tractors, given recent trends in the used tractor market. Management prospectively accounted for this as a change in accounting estimate. This increased "Depreciation and amortization of property and equipment" in the consolidated income statements by approximately $3.6 million for the three and nine months ended September 30, 2016, which immaterially affected basic and diluted earnings per share.
Change in Presentation
In April 2015, FASB issued ASU 2015-03, Simplifying the Presentation of Debt Issuance Costs, which amended ASC Subtopic 835-30, Interest – Imputation of Interest. The amendments in this ASU simplify the presentation of debt issuance costs and align the presentation with debt discounts. Entities are required to present debt issuance costs within liabilities as a direct deduction from the face amount of the related debt, rather than as a deferred charge within assets. In August 2015, FASB issued ASU 2015-15, Presentation and Subsequent Measurement of Debt Issuance Costs Associated with Line-of-Credit Arrangements – Amendments to SEC Paragraphs Pursuant to Staff Announcement at June 18, 2015 EITF Meeting (SEC Update), which also amended ASC Subtopic 835-30, Interest – Imputation of Interest. The SEC determined that ASU 2015-03 (discussed above) did not address costs related to line-of-credit arrangements. The amendments in ASU 2015-15 clarify that entities may defer and present debt issuance costs as an asset, and subsequently amortize the deferred debt issuance costs ratably over the term of the line-of-credit arrangement, regardless of whether there are any outstanding borrowings on the line-of-credit arrangement. The amendments in these ASUs require retrospective application, with related disclosures for a change in accounting principle. For public business entities, the amendments in these ASUs are effective for financial statements issued for fiscal years beginning after December 15, 2015, and the interim periods within those fiscal years, with early adoption permitted.
11
NOTES TO CONSOLIDATED FINANCIAL STATEMENTS (UNAUDITED) — CONTINUED
The Company adopted this guidance at the beginning of 2016. Accordingly, DLCs, except for those associated with the Company’s New Revolver, are presented as direct deductions from the face amount of the related debt. The Company retrospectively adjusted the December 31, 2015 consolidated balance sheet to align with the current period presentation, as follows:
December 31, 2015 | ||||||||||||
Financial Statement Caption | Unadjusted Consolidated Balance Sheet | Reclassification Adjustments | Adjusted Consolidated Balance Sheet | |||||||||
(In thousands) | ||||||||||||
ASSETS: | ||||||||||||
Other assets | $ | 29,353 | $ | (2,768 | ) | $ | 26,585 | |||||
LIABILITIES: | ||||||||||||
Current portion of long-term debt | $ | 35,582 | $ | (68 | ) | $ | 35,514 | |||||
Long-term debt, less current portion | 645,290 | (1,627 | ) | 643,663 | ||||||||
Accounts receivable securitization | 225,000 | (1,073 | ) | 223,927 | ||||||||
Note 2 — Recently Issued Accounting Pronouncements
The following table presents accounting pronouncements recently issued by FASB, but not yet adopted by the Company.
Date Issued | Reference | Description | Expected Adoption Date and Method | Financial Statement Impact | ||||
August 2016 | 2016-15: Statement of Cash Flows (Topic 230) – Classification of Certain Cash Receipts and Cash Payments | This ASU has several amendments, which are designed to reduce existing diversity in practice of how certain cash receipts and cash payments are presented and classified in the statement of cash flows. The ASU addresses eight specific cash flow issues, of which the following are expected to be applicable to Swift: 1) debt prepayment and extinguishment costs, 2) proceeds from settlement of insurance claims, 3) proceeds from settlement of corporate-owned life insurance policies, 4) beneficial interests in securitization transactions, and 5) separately identifiable cash flows and application of the predominance principle. | January 2018, Retrospective | Currently under evaluation; not expected to be material. | ||||
June 2016 | 2016-13: Financial Instruments – Credit Losses (Topic 326) – Measurement of Credit Losses on Financial Instruments | The purpose of this ASU is to amend the current incurred loss impairment methodology with a new methodology that reflects expected credit losses and requires a broader range of reasonable and supportable information to inform credit loss estimates. This is the final credit accounting standard, out of a series, with detailed guidance on the new loss reserve model, Current Expected Credit Loss ("CECL"). Among other provisions, the amendments in the ASU require a financial asset (or group of assets) measured at amortized cost basis to be presented at the net amount expected to be collected. Entities are no longer required to wait until a loss is probable to record it. | January 2020, Adoption method varies by amendment | Currently under evaluation; not expected to be material. | ||||
May 2016 | 2016-12: Revenue from Contracts with Customers (Topic 606) – Narrow-scope Improvements and Practical Expedients | The amendments in this ASU clarify certain aspects regarding the collectibility criterion, sales taxes collected from customers, noncash consideration, contract modifications, and completed contracts at transition. It additionally clarifies that retrospective application only requires disclosure of the accounting change effect on prior periods presented, not on the period of adoption. | January 2018, Modified retrospective | Impact of ASC Topic 606 overall is currently under evaluation; may be material, but not yet quantifiable. | ||||
12
SWIFT TRANSPORTATION COMPANY
NOTES TO CONSOLIDATED FINANCIAL STATEMENTS (UNAUDITED) — CONTINUED
Date Issued | Reference | Description | Expected Adoption Date and Method | Financial Statement Impact | ||||
April 2016 | 2016-10: Revenue from Contracts with Customers (Topic 606) – Identifying Performance Obligations and Licensing | The amendments in this ASU clarify the following two aspects of Topic 606: identifying performance obligations and the licensing implementation guidance, while retaining the related principles for those areas. The amendments do not change the core principle of the guidance. | January 2018, Modified retrospective | Impact of ASC Topic 606 overall is currently under evaluation; may be material, but not yet quantifiable. | ||||
March 2016 | 2016-08: Revenue from Contracts with Customers (Topic 606) – Principal versus Agent Considerations (Reporting Revenue Gross versus Net) | The amendments in this ASU are intended to improve the operability and understandability of the implementation guidance on principal versus agent considerations, but do not change the core principle of the guidance. | January 2018, Modified retrospective | Impact of ASC Topic 606 overall is currently under evaluation; may be material, but not yet quantifiable. | ||||
March 2016 | 2016-09: Compensation – Stock Compensation (Topic 718) – Improvements to Employee Share-based Payment Accounting | The amendments in this ASU are intended to simplify various aspects of accounting for stock-based compensation, including income tax consequences, classification of awards as equity or liability, as well as classification of activities within the statement of cash flows. | January 2017, Adoption method varies by amendment | Currently under evaluation; not yet quantifiable. | ||||
February 2016 | 2016-02: Leases (Topic 842) | The new standard requires lessees to recognize assets and liabilities arising from both operating and financing leases on the balance sheet. Lessor accounting for leases is largely unaffected by the new guidance. | January 2019, Modified retrospective | Currently under evaluation; expected to be material, but not yet quantifiable. | ||||
January 2016 | 2016-01: Financial Instruments – Overall (Subtopic 825-10) – Recognition and Measurement of Financial Assets and Financial Liabilities | The amendments in this ASU address various aspects of recognition, measurement, presentation, and disclosure of financial instruments. They additionally establish ASC Topic 321 – Investments – Equity Securities, which applies to investments in equity securities and other ownership interests in an entity, including investments in partnerships, unincorporated joint ventures, and limited liability companies. | January 2018, Modified retrospective | Not expected to be material. | ||||
Note 3 — Restricted Investments
The following table presents the cost or amortized cost, gross unrealized gains and temporary losses, and estimated fair value of the Company’s restricted investments:
September 30, 2016 | |||||||||||||||
Gross Unrealized | |||||||||||||||
Cost or Amortized Cost | Gains | Temporary Losses | Estimated Fair Value | ||||||||||||
(In thousands) | |||||||||||||||
United States corporate securities | $ | 16,483 | $ | 1 | $ | (8 | ) | $ | 16,476 | ||||||
Municipal bonds | 4,956 | — | (6 | ) | 4,950 | ||||||||||
Negotiable certificate of deposits | 1,425 | — | — | 1,425 | |||||||||||
Restricted investments, held to maturity | $ | 22,864 | $ | 1 | $ | (14 | ) | $ | 22,851 | ||||||
13
SWIFT TRANSPORTATION COMPANY
NOTES TO CONSOLIDATED FINANCIAL STATEMENTS (UNAUDITED) — CONTINUED
December 31, 2015 | |||||||||||||||
Gross Unrealized | |||||||||||||||
Cost or Amortized Cost | Gains | Temporary Losses | Estimated Fair Value | ||||||||||||
(In thousands) | |||||||||||||||
United States corporate securities | $ | 16,686 | $ | 2 | $ | (27 | ) | $ | 16,661 | ||||||
Municipal bonds | 4,904 | 1 | (1 | ) | 4,904 | ||||||||||
Negotiable certificate of deposits | 1,625 | — | — | 1,625 | |||||||||||
Restricted investments, held to maturity | $ | 23,215 | $ | 3 | $ | (28 | ) | $ | 23,190 | ||||||
Refer to Note 15 for additional information regarding fair value measurements of restricted investments.
As of September 30, 2016, the contractual maturities of the restricted investments were one year or less. There were 44 securities and 36 securities that were in an unrealized loss position for less than twelve months as of September 30, 2016 and December 31, 2015, respectively. The Company did not recognize any impairment losses for the three or nine months ended September 30, 2016 or 2015.
Note 4 — Goodwill and Other Intangible Assets
There were no goodwill impairments recorded during the three or nine months ended September 30, 2016 or 2015. Other intangible asset balances were as follows:
September 30, 2016 | December 31, 2015 | ||||||
(In thousands) | |||||||
Customer Relationships: | |||||||
Gross carrying value | $ | 275,324 | $ | 275,324 | |||
Accumulated amortization | (185,853 | ) | (173,242 | ) | |||
Customer relationships, net | 89,471 | 102,082 | |||||
Trade Name: | |||||||
Gross carrying value | 181,037 | 181,037 | |||||
Intangible assets, net | $ | 270,508 | $ | 283,119 | |||
The following table presents amortization of intangible assets related to the 2007 Transactions and intangible assets existing prior to the 2007 Transactions:
Three Months Ended September 30, | Nine Months Ended September 30, | ||||||||||||||
2016 | 2015 | 2016 | 2015 | ||||||||||||
(In thousands) | |||||||||||||||
Amortization of intangible assets related to the 2007 Transactions | $ | 3,912 | $ | 3,912 | $ | 11,736 | $ | 11,736 | |||||||
Amortization related to intangible assets existing prior to the 2007 Transactions | 292 | 292 | 875 | 875 | |||||||||||
Amortization of intangibles | $ | 4,204 | $ | 4,204 | $ | 12,611 | $ | 12,611 | |||||||
14
SWIFT TRANSPORTATION COMPANY
NOTES TO CONSOLIDATED FINANCIAL STATEMENTS (UNAUDITED) — CONTINUED
On December 10, 2015, SRCII, a wholly-owned subsidiary of the Company, entered into the 2015 RSA, which further amended the 2013 RSA. The parties to the 2015 RSA include SRCII as the seller, Swift Transportation Services, LLC as the servicer, the various conduit purchasers, the various related committed purchasers, the various purchaser agents, the various letters of credit participants, and PNC Bank, National Association as the issuing bank of letters of credit and as administrator. Pursuant to the 2015 RSA, the Company's receivable originator subsidiaries sell, on a revolving basis, undivided interests in all of their eligible accounts receivable to SRCII. In turn, SRCII sells a variable percentage ownership interest in the eligible accounts receivable to the various purchasers. The facility qualifies for treatment as a secured borrowing under ASC Topic 860, Transfers and Servicing. As such, outstanding amounts are classified as liabilities on the Company’s consolidated balance sheets. Refer to Note 15 for information regarding the fair value of the 2015 RSA.
As of September 30, 2016 and December 31, 2015, interest accrued on the aggregate principal balance at a rate of 1.1% and 1.0%, respectively. Program fees and unused commitment fees are recorded in interest expense in the Company's consolidated income statements. The Company incurred program fees of $1.2 million related to the 2015 RSA and $0.8 million related to the 2013 RSA, during the three months ended September 30, 2016 and 2015, respectively. The Company incurred program fees of $3.1 million related to the 2015 RSA and $2.7 million related to the 2013 RSA, during the nine months ended September 30, 2016 and 2015, respectively.
The 2015 RSA is subject to customary fees and contains various customary affirmative and negative covenants, representations and warranties, and default and termination provisions. Collections on the underlying receivables by the Company are held for the benefit of SRCII and the Purchasers in the facility and are unavailable to satisfy claims of the Company and its subsidiaries.
Note 6 — Debt and Financing
Other than the Company’s accounts receivable securitization, as discussed in Note 5, and its outstanding capital lease obligations as discussed in Note 8, the Company's long-term debt consisted of the following:
September 30, 2016 | December 31, 2015 | ||||||
(In thousands) | |||||||
2015 Agreement: New Term Loan A, due July 2020, net of $1,431 and $1,695 DLCs as of September 30, 2016 and December 31, 2015, respectively (1) | $ | 592,819 | $ | 668,055 | |||
Other | 1,243 | 11,122 | |||||
Long-term debt | 594,062 | 679,177 | |||||
Less: current portion of long-term debt, net of $0 and $68 DLCs as of September 30, 2016 and December 31, 2015, respectively | (799 | ) | (35,514 | ) | |||
Long-term debt, less current portion | $ | 593,263 | $ | 643,663 | |||
September 30, 2016 | December 31, 2015 | ||||||
(In thousands) | |||||||
Long-term debt | $ | 594,062 | $ | 679,177 | |||
Revolving line of credit, due July 2020 (1) (2) | 50,000 | 200,000 | |||||
Long-term debt, including revolving line of credit | $ | 644,062 | $ | 879,177 | |||
____________
(1) | Refer to Note 15 for information regarding the fair value of long-term debt. |
(2) | The Company additionally had outstanding letters of credit, primarily related to workers' compensation and self-insurance liabilities of $97.0 million and $95.0 million under the New Revolver at September 30, 2016 and December 31, 2015, respectively. |
15
SWIFT TRANSPORTATION COMPANY
NOTES TO CONSOLIDATED FINANCIAL STATEMENTS (UNAUDITED) — CONTINUED
Credit Agreement
On July 27, 2015, the Company entered into the 2015 Agreement, which replaced the 2014 Agreement, including the $450.0 million Old Revolver (zero outstanding at closing), $500.0 million Old Term Loan A ($485.0 million outstanding at closing), and $400.0 million Term Loan B ($395.0 million outstanding at closing). The 2015 Agreement includes a New Revolver and a New Term Loan A. Upon closing, the $680.0 million in proceeds from the New Term Loan A, a $200.0 million draw on the New Revolver, and $4.9 million cash on hand were used to pay off the then-outstanding balances of the Old Term Loan A and Term Loan B, including accrued interest and fees under the 2014 Agreement, as well as certain transactional fees associated with the 2015 Agreement.
The following table presents the key terms of the 2015 Agreement:
Description | New Term Loan A | New Revolver (2) | ||
(Dollars in thousands) | ||||
Maximum borrowing capacity | $680,000 | $600,000 | ||
Final maturity date | July 27, 2020 | July 27, 2020 | ||
Interest rate base | LIBOR | LIBOR | ||
LIBOR floor | —% | —% | ||
Interest rate minimum margin (1) | 1.50% | 1.50% | ||
Interest rate maximum margin (1) | 2.25% | 2.25% | ||
Minimum principal payment – amount (3) | $6,625 | $— | ||
Minimum principal payment – frequency | Quarterly | Once | ||
Minimum principal payment – commencement date (3) | December 31, 2015 | July 27, 2020 | ||
____________
(1) | The interest rate margin for the New Term Loan A and New Revolver is based on the Company's consolidated leverage ratio. As of September 30, 2016, interest accrued at 2.03% on the New Term Loan A and 2.03% on the New Revolver. As of December 31, 2015, interest accrued at 2.12% on the New Term Loan A and 2.08% on the New Revolver. |
(2) | The commitment fee for the unused portion of the New Revolver is based on the Company's consolidated leverage ratio and ranges from 0.25% to 0.35%. As of September 30, 2016, commitment fees on the unused portion of the New Revolver accrued at 0.25% and outstanding letter of credit fees accrued at 1.50%. As of December 31, 2015, commitment fees on the unused portion of the New Revolver accrued at 0.25% and outstanding letter of credit fees accrued at 1.75%. |
(3) | Commencing in March 2017, the minimum quarterly payment amount on the New Term Loan A is $12.3 million, at which it remains until final maturity. |
The New Revolver and New Term Loan A of the 2015 Agreement contain certain financial covenants with respect to a maximum leverage ratio and a minimum consolidated interest coverage ratio. The 2015 Agreement provides flexibility regarding the use of proceeds from asset sales, payment of dividends, stock repurchases, and equipment financing. In addition to the financial covenants, the 2015 Agreement includes customary events of default, including a change in control default and certain affirmative and negative covenants, including, but not limited to, restrictions, subject to certain exceptions, on incremental indebtedness, asset sales, certain restricted payments (including dividends and stock repurchases), certain incremental investments or advances, transactions with affiliates, engagement in additional business activities, and prepayment of certain other indebtedness.
Borrowings under the 2015 Agreement are secured by substantially all of the assets of the Company and are guaranteed by Swift Transportation Company, IEL, Central Refrigerated Transportation, LLC and its subsidiaries, Swift Transportation Co., LLC and its domestic subsidiaries (other than its captive insurance subsidiaries, driver academy subsidiary, and its bankruptcy-remote special purpose subsidiary).
Loss on Debt Extinguishment
The Company incurred no losses on debt extinguishment during the three and nine months ended September 30, 2016. During the three and nine months ended September 30, 2015, the Company incurred $9.6 million in losses on debt extinguishment reflecting the write-off of the unamortized OID and deferred financing fees related to the 2014 Agreement, which was replaced by the 2015 Agreement.
16
SWIFT TRANSPORTATION COMPANY
NOTES TO CONSOLIDATED FINANCIAL STATEMENTS (UNAUDITED) — CONTINUED
Note 7 — Deferred Loan Costs
As discussed in Note 1, DLCs related to the Company's New Term Loan A and accounts receivable securitization are now netted against the face amount of the debt, pursuant to the amendments in ASU 2015-03. DLCs related to the New Revolver are reported in "Other assets." The following table presents the classification of DLCs in the Company's consolidated balance sheets:
September 30, 2016 | December 31, 2015 | ||||||
(In thousands) | |||||||
ASSETS: | |||||||
Other assets | $ | 1,251 | $ | 1,496 | |||
LIABILITIES: | |||||||
Current portion of long-term debt | — | 68 | |||||
Long-term debt, less current portion | 1,431 | 1,627 | |||||
Accounts receivable securitization | 804 | 1,073 | |||||
Total DLCs | $ | 3,486 | $ | 4,264 | |||
The Company finances a portion of its revenue equipment under capital and operating leases and certain terminals under operating leases.
Capital Leases (as Lessee) — The Company’s capital leases are typically structured with balloon payments at the end of the lease term equal to the residual value the Company is contracted to receive from certain equipment manufacturers upon sale or trade back to the manufacturers. If the Company does not receive proceeds of the contracted residual value from the manufacturer, the Company is still obligated to make the balloon payment at the end of the lease term. Certain leases contain renewal or fixed price purchase options. The present value of obligations under capital leases is included under "Current portion of capital lease obligations" and "Capital lease obligations, less current portion" in the consolidated balance sheets. As of September 30, 2016, the leases were collateralized by revenue equipment with a cost of $326.2 million and accumulated amortization of $91.5 million. As of December 31, 2015, the leases were collateralized by revenue equipment with a cost of $357.8 million and accumulated amortization of $90.1 million. Amortization of the equipment under capital leases is included in "Depreciation and amortization of property and equipment" in the Company’s consolidated income statements.
Operating Leases (as Lessee) — Rent expense related to operating leases was $57.0 million and $59.1 million for the three months ended September 30, 2016 and 2015, respectively. Rent expense related to operating leases was $170.3 million and $180.9 million for the nine months ended September 30, 2016 and 2015, respectively.
As of September 30, 2016, the Company's outstanding commitments to acquire revenue equipment were as follows:
• | remainder of 2016: $174.3 million ($103.2 million of which were tractor commitments), |
• | year-ended December 31, 2017: $190.9 million ($190.9 million of which were tractor commitments), and |
• | thereafter: none. |
The Company has the option to cancel tractor purchase orders with 60 to 90 days' notice prior to the scheduled production, although the notice period has lapsed for 35.1% of the tractor commitments outstanding as of September 30, 2016. These purchases are expected to be financed by the combination of operating leases, capital leases, debt, proceeds from sales of existing equipment, and cash flows from operations.
As of September 30, 2016, the Company had $0.3 million in outstanding purchase commitments for non-revenue equipment and no purchase commitments for facilities. Factors such as costs and opportunities for future terminal expansions may change the amount of such expenditures.
17
SWIFT TRANSPORTATION COMPANY
NOTES TO CONSOLIDATED FINANCIAL STATEMENTS (UNAUDITED) — CONTINUED
The Company is involved in certain claims and pending litigation primarily arising in the normal course of business. The majority of these claims relate to workers' compensation, auto collision and liability, physical damage, and cargo damage. The Company expenses legal fees as incurred and accrues for the uninsured portion of contingent losses from these and other pending claims when it is both probable that a liability has been incurred and the amount of the loss can be reasonably estimated. Based on the knowledge of the facts and, in certain cases, advice of outside counsel, management believes the resolution of claims and pending litigation, taking into account existing reserves, will not have a material adverse effect on the Company. Moreover, the results of complex legal proceedings are difficult to predict and the Company’s view of these matters may change in the future as the litigation and events related thereto unfold.
For certain cases described below, management is unable to provide a meaningful estimate of the possible loss or range of loss because, among other reasons, (1) the proceedings are in various stages that do not allow for assessment; (2) damages have not been sought; (3) damages are unsupported and/or exaggerated; (4) there is uncertainty as to the outcome of pending appeals; and/or (5) there are significant factual issues to be resolved. For these cases, however, management does not believe, based on currently available information, that the outcomes of these proceedings will have a material adverse effect on our financial condition, though the outcomes could be material to our operating results for any particular period, depending, in part, upon the operating results for such period.
Arizona Owner-operator Class Action Litigation
On January 30, 2004, a class action lawsuit was filed by Leonel Garza on behalf of himself and all similarly-situated persons against Swift Transportation: Garza v. Swift Transportation Co., Inc., Case No. CV7-472 (the "Garza Complaint"). The putative class originally involved certain owner-operators who contracted with the Company under a 2001 Contractor Agreement that was in place for one year. The putative class is alleging that the Company should have reimbursed owner-operators for actual miles driven rather than the contracted and industry standard remuneration based upon dispatched miles. The trial court denied the plaintiff’s petition for class certification. The plaintiff appealed and on August 6, 2008, the Arizona Court of Appeals issued an unpublished Memorandum Decision reversing the trial court’s denial of class certification and remanding the case back to the trial court. On November 14, 2008, the Company filed a petition for review to the Arizona Supreme Court regarding the issue of class certification as a consequence of the denial of the Motion for Reconsideration by the Court of Appeals. On March 17, 2009, the Arizona Supreme Court granted the Company’s petition for review, and on July 31, 2009, the Arizona Supreme Court vacated the decision of the Court of Appeals, opining that the Court of Appeals lacked automatic appellate jurisdiction to reverse the trial court’s original denial of class certification and remanded the matter back to the trial court for further evaluation and determination. Thereafter, the plaintiff renewed the motion for class certification and expanded it to include all persons who were employed by Swift as employee drivers or who contracted with Swift as owner-operators on or after January 30, 1998, in each case who were compensated by reference to miles driven. On November 4, 2010, the Maricopa County trial court entered an order certifying a class of owner-operators and expanding the class to include employees. Upon certification, the Company filed a motion to compel arbitration, as well as filing numerous motions in the trial court urging dismissal on several other grounds including, but not limited to the lack of an employee as a class representative, and the named owner-operator class representative only contracted with the Company for a three-month period under a one-year contract that no longer exists. In addition to these trial court motions, the Company also filed a petition for special action with the Arizona Court of Appeals, arguing that the trial court erred in certifying the class because the trial court relied upon the Court of Appeals ruling that was previously overturned by the Arizona Supreme Court. On April 7, 2011, the Arizona Court of Appeals declined jurisdiction to hear this petition for special action and the Company filed a petition for review to the Arizona Supreme Court. On August 31, 2011, the Arizona Supreme Court declined to review the decision of the Arizona Court of Appeals. In April 2012, the trial court issued the following rulings with respect to certain motions filed by Swift: (1) denied Swift’s motion to compel arbitration; (2) denied Swift’s request to decertify the class; (3) granted Swift’s motion that there is no breach of contract; and (4) granted Swift’s motion to limit class size based on statute of limitations. On November 13, 2014, the court denied the plaintiff's motion to add new class representatives for the employee class and therefore the employee class remains without a plaintiff class representative. On March 18, 2015, the court denied Swift's two motions for summary judgment (1) to dismiss any claims related to the employee class since there is no class representative; and (2) to dismiss the plaintiff's claim of breach of a duty of good faith and fair dealing. On July 14, 2015, the court granted Swift's motion to decertify the entire class. On December 23, 2015, the plaintiff filed a petition for special action with the Arizona Court of Appeals. On July 12, 2016, the Court of Appeals reversed the lower court’s order decertifying the class. Swift filed a petition for review with the Arizona Supreme Court on August 12, 2016. A decision regarding the petition for review is forthcoming. The final disposition of this case and the impact of such disposition cannot be determined at this time.
Ninth Circuit Owner-operator Misclassification Class Action Litigation
On December 22, 2009, a class action lawsuit was filed against Swift Transportation and IEL: Virginia VanDusen, John Doe 1, and Joseph Sheer, individually and on behalf of all other similarly-situated persons v. Swift Transportation Co., Inc., Interstate Equipment Leasing, Inc., Jerry Moyes, and Chad Killebrew, Case No. 9-CIV-10376 filed in the United States District Court for the Southern District of New York (the "Sheer Complaint"). The putative class involves owner-operators alleging that Swift Transportation
18
SWIFT TRANSPORTATION COMPANY
NOTES TO CONSOLIDATED FINANCIAL STATEMENTS (UNAUDITED) — CONTINUED
misclassified owner-operators as independent contractors in violation of the federal FLSA, and various New York and California state laws and that such owner-operators should be considered employees. The lawsuit also raises certain related issues with respect to the lease agreements that certain owner-operators have entered into with IEL. At present, in addition to the named plaintiffs, approximately 450 other current or former owner-operators have joined this lawsuit. Upon Swift’s motion, the matter was transferred from the United States District Court for the Southern District of New York to the United States District Court in Arizona. On May 10, 2010, the plaintiffs filed a motion to conditionally certify an FLSA collective action and authorize notice to the potential class members. On September 23, 2010, the plaintiffs filed a motion for a preliminary injunction seeking to enjoin Swift and IEL from collecting payments from plaintiffs who are in default under their lease agreements and related relief. On September 30, 2010, the district court granted Swift’s motion to compel arbitration and ordered that the class action be stayed, pending the outcome of arbitration. The district court further denied the plaintiff’s motion for preliminary injunction and motion for conditional class certification. The district court also denied the plaintiff’s request to arbitrate the matter as a class.
The plaintiff filed a petition for a writ of mandamus to the Ninth Circuit Court of Appeals asking that the district court’s September 30, 2010 order be vacated. On July 27, 2011, the Ninth Circuit Court of Appeals denied the plaintiff’s petition for writ of mandamus and thereafter the district court denied the plaintiff’s motion for reconsideration and certified its September 30, 2010 order. The plaintiffs filed an interlocutory appeal to the Ninth Circuit Court of Appeals to overturn the district court’s September 30, 2010 order to compel arbitration, alleging that the agreement to arbitrate is exempt from arbitration under Section 1 of the Federal Arbitration Act ("FAA") because the class of plaintiffs allegedly consists of employees exempt from arbitration agreements. On November 6, 2013, the Ninth Circuit Court of Appeals reversed and remanded, stating its prior published decision, "expressly held that a district court must determine whether an agreement for arbitration is exempt from arbitration under Section 1 of the FAA as a threshold matter." As a consequence of this determination by the Ninth Circuit Court of Appeals being different from a decision of the Eighth Circuit Court of Appeals on a similar issue, on February 4, 2014, the Company filed a petition for writ of certiorari to the United States Supreme Court to address whether the district court or arbitrator should determine whether the contract is an employment contract exempt from Section 1 of the Federal Arbitration Act. On June 16, 2014, the United States Supreme Court denied the Company’s petition for writ of certiorari.
The matter remains pending in the district court and dispositive motion briefing was completed on September 30, 2016. The Company also filed a writ of mandamus and appeal from the district court's order that effectively denied the Company's motion to compel arbitration. The Ninth Circuit held oral argument on November 16, 2015, and after further briefing, dismissed the appeal on July 26, 2016, finding that it lacked jurisdiction. The Company has filed a motion for reconsideration of this decision. The Company intends to vigorously defend against any proceedings. The final disposition of this case and the impact of such final disposition cannot be determined at this time.
California Wage, Meal, and Rest Driver Class Actions
On March 22, 2010, a class action lawsuit was filed by John Burnell, individually and on behalf of all other similarly-situated persons against Swift Transportation: John Burnell and all others similarly-situated v. Swift Transportation Co., Inc., filed in the Superior Court of California, County of San Bernardino (the "Burnell Complaint"). On September 3, 2010, upon motion by Swift, the matter was removed to the United States District Court for the Central District of California (the "California Court"), Case No. EDCV10-809-VAP. The putative class includes drivers who worked for Swift during the four years preceding the date of filing and alleges that Swift failed to pay the California minimum wage, failed to provide proper meal and rest periods, and failed to timely pay wages upon separation from employment. On April 9, 2013, the Company filed a motion for judgment on the pleadings, requesting dismissal of the plaintiff's claims related to alleged meal and rest break violations under the California Labor Code alleging that such claims are preempted by the Federal Aviation Administration Authorization Act.
The issue of class certification must first be resolved before the California Court will address the merits of these cases, and the Company retains all of its defenses against liability and damages pending a determination of class certification. Class certification briefing is now complete and a class certification hearing was scheduled for April 25, 2016. The class certification hearing was held and argued as scheduled. In May 2016, the District Court issued an order denying class certification. The plaintiffs and petitioners sought leave from the Ninth Circuit Court of Appeals to appeal the class decertification order. On July 18, 2016, the court denied the plaintiffs' and petitioners' petition to appeal the decertification order. Therefore, at the present time and based upon the current procedural nature of the case, the final disposition and impact to the Company cannot be determined.
On April 5, 2012, the Company was served with an additional class action complaint, alleging facts similar to those as set forth in the Burnell Complaint: James R. Rudsell, on behalf of himself and all others similarly-situated v. Swift Transportation Co. of Arizona, LLC and Swift Transportation Company, in the Superior Court of California, County of San Bernardino (the "Rudsell Complaint"). On May 3, 2012, upon motion by Swift, the matter was removed to the California Court, Case No. EDCV12-00692-VAP. The Rudsell Complaint was stayed on April 29, 2013, pending a resolution of the Burnell Complaint.
On September 25, 2014, a class action lawsuit was filed by Lawrence Peck on behalf of himself and all other similarly-situated persons against Swift Transportation: Peck v. Swift Transportation Co. of Arizona, LLC in the Superior Court of California, County of Riverside (the "Peck Complaint"). The putative class, which includes current and former non-exempt employee truck drivers who performed services in California within the four-year statutory period, alleges that Swift failed to pay for all hours worked (specifically
19
SWIFT TRANSPORTATION COMPANY
NOTES TO CONSOLIDATED FINANCIAL STATEMENTS (UNAUDITED) — CONTINUED
that pay-per-mile fails to compensate drivers for non-driving related services), failed to pay overtime, failed to properly reimburse work-related expenses, failed to timely pay wages, and failed to provide accurate wage statements. On October 24, 2014, upon motion by Swift, the matter was removed to the California Court, Case No. 14-CV-02206-VAP. The Peck Complaint was stayed on April 6, 2015, pending a resolution of the earlier filed cases. On November 20, 2014, the plaintiff filed a Private Attorneys General Act class action lawsuit in the Superior Court of California, County of Riverside (the "Peck PAGA Complaint"). Upon motion by Swift, the Peck PAGA Complaint was stayed on March 19, 2015. On May 24, 2016, after the Burnell Court failed to certify the petitioner’s class, the plaintiff filed a motion to lift the stay regarding the Peck PAGA Complaint. On June 22, 2016, the court lifted the stay. The matter is in its initial stages and the parties are engaging in discovery.
On February 27, 2015, Sadashiv Mares filed a complaint alleging five Causes of Action arising under California state law on behalf of himself and a putative class against Swift Transportation Co. of Arizona, LLC in the Superior Court of California, County of Alameda (the "Mares Complaint"). On July 13, 2015, upon motion by Swift, the matter was removed to the United States District Court for the Northern District of California, Case No. 2:15-CV-03253-JSW. Upon the parties' stipulation, on October 17, 2015, the case was transferred to the California Court, Case No. 2:15-CV-07920-VAP. The Mares Complaint was stayed on February 24, 2016, pending a resolution of the earlier filed cases. On October 11, 2016, the court granted a motion filed by the plaintiffs to lift the stay. The matter is in its initial phases and is expected to move into discovery.
On or about April 15, 2015, a complaint was filed in the Superior Court of California, County of San Bernardino: Rafael McKinsty et al. v. Swift Transportation Co. of Arizona, LLC, et al., (the "McKinsty Complaint"). The McKinsty Complaint, a purported class action, alleges violation of California rest break laws and is similar to the Burnell, Rudsell, Peck, and Mares Complaints. On July 2, 2015, upon motion by Swift, the matter was removed to the California Court, Case No. 15-CV-1317-VAP. The McKinsty Complaint was stayed on August 19, 2015, pending a resolution of the earlier filed cases.
On October 15, 2015, a class action lawsuit was filed in the Superior Court of California, County of Riverside: Thor Nilsen v. Swift Transportation Co. of Arizona, LLC (the "Nilsen Complaint"). The Nilsen Complaint alleges violations of California law similar to the Burnell, Rudsell, Peck, Mares, and McKinsty Complaints. On December 9, 2015, upon motion by Swift, the matter was removed to the California Court, Case No. 15-CV-02504-VAP. The Nilsen Complaint was stayed January 29, 2016, pending resolution of the earlier filed cases.
California Private Attorney General Act Class Action
On July 8, 2016, a class action lawsuit was filed by Theron Christopher on behalf of himself and all other similarly-situated persons against Swift Transportation Co. of Arizona, LLC, in the Superior Court of California, County of Riverside (the "Christopher Complaint"). The plaintiff purports to represent all current and former employees employed by Swift in California and alleges that Swift violated California law by failing to timely pay wages and failing to reimburse employees for business expenses. The matter is in its initial phases and is expected to move into discovery. The Company retains all of its defenses against liability and damages. The Company intends to vigorously defend against the merits of these claims and to challenge certification. The final disposition of this case and the impact of such final disposition of this case cannot be determined at this time.
California Wage, Meal, and Rest: Yard Hostler Class Actions
On January 28, 2016, a class action lawsuit was filed by Grant Fritsch, individually and on behalf of all other similarly-situated persons against Swift Transportation Services, LLC and Swift Transportation Company in the Superior Court of California, County of San Bernardino (the "Fritsch Complaint"). The plaintiff worked for Swift as a yard hostler and purports to represent a class of "non-exempt maintenance and service employees" of Swift Transportation Services, LLC and/or Swift Transportation Company. The Fritsch Complaint alleges that Swift failed to pay overtime and doubletime wages required by California law, failed to provide proper meal and rest periods, failed to provide accurate itemized wage statements, and failed to timely pay wages upon separation from employment. The Fritsch Complaint also includes a claim under the Private Attorneys General Act. The Company filed a motion to dismiss based upon the wrong party being named in the lawsuit, and the plaintiff agreed to amend the complaint, which was served June 17, 2016. On August 30, 2016, the plaintiff again amended his complaint to clarify the class he was seeking to represent a class of individuals employed by Swift as yard hostlers in California. The Company retains all of its defenses against liability and damages. The Company intends to vigorously defend against the merits of these claims and to challenge certification. The final disposition of this case and the impact of such final disposition of this case cannot be determined at this time.
On April 1, 2016, a class action lawsuit was filed by Bill Barker, Tab Bachman, and William Yingling, on behalf of all other similarly-situated persons against Swift Transportation Company of Arizona, LLC, in the Superior Court of California, County of Sacramento (the "Barker Complaint"). The Barker Complaint alleges that Swift failed to pay minimum wage and overtime, failed to reimburse for business expenses, failed to provide proper meal and rest periods, failed to provide accurate itemized wage statements, and failed to timely pay wages upon separation from employment. On July 5, 2016, upon motion by Swift, the matter was removed to the United States District Court for the Eastern District of California, Case No. 2:16-CV-01532-TLN-CKD. The matter is in its initial phases and is expected to move into discovery. The Company retains all of its defenses against liability and damages. The Company intends to vigorously defend against the merits of these claims and to challenge certification. The final disposition of this case and the impact of such final disposition of this case cannot be determined at this time.
20
SWIFT TRANSPORTATION COMPANY
NOTES TO CONSOLIDATED FINANCIAL STATEMENTS (UNAUDITED) — CONTINUED
National Customer Service Misclassification Class Action Litigation
On May 11, 2016, a collective and class action was filed by a former Swift customer service representative level four ("CSR IV"), Salvador Castro, individually and on behalf of herself and all similarly-situated persons against Swift Transportation Co. of Arizona, LLC in the United States District Court for the Central District of California, Case No. CV 16-3232 (the "Castro Complaint"). The operative complaint alleges failure to pay overtime under the FLSA, as well as California state law claims including failure to pay timely final wages, failure to provide meal and rest periods, failure to pay overtime, and violation of the unfair competition. So far five plaintiffs have opted in to the lawsuit. The matter is in its initial phases and the parties are conducting discovery. The Company retains all of its defenses against liability and damages. The Company intends to vigorously defend against the merits of these claims and to challenge certification. The final disposition of this case and the impact of such final disposition of this case cannot be determined at this time.
In addition to the Castro Complaint, fourteen former or current CSR IVs who signed arbitration agreements with Swift have filed individual arbitrations with the American Arbitration Association ("AAA"). The claims alleged in the individual arbitrations are the same claims asserted in the Castro Complaint.
Arizona Fair Labor Standards Act Class Action Litigation
On December 29, 2015, a class action lawsuit was filed by Pamela Julian, individually and on behalf of all other similarly-situated persons against Swift Transportation, Inc., et al. in the United States District Court for the District of Delaware, Case No. 1:15-CV-01212-UNA (the "Julian Compliant"). The Julian Complaint alleges that Swift violated the FLSA by failing to pay its trainee drivers minimum wage for all work performed and by failing to pay overtime. On February 29, 2016, upon Stipulation of the Parties, the court transferred the case to the United States District Court for the District of Arizona, Case No. 2:16-CV-00576-ROS. On March 9, 2016, Swift filed a motion to dismiss the plaintiffs' overtime claims, which was granted by the District Court on May 31, 2016. The Company retains all of its defenses against liability and damages for the remaining claims. The Company intends to vigorously defend against the merits of these claims and to challenge certification. The final disposition of this case and the impact of such final disposition of this case cannot be determined at this time.
Washington Overtime Class Actions
On September 9, 2011, a class action lawsuit was filed by Troy Slack and several other drivers on behalf of themselves, and all similarly-situated persons, against Swift Transportation: Troy Slack, et al. v. Swift Transportation Co. of Arizona, LLC and Swift Transportation Corporation in the State Court of Washington, Pierce County (the "Slack Complaint"). The Slack Complaint was removed to the United States District Court for the Western District of Washington (the "Court") on October 12, 2011, case number 11-2-114380. The putative class includes all current and former Washington state-based employee drivers during the three-year statutory period prior to the filing of the lawsuit, and through the present, and alleges that they were not paid minimum wage and overtime in accordance with Washington state law and that they suffered unlawful deductions from wages. On November 23, 2013, the court entered an order on the plaintiffs' motion to certify the class. The court only certified the class as it pertains to "dedicated" drivers and did not certify any other class, including any class related to over-the-road drivers. On September 2, 2015, new counsel was appointed for the plaintiffs and on November 16, 2015, new legal counsel was substituted for the Company. As a result of the substitution of counsel for both parties, the court extended all existing dates by ten months. On April 1, 2016, the court entered an order approving the plaintiffs' proposed class notice. The matter is now in discovery. The Company retains all of its defenses against liability and damages. The Company intends to vigorously defend against the merits of these claims and to challenge certification. The final disposition of this case and the impact of such final disposition of this case cannot be determined at this time.
On January 14, 2016, a class action lawsuit was filed by Julie Hedglin, individually and on behalf of all others similarly situated against Swift Transportation Co. of Arizona, LLC in the State Court of Washington, Pierce County (the "Hedglin Complaint"). The Hedglin Complaint was removed to the Court on February 18, 2016, 3:16-CV-05127-RJB. The putative class includes all current and former Washington heavy haul drivers and alleges the class was not paid for meal and rest periods, was not paid for overtime, was not paid all wages due at established pay periods, and was not provided accurate wage statements. The matter is in its initial phases and is expected to move into discovery. The Company retains all of its defenses against liability and damages. The Company intends to vigorously defend against the merits of these claims and to challenge certification. The final disposition of this case and the impact of such final disposition of this case cannot be determined at this time.
21
SWIFT TRANSPORTATION COMPANY
NOTES TO CONSOLIDATED FINANCIAL STATEMENTS (UNAUDITED) — CONTINUED
Indiana Fair Credit Reporting Act Class Action Litigation
On March 18, 2015, a class action lawsuit was filed by Melvin Banks, individually and on behalf of all other similarly-situated persons against Central Refrigerated Service, Inc. in the United States District Court for the Northern District of Indiana, Case No. 2:15-CV-00105. The complaint alleges that Central Refrigerated Service, Inc. violated the Fair Credit Reporting Act by failing to provide job applicants with adverse action notices and copies of their consumer reports and statements of rights. At this time, the size of the potential class is unknown. The Company’s motion to have the case transferred from Indiana to the United States District Court for the District of Arizona has been granted. The first phase of discovery, regarding potential for identifying and certifying a class of affected job applicants, has been completed. The Company retains all of its defenses against liability and damages. The Company intends to vigorously defend against the merits of these claims and to challenge certification. The final disposition of this case, including the size of any affected class, and the impact of such final disposition of this case cannot be determined at this time.
Utah Collective and Individual Arbitration
On June 1, 2012, Gabriel Cilluffo, Kevin Shire, and Bryan Ratterree filed a putative class and collective action lawsuit against Central Refrigerated Service, Inc., Central Leasing, Inc., Jon Isaacson, and Jerry Moyes (collectively referred to herein as the "Central Parties"), Case No. ED CV 12-00886 in the United States District Court for the Central District of California. Through this action, the plaintiffs alleged that the Central Parties misclassified owner-operator drivers as independent contractors and were therefore liable to these drivers for minimum wages and other employee benefits under the FLSA. The complaint also alleged a federal forced labor claim under 18 U.S.C. § 1589 and 1595, as well as fraud and other state-law claims.
Pursuant to the plaintiffs' owner-operator agreements, the district court issued an order compelling arbitration and directed that the plaintiffs' causes of action under the FLSA should proceed to collective arbitration, while their forced labor, fraud, and state law claims would proceed as separate individual arbitrations. A collective arbitration was subsequently initiated with the AAA. Notice of the collective arbitration was sent to more than 3,000 owner-operators who worked for Central Refrigerated Service, Inc. and leased a vehicle from Central Leasing, Inc. on or after June 1, 2009. On October 26, 2016 the arbitrator assigned to the case ruled that approximately 1,300 Central Refrigerated drivers involved in the collective arbitration have been misclassified as independent contractors and that they should have been compensated as employees. The ruling left open the question of what damages, if any, are payable to these drivers. The arbitrator ruled that such damages could be assessed in a collective proceeding and declined to decertify the collective proceeding under the FLSA. No trial date on the claimant's damages has been set by the arbitrator.
In addition to the collective arbitration that is pending before the AAA, the three named plaintiffs, along with approximately 325 other owner-operators, have initiated a series of individual, bilateral proceedings against the Central Parties with the AAA. Discovery is commencing in these individual cases, which are pending before approximately 30 separate arbitrators. Rather than proceed simultaneously in hundreds of separate arbitration proceedings, the parties have agreed to select a small number of arbitration cases that will be litigated and proceed to hearing. The outcome in these sample cases-some of which will be selected by plaintiffs’ counsel and some by the Company’s attorneys-will not have a binding impact on the remaining cases, which will be stayed. The parties anticipate that the outcome of these sample, or bellwether cases, may illustrate potential outcomes of the other bilateral arbitration cases and facilitate resolution. Actual trial dates for these sample proceedings have not yet been finally set by the arbitrators, but trials in the limited number of bellwether-like cases are likely to occur in the second quarter of 2017.
Upon the acquisition of Central Refrigerated Service, Inc. by Swift Transportation Company (the "Company"), the plaintiffs in both the collective and individual actions were allowed to amend their complaints in June 2015 to include the Company as a defendant.
In June 2016, the parties engaged in mediation that ultimately did not result in a settlement of the matter, given the plaintiff's initial demand was $69.0 million and the Company's estimated potential liability was $3.0 million. Based upon the information exchanged between the parties during the mediation, and in accordance with GAAP, the Company recorded an accrual of $3.0 million in the second quarter of 2016 for the estimated probable loss incurred. Based on the October 2016 arbitration ruling, the Company recorded an additional accrual of $22.0 million as of September 30, 2016. Our estimate of the probable loss on this matter is based on the requirements of GAAP and upon the currently available information. The Company and the Central Parties dispute the arbitrator’s rulings to date and intend to continue to vigorously defend against the plaintiff’s claims in both the collective action and individual proceedings.
California Class and Collective Action for Pre-employment Physical Testing
On October 6, 2014 Robin Anderson filed a putative class and collective action against Central Refrigerated Service, Inc. Case No. 5:14-CV 02062 in the United States District Court for the Central District of California (the "Anderson Complaint"). In this action, the plaintiff alleges that pre-employment tests of physical strength administered by a third party on behalf of Central Refrigerated Service, Inc. had an unlawfully discriminatory impact on female applicants and applicants over the age of 40. The suit seeks damages under Title VII of the Civil Rights Act of 1964, the Age Discrimination Act, and parallel California state law provisions, including the California Fair Employment and Housing Act.
22
SWIFT TRANSPORTATION COMPANY
NOTES TO CONSOLIDATED FINANCIAL STATEMENTS (UNAUDITED) — CONTINUED
Upon the acquisition of Central Refrigerated Service, Inc. by Swift Transportation Company, the plaintiff was allowed to amend her complaint in October 2015 to include Swift Transportation Company and Workwell Systems, Inc. as additional defendants. Workwell Systems, Inc. is the company that provided the physical testing service used by Central Refrigerated Service, Inc. The litigation is still at a very preliminary stage and no trial date has been set. There is not currently any information available regarding the number of potential members of the putative class or collective actions.
Central Refrigerated Service, Inc. and Swift intend to vigorously defend against the merits of the plaintiff’s claims and to oppose certification of any class of plaintiffs. The final disposition of this case and the impact cannot be determined at this time.
Demand for Inspection of Books and Records
In February 2016, the Company received several shareholder demands, requesting to inspect the Company’s books and records, pursuant to Section 220 of the Delaware General Corporation Law. The demands relate to the shareholders’ alleged investigation pertaining to whether the Board and Jerry Moyes have breached their fiduciary duties with respect to matters that have been publicly disclosed concerning the Company's securities trading policy, limitations on the pledging of Company stock on margin, and share repurchases. The Company responded to the shareholders’ requests. In September 2016, the Company received an additional request for records related to Board members' status as independent directors. Any future disposition or resolution of these matters cannot be determined at this time.
Environmental
The Company's tractors and trailers are involved in motor vehicle accidents, and experience damage, mechanical failures, and cargo issues as an incidental part of its normal course of operations. From time to time, these matters result in the discharge of diesel fuel, motor oil, or other hazardous materials into the environment. Depending on local regulations and who is determined to be at fault, the Company is sometimes responsible for the clean-up costs associated with these discharges. As of September 30, 2016, the Company's estimate for its total legal liability for all such clean-up and remediation costs was approximately $0.4 million in the aggregate for all current and prior year claims.
The final settlement of the Company's interest rate swaps occurred in July 2015. The following table presents pre-tax gains and losses from changes in fair value of the Company's interest rate swaps, included in earnings:
Three Months Ended September 30, | Nine Months Ended September 30, | |||||||||||||||
2016 | 2015 | 2016 | 2015 | |||||||||||||
(In thousands) | ||||||||||||||||
Loss reclassified from AOCI into net income from cash flow hedges (effective portion) | $ | — | $ | 69 | $ | — | $ | 3,886 | ||||||||
(Gain) loss recognized in income from de-designated derivative contracts | — | (1 | ) | — | 86 | |||||||||||
Derivative interest expense | $ | — | $ | 68 | $ | — | $ | 3,972 | ||||||||
Losses (benefits) on cash flow hedging, reclassified out of AOCI into the consolidated income statements were as follows:
Three Months Ended September 30, | Nine Months Ended September 30, | ||||||||||||||||
Reclassified to: | 2016 | 2015 | 2016 | 2015 | |||||||||||||
(In thousands) | |||||||||||||||||
Interest rate swaps | Derivative interest expense | $ | — | $ | 69 | $ | — | $ | 3,886 | ||||||||
Income tax benefit | Income tax expense | — | — | — | (1,469 | ) | |||||||||||
Net income | $ | — | $ | 69 | $ | — | $ | 2,417 | |||||||||
23
SWIFT TRANSPORTATION COMPANY
NOTES TO CONSOLIDATED FINANCIAL STATEMENTS (UNAUDITED) — CONTINUED
The following table presents our repurchases of our Class A common stock under the respective share repurchase programs, net of advisory fees:
Three Months Ended September 30, | Nine Months Ended September 30, | As of September 30, | ||||||||||||||||||
Share Repurchase Program | 2016 | 2016 | 2016 | |||||||||||||||||
Authorized Amount | Board Approval Date | Shares | Amount | Shares | Amount | Amount Remaining | ||||||||||||||
(In thousands) | ||||||||||||||||||||
$100,000 | September 24, 2015 | — | $ | — | 2,221 | $ | 30,000 | $ | — | |||||||||||
$150,000 | February 22, 2016 | 1,341 | $ | 25,000 | 5,072 | $ | 85,000 | $ | 65,000 | |||||||||||
1,341 | $ | 25,000 | 7,293 | $ | 115,000 | $ | 65,000 | |||||||||||||
No share repurchases were made during the three or nine months ended September 30, 2015.
The following table reconciles basic weighted average shares outstanding to diluted weighted average shares outstanding:
Three Months Ended September 30, | Nine Months Ended September 30, | ||||||||||
2016 | 2015 | 2016 | 2015 | ||||||||
(In thousands) | |||||||||||
Basic weighted average common shares outstanding | 132,930 | 142,801 | 134,622 | 142,535 | |||||||
Dilutive effect of stock options | 1,532 | 1,331 | 1,605 | 1,703 | |||||||
Diluted weighted average common shares outstanding | 134,462 | 144,132 | 136,227 | 144,238 | |||||||
Anti-dilutive shares excluded from the dilutive-effect calculation (1) | 154 | 350 | 156 | 195 | |||||||
____________
(1) | Shares were excluded from the dilutive-effect calculation because the outstanding options' exercise prices were greater than the average market price of the Company's common shares during the period. |
24
SWIFT TRANSPORTATION COMPANY
NOTES TO CONSOLIDATED FINANCIAL STATEMENTS (UNAUDITED) — CONTINUED
Effective Tax Rate — The effective tax rate for the three months ended September 30, 2016 was 30.0%, which was lower than management's expectation of 36.5%. The difference was primarily due to Federal domestic production deductions realized as discrete items in the three months ended September 30, 2016. The effective tax rate for the three months ended September 30, 2015 was 37.0%, which was lower than management's expectation of 38.5%, primarily due to certain Federal employment tax credits realized as discrete items.
The effective tax rate for the nine months ended September 30, 2016 was 31.9%, which was lower than management's expectation of 36.5%. The difference was primarily due to a foreign subsidiary's income tax credits related to tolls paid, a domestic subsidiary's income tax credits for research and development, a reduction in the uncertain tax position reserve, and Federal domestic production deductions, all realized as discrete items. The effective tax rate for the nine months ended September 30, 2015 was 38.1%, which was lower than management's expectation of 38.5%, primarily due to certain Federal employment tax credits realized as discrete items.
Interest and Penalties — Accrued interest and penalties related to unrecognized tax benefits as of September 30, 2016 and December 31, 2015 were approximately $0.4 million and $1.4 million, respectively. The Company does not anticipate a decrease of unrecognized tax benefits during the next twelve months.
Tax Examinations — Certain of the Company’s subsidiaries are currently under examination by the Internal Revenue Service and various state jurisdictions for tax years ranging from 2010 through 2015. At the completion of these examinations, management does not expect any adjustments that would have a material impact on the Company’s effective tax rate. Years subsequent to 2011 remain subject to examination.
The following table presents the carrying amounts and estimated fair values of the Company’s financial instruments:
September 30, 2016 | December 31, 2015 | ||||||||||||||
Carrying Value | Estimated Fair Value | Carrying Value | Estimated Fair Value | ||||||||||||
(In thousands) | |||||||||||||||
Financial Assets: | |||||||||||||||
Restricted investments (1) | $ | 22,864 | $ | 22,851 | $ | 23,215 | $ | 23,190 | |||||||
Financial Liabilities: | |||||||||||||||
2015 Agreement: New Term Loan A, due July 2020 (2) | 592,819 | 594,250 | 668,055 | 669,750 | |||||||||||
Accounts receivable securitization, due January 2019 (3) | 299,196 | 300,000 | 223,927 | 225,000 | |||||||||||
Revolving line of credit, due July 2020 | 50,000 | 50,000 | 200,000 | 200,000 | |||||||||||
The carrying amounts of the financial instruments shown in the table are included in the consolidated balance sheets, as follows:
(1) | Restricted investments are included in "Restricted investments, held to maturity, amortized cost." |
(2) | The New Term Loan A is included in "Current portion of long-term debt" and "Long-term debt, less current portion." Carrying value is net of $1.4 million and $1.7 million DLCs as of September 30, 2016 and December 31, 2015, respectively. |
(3) | Carrying value is net of $0.8 million and $1.1 million DLCs as of September 30, 2016 and December 31, 2015, respectively. |
Recurring Fair Value Measurements
As of September 30, 2016 and December 31, 2015, no major categories of assets or liabilities included in the Company's consolidated balance sheets at estimated fair value were measured on a recurring basis.
25
SWIFT TRANSPORTATION COMPANY
NOTES TO CONSOLIDATED FINANCIAL STATEMENTS (UNAUDITED) — CONTINUED
Nonrecurring Fair Value Measurements
As of September 30, 2016, there were no assets or liabilities on the Company's consolidated balance sheet estimated at fair value that were measured on a nonrecurring basis.
The following table depicts the level in the fair value hierarchy of the inputs used to estimate fair value of assets measured on a nonrecurring basis as of December 31, 2015 (in thousands):
Fair Value Measurements at Reporting Date Using: | |||||||||||||||||||
Estimated Fair Value | Level 1 Inputs | Level 2 Inputs | Level 3 Inputs | Total Gains (Losses) | |||||||||||||||
As of December 31, 2015 | (In thousands) | ||||||||||||||||||
Note receivable | $ | — | $ | — | $ | — | $ | — | $ | (1,480 | ) | ||||||||
In September 2013, the Company agreed to advance up to $2.3 million, pursuant to an unsecured promissory note, to an independent fleet contractor that transported freight on Swift's behalf. In March 2015, management became aware that the independent contractor violated various covenants outlined in the unsecured promissory note, which created an event of default that made the principal and accrued interest immediately due and payable. As a result of this event of default, as well as an overall decline in the independent contractor's financial condition, management re-evaluated the fair value of the unsecured promissory note. At March 31, 2015, management determined that the remaining balance due from the independent contractor to the Company was not collectible, which resulted in a $1.5 million pre-tax adjustment that was recorded in "Non-cash impairments of non-operating assets" in the Company's consolidated income statement.
As of December 31, 2015, there were no liabilities on the Company's consolidated balance sheet estimated at fair value that were measured on a nonrecurring basis.
Segment Information
The Company’s four reportable operating segments are Truckload, Dedicated, Swift Refrigerated, and Intermodal.
Truckload — The Truckload segment consists of one-way movements over irregular routes throughout the United States, Mexico, and Canada. This service utilizes both company and owner-operator tractors with dry van, flatbed, and other specialized trailing equipment.
Dedicated — Through the Dedicated segment, the Company devotes use of equipment to specific customers and offers tailored solutions under long-term contracts. This segment utilizes refrigerated, dry van, flatbed, and other specialized trailing equipment.
Swift Refrigerated — This segment primarily consists of shipments for customers that require temperature-controlled trailers. These shipments include one-way movements over irregular routes, as well as dedicated truck operations.
Intermodal — The Intermodal segment includes revenue generated by moving freight over the rail in the Company's containers and other trailing equipment, combined with revenue for drayage to transport loads between the railheads and customer locations.
Non-reportable Segments — The non-reportable segments include the Company's logistics and freight brokerage services, as well as support services that its subsidiaries provide to customers and owner-operators, including repair and maintenance shop services, equipment leasing, and insurance. Intangible amortization related to the 2007 Transactions, certain legal settlements and reserves, and certain other corporate expenses are also included in the non-reportable segments.
Intersegment Eliminations — Certain operating segments provide transportation and related services for other affiliates outside their reportable segment. Revenues for such services are based on negotiated rates, which we believe approximate fair value, and are reflected as revenues of the billing segment. These rates are adjusted from time to time, based on market conditions. Such intersegment revenues and expenses are eliminated in our consolidated results.
26
SWIFT TRANSPORTATION COMPANY
NOTES TO CONSOLIDATED FINANCIAL STATEMENTS (UNAUDITED) — CONTINUED
Set forth in the tables below is certain financial information with respect to the Company’s reportable segments:
Three Months Ended September 30, | Nine Months Ended September 30, | |||||||||||||||
2016 | 2015 | 2016 | 2015 | |||||||||||||
Operating revenue: | (In thousands) | |||||||||||||||
Truckload | $ | 516,692 | $ | 552,816 | $ | 1,526,807 | $ | 1,646,872 | ||||||||
Dedicated | 248,798 | 234,517 | 713,923 | 686,505 | ||||||||||||
Swift Refrigerated | 85,019 | 93,045 | 256,774 | 286,301 | ||||||||||||
Intermodal | 92,260 | 100,966 | 264,874 | 289,827 | ||||||||||||
Subtotal | 942,769 | 981,344 | 2,762,378 | 2,909,505 | ||||||||||||
Non-reportable segments | 89,740 | 104,176 | 288,303 | 289,667 | ||||||||||||
Intersegment eliminations | (19,283 | ) | (20,547 | ) | (57,778 | ) | (59,651 | ) | ||||||||
Consolidated operating revenue | $ | 1,013,226 | $ | 1,064,973 | $ | 2,992,903 | $ | 3,139,521 | ||||||||
Three Months Ended September 30, | Nine Months Ended September 30, | |||||||||||||||
2016 | 2015 | 2016 | 2015 | |||||||||||||
Operating income (loss): | (In thousands) | |||||||||||||||
Truckload | $ | 47,670 | $ | 57,012 | $ | 134,432 | $ | 181,810 | ||||||||
Dedicated | 30,333 | 17,573 | 82,640 | 54,885 | ||||||||||||
Swift Refrigerated | (20,250 | ) | 2,622 | (15,778 | ) | 13,538 | ||||||||||
Intermodal | 358 | 723 | (1,647 | ) | 1,081 | |||||||||||
Subtotal | 58,111 | 77,930 | 199,647 | 251,314 | ||||||||||||
Non-reportable segments | (18,258 | ) | (3,009 | ) | (33,106 | ) | (2,917 | ) | ||||||||
Consolidated operating income | $ | 39,853 | $ | 74,921 | $ | 166,541 | $ | 248,397 | ||||||||
Three Months Ended September 30, | Nine Months Ended September 30, | |||||||||||||||
2016 | 2015 | 2016 | 2015 | |||||||||||||
Depreciation and amortization of property and equipment: | (In thousands) | |||||||||||||||
Truckload | $ | 31,868 | $ | 31,424 | $ | 93,721 | $ | 89,958 | ||||||||
Dedicated | 17,417 | 15,992 | 49,826 | 45,885 | ||||||||||||
Swift Refrigerated | 3,975 | 4,735 | 12,752 | 11,399 | ||||||||||||
Intermodal | 2,895 | 3,535 | 8,894 | 10,231 | ||||||||||||
Subtotal | 56,155 | 55,686 | 165,193 | 157,473 | ||||||||||||
Non-reportable segments | 11,090 | 11,166 | 33,691 | 26,721 | ||||||||||||
Consolidated depreciation and amortization of property and equipment | $ | 67,245 | $ | 66,852 | $ | 198,884 | $ | 184,194 | ||||||||
Geographical Information
In aggregate, operating revenue from the Company's foreign operations was less than 5.0% of consolidated operating revenue for the three and nine months ended September 30, 2016 and 2015. Additionally, long-lived assets on the Company's foreign subsidiaries' balance sheets were less than 5.0% of consolidated total assets as of September 30, 2016 and December 31, 2015.
27
SWIFT TRANSPORTATION COMPANY
NOTES TO CONSOLIDATED FINANCIAL STATEMENTS (UNAUDITED) — CONTINUED
In conjunction with the Company's September 8, 2016 announcement that Jerry Moyes would retire from his position as Chief Executive Officer effective December 31, 2016, the Company entered into an agreement with Mr. Moyes to memorialize the terms of his retirement. The Company contracted with Mr. Moyes to serve as a non-employee consultant from January 1, 2017 through December 31, 2019, during which time the Company will pay Mr. Moyes a monthly consulting fee of $0.2 million in cash. Additionally, the Company modified the vesting terms and forfeiture conditions of Mr. Moyes' previously-granted equity awards. As a result of the terms of the agreement, the Company incurred a one-time expense in September 2016 of $7.1 million, consisting of $6.8 million in accrued consulting fees and $0.3 million for the impact of the equity award modifications. The amounts are included in "Salaries, wages, and employee benefits" within the non-reportable segments' income statement.
The following schedule is a rollforward of the accrued liability for the consulting fees:
September 30, 2016 | |||
(In thousands) | |||
Balance at December 31, 2015 | $ | — | |
Additions to accrual | 6,837 | ||
Less: payments | — | ||
Balance at September 30, 2016 (1) | $ | 6,837 | |
____________
(1) | The $0.3 million impact of the equity award modification is excluded from the accrual balance because it is classified as "Additional paid-in capital" in the consolidated balance sheet. |
28
ITEM 2. | MANAGEMENT'S DISCUSSION AND ANALYSIS OF FINANCIAL CONDITION AND RESULTS OF OPERATIONS |
CAUTIONARY NOTE REGARDING FORWARD-LOOKING STATEMENTS |
This report contains statements that may constitute forward-looking statements, which are based on information currently available, usually defined by words such as "anticipates," "believes," "estimates," "plans," "projects," "expects," "hopes," "intends," "will," "could," "should," "may," or similar expressions which speak only as of the date the statement was made. Such forward-looking statements are made pursuant to the safe harbor provisions of the Private Securities Litigation Reform Act of 1995. Such statements include, but are not limited to, statements concerning:
• | trends, management's beliefs, and expectations relating to our operations, Revenue xFSR, expenses, other revenue, pricing, our effective tax rate, profitability and related metrics, as well as share repurchases; |
• | impact and planned timing of adopting recently issued accounting pronouncements on future periods; |
• | that we will reduce our participation in the trucking spot market; |
• | the benefits of eliminating our TOFC service; |
• | the amount and timing of future dispositions of property and equipment; |
• | the impact of changes in interest rates; |
• | the outcome and impact of pending claims, litigation, and actions in respect thereof; |
• | our intentions concerning the potential use of derivative financial instruments to hedge fuel price increases; |
• | the timing and amount of future acquisitions of revenue equipment and other capital expenditures, as well as the use and availability of cash, cash flows from operations, leases, and debt to finance such acquisitions; |
• | that we may seek additional borrowings, lease financing, or equity capital; |
• | the potential impact of inflation, seasonality, and severe weather conditions on our results of operations; |
• | that we will receive additional tax deductions during the remainder of 2016; and |
• | our ability to finance our cash needs from operations for the next twelve months. |
Such forward-looking statements are inherently uncertain, and are based upon the current beliefs, assumptions, and expectations of Company management and current market conditions, which are subject to significant risks and uncertainties, as set forth in the Risk Factors section of our Annual Report on Form 10-K for the year ended December 31, 2015. As to the Company's business and financial performance, the following factors, among others, could cause actual results to materially differ from those in forward-looking statements:
• | economic conditions, including future recessionary economic cycles and downturns in customers’ business cycles, particularly in market segments and industries in which we have a significant concentration of customers; |
• | increasing competition from trucking, rail, intermodal, and brokerage competitors; |
• | our ability to execute or integrate any future acquisitions successfully; |
• | increases in driver compensation to the extent not offset by increases in freight rates, and difficulties in driver recruitment and retention; |
• | additional risks arising from our contractual agreements with owner-operators that do not exist with Company drivers; |
• | our ability to retain or replace key personnel; |
• | our dependence on third parties for intermodal and brokerage business; |
• | potential failure in computer or communications systems; |
• | seasonal factors such as severe weather conditions that increase operating costs; |
• | the regulatory environment in which we operate, including existing regulations and changes in existing regulations, or violations by us of existing or future regulations; |
• | the possible re-classification of owner-operators as employees; |
• | changes in rules or legislation by the NLRB or Congress and/or union organizing efforts; |
• | our CSA safety rating; |
29
MANAGEMENT'S DISCUSSION AND ANALYSIS OF FINANCIAL CONDITION AND RESULTS OF OPERATIONS — CONTINUED
• | government regulation with respect to our captive insurance companies; |
• | risks and uncertainties associated with our operations in Mexico; |
• | a significant reduction in, or termination of, our trucking services by a key customer; |
• | our significant ongoing capital requirements; |
• | volatility in the price or availability of fuel, as well as our ability to recover fuel prices through our fuel surcharge program; |
• | fluctuations in new equipment prices or replacement costs, and the potential failure of manufacturers to meet their sale and trade-back obligations; |
• | the impact that our substantial leverage may have on the way we operate our business and our ability to service our debt, including compliance with our debt covenants; |
• | restrictions contained in our debt agreements; |
• | adverse impacts of insuring risk through our captive insurance companies, including our need to provide restricted cash and similar collateral for anticipated losses; |
• | potential volatility or decrease in the amount of earnings as a result of our claims exposure through our captive insurance companies; |
• | the potential impact of the significant number of shares of our common stock that is eligible for future sale; |
• | goodwill impairment; |
• | our intention to not pay dividends; |
• | conflicts of interest or potential litigation that may arise from other businesses owned by Jerry Moyes, including pledges of Swift stock and guarantees by Jerry Moyes related to other businesses; |
• | the significant amount of our stock and related control over the Company by Jerry Moyes; and |
• | related-party transactions between the Company and Jerry Moyes. |
Important factors, in addition to those listed above and in our filings with the SEC, could impact us financially. As a result of these and other factors, actual results may differ from those set forth in the forward-looking statements, and the prices of the Company's securities may dramatically fluctuate. The Company makes no commitment, and disclaims any duty, to update or revise any forward-looking statements to reflect future events, new information or changes in these expectations, except as required by law.
Reference to Glossary of Terms |
Reference to Annual Report on Form 10-K |
30
SWIFT TRANSPORTATION COMPANY
MANAGEMENT'S DISCUSSION AND ANALYSIS OF FINANCIAL CONDITION AND RESULTS OF OPERATIONS — CONTINUED
Executive Summary |
Company Overview — Swift is a multi-faceted transportation services company, operating one of the largest fleets of truckload equipment in North America from over 40 terminals near key freight centers and traffic lanes. We principally operate in short- to medium-haul traffic lanes around our terminals and dedicated customer locations. We concentrate on this length of haul because the majority of domestic truckload freight (as measured by revenue) moves in these lanes and our extensive terminal network affords us marketing, equipment control, supply chain, customer service, and driver retention advantages in local markets. Since our average length of haul is relatively short, it helps reduce competition from railroads and trucking companies that lack a regional presence.
Our four reportable segments are Truckload, Dedicated, Swift Refrigerated, and Intermodal. Our extensive suite of service offerings (which includes line-haul services, dedicated customer contracts, temperature-controlled units, intermodal freight solutions, cross-border United States/Mexico and United States/Canada freight, flatbed hauling, freight brokerage and logistics, and others) provides our customers with the opportunity to "one-stop-shop" for their truckload transportation needs.
Revenue — We primarily generate revenue by transporting freight for our customers, generally at a predetermined rate per mile. We supplement this revenue by charging for fuel surcharges, stop-off pay, loading and unloading activities, tractor and trailer detention, and other ancillary services. The main factors that affect our revenue from transporting freight are the rate per mile we receive from our customers and loaded miles. The main factors that affect fuel surcharge revenue are the price of diesel fuel and the number of loaded miles. Fuel surcharges are billed on a lagging basis, meaning that we typically bill customers in the current week based on a previous week's applicable index. Therefore, in times of increasing fuel prices, we do not recover as much as we are currently paying for fuel. In periods of declining prices, the opposite is true.
Revenue in our non-reportable segments is generated by our non-asset-based freight brokerage and logistics management service, tractor leasing revenue from our financing subsidiaries, premium revenue from our captive insurance companies, and revenue from third parties serviced by our repair and maintenance shops. Main factors affecting revenue in our non-reportable segments are demand for brokerage and logistics services, as well as the number of equipment leases by our financing subsidiaries to the owner-operators we contract with and other third parties.
Expenses — Our most significant expenses vary with miles traveled and include fuel, driver-related expenses (such as wages and benefits), and services purchased from owner-operators and other transportation providers (such as railroads, drayage providers, and other trucking companies). Maintenance and tire expenses, as well as the cost of insurance and claims generally vary with the miles we travel, but also have a controllable component based on safety improvements, fleet age, efficiency, and other factors. Our primary fixed costs are depreciation and lease expense for revenue equipment and terminals, interest expense, and non-driver compensation.
Compared to changes in rate per mile and loaded miles, changes in deadhead miles percentage generally have the largest proportionate effect on our profitability because we still bear all of the expenses for each deadhead mile, but do not earn any revenue to offset those expenses. Changes in rate per mile have the next largest proportionate effect on profitability because incremental improvements in rate per mile are not offset by any additional expenses. Changes in loaded miles generally have a smaller effect on profitability because variable expenses fluctuate with changes in miles. However, changes in mileage are affected by driver satisfaction and network efficiency, which indirectly affect expenses.
Recent Developments — The truckload freight environment in 2016 has been challenging. Excess industry capacity, excess customer inventories, and depressed shipping demand have pressured volumes and pricing. We implemented the following initiatives to help counter the effects of these external factors:
• | We downsized our core truckload fleet in an effort to improve asset utilization, and we continue to closely monitor and adjust our truckload fleet size to ensure proper utilization of our fleets. |
• | We selectively increased our participation in the spot market to improve network balance and help offset the lack of available freight in certain markets. Our sales team remains heavily focused on increasing freight levels with both new and existing customer contracts, with the goal of eventually reducing our spot market activity. |
• | We implemented several cost control initiatives throughout the organization, which include streamlining processes, reducing headcount, postponing non-critical system implementations, and reducing expenses in various other manners. |
On September 8, 2016, we announced that Jerry Moyes would retire from his position as Chief Executive Officer effective December 31, 2016. Richard Stocking (previously our President and Chief Operating Officer) and Mr. Moyes will serve as Co-Chief Executive Officers, with Mr. Stocking assuming all duties and authority of the office of Chief Executive Officer, from September 8, 2016 through December 31, 2016. Pursuant to the unanimous approval by the Board, Mr. Stocking will begin serving as our sole President and Chief Executive Officer on January 1, 2017. The Company has contracted with Mr. Moyes to serve as a consultant with the title "Founder and Chairman Emeritus" for the three-year period following his retirement date. Additionally, Mr. Moyes will continue on as a member of the Board.
31
SWIFT TRANSPORTATION COMPANY
MANAGEMENT'S DISCUSSION AND ANALYSIS OF FINANCIAL CONDITION AND RESULTS OF OPERATIONS — CONTINUED
Financial Overview
Three Months Ended September 30, | Nine Months Ended September 30, | ||||||||||||||
2016 | 2015 | 2016 | 2015 | ||||||||||||
(Dollars in thousands, except per share data) | |||||||||||||||
GAAP financial data: | |||||||||||||||
Operating revenue | $ | 1,013,226 | $ | 1,064,973 | $ | 2,992,903 | $ | 3,139,521 | |||||||
Revenue xFSR | $ | 929,732 | $ | 954,974 | $ | 2,772,054 | $ | 2,785,737 | |||||||
Net income | $ | 24,024 | $ | 36,281 | $ | 98,825 | $ | 125,075 | |||||||
Diluted earnings per share | $ | 0.18 | $ | 0.25 | $ | 0.73 | $ | 0.87 | |||||||
Operating Ratio | 96.1 | % | 93.0 | % | 94.4 | % | 92.1 | % | |||||||
Non-GAAP financial data: | |||||||||||||||
Adjusted EPS (1) | $ | 0.24 | $ | 0.31 | $ | 0.82 | $ | 0.96 | |||||||
Adjusted Operating Ratio (1) | 94.5 | % | 91.7 | % | 93.3 | % | 90.7 | % | |||||||
Adjusted EBITDA (1) | $ | 113,675 | $ | 148,464 | $ | 382,820 | $ | 446,161 | |||||||
____________
(1) | Adjusted EPS, Adjusted Operating Ratio, and Adjusted EBITDA are non-GAAP financial measures. These non-GAAP financial measures should not be considered alternatives, or superior, to GAAP financial measures. However, management believes that presentation of these non-GAAP financial measures provides useful information to investors regarding the Company's results of operations. Adjusted EPS, Adjusted Operating Ratio, and Adjusted EBITDA are reconciled to the most directly comparable GAAP financial measures under "Non-GAAP Financial Measures," below. |
Total Equipment — The following table summarizes our revenue equipment and supports the discussions and analyses below:
September 30, 2016 | December 31, 2015 | September 30, 2015 | ||||||
Tractors | ||||||||
Company: | ||||||||
Owned | 6,838 | 7,442 | 7,334 | |||||
Leased – capital leases | 2,098 | 2,170 | 2,296 | |||||
Leased – operating leases | 5,444 | 5,599 | 6,194 | |||||
Total company tractors | 14,380 | 15,211 | 15,824 | |||||
Owner-operator: | ||||||||
Financed through the Company | 3,348 | 3,767 | 3,891 | |||||
Other | 1,429 | 886 | 1,121 | |||||
Total owner-operator tractors | 4,777 | 4,653 | 5,012 | |||||
Total tractors | 19,157 | 19,864 | 20,836 | |||||
Trailers | 62,727 | 65,233 | 64,528 | |||||
Containers | 9,131 | 9,150 | 9,150 | |||||
Average Operational Truck Count — The following table summarizes average operational truck count, which is defined under "Results of Operations — Segment Review."
Three Months Ended September 30, | Nine Months Ended September 30, | ||||||||||
2016 | 2015 | 2016 | 2015 | ||||||||
Company | 13,089 | 13,469 | 13,183 | 13,249 | |||||||
Owner-operator | 4,391 | 4,592 | 4,459 | 4,632 | |||||||
Total (1) | 17,480 | 18,061 | 17,642 | 17,881 | |||||||
____________
(1) | Includes trucks within our non-reportable segments. |
32
SWIFT TRANSPORTATION COMPANY
MANAGEMENT'S DISCUSSION AND ANALYSIS OF FINANCIAL CONDITION AND RESULTS OF OPERATIONS — CONTINUED
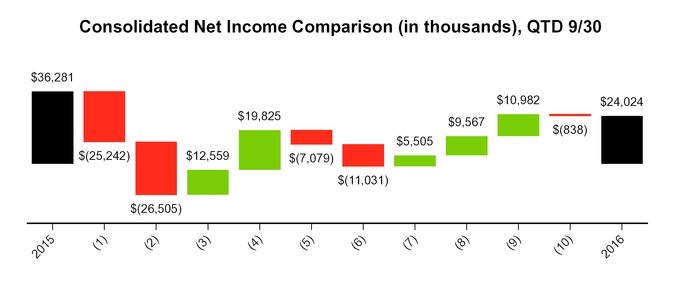
Results of Operations — Comparison Between the Three Months Ended September 30, 2016 and September 30, 2015
The $12.3 million decrease in net income from $36.3 million for the three months ended September 30, 2015 to $24.0 million for the same period in 2016, reflects the following:
(1) | $25.2 million decrease in Revenue xFSR — This was driven by decreases in the Truckload, Non-reportable, Swift Refrigerated, and Intermodal segments, partially offset by an increase in Revenue xFSR in the Dedicated segment. |
(2) | $26.5 million decrease in fuel surcharge revenue — Fuel prices were lower overall during the three months ended September 30, 2016, which had an average DOE index of $2.38, compared to $2.63 for the same period in 2015. |
(3) | $12.6 million decrease in fuel expense, primarily due to lower fuel prices. |
(4) | $19.8 million decrease in purchased transportation — This was attributed to lower logistics and intermodal freight volumes, resulting in a decrease in payments to rail and other third-party carriers. Additionally, fuel reimbursements to owner-operators and other third parties decreased as a result of lower fuel prices and fewer miles driven by owner-operators. |
(5) | $7.1 million one-time expense pertaining to Jerry Moyes' retirement package during the three months ended September 30, 2016, included in "Salaries, wages, and employee benefits." |
(6) | $11.0 million increase in "Operating supplies and expenses," which was primarily due to a $22.0 million increase in legal reserves resulting from the receipt of unfavorable information regarding certain litigation within our Swift Refrigerated segment that was outstanding as of September 30, 2016. |
The three months ended September 30, 2015 included a $5.1 million settlement of a class action lawsuit and related items.
(7) | $5.5 million decrease in insurance and claims, predominantly associated with negative development incurred during the three months ended September 30, 2015, compared to the three months ended September 30, 2016. |
(8) | $9.6 million loss on debt extinguishment during the three months ended September 30, 2015, resulting from the replacement of the 2014 Agreement with the 2015 Agreement. |
(9) | $11.0 million decrease in income tax expense. The effective tax rate for the three months ended September 30, 2016 was 30.0%, which was lower than our expectation of 36.5%. The difference was primarily due to Federal domestic production deductions realized as discrete items in the three months ended September 30, 2016. |
The effective tax rate for the three months ended September 30, 2015 was 37.0%, which was lower than our expectation of 38.5%, primarily due to certain Federal employment tax credits realized as discrete items.
(10) | Other items. |
33
SWIFT TRANSPORTATION COMPANY
MANAGEMENT'S DISCUSSION AND ANALYSIS OF FINANCIAL CONDITION AND RESULTS OF OPERATIONS — CONTINUED
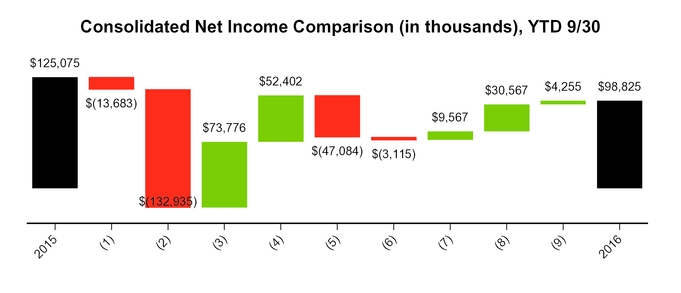
Results of Operations — Comparison Between the Nine Months Ended September 30, 2016 and September 30, 2015
The $26.3 million decrease in net income from $125.1 million for the nine months ended September 30, 2015 to $98.8 million for the same period in 2016, reflects the following:
(1) | $13.7 million decrease in Revenue xFSR — This was driven by decreases in the Truckload, Swift Refrigerated, and Intermodal segments, partially offset by an increase in the Dedicated segment. |
(2) | $132.9 million decrease in fuel surcharge revenue — Fuel prices were lower overall during the nine months ended September 30, 2016, which had an average DOE index of $2.25, compared to $2.80 for the same period in 2015. |
(3) | $73.8 million decrease in fuel expense, primarily due to lower fuel prices. |
(4) | $52.4 million decrease in purchased transportation — This was primarily attributed to reduced fuel reimbursements to owner-operators, as a result of lower fuel prices and fewer miles driven by owner-operators. Additionally, lower intermodal freight volumes resulted in a decrease in payments to rail carriers, further contributing to the decrease in the expense. |
(5) | $47.1 million increase in salaries, wages, and employee benefits expense — This was due to the driver pay increase implemented in May 2015, an increase in total miles driven by company drivers in the nine months ended September 30, 2016, compared to the same period in 2015, an increase in group health insurance expenses, and a $7.1 million one-time expense pertaining to Jerry Moyes' retirement package during the nine months ended September 30, 2016. |
(6) | $3.1 million increase in "Operating supplies and expenses," which was primarily due to a $22.0 million increase in legal reserves resulting from the receipt of unfavorable information regarding certain litigation within our Swift Refrigerated segment that was outstanding as of September 30, 2016. The three months ended September 30, 2015 included a $5.1 million settlement of a class action lawsuit and related items. The increase in legal reserves was partially offset by an $11.2 million decrease in equipment maintenance costs. |
(7) | $9.6 million loss on debt extinguishment during the nine months ended September 30, 2015, resulting from the replacement of the 2014 Agreement with the 2015 Agreement. |
(8) | $30.6 million decrease in income tax expense — The effective tax rate for the nine months ended September 30, 2016 was 31.9%, which was lower than our expectation of 36.5%. The difference was primarily due to certain income tax credits in our foreign and domestic subsidiaries, a reduction in our uncertain tax position reserve, and Federal domestic production deductions, all realized as discrete items. |
The effective tax rate for the nine months ended September 30, 2015 was 38.1%, which was lower than our expectation of 38.5%, primarily due to certain Federal employment tax credits realized as discrete items.
(9) | Other items. |
34
SWIFT TRANSPORTATION COMPANY
MANAGEMENT'S DISCUSSION AND ANALYSIS OF FINANCIAL CONDITION AND RESULTS OF OPERATIONS — CONTINUED
Non-GAAP Financial Measures |
Adjusted EPS, Adjusted Operating Ratio, and Adjusted EBITDA are not substitutes for their comparable GAAP financial measures, such as net income, cash flows from operating activities, operating margin, or other measures prescribed by GAAP. There are limitations to using non-GAAP financial measures. Although we believe that they improve comparability in analyzing our period to period performance, they could limit comparability to other companies in our industry if those companies define these measures differently. Because of these limitations, our non-GAAP financial measures should not be considered measures of income generated by our business or discretionary cash available to us to invest in the growth of our business. Management compensates for these limitations by primarily relying on GAAP results and using non-GAAP financial measures on a supplemental basis.
Adjusted EPS — Our definition of the non-GAAP measure, Adjusted EPS, starts with (a) income (loss) before income taxes, the most comparable GAAP measure. We add the following items back to (a) to arrive at (b) adjusted income (loss) before income taxes:
(i) | amortization of the intangibles from the 2007 Transactions, |
(ii) | non-cash impairments, |
(iii) | other special non-cash items, |
(iv) | excludable transaction costs, |
(v) | mark-to-market adjustments on our interest rate swaps, recognized in the income statement, |
(vi) | amortization of previous losses recorded in AOCI related to the interest rate swaps we terminated upon our IPO and refinancing transactions in December 2010, and |
(vii) | severance expense, including cash and equity award impact, related to the departure of certain executive leadership. |
We subtract income taxes, at the GAAP effective tax rate, from (b) to arrive at (c) adjusted earnings. Adjusted EPS is equal to (c) divided by weighted average diluted shares outstanding.
We believe that excluding the impact of derivatives provides for more transparency and comparability since these transactions have historically been volatile. Additionally, we believe that comparability of our performance is improved by excluding impairments that are unrelated to our core operations, as well as intangibles from the 2007 Transactions and other special items that are non-comparable in nature.
The following table is a GAAP to non-GAAP reconciliation for consolidated Adjusted EPS:
Note: Since the numbers reflected in the table below are calculated on a per share basis, they may not foot due to rounding.
Three Months Ended September 30, | Nine Months Ended September 30, | ||||||||||||||
2016 | 2015 | 2016 | 2015 | ||||||||||||
Diluted earnings per share | $ | 0.18 | $ | 0.25 | $ | 0.73 | $ | 0.87 | |||||||
Adjusted for: | |||||||||||||||
Income tax expense | 0.08 | 0.15 | 0.34 | 0.53 | |||||||||||
Income before income taxes | 0.26 | 0.40 | 1.07 | 1.40 | |||||||||||
Non-cash impairments of non-operating assets (1) | — | — | — | 0.01 | |||||||||||
Loss on debt extinguishment (2) | — | 0.07 | — | 0.07 | |||||||||||
Amortization of certain intangibles (3) | 0.03 | 0.03 | 0.09 | 0.08 | |||||||||||
Moyes retirement package (4) | 0.05 | — | 0.05 | — | |||||||||||
Adjusted income before income taxes | 0.34 | 0.49 | 1.20 | 1.56 | |||||||||||
Provision for income tax expense at effective rate | 0.10 | 0.18 | 0.38 | 0.59 | |||||||||||
Adjusted EPS | $ | 0.24 | $ | 0.31 | $ | 0.82 | $ | 0.96 | |||||||
35
SWIFT TRANSPORTATION COMPANY
MANAGEMENT'S DISCUSSION AND ANALYSIS OF FINANCIAL CONDITION AND RESULTS OF OPERATIONS — CONTINUED
____________
(1) | Refer to the discussion "Non-cash Impairments of Non-operating Assets" for the nine months ended September 30, 2015 under "Results of Operations — Consolidated Operating and Other Expenses," below. |
(2) | Refer to the discussion "Loss on Debt Extinguishment" for the three and nine months ended September 30, 2015 under "Results of Operations — Consolidated Operating and Other Expenses," below. |
(3) | "Amortization of certain intangibles" specifically reflects the non-cash amortization expense relating to certain intangible assets identified in the 2007 Transactions through which Swift Corporation acquired Swift Transportation Co, Inc. |
(4) | Refer to the discussion "Salaries, Wages, and Employee Benefits" for the three months ended September 30, 2016 under "Results of Operations — Consolidated Operating and Other Expenses," below. |
Adjusted Operating Ratio — Our definition of the non-GAAP measure, Adjusted Operating Ratio, starts with (a) operating expense and (b) operating revenue, which are GAAP financial measures. We subtract the following items from (a) to arrive at (c) adjusted operating expense:
(i) | fuel surcharge revenue, |
(ii) | amortization of the intangibles from the 2007 Transactions, |
(iii) | non-cash operating impairment charges, |
(iv) | other special non-cash items, |
(v) | excludable transaction costs, and |
(vi) | severance expense, including cash and equity award impact, related to the departure of certain executive leadership. |
We then subtract fuel surcharge revenue from (b) to arrive at (d) Revenue xFSR. Adjusted Operating Ratio is equal to (c) adjusted operating expense as a percentage of (d) Revenue xFSR.
We net fuel surcharge revenue against fuel expense in the calculation of our Adjusted Operating Ratio, thereby excluding fuel surcharge revenue from operating revenue in the denominator. Because fuel surcharge revenue is so volatile, we believe excluding it provides for more transparency and comparability. Additionally, we believe that comparability of our performance is improved by excluding operating impairment charges, non-comparable intangibles from the 2007 Transactions, and other special items.
The following table is a GAAP to non-GAAP reconciliation for consolidated Adjusted Operating Ratio:
Three Months Ended September 30, | Nine Months Ended September 30, | ||||||||||||||
2016 | 2015 | 2016 | 2015 | ||||||||||||
(Dollars in thousands) | |||||||||||||||
Operating revenue | $ | 1,013,226 | $ | 1,064,973 | $ | 2,992,903 | $ | 3,139,521 | |||||||
Less: Fuel surcharge revenue | (83,494 | ) | (109,999 | ) | (220,849 | ) | (353,784 | ) | |||||||
Revenue xFSR | $ | 929,732 | $ | 954,974 | $ | 2,772,054 | $ | 2,785,737 | |||||||
Operating expense | $ | 973,373 | $ | 990,052 | $ | 2,826,362 | $ | 2,891,124 | |||||||
Adjusted for: | |||||||||||||||
Fuel surcharge revenue | (83,494 | ) | (109,999 | ) | (220,849 | ) | (353,784 | ) | |||||||
Amortization of certain intangibles (1) | (3,912 | ) | (3,912 | ) | (11,736 | ) | (11,736 | ) | |||||||
Moyes retirement package (2) | (7,079 | ) | — | (7,079 | ) | — | |||||||||
Adjusted operating expense | $ | 878,888 | $ | 876,141 | $ | 2,586,698 | $ | 2,525,604 | |||||||
Operating Ratio | 96.1 | % | 93.0 | % | 94.4 | % | 92.1 | % | |||||||
Adjusted Operating Ratio | 94.5 | % | 91.7 | % | 93.3 | % | 90.7 | % | |||||||
____________
(1) | Refer to footnote (3) to the Adjusted EPS reconciliation for a description of "Amortization of certain intangibles." |
(2) | Refer to the discussion "Salaries, Wages, and Employee Benefits" for the three months ended September 30, 2016 under "Results of Operations — Consolidated Operating and Other Expenses," below. |
36
SWIFT TRANSPORTATION COMPANY
MANAGEMENT'S DISCUSSION AND ANALYSIS OF FINANCIAL CONDITION AND RESULTS OF OPERATIONS — CONTINUED
Adjusted EBITDA — Our definition of the non-GAAP measure, Adjusted EBITDA, starts with (a) net income (loss), the most comparable GAAP measure. We add the following items back to (a) to arrive at Adjusted EBITDA:
(i) | depreciation and amortization, |
(ii) | interest and derivative interest expense, including fees and charges associated with indebtedness, net of interest income, |
(iii) | income taxes, |
(iv) | non-cash equity compensation expense, |
(v) | non-cash impairments, |
(vi) | other special non-cash items, and |
(vii) | excludable transaction costs. |
We believe that Adjusted EBITDA is a relevant measure for estimating the cash generated by our operations that would be available to cover capital expenditures, taxes, interest, and other investments and that it enhances an investor’s understanding of our financial performance. We use Adjusted EBITDA for business planning purposes and in measuring our performance. Our method of computing Adjusted EBITDA is consistent with that used in our debt covenants, specifically in our leverage ratio, and is also routinely reviewed by management for that purpose.
The following table is a GAAP to non-GAAP reconciliation for consolidated Adjusted EBITDA:
Three Months Ended September 30, | Nine Months Ended September 30, | ||||||||||||||
2016 | 2015 | 2016 | 2015 | ||||||||||||
(In thousands) | |||||||||||||||
Net income | $ | 24,024 | $ | 36,281 | $ | 98,825 | $ | 125,075 | |||||||
Adjusted for: | |||||||||||||||
Depreciation and amortization of property and equipment | 67,245 | 66,852 | 198,884 | 184,194 | |||||||||||
Amortization of intangibles | 4,204 | 4,204 | 12,611 | 12,611 | |||||||||||
Interest expense | 7,384 | 9,130 | 23,545 | 29,627 | |||||||||||
Derivative interest expense | — | 68 | — | 3,972 | |||||||||||
Interest income | (624 | ) | (647 | ) | (2,011 | ) | (1,825 | ) | |||||||
Income tax expense | 10,292 | 21,274 | 46,275 | 76,842 | |||||||||||
EBITDA | 112,525 | 137,162 | 378,129 | 430,496 | |||||||||||
Non-cash equity compensation (1) | 1,150 | 1,735 | 4,691 | 4,618 | |||||||||||
Loss on debt extinguishment (2) | — | 9,567 | — | 9,567 | |||||||||||
Non-cash impairments of non-operating assets (3) | — | — | — | 1,480 | |||||||||||
Adjusted EBITDA | $ | 113,675 | $ | 148,464 | $ | 382,820 | $ | 446,161 | |||||||
____________
(1) | Represents recurring non-cash equity compensation expense on a pre-tax basis. In accordance with the terms of the 2015 Agreement, this expense is added back in the calculation of Adjusted EBITDA for covenant compliance purposes. |
(2) | Refer to the discussion "Loss on Debt Extinguishment" for the three and nine months ended September 30, 2015 under "Results of Operations — Consolidated Operating and Other Expenses," below. |
(3) | Refer to the discussion "Non-cash Impairments of Non-operating Assets" for the nine months ended September 30, 2015 under "Results of Operations — Consolidated Operating and Other Expenses," below. |
37
SWIFT TRANSPORTATION COMPANY
MANAGEMENT'S DISCUSSION AND ANALYSIS OF FINANCIAL CONDITION AND RESULTS OF OPERATIONS — CONTINUED
Results of Operations — Segment Review |
Consolidating tables for operating revenue and operating income are as follows:
Three Months Ended September 30, | Nine Months Ended September 30, | ||||||||||||||
2016 | 2015 | 2016 | 2015 | ||||||||||||
(In thousands) | |||||||||||||||
Operating revenue: | |||||||||||||||
Truckload | $ | 516,692 | $ | 552,816 | $ | 1,526,807 | $ | 1,646,872 | |||||||
Dedicated | 248,798 | 234,517 | 713,923 | 686,505 | |||||||||||
Swift Refrigerated | 85,019 | 93,045 | 256,774 | 286,301 | |||||||||||
Intermodal | 92,260 | 100,966 | 264,874 | 289,827 | |||||||||||
Subtotal | 942,769 | 981,344 | 2,762,378 | 2,909,505 | |||||||||||
Non-reportable segments | 89,740 | 104,176 | 288,303 | 289,667 | |||||||||||
Intersegment eliminations | (19,283 | ) | (20,547 | ) | (57,778 | ) | (59,651 | ) | |||||||
Consolidated operating revenue | $ | 1,013,226 | $ | 1,064,973 | $ | 2,992,903 | $ | 3,139,521 | |||||||
Three Months Ended September 30, | Nine Months Ended September 30, | ||||||||||||||
2016 | 2015 | 2016 | 2015 | ||||||||||||
(In thousands) | |||||||||||||||
Operating income (loss): | |||||||||||||||
Truckload | $ | 47,670 | $ | 57,012 | $ | 134,432 | $ | 181,810 | |||||||
Dedicated | 30,333 | 17,573 | 82,640 | 54,885 | |||||||||||
Swift Refrigerated | (20,250 | ) | 2,622 | (15,778 | ) | 13,538 | |||||||||
Intermodal | 358 | 723 | (1,647 | ) | 1,081 | ||||||||||
Subtotal | 58,111 | 77,930 | 199,647 | 251,314 | |||||||||||
Non-reportable segments | (18,258 | ) | (3,009 | ) | (33,106 | ) | (2,917 | ) | |||||||
Consolidated operating income | $ | 39,853 | $ | 74,921 | $ | 166,541 | $ | 248,397 | |||||||
Our chief operating decision makers monitor the GAAP results of our reportable segments, as supplemented by certain non-GAAP information. Refer to "Non-GAAP Financial Measures" above for more details. Additionally, we use a number of primary indicators to monitor our revenue and expense performance and efficiency.
Weekly Revenue xFSR per Tractor (monitored monthly) — This is our primary measure of productivity for our Truckload, Dedicated, and Swift Refrigerated segments. Weekly Revenue xFSR per tractor is affected by the following factors, which are typically monitored daily:
• | loaded miles (miles driven when hauling freight), |
• | fleet size (because available loads are spread over available tractors), |
• | rates received for our services, and |
• | network balance (number of loads accepted, compared to available trucks, by market). |
We strive to increase our revenue per tractor by improving freight rates with customers, hauling more loads with existing equipment, effectively moving freight, managing balance within our network, maintaining our tractors, recruiting and retaining company drivers, and attracting and maintaining contracts with owner-operators.
38
SWIFT TRANSPORTATION COMPANY
MANAGEMENT'S DISCUSSION AND ANALYSIS OF FINANCIAL CONDITION AND RESULTS OF OPERATIONS — CONTINUED
Deadhead Miles Percentage (monitored daily) — This is calculated by dividing the number of unpaid miles by the total number of miles driven. We monitor deadhead miles percentage in Truckload and Swift Refrigerated, as we strive to reduce our number of deadhead miles within these segments. By balancing our freight flows and planning consecutive loads with shorter distances between the drop-off and pick-up locations, we are able to reduce the percentage of deadhead miles driven to allow for more revenue-generating miles during our drivers’ hours-of-service. This also enables us to reduce wage, fuel, and other costs associated with deadhead miles.
Average Operational Truck Count (monitored daily) — We use this measure for all of our reportable segments. It includes tractors driven by company drivers as well as owner-operator units. This measure changes based on our ability to adjust our fleet size in response to changes in demand.
Load Count and Average Container Count (monitored daily) — Within Intermodal, we monitor load count and average container count. These metrics allow us to measure our utilization of our container fleet.
Adjusted Operating Ratio (monitored monthly) — We consider this ratio an important measure of our operating profitability for each of our reportable segments. We define and reconcile Adjusted Operating Ratio under "Non-GAAP Financial Measures" above. GAAP Operating Ratio is operating expenses as a percentage of revenue, or the inverse of operating margin, and produces an indication of operating efficiency. It is widely used in our industry as an assessment of management’s effectiveness in controlling all categories of operating expenses.
The following tables are GAAP to non-GAAP reconciliations for each reportable segment's Adjusted Operating Ratio:
Truckload Segment
Three Months Ended September 30, | Nine Months Ended September 30, | ||||||||||||||
2016 | 2015 | 2016 | 2015 | ||||||||||||
(Dollars in thousands) | |||||||||||||||
Operating revenue | $ | 516,692 | $ | 552,816 | $ | 1,526,807 | $ | 1,646,872 | |||||||
Less: Fuel surcharge revenue | (47,549 | ) | (63,363 | ) | (128,101 | ) | (203,205 | ) | |||||||
Revenue xFSR | $ | 469,143 | $ | 489,453 | $ | 1,398,706 | $ | 1,443,667 | |||||||
Operating expense | $ | 469,022 | $ | 495,804 | $ | 1,392,375 | $ | 1,465,062 | |||||||
Adjusted for: Fuel surcharge revenue | (47,549 | ) | (63,363 | ) | (128,101 | ) | (203,205 | ) | |||||||
Adjusted operating expense | $ | 421,473 | $ | 432,441 | $ | 1,264,274 | $ | 1,261,857 | |||||||
Operating Ratio | 90.8 | % | 89.7 | % | 91.2 | % | 89.0 | % | |||||||
Adjusted Operating Ratio | 89.8 | % | 88.4 | % | 90.4 | % | 87.4 | % | |||||||
Dedicated Segment
Three Months Ended September 30, | Nine Months Ended September 30, | ||||||||||||||
2016 | 2015 | 2016 | 2015 | ||||||||||||
(Dollars in thousands) | |||||||||||||||
Operating revenue | $ | 248,798 | $ | 234,517 | $ | 713,923 | $ | 686,505 | |||||||
Less: Fuel surcharge revenue | (14,401 | ) | (19,271 | ) | (35,021 | ) | (64,169 | ) | |||||||
Revenue xFSR | $ | 234,397 | $ | 215,246 | $ | 678,902 | $ | 622,336 | |||||||
Operating expense | $ | 218,465 | $ | 216,944 | $ | 631,283 | $ | 631,620 | |||||||
Adjusted for: Fuel surcharge revenue | (14,401 | ) | (19,271 | ) | (35,021 | ) | (64,169 | ) | |||||||
Adjusted operating expense | $ | 204,064 | $ | 197,673 | $ | 596,262 | $ | 567,451 | |||||||
Operating Ratio | 87.8 | % | 92.5 | % | 88.4 | % | 92.0 | % | |||||||
Adjusted Operating Ratio | 87.1 | % | 91.8 | % | 87.8 | % | 91.2 | % | |||||||
39
SWIFT TRANSPORTATION COMPANY
MANAGEMENT'S DISCUSSION AND ANALYSIS OF FINANCIAL CONDITION AND RESULTS OF OPERATIONS — CONTINUED
Swift Refrigerated Segment
Three Months Ended September 30, | Nine Months Ended September 30, | ||||||||||||||
2016 | 2015 | 2016 | 2015 | ||||||||||||
(Dollars in thousands) | |||||||||||||||
Operating revenue | $ | 85,019 | $ | 93,045 | $ | 256,774 | $ | 286,301 | |||||||
Less: Fuel surcharge revenue | (9,920 | ) | (12,055 | ) | (27,373 | ) | (40,933 | ) | |||||||
Revenue xFSR | $ | 75,099 | $ | 80,990 | $ | 229,401 | $ | 245,368 | |||||||
Operating expense | $ | 105,269 | $ | 90,423 | $ | 272,552 | $ | 272,763 | |||||||
Adjusted for: Fuel surcharge revenue | (9,920 | ) | (12,055 | ) | (27,373 | ) | (40,933 | ) | |||||||
Adjusted operating expense | $ | 95,349 | $ | 78,368 | $ | 245,179 | $ | 231,830 | |||||||
Operating Ratio | 123.8 | % | 97.2 | % | 106.1 | % | 95.3 | % | |||||||
Adjusted Operating Ratio | 127.0 | % | 96.8 | % | 106.9 | % | 94.5 | % | |||||||
Intermodal Segment
Three Months Ended September 30, | Nine Months Ended September 30, | ||||||||||||||
2016 | 2015 | 2016 | 2015 | ||||||||||||
(Dollars in thousands) | |||||||||||||||
Operating revenue | $ | 92,260 | $ | 100,966 | $ | 264,874 | $ | 289,827 | |||||||
Less: Fuel surcharge revenue | (9,294 | ) | (12,903 | ) | (24,291 | ) | (39,657 | ) | |||||||
Revenue xFSR | $ | 82,966 | $ | 88,063 | $ | 240,583 | $ | 250,170 | |||||||
Operating expense | $ | 91,902 | $ | 100,243 | $ | 266,521 | $ | 288,746 | |||||||
Adjusted for: Fuel surcharge revenue | (9,294 | ) | (12,903 | ) | (24,291 | ) | (39,657 | ) | |||||||
Adjusted operating expense | $ | 82,608 | $ | 87,340 | $ | 242,230 | $ | 249,089 | |||||||
Operating Ratio | 99.6 | % | 99.3 | % | 100.6 | % | 99.6 | % | |||||||
Adjusted Operating Ratio | 99.6 | % | 99.2 | % | 100.7 | % | 99.6 | % | |||||||
Segment Review — Comparison Between the Three Months Ended September 30, 2016 and September 30, 2015
Truckload Segment
Three Months Ended September 30, | Increase (Decrease) | |||||||||||||
2016 | 2015 | Amount | Percentage | |||||||||||
(Dollars (except per tractor amounts) and miles in thousands) | ||||||||||||||
Operating revenue | $ | 516,692 | $ | 552,816 | $ | (36,124 | ) | (6.5 | )% | |||||
Revenue xFSR | $ | 469,143 | $ | 489,453 | $ | (20,310 | ) | (4.1 | )% | |||||
Operating income | $ | 47,670 | $ | 57,012 | $ | (9,342 | ) | (16.4 | )% | |||||
Operating Ratio | 90.8 | % | 89.7 | % | 1.1 | % | ||||||||
Adjusted Operating Ratio | 89.8 | % | 88.4 | % | 1.4 | % | ||||||||
Weekly Revenue xFSR per tractor | $ | 3,460 | $ | 3,493 | $ | (33 | ) | (0.9 | )% | |||||
Total loaded miles | 256,532 | 261,339 | (4,807 | ) | (1.8 | )% | ||||||||
Deadhead miles percentage | 11.7 | % | 12.2 | % | (0.5 | )% | ||||||||
Average operational truck count: | ||||||||||||||
Company | 7,448 | 7,663 | (215 | ) | (2.8 | )% | ||||||||
Owner-operator | 2,869 | 2,999 | (130 | ) | (4.3 | )% | ||||||||
Total | 10,317 | 10,662 | (345 | ) | (3.2 | )% | ||||||||
40
SWIFT TRANSPORTATION COMPANY
MANAGEMENT'S DISCUSSION AND ANALYSIS OF FINANCIAL CONDITION AND RESULTS OF OPERATIONS — CONTINUED
Truckload Revenue — The decrease in operating revenue for the three months ended September 30, 2016, as compared to the same period in 2015, consisted of a $15.8 million decrease in fuel surcharge revenue, due to lower fuel prices, and a $20.3 million decrease in Revenue xFSR. The 4.1% decrease in Revenue xFSR reflects the following:
• | 2.3% decrease in Revenue xFSR per loaded mile, and a |
• | 1.8% decrease in total loaded miles. |
The decrease in weekly Revenue xFSR per tractor of 0.9% reflects the following:
• | 2.3% decrease in Revenue xFSR per loaded mile, noted above, partially offset by the |
• | 1.4% increase in loaded miles per tractor per week. |
Truckload volumes and pricing continued to be challenged with excess industry capacity, excess customer inventories, and depressed shipping demand during the three months ended September 30, 2016. We continued our participation in the spot market to help offset the lack of available freight in certain markets. This helped to balance our network, but had a negative impact on Revenue xFSR per loaded mile. We continue to monitor our spot market activity and expect to reduce our participation in the coming months.
Truckload Operating Income — Operating income decreased for the three months ended September 30, 2016, as compared to the same period in 2015, which was primarily driven by the decrease in Revenue xFSR, discussed above. Other factors that affected operating income are discussed within "Truckload Adjusted Operating Ratio," below.
Truckload Adjusted Operating Ratio — Adjusted Operating Ratio increased 140 basis points for the three months ended September 30, 2016, as compared to the same period in 2015, primarily driven by the decrease in Revenue xFSR, discussed above. In addition to the industry challenges associated with volumes and pricing that negatively affected Revenue xFSR, the continued soft used truck market contributed to an increase in depreciation expense (due to a change in the projected residual values of certain trucks) and a decrease in gain on disposals of property and equipment. This was partially offset by decreases in operating supplies and expenses and equipment maintenance expense.
During the three months ended September 30, 2016, we continued to implement various measures to improve cost control and efficiency, including right-sizing the fleet to drive improvements in asset utilization, improving freight and equipment network balance (which reduced deadhead percentage), continuing to focus on driver safety and satisfaction, and other cost control initiatives.
Dedicated Segment
Three Months Ended September 30, | Increase (Decrease) | |||||||||||||
2016 | 2015 | Amount | Percentage | |||||||||||
(Dollars in thousands, except per tractor amounts) | ||||||||||||||
Operating revenue | $ | 248,798 | $ | 234,517 | $ | 14,281 | 6.1 | % | ||||||
Revenue xFSR | $ | 234,397 | $ | 215,246 | $ | 19,151 | 8.9 | % | ||||||
Operating income | $ | 30,333 | $ | 17,573 | $ | 12,760 | 72.6 | % | ||||||
Operating Ratio | 87.8 | % | 92.5 | % | (4.7 | )% | ||||||||
Adjusted Operating Ratio | 87.1 | % | 91.8 | % | (4.7 | )% | ||||||||
Weekly Revenue xFSR per tractor | $ | 3,603 | $ | 3,333 | $ | 270 | 8.1 | % | ||||||
Average operational truck count: | ||||||||||||||
Company | 4,106 | 4,020 | 86 | 2.1 | % | |||||||||
Owner-operator | 845 | 893 | (48 | ) | (5.4 | )% | ||||||||
Total | 4,951 | 4,913 | 38 | 0.8 | % | |||||||||
Dedicated Revenue — The increase in operating revenue for the three months ended September 30, 2016, as compared to the same period in 2015, consisted of a $4.9 million decrease in fuel surcharge revenue, due to lower fuel prices, more than offset by a $19.2 million increase in Revenue xFSR. The 8.9% increase in Revenue xFSR reflects the following:
• | 8.1% increase in weekly Revenue xFSR per tractor from improved pricing and freight mix, and a |
• | 0.8% increase in average operational truck count, which was the result of recently awarded growth opportunities with our existing Dedicated customer base. We expect further truck count growth in this segment during the three months ended December 31, 2016, excluding seasonal surge support from the Truckload segment of approximately 20 to 30 trucks. |
41
SWIFT TRANSPORTATION COMPANY
MANAGEMENT'S DISCUSSION AND ANALYSIS OF FINANCIAL CONDITION AND RESULTS OF OPERATIONS — CONTINUED
Dedicated Operating Income — Operating income increased for the three months ended September 30, 2016, as compared to the same period in 2015, which was primarily driven by the increase in Revenue xFSR, discussed above. Other factors that affected operating income are discussed within "Dedicated Adjusted Operating Ratio," below.
Dedicated Adjusted Operating Ratio — Adjusted Operating Ratio decreased 470 basis points for the three months ended September 30, 2016, as compared to the same period in 2015. This was primarily driven by the increase in Revenue xFSR, discussed above, as well as the segment's continued focus on improving pricing, freight mix, underperforming fleets, and cost control. These improvements were partially offset by an increase in driver salaries and wages.
Swift Refrigerated Segment
Three Months Ended September 30, | Increase (Decrease) | |||||||||||||
2016 | 2015 | Amount | Percentage | |||||||||||
(Dollars (except per tractor amounts) and miles in thousands) | ||||||||||||||
Operating revenue | $ | 85,019 | $ | 93,045 | $ | (8,026 | ) | (8.6 | )% | |||||
Revenue xFSR | $ | 75,099 | $ | 80,990 | $ | (5,891 | ) | (7.3 | )% | |||||
Operating (loss) income | $ | (20,250 | ) | $ | 2,622 | $ | (22,872 | ) | (872.3 | )% | ||||
Operating Ratio | 123.8 | % | 97.2 | % | 26.6 | % | ||||||||
Adjusted Operating Ratio | 127.0 | % | 96.8 | % | 30.2 | % | ||||||||
Weekly Revenue xFSR per tractor | $ | 3,568 | $ | 3,466 | $ | 102 | 2.9 | % | ||||||
Total loaded miles | 40,701 | 42,431 | (1,730 | ) | (4.1 | )% | ||||||||
Deadhead miles percentage | 14.0 | % | 14.4 | % | (0.4 | )% | ||||||||
Average operational truck count: | ||||||||||||||
Company | 1,009 | 1,191 | (182 | ) | (15.3 | )% | ||||||||
Owner-operator | 593 | 587 | 6 | 1.0 | % | |||||||||
Total | 1,602 | 1,778 | (176 | ) | (9.9 | )% | ||||||||
Swift Refrigerated Revenue — The decrease in operating revenue for the three months ended September 30, 2016, as compared to the same period in 2015, consisted of a $2.1 million decrease in fuel surcharge revenue, due to lower fuel prices, and a $5.9 million decrease in Revenue xFSR. The 7.3% decrease in Revenue xFSR reflects the following:
• | 4.1% decrease in total loaded miles, and a |
• | 3.2% decrease in Revenue xFSR per loaded mile. |
The refrigerated market remained challenging as shippers continued to take advantage of the spot market, leading to sustained pricing pressures. This, along with the cost structure inherent in operating a refrigerated business, unfavorably impacted the profitability of this segment. In response to these market challenges, Swift Refrigerated continued to work on securing quality freight, improving asset utilization, and controlling costs. These efforts contributed to an increase in weekly Revenue xFSR per tractor of 2.9%, which was favorably impacted by a 6.5% increase in loaded miles per tractor per week and unfavorably impacted by the decrease in Revenue xFSR per loaded mile, noted above. During the three months ended September 30, 2016, we continued refining our refrigerated network, allowing more efficient matching of trucks with freight. As a result, deadhead percentage in this segment improved.
Swift Refrigerated Operating (Loss) Income — Swift Refrigerated recognized an operating loss for the three months ended September 30, 2016, as compared to operating income for the same period in 2015. The unfavorable change was driven by the decrease in Revenue xFSR, discussed above, and the factors discussed within "Swift Refrigerated Adjusted Operating Ratio," below.
Swift Refrigerated Adjusted Operating Ratio — Adjusted Operating Ratio increased significantly from the three months ended September 30, 2015 to the three months ended September 30, 2016, which was primarily driven by a $22.0 million increase in legal reserves related to new, unfavorable information associated with certain litigation within this segment, as well as a decrease in Revenue xFSR.
42
SWIFT TRANSPORTATION COMPANY
MANAGEMENT'S DISCUSSION AND ANALYSIS OF FINANCIAL CONDITION AND RESULTS OF OPERATIONS — CONTINUED
Intermodal Segment
Three Months Ended September 30, | Increase (Decrease) | |||||||||||||
2016 | 2015 | Amount | Percentage | |||||||||||
(Dollars in thousands) | ||||||||||||||
Operating revenue | $ | 92,260 | $ | 100,966 | $ | (8,706 | ) | (8.6 | )% | |||||
Revenue xFSR | $ | 82,966 | $ | 88,063 | $ | (5,097 | ) | (5.8 | )% | |||||
Operating income | $ | 358 | $ | 723 | $ | (365 | ) | (50.5 | )% | |||||
Operating Ratio | 99.6 | % | 99.3 | % | 0.3 | % | ||||||||
Adjusted Operating Ratio | 99.6 | % | 99.2 | % | 0.4 | % | ||||||||
Average operational truck count: | ||||||||||||||
Company | 426 | 546 | (120 | ) | (22.0 | )% | ||||||||
Owner-operator | 84 | 111 | (27 | ) | (24.3 | )% | ||||||||
Total | 510 | 657 | (147 | ) | (22.4 | )% | ||||||||
Load count | 43,787 | 47,107 | (3,320 | ) | (7.0 | )% | ||||||||
Average container count | 9,138 | 9,150 | (12 | ) | (0.1 | )% | ||||||||
Intermodal Revenue — The decrease in operating revenue for the three months ended September 30, 2016, as compared to the same period in 2015, consisted of a $3.6 million decrease in fuel surcharge revenue, due to lower fuel prices, and a $5.1 million decrease in Revenue xFSR. The 5.8% decrease in Revenue xFSR includes the following:
• | 7.0% decrease in load count, partially offset by a |
• | 1.4% increase in Revenue xFSR per load. |
Securing intermodal freight that met our internal pricing requirements continued to be a challenge during the three months ended September 30, 2016. The intermodal freight market initially showed signs of strengthening in the three months ended September 30, 2016, as our monthly COFC load volume deficit decreased in July and August 2016. However, United States rail traffic declined in September 2016, which caused inconsistent load volumes, primarily within our interior markets. This created container and freight imbalances and increased pricing pressures, as an increasing number of intermodal providers continued with their attempts to balance their networks and gain volume through aggressive pricing. Our COFC load counts decreased by 4.4%, which closely mirrored load count reductions in the intermodal industry as a whole. Our TOFC load counts significantly decreased since we stopped offering this service in March 2016.
Intermodal Operating Income — Operating income decreased for the three months ended September 30, 2016, as compared to the same period in 2015. This was primarily driven by the factors discussed within "Intermodal Revenue," above, and "Intermodal Adjusted Operating Ratio," below.
Intermodal Adjusted Operating Ratio — Adjusted Operating Ratio increased 40 basis points for the three months ended September 30, 2016, as compared to the same period in 2015. This was primarily driven by the decrease in Revenue xFSR, discussed above, partially offset by the favorable impacts from our initiatives to improve our cost infrastructure and operational efficiencies.
43
SWIFT TRANSPORTATION COMPANY
MANAGEMENT'S DISCUSSION AND ANALYSIS OF FINANCIAL CONDITION AND RESULTS OF OPERATIONS — CONTINUED
Non-reportable Segments
Three Months Ended September 30, | Increase (Decrease) | |||||||||||||
2016 | 2015 | Amount | Percentage | |||||||||||
(In thousands) | ||||||||||||||
Operating revenue | $ | 89,740 | $ | 104,176 | $ | (14,436 | ) | (13.9 | )% | |||||
Operating loss | (18,258 | ) | (3,009 | ) | (15,249 | ) | 506.8 | % | ||||||
Non-reportable Segments Revenue — Operating revenue within our non-reportable segments decreased for the three months ended September 30, 2016, as compared to the same period in 2015. This was primarily driven by the logistics business from a change in shipping patterns for two customers, as well as a decrease in revenue from services provided to owner-operators.
Non-reportable Segments Operating Loss — Operating loss increased for the three months ended September 30, 2016, as compared to the same period in 2015. This was primarily driven by the decrease in operating revenue, discussed above. Additionally, the one-time expense pertaining to Jerry Moyes' retirement package was recorded within the non-reportable segments in September 2016. This is discussed in more detail in "Salaries, Wages, and Employee Benefits" for the three months ended September 30, 2016 under "Results of Operations — Consolidated Operating and Other Expenses," below.
In the three months ended September 30, 2015, the operating loss in the non-reportable segments included a $5.1 million charge associated with the settlement of a class action lawsuit and related costs.
Segment Review — Comparison Between the Nine Months Ended September 30, 2016 and September 30, 2015
Truckload Segment
Nine Months Ended September 30, | Increase (Decrease) | |||||||||||||
2016 | 2015 | Amount | Percentage | |||||||||||
(Dollars (except per tractor amounts) and miles in thousands) | ||||||||||||||
Operating revenue | $ | 1,526,807 | $ | 1,646,872 | $ | (120,065 | ) | (7.3 | )% | |||||
Revenue xFSR | $ | 1,398,706 | $ | 1,443,667 | $ | (44,961 | ) | (3.1 | )% | |||||
Operating income | $ | 134,432 | $ | 181,810 | $ | (47,378 | ) | (26.1 | )% | |||||
Operating Ratio | 91.2 | % | 89.0 | % | 2.2 | % | ||||||||
Adjusted Operating Ratio | 90.4 | % | 87.4 | % | 3.0 | % | ||||||||
Weekly Revenue xFSR per tractor | $ | 3,399 | $ | 3,508 | $ | (109 | ) | (3.1 | )% | |||||
Total loaded miles | 760,293 | 777,874 | (17,581 | ) | (2.3 | )% | ||||||||
Deadhead miles percentage | 12.0 | % | 11.9 | % | 0.1 | % | ||||||||
Average operational truck count: | ||||||||||||||
Company | 7,576 | 7,488 | 88 | 1.2 | % | |||||||||
Owner-operator | 2,936 | 3,063 | (127 | ) | (4.1 | )% | ||||||||
Total | 10,512 | 10,551 | (39 | ) | (0.4 | )% | ||||||||
Truckload Revenue — The decrease in operating revenue for the nine months ended September 30, 2016, as compared to the same period in 2015, consisted of a $75.1 million decrease in fuel surcharge revenue, due to lower fuel prices, and a $45.0 million decrease in Revenue xFSR. The 3.1% decrease in Revenue xFSR reflects the following:
• | 2.3% decrease in total loaded miles, and a |
• | 0.8% decrease in Revenue xFSR per loaded mile. |
The decrease in weekly Revenue xFSR per tractor of 3.1% reflects the following:
• | 2.3% decrease in loaded miles per tractor per week, and the |
• | 0.8% decrease in Revenue xFSR per loaded mile, noted above. |
Truckload volumes and pricing continued to be challenged with excess industry capacity, excess customer inventories, and depressed shipping demand throughout the nine months ended September 30, 2016.
44
SWIFT TRANSPORTATION COMPANY
MANAGEMENT'S DISCUSSION AND ANALYSIS OF FINANCIAL CONDITION AND RESULTS OF OPERATIONS — CONTINUED
Truckload Operating Income — Operating income decreased for the nine months ended September 30, 2016, as compared to the same period in 2015, which was primarily driven by the decrease in Revenue xFSR, discussed above. Other factors that affected operating income are discussed within "Truckload Adjusted Operating Ratio," below.
Truckload Adjusted Operating Ratio — Adjusted Operating Ratio increased 300 basis points for the nine months ended September 30, 2016, as compared to the same period in 2015. This was primarily driven by the decrease in Revenue xFSR, discussed above. In addition to the industry challenges associated with volumes and pricing that negatively affected Revenue xFSR, the continued soft used truck market contributed to an increase in depreciation expense (due to a change in projected residual values of certain trucks) and a decrease in gain on disposals of property and equipment. Additionally, driver salaries and wages expense increased, primarily due to the company driver wage increase implemented in May 2015 and an increase in group health insurance expense. This was partially offset by impacts from the segment's continued focus on improving cost control.
Dedicated Segment
Nine Months Ended September 30, | Increase (Decrease) | |||||||||||||
2016 | 2015 | Amount | Percentage | |||||||||||
(Dollars in thousands, except per tractor amounts) | ||||||||||||||
Operating revenue | $ | 713,923 | $ | 686,505 | $ | 27,418 | 4.0 | % | ||||||
Revenue xFSR | $ | 678,902 | $ | 622,336 | $ | 56,566 | 9.1 | % | ||||||
Operating income | $ | 82,640 | $ | 54,885 | $ | 27,755 | 50.6 | % | ||||||
Operating Ratio | 88.4 | % | 92.0 | % | (3.6 | )% | ||||||||
Adjusted Operating Ratio | 87.8 | % | 91.2 | % | (3.4 | )% | ||||||||
Weekly Revenue xFSR per tractor | $ | 3,563 | $ | 3,294 | $ | 269 | 8.2 | % | ||||||
Average operational truck count: | ||||||||||||||
Company | 4,032 | 3,963 | 69 | 1.7 | % | |||||||||
Owner-operator | 835 | 881 | (46 | ) | (5.2 | )% | ||||||||
Total | 4,867 | 4,844 | 23 | 0.5 | % | |||||||||
Dedicated Revenue — The increase in operating revenue for the nine months ended September 30, 2016, as compared to the same period in 2015, consisted of a $29.1 million decrease in fuel surcharge revenue, due to lower fuel prices, more than offset by a $56.6 million increase in Revenue xFSR. The 9.1% increase in Revenue xFSR includes the following:
• | 8.2% increase in weekly Revenue xFSR per tractor from improved pricing and freight mix, and a |
• | 0.5% increase in average operational truck count. |
Dedicated Operating Income — Operating income increased for the nine months ended September 30, 2016, as compared to the same period in 2015, which was primarily driven by the increase in Revenue xFSR, discussed above. Other factors that affected operating income are discussed within "Dedicated Adjusted Operating Ratio," below.
Dedicated Adjusted Operating Ratio — Adjusted Operating Ratio decreased 340 basis points for the nine months ended September 30, 2016, as compared to the same period in 2015. This was primarily driven by the increase in Revenue xFSR, discussed above, as well as the segment's continued focus on improving pricing, freight mix, underperforming fleets, and cost control. These improvements were partially offset by an increase in salaries, wages, and employee benefits, primarily due to the company driver wage increases implemented in 2015 and an increase in group health insurance expense.
45
SWIFT TRANSPORTATION COMPANY
MANAGEMENT'S DISCUSSION AND ANALYSIS OF FINANCIAL CONDITION AND RESULTS OF OPERATIONS — CONTINUED
Swift Refrigerated Segment
Nine Months Ended September 30, | Increase (Decrease) | |||||||||||||
2016 | 2015 | Amount | Percentage | |||||||||||
(Dollars (except per tractor amounts) and miles in thousands) | ||||||||||||||
Operating revenue | $ | 256,774 | $ | 286,301 | $ | (29,527 | ) | (10.3 | )% | |||||
Revenue xFSR | $ | 229,401 | $ | 245,368 | $ | (15,967 | ) | (6.5 | )% | |||||
Operating (loss) income | $ | (15,778 | ) | $ | 13,538 | $ | (29,316 | ) | (216.5 | )% | ||||
Operating Ratio | 106.1 | % | 95.3 | % | 10.8 | % | ||||||||
Adjusted Operating Ratio | 106.9 | % | 94.5 | % | 12.4 | % | ||||||||
Weekly Revenue xFSR per tractor | $ | 3,518 | $ | 3,429 | $ | 89 | 2.6 | % | ||||||
Total loaded miles | 124,289 | 127,525 | (3,236 | ) | (2.5 | )% | ||||||||
Deadhead miles percentage | 13.9 | % | 14.1 | % | (0.2 | )% | ||||||||
Average operational truck count: | ||||||||||||||
Company | 1,068 | 1,246 | (178 | ) | (14.3 | )% | ||||||||
Owner-operator | 598 | 589 | 9 | 1.5 | % | |||||||||
Total | 1,666 | 1,835 | (169 | ) | (9.2 | )% | ||||||||
Swift Refrigerated Revenue — The decrease in operating revenue for the nine months ended September 30, 2016, as compared to the same period in 2015, consisted of a $13.6 million decrease in fuel surcharge revenue, due to lower fuel prices, and a $16.0 million decrease in Revenue xFSR. The 6.5% decrease in Revenue xFSR reflects the following:
• | 4.0% decrease in Revenue xFSR per loaded mile, and a |
• | 2.5% decrease in total loaded miles. |
Our efforts in increasing freight volumes and improving asset utilization contributed to an increase in weekly Revenue xFSR per tractor of 2.6%, which was favorably impacted by a 7.0% increase in loaded miles per tractor per week and unfavorably impacted by the decrease in Revenue xFSR per loaded mile, noted above.
Swift Refrigerated Operating (Loss) Income — Swift Refrigerated recognized an operating loss for the nine months ended September 30, 2016, as compared to operating income for the same period in 2015. The unfavorable change was driven by the decrease in Revenue xFSR, discussed above, and the factors discussed within "Swift Refrigerated Adjusted Operating Ratio," below.
Swift Refrigerated Adjusted Operating Ratio — Adjusted Operating Ratio increased significantly from the nine months ended September 30, 2015 to the nine months ended September 30, 2016, which was primarily driven by a $22.0 million increase in legal reserves related to new, unfavorable information associated with certain litigation within this segment, as well as a decrease in Revenue xFSR. This was partially offset by decreases in rent and depreciation, salaries and wages, and other operating expenses from our initiatives to improve cost control.
46
SWIFT TRANSPORTATION COMPANY
MANAGEMENT'S DISCUSSION AND ANALYSIS OF FINANCIAL CONDITION AND RESULTS OF OPERATIONS — CONTINUED
Intermodal Segment
Nine Months Ended September 30, | Increase (Decrease) | |||||||||||||
2016 | 2015 | Amount | Percentage | |||||||||||
(Dollars in thousands) | ||||||||||||||
Operating revenue | $ | 264,874 | $ | 289,827 | $ | (24,953 | ) | (8.6 | )% | |||||
Revenue xFSR | $ | 240,583 | $ | 250,170 | $ | (9,587 | ) | (3.8 | )% | |||||
Operating (loss) income | $ | (1,647 | ) | $ | 1,081 | $ | (2,728 | ) | (252.4 | )% | ||||
Operating Ratio | 100.6 | % | 99.6 | % | 1.0 | % | ||||||||
Adjusted Operating Ratio | 100.7 | % | 99.6 | % | 1.1 | % | ||||||||
Average operational truck count: | ||||||||||||||
Company | 441 | 516 | (75 | ) | (14.5 | )% | ||||||||
Owner-operator | 90 | 98 | (8 | ) | (8.2 | )% | ||||||||
Total | 531 | 614 | (83 | ) | (13.5 | )% | ||||||||
Load count | 128,166 | 135,564 | (7,398 | ) | (5.5 | )% | ||||||||
Average container count | 9,146 | 9,150 | (4 | ) | — | % | ||||||||
Intermodal Revenue — The decrease in operating revenue for the nine months ended September 30, 2016, as compared to the same period in 2015, consisted of a $15.4 million decrease in fuel surcharge revenue, due to lower fuel prices, and a $9.6 million decrease in Revenue xFSR. The 3.8% decrease in Revenue xFSR reflects the following:
• | 5.5% decrease in load count. COFC loads decreased by 3.0%, while TOFC loads were progressively ramped down, as we strategically focused on our COFC service. In March 2016, the TOFC service offering was completely eliminated, which we believe will allow for increased operational efficiencies going forward. |
• | partially offset by a 1.7% increase in Revenue xFSR per load. |
The intermodal market was challenging throughout the nine months ended September 30, 2016, with freight imbalances and increased pricing pressures. The Intermodal segment remained committed to its strategy of moving appropriately-priced freight, aligned with its network.
Intermodal Operating (Loss) Income — Intermodal incurred an operating loss of $1.6 million during the nine months ended September 30, 2016, as compared to operating income of $1.1 million for the same period in 2015. This was primarily driven by the factors discussed within "Intermodal Revenue," above, and "Intermodal Adjusted Operating Ratio," below.
Intermodal Adjusted Operating Ratio — Adjusted Operating Ratio increased 110 basis points for the nine months ended September 30, 2016, as compared to the same period in 2015. This was primarily driven by the decrease in Revenue xFSR, discussed above, partially offset by the favorable impacts from our initiatives to improve our cost infrastructure and operational efficiencies.
Non-reportable Segments
Nine Months Ended September 30, | Increase (Decrease) | |||||||||||||
2016 | 2015 | Amount | Percentage | |||||||||||
(In thousands) | ||||||||||||||
Operating revenue | $ | 288,303 | $ | 289,667 | $ | (1,364 | ) | (0.5 | )% | |||||
Operating loss | (33,106 | ) | (2,917 | ) | (30,189 | ) | 1,034.9 | % | ||||||
Non-reportable Segments Revenue — Operating revenue within our non-reportable segments decreased for the nine months ended September 30, 2016, as compared to the same period in 2015. This was primarily driven by a decrease in revenue from services provided to owner-operators, partially offset by growth in the logistics business.
Non-reportable Segments Operating Loss — Operating loss increased for the nine months ended September 30, 2016, as compared to the same period in 2015. In addition to the decrease in operating revenue, discussed above, the increase in operating loss was driven by an increase in purchased transportation expenses within the logistics business and increased expenses for our services provided to owner-operators for maintenance and insurance. Additionally, the one-time expense pertaining to Jerry Moyes' retirement package was recorded within the non-reportable segments in September 2016. This is discussed in more detail in "Salaries, Wages, and Employee Benefits" for the three months ended September 30, 2016 under "Results of Operations — Consolidated Operating and Other Expenses," below.
In the nine months ended September 30, 2015, the operating loss in the non-reportable segments included a $5.1 million charge associated with the settlement of a class action lawsuit and related costs.
47
SWIFT TRANSPORTATION COMPANY
MANAGEMENT'S DISCUSSION AND ANALYSIS OF FINANCIAL CONDITION AND RESULTS OF OPERATIONS — CONTINUED
Results of Operations — Consolidated Operating and Other Expenses |
Operating Expenses — The following tables present certain operating expenses from our consolidated income statements, including each operating expense as a percentage of operating revenue and as a percentage of Revenue xFSR. Fuel surcharge revenue can be volatile and is primarily dependent upon the cost of fuel, rather than operational expenses that are unrelated to fuel. Therefore, we believe that Revenue xFSR is a better measure for analyzing many of our expenses and operating metrics.
Consolidated Expenses — Comparison Between the Three Months Ended September 30, 2016 and September 30, 2015
Three Months Ended September 30, | Increase (Decrease) | |||||||||||||
2016 | 2015 | Amount | Percentage | |||||||||||
(Dollars in thousands) | ||||||||||||||
Salaries, wages, and employee benefits | $ | 293,098 | $ | 283,767 | $ | 9,331 | 3.3 | % | ||||||
% of operating revenue | 28.9 | % | 26.6 | % | 2.3 | % | ||||||||
% of Revenue xFSR | 31.5 | % | 29.7 | % | 1.8 | % | ||||||||
The increase in salaries, wages, and employee benefits was primarily due to Jerry Moyes' retirement package. In conjunction with the Company's September 8, 2016 announcement that Mr. Moyes would retire from his position as Chief Executive Officer effective December 31, 2016, the Company entered into an agreement with Mr. Moyes to memorialize the terms of his retirement. The Company contracted with Mr. Moyes to serve as a non-employee consultant from January 1, 2017 through December 31, 2019, during which time the Company will pay Mr. Moyes a monthly consulting fee of $0.2 million in cash. Additionally, the Company modified the vesting terms and forfeiture conditions of Mr. Moyes' previously-granted equity awards. As a result of the terms of the agreement, the Company incurred a one-time expense in September 2016 of $7.1 million, consisting of $6.8 million in accrued consulting fees and $0.3 million for the impact of the equity award modifications. The amount is included in the non-reportable segments' income statement.
Additionally, driver wage expenses were higher in the three months ended September 30, 2016, compared to the same period in 2015, which was primarily due to higher driver pay rates and a 0.6% increase in total miles driven by company drivers. This was partially offset by lower expenses associated with workers' compensation and employee benefits.
Three Months Ended September 30, | Increase (Decrease) | |||||||||||||
2016 | 2015 | Amount | Percentage | |||||||||||
(Dollars in thousands) | ||||||||||||||
Operating supplies and expenses | $ | 113,750 | $ | 102,719 | $ | 11,031 | 10.7 | % | ||||||
% of operating revenue | 11.2 | % | 9.6 | % | 1.6 | % | ||||||||
% of Revenue xFSR | 12.2 | % | 10.8 | % | 1.4 | % | ||||||||
The increase in operating supplies and expenses was primarily due to a $22.0 million increase in legal reserves resulting from the receipt of unfavorable information regarding certain litigation within our Swift Refrigerated segment that was outstanding as of September 30, 2016.
The three months ended September 30, 2015 included a $5.1 million settlement of a class action lawsuit and related items.
Three Months Ended September 30, | Increase (Decrease) | |||||||||||||
2016 | 2015 | Amount | Percentage | |||||||||||
(Dollars in thousands) | ||||||||||||||
Fuel expense | $ | 90,464 | $ | 103,023 | $ | (12,559 | ) | (12.2 | )% | |||||
% of operating revenue | 8.9 | % | 9.7 | % | (0.8 | )% | ||||||||
% of Revenue xFSR | 9.7 | % | 10.8 | % | (1.1 | )% | ||||||||
Fuel prices were lower overall during the three months ended September 30, 2016, which had an average DOE index of $2.38, compared to the same period in 2015, which had an average DOE index of $2.63. The decrease in fuel expense was the result of lower fuel prices, as well as improved fuel efficiency, partially offset by the increase in total miles driven by company drivers, noted above.
48
SWIFT TRANSPORTATION COMPANY
MANAGEMENT'S DISCUSSION AND ANALYSIS OF FINANCIAL CONDITION AND RESULTS OF OPERATIONS — CONTINUED
Three Months Ended September 30, | Increase (Decrease) | |||||||||||||
2016 | 2015 | Amount | Percentage | |||||||||||
(Dollars in thousands) | ||||||||||||||
Purchased transportation expense | $ | 280,041 | $ | 299,866 | $ | (19,825 | ) | (6.6 | )% | |||||
% of operating revenue | 27.6 | % | 28.2 | % | (0.6 | )% | ||||||||
% of Revenue xFSR | 30.1 | % | 31.4 | % | (1.3 | )% | ||||||||
Purchased transportation expense includes payments made to owner-operators, rail partners, and other third parties that we use for intermodal drayage and other brokered business. The decrease in the expense was attributed to lower logistics and intermodal freight volumes, resulting in a decrease in payments to rail and other third-party carriers. Additionally, fuel reimbursements to owner-operators and other third parties decreased as a result of lower fuel prices and a 2.9% decrease in miles driven by owner-operators.
Three Months Ended September 30, | Increase (Decrease) | |||||||||||||
2016 | 2015 | Amount | Percentage | |||||||||||
(Dollars in thousands) | ||||||||||||||
Insurance and claims | $ | 47,372 | $ | 52,877 | $ | (5,505 | ) | (10.4 | )% | |||||
% of operating revenue | 4.7 | % | 5.0 | % | (0.3 | )% | ||||||||
% of Revenue xFSR | 5.1 | % | 5.5 | % | (0.4 | )% | ||||||||
Insurance and claims expense decreased from the three months ended September 30, 2015 to the three months ended September 30, 2016. This was predominantly associated with the negative development incurred during the three months ended September 30, 2015, as compared to the three months ended September 30, 2016. During the three months ended September 30, 2015, our insurance and claims expense increased significantly due to adverse development within our then prior-year claims and the corresponding impact on our reserves.
Three Months Ended September 30, | Increase (Decrease) | |||||||||||||
2016 | 2015 | Amount | Percentage | |||||||||||
(Dollars in thousands) | ||||||||||||||
Rental expense and depreciation and amortization of property and equipment | $ | 124,249 | $ | 125,940 | $ | (1,691 | ) | (1.3 | )% | |||||
% of operating revenue | 12.3 | % | 11.8 | % | 0.5 | % | ||||||||
% of Revenue xFSR | 13.4 | % | 13.2 | % | 0.2 | % | ||||||||
For analytical purposes only, we combine our rental expense with depreciation and amortization of property and equipment because the mix of our leased versus owned tractors varies from period to period. The combined expense decreased due to a smaller tractor and trailer fleet, but this decrease was partially offset by an increase in depreciation resulting from a reduction in the residual values of certain trucks.
Three Months Ended September 30, | Increase (Decrease) | |||||||||||||
2016 | 2015 | Amount | Percentage | |||||||||||
(Dollars in thousands) | ||||||||||||||
Gain on disposal of property and equipment | $ | 5,620 | $ | 9,825 | $ | (4,205 | ) | (42.8 | )% | |||||
% of operating revenue | 0.6 | % | 0.9 | % | (0.3 | )% | ||||||||
% of Revenue xFSR | 0.6 | % | 1.0 | % | (0.4 | )% | ||||||||
Gain on disposal of property and equipment is dependent upon the number of tractors and trailers that we have available for trade or sale during the period, execution of those sales, the type of equipment we are selling, and the used equipment market, among other things. The decrease in gain on disposal of property and equipment was primarily driven by lower gain on disposals of tractors, due to a soft used truck market in the three months ended September 30, 2016, compared to the same period in 2015. This was partially offset by an increase in the volume of trailers sold.
We expect gain on disposals of property and equipment to remain soft (in the $3.0 million to $4.0 million range) in the three months ended December 31, 2016.
49
SWIFT TRANSPORTATION COMPANY
MANAGEMENT'S DISCUSSION AND ANALYSIS OF FINANCIAL CONDITION AND RESULTS OF OPERATIONS — CONTINUED
Other Expenses — The following table summarizes fluctuations in certain non-operating expenses, included in our consolidated income statements, for the three months ended September 30, 2016, as compared to the three months ended September 30, 2015.
Three Months Ended September 30, | Increase (Decrease) | |||||||||||||
2016 | 2015 | Amount | Percentage | |||||||||||
(Dollars in thousands) | ||||||||||||||
Interest expense | $ | 7,384 | $ | 9,130 | $ | (1,746 | ) | (19.1 | )% | |||||
Loss on debt extinguishment | $ | — | $ | 9,567 | $ | (9,567 | ) | (100.0 | )% | |||||
Income tax expense | $ | 10,292 | $ | 21,274 | $ | (10,982 | ) | (51.6 | )% | |||||
Interest Expense — Interest expense is comprised of debt interest expense, amortization of DLCs, and (with respect to the three months ended September 30, 2015) OID. The decrease in interest expense was primarily driven by overall lower debt balances during the three months ended September 30, 2016.
Loss on Debt Extinguishment — In July 2015, we replaced the 2014 Agreement with the 2015 Agreement, which resulted in a loss on debt extinguishment of $9.6 million, reflecting the write-off of the unamortized OID and DLCs fees related to the 2014 Agreement.
Income Tax Expense — The effective tax rate for the three months ended September 30, 2016 was 30.0%, which was lower than our expectation of 36.5%. The difference was primarily due to Federal domestic production deductions realized as discrete items in the three months ended September 30, 2016. The Company anticipates securing additional Federal domestic production deductions for other tax years during the three months ended December 31, 2016, but the exact amount is not yet known. Due to ongoing income tax credits and deductions, we expect the 2017 quarterly GAAP effective tax rate to be in the range of 36.0% to 37.5%, before discrete items.
The effective tax rate for the three months ended September 30, 2015 was 37.0%, which was lower than our expectation of 38.5%, primarily due to certain Federal employment tax credits realized as discrete items.
Consolidated Expenses — Comparison Between the Nine Months Ended September 30, 2016 and September 30, 2015
Nine Months Ended September 30, | Increase (Decrease) | |||||||||||||
2016 | 2015 | Amount | Percentage | |||||||||||
(Dollars in thousands) | ||||||||||||||
Salaries, wages, and employee benefits | $ | 868,831 | $ | 821,747 | $ | 47,084 | 5.7 | % | ||||||
% of operating revenue | 29.0 | % | 26.2 | % | 2.8 | % | ||||||||
% of Revenue xFSR | 31.3 | % | 29.5 | % | 1.8 | % | ||||||||
The increase in salaries, wages, and employee benefits was primarily due to the driver wage increase implemented in May 2015, a 1.6% increase in total miles driven by company drivers in the nine months ended September 30, 2016, compared to the same period in 2015, as well as an increase in group health insurance expenses. Additionally, the Company incurred a $7.1 million one-time expense pertaining to Jerry Moyes' retirement package in September 2016, which is discussed in more detail under "Consolidated Expenses — Comparison Between the Three Months Ended September 30, 2016 and September 30, 2015," above.
Nine Months Ended September 30, | Increase (Decrease) | |||||||||||||
2016 | 2015 | Amount | Percentage | |||||||||||
(Dollars in thousands) | ||||||||||||||
Operating supplies and expenses | $ | 291,185 | $ | 288,070 | $ | 3,115 | 1.1 | % | ||||||
% of operating revenue | 9.7 | % | 9.2 | % | 0.5 | % | ||||||||
% of Revenue xFSR | 10.5 | % | 10.3 | % | 0.2 | % | ||||||||
The increase in operating supplies and expenses was primarily due to a $22.0 million increase in legal reserves resulting from the receipt of unfavorable information regarding certain litigation within our Swift Refrigerated segment that was outstanding as of September 30, 2016. The three months ended September 30, 2015 included a $5.1 million settlement of a class action lawsuit and related items. The increase in legal reserves was partially offset by an $11.2 million decrease in equipment maintenance costs.
50
SWIFT TRANSPORTATION COMPANY
MANAGEMENT'S DISCUSSION AND ANALYSIS OF FINANCIAL CONDITION AND RESULTS OF OPERATIONS — CONTINUED
Nine Months Ended September 30, | Increase (Decrease) | |||||||||||||
2016 | 2015 | Amount | Percentage | |||||||||||
(Dollars in thousands) | ||||||||||||||
Fuel expense | $ | 252,822 | $ | 326,598 | $ | (73,776 | ) | (22.6 | )% | |||||
% of operating revenue | 8.4 | % | 10.4 | % | (2.0 | )% | ||||||||
% of Revenue xFSR | 9.1 | % | 11.7 | % | (2.6 | )% | ||||||||
Fuel prices were lower overall during the nine months ended September 30, 2016, which had an average DOE index of $2.25, compared to the same period in 2015, which had an average DOE index of $2.80. The decrease in our fuel expense was the result of lower fuel prices, as well as improved fuel efficiency, partially offset by the increase in total miles driven by company drivers, noted above.
Nine Months Ended September 30, | Increase (Decrease) | |||||||||||||
2016 | 2015 | Amount | Percentage | |||||||||||
(Dollars in thousands) | ||||||||||||||
Purchased transportation expense | $ | 830,952 | $ | 883,354 | $ | (52,402 | ) | (5.9 | )% | |||||
% of operating revenue | 27.8 | % | 28.1 | % | (0.3 | )% | ||||||||
% of Revenue xFSR | 30.0 | % | 31.7 | % | (1.7 | )% | ||||||||
The decrease in the expense was attributed to reduced fuel reimbursements to owner-operators, as a result of lower fuel prices and a 3.4% decrease in miles driven by owner-operators. Additionally, lower intermodal freight volumes resulted in a decrease in payments to rail carriers, further contributing to the decrease in the expense. This was partially offset by the impact of increasing owner-operator contracted pay rates in May 2015.
Nine Months Ended September 30, | Increase (Decrease) | |||||||||||||
2016 | 2015 | Amount | Percentage | |||||||||||
(Dollars in thousands) | ||||||||||||||
Insurance and claims | $ | 140,888 | $ | 139,390 | $ | 1,498 | 1.1 | % | ||||||
% of operating revenue | 4.7 | % | 4.4 | % | 0.3 | % | ||||||||
% of Revenue xFSR | 5.1 | % | 5.0 | % | 0.1 | % | ||||||||
Although insurance and claims expense slightly increased from the nine months ended September 30, 2015 to the nine months ended September 30, 2016, the expense remained relatively flat as a percentage of Revenue xFSR.
Nine Months Ended September 30, | Increase (Decrease) | |||||||||||||
2016 | 2015 | Amount | Percentage | |||||||||||
(Dollars in thousands) | ||||||||||||||
Rental expense and depreciation and amortization of property and equipment | $ | 369,210 | $ | 365,103 | $ | 4,107 | 1.1 | % | ||||||
% of operating revenue | 12.3 | % | 11.6 | % | 0.7 | % | ||||||||
% of Revenue xFSR | 13.3 | % | 13.1 | % | 0.2 | % | ||||||||
Combined rental expense and depreciation and amortization of property and equipment slightly increased (partially due to a change in the projected residual values of certain trucks), but remained relatively flat as a percentage of Revenue xFSR.
Nine Months Ended September 30, | Increase (Decrease) | |||||||||||||
2016 | 2015 | Amount | Percentage | |||||||||||
(Dollars in thousands) | ||||||||||||||
Gain on disposal of property and equipment | $ | 16,909 | $ | 23,987 | $ | (7,078 | ) | (29.5 | )% | |||||
% of operating revenue | 0.6 | % | 0.8 | % | (0.2 | )% | ||||||||
% of Revenue xFSR | 0.6 | % | 0.9 | % | (0.3 | )% | ||||||||
51
SWIFT TRANSPORTATION COMPANY
MANAGEMENT'S DISCUSSION AND ANALYSIS OF FINANCIAL CONDITION AND RESULTS OF OPERATIONS — CONTINUED
At the end of 2015, we had a significant backlog of tractors that we were processing for trade or sale. During the three months ended March 31, 2016, we worked through a majority of the backlog; however, due to the soft used truck market throughout the nine months ended September 30, 2016, gain on disposals of tractors was lower than in the nine months ended September 30, 2015. This was partially offset by an increase in the volume of trailers sold in the nine months ended September 30, 2016, compared to the same period in 2015.
Other Expenses — The following table summarizes fluctuations in certain non-operating expenses, included in our consolidated income statements, for the nine months ended September 30, 2016, as compared to the nine months ended September 30, 2015.
Nine Months Ended September 30, | Increase (Decrease) | |||||||||||||
2016 | 2015 | Amount | Percentage | |||||||||||
(Dollars in thousands) | ||||||||||||||
Interest expense | $ | 23,545 | $ | 29,627 | $ | (6,082 | ) | (20.5 | )% | |||||
Derivative interest expense | $ | — | $ | 3,972 | $ | (3,972 | ) | (100.0 | )% | |||||
Loss on debt extinguishment | $ | — | $ | 9,567 | $ | (9,567 | ) | (100.0 | )% | |||||
Non-cash impairments of non-operating assets | $ | — | $ | 1,480 | $ | (1,480 | ) | (100.0 | )% | |||||
Legal settlements and reserves | $ | 3,000 | $ | 6,000 | $ | (3,000 | ) | (50.0 | )% | |||||
Income tax expense | $ | 46,275 | $ | 76,842 | $ | (30,567 | ) | (39.8 | )% | |||||
Interest Expense — Interest expense is comprised of debt interest expense, amortization of DLCs, and (with respect to the nine months ended September 30, 2015) OID. The decrease in interest expense was primarily driven by overall lower debt balances during the nine months ended September 30, 2016, as well as more favorable interest rates and terms in the 2015 Agreement, which replaced the 2014 Agreement in July 2015.
Derivative Interest Expense — Derivative interest expense reflects losses reclassified from AOCI into net income from the effective portion of cash flow hedges, as well as the income effect of mark-to-market adjustments and current settlements of interest rate swaps, which were de-designated in February 2013. The final settlement of our interest rate swaps occurred in July 2015.
Loss on Debt Extinguishment — In July 2015, we replaced the 2014 Agreement with the 2015 Agreement, which resulted in a loss on debt extinguishment of $9.6 million, reflecting the write-off of the unamortized OID and DLCs related to the 2014 Agreement.
Non-cash Impairments of Non-operating Assets — In September 2013, the Company agreed to advance up to $2.3 million, pursuant to an unsecured promissory note, to an independent fleet contractor that transported freight on Swift's behalf. In March 2015, management became aware that the independent contractor violated various covenants outlined in the unsecured promissory note, which created an event of default that made the principal and accrued interest immediately due and payable. As a result of this event of default, as well as an overall decline in the independent contractor's financial condition, management re-evaluated the fair value of the unsecured promissory note. At March 31, 2015, management determined that the remaining balance due from the independent contractor to the Company was not collectible, which resulted in a $1.5 million pre-tax adjustment that was recorded in "Non-cash impairments of non-operating assets" in the Company's consolidated income statements.
Legal Settlements and Reserves — In June 2016, we reserved for a $3.0 million expense from a legal matter, which was not associated with our normal business operations.
In June 2015, the Company settled a lawsuit related to a contractual dispute with an ancillary fuel system equipment supplier. As a result of this settlement, the Company incurred a $6.0 million expense.
Income Tax Expense — The effective tax rate for the nine months ended September 30, 2016 was 31.9%, which was lower than our expectation of 36.5%. The difference was primarily due to a foreign subsidiary's income tax credits related to tolls paid, a domestic subsidiary's income tax credits for research and development, a reduction in the uncertain tax position reserve, and Federal domestic production deductions, all realized as discrete items.
The effective tax rate for the nine months ended September 30, 2015 was 38.1%, which was lower than our expectation of 38.5%, primarily due to certain Federal employment tax credits realized as discrete items.
52
SWIFT TRANSPORTATION COMPANY
MANAGEMENT'S DISCUSSION AND ANALYSIS OF FINANCIAL CONDITION AND RESULTS OF OPERATIONS — CONTINUED
Liquidity and Capital Resources |
Sources of Liquidity
The following table presents our available sources of liquidity:
Source | September 30, 2016 | |||
(In thousands) | ||||
Cash and cash equivalents, excluding restricted cash | $ | 71,258 | ||
Availability under New Revolver, due July 2020 (1) | 453,037 | |||
Availability under 2015 RSA, due January 2019 (2) | 6,300 | |||
Total unrestricted liquidity | $ | 530,595 | ||
Cash and cash equivalents – restricted (3) | 59,487 | |||
Restricted investments, held to maturity, amortized cost (3) | 22,864 | |||
Total liquidity, including restricted cash and restricted investments | $ | 612,946 | ||
____________
(1) | As of September 30, 2016, we had $50.0 million in borrowings under the $600.0 million New Revolver. We additionally had $97.0 million in outstanding letters of credit (discussed below), leaving $453.0 million available under the New Revolver. |
(2) | Based on eligible receivables at September 30, 2016, our borrowing base for the 2015 RSA was $306.3 million, while outstanding borrowings were $300.0 million, gross of DLCs. |
(3) | Restricted cash and cash equivalents, and restricted short-term investments are primarily held by our captive insurance companies for claims payments. |
Uses of Liquidity
Our business requires substantial amounts of cash for operating activities, including salaries and wages paid to our employees, contract payments to owner-operators, insurance and claims payments, tax payments, and others. We also use large amounts of cash and credit for the following activities:
• | Capital Expenditures — When justified by customer demand, as well as our liquidity and our ability to generate acceptable returns, we make substantial cash capital expenditures to maintain a modern company tractor fleet, refresh our trailer fleet, and fund growth in our revenue equipment fleet. We expect net cash capital expenditures to be in the range of $125.0 to $135.0 million for full-year 2016. In addition to this, we expect to continue to obtain a portion of our equipment under operating and capital leases. We believe we have ample flexibility with our trade cycle and purchase agreements to alter our current plans if economic or other conditions warrant. |
Over the long-term, we will continue to have significant capital requirements, which may require us to seek additional borrowing, lease financing, or equity capital. The availability of financing or equity capital will depend upon our financial condition and results of operations as well as prevailing market conditions. If such additional borrowing, lease financing, or equity capital is not available at the time we need it, then we may need to borrow more under the revolving credit facility (if not then fully drawn), extend the maturity of then-outstanding debt, rely on alternative financing arrangements, or engage in asset sales.
There can be no assurance that we will be able to incur additional debt under our existing financial arrangements to satisfy our ongoing capital requirements. However, we believe the combination of our expected cash flows, financing available through operating leases, which are not subject to debt incurrence baskets, the capital lease basket, available funds under the 2015 RSA, and availability under the New Revolver will be sufficient to fund our expected capital expenditures for at least the next twelve months.
• | Principal and Interest Payments — As of September 30, 2016, we had material debt and capital lease obligations of $1.2 billion, which are discussed under "Material Debt Agreements," below. A significant amount of our cash flows from operations are committed to minimum payments of principal and interest on our debt facilities and lease obligations. Additionally, when our financial position allows, we periodically make voluntary prepayments on our outstanding debt balances. |
• | Letters of Credit — Pursuant to the terms of the 2015 Agreement, our lenders may issue standby letters of credit on our behalf. When we have letters of credit outstanding, it reduces the availability under the $600.0 million New Revolver. Standby letters of credit are typically issued for the benefit of third-party insurance companies and state departments of insurance for the purpose of satisfying certain collateral requirements, primarily related to our automobile, workers' compensation, and general insurance liabilities. Our outstanding letters of credit have historically been in the range of approximately $100.0 million to $150.0 million. |
53
SWIFT TRANSPORTATION COMPANY
MANAGEMENT'S DISCUSSION AND ANALYSIS OF FINANCIAL CONDITION AND RESULTS OF OPERATIONS — CONTINUED
• | Share Repurchases — From time to time, and depending on free cash flow availability, debt levels, stock prices, general economic and market conditions, as well as Board approval, we may repurchase shares of our outstanding common stock. In September 2015, the Board authorized the Company to repurchase up to $100.0 million of its outstanding Class A common stock. We finished our repurchases under this authorization in January 2016. In February 2016, the Board authorized an additional $150.0 million in share repurchases, of which $65.0 million remained available as of September 30, 2016. See further details regarding our share repurchases under Note 12 in the Notes to Consolidated Financial Statements, included in Part I, Item 1: Financial Information. |
Working Capital
As of September 30, 2016 and December 31, 2015, we had a working capital surplus of $231.7 million and $306.7 million, respectively.
Material Debt Agreements
As of September 30, 2016, we had $1.2 billion in material debt obligations at the following carrying values:
• | $592.8 million: New Term Loan A, due July 2020, net of $1.4 million DLC |
• | $299.2 million: 2015 RSA outstanding borrowings, due January 2019, net of $0.8 million DLC |
• | $248.9 million: Capital lease obligations |
• | $50.0 million: New Revolver, due July 2020 |
• | $1.2 million: Other |
As of December 31, 2015, we had $1.4 billion in material debt obligations at the following carrying values:
• | $668.1 million: New Term Loan A, due July 2020, net of $1.7 million DLC |
• | $223.9 million: 2015 RSA outstanding borrowings, due January 2019, net of $1.1 million DLC |
• | $281.8 million: Capital lease obligations |
• | $200.0 million: New Revolver, due July 2020 |
• | $11.1 million: Other |
Key terms and other details regarding our material debt agreements and capital leases are discussed in Notes 5, 6, 7, and 8 in the Notes to Consolidated Financial Statements, included in Part I, Item 1: Financial Information, in this Quarterly Report on Form 10-Q, incorporated by reference herein.
Capital and Operating Leases
In addition to our net cash capital expenditures, we enter into lease agreements to acquire revenue equipment, including tractors and trailers. Our tractor and trailer lease acquisitions and terminations were as follows:
Nine Months Ended September 30, | |||||||
2016 | 2015 | ||||||
(In thousands) | |||||||
Gross value of revenue equipment acquired with: | |||||||
Capital leases | $ | 12,811 | $ | 142,937 | |||
Operating leases | 245,052 | 283,119 | |||||
Originating value of terminated revenue equipment leases: | |||||||
Capital leases | $ | 44,448 | $ | 10,735 | |||
Operating leases | 214,292 | 258,095 | |||||
54
SWIFT TRANSPORTATION COMPANY
MANAGEMENT'S DISCUSSION AND ANALYSIS OF FINANCIAL CONDITION AND RESULTS OF OPERATIONS — CONTINUED
Cash Flow Analysis
The following table summarizes our cash flow activities for the nine months ended September 30, 2016, as compared to the nine months ended September 30, 2015.
Nine Months Ended September 30, | Favorable (Unfavorable) Cash Flow Variance | ||||||||||
2016 | 2015 | ||||||||||
(In thousands) | |||||||||||
Net cash provided by operating activities | $ | 328,833 | $ | 357,222 | $ | (28,389 | ) | ||||
Net cash used in investing activities | (50,717 | ) | (204,218 | ) | 153,501 | ||||||
Net cash used in financing activities | (314,448 | ) | (204,430 | ) | (110,018 | ) | |||||
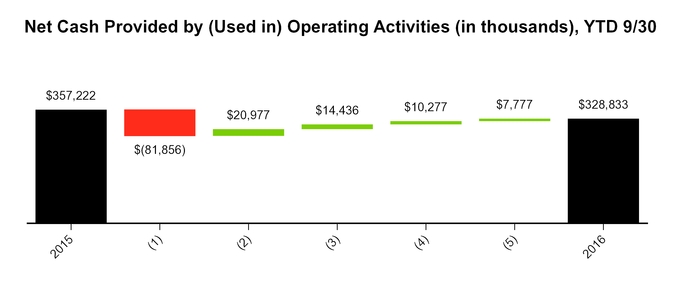
The $28.4 million decrease in net cash provided by operating activities for the nine months ended September 30, 2016, as compared to the nine months ended September 30, 2015, consisted of:
Unfavorable Cash Flow Variance: |
(1) | $81.9 million decrease in operating income, driven by the factors discussed in "Results of Operations — Segment Review" and "Results of Operations — Consolidated Operating and Other Expenses," above. |
Favorable Cash Flow Variances: |
(2) | $21.0 million increase in net cash provided by operating activities related to changes in accounts payable, accrued, and other liabilities, primarily due to increases in accrued liabilities, partially offset by timing differences in payments to our vendors. |
(3) | $14.4 million decrease in interest payments during the nine months ended September 30, 2016, compared to the same period in 2015. This was driven by overall lower debt balances during the nine months ended September 30, 2016, as well as more favorable interest rates and terms in the 2015 Agreement, which replaced the 2014 Agreement in July 2015. |
(4) | $10.3 million decrease in income tax payments during the nine months ended September 30, 2016, compared to the same period in 2015. This was primarily due to the decrease in income before income taxes over the comparable nine-month periods. |
(5) | $7.8 million net remaining favorable variance was related to various factors that had an immaterial impact on net cash provided by operating activities. |
55
SWIFT TRANSPORTATION COMPANY
MANAGEMENT'S DISCUSSION AND ANALYSIS OF FINANCIAL CONDITION AND RESULTS OF OPERATIONS — CONTINUED

The $153.5 million decrease in net cash used in investing activities for the nine months ended September 30, 2016, as compared to the nine months ended September 30, 2015, consisted of:
Favorable Cash Flow Variances: |
(1) | $119.6 million decrease in capital expenditures due to the timing of lease financing versus cash capital expenditures. Our primary focus in 2016 has been fleet utilization. As such, we did not add net capacity within our truck count during the nine months ended September 30, 2016; however, we did replace older revenue equipment with new equipment during this time. These replacements were primarily funded using operating leases, as compared to the nine months ended September 30, 2015, when our revenue equipment additions were funded using a mixture of operating leases, capital leases, and cash on hand. |
(2) | $19.7 million increase in proceeds from sale of property and equipment. The volume of trailer sales increased over the comparable nine-month periods, which was the primary contributor to the total increase in proceeds from sales of property and equipment. |
(3) | $8.6 million favorable change in restricted cash and cash equivalents. Changes in the balance are driven by the amount and timing of future claims payments by our captive insurance companies. The restricted cash and cash equivalents balance increased $4.2 million during the nine months ended September 30, 2016, as compared to the nine months ended September 30, 2015, when it increased $12.8 million. |
(4) | $5.6 million net remaining favorable variance was related to various factors that had an immaterial impact on net cash used in investing activities. |
Unfavorable Cash Flow Variances: |
There were no individually significant unfavorable variances in net cash used in investing activities between the nine months ended September 30, 2016 and September 30, 2015.
56
SWIFT TRANSPORTATION COMPANY
MANAGEMENT'S DISCUSSION AND ANALYSIS OF FINANCIAL CONDITION AND RESULTS OF OPERATIONS — CONTINUED
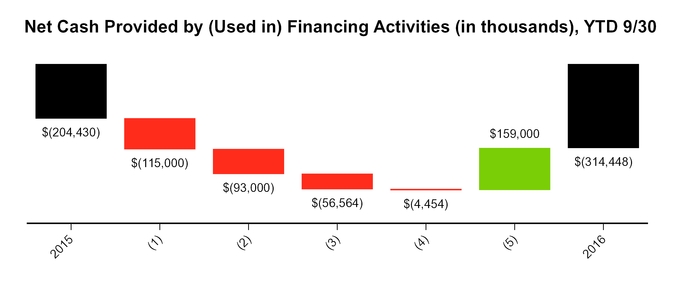
Cash Flow Impact of the 2015 Agreement: The 2015 Agreement includes a $600.0 million New Revolver and a $680.0 million New Term Loan A. Upon closing in July 2015, the proceeds from the New Term Loan A, a $200.0 million draw on the New Revolver and $4.9 million cash on hand were used to pay off the then-outstanding balances of the Old Term Loan A ($485.0 million) and Term Loan B ($395.0 million), including accrued interest and fees under the 2014 Agreement, as well as certain transactional fees associated with the 2015 Agreement.
The $110.0 million increase in net cash used in financing activities for the nine months ended September 30, 2016, as compared to the nine months ended September 30, 2015, consisted of:
Unfavorable Cash Flow Variances: |
(1) | $115.0 million cash used during the nine months ended September 30, 2016 to repurchase shares of our outstanding Class A common stock, pursuant to the Board-authorized share repurchase programs. See further details regarding our share repurchases under Note 12 in the Notes to Consolidated Financial Statements, included in Part I, Item 1: Financial Information and "Uses of Liquidity — Share Repurchases," above. |
(2) | $93.0 million increase in net repayments on the revolving line of credit. We repaid $150.0 million on the New Revolver during the nine months ended September 30, 2016. Excluding the impact of the 2015 Agreement, we repaid $57.0 million on the revolving line of credit during the nine months ended September 30, 2015. |
(3) | $56.6 million increase in repayments of long-term debt and capital leases. During the nine months ended September 30, 2016, we repaid $75.5 million on the New Term Loan A, reflecting $55.6 million in prepayments for the remainder of 2016 through 2017, as well as $19.9 million in scheduled minimum principal payments. Excluding the impact of the 2015 Agreement, we repaid $20.6 million in principal payments on our term loans during the nine months ended September 30, 2015. The remaining variance was attributed to other debt and capital leases. |
(4) | $4.4 million net remaining unfavorable variance was related to various factors that had an immaterial impact on net cash used in financing activities. |
Favorable Cash Flow Variance: |
(5) | $159.0 million favorable cash flow variance related to accounts receivable securitization. During the nine months ended September 30, 2016, we received proceeds from advances of $75.0 million under the 2015 RSA, net of repayments. During the nine months ended September 30, 2015, we repaid $84.0 million under the 2013 RSA, net of proceeds received from advances. |
57
SWIFT TRANSPORTATION COMPANY
MANAGEMENT'S DISCUSSION AND ANALYSIS OF FINANCIAL CONDITION AND RESULTS OF OPERATIONS — CONTINUED
Contractual Obligations |
Off Balance Sheet Arrangements |
Purchase Commitments — As of September 30, 2016, the Company's outstanding commitments to acquire revenue equipment were as follows:
• | remainder of 2016: $174.3 million ($103.2 million of which were tractor commitments), |
• | year-ended December 31, 2017: $190.9 million ($190.9 million of which were tractor commitments), and |
• | thereafter: none. |
The Company has the option to cancel tractor purchase orders with 60 to 90 days' notice prior to the scheduled production, although the notice period has lapsed for 35.1% of the tractor commitments outstanding as of September 30, 2016. These purchases are expected to be financed by the combination of operating leases, capital leases, debt, proceeds from sales of existing equipment, and cash flows from operations.
As of September 30, 2016, the Company had $0.3 million in outstanding purchase commitments for non-revenue equipment and no purchase commitments for facilities. Factors such as costs and opportunities for future terminal expansions may change the amount of such expenditures.
Seasonality |
Inflation |
Recently Issued Accounting Pronouncements |
• | Note 1 for recently issued accounting pronouncements the Company adopted in the nine months ended September 30, 2016. |
• | Note 2 for recently issued accounting pronouncements, not yet adopted by the Company as of September 30, 2016. |
58
ITEM 3. | QUANTITATIVE AND QUALITATIVE DISCLOSURES ABOUT MARKET RISK |
We have exposure from variable interest rates, primarily related to our 2015 Agreement and 2015 RSA. These variable interest rates are impacted by changes in short-term interest rates. We primarily manage interest rate exposure through a mix of variable-rate debt (weighted average variable rate of 1.7% for the nine months ended September 30, 2016 and 2015). Assuming the current level of borrowings, a hypothetical one-percentage point increase in interest rates would increase our annual interest expense by $9.4 million.
We have commodity exposure with respect to fuel used in company-owned tractors. Increases in fuel prices would continue to raise our operating costs, even after applying fuel surcharge revenue. Historically, we have been able to recover a majority of fuel price increases from our customers in the form of fuel surcharges. The weekly average diesel price per gallon in the United States, as reported by the DOE, decreased from an average of $2.797 per gallon for the nine months ended September 30, 2015 to an average of $2.250 per gallon for the nine months ended September 30, 2016. We cannot predict the extent or speed of potential changes in fuel price levels in the future, the degree to which the lag effect of our fuel surcharge programs will impact us as a result of the timing and magnitude of such changes, or the extent to which effective fuel surcharges can be maintained and collected to offset such increases. We generally have not used derivative financial instruments to hedge our fuel price exposure in the past, but continue to evaluate this possibility.
ITEM 4. | CONTROLS AND PROCEDURES |
Evaluation of Disclosure Controls and Procedures
Management, with the participation of our Chief Executive Officer and Chief Financial Officer, has evaluated the effectiveness of the design and operation of our disclosure controls and procedures and determined that as of September 30, 2016 our disclosure controls and procedures were effective at a reasonable assurance level to ensure that information required to be disclosed by us in reports that we file or submit under the Securities Exchange Act of 1934, as amended, is recorded, processed, summarized, and reported within the time periods specified in the SEC’s rules and forms and that such information is accumulated and communicated to our management, including our Chief Executive Officer and Chief Financial Officer, as appropriate, to allow timely decisions regarding required disclosure.
Change in Internal Control over Financial Reporting
There has been no change in our internal control over financial reporting during the quarter ended September 30, 2016 that has materially affected, or is reasonably likely to materially affect, our internal control over financial reporting.
59
PART II OTHER INFORMATION | ||||
ITEM 1. | LEGAL PROCEEDINGS |
Information about our legal proceedings is included in Note 10 of the notes to our consolidated financial statements, included in Part I, Item 1, in this Quarterly Report on Form 10-Q for the period ended September 30, 2016, and is incorporated by reference herein.
ITEM 1A. | RISK FACTORS |
In addition to the other information set forth in this report, the factors discussed in Part I, Item 1A, "Risk Factors" in our Annual Report on Form 10-K for the year ended December 31, 2015 should be carefully considered as these risk factors could materially affect our business, financial condition, future results and/or our ability to maintain compliance with our debt covenants. The risks described in our Form 10-K are not the only risks facing us. Additional risks and uncertainties not currently known to us or that we currently deem to be immaterial may also adversely affect our business, financial condition, operating results and/or our ability to maintain compliance with our debt covenants.
The risk factor set forth below updates the risk factor in our Form 10-K under the same heading.
Mr. Moyes has loans and other obligations against which he and certain of his family members have pledged a portion of their Class B common stock, which may cause a conflict of interests between Mr. Moyes and our other stockholders, and adversely affect the trading price of our Class A Common Stock.
Cactus II Pledging — In July 2011 and December 2011, Cactus Holding Company II, LLC ("Cactus II"), an entity controlled by Mr. Moyes, pledged 12,023,343 shares of Class B common stock on margin as collateral for loan arrangements entered into by Cactus II and relating to Mr. Moyes. In connection with these December 2011 transactions, Cactus II converted 6,553,253 of the 12,023,343 pledged shares of Class B common stock into shares of Class A common stock on a one-for-one basis. During 2012, the Moyes Affiliates converted an additional 1,068,224 shares of Class B common stock to Class A common stock and sold 4,831,878 of these pledged Class A shares to a counter-party pursuant to a sale and repurchase agreement with a full recourse obligation to repurchase the securities at the same price on the fourth anniversary of sale. This sale and repurchase agreement was replaced in May 2014 with a similar sale and repurchase agreement covering 6,761,400 shares. On May 18, 2016 the maturity of this agreement was extended to May 30, 2017. On May 18, 2016, 1,951,006 shares of Class A common stock and 5,054,978 shares of Class B common stock previously pledged on margin for collateral for loan arrangements were transferred to a new VPF agreement as described below. On July 20, 2016, Cactus Holding II pledged an incremental 1,863,140 shares as collateral for a new loan arrangement. As of August 2, 2016, the Moyes Affiliates had pledged on margin a total of 4,130,112 shares, of which 2,243,252 were Class B and 1,886,860 were Class A common stock. These pledged shares could cause Mr. Moyes’ interest to conflict with the interests of our other stockholders and could result in the future sale of such shares. Such sales could adversely affect the trading price or otherwise disrupt the market for our Class A common stock.
M Capital II VPF — In addition to the shares that were allowed to be pledged on margin pursuant to our second amended and restated securities trading policy, on October 29, 2013, an affiliate of Mr. Moyes ("M Capital II") entered into a VPF contract with Citibank, N.A. that was intended to facilitate settlement of the 2010 METS, issued in 2010 by an unaffiliated trust concurrently with the Company’s IPO, which was required to be settled with shares of the Company’s Class A common stock, or cash, on December 31, 2013. This transaction effectively replaced the 2010 METS with the VPF contract and allowed the parties to the 2010 METS transaction to satisfy their obligations under the 2010 METS (as contemplated by their terms) without reducing the number of shares owned by these parties. The VPF transaction allowed Mr. Moyes and certain of his affiliates, through their ownership of M Capital II, to participate in future price appreciation of the Company’s Common Stock within certain levels, and retain the voting power of the shares collateralized to secure the VPF contract. Under the VPF contract, M Capital II was obligated to deliver to Citibank a variable amount of stock or cash during two twenty trading day periods beginning on January 4, 2016, and July 5, 2016, respectively.
Amended M Capital II VPF and Cactus VPFs — On October 30, 2015, M Capital II and another Moyes Affiliate, Cactus Holding I, entered into the Amended M Capital II VPF and the Cactus VPF, respectively. The purposes of these two VPF contracts were to (i) extend the maturity date of M Capital II’s then-existing VPF with Citibank N.A. (discussed above) and (ii) generate cash proceeds for the repayment of certain stock-secured obligations of Cactus Holding II, a Moyes Affiliate, and thereby effect the release of certain shares of Class B Common Stock pledged in connection with the same.
60
Cactus Holding I entered into the Cactus VPF contract in respect of 3,300,000 shares of the Company's Class B Common Stock, which were pledged by Cactus Holding I as security for its obligations under the Cactus VPF contract. Under the Cactus VPF contract, Cactus Holding I is required to deliver to Citigroup Global Markets Inc. ("CGMI") a variable amount of stock or cash during a three trading day period at the maturity of the contract on November 21, 2016 through November 24, 2016 (later extended to November 25, 2016). In connection with the Cactus VPF contract, Cactus Holding I received $48.3 million from CGMI (including the $18.5 million noted in the paragraph below).
In connection with the Amended M Capital II VPF, M Capital II paid Citibank N.A $18.5 million. The source of these funds was a cash payment from CGMI in connection with the Cactus VPF Contract. Under the Amended M Capital II VPF contract, M Capital II is required to deliver to Citibank N.A. a variable amount of stock or cash during a three trading day period at the maturity of the contract on November 21, 2016 through November 24, 2016 (later extended to November 25, 2016). The number of shares of the Company's Class B Common Stock subject to the Amended M Capital VPF remains unchanged at 13,700,000.
On May 18, 2016, M Capital II terminated its VPF covering 12,294,016 shares of Class A Common Stock, and entered into a new VPF covering the same number of shares of Class A Common Stock. The new VPF requires M Capital II to deliver a variable amount of Class A Common Stock, up to a maximum of 12,294,016 shares, or an equivalent amount of cash, upon maturity dates occurring on May 26, 2017 through May 31, 2017. The new VPF is collateralized by 12,294,016 shares of Class B Common Stock.
On the same date, Cactus Holding I entered into a new VPF covering 7,005,984 shares of Class A Common Stock. The new VPF requires Cactus Holding I to deliver a variable amount of Class A Common Stock, up to a maximum of 7,005,984 shares, or an equivalent amount of cash, upon maturity dates occurring on May 26, 2017 through May 31, 2017. The new VPF is collateralized by an aggregate of 7,005,984 shares of Class A Common Stock and Class B Common Stock which were previously pledged on margin.
The VPF contracts allow Mr. Moyes and the Moyes Affiliates to retain the same number of shares and voting percentage as they had prior to these VPF contracts. In addition, Mr. Moyes and the Moyes Affiliates are able to participate in any price appreciation of the Company’s common stock within certain levels.
In connection with the VPF transactions described above, an aggregate of 34,348,994 shares of Class B Common Stock and 1,951,006 shares of Class A Common Stock are collateralized to secure M Capital II’s and Cactus Holding I's respective obligations under the VPF transactions. As these shares are not pledged to secure a loan on margin, they are not subject to the securities trading policy limitation discussed below. Although M Capital II and Cactus Holding I, respectively, may settle their obligations under the VPF transactions in cash, any or all of the collateralized Class B Common Stock shares could be converted into Class A common stock and any of the collateralized shares delivered on such dates to settle such obligations. Such transfers of our common stock, or the perception that they may occur, may have an adverse effect on the trading price of our Class A common stock and may create conflicts of interest for Mr. Moyes.
Other Obligations — On April 20, 2016, Mr. Moyes entered into a settlement agreement with the National Hockey League ("NHL") relating to a previously disclosed lawsuit between the NHL and Mr. Moyes. As part of the settlement agreement, certain of Mr. Moyes’ adult children entered into a Non-Recourse Guaranty and Pledge Agreement with the NHL pursuant to which they guaranteed certain obligations of Mr. Moyes and certain Moyes Affiliates to the NHL. The guarantor’s obligations are collateralized by 2,000,000 shares of Class B common stock owned by the guarantors.
Margin Pledging Limitations — The Company has a securities trading policy ("STP") that includes, among other things, limitations on the pledging of Company stock on margin. As disclosed at the time of our IPO, under the STP, directors, senior executive officers (including the Chief Executive Officer) and compliance officers were not permitted to pledge more than 20% of their family stock holdings for margin loans. In July 2013, the Nominating and Governance Committee and the Board approved revisions to the STP to further limit pledging of stock on margin, under which, effective July 1, 2014, the limitation was reduced to 15% of family stock holdings and was scheduled to be reduced to 10% of family stock holdings as of July 1, 2015.
In June 2015, Mr. Moyes reported to the independent chairman of the Board that he was in compliance with the limitation on pledging stock on margin and was working to reduce the amount pledged on margin to below the 10% limit scheduled to take effect, but needed until November 2015 to do so in an orderly fashion. Following Board discussion of these circumstances, the Board amended the STP so that the 15% limit would remain in effect through November 30, 2015 and the 10% limit would take effect on December 1, 2015.
In October 2015, Mr. Moyes informed the Company that due to the drop in the stock price he had pledged additional shares of Company stock on margin in August and September 2015, in contravention of the STP, and that the percentage of family stock holdings pledged on margin was in excess of the 15% limit. He was precluded from selling shares during this time because he was in possession of material non-public information.
The independent members of the Board met and considered these events in light of competing concerns. On the one hand, the policy and limitations on pledging stock on margin were intended to avoid the risks of stock being sold to satisfy a margin call at a time when Company insiders might have material nonpublic information. On the other hand, unwinding margin positions in significant amounts in a short period could generate adverse market perceptions concerning the Company and the stock. In addition, the Board sought additional information regarding Mr. Moyes' plans to reduce the level of stock pledged on margin.
61
In response to these developments and the competing concerns identified, the Board directed Mr. Moyes to reduce the level of stock pledged on margin to 15% or less of family holdings no later than November 4, 2015 and determined to waive compliance with the 10% limit (but not the 15% limit) through December 31, 2016 so that the margin positions could be reduced in an orderly fashion. In addition, the Board formally reprimanded Mr. Moyes and imposed sanctions.
The Company's stock price volatility continued in December 2015 and necessitated Mr. Moyes to increase the level of Company stock pledged on margin; thereby exceeding the 15% limit. Taking into account various competing concerns, on December 18, 2015, the Board determined to waive compliance with the 15% limit (but not the 20% limit) through December 31, 2016 to allow Mr. Moyes to reduce the margin position in an orderly manner.
After giving effect to the amendments and waivers discussed above, the current STP provides that directors, senior executive officers (including the Chief Executive Officer) and compliance officers are not permitted to pledge more than 20% of their family stock holdings for margin loans through December 31, 2016, reducing to 15% of family stock holdings through December 31, 2017 and 10% of family stock holdings after January 1, 2018.
ITEM 2. | UNREGISTERED SALES OF EQUITY SECURITIES AND USE OF PROCEEDS |
The following table shows our purchases of our common stock and the remaining amounts we are authorized to repurchase for each period in the three months ended September 30, 2016:
Period | Total Number of Shares Purchased | Average Price Paid per Share | Total Number of Shares Purchased as Part of Publicly Announced Plans or Programs | Approximate Dollar Value That May Yet be Purchased Under the Plans or Programs (1) | |||||||||
July 1, 2016 to July 31, 2016 | — | $ | — | — | $ | 90,000,000 | |||||||
August 1, 2016 to August 31, 2016 | 1,341,088 | $ | 18.64 | 1,341,088 | $ | 65,000,000 | |||||||
September 1, 2016 to September 30, 2016 | — | $ | — | — | $ | 65,000,000 | |||||||
Total | 1,341,088 | $ | 18.64 | 1,341,088 | $ | 65,000,000 | |||||||
____________
(1) | In February 2016, the Board authorized the Company to repurchase up to $150.0 million of its outstanding Class A common stock. There is no expiration date associated with this share repurchase authorization. |
ITEM 3. | DEFAULTS UPON SENIOR SECURITIES |
Not applicable.
ITEM 4. | MINE SAFETY DISCLOSURES |
Not applicable.
ITEM 5. | OTHER INFORMATION |
None.
62
ITEM 6. | EXHIBITS |
Exhibit Number | Description | Page or Method of Filing | ||
3.1 | Amended and Restated Certificate of Incorporation of Swift Transportation Company | Incorporated by reference to Exhibit 3.1 of Form 10-K for the year ended December 31, 2010 | ||
3.2 | By-laws of Swift Transportation Company | Incorporated by reference to Exhibit 3.2 of Form 10-K for the year ended December 31, 2010 | ||
3.3 | Amendment to Bylaws of Swift Transportation Company | Incorporated by reference to Exhibit 3.1 of Form 8-K filed on September 8, 2016 | ||
10.1 | Agreement re: Jerry Moyes Retirement | Incorporated by reference to Exhibit 10.1 of Form 8-K filed on September 8, 2016 | ||
31.1 | Certification by CEO pursuant to Rule 13a-14(a) or 15d-14(a) of the Securities Exchange Act of 1934, as adopted pursuant to Section 302 of the Sarbanes-Oxley Act of 2002 | Filed herewith | ||
31.2 | Certification by CFO pursuant to Rule 13a-14(a) or 15d-14(a) of the Securities Exchange Act of 1934, as adopted pursuant to Section 302 of the Sarbanes-Oxley Act of 2002 | Filed herewith | ||
32.1 | Certification by CEO and CFO pursuant to 18 U.S.C. Section 1350, as adopted pursuant to Section 906 of the Sarbanes-Oxley Act of 2002 | Furnished herewith | ||
101.INS | XBRL Instance Document | Filed herewith | ||
101.SCH | XBRL Taxonomy Extension Schema Document | Filed herewith | ||
101.CAL | XBRL Taxonomy Calculation Linkbase Document | Filed herewith | ||
101.LAB | XBRL Taxonomy Label Linkbase Document | Filed herewith | ||
101.PRE | XBRL Taxonomy Presentation Linkbase Document | Filed herewith | ||
101.DEF | XBRL Taxonomy Extension Definition Document | Filed herewith | ||
63
SIGNATURES
Pursuant to the requirements of the Securities Exchange Act of 1934, the registrant has duly caused this report to be signed on its behalf by the undersigned hereunto duly authorized.
SWIFT TRANSPORTATION COMPANY | |||||
Date: | November 1, 2016 | /s/ Richard Stocking | |||
Richard Stocking | |||||
Chief Executive Officer | |||||
(Principal Executive Officer) | |||||
Date: | November 1, 2016 | /s/ Virginia Henkels | |||
Virginia Henkels | |||||
Executive Vice President and Chief Financial Officer | |||||
(Principal Financial Officer) | |||||
64