Attached files
UNITED STATES
SECURITIES AND EXCHANGE COMMISSION
Washington, D.C. 20549
___________________________________________________________________________________________________________________FORM 10-K
___________________________________________________________________________________________________________________
(mark one)
ý ANNUAL REPORT PURSUANT TO SECTION 13 OR 15(d) OF THE SECURITIES EXCHANGE ACT OF 1934
For the fiscal year ended December 31, 2017
or
¨ TRANSITION REPORT PURSUANT TO SECTION 13 OR 15(d) OF THE SECURITIES EXCHANGE ACT OF 1934
For the transition period from to
Commission file number 001-35007
___________________________________________________________________________________________________________________
Knight-Swift Transportation Holdings Inc.
(Exact name of registrant as specified in its charter)
___________________________________________________________________________________________________________________
Delaware | 20-5589597 | |
(State or other jurisdiction of incorporation or organization) | (I.R.S. Employer Identification No.) | |
20002 North 19th Avenue
Phoenix, Arizona 85027
(Address of principal executive offices and Zip Code)
(602) 269-2000
(Registrant's telephone number, including area code)
Securities registered pursuant to Section 12(b) of the Act:
Title of each class | Name of each exchange on which registered |
Class A Common Stock, par value $0.01 per share | New York Stock Exchange |
Securities registered pursuant to section 12(g) of the Act: None
___________________________________________________________________________________________________________________
Indicate by check mark if the registrant is a well-known seasoned issuer, as defined in Rule 405 of the Securities Act. Yes ý No ¨
Indicate by check mark if the registrant is not required to file reports pursuant to Section 13 or Section 15(d) of the Act. Yes ¨ No ý
Indicate by check mark whether the registrant (1) has filed all reports required to be filed by Section 13 or 15(d) of the Securities Exchange Act of 1934 during the preceding 12 months (or for such shorter period that the registrant was required to file such reports), and (2) has been subject to such filing requirements for the past 90 days. Yes ý No ¨
Indicate by check mark whether the registrant has submitted electronically and posted on its corporate Web site, if any, every Interactive Data File required to be submitted and posted pursuant to Rule 405 of Regulation S-T (§ 232.405 of this chapter) during the preceding 12 months (or for such shorter period that the registrant was required to submit and post such files). Yes ý No ¨
Indicate by check mark if disclosure of delinquent filers pursuant to Item 405 of Regulation S-K (§ 229.405 of this chapter) is not contained herein, and will not be contained, to the best of registrant's knowledge, in definitive proxy or information statements incorporated by reference in Part III of this Form 10-K or any amendment to this Form 10-K. o
Indicate by check mark whether the registrant is a large accelerated filer, an accelerated filer, a non-accelerated filer, or a smaller reporting company. See the definitions of "large accelerated filer," "accelerated filer" and "smaller reporting company" in Rule 12b-2 of the Exchange Act.
Large accelerated filer | ý | Accelerated filer | ¨ | |||
Non-accelerated filer | ¨ (Do not check if a smaller reporting company) | Smaller reporting company | ¨ | |||
Emerging growth company | ¨ | |||||
If an emerging growth company, indicate by check mark if the registrant has elected not to use the extended transition period for complying with any new or revised financial accounting standards provided pursuant to Section 13(a) of the Exchange Act. o
Indicate by check mark whether the registrant is a shell company (as defined in Rule 12b-2 of the Exchange Act). Yes ¨ No ý
As of June 30, 2017, the aggregate market value of our Class A common stock held by non-affiliates was $2,126,210,355, based on the closing price of our common stock as quoted on the NYSE as of such date.
There were 178,189,491 shares of the registrant's Class A common stock and 0 shares of the registrant's Class B common stock outstanding as of February 19, 2018.
DOCUMENTS INCORPORATED BY REFERENCE
Portions of the registrant's definitive proxy statement for its 2018 Annual Meeting of Stockholders to be filed with the Securities and Exchange Commission (the "SEC") are incorporated by reference into Part III of this report.
KNIGHT-SWIFT TRANSPORTATION HOLDINGS INC.
2017 ANNUAL REPORT ON FORM 10-K |
TABLE OF CONTENTS | |
PAGE | |
1
2017 ANNUAL REPORT ON FORM 10-K | ||
GLOSSARY OF TERMS | ||
The following glossary provides definitions for certain acronyms and terms used in this Annual Report on Form 10-K. These acronyms and terms are specific to our company, commonly used in our industry, or are otherwise frequently used throughout our document. | ||
Term | Definition | |
Knight-Swift/the Company/Management/We/Us/Our | Unless otherwise indicated or the context otherwise requires, these terms represent Knight-Swift Transportation Holdings Inc. and its subsidiaries. | |
Annual Report | Annual Report on Form 10-K | |
2017 Merger | See complete description of the 2017 Merger included in Note 1 of the footnotes to the consolidated financial statements, included in Part II, Item 8 of this Annual Report on Form 10-K. | |
2012 ESPP | Employee Stock Purchase Plan, effective beginning in 2012, amended and restated in 2017 | |
2013 Debt Agreement | Knight's unsecured credit facility | |
2015 RSA | Amended and Restated Receivables Sales Agreement, entered into in 2015 by Swift Receivables Company II, LLC with unrelated financial entities. | |
2014 Stock Plan | The Company's amended and restated 2014 Omnibus Incentive Plan | |
2015 Debt Agreement | Swift's Fourth Amended and Restated Credit Agreement, entered into on July 25, 2015 | |
2017 Debt Agreement | The Company's Credit Agreement, entered into on September 29, 2017 | |
ASC | Accounting Standards Codification Topic | |
ASU | Accounting Standards Update | |
Board | Knight-Swift's Board of Directors | |
C-TPAT | Customs-Trade Partnership Against Terrorism | |
CSA | Compliance Safety Accountability | |
DOT | United States Department of Transportation | |
ELD | Electronic Logging Device | |
EPA | United States Environmental Protection Agency | |
EPS | Earnings Per Share | |
ERP | Enterprise Resource Planning system | |
FASB | Financial Accounting Standards Board | |
FLSA | Fair Labor Standards Act | |
FMCSA | Federal Motor Carrier Safety Administration | |
GAAP | United States Generally Accepted Accounting Principles | |
LIBOR | London InterBank Offered Rate | |
Knight | Unless otherwise indicated or the context otherwise requires, this term represents Knight Transportation, Inc. and its subsidiaries | |
Knight Revolver | Revolving line of credit under the 2013 Debt Agreement | |
Mohave | Mohave Transportation Insurance Company, a Swift wholly-owned captive insurance subsidiary | |
NASDAQ | National Association of Securities Dealers Automated Quotations | |
NLRB | National Labor Relations Board | |
NYSE | New York Stock Exchange | |
Red Rock | Red Rock Risk Retention Group, Inc., a Swift wholly-owned captive insurance subsidiary | |
Revolver | Revolving line of credit under the 2017 Debt Agreement | |
SEC | Securities and Exchange Commission | |
Swift | Unless otherwise indicated or the context otherwise requires, this term represents Swift Transportation Company and its subsidiaries | |
Swift Revolver | Swift's revolving line of credit under the 2015 Debt Agreement | |
Term Loan A | Swift's first lien term loan A under the 2015 Debt Agreement | |
Term Loan | The Company's term loan under the 2017 Debt Agreement | |
US | The United States of America | |
2
PART I | ||||
CAUTIONARY NOTE REGARDING FORWARD-LOOKING STATEMENTS |
This Annual Report contains certain statements that may be considered "forward-looking statements" within the meaning of Section 21E of the Securities Exchange Act of 1934, as amended (the "Exchange Act") and Section 27A of the Securities Act of 1933, as amended. All statements, other than statements of historical or current fact, are statements that could be deemed forward-looking statements, including without limitation:
• | any projections of earnings, revenues, cash flows, dividends, capital expenditures, or other financial items, |
• | any statement of plans, strategies, and objectives of management for future operations, |
• | any statements concerning proposed acquisition plans, new services or developments, |
• | any statements regarding future economic conditions or performance, and |
• | any statements of belief and any statements of assumptions underlying any of the foregoing. |
In this Annual Report, forward-looking statements include statements we make concerning:
• | the ability of our infrastructure to support future growth, whether we grow organically or through potential acquisitions, |
• | the future impact of the 2017 Merger, including achievement of anticipated synergies, |
• | the flexibility of our model to adapt to market conditions, |
• | our ability to recruit and retain qualified driving associates, |
• | our ability to gain market share, |
• | our ability and desire to expand our brokerage and intermodal operations, |
• | future equipment prices, our equipment purchasing plans, and our equipment turnover (including expected tractor trade-ins), |
• | our ability to sublease equipment to independent contractors, |
• | the impact of pending legal proceedings, |
• | the expected freight environment, including freight demand and volumes, |
• | economic conditions, including future inflation and consumer spending, |
• | our ability to obtain favorable pricing terms from vendors and suppliers, |
• | expected liquidity and methods for achieving sufficient liquidity, |
• | future fuel prices, |
• | future expenses and our ability to control costs, |
• | future third-party service provider relationships and availability, |
• | future contracted pay rates with independent contractors and compensation arrangements with driving associates, |
• | our expected need or desire to incur indebtedness, |
• | expected sources of liquidity for capital expenditures and allocation of capital, |
• | expected capital expenditures, |
• | future mix of owned versus leased revenue equipment, |
• | future asset utilization, |
• | future capital requirements, |
• | future return on capital, |
• | future tax rates, |
• | our intention to pay dividends in the future, |
• | future trucking industry capacity, |
• | future rates, |
• | future depreciation and amortization, |
• | expected tractor and trailer fleet age, |
• | political conditions and regulations, including future changes thereto, |
• | future purchased transportation expense, and |
• | others. |
Such statements may be identified by their use of terms or phrases such as "believe," "may," "could," "expects," "estimates," "projects," "anticipates," "plans," "intends," "hopes," "strategy," "objective," and similar terms and phrases. Forward-looking statements are based on currently available operating, financial, and competitive information. Forward-looking statements are inherently subject to risks and uncertainties, some of which cannot be predicted or quantified, which could cause future events and actual results to materially differ from those set forth in, contemplated by, or underlying the forward-looking statements. Factors that could cause or contribute to such differences include, but are not limited to, those discussed in Item 1A. "Risk Factors" of this Annual Report, and various disclosures in our press releases, stockholder reports, and other filings with the SEC.
All such forward-looking statements speak only as of the date of this Annual Report. You are cautioned not to place undue reliance on such forward-looking statements. We expressly disclaim any obligation or undertaking to publicly release any updates or revisions to any forward-looking statements contained herein, to reflect any change in our expectations with regard thereto, or any change in the events, conditions, or circumstances on which any such statement is based.
3
ITEM 1. | BUSINESS |
Certain acronyms and terms used throughout this Annual Report are specific to our company, commonly used in our industry, or are otherwise frequently used throughout our document. Definitions for these acronyms and terms are provided in the "Glossary of Terms," available in the front of this document.
Company Overview |
Knight-Swift Transportation Holdings Inc. is North America's largest truckload carrier and a provider of transportation solutions, from its Phoenix, Arizona headquarters. The Company provides multiple truckload transportation and logistics services using a nationwide network of business units and terminals in the United States and Mexico to serve customers throughout North America. In addition to its truckload services, Knight-Swift also contracts with third-party capacity providers to provide a broad range of truckload services to its customers while creating quality driving jobs for our driving associates and successful business opportunities for independent contractors.
During 2017, we covered 0.9 billion loaded miles for shippers throughout North America, contributing to consolidated total revenue of $2.4 billion and consolidated operating income of $200.6 million. As of December 31, 2017, our fleet was comprised of 18,381 company tractors, 4,688 independent contractor tractors, 74,949 trailers, and 9,122 intermodal containers. The Company's six reportable segments are Knight Trucking, Knight Logistics, Swift Truckload, Swift Dedicated, Swift Refrigerated, and Swift Intermodal.
We have historically grown through a combination of organic growth, as well as through mergers and acquisitions (discussed below). Mergers and acquisitions have enhanced Knight's and Swift's businesses and service offerings with additional terminals, driving associates, revenue equipment, and capacity. Our multiple service offerings, capabilities, and transportation modes enable us to transport, or arrange transportation for, general commodities for our diversified customer base throughout the contiguous United States and Mexico using our equipment, information technology, and qualified driving associates and non-driver employees. We are committed to providing our customers with a wide range of truckload and logistics services and continuing to invest considerable resources toward developing a range of solutions for our customers across multiple service offerings and transportation modes. Our overall objective is to provide truckload and logistics services that, when combined, lead the industry for margin and growth, while providing efficient and cost-effective solutions for our customers.
Business Combinations and Investments |
2017 Merger
On September 8, 2017, we became Knight-Swift Transportation Holdings Inc. upon the effectiveness of the 2017 Merger. We accounted for the 2017 Merger using the acquisition method of accounting in accordance with GAAP. GAAP requires that either Knight or Swift is designated as the acquirer for accounting and financial reporting purposes ("Accounting Acquirer"). Based on the evidence available, Knight was designated as the Accounting Acquirer while Swift was the acquirer for legal purposes. Therefore, Knight’s historical results of operations replaced Swift’s historical results of operations for all periods prior to the 2017 Merger.
In conjunction with the 2017 Merger announcement, we provided an estimate of $150.0 million in synergies that we expect will be realized from the remainder of 2017 through 2019 with the combined efforts of Knight and Swift. See Note 4 in Part II, Item 8 of this Annual Report for more details regarding the 2017 Merger.
Historical Acquisitions
Knight — Since 1999, Knight has acquired all of the outstanding stock of five short-to-medium haul truckload carriers, or has acquired substantially all of the trucking assets of such carriers, including Granger, Iowa-based Barr-Nunn, acquired in 2014.
Swift — Since 1966, Swift has completed thirteen acquisitions, including the 2013 acquisition of Central Refrigerated Transportation, LLC (formerly Central Refrigerated Transportation, Inc.)
Joint Ventures
See Note 1 in Part II, Item 8 in this Annual Report, regarding Knight's joint ventures.
Partnerships
See Note 7 in Part II, Item 8 in this Annual Report, regarding Knight's partnership agreements with Transportation Resource Partners.
4
Industry and Competition |
Truckload carriers represent the largest part of the transportation supply chain for most retail and manufactured goods in North America and typically transport a full trailer (or container) of freight for a single customer from origin to destination without intermediate sorting and handling. Generally, the truckload industry is compensated based on miles, whereas the less-than-truckload industry is compensated based on package size and/or weight. Overall, the United States trucking industry is large, fragmented, and highly competitive. We compete with thousands of truckload carriers, most of whom operate significantly smaller fleets than we do. Our trucking segments compete with other motor carriers for the services of driving associates, independent contractors, and management employees. To a lesser extent, our intermodal services, as well as our freight brokerage and logistics businesses, compete with railroads, less-than-truckload carriers, logistics providers, and other transportation companies. Our logistics businesses compete with other logistics companies for the services of third-party capacity providers and management employees.
Our industry has encountered the following major economic cycles since 2000:
Period | Economic Cycle |
2000 — 2001 | industry over-capacity and depressed freight volumes |
2002 — 2006 | economic expansion |
2007 — 2009 | freight slowdown, fuel price spike, economic recession, and credit crisis |
2010 — 2013 | moderate recovery. The industry freight data began to show positive trends for both volume and pricing. The slow, steady growth is a result of moderate increases in gross domestic product, coupled with a tighter supply of available tractors. Trends in supply of available tractors were lower due to several years of below average truck builds, an increase in truckload fleet bankruptcies in 2009 and 2010, increasing equipment prices due to stringent EPA requirements, less available credit, and less driver availability. |
2014 — 2016 | return to pre-recession levels and relative stabilization. In 2014, total spending on transportation, which fell during the 2007 – 2009 recession, returned to pre-recession levels. Truck tonnage grew throughout 2014, followed by decelerating growth in 2015, and relative stabilization in 2016. Capacity became looser in 2015 and 2016, as inventory levels were high and large volumes of tractor purchases created a supply/demand imbalance, putting pressure on pricing. Fuel prices declined. |
2017 | Demand increased for transportation services, including non-contract market demand, partially due to a strong retail season. Capacity became tighter in the second half of 2017, due to increasing government regulation, the driver shortage, severe storms interrupting business, among other factors. In addition, US fuel prices increased. |
The principal means of competition in our industry are customer service, capacity, and price. In times of strong freight demand, customer service, and capacity become increasingly important, and in times of weak freight demand, pricing becomes increasingly important. Most truckload contracts (other than dedicated contracts) do not guarantee truck availability or load levels. Pricing is influenced by supply and demand.
The trucking industry faces the following primary challenges, which we believe we are well-positioned to address, as discussed under "Our Competitive Strengths" and "Company Strategy," below:
• | tightening industry capacity; |
• | cumulative impacts of regulatory initiatives, such as ELDs, hours-of service limitations for drivers, and others; |
• | uncertainty in the economic environment, including changing supply chain and consumer spending patterns; |
• | driver shortages; |
• | significant and rapid fluctuations in fuel prices; and |
• | increased prices for new revenue equipment, design changes of new engines, and volatility in the used equipment sales market. |
5
Our Competitive Strengths |
We believe that our principal competitive strengths are our regional presence, customer service (including our ability to provide multiple transportation solutions, and configuration of equipment that satisfies customers' needs), operating efficiency, cost control, and technological enhancements in our revenue equipment and supporting back-office functions.
Regional Presence |
We believe that regional operations, which have recently expanded with the merger between Knight and Swift, offer several advantages, including: • obtaining greater freight volumes, • achieving higher revenue per mile by focusing on high-density freight lanes to minimize non-revenue miles, • enhancing our ability to recruit and train qualified driving associates, • enhancing safety and driver development and retention, • enhancing our ability to provide a high level of service and consistent capacity to our customers, • enhancing accountability for performance and growth, • furthering our trucking capabilities to provide various shipping solutions to our customers, and • furthering our logistics capabilities to contract with more third-party capacity providers. |
Operating Efficiency and Cost Control |
We expect to generate cost and revenue synergies as a result of the 2017 Merger through, among other things, increased operational efficiencies through the adoption of best practices and capabilities from each of Knight and Swift. We operate modern tractors and trailers in order to obtain operating efficiencies and attract and retain driving associates. We believe a generally compatible fleet of tractors and trailers simplifies our maintenance procedures and reduces parts, supplies, and maintenance costs. We regulate vehicle speed, which we believe will maximize fuel efficiency, reduce wear and tear, and enhance safety. We continue to update our fleet with more fuel-efficient post-2014 United States EPA emission compliant engines, install aerodynamic devices on our tractors, and equip our trailers with trailer blades, which have led to meaningful improvements in fuel efficiency. Our logistics and intermodal businesses focus on effectively optimizing and meeting the transportation and logistics requirements of our customers and providing customers with various sources and modes of transportation capacity across our nationwide service network. We invest in technology that enhances our ability to optimize our freight opportunities while maintaining a low cost per transaction. |
Customer Service |
We strive to provide superior, on-time service at a meaningful value to our customers and seek to establish ourselves as a preferred truckload and logistics provider for our customers. We provide truckload capacity for customers in high-density lanes, where we can provide them with a high level of service, as well as flexible and customized logistics services on a nationwide basis. Our trucking services include dry van, refrigerated, and drayage, which also include dedicated and cross-border truckload services, customized according to customer needs. Our logistics and intermodal services include brokerage, intermodal, and certain logistics, freight management, and non-trucking services, which provide various shipping alternatives and transportation modes for customers by utilizing our expansive network of third-party capacity providers and rail partners. We price our trucking, logistics, and intermodal services commensurately with the level of service our customers require and market conditions. By providing customers a high level of service, we believe we avoid competing solely based on price. |
Using Technology that Enhances Our Business |
We purchase and deploy technology that we believe will allow us to operate more safely, securely, and efficiently. Substantially all of our company-owned tractors are equipped with in-cab communication devices that enable us to communicate with our driving associates, obtain load position updates, manage our fleets, and provide our customers with freight visibility, as well as with ELDs that automatically record our driving associates' hours-of-service. The majority of our trailers are equipped with trailer-tracking technology that allows us to better manage our trailers. We have purchased and developed software for our logistics businesses that provides greater visibility of the capacity of our third-party providers and enhances our ability to provide our customers with solutions that offer a superior level of service. We have automated many of our back-office functions, and we continue to invest in technology that we expect will allow us to better serve our customers and improve overall efficiency. |
6
Our Mission and Company Strategy |
Segment Operating Strategies | |
Trucking Segments | Our operating strategy for our trucking segments, which includes Knight Trucking, Swift Truckload, Swift Dedicated, and Swift Refrigerated, is to achieve a high level of asset utilization within a highly disciplined operating system, while maintaining strict controls over our cost structure. We hope to achieve these goals by primarily operating in high-density, predictable freight lanes and attempting to develop and expand our customer base around each of our terminals by providing multiple truckload services for each customer. We believe this operating strategy allows us to take advantage of the large amount of freight transported in the markets we serve. Our terminals enable us to better serve our customers and work more closely with our driving associates. We operate a premium modern fleet that we believe appeals to driving associates and customers, reduces maintenance expenses and driving associate and equipment downtime, and enhances our fuel and other operating efficiencies. We employ technology in a cost-effective manner to assist us in controlling operating costs and enhancing revenue. |
Logistics businesses | Our logistics operating strategy is to match the shipping needs of our customers with the capacity provided by our network of third-party carriers and our rail providers. Our goal is to increase our market presence, both in existing operating regions and in other areas where we believe the freight environment meets our operating strategy, while seeking to achieve industry-leading operating margins and returns on investment. |
Swift Intermodal | Our Swift Intermodal operating strategy is to complement our regional operating model, allowing us to better serve customers in longer haul lanes, and reduce our investment in fixed assets. We have intermodal agreements with most major North American rail carriers, which have helped increase our volumes through more competitive pricing. |
Growth Strategies | |
We believe we have the terminal network, systems capability, and management capacity to support substantial growth. We have established a geographically diverse network that we believe can support a substantial increase in freight volumes, organic or acquired. Our network and business lines afford us the ability to provide multiple transportation solutions for our customers, and we maintain the flexibility within our network to adapt to freight market conditions. We believe our unique mix of regional management, together with our consistent efforts to centralize certain business functions to achieve collective economies of scale, allow us to develop future company leaders with relevant operating and industry experience, minimize the potential diseconomies of scale that can come with growth in size, take advantage of regional knowledge concerning capacity and customer shipping needs, and manage our overall business with a high level of performance accountability. | |
Strengthening our customer relationships | We market our services to both existing and new customers who value our broad geographic coverage, suite of transportation and logistics services, and industry-leading truckload capacity and freight lanes that complement our existing operations. We seek customers who will diversify our freight base. We market our dry van, refrigerated, drayage, brokerage, and intermodal services, including dedicated and cross-border services within those offerings, to logistics customers seeking a single-source provider of multiple services but do not currently take advantage of our array of truckload solutions. |
Improving asset productivity | We focus on improving the revenue generated from our tractors and trailers without compromising safety. We anticipate that we can accomplish this objective through increased miles driven and rate per mile. |
Acquiring and growing opportunistically | We regularly evaluate potential opportunities for mergers, acquisitions, and other development and growth opportunities. In addition to the merger between Knight and Swift in 2017, since 1999, Knight has acquired five short-to-medium haul truckload carriers, including the acquisition of Barr-Nunn during 2014, and Swift has acquired thirteen companies since 1966. |
Expanding existing terminals | Historically, a substantial portion of our revenue growth has been generated by our expansion into new geographic regions through the opening of additional terminals. Although we continue to seek opportunities to further increase our business in this manner, our primary focus is on developing and expanding our existing terminals by strengthening our customer relationships, recruiting quality driving associates and non-driver employees, adding new customers, and expanding the range of transportation and logistics solutions offered from these terminals. |
Diversifying our service offerings | We are committed to providing our customers a broad and growing range of truckload and logistics services and continue to invest considerable resources toward developing a range of solutions for our customers. We believe that these offerings contribute meaningfully to our results and reflect our strategy to bring complementary services to our customers to assist them with their supply chain needs. We plan to continue to leverage our nationwide footprint and expertise to add value to our customers through our diversified service offerings. |
7
Information by Segment and Geography |
Segments
Our six reportable segments are Knight Trucking, Knight Logistics, Swift Truckload, Swift Dedicated, Swift Refrigerated, and Swift Intermodal. Segment information is provided in Notes 2 and 25 to the consolidated financial statements, including accounting and reporting policy, segment definitions, and financial information. Supplementary segment information is available in Part II, Item 7, Management's Discussion and Analysis of Financial Condition and Results of Operations.
Geography
The required disclosures relating to revenue and long-lived assets by geography are included in Note 25 to the consolidated financial statements. Income tax information by geography is included in Note 14 to the consolidated financial statements.
Customers and Marketing |
Marketing
Our marketing mission is to be a strategic, efficient transportation capacity partner for our customers by providing truckload and logistics solutions customizable to the unique needs of our customers. We deliver these capacity solutions through our network of owned assets, independent contractors, third-party capacity providers, and our rail providers. The diverse and premium services we offer provide a comprehensive approach to providing ample supply chain solutions to our customers. At December 31, 2017, we had a sales staff of approximately 85 individuals across the United States, Mexico, and Canada, who work closely with management to establish and expand accounts. Our sales and marketing leaders are members of our senior management team, who are assisted by other sales professionals in each segment. Our sales team emphasizes our industry-leading service, environmental leadership, and our ability to accommodate a variety of customer needs, provide consistent capacity, and financial strength and stability.
Customers
Our customers are typically large corporations in the retail (including discount and online retail), food and beverage, consumer products, paper products, transportation and logistics, housing and building, automotive, and manufacturing industries. Many of our customers have extensive operations, geographically distributed locations, and diverse shipping needs.
Consistent with industry practice, our typical customer contracts (other than dedicated contracts) do not guarantee shipment volumes by our customers or truck availability by us. This affords us and our customers some flexibility to negotiate rates in response to changes in freight demand and industry-wide truck capacity. Our dedicated services within the Swift Dedicated and Knight Trucking segments assign particular driving associates and revenue equipment to prescribed routes, pursuant to multi-year agreements. This provides individual customers with a guaranteed source of capacity, and allows our driving associates to have more predictable schedules and routes. Under our dedicated transportation services, we provide driving associates, equipment, maintenance, and, in some instances, transportation management services that supplement the customer's in-house transportation department.
Our terminals are linked to our corporate information technology system in our Phoenix headquarters. The capabilities of this system and its software enhance our operating efficiency by providing cost-effective access to detailed information concerning equipment location and availability, shipment tracking and on-time delivery status, and other specific customer requirements. The system also enables us to respond promptly and accurately to customer requests and assists us in geographically matching available equipment with customer loads. Additionally, our customers can track shipments and obtain copies of shipping documents via our website. We also provide electronic data interchange services to customers desiring these services.
We believe our fleet capacity, terminal network, customer service and breadth of services offer a competitive advantage to major shippers, particularly in times of rising freight volumes when shippers must quickly access capacity across multiple facilities and regions.
We strive to maintain a diversified customer base. Services provided to the Company's largest customer, Wal-Mart, generated 15.8%, 13.7%, and 12.4% of total revenue in 2017, 2016, and 2015, respectively. Revenue generated by Wal-Mart is reported in the Knight Trucking, Swift Truckload, Swift Dedicated, Swift Refrigerated, and Swift Intermodal operating segments. No other customer accounted for 10% or more of total revenue in 2017, 2016, or 2015.
Our top 25 customers drive a substantial portion of our total revenue, as follows (amounts reflect only Swift's result prior to the 2017 Merger date, and Knight-Swift's results after the 2017 Merger date):
• | In 2017, our top 25, top 10, and top 5 customers accounted for 56.6%, 39.7%, and 31.7% of our total revenue, respectively. |
• | In 2016, our top 25, top 10, and top 5 customers accounted for 53.7%, 37.3%, and 27.7% of our total revenue, respectively. |
• | In 2015, our top 25, top 10, and top 5 customers accounted for 53.1%, 36.2%, and 26.2% of our total revenue, respectively. |
8
Revenue Equipment |
We operate a modern company tractor fleet to help attract and retain driving associates, promote safe operations, and reduce maintenance and repair costs. The following table shows our owned and leased tractor and trailer ages as of December 31, 2017:
Model Year | Tractors (1) | Trailers | ||||
2019 | — | 9 | ||||
2018 | 2,798 | 3,968 | ||||
2017 | 2,232 | 8,835 | ||||
2016 | 5,185 | 6,913 | ||||
2015 | 4,968 | 8,846 | ||||
2014 | 2,223 | 5,624 | ||||
2013 | 374 | 5,666 | ||||
2012 | 123 | 4,470 | ||||
2011 and prior | 478 | 30,618 | ||||
Total | 18,381 | 74,949 | ||||
_______________
(1) Excludes 4,688 independent contractor tractors.
We typically purchase or lease tractors and trailers manufactured to our specifications in order to meet a wide variety of customer needs. Growth of our tractor and trailer fleet is determined by market conditions and our experience and expectations regarding equipment utilization. In acquiring revenue equipment, we consider a number of factors, including economy, price, rate, economic environment, technology, warranty terms, manufacturer support, driving associate comfort, and resale value. We maintain strong relationships with our equipment vendors and have the financial flexibility to react as market conditions dictate.
Our current policy is to replace our tractors between 42 months and 60 months after purchase and to replace our trailers over a five- to ten-year period. Changes in the current market for used tractors and trailers, regulatory changes, and difficult market conditions faced by tractor and trailer manufacturers, may result in price increases that may affect the period of time for which we operate our equipment.
Our newer equipment has enhanced features, which we believe tends to lower the overall life cycle costs by reducing safety-related expenses, lowering repair and maintenance expenses, improving fuel economy, and improving driving associate satisfaction. In 2018 and beyond, we will continue to monitor the appropriateness of this relatively short tractor trade-in cycle against the lower capital expenditure and financing costs of a longer tractor trade-in cycle, based on current and future business needs.
Employees |
The strength of our company is our people, working together with common goals. There were approximately 25,200 full-time employees in our total headcount of approximately 25,400 employees as of December 31, 2017, which was comprised of:
Company driving associates (including driver trainees) | 19,200 | ||
Technicians and other equipment maintenance personnel | 1,400 | ||
Support personnel (such as corporate managers, sales, and administrative personnel) | 4,800 | ||
Total | 25,400 | ||
As of December 31, 2017, we had approximately 780 Trans-Mex driving associates in Mexico that were represented by a union.
Company Driving Associates
We recognize that the recruitment, training, and retention of a professional driving associate workforce, which is one of our most valuable assets, are essential to our continued growth and meeting the service requirements of our customers. In order to attract and retain safe driving associates who are committed to the highest levels of customer service and safety, we focus our operations for driving associates around a collaborative and supportive team environment. We provide late model and comfortable equipment, direct communication with senior management, competitive wages and benefits, and other incentives designed to encourage driving associate safety, retention, and long-term employment. We have established various driving academies across the United States. Our academies are strategically located in areas where external driver-training organizations were lacking. In other areas of the US, we have contracted with driver training schools, which are managed by third parties. There are certain minimum qualifications for candidates to be accepted into the academy, including passing the DOT physical examination and drug/alcohol screening.
9
Terminal Staff
Most of our large terminals are staffed with terminal leaders, fleet leaders, driver leaders, planners, safety coordinators, shop leaders, technicians, and customer service representatives. Our terminal leaders work with driver leaders, customer service representatives, and other operations personnel to coordinate the needs of both our customers and our driving associates. Terminal leaders are also responsible for serving existing customers in their areas. Fleet leaders supervise driver leaders, who are responsible for the general operation of our trucks and their driving associates, focusing on driving associate retention, productivity per truck, fuel consumption, fuel efficiency (with respect to driver-controllable idle time), safety, and scheduled maintenance. Customer service representatives are assigned specific customers to ensure specialized, high-quality service, and frequent customer contact.
Independent Contractors |
In addition to Knight-Swift-employed driving associates, we enter into contractor agreements with third parties who own and operate tractors (or hire their own driving associates to operate the tractors) that service our customers. We pay these independent contractors for their services, based on a contracted rate per mile. By operating safely and productively, independent contractors can improve their own profitability and ours. Independent contractors are responsible for most costs incurred for owning and operating their tractors. For convenience, we offer independent contractors maintenance services at our in-house shops and fuel at our terminals at competitive and attractive prices. As of December 31, 2017, independent contractors comprised 20.3% of our total fleet, as measured by tractor count.
Safety and Insurance |
Safety
We are committed to safe and secure operations. We conduct a mandatory intensive driver qualification process, including defensive driving training for all drivers, which includes our company driving associates. We require prospective drivers to meet higher qualification standards than those required by the DOT. We regularly communicate with drivers to promote safety and instill safe work habits through effective use of various media and safety review sessions. We dedicate personnel and resources designed to ensure safe operation and regulatory compliance. We employ technology to assist us in managing risks associated with our business. In addition, we have an innovative recognition program for driver safety performance and emphasize safety through our equipment specifications and maintenance programs. Our Corporate Directors of Safety review all accidents and report weekly to the Senior Director of Safety and Risk Management.
Insurance
The primary claims arising in our business consist of auto liability, including personal injury, property damage, physical damage, and cargo loss. We self-insure for a significant portion of our claims exposure and related expenses. We also maintain insurance that covers our directors and officers for losses and expenses arising out of claims, based on acts or omissions in their capacities as directors or officers. While under dispatch and the Company's operating authority, the independent contractors the Company contracts with are covered by the Company's liability coverage and self-insurance retention limits. However, each is responsible for physical damage to his or her own equipment, occupational accident coverage, and liability exposure while the truck is used for non-company purposes. Additionally, fleet operators are responsible for any applicable workers' compensation requirements for their employees.
Swift — The following table includes Swift's self-insured retention amounts, maximum benefits per claim, and other limitations:
Insurance | Limits |
Automobile Liability, General Liability, and Excess Liability | $250.0 million of coverage per occurrence, subject to a $10.0 million self-insured retention per-occurrence. |
Cargo Damage and Loss | $2.0 million limit per truck or trailer with a $10.0 million limit per occurrence; provided that there is a $1.0 million limit for tobacco loads and a $250 thousand deductible |
Property and Catastrophic Physical Damage | $150.0 million limit for property and $100.0 million limit for vehicle damage, excluding over the road exposures, subject to a $1.0 million deductible |
Workers' Compensation/Employers' Liability | Statutory coverage limits; employers' liability of $1.0 million bodily injury by accident and disease, subject to a $5.0 million self-insured retention for each accident or disease |
Employment Practices Liability | Primary policy with a $10.0 million limit subject to a $2.5 million self-insured retention |
Health Care | As of January 1, 2015, Swift is fully insured for medical, subject to contributed premiums. |
10
Knight — The following table includes information regarding Knight's main insurance programs:
Insurance | Limits |
Automobile Liability | $130.0 million of coverage per occurrence, subject to a $1.0 million self-insured retention per-occurrence, and a $2.5 million aggregate deductible for any loss within the excess coverage layer. |
Workers' Compensation | $1.0 million self-insured retention per occurrence. |
Employee Medical and Hospitalization | Primary and excess coverage for employee medical expenses and hospitalization, with $0.2 million self-insured retention per claimant. |
Fuel |
We actively manage our fuel purchasing network in an effort to maintain adequate fuel supplies and reduce our fuel costs. Additionally, we utilize a fuel surcharge program to pass a majority of increases in fuel costs to our customers. In 2017, we purchased 14.8% of our fuel in bulk at our Swift, Knight, and dedicated customer locations across the United States and Mexico. We purchased substantially all of the remainder through a network of retail truck stops with which we have negotiated volume purchasing discounts. The volumes we purchase at terminals and through the fuel network vary based on procurement costs and other factors. We seek to reduce our fuel costs by routing our driving associates to truck stops when fuel prices at such stops are cheaper than the bulk rate paid for fuel at our terminals. We primarily store fuel in above-ground storage tanks at most of our other bulk fueling terminals. We believe that we are sufficiently in compliance with applicable environmental laws and regulations relating to the storage and dispensing of fuel.
Seasonality |
In the transportation industry, results of operations generally follow a seasonal pattern. Freight volumes in the first quarter are typically lower due to less consumer demand, customers reducing shipments following the holiday season, and inclement weather impeding operations. At the same time, operating expenses generally increase, and tractor productivity of our fleet, independent contractors, and third-party carriers decreases during the winter months due to decreased fuel efficiency, increased cold-weather-related equipment maintenance and repairs, and increased insurance claims and costs attributed to higher accident frequency from harsh weather. During this period, the profitability of our operations is generally lower than during other parts of the year. Additionally, we have seen surges between Thanksgiving and Christmas resulting from holiday shopping trends toward delivery of gifts purchased over the Internet, as well as the impact of shorter holiday seasons (Thanksgiving holiday recently falling closer to Christmas).
Environmental Regulation |
General
We have bulk fuel storage and fuel islands at many of our terminals, as well as vehicle maintenance, repair, and washing operations at some of our facilities, which exposes us to certain environmental risks. Soil and groundwater contamination have occurred at some of our facilities in prior years, for which we have been responsible for remediating the environmental contamination. Also, a small percentage of our total shipments contain hazardous materials, which are generally rated as low- to medium-risk, and subject us to a wide array of regulation. In the past, we have been responsible for the costs of clean-up of cargo and diesel fuel spills caused by traffic accidents or other events.
We have instituted programs to monitor and mitigate environmental risks and maintain compliance with applicable environmental laws dealing with the hauling, handling, and disposal of hazardous materials, fuel spillage or seepage, emissions from our vehicles and facilities, engine-idling, discharge and retention of storm water, and other environmental matters. As part of our safety and risk management program, we periodically perform internal environmental reviews. We are a Charter Partner in the EPA's SmartWay Transport Partnership, a voluntary program promoting energy efficiency and air quality. We believe that our operations are sufficiently in compliance with current laws and regulations and do not know of any existing environmental condition that would reasonably be expected to have a material adverse effect on our business or operating results.
If we are held responsible for the cleanup of any environmental incidents caused by our operations or business, or if we are found to be in violation of applicable laws or regulations, we could be subject to clean-up costs and other liabilities, including substantial fines or penalties or civil and criminal liability, any of which could have a material, adverse effect on our business and results of operations. We have paid penalties for spills and violations in the past; however, they have not been material to our financial results or position.
11
Greenhouse Gas ("GHG") Emissions and Fuel Efficiency Standards
California ARB — In 2008 the State of California's Air Resources Board ("ARB") approved the Heavy-Duty Vehicle GHG Emission Reduction Regulation in efforts to reduce GHG emissions from certain long-haul tractor-trailers that operate in California by requiring them to utilize technologies that improve fuel efficiency (regardless of where the vehicle is registered). The regulation required owners of long-haul tractors and 53-foot trailers to be EPA SmartWay certified or replace or retrofit their vehicles with aerodynamic technologies and low-rolling resistance tires. The regulation also contained certain emissions and registration standards for refrigerated trailers.
In December 2013, California's ARB approved regulations to align its GHG emission standards and test procedures, as well as its tractor-trailer GHG regulation, with the feder Phase 1 GHG regulation (see below).
Additionally, in February 2017 California's ARB proposed California Phase 2 standards that would generally align with the federal Phase 2 Standards (see below), with some minor additional requirements, and as proposed would stay in place even if the federal Phase 2 Standards are affected by action from President Trump's administration. California's ARB has announced it plans to bring a formal proposed program to its board of directors in early 2018.
Complying with current and proposed GHG regulations has increased the cost of our new tractors, may increase the cost of any new trailers that will operate in California, may require us to retrofit certain of our pre-2011 model year trailers that operate in California, and could impair equipment productivity and increase our operating expenses. These adverse effects, combined with the uncertainty as to the reliability of the newly designed diesel engines and the residual values of these vehicles, could materially increase our costs or otherwise adversely affect our business or operations. We will continue monitoring our compliance with California's ARB regulations.
EPA and NHTSA — The EPA and the National Highway Traffic Safety Administration ("NHTSA") began taking coordinated steps in support of a new generation of clean vehicles and engines through reduced GHG emissions and improved fuel efficiency at a national level.
• | Phase 1 — In September 2011, the EPA finalized federal regulations for controlling GHG emissions, beginning with model-year 2014 medium- and heavy-duty engines and vehicles and increasing in stringency through model-year 2018. The federal regulations relate to efficient engines, use of auxiliary power units, mass reduction, low-rolling resistance tires, improved aerodynamics, improved transmissions, and reduced accessory loads. |
In December 2013, California's ARB approved regulations to align its GHG emission standards and test procedures, as well as its tractor-trailer GHG regulation, with the federal Phase 1 GHG regulation.
• | Phase 2 — In June 2015, the EPA and NHTSA, working in concert with California's ARB, formally announced a proposed national program establishing Phase 2 of the GHG emissions and fuel efficiency standards for medium- and heavy-duty vehicles for model-year 2018 and beyond. In August 2016, the EPA and NHTSA announced the final rule regarding Phase 2, which builds upon Phase 1, and would apply to certain trailer types beginning with model-year 2018 for EPA standards (voluntary for NHTSA standards through model-year 2020). Tractors and certain trailer types would be subject to the Phase 2 standards beginning with model-year 2021, increasing in stringency through model-year 2024, and phasing in completely by model-year 2027. This rule marks the first time federal mandates will be applied to trailers, with respect to aerodynamics and low-rolling resistance tires. The final rule was effective December 27, 2016. |
In October 2017, the EPA announced a proposal to repeal the Phase 2 Standards as they relate to gliders (which mix refurbished older components, including transmissions and pre-emission-rule engines, with a new frame, cab, steer axle, wheels, and other standard equipment). Additionally, implementation of the Phase 2 Standards as they relate to trailers has been delayed due to a provisional stay granted in October 2017 by the US Court of Appeals for the District of Columbia, which is overseeing a case against the EPA by the Truck Trailer Manufacturers Association, Inc. regarding the Phase 2 Standards. If the glider provisions are removed from the Phase 2 standards, there would be no direct effect on our results of operations. If the trailer provisions of the Phase 2 Standards are permanently removed, we would expect a lessened impact on our operations.
We believe the EPA and NHTSA GHG requirements will result in additional increases in new tractor and trailer prices and additional parts and maintenance costs incurred to retrofit our tractors and trailers with technology to achieve compliance with such standards, which could adversely affect our operating results and profitability, particularly if such costs are not offset by potential fuel savings. We cannot predict, however, the extent to which our operations and productivity will be impacted.
Climate-change Proposals
Federal and state lawmakers are considering a variety of other climate-change proposals related to carbon emissions and GHG emissions. The proposals could potentially limit carbon emissions for certain states and municipalities, which continue to restrict the location and amount of time that diesel-powered tractors (like ours) may idle.
These restrictions could force us to purchase on-board power units that do not require the engine to idle or to alter our drivers' behavior, which could result in a decrease in productivity, or increase in driving associate turnover.
12
Industry Regulation |
Our operations are regulated and licensed by various federal, state, and local government agencies in North America, including the DOT, the FMCSA, and the United States Department of Homeland Security, among others. Our company, as well as our driving associates and independent contractors, must comply with enacted governmental regulations regarding safety, equipment, and operating methods. Examples include regulation of equipment weight, equipment dimensions, driver hours-of-service, driver eligibility requirements, on-board reporting of operations, and ergonomics. The following discussion presents recently enacted federal, state, and local regulations that have an impact on our operations.
Hours-of-service
From time to time, the FMCSA proposes and implements changes to regulations impacting hours-of-service. Such changes can negatively impact our productivity and affect our operations and profitability by reducing the number of hours per day or week our drivers may operate and/or disrupting our network. No such changes are currently proposed. However, any future changes to hours-of-service regulations could materially and adversely affect our operations and profitability.
Safety and Fitness Ratings
There are currently two methods of evaluating the safety and fitness of carriers: CSA BASICS, which evaluates and ranks fleets on certain safety-related standards by analyzing data from recent safety events and investigation results, and DOT SafeStat, which is based on an on-site investigation and affects a carrier's ability to operate in interstate commerce. Additionally, the FMCSA has proposed rules in the past that would change the methodologies used to determine carrier safety and fitness.
DOT SafeStat — SafeStat is currently the only safety measurement system in effect. Both Knight and Swift currently have a satisfactory SafeStat DOT rating, which is the best available rating under the current safety rating scale. If we were to receive a conditional or unsatisfactory DOT safety rating, it could adversely affect our business, as some of our existing customer contracts require a satisfactory DOT safety rating.
CSA BASICs — In December 2010, the FMCSA introduced an enforcement and compliance model that ranks on seven categories of safety-related data. The seven categories of safety-related data, known as BASICs, currently include Unsafe Driving, Fatigued Driving (hours-of-service), Driver Fitness, Controlled Substances/Alcohol, Vehicle Maintenance, Hazardous Materials Compliance, and Crash Indicator. Carriers are grouped by category with other carriers that have a similar number of safety events (i.e. crashes, inspections, or violations) and carriers are ranked and assigned a rating percentile or score to prioritize them for interventions if they are above a certain threshold.
Certain CSA BASICs information was initially published and made available to carriers, as well as the general public. However, in December 2015, as part of the Fixing America's Surface Transportation ("FAST") Act, Congress mandated that the FMCSA remove all CSA scores from public view until a more comprehensive study regarding the effectiveness of CSA BASICs improving truck safety could be completed. During this period of review by the FMCSA, we will continue to have access to our own scores and will still be subject to intervention by the FMCSA when such scores are above the intervention thresholds. The study was conducted and delivered to the FMCSA in June 2017 with several recommendations to make the CSA program more fair, accurate, and reliable. The FMCSA is expected to provide its report to Congress in early 2018 outlining the changes it will make to the CSA program in response to the study.
It is unclear if, when, and to what extent any such changes will occur. However, any changes that increase the likelihood of us receiving unfavorable scores could adversely affect our results of operations and profitability.
CSA BASICS scores do not currently have a direct impact on a carrier's safety rating. However, the occurrence of unfavorable scores in one or more categories may affect driving associate recruiting and retention by causing qualified driving associates to seek employment with other carriers, cause our customers to direct their business away from us and to carriers with higher fleet rankings, subjecting us to an increase in compliance reviews and roadside inspections, or causing us to incur greater than expected expenses in our attempts to improve unfavorable scores, any of which could adversely affect our results of operations and profitability.
13
Safety Fitness Determination — In January 2016, the FMCSA published a Notice of Proposed Rulemaking ("NPRM") in the Federal Register, regarding carrier safety fitness determination. The NPRM proposed new methodologies that would have determined when a motor carrier was not fit to operate a commercial motor vehicle. Key proposed changes that were included in the NPRM are as follows:
• | There would be only one safety rating of "unfit," as compared to the current rules, which have three safety ratings (satisfactory, conditional, and unsatisfactory). |
• | Carriers could be determined "unfit" by failing two or more BASICs, investigation results, or a combination of the two. |
• | Stricter standards would be used for BASICs with a higher correlation to crash risk (Unsafe Driving and Hours-of-Service Compliance). |
• | All investigation results would be used, not just results from comprehensive on-site reviews. |
• | Violations of a revised list of "critical" and "acute" safety regulations would result in failing a BASIC. |
• | Carriers would be assessed monthly. |
Public comments on the proposed rule were due in June 2016 and several industry groups and lawmakers expressed their disagreement with the proposed rule, arguing that it violates the requirements of the FAST Act and that the FMCSA must first finalize its review of the CSA scoring system. Based on this feedback and other concerns raised by industry stakeholders, in March 2017, the FMCSA withdrew the Notice of Proposed Rulemaking related to the new safety rating system. In its notice of withdrawal, the FMCSA noted that a new rulemaking related to a similar process may be initiated in the future. Therefore, it is uncertain if, when, or under what form any such rule could be implemented.
Moving Ahead for Progress in the 21st Century Bill
In July 2012, Congress passed the Moving Ahead for Progress in the 21st Century bill into law. Included in the highway bill was a provision that mandates electronic logging devices in commercial motor vehicles to record hours-of-service. Additionally, in response to the bill, a final rule related to entry-level driver training was passed in 2016, as well as amendments to the Drug and Alcohol Clearinghouse rules.
ELD — During 2012, the FMCSA published a Supplemental NPRM, announcing its plan to proceed with the ELDs and hours-of-service supporting documents rulemaking. The ELD rule became final in December 2015, as published in the Federal Register, with an effective date of February 16, 2016. The ELD rule phases in over a four-year period:
• | Phase 1 (February 16, 2016 through December 18, 2017): Carriers and drivers subject to the rule may voluntarily use ELDs or use other forms of logging devices. |
• | Phase 2 (December 18, 2017 through December 16, 2019): Carriers and drivers subject to the rule can use Automatic On-board Recording Devices ("AOBRD") that were installed prior to December 18, 2017 or ELDs certified and registered after December 16, 2015. |
• | Phase 3 (after December 16, 2019): All drivers and carriers subject to the rule must use certified and registered ELDs that comply with the requirements of the ELD regulations. |
Although the final ELD rule may have a large impact on the industry as a whole, we have not experienced an adverse impact on Knight-Swift, as we previously installed ELDs in our operational trucks in conjunction with our efforts to improve efficiency and communications with driving associates and independent contractors. However, we believe that more effective hours-of-service enforcement under the ELD Rule may improve our competitive position by causing all carriers to adhere more closely to hours-of-service requirements.
Entry-Level Driver Training — In December 2016, the FMCSA established new minimum training standards for certain individuals applying for (or upgrading) a Class A or Class B commercial driver's license, or obtaining a hazardous materials, passenger, or school bus endorsement on their commercial driver's license for the first time. These individuals are subject to the Entry-level driver training requirements and must complete a prescribed program of theory and behind-the wheel instruction. The final rule requires that behind-the-wheel proficiency of an entry-level truck driver be determined solely by the instructor's evaluation of how well the driver-trainee performs the fundamental vehicle controls skills and driving procedures set forth in the curricula, but does not have a minimum training hours requirement, as proposed by the FMCSA earlier in 2016. The final rule went into effect on February 6, 2017, with a compliance date of February 7, 2020. Upon the compliance date, training schools will be required to register with the FMCSA's Training Provider Registry and certify that their program meets the classroom and driving standards. The effect of this rule could result in a decrease in fleet production and driver availability, either of which could adversely affect our business or operations.
14
Commercial Driver's License Drug and Alcohol Clearinghouse — In December 2016, the FMCSA amended the Federal Motor Carrier Safety Regulations to establish requirements of the Commercial Driver's License Drug and Alcohol Clearinghouse, a database under its administration that will contain information about violations of the FMCSA's drug and alcohol testing program for holders of commercial driver's licenses. In addition to requiring employers to check the database for driver applicant drug and alcohol test failures, the final rule requires employers to check the database to determine whether current employees have incurred a drug or alcohol violation that would prohibit them from performing safety-sensitive functions. The final rule became effective on January 4, 2017, with a compliance date of January 6, 2020. Upon implementation, the rule may reduce the number of available drivers in an already constrained driver market.
Prohibiting Coercion of Commercial Motor Vehicle Drivers
In November 2015, the Prohibiting Coercion of Commercial Motor Vehicle Drivers rule became final, as published in the Federal Register and adopted by the FMCSA. The rule explicitly prohibits motor carriers from coercing drivers to violate certain FMCSA regulations, including driver hours-of-service limits, Commercial Drivers' License regulations, drug and alcohol testing rules, and hazardous materials regulations, among others. Under the rule, drivers can report incidents of coercion to the FMCSA, who is authorized to issue penalties against the motor carrier. We have not experienced any significant impacts from this rule.
Speed Limiting Devices
In September 2016, the NHTSA and FMCSA proposed regulations that would require speed limiting devices on vehicles with a gross vehicle weight rating of more than 26,000 pounds for the service life of the vehicle. The speed was expected to be limited to 62, 65, or 68, but ultimately would have been be set by the final rule. Based on the agencies' review of the available data, limiting the speed of these heavy vehicles would reduce the severity of crashes involving these vehicles and reduce the resulting injuries and fatalities. Public comments on the proposed rule were due in November 2016, and in July 2017, the DOT announced that it would no longer pursue a speed limiter rule, but left open the possibility that it could resume such a pursuit in the future. The effect of this rule, to the extent it became effective, could result in a decrease in fleet production and driver availability, either of which could adversely affect our business or operations.
For safety, we electronically govern the speed of substantially all of our company tractors. Additionally, our independent contractor agreements include statements that independent contractors must comply with the Company's speed policy.
Food Safety Modernization Act of 2011 ("FSMA")
In April 2016, the Food and Drug Administration published a final rule establishing requirements for shippers, loaders, carriers by motor vehicle and rail vehicle, and receivers engaged in the transportation of food, to use sanitary transportation practices to ensure the safety of the food they transport as part of the FSMA. This rule sets forth requirements related to:
• | the design and maintenance of equipment used to transport food, |
• | the measures taken during food transportation to ensure food safety, |
• | the training of carrier personnel in sanitary food transportation practices, and |
• | maintenance and retention of records of written procedures, agreements, and training related to the foregoing items. |
These requirements took effect for larger carriers such as us in April 2017 and are also applicable when we perform as a carrier or as a broker. We believe we have been in compliance with these requirement since that time. However, if we are found to be in violation of applicable laws or regulations related to the FSMA, we could be subject to substantial fines, penalties and/or criminal liability, any of which could have a material adverse effect on our business, financial condition, and results of operations.
15
Legislation Regarding Independent Contractors
Tax and other regulatory authorities have sought in the past to assert that independent contractors in the trucking industry are employees rather than independent contractors. Federal legislators continue to introduce legislation concerning the classification of independent contractors as employees, including legislation that proposes to increase the tax and labor penalties against employers who intentionally or unintentionally misclassify employees as independent contractors and are found to have violated employees' overtime or wage requirements. Additionally, federal legislators have sought to:
• | abolish the current safe harbor allowing taxpayers meeting certain criteria to treat individuals as independent contractors if they are following a long-standing, recognized practice, |
• | extend the FLSA to independent contractors, and |
• | impose notice requirements based upon employment or independent contractor status and fines for failure to comply. |
Some states have adopted initiatives to increase their revenues from items such as unemployment, workers' compensation, and income taxes, and we believe a reclassification of independent contractors as employees would help states with this initiative. Federal and state taxing and other regulatory authorities and courts apply a variety of standards in their determination of independent contractor status.
Further, class actions and other lawsuits have been filed against us and other members of our industry seeking to reclassify independent contractors as employees for a variety of purposes, including workers' compensation and health care coverage. Our defense of such class actions and other lawsuits has not always been successful, and we have been subject to adverse judgments with respect to such matters. If our independent contractors were determined to be our employees, we would incur additional exposure under federal and state tax, workers' compensation, unemployment benefits, labor, employment, and tort laws, which could potentially include prior periods, as well as potential liability for employee benefits and tax withholdings. We currently observe and monitor our compliance with current related and applicable laws and regulations, but we cannot predict whether laws and regulations adopted in the future regarding the classification of our independent contractors will adversely affect our business or operations.
Other Regulation |
Executive Order
The regulatory environment has changed under the administration of President Trump. In January 2017, the President signed an executive order requiring federal agencies to repeal two regulations for each new one they propose and imposing a regulatory budget, which would limit the amount of new regulatory costs federal agencies can impose on individuals and businesses each year. We do not believe the order has had a significant impact on our industry. However, the order, and other anti-regulatory action by the President and/or Congress, may inhibit future new regulations and/or lead to the repeal or delayed effectiveness of existing regulations. Therefore, it is uncertain how we may be impacted in the future by existing, proposed, or repealed regulations.
The Tax Cuts and Jobs Act
On December 22, 2017, the United States enacted significant changes to its tax law following the passage and signing of H.R.1, "An Act to Provide for Reconciliation Pursuant to Titles II and V of the Concurrent Resolution on the Budget for Fiscal Year 2018" (previously known as "The Tax Cuts and Jobs Act"). The new tax law is complex and includes various changes which may impact the Company. See Note 14 in Part II, Item 8 of this Annual Report for further details, including the financial impact on the Company.
Available Information |
General information about the Company is provided, free of charge, regarding Knight at www.knighttrans.com and regarding Swift at www.swifttrans.com. These websites also include links to the combined company's investor site http://investor.knight-swift.com, which includes our annual reports on Form 10-K with accompanying XBRL documents, quarterly reports on Form 10-Q with accompanying XBRL documents, current reports on Form 8-K, and amendments to those reports that are filed or furnished pursuant to Section 13(a) or 15(d) of the Securities Exchange Act of 1934, as soon as reasonably practicable once the material is electronically filed or furnished to the SEC.
16
ITEM 1A. | RISK FACTORS |
When evaluating our company, the following risks should be considered in conjunction with the other information contained in this Annual Report. If we are unable to mitigate and/or are exposed to any of the following risks in the future, then there could be a material, adverse effect on our business, results of operations, or financial condition.
Our risks are grouped into the following risk categories: | ||||||
Strategic | Operational | Compliance | Financial | |||
*Industry and Competition | *Company Growth | *Trucking Industry Regulation | *Capital Requirements | |||
*Market Changes | *Employees | *Environmental Regulation | *Debt | |||
*Macroeconomic Changes | *Independent Contractors | *Insurance Regulation | *Investments | |||
*Mergers and Acquisitions | *Vendors and Suppliers | *Goodwill and Intangibles | ||||
*International Operations | *Customers | *Common Stock | ||||
*Information Systems | *Dividends | |||||
Strategic Risk |
Our business is subject to general economic, credit, business, and regulatory factors affecting the truckload industry that are largely beyond our control, any of which could have a materially adverse effect on our results of operations.
The truckload industry is highly cyclical, and our business is dependent on a number of factors that may have a materially adverse effect on our results of operations, many of which are beyond our control. We believe that some of the most significant of these factors include (1) excess tractor and trailer capacity in the trucking industry in comparison with shipping demand; (2) declines in the resale value of used equipment; (3) recruiting and retaining qualified driving associates; (4) strikes, work stoppages, or work slowdowns at our facilities or at customer, port, border crossing, or other shipping-related facilities; (5) increases in interest rates, fuel, taxes, tolls, and license and registration fees; and (6) rising costs of healthcare.
We are also affected by (1) recessionary economic cycles, such as the period from 2007 through 2009 and the 2016 freight environment, which was characterized by weak demand and downward pressure on rates; (2) changes in customers' inventory levels and practices, including shrinking product/package sizes, and in the availability of funding for their working capital; (3) changes in the way our customers choose to source or utilize our services; and (4) downturns in our customers' business cycles. Economic conditions may adversely affect our customers and their demand for and ability to pay for our services. Customers encountering adverse economic conditions represent a greater potential for loss and we may be required to increase our allowance for doubtful accounts.
Economic conditions that decrease shipping demand or increase the supply of available tractors and trailers can exert downward pressure on rates and equipment utilization, thereby decreasing asset productivity. The risks associated with these factors are heightened when the US economy is weakened, such as the period from 2007 through 2009. Some of the principal risks during such times, which risks Knight and Swift have experienced during prior recessionary periods, are as follows:
• | we may experience a reduction in overall freight levels, which may impair our asset utilization; |
• | freight patterns may change as supply chains are redesigned, resulting in an imbalance between our capacity and our customers' freight demand; |
• | customers may experience credit issues and cash flow problems, resulting in an inability to compensate us for rendered services; |
• | customers may solicit bids for freight from multiple trucking companies or select competitors that offer lower rates from among existing choices in an attempt to lower their costs, and we might be forced to lower our rates or lose freight; |
• | we may be forced to accept more freight from freight brokers, where freight rates are typically lower, or may be forced to incur more non-revenue miles to obtain loads; |
• | we may need to incur significantly more non-paid empty miles to obtain loads; and |
• | lack of access to current sources of credit or lack of lender access to capital, leading to an inability to secure credit financing on satisfactory terms, or at all. |
We are also subject to potential increases in various costs and other events that are outside of our control that could materially reduce our profitability if we are unable to increase our rates sufficiently. Such cost increases include, but are not limited to, fuel and energy prices, driving associate and non-driver employee wages, purchased transportation costs, taxes and interest rates, tolls, license and registration fees, insurance premiums and claims, revenue equipment and related maintenance costs, tires and other components, and healthcare and other benefits for our employees. We could be affected by strikes or other work stoppages at our terminals, or at customer, port, border, or other shipping locations. Further, we may not be able to appropriately adjust our costs and staffing levels to changing market demands. In periods of rapid change, it is more difficult to match our staffing level to our business needs.
17
Changing impacts of regulatory measures could impair our operating efficiency and productivity, decrease our operating revenues and profitability, and result in higher operating costs. From time-to-time, various US federal, state, or local taxes are also increased, including taxes on fuels. We cannot predict whether, or in what form, any such increase applicable to us will be enacted, but such an increase could adversely affect our results of operations and profitability.
In addition, we cannot predict future economic conditions, fuel price fluctuations, revenue equipment resale values, or how consumer confidence could be affected by actual or threatened armed conflicts or terrorist attacks, government efforts to combat terrorism, military action against a foreign state or group located in a foreign state, or heightened security requirements. Enhanced security measures in connection with such events could impair our operating efficiency and productivity and result in higher operating costs.
We operate in a highly competitive and fragmented industry, and numerous competitive factors could limit growth opportunities and could have a materially adverse effect on our results of operations.
We operate in a highly competitive industry, which includes thousands of trucking and logistics companies. In our truckload operations, we primarily compete with other capacity providers that provide dry van, temperature-controlled, and drayage services similar to those we provide. Less-than-truckload carriers, private carriers, intermodal companies, railroads, logistics, brokerage, and freight forwarding companies compete to a lesser extent with our truckload operations but are direct competitors of our brokerage, intermodal, and logistics operations. We transport or arrange for the transportation of various types of freight, and competition for such freight is based mainly on customer service, efficiency, available capacity and shipment modes, and rates that can be obtained from customers. Such competition in the transportation industry could adversely affect our freight volumes, the freight rates we charge our customers, or profitability and thereby limit our business opportunities. Additional factors may have a materially adverse effect on our results of operations. These factors include the following:
• | many of our competitors periodically reduce their freight rates to gain business, especially during times of reduced growth rates in the economy, which may limit our ability to maintain or increase freight rates or maintain or grow profitability of our business; |
• | many customers periodically accept bids from multiple carriers for their shipping needs, and this process may depress freight rates or result in the loss of some of our business to competitors; |
• | many customers reduce the number of carriers they use by selecting so-called "core carriers" as approved service providers or by engaging dedicated providers, and in some instances we may not be selected; |
• | some of our customers operate their own private trucking fleets and they may decide to transport more of their own freight; |
• | the market for qualified drivers is increasingly competitive, and our inability to attract and retain driving associates could reduce our equipment utilization or cause us to increase driving associate compensation, both of which would adversely affect our profitability; |
• | competition from non-asset-based and other logistics and freight brokerage companies may adversely affect our customer relationships and freight rates; |
• | the continuing trend toward consolidation in the trucking industry may result in more large carriers with greater financial resources and other competitive advantages, with which we may have difficulty competing; |
• | economies of scale that procurement aggregation providers may pass on to smaller carriers may improve their ability to compete with us; |
• | advances in technology may require us to increase investments in order to remain competitive, and our customers may not be willing to accept higher freight rates to cover the cost of these investments; |
• | the Knight and Swift brand names are valuable assets that are subject to the risk of adverse publicity (whether or not justified),which could result in the loss of value attributable to our brand and reduced demand for our services; and |
• | higher fuel prices and, in turn, higher fuel surcharges to our customers may cause some of our customers to consider freight transportation alternatives, including rail transportation. |
Increased prices for new revenue equipment, design changes of new engines, decreased availability of new revenue equipment, future use of autonomous trucks, and the failure of manufacturers to meet their sale or trade-back obligations to us could have a materially adverse effect on our business, financial condition, results of operations, and profitability.
We are subject to risk with respect to higher prices for new equipment for our truckload operations. We have experienced an increase in prices for new tractors over the past few years, and the resale value of the tractors has not increased to the same extent. Prices have increased and may continue to increase, due to, among other reasons, (1) increases in commodity prices; (2) government regulations applicable to newly manufactured tractors, trailers, and diesel engines; and (3) the pricing discretion of equipment manufacturers. In addition, the engines installed in our newer tractors are subject to emissions control regulations issued by the EPA and certain states. Increased regulation has increased the cost of our new tractors and could impair equipment productivity, in some cases, resulting in lower fuel mileage, and increasing our operating expenses. Further regulations with stricter emissions and efficiency requirements have been proposed that would further increase our costs and impair equipment productivity. These adverse effects, combined with the uncertainty as to the reliability of the vehicles equipped with the newly designed diesel engines and the residual values realized from the disposition of these vehicles, could increase our costs or otherwise adversely affect our business or operations as the regulations become effective. Over the past several years, some manufacturers have significantly increased new equipment prices, in part to meet new engine design and operations requirements. Our business could
18
be harmed if we are unable to continue to obtain an adequate supply of new tractors and trailers for these or other reasons. As a result, we expect to continue to pay increased prices for equipment and incur additional expenses for the foreseeable future. Furthermore, reduced equipment efficiency may result from new engines designed to reduce emissions, thereby increasing our operating expenses.
Tractor and trailer vendors may reduce their manufacturing output in response to lower demand for their products in economic downturns or shortages of component parts. A decrease in vendor output may have a materially adverse effect on our ability to purchase a quantity of new revenue equipment that is sufficient to sustain our desired growth rate and to maintain a late-model fleet. Moreover, an inability to obtain an adequate supply of new tractors or trailers could have a materially adverse effect on our business, financial condition, and results of operations.
We have certain revenue equipment leases and financing arrangements with balloon payments at the end of the lease term equal to the residual value we are contracted to receive from certain equipment manufacturers upon sale or trade back to the manufacturers. If we do not purchase new equipment that triggers the trade-back obligation, or the equipment manufacturers do not pay the contracted value at the end of the lease term, we could be exposed to losses equal to the excess of the balloon payment owed to the lease or finance company over the proceeds from selling the equipment on the open market.
We have trade-in and repurchase commitments that specify, among other things, what our primary equipment vendors will pay us for disposal of a substantial portion of our revenue equipment. The prices we expect to receive under these arrangements may be higher than the prices we would receive in the open market. We may suffer a financial loss upon disposition of our equipment if these vendors refuse or are unable to meet their financial obligations under these agreements, we do not enter into definitive agreements that reflect favorable equipment replacement or trade-in terms, we fail to or are unable to enter into similar arrangements in the future, or we do not purchase the number of new replacement units from the vendors required for such trade-ins.
Used equipment prices are subject to substantial fluctuations based on freight demand, supply of used trucks, availability of financing, presence of buyers for export, and commodity prices for scrap metal. These and any impacts of a depressed market for used equipment could require us to dispose of our revenue equipment below the carrying value. This leads to losses on disposal or impairments of revenue equipment, when not otherwise protected by residual value arrangements. Deteriorations of resale prices or trades at depressed values could cause more losses on disposal or impairment charges in future periods.
Declines in demand for our used revenue equipment could result in decreased equipment sales, resale values, and gains on sales of assets.
We are sensitive to the used equipment market and fluctuations in prices and demand for tractors and trailers. Through certain subsidiaries, we sell our used company-owned tractors and trailers that we do not trade-in to manufacturers. The market for used equipment is affected by several factors, including the demand for freight, the supply of used equipment, the availability of financing, the presence of buyers for export to foreign countries, and commodity prices for scrap metal. Declines in demand for the used equipment we sell could result in diminished sale volumes or lower used equipment sales prices, either of which could negatively affect our gains on sales of assets.
If fuel prices increase significantly, our results of operations could be adversely affected.
Our truckload operations are dependent upon diesel fuel, and accordingly, significant increases in diesel fuel costs could materially and adversely affect our results of operations and financial condition if we are unable to pass increased costs on to customers through rate increases or fuel surcharges. Prices and availability of petroleum products are subject to political, economic, geographic, weather-related, and market factors that are generally outside our control and each of which may lead to fluctuations in the cost of fuel. Fuel prices are also affected by the rising demand for fuel in developing countries, and could be materially adversely affected by the use of crude oil and oil reserves for purposes other than fuel production and by diminished drilling activity. Such events may lead not only to increases in fuel prices, but also to fuel shortages and disruptions in the fuel supply chain.
We use a number of strategies to mitigate fuel expense, which is one of our largest operating expenses. We purchase bulk fuel at many of our terminals and utilize a fuel optimizer to identify the most cost effective fuel centers to purchase fuel over-the-road. We manage our fuel miles per gallon with a focus on reducing idle time, managing out-of-route miles, and improving the driving habits of our driving associates. We also continue to update our fleet with more fuel efficient, EPA emission-compliant post-2014 model engines, and to install aerodynamic devices on our tractors and trailers, which lead to fuel efficiency improvements. Fuel is also subject to regional pricing differences and often costs more on the West Coast and in the Northeast, where we have significant operations. We use a fuel surcharge program to recapture a portion, but not all, of the increases in fuel prices over a base rate negotiated with our customers. Our fuel surcharge program does not protect us against the full effect of increases in fuel prices. The terms of each customer's fuel surcharge agreements vary and customers may seek to modify the terms of their fuel surcharge agreements to minimize recoverability for fuel price increases. In addition, because our fuel surcharge recovery lags behind changes in fuel prices, our fuel surcharge recovery may not capture the increased costs we pay for fuel, especially when prices are rising. This could lead to fluctuations in our levels of reimbursement, which have occurred in the past. During periods of low freight volumes, shippers can use their negotiating leverage to impose less robust fuel surcharge policies. There is no assurance that such fuel surcharges can be maintained indefinitely or will be sufficiently effective. Our results of operations would be negatively affected to the extent we cannot recover higher fuel costs or fail to improve our fuel price protection through our fuel surcharge program. Increases in fuel prices, or a shortage or rationing of diesel fuel, could also materially and adversely affect our results of operations.
19
We have not historically used derivatives to mitigate volatility in our fuel costs, but we periodically evaluate the benefits of employing this strategy. As of December 31, 2017, we did not have any derivative financial instruments to reduce our exposure to fuel price fluctuations. To mitigate the impact of rising fuel costs, we contract with some of our fuel suppliers to buy fuel at a fixed price or within banded pricing for a specified period, usually not exceeding twelve months. However, this only covers a small portion of our fuel consumption. Accordingly, fuel price fluctuations may still negatively impact us.
We are subject to certain risks arising from doing business in Mexico.
We have growing operations in Mexico, through our wholly owned subsidiary, Trans-Mex, which subjects us to general international business risks, including:
• | foreign currency fluctuation; |
• | changes in Mexico's economic strength; |
• | difficulties in enforcing contractual obligations and intellectual property rights; |
• | burdens of complying with a wide variety of international and United States export, import, business procurement, transparency, and corruption laws, including the US Foreign Corrupt Practices Act; |
• | changes in trade agreements and United States-Mexico relations; |
• | theft or vandalism of our revenue equipment; and |
• | social, political, and economic instability. |
In addition, if we are unable to maintain our Free and Secure Trade ("FAST"), Business Alliance for Secure Commerce ("BASC"), and C-TPAT status, we may have significant border delays. This could cause our Mexican operations to be less efficient than those of competing capacity providers that have FAST, BASC, and C-TPAT status and operate in Mexico. We also face additional risks associated with our foreign operations, including restrictive trade policies and duties, taxes, or government royalties imposed by the Mexican government, to the extent not preempted by the terms of the North American Free Trade Agreement.
We may not make acquisitions in the future, or if we do, we may not be successful in our acquisition strategy.
Historically, acquisitions were a part of Knight's and Swift's growth strategies. There is no assurance that we will be successful in identifying, negotiating, or consummating any future acquisitions. If we do not make any future acquisitions, our growth rate could be materially and adversely affected. Any future acquisitions we undertake could involve issuing dilutive equity securities or incurring indebtedness. In addition, acquisitions involve numerous risks, any of which could have a materially adverse effect on our business and results of operations, including:
• | the acquired company may not achieve anticipated revenue, earnings, or cash flow; |
• | we may assume liabilities beyond our estimates or what was disclosed to us; |
• | we may be unable to assimilate or integrate the acquired company's operations or assets into our business successfully and realize the anticipated economic, operational, and other benefits in a timely manner, which could result in substantial costs and delays or other operational, technical, or financial problems; |
• | diverting our management's attention from other business concerns; |
• | risks of entering into markets in which we have had no or only limited direct experience; and |
• | the potential loss of customers, key employees, or driving associates of the acquired company. |
We may face business uncertainties related to the 2017 Merger that could adversely affect our businesses and operations.
Uncertainty about the effect of the 2017 Merger and integration of Knight's and Swift's businesses on employees, customers, and driving associates may have an adverse effect on us. These uncertainties may impair our ability to attract, retain, and motivate personnel for a period of time following the 2017 Merger, and could cause customers and others who formerly dealt with Knight and Swift separately to seek to change existing business relationships with us. Employee and driving associate retention may be challenging during the transition period, as employees and driving associates may experience uncertainty about their future roles. If employees or driving associates depart because of issues related to the uncertainty and difficulty of integration or a desire not to remain with us, our business and results of operations could be adversely affected.
Efforts to integrate Knight and Swift businesses may disrupt attention of our management from ongoing business operations.
We expect to continue to expend significant management resources to integrate Knight's and Swift's businesses. Management's attention may be diverted away from our day-to-day operations, as we continue to implement initiatives to improve performance in 2018, and execute existing business plans in an effort to complete the combination. This diversion of management resources could disrupt our operations and may have an adverse effect on our business, financial condition, and results of operations.
20
We may fail to realize all of the anticipated benefits of the 2017 Merger or those benefits may take longer to realize than expected. We may also encounter significant difficulties in integrating Knight's and Swift's businesses.
Our ability to realize the anticipated benefits of the 2017 Merger will depend, to a large extent, on our ability to operate the Knight and Swift businesses together in a manner that realizes anticipated synergies. In order to achieve these expected benefits, we must successfully operate the businesses of Knight and Swift without adversely affecting current revenues and investments in future growth. If we are unable to successfully achieve these objectives, the anticipated benefits of the 2017 Merger may not be realized fully or at all or may take longer to realize than expected.
In connection with the 2017 Merger, Knight and Swift prepared and considered internal financial forecasts for Knight and Swift. These financial projections included assumptions regarding future operating cash flows, expenditures, and income of Knight and Swift. These financial projections were not prepared with a view to public disclosure, are subject to significant economic, competitive, industry, and other uncertainties, and may not be achieved in full, at all, or within projected timeframes. The failure of Knight or Swift to achieve projected results could have a material adverse effect on the market price of our Class A common stock, our financial position, and our ability to pay dividends in the future.
In addition, the continued operation of two independent businesses within one company is a complex, costly, and time-consuming process. As a result, we will be required to devote significant management attention and resources to coordinating their business practices and operations. This process may disrupt the businesses. The failure to meet the challenges involved in operating the two businesses within one company and to realize the anticipated benefits of the 2017 Merger could cause an interruption of, or a loss of momentum in, our activities and could adversely affect our results of operations. The integration of Knight's and Swift's businesses may also result in material unanticipated problems, expenses, liabilities, competitive responses, and loss of customer and other business relationships or other adverse reactions. The difficulties of combining the operations of the companies include, among others:
• | difficulties in integrating functions, personnel, and systems; |
• | challenges in conforming standards, controls, procedures, and accounting and other policies, business cultures, and compensation structures between the two companies; |
• | difficulties in integrating the internal controls over financial reporting of Swift into our internal controls; |
• | difficulties in assimilating driving associates and employees and in attracting and retaining key personnel; |
• | challenges in retaining existing customers and obtaining new customers; |
• | difficulties in achieving anticipated cost savings, synergies, business opportunities, and growth prospects from the combination; |
• | difficulties in managing multiple brands under a significantly larger and more complex company; |
• | contingent liabilities that are larger than expected; and |
• | potential unknown liabilities, adverse consequences, and unforeseen increased expenses associated with the 2017 Merger. |
Many of these factors are outside of our control and any one of them could result in increased costs, decreased expected revenues and diversion of management time and energy, which could materially impact our business, financial condition, and results of operations. In addition, even if the businesses of Knight and Swift are operated successfully within one company, the full benefits of the transaction may not be realized, including the synergies that are expected. These benefits may not be achieved within the anticipated time frame, or at all. Further, additional unanticipated costs may be incurred in operating the businesses of Knight and Swift. Additionally, given the timing of the 2017 Merger and the relative size of and complexity of Swift, our management's annual report on our internal control over financial reporting and our independent registered public accounting firm's attestation report on the effectiveness of our internal control over financial reporting for 2017 excludes Swift's internal controls over financial reporting. All of these factors could cause dilution to our earnings per share, decrease or delay the expected accretive effect of the 2017 Merger and negatively impact the market price of our Class A common stock. As a result, it cannot be assured that the combination of Knight and Swift will result in the realization of the full benefits anticipated from the 2017 Merger within the anticipated time frames, or at all.
We may continue to incur direct and indirect costs as a result of the 2017 Merger.
We may continue to incur expenses in connection with and as a result of consummating the 2017 Merger and in connection with coordinating and, in certain cases, combining the businesses, operations, and policies and procedures of Knight and Swift. The expenses that may be incurred, by their nature, are difficult to estimate accurately. These expenses may exceed the costs historically borne by Knight and Swift. These costs could adversely affect our financial condition and results of operations.
21
Operational Risk |
We may not grow substantially in the future and we may not be successful in sustaining or improving our profitability.
There is no assurance that in the future, our business will grow substantially or without volatility, nor can we assure you that we will be able to effectively adapt our management, administrative, and operational systems to respond to any future growth. Furthermore, there is no assurance that our operating margins will not be adversely affected by future changes in and expansion of our business or by changes in economic conditions or that we will be able to sustain or improve our profitability in the future.
We have terminals throughout the United States that serve markets in various regions. These operations require the commitment of additional personnel and revenue equipment, as well as management resources, for future development. Should the growth in our operations stagnate or decline, our results of operations could be adversely affected. If we expand, it may become more difficult to identify large cities that can support a terminal, and we may expand into smaller cities where there is insufficient economic activity, fewer opportunities for growth, and fewer driving non-driving associates to support the terminal. We may encounter operating conditions in these new markets, as well as our current markets, that differ substantially from our current operations, and customer relationships and appropriate freight rates in new markets could be challenging to attain. We may not be able to duplicate or sustain our operating strategy successfully throughout, or possibly outside of, the United States, and establishing terminals and operations in new markets could require more time or resources, or a more substantial financial commitment than anticipated.
Furthermore, the continued progression and development of our brokerage and logistics businesses are subject to the risks inherent in entering and cultivating new lines of business, including, but not limited to, (1) initial unfamiliarity with pricing, service, operational, and liability issues; (2) customer relationships may be difficult to obtain or we may have to reduce rates to gain and develop customer relationships; (3) specialized equipment and information and management systems technology may not be adequately utilized; (4) insurance and claims may exceed our past experience or estimations; and (5) we may be unable to recruit and retain qualified personnel and management with requisite experience or knowledge of our brokerage and logistics services.
We derive a significant portion of our revenues from our major customers, the loss of one or more of which could have a materially adverse effect on our business.
We strive to maintain a diverse customer base; however, a significant portion of our operating revenue is generated from a number of major customers, the loss of one or more of which could have a materially adverse effect on our business. Refer to Part I, Item 1, "Business" for information regarding our customer concentrations. Aside from our dedicated operations, we generally do not have long-term contractual relationships or rate agreements or minimum volume guarantees with our customers. Furthermore, certain of the long-term contracts in our dedicated operations are subject to cancellation. Accordingly, we cannot assure you that our customer relationships will continue as presently in effect or that we will receive our current customer rate or volume levels in the future.
Economic conditions and capital markets may adversely affect our customers and their ability to remain solvent. Retail and discount retail customers account for a substantial portion of our freight. Accordingly, our results may be more susceptible to trends in unemployment and retail sales than carriers that do not have this concentration.
While we review and monitor the financial condition of our key customers on an ongoing basis to determine whether to provide services on credit, our customers' financial difficulties could nevertheless negatively impact our results of operations and financial condition, especially if these customers were to delay or default on payments to us. For our multi-year and dedicated contracts, the rates we charge may not remain advantageous. A reduction in or termination of our services by one or more of our major customers could have a materially adverse effect on our business and results of operations.
Difficulty in obtaining goods and services from our vendors and suppliers could adversely affect our business.
We are dependent upon our vendors and suppliers for certain products and materials. We believe that we have positive vendor and supplier relationships and are generally able to obtain favorable pricing and other terms from such parties. If we fail to maintain amenable relationships with our vendors and suppliers, or if our vendors and suppliers are unable to provide the products and materials we need or undergo financial hardship, we could experience difficulty in obtaining needed goods and services because of production interruptions, limited material availability, or other reasons. Subsequently, our business and operations could be adversely affected.
We depend on third-party capacity providers, and service instability from these transportation providers could increase our operating costs, reduce our ability to offer intermodal and brokerage services, and limit growth in our brokerage and logistics operations, which could adversely affect our revenue, results of operations, and customer relationships.
Our intermodal operations use railroads and some third-party drayage carriers to transport freight for our customers, and intermodal dependence on railroads could increase as intermodal services expand. In certain markets, rail service is limited to a few railroads or even a single railroad. Recently, many intermodal providers experienced poor service from providers of rail-based services. Our ability to provide intermodal services in certain traffic lanes would be reduced or eliminated if the railroads' services became unstable. Railroads with which we have, or in the future may have, contractual relationships could reduce their services in the future, which could increase the cost of the rail-based services we provide and could reduce the reliability, timeliness, efficiency, and overall
22
attractiveness of our rail-based intermodal services. Furthermore, railroads increase shipping rates as market conditions permit. Price increases could result in higher costs to us, which we may be unable to pass on to our customers and could result in the reduction or elimination of our ability to offer intermodal services. In addition, we may not be able to negotiate additional contracts with railroads to expand our capacity, add additional routes, obtain multiple providers, or obtain railroad services at current cost levels, any of which could limit our ability to provide this service. Our intermodal operations could also be adversely affected by a work stoppage at one or more railroads or by adverse weather conditions or other factors that hinder the railroads' ability to provide reliable service.
Our brokerage and logistics operations are dependent upon the services of third-party capacity providers, including other capacity providers. These third-party providers may seek other freight opportunities and may require increased compensation in times of improved freight demand or tight truckload capacity. Our third-party capacity providers may also be affected by certain factors to which our driving associates and independent contractors are subject, including, but not limited to, changing workforce demographics, alternative employment opportunities, varying freight market conditions, trucking industry regulations, and limited availability of equipment financing. Most of our third-party capacity provider transportation services contracts are cancelable on 30 days' notice or less. If we are unable to secure the services of these third-parties, or if we become subject to increases in the prices we must pay to secure such services, and we are not able to obtain corresponding customer rate increases, our business, financial condition, and results of operations may be materially adversely affected.
If we are unable to recruit, develop, and retain our key employees, our business, financial condition, and results of operations could be adversely affected.
We are highly dependent upon the services of certain key employees, including, but not limited to, our team of executive officers and terminal managers. We believe our team of executive officers possesses valuable knowledge about the trucking industry and their knowledge of and relationships with our key customers and vendors would be difficult to replicate. We currently do not have employment agreements with most of our key employees or executive officers, and the loss of any of their services or inadequate succession planning could negatively impact our operations and future profitability. Additionally, because of our regional operating strategy, we must continue to recruit, develop, and retain skilled and experienced terminal managers. Failure to recruit, develop, and retain a core group of terminal managers could have an adverse effect on our results of operations.
Increases in driving associate compensation or difficulties attracting and retaining qualified driving associates could have a materially adverse effect on our profitability and the ability to maintain or grow our fleet.
With respect to our trucking services, difficulty in attracting and retaining sufficient numbers of qualified driving associates, which includes the engagement of independent contractors, in our truckload operations, and third-party capacity providers in our brokerage and logistics operations, could have a materially adverse effect on our growth and profitability. The truckload transportation industry is subject to a shortage of qualified driving associates. Such shortage is exacerbated during periods of economic expansion, in which alternative employment opportunities are more plentiful and freight demand increases, or during periods of economic downturns, in which unemployment benefits might be extended and financing is limited for independent contractors who seek to purchase equipment or for students who seek financial aid for driving school. Regulatory requirements, including those related to safety ratings, ELDs, hours-of-service changes, and drug and alcohol testing, could further reduce the number of eligible driving associates or force us to increase driving associate compensation to attract and retain driving associates. We have seen evidence that stricter hours-of-service regulations adopted by the DOT in the past have tightened, and to the extent new regulations are enacted, may continue to tighten, the market for eligible driving associates. We believe the required implementation of ELDs has tightened and may further tighten the market. We believe the shortage of qualified driving associates and intense competition for driving associates from other trucking companies will create difficulties in maintaining or increasing the number of driving associates and may restrain our ability to engage a sufficient number of driving associates and independent contractors; our inability to do so may negatively affect our operations. Further, the compensation we offer our driving associates and independent contractor expenses are subject to market conditions. We have increased these rates in recent years and we may find it necessary to increase driving associate and independent contractor contracted rates in future periods.
Our independent contractors and third-party capacity providers are responsible for paying for their own equipment, fuel, and other operating costs, and significant increases in these costs could cause them to seek higher contracted rates from us or seek other opportunities within or outside the trucking industry. In addition, we and many others suffer from a high turnover rate of driving associates and independent contractors. This high turnover rate requires us to continually recruit a substantial number of driving associates and independent contractors in order to operate existing revenue equipment and maintain our independent contractor fleet. If we are unable to continue to attract and contract with driving associates, independent contractors, and third-party capacity providers, we could be forced to, among other things, limit our growth, decrease the number of our tractors in service, adjust our driving associate compensation package or independent contractor contracted rates, or pay higher rates to third-party capacity providers, which could adversely affect our profitability and results of operations if not offset by a corresponding increase in customer rates.
23
Our contractual agreements with independent contractors expose us to risks that we do not face with our company driving associates.
Our financing subsidiaries offer financing to some of the independent contractors we contract with to purchase or lease tractors from us. If these independent contractors default or experience a lease termination in conjunction with these agreements and we cannot replace them, we may incur losses on amounts owed to us. Also, if liquidity constraints or other restrictions prevent us from providing financing to the independent contractors we contract with in the future, then we could experience a shortage of independent contractors.
Pursuant to our fuel reimbursement program with independent contractors, when fuel prices increase above a certain level, we share the cost with the independent contractors we contract with in order to mute the impact that increasing fuel prices may have on their business operations. A significant increase or rapid fluctuation in fuel prices could cause our reimbursement costs under this program to be higher than the revenue we receive from our customers under our fuel surcharge programs.
Independent contractors are third-party service providers, as compared to company driving associates, who are employed by us. As independent business owners, the independent contractors we contract with may make business or personal decisions that conflict with our best interests. For example, if a load is unprofitable, route distance is too far from home, personal scheduling conflicts arise, or for other reasons, independent contractors may deny loads of freight from time-to-time. In these circumstances, we must be able to timely deliver the freight in order to maintain relationships with customers.
We are dependent on management information and communications systems, and significant systems disruptions could adversely affect our business.
Our business depends on the efficient, stable, and uninterrupted operation of our management information and communications systems. Some of our key software, hardware systems, and infrastructure were developed internally or by adapting purchased software applications and hardware to suit our needs. Our management information and communication systems are used in various aspects of our business, including but not limited to load planning and receiving, dispatch of driving associates and third-party capacity providers, customer billing, producing productivity, financial and other reports, and other general functions and purposes. If any of our critical information or communications systems fail or become unavailable, we could have to perform certain functions manually, which could temporarily affect the efficiency and effectiveness of our operations. Our operations and those of our technology and communications service providers are vulnerable to interruption by natural disaster, fire, power loss, telecommunications failure, terrorist attacks, internet failures, computer viruses, malware, hacking, and other events beyond our control. More sophisticated and frequent cyber-attacks in recent years have also increased security risks associated with information technology systems. We maintain information security policies to protect our information, computer systems, and data from cyber security threats, breaches, and other such events. We currently maintain our primary computer hardware systems at Knight's and Swift's headquarters, both located in Phoenix, Arizona, along with computer equipment at each of our terminals. In an attempt to reduce the risk of disruption to our business operations should a disaster occur, we have redundant computer systems and networks and the capability to deploy these back-up systems from an off-site alternate location. We believe that any such disruption would be minimal, moderate, or temporary. However, we cannot predict the likelihood or extent to which such alternate location or our information and communication systems would be affected. Our business and operations could be adversely affected in the event of a system failure, disruption, or security breach that causes a delay, interruption, or impairment of our services and operations.
We receive and transmit confidential data with and among our customers, driving associates, vendors, employees, and service providers in the normal course of business. Despite our implementation of secure transmission techniques, internal data security measures, and monitoring tools, our information and communication systems are vulnerable to disruption of communications with our customers, driving associates, vendors, employees, and service providers and access, viewing, misappropriation, altering, or deleting information in our systems, including customer, driving associate, vendor, employee, and service provider information and our proprietary business information. A security breach could damage our business operations and reputation and could cause us to incur costs associated with repairing our systems, increased security, customer notifications, lost operating revenue, litigation, regulatory action, and reputational damage.
Seasonality and the impact of weather and other catastrophic events affect our operations and profitability.
Our tractor productivity decreases during the winter season because inclement weather impedes operations, and some shippers reduce their shipments after the winter holiday season. Revenue can be affected by bad weather and holidays, since revenue is directly related to available working days of shippers. At the same time, operating expenses increase because of harsh weather creating higher accident frequency, increased claims, and more equipment repairs, and fuel efficiency declines because of increased engine idling. In addition, some of our customers demand additional capacity during the fourth quarter, which could limit our ability to take advantage of more attractive spot market rates that generally exist during such periods. Further, despite our efforts to meet such demands, we may fail to do so, which may result in lost future business opportunities with such customers, which could have an adverse effect on our operations. We may also suffer from weather-related or other unforeseen events such as tornadoes, hurricanes, blizzards, ice storms, floods, fires, earthquakes, and explosions. These events may disrupt fuel supplies, increase fuel costs, disrupt freight shipments or routes, affect regional economies, destroy our assets, or adversely affect the business or financial condition of our customers, any of which could have a materially adverse effect on our results of operations or make our results of operations more volatile.
24
Insurance and claims expenses could significantly reduce our earnings.
Our future insurance and claims expense might exceed historical levels, which could reduce our earnings. We self-insure or insure through our captive insurance companies a significant portion of our claims exposure resulting from workers' compensation, auto liability, general liability, cargo and property damage claims, as well as Knight's employee health insurance, which could increase the volatility of, and decrease the amount of, our earnings, and could have a materially adverse effect on our results of operations. Prior to the 2017 Merger, Knight's auto liability self-insured retention was $1.0 million per occurrence and Swift's was $10.0 million per occurrence. Such self-insured retention levels continue at our Knight and Swift businesses following the 2017 Merger. Higher self-insured retention levels may increase the impact of auto liability occurrences on our results of operations. We are also responsible for our legal expenses relating to such claims. We reserve for anticipated losses and expenses and periodically evaluate and adjust our claims reserves to reflect our experience. Estimating the number and severity of claims, as well as related judgment or settlement amounts, is inherently difficult. This, along with legal expenses, incurred but not reported claims, and other uncertainties can cause unfavorable differences between actual self-insurance costs and our reserve estimates. Accordingly, ultimate results may differ from our estimates, which could result in losses over our reserved amounts.
We maintain insurance with licensed insurance carriers above the amounts in which we self-insure. Although we believe our aggregate insurance limits should be sufficient to cover reasonably expected claims, it is possible that the amount of one or more claims could exceed our aggregate coverage limits. If any claim were to exceed our coverage, we would bear the excess, in addition to our other self-insured amounts. Insurance carriers have raised premiums for many businesses, including transportation companies. As a result, our insurance and claims expense could increase, or we could raise our self-insured retention when our policies are renewed or replaced. Our results of operations and financial condition could be materially and adversely affected if (1) cost per claim, premiums, or the number of claims significantly exceeds our coverage limits or retention amounts; (2) we experience a claim in excess of our coverage limits; (3) our insurance carriers fail to pay on our insurance claims; or (4) we experience a claim for which coverage is not provided.
Healthcare legislation and inflationary cost increases also could negatively impact financial results by increasing annual employee healthcare costs. We cannot presently determine the extent of the impact such increased healthcare costs will have on our financial performance. In addition, rising healthcare costs could force us to make changes to existing benefit programs, which could negatively impact our ability to attract and retain employees.
Insuring risk through our captive insurance companies could adversely impact our operations.
We insure a portion of our risk through our captive insurance companies, Mohave and Red Rock. In addition to insuring portions of our own risk, Mohave provides reinsurance coverage to third-party insurance companies associated with our affiliated companies' independent contractors. Red Rock insures a share of our automobile liability risk. The insurance and reinsurance markets are subject to market pressures. Our captive insurance companies' abilities or needs to access the reinsurance markets may involve the retention of additional risk, which could expose us to volatility in claims expenses.
To comply with certain state insurance regulatory requirements, cash and cash equivalents must be paid to Red Rock and Mohave as capital investments and insurance premiums, to be restricted as collateral for anticipated losses. The restricted cash is used for payment of insured claims. In the future, we may continue to insure our automobile liability risk through our captive insurance subsidiaries, which will cause increases in the required amount of our restricted cash or other collateral, such as letters of credit. Significant increases in the amount of collateral required by third-party insurance carriers and regulators would reduce our liquidity.
25
Compliance Risk |
We operate in a highly regulated industry, and changes in existing regulations or violations of existing or future regulations could have a materially adverse effect on our operations and profitability.
We have authority to operate in the United States, as granted by the DOT, Mexico (as granted by the Secretaría de Comunicaciones y Transportes), and various Canadian provinces (as granted by the Ministries of Transportation and Communication in such provinces). In the United States, we are also regulated by the EPA, United States Department of Homeland Security, and other agencies in states in which we operate. Our company driving associates, independent contractors, and third-party capacity providers also must comply with the applicable safety and fitness regulations of the DOT, including those relating to drug and alcohol testing, driver safety performance, and hours-of-service. Matters such as weight, equipment dimensions, exhaust emissions, and fuel efficiency are also subject to government regulations. We also may become subject to new or more restrictive regulations relating to fuel efficiency, exhaust emissions, hours-of-service, drug and alcohol testing, ergonomics, on-board reporting of operations, collective bargaining, security at ports, speed limiters, driver training, and other matters affecting safety or operating methods. Future laws and regulations may be more stringent, require changes in our operating practices, influence the demand for transportation services, or require us to incur significant additional costs. Higher costs incurred by us, or by our suppliers who pass the costs onto us through higher supplies and materials pricing, could adversely affect our results of operations. In addition, the Trump administration has indicated a desire to reduce regulatory burdens that constrain growth and productivity, and also to introduce legislation such as infrastructure spending, that could improve growth and productivity. Changes in regulations, such as those related to trailer size and gross vehicle weight limits, hours-of-service, mandating ELDs, and drug and alcohol testing, could increase capacity in the industry or improve the position of certain competitors, either of which could negatively impact pricing and volumes, or require additional investments by us. The short and long term impacts of changes in legislation or regulations are difficult to predict and could materially adversely affect our operations.
Our lease contracts with independent contractors are governed by federal leasing regulations, which impose specific requirements on us and the independent contractors. In the past, Swift has been the subject of lawsuits, alleging violations of lease agreements or failure to follow the contractual terms, some of which resulted in adverse decisions against Swift. We could be subjected to similar lawsuits and decisions in the future, which if determined adversely to us, could have an adverse effect on our financial condition.
In December 2016, the FMCSA established new minimum training standards for certain individuals applying for (or upgrading) a Class A or Class B commercial driver's license, or obtaining a hazardous materials, passenger, or school bus endorsement on their commercial driver's license for the first time. These individuals must complete a prescribed program of theory and behind-the wheel instruction. The final rule requires that behind-the-wheel proficiency of an entry-level truck driver be determined solely by the instructor's evaluation of how well the driver-trainee performs the fundamental vehicle controls skills and driving procedures set forth in the curricula, but does not have a minimum training hours requirement, as proposed by the FMCSA earlier in 2016. The final rule went into effect in February 2017, with a compliance date of February 7, 2020. Upon the compliance date, training schools, including the driving academies we operate, will be required to register with the FMCSA's Training Provider Registry and certify that their program meets the classroom and driving standards.
"Regulation" in Part I, Item 1 of this Annual Report, discusses in detail several proposed, pending, suspended, and final regulations that could materially impact our business and operations.
The CSA program adopted by the FMCSA could adversely affect our profitability and operations, our ability to maintain or grow our fleet, and our customer relationships.
Under CSA, fleets are evaluated and ranked against their peers based on certain safety-related standards. As a result, our fleet could be ranked poorly as compared to our peer carriers. We recruit and retain first-time driving associates to be part of our fleet, and these driving associates may have a higher likelihood of creating adverse safety events under CSA. The occurrence of future deficiencies could affect driving associate recruitment by causing high-quality driving associates to seek employment with other carriers or limit the pool of available driving associates or could cause our customers to direct their business away from us and to carriers with higher fleet safety rankings, either of which would adversely affect our business, financial condition and results of operations. Additionally, competition for driving associates with favorable safety backgrounds may increase, which could necessitate increases in driving associate-related compensation costs. Further, we may incur greater than expected expenses in our attempts to improve unfavorable scores.
In December 2015, Congress passed a new highway funding bill called Fixing America's Surface Transportation Act (the "FAST Act"), which calls for significant CSA reform. The FAST Act directs the FMCSA to conduct studies of the scoring system used to generate CSA rankings to determine if it is effective in identifying high-risk carriers and predicting future crash risk. This study was conducted and delivered to the FMCSA in June 2017 with several recommendations to make the CSA program more fair, accurate, and reliable. The FMCSA is expected to provide its report to Congress outlining the changes it will make to the CSA program in response to the study. It is unclear if, when, and to what extent any such changes will occur. However, any changes that increase the likelihood of us receiving unfavorable scores could adversely affect our results of operations and profitability.
26
Receipt of an unfavorable DOT safety rating could have a materially adverse effect on our operations and profitability.
Each of our subsidiaries with a DOT-issued operating authority currently has a satisfactory DOT rating, which is the highest available rating under the current safety rating scale. If we were to receive a conditional or unsatisfactory DOT safety rating, it could materially adversely affect our business, financial condition, and results of operations, as customer contracts may require a satisfactory DOT safety rating, and a conditional or unsatisfactory rating could materially adversely affect or restrict our operations.
The FMCSA has proposed regulations that would modify the existing rating system and the safety labels assigned to motor carriers evaluated by the DOT. Under regulations that were proposed in 2016, the methodology for determining a carrier's DOT safety rating would be expanded to include the on-road safety performance of the carrier's drivers and equipment, as well as results obtained from investigations. Exceeding certain thresholds based on such performance or results would cause a carrier to receive an unfit safety rating. The proposed regulations were withdrawn in March 2017, but the FMCSA noted that a similar process may be initiated in the future. If similar regulations were enacted and we were to receive an unfit or other negative safety rating, our business would be materially adversely affected in the same manner as if we received a conditional or unsatisfactory safety rating under the current regulations. In addition, poor safety performance could lead to increased risk of liability, increased insurance, maintenance and equipment costs, and potential loss of customers, which could materially adversely affect our business, financial condition, and results of operations.
Compliance with various environmental laws and regulations to which our operations are subject may increase our costs of operations, and non-compliance with such laws and regulations could result in substantial fines or penalties.
In addition to direct regulation by the DOT and related agencies, we are subject to various federal, state, and local environmental laws and regulations dealing with the transportation, storage, discharge, presence, use, disposal, and handling of hazardous materials, wastewater, storm water, waste oil, and fuel storage tanks. We are also subject to various environmental laws and regulations involving air emissions from our equipment and facilities, and discharge and retention of storm water. Our terminals often are located in industrial areas where groundwater or other forms of environmental contamination may have occurred or could occur. Our operations involve the risks of fuel spillage or seepage, environmental damage, and hazardous waste disposal, among others. Certain of our facilities have waste oil or fuel storage tanks and fueling islands. A small percentage of our freight consists of low-grade hazardous substances, which subjects us to a wide array of regulations. We have instituted programs to monitor and control environmental risks and promote compliance with applicable environmental laws and regulations; however, if (1) we are involved in a spill or other accident involving hazardous substances; (2) there are releases of hazardous substances we transport; (3) soil or groundwater contamination is found at our facilities or results from our operations; or (4) we are found to be in violation of or fail to comply with applicable environmental laws or regulations, then we could be subject to clean-up costs and liabilities, including substantial fines or penalties or civil and criminal liability, any of which could have a materially adverse effect on our business and results of operations.
Certain of our terminals are located on or near environmental Superfund sites designated by the EPA and/or state environmental authorities. We have not been identified as a potentially responsible party with regard to any such site. Nevertheless, we could be deemed responsible for clean-up costs.
In addition, tractors and trailers used in our truckload operations have been and are affected by federal, state, and local statutory and regulatory requirements related to air emissions and fuel efficiency, including rules established in 2011 and 2016 by the National Highway Traffic Safety Administration and the EPA and certain states for stricter fuel efficiency standards for heavy trucks, described in detail in "Regulation" in Part I, Item 1 of this Annual Report. In order to reduce exhaust emissions and traffic congestion, some states and municipalities have restricted the locations and amount of time where diesel-powered tractors, such as ours, may idle or travel. These and other similar restrictions could cause us to alter our drivers' behavior and routes, purchase additional auxiliary or other on-board power units to replace or minimize engine power and idling, or experience decreases in productivity. Our tractors and trailers could also be adversely affected by related or similar legislative or regulatory actions in the future.
Developments in labor and employment law and any unionizing efforts by employees could have a materially adverse effect on our results of operations.
Although our only collective bargaining agreement exists at our Mexican subsidiary, Trans-Mex, we always face the risk that our employees will try to unionize. Congress, federal agencies, or one or more states could adopt legislation or regulations significantly affecting our business and our relationship with our employees, such as the previously proposed federal legislation referred to as the "Employee Free Choice Act" that would substantially liberalize the procedures for union organizing. Any attempt to organize by our employees could result in increased legal and other associated costs. Additionally, given the National Labor Relations Board's "speedy election" rule, it would be difficult to timely and effectively address any unionizing efforts. If we entered into a collective bargaining agreement with our domestic employees, the terms could materially adversely affect our costs, efficiency, and ability to generate acceptable returns on the affected operations. If the independent contractors we contract with were ever re-classified as employees, the magnitude of this risk would increase.
In addition, the Department of Labor ("DOL") issued a final rule in 2016 raising the minimum salary basis for executive, administrative, and professional exemptions from overtime payment. The rule increases the minimum salary from the current amount of $23,660 to $47,476 and up to 10% of non-discretionary bonus, commission, and other incentive payments can be counted towards the minimum salary requirement. The rule was scheduled to go into effect on December 1, 2016. However, the rule was temporarily
27
enjoined from going into effect in November 2016, and later invalidated in August 2017, after several states and business groups filed separate lawsuits against the DOL challenging the rule. However, any similar future rule that impacts the way we classify certain positions, increases our payment of overtime wages, or increases the salaries we pay to currently exempt employees to maintain their exempt status, may have an adverse effect on our business, financial condition, and results of operations.
In May 2015, the Supreme Court of the United States refused to grant certiorari to appellees in the United States Court of Appeals for the Ninth Circuit case, Dilts et al. v. Penske Logistics, LLC, et al. Consequently, the Appeals Court decision stands, holding that California state wage and hour laws are not preempted by federal law. As a result, the trucking industry has been confronted with a patchwork of state and local laws, related to employee rest and meal breaks. Further, driver piece rate compensation, which is an industry standard, has been attacked as non-compliant with state minimum wage laws. Both of these issues are adversely impacting us and the industry as a whole, with respect to the practical application of the laws, thereby resulting in additional cost. In our individual capacity, as well as participating with industry trade organizations, we support and actively pursue legislative relief through Congress. Federal legislation has been proposed that would clarify the preemptive scope of federal transportation law and regulations, as originally contemplated by Congress. We believe enacting such legislation would eliminate much of the current wage and hour confusion along with lessening the burden on interstate commerce. However, the passage of such proposed federal legislation is uncertain. Existing state and local laws, as well as new laws adopted in the future, which are not preempted by federal law, may result in increased labor costs, driving associate turnover, reduced operational efficiencies, and amplified legal exposure.
If our independent contractors are deemed by regulators or judicial process to be employees, our business, financial condition, and results of operations could be adversely affected.
Tax and other regulatory authorities, as well as independent contractors themselves, have increasingly asserted that independent contractors in the trucking industry are employees rather than independent contractors for a variety of purposes, including income tax withholding, workers' compensation, wage and hour compensation, unemployment, and other issues. Federal legislators have introduced legislation in the past to make it easier for tax and other authorities to reclassify independent contractors as employees, including legislation to increase the recordkeeping requirements for those that engage independent contractors and to increase the penalties of companies who misclassify their employees as independent contractors and are found to have violated employees' overtime and/or wage requirements. Additionally, federal legislators have sought to abolish the current safe harbor allowing taxpayers meeting certain criteria to treat individuals as independent contractors if they are following a long-standing, recognized practice, extend the FLSA to independent contractors, and impose notice requirements based upon employment or independent contractor status and fines for failure to comply. Some states adopted initiatives to increase their revenues from items such as unemployment, workers' compensation, and income taxes, and a reclassification of independent contractors as employees would help states with these initiatives. Taxing and other regulatory authorities and courts apply a variety of standards in their determination of independent contractor status. In addition, carriers such as us that operate or have operated lease-purchase programs have been more susceptible to lawsuits seeking to reclassify independent contractors that have engaged in such programs. If the independent contractors we engage were determined to be our employees, we would incur additional exposure under federal and state tax, workers' compensation, unemployment benefits, labor, employment, insurance, discrimination, and tort laws, including for prior periods, as well as potential liability for employee benefits and tax withholdings. Furthermore, if independent contractors were deemed employees, then certain of our third-party revenue sources, including shop and insurance margins, would be eliminated.
We are party to class actions from time-to-time alleging violations of the FLSA and other state and federal laws and seeking to reclassify independent contractors as employees. Adverse decisions on these or similar matters could adversely affect our results of operations and profitability, particularly if a decision results in exposure that exceeds our related accrual.
Litigation may adversely affect our business, financial condition, and results of operations.
Our business is subject to the risk of litigation by employees, independent contractors, customers, vendors, government agencies, stockholders, and other parties through private actions, class actions, administrative proceedings, regulatory actions, and other processes. Recently, trucking companies, including us, have been subject to lawsuits, including class action lawsuits, alleging violations of various federal and state wage and hour laws regarding, among other things, employee meal breaks, rest periods, overtime eligibility, and failure to pay for all hours worked. A number of these lawsuits have resulted in the payment of substantial settlements or damages by the defendants.
The outcome of litigation, particularly class action lawsuits and regulatory actions, is difficult to assess or quantify, and the magnitude of the potential loss relating to such lawsuits may remain unknown for substantial periods of time. The cost to defend litigation may also be significant. Not all claims are covered by our insurance, and there can be no assurance that our coverage limits will be adequate to cover all amounts in dispute. To the extent we experience claims that are uninsured, exceed our coverage limits, involve significant aggregate use of our self-insured retention amounts, or cause increases in future premiums, the resulting expenses could have a materially adverse effect on our business, results of operations, financial condition, or cash flows.
28
Our captive insurance companies are subject to substantial government regulation.
Our captive insurance companies are regulated by state authorities. State regulations generally provide protection to policy holders, rather than stockholders, and generally involve:
• | approval of premium rates for insurance; |
• | standards of solvency; |
• | minimum amounts of statutory capital surplus that must be maintained; |
• | limitations on types and amounts of investments; |
• | regulation of dividend payments and other transactions between affiliates; |
• | regulation of reinsurance; |
• | regulation of underwriting and marketing practices; |
• | approval of policy forms; |
• | methods of accounting; and |
• | filing of annual and other reports with respect to financial condition and other matters. |
These regulations may increase our costs of regulatory compliance, limit our ability to change premiums, restrict our ability to access cash held in our captive insurance companies, and otherwise impede our ability to take actions we deem advisable.
Uncertainties in the interpretation and application of the Tax Cuts and Jobs Act could materially affect our tax obligations and effective tax rate.
On December 22, 2017, the US enacted significant changes to its tax law following the passage of the Tax Cuts and Jobs Act. The new law requires complex computations not previously required by US tax law. As such, the application of accounting guidance for such items is currently uncertain. Further, compliance with the new law and the accounting for such provisions requires preparation and analysis of information not previously required or regularly produced. In addition, the US Department of Treasury has broad authority to issue regulations and interpretative guidance that may significantly impact how we will apply the law and impact our results of operations in future periods. Accordingly, while we have provided a provisional estimate on the effect of the new law in our consolidated financial statements, further regulatory or GAAP accounting guidance for the law, our further analysis on the application of the law, and refinement of our initial estimates and calculations could materially change our current provisional estimates, which could in turn materially affect our tax obligations and effective tax rate. There are also likely to be significant future impacts that these tax reforms will have on our future financial results and our business strategies. In addition, there is a risk that states or foreign jurisdictions may amend their tax laws in response to these tax reforms, which could have a material impact on our future results.
Financial Risk |
We have significant ongoing capital requirements that could affect our profitability if we are unable to generate sufficient cash from operations and obtain financing on favorable terms.
The truckload industry and our truckload operations are capital intensive, and our policy of operating newer equipment requires us to expend significant amounts annually. We expect to pay for projected capital expenditures primarily with cash flows from operations and borrowings under the Revolver. If these sources were insufficient to meet our capital expenditure needs, we would need to seek alternative sources of capital, including additional borrowing or equity capital. In the event that we are unable to generate sufficient cash from operations, maintain compliance with financial and other covenants in our financing agreements, or obtain equity capital or financing on favorable terms in the future, we may have to limit our fleet size, enter into less favorable financing, or operate our revenue equipment for longer periods, any of which could have a materially adverse effect on our operations and profitability.
Credit markets may weaken at some point in the future, which would make it difficult for us to access our current sources of credit and difficult for our lenders to find the capital to fund us. We may need to incur additional debt, or issue debt or equity securities in the future, to refinance existing debt, fund working capital requirements, make investments, or support other business activities. Declines in consumer confidence, decreases in domestic spending, economic contractions, rating agency actions, and other trends in the credit market may impair our future ability to secure financing on satisfactory terms, or at all.
29
Our leverage could adversely affect our ability to raise additional capital to fund our operations, limit our ability to react to changes in the economy or our industry, and prevent us from meeting our debt obligations.
Prior to the 2017 Merger, Knight carried an immaterial amount of long-term debt, while Swift carried a significant amount of long-term debt. Following the 2017 Merger, we continue to carry much of Swift's historical debt, including significant outstanding borrowings on the Term Loan, Revolver, and 2015 RSA. While we believe the combined company is in a better position to service such indebtedness, the indebtedness could place us at a competitive disadvantage compared to our competitors that are less leveraged. This could have negative consequences that include:
• | increased vulnerability to adverse economic, industry, or competitive developments; |
• | cash flows from operations that are committed to payment of principal and interest, thereby reducing our ability to use cash for our operations, capital expenditures, and future business opportunities; |
• | increased interest rates that would affect our variable rate debt; |
• | noncompliance with financial covenants, borrowing conditions, and other debt obligations, which could result in an event of default or (where applicable) cross-default; |
• | non-strategic divestitures or inability to make strategic acquisitions; |
• | lack of financing for working capital, capital expenditures, product development, debt service requirements, and general corporate or other purposes; and |
• | limits on our flexibility to plan for, or react to, changes in our business, market conditions, or in the economy. |
Our debt agreements contain restrictions that limit our flexibility in operating our business.
As detailed in Note 16 to the consolidated financial statements, included in Part II, Item 8 of this Annual Report, our 2017 Debt Agreement requires compliance with various affirmative, negative, and financial covenants. A breach of any of these covenants could result in default or (when applicable) cross-default. Upon default under our 2017 Debt Agreement, the lenders could elect to declare all outstanding amounts to be immediately due and payable, as well as terminate all commitments to extend further credit. Such actions by those lenders could cause cross-defaults with our other debt agreements. If we were unable to repay those amounts, the lenders could use the collateral granted to satisfy all or part of the debt owed to them. If the lenders accelerated our debt repayments, we might not have sufficient assets to repay all amounts borrowed.
In addition, our 2015 RSA includes certain affirmative and negative covenants and cross default provisions with respect to our 2017 Debt Agreement. Failure to comply with these covenants and provisions may jeopardize our ability to continue to sell receivables under the facility and could negatively impact our liquidity.
We could determine that our goodwill and other indefinite-lived intangibles are impaired, thus recognizing a related loss.
As of December 31, 2017, we had goodwill of $2.9 billion and indefinite-lived intangible assets of $1.4 billion primarily from the 2017 Merger. We evaluate our goodwill and indefinite-lived intangible assets for impairment. We could recognize impairments in the future, and we may never realize the full value of our intangible assets. If these events occur, our profitability and financial condition will suffer.
If our investments in entities are not successful or decrease in market value, we may have to write off or lose the value of a portion or all of our investments, which could have a materially adverse effect on our results of operations.
We have invested, either directly or indirectly through one of our wholly owned subsidiaries, in certain entities that make privately negotiated equity investments, and Knight has in the past recorded impairment charges to reflect the other-than-temporary decreases in the fair value of its portfolio. If the financial position of any such entity declines, we could be required to write down all or part of our investment in that entity, which could have a materially adverse effect on our results of operations.
The market price of our Class A common stock could decline due to the large number of outstanding shares of our Class A common stock eligible for future sale.
Sales of substantial amounts of our Class A common stock in the public market, or the perception that these sales could occur, could cause the market price of our Class A common stock to decline. All shares of our outstanding Class A common stock are freely tradable, except that any shares owned by "affiliates" (as that term is defined in Rule 144 under the Securities Act) may only be sold in compliance with the limitations described in Rule 144 under the Securities Act. These sales also could make it more difficult for us to sell equity or equity-related securities in the future at a time and price that we deem appropriate.
In addition, we have an aggregate of 4.0 million shares of Class A common stock reserved for issuance under our compensatory and non-compensatory equity incentive plans. Issuances of Class A common stock to our directors, executive officers, and employees through exercise of stock options under our stock plans, or purchases by our executive officers and employees through our 2012 ESPP, dilute a stockholder's interest in the Company.
30
We may not pay dividends in the future.
Starting in December 2004, and in each consecutive quarter prior to the 2017 Merger, Knight paid a quarterly cash dividend. Prior to the 2017 Merger, Swift did not pay dividends. While it is expected we will pay a quarterly dividend, there is no assurance that we will declare or pay any future dividends or as to the amount or timing of those dividends, if any.
Jerry Moyes and certain of his family members and affiliated entities are significant stockholders and we face certain risks related to their significant ownership and related party transactions with Mr. Moyes.
As of December 31, 2017, Jerry Moyes, together with his family and related entities, beneficially own approximately 24.0% of our outstanding Class A common stock. In addition, Mr. Moyes, together with his family and related entities, have pledged a significant portion of their holdings as collateral for loans and other obligations, including variable prepaid forward contracts, which arrangements could create conflicts of interest and adversely affect or increase volatility in the market price of our Class A common stock. As one of our directors, Mr. Moyes is subject to our stock hedging and pledging policy, which restricts directors and executive officers from engaging in any future pledging or hedging transactions. However, Mr. Moyes, together with his family and related entities, is permitted, notwithstanding this policy, to (1) maintain existing hedging and pledging arrangements and (2) when existing hedging and pledging arrangements become subject to renewal or replacement, hedge or pledge currently hedged or pledged shares and additional shares solely to the extent necessary to renew or replace those existing arrangements. The ability of Mr. Moyes, together with his family and related entities, to hedge and pledge additional shares in connection with any such renewal or replacement could result in the pledging or hedging of a material amount of additional shares. Our stock hedging and pledging policy requires approval of a majority of our directors to be modified. If Mr. Moyes, his family, or related entities were to sell or otherwise transfer all or a large percentage of their holdings (including under circumstances in which they settle these obligations with shares of our Class A common stock or if they default under the pledging arrangements), the market price of our Class A common stock could decline or be volatile.
Mr. Moyes has given personal guarantees to lenders to the various businesses and real estate investments in which he has an ownership interest and, in certain cases, the underlying loans are in default and are in the process of being restructured and/or settled. If Mr. Moyes is otherwise unable to settle or raise the necessary amount of proceeds to satisfy his obligations to such lenders, he may be subject to significant lawsuits and expose his shares of our Class A common stock to creditors.
Mr. Moyes serves as a non-executive Senior Advisor to our Executive Chairman and our Vice Chairman. In this role, Mr. Moyes has access to our Executive Chairman and Vice Chairman, and is better positioned than other stockholders to express his views and opinions regarding our operations and strategic alternatives.
Mr. Moyes and certain of his family members and affiliated entities are contractually obligated to vote shares of our Class A common stock that they hold in excess of 12.5% of our outstanding shares in the manner determined by a voting committee comprised of Mr. Moyes, Kevin Knight, and Gary Knight or their respective appointed successors. However, Mr. Moyes and certain of his family members and affiliated entities are entitled to vote all of their shares of our Class A common stock on any stockholder vote taken to approve a sale of the Company. Consequently, their influence with respect to any such stockholder vote may have the effect of delaying or preventing a change of control, including a merger, consolidation, or other business combination involving us, or discouraging a potential acquirer from making a tender offer or otherwise attempting to obtain control, even if that change of control would benefit our other stockholders.
We engage in various transactions with entities controlled by and/or affiliated with Mr. Moyes. Additionally, some entities controlled by Mr. Moyes and certain members of his family operate in the transportation industry, which may create conflicts of interest or require judgments that are disadvantageous to our stockholders in the event we compete for the same freight or other business opportunities. As a result, Mr. Moyes may have interests that conflict with our stockholders.
Additionally, our amended and restated certificate of incorporation contains provisions that specifically relate to prior approval of related party transactions with Mr. Moyes and certain Moyes-affiliated entities. However, we cannot assure that the policy or these provisions will be successful in eliminating conflicts of interest.
ITEM 1B. | UNRESOLVED STAFF COMMENTS |
None.
31
ITEM 2. | PROPERTIES |
Our Knight and Swift headquarters are both located in Phoenix, Arizona. Including Knight's former headquarters location, which was re-purposed as a regional operations facility, our combined headquarters cover approximately 200 acres, consisting of about 300 thousand square feet of office space, 150 thousand square feet of repair and maintenance facilities, a twenty thousand square-foot driving associates' center and restaurant, an eight thousand square-foot recruiting and training center, a six thousand square-foot warehouse, a 300-space parking structure, as well as two truck wash and fueling facilities.
We have over 80 locations in the United States and Mexico, including our headquarters, terminals, driving academies, and certain other locations, which are included in the table below. Our terminals may include customer service, marketing, fuel, and/or repair facilities, which are used by our trucking, Knight Logistics, Swift Intermodal, and Swift's non-reportable segments. We also own or lease parcels of vacant land, drop yards, and space for temporary trailer storage for ourselves and other carriers, as well as several non-operating facilities, which are excluded from the table below. As of December 31, 2017, our aggregate monthly rent for all leased properties was approximately $0.9 million with varying terms expiring through December 2053. We believe that substantially all of our property and equipment is in good condition and our facilities have sufficient capacity to meet our current needs.
Owned/Leased | Brand | |||||||||||||
Location | Owned | Leased | Knight | Swift | Barr Nunn | Kold Trans | Total | |||||||
Arizona | 4 | 2 | 2 | 4 | ||||||||||
California | 7 | 2 | 3 | 6 | 9 | |||||||||
Colorado | 2 | 1 | 1 | 2 | ||||||||||
Florida | 2 | 1 | 1 | 1 | 1 | 3 | ||||||||
Georgia | 2 | 1 | 1 | 2 | 3 | |||||||||
Idaho | 1 | 2 | 2 | 1 | 3 | |||||||||
Illinois | 2 | 1 | 3 | 3 | ||||||||||
Indiana | 2 | 1 | 1 | 2 | ||||||||||
Iowa | 1 | 1 | 1 | |||||||||||
Kansas | 2 | 1 | 1 | 2 | ||||||||||
Massachusetts | 1 | 1 | 1 | |||||||||||
Mexico | 3 | 3 | 3 | |||||||||||
Michigan | 1 | 1 | 1 | 1 | 2 | |||||||||
Minnesota | 1 | 1 | 1 | |||||||||||
Mississippi | 2 | 2 | 2 | |||||||||||
Missouri | 1 | 1 | 1 | |||||||||||
Nevada | 4 | 2 | 2 | 4 | ||||||||||
New Jersey | 1 | 1 | 1 | |||||||||||
New Mexico | 1 | 1 | 1 | |||||||||||
New York | 1 | 1 | 2 | 2 | ||||||||||
North Carolina | 2 | 1 | 1 | 2 | ||||||||||
Ohio | 2 | 1 | 1 | 1 | 1 | 3 | ||||||||
Oklahoma | 2 | 1 | 1 | 2 | ||||||||||
Oregon | 2 | 1 | 1 | 2 | ||||||||||
Pennsylvania | 2 | 2 | 1 | 2 | 1 | 4 | ||||||||
South Carolina | 1 | 1 | 1 | |||||||||||
South Dakota | 1 | 1 | 1 | |||||||||||
Tennessee | 3 | 1 | 2 | 3 | ||||||||||
Texas | 7 | 1 | 3 | 5 | 8 | |||||||||
Utah | 2 | 1 | 1 | 1 | 1 | 3 | ||||||||
Virginia | 1 | 1 | 1 | |||||||||||
Washington | 2 | 1 | 1 | 2 | ||||||||||
West Virginia | 1 | 1 | 1 | |||||||||||
Wisconsin | 1 | 1 | 1 | |||||||||||
Total Properties | 68 | 16 | 30 | 49 | 4 | 1 | 84 | |||||||
ITEM 3. | LEGAL PROCEEDINGS |
We are party to certain lawsuits in the ordinary course of business. Information about our legal proceedings is included in Note 19 in Part II, Item 8 of this Annual Report and is incorporated by reference herein. Based on management's present knowledge of the facts and (in certain cases) advice of outside counsel, management does not believe that loss contingencies arising from pending matters are likely to have a material adverse effect on the Company's overall financial position, operating results, or cash flows after taking into account any existing accruals. However, actual outcomes could be material to the Company's financial position, operating results, or cash flows for any particular period.
ITEM 4. | MINE SAFETY DISCLOSURES |
Not applicable.
32
PART II | ||||
ITEM 5. | MARKET FOR THE REGISTRANT'S COMMON EQUITY, RELATED STOCKHOLDER MATTERS AND ISSUER PURCHASES OF EQUITY SECURITIES |
Common Stock |
Share prices and dividends are different than the amounts disclosed in our selected financial data in Item 6 and in our consolidated financial statements in Item 8 due to the distinction between legal and accounting acquirer as a result of the reverse merger acquisition with Knight. The information prior to the merger date of September 8, 2017 in Item 5 represents historical Swift amounts as Swift was the legal acquirer.
Our Class A common stock trades on the NYSE under the symbol "KNX". Prior to the completion of the 2017 Merger, shares of Swift Class A common stock traded on the NYSE under the symbol "SWFT" while shares of Knight common stock traded on the NYSE under the symbol "KNX." The following table sets forth the high and low sales prices per share of our Class A common stock as reported on the NYSE for the periods indicated. Due to the "reverse acquisition" nature of the 2017 Merger, historical information below through September 8, 2017, reflects the high and low prices of Swift.
2017 | High | Low | |||||
First quarter (1) | $ | 35.00 | $ | 26.68 | |||
Second quarter (1) | 37.38 | 27.61 | |||||
Third quarter (1) | 44.45 | 34.39 | |||||
Fourth quarter | 44.60 | 37.10 | |||||
2016 | High | Low | |||||
First quarter (1) | $ | 25.92 | $ | 16.31 | |||
Second quarter (1) | 26.56 | 19.88 | |||||
Third quarter (1) | 30.76 | 21.10 | |||||
Fourth quarter (1) | 37.75 | 27.10 | |||||
____________
(1) | Swift's market prices on and prior to September 8, 2017 have been retrospectively adjusted based on the 0.72 reverse stock split completed with the 2017 Merger. |
Class A Common Stock — As of December 31, 2017, we had 177,997,640 shares of Class A common stock outstanding. On February 19, 2018, there were 42 holders of record of our Class A common stock. Because many of our shares of Class A common stock are held by brokers or other institutions on behalf of stockholders, we are unable to estimate the total number of individual stockholders represented by the record holders.
Class B Common Stock — There is currently no established trading market for our Class B common stock. As of December 31, 2017, we had no shares of Class B common stock issued and outstanding; however $250,000,000 remained authorized.
Dividend Policy |
Prior to the 2017 Merger, Swift did not pay dividends. Following the 2017 Merger, we have paid a quarterly cash dividend, consistent with Knight's historical practice that started in December 2004, and that continued in consecutive quarters since prior to the 2017 Merger. Listed below are the dividends declared and paid by Swift prior to the 2017 Merger and the combined company after the 2017 Merger with respect to the two most recent fiscal years:
Period | First Quarter | Second Quarter | Third Quarter | Fourth Quarter | Total | ||||||||||||||
2017 dividend paid per common share | $ | — | $ | — | $ | 0.06 | $ | 0.06 | $ | 0.12 | |||||||||
2016 dividend paid per common share | $ | — | $ | — | $ | — | $ | — | $ | — | |||||||||
Our most recent dividend was declared in February of 2018 for $0.06 per share of Class A common stock and is scheduled to be paid in March of 2018.
We currently expect to continue to pay comparable quarterly cash dividends in the future. Future payment of cash dividends, and the amount of any such dividends, will depend upon our financial condition, results of operations, cash requirements, tax treatment, and certain corporate law requirements, as well as other factors deemed relevant by our Board.
33
Purchases of Equity Securities by the Issuer and Affiliated Purchasers |
The following table shows our purchases of our Class A common stock and the remaining amounts we are authorized to repurchase for each monthly period in the fourth quarter of 2017.
Period | Total Number of Shares Purchased | Average Price Paid per Share | Total Number of Shares Purchased as Part of Publicly Announced Plans or Programs | Approximate Dollar Value That May Yet be Purchased Under the Plans or Programs (1) | |||||||||
October 1, 2017 to October 31, 2017 | — | $ | — | — | $ | 62,881,000 | |||||||
November 1, 2017 to November 30, 2017 | — | $ | — | — | $ | 62,881,000 | |||||||
December 1, 2017 to December 31, 2017 | — | $ | — | — | $ | 62,881,000 | |||||||
Total | — | $ | — | — | $ | 62,881,000 | |||||||
________________
(1) | Following the 2017 Merger, the existing Swift Repurchase Plan remained in effect. The Swift Repurchase Plan authorized the Company to repurchase up to $150.0 million of its outstanding Class A common stock. There is no expiration date associated with this share repurchase authorization. See Note 20 in Part II, Item 8 of this Annual Report. |
Stockholders Return Performance Graph |
The following graph compares the cumulative annual total return of stockholders from December 31, 2012 to December 31, 2017 of our stock relative to the cumulative total returns of the NYSE Composite index and an index of other companies within the trucking industry (NASDAQ Trucking & Transportation) over the same period. The graph assumes that the value of the investment in Swift's common stock and in each of the indexes (including reinvestment of dividends) was $100 on December 31, 2012, and tracks it through December 31, 2017. The stock price performance included in this graph is not necessarily indicative of Knight-Swift's future stock price performance.
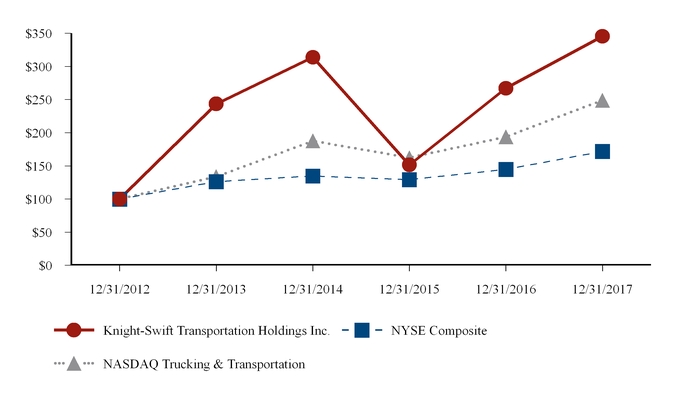
December 31, | |||||||||||||||||||||||
2012 | 2013 | 2014 | 2015 | 2016 | 2017 | ||||||||||||||||||
Knight-Swift Transportation Holdings Inc. | $ | 100.00 | $ | 243.53 | $ | 313.93 | $ | 151.54 | $ | 267.11 | $ | 345.64 | |||||||||||
NYSE Composite | 100.00 | 126.28 | 134.81 | 129.29 | 144.73 | 171.83 | |||||||||||||||||
NASDAQ Trucking & Transportation | 100.00 | 133.76 | 187.65 | 162.30 | 193.79 | 248.92 | |||||||||||||||||
34
ITEM 6. | SELECTED FINANCIAL DATA |
The information presented below is derived from our audited consolidated financial statements, included elsewhere in this report, except for 2013 and 2014, which were previously reported. Due to the "reverse acquisition" nature of the 2017 Merger, the historical financial statements of legacy Knight have replaced the historical financial statements of legacy Swift. In management's opinion, all necessary adjustments for the fair presentation of the information outlined in these financial statements have been applied. The selected financial data for 2017, 2016, and 2015 should be read alongside the consolidated financial statements and accompanying footnotes in Part II, Item 8 of this Annual Report.
Note: Factors that materially affect the comparability of the data for 2015 through 2017 are discussed in Part II, Item 7 of this Annual Report. Factors that materially affect the comparability of the selected financial data for 2013 and 2014 are set forth below the table.
The following table highlights key measures of the Company's financial condition and results of operations (dollars in thousands, except per share amounts and operating data):
Consolidated income statement GAAP data (1): | 2017 | 2016 | 2015 | 2014 (8) | 2013 | ||||||||||||||
Total revenue | $ | 2,425,453 | $ | 1,118,034 | $ | 1,182,964 | $ | 1,102,332 | $ | 969,237 | |||||||||
Operating expenses | 2,224,823 | 969,555 | 1,004,964 | 939,610 | 855,328 | ||||||||||||||
Operating income | 200,630 | 148,479 | 178,000 | 162,722 | 113,909 | ||||||||||||||
Interest income & other income | 1,765 | 5,248 | 9,502 | 9,838 | 3,257 | ||||||||||||||
Interest expense | (8,686 | ) | (897 | ) | (998 | ) | (730 | ) | (462 | ) | |||||||||
Income before income taxes | 193,709 | 152,830 | 186,504 | 171,830 | 116,704 | ||||||||||||||
Net income | 485,425 | 95,238 | 118,457 | 104,021 | 70,024 | ||||||||||||||
Net income attributable to Knight-Swift | 484,292 | 93,863 | 116,718 | 102,862 | 69,282 | ||||||||||||||
Basic earnings per share | 4.38 | 1.17 | 1.43 | 1.27 | 0.87 | ||||||||||||||
Diluted earnings per share | 4.34 | 1.16 | 1.42 | 1.25 | 0.86 | ||||||||||||||
Cash dividend per share on Class A common stock | 0.24 | 0.24 | 0.24 | 0.24 | 0.24 | ||||||||||||||
Operating ratio (2) | 91.7 | % | 86.7 | % | 85.0 | % | 85.2 | % | 88.2 | % | |||||||||
December 31, | |||||||||||||||||||
Consolidated balance sheet GAAP data (1): | 2017 | 2016 | 2015 | 2014 (8) | 2013 | ||||||||||||||
Working capital | $ | 313,657 | $ | 111,541 | $ | 164,090 | $ | 145,667 | $ | 101,768 | |||||||||
Total assets | 7,683,442 | 1,078,525 | 1,120,232 | 1,082,285 | 807,121 | ||||||||||||||
Total debt (3) | 970,905 | 18,000 | 112,000 | 134,400 | 38,000 | ||||||||||||||
Knight-Swift stockholders' equity | 5,237,732 | 786,473 | 738,398 | 677,760 | 553,588 | ||||||||||||||
Non-GAAP financial data (unaudited) (1): | 2017 | 2016 | 2015 | 2014 (8) | 2013 | ||||||||||||||
Adjusted Net Income Attributable to Knight-Swift (4) | $ | 154,565 | $ | 95,373 | $ | 121,113 | $ | 102,862 | $ | 69,282 | |||||||||
Adjusted EPS (4) | 1.38 | 1.17 | 1.47 | 1.25 | 0.86 | ||||||||||||||
Adjusted Operating Ratio (4) | 88.3 | % | 85.3 | % | 82.6 | % | 82.4 | % | 85.6 | % | |||||||||
Operating data (unaudited):(1) | 2017 | 2016 | 2015 | 2014 (8) | 2013 | ||||||||||||||
Average revenue per tractor (5) | $ | 184,920 | $ | 172,185 | $ | 173,329 | $ | 171,510 | $ | 160,186 | |||||||||
Average length of haul (miles) | 479 | 498 | 503 | 492 | 479 | ||||||||||||||
Non-paid empty miles percentage | 12.6 | % | 12.5 | % | 12.0 | % | 10.1 | % | 10.6 | % | |||||||||
Average tractors (6) (7) | 9,432 | 4,706 | 4,793 | 4,173 | 4,017 | ||||||||||||||
Average trailers (7) | 31,967 | 12,288 | 11,789 | 9,732 | 9,405 | ||||||||||||||
Average containers | 9,122 | — | — | — | — | ||||||||||||||
(1) | Pursuant to the 2017 Merger, data after September 8, 2017 includes the results of Swift. |
(2) | Operating expenses expressed as a percentage of total revenue. |
(3) | Includes current and noncurrent portions of term loan debt, revolving credit facilities, receivables sales agreement, and capital leases. For more discussion refer to "Liquidity and Capital Resources" in Part II, Item 7 of this Annual Report. |
(4) | Adjusted Net Income Attributable to Knight-Swift, Adjusted EPS, and Adjusted Operating Ratio, are non-GAAP financial measures. These non-GAAP financial measures should not be considered alternatives to, or superior to, GAAP financial measures. However, management believes that presentation of these non-GAAP financial measures provides useful information to investors regarding the Company's results of operations. Adjusted Net Income Attributable to Knight-Swift, Adjusted EPS, and Adjusted Operating Ratio are reconciled to the most directly comparable GAAP financial measures in "Non-GAAP Financial Measures" in Part II, Item 7 of this Annual Report. |
(5) | Average revenue per tractor includes revenue for our Knight Trucking, Swift Truckload, Swift Dedicated, and Swift Refrigerated segments only. It does not include fuel surcharge revenue or revenues from our Knight Logistics, Swift Intermodal and Swift Non-Reportable segments. |
(6) | Reflects operational tractors within the Knight Trucking, Swift Truckload, Swift Dedicated, and Swift Refrigerated segments, including company tractors and tractors owned by independent contractors. |
(7) | See Note (3) to "Executive Summary — Financial Overview" in Part II, Item 7 of this Annual Report, regarding the calculation of average tractors and average trailers. |
(8) | Knight acquired 100% of the outstanding stock of Barr-Nunn on October 1, 2014, and therefore, Knight's operating results include those of Barr-Nunn for periods after October 1, 2014. |
35
ITEM 7. | MANAGEMENT'S DISCUSSION AND ANALYSIS OF FINANCIAL CONDITION AND RESULTS OF OPERATIONS |
Certain acronyms and terms used throughout this Annual Report are specific to our company, commonly used in our industry, or are otherwise frequently used throughout our document. Definitions for these acronyms and terms are provided in the "Glossary of Terms," available in the front of this document.
Management's discussion and analysis of financial condition and results of operations should be read together with "Business" in Part I, Item 1 of this Annual Report, as well as the consolidated financial statements and accompanying footnotes in Part II, Item 8 of this Annual Report. This discussion contains forward-looking statements as a result of many factors, including those set forth under Part I, Item 1A. "Risk Factors" and Part I "Cautionary Note Regarding Forward-looking Statements" of this Annual Report, and elsewhere in this report. These statements are based on current expectations and assumptions that are subject to risks and uncertainties. Actual results could differ materially from those discussed.
Executive Summary |
Company Overview
2017 Merger — On September 8, 2017, we became Knight-Swift Transportation Holdings Inc. upon the effectiveness of the 2017 Merger. Immediately upon the consummation of the 2017 Merger, former Knight stockholders and former Swift stockholders owned approximately 46.0% and 54.0%, respectively, of the Company. Upon closing of the 2017 Merger, the shares of Knight common stock that previously traded under the ticker symbol "KNX" ceased trading and were delisted from the NYSE. Our shares of Class A common stock commenced trading on the NYSE on a post-reverse split basis under the ticker symbol "KNX" on September 11, 2017.
We accounted for the 2017 Merger using the acquisition method of accounting in accordance with GAAP. GAAP requires that either Knight or Swift is designated as the acquirer for accounting and financial reporting purposes ("Accounting Acquirer"). Based on the evidence available, Knight was designated as the Accounting Acquirer while Swift was the acquirer for legal purposes. Therefore, Knight’s historical results of operations replaced Swift’s historical results of operations for all periods prior to the 2017 Merger. More specifically, for periods prior to the 2017 Merger, the consolidated financial statements in Part II, Item 8 of this Annual Report are those of Knight and its subsidiaries and do not include Swift, and for periods subsequent to the 2017 Merger, also include Swift. Accordingly, comparisons between our 2017 results and prior periods may not be meaningful.
Segments — Our six reportable segments are Knight Trucking, Knight Logistics, Swift Truckload, Swift Dedicated, Swift Refrigerated, and Swift Intermodal. Additionally, Swift has various non-reportable segments. Refer to Note 25 in Part II, Item 8 of this Annual Report for descriptions of our segments.
Revenue — We offer a broad range of full truckload, intermodal, brokerage, and logistics services within North America's largest for-hire truckload tractor fleet, operated through a nationwide network of terminals, and contractual access to thousands of third-party capacity providers. Our objective is to operate our trucking and logistics businesses with industry-leading margins and growth while providing safe, high-quality, cost-effective solutions for our customers.
• | Our trucking services include dry van, refrigerated, dedicated, drayage, flatbed, and cross-border transportation of various products, goods, and materials for our diverse customer base. We primarily generate revenue before fuel surcharge by transporting freight for our customers through our trucking services in our Knight Trucking, Swift Truckload, Swift Dedicated, and Swift Refrigerated segments. |
• | Our brokerage and intermodal operations provide a multitude of shipping solutions, including additional sources of truckload capacity and alternative transportation modes, by utilizing our vast network of third-party capacity providers and rail providers, as well as certain logistics, freight management, and other non-trucking services. Revenue before fuel surcharge in our brokerage and intermodal operations is generated through our Knight Logistics and Swift Intermodal segments. |
• | Our Swift non-reportable segments generate revenue before fuel surcharge by providing freight management, sourcing, and other non-trucking services (such as used equipment sales and leasing to independent contractors, as well as third parties). |
• | In addition to the revenues earned from our customers for the trucking and non-trucking services discussed above, we also earn fuel surcharge revenue from our customers through our fuel surcharge program, which serves to recover a majority of our fuel costs. This applies only to loaded miles and typically does not offset non-paid empty miles, idle time, and out-of-route miles driven. Fuel surcharge programs involve a computation based on the change in national or regional fuel prices. These programs may update as often as weekly, but typically require a specified minimum change in fuel cost to prompt a change in fuel surcharge revenue. Therefore, many of these programs have a time lag between when fuel costs change and when the change is reflected in fuel surcharge revenue for our trucking segments. |
36
KNIGHT-SWIFT TRANSPORTATION HOLDINGS INC.
MANAGEMENT'S DISCUSSION AND ANALYSIS OF FINANCIAL CONDITION AND RESULTS OF OPERATIONS — CONTINUED
Expenses — Our most significant expenses vary with miles traveled and include fuel, driving associate-related expenses (such as wages and benefits), and services purchased from independent contractors and other transportation providers (such as railroads, drayage providers, and other trucking companies). Maintenance and tire expenses, as well as the cost of insurance and claims generally vary with the miles we travel, but also have a controllable component based on safety improvements, fleet age, efficiency, and other factors. Our primary fixed costs are depreciation and lease expense for revenue equipment and terminals, interest expense, and non-driver employee compensation.
Operating Statistics — We measure our consolidated and segment results through certain operating statistics, which are discussed under "Results of Operations — Segments — Operating Statistics," below. Our results are affected by various economic, industry, operational, regulatory, and other factors, which are discussed in detail in "Part I, Item 1A. Risk Factors," as well as in various disclosures in our press releases, stockholder reports, and other filings with the SEC.
Financial Overview
2017 | 2016 | 2015 | |||||||||
GAAP Financial data: | (Dollars in thousands, except per share data) | ||||||||||
Total revenue | $ | 2,425,453 | $ | 1,118,034 | $ | 1,182,964 | |||||
Revenue before fuel surcharge | $ | 2,179,873 | $ | 1,028,148 | $ | 1,061,739 | |||||
Net income attributable to Knight-Swift | $ | 484,292 | $ | 93,863 | $ | 116,718 | |||||
Diluted EPS | $ | 4.34 | $ | 1.16 | $ | 1.42 | |||||
Operating ratio | 91.7 | % | 86.7 | % | 85.0 | % | |||||
Non-GAAP financial data: | |||||||||||
Adjusted Net Income Attributable to Knight-Swift (1) | $ | 154,565 | $ | 95,373 | $ | 121,113 | |||||
Adjusted EPS (1) | $ | 1.38 | $ | 1.17 | $ | 1.47 | |||||
Adjusted Operating Ratio (1) | 88.3 | % | 85.3 | % | 82.6 | % | |||||
Revenue equipment: | |||||||||||
Average tractors (2 (3) | 9,432 | 4,706 | 4,793 | ||||||||
Average trailers (3) | 31,967 | 12,288 | 11,789 | ||||||||
Average containers | 9,122 | — | — | ||||||||
____________
(1) | Adjusted Net Income Attributable to Knight-Swift, Adjusted EPS, and Adjusted Operating Ratio are non-GAAP financial measures and should not be considered alternatives, or superior, to the most directly comparable GAAP financial measures. However, management believes that presentation of these non-GAAP financial measures provides useful information to investors regarding the Company's results of operations. Adjusted Net Income Attributable to Knight-Swift, Adjusted EPS, and Adjusted Operating Ratio are reconciled to the most directly comparable GAAP financial measures under "Non-GAAP Financial Measures," below. |
(2) | Reflects operational tractors within the Knight Trucking, Swift Truckload, Swift Dedicated, and Swift Refrigerated segments, including company tractors and tractors owned by independent contractors. |
(3) | Consolidated "Average tractors" reflect Knight's actual average tractors for full-year 2017 and Swift's average tractors pro-rated for the portion of the year for which its results of operations are reported following the close of the 2017 Merger. |
Consolidated "Average trailers" reflect Knight's actual average trailers for full-year 2017 and Swift's average trailers pro-rated for the portion of the year for which its results of operations are reported following the close of the 2017 Merger.
37
KNIGHT-SWIFT TRANSPORTATION HOLDINGS INC.
MANAGEMENT'S DISCUSSION AND ANALYSIS OF FINANCIAL CONDITION AND RESULTS OF OPERATIONS — CONTINUED
Summarized Results of Consolidated Operations and Financial Condition
Trends and Outlook — The broader economy continues to show signs of growth in consumer spending, durable goods, and the prospects of increased manufacturing and construction, especially considering the recent tax relief from the Tax Cuts and Jobs Act.
A shortage in drivers continues to be a headwind for the industry and will likely impact the ability to increase capacity. We also believe that the ELD mandate began to have an impact on capacity late in the fourth quarter of 2017, which has continued into 2018. Given the strength in the freight market, as well as inflationary pressures related to driver wages, purchased transportation and other costs, we expect to see rate increases in our contract business throughout 2018. In this environment, we will continue to monitor the markets in order to maximize service to our customers and yield.
Note: Our 2017 consolidated results of operations included the results of operations for Swift after September 8, 2017. Results for the periods on and prior to September 8, 2017 reflect only those of Knight and do not include the results of operations of Swift. Accordingly, comparison between the consolidated results for 2017 and 2016 may not be meaningful.
2017 Compared 2016 — The $390.4 million increase in net income attributable to Knight-Swift to $484.3 million in 2017 from $93.9 million in 2016, includes the following:
• | $95.7 million in operating income from Swift's results from the September 9, 2017 through December 31, 2017 period; |
• | $364.2 million income tax benefit, representing management's estimate of the net impact of the Tax Cuts and Jobs Act enacted during the fourth quarter of 2017; |
• | improvements in average revenue per tractor; |
• | a $16.7 million impairment related to the termination of Swift's implementation of its ERP system; and |
• | merger-related expenses associated with the 2017 Merger, including $16.5 million related to incurred legal and professional fees, $5.6 million for merger-related bonuses and accelerated stock-based compensation expense, $0.9 million merger-related statutory filings and $0.1 million in driving associate-incentive expenses. |
See additional discussion of our operating results within "Results of Operations — Consolidated" below.
In 2017, we generated $318.6 million in cash flows from operations and used $304.5 million for capital expenditures, net of equipment sales. During 2017, we returned $25.5 million to our stockholders in the form of quarterly dividends. We ended the year with $76.6 million in unrestricted cash and cash equivalents, $489.8 million in long-term debt (excluding the 2015 RSA and capital leases), and $5.2 billion of stockholders' equity. See discussion under "Liquidity and Capital Resources" and "Off-Balance Sheet Transactions" for additional information.
2016 Compared to 2015 — The $22.8 million decrease in our net income attributable to Knight-Swift to $93.9 million in 2016 from $116.7 million in 2015, includes the following:
• | a $7.2 million decrease in gain on sale of equipment; |
• | a $4.1 million decrease in gain on sale of available-for-sale securities; |
• | a $3.6 million decrease in the positive effects of the effective tax rate on net income; and |
• | a $4.7 million decrease in settlement expense for certain class action lawsuits. |
See additional discussion of our operating results within "Results of Operations — Consolidated" below.
In 2016, Knight generated $243.4 million in cash flow from operations and used $89.0 million for capital expenditures, net of equipment sales. During 2016, Knight returned $59.5 million to its stockholders in the form of quarterly dividends and stock repurchases. Knight ended the year with $8.0 million in unrestricted cash, $18.0 million in long-term debt, and $786.5 million in stockholders' equity.
38
KNIGHT-SWIFT TRANSPORTATION HOLDINGS INC.
MANAGEMENT'S DISCUSSION AND ANALYSIS OF FINANCIAL CONDITION AND RESULTS OF OPERATIONS — CONTINUED
Results of Operations — Segment Review |
Our six reportable segments include our trucking segments (Knight Trucking, Swift Truckload, Swift Dedicated, and Swift Refrigerated), Knight Logistics, and Swift Intermodal. Swift also has certain non-reportable segments. Refer to Note 25 in Part II, Item 8 of this Annual Report for descriptions of our segments. Refer to Part I, Item 1, "Business – Our Strategy" of this Annual Report for discussion related to our segment operating strategies.
Consolidating Tables for Total Revenue and Operating Income
2017 | 2016 | 2015 | ||||||||||||||||||
Total revenue: | (Dollars in thousands) | |||||||||||||||||||
Knight – Trucking | $ | 906,484 | 37.4 | % | $ | 900,368 | 80.5 | % | $ | 952,098 | 80.5 | % | ||||||||
Knight – Logistics | $ | 234,155 | 9.7 | % | $ | 226,912 | 20.3 | % | $ | 249,365 | 21.1 | % | ||||||||
Swift – Truckload | $ | 609,112 | 25.1 | % | $ | — | — | % | $ | — | — | % | ||||||||
Swift – Dedicated | $ | 200,628 | 8.3 | % | $ | — | — | % | $ | — | — | % | ||||||||
Swift – Refrigerated | $ | 254,102 | 10.5 | % | $ | — | — | % | $ | — | — | % | ||||||||
Swift – Intermodal | $ | 130,441 | 5.4 | % | $ | — | — | % | $ | — | — | % | ||||||||
Subtotal | $ | 2,334,922 | 96.4 | % | $ | 1,127,280 | 100.8 | % | $ | 1,201,463 | 101.6 | % | ||||||||
Non-reportable segments | $ | 115,530 | 4.8 | % | $ | — | — | % | $ | — | — | % | ||||||||
Intersegment eliminations | $ | (24,999 | ) | (1.2 | )% | $ | (9,246 | ) | (0.8 | )% | $ | (18,499 | ) | (1.6 | )% | |||||
Total revenue | $ | 2,425,453 | 100.0 | % | $ | 1,118,034 | 100.0 | % | $ | 1,182,964 | 100.0 | % | ||||||||
2017 | 2016 | 2015 | ||||||||||||||||||
Operating income (loss): | (Dollars in thousands) | |||||||||||||||||||
Knight – Trucking (1) | $ | 92,298 | 46.0 | % | $ | 136,229 | 91.7 | % | $ | 162,143 | 91.1 | % | ||||||||
Knight – Logistics | $ | 12,600 | 6.3 | % | $ | 12,250 | 8.3 | % | $ | 15,857 | 8.9 | % | ||||||||
Swift – Truckload | $ | 74,924 | 37.3 | % | $ | — | — | % | $ | — | — | % | ||||||||
Swift – Dedicated | $ | 22,410 | 11.2 | % | $ | — | — | % | $ | — | — | % | ||||||||
Swift – Refrigerated | $ | 13,626 | 6.8 | % | $ | — | — | % | $ | — | — | % | ||||||||
Swift – Intermodal | $ | 5,977 | 3.0 | % | $ | — | — | % | $ | — | — | % | ||||||||
Subtotal | $ | 221,835 | 110.6 | % | $ | 148,479 | 100.0 | % | $ | 178,000 | 100.0 | % | ||||||||
Non-reportable segments | $ | (21,205 | ) | (10.6 | )% | $ | — | — | % | $ | — | — | % | |||||||
Operating income | $ | 200,630 | 100.0 | % | $ | 148,479 | 100.0 | % | $ | 178,000 | 100.0 | % | ||||||||
____________
(1) | 2017 operating income for the Knight Trucking segment includes $23.1 million in 2017 Merger-related costs, which are discussed under "Summarized Results of Consolidated Operations and Financial Condition," above. |
Operating Statistics
Our chief operating decision makers monitor the GAAP results of our reportable segments, as supplemented by certain non-GAAP information. Refer to "Non-GAAP Financial Measures" below for more details. Additionally, we use a number of primary indicators to monitor our revenue and expense performance and efficiency.
Average Revenue per Tractor — This operating statistic is used to measure productivity within our Knight Trucking, Swift Truckload, Swift Dedicated, and Swift Refrigerated segments and represents the average revenue per tractor based on revenue, net of fuel surcharge (net of intersegment eliminations for our Knight Trucking segment) for the period.
Average Revenue per Load — This operating statistic is used within our Swift Intermodal segment and represents the average revenue per load based on revenue before fuel surcharge for the period.
Average Length of Haul — This represents the average of our miles with loaded trailer cargo and is used within our Knight Trucking, Swift Truckload, Swift Dedicated, and Swift Refrigerated segments.
39
KNIGHT-SWIFT TRANSPORTATION HOLDINGS INC.
MANAGEMENT'S DISCUSSION AND ANALYSIS OF FINANCIAL CONDITION AND RESULTS OF OPERATIONS — CONTINUED
Non-paid Empty Miles Percentage — Our Knight Trucking, Swift Truckload, and Swift Refrigerated segments monitor this operating statistic, which represents the average of our miles without trailer cargo.
Average Tractors — We use this measure for our Knight Trucking, Swift Truckload, Swift Dedicated, Swift Refrigerated, and Swift Intermodal segments. This operating statistic represents the average tractors in operation during the period.
Average Trailers — This represents the average trailers in operation during the period and is monitored within our Knight Trucking, Swift Truckload, Swift Dedicated, and Swift Refrigerated segments.
Average Containers — Our Swift Intermodal segment uses this measure to monitor the average number of containers in operation during the period.
Gross Margin Percentage — This measure is used in our Knight Logistics segment and represents Knight Logistics' gross margin (revenue, net of intersegment transactions, less purchased transportation expense) as a percentage of Knight Logistics' revenue, net of intersegment transactions.
Operating Ratio and Adjusted Operating Ratio — Operating ratio is widely used in our industry as an assessment of management's effectiveness in controlling all categories of operating expenses. We consider these ratios as important measures of our operating profitability for each of our reportable segments. GAAP operating ratio is operating expenses as a percentage of revenue, or the inverse of operating margin, and produces an indication of operating efficiency. Consolidated and segment Adjusted Operating Ratios are reconciled to their corresponding GAAP operating ratios under "Non-GAAP Financial Measures," below.
Segment Review
Knight Trucking Segment
We generate revenue in the Knight Trucking segment through dry van, refrigerated, and drayage service offerings. Generally, we are paid a predetermined rate per mile or per load for our trucking services. Additional revenues are generated in all four of our trucking segments (Knight Trucking, Swift Truckload, Swift Dedicated, and Swift Refrigerated) by charging for tractor and trailer detention, loading and unloading activities, dedicated services, and other specialized services, as well as through the collection of fuel surcharge revenue to mitigate the impact of increases in the cost of fuel. The main factors that affect the revenue generated by our trucking segments are rate per mile from our customers, the percentage of miles for which we are compensated, and the number of loaded miles we generate with our equipment.
The most significant expenses in the trucking segments are primarily variable and include fuel and fuel taxes, driving associate-related expenses (such as wages, benefits, training, and recruitment), and costs associated with independent contractors primarily included in "Purchased transportation" in the consolidated income statements. Maintenance expense (which includes costs for replacement tires for our revenue equipment) and insurance and claims expenses have both fixed and variable components. These expenses generally vary with the miles we travel, but also have a controllable component based on safety, fleet age, efficiency, and other factors. The main fixed costs in the trucking segments are depreciation and rent expenses from leasing and acquiring revenue equipment and terminals, as well as compensating our non-driver employees.
2017 | 2016 | 2015 | 2017 vs. 2016 | 2016 vs. 2015 | |||||||||||||
(Dollars in thousands, except per tractor data) | Increase (decrease) | ||||||||||||||||
Total revenue | $ | 906,484 | $ | 900,368 | $ | 952,098 | 0.7 | % | (5.4 | ) % | |||||||
Revenue, net of fuel surcharge and intersegment transactions | $ | 797,706 | $ | 810,358 | $ | 830,710 | (1.6 | ) % | (2.4 | ) % | |||||||
Operating income | $ | 92,298 | $ | 136,229 | $ | 162,143 | (32.2 | ) % | (16.0 | ) % | |||||||
Average revenue per tractor (1) | $ | 174,553 | $ | 172,185 | $ | 173,329 | 1.4 | % | (0.7 | ) % | |||||||
GAAP: Operating ratio (1) | 89.8 | % | 84.9 | % | 83.0 | % | 490 | bps | 190 | bps | |||||||
Non-GAAP: Adjusted Operating Ratio (1) | 85.3 | % | 82.9 | % | 79.6 | % | 240 | bps | 330 | bps | |||||||
Non-paid empty miles percentage (1) | 12.9 | % | 12.5 | % | 12.0 | % | 40 | bps | 50 | bps | |||||||
Average length of haul (miles) (1) | 483 | 498 | 503 | (3.0 | ) % | (1.0 | ) % | ||||||||||
Average tractors (1) (2) | 4,570 | 4,706 | 4,793 | (2.9 | ) % | (1.8 | ) % | ||||||||||
Average trailers (1) (3) | 12,383 | 12,288 | 11,789 | 0.8 | % | 4.2 | % | ||||||||||
____________
(1) | Defined under "Operating Statistics," above. |
(2) | Includes 4,142 company-owned tractors with an average age of 2.6 years in 2017, 4,286 company-owned tractors with an average age of 1.9 years in 2016, and 4,363 company owned-tractors with an average age of 1.7 years in 2015. |
(3) | The average age of the trailer fleet was 4.0 years in 2017, 4.4 years in 2016, and 4.4 years in 2015. |
40
KNIGHT-SWIFT TRANSPORTATION HOLDINGS INC.
MANAGEMENT'S DISCUSSION AND ANALYSIS OF FINANCIAL CONDITION AND RESULTS OF OPERATIONS — CONTINUED
2017 Compared to 2016 —The Knight Trucking segment total revenue increased $6.1 million, consisting of an $18.8 million increase in fuel surcharge revenue from higher average fuel prices, partially offset by a $12.7 million decrease in revenue, net of fuel surcharge and intersegment transactions. Average revenue per loaded mile increased 4.3% due to an increase in non-contract opportunities and rates during the year. This was partially offset by a 2.4% decrease in average miles per tractor, a difficult driver market, and other network disruptions, thus resulting in a 1.4% increase in average revenue per tractor. Additionally, non-paid empty miles increased, as a percentage of total miles.
Operating ratio and Adjusted Operating Ratio increased, as driving associate-related costs and less gain on sale of equipment continued to present cost headwinds in the Knight Trucking segment, and are continuing to be challenging in 2018. Our focus in the Knight Trucking segment remains on developing our freight network, improving the productivity of our assets, and controlling costs, in areas where we have experienced higher than normal inflation, such as maintenance, driving associate pay, and professional fees.
Knight Trucking depreciation and amortization of property and equipment as a percentage of Knight Trucking revenue, net of fuel surcharge and intersegment transactions remained relatively flat in 2017, compared to 2016. Rising new equipment prices in 2017 caused expense to increase; however, this was offset by a decrease in the segment's tractor to trailer ratio and older fleet.
Knight Trucking purchased transportation expense as a percentage of Knight Trucking revenue, net of fuel surcharge and intersegment transactions increased 80 basis points to 7.9% in 2017. This increase was predominately related to increases in fuel reimbursements to our independent contractors due to the increase in average diesel fuel prices, as well as a 2.8% increase in miles driven by independent contractors.
2016 Compared to 2015 — Knight Trucking segment total revenue decreased $51.7 million, consisting of a $31.3 million decrease in fuel surcharge revenue driven by lower average fuel prices and a $20.4 million decrease in revenue, net of fuel surcharge and intersegment transactions. Average miles per tractor increased 1.4% in 2016, compared to 2015. However, this improvement was offset by a 1.5% decrease in average revenue per loaded mile, and an increase in non-paid empty miles percentage rate to 12.5% from 12.0%. This negatively affected our tractor productivity, as measured by average revenue per tractor, net of fuel surcharge, which decreased by 0.7% in 2016, compared to 2015.
Operating ratio and Adjusted Operating Ratio increased from 2015 to 2016. Higher net fuel expense, less gain on sale of revenue equipment, and higher driving associate-related expenses were the main factors negatively affecting our 2016 operating results when compared to the prior year.
Depreciation and amortization expense for the Knight Trucking segment, as a percentage of Knight Trucking revenue, was 13.8% in 2016, compared to 12.9% in 2015. Factors contributing to the increase were the decrease in average revenue per tractor, rising new equipment prices, and an increase in our tractor to trailer ratio.
41
KNIGHT-SWIFT TRANSPORTATION HOLDINGS INC.
MANAGEMENT'S DISCUSSION AND ANALYSIS OF FINANCIAL CONDITION AND RESULTS OF OPERATIONS — CONTINUED
Knight Logistics Segment
The Knight Logistics segment is less asset-intensive than the trucking segments and is instead dependent upon capable non-driver employees, modern and effective information technology, and third-party capacity providers. Knight Logistics' revenue is generated primarily by its brokerage and intermodal operating units. We also provide logistics, freight management and other non-trucking services to our customers through our Knight Logistics segment. We generate additional revenue by offering specialized logistics solutions (including, but not limited to, origin management, surge volume, disaster relief, special projects, and other logistic needs). Knight Logistics' revenue is mainly affected by the rates we obtain from customers, the freight volumes we ship through third-party capacity providers, and our ability to secure third-party capacity providers to transport customer freight.
The most significant expense in the Knight Logistics segment is the (primarily) variable cost of purchased transportation that we pay to third-party capacity providers (including rail providers), included in "Purchased transportation" in the consolidated income statements. This expense generally varies depending upon truckload and rail capacity, availability of third-party capacity providers, rates charged to customers, and current freight demand and customer shipping needs. Other Knight Logistics operating expenses are generally fixed and primarily include non-driver employee compensation and benefits recorded in "Salaries, wages, and benefits" in the consolidated income statements, and depreciation and amortization expense recorded in "Depreciation and amortization of property and equipment."
2017 | 2016 | 2015 | 2017 vs. 2016 | 2016 vs. 2015 | |||||||||||||
(Dollars in thousands, except per load data) | Increase (decrease) | ||||||||||||||||
Total revenue | $ | 234,155 | $ | 226,912 | $ | 249,365 | 3.2 | % | (9.0 | ) % | |||||||
Revenue, net of intersegment transactions | $ | 227,952 | $ | 217,790 | $ | 231,029 | 4.7 | % | (5.7 | ) % | |||||||
Operating income | $ | 12,600 | $ | 12,250 | $ | 15,857 | 2.9 | % | (22.7 | ) % | |||||||
Revenue per load – Brokerage only | $ | 1,357 | $ | 1,275 | $ | 1,509 | 6.4 | % | (15.5 | ) % | |||||||
Gross margin percentage (1) – Brokerage only | 15.4 | % | 16.5 | % | 15.9 | % | (110 | ) bps | 60 | bps | |||||||
GAAP: Operating ratio (1) | 94.6 | % | 94.6 | % | 93.6 | % | — | 100 | bps | ||||||||
Non-GAAP: Adjusted Operating Ratio (1) | 94.5 | % | 94.4 | % | 93.1 | % | 10 | bps | 130 | bps | |||||||
____________
(1) | Defined under "Operating Statistics," above. |
2017 Compared to 2016 — The Knight Logistics segment's total revenue increased $7.2 million, while operating ratio and Adjusted Operating Ratio remained flat. Revenue, net of intersegment transactions increased 11.5% in the Knight brokerage business, which is the largest component of the Knight Logistics segment. This was driven by a 6.4% increase in revenue per load and a 4.7% increase in load volume in the Knight brokerage business. Gross margin percentage in Knight's brokerage business decreased 110 basis points in 2017, compared to 2016, due to an increase in purchased transportation costs.
Depreciation and amortization of property and equipment expense within our Knight Logistics segment increased by $0.7 million from 2016 to 2017, which was primarily due to an increase in equipment leased to third parties. As a percentage of Knight Logistics revenue, net of intersegment transactions, depreciation and amortization of property and equipment remained relatively flat. Absent offsetting growth in our Knight Logistics segments, our expense as a percentage of revenue in this category could increase in the future.
We plan to continue to invest in our Knight Logistics segment, including transportation management technology, which we believe will continue to improve our return on capital, compared with asset-based operations.
2016 Compared to 2015 — Knight Logistics revenue decreased, primarily due to declining revenue from the non-Trucking services as we exited our agricultural sourcing business in the first quarter of 2016, as well as due to lower revenue per load from lower fuel surcharge. Revenue in the Knight brokerage business, which is the largest component of our Logistics segment, decreased in 2016 compared to 2015; however, we continued to see load volume growth. A shorter length of haul and lower non-contract pricing offset this load volume growth. We achieved this growth by increasing our Logistics services to our customers through our third-party carriers and rail providers.
Purchased transportation expense within our Knight Logistics segment decreased as expected with the decrease in Knight Logistics revenue; however increased costs associated with exiting our agriculture sourcing business in the first quarter of 2016 partially offset the decrease in purchased transportation expense.
42
KNIGHT-SWIFT TRANSPORTATION HOLDINGS INC.
MANAGEMENT'S DISCUSSION AND ANALYSIS OF FINANCIAL CONDITION AND RESULTS OF OPERATIONS — CONTINUED
Swift Segments
Swift Truckload, Swift Dedicated, and Swift Refrigerated — We generate revenue in the Swift trucking segments through dry van, refrigerated, dedicated, drayage, flatbed, and cross-border service offerings. Refer to "Knight Trucking Segment," above for discussion of revenues generated and expenses incurred in all of the Company's trucking segments.
Swift Intermodal — The Swift Intermodal segment complements our regional operating model, allows us to better serve customers in longer haul lanes, and reduces our investment in fixed assets. Through the Swift Intermodal segment, we generate revenue by moving freight over the rail in our containers and other trailing equipment, combined with revenue for drayage to transport loads between railheads and customer locations. The most significant expense in the Swift Intermodal segment is the (primarily) variable cost of purchased transportation that we pay to third-party capacity providers (including rail providers), included in "Purchased transportation" in the consolidated income statements. Purchased transportation varies as it relates to rail capacity, freight demand, and customer shipping needs. The main fixed costs in the Swift Intermodal segment are depreciation of our containers and chassis, as well as non-driver employee compensation and benefits.
September 9, 2017 – December 31, 2017 | |||||||||||||||
Swift | Swift | Swift | Swift | ||||||||||||
Truckload | Dedicated | Refrigerated | Intermodal | ||||||||||||
(Dollars in thousands, except per tractor and per load data) | |||||||||||||||
Total revenue | $ | 609,112 | $ | 200,628 | $ | 254,102 | $ | 130,441 | |||||||
Revenue, net of fuel surcharge | $ | 536,848 | $ | 179,847 | $ | 229,826 | $ | 112,865 | |||||||
Operating income | $ | 74,924 | $ | 22,410 | $ | 13,626 | $ | 5,977 | |||||||
Average revenue per tractor (1) | $ | 196,864 | $ | 187,928 | $ | 194,933 | N/A | ||||||||
Average revenue per load (1) | N/A | N/A | N/A | $ | 1,882 | ||||||||||
GAAP: Operating ratio (1) | 87.7 | % | 88.8 | % | 94.6 | % | 95.4 | % | |||||||
Non-GAAP: Adjusted Operating Ratio (1) | 86.0 | % | 87.5 | % | 94.1 | % | 94.7 | % | |||||||
Non-paid empty miles percentage (1) | 13.2 | % | 17.4 | % | 7.1 | % | N/A | ||||||||
Average length of haul (miles) (1) | 610 | 191 | 394 | N/A | |||||||||||
Average tractors (1) (2) | 2,727 | 957 | 1,179 | 166 | |||||||||||
Average trailers (containers for Intermodal) (1) (2) | 11,176 | 4,667 | 1,353 | 9,122 | |||||||||||
____________
(1) | Defined under "Operating Statistics," above. |
(2) | "Average tractors" reflect Swift's average tractors pro-rated for the portion of the year for which its results of operations are reported following the close of the 2017 Merger. |
"Average trailers" reflect Swift's average trailers pro-rated for the portion of the year for which its results of operations are reported following the close of the 2017 Merger.
The Swift trucking segments operated an average of 5,029 tractors, of which 3,781 were company-owned tractors that had an average age of 2.5 years. The average age of Swift's trailer fleet was 8.4 years.
Swift Truckload, Swift Dedicated, and Swift Refrigerated — For September 9, 2017 through December 31, 2017, the strong freight market positively affected revenue, net of fuel surcharge, in our Swift Truckload, Swift Dedicated, and Swift Refrigerated segments, as evidenced by average revenue per tractor in these segments. Operating and Adjusted Operating Ratios in the Swift trucking segments have been improving, but are facing headwinds largely due to the challenging driver market we are experiencing. Sourcing and retaining high-quality driving associates remains a significant challenge and tractor counts have been accordingly decreasing in these segments. This has increased pressure on our recruiting efforts, as well as driving associate wage expenses. In addition, Swift adopted more stringent hiring practices in October 2017 that negatively impacted operating results in the current period, but are expected to improve operating costs in the future. In an effort to combat these headwinds, we remain disciplined with our cost control initiatives, as well as improving yield, asset efficiency, and return on investment in Swift's trucking segments.
Swift Intermodal — For September 9, 2017 through December 31, 2017, we saw improvements in the Swift Intermodal segment's revenue, net of fuel surcharge, driven by a strong revenue per container. This segment's operating and Adjusted Operating Ratios were positively affected by the aforementioned increase in load count as well as improved drayage efficiencies. Additionally, Swift Intermodal benefited from the impact of fuel prices on fuel surcharge revenue. We are focused on improving Swift Intermodal by right-sizing its cost infrastructure, increasing container turns, and driving operational efficiencies.
Swift Non-reportable Segments — A $16.7 million impairment related to terminating Swift's ERP system was included within the operating expenses of the Swift non-reportable segments in the September 9, 2017 through December 31, 2017 period.
43
KNIGHT-SWIFT TRANSPORTATION HOLDINGS INC.
MANAGEMENT'S DISCUSSION AND ANALYSIS OF FINANCIAL CONDITION AND RESULTS OF OPERATIONS — CONTINUED
Results of Operations — Consolidated Operating and Other Expenses |
Consolidated Operating Expenses
The following tables present certain operating expenses from our consolidated income statements, including each operating expense as a percentage of total revenue and as a percentage of revenue before fuel surcharge. Fuel surcharge revenue can be volatile and is primarily dependent upon the cost of fuel, rather than operation expenses unrelated to fuel. Therefore, we believe that revenue before fuel surcharge is a better measure for analyzing many of our expenses and operating metrics.
Note: Our 2017 results of operations include the results of operations of Swift after September 8, 2017. Results for periods on and prior to September 8, 2017 reflect only those of Knight and do not include the results of operations of Swift. Accordingly, comparisons between our 2017 results and prior periods may not be meaningful.
2017 | 2016 | 2015 | 2017 vs. 2016 | 2016 vs. 2015 | |||||||||||||
(Dollars in thousands) | Increase (decrease) | ||||||||||||||||
Salaries, wages, and benefits | $ | 688,543 | $ | 333,929 | $ | 334,069 | 106.2 | % | — | ||||||||
% of total revenue | 28.4 | % | 29.9 | % | 28.2 | % | (150 bps) | 170 | bps | ||||||||
% of revenue before fuel surcharge | 31.6 | % | 32.5 | % | 31.5 | % | (90 bps) | 100 | bps | ||||||||
Salaries, wages, and benefits expense is primarily affected by the total number of miles driven by company driving associates, the rate per mile we pay our company driving associates, and employee benefits, including healthcare, workers' compensation, and other benefits. To a lesser extent, non-driver employee headcount, compensation, and benefits affect this expense. Driving associate wages is the largest component of salaries, wages, and benefits expense. We believe the driver market will continue to remain challenging and that several ongoing market factors have further reduced the pool of available driving associates. Having a sufficient number of qualified driving associates continues to be a major concern and our biggest headwind, although we continue to seek ways to attract and retain qualified driving associates, including investing in technology and terminals that improve the experience of driving associates. We expect driving associate pay to be inflationary, and we anticipate granting additional increases to our driving associates in the near term if supported by increases in the rates we receive from our customers as the market for qualified driving associates continues to tighten.
2017 Compared to 2016 — The $354.6 million increase in consolidated salaries, wages, and benefits includes $352.6 million of expense from Swift's results for the September 9, 2017 through December 31, 2017 period, which included the wage increase we granted to over-the-road driving associates that was effective upon the 2017 Merger closing. Further, Knight's salaries, wages, and benefits expense increased $2.0 million from 2016 to 2017. In 2017, we recorded $5.6 million in merger-related bonuses and accelerated stock compensation expense recorded upon the close of the 2017 Merger. These items were offset primarily by a 6.9% decrease in miles driven by Knight's company driving associates from 2016 to 2017. As a percentage of revenue before fuel surcharge, Knight's expense remained relatively flat.
2016 Compared to 2015 — Salaries, wages, and benefits expense, as a percentage of total revenue, increased to 29.9% in 2016 from 28.2% in 2015. The primary reason for the increase is attributable to lower total revenue in 2016 compared to 2015, as the dollar expense remained relatively flat.
2017 | 2016 | 2015 | 2017 vs. 2016 | 2016 vs. 2015 | |||||||||||||
(Dollars in thousands) | Increase (decrease) | ||||||||||||||||
Fuel | $ | 274,956 | $ | 129,696 | $ | 152,752 | 112.0 | % | (15.1 | %) | |||||||
% of total revenue | 11.3 | % | 11.6 | % | 12.9 | % | (30 bps) | (130 bps) | |||||||||
% of revenue before fuel surcharge | 12.6 | % | 12.6 | % | 14.4 | % | — | (180 bps) | |||||||||
Fuel expense consists primarily of diesel fuel expense for our company-owned tractors and fuel taxes. The primary factors affecting our fuel expense are the cost of diesel fuel, the fuel economy of our equipment, and the miles driven by company driving associates.
Our fuel surcharge programs help to offset increases in fuel prices, but apply only to loaded miles and typically do not offset non-paid empty miles, idle time, and out-of-route miles driven. Typical fuel surcharge programs involve a computation based on the change in national or regional fuel prices. These programs may update as often as weekly, but typically require a specified minimum change in fuel cost to prompt a change in fuel surcharge revenue for our trucking segments. Therefore, many of these programs have a time lag between when fuel costs change and when the change is reflected in fuel surcharge revenue. Due to this time lag, our fuel expense, net of fuel surcharge, negatively impacts our operating income during periods of sharply rising fuel costs and positively impacts our operating income during periods of falling fuel costs. We continue to utilize our fuel efficiency initiatives such as trailer blades, idle-control, managing tractor speeds, updating our fleet with more fuel-efficient engines, managing fuel procurement, and driving associate training programs that we believe contribute to controlling our fuel expense.
44
KNIGHT-SWIFT TRANSPORTATION HOLDINGS INC.
MANAGEMENT'S DISCUSSION AND ANALYSIS OF FINANCIAL CONDITION AND RESULTS OF OPERATIONS — CONTINUED
2017 Compared to 2016 — The $145.3 million increase in consolidated fuel expense includes $131.2 million of expense from Swift's results for the September 9, 2017 through December 31, 2017 period. Knight's fuel expense increased $14.1 million from 2016 to 2017. As a percentage of revenue before fuel surcharge, consolidated fuel expense was consistent, despite higher average United States diesel fuel prices in 2017 of $2.65, compared to 2016 of $2.30. Higher diesel fuel prices were offset by a 6.9% decrease in miles driven by Knight's company driving associates.
2016 Compared to 2015 — Fuel expense decreased, as a percentage of total revenue, to 11.6% in 2016, from 12.9% in 2015, as the US National Average Diesel Fuel price decreased by 14.9% in 2016. Fuel prices were falling throughout 2015 and bottomed out in the first quarter of 2016, before rising in each of the remaining quarters of 2016.
2017 | 2016 | 2015 | 2017 vs. 2016 | 2016 vs. 2015 | |||||||||||||
(Dollars in thousands) | Increase (decrease) | ||||||||||||||||
Operations and maintenance | $ | 164,307 | $ | 76,246 | $ | 80,855 | 115.5 | % | (5.7 | %) | |||||||
% of total revenue | 6.8 | % | 6.8 | % | 6.8 | % | — | — | |||||||||
% of revenue before fuel surcharge | 7.5 | % | 7.4 | % | 7.6 | % | 10 | bps | (20 bps) | ||||||||
Operations and maintenance expense consists of direct operating expenses, equipment maintenance, and tire expense. Operations and maintenance expenses are affected by the age of our company-owned fleet of tractors and trailers. We expect the driver market to remain competitive throughout 2018, which could increase future driving associate development and recruiting costs and negatively affect our operations and maintenance expense. We expect to begin refreshing our Knight and Swift tractor fleets in the coming quarters, and anticipate that maintenance costs will gradually decrease as we reduce the average age of our fleet.
2017 Compared to 2016 — The $88.1 million increase in operations and maintenance expense includes $81.6 million of expense from Swift's results for the September 9, 2017 through December 31, 2017 period. Increasing maintenance expense is negatively impacting performance in our Swift Truckload, Swift Dedicated, and Swift Refrigerated segments. Knight's operations and maintenance expense increased $6.5 million from 2016 to 2017. With rising equipment prices and a soft used equipment market, Knight extended its tractor trade cycle beginning in the third quarter of 2016. Accordingly, equipment maintenance expense increased from 2016 to 2017 as Knight has been maintaining its tractors for comparatively longer periods. As a percentage of revenue before fuel surcharge, consolidated operations and maintenance expense was relatively consistent. Direct operating expenses, including operating supplies and driving associate development and recruiting costs also increased from 2016 to 2017.
2016 Compared to 2015 — Operations and maintenance expense, as a percentage of total revenue, remained flat at 6.8% in 2016 and 2015. Operations and maintenance expense as a percentage of revenue before fuel surcharge, decreased to 7.4% in 2016 from 7.6% in 2015, due to improved cost control measures at Knight. Direct operating expenses decreased as a percentage of total revenue before fuel surcharge in 2016 due to lower operating supply costs and drayage related operating costs.
2017 | 2016 | 2015 | 2017 vs. 2016 | 2016 vs. 2015 | |||||||||||||
(Dollars in thousands) | Increase (decrease) | ||||||||||||||||
Insurance and claims | $ | 95,199 | $ | 34,441 | $ | 33,632 | 176.4 | % | 2.4 | % | |||||||
% of total revenue | 3.9 | % | 3.1 | % | 2.9 | % | 80 | bps | 20 | bps | |||||||
% of revenue before fuel surcharge | 4.4 | % | 3.3 | % | 3.2 | % | 110 | bps | 10 | bps | |||||||
Insurance and claims expense consists of premiums for liability, physical damage, and cargo, and will vary based upon the frequency and severity of claims, as well as our level of self-insurance, and premium expense. In recent years, insurance carriers have raised premiums for many businesses, including transportation companies, and as a result, our insurance and claims expense could increase in the future, or we could raise our self-insured retention when our policies are renewed or replaced. Insurance and claims expense also varies based on the number of miles driven by company driving associates and independent contractors, the frequency and severity of accidents, trends in development factors used in actuarial accruals, and developments in large, prior-year claims.
2017 Compared to 2016 — The $60.8 million increase in consolidated insurance and claims expense includes $60.0 million of expense from Swift's results for the September 9, 2017 through December 31, 2017 period. Knight's insurance and claims expense increased $0.8 million from 2016 to 2017. As a percentage of revenue before fuel surcharge, consolidated insurance and claims expense increased by 110 basis points. The increase is predominately associated with Swift's higher self-retention limits assumed following the close of the 2017 Merger, which may cause our insurance and claims expense to fluctuate more in future periods.
2016 Compared to 2015 — Insurance and claims expense, as a percentage of total revenue, increased to 3.1% in 2016, from 2.9% in 2015. Insurance and claims expense as a percentage of total revenue before fuel surcharge increased slightly to 3.3% in 2016 from 3.2% in 2015, and increased slightly on a per mile basis, year-over-year. The increase was partly due to the decrease in total revenue in 2016 from 2015, combined with slightly higher premium costs and changes in the severity of claims.
45
KNIGHT-SWIFT TRANSPORTATION HOLDINGS INC.
MANAGEMENT'S DISCUSSION AND ANALYSIS OF FINANCIAL CONDITION AND RESULTS OF OPERATIONS — CONTINUED
2017 | 2016 | 2015 | 2017 vs. 2016 | 2016 vs. 2015 | |||||||||||||
(Dollars in thousands) | Increase (decrease) | ||||||||||||||||
Operating taxes and licenses | $ | 40,544 | $ | 18,728 | $ | 18,911 | 116.5 | % | (1.0 | %) | |||||||
% of total revenue | 1.7 | % | 1.6 | % | 1.6 | % | 10 | bps | — | ||||||||
% of revenue before fuel surcharge | 1.9 | % | 1.8 | % | 1.8 | % | 10 | bps | — | ||||||||
Operating taxes and licenses include state franchise taxes, federal highway use taxes, property taxes, vehicle license and registration fees, fuel and mileage taxes, among others. The expense is impacted by changes in the tax rates and registration fees associated with our tractor fleet and regional operating facilities.
2017 Compared to 2016 — The $21.8 million increase in consolidated operating taxes and licenses includes $21.7 million of expense from Swift's results for the September 9, 2017 through December 31, 2017 period. Knight's operating taxes and licenses expense remained relatively flat from 2016 to 2017. As a percentage of revenue before fuel surcharge, consolidated operating taxes and licenses remained relatively flat from 2016 to 2017.
2016 Compared to 2015 — Operating taxes and licenses expense, as a percentage of total revenue, remained relatively flat in 2016 and 2015.
2017 | 2016 | 2015 | 2017 vs. 2016 | 2016 vs. 2015 | |||||||||||||
(Dollars in thousands) | Increase (decrease) | ||||||||||||||||
Communications | $ | 10,691 | $ | 4,182 | $ | 4,095 | 155.6 | % | 2.1 | % | |||||||
% of total revenue | 0.4 | % | 0.4 | % | 0.3 | % | — | 10 | bps | ||||||||
% of revenue before fuel surcharge | 0.5 | % | 0.4 | % | 0.4 | % | 10 | bps | — | ||||||||
Communications expense is comprised of costs associated with our tractor and trailer tracking systems, information technology systems, and phone systems.
2017 Compared to 2016 — The $6.5 million increase in consolidated communications expense includes $6.2 million of expense from Swift's results for the September 9, 2017 through December 31, 2017 period. Knight's communications expense slightly increased from 2016 to 2017, but remained flat as a percentage of revenue before fuel surcharge, as did consolidated communications expense.
2016 Compared to 2015 — Communications expense, as a percentage of total revenue, remained flat at 0.4% for 2016 and 2015.
2017 | 2016 | 2015 | 2017 vs. 2016 | 2016 vs. 2015 | |||||||||||||
(Dollars in thousands) | Increase (decrease) | ||||||||||||||||
Depreciation and amortization of property and equipment | $ | 193,733 | $ | 115,660 | $ | 110,523 | 67.5 | % | 4.6 | % | |||||||
% of total revenue | 8.0 | % | 10.3 | % | 9.3 | % | (230 bps) | 100 | bps | ||||||||
% of revenue before fuel surcharge | 8.9 | % | 11.2 | % | 10.4 | % | (230 bps) | 80 | bps | ||||||||
Depreciation relates primarily to our owned tractors, trailers, ELDs and other communication units, and other similar assets. Changes to this fixed cost are generally attributed to increases or decreases to company-owned equipment, the relative percentage of owned versus leased equipment, and fluctuations in new equipment purchase prices, which have historically been precipitated in part by new or proposed federal and state regulations (such as the EPA engine emissions requirements relating to post-2014 model tractors and the California trailer efficiency requirements). Depreciation can also be affected by the cost of used equipment that we sell or trade and the replacement of older used equipment. Management periodically reviews the condition, average age, and reasonableness of estimated useful lives and salvage values of our equipment and considers such factors in light of our experience with similar assets, used equipment market conditions, and prevailing industry practice.
2017 Compared to 2016 — The $78.1 million increase in consolidated depreciation and amortization of property and equipment includes $77.1 million of expense from Swift's results for the September 9, 2017 through December 31, 2017 period. Knight's depreciation and amortization of property and equipment increased slightly in 2017 compared to 2016.
Knight extended its trade cycle for its tractors and reduced its average tractor count, which reduced capital expenditures. Knight has been proactive in managing its preventative maintenance program with a goal of partially mitigating the additional maintenance cost commonly associated with a slightly older fleet. We expect to begin refreshing Knight and Swift tractor fleets through replacement units in the coming quarters, and anticipate that depreciation and amortization costs will increase in future quarters. See additional discussion of depreciation and amortization of property and equipment under "Results of Operations — Segment Review," above.
46
KNIGHT-SWIFT TRANSPORTATION HOLDINGS INC.
MANAGEMENT'S DISCUSSION AND ANALYSIS OF FINANCIAL CONDITION AND RESULTS OF OPERATIONS — CONTINUED
2016 Compared to 2015 — Consolidated depreciation and amortization of property and equipment, as a percentage of total revenue, increased from 2015 to 2016, in part due to the decrease in fuel surcharge revenue. As a percentage of revenue before fuel surcharge, depreciation and amortization increased to 11.2% in 2016 from 10.4% in 2015. This increase was due to a combination of the decrease in revenue before fuel surcharge, driven by the decrease in average revenue per tractor in our Knight Trucking segment, and the decrease in revenue from our less asset-intensive Knight Logistics segment, driven by the decrease in revenue per load and reduced non-Trucking service revenue.
2017 | 2016 | 2015 | 2017 vs. 2016 | 2016 vs. 2015 | |||||||||||||
(Dollars in thousands) | Increase (decrease) | ||||||||||||||||
Amortization of intangibles | $ | 13,372 | $ | 500 | $ | 500 | 2,574.4 | % | — | ||||||||
% of total revenue | 0.6 | % | — | % | — | % | 60 | bps | — | ||||||||
% of revenue before fuel surcharge | 0.6 | % | — | % | — | % | 60 | bps | — | ||||||||
Amortization of intangibles primarily relates to intangible assets identified with the 2017 Merger. See Note 4 and Note 11 in Part II, Item 8, of this Annual Report for further details regarding the Company's intangible assets, historical amortization, and anticipated future amortization.
2017 Compared to 2016 — The $12.9 million increase in consolidated amortization of intangibles is entirely attributed to Swift's amortization of the intangible assets identified with the 2017 Merger.
2016 Compared to 2015 — There was no change in amortization of intangibles from 2015 to 2016.
2017 | 2016 | 2015 | 2017 vs. 2016 | 2016 vs. 2015 | |||||||||||||
(Dollars in thousands) | Increase (decrease) | ||||||||||||||||
Rental expense | $ | 74,224 | $ | 5,036 | $ | 4,695 | 1,373.9 | % | 7.3 | % | |||||||
% of total revenue | 3.1 | % | 0.5 | % | 0.4 | % | 260 | bps | 10 | bps | |||||||
% of revenue before fuel surcharge | 3.4 | % | 0.5 | % | 0.4 | % | 290 | bps | 10 | bps | |||||||
Rental expense consists primarily of payments for tractors and trailers financed with operating leases. The primary factors affecting the expense are the size our revenue equipment fleet and the relative percentage of owned versus leased equipment.
2017 Compared to 2016 — The $69.2 million increase in consolidated rental expense includes $69.0 million of expense from Swift's results for the September 9, 2017 through December 31, 2017 period. Knight's rental expense increased slightly from 2016 to 2017, but remained flat as a percentage of revenue before fuel surcharge. Consolidated rental expense as a percentage of revenue before fuel surcharge increased, as Swift historically obtained a larger portion of its equipment through operating leases, as compared to Knight.
2016 Compared to 2015 — As a percentage of revenue before fuel surcharge, rental expense was consistent from 2015 to 2016.
2017 | 2016 | 2015 | 2017 vs. 2016 | 2016 vs. 2015 | |||||||||||||
(Dollars in thousands) | Increase (decrease) | ||||||||||||||||
Purchased transportation | $ | 594,113 | $ | 233,863 | $ | 246,864 | 154.0 | % | (5.3 | %) | |||||||
% of total revenue | 24.5 | % | 20.9 | % | 20.9 | % | 360 | bps | — | ||||||||
% of revenue before fuel surcharge | 27.3 | % | 22.7 | % | 23.3 | % | 460 | bps | (60 bps) | ||||||||
Purchased transportation expense is comprised of (1) payments to independent contractors in our trucking operations and (2) payments to third-party capacity providers related to logistics, freight management, and non-trucking services in our logistics and intermodal businesses. Purchased transportation is generally affected by capacity in the market as well changes in fuel prices. As capacity tightens, our payments to third-party capacity providers and to independent contractors tend to increase. Additionally, as fuel prices increase, payments to third-party capacity providers and independent contractors increase.
2017 Compared to 2016 — The $360.3 million increase in consolidated purchased transportation includes $347.3 million of expense from Swift's results for the September 9, 2017 through December 31, 2017 period. Knight's purchased transportation expense increased by $13.0 million and increased as a percentage of revenue before fuel surcharge by 140 basis points. US diesel fuel prices were higher on average in 2017 at $2.65, compared to 2016 at $2.30, which increased our payments made to independent contractors for fuel reimbursements. Additionally, there was a 2.8% increase in miles driven by independent contractors from 2016 to 2017. In 2017, we also incurred $0.1 million in driver-incentive expenses related to the 2017 Merger. See additional discussion of purchased transportation expense under "Results of Operations — Segment Review," above.
47
KNIGHT-SWIFT TRANSPORTATION HOLDINGS INC.
MANAGEMENT'S DISCUSSION AND ANALYSIS OF FINANCIAL CONDITION AND RESULTS OF OPERATIONS — CONTINUED
We expect purchased transportation will increase as a percentage of revenue if we are successful in continuing to grow our logistics businesses, as well as Swift Intermodal. The increase could be partially offset if independent contractors exit the market with recent regulatory changes or further increased if we need to pay independent contractors more to stay with us in light of such regulatory changes. Third-party capacity has recently tightened, and we anticipate that this trend will continue into 2018.
2016 Compared to 2015 — Purchased transportation expense, as a percentage of total revenue, remained flat at 20.9% for 2016 and 2015. The overall decrease in this category is primarily due to lower fuel surcharge equivalent payments to independent contractors and third-party capacity providers.
2017 | 2016 | 2015 | 2017 vs. 2016 | 2016 vs. 2015 | |||||||||||||
(Dollars in thousands) | Increase (decrease) | ||||||||||||||||
Impairments | $ | 16,844 | $ | — | $ | — | — | — | |||||||||
% of total revenue | 0.7 | % | — | % | — | % | 70 | bps | — | ||||||||
% of revenue before fuel surcharge | 0.8 | % | — | % | — | % | 80 | bps | — | ||||||||
2017 Compared to 2016 — During the third quarter of 2017, we terminated the implementation of Swift's ERP system, resulting in a pre-tax impairment loss of $16.7 million. During the fourth quarter of 2017, management reassessed the fair value of certain tractors within one of the Company's leasing subsidiaries, determining that there was a pre-tax impairment loss of $0.1 million.
2016 Compared to 2015 — There were no impairments in 2016 or 2015.
2017 | 2016 | 2015 | 2017 vs. 2016 | 2016 vs. 2015 | |||||||||||||
(Dollars in thousands) | Increase (decrease) | ||||||||||||||||
Miscellaneous operating expenses, net | $ | 41,781 | $ | 17,274 | $ | 18,068 | 141.9 | % | (4.4 | %) | |||||||
% of total revenue | 1.7 | % | 1.5 | % | 1.5 | % | 20 | bps | — | ||||||||
% of revenue before fuel surcharge | 1.9 | % | 1.7 | % | 1.7 | % | 20 | bps | — | ||||||||
Miscellaneous operating expenses, net primarily consists of legal and professional services fees, general and administrative expenses, other costs, as well as gain on sales of equipment.
2017 Compared to 2016 — The $24.5 million increase in consolidated miscellaneous operating expenses, net includes $19.2 million of expense from Swift's results for the September 9, 2017 through December 31, 2017 period. Knight's miscellaneous operating expenses, net increased $5.3 million from 2016 to 2017, and increased 50 basis points as a percentage of revenue before fuel surcharge. The increase is primarily due to Knight's $4.3 million decrease in gain on sales of equipment, as Knight extended the trade cycle of its tractors in the latter half of 2016 and throughout 2017, resulting in fewer units disposed of in 2017 compared to 2016. The used tractor market continued to be soft throughout much of 2017, but showed signs of strengthening in the latter half of the year. We believe the used equipment market will continue to help offset other miscellaneous operating expenses, but not to the extent Knight and Swift experienced in prior years, and we expect a similar environment throughout 2018. We additionally recorded $0.9 million in 2017 for merger-related statutory filings associated with the 2017 Merger.
2016 Compared to 2015 — Miscellaneous operating expenses decreased from 2015 to 2016 due to decreased legal expenses. This was partially offset by a decrease in gain on sale of used equipment to $8.1 million in 2016, from $15.3 million in 2015, as a result of a soft used equipment resale market prevalent in 2016.
2017 | 2016 | 2015 | 2017 vs. 2016 | 2016 vs. 2015 | |||||||||||||
(Dollars in thousands) | Increase (decrease) | ||||||||||||||||
Merger-related costs | $ | 16,516 | $ | — | $ | — | — | — | |||||||||
% of total revenue | 0.7 | % | — | % | — | % | 70 | bps | — | ||||||||
% of revenue before fuel surcharge | 0.8 | % | — | % | — | % | 80 | bps | — | ||||||||
2017 Compared to 2016 — Direct and incremental costs associated with the 2017 Merger were recorded on a separate line item in the consolidated income statement in 2017 as "Merger-related costs." These costs were primarily incurred for legal and professional fees associated with the transaction. See other merger-related operating expenses associated with the 2017 Merger discussed within "Salaries, wages, and, benefits" and "Miscellaneous operating expenses, net" above.
2016 Compared to 2015 — Not applicable.
48
KNIGHT-SWIFT TRANSPORTATION HOLDINGS INC.
MANAGEMENT'S DISCUSSION AND ANALYSIS OF FINANCIAL CONDITION AND RESULTS OF OPERATIONS — CONTINUED
Consolidated Other Expenses
The following table summarizes fluctuations in certain non-operating expenses, included in our consolidated income statements:
2017 | 2016 | 2015 | 2017 vs. 2016 | 2016 vs. 2015 | |||||||||||||
(Dollars in thousands) | Increase (decrease) | ||||||||||||||||
Interest income | $ | 1,207 | $ | 309 | $ | 460 | 290.6 | % | (32.8 | %) | |||||||
Interest expense | $ | (8,686 | ) | $ | (897 | ) | $ | (998 | ) | 868.3 | % | (10.1 | %) | ||||
Other income, net | $ | 558 | $ | 4,939 | $ | 9,042 | (88.7 | %) | (45.4 | %) | |||||||
Income tax benefit (expense) | $ | 291,716 | $ | (57,592 | ) | $ | (68,047 | ) | (606.5 | %) | (15.4 | %) | |||||
Interest income — Interest income includes interest earned from financing revenue equipment to independent contractors, as well as interest earned from our investments.
2017 Compared to 2016 — The $0.9 million increase in consolidated interest income includes $0.7 million of income from Swift's results for the September 9, 2017 through December 31, 2017 period. Knight's interest income increased by $0.2 million from 2016 to 2017.
2016 Compared to 2015 — The 2016 and 2015 balances were below our threshold for explanation.
Interest expense — Interest expense is comprised of debt and capital lease interest expense as well as amortization of deferred loan costs.
2017 Compared to 2016 — The $7.8 million increase in consolidated interest expense is attributed to Swift's higher debt balances replacing Knight's lower debt balances in conjunction with the 2017 Debt Agreement in September 2017. The $7.8 million increase includes $8.5 million of expense from Swift's results for the September 9, 2017 through December 31, 2017 period. See Note 16 in Part II, Item 8 of this Annual Report for further information related to the 2017 Debt Agreement and related interest rates and deferred loan costs.
2016 Compared to 2015 — Interest expense decreased in 2016 because of the decreased average borrowing during the year. Our debt balance decreased to $18.0 million at December 31, 2016 from $112.0 million at December 31, 2015.
Other income, net — Other income, net is primarily comprised of income (expense) from realized gains on sale of available-for-sale securities, unrealized gains from Knight's investments in Transportation Resource Partners accounted for under the equity method, as well as certain other non-operating income and expense that may arise outside of the normal course of business.
2017 Compared to 2016 — The $4.4 million decrease in consolidated other income, net was driven by Knight's disposal of its remaining available-for-sale securities for a $4.5 million gain in 2016. Additionally, we contributed $2.0 million to a charitable foundation in 2017. The impact of these activities was partially offset by a $1.0 million increase in gain on TRP investments from 2016 to 2017, as well as $0.4 million in expense from Swift's results for the September 9, 2017 through December 31, 2017 period.
2016 Compared to 2015 — The decrease in other income, net was driven by a $4.1 million decrease in realized gains from the sale of available-for-sale securities in 2016, compared to 2015, primarily due to fewer securities sold during 2016.
Income tax benefit (expense) — In addition to the discussion below, Note 14 in Part II, Item 8 of this Annual Report provides further analysis related to income taxes.
2017 Compared to 2016 — Consolidated income taxes changed from expense of $57.6 million (with an effective tax rate of 38.0%) in 2016 to a benefit of $291.7 million (with an effective tax rate of (150.6%) in 2017). The income tax benefit in 2017 was driven by a $364.2 million income tax benefit representing management's estimate of the net impact of the Tax Cuts and Jobs Act enacted during the fourth quarter. Discrete items, such as stock compensation deductions, the impact of state tax rate changes on deferred taxes, among others were also included in the 2017 income tax benefit.
2016 Compared to 2015 — Our effective tax rate was 38.0% for 2016 and 36.8% for 2015. The unusually low rate in 2015 was attributable to favorable tax positions taken on amended federal and state income tax returns for tax years 2010 through 2013 and other miscellaneous non-recurring decreases, which positively impacted our net income by approximately $5.4 million.
49
KNIGHT-SWIFT TRANSPORTATION HOLDINGS INC.
MANAGEMENT'S DISCUSSION AND ANALYSIS OF FINANCIAL CONDITION AND RESULTS OF OPERATIONS — CONTINUED
Non-GAAP Financial Measures |
The terms "Adjusted Net Income Attributable to Knight-Swift," "Adjusted EPS," and "Adjusted Operating Ratio", as we define them, are not presented in accordance with GAAP. These financial measures supplement our GAAP results in evaluating certain aspects of our business. We believe that using these measures improves comparability in analyzing our performance because they remove the impact of items from our operating results that, in our opinion, do not reflect our core operating performance. Management and the Board focus on Adjusted Net Income Attributable to Knight-Swift, Adjusted EPS, and Adjusted Operating Ratio as key measures of our performance, all of which are reconciled to the most comparable GAAP financial measures and further discussed below. We believe our presentation of these non-GAAP financial measures is useful because it provides investors and securities analysts the same information that we use internally for purposes of assessing our core operating performance.
Adjusted Net Income Attributable to Knight-Swift, Adjusted EPS, and Adjusted Operating Ratio are not substitutes for their comparable GAAP financial measures, such as net income, cash flows from operating activities, operating margin, or other measures prescribed by GAAP. There are limitations to using non-GAAP financial measures. Although we believe that they improve comparability in analyzing our period to period performance, they could limit comparability to other companies in our industry if those companies define these measures differently. Because of these limitations, our non-GAAP financial measures should not be considered measures of income generated by our business or discretionary cash available to us to invest in the growth of our business. Management compensates for these limitations by primarily relying on GAAP results and using non-GAAP financial measures on a supplemental basis.
Pursuant to the requirements of Regulation G, the following tables reconcile GAAP consolidated net income attributable to Knight-Swift to non-GAAP consolidated Adjusted Net Income attributable to Knight-Swift, GAAP consolidated earnings per diluted share to non-GAAP consolidated Adjusted Earnings per Diluted Share, GAAP consolidated operating ratio to non-GAAP consolidated Adjusted Operating Ratio, and GAAP reportable segment operating ratio to non-GAAP reportable segment Adjusted Operating Ratio.
In the consolidated GAAP to non-GAAP reconciliations below, 2014 and 2013 are included to support the five-year presentation in "Selected Financial Data" in Part II, Item 6 of this Annual Report.
Note: Our results of operations for 2017 include the results of operations of Swift after September 8, 2017. Results for periods on and prior to September 8, 2017 reflect only those of Knight and do not include the results of operations of Swift. Accordingly, comparisons between our 2017 results and prior periods may not be meaningful.
Non-GAAP Reconciliation:
Consolidated Adjusted Net Income Attributable to Knight-Swift and Adjusted EPS
2017 | 2016 | 2015 | 2014 | 2013 | |||||||||||||||
(Dollars in thousands) | |||||||||||||||||||
GAAP: Net income attributable to Knight-Swift | $ | 484,292 | $ | 93,863 | $ | 116,718 | $ | 102,862 | $ | 69,282 | |||||||||
Adjusted for: | |||||||||||||||||||
Income tax (benefit) expense attributable to Knight-Swift | (291,716 | ) | 57,592 | 68,047 | 67,809 | 46,680 | |||||||||||||
Income before income taxes attributable to Knight-Swift | 192,576 | 151,455 | 184,765 | 170,671 | 115,962 | ||||||||||||||
Impairments (1) | 16,844 | — | — | — | — | ||||||||||||||
Accruals for class action lawsuits (2) | 1,900 | 2,450 | 7,163 | — | — | ||||||||||||||
Amortization of 2017 Merger intangibles (3) | 12,872 | — | — | — | — | ||||||||||||||
Other merger-related operating expenses (4) | 6,596 | — | — | — | — | ||||||||||||||
Merger-related costs (5) | 16,516 | — | — | — | — | ||||||||||||||
Adjusted income before income taxes | 247,304 | 153,905 | 191,928 | 170,671 | 115,962 | ||||||||||||||
Provision for income tax expense at effective rate (6) | (92,739 | ) | (58,532 | ) | (70,815 | ) | (67,809 | ) | (46,680 | ) | |||||||||
Non-GAAP: Adjusted Net Income Attributable to Knight-Swift | $ | 154,565 | $ | 95,373 | $ | 121,113 | $ | 102,862 | $ | 69,282 | |||||||||
50
KNIGHT-SWIFT TRANSPORTATION HOLDINGS INC.
MANAGEMENT'S DISCUSSION AND ANALYSIS OF FINANCIAL CONDITION AND RESULTS OF OPERATIONS — CONTINUED
Note: Since the numbers reflected in the table below are calculated on a per share basis, they may not foot due to rounding.
2017 | 2016 | 2015 | 2014 | 2013 | |||||||||||||||
GAAP: Diluted earnings per share | $ | 4.34 | $ | 1.16 | $ | 1.42 | $ | 1.25 | $ | 0.86 | |||||||||
Adjusted for: | |||||||||||||||||||
Income tax (benefit) expense attributable to Knight-Swift | (2.61 | ) | 0.71 | 0.83 | 0.83 | 0.58 | |||||||||||||
Income before income taxes attributable to Knight-Swift | 1.72 | 1.86 | 2.24 | 2.08 | 1.44 | ||||||||||||||
Impairments (1) | 0.15 | — | — | — | — | ||||||||||||||
Accruals for class action lawsuits (2) | 0.02 | 0.03 | 0.09 | — | — | ||||||||||||||
Amortization of 2017 Merger intangibles (3) | 0.12 | — | — | — | — | ||||||||||||||
Other merger-related operating expenses (4) | 0.06 | — | — | — | — | ||||||||||||||
Merger-related costs (5) | 0.15 | — | — | — | — | ||||||||||||||
Adjusted income before income taxes | 2.21 | 1.89 | 2.33 | 2.08 | 1.44 | ||||||||||||||
Provision for income tax expense at effective rate (6) | (0.83 | ) | (0.72 | ) | (0.86 | ) | (0.83 | ) | (0.58 | ) | |||||||||
Non-GAAP: Adjusted EPS | $ | 1.38 | $ | 1.17 | $ | 1.47 | $ | 1.25 | $ | 0.86 | |||||||||
____________
(1) | Impairment related to the termination of Swift's implementation of a new ERP system during the quarter ended September 30, 2017. Additionally, during the quarter ended December 31, 2017, management reassessed the fair value of certain tractors within the Company's leasing subsidiary, Interstate Equipment Leasing, LLC, determining that there was a pre-tax impairment loss. |
(2) | In 2017, 2016 and 2015, we accrued expenses incurred related to certain class action lawsuits involving employment-related claims. |
(3) | "Amortization of 2017 Merger intangibles" specifically reflects the non-cash amortization expense relating to certain intangible assets identified in the 2017 Merger. Certain data necessary to complete the purchase price allocation is open for adjustments during the measurement period, and includes, but is not limited to, the finalization of certain identified contingent liabilities and the calculation of deferred taxes based upon the underlying tax basis of assets acquired and liabilities assumed and assessment of other tax related items. We believe the estimates used are reasonable but are subject to change as additional information becomes available. |
(4) | "Other merger-related operating expenses" represent one-time expenses associated with the 2017 Merger, including acceleration of stock compensation expense, bonuses, and other operating expenses. |
(5) | Knight-Swift incurred certain merger-related expenses associated with the 2017 Merger, consisting of legal and professional fees. |
(6) | For 2017, a normalized effective tax rate of 37.5% was utilized to calculate "Provision for income tax expense at effective rate," as the actual effective tax rate for the year includes a significant income tax benefit representing management's estimate of the net impact of the Tax Cuts and Jobs Act passed during the fourth quarter of 2017. |
51
KNIGHT-SWIFT TRANSPORTATION HOLDINGS INC.
MANAGEMENT'S DISCUSSION AND ANALYSIS OF FINANCIAL CONDITION AND RESULTS OF OPERATIONS — CONTINUED
Non-GAAP Reconciliation: Consolidated Adjusted Operating Ratio
2017 | 2016 | 2015 | 2014 | 2013 | |||||||||||||||
GAAP Presentation | (Dollars in thousands) | ||||||||||||||||||
Total revenue | $ | 2,425,453 | $ | 1,118,034 | $ | 1,182,964 | $ | 1,102,332 | $ | 969,237 | |||||||||
Total operating expenses | (2,224,823 | ) | (969,555 | ) | (1,004,964 | ) | (939,610 | ) | (855,328 | ) | |||||||||
Operating income | $ | 200,630 | $ | 148,479 | $ | 178,000 | $ | 162,722 | $ | 113,909 | |||||||||
Operating ratio | 91.7 | % | 86.7 | % | 85.0 | % | 85.2 | % | 88.2 | % | |||||||||
Non-GAAP Presentation | |||||||||||||||||||
Total revenue | $ | 2,425,453 | $ | 1,118,034 | $ | 1,182,964 | $ | 1,102,332 | $ | 969,237 | |||||||||
Fuel surcharge | (245,580 | ) | (89,886 | ) | (121,225 | ) | (176,347 | ) | (177,386 | ) | |||||||||
Revenue before fuel surcharge | 2,179,873 | 1,028,148 | 1,061,739 | 925,985 | 791,851 | ||||||||||||||
Total operating expenses | 2,224,823 | 969,555 | 1,004,964 | 939,610 | 855,328 | ||||||||||||||
Adjusted for: | |||||||||||||||||||
Fuel surcharge | (245,580 | ) | (89,886 | ) | (121,225 | ) | (176,347 | ) | (177,386 | ) | |||||||||
Impairments (1) | (16,844 | ) | — | — | — | — | |||||||||||||
Accruals for class action lawsuits (2) | (1,900 | ) | (2,450 | ) | (7,163 | ) | — | — | |||||||||||
Amortization of 2017 Merger intangibles (3) | (12,872 | ) | — | — | — | — | |||||||||||||
Other merger-related operating expenses (4) | (6,596 | ) | — | — | — | — | |||||||||||||
Merger-related costs (5) | (16,516 | ) | — | — | — | — | |||||||||||||
Adjusted Operating Expenses | 1,924,515 | 877,219 | 876,576 | 763,263 | 677,942 | ||||||||||||||
Adjusted Operating Income | $ | 255,358 | $ | 150,929 | $ | 185,163 | $ | 162,722 | $ | 113,909 | |||||||||
Adjusted Operating Ratio | 88.3 | % | 85.3 | % | 82.6 | % | 82.4 | % | 85.6 | % | |||||||||
____________
(1) | See Non-GAAP Reconciliation: Consolidated Adjusted Net Income Attributable to Knight-Swift and Adjusted EPS footnote (1). |
(2) | See Non-GAAP Reconciliation: Consolidated Adjusted Net Income Attributable to Knight-Swift and Adjusted EPS footnote (2). |
(3) | See Non-GAAP Reconciliation: Consolidated Adjusted Net Income Attributable to Knight-Swift and Adjusted EPS footnote (3). |
(4) | See Non-GAAP Reconciliation: Consolidated Adjusted Net Income Attributable to Knight-Swift and Adjusted EPS footnote (4). |
(5) | See Non-GAAP Reconciliation: Consolidated Adjusted Net Income Attributable to Knight-Swift and Adjusted EPS footnote (5). |
52
KNIGHT-SWIFT TRANSPORTATION HOLDINGS INC.
MANAGEMENT'S DISCUSSION AND ANALYSIS OF FINANCIAL CONDITION AND RESULTS OF OPERATIONS — CONTINUED
Non-GAAP Reconciliation: Reportable Segment Adjusted Operating Ratio
Knight Trucking Segment
2017 | 2016 | 2015 | |||||||||
GAAP Presentation | (Dollars in thousands) | ||||||||||
Total revenue | $ | 906,484 | $ | 900,368 | $ | 952,098 | |||||
Total operating expenses | (814,186 | ) | (764,139 | ) | (789,955 | ) | |||||
Operating income | $ | 92,298 | $ | 136,229 | $ | 162,143 | |||||
Operating ratio | 89.8 | % | 84.9 | % | 83.0 | % | |||||
Non-GAAP Presentation | |||||||||||
Total revenue | $ | 906,484 | $ | 900,368 | $ | 952,098 | |||||
Fuel surcharge | (108,649 | ) | (89,886 | ) | (121,225 | ) | |||||
Intersegment transactions | (129 | ) | (124 | ) | (163 | ) | |||||
Revenue, net of fuel surcharge and intersegment transactions | 797,706 | 810,358 | 830,710 | ||||||||
Total operating expenses | 814,186 | 764,139 | 789,955 | ||||||||
Adjusted for: | |||||||||||
Fuel surcharge | (108,649 | ) | (89,886 | ) | (121,225 | ) | |||||
Intersegment transactions | (129 | ) | (124 | ) | (163 | ) | |||||
Accruals for class action lawsuits (1) | (1,900 | ) | (2,450 | ) | (7,163 | ) | |||||
Other merger-related operating expenses (2) | (6,596 | ) | — | — | |||||||
Merger-related costs (3) | (16,516 | ) | — | — | |||||||
Adjusted Operating Expenses | 680,396 | 671,679 | 661,404 | ||||||||
Adjusted Operating Income | $ | 117,310 | $ | 138,679 | $ | 169,306 | |||||
Adjusted Operating Ratio | 85.3 | % | 82.9 | % | 79.6 | % | |||||
____________
(1) | See Non-GAAP Reconciliation: Consolidated Adjusted Net Income Attributable to Knight-Swift and Adjusted EPS footnote (2). |
(2) | See Non-GAAP Reconciliation: Consolidated Adjusted Net Income Attributable to Knight-Swift and Adjusted EPS footnote (4). |
(3) | See Non-GAAP Reconciliation: Consolidated Adjusted Net Income Attributable to Knight-Swift and Adjusted EPS footnote (5). |
53
KNIGHT-SWIFT TRANSPORTATION HOLDINGS INC.
MANAGEMENT'S DISCUSSION AND ANALYSIS OF FINANCIAL CONDITION AND RESULTS OF OPERATIONS — CONTINUED
Knight Logistics Segment
2017 | 2016 | 2015 | |||||||||
GAAP Presentation | (Dollars in thousands) | ||||||||||
Total revenue | $ | 234,155 | $ | 226,912 | $ | 249,365 | |||||
Total operating expenses | (221,555 | ) | (214,662 | ) | (233,508 | ) | |||||
Operating income | $ | 12,600 | $ | 12,250 | $ | 15,857 | |||||
Operating ratio | 94.6 | % | 94.6 | % | 93.6 | % | |||||
Non-GAAP Presentation | |||||||||||
Total revenue | $ | 234,155 | $ | 226,912 | $ | 249,365 | |||||
Intersegment transactions | (6,203 | ) | (9,122 | ) | (18,336 | ) | |||||
Revenue, net of intersegment transactions | 227,952 | 217,790 | 231,029 | ||||||||
Total operating expenses | 221,555 | 214,662 | 233,508 | ||||||||
Adjusted for: | |||||||||||
Intersegment transactions | (6,203 | ) | (9,122 | ) | (18,336 | ) | |||||
Adjusted Operating Expenses | 215,352 | 205,540 | 215,172 | ||||||||
Adjusted Operating Income | $ | 12,600 | $ | 12,250 | $ | 15,857 | |||||
Adjusted Operating Ratio | 94.5 | % | 94.4 | % | 93.1 | % | |||||
Swift Segments
September 9, 2017 — December 31, 2017 | |||||||||||||||
Swift | Swift | Swift | Swift | ||||||||||||
Truckload | Dedicated | Refrigerated | Intermodal | ||||||||||||
GAAP Presentation | (Dollars in thousands) | ||||||||||||||
Total revenue | $ | 609,112 | $ | 200,628 | $ | 254,102 | $ | 130,441 | |||||||
Total operating expenses | (534,188 | ) | (178,218 | ) | (240,476 | ) | (124,464 | ) | |||||||
Operating income | $ | 74,924 | $ | 22,410 | $ | 13,626 | $ | 5,977 | |||||||
Operating ratio | 87.7 | % | 88.8 | % | 94.6 | % | 95.4 | % | |||||||
Non-GAAP Presentation | |||||||||||||||
Total revenue | $ | 609,112 | $ | 200,628 | $ | 254,102 | $ | 130,441 | |||||||
Fuel surcharge | (72,264 | ) | (20,781 | ) | (24,276 | ) | (17,576 | ) | |||||||
Revenue, net of fuel surcharge | 536,848 | 179,847 | 229,826 | 112,865 | |||||||||||
Total operating expenses | 534,188 | 178,218 | 240,476 | 124,464 | |||||||||||
Adjusted for: | |||||||||||||||
Fuel surcharge | (72,264 | ) | (20,781 | ) | (24,276 | ) | (17,576 | ) | |||||||
Adjusted Operating Expenses | 461,924 | 157,437 | 216,200 | 106,888 | |||||||||||
Adjusted Operating Income | $ | 74,924 | $ | 22,410 | $ | 13,626 | $ | 5,977 | |||||||
Adjusted Operating Ratio | 86.0 | % | 87.5 | % | 94.1 | % | 94.7 | % | |||||||
54
KNIGHT-SWIFT TRANSPORTATION HOLDINGS INC.
MANAGEMENT'S DISCUSSION AND ANALYSIS OF FINANCIAL CONDITION AND RESULTS OF OPERATIONS — CONTINUED
Liquidity and Capital Resources |
Sources of Liquidity
The following table presents our available sources of liquidity as of December 31, 2017:
Source: | Amount | |||
(In thousands) | ||||
Cash and cash equivalents, excluding restricted cash | $ | 76,649 | ||
Availability under Revolver, due July 2020 (1) | 552,748 | |||
Availability under 2015 RSA, due January 2019 (2) | 12,600 | |||
Total unrestricted liquidity | $ | 641,997 | ||
Restricted cash and cash equivalents (3) | 76,971 | |||
Restricted investments, held to maturity, amortized cost (3) | 22,232 | |||
Total liquidity, including restricted cash and restricted investments | $ | 741,200 | ||
____________
(1) | As of December 31, 2017, we had $125.0 million in borrowings under our $800.0 million Revolver. We additionally had $122.3 million in outstanding letters of credit (discussed below), leaving $552.7 million available under the Revolver. |
(2) | Based on eligible receivables at December 31, 2017, our borrowing base for the 2015 RSA was $317.6 million, while outstanding borrowings were $305.0 million. |
(3) | Restricted cash and restricted investments are primarily held by our captive insurance companies for claims payments. "Restricted cash and cash equivalents" consists of $73.7 million is included in "Cash and cash equivalents — restricted" in the consolidated balance sheet and is held by Mohave and Red Rock for claims payments. The remaining $3.3 million is included in "Other long-term assets and restricted cash and other investments" and is held in escrow accounts to meet statutory requirements. |
Uses of Liquidity
Our business requires substantial amounts of cash for operating activities, including salaries and wages paid to our employees, contract payments to independent contractors, insurance and claims payments, tax payments, and others. We also use large amounts of cash and credit for the following activities:
Capital Expenditures — When justified by customer demand, as well as our liquidity and our ability to generate acceptable returns, we make substantial cash capital expenditures to maintain a modern company tractor fleet, refresh our trailer fleet, and fund replacement and/or growth in our revenue equipment fleet. We expect the net cash capital expenditures required to maintain our current fleet to be in the range of $525.0 million to $575.0 million in 2018, but intend to keep this range as flexible as possible to appropriately respond to pending business opportunities and the overall market environment. We believe we have ample flexibility with our trade cycle and purchase agreements to alter our current plans if economic or other conditions warrant.
Over the long-term, we will continue to have significant capital requirements, which may require us to seek additional borrowing, lease financing, or equity capital. The availability of financing or equity capital will depend upon our financial condition and results of operations as well as prevailing market conditions. If such additional borrowing, lease financing, or equity capital is not available at the time we need it, then we may need to borrow more under the Revolver (if not then fully drawn), extend the maturity of then-outstanding debt, rely on alternative financing arrangements, engage in asset sales, limit our fleet size, or operate our revenue equipment for longer periods.
There can be no assurance that we will be able to obtain additional debt under our existing financial arrangements to satisfy our ongoing capital requirements. However, we believe the combination of our expected cash flows, financing available through operating and capital leases, available funds under the 2015 RSA, and availability under the Revolver will be sufficient to fund our expected capital expenditures for at least the next twelve months.
Principal and Interest Payments — As of December 31, 2017, we had material debt and capital lease obligations of $971.5 million (gross of deferred loan costs) which are discussed under "Material Debt Agreements," below. A significant amount of our cash flows from operations are committed to minimum payments of principal and interest on our debt facilities and lease obligations. Additionally, when our financial position allows, we periodically make voluntary prepayments on our outstanding debt balances. Following the 2017 Merger, the combined company carries substantially more debt than Knight has historically carried and the combined company has significantly higher interest expense and exposure to interest rate fluctuations than Knight historically had.
55
KNIGHT-SWIFT TRANSPORTATION HOLDINGS INC.
MANAGEMENT'S DISCUSSION AND ANALYSIS OF FINANCIAL CONDITION AND RESULTS OF OPERATIONS — CONTINUED
Letters of Credit — Pursuant to the terms of the 2017 Debt Agreement, our lenders may issue standby letters of credit on our behalf. When we have letters of credit outstanding, it reduces the availability under our $800.0 million Revolver. Standby letters of credit are typically issued for the benefit of regulatory authorities, insurance companies and state departments of insurance for the purpose of satisfying certain collateral requirements, primarily related to our automobile, workers' compensation, and general insurance liabilities.
Share Repurchases — From time to time, and depending on free cash flow availability, debt levels, stock prices, general economic and market conditions, as well as Board approval, we may repurchase shares of our outstanding Class A common stock. In February 2016, Swift's board of directors authorized $150.0 million in share repurchases, of which $62.9 million was assumed by the new entity, Knight-Swift, and remained available as of December 31, 2017. See further details regarding our share repurchases under Note 20 in Part II, Item 8 in this Annual Report.
Working Capital
As of December 31, 2017 and December 31, 2016, we had a working capital surplus of $313.7 million and $111.5 million, respectively.
Material Debt Agreements
As of December 31, 2017, we had $970.9 million in material debt obligations at the following carrying values:
• | $364.4 million: Term Loan, due October 2020, net of $0.6 million deferred loan costs |
• | $305.0 million: 2015 RSA outstanding borrowings, due January 2019 |
• | $176.1 million: Capital lease obligations |
• | $125.0 million: Revolver, due October 2022 |
• | $0.4 million: Other |
As of December 31, 2016, Knight's only material debt obligation was the Knight Revolver, due August 2019, with a carrying value of $18.0 million.
Key terms and other details regarding our material debt and capital leases are discussed in Notes 15, 16, and 17 in Part II, Item 8 in this Annual Report, and is incorporated by reference herein.
Capital and Operating Leases
In addition to our net cash capital expenditures, we enter into lease agreements to acquire revenue equipment, including tractors and trailers. Our tractor and trailer lease acquisitions and terminations were as follows:
2017 | 2016 | 2015 | |||||||||
(In thousands) | |||||||||||
Gross value of revenue equipment acquired with: | |||||||||||
Capital leases | $ | 15,020 | $ | — | $ | — | |||||
Operating leases | 2,489 | 1,716 | 5,093 | ||||||||
Originating value of terminated revenue equipment leases: | |||||||||||
Capital leases | $ | 4,714 | $ | — | $ | — | |||||
Operating leases | 73,437 | — | — | ||||||||
56
KNIGHT-SWIFT TRANSPORTATION HOLDINGS INC.
MANAGEMENT'S DISCUSSION AND ANALYSIS OF FINANCIAL CONDITION AND RESULTS OF OPERATIONS — CONTINUED
Contractual Obligations |
The table below summarizes our contractual obligations as of December 31, 2017, excluding deferred taxes and claims accruals:
Payments Due By Period | |||||||||||||||||||
Total | 1 Year or Less | 1-3 Years | 3-5 Years | More Than 5 Years | |||||||||||||||
(In thousands) | |||||||||||||||||||
Long-term debt obligations (1) | $ | 365,446 | $ | 30 | $ | 365,416 | $ | — | $ | — | |||||||||
Revolving line of credit (1) | 125,000 | — | 125,000 | — | — | ||||||||||||||
2015 RSA (1) | 305,000 | — | 305,000 | — | — | ||||||||||||||
Capital lease obligations (2) | 176,104 | 48,972 | 69,584 | 47,219 | 10,329 | ||||||||||||||
Interest obligations (3) | 54,979 | 25,353 | 26,880 | 2,156 | 590 | ||||||||||||||
Operating lease obligations (4) | 480,300 | 180,777 | 199,532 | 63,034 | 36,957 | ||||||||||||||
Purchase obligations (5) | 235,609 | 235,609 | — | — | — | ||||||||||||||
Investment commitments (6) | 3,814 | 2,213 | 1,401 | 100 | 100 | ||||||||||||||
ERP obligation (7) | 5,144 | — | 1,880 | 3,264 | — | ||||||||||||||
Dividend payable | 1,578 | 303 | 503 | 518 | 254 | ||||||||||||||
Total contractual obligations | $ | 1,752,974 | $ | 493,257 | $ | 1,095,196 | $ | 116,291 | $ | 48,230 | |||||||||
________
(1) | Represents borrowings owed at December 31, 2017. Interest rates vary. |
(2) | Represents principal payments owed at December 31, 2017. The borrowing consists of capital leases with finance companies, fixed borrowing amounts, and fixed interest rates, as set forth on each applicable lease schedule. Accordingly, interest on each lease varies between schedules. The Company's capital leases are typically structured with balloon payments at the end of the lease term equal to the residual value the Company is contracted to receive from certain equipment manufacturers upon sale or trade back to the manufacturers. |
(3) | Represents interest obligations on long-term debt, the 2015 RSA, and capital lease obligations. For variable rate debt, the interest rate in effect as of December 31, 2017 was utilized. The table assumes long-term debt and the 2015 RSA are held to maturity. |
(4) | Represents future monthly rental payment obligations, which include an interest element, under operating leases for tractors, trailers, chassis, and facilities. Substantially all lease agreements for revenue equipment have fixed payment terms based on the passage of time. The tractor lease agreements generally stipulate maximum miles and provide for mileage penalties for excess miles. These leases generally run for a period of three to five years for tractors and five to seven years for trailers. |
(5) | Represents purchase obligations for revenue equipment, facilities, and non-revenue equipment, of which a significant portion is expected to be purchased with cash, to the extent available, as well as borrowings under the Revolver. Refer to Note 18 in Part II, Item 8 of this Annual Report for additional information regarding our purchase commitments. |
(6) Investment commitments primarily consist of contractual obligations to investments in various Transportation Resource Partnerships, which are subject to capital calls. The expected timing of the capital calls is presented above.
(7) ERP obligation consists of outstanding commitments related to terminating the implementation of the Swift ERP system. Refer to Note 23 in Part II, Item 8 of this Annual Report for discussion of the related impairment.
Off Balance Sheet Arrangements |
Information about our off balance sheet arrangements is included in Note 17 and Note 18 in Part II, Item 8 of this Annual Report and is incorporated by reference herein. See also "Contractual Obligations," above.
57
KNIGHT-SWIFT TRANSPORTATION HOLDINGS INC.
MANAGEMENT'S DISCUSSION AND ANALYSIS OF FINANCIAL CONDITION AND RESULTS OF OPERATIONS — CONTINUED
Cash Flow Analysis |
2017 | 2016 | 2015 | 2017 vs. 2016 | 2016 vs. 2015 | |||||||||||||||
(In thousands) | Increase (decrease) in thousands | ||||||||||||||||||
Net cash provided by operating activities | $ | 318,569 | $ | 243,354 | $ | 205,765 | $ | 75,215 | $ | 37,589 | |||||||||
Net cash used in investing activities | (273,941 | ) | (101,020 | ) | (138,335 | ) | (172,921 | ) | 37,315 | ||||||||||
Net cash provided by (used in) financing activities | 24,000 | (143,004 | ) | (75,805 | ) | 167,004 | (67,199 | ) | |||||||||||
Net Cash Provided by Operating Activities
2017 Compared to 2016 — The $75.2 million increase in net cash provided by operating activities was primarily due to the $52.2 million increase in operating income, due to the factors discussed in "Results of Operations — Segment Review" and "Results of Operations — Consolidated Operating and Other Expenses," above.
2016 Compared to 2015 — The $37.6 million increase in net cash provided by operating activities was driven by lower income tax payments made in 2016, as Knight depleted the large income tax receivable balance on its consolidated balance sheet at December 31, 2015.
Net Cash Used in Investing Activities
2017 Compared to 2016 — The $172.9 million increase in net cash used in investing activities was due to the following:
• | $215.5 million increase in cash capital expenditures, net of proceeds from sale and trade-in of equipment. |
• | This was partially offset by a $30.0 million decrease in cash contributions to Knight's Transportation Resource Partners portfolio investments, net of proceeds received. |
• | This was further offset by a $28.5 million increase in cash Knight received in association with the 2017 Merger. |
2016 Compared to 2015 — The $37.3 million decrease in net cash used in investing activities was primarily due to Knight's decision in 2016 to limit organic fleet expansion and extend the expected trade cycle of its tractors in response to a challenging freight market and soft used equipment market.
Net Cash Provided by (Used in) Financing Activities
2017 Compared to 2016 — Net cash provided by (used in) financing activities favorably changed by $167.0 million, which was due to the following:
• | $76.0 million decrease in repayments on the previous Knight Revolver |
• | $40.0 million in borrowings under the 2015 RSA |
• | Cash Flow Impact of the 2017 Debt Agreement: The 2017 Debt Agreement includes an $800.0 million Revolver and a $400.0 million Term Loan. Upon closing in September 2017, the proceeds from the Term Loan, an $85.0 million draw on the Revolver and $3.4 million cash on hand were used to pay off the then-outstanding balances, accrued interest, and fees under the 2015 Debt Agreement, as well as certain transactional fees and expenses associated with the 2017 Debt Agreement. |
Excluding the impact of the 2017 Debt Agreement, borrowings on the Revolver increased by $40.0 million, which was partially offset by an $18.2 million increase in repayments of long-term debt and capital leases.
• | $39.9 million decrease in repurchases of Knight's common stock. |
2016 Compared to 2015 — The $67.2 million increase in net cash used in financing activities was due to the following:
• | In 2016 and 2015, Knight had net payments on the previous Knight Revolver of $94.0 million and $22.4 million, respectively. |
• | Knight repurchased $39.9 million of its common stock on the open market in 2016 and $45.3 million in 2015. |
• | Proceeds from exercises of stock options were $13.2 million in 2016 and $9.9 million in 2015. |
• | Knight returned $19.6 million in 2016 and $19.9 million in 2015 to its stockholders by way of dividends. |
Inflation |
58
KNIGHT-SWIFT TRANSPORTATION HOLDINGS INC.
MANAGEMENT'S DISCUSSION AND ANALYSIS OF FINANCIAL CONDITION AND RESULTS OF OPERATIONS — CONTINUED
Critical Accounting Estimates |
The preparation of our consolidated financial statements in conformity with GAAP requires management to make estimates and assumptions that impact the amounts reported in our consolidated financial statements and accompanying notes. Therefore, the reported amounts of assets, liabilities, revenue, expenses, and associated disclosures of contingent assets and liabilities are affected by these estimates and assumptions. We evaluate these estimates and assumptions on an ongoing basis, utilizing historical experience, consultation with experts, and other methods considered reasonable in the particular circumstances. Nevertheless, actual results may differ significantly from our estimates and assumptions, and it is possible that materially different amounts could be reported using differing estimates or assumptions. We consider our critical accounting estimates to be those that require us to make more significant judgments and estimates when we prepare our financial statements.
Note 2 in Part II, Item 8 of this Annual Report describes the Company's accounting policies. The following discussion should be read in conjunction with Note 2, as it presents uncertainties involved in applying the accounting policies, and provides insight into the quality of management's estimates and variability in the amounts recorded for these critical accounting estimates. Our critical accounting estimates include the following:
Claims Accruals — Insurance and claims expense varies as a percentage of total revenue, based on the frequency and severity of claims incurred in a given period, as well as changes in claims development trends. The actual cost to settle our self-insured claim liabilities may differ from our reserve estimates due to legal costs, claims that have been incurred but not reported, and various other uncertainties, including the inherent difficulty in estimating the severity of the claim and the potential judgment or settlement amount to dispose of the claim. If claims development factors that are based upon historical experience had increased by 10%, our claims accrual as of December 31, 2017 would have potentially increased by $16.2 million.
Goodwill and Indefinite-lived Intangible Assets — The test of goodwill and indefinite-lived intangible assets requires judgment, including the identification of reporting units, assigning assets (including goodwill) and liabilities to reporting units and determining the fair value of each reporting unit. Fair value of the reporting unit is determined using a combination of comparative valuation multiples of publicly traded companies, internal transaction methods, and discounted cash flow models. Estimating the fair value of reporting units includes several significant assumptions, including future cash flow estimates, determination of appropriate discount rates, and other assumptions that management believed reasonable under the circumstances. Changes in these estimates and assumptions could materially affect the determination of fair value and/or goodwill impairment for each reporting unit.
Knight evaluated its goodwill associated with the Barr-Nunn Transportation, Inc. acquisition as of June 30, 2016 and June 30, 2017 using the qualitative factors prescribed in ASC 350, Intangibles – Goodwill and Other, to determine whether to perform the two-step quantitative goodwill impairment test. The assessment of qualitative factors requires judgment, including identification of reporting units, evaluation of macroeconomic conditions, analysis of industry and market conditions, measurement of cost factors, and identification of entity-specific events (such as financial performance and changes within our share price). In evaluating these qualitative factors, Knight determined that it was more likely than not that fair value exceeded carrying value for Knight's reporting units as of June 30, 2016 and June 30, 2017. As such, it was not necessary to perform the two-step quantitative goodwill impairment test. Additionally, in conjunction with the 2017 Merger, the fair value of Swift's goodwill, which is primarily attributable to Swift's existing workforce and the synergies expected to arise after the 2017 Merger, was measured as of September 8, 2017. See additional details regarding the 2017 Merger in Note 4 included in Part II, Item 8 of this Annual Report, as well as information regarding the Company's goodwill balance, including the allocation of goodwill by segment in Note 11 included in Part II, Item 8 of this Annual Report.
Depreciation and Amortization — Selecting the appropriate accounting method requires management judgment, as there are multiple acceptable methods that are in accordance with GAAP, including straight-line, declining-balance, and sum-of-the-years' digits. As discussed in Note 2 included in Part II, Item 8 of this Annual Report, property and equipment is depreciated on a straight-line basis and intangible customer relationships are amortized over the estimated useful lives of the assets. We believe that these methods properly spread the costs over the useful lives of the assets. Management judgment is also involved when determining estimated useful lives of the Company's long-lived assets. We determine useful lives of our long-lived assets, based on historical experience, as well as future expectations regarding the period we expect to benefit from the asset. Factors affecting estimated useful lives of property and equipment may include estimating loss, damage, obsolescence, and company policies around maintenance and asset replacement. Factors affecting estimated useful lives of long-lived intangible assets may include legal, contractual, or other provisions that limit useful lives, historical experience with similar assets, future expectations of customer relationships, among others.
Impairments of Long-lived Assets — Fair value is determined through various valuation techniques, including discounted cash flow models, quoted market values, and third-party independent appraisals, as necessary. Estimating fair value includes several significant assumptions, including future cash flow estimates, determination of appropriate discount rates, and other assumptions that management believed reasonable under the circumstances. Changes in these estimates and assumptions could materially affect the determination of fair value and/or impairment.
59
KNIGHT-SWIFT TRANSPORTATION HOLDINGS INC.
MANAGEMENT'S DISCUSSION AND ANALYSIS OF FINANCIAL CONDITION AND RESULTS OF OPERATIONS — CONTINUED
Income Taxes — Significant management judgment is required in determining our provision for income taxes and in determining whether deferred tax assets will be realized in full or in part. We periodically assess the likelihood that all or some portion of deferred tax assets will be recovered from future taxable income. To the extent we believe the likelihood of recovery is not sufficient, a valuation allowance is established for the amount determined not to be realizable. Management judgment is necessary in determining the frequency at which we assess the need for a valuation allowance, the accounting period in which to establish the valuation allowance, as well as the amount of the valuation allowance. We believe that we have adequately provided for our future tax consequences based upon current facts and circumstances and current tax law. However, should our tax positions be challenged, different outcomes could result and have a significant impact on the amounts reported in our consolidated income statements.
Management judgment is also required regarding a variety of other factors including the appropriateness of tax strategies. We utilize certain income tax planning strategies to reduce our overall income taxes. It is possible that certain strategies might be disallowed, resulting in an increased liability for income taxes. Significant management judgments are involved in assessing the likelihood of sustaining the strategies and determining the likely range of defense and settlement costs, in the event that tax strategies are challenged by taxing authorities. An ultimate result worse than our expectations could adversely affect our results of operations.
Operating Leases — In accordance with ASC 840, Leases, property and equipment held under operating leases, and liabilities related thereto, are off-balance sheet. All expenses related to operating leases are reflected in our consolidated income statements in "Rental expense." At the inception of a lease, management judgment is involved in classification as an operating or capital lease, as well as determination of useful lives and estimation of residual values of the related equipment. Future minimum lease payments used in determining lease classification represent the minimum rental payments called for over the lease term, inclusive of residual value guarantees (if applicable) and amounts that would be required to be paid, if any, by the Company upon default for leases containing subjective acceleration or cross default clauses.
In connection with various operating leases, we issued residual value guarantees, which provide that if we do not purchase the leased equipment from the lessor at the end of the lease term, we are liable to the lessor for an amount equal to the shortage (if any) between the proceeds from the sale of the equipment and an agreed value. To the extent we believe any manufacturer will refuse or be unable to meet its obligation, we recognize additional rental expense to the extent we believe the fair market value at the lease termination will be less than our obligation to the lessor. We believe that proceeds from the sale of equipment under operating leases would exceed the payment obligation on substantially all operating leases.
Stock-based Compensation — We issue several types of stock-based compensation, including awards that vest, based on service and performance conditions or a combination of service and performance conditions. Performance-based awards vest contingent upon meeting certain performance criteria established by our compensation committee. All awards require future service and thus forfeitures are estimated based on historical forfeitures and the remaining term until the related award vests. ASC 718, Compensation – Stock Compensation, requires that all stock-based payments to employees, including grants of employee stock options, be recognized in the financial statements based upon a grant-date fair value of an award. Determining the appropriate amount to expense in each period is based on likelihood and timing of achievement of the stated targets for performance-based awards, and requires judgment, including forecasting future financial results and market performance. The estimates are revised periodically, based on the probability and timing of achieving the required performance targets, and adjustments are made as appropriate. Awards that are only subject to time-vesting provisions are amortized using the straight-line method. Awards subject to time-based vesting and performance conditions are amortized using the individual vesting tranches.
Legal Settlements and Reserves — See Note 19 in Part II Item 8 of this Annual Report.
Recently Issued Accounting Pronouncements |
See Note 3 under Part II Item 8 of this Annual Report for recently issued accounting pronouncements that could have an impact on our consolidated financial statements.
ITEM 7A. | QUANTITATIVE AND QUALITATIVE DISCLOSURES ABOUT MARKET RISK |
We have exposure from variable interest rates, primarily related to our 2017 Debt Agreement, and 2015 RSA. These variable interest rates are impacted by changes in short-term interest rates. We primarily manage interest rate exposure through a mix of variable rate debt (weighted average rate of 2.3% as of December 31, 2017). Assuming the level of borrowings as of December 31, 2017, a hypothetical one percentage point increase in interest rates would increase our annual interest expense by $8.0 million.
We have commodity exposure with respect to fuel used in company-owned tractors. Increases in fuel prices would continue to raise our operating costs, even after applying fuel surcharge revenue. Historically, we have been able to recover a majority of fuel price increases from our customers in the form of fuel surcharges. The weekly average diesel price per gallon in the United States, as reported by the United States Department of Energy, increased from an average of $2.30 per gallon for 2016 to $2.65 per gallon for 2017. We cannot predict the extent or speed of potential changes in fuel price levels in the future, the degree to which the lag effect of our fuel surcharge programs will impact us as a result of the timing and magnitude of such changes, or the extent to which effective fuel surcharges can be maintained and collected to offset such increases. We generally have not used derivative financial instruments to hedge our fuel price exposure in the past, but continue to evaluate this possibility.
60
ITEM 8. | FINANCIAL STATEMENTS AND SUPPLEMENTARY DATA |
The Consolidated Financial Statements of the Company as of December 31, 2017 and 2016 and for the years ended December 31, 2017, 2016, and 2015, together with related notes and the report of Grant Thornton LLP, independent registered public accountants, are set forth on the following pages. Other required financial information set forth herein is more fully described in Item 15 of this Annual Report.
Audited Financial Statements of Knight-Swift Transportation Holdings Inc. | |
Index to Consolidated Financial Statements | |
Consolidated Financial Statements | Page |
Notes to Consolidated Financial Statements | ||
Note 1 | ||
Note 2 | ||
Note 3 | ||
Note 4 | ||
Note 5 | ||
Note 6 | ||
Note 7 | ||
Note 8 | ||
Note 9 | ||
Note 10 | ||
Note 11 | ||
Note 12 | ||
Note 13 | ||
Note 14 | ||
Note 15 | ||
Note 16 | ||
Note 17 | ||
Note 18 | ||
Note 19 | ||
Note 20 | ||
Note 21 | ||
Note 22 | ||
Note 23 | ||
Note 24 | ||
Note 25 | ||
Note 26 | ||
61
REPORT OF INDEPENDENT REGISTERED PUBLIC ACCOUNTING FIRM
Board of Directors and Shareholders
Knight-Swift Transportation Holdings Inc.
Opinion on the financial statements
We have audited the accompanying consolidated balance sheets of Knight-Swift Transportation Holdings Inc. (an Arizona corporation) and subsidiaries (the “Company”) as of December 31, 2017 and 2016, the related consolidated income statements, comprehensive income, changes in stockholders’ equity, and cash flows for each of the three years in the period ended December 31, 2017, and the related notes (collectively referred to as the “financial statements”). In our opinion, the financial statements present fairly, in all material respects, the financial position of the Company as of December 31, 2017 and 2016, and the results of their operations and their cash flows for each of the three years in the period ended December 31, 2017, in conformity with accounting principles generally accepted in the United States of America.
We also have audited, in accordance with the standards of the Public Company Accounting Oversight Board (United States) (“PCAOB”), the Company’s internal control over financial reporting as of December 31, 2017, based on criteria established in the 2013 Internal Control—Integrated Framework issued by the Committee of Sponsoring Organizations of the Treadway Commission (“COSO”), and our report dated March 1, 2018, expressed an unqualified opinion.
Basis for opinion
These financial statements are the responsibility of the Company’s management. Our responsibility is to express an opinion on the Company’s financial statements based on our audits. We are a public accounting firm registered with the PCAOB and are required to be independent with respect to the Company in accordance with the U.S. federal securities laws and the applicable rules and regulations of the Securities and Exchange Commission and the PCAOB.
We conducted our audits in accordance with the standards of the PCAOB. Those standards require that we plan and perform the audit to obtain reasonable assurance about whether the financial statements are free of material misstatement, whether due to error or fraud. Our audits included performing procedures to assess the risks of material misstatement of the financial statements, whether due to error or fraud, and performing procedures that respond to those risks. Such procedures included examining, on a test basis, evidence supporting the amounts and disclosures in the financial statements. Our audits also included evaluating the accounting principles used and significant estimates made by management, as well as evaluating the overall presentation of the financial statements. We believe that our audits provide a reasonable basis for our opinion.
/s/ GRANT THORNTON LLP
We have served as the Company’s auditor since 2011.
Phoenix, Arizona
March 1, 2018
62
Consolidated Balance Sheets |
December 31, | |||||||
2017 | 2016 | ||||||
ASSETS | (In thousands, except per share data) | ||||||
Current assets: | |||||||
Cash and cash equivalents | $ | 76,649 | $ | 8,021 | |||
Cash and cash equivalents — restricted | 73,657 | — | |||||
Restricted investments, held to maturity, amortized cost | 22,232 | — | |||||
Trade receivables, net of allowance for doubtful accounts of $14,829 and $2,727, respectively | 574,265 | 133,846 | |||||
Equipment sales receivables | 8,925 | 8,321 | |||||
Notes receivable, net | 4,742 | 560 | |||||
Prepaid expenses | 58,525 | 13,244 | |||||
Assets held for sale | 25,153 | 9,634 | |||||
Income tax receivable | 55,114 | 8,406 | |||||
Other current assets | 23,945 | 8,159 | |||||
Total current assets | 923,207 | 190,191 | |||||
Property and equipment: | |||||||
Revenue equipment | 2,197,158 | 910,042 | |||||
Land and land improvements | 216,676 | 54,106 | |||||
Buildings and building improvements | 357,409 | 145,866 | |||||
Furniture and fixtures | 43,131 | 20,241 | |||||
Shop and service equipment | 22,864 | 16,859 | |||||
Leasehold improvements | 9,905 | 4,735 | |||||
Total property and equipment | 2,847,143 | 1,151,849 | |||||
Less: accumulated depreciation and amortization | (462,922 | ) | (348,991 | ) | |||
Property and equipment, net | 2,384,221 | 802,858 | |||||
Notes receivable, long-term | 11,060 | 3,047 | |||||
Goodwill | 2,887,867 | 47,031 | |||||
Intangible assets, net | 1,440,903 | 2,575 | |||||
Other long-term assets, restricted cash, and investments | 36,184 | 32,823 | |||||
Total assets | $ | 7,683,442 | $ | 1,078,525 | |||
LIABILITIES AND STOCKHOLDERS’ EQUITY | |||||||
Current liabilities: | |||||||
Accounts payable | $ | 119,867 | $ | 18,006 | |||
Accrued payroll and purchased transportation | 107,017 | 25,017 | |||||
Accrued liabilities | 186,076 | 16,722 | |||||
Claims accruals – current portion | 147,285 | 18,633 | |||||
Long-term debt – current portion | 30 | — | |||||
Capital lease obligations – current portion | 48,972 | — | |||||
Dividend payable – current portion | 303 | 272 | |||||
Total current liabilities | 609,550 | 78,650 | |||||
Revolving line of credit | 125,000 | 18,000 | |||||
Long-term debt – less current portion | 364,771 | — | |||||
Capital lease obligations – less current portion | 127,132 | — | |||||
Accounts receivable securitization | 305,000 | — | |||||
Claims accruals – less current portion | 206,144 | 13,290 | |||||
Deferred tax liabilities | 679,077 | 178,000 | |||||
Long-term dividend payable and other long-term liabilities | 26,398 | 1,854 | |||||
Total liabilities | 2,443,072 | 289,794 | |||||
Commitments and contingencies (notes 17, 18, and 19) | |||||||
Stockholders’ equity: | |||||||
Preferred stock, par value $0.01 per share; 10,000 shares authorized; none issued | — | — | |||||
Class A common stock, par value $0.01 per share; 500,000 shares authorized; 177,998 and 80,229 shares issued and outstanding as of December 31, 2017 and December 31, 2016, respectively | 1,780 | 802 | |||||
Class B common stock, par value $0.01 per share; Authorized 250,000 shares; none issued | — | — | |||||
Additional paid-in capital | 4,219,214 | 223,267 | |||||
Retained earnings | 1,016,738 | 562,404 | |||||
Total Knight-Swift stockholders' equity | 5,237,732 | 786,473 | |||||
Noncontrolling interest | 2,638 | 2,258 | |||||
Total stockholders’ equity | 5,240,370 | 788,731 | |||||
Total liabilities and stockholders’ equity | $ | 7,683,442 | $ | 1,078,525 | |||
See accompanying notes to consolidated financial statements.
63
Consolidated Income Statements |
2017 | 2016 | 2015 | |||||||||
(In thousands, except per share data) | |||||||||||
Operating revenue: | |||||||||||
Revenue before fuel surcharge | $ | 2,179,873 | $ | 1,028,148 | $ | 1,061,739 | |||||
Fuel surcharge | 245,580 | 89,886 | 121,225 | ||||||||
Total revenue | 2,425,453 | 1,118,034 | 1,182,964 | ||||||||
Operating expenses: | |||||||||||
Salaries, wages, and benefits | 688,543 | 333,929 | 334,069 | ||||||||
Fuel | 274,956 | 129,696 | 152,752 | ||||||||
Operations and maintenance | 164,307 | 76,246 | 80,855 | ||||||||
Insurance and claims | 95,199 | 34,441 | 33,632 | ||||||||
Operating taxes and licenses | 40,544 | 18,728 | 18,911 | ||||||||
Communications | 10,691 | 4,182 | 4,095 | ||||||||
Depreciation and amortization of property and equipment | 193,733 | 115,660 | 110,523 | ||||||||
Amortization of intangibles | 13,372 | 500 | 500 | ||||||||
Rental expense | 74,224 | 5,036 | 4,695 | ||||||||
Purchased transportation | 594,113 | 233,863 | 246,864 | ||||||||
Impairments | 16,844 | — | — | ||||||||
Miscellaneous operating expenses, net | 41,781 | 17,274 | 18,068 | ||||||||
Merger-related costs | 16,516 | — | — | ||||||||
Total operating expenses | 2,224,823 | 969,555 | 1,004,964 | ||||||||
Operating income | 200,630 | 148,479 | 178,000 | ||||||||
Other income (expenses): | |||||||||||
Interest income | 1,207 | 309 | 460 | ||||||||
Interest expense | (8,686 | ) | (897 | ) | (998 | ) | |||||
Other income, net | 558 | 4,939 | 9,042 | ||||||||
Total other (expense) income, net | (6,921 | ) | 4,351 | 8,504 | |||||||
Income before income taxes | 193,709 | 152,830 | 186,504 | ||||||||
Income tax (benefit) expense | (291,716 | ) | 57,592 | 68,047 | |||||||
Net income | 485,425 | 95,238 | 118,457 | ||||||||
Net income attributable to noncontrolling interest | (1,133 | ) | (1,375 | ) | (1,739 | ) | |||||
Net income attributable to Knight-Swift | $ | 484,292 | $ | 93,863 | $ | 116,718 | |||||
Earnings per share: | |||||||||||
Basic | $ | 4.38 | $ | 1.17 | $ | 1.43 | |||||
Diluted | $ | 4.34 | $ | 1.16 | $ | 1.42 | |||||
Dividends declared per share: | $ | 0.24 | $ | 0.24 | $ | 0.24 | |||||
Weighted average shares outstanding: | |||||||||||
Basic | 110,657 | 80,362 | 81,491 | ||||||||
Diluted | 111,697 | 81,228 | 82,467 | ||||||||
See accompanying notes to consolidated financial statements.
64
Consolidated Statements of Comprehensive Income |
2017 | 2016 | 2015 | |||||||||
(In thousands) | |||||||||||
Net income | $ | 485,425 | $ | 95,238 | $ | 118,457 | |||||
Other comprehensive income, net of income taxes: | |||||||||||
Realized gains from available-for-sale securities reclassified to net income (1) | — | (2,771 | ) | (5,273 | ) | ||||||
Unrealized gains (losses) from changes in fair value of available-for-sale securities (2) | — | 198 | (4,385 | ) | |||||||
Other comprehensive income, net of income taxes: | — | (2,573 | ) | (9,658 | ) | ||||||
Comprehensive income, net of income taxes | 485,425 | 92,665 | 108,799 | ||||||||
Comprehensive income attributable to noncontrolling interest | — | (1,375 | ) | (1,739 | ) | ||||||
Comprehensive income attributable to Knight-Swift | $ | 485,425 | $ | 91,290 | $ | 107,060 | |||||
____________
(1) | Net of current income tax expense of $1,723 and $3,318 in 2016 and 2015, respectively. |
(2) | Net of deferred income tax expense (benefit) of $104 and $(2,870) in 2016 and 2015, respectively. |
See accompanying notes to consolidated financial statements.
65
Consolidated Statements of Stockholders' Equity |
Class A Common Stock | Additional Paid-in Capital | Retained Earnings | Accumulated Other Comprehensive Income (Loss) | Total Knight-Swift Transportation Stockholder's Equity | Noncontrolling Interest | Total Stockholders' Equity | ||||||||||||||||||||||||
Shares | Par Value | |||||||||||||||||||||||||||||
(In thousands) | ||||||||||||||||||||||||||||||
Balances, December 31, 2014 | 81,842 | $ | 818 | $ | 185,184 | $ | 479,527 | $ | 12,231 | $ | 677,760 | $ | 1,515 | $ | 679,275 | |||||||||||||||
Issuance of common stock to employees | 720 | 8 | 9,923 | 9,931 | 9,931 | |||||||||||||||||||||||||
Issuance of common stock to the board of directors | 12 | — | 354 | 354 | 354 | |||||||||||||||||||||||||
Company shares repurchased | (1,607 | ) | (16 | ) | (45,329 | ) | (45,345 | ) | (45,345 | ) | ||||||||||||||||||||
Shares withheld – restricted stock unit settlement | (1,843 | ) | (1,843 | ) | (1,843 | ) | ||||||||||||||||||||||||
Excess tax benefit of stock option exercises | 3,175 | 3,175 | 3,175 | |||||||||||||||||||||||||||
Employee stock-based compensation expense | 7,012 | 7,012 | 7,012 | |||||||||||||||||||||||||||
Cash dividends paid and dividends accrued | (19,706 | ) | (19,706 | ) | (19,706 | ) | ||||||||||||||||||||||||
Net income attributable to Knight-Swift | 116,718 | 116,718 | 116,718 | |||||||||||||||||||||||||||
Other comprehensive income, net of income taxes | (9,658 | ) | (9,658 | ) | (9,658 | ) | ||||||||||||||||||||||||
Distribution to noncontrolling interest | (1,280 | ) | (1,280 | ) | ||||||||||||||||||||||||||
Net income attributable to noncontrolling interest | 1,739 | 1,739 | ||||||||||||||||||||||||||||
Balances, December 31, 2015 | 80,967 | $ | 810 | $ | 205,648 | $ | 529,367 | $ | 2,573 | $ | 738,398 | $ | 1,974 | $ | 740,372 | |||||||||||||||
Issuance of common stock to employees | 832 | 8 | 13,180 | 13,188 | 13,188 | |||||||||||||||||||||||||
Issuance of common stock to the board of directors | 15 | — | 398 | 398 | 398 | |||||||||||||||||||||||||
Company shares repurchased | (1,585 | ) | (16 | ) | (39,857 | ) | (39,873 | ) | (39,873 | ) | ||||||||||||||||||||
Shares withheld – restricted stock unit settlement | (1,631 | ) | (1,631 | ) | (1,631 | ) | ||||||||||||||||||||||||
Employee stock-based compensation expense | 4,041 | 4,041 | 4,041 | |||||||||||||||||||||||||||
Cash dividends paid and dividends accrued | (19,338 | ) | (19,338 | ) | (19,338 | ) | ||||||||||||||||||||||||
Net income attributable to Knight-Swift | 93,863 | 93,863 | 93,863 | |||||||||||||||||||||||||||
Other comprehensive income, net of income taxes | (2,573 | ) | (2,573 | ) | (2,573 | ) | ||||||||||||||||||||||||
Distribution to noncontrolling interest | (1,091 | ) | (1,091 | ) | ||||||||||||||||||||||||||
Net income attributable to noncontrolling interest | 1,375 | 1,375 | ||||||||||||||||||||||||||||
Balances, December 31, 2016 | 80,229 | $ | 802 | $ | 223,267 | $ | 562,404 | $ | — | $ | 786,473 | $ | 2,258 | $ | 788,731 | |||||||||||||||
2017 Merger reverse split of Swift shares | 97,031 | 971 | 3,975,832 | 3,976,803 | 102 | 3,976,905 | ||||||||||||||||||||||||
Issuance of common stock to employees | 718 | 7 | 13,151 | 13,158 | 13,158 | |||||||||||||||||||||||||
Issuance of common stock to the board of directors | 12 | — | 398 | 398 | 398 | |||||||||||||||||||||||||
Shares issued under employee stock purchase plan | 8 | — | 324 | 324 | 324 | |||||||||||||||||||||||||
Shares withheld – restricted stock unit settlement | (4,709 | ) | (4,709 | ) | (4,709 | ) | ||||||||||||||||||||||||
Employee stock-based compensation expense | 6,242 | 6,242 | 6,242 | |||||||||||||||||||||||||||
Cash dividends paid and dividends accrued | (25,249 | ) | (25,249 | ) | (25,249 | ) | ||||||||||||||||||||||||
Net income attributable to Knight-Swift | 484,292 | 484,292 | 484,292 | |||||||||||||||||||||||||||
Distribution to noncontrolling interest | (855 | ) | (855 | ) | ||||||||||||||||||||||||||
Net income attributable to noncontrolling interest | 1,133 | 1,133 | ||||||||||||||||||||||||||||
Balances, December 31, 2017 | 177,998 | $ | 1,780 | $ | 4,219,214 | $ | 1,016,738 | $ | — | $ | 5,237,732 | $ | 2,638 | $ | 5,240,370 | |||||||||||||||
See accompanying notes to consolidated financial statements.
66
Consolidated Statements of Cash Flows |
2017 | 2016 | 2015 | |||||||||
(In thousands) | |||||||||||
Cash flows from operating activities: | |||||||||||
Net income | $ | 485,425 | $ | 95,238 | $ | 118,457 | |||||
Adjustments to reconcile net income to net cash provided by operating activities: | |||||||||||
Depreciation and amortization of property, equipment, and intangibles | 207,105 | 116,160 | 111,023 | ||||||||
Amortization of debt issuance costs and other | 209 | — | — | ||||||||
Gain on sale of equipment | (8,939 | ) | (8,124 | ) | (15,346 | ) | |||||
Earn-out on sold investment | — | — | (208 | ) | |||||||
Gain from available-for-sale securities | — | (4,494 | ) | (8,591 | ) | ||||||
Impairments | 16,844 | — | — | ||||||||
Deferred income taxes | (305,584 | ) | 5,454 | 21,532 | |||||||
Provision for doubtful accounts and notes receivable | 5,245 | 882 | 1,359 | ||||||||
Non-cash compensation expense for issuance of common stock to certain members of the board of directors | 398 | 398 | 354 | ||||||||
Excess tax benefits from stock-based compensation | — | — | (3,175 | ) | |||||||
Stock-based compensation expense | 6,242 | 4,041 | 7,012 | ||||||||
Income from investment in Transportation Resource Partners | (1,413 | ) | (533 | ) | (422 | ) | |||||
Transportation Resource Partners impairment | 56 | 86 | 177 | ||||||||
Increase (decrease) in cash resulting from changes in: | |||||||||||
Trade receivables and equipment sales receivable | (48,454 | ) | (11,099 | ) | 10,266 | ||||||
Other current assets | 259 | 6,056 | (870 | ) | |||||||
Prepaid expenses | (1,163 | ) | 4,076 | 103 | |||||||
Income tax receivable | (39,122 | ) | 33,561 | (22,535 | ) | ||||||
Other long-term assets | (4,469 | ) | 695 | (1,236 | ) | ||||||
Accounts payable | (29,890 | ) | 3,788 | (8,543 | ) | ||||||
Accrued liabilities and claims accrual | 35,820 | (2,831 | ) | (3,592 | ) | ||||||
Net cash provided by operating activities | 318,569 | 243,354 | 205,765 | ||||||||
Cash flows from investing activities: | |||||||||||
Increase in cash and cash equivalents — restricted | (10,215 | ) | (6 | ) | (18 | ) | |||||
Proceeds from maturities of held-to-maturity investments | 10,730 | — | — | ||||||||
Purchases of held-to-maturity investments | (10,893 | ) | — | — | |||||||
Proceeds from sale of available-for-sale securities | — | 7,403 | 12,528 | ||||||||
Proceeds from sale of property and equipment, including assets held for sale | 82,731 | 65,595 | 72,246 | ||||||||
Purchases of property and equipment | (387,191 | ) | (154,596 | ) | (221,660 | ) | |||||
Proceeds from notes receivable | 3,778 | 1,797 | 1,779 | ||||||||
Expenditures on assets held for sale | (1,553 | ) | — | — | |||||||
Payments received on equipment sale receivables | 1,505 | — | — | ||||||||
Cash payments to Transportation Resource Partners | (1,172 | ) | (21,709 | ) | (70 | ) | |||||
Cash proceeds from Transportation Resource Partners | 9,846 | 496 | 360 | ||||||||
Investment in Barr-Nunn Transportation | — | — | (3,500 | ) | |||||||
Cash and cash equivalents received with 2017 Merger | 28,493 | — | — | ||||||||
Net cash used in investing activities | (273,941 | ) | (101,020 | ) | (138,335 | ) | |||||
See accompanying notes to consolidated financial statements. | |||||||||||
67
2017 | 2016 | 2015 | |||||||||
(In thousands) | |||||||||||
Cash flows from financing activities: | |||||||||||
Repayment of long-term debt and capital leases | (503,153 | ) | — | — | |||||||
Proceeds from long-term debt | 400,000 | — | — | ||||||||
Repayments on Knight Revolver, net | (18,000 | ) | (94,000 | ) | (22,400 | ) | |||||
Borrowings on Revolver, net | 125,000 | — | — | ||||||||
Borrowings under accounts receivable securitization | 40,000 | — | — | ||||||||
Payment of deferred loan costs | (2,312 | ) | — | — | |||||||
Proceeds from common stock issued | 13,483 | 13,188 | 9,930 | ||||||||
Share withholding for taxes due on equity awards | (4,709 | ) | (1,631 | ) | — | ||||||
Payments to repurchase company's common stock | — | (39,873 | ) | (45,345 | ) | ||||||
Dividends paid | (25,454 | ) | (19,597 | ) | (19,885 | ) | |||||
Cash distribution to noncontrolling interest holder | (855 | ) | (1,091 | ) | (1,280 | ) | |||||
Excess tax benefits from stock-based compensation | — | — | 3,175 | ||||||||
Net cash provided by (used in) financing activities | 24,000 | (143,004 | ) | (75,805 | ) | ||||||
Net increase (decrease) in cash and cash equivalents | 68,628 | (670 | ) | (8,375 | ) | ||||||
Cash and cash equivalents at beginning of period | 8,021 | 8,691 | 17,066 | ||||||||
Cash and cash equivalents at end of period | $ | 76,649 | $ | 8,021 | $ | 8,691 | |||||
2017 | 2016 | 2015 | |||||||||
(In thousands) | |||||||||||
Supplemental disclosures of cash flow information: | |||||||||||
Cash paid during the period for: | |||||||||||
Interest | $ | 9,286 | $ | 941 | $ | 1,037 | |||||
Income taxes | 51,817 | 18,467 | 65,594 | ||||||||
Non-cash investing and financing activities: | |||||||||||
Equipment acquired included in accounts payable | $ | 8,361 | $ | 3,619 | $ | 4,251 | |||||
Equipment sales receivables | 350 | — | — | ||||||||
Financing provided to independent contractors for equipment sold | 3,316 | 1,310 | 787 | ||||||||
Transfer from property and equipment to assets held for sale | 45,016 | 30,755 | 49,786 | ||||||||
Capital lease additions | 15,020 | — | — | ||||||||
Net dividend accrued for restricted stock units | 73 | 103 | 178 | ||||||||
See accompanying notes to consolidated financial statements.
68
Notes to Consolidated Financial Statements |
Note 1 — Introduction and Basis of Presentation
Certain acronyms and terms used throughout this Annual Report are specific to Knight-Swift, commonly used in the trucking industry, or are otherwise frequently used throughout this document. Definitions for these acronyms and terms are provided in the "Glossary of Terms," available in the front of this document.
Description of Business
Knight-Swift is a transportation solutions provider, headquartered in Phoenix, Arizona. As of December 31, 2017, the Company's fleet of revenue equipment included 23,069 tractors (comprised of 18,381 company tractors and 4,688 independent contractor tractors), 74,949 trailers, and 9,122 intermodal containers. The Company's six reportable segments are Knight Trucking, Knight Logistics, Swift Truckload, Swift Dedicated, Swift Refrigerated, and Swift Intermodal.
2017 Merger
On September 8, 2017, the Company became Knight-Swift Transportation Holdings Inc. upon the effectiveness of the 2017 Merger. Immediately upon the consummation of the 2017 Merger, former Knight stockholders and former Swift stockholders owned approximately 46.0% and 54.0%, respectively, of the Company. Upon closing of the 2017 Merger, the shares of Knight common stock that previously traded under the ticker symbol "KNX" ceased trading and were delisted from the NYSE. The shares of Class A common stock commenced trading on the NYSE on a post-reverse split basis under the ticker symbol "KNX" on September 11, 2017.
The Company accounted for the 2017 Merger using the acquisition method of accounting in accordance with GAAP. GAAP requires that either Knight or Swift is designated as the acquirer for accounting and financial reporting purposes ("Accounting Acquirer"). Based on the evidence available, Knight was designated as the Accounting Acquirer while Swift was the acquirer for legal purposes. Therefore, Knight’s historical results of operations replaced Swift’s historical results of operations for all periods prior to the 2017 Merger. More specifically, the accompanying consolidated financial statements for periods prior to the 2017 Merger are those of Knight and its subsidiaries, and for periods subsequent to the 2017 Merger, also include Swift.
In identifying Knight as the Accounting Acquirer, management took into account the structure of the 2017 Merger, the composition of the combined company's board of directors and the designation of certain senior management positions of the combined company, among other factors.
See Note 4 for further details of the 2017 Merger, including discussion of the purchase price allocation applied, as well as Note 21 for further discussion related to the treatment of the Swift equity awards assumed pursuant to the 2017 Merger.
Basis of Presentation
The consolidated financial statements and footnotes included in this Annual Report should be read in conjunction with the consolidated financial statements and footnotes included in Knight's 2016 Annual Report. The consolidated financial statements include the accounts of Knight-Swift Transportation Holdings Inc. and its subsidiaries. In management's opinion, these consolidated financial statements were prepared in accordance with GAAP and include all adjustments necessary (consisting of normal recurring adjustments) for the fair presentation of the periods presented.
With respect to transactional/durational data, references to years, such as "2017", "2016", "2015", "2014", and "2013" pertain to calendar years. Similarly, references to quarters, such as "first", "second", "third", and "fourth" pertain to calendar quarters.
Note regarding comparability — Based on the structure of the 2017 Merger, the historical financial statements of Knight are the historical financial statements of the combined company for all periods prior to the 2017 Merger. The Company's 2017 results of operations include the results of operations of Swift after September 8, 2017. Results for periods on and prior to September 8, 2017 reflect only those of Knight and do not include the results of operations of Swift. Accordingly, comparisons between the Company's 2017 results and prior periods may not be meaningful.
Joint ventures — The financial activities of the following entities with which the Company has joint ventures are consolidated. The noncontrolling interest for these entities is presented as a separate component of the consolidated financial statements.
• | In 2014, Knight formed an Arizona limited liability company, now known as Kold Trans, LLC, for the purpose of expanding its refrigerated trucking business. Knight is entitled to 80.0% of the profits of the entity and has effective control over the management of the entity. |
• | In 2010, Knight partnered with a non-related investor to form an Arizona limited liability company for the purpose of sourcing commercial vehicle parts. Knight acquired a 52.0% ownership interest in this entity. |
Equity and cost method investments — Refer to Note 7 for basis of presentation disclosures regarding Knight's equity and cost method investments in Transportation Resource Partners.
69
KNIGHT-SWIFT TRANSPORTATION HOLDINGS INC.
NOTES TO CONSOLIDATED FINANCIAL STATEMENTS — CONTINUED
Changes in Presentation
Beginning in 2017, the Company made the following changes in presentation:
• | Equipment sales receivables are separately presented within "Total current assets" in the consolidated balance sheets. The prior period presentation has been retrospectively adjusted to reclassify the amount out of "Trade receivables, net of allowance for doubtful accounts" and into the new line item "Equipment sales receivable." The change in presentation has no net impact on "Total current assets." |
• | Rental expenses related to revenue equipment are separately presented within "Total operating expenses" in the consolidated income statements. The prior period presentation has been retrospectively adjusted to reclassify the amount out of "Miscellaneous operating expenses" and into the new line item "Rental expense." The change in presentation has no net impact on "Total operating expenses." |
Seasonality
In the transportation industry, results of operations generally follow a seasonal pattern. Freight volumes in the first quarter are typically lower due to less consumer demand, customers reducing shipments following the holiday season, and inclement weather impeding operations. At the same time, operating expenses generally increase, and tractor productivity of the Company's fleet, independent contractors, and third-party carriers decreases during the winter months due to decreased fuel efficiency, increased cold-weather-related equipment maintenance and repairs, and increased insurance claims and costs attributed to higher accident frequency from harsh weather. During this period, the profitability of the Company's operations is generally lower than during other parts of the year. Additionally, the Company has seen surges between Thanksgiving and Christmas resulting from holiday shopping trends toward delivery of gifts purchased over the Internet, as well as the impact of shorter holiday seasons (Thanksgiving holiday recently falling closer to Christmas).
Note 2 — Summary of Significant Accounting Policies
Use of Estimates — The preparation of the consolidated financial statements, in accordance with GAAP, requires management to make estimates and assumptions about future events that affect the amounts reported in the Company's consolidated financial statements and accompanying notes. On an ongoing basis, management evaluates and periodically adjusts its estimates and assumptions, based on historical experience, the impact of the current economic environment, and other key factors. Volatile energy markets, as well as changes in consumer spending have increased the inherent uncertainty in such estimates and assumptions. As future events and their effects cannot be determined with precision, actual results could differ significantly from these estimates. Significant items subject to such estimates and assumptions include:
• | carrying amount of property and equipment, intangibles, and goodwill; |
• | valuation allowances for receivables, inventories, and deferred income tax assets; |
• | valuation of financial instruments; |
• | calculation of stock-based compensation; |
• | estimates of claims accruals; |
• | leases, and |
• | contingent obligations. |
Segments — The Company uses the "management approach" to determine its reportable segments, as well as to determine the basis of reporting the operating segment information. Certain of the Company's operating segments have been aggregated into reportable segments. The management approach focuses on financial information that management uses to make operating decisions. The Company's chief operating decision makers use total revenue, operating expense categories, operating ratios, operating income, and key operating statistics to evaluate performance and allocate resources to the Company's operations.
Operating income is the measure that management uses to evaluate segment performance and allocate resources, which is consistent with GAAP for segment reporting. Operating income should not be viewed as a substitute for GAAP net income (loss). Management believes the presentation of operating income enhances the understanding of the Company's performance by highlighting the results of operations and the underlying profitability drivers of the business segments. Operating income is defined as "Total revenue" less "Operating expenses."
Based on the unique nature of the Company's operating structure, certain revenue-generating assets are interchangeable between segments. Additionally, the Company's chief operating decision makers do not review assets or liabilities by segment to make operating decisions. The Company allocates depreciation and amortization expense of its property and equipment to the segments based on the actual utilization of the asset by the segment during the period.
See Note 25 for additional disclosures regarding the Company's segments.
70
KNIGHT-SWIFT TRANSPORTATION HOLDINGS INC.
NOTES TO CONSOLIDATED FINANCIAL STATEMENTS — CONTINUED
Cash and Cash Equivalents — Cash and cash equivalents are comprised of cash, money market funds, and highly liquid instruments with insignificant interest rate risk and original maturities of three months or less. Cash balances with institutions may be in excess of Federal Deposit Insurance Corporation ("FDIC") limits or may be invested in sweep accounts that are not insured by the institution, the FDIC, or any other government agency.
Restricted Cash — The Company's wholly-owned captive insurance companies, Red Rock and Mohave, maintain certain operating bank accounts, working trust accounts, and investment accounts. The cash and short-term investments within the accounts are restricted by insurance regulations to fund the insurance claim losses to be paid by the captive insurance companies. Therefore, these cash and short-term investments are classified as "Cash and cash equivalents – restricted" in the consolidated balance sheets.
Restricted Investments — The Company's investments are restricted by insurance regulations to fund the insurance claim losses to be paid by the captive insurance companies. The Company accounts for its investments in accordance with ASC 320, Investments – Debt and Equity Securities. Management determines the appropriate classification of its investments in debt securities at the time of purchase and re-evaluates the determination on a quarterly basis. As of December 31, 2017, all of the Company's investments in fixed-maturity securities were classified as held-to-maturity, as the Company has the positive intent and ability to hold these securities to maturity. Held-to-maturity securities are carried at amortized cost. The amortized cost of debt securities is adjusted using the effective interest rate method for amortization of premiums and accretion of discounts. Amortization and accretion are reported in "Other income, net" in the consolidated income statements.
Management periodically evaluates restricted investments for impairment. The assessment of whether impairments have occurred is based on management's case-by-case evaluation of the underlying reasons for the decline in estimated fair value. Management accounts for other-than-temporary impairments of debt securities in accordance with ASC 320, Investments – Debt and Equity Securities. This guidance requires the Company to evaluate whether it intends to sell an impaired debt security or whether it is more likely than not that it will be required to sell an impaired debt security before recovery of the amortized cost basis. If either of these criteria are met, an impairment loss equal to the difference between the debt security's amortized cost and its estimated fair value is recognized in earnings. For impaired debt securities that do not meet these criteria, the Company determines if a credit loss exists with respect to the impaired security. If a credit loss exists, the credit loss component of the impairment (i.e., the difference between the security's amortized cost and the present value of projected future cash flows expected to be collected) is recognized in earnings and the remaining portion of the impairment is recognized as a component of accumulated other comprehensive income.
See Note 6 for additional disclosures regarding the Company's restricted investments.
Inventories and Supplies — Inventories and supplies, which are included in "Other current assets" in the consolidated balance sheets, primarily consist of spare parts, tires, fuel, and supplies and are stated at lower of cost or net realizable value. Depending on the class of inventory, cost is determined using the first-in, first-out method or average cost.
Property and Equipment — Property and equipment is stated at cost less accumulated depreciation. Costs to construct significant assets include capitalized interest incurred during the construction and development period. Expenditures for replacements and improvements are capitalized. Maintenance and repairs are expensed as incurred.
Depreciation of property and equipment is calculated on a straight-line basis down to the salvage value, as applicable, over the following estimated useful lives:
Category: | Range (in years) | |||
Revenue equipment | 4 | — | 20 | |
Shop and service equipment | 2 | — | 10 | |
Land improvements | 5 | — | 15 | |
Buildings and building improvements | 10 | — | 40 | |
Furniture and fixtures | 3 | — | 10 | |
Leasehold improvements | Life of the lease | |||
Net gains on the disposal of property and equipment are presented in the consolidated income statements within miscellaneous operating expenses, net.
Tires on purchased revenue equipment are capitalized along with the related equipment cost when the vehicle is placed in service and depreciated over the life of the vehicle. Replacement tires are classified as inventory and expensed when placed in service.
Management evaluates its property and equipment whenever events or changes in circumstances indicate that the carrying amount of an asset may not be recoverable in accordance with ASC 360, Property, Plant and Equipment. When such events or changes in circumstances occur, management performs a recoverability test that compares the carrying amount with the projected undiscounted cash flows from the use and eventual disposition of the asset or asset group. An impairment is recorded for any excess of the carrying amount over the estimated fair value. Fair value is determined through various valuation techniques including discounted cash flow models, quoted market values, and third-party independent appraisals, as considered necessary.
71
KNIGHT-SWIFT TRANSPORTATION HOLDINGS INC.
NOTES TO CONSOLIDATED FINANCIAL STATEMENTS — CONTINUED
Intangible Assets other than Goodwill — The Company's intangible assets other than goodwill primarily consist of acquired customer relationships and trade names from the 2017 Merger, as well as intangibles from Knight's 2014 acquisition of Barr-Nunn Transportation, Inc. and certain of its affiliates. Amortization of acquired customer relationships is calculated on a straight-line basis over the estimated useful life, which ranges from 5 years to 20 years. The trade names have indefinite useful lives and are not amortized, but are tested for impairment at least annually, unless events occur or circumstances change between annual tests that would more likely than not reduce the fair value.
Management reviews its intangible assets for impairment whenever events or circumstances indicate that the carrying amount of the asset may not be recoverable, in accordance with ASC 350, Intangibles – Goodwill and Other. When such events or changes in circumstances occur, management performs a recoverability test that compares the carrying amount with the projected discounted cash flows from the use and eventual disposition of the asset or asset group. An impairment is recorded for any excess of the carrying amount over the estimated fair value, which is generally determined using discounted future cash flows.
See Notes 4 and 11 for additional disclosures regarding the Company's intangible assets.
Goodwill — Management evaluates goodwill on an annual basis as of June 30th, or more frequently if indicators of impairment exist. The Company assesses qualitative factors to determine whether it is more likely than not that the fair value of a reporting unit is less than the carrying amount. If the Company concludes that it is more likely than not that the fair value of a reporting unit is less than its carrying amount, the Company conducts a two-step quantitative goodwill impairment test. The first step of the quantitative impairment test involves comparing the fair values of the applicable reporting units with their carrying values. Management estimates the fair values of its reporting units using a combination of the income and market approaches. If the carrying amount of a reporting unit exceeds the reporting unit's fair value, then management performs the second step of the quantitative impairment test. The second step of the quantitative impairment test involves comparing the implied fair value of the affected reporting unit's goodwill with the carrying value of that goodwill. Any amount by which the carrying value of the goodwill exceeds its implied fair value is recognized as an impairment loss. Refer to Note 11 for discussion of the results of the Company's annual evaluation as of June 30, 2017.
See Notes 4 and 11 for additional disclosures regarding the Company's goodwill.
Claims Accruals — The Company is self-insured for a portion of its risk related to auto liability, workers' compensation, property damage, and cargo damage. Self-insurance results from buying insurance coverage that applies in excess of a retained portion of risk for each respective line of coverage. The Company accrues for the cost of the uninsured portion of pending claims by evaluating the nature and severity of individual claims and by estimating future claims development based upon historical claims development trends. The actual cost to settle self-insured claim liabilities may differ from the Company's reserve estimates due to legal costs, claims that have been incurred but not reported, and various other uncertainties, including the inherent difficulty in estimating the severity of the claims and the potential judgment or settlement amount to dispose of the claim.
See Notes 13 and 19 for additional disclosures regarding the Company's claims accruals.
Operating Leases — In accordance with ASC 840, Leases, property and equipment held under operating leases, and liabilities related thereto, are off-balance sheet. All expenses related to operating leases are reflected in the consolidated income statements in "Rental expense." At lease inception, management determines whether the lease should be classified as operating or capital lease, based on the guidance set forth in ASC 840. Additionally at lease inception, management determines the useful life and estimates residual values of the related equipment. Future minimum lease payments used in determining lease classification represent the minimum rental payments called for over the lease term, inclusive of residual value guarantees (if applicable) and amounts that would be required to be paid, if any, by the Company upon default for leases containing subjective acceleration or cross default clauses.
In connection with various operating leases, we issued residual value guarantees, which provide that if we do not purchase the leased equipment from the lessor at the end of the lease term, we are liable to the lessor for an amount equal to the shortage (if any) between the proceeds from the sale of the equipment and an agreed value. To the extent we believe any manufacturer will refuse or be unable to meet its obligation, we recognize additional rental expense to the extent we believe the fair market value at the lease termination will be less than our obligation to the lessor. We believe that proceeds from the sale of equipment under operating leases would exceed the payment obligation on substantially all operating leases.
See Note 17 for additional disclosures regarding the Company's operating leases.
Fair Value Measurements — See Note 23 for accounting policies and financial information relating to fair value measurements.
Contingencies — See Note 19 for accounting policies and financial information related to contingencies.
72
KNIGHT-SWIFT TRANSPORTATION HOLDINGS INC.
NOTES TO CONSOLIDATED FINANCIAL STATEMENTS — CONTINUED
Revenue Recognition — In accordance with ASC 605-20-25-13, Services for Freight-in-Transit at the End of a Reporting Period, the Company currently recognizes operating revenue and the related direct costs of such revenue when persuasive evidence of an arrangement exists, the fee is fixed and determinable, and collectability is probable, all of which occur as of the date the freight is delivered.
Credit terms for customer accounts are generally on a net 30 day basis. The Company establishes an allowance for doubtful accounts based on historical experience and any known trends or uncertainties related to customer billing and account collectability. The Company reviews the adequacy of its allowance for doubtful accounts on a quarterly basis. Uncollectible accounts are written off when deemed uncollectible, and accounts receivable are presented net of an allowance for doubtful accounts.
The Company recognizes operating lease revenue from leasing tractors and related equipment to independent contractors. Operating lease revenue from rental operations is recognized as earned, which is straight-lined per the rent schedules in the lease agreements. Losses from lease defaults are recognized as offsets to revenue.
Stock-based Compensation — The Company accounts for stock-based compensation expense in accordance with ASC 718, Compensation – Stock Compensation. ASC 718 requires that all share-based payments to employees and non-employee directors, including grants of employee stock options, be recognized in the financial statements based upon a grant-date fair value of an award. The fair value of performance units is estimated using the Monte Carlo Simulation valuation model. Equity awards settled in cash are remeasured at each reporting period and are recognized as a liability in the consolidated balance sheets during the vesting period until settlement. The fair value of stock options is estimated using the Black-Scholes option-valuation model. The Company calculates the number of awards expected to vest as awards granted, less expected forfeitures over the life of the award (estimated at grant date). Compensation expense is recorded on a straight-line basis, by amortizing the grant-date fair value over the requisite service period of the entire award. Unless a material deviation from the assumed forfeiture rate is observed during the term in which the awards are expensed, any adjustment necessary to reflect differences in actual experience is recognized in the period the award becomes payable or exercisable. See Note 21 for additional information relating to the Company's stock compensation plan.
Income Taxes — Management accounts for income taxes under the asset and liability method. Accordingly, deferred tax assets and liabilities are recognized for the future tax consequences of events that have been included in the consolidated financial statements. Additionally, deferred tax assets and liabilities are determined based on the differences between the financial statement carrying amounts and respective tax bases of assets and liabilities (using enacted tax rates in effect for the year in which the differences are expected to reverse). The effect on deferred tax assets and liabilities of changes in tax rates is recognized in income in the period that includes the enactment date. Net deferred incomes taxes are classified as noncurrent in the consolidated balance sheets.
A valuation allowance is provided against deferred tax assets if the Company determines it is more likely than not that such assets will not ultimately be realized. In making such determinations, the Company considers all available positive and negative evidence, including scheduled reversals of deferred tax liabilities, projected future taxable income, tax planning strategies, and recent financial operations.
Unrecognized tax benefits are defined as the difference between a tax position taken or expected to be taken in a tax return and the benefit recognized and measured pursuant to ASC 740, Income Taxes. The Company does not recognize a tax benefit for uncertain tax positions unless it concludes that it is more likely than not that the benefit will be sustained on audit (including resolutions of any related appeals or litigation processes) by the taxing authority, based solely on the technical merits of the associated tax position. If the recognition threshold is met, the Company recognizes a tax benefit measured at the largest amount of the tax benefit that, in the management's judgment, is greater than 50% likely to be realized. The Company records expected incurred interest and penalties related to unrecognized tax positions in "Income tax (benefit) expense" in the consolidated income statements. To the extent interest and penalties are not assessed with respect to uncertain tax positions, amounts accrued will be reduced and reflected as a reduction of the overall income tax provision.
See Note 14 for additional disclosures regarding the Company's income taxes.
73
KNIGHT-SWIFT TRANSPORTATION HOLDINGS INC.
NOTES TO CONSOLIDATED FINANCIAL STATEMENTS — CONTINUED
Note 3 — Recently Issued Accounting Pronouncements, Not Yet Adopted
Date Issued | Reference | Description | Expected Adoption Date and Method | Financial Statement Impact | ||||
January 2017 | 2017-04: Intangibles – Goodwill and Other (Topic 350) Simplifying the Test for Goodwill Impairment | The amendments in this ASU are intended to simplify subsequent measurement of goodwill. The key amendment in the ASU eliminates Step 2 from the goodwill impairment test, in which entities measured a goodwill impairment loss by comparing the implied fair value to the carrying amount of a reporting unit's goodwill. Instead, an entity should perform its annual, or interim, goodwill impairment test by comparing the fair value with the carrying amount of a reporting unit and recognize an impairment charge for the amount by which the carrying amount exceeds the reporting unit's fair value. | January 2020, prospective | Currently under evaluation; not expected to be material | ||||
January 2017 | 2017-03: Accounting Changes and Error Corrections (Topic 250) and Investments – Equity Method and Joint Ventures (Topic 323) – Amendments to SEC Paragraphs Pursuant to Staff Announcements at the September 22, 2016 and November 17, 2016 EITF Meetings | The amendments in this ASU that are relevant to the Company pertain to disclosures around the impact that recently issued accounting standards will have on the financial statements of a registrant when such standards are adopted in a future period. The amendments in this ASU indicate that the SEC staff expects that if an entity cannot reasonably estimate the impact of an ASU on the financial statements, then the entity should consider additional qualitative disclosures to assist the reader in assessing the significance of the standard's impact on its financial statements. | Immediate | None - The Company's recently issued accounting pronouncements disclosures are aligned with the amendments in this ASU. | ||||
November 2016 | 2016-18: Statement of Cash Flows – (Topic 230) Restricted Cash (a Consensus of the FASB Emerging Issues Task Force) | The amendments in this ASU require transfers between cash and equivalents and restricted cash and equivalents, as well as direct cash receipts into and cash payments made from restricted cash and equivalents to be explained in the statement of cash flows. Restricted cash and restricted cash equivalents are to be included in the beginning and ending cash and cash equivalent balance totals on the statement of cash flows. | January 2018; Retrospective | Material impact in cash flow presentation to reclassify restricted cash to "net increase/decrease in cash, restricted cash, and equivalents," and adjust the beginning and ending balances. | ||||
October 2016 | 2016-16: Income Taxes (Topic 740) – Intra-entity Transfers of Assets Other than Inventory | This ASU states that entities should recognize the income tax consequences of an intra-entity transfer of an asset other than inventory when the transfer occurs (as compared to current GAAP, which prohibits the recognition of current and deferred income taxes for intra-entity asset transfer until the asset has been sold to an outside party). | January 2018, Modified Retrospective | Currently under evaluation; not expected to be material since the Company's fixed assets are not typically transferred between legal entities for consideration. | ||||
August 2016 | 2016-15: Statement of Cash Flows (Topic 230) – Classification of Certain Cash Receipts and Cash Payments | This ASU has several amendments, which are designed to reduce existing diversity in practice of how certain cash receipts and cash payments are presented and classified in the statement of cash flows. The ASU addresses eight specific cash flow issues, of which the following are expected to be applicable to the Company: 1) debt prepayment and extinguishment costs, 2) proceeds from settlement of insurance claims, 3) proceeds from settlement of corporate-owned life insurance policies, 4) beneficial interests in securitization transactions, and 5) separately identifiable cash flows and application of the predominance principle. | January 2018, Retrospective | Currently under evaluation; not expected to be material. | ||||
74
KNIGHT-SWIFT TRANSPORTATION HOLDINGS INC.
NOTES TO CONSOLIDATED FINANCIAL STATEMENTS — CONTINUED
Date Issued | Reference | Description | Expected Adoption Date and Method | Financial Statement Impact | ||||
June 2016 | 2016-13: Financial Instruments – Credit Losses (Topic 326) – Measurement of Credit Losses on Financial Instruments | The purpose of this ASU is to amend the current incurred loss impairment methodology with a new methodology that reflects expected credit losses and requires a broader range of reasonable and supportable information to inform credit loss estimates. This is the final credit accounting standard, out of a series, with detailed guidance on the new loss reserve model, Current Expected Credit Loss ("CECL"). Among other provisions, the amendments in the ASU require a financial asset (or group of assets) measured at amortized cost basis to be presented at the net amount expected to be collected. Entities are no longer required to wait until a loss is probable to record it. | January 2020, Adoption method varies by amendment | Currently under evaluation; not expected to be material. | ||||
May 2016 | 2016-12: Revenue from Contracts with Customers (Topic 606) – Narrow-scope Improvements and Practical Expedients | The amendments in this ASU clarify certain aspects regarding the collectability criterion, sales taxes collected from customers, noncash consideration, contract modifications, and completed contracts at transition. It additionally clarifies that retrospective application only requires disclosure of the accounting change effect on prior periods presented, not on the period of adoption. | January 2018, Modified retrospective | Currently under evaluation (1) | ||||
April 2016 | 2016-10: Revenue from Contracts with Customers (Topic 606) – Identifying Performance Obligations and Licensing | The amendments in this ASU clarify the following two aspects of Topic 606: identifying performance obligations and the licensing implementation guidance, while retaining the related principles for those areas. The amendments do not change the core principle of the guidance. | January 2018, Modified retrospective | Currently under evaluation (1) | ||||
March 2016 | 2016-08: Revenue from Contracts with Customers (Topic 606) – Principal versus Agent Considerations (Reporting Revenue Gross versus Net) | The amendments in this ASU are intended to improve the operability and understandability of the implementation guidance on principal versus agent considerations, but do not change the core principle of the guidance. | January 2018, Modified retrospective | Currently under evaluation (1) | ||||
February 2016 | 2016-02: Leases (Topic 842) | The new standard requires lessees to recognize assets and liabilities arising from both operating and financing leases on the balance sheet. Lessor accounting for leases is largely unaffected by the new guidance. | January 2019, Modified retrospective | Currently under evaluation; expected to be material, but not yet quantifiable. | ||||
January 2016 | 2016-01: Financial Instruments – Overall (Subtopic 825-10) – Recognition and Measurement of Financial Assets and Financial Liabilities | The amendments in this ASU address various aspects of recognition, measurement, presentation, and disclosure of financial instruments. They additionally establish ASC 321 – Investments – Equity Securities, which applies to investments in equity securities and other ownership interests in an entity, including investments in partnerships, unincorporated joint ventures, and limited liability companies. | January 2018, Modified retrospective | Currently under evaluation | ||||
August 2015 | 2015-14: Revenue from Contracts with Customers (Topic 606) – Deferral of the Effective Date | This ASU deferred the effective date of ASU 2014-09 (Topic 606) to annual reporting periods beginning after December 15, 2017. | January 2018, Modified retrospective | Currently under evaluation (1) | ||||
75
KNIGHT-SWIFT TRANSPORTATION HOLDINGS INC.
NOTES TO CONSOLIDATED FINANCIAL STATEMENTS — CONTINUED
____________
(1) | ASC 606, Revenue from Contracts with Customers — The Company established an ASC 606 implementation team, which includes support from external experts, to evaluate and implement the standard. The diagnostic phase of assessing the financial and business impacts of implementing the standard is complete and included identifying revenue sources within the Company's lines of business, reviewing a sample of contracts, analyzing the impact on systems, and developing a preliminary assessment. As the diagnostic phase was being finalized, management was concurrently designing and developing solutions in preparation for the implementation phase of the standard. Additionally, management developed internal controls to ensure that the Company properly evaluated the company's material contracts under the five-step model in ASC 606. As of March 1, 2018, management is implementing the necessary changes in accounting, reporting, sales, information technology, internal controls, and other business processes to ensure compliance with the new guidance. |
Management identified the following key considerations with respect to accounting and reporting under the new standard:
• | identification of what constitutes a contract in the Company's business practices, |
• | variability in individual contracts, such as customer-specific terms that may vary from the master agreement, |
• | principal versus agent determinations, |
• | timing of revenue recognition (for example, point-in-time versus over time and/or accelerated versus deferred), |
• | single versus multiple performance obligations, including the timing of when such performance obligations are satisfied, |
• | new/changed estimates and management judgments (for example, system estimation of in-transit accruals versus manual estimation), |
• | disaggregation of revenue by category within segments, and |
• | others. |
The Company considered its various operating segments, determining that the key segments affected will be its four trucking segments (Knight Trucking, Swift Truckload, Swift Dedicated, and Swift Refrigerated), as well as its intermodal, logistics, and shop businesses. The Company's other streams of revenue within Swift's non-reportable segments (specifically its leasing and captive insurance subsidiaries) were determined to be out of scope.
The most notable impact on the Company of the new standard pertains to recognizing revenue at a point in time versus over time. Under ASC 605, the Company recognized revenue at the point in time that the freight was delivered. Beginning in the first quarter of 2018, under ASC 606, the Company will recognize revenue that is in-transit at period end, as estimated in days. As such, timing of revenue recognition (as well as the related variable costs) between reportable periods will change, but the net impact on the Company's results of operations on each reportable period is expected to be immaterial. Management expects to continue recognizing revenue on a gross basis, consistent with past practices. Additionally, there was no change in management's determination of principal versus agent for its recognition of revenue under ASC 606, compared to ASC 605.
Since the Company is applying the modified retrospective approach of adoption, a cumulative-effect adjustment to retained earnings will be recorded in the first quarter of 2018, and the prior year information will not be adjusted. Based on the information currently available, management expects a cumulative-effect adjustment to retained earnings in the first quarter of 2018 to be in the range of $3.0 million to $6.0 million, which reflects the operating revenue impact, net of related variable costs and income taxes.
Management is currently evaluating the impact on its accounting policies and other required disclosures that will be effective in the Quarterly Report on Form 10-Q for the first quarter of 2018. Management is expecting updates to the Company's footnote disclosures around revenue recognition, as the new guidance requires enhanced disclosures, including revenue recognition policies to identify performance obligations to customers, as well as significant management judgment used in measurement and recognition of revenue. Management is not expecting any changes in financial statement classification. Additionally, no impact on the Company's debt covenants is expected. Since management is continuing to evaluate the impact of the standard, disclosures around these preliminary assessments are subject to change.
76
KNIGHT-SWIFT TRANSPORTATION HOLDINGS INC.
NOTES TO CONSOLIDATED FINANCIAL STATEMENTS — CONTINUED
Note 4 — Merger and Purchase Price Allocation
2017 Merger
On September 8, 2017, pursuant to the Agreement and Plan of Merger, dated as of April 9, 2017, by Swift Transportation Company, Bishop Merger Sub, Inc., a direct wholly owned subsidiary of Swift ("Merger Sub"), and Knight Transportation, Inc., Merger Sub merged with and into Knight, with Knight surviving as a direct wholly owned subsidiary of Swift (the "2017 Merger"). Immediately prior to the effective time of the 2017 Merger (the "Effective Time"), the certificate of incorporation of the Company was amended and restated (the "Amended Company Charter") to reflect, among other things, that:
(1) | the Company's corporate name changed from "Swift Transportation Company" to "Knight-Swift Transportation Holdings Inc."; and |
(2) | each issued and outstanding share of Class B common stock, par value $0.01 per share, of Swift was converted (the "Class B Conversion") into one share of Class A common stock, par value $0.01 per share, of Swift and immediately thereafter, each issued and outstanding share of Swift Class A common stock (including each share of Swift Class A common stock into which the shares Swift Class B common stock was converted pursuant to the Class B Conversion) was, by means of a reverse stock split (the "Reverse Split"), consolidated into 0.72 of a share of Class A common stock of the Company. No fractional shares of Class A common stock were issued in the Reverse Split, and, in connection with the Reverse Split, holders of Class A common stock became entitled to receive cash in lieu of any fractional shares in accordance with the Amended Company Charter. |
At the Effective Time, each share of Knight common stock, par value $0.01 per share, of Knight ("Knight Common Stock") issued and outstanding immediately prior to the Effective Time (other than shares held in the treasury of Knight or owned or held, directly or indirectly, by Swift or any wholly owned subsidiary of Swift or Knight, in each case not held in a fiduciary capacity on behalf of a third-party) was converted into the right to receive one share of the Company's Class A common stock.
Upon the closing of the 2017 Merger, the shares of Knight common stock that previously traded under the ticker symbol "KNX" on the NYSE ceased trading on, and were delisted from, the NYSE. Shares of the Company's Class A common stock commenced trading on the NYSE, on a post-Reverse Split basis, under the ticker symbol "KNX" on September 11, 2017.
In 2017, the Company recorded $16.5 million of direct and incremental costs associated with 2017 Merger-related activities, primarily incurred for legal and professional fees, which were recorded in the "Merger-related costs" line in the consolidated income statements. In association with the 2017 Merger, the Company incurred merger-related bonuses and accelerated stock compensation expense totaling $5.6 million, which is recorded in the "Salaries, wages, and benefits" line in the consolidated income statements. Additionally, the Company incurred $0.9 million in merger-related statutory filing fees and miscellaneous expense, and $0.1 million in independent contractor retention expenses recorded within the "Miscellaneous operating expenses, net" and "Purchased transportation" lines in the consolidated income statements.
Purchase Price Allocation
Following the consummation of the 2017 Merger, Knight and Swift stockholders own approximately 46% and 54%, respectively, of the Company. Based on Knight's $40.85 per share closing price on September 8, 2017 and the fair value of Swift equity awards, consisting of outstanding stock options and certain unvested restricted stock units, and noncontrolling interest assumed by the Company totaling $13.2 million, the 0.72 of a combined company share that the Swift stockholders received in respect of each class A share of Swift had an aggregate fair value of approximately $4.0 billion.
The purchase price allocation for the 2017 Merger is open for adjustments and has been allocated based on estimated fair values of the assets acquired and liabilities assumed at the acquisition date, pending the finalization of certain identified contingent liabilities and the calculation of deferred taxes based upon the underlying tax basis of assets acquired and liabilities assumed and assessment of other tax related items. Management expects that, as more information is obtained, the purchase price allocation disclosed below may change. Any future adjustments to the purchase price allocation, including changes within identifiable intangible assets or estimation uncertainty impacted by market conditions, may impact future net earnings. The purchase price allocation adjustments can be made through the end of the measurement period, which is not to exceed one year from the acquisition date.
The following table summarizes the total fair value consideration transferred:
(In thousands, except ratio and stock price) | |||
Number of Swift shares outstanding at September 8, 2017 | 134,765 | ||
Swift share consolidation ratio | 0.72 | ||
Swift shares outstanding post-Reverse Split and immediately prior to the 2017 Merger | 97,031 | ||
Closing price of Knight on September 8, 2017 | $ | 40.85 | |
Fair value of equity portion of the 2017 Merger consideration | $ | 3,963,712 | |
Fair value of Swift equity awards and noncontrolling interest assumed | 13,193 | ||
Total fair value of consideration transferred | $ | 3,976,905 | |
77
KNIGHT-SWIFT TRANSPORTATION HOLDINGS INC.
NOTES TO CONSOLIDATED FINANCIAL STATEMENTS — CONTINUED
The following is a summary of the allocation of purchase consideration (which is open for adjustments) to the estimated fair value of Swift's assets acquired and liabilities assumed in the 2017 Merger:
September 9, 2017 Opening Balance Sheet as Reported at September 30, 2017 | Fourth Quarter 2017 Adjustments | Adjusted September 9, 2017 Opening Balance Sheet as Reported at December 31, 2017 | |||||||||
(In thousands) | |||||||||||
Fair value of the consideration transferred | $ | 3,976,905 | $ | — | $ | 3,976,905 | |||||
Cash and cash equivalents | $ | 28,484 | $ | — | $ | 28,484 | |||||
Restricted cash and fixed maturity securities | 85,615 | — | 85,615 | ||||||||
Trade and other receivables | 411,767 | — | 411,767 | ||||||||
Prepaid expenses | 44,564 | — | 44,564 | ||||||||
Other current assets | 19,736 | — | 19,736 | ||||||||
Property and equipment | 1,522,123 | — | 1,522,123 | ||||||||
Identifiable intangible assets (1) | 1,285,900 | 165,800 | 1,451,700 | ||||||||
Other noncurrent assets | 18,537 | — | 18,537 | ||||||||
Total assets | 3,416,726 | 165,800 | 3,582,526 | ||||||||
Accounts payable | (188,411 | ) | — | (188,411 | ) | ||||||
Accrued liabilities | (232,280 | ) | — | (232,280 | ) | ||||||
Claims accruals | (306,846 | ) | — | (306,846 | ) | ||||||
Long-term debt and capital lease obligations | (894,681 | ) | — | (894,681 | ) | ||||||
Deferred tax liabilities (1) | (741,405 | ) | (64,392 | ) | (805,797 | ) | |||||
Other long-term liabilities | (18,452 | ) | — | (18,452 | ) | ||||||
Total liabilities | (2,382,075 | ) | (64,392 | ) | (2,446,467 | ) | |||||
Goodwill (1) | $ | 2,942,254 | $ | (101,408 | ) | $ | 2,840,846 | ||||
____________
(1) | Adjustments made to identifiable intangible assets, goodwill, and deferred tax liabilities pertain to management's re-evaluation of the royalty rate used associated with certain trade names. |
The goodwill is primarily attributable to Swift's existing workforce and the synergies expected to arise after the 2017 Merger. These acquired capabilities, when combined with Knight's business, will result in opportunities that allow us to provide services under contracts that could not have been pursued individually by either Knight or Swift. As noted above, the purchase price allocation is open for adjustments, but the Company has allocated goodwill to its reportable segments (as presented in Note 11). The goodwill will not be deductible for tax purposes.
The estimated fair value of the acquired identifiable intangible assets is based on a valuation completed for Swift, along with related tangible assets, using a combination of the income method and comparable market transactions. Following are the details of the preliminary purchase price allocated to the identifiable intangible assets acquired:
Estimated Life | Estimated Fair Value as of September 9, 2017 | Adjustments | Adjusted Estimated Fair Value as of September 9, 2017 | ||||||||||
(years) | (thousands) | ||||||||||||
Customer relationships | 10 - 20 years | $ | 817,200 | $ | (700 | ) | $ | 816,500 | |||||
Trade name | indefinite | 468,700 | 166,500 | 635,200 | |||||||||
Total identifiable intangible assets | $ | 1,285,900 | $ | 165,800 | $ | 1,451,700 | |||||||
See (1), above for nature of the adjustments made to intangible assets. The Company assumed certain claims and contingent liabilities, including legal reserves, at the acquisition date. The fair value of these liabilities is open for adjustments and as additional information is obtained, the fair value of these liabilities may change.
78
KNIGHT-SWIFT TRANSPORTATION HOLDINGS INC.
NOTES TO CONSOLIDATED FINANCIAL STATEMENTS — CONTINUED
The Company's 2017 consolidated financial statements include Swift's results of operations after September 8, 2017 (closing of the 2017 Merger) through December 31, 2017. During 2017, Swift's total revenue and net income included within the Company's consolidated operating results was $1.3 billion and $95.7 million, respectively. Swift's net income for this period includes a $16.8 million impairment charge primarily related to termination of implementation of Swift's ERP system, as well as $12.9 million related to the amortization of intangibles acquired in the 2017 Merger.
The following unaudited pro forma information combines the historical operations of Knight and Swift, giving effect to the 2017 Merger and related transactions as if they had been consummated on January 1, 2016, the beginning of the previous period.
2017 | 2016 | ||||||
(in thousands, except per share data) | |||||||
Total revenue | $ | 5,136,261 | $ | 5,149,551 | |||
Net income attributable to Knight-Swift | $ | 529,922 | $ | 223,209 | |||
Diluted earnings per share | $ | 2.97 | $ | 1.25 | |||
The unaudited pro forma condensed combined financial information has been presented for comparative purposes only and includes certain adjustments such as recognition of assets acquired at estimated fair values and related depreciation and amortization, elimination of transaction costs incurred by Knight and by Swift during the periods presented that were directly related to the 2017 Merger, and related income tax effects of these items. As a result of the 2017 Merger, both Knight and Swift incurred certain merger-related expenses, including professional legal and advisory fees, acceleration of share-based compensation, bonus incentives, severance payments, filing fees and other miscellaneous expenses. These merger-related expenses for both Knight and Swift totaled $57.0 million in 2017 and are eliminated from presentation of the unaudited pro forma net income presented above. The unaudited pro forma condensed combined financial information does not purport to represent the actual results of operations that Knight and Swift would have achieved had the companies been combined during the periods presented in the unaudited pro forma condensed combined financial statements and is not intended to project the future results of operations that the combined company may achieve after the 2017 Merger. The unaudited pro forma condensed combined financial information does not reflect any cost savings that may be realized as a result of the 2017 Merger and also does not reflect any restructuring or integration-related costs to achieve those potential cost savings.
Note 5 — Marketable Securities
Historically, Knight, from time to time, held certain marketable equity securities classified as available-for-sale securities, which are recorded at fair value with unrealized gains and losses, net of tax, as a component of "Accumulated other comprehensive income (loss)" in stockholders' equity on the accompanying consolidated balance sheets. Realized gains and losses on available-for-sale securities are included in the determination of net income. Management uses specific identification to determine the cost of securities sold, or amounts reclassified out of accumulated other comprehensive income into earnings and included in "Other income" in the accompanying income statements.
The following table shows realized gains during 2017, 2016, and 2015, on certain securities that were classified as available-for-sale:
2017 | 2016 | 2015 | |||||||||
(In thousands) | |||||||||||
Realized Gains: | |||||||||||
Sales proceeds | $ | — | $ | 7,403 | $ | 12,528 | |||||
Cost of securities sold | — | 2,909 | 3,937 | ||||||||
Realized gain | $ | — | $ | 4,494 | $ | 8,591 | |||||
Realized gain, net of taxes | $ | — | $ | 2,771 | $ | 5,273 | |||||
Knight disposed of its holdings in available-for-sale equity investments in 2016, leaving no balance on the accompanying consolidated balance sheets as of December 31, 2017 or December 31, 2016.
Refer to Note 23 for additional information regarding fair value measurements of the Company's marketable securities.
79
KNIGHT-SWIFT TRANSPORTATION HOLDINGS INC.
NOTES TO CONSOLIDATED FINANCIAL STATEMENTS — CONTINUED
Note 6 — Restricted Investments
The following table presents the cost or amortized cost, gross unrealized gains and temporary losses, and estimated fair value of the Company's restricted investments:
December 31, 2017 | |||||||||||||||
Gross Unrealized | |||||||||||||||
Cost or Amortized Cost | Gains | Temporary Losses | Estimated Fair Value | ||||||||||||
(In thousands) | |||||||||||||||
United States corporate securities | $ | 15,982 | $ | — | $ | (14 | ) | $ | 15,968 | ||||||
Municipal bonds | 4,970 | — | (10 | ) | 4,960 | ||||||||||
Negotiable certificates of deposit | 1,280 | — | — | 1,280 | |||||||||||
Restricted investments, held to maturity | $ | 22,232 | $ | — | $ | (24 | ) | $ | 22,208 | ||||||
The Company did not have any held-to-maturity restricted investments as of December 31, 2016. As of December 31, 2017, the contractual maturities of the restricted investments were one year or less. There were 32 securities that were in an unrealized loss position for less than twelve months as of December 31, 2017. The Company did not recognize any impairment losses related to restricted investments during 2017, 2016, or 2015.
Refer to Note 2 for accounting policy and Note 23 for additional information regarding fair value measurements of restricted investments.
Note 7 — Transportation Resource Partners
From 2003 through 2016, Knight has entered into partnership agreements with entities that make privately-negotiated equity investments, including Transportation Resource Partners ("TRP"), Transportation Resource Partners III, LP ("TRP III"), TRP Capital Partners, LP ("TRP IV"), TRP CoInvest Partners, (NTI) I, LP ("TRP Coinvestment NTI"), and TRP CoInvest Partners, (QLS) I, LP ("TRP Coinvestment QLS"). In these agreements, Knight committed to invest in return for an ownership percentage.
The following table presents ownership and commitment information for Knight's investments in TRP partnerships:
December 31, 2017 | ||||||||||||||
Knight's Ownership Interest (4) | Total Commitment (All Partners) | Knight's Contracted Commitment | Knight's Remaining Commitment | |||||||||||
(Dollars in thousands) | ||||||||||||||
TRP – cost method investment | 2.3 | % | $ | 260,000 | $ | 5,500 | $ | — | ||||||
TRP III – equity method investment (1) | 4.8 | % | $ | 245,000 | $ | 15,000 | $ | 1,739 | ||||||
TRP IV – cost method investment (2) | 4.1 | % | $ | 116,000 | $ | 4,900 | $ | 2,075 | ||||||
TRP Coinvestment NTI – equity method investment (3) | 8.3 | % | $ | 120,000 | $ | 10,000 | $ | — | ||||||
TRP Coinvestment QLS – equity method investment (3) | 25.0 | % | $ | 39,000 | $ | 9,735 | $ | — | ||||||
____________
(1) | Management anticipates that the following amounts will be due: $0.9 million in 2018 and $0.8 million from 2019 through 2020. |
(2) | Management anticipates that the following amounts will be due: $1.3 million in 2018, $0.5 million from 2019 through 2020, $0.2 million from 2021 through 2022, and $0.1 million from 2023 through 2024. |
(3) | The TRP Coinvestments are unconsolidated majority interests. Management considered the criteria set forth in ASC 323, Investments – Equity Method and Joint Ventures, to establish the appropriate accounting treatment for these investments. This guidance requires the use of the equity method for recording investments in limited partnerships where the "so minor" interest is not met. As such, the investments are being accounted for under the equity method. Knight's ownership interest reflects its ultimate ownership of the portfolio companies underlying the TRP Coinvestment NTI and TRP Coinvestment QLS legal entities. |
(4) | Knight's share of the results is included within "Other Income" in the consolidated income statements. |
80
KNIGHT-SWIFT TRANSPORTATION HOLDINGS INC.
NOTES TO CONSOLIDATED FINANCIAL STATEMENTS — CONTINUED
Net investment balances included in "Other long-term assets, restricted cash and investments" in the consolidated balance sheets were as follows:
December 31, | |||||||
2017 | 2016 | ||||||
(in thousands) | |||||||
TRP – cost method investment | $ | 211 | $ | 214 | |||
TRP III – equity method investment | 1,973 | 5,882 | |||||
TRP IV – cost method investment | 2,577 | 1,882 | |||||
TRP Coinvestment NTI – equity method investment | 7,579 | 10,000 | |||||
TRP Coinvestment QLS – equity method investment | 8,054 | 9,735 | |||||
Total carrying value | $ | 20,394 | $ | 27,713 | |||
Trade receivables balances were as follows:
December 31, | |||||||
2017 | 2016 | ||||||
(In thousands) | |||||||
Trade customers | $ | 565,732 | $ | 123,555 | |||
Equipment manufacturers | 6,017 | 468 | |||||
Other | 17,345 | 12,550 | |||||
Trade receivables | 589,094 | 136,573 | |||||
Less: Allowance for doubtful accounts | (14,829 | ) | (2,727 | ) | |||
Trade receivables, net | $ | 574,265 | $ | 133,846 | |||
The following is a rollforward of the allowance for doubtful accounts for trade receivables:
2017 | 2016 | 2015 | |||||||||
(In thousands) | |||||||||||
Beginning balance | $ | 2,727 | $ | 3,106 | $ | 3,355 | |||||
Provision | 4,671 | 909 | 1,333 | ||||||||
Write-offs directly against the reserve | (1,583 | ) | — | — | |||||||
Write-offs for revenue adjustments | (3,758 | ) | (1,288 | ) | (1,582 | ) | |||||
Other (1) | 12,772 | — | — | ||||||||
Ending balance | $ | 14,829 | $ | 2,727 | $ | 3,106 | |||||
____________
(1) | Increase in allowance for doubtful accounts relates to trade receivables assumed from Swift as part of the 2017 Merger. See Note 4 for further details regarding the 2017 Merger. |
See Note 15 for a discussion of the Company's accounts receivable securitization program and the related accounting treatment.
81
KNIGHT-SWIFT TRANSPORTATION HOLDINGS INC.
NOTES TO CONSOLIDATED FINANCIAL STATEMENTS — CONTINUED
The Company provides financing to independent contractors and other third-parties on equipment sold or leased. Most of the notes are collateralized and are due in weekly installments, including principal and interest payments, ranging from 2% to 20%. Notes receivable are included in "Notes receivable, net" and "Notes receivable, long-term" in the consolidated balance sheets and were comprised of:
December 31, | |||||||
2017 | 2016 | ||||||
(In thousands) | |||||||
Notes receivable from independent contractors | $ | 8,977 | $ | 1,039 | |||
Notes receivable from third parties | 7,865 | 2,808 | |||||
Gross notes receivable | 16,842 | 3,847 | |||||
Allowance for doubtful notes receivable | (1,040 | ) | (240 | ) | |||
Total notes receivable, net of allowance | $ | 15,802 | $ | 3,607 | |||
Current portion, net of allowance | 4,742 | 560 | |||||
Long-term portion | $ | 11,060 | $ | 3,047 | |||
The following is a rollforward of the allowance for doubtful notes receivable:
December 31, | |||||||||||
2017 | 2016 | 2015 | |||||||||
(In thousands) | |||||||||||
Beginning balance | $ | 240 | $ | 273 | $ | 351 | |||||
Provision (Reduction) | 574 | (27 | ) | 26 | |||||||
Write-offs | (53 | ) | (6 | ) | (104 | ) | |||||
Other (1) | 279 | — | — | ||||||||
Ending balance | $ | 1,040 | $ | 240 | $ | 273 | |||||
____________
(1) | Increase in allowance for doubtful notes relates to notes receivable assumed from Swift as part of the 2017 Merger. See Note 4 for further details regarding the 2017 Merger. |
As of December 31, 2017 and 2016, assets held for sale are carried at the lower of depreciated cost or estimated fair value, less expected selling costs when the required criteria, as defined by ASC 360, Property, Plant, and Equipment, are satisfied. Depreciation ceases on the date that the held for sale criteria are met. The Company expects to sell these assets within the next twelve months. Revenue equipment held for sale totaled $25.2 million and $9.6 million as of December 31, 2017 and 2016, respectively. The Company had no land or facilities classified as held for sale as of December 31, 2017 or 2016.
Refer to Note 23 for discussion about the Company's impairment losses pertaining to assets held for sale in 2017. The Company did not recognize any impairment losses in 2016 or 2015.
In 2017, 2016, and 2015, the Company sold no operating properties classified as held for sale. Accordingly, there was no gain or loss on disposal of properties recognized. Gain on disposals of property and equipment recognized in the income statements for those years pertain to revenue equipment.
82
KNIGHT-SWIFT TRANSPORTATION HOLDINGS INC.
NOTES TO CONSOLIDATED FINANCIAL STATEMENTS — CONTINUED
The changes in the carrying amounts of goodwill were as follows:
December 31, | |||||||
2017 | 2016 | ||||||
(In thousands) | |||||||
Goodwill at beginning of period | $ | 47,031 | $ | 47,050 | |||
Amortization relating to deferred tax assets | (10 | ) | (19 | ) | |||
Goodwill related to 2017 Merger | 2,840,846 | — | |||||
Goodwill at end of period | $ | 2,887,867 | $ | 47,031 | |||
The following presents the components of goodwill by segment as of December 31, 2017 and 2016:
December 31, | |||||||
2017 | 2016 | ||||||
Net Carrying Amount (1) | Net Carrying Amount (1) | ||||||
(In thousands) | |||||||
Swift – Truckload | $ | 1,150,012 | $ | — | |||
Swift – Dedicated | 779,335 | — | |||||
Swift – Refrigerated | 650,613 | — | |||||
Swift – Intermodal | 175,594 | — | |||||
Swift – Non-reportable | 85,292 | — | |||||
Knight – Trucking | 47,021 | 47,031 | |||||
Goodwill | $ | 2,887,867 | $ | 47,031 | |||
____________
(1) | Except for the net accumulated amortization related to deferred tax assets in the Knight Trucking segment, the net carrying amount and gross carrying amount are equal since there are no accumulated impairment losses. |
There were no impairments identified during annual goodwill impairment testing in 2017, 2016, or 2015.
Intangible asset balances were as follows:
December 31, | |||||||
2017 | 2016 | ||||||
(In thousands) | |||||||
Customer relationships and non-compete: | |||||||
Gross carrying value | $ | 820,200 | $ | 3,700 | |||
Accumulated amortization | (14,497 | ) | (1,125 | ) | |||
Customer relationships and non-compete, net | 805,703 | 2,575 | |||||
Trade name: | |||||||
Gross carrying value | 635,200 | — | |||||
Intangible assets, net | $ | 1,440,903 | $ | 2,575 | |||
83
KNIGHT-SWIFT TRANSPORTATION HOLDINGS INC.
NOTES TO CONSOLIDATED FINANCIAL STATEMENTS — CONTINUED
The following table presents amortization of intangible assets related to the 2017 Merger and intangible assets existing prior to the 2017 Merger:
2017 | 2016 | 2015 | |||||||||
(In thousands) | |||||||||||
Amortization of intangible assets related to the 2017 Merger | $ | 12,872 | $ | — | $ | — | |||||
Amortization of intangible assets existing prior to the 2017 Merger | 500 | 500 | 500 | ||||||||
Amortization of intangibles | $ | 13,372 | $ | 500 | $ | 500 | |||||
Identifiable intangible assets subject to amortization have been recorded at fair value. Intangible assets related to acquisitions prior to 2017 are amortized over a weighted-average amortization period of 7.6 years. The Company's customer relationship intangible assets related to the 2017 Merger are being amortized over a weighted average amortization period of 19.9 years.
As of December 31, 2017, management anticipates that the composition and amount of amortization associated with intangible assets will be $41.9 million in each of 2018 and 2019, $41.8 million in each of 2020 and 2021, and $41.7 million in 2022. Actual amounts of amortization expense may differ from estimated amounts due to additional intangible asset acquisitions, impairment of intangible assets, accelerated amortization of intangible assets, and other events.
See Note 2 for accounting policies regarding goodwill and other intangible assets.
The following table presents the composition of accrued payroll and purchased transportation:
December 31, | |||||||
2017 | 2016 | ||||||
(In thousands) | |||||||
Accrued payroll (1) | $ | 58,438 | $ | 7,877 | |||
Accrued purchased transportation | 48,579 | 17,140 | |||||
Accrued payroll and purchased transportation | $ | 107,017 | $ | 25,017 | |||
____________
(1) | Accrued payroll includes accruals related to the various 401(k) plans the Company offers to its employees. In order to qualify for these plans, employees must meet the minimum age requirement (18 – 21 years) and have completed six months of service with the Company. Employees' rights to employer contributions are fully vested after five years from their date of employment. The plans offer either mandatory matching contributions, capped at $1,600 annually per employee, or discretionary matching contributions, capped at 3% of an employee's compensation. |
The Company's employee benefits expense for matching contributions related to the 401(k) plans was approximately $3.9 million, $1.2 million, and $0.8 million in 2017, 2016, and 2015, respectively. This expense was included in "Salaries, wages, and benefits" in the consolidated income statements. As of December 31, 2017 and 2016, the balance included $6.8 million and $0.1 million, respectively, in respect to matching contributions for the 401(k) plans.
The following table presents the composition of accrued liabilities:
December 31, | |||||||
2017 | 2016 | ||||||
(In thousands) | |||||||
Accrued legal (1) | 121,453 | 3,006 | |||||
Other | 64,623 | 13,716 | |||||
Accrued liabilities | $ | 186,076 | $ | 16,722 | |||
____________
(1) | See Note 19 for further details regarding the Company's legal accruals. |
84
KNIGHT-SWIFT TRANSPORTATION HOLDINGS INC.
NOTES TO CONSOLIDATED FINANCIAL STATEMENTS — CONTINUED
Claims accruals represent the uninsured portion of outstanding claims at year-end. The current portion reflects the amount of claims expected to be paid in the following year. The Company's insurance program for workers' compensation, auto and collision liability, physical damage, independent contractor claims, and cargo damage involves self-insurance with varying risk retention levels.
Claims accruals were comprised of the following:
December 31, | |||||||
2017 | 2016 | ||||||
(In thousands) | |||||||
Auto reserves | $ | 204,400 | $ | 21,474 | |||
Workers’ compensation reserves | 126,563 | 7,935 | |||||
Independent contractor claims reserves | 15,236 | — | |||||
Cargo damage reserves | 4,047 | — | |||||
Employee medical reserves | 3,183 | 2,514 | |||||
Claims accruals | 353,429 | 31,923 | |||||
Less: current portion of claims accruals | (147,285 | ) | (18,633 | ) | |||
Claims accruals, less current portion | $ | 206,144 | $ | 13,290 | |||
See Note 2 for accounting policy regarding the Company's claims accruals.
The following table presents the Company's income tax expense:
2017 | 2016 | 2015 | |||||||||
(In thousands) | |||||||||||
Current expense: | |||||||||||
Federal | $ | 4,868 | $ | 43,638 | $ | 41,549 | |||||
State | 8,337 | 8,500 | 4,966 | ||||||||
Foreign | 133 | — | — | ||||||||
13,338 | 52,138 | 46,515 | |||||||||
Deferred (benefit) expense: | |||||||||||
Federal | (323,326 | ) | 6,789 | 19,666 | |||||||
State | 17,731 | (1,335 | ) | 1,866 | |||||||
Foreign | 541 | — | — | ||||||||
(305,054 | ) | 5,454 | 21,532 | ||||||||
Income tax (benefit) expense | $ | (291,716 | ) | $ | 57,592 | $ | 68,047 | ||||
Rate Reconciliation — Expected tax expense is computed by applying the United States federal corporate income tax rate of 35.0% to earnings before income taxes. Actual tax expense differs from expected tax expense as follows:
2017 | 2016 | 2015 | |||||||||
(In thousands) | |||||||||||
Computed "expected" tax expense | $ | 67,798 | $ | 53,490 | $ | 65,277 | |||||
Increase (decrease) in income taxes resulting from: | |||||||||||
State income taxes, net of federal income tax benefit | 4,871 | 4,657 | 4,441 | ||||||||
Statutory rate change effect on deferred taxes | (367,000 | ) | — | — | |||||||
Other | 2,615 | (555 | ) | (1,671 | ) | ||||||
Income tax (benefit) expense | $ | (291,716 | ) | $ | 57,592 | $ | 68,047 | ||||
85
KNIGHT-SWIFT TRANSPORTATION HOLDINGS INC.
NOTES TO CONSOLIDATED FINANCIAL STATEMENTS — CONTINUED
Deferred Income Taxes — The components of the net deferred tax asset (liability) included in "Deferred income taxes" in the consolidated balance sheets were:
December 31, | |||||||
2017 | 2016 | ||||||
(In thousands) | |||||||
Deferred tax assets: | |||||||
Claims accrual | $ | 70,564 | $ | 11,355 | |||
Allowance for doubtful accounts | 5,117 | 1,133 | |||||
Amortization of stock options | 4,717 | 3,101 | |||||
Accrued liabilities | 37,654 | 1,388 | |||||
Vacation accrual | 3,585 | — | |||||
Other | 7,227 | 2,345 | |||||
Total deferred tax assets | 128,864 | 19,322 | |||||
Valuation allowance | — | — | |||||
Total deferred tax assets, net | 128,864 | 19,322 | |||||
Deferred tax liabilities: | |||||||
Property and equipment, principally due to differences in depreciation | (429,917 | ) | (192,363 | ) | |||
Prepaid taxes, licenses, and permits deducted for tax purposes | (10,217 | ) | (2,737 | ) | |||
Intangible assets | (365,564 | ) | — | ||||
Other | (2,243 | ) | (2,222 | ) | |||
Deferred tax liabilities | (807,941 | ) | (197,322 | ) | |||
Deferred income taxes | $ | (679,077 | ) | $ | (178,000 | ) | |
Valuation Allowance — As of December 31, 2017, the Company had a federal net operating loss carryforward with estimated tax effects of $0.2 million. The federal net operating loss will expire at various times between 2030 and 2032. As of December 31, 2017, the Company had state income tax credit carryforwards for which a deferred tax asset was recorded in the amount of $1.8 million and expires in the year 2021. The Company has not established a valuation allowance as it has been determined that, based upon available evidence, a valuation allowance is not required. Management asserts that it is more likely than not that the results of future operations will generate sufficient taxable income to realize the deferred tax assets. All other deferred tax assets are expected to be realized and utilized by continued profitability in future periods.
Cumulative Undistributed Foreign Earnings — As of December 31, 2017, foreign withholding taxes have not been provided on approximately $58.7 million of cumulative undistributed earnings of foreign subsidiaries. The earnings are considered to be permanently reinvested outside the United States. As such, the Company is not required to provide withholding taxes on these earnings until they are repatriated in the form of dividends or otherwise.
Unrecognized Tax Benefits — The Company's unrecognized tax benefits as of December 31, 2017 would favorably impact the Company's effective tax rate if subsequently recognized.
See Note 2 for accounting policy related to the Company's income taxes.
A reconciliation of the beginning and ending amount of unrecognized tax benefits for 2017, 2016 and 2015 is as follows:
2017 | 2016 | 2015 | |||||||||
(In thousands) | |||||||||||
Unrecognized tax benefits at beginning of year | $ | 729 | $ | — | $ | — | |||||
Increases for tax positions taken prior to beginning of year | 5,432 | 729 | — | ||||||||
Increases for tax positions taken in the current year | 935 | — | — | ||||||||
Unrecognized tax benefits at end of year | $ | 7,096 | $ | 729 | $ | — | |||||
86
KNIGHT-SWIFT TRANSPORTATION HOLDINGS INC.
NOTES TO CONSOLIDATED FINANCIAL STATEMENTS — CONTINUED
Interest and Penalties — Accrued interest and penalties as of December 31, 2017 were approximately $0.3 million. The Company had no interest and penalties accrued as of December 31, 2016 or 2015.
Tax Examinations — Certain of the Company's subsidiaries are currently under examination by various state jurisdictions for tax years ranging from 2011 to 2016. At the completion of these examinations, management does not expect any adjustments that would have a material impact on the Company's effective tax rate. Years subsequent to 2012 remain subject to examination.
Regulatory Developments — On December 22, 2017, the United States enacted significant changes to US tax law following the passage and signing of H.R.1, "An Act to Provide for Reconciliation Pursuant to Titles II and V of the Concurrent Resolution on the Budget for Fiscal Year 2018" (previously known as "The Tax Cuts and Jobs Act" and hereafter "the Act"). The new tax law is complex and includes various changes which may impact the Company. Management estimates that the Act will have a net beneficial impact of $364.2 million, discussed below.
• | The Company is subject to the provisions of ASC 740-10, Income Taxes, which requires that the effect on deferred tax assets and liabilities as a result of a change in statutory tax rate be recognized in the period in which the tax rate change was enacted. The Company currently expects the enacted reduction in the US corporate income tax rate, to result in a one-time, non-cash decrease to income tax expense of $367.0 million in 2017. |
• | The Act requires a mandatory deemed repatriation of post-1986 undistributed foreign earnings and profits ("E&P"). A proportional deduction on the deemed repatriation will result in a repatriation transition tax of 15.5% for cash and liquid assets and 8.0% for non-liquid assets. The tax will be assessed regardless of whether or not the Company has cash in its foreign subsidiaries and regardless of whether the Company brings back the earnings. The tax is determined based on the greater of E&P as of two measurement dates (November 2, 2017 or December 31, 2017). The amount of cash and liquid assets is determined based on the greater of the amounts calculated using the two alternative measurement periods. The estimated Transition Tax for 2017 is $2.8 million. |
Due to the complexities involved in accounting for the enactment of the Act, SEC Staff Accounting Bulletin ("SAB") 118 allows taxpayers to provide a provisional estimate of the impacts of the Act on the income tax provision for 2017. The accounting for the statutory rate change and Transition Tax described above is estimated using provisional amounts and is not yet complete. We will continue to assess our provision for income taxes as future guidance is issued but do not currently anticipate significant revisions will be necessary. Any such revisions will be treated in accordance with the measurement period guidance outline in SAB No. 118.
On December 10, 2015, Swift Receivables Company II, LLC ("SRCII") , a wholly-owned subsidiary of Swift, entered into the Third Amendment to Amended and Restated Receivables Sale Agreement ("2015 RSA"), with unrelated financial entities ("The Purchasers"), which further amends the Second Amended and Restated Receivables Sale Agreement. The parties to the 2015 RSA include SRCII as the seller, Swift Transportation Services, LLC as the servicer, the various conduit purchasers, the various related committed purchasers, the various purchaser agents, the various letters of credit participants, and PNC Bank, National Association as the issuing bank of letters of credit and as administrator. Pursuant to the 2015 RSA, the Company's receivable originator subsidiaries sell, on a revolving basis, undivided interests in all of their eligible accounts receivable to SRCII. In turn, SRCII sells a variable percentage ownership interest in the eligible accounts receivable to the various purchasers. The facility qualifies for treatment as a secured borrowing under ASC 860, Transfers and Servicing. As such, outstanding amounts are classified as liabilities in the Company's consolidated balance sheets. Refer to Note 23 for information regarding the fair value of the 2015 RSA.
The following table summarizes the key attributes of the current securitization program:
2015 RSA | |
(Dollars in thousands) | |
Effective | December 2015 |
Borrowing capacity (1) | $400,000 |
Final maturity date | January 10, 2019 |
Unused commitment fee rate | 35 basis points |
Program fees on outstanding balances | one-month LIBOR + 90 basis points |
____________
(1) | The 2015 RSA has an accordion option to increase the maximum borrowing capacity by up to an additional $75.0 million, subject to participation by the Purchasers. |
87
KNIGHT-SWIFT TRANSPORTATION HOLDINGS INC.
NOTES TO CONSOLIDATED FINANCIAL STATEMENTS — CONTINUED
As of December 31, 2017, interest accrued on the aggregate principal balance at a rate of 2.1%. Program fees and unused commitment fees are recorded in "Interest expense" in the consolidated income statements. The Company incurred program fees of $2.2 million during December 31, 2017.
The 2015 RSA is subject to customary fees and contains various customary affirmative and negative covenants, representations and warranties, and default and termination provisions. The Company was in compliance with these covenants as of December 31, 2017. Collections on the underlying receivables by the Company are held for the benefit of SRCII and the various purchasers and are unavailable to satisfy claims of the Company and its subsidiaries.
Other than the Company's accounts receivable securitization as discussed in Note 15 and its outstanding capital lease obligations as discussed in Note 17, the Company's long-term debt consisted of the following:
December 31, | |||||||
2017 | 2016 | ||||||
(In thousands) | |||||||
Term Loan, due October 2020, net of $645 deferred loan costs(1) | $ | 364,355 | $ | — | |||
Other long-term debt, including current portion | 446 | — | |||||
Total long-term debt, including current portion | 364,801 | — | |||||
Less: current portion of long-term debt | (30 | ) | — | ||||
Long-term debt, less current portion | $ | 364,771 | $ | — | |||
December 31, | |||||||
2017 | 2016 | ||||||
(In thousands) | |||||||
Total long-term debt, including current portion | $ | 364,801 | $ | — | |||
Knight Revolver, due August 2019 (1) (2) | — | 18,000 | |||||
Revolver, due October 2022 (1) (3) | 125,000 | — | |||||
Long-term debt, including revolving line of credit | $ | 489,801 | $ | 18,000 | |||
____________
(1) | Refer to Note 23 for information regarding the fair value of debt. |
(2) | Knight also had outstanding letters of credit under the Knight Revolver of $31.3 million at December 31, 2016, issued to various regulatory authorities and insurance carriers in connection with Knight's self-insurance programs. |
(3) | The Company also had outstanding letters of credit under the Revolver, primarily related to workers' compensation and self-insurance liabilities of $122.3 million at December 31, 2017. |
Credit Agreements
2017 Debt Agreement — On September 29, 2017, Knight-Swift entered into the $1.2 billion 2017 Debt Agreement (which is an unsecured credit facility), with a group of banks, replacing Swift's previous secured 2015 Debt Agreement, and Knight's unsecured 2013 Debt Agreement. The 2017 Debt Agreement includes an $800.0 million Revolver maturing October 2022, $85.0 million of which was drawn at closing, and a $400.0 million Term Loan maturing October 2020. There are no scheduled principal payments on the Term Loan until its maturity.
The 2015 Debt Agreement included a $600.0 million revolving line of credit maturing July 2020 ($35.0 million outstanding as of the closing of the 2017 Debt Agreement) and a $680.0 million Term Loan A ($450.0 million face value outstanding as of closing). Additionally, prior to the 2017 Merger, the 2013 Debt Agreement included a $300.0 million Knight Revolver maturing August 2019, with no balance outstanding as of the closing of the 2017 Debt Agreement. Upon closing of the 2017 Debt Agreement, proceeds from the $400.0 million Term Loan, $85.0 million drawn from the Revolver, and $3.4 million cash on hand were used to pay off the then-outstanding balances and accrued interest and fees under the 2015 Debt Agreement, as well as certain transaction fees and expenses associated with the 2017 Debt Agreement.
Under the 2017 Debt Agreement, the interest rate on the Revolver and the Term Loan is subject to a leverage-based pricing grid and equaled the LIBOR rate plus 1.125% at closing, which is 0.375% lower than the rate applicable under the Swift 2015 Debt Agreement and 0.50% higher than the rate applicable under the 2013 Debt Agreement as of the closing of the 2017 Debt Agreement.
88
KNIGHT-SWIFT TRANSPORTATION HOLDINGS INC.
NOTES TO CONSOLIDATED FINANCIAL STATEMENTS — CONTINUED
The following table presents the key terms of the 2017 Debt Agreement:
Term Loan | Revolver (2) | |||
2017 Debt Agreement Terms: | (Dollars in thousands) | |||
Maximum borrowing capacity | $400,000 | $800,000 | ||
Final maturity date | October 2, 2020 | October 3, 2022 | ||
Interest rate base | LIBOR | LIBOR | ||
Interest rate minimum margin (1) | 0.88% | 0.88% | ||
Interest rate maximum margin (1) | 1.50% | 1.50% | ||
Minimum principal payment — amount | $— | $— | ||
Minimum principal payment — frequency | Once | Once | ||
Minimum principal payment — commencement date | October 2, 2020 | October 3, 2022 | ||
____________
(1) | The interest rate margin for the Term Loan and Revolver is based on the Company's consolidated leverage ratio. As of December 31, 2017, interest accrued at 2.694% on the Term Loan and 2.687% on the Revolver. |
(2) | The commitment fee for the unused portion of the Revolver is based on the Company's consolidated leverage ratio, and ranges from 0.07% to 0.20%. As of December 31, 2017, commitment fees on the unused portion of the Revolver accrued at 0.125% and outstanding letter of credit fees accrued at 1.125%. |
Pursuant to the 2017 Debt Agreement, the Revolver and the Term Loan contain certain financial covenants with respect to a maximum net leverage ratio and a minimum consolidated interest coverage ratio. The 2017 Debt Agreement provides flexibility regarding the use of proceeds from asset sales, payment of dividends, stock repurchases and equipment financing. In addition to the financial covenants, the 2017 Debt Agreement includes usual and customary events of default for a facility of this nature and provides that, upon the occurrence and continuation of an event of default, payment of all amounts payable under the 2017 Debt Agreement may be accelerated, and the lenders' commitments may be terminated. The 2017 Debt Agreement contains certain usual and customary restrictions and covenants relating to, among other things, dividends (which would be restricted only if a default or event of default had occurred and was continuing or would result therefrom), liens, affiliate transactions, and other indebtedness. As of December 31, 2017, the Company was in compliance with the debt covenants that the 2017 Debt Agreement was subject to.
Borrowings under the 2017 Debt Agreement are guaranteed by Knight-Swift Transportation Holdings Inc., Swift Transportation Company, Interstate Equipment Leasing, LLC, Knight Transportation, Inc. and the Company's domestic subsidiaries (other than its captive insurance subsidiaries, driving academy subsidiary, and bankruptcy-remote special purpose subsidiary).
Knight Revolver — Prior to the closing of the 2017 Debt Agreement, the 2013 Debt Agreement included the $300.0 million Knight Revolver, which permitted revolving borrowings and letters of credit. The scheduled maturity of the Knight Revolver was August 1, 2019, which was accelerated to December 31, 2017 in connection with the closing of the 2017 Merger. Knight incurred interest on borrowings under the Knight Revolver at either the prime rate or LIBOR plus 0.625%, determined by Knight at the time of borrowing. There were no outstanding borrowings under the Knight Revolver as of December 31, 2017 as a result of its cancellation pursuant to the 2017 Debt Agreement, compared to $18.0 million as of December 31, 2016, recorded within the "Revolving line of credit" of the Company's consolidated balance sheets. Excluding commitment fees incurred for the unused portion of the Knight Revolver, the weighted average variable annual percentage rate for 2017 and 2016 was 1.40%, and 1.32%, respectively. The Knight Revolver was subject to commitment fees for any unused portion at a rate of 0.8%.
See Note 23 for fair value disclosures regarding the Company's debt instruments.
89
KNIGHT-SWIFT TRANSPORTATION HOLDINGS INC.
NOTES TO CONSOLIDATED FINANCIAL STATEMENTS — CONTINUED
The Company finances a portion of its revenue equipment under capital and operating leases and certain terminals under operating leases.
Capital Leases (as Lessee) — The Company's capital leases are typically structured with balloon payments at the end of the lease term equal to the residual value the Company is contracted to receive from certain equipment manufacturers upon sale or trade back to the manufacturers. If the Company does not receive proceeds of the contracted residual value from the manufacturer, the Company is still obligated to make the balloon payment at the end of the lease term. Certain leases contain renewal or fixed price purchase options. The present value of obligations under capital leases is included under "Capital lease obligations – current portion" and "Capital lease obligations, less current portion" in the consolidated balance sheets. As of December 31, 2017, the leases were collateralized by revenue equipment with a cost of $173.7 million and accumulated amortization of $9.4 million. Knight had no capital leases as of December 31, 2016 and 2015, therefore no revenue equipment was held as collateral during those periods. Amortization of the equipment under capital leases is included in "Depreciation and amortization of property and equipment" in the Company's consolidated income statements.
Operating Leases (as Lessee) — Operating leases generally include tractors, trailers, chassis, and facilities. Substantially all lease agreements for revenue equipment have fixed payment terms based on the passage of time. The tractor lease agreements generally stipulate maximum miles and provide for mileage penalties for excess miles. These leases generally run for a period of three to five years for tractors and five to seven years for trailers.
Operating and Capital Leases (as Lessee) — As of December 31, 2017, annual future minimum lease payments for all noncancelable leases were:
Operating | Capital | ||||||
(In thousands) | |||||||
2018 | $ | 180,777 | $ | 53,425 | |||
2019 | 122,950 | 59,618 | |||||
2020 | 76,582 | 15,146 | |||||
2021 | 40,547 | 30,846 | |||||
2022 | 22,487 | 18,529 | |||||
Thereafter | 36,957 | 10,919 | |||||
Future minimum lease payments | $ | 480,300 | $ | 188,483 | |||
Less: amounts representing interest | (12,379 | ) | |||||
Present value of minimum lease payments | 176,104 | ||||||
Less: current portion | (48,972 | ) | |||||
Capital lease obligations, less current portion | $ | 127,132 | |||||
Operating Leases (as Lessor) — The Company's wholly-owned financing subsidiaries lease revenue equipment to the Company's independent contractors under operating leases. Annual future minimum lease payments receivable under operating leases for the periods noted below were:
(In thousands) | |||
2018 | $ | 75,130 | |
2019 | 40,573 | ||
2020 | 21,914 | ||
2021 | 7,504 | ||
2022 | 239 | ||
Thereafter | — | ||
Future minimum lease payments receivable | $ | 145,360 | |
Lease classification is determined based on minimum rental payments per the agreement, including residual value guarantees, when applicable, as well as receivables due to the Company upon default or cross-default. When independent-contractors default on their leases, the Company typically re-leases the equipment to other independent-contractors. As such, future minimum lease payments reflect original leases and re-leases.
90
KNIGHT-SWIFT TRANSPORTATION HOLDINGS INC.
NOTES TO CONSOLIDATED FINANCIAL STATEMENTS — CONTINUED
As of December 31, 2017, the Company had outstanding commitments to acquire revenue equipment in 2018 of $229.6 million ($195.4 million of which were tractor commitments) and none thereafter. These purchases may be financed through any combination of operating leases, capital leases, debt, proceeds from sales of existing equipment, and cash flows from operations.
As of December 31, 2017, the Company had outstanding purchase commitments to acquire facilities and non-revenue equipment in 2018 of $6.0 million and none thereafter.
Factors such as costs and opportunities for future terminal expansions may change the amount of such expenditures.
Note 19 — Contingencies and Legal Proceedings
Accounting Policy
The Company is involved in certain claims and pending litigation primarily arising in the normal course of business. The majority of these claims relate to workers' compensation, auto collision and liability, physical damage, and cargo damage, as well as certain class action litigation in which plaintiffs allege failure to provide meal and rest breaks, unpaid wages, unauthorized deductions, and other items. The Company accrues for the uninsured portion of claims losses and the gross amount of other losses when the likelihood of the loss is probable and the amount of the loss is reasonably estimable. These accruals are based on management's best estimate within a possible range of loss. When there is no amount within the range of loss that appears to be a better estimate than any other amount, then management accrues to the low end of the range. Legal fees are expensed as incurred.
When it is reasonably possible that exposure exists in excess of the related accrual (which could be no accrual), management discloses an estimate of the possible loss or range of loss, unless an estimate cannot be determined (because, among other reasons, (1) the proceedings are in various stages that do not allow for assessment; (2) damages have not been sought; (3) damages are unsupported and/or exaggerated; (4) there is uncertainty as to the outcome of pending appeals; and/or (5) there are significant factual issues to be resolved).
If the likelihood of a loss is remote, the Company does not accrue for the loss. However, if the likelihood of a loss is remote, but it is at least reasonably possible that one or more future confirming events may materially change management's estimate within twelve months from the date of the financial statements, management discloses an estimate of the possible loss or range of loss, unless an estimate cannot be determined.
Legal Proceedings
Information is provided below regarding the nature, status, and contingent loss amounts, if any, associated with the Company's pending legal matters. There are inherent uncertainties in these legal matters, some of which are beyond management's control, making the ultimate outcomes difficult to predict. Moreover, management's views and estimates related to these matters may change in the future, as new events and circumstances arise and the matters continue to develop.
The Company has made accruals with respect to its legal matters where appropriate, which are reflected in the consolidated financial statements. The Company has recorded an aggregate accrual of approximately $121.5 million relating to the Company's outstanding legal proceedings as of December 31, 2017.
Based on management's present knowledge of the facts and (in certain cases) advice of outside counsel, management does not believe that loss contingencies arising from pending matters are likely to have a material adverse effect on the Company's overall financial position, operating results, or cash flows after taking into account any existing accruals. However, actual outcomes could be material to the Company's financial position, operating results, or cash flows for any particular period.
91
KNIGHT-SWIFT TRANSPORTATION HOLDINGS INC.
NOTES TO CONSOLIDATED FINANCIAL STATEMENTS — CONTINUED
EMPLOYEE COMPENSATION AND PAY PRACTICES MATTERS | ||||||
Washington Overtime Class Actions | ||||||
The plaintiffs allege one or more of the following, pertaining to Washington state-based driving associates: that Swift 1) failed to pay minimum wage; 2) failed to pay overtime; 3) failed to pay all wages due at established pay periods; 4) failed to provide proper meal and rest periods; 5) failed to provide accurate wage statements; and 6) unlawfully deducted from employee wages. The plaintiffs seek unpaid wages, exemplary damages, interest, other costs, and attorneys’ fees. | ||||||
Plaintiff(s) | Defendant(s) | Date instituted | Court or agency currently pending in | |||
Troy Slack (1) | Swift Transportation Company of Arizona, LLC and Swift Transportation Corporation | September 9, 2011 | United States District Court for the Western District of Washington | |||
Recent Developments and Current Status | ||||||
On August 29, 2017, the parties in the Slack case reached a settlement. The parties are currently disputing the scope of the settlement release. The likelihood that a loss has been incurred is probable and estimable, and has accordingly been accrued. | ||||||
___________
(1) | Individually and on behalf of all others similarly situated. |
INDEPENDENT CONTRACTOR MATTERS | ||||||
Ninth Circuit Independent Contractors Misclassification Class Action | ||||||
The putative class alleges that Swift misclassified independent contractors as independent contractors, instead of employees, in violation of the FLSA and various state laws. The lawsuit also raises certain related issues with respect to the lease agreements that certain independent contractors have entered into with Interstate Equipment Leasing, LLC. The putative class seeks unpaid wages, liquidated damages, interest, other costs, and attorneys' fees. | ||||||
Plaintiff(s) | Defendant(s) | Date instituted | Court or agency currently pending in | |||
Joseph Sheer, Virginia Van Dusen, Jose Motolinia, Vickii Schwalm, Peter Wood (1) | Swift Transportation Co., Inc., Interstate Equipment Leasing, Inc., Jerry Moyes, and Chad Killebrew | December 22, 2009 | Unites States District Court of Arizona and Ninth Circuit Court of Appeals | |||
Recent Developments and Current Status | ||||||
In January 2017, the district court issued an order finding that the plaintiffs had signed contracts of employment and thus the case could properly proceed in court, instead of arbitration. Swift has appealed this decision to the Ninth Circuit and the parties have discussed settlement. Based on the above, the likelihood that a loss has been incurred is probable and estimable, and has accordingly been accrued. | ||||||
Utah Collective and Individual Arbitration | ||||||
The plaintiffs allege that the Central Parties (defined below) misclassified independent contractors as independent contractors, instead of employees, in violation of the FLSA and various state laws. The putative class seeks unpaid wages, liquidated damages, interest, other costs, and attorneys' fees. | ||||||
Plaintiff(s) | Defendant(s) | Date instituted | Court or agency currently pending in | |||
Gabriel Ciluffo, Kevin Shire, and Bryan Ratterree (1) | Central Refrigerated Service, Inc., Central Leasing, Inc., Jon Isaacson, and Jerry Moyes (the "Central Parties"), as well as Swift Transportation Company | June 1, 2012 | American Arbitration Association | |||
Recent Developments and Current Status | ||||||
In October 2016, the arbitrator ruled that approximately 1,300 Central Refrigerated Service, Inc. drivers should have been classified as employees, not independent contractors. The arbitrator ruled that damages could ultimately be assessed in a collective proceeding and denied Swift's motion to decertify the collective proceeding. On April 14, 2017, the parties reached a settlement of the matter. The parties are currently pursuing court approval of that settlement. The likelihood that a loss has been incurred is probable and estimable, and has accordingly been accrued. | ||||||
___________
(1) | Individually and on behalf of all others similarly situated. |
92
KNIGHT-SWIFT TRANSPORTATION HOLDINGS INC.
NOTES TO CONSOLIDATED FINANCIAL STATEMENTS — CONTINUED
Self Insurance
The Company is insured against auto liability ("AL") claims under a primary self-insured retention ("SIR") policy. Knight's AL claims have SIRs ranging from $1.0 million to $3.0 million per occurrence and in some years, depending on the applicable policy year, Knight has been responsible for aggregate losses up to $1.5 million within the primary AL layer. For the policy period March 1, 2017 to March 1, 2018, Knight's SIR is $1.0 million, subject to an annual aggregate limit. For the policy period March 1, 2016 to March 1, 2017, Knight's SIR was $2.5 million with no additional aggregate limits or deductibles within the primary AL policy. The Company secured excess liability coverage up to $130.0 million per occurrence for the Knight policy periods March 1, 2017 to March 1, 2018, and March 1, 2016 to March 1, 2017. Knight also carries a $2.5 million aggregate deductible for any loss or losses within the excess coverage layer. Swift AL claims have $250.0 million of coverage per occurrence ($350.0 million aggregated limits through October 31, 2016), subject to a $10.0 million SIR per-occurrence.
The Company is self-insured for workers' compensation coverage. In the first quarter of 2016, the Knight self-retention level was increased from a maximum of $0.5 million per occurrence to a maximum $1.0 million per occurrence. Swift maintains statutory coverage limits, subject to a $5.0 million SIR for each accident or disease. Additionally, through Knight, the Company also maintains primary and excess coverage for employee medical expenses and hospitalization, with self-insured retention of $0.2 million per claimant in 2017 and 2016. Since January 1, 2015, Swift was fully insured on its medical benefits, subject to contributed premiums.
Note 20 — Share Repurchase Programs
In 2011, Knight's board of directors unanimously authorized the repurchase of up to 10.0 million shares of Knight common stock (the "Knight Repurchase Plan"). There were 1.6 million share repurchases under the Knight Repurchase Plan in each of 2016 and 2015. There were no repurchases in 2017. In connection with the 2017 Merger, the Knight Repurchase Plan was terminated.
In February 2016, Swift's board of directors authorized the repurchase of up to $150.0 million of Swift Class A common stock (the "Swift Repurchase Plan"). Following the 2017 Merger, the Swift Repurchase Plan remained in effect. As of December 31, 2017, approximately $62.9 million remained available under the Swift Repurchase Plan to repurchase shares of the Company's Class A common stock. The Company did not repurchase any shares of its Class A common stock under the Swift Repurchase Plan from September 9, 2017 through December 31, 2017.
Note 21 — Stock-based Compensation
2017 Merger Impact — Refer to Note 4 for a summary of the 2017 Merger transaction.
Accounting Perspective — Pursuant to the Merger Agreement, the following stock transactions occurred on September 8, 2017 (the "Merger Date"):
(1) | each outstanding Swift stock option fully vested as a result of the 2017 Merger, was converted into a stock option to acquire the Company's shares using a 0.72-for-one share consolidation ratio and adjusting the exercise price using the same consolidation ratio; |
(2) | each outstanding unvested Swift restricted stock award fully vested as a result of the 2017 Merger, and was converted into the Company's Class A common stock, using the 0.72-for-one share consolidation ratio; |
(3) | each outstanding unvested Swift restricted stock unit (except for the awards granted in May 2017 that excluded acceleration of vesting related to mergers within the award notices) fully vested as a result of the 2017 Merger, and was converted into the Company's Class A common stock, using the 0.72-for-one share consolidation ratio; and |
(4) | each outstanding unvested Swift performance share unit (except for one director) fully vested as a result of the 2017 Merger, and was converted into the Company's Class A common stock, using the 0.72-for-one consolidation ratio. |
Except for the conversion of stock options, unvested restricted stock awards, unvested restricted stock units, and unvested performance units discussed herein, the material terms of the awards remained unchanged. Prior to the closing of the 2017 Merger, Swift had various unvested equity awards outstanding, of which the vesting was accelerated as of the Merger Date (with the exceptions noted above).
In accordance with authoritative guidance on accounting for stock-based compensation, the Company revalued the awards upon the 2017 Merger closing and allocated the revised fair value between purchase consideration and continuing compensation expense, based on the ratio of service performed through the Merger Date over the total service period of the awards. The total value of Swift awards earned as of the Merger Date included as purchase consideration was $13.1 million. The revised fair value allocated to post-merger services resulted in incremental expense, which is recognized over the remaining service period of the awards. The total value of Swift awards not earned as of the Merger Date was $6.3 million, which is being expensed over the remaining future vesting period. Of this amount, $1.0 million was recorded within "Salaries, wages, and benefits" in the 2017 consolidated income statements. Refer to Note 4 to the consolidated financial statements for further information regarding the 2017 Merger.
93
KNIGHT-SWIFT TRANSPORTATION HOLDINGS INC.
NOTES TO CONSOLIDATED FINANCIAL STATEMENTS — CONTINUED
Legal Perspective — Pursuant to the Merger Agreement, the following stock transactions occurred on the Merger Date:
(1) | each outstanding vested and unvested Knight stock option was assumed by the Company and automatically converted into a stock option to acquire an equal number of Company shares; |
(2) | each outstanding vested and unvested Knight restricted stock unit was assumed by the Company and automatically converted into a restricted stock unit award of the Company; and |
(3) | each outstanding vested and unvested Knight performance unit was assumed by the Company and automatically converted into a performance unit award of the Company. |
Except for the conversion of stock options, restricted stock awards, restricted stock unit awards, and performance unit awards discussed herein, the material terms of the awards remained unchanged. Certain of the Knight performance unit awards vested upon the consummation of the 2017 Merger, as described below.
Compensatory Stock Plans
Before the 2017 Merger, Knight and Swift granted stock-based awards under their respective stock-based compensation plans, discussed below.
2014 Stock Plan — Currently, the 2014 Stock Plan, as amended and restated, is the combined company’s only compensatory stock-based incentive plan. The previous 2014 stock plan replaced Swift's 2007 Omnibus Incentive Plan when it was adopted by Swift's board of directors in March 2014 and then approved by the Swift stockholders in May 2014. The previous 2014 stock plan was amended and restated to rename the plan and for other administrative changes relating to the 2017 Merger. The terms of the 2014 Stock Plan, as amended and restated, remain substantially the same as the previous 2014 stock plan. The 2014 Stock Plan, as amended and restated, permits the payment of cash incentive compensation and authorizes the granting of stock options, stock appreciation rights, restricted stock and restricted stock units, performance shares and performance units, cash-based awards, and stock-based awards to the Company's employees and non-employee directors. As of December 31, 2017, the aggregate number of shares remaining available under the 2014 Stock Plan was approximately 2.9 million.
Legacy Plans — In connection with the 2017 Merger, the registered securities under the Knight Amended and Restated 2003 Stock Option Plan, the Knight 2012 Equity Compensation Plan, the Knight Amended and Restated 2015 Omnibus Incentive Plan, and the Swift 2007 Omnibus Incentive Plan (collectively, the "Legacy Plans") were deregistered. As such, no future awards may be granted under these Legacy Plans. Outstanding awards granted under the Legacy Plans were assumed by the combined company and continue to be governed by such Legacy Plans until such awards have been exercised, forfeited, canceled, or have otherwise expired or terminated.
See Note 2 regarding the Company's accounting policy for stock-based compensation.
Stock-based Compensation Expense
Stock-based compensation expense, net of forfeitures, which is included in "Salaries, wages, and benefits" in the consolidated income statements is comprised of the following:
2017 | 2016 | 2015 | |||||||||
(In thousands) | |||||||||||
Stock options | $ | 1,788 | $ | 1,734 | $ | 1,061 | |||||
Restricted stock units and restricted stock awards | 4,004 | 1,506 | 4,038 | ||||||||
Performance units | 450 | 801 | 1,913 | ||||||||
Stock-based compensation expense – equity awards | $ | 6,242 | $ | 4,041 | $ | 7,012 | |||||
Stock-based compensation expense – liability awards (1) | 148 | — | — | ||||||||
Total stock-based compensation expense, net of forfeitures | 6,390 | 4,041 | 7,012 | ||||||||
Income tax benefit | $ | 2,415 | $ | 1,515 | $ | 2,630 | |||||
____________
(1) | Includes awards granted to executive management in November 2017 that ultimately settle in cash upon fulfilling a requisite service period (for restricted stock units) and fulfilling a requisite service period and achieving performance targets (for performance units). |
94
KNIGHT-SWIFT TRANSPORTATION HOLDINGS INC.
NOTES TO CONSOLIDATED FINANCIAL STATEMENTS — CONTINUED
Unrecognized Stock-based Compensation Expense
The following table presents the total unrecognized stock-based compensation expense and the expected weighted average period over which these expenses will be recognized:
December 31, 2017 | |||||
Expense | Weighted Average Period | ||||
(In thousands) | (In years) | ||||
Equity awards – Stock options | $ | 3,878 | 1.8 | ||
Equity awards – Restricted stock units and restricted stock awards | 19,156 | 2.3 | |||
Equity awards – Performance units | 1,303 | 3.1 | |||
Liability awards – Restricted stock units and performance units | 3,169 | 2.7 | |||
Total unrecognized stock-based compensation expense | $ | 27,506 | 2.3 | ||
Stock Award Grants
2017 | 2016 | 2015 | ||||||
Stock options | 497,421 | 569,480 | 590,141 | |||||
Restricted stock units and restricted stock awards | 266,958 | 17,000 | 13,950 | |||||
Performance units | 44,244 | 177,741 | 165,720 | |||||
Equity awards granted | 808,623 | 764,221 | 769,811 | |||||
Liability awards granted (1) | 77,620 | — | — | |||||
Total stock awards granted | 886,243 | 764,221 | 769,811 | |||||
____________
(1) | Includes 46,572 performance units and 31,048 restricted stock units. |
Stock Options
Stock options are the contingent right of award holders to purchase shares of the Company's Class A common stock at a stated price for a limited time. The exercise price of options granted equals the fair value of the Company's Class A common stock determined by the closing price of the Company's Class A common stock quoted on the NYSE on the grant date. Most stock options granted by the Company cannot be exercised until at least one year after the grant date and have a five to ten-year contractual term. Stock options are forfeited upon termination of employment for reasons other than death, disability, or retirement.
A summary of 2017 stock option activity follows:
Stock options outstanding: | Shares Under Option | Weighted Average Exercise Price | Weighted Average Remaining Contractual Term | Aggregate Intrinsic Value (1) | ||||||||
(In years) | (In thousands) | |||||||||||
Stock options outstanding at December 31, 2016 | 1,737,400 | $ | 23.19 | 2.9 | $ | 17,200 | ||||||
Granted | 497,421 | 33.35 | ||||||||||
Assumed Swift stock options from 2017 Merger | 528,466 | 21.93 | ||||||||||
Exercised | (589,020 | ) | 21.44 | |||||||||
Expired | (24,552 | ) | 24.44 | |||||||||
Forfeited | (190,424 | ) | 27.96 | |||||||||
Stock options outstanding at December 31, 2017 | 1,959,291 | $ | 25.48 | 3.2 | $ | 35,779 | ||||||
Aggregate number of stock options expected to vest at a future date as of December 31, 2017 | 969,965 | 29.00 | 3.5 | $ | 14,283 | |||||||
Exercisable at December 31, 2017 | 918,594 | $ | 21.29 | 2.8 | $ | 20,428 | ||||||
____________
(1) | The aggregate intrinsic value was computed using the closing share price on December 29, 2017 of $43.72 and on December 30, 2016 of $32.83, as applicable. |
95
KNIGHT-SWIFT TRANSPORTATION HOLDINGS INC.
NOTES TO CONSOLIDATED FINANCIAL STATEMENTS — CONTINUED
The fair value of each stock option grant is estimated on the grant date using the Black-Scholes option-valuation model. The following table presents the weighted average assumptions used in the fair value computation:
Stock option fair value assumptions: | 2017 | 2016 | 2015 | ||
Dividend yield (1) | 0.72% | 0.99% | 0.8% | ||
Risk-free rate of return (2) | 1.49% | 0.90% | 0.98% | ||
Expected volatility (3) | 27.95% | 27.91% | 25.88% | ||
Expected term (in years) (4) | 3.2 | 2.7 | 2.7 | ||
Weighted average fair value of stock options granted | $6.78 | $4.28 | $5.00 | ||
____________
(1) | The dividend yield assumption is based on Knight's historical experience and anticipated future dividend payouts. |
(2) | The risk-free interest rate assumption is based on the United States Treasury securities at a constant maturity with a maturity period that most closely resembles the expected term of the stock option award. |
(3) | Expected volatility of the Company's Class A common stock is determined based on Knight's historical data. |
(4) | The expected term of employee stock options represents the weighted-average period the stock options are expected to remain outstanding and was determined based on an analysis of historical exercise behavior. |
The following table summarizes stock option exercise information for the years presented:
Stock option exercises | 2017 | 2016 | 2015 | ||||||||
(In thousands, except share data) | |||||||||||
Number of stock options exercised | 589,020 | 708,244 | 594,673 | ||||||||
Intrinsic value of stock options exercised | $ | 8,792 | $ | 7,100 | $ | 8,300 | |||||
Cash received upon exercise of stock options | $ | 13,159 | $ | 13,188 | $ | 9,930 | |||||
Income tax benefit | $ | 1,833 | $ | 1,847 | $ | 3,175 | |||||
The following table is a rollforward of the Company's unvested stock options:
Unvested stock options: | Shares | Weighted Average Fair Value | ||||
Unvested stock options at December 31, 2016 | 1,131,773 | $ | 4.39 | |||
Granted | 497,421 | 6.78 | ||||
Vested | (398,073 | ) | 4.18 | |||
Forfeited | (190,424 | ) | 5.10 | |||
Unvested stock options at December 31, 2017 | 1,040,697 | $ | 5.49 | |||
The total fair value of the shares vested during the years ended December 31, 2017, 2016, and 2015 was $1.7 million, $1.4 million, and $0.8 million, respectively.
96
KNIGHT-SWIFT TRANSPORTATION HOLDINGS INC.
NOTES TO CONSOLIDATED FINANCIAL STATEMENTS — CONTINUED
Restricted Stock Units
A restricted stock unit represents a right to receive a common share of stock when the unit vests. Restricted stock unit recipients do not have voting rights with respect to the shares underlying unvested awards. Employees forfeit their units if their employment terminates before the vesting date.
The following table is a rollforward of unvested restricted stock units, including restricted stock units classified as equity and those classified as liabilities:
Unvested restricted stock units: | Number of Awards | Weighted Average Fair Value (1) | ||||
Unvested restricted stock units at December 31, 2016 | 686,786 | $ | 16.46 | |||
Granted | 298,006 | 36.44 | ||||
Assumed Swift restricted stock units from 2017 Merger | 168,488 | 40.85 | ||||
Vested | (126,871 | ) | 16.77 | |||
Forfeited | (46,692 | ) | 23.59 | |||
Unvested restricted stock units at December 31, 2017 | 979,717 | $ | 26.59 | |||
____________
(1) | The fair value of each restricted stock unit is based on the closing market price on the grant date, except for the Swift restricted stock unit awards assumed, which were re-measured at the Merger Date. |
Performance Units
The Company issues performance units to selected key employees, that may be earned based on achieving performance targets approved by the compensation committee annually. The initial award is subject to an adjustment determined by the Company's performance achieved over a three-year performance period when compared to the objective performance standards adopted by the compensation committee. Furthermore, the performance units have additional service requirements subsequent to the achievement of the performance targets. Performance units do not earn dividend equivalents.
Performance units granted prior to the 2017 Merger were accelerated on September 8, 2017, the 2017 Merger date, pursuant to the terms of the award agreements. On the 2017 Merger date, awards granted in 2014, 2015, and 2016 were accelerated, but only the performance measurement period for the 2014 award was complete allowing for the final award to be expensed and paid out. The performance period for the 2015 and 2016 awards ended December 31, 2017. The performance criteria were not met based on the performance period results ended December 31, 2017, therefore, no expense was recorded, and no payout was made related to the 2015 or 2016 awards.
Beginning in 2013, Swift granted performance units to certain members of executive management. These awards provided each grantee a number of shares of Swift's Class A common stock at the end of a three-year period, based on certain performance criteria established by Swift's compensation committee.
The following table is a rollforward of unvested performance units, including performance units classified as equity and those classified as liabilities:
Unvested performance units: | Shares | Weighted Average Fair Value | ||||
Unvested performance units at December 31, 2016 | 508,478 | $ | 25.60 | |||
Granted (1) | 90,816 | $ | 40.81 | |||
Assumed Swift performance units from 2017 Merger | 56,817 | $ | 40.85 | |||
Shares earned above target | 21,117 | $ | 23.85 | |||
Vested | (519,483 | ) | $ | 25.53 | ||
Forfeited | (10,112 | ) | $ | 25.40 | ||
Unvested performance units at December 31, 2017 | 147,633 | $ | 35.34 | |||
____________
(1) | The performance measurement period for performance units granted in 2017 is January 1, 2018 to December 31, 2020 (three full calendar years). These awards will vest one month following the expiration of the performance measurement period. |
97
KNIGHT-SWIFT TRANSPORTATION HOLDINGS INC.
NOTES TO CONSOLIDATED FINANCIAL STATEMENTS — CONTINUED
The following table presents the weighted average assumptions used in the fair value computation for performance units, including performance units classified as equity and those classified as liabilities:
Performance unit fair value assumptions: | 2017 | 2016 | 2015 | ||||||||
Dividend yield (1) | 0.59 | % | 0.99 | % | 0.80 | % | |||||
Expected volatility (2) | 31.28 | % | 27.95 | % | 23.18 | % | |||||
Average peer volatility (2) | 28.45 | % | 34.37 | % | 30.70 | % | |||||
Average peer correlation coefficient (3) | 0.60 | 0.60 | 0.49 | ||||||||
Risk-free interest rate (4) | 1.88 | % | 0.89 | % | 0.78 | % | |||||
Expected term (in years) (5) | 3.1 | 2.8 | 2.6 | ||||||||
Weighted-average fair value of performance units granted | $ | 40.81 | $ | 23.89 | $ | 29.30 | |||||
____________
(1) | The dividend yield, used to project stock price to the end of the performance period, is based on the Knight's historical experience and future expectation of dividend payouts. Total stockholder return is determined assuming that dividends are reinvested in the issuing entity over the performance period, which is mathematically equivalent to utilizing a 0% dividend yield. |
(2) | Management (or peer company) estimated volatility using Knight's (or peer company's) historical share price performance over the remaining performance period as of the grant date. |
(3) | The correlation coefficients are used to model the way in which each entity tends to move in relation to each other; the correlation assumptions were developed using the same stock price data as the volatility assumptions. |
(4) | The risk-free interest rate assumption is based on United States Treasury securities at a constant maturity with a maturity period that most closely resembles the expected term of the performance award. |
(5) | Since the Monte Carlo Simulation valuation is an open form model that uses an expected life commensurate with the performance period, the expected life of the performance units was assumed to be the period from the grant date to the end of the performance period. |
Non-compensatory Stock Plan: ESPP
In 2012, Swift's board of directors adopted, and its stockholders approved, the Swift Transportation Company 2012 ESPP (the "2012 ESPP"). The 2012 ESPP continues to be administered by the Company following the 2017 Merger, is intended to qualify under Section 423 of the Internal Revenue Code, and is considered noncompensatory. Pursuant to the 2012 ESPP, the Company is authorized to issue up to 1.4 million shares of its Class A common stock to eligible employees who participate in the plan. Employees are eligible to participate in the 2012 ESPP following at least 90 days of employment with the Company or any of its participating subsidiaries. Under the terms of the 2012 ESPP, eligible employees may elect to purchase Class A common stock through payroll deductions, not to exceed 15% of their gross cash compensation. The purchase price of the Class A common stock is 95% of the Class A common stock's fair market value quoted on the NYSE on the last trading day of each offering period. There are four three-month offering periods corresponding to the calendar quarters. Each eligible employee is restricted to purchasing a maximum of $6,250 of Class A common stock during an offering period, determined by the fair market value of the Class A common stock as of the first day of the offering period, and $25,000 of Class A common stock during a calendar year. Employees who own 5% or more of the total voting power or value of Class A common stock are restricted from participating in the 2012 ESPP.
The 2012 ESPP was amended and restated in January 2018 to be a Knight-Swift plan, thus permitting Knight employees to participate in the plan in addition to Swift employees. The terms and definitions of the amended and restated 2012 ESPP remain substantially the same as the original 2012 ESPP.
In 2017, the Company issued eight thousand shares under the 2012 ESPP at an average discounted price per share of $39.47. As of December 31, 2017, the Company is authorized to issue an additional 1.2 million shares under the 2012 ESPP.
98
KNIGHT-SWIFT TRANSPORTATION HOLDINGS INC.
NOTES TO CONSOLIDATED FINANCIAL STATEMENTS — CONTINUED
Basic and diluted earnings per share, as presented in the consolidated income statements, are calculated by dividing net income attributable to Knight-Swift by the respective weighted average common shares outstanding during the period.
The following table reconciles basic weighted average shares outstanding to diluted weighted average shares outstanding:
December 31, | ||||||||
2017 | 2016 | 2015 | ||||||
(In thousands) | ||||||||
Basic weighted average common shares outstanding | 110,657 | 80,362 | 81,491 | |||||
Dilutive effect of equity awards | 1,040 | 866 | 976 | |||||
Diluted weighted average common shares outstanding | 111,697 | 81,228 | 82,467 | |||||
Anti-dilutive shares excluded from diluted earnings per share (1) | 98 | 886 | 388 | |||||
____________
(1) | Shares were excluded from the dilutive-effect calculation because the outstanding options' exercise prices were greater than the average market price of Knight's common stock (for 2015 and 2016) and the Company's Class A common stock (for 2017). |
99
KNIGHT-SWIFT TRANSPORTATION HOLDINGS INC.
NOTES TO CONSOLIDATED FINANCIAL STATEMENTS — CONTINUED
ASC 820, Fair Value Measurements and Disclosures, requires that the Company disclose estimated fair values for its financial instruments. The estimated fair value of a financial instrument is the amount that would be received to sell an asset or paid to transfer a liability in an orderly transaction between market participants at the measurement date in the principal or most advantageous market for the asset or liability. Fair value estimates are made at a specific point in time and are based on relevant market information and information about the financial instrument. These estimates do not reflect any premium or discount that could result from offering for sale at one time the Company's entire holdings of a particular financial instrument. Changes in assumptions could significantly affect these estimates. Because the fair value is estimated as of December 31, 2017 and 2016, the amounts that will actually be realized or paid at settlement or maturity of the instruments in the future could be significantly different.
The tables below exclude certain financial instruments. The excluded financial instruments are as follows: cash and cash equivalents, restricted cash, net accounts receivable, income tax refund receivable, and accounts payable. The estimated fair value of these financial instruments approximate carrying value as they are short-term in nature. Additionally, for notes payable under revolving lines of credit, fair value approximates the carrying value due to the variable interest rate. For capital leases, the carrying value approximates the fair value. The table below also excludes financial instruments reported at estimated fair value on a recurring basis. See "Recurring Fair Value Measurements." All remaining balance sheet amounts excluded from the table below are not considered financial instruments subject to this disclosure.
The following table presents the carrying amounts and estimated fair values of the Company's financial instruments:
December 31, | |||||||||||||||
2017 | 2016 | ||||||||||||||
Carrying Value | Estimated Fair Value | Carrying Value | Estimated Fair Value | ||||||||||||
(In thousands) | |||||||||||||||
Financial Assets: | |||||||||||||||
Restricted investments (1) | $ | 22,232 | $ | 22,208 | $ | — | $ | — | |||||||
Money market funds (2) | 1,427 | 1,427 | 1,385 | 1,385 | |||||||||||
Debt securities – municipal securities (2) | 1,887 | 1,887 | 1,903 | 1,903 | |||||||||||
Financial Liabilities: | |||||||||||||||
Term Loan, due October 2020 (3) | 364,355 | 365,000 | — | — | |||||||||||
2015 RSA, due January 2019 | 305,000 | 305,000 | — | — | |||||||||||
Knight Revolver, due August 2019 | — | — | 18,000 | 18,000 | |||||||||||
Revolver, due October 2022 | 125,000 | 125,000 | — | — | |||||||||||
100
KNIGHT-SWIFT TRANSPORTATION HOLDINGS INC.
NOTES TO CONSOLIDATED FINANCIAL STATEMENTS — CONTINUED
____________
The carrying amounts of the final instruments shown in the table are included in the consolidated balance sheets, as follows:
(1) | Restricted investments are included in "Restricted investments, held to maturity, amortized cost." |
(2) | These instruments are trading securities and are included within "Other long-term assets, restricted cash and investments." |
(3) | The Term Loan is included in "Current portion of long-term debt" and "Long-term debt, less current portion." The carrying value is net of $0.6 million deferred loan costs as of December 31, 2017. |
The estimated fair values of the financial instruments shown in the above table as of December 31, 2017 and 2016, represent management's best estimates of the amounts that would be received to sell those assets or that would be paid to transfer those liabilities in an orderly transaction between market participants at that date. The estimated fair value measurements maximize the use of observable inputs. However, in situations where there is little, if any, market activity for the asset or liability at the measurement date, the estimated fair value measurement reflects the Company's own judgments about the assumptions that market participants would use in pricing the asset or liability. These judgments are developed by the Company based on the best information available under the circumstances.
The following summary presents a description of the methods and assumptions used to estimate the fair value of each class of financial instrument.
Restricted Investments, Money Market Funds, and Debt Securities — The estimated fair value of the Company's restricted investments is based on quoted prices in active markets that are readily and regularly obtainable. See Note 6 for additional investments disclosures.
Term Loans — The estimated fair value of the Term Loan approximates the face value. See Note 16 for additional debt disclosures.
101
KNIGHT-SWIFT TRANSPORTATION HOLDINGS INC.
NOTES TO CONSOLIDATED FINANCIAL STATEMENTS — CONTINUED
Securitization of Accounts Receivable — The Company's securitization of accounts receivable consists of borrowings outstanding pursuant to the 2015 RSA as of December 31, 2017 and 2016, as discussed in Note 15. The estimated fair value of the 2015 RSA approximates the face value.
Fair Value Hierarchy — ASC 820 establishes a framework for measuring fair value in accordance with GAAP and expands financial statement disclosure requirements for fair value measurements. ASC 820 further specifies a hierarchy of valuation techniques, which is based on whether the inputs into the valuation technique are observable or unobservable. The hierarchy follows:
• | Level 1 — Valuation techniques in which all significant inputs are quoted prices from active markets for assets or liabilities that are identical to the assets or liabilities being measured. |
• | Level 2 — Valuation techniques in which significant inputs include quoted prices from active markets for assets or liabilities that are similar to the assets or liabilities being measured and/or quoted prices from markets that are not active for assets or liabilities that are identical or similar to the assets or liabilities being measured. Also, model-derived valuations in which all significant inputs and significant value drivers are observable in active markets are Level 2 valuation techniques. |
• | Level 3 — Valuation techniques in which one or more significant inputs or significant value drivers are unobservable. Unobservable inputs are valuation technique inputs that reflect the Company's own assumptions about the assumptions that market participants would use in pricing an asset or liability. |
When available, the Company uses quoted market prices to determine the estimated fair value of an asset or liability. If quoted market prices are not available, the Company measures fair value using valuation techniques that use, when possible, current market-based or independently-sourced market parameters, such as interest rates and currency rates. The level in the fair value hierarchy within which a fair value measurement in its entirety falls is based on the lowest level input that is significant to the estimated fair value measurement in its entirety.
102
KNIGHT-SWIFT TRANSPORTATION HOLDINGS INC.
NOTES TO CONSOLIDATED FINANCIAL STATEMENTS — CONTINUED
Recurring Fair Value Measurements — The following table depicts the level in the fair value hierarchy of the inputs used to estimate fair value of assets measured on a recurring basis as of December 31, 2017 and 2016:
Fair Value Measurements at Reporting Date Using | |||||||||||||||
Estimated Fair Value | Level 1 Inputs | Level 2 Inputs | Level 3 Inputs | ||||||||||||
(In thousands) | |||||||||||||||
As of December 31, 2017 | |||||||||||||||
Money market funds | $ | 1,427 | $ | 1,427 | $ | — | $ | — | |||||||
Debt securities – municipal securities | 1,887 | — | 1,887 | — | |||||||||||
As of December 31, 2016 | |||||||||||||||
Money market funds | 1,385 | 1,385 | — | — | |||||||||||
Debt securities – municipal securities | 1,903 | — | 1,903 | — | |||||||||||
As of December 31, 2017 and 2016, there were no major categories of liabilities included in the Company's consolidated balance sheets at estimated fair value that were measured on a recurring basis.
Nonrecurring Fair Value Measurements — The following table presents assets measured at estimated fair value on a nonrecurring basis as of December 31, 2017:
Fair Value Measurements at Reporting Date Using | |||||||||||||||||||
Estimated Fair Value | Level 1 Inputs | Level 2 Inputs | Level 3 Inputs | Total Losses | |||||||||||||||
(In thousands) | |||||||||||||||||||
As of December 31, 2017 | |||||||||||||||||||
Software (1) | $ | — | $ | — | $ | — | $ | — | $ | (16,746 | ) | ||||||||
Equipment (2) | 350 | — | — | 350 | (98 | ) | |||||||||||||
_____________
(1) | The Company terminated the implementation of the Swift ERP system in 2017. This resulted in a pre-tax impairment loss of $16.7 million, which was recorded in "Impairments" within operating income in the consolidated income statement (within Swift's non-reportable segments). |
(2) | Management reassessed the fair value of certain Interstate Equipment Leasing, LLC tractors as of December 31, 2017, which had a total book value of $0.4 million, determining that there was a pre-tax impairment loss of $0.1 million in 2017. The impairment loss was recorded in "Impairments" within operating income in the consolidated income statement (within Swift's non-reportable segments). |
As of December 31, 2016 there were no assets included in the Company's consolidated balance sheets at estimated fair value that were measured on a nonrecurring basis. As of December 31, 2017 and 2016 there were no liabilities included in the Company's consolidated balance sheets at estimated fair value that were measured on a nonrecurring basis.
103
KNIGHT-SWIFT TRANSPORTATION HOLDINGS INC.
NOTES TO CONSOLIDATED FINANCIAL STATEMENTS — CONTINUED
Note 24 — Related Party Transactions
The following table presents Knight-Swift's transactions with companies controlled by and/or affiliated with its related parties:
2017 | 2016 | ||||||||||||||
Provided by Knight-Swift | Received by Knight-Swift | Provided by Knight | Received by Knight | ||||||||||||
(In thousands) | |||||||||||||||
Freight Services: | |||||||||||||||
Central Freight Lines (1) | $ | 161 | $ | — | $ | — | $ | — | |||||||
SME Industries (1) | 275 | — | — | — | |||||||||||
Total | $ | 436 | $ | — | $ | — | $ | — | |||||||
Facility and Equipment Leases: | |||||||||||||||
Central Freight Lines (1) | $ | 245 | $ | 92 | $ | — | $ | — | |||||||
Other Services: | |||||||||||||||
Updike Distribution and Logistics (2) | $ | 2,771 | $ | — | $ | 1,433 | $ | — | |||||||
Other Affiliates (1) | 48 | 604 | — | — | |||||||||||
Total | $ | 2,819 | $ | 604 | $ | 1,433 | $ | — | |||||||
____________
(1) | Entities affiliated with, Board member, Jerry Moyes include Central Freight Lines, SME Industries, and Compensi Services. Transactions with these entities that are controlled by and/or are otherwise affiliated with Jerry Moyes, include freight services, facility leases, equipment sales, and other services. |
• | Freight Services Provided by Knight-Swift — The Company charges for freight services to each of these companies for transportation services. |
• | Freight Services Received by Knight-Swift — Transportation services received from Central Freight represent less-than-truckload freight services rendered to haul parts and equipment to Company shop locations. |
• | Other Services Provided by Knight-Swift — Other services provided by the Company to the identified related parties include equipment sales and miscellaneous services. |
• | Other Services Received by Knight-Swift — Consulting fees and certain third-party payroll and employee benefits administration services from the identified related parties are included in other services received by the Company. |
• | In conjunction with Swift's September 8, 2016 announcement that Jerry Moyes would retire from his position as Chief Executive Officer effective December 31, 2016, Swift entered into an agreement with Mr. Moyes to memorialize the terms of his retirement, which was assumed by Knight-Swift. Swift contracted with Mr. Moyes to serve as a non-employee consultant from January 1, 2017 through December 31, 2019, during which time Swift will pay Mr. Moyes a monthly consulting fee of $0.2 million in cash. |
The following is a rollforward of the accrued liability for the consulting fees:
(In thousands) | |||
Accrued consulting fees – Jerry Moyes, balance at September 9, 2017 (1a) | $ | 5,050 | |
Additions to accrual | — | ||
Less: payments | (600 | ) | |
Accrued consulting fees – Jerry Moyes, balance at December 31, 2017 (1a) | $ | 4,450 | |
____________
(1a) The balance is included in "Long-term dividend payable and other long-term liabilities" (noncurrent) and "Accrued liabilities" (current) in the consolidated balance sheets, based on the timing of the expected payments.
(2) | Knight has an arrangement with Updike Distribution and Logistics, a company that is owned by the father and three brothers of Executive Vice President of Sales and Marketing, James Updike, Jr. The arrangement allows Updike Distribution and Logistics to purchase fuel from Knight's vendors at cost, plus an administrative fee. |
Knight had no related party transactions during 2015.
104
KNIGHT-SWIFT TRANSPORTATION HOLDINGS INC.
NOTES TO CONSOLIDATED FINANCIAL STATEMENTS — CONTINUED
Receivables and payables pertaining to related party transactions were:
December 31, 2017 | |||||||
Receivable | Payable | ||||||
(In thousands) | |||||||
Central Freight Lines | $ | 213 | $ | — | |||
SME Industries | 79 | — | |||||
Total | $ | 292 | $ | — | |||
As of December 31, 2016, Knight had no receivable or payable pertaining to related party transactions.
Segment Information
Following the 2017 Merger, the Company continues to maintain Knight's and Swift's distinct brands in customer and driver-facing activities, while benefiting from the combined experience of its senior leadership. The Company's chief operating decision makers continue to assess performance based on Knight's and Swift's historical operating segments. As a result, the Company has six reportable segments, which are the historical reportable operating segments of Knight and Swift: Knight Trucking, Knight Logistics, Swift Truckload, Swift Dedicated, Swift Refrigerated, and Swift Intermodal, as well as the Swift non-reportable segments, discussed below.
Knight Segments
• | Knight Trucking — The Knight Trucking segment is comprised of three operating segments (Dry Van, Refrigerated, and Drayage). |
• | Knight Logistics — The Knight Logistics segment is comprised of two operating segments (Brokerage and Intermodal). The Company also provides logistics freight management and other non-trucking services through its Knight Logistics business. |
Swift Segments
• | Swift Truckload — The Swift Truckload segment consists of one-way movements over irregular routes throughout the United States, Mexico, and Canada. |
• | Swift Dedicated — The Swift Dedicated segment devotes use of equipment to specific customers and offers tailored solutions under long-term contracts. |
• | Swift Refrigerated — The Swift Refrigerated segment primarily consists of shipments for customers that require temperature-controlled trailers. These shipments include one-way movements over irregular routes, as well as dedicated truck operations. |
• | Swift Intermodal — The Swift Intermodal segment includes revenue generated by moving freight over the rail in Swift's containers and other trailing equipment, combined with revenue for drayage to transport loads between the railheads and customer locations. |
• | Swift Non-reportable Segments — The Swift non-reportable segments include Swift's logistics and freight brokerage services, as well as support services that Swift's subsidiaries provide to customers and independent contractors, including repair and maintenance shop services, equipment leasing and insurance. Certain of Swift's legal settlements and accruals, amortization of intangibles related to the 2017 Merger, and certain other corporate expenses are also included in the non-reportable segments. |
Intersegment Eliminations
Certain operating segments provide transportation and related services for other affiliates outside their reportable segment. For Knight operating segments, such services are billed at cost, and no profit is earned. For Swift operating segments, revenues for such services are based on negotiated rates, and are reflected as revenues of the billing segment. These rates are adjusted from time to time, based on market conditions. Such intersegment revenues and expenses are eliminated in Knight-Swift's consolidated results.
105
KNIGHT-SWIFT TRANSPORTATION HOLDINGS INC.
NOTES TO CONSOLIDATED FINANCIAL STATEMENTS — CONTINUED
The following tables present the Company's financial information by segment:
2017 | 2016 | 2015 | ||||||||||||||||||
Operating revenue: | (Dollars in thousands) | |||||||||||||||||||
Knight – Trucking | $ | 906,484 | 37.4 | % | $ | 900,368 | 80.5 | % | $ | 952,098 | 80.5 | % | ||||||||
Knight – Logistics | $ | 234,155 | 9.7 | % | $ | 226,912 | 20.3 | % | $ | 249,365 | 21.1 | % | ||||||||
Swift – Truckload | $ | 609,112 | 25.1 | % | $ | — | — | % | $ | — | — | % | ||||||||
Swift – Dedicated | $ | 200,628 | 8.3 | % | $ | — | — | % | $ | — | — | % | ||||||||
Swift – Refrigerated | $ | 254,102 | 10.5 | % | $ | — | — | % | $ | — | — | % | ||||||||
Swift – Intermodal | $ | 130,441 | 5.4 | % | $ | — | — | % | $ | — | — | % | ||||||||
Subtotal | $ | 2,334,922 | 96.4 | % | $ | 1,127,280 | 100.8 | % | $ | 1,201,463 | 101.6 | % | ||||||||
Non-reportable segments | $ | 115,530 | 4.8 | % | $ | — | — | % | $ | — | — | % | ||||||||
Intersegment eliminations | $ | (24,999 | ) | (1.2 | )% | $ | (9,246 | ) | (0.8 | )% | $ | (18,499 | ) | (1.6 | )% | |||||
Total revenue | $ | 2,425,453 | 100.0 | % | $ | 1,118,034 | 100.0 | % | $ | 1,182,964 | 100.0 | % | ||||||||
2017 | 2016 | 2015 | ||||||||||||||||||
Operating income (loss): | (Dollars in thousands) | |||||||||||||||||||
Knight – Trucking | $ | 92,298 | 46.0 | % | $ | 136,229 | 91.7 | % | $ | 162,143 | 91.1 | % | ||||||||
Knight – Logistics | $ | 12,600 | 6.3 | % | $ | 12,250 | 8.3 | % | $ | 15,857 | 8.9 | % | ||||||||
Swift – Truckload | $ | 74,924 | 37.3 | % | $ | — | — | % | $ | — | — | % | ||||||||
Swift – Dedicated | $ | 22,410 | 11.2 | % | $ | — | — | % | $ | — | — | % | ||||||||
Swift – Refrigerated | $ | 13,626 | 6.8 | % | $ | — | — | % | $ | — | — | % | ||||||||
Swift – Intermodal | $ | 5,977 | 3.0 | % | $ | — | — | % | $ | — | — | % | ||||||||
Subtotal | $ | 221,835 | 110.6 | % | $ | 148,479 | 100.0 | % | $ | 178,000 | 100.0 | % | ||||||||
Non-reportable segments | $ | (21,205 | ) | (10.6 | )% | $ | — | — | % | $ | — | — | % | |||||||
Operating income | $ | 200,630 | 100.0 | % | $ | 148,479 | 100.0 | % | $ | 178,000 | 100.0 | % | ||||||||
2017 | 2016 | 2015 | ||||||||||||||||||
Depreciation and amortization of property and equipment: | (Dollars in thousands) | |||||||||||||||||||
Knight – Trucking | $ | 111,536 | 57.6 | % | $ | 111,242 | 96.2 | % | $ | 106,491 | 96.4 | % | ||||||||
Knight – Logistics | $ | 5,089 | 2.6 | % | $ | 4,418 | 3.8 | % | $ | 4,032 | 3.6 | % | ||||||||
Swift – Truckload | $ | 32,258 | 16.7 | % | $ | — | — | % | $ | — | — | % | ||||||||
Swift – Dedicated | $ | 14,381 | 7.4 | % | $ | — | — | % | $ | — | — | % | ||||||||
Swift – Refrigerated | $ | 11,163 | 5.8 | % | $ | — | — | % | $ | — | — | % | ||||||||
Swift – Intermodal | $ | 3,231 | 1.7 | % | $ | — | — | % | $ | — | — | % | ||||||||
Subtotal | $ | 177,658 | 91.7 | % | $ | 115,660 | 100.0 | % | $ | 110,523 | 100.0 | % | ||||||||
Non-reportable segments | $ | 16,075 | 8.3 | % | $ | — | — | % | $ | — | — | % | ||||||||
Consolidated depreciation and amortization of property and equipment | $ | 193,733 | 100.0 | % | $ | 115,660 | 100.0 | % | $ | 110,523 | 100.0 | % | ||||||||
See Note 2 for discussion of the Company's accounting policy related to segments.
106
KNIGHT-SWIFT TRANSPORTATION HOLDINGS INC.
NOTES TO CONSOLIDATED FINANCIAL STATEMENTS — CONTINUED
Geographical Information
In aggregate, operating revenue from the Company's foreign operations was less than 5.0% of consolidated total revenue for each of 2017, 2016, and 2015. Additionally, long-lived assets on the balance sheets of the Company's foreign subsidiaries were less than 5.0% of consolidated "Total assets" as of December 31, 2017 and 2016.
Customer Concentration
Services provided to the Company's largest customer, Wal-Mart, generated 12.5% of total revenue in 2017. Revenue generated by Wal-Mart is reported in the Knight Trucking, Swift Truckload, Swift Dedicated, Swift Refrigerated, and Intermodal operating segments. No other customer accounted for 10.0% or more of total revenue in 2017. No customer accounted for 10.0% or more of total revenue in 2016 or 2015.
In management's opinion, the following summarized financial information fairly presents the Company's results of operations for the quarters noted. These results are not necessarily indicative of future quarterly results.
First Quarter | Second Quarter | Third Quarter | Fourth Quarter | ||||||||||||
(In thousands, except per share data) | |||||||||||||||
2017 | |||||||||||||||
Total revenue | $ | 271,182 | $ | 273,243 | $ | 521,608 | $ | 1,359,420 | |||||||
Net income | 15,106 | 18,259 | 4,199 | 447,861 | |||||||||||
Net income attributable to Knight-Swift | 14,876 | 17,970 | 3,881 | 447,564 | |||||||||||
Basic earnings per share | 0.19 | 0.22 | 0.04 | 2.52 | |||||||||||
Diluted earnings per share | 0.18 | 0.22 | 0.04 | 2.50 | |||||||||||
2016 | |||||||||||||||
Total revenue | $ | 272,088 | $ | 276,318 | $ | 280,530 | $ | 289,098 | |||||||
Net income | 23,470 | 25,214 | 24,083 | 22,472 | |||||||||||
Net income attributable to Knight-Swift | 23,017 | 24,918 | 23,767 | 22,161 | |||||||||||
Basic earnings per share | 0.29 | 0.31 | 0.30 | 0.28 | |||||||||||
Diluted earnings per share | 0.28 | 0.31 | 0.29 | 0.27 | |||||||||||
ITEM 9. | CHANGES IN AND DISAGREEMENTS WITH ACCOUNTANTS ON ACCOUNTING AND FINANCIAL DISCLOSURE |
None.
ITEM 9A. | CONTROLS AND PROCEDURES |
Disclosure Controls and Procedures
We have established disclosure controls and procedures (as defined in Rules 13a-15(e) and 15d-15(e) under the Exchange Act) to ensure that material information relating to us, including our consolidated subsidiaries, is made known to the officers who certify our financial reports and to other members of senior management and the Board. Our management, with the participation of our principal executive officer and principal financial officer, conducted an evaluation of the effectiveness of our disclosure controls and procedures. Based on this evaluation, as of the end of the period covered by this Annual Report on Form 10-K, our principal executive officer and principal financial officer have concluded that our disclosure controls and procedures are effective to ensure that the information required to be disclosed by us in the reports that we file or submit under the Exchange Act is (1) recorded, processed, summarized, and reported within the time periods specified in the SEC rules and forms, and (2) accumulated and communicated to management, including our principal executive officer and principal financial officer, as appropriate, to allow timely decisions regarding required disclosure.
107
Changes in Internal Control over Financial Reporting
Except as set forth below, there was no change in our internal control over financial reporting (as defined in Rules 13a-15(f) and 15d-15(f) under the Exchange Act) during the quarter ended December 31, 2017 that has materially affected, or is reasonably likely to materially affect, our internal control over financial reporting.
On September 8, 2017, we became Knight-Swift Transportation Holdings Inc. upon the effectiveness of the 2017 Merger of Knight and Swift. In the 2017 Merger, Knight was treated as the acquiring entity for accounting purposes and Swift was treated as the legal acquirer. We are currently integrating policies, processes, personnel, technology, and operations of Knight and Swift. Management will continue to evaluate our internal control over financial reporting as we execute 2017 Merger integration activities.
Management's Report on Internal Control over Financial Reporting
Management is responsible for establishing and maintaining adequate internal control over financial reporting as defined in Rules 13a-15(f) and 15d-15(f) under the Securities Exchange Act of 1934. The Company's internal control over financial reporting is designed to provide reasonable assurance regarding the reliability of financial reporting and the preparation of financial statements for external purposes in accordance with accounting principles generally accepted in the United States. Internal control over financial reporting includes policies and procedures that:
(1) | pertain to the maintenance of records that in reasonable detail accurately and fairly reflect the transactions and dispositions of the Company's assets; |
(2) | provide reasonable assurance that transactions are recorded as necessary to permit preparation of financial statements in accordance with generally accepted accounting principles, and that receipts and expenditures are being made only in accordance with the authorization of management and directors of the Company; and |
(3) | provide reasonable assurance regarding prevention or timely detection of unauthorized acquisition, use or disposition of the Company's assets that could have a material effect on the financial statements. |
Because of inherent limitations, internal control over financial reporting may not prevent or detect misstatements. Therefore, even those systems determined to be effective can provide only reasonable assurance with respect to financial statement preparation and presentation.
Under the supervision and with the participation of our CEO and CFO, management conducted an evaluation of the Knight's internal control over financial reporting as of December 31, 2017. In making this evaluation, management used the criteria in Internal Control – Integrated Framework, issued in 2013 by the Committee of Sponsoring Organizations of the Treadway Commission ("COSO"). Based on this assessment, management concluded that the Company's internal control over financial reporting was effective as of December 31, 2017.
The effectiveness of internal control over financial reporting as of December 31, 2017 was audited by Grant Thornton LLP, the independent registered public accounting firm that also audited the Company's consolidated financial statements included in this Annual Report on Form 10-K. Grant Thornton LLP's report on the Company's internal control over financial reporting is included herein.
In light of the "reverse acquisition" nature and timing of the 2017 Merger, among other factors, we determined that it was impracticable to provide a report on our internal control over financial reporting of all of our consolidated entities as December 31, 2017. Therefore, we have limited the scope of management’s assessment of the effectiveness of the Company's internal control over financial reporting in this report to Knight and have excluded Swift Transportation Co., LLC and Interstate Equipment Leasing LLC. We believe this limitation of scope of management’s assessment of the effectiveness of the Company’s internal control over financial reporting in this report is appropriate for several reasons, including the following:
• | the "reverse acquisition" nature of the 2017 Merger, which resulted in Knight, as the legal acquiree, being considered the accounting acquirer, and Swift as the legal acquirer, being considered the accounting acquiree for accounting purposes under GAAP; |
• | the fact that Knight’s historical results of operations replaced Swift's historical results of operations for all periods prior to the 2017 Merger and Swift’s historical financial information is only included after the 2017 Merger; |
• | the timing of the 2017 Merger, which occurred on September 8, 2017, and therefore, did not give us sufficient time to fully incorporate the internal control over financial reporting of Swift into our internal control over financial reporting; |
• | the fact that our principal executive officer and principal financial officer were the principal executive officer and principal financial officer of Knight and not Swift; and |
• | the internal control over financial reporting environment that existed after the 2017 Merger largely represents the internal control over financial reporting environment of Knight. |
Accordingly, we believe that management’s assessment of the effectiveness of internal control over financial reporting of Knight, the legal acquiree, but accounting acquirer, is more relevant and meaningful than an assessment of the effectiveness of the internal control over financial reporting of Swift, the legal acquirer, but accounting acquiree.
Swift's total assets, excluding goodwill and intangibles, which were subject to Swift's consolidation and business combination controls and thus would be included in management’s report on internal control over financial reporting, totaled 29.5% of total consolidated
assets as of December 31, 2017. Swift’s total revenue represented approximately 53.2% of our consolidated total revenue reflected in our consolidated financial statements for the year ended December 31, 2017.
108
REPORT OF INDEPENDENT REGISTERED PUBLIC ACCOUNTING FIRM
Board of Directors and Shareholders
Knight-Swift Transportation Holdings Inc.
Opinion on internal control over financial reporting
We have audited the internal control over financial reporting of Knight-Swift Transportation Holdings Inc. (an Arizona corporation) and subsidiaries (the “Company”) as of December 31, 2017, based on criteria established in the 2013 Internal Control—Integrated Framework issued by the Committee of Sponsoring Organizations of the Treadway Commission (“COSO”). In our opinion, the Company maintained, in all material respects, effective internal control over financial reporting as of December 31, 2017, based on criteria established in the 2013 Internal Control—Integrated Framework issued by COSO.
We also have audited, in accordance with the standards of the Public Company Accounting Oversight Board (United States) (“PCAOB”), the consolidated financial statements of the Company as of and for the year ended December 31, 2017, and our report dated March 1, 2018 expressed an unqualified opinion on those financial statements.
Basis for opinion
The Company’s management is responsible for maintaining effective internal control over financial reporting and for its assessment of the effectiveness of internal control over financial reporting, included in the accompanying Management’s Report on Internal Control over Financial Reporting (“Management’s Report”). Our responsibility is to express an opinion on the Company’s internal control over financial reporting based on our audit. We are a public accounting firm registered with the PCAOB and are required to be independent with respect to the Company in accordance with the U.S. federal securities laws and the applicable rules and regulations of the Securities and Exchange Commission and the PCAOB.
We conducted our audit in accordance with the standards of the PCAOB. Those standards require that we plan and perform the audit to obtain reasonable assurance about whether effective internal control over financial reporting was maintained in all material respects. Our audit included obtaining an understanding of internal control over financial reporting, assessing the risk that a material weakness exists, testing and evaluating the design and operating effectiveness of internal control based on the assessed risk, and performing such other procedures as we considered necessary in the circumstances. We believe that our audit provides a reasonable basis for our opinion.
Our audit of, and opinion on, the Company’s internal control over financial reporting does not include the internal control over financial reporting of Swift Transportation Co., LLC and subsidiaries and Interstate Equipment Leasing LLC (collectively, “Swift”), wholly-owned subsidiaries, whose financial statements reflect total assets, excluding goodwill and intangibles, and revenues constituting 29.5 and 53.2 percent, respectively, of the related consolidated financial statement amounts as of and for the year ended December 31, 2017. As indicated in Management’s Report, Swift was acquired during 2017. Management’s assertion on the effectiveness of the Company’s internal control over financial reporting excluded internal control over financial reporting of Swift.
Definition and limitations of internal control over financial reporting
A company’s internal control over financial reporting is a process designed to provide reasonable assurance regarding the reliability of financial reporting and the preparation of financial statements for external purposes in accordance with generally accepted accounting principles. A company’s internal control over financial reporting includes those policies and procedures that (1) pertain to the maintenance of records that, in reasonable detail, accurately and fairly reflect the transactions and dispositions of the assets of the company; (2) provide reasonable assurance that transactions are recorded as necessary to permit preparation of financial statements in accordance with generally accepted accounting principles, and that receipts and expenditures of the company are being made only in accordance with authorizations of management and directors of the company; and (3) provide reasonable assurance regarding prevention or timely detection of unauthorized acquisition, use, or disposition of the company’s assets that could have a material effect on the financial statements.
Because of its inherent limitations, internal control over financial reporting may not prevent or detect misstatements. Also, projections of any evaluation of effectiveness to future periods are subject to the risk that controls may become inadequate because of changes in conditions, or that the degree of compliance with the policies or procedures may deteriorate.
/s/ GRANT THORNTON LLP
Phoenix, Arizona
March 1, 2018
109
ITEM 9B. | OTHER INFORMATION |
None.
PART III | ||||
ITEM 10. | DIRECTORS, EXECUTIVE OFFICERS AND CORPORATE GOVERNANCE |
The information required under this Item 10 is hereby incorporated by reference to the information set forth under the captions "Proposal No. 1: Election of Directors," "Management," "Section 16(a) Beneficial Ownership Reporting Compliance," "The Board of Directors and Corporate Governance — Code of Business Conduct and Ethics," "The Board of Directors and Corporate Governance — Nomination of Director Candidates," and "The Board of Directors and Corporate Governance — Board Committees" in the Company's definitive proxy statement for its 2018 Annual Meeting of Stockholders to be filed with the SEC.
ITEM 11. | EXECUTIVE COMPENSATION |
The information required under this Item 11 is hereby incorporated by reference to the information set forth under the captions "Executive Compensation," "Compensation Committee Interlocks and Insider Participation," and "Compensation Committee Report in the Company's definitive proxy statement for its 2018 Annual Meeting of Stockholders to be filed with the SEC.
ITEM 12. | SECURITY OWNERSHIP OF CERTAIN BENEFICIAL OWNERS AND MANAGEMENT AND RELATED STOCKHOLDER MATTERS |
Equity Compensation Plan Information
Before the 2017 Merger, Knight and Swift granted stock-based awards under their respective stock-based compensation plans, discussed below.
2014 Stock Plan — Currently, the 2014 Stock Plan, as amended and restated, is the combined company’s only compensatory stock-based incentive plan. The previous 2014 stock plan replaced Swift's 2007 Omnibus Incentive Plan when it was adopted by Swift's board of directors in March 2014 and then approved by the Swift stockholders in May 2014. The previous 2014 stock plan was amended and restated to rename the plan and for other administrative changes relating to the 2017 Merger. The terms of the 2014 Stock Plan, as amended and restated, remain substantially the same as the previous 2014 stock plan. The 2014 Stock Plan, as amended and restated, permits the payment of cash incentive compensation and authorizes the granting of stock options, stock appreciation rights, restricted stock and restricted stock units, performance shares and performance units, cash-based awards, and stock-based awards to the Company's employees and non-employee directors.
Legacy Plans — In connection with the 2017 Merger, the registered securities under the Knight Amended and Restated 2003 Stock Option Plan, the Knight 2012 Equity Compensation Plan, the Knight Amended and Restated 2015 Omnibus Incentive Plan, and the Swift 2007 Omnibus Incentive Plan (collectively, the "Legacy Plans") were deregistered. As such, no future awards may be granted under these Legacy Plans. Outstanding awards granted under the Legacy Plans were assumed by the combined company and continue to be governed by such Legacy Plans until such awards have been exercised, forfeited, canceled, or have otherwise expired or terminated.
110
The following table represents securities authorized for issuance under the Company's stock plans at December 31, 2017:
Number of securities to be issued upon exercise of outstanding options, warrants and rights | Weighted-average exercise price of outstanding options, warrants and rights | Number of securities remaining available for future issuance under equity compensation plans (excluding securities reflected in column (a)) | |||||||
Plan Category: | (a) | (b) | (c) | ||||||
Equity compensation plans approved by security holders | 3,086,641 | $ | 25.48 | 4,036,647 | |||||
Equity compensation plans not approved by security holders | — | — | — | ||||||
Total | 3,086,641 | $ | 25.48 | 4,036,647 | |||||
Column (a) includes 1,127,350 shares of Knight-Swift Class A common stock underlying outstanding restricted stock units and performance units. Because there is no exercise price associated with such awards, such equity awards are not included in the weighted-average exercise price calculation in column (b).
Columns (a) and (b) pertain to the 2014 Stock Plan. No amounts related to the 2012 ESPP are included in columns (a) or (b). Column (c) includes 2,833,981 shares available for issuance under the 2014 Stock Plan and 1,202,666 shares available for issuance under the 2012 ESPP.
Other information required under this Item 12 is hereby incorporated by reference to the information set forth under the caption "Security Ownership of Certain Beneficial Owners and Management in the Company's definitive proxy statement for its 2018 Annual Meeting of Stockholders to be filed with the SEC.
ITEM 13. | CERTAIN RELATIONSHIPS AND RELATED TRANSACTIONS, AND DIRECTOR INDEPENDENCE |
The information required under this Item 13 is hereby incorporated by reference to the information set forth under the captions "Relationships and Related Party Transactions," "The Board of Directors and Corporate Governance — Composition of Board and Board Leadership Structure," and "Board Committees" in the Company's definitive proxy statement for its 2018 Annual Meeting of Stockholders to be filed with the SEC.
ITEM 14. | PRINCIPAL ACCOUNTANT FEES AND SERVICES |
The information required under this Item 14 is hereby incorporated by reference to the information responsive to this Item contained in the Company's definitive proxy statement for its 2018 Annual Meeting of Stockholders to be filed with the SEC.
111
PART IV | ||||
ITEM 15. | EXHIBITS AND FINANCIAL STATEMENT SCHEDULES |
(a) | List of documents filed as a part of this Form 10-K: |
(1) | See the Consolidated Financial Statements included in Item 8 hereof. |
(2) | Financial Statement Schedules are omitted since the required information is not present or is not present in the amounts sufficient to require submission of a schedule, or because the information required is included in the consolidated financial statements, including the notes thereto. |
(b) | Exhibits |
Exhibit Number | Description | Page or Method of Filing | ||
112
Exhibit Number | Description | Page or Method of Filing | ||
113
Exhibit Number | Description | Page or Method of Filing | ||
114
Exhibit Number | Description | Page or Method of Filing | ||
101.INS | XBRL Instance Document | Filed herewith | ||
101.SCH | XBRL Taxonomy Extension Schema Document | Filed herewith | ||
101.CAL | XBRL Taxonomy Calculation Linkbase Document | Filed herewith | ||
101.LAB | XBRL Taxonomy Label Linkbase Document | Filed herewith | ||
101.PRE | XBRL Taxonomy Presentation Linkbase Document | Filed herewith | ||
101.DEF | XBRL Taxonomy Extension Definition Document | Filed herewith | ||
* | Schedules have been omitted pursuant to Item 601(b)(2) of Regulation S-K. The Company agrees to furnish to the SEC a supplemental copy of any omitted schedule upon request by the SEC. |
** | Management contract or compensatory plan, contract, or arrangement. |
*** | Certain confidential information contained in this Exhibit was omitted by means of redacting a portion of the text and replacing it with an asterisk. This Exhibit has been filed separately with the Secretary of the Securities and Exchange Commission without the redaction pursuant to a Confidential Treatment Request under Rule 24b-2 of the Securities Exchange Act of 1934. |
ITEM 16. | 10-K SUMMARY |
Not applicable.
115
SIGNATURES
Pursuant to the requirement of Section 13 or 15(d) of the Securities Exchange Act of 1934, the registrant has duly caused this report to be signed on its behalf by the undersigned, thereunto duly authorized.
KNIGHT-SWIFT TRANSPORTATION HOLDINGS INC. | ||||
By: | /s/ David A. Jackson | |||
David A. Jackson | ||||
President and Chief Executive Officer | ||||
in his capacity as such and on behalf of the registrant | ||||
March 1, 2018
Pursuant to the requirements of the Securities Exchange Act of 1934, this report has been signed below by the following persons on behalf of the registrant and in the capacities and on the date indicated.
Signature and Title | Date | Signature and Title | Date | |||
/s/ David A. Jackson | March 1, 2018 | /s/ Michael Garnreiter | March 1, 2018 | |||
David A. Jackson | Michael Garnreiter | |||||
President, Chief Executive Officer, and Director | Director | |||||
(Principal Executive Officer) | ||||||
/s/ Adam W. Miller | March 1, 2018 | /s/ Robert Synowicki, Jr. | March 1, 2018 | |||
Adam W. Miller | Robert Synowicki, Jr. | |||||
Chief Financial Officer | Director | |||||
(Principal Financial Officer) | ||||||
/s/ Cary M. Flanagan | March 1, 2018 | /s/ David Vanderploeg | March 1, 2018 | |||
Cary M. Flanagan | David Vanderploeg | |||||
Chief Accounting Officer | Director | |||||
(Principal Accounting Officer) | ||||||
/s/ Kevin P. Knight | March 1, 2018 | /s/ Glenn F. Brown | March 1, 2018 | |||
Kevin P. Knight | Glenn F. Brown | |||||
Executive Chairman | Director | |||||
/s/ Gary J. Knight | March 1, 2018 | /s/ Kathryn Munro | March 1, 2018 | |||
Gary J. Knight | Kathryn Munro | |||||
Executive Vice Chairman | Director | |||||
/s/ Jerry C. Moyes | March 1, 2018 | /s/ Richard Lehmann | March 1, 2018 | |||
Jerry C. Moyes | Richard Lehmann | |||||
Director | Director | |||||
/s/ Richard H. Dozer | March 1, 2018 | /s/ Roberta Roberts Shank | March 1, 2018 | |||
Richard H. Dozer | Roberta Roberts Shank | |||||
Director | Director | |||||
/s/ Richard Kraemer | March 1, 2018 | |||||
Richard Kraemer | ||||||
Director | ||||||
116