Attached files
| file | filename |
|---|---|
| 8-K - 8-K - TCF FINANCIAL CORP | a11-28517_18k.htm |
Exhibit 99.1
|
|
TCF Financial Corporation 2011 Third Quarter Investor Presentation |
|
|
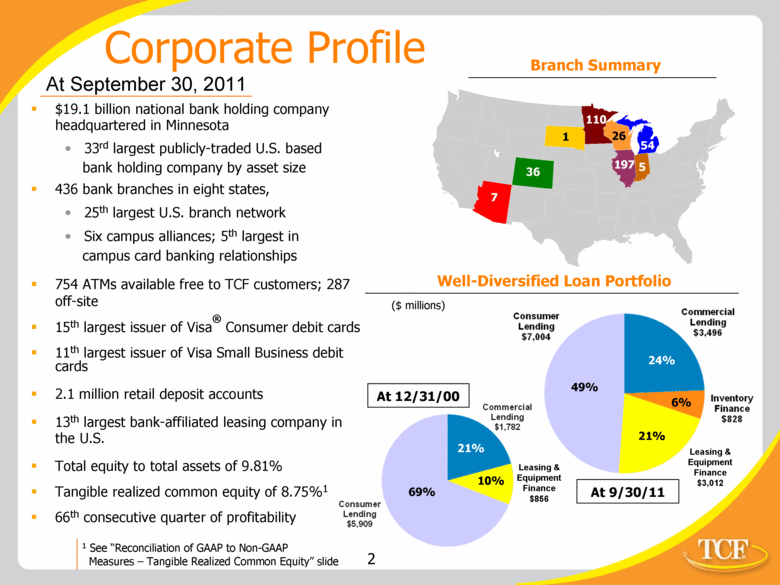
$19.1 billion national bank holding company headquartered in Minnesota 33rd largest publicly-traded U.S. based bank holding company by asset size 436 bank branches in eight states, 25th largest U.S. branch network Six campus alliances; 5th largest in campus card banking relationships 754 ATMs available free to TCF customers; 287 off-site 15th largest issuer of Visa® Consumer debit cards 11th largest issuer of Visa Small Business debit cards 2.1 million retail deposit accounts 13th largest bank-affiliated leasing company in the U.S. Total equity to total assets of 9.81% Tangible realized common equity of 8.75%1 66th consecutive quarter of profitability Corporate Profile At September 30, 2011 1 36 7 110 26 54 197 5 Well-Diversified Loan Portfolio ($ millions) 6% 49% 24% 21% At 12/31/00 69% 21% 10% 1 See “Reconciliation of GAAP to Non-GAAP Measures – Tangible Realized Common Equity” slide At 9/30/11 Branch Summary Leasing & Equipment Finance $856 Leasing & Equipment Finance $3,012 Consumer Lending $5,909 Commercial Lending $1,782 $7,004 $3,496 Inventory Finance $828 |
|
|
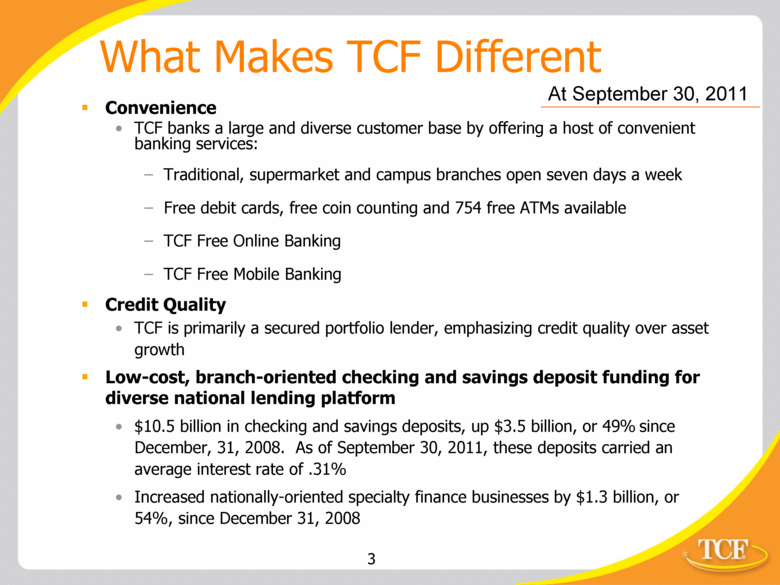
What Makes TCF Different Convenience TCF banks a large and diverse customer base by offering a host of convenient banking services: Traditional, supermarket and campus branches open seven days a week Free debit cards, free coin counting and 754 free ATMs available TCF Free Online Banking TCF Free Mobile Banking Credit Quality TCF is primarily a secured portfolio lender, emphasizing credit quality over asset growth Low-cost, branch-oriented checking and savings deposit funding for diverse national lending platform $10.5 billion in checking and savings deposits, up $3.5 billion, or 49% since December, 31, 2008. As of September 30, 2011, these deposits carried an average interest rate of .31% Increased nationally-oriented specialty finance businesses by $1.3 billion, or 54%, since December 31, 2008 At September 30, 2011 |
|
|
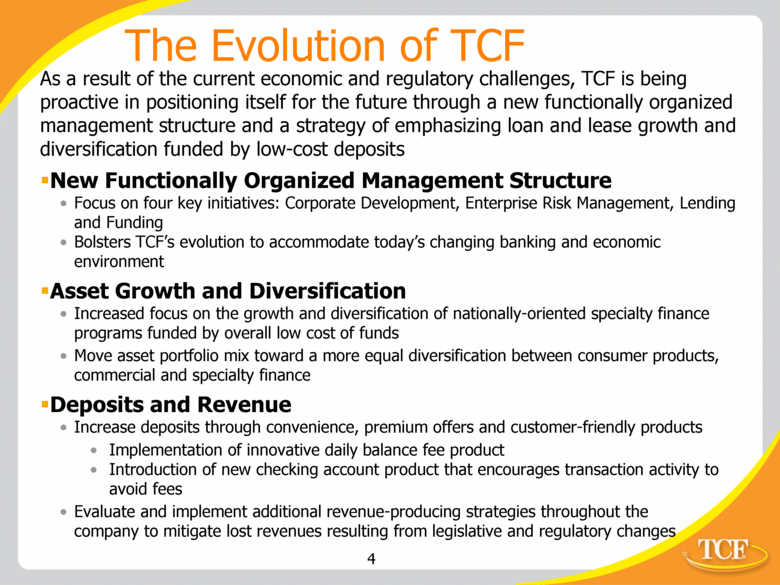
The Evolution of TCF As a result of the current economic and regulatory challenges, TCF is being proactive in positioning itself for the future through a new functionally organized management structure and a strategy of emphasizing loan and lease growth and diversification funded by low-cost deposits New Functionally Organized Management Structure Focus on four key initiatives: Corporate Development, Enterprise Risk Management, Lending and Funding Bolsters TCF’s evolution to accommodate today’s changing banking and economic environment Asset Growth and Diversification Increased focus on the growth and diversification of nationally-oriented specialty finance programs funded by overall low cost of funds Move asset portfolio mix toward a more equal diversification between consumer products, commercial and specialty finance Deposits and Revenue Increase deposits through convenience, premium offers and customer-friendly products Implementation of innovative daily balance fee product Introduction of new checking account product that encourages transaction activity to avoid fees Evaluate and implement additional revenue-producing strategies throughout the company to mitigate lost revenues resulting from legislative and regulatory changes |
|
|
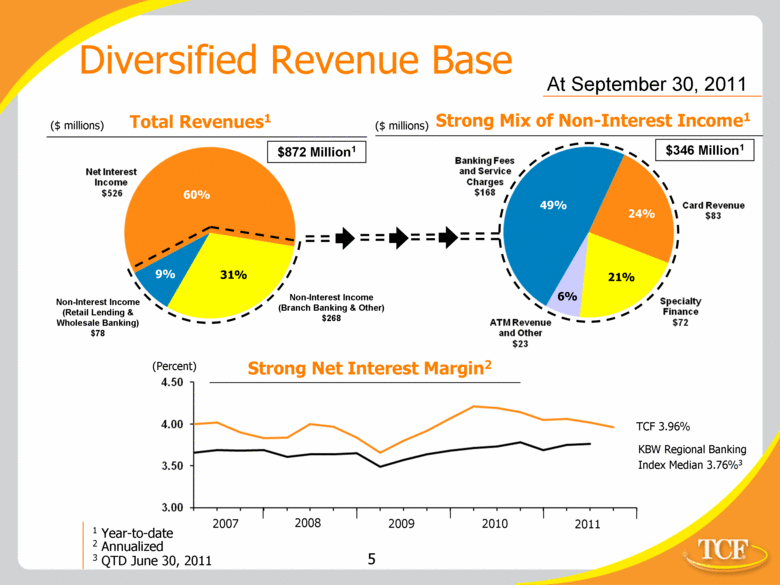
Diversified Revenue Base Total Revenues1 Strong Net Interest Margin2 Strong Mix of Non-Interest Income1 ($ millions) (Percent) TCF 3.96% KBW Regional Banking Index Median 3.76%3 49% 24% 6% 21% 1 Year-to-date 2 Annualized 3 QTD June 30, 2011 At September 30, 2011 2008 2009 2010 2011 2007 ($ millions) 60% 9% 31% Non-Interest Income (Branch Banking & Other) $268 Non-Interest Income (Retail Lending & Wholesale Banking) $78 $872 Million1 $346 Million1 Net Interest Income $526 4.50 4.00 3.50 3.00 Banking Fees and Service Charges $168 Card Revenue $83 ATM Revenue and Other $23 Specialty Finance $72 |
|
|
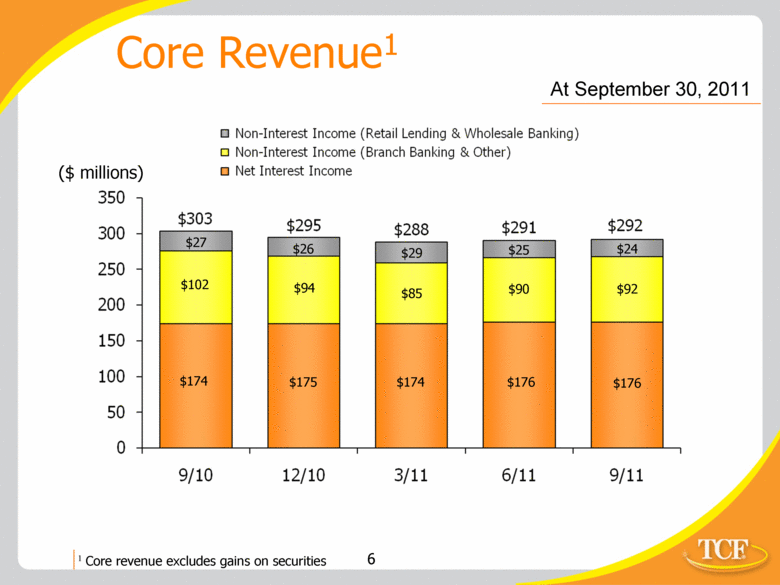
Core Revenue1 ($ millions) At September 30, 2011 1 Core revenue excludes gains on securities $102 $174 $94 $175 $85 $174 $90 $176 $92 $176 $24 $25 $29 $26 $27 Non-Interest Income (Retail Lending & Wholesale Banking) (Branch Banking & Other) Net Interest Income 350 300 250 200 150 100 50 0 $303 $295 $288 $291 $292 9/10 12/10 3/11 6/11 9/11 |
|
|
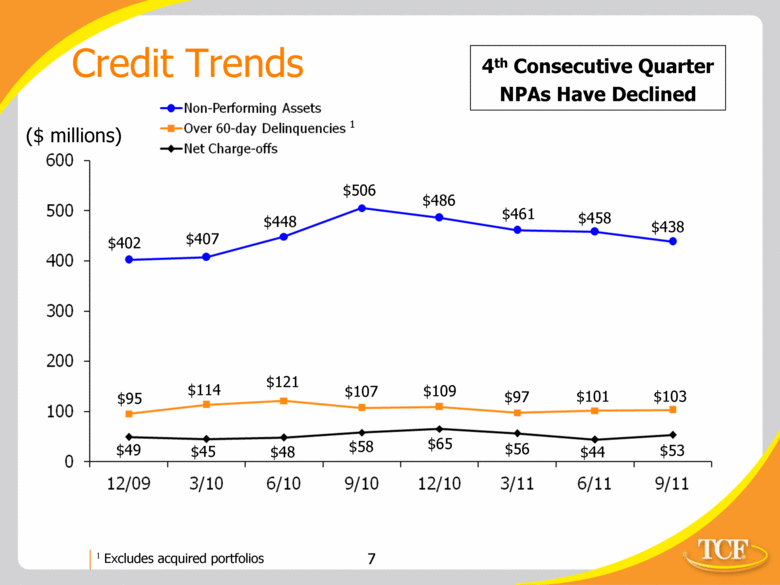
Credit Trends $402 1 Excludes acquired portfolios 1 $461 $438 $407 $448 $506 $486 $458 ($ millions) $65 $58 $45 $48 $49 $53 $103 $95 $114 $121 $107 $109 $97 $101 $44 $56 4th Consecutive Quarter NPAs Have Declined Non-Performing Assets Over 60-day Delinquencies 1 Net Charge-offs 600 500 400 300 200 100 0 12/09 3/10 6/10 9/10 12/10 3/11 6/11 9/11 |
|
|
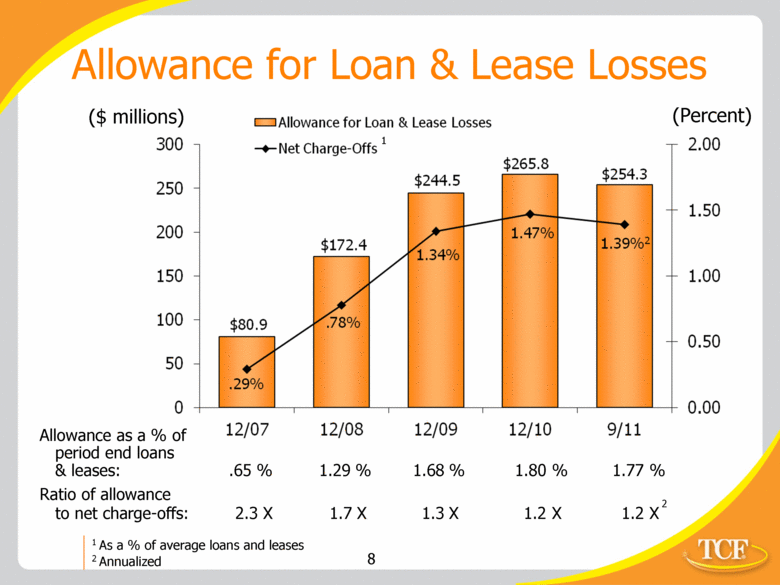
Allowance as a % of period end loans & leases: .65 % 1.29 % 1.68 % 1.80 % 1.77 % Ratio of allowance to net charge-offs: 2.3 X 1.7 X 1.3 X 1.2 X 1.2 X Allowance for Loan & Lease Losses ($ millions) (Percent) 1 As a % of average loans and leases 2 Annualized 2 1 300 250 200 150 100 50 0 12/07 12/08 12/09 12/10 9/11 0.00 0.50 1.00 1.50 2.00 Allowance for Loan & Lease Losses Net Charge-Offs $80.9 $172.4 $244.5 $265.8 $254.3 .29% .78% 1.34% 1.47% 1.39% 2 |
|
|
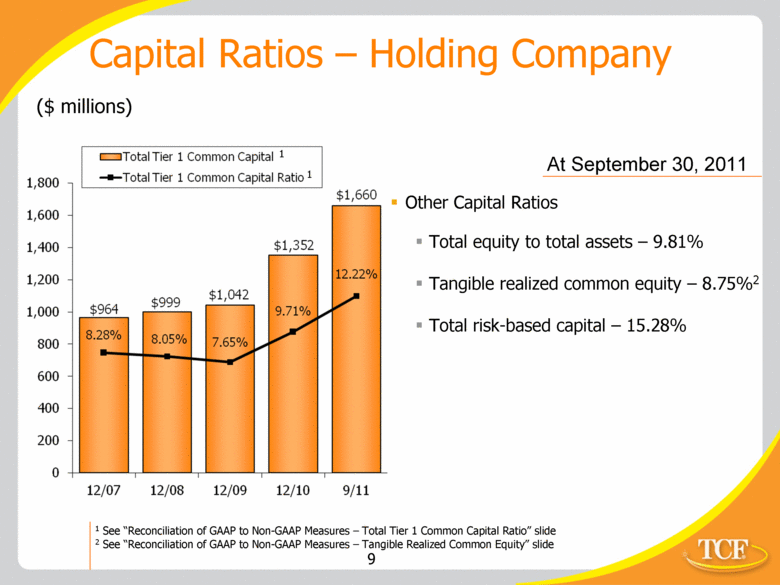
1 See “Reconciliation of GAAP to Non-GAAP Measures – Total Tier 1 Common Capital Ratio” slide 2 See “Reconciliation of GAAP to Non-GAAP Measures – Tangible Realized Common Equity” slide Capital Ratios – Holding Company ($ millions) At September 30, 2011 Other Capital Ratios Total equity to total assets – 9.81% Tangible realized common equity – 8.75%2 Total risk-based capital – 15.28% 1 1 Total Tier 1 Common Capital Ratio 1,800 1,600 1,400 1,200 1,000 800 600 400 200 0 12/07 12/08 12/09 12/10 9/11 $964 $999 $1,042 $1,352 $1,660 8.28% 8.05% 7.65% 9.71% 12.22% |
|
|
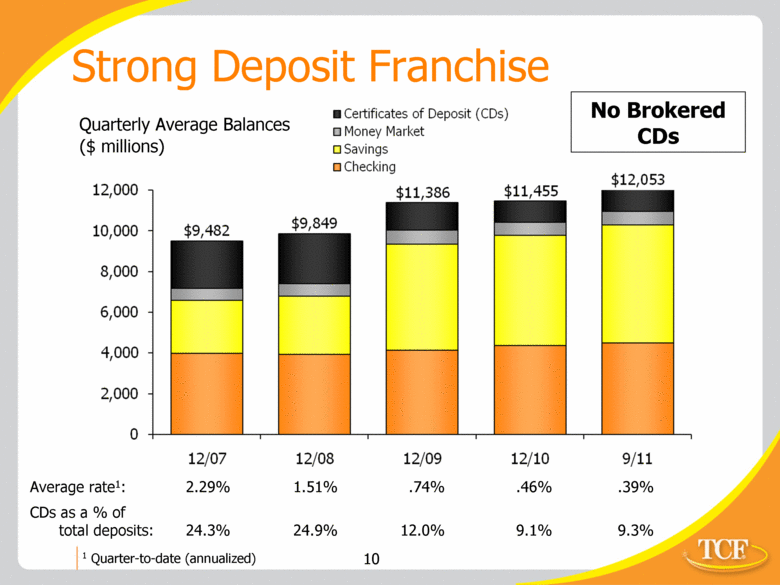
Strong Deposit Franchise Quarterly Average Balances ($ millions) Average rate1: 2.29% 1.51% .74% .46% .39% CDs as a % of total deposits: 24.3% 24.9% 12.0% 9.1% 9.3% 1 Quarter-to-date (annualized) No Brokered CDs 12,000 10,000 8,000 6,000 4,000 2,000 0 12/07 12/08 12/09 12/10 9/11 $9,482 $9,849 $11,386 $11,455 $12,053 Certificates of Deposit (CDs) Money Market Savings Checking |
|
|
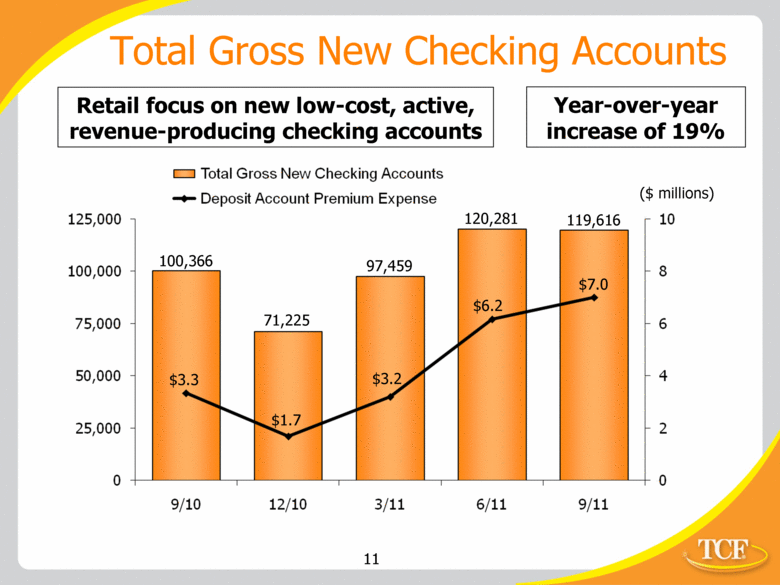
Total Gross New Checking Accounts 119,616 120,281 97,459 71,225 100,366 Retail focus on new low-cost, active, revenue-producing checking accounts $6.2 $7.0 $3.2 $1.7 $3.3 ($ millions) Year-over-year increase of 19% Total Gross New Checking Accounts Deposit Account Premium Expense 125,000 100,000 75,000 50,000 25,000 0 9/10 12/10 3/11 6/11 9/11 |
|
|
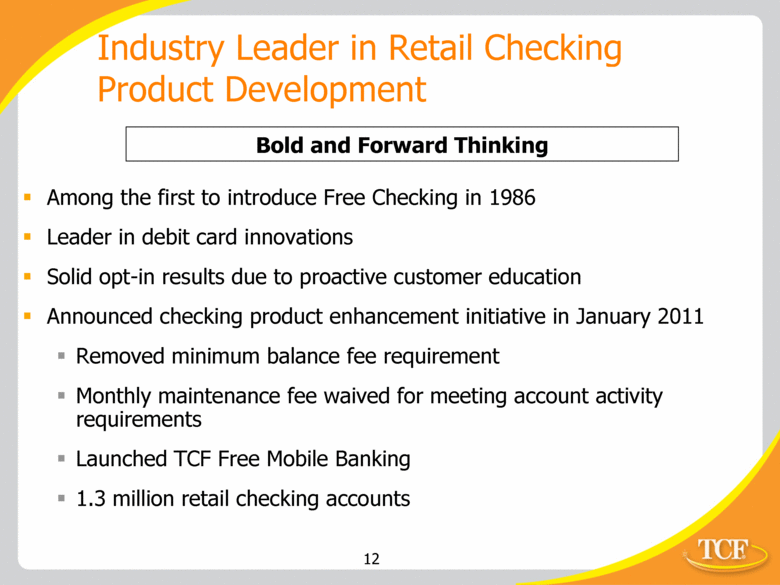
Among the first to introduce Free Checking in 1986 Leader in debit card innovations Solid opt-in results due to proactive customer education Announced checking product enhancement initiative in January 2011 Removed minimum balance fee requirement Monthly maintenance fee waived for meeting account activity requirements Launched TCF Free Mobile Banking 1.3 million retail checking accounts Industry Leader in Retail Checking Product Development Bold and Forward Thinking |
|
|
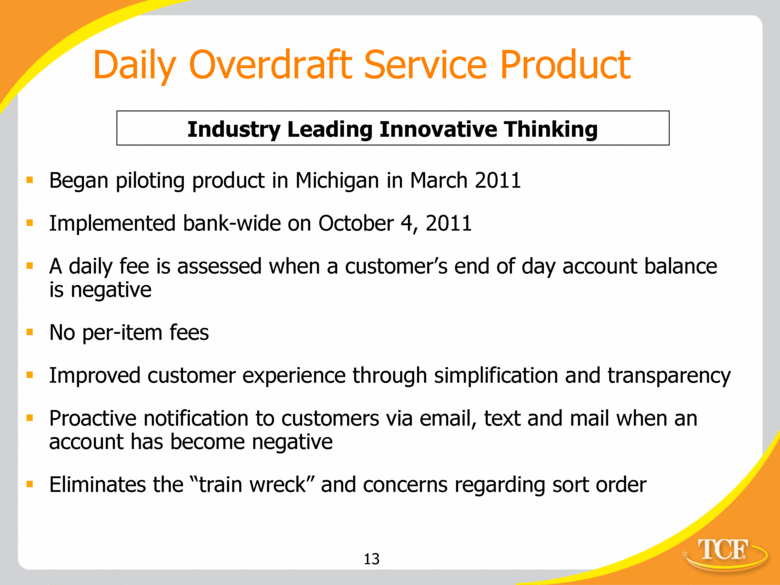
Began piloting product in Michigan in March 2011 Implemented bank-wide on October 4, 2011 A daily fee is assessed when a customer’s end of day account balance is negative No per-item fees Improved customer experience through simplification and transparency Proactive notification to customers via email, text and mail when an account has become negative Eliminates the “train wreck” and concerns regarding sort order Daily Overdraft Service Product Industry Leading Innovative Thinking |
|
|
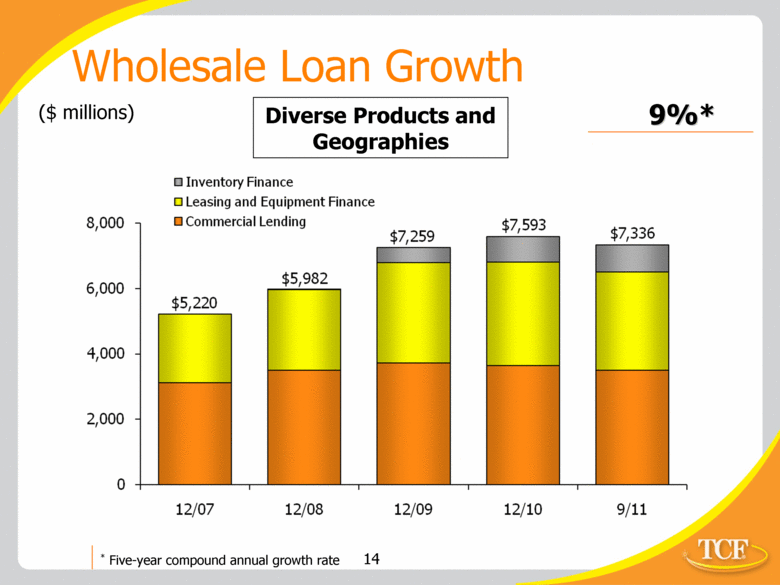
Wholesale Loan Growth ($ millions) Diverse Products and Geographies 9%* * Five-year compound annual growth rate Inventory Finance Leasing and Equipment Finance Commercial Lending 8,000 6,000 4,000 2,000 0 12/07 12/08 12/09 12/10 9/11 $5,220 $5,982 $7,259 $7,593 $7,336 |
|
|
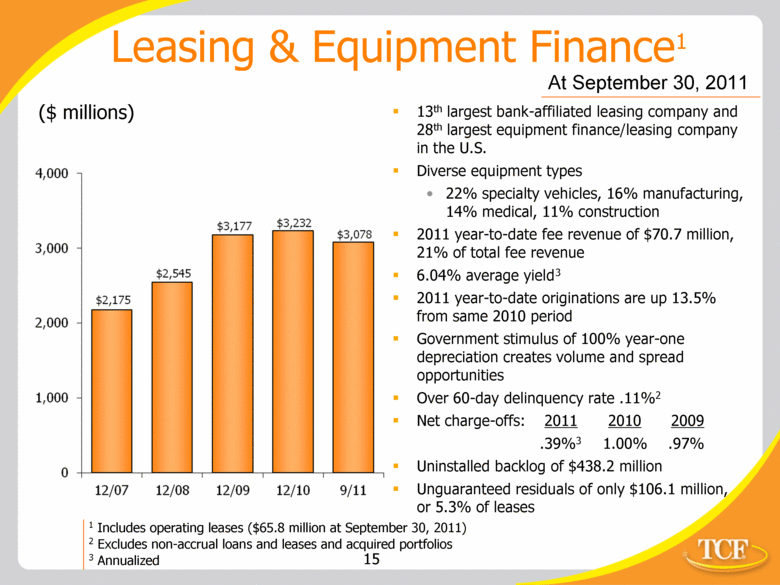
Leasing & Equipment Finance1 1 Includes operating leases ($65.8 million at September 30, 2011) 2 Excludes non-accrual loans and leases and acquired portfolios 3 Annualized ($ millions) At September 30, 2011 13th largest bank-affiliated leasing company and 28th largest equipment finance/leasing company in the U.S. Diverse equipment types 22% specialty vehicles, 16% manufacturing, 14% medical, 11% construction 2011 year-to-date fee revenue of $70.7 million, 21% of total fee revenue 6.04% average yield 3 2011 year-to-date originations are up 13.5% from same 2010 period Government stimulus of 100% year-one depreciation creates volume and spread opportunities Over 60-day delinquency rate .11%2 Net charge-offs: 2011 2010 2009 .39%3 1.00% .97% Uninstalled backlog of $438.2 million Unguaranteed residuals of only $106.1 million, or 5.3% of leases 4,000 3,000 2,000 1,000 0 12/07 12/08 12/09 12/10 9/11 $2,175 $2,545 $3,177 $3,232 $3,078 |
|
|
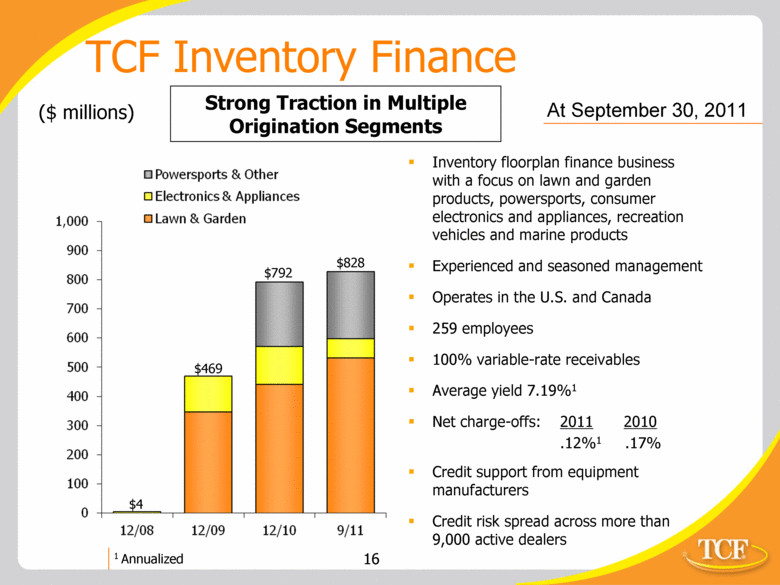
TCF Inventory Finance ($ millions) $4 $469 $828 At September 30, 2011 Inventory floorplan finance business with a focus on lawn and garden products, powersports, consumer electronics and appliances, recreation vehicles and marine products Experienced and seasoned management Operates in the U.S. and Canada 259 employees 100% variable-rate receivables Average yield 7.19%1 Net charge-offs: 2011 2010 .12%1 .17% Credit support from equipment manufacturers Credit risk spread across more than 9,000 active dealers Strong Traction in Multiple Origination Segments $792 1 Annualized 1,000 900 800 700 600 500 400 300 200 100 0 12/08 12/09 12/10 9/11 Powersports & Other Electronics & Appliances Lawm & Garden |
|
|
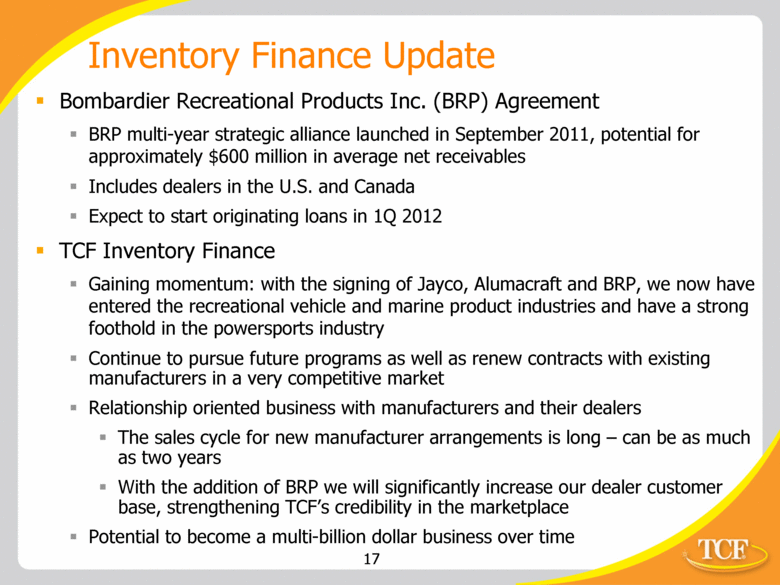
Bombardier Recreational Products Inc. (BRP) Agreement BRP multi-year strategic alliance launched in September 2011, potential for approximately $600 million in average net receivables Includes dealers in the U.S. and Canada Expect to start originating loans in 1Q 2012 TCF Inventory Finance Gaining momentum: with the signing of Jayco, Alumacraft and BRP, we now have entered the recreational vehicle and marine product industries and have a strong foothold in the powersports industry Continue to pursue future programs as well as renew contracts with existing manufacturers in a very competitive market Relationship oriented business with manufacturers and their dealers The sales cycle for new manufacturer arrangements is long – can be as much as two years With the addition of BRP we will significantly increase our dealer customer base, strengthening TCF’s credibility in the marketplace Potential to become a multi-billion dollar business over time Inventory Finance Update |
|
|
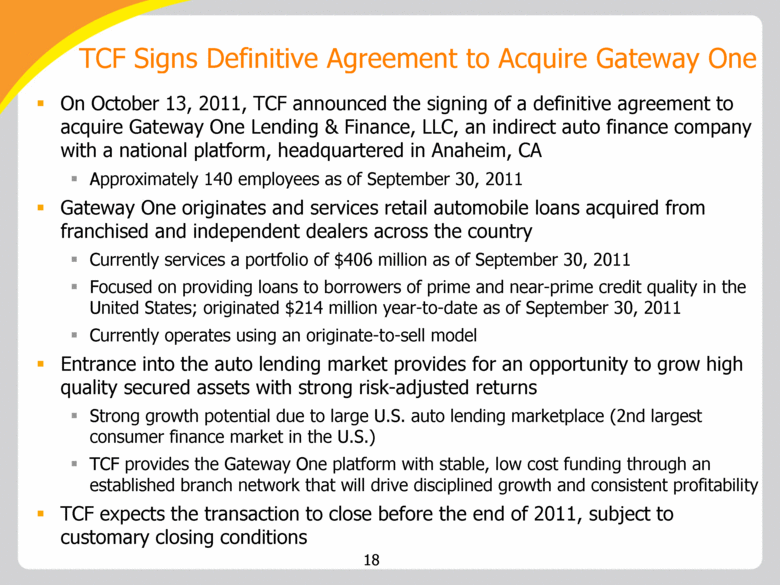
On October 13, 2011, TCF announced the signing of a definitive agreement to acquire Gateway One Lending & Finance, LLC, an indirect auto finance company with a national platform, headquartered in Anaheim, CA Approximately 140 employees as of September 30, 2011 Gateway One originates and services retail automobile loans acquired from franchised and independent dealers across the country Currently services a portfolio of $406 million as of September 30, 2011 Focused on providing loans to borrowers of prime and near-prime credit quality in the United States; originated $214 million year-to-date as of September 30, 2011 Currently operates using an originate-to-sell model Entrance into the auto lending market provides for an opportunity to grow high quality secured assets with strong risk-adjusted returns Strong growth potential due to large U.S. auto lending marketplace (2nd largest consumer finance market in the U.S.) TCF provides the Gateway One platform with stable, low cost funding through an established branch network that will drive disciplined growth and consistent profitability TCF expects the transaction to close before the end of 2011, subject to customary closing conditions TCF Signs Definitive Agreement to Acquire Gateway One 18 |
|
|
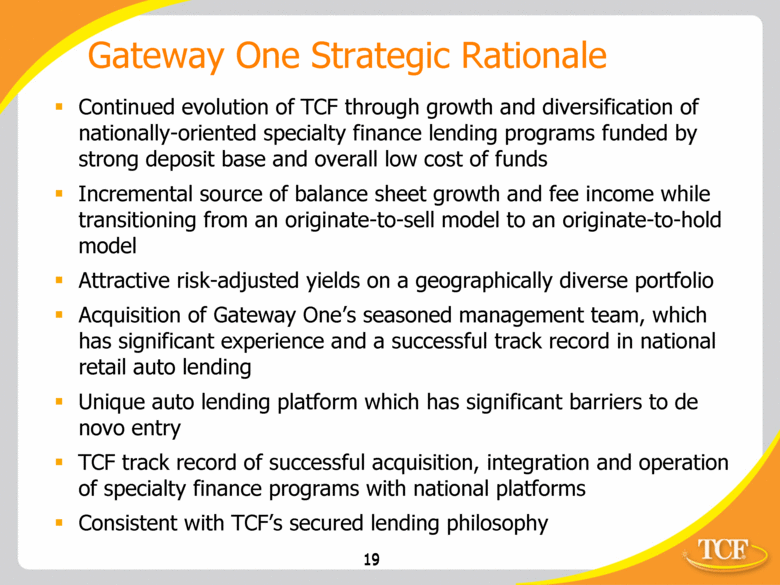
Continued evolution of TCF through growth and diversification of nationally-oriented specialty finance lending programs funded by strong deposit base and overall low cost of funds Incremental source of balance sheet growth and fee income while transitioning from an originate-to-sell model to an originate-to-hold model Attractive risk-adjusted yields on a geographically diverse portfolio Acquisition of Gateway One’s seasoned management team, which has significant experience and a successful track record in national retail auto lending Unique auto lending platform which has significant barriers to de novo entry TCF track record of successful acquisition, integration and operation of specialty finance programs with national platforms Consistent with TCF’s secured lending philosophy Gateway One Strategic Rationale 19 |
|
|
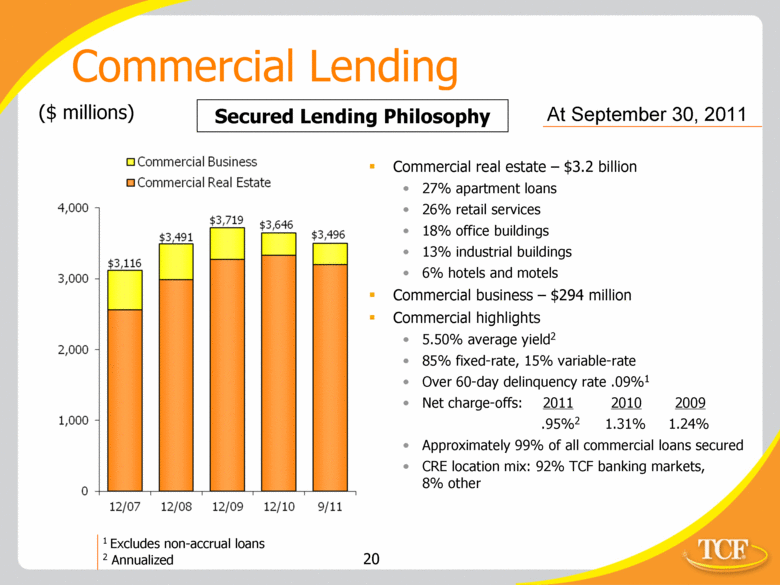
Commercial Lending ($ millions) At September 30, 2011 Commercial real estate – $3.2 billion 27% apartment loans 26% retail services 18% office buildings 13% industrial buildings 6% hotels and motels Commercial business – $294 million Commercial highlights 5.50% average yield2 85% fixed-rate, 15% variable-rate Over 60-day delinquency rate .09%1 Net charge-offs: 2011 2010 2009 .95%2 1.31% 1.24% Approximately 99% of all commercial loans secured CRE location mix: 92% TCF banking markets, 8% other 1 Excludes non-accrual loans 2 Annualized Secured Lending Philosophy 4,000 3,000 2,000 1,000 0 12/07 12/08 12/09 12/10 9/11 $3,116 $3,491 $3,719 $3,646 $3,496 |
|
|
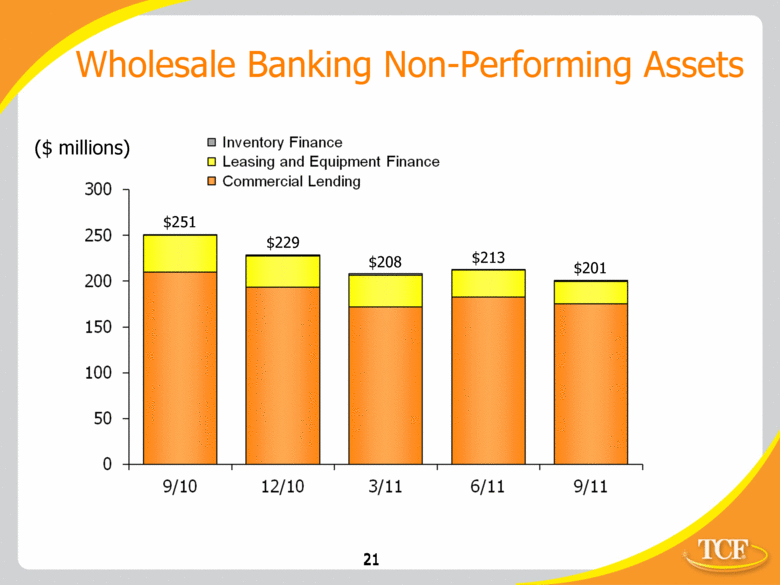
($ millions) 21 $251 $229 $208 $213 $201 Wholesale Banking Non-Performing Assets Inventory Finance Leasing and Equipment Finance Commercial Lending 300 250 200 150 100 50 0 9/10 12/10 3/11 6/11 9/11 |
|
|
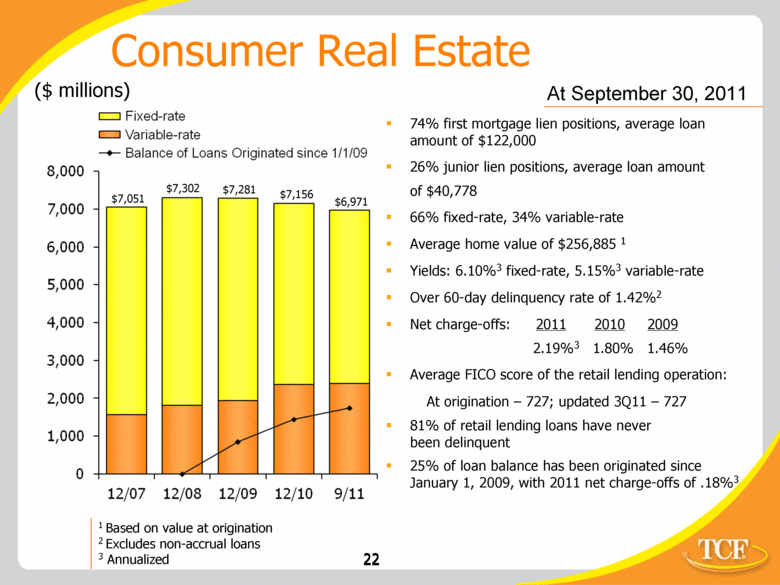
74% first mortgage lien positions, average loan amount of $122,000 26% junior lien positions, average loan amount of $40,778 66% fixed-rate, 34% variable-rate Average home value of $256,885 1 Yields: 6.10%3 fixed-rate, 5.15%3 variable-rate Over 60-day delinquency rate of 1.42%2 Net charge-offs: 2011 2010 2009 2.19% 3 1.80% 1.46% Average FICO score of the retail lending operation: At origination – 727; updated 3Q11 – 727 81% of retail lending loans have never been delinquent 25% of loan balance has been originated since January 1, 2009, with 2011 net charge-offs of .18%3 Consumer Real Estate ($ millions) 1 Based on value at origination 2 Excludes non-accrual loans 3 Annualized At September 30, 2011 $6,971 $7,051 $7,281 $7,156 $7,302 22 8,000 7,000 6,000 5,000 4,000 3,000 2,000 1,000 0 12/07 12/08 12/09 12/10 9/11 |
|
|
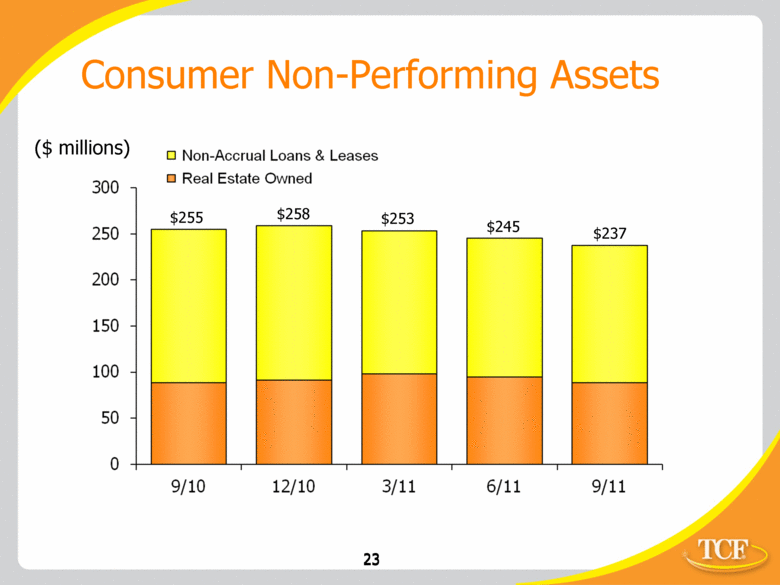
($ millions) 23 $255 $258 $253 $245 $237 Consumer Non-Performing Assets 300 250 200 150 100 50 0 9/10 12/10 3/11 6/11 9/11 |
|
|
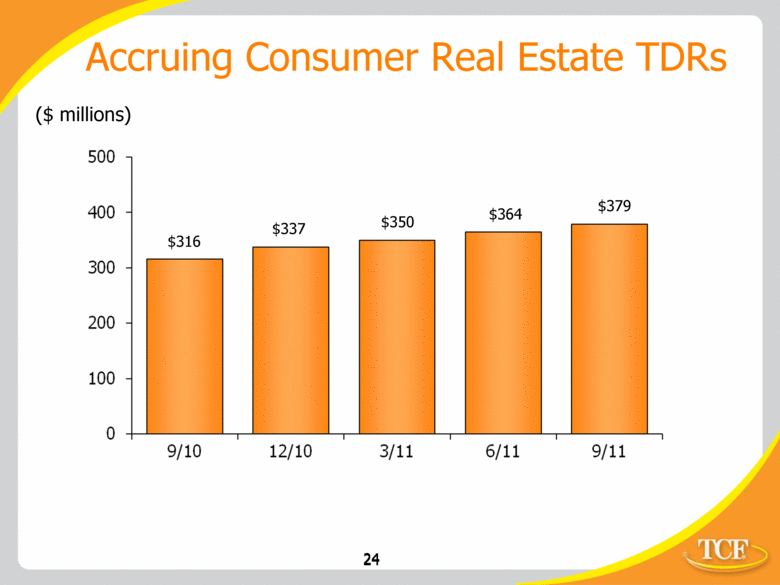
Accruing Consumer Real Estate TDRs ($ millions) 24 $316 $337 $350 $364 $379 500 400 300 200 100 0 9/10 12/10 3/11 6/11 9/11 |
|
|
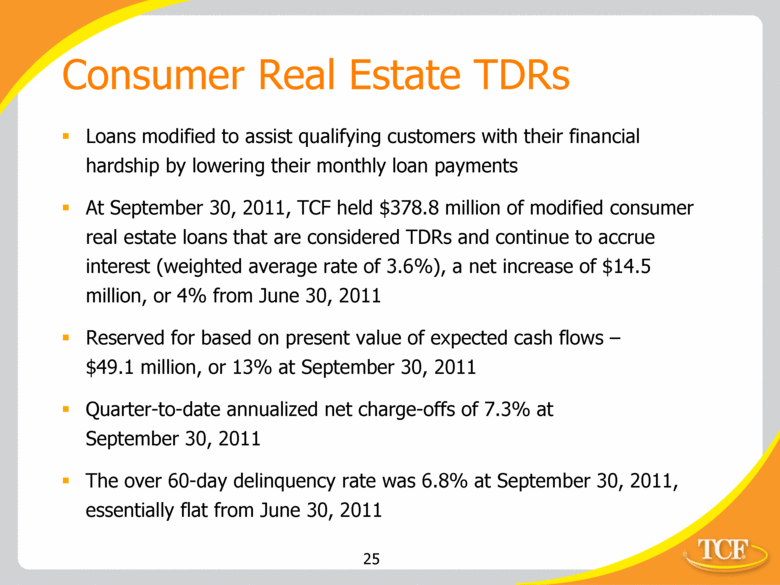
Consumer Real Estate TDRs Loans modified to assist qualifying customers with their financial hardship by lowering their monthly loan payments At September 30, 2011, TCF held $378.8 million of modified consumer real estate loans that are considered TDRs and continue to accrue interest (weighted average rate of 3.6%), a net increase of $14.5 million, or 4% from June 30, 2011 Reserved for based on present value of expected cash flows – $49.1 million, or 13% at September 30, 2011 Quarter-to-date annualized net charge-offs of 7.3% at September 30, 2011 The over 60-day delinquency rate was 6.8% at September 30, 2011, essentially flat from June 30, 2011 |
|
|
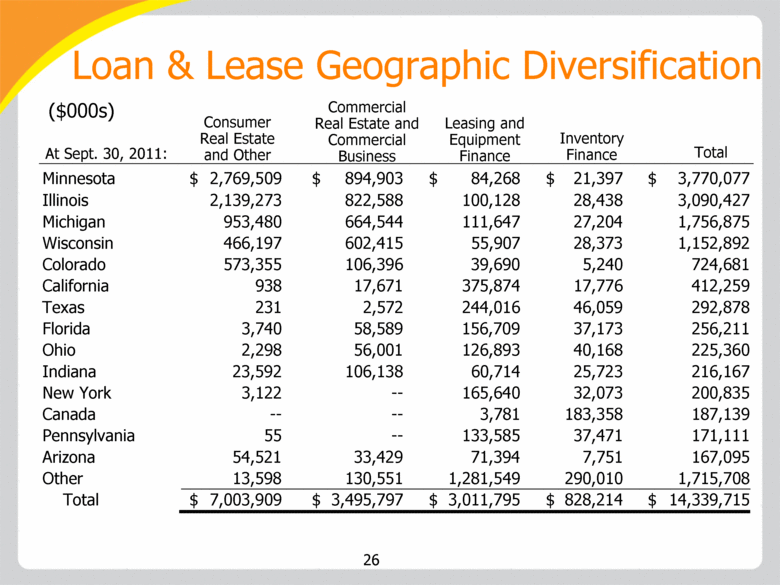
Loan & Lease Geographic Diversification Consumer Real Estate and Other At Sept. 30, 2011: ($000s) Commercial Real Estate and Commercial Business Leasing and Equipment Finance Inventory Finance Total Minnesota $ 2,769,509 $ 894,903 $ 84,268 $ 21,397 $ 3,770,077 Illinois 2,139,273 822,588 100,128 28,438 3,090,427 Michigan 953,480 664,544 111,647 27,204 1,756,875 Wisconsin 466,197 602,415 55,907 28,373 1,152,892 Colorado 573,355 106,396 39,690 5,240 724,681 California 938 17,671 375,874 17,776 412,259 Texas 231 2,572 244,016 46,059 292,878 Florida 3,740 58,589 156,709 37,173 256,211 Ohio 2,298 56,001 126,893 40,168 225,360 Indiana 23,592 106,138 60,714 25,723 216,167 New York 3,122 -- 165,640 32,073 200,835 Canada -- -- 3,781 183,358 187,139 Pennsylvania 55 -- 133,585 37,471 171,111 Arizona 54,521 33,429 71,394 7,751 167,095 Other 13,598 130,551 1,281,549 290,010 1,715,708 Total $ 7,003,909 $ 3,495,797 $ 3,011,795 $ 828,214 $ 14,339,715 26 |
|
|
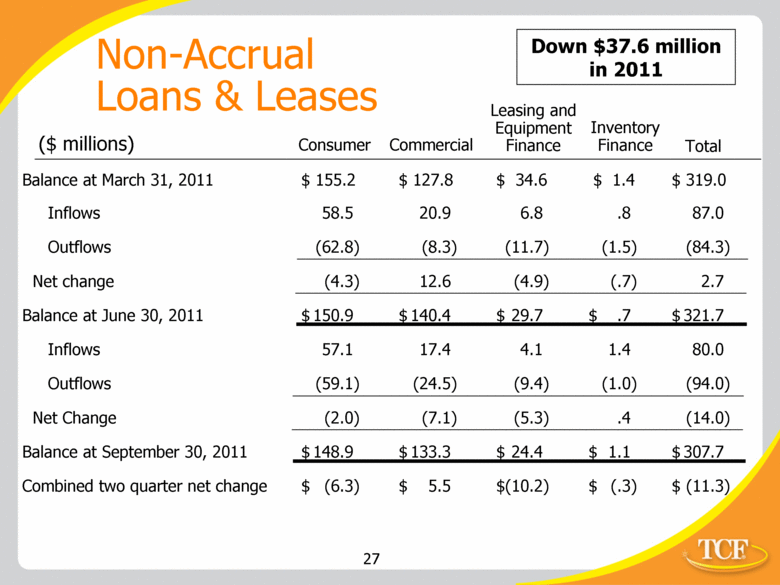
Non-Accrual Loans & Leases ($ millions) Consumer Commercial Leasing and Equipment Finance Inventory Finance Total Balance at March 31, 2011 $ 155.2 $ 127.8 $ 34.6 $ 1.4 $ 319.0 Inflows 58.5 20.9 6.8 .8 87.0 Outflows (62.8) (8.3) (11.7) (1.5) (84.3) Net change (4.3) 12.6 (4.9) (.7) 2.7 Balance at June 30, 2011 $ 150.9 $ 140.4 $ 29.7 $ .7 $ 321.7 Inflows 57.1 17.4 4.1 1.4 80.0 Outflows (59.1) (24.5) (9.4) (1.0) (94.0) Net Change (2.0) (7.1) (5.3) .4 (14.0) Balance at September 30, 2011 $ 148.9 $ 133.3 $ 24.4 $ 1.1 $ 307.7 Combined two quarter net change $ (6.3) $ 5.5 $ (10.2) $ (.3) $ (11.3) Down $37.6 million in 2011 |
|
|
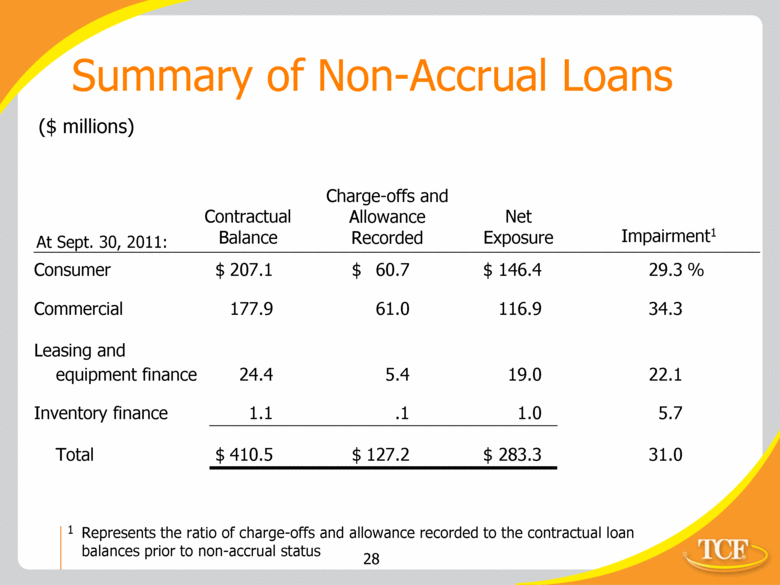
Summary of Non-Accrual Loans Charge-offs and Allowance Recorded Net Exposure Contractual Balance ($ millions) Impairment1 At Sept. 30, 2011: Represents the ratio of charge-offs and allowance recorded to the contractual loan balances prior to non-accrual status 1 Consumer $ 207.1 $ 60.7 $ 146.4 29.3 % Commercial 177.9 61.0 116.9 34.3 Leasing and equipment finance 24.4 5.4 19.0 22.1 Inventory finance 1.1 .1 1.0 5.7 Total $ 410.5 $ 127.2 $ 283.3 31.0 |
|
|
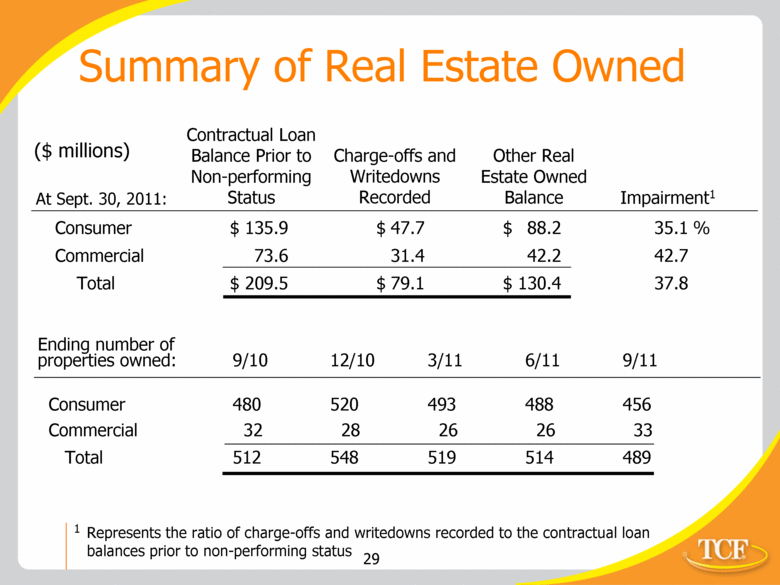
Summary of Real Estate Owned Charge-offs and Writedowns Recorded Other Real Estate Owned Balance ($ millions) Contractual Loan Balance Prior to Non-performing Status At Sept. 30, 2011: Impairment1 Represents the ratio of charge-offs and writedowns recorded to the contractual loan balances prior to non-performing status 1 Consumer $ 135.9 $ 47.7 $ 88.2 35.1 % Commercial 73.6 31.4 42.2 42.7 Total $ 209.5 $ 79.1 $ 130.4 37.8 Ending number of properties owned: 9/10 12/10 3/11 6/11 9/11 Consumer 480 520 493 488 456 Commercial 32 28 26 26 33 Total 512 548 519 514 489 |
|
|
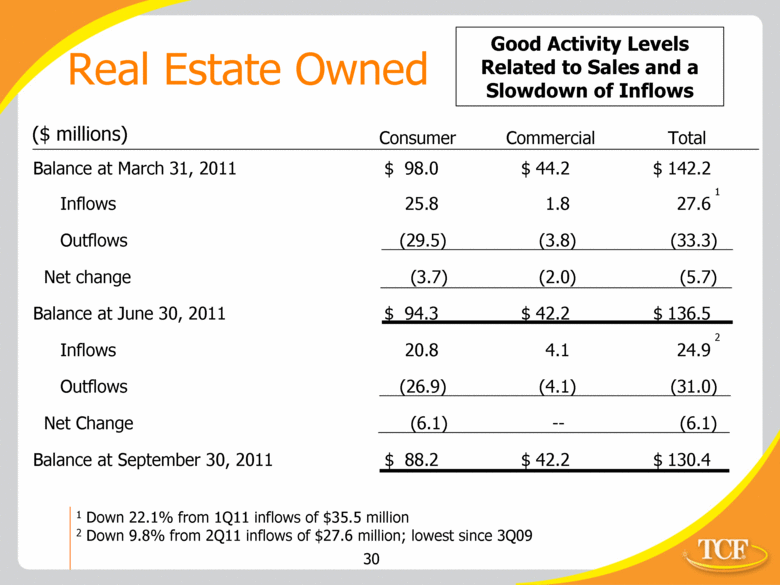
Real Estate Owned ($ millions) Consumer Commercial Total Good Activity Levels Related to Sales and a Slowdown of Inflows Balance at March 31, 2011 $ 98.0 $ 44.2 $ 142.2 Inflows 25.8 1.8 27.6 Outflows (29.5) (3.8) (33.3) Net change (3.7) (2.0) (5.7) Balance at June 30, 2011 $ 94.3 $ 42.2 $ 136.5 Inflows 20.8 4.1 24.9 Outflows (26.9) (4.1) (31.0) Net Change (6.1) -- (6.1) Balance at September 30, 2011 $ 88.2 $ 42.2 $ 130.4 1 Down 22.1% from 1Q11 inflows of $35.5 million 2 Down 9.8% from 2Q11 inflows of $27.6 million; lowest since 3Q09 1 2 |
|
|
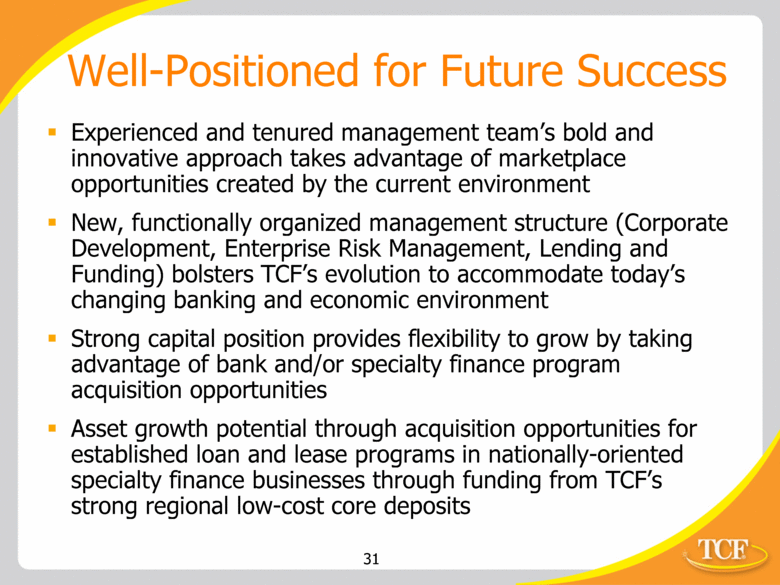
Well-Positioned for Future Success Experienced and tenured management team’s bold and innovative approach takes advantage of marketplace opportunities created by the current environment New, functionally organized management structure (Corporate Development, Enterprise Risk Management, Lending and Funding) bolsters TCF’s evolution to accommodate today’s changing banking and economic environment Strong capital position provides flexibility to grow by taking advantage of bank and/or specialty finance program acquisition opportunities Asset growth potential through acquisition opportunities for established loan and lease programs in nationally-oriented specialty finance businesses through funding from TCF’s strong regional low-cost core deposits |
|
|
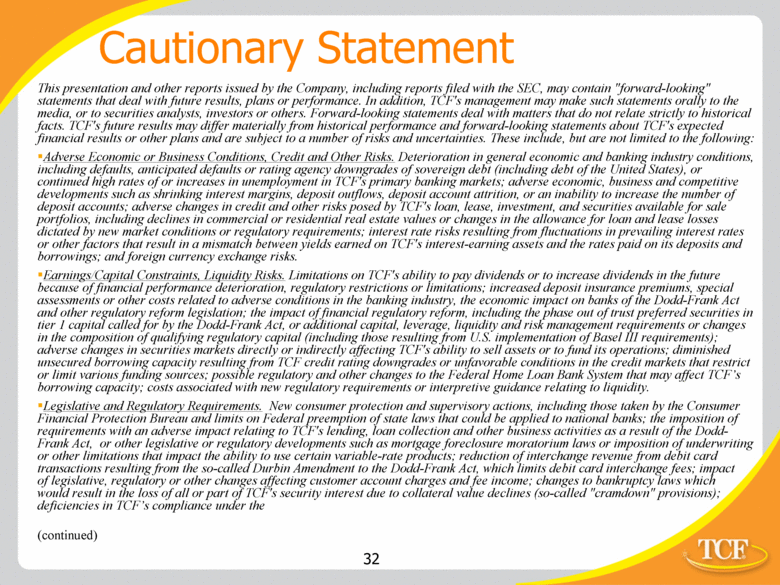
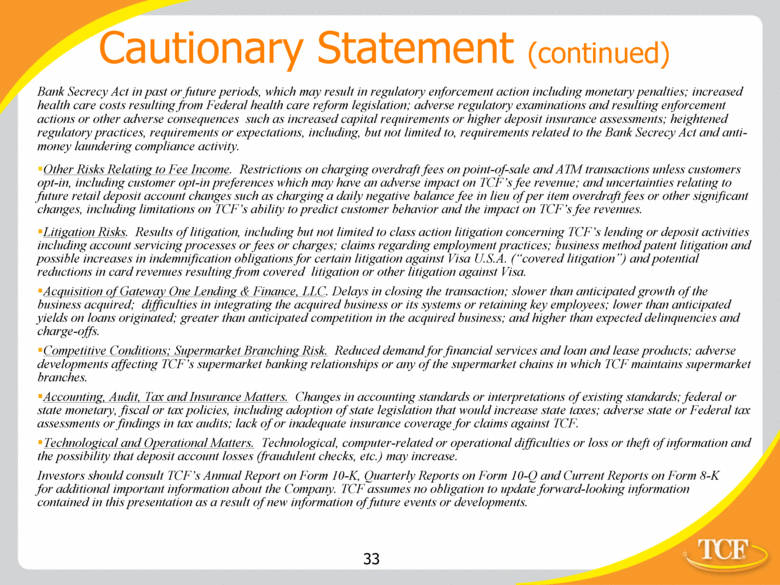
Cautionary Statement This presentation and other reports issued by the Company, including reports filed with the SEC, may contain "forward-looking" statements that deal with future results, plans or performance. In addition, TCF's management may make such statements orally to the media, or to securities analysts, investors or others. Forward-looking statements deal with matters that do not relate strictly to historical facts. TCF's future results may differ materially from historical performance and forward-looking statements about TCF's expected financial results or other plans and are subject to a number of risks and uncertainties. These include, but are not limited to the following: Adverse Economic or Business Conditions, Credit and Other Risks. Deterioration in general economic and banking industry conditions, including defaults, anticipated defaults or rating agency downgrades of sovereign debt (including debt of the United States), or continued high rates of or increases in unemployment in TCF's primary banking markets; adverse economic, business and competitive developments such as shrinking interest margins, deposit outflows, deposit account attrition, or an inability to increase the number of deposit accounts; adverse changes in credit and other risks posed by TCF's loan, lease, investment, and securities available for sale portfolios, including declines in commercial or residential real estate values or changes in the allowance for loan and lease losses dictated by new market conditions or regulatory requirements; interest rate risks resulting from fluctuations in prevailing interest rates or other factors that result in a mismatch between yields earned on TCF's interest-earning assets and the rates paid on its deposits and borrowings; and foreign currency exchange risks. Earnings/Capital Constraints, Liquidity Risks. Limitations on TCF's ability to pay dividends or to increase dividends in the future because of financial performance deterioration, regulatory restrictions or limitations; increased deposit insurance premiums, special assessments or other costs related to adverse conditions in the banking industry, the economic impact on banks of the Dodd-Frank Act and other regulatory reform legislation; the impact of financial regulatory reform, including the phase out of trust preferred securities in tier 1 capital called for by the Dodd-Frank Act, or additional capital, leverage, liquidity and risk management requirements or changes in the composition of qualifying regulatory capital (including those resulting from U.S. implementation of Basel III requirements); adverse changes in securities markets directly or indirectly affecting TCF's ability to sell assets or to fund its operations; diminished unsecured borrowing capacity resulting from TCF credit rating downgrades or unfavorable conditions in the credit markets that restrict or limit various funding sources; possible regulatory and other changes to the Federal Home Loan Bank System that may affect TCF’s borrowing capacity; costs associated with new regulatory requirements or interpretive guidance relating to liquidity. Legislative and Regulatory Requirements. New consumer protection and supervisory actions, including those taken by the Consumer Financial Protection Bureau and limits on Federal preemption of state laws that could be applied to national banks; the imposition of requirements with an adverse impact relating to TCF's lending, loan collection and other business activities as a result of the Dodd-Frank Act, or other legislative or regulatory developments such as mortgage foreclosure moratorium laws or imposition of underwriting or other limitations that impact the ability to use certain variable-rate products; reduction of interchange revenue from debit card transactions resulting from the so-called Durbin Amendment to the Dodd-Frank Act, which limits debit card interchange fees; impact of legislative, regulatory or other changes affecting customer account charges and fee income; changes to bankruptcy laws which would result in the loss of all or part of TCF's security interest due to collateral value declines (so-called "cramdown" provisions); deficiencies in TCF’s compliance under the (continued) |
|
|
Cautionary Statement (continued) Bank Secrecy Act in past or future periods, which may result in regulatory enforcement action including monetary penalties; increased health care costs resulting from Federal health care reform legislation; adverse regulatory examinations and resulting enforcement actions or other adverse consequences such as increased capital requirements or higher deposit insurance assessments; heightened regulatory practices, requirements or expectations, including, but not limited to, requirements related to the Bank Secrecy Act and anti-money laundering compliance activity. Other Risks Relating to Fee Income. Restrictions on charging overdraft fees on point-of-sale and ATM transactions unless customers opt-in, including customer opt-in preferences which may have an adverse impact on TCF’s fee revenue; and uncertainties relating to future retail deposit account changes such as charging a daily negative balance fee in lieu of per item overdraft fees or other significant changes, including limitations on TCF’s ability to predict customer behavior and the impact on TCF’s fee revenues. Litigation Risks. Results of litigation, including but not limited to class action litigation concerning TCF’s lending or deposit activities including account servicing processes or fees or charges; claims regarding employment practices; business method patent litigation and possible increases in indemnification obligations for certain litigation against Visa U.S.A. (“covered litigation”) and potential reductions in card revenues resulting from covered litigation or other litigation against Visa. Acquisition of Gateway One Lending & Finance, LLC. Delays in closing the transaction; slower than anticipated growth of the business acquired; difficulties in integrating the acquired business or its systems or retaining key employees; lower than anticipated yields on loans originated; greater than anticipated competition in the acquired business; and higher than expected delinquencies and charge-offs. Competitive Conditions; Supermarket Branching Risk. Reduced demand for financial services and loan and lease products; adverse developments affecting TCF’s supermarket banking relationships or any of the supermarket chains in which TCF maintains supermarket branches. Accounting, Audit, Tax and Insurance Matters. Changes in accounting standards or interpretations of existing standards; federal or state monetary, fiscal or tax policies, including adoption of state legislation that would increase state taxes; adverse state or Federal tax assessments or findings in tax audits; lack of or inadequate insurance coverage for claims against TCF. Technological and Operational Matters. Technological, computer-related or operational difficulties or loss or theft of information and the possibility that deposit account losses (fraudulent checks, etc.) may increase. Investors should consult TCF’s Annual Report on Form 10-K, Quarterly Reports on Form 10-Q and Current Reports on Form 8-K for additional important information about the Company. TCF assumes no obligation to update forward-looking information contained in this presentation as a result of new information of future events or developments. |
|
|
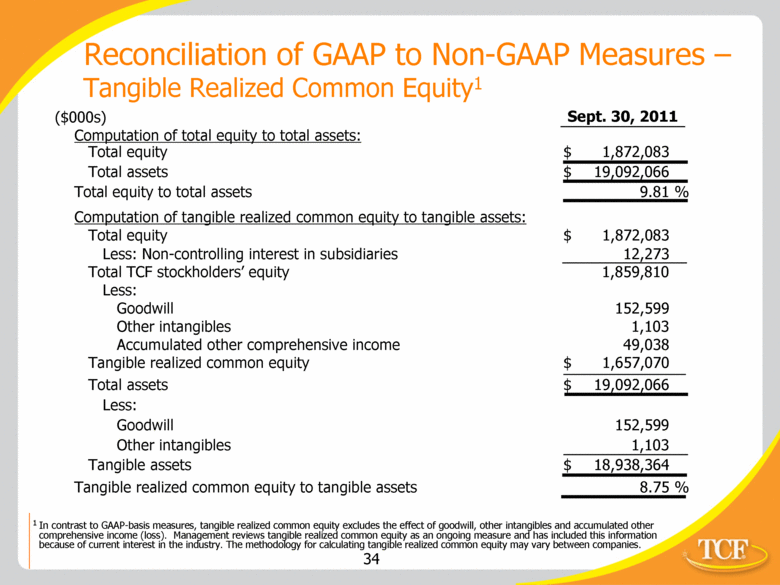
1 In contrast to GAAP-basis measures, tangible realized common equity excludes the effect of goodwill, other intangibles and accumulated other comprehensive income (loss). Management reviews tangible realized common equity as an ongoing measure and has included this information because of current interest in the industry. The methodology for calculating tangible realized common equity may vary between companies. Reconciliation of GAAP to Non-GAAP Measures –Tangible Realized Common Equity1 ($000s) Sept. 30, 2011 Computation of total equity to total assets: Total equity $ 1,872,083 Total assets $ 19,092,066 Total equity to total assets 9.81 % Computation of tangible realized common equity to tangible assets: Total equity $ 1,872,083 Less: Non-controlling interest in subsidiaries 12,273 Total TCF stockholders’ equity 1,859,810 Less: Goodwill 152,599 Other intangibles 1,103 Accumulated other comprehensive income 49,038 Tangible realized common equity $ 1,657,070 Total assets $ 19,092,066 Less: Goodwill 152,599 Other intangibles 1,103 Tangible assets $ 18,938,364 Tangible realized common equity to tangible assets 8.75 % |
|
|
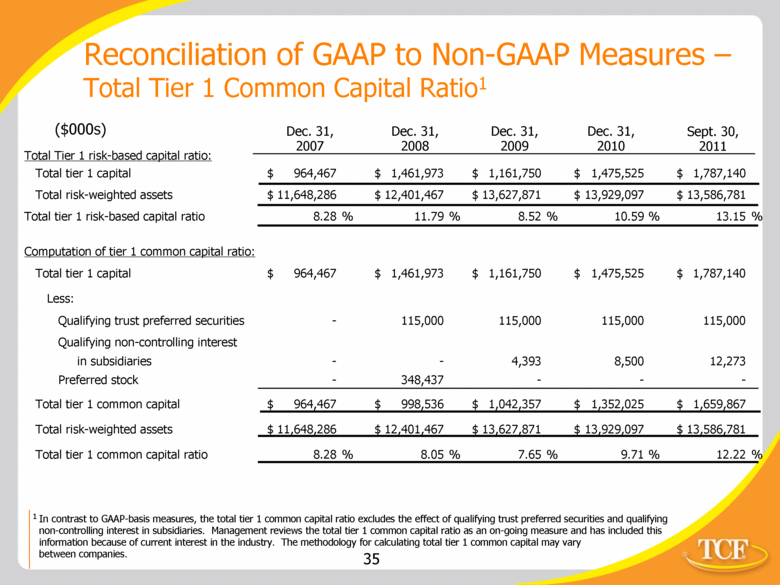
Sept. 30, 2011 1 In contrast to GAAP-basis measures, the total tier 1 common capital ratio excludes the effect of qualifying trust preferred securities and qualifying non-controlling interest in subsidiaries. Management reviews the total tier 1 common capital ratio as an on-going measure and has included this information because of current interest in the industry. The methodology for calculating total tier 1 common capital may vary between companies. Reconciliation of GAAP to Non-GAAP Measures – Total Tier 1 Common Capital Ratio1 ($000s) Dec. 31, 2010 Dec. 31, 2009 Dec. 31, 2008 Dec. 31, 2007 Total Tier 1 risk-based capital ratio: Total tier 1 capital $ 964,467 $ 1,461,973 $ 1,161,750 $ 1,475,525 $ 1,787,140 Total risk-weighted assets $ 11,648,286 $ 12,401,467 $ 13,627,871 $ 13,929,097 $ 13,586,781 Total tier 1 risk-based capital ratio 8.28 % 11.79 % 8.52 % 10.59 % 13.15 % Computation of tier 1 common capital ratio: Total tier 1 capital $ 964,467 $ 1,461,973 $ 1,161,750 $ 1,475,525 $ 1,787,140 Less: Qualifying trust preferred securities - 115,000 115,000 115,000 115,000 Qualifying non-controlling interest in subsidiaries - - 4,393 8,500 12,273 Preferred stock - 348,437 - - - Total tier 1 common capital $ 964,467 $ 998,536 $ 1,042,357 $ 1,352,025 $ 1,659,867 Total risk-weighted assets $ 11,648,286 $ 12,401,467 $ 13,627,871 $ 13,929,097 $ 13,586,781 Total tier 1 common capital ratio 8.28 % 8.05 % 7.65 % 9.71 % 12.22 % |
|
|
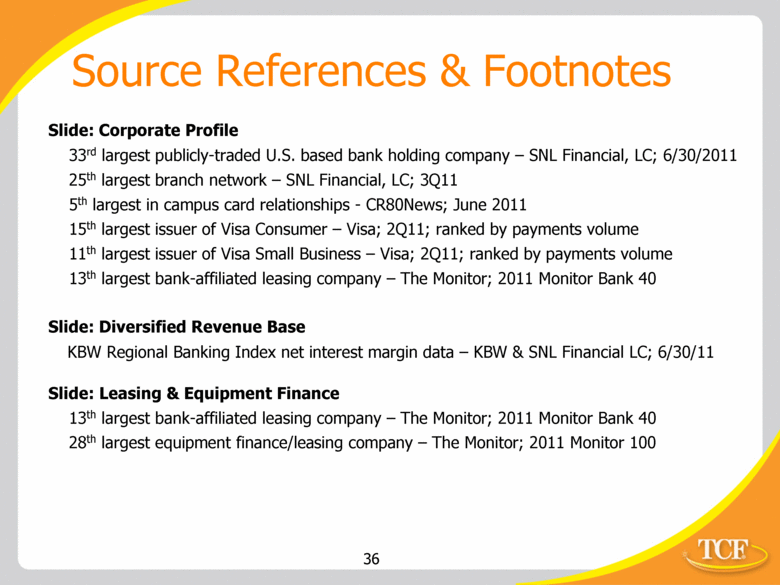
Source References & Footnotes Slide: Corporate Profile 33rd largest publicly-traded U.S. based bank holding company – SNL Financial, LC; 6/30/2011 25th largest branch network – SNL Financial, LC; 3Q11 5th largest in campus card relationships - CR80News; June 2011 15th largest issuer of Visa Consumer – Visa; 2Q11; ranked by payments volume 11th largest issuer of Visa Small Business – Visa; 2Q11; ranked by payments volume 13th largest bank-affiliated leasing company – The Monitor; 2011 Monitor Bank 40 Slide: Diversified Revenue Base KBW Regional Banking Index net interest margin data – KBW & SNL Financial LC; 6/30/11 Slide: Leasing & Equipment Finance 13th largest bank-affiliated leasing company – The Monitor; 2011 Monitor Bank 40 28th largest equipment finance/leasing company – The Monitor; 2011 Monitor 100 |

