Attached files
| file | filename |
|---|---|
| 8-K - 8-K - TCF FINANCIAL CORP | a11-26485_18k.htm |
| EX-99.2 - EX-99.2 - TCF FINANCIAL CORP | a11-26485_1ex99d2.htm |
|
|
TCF Financial Corporation 2011 Second Quarter Investor Presentation Exhibit 99.1 |
|
|
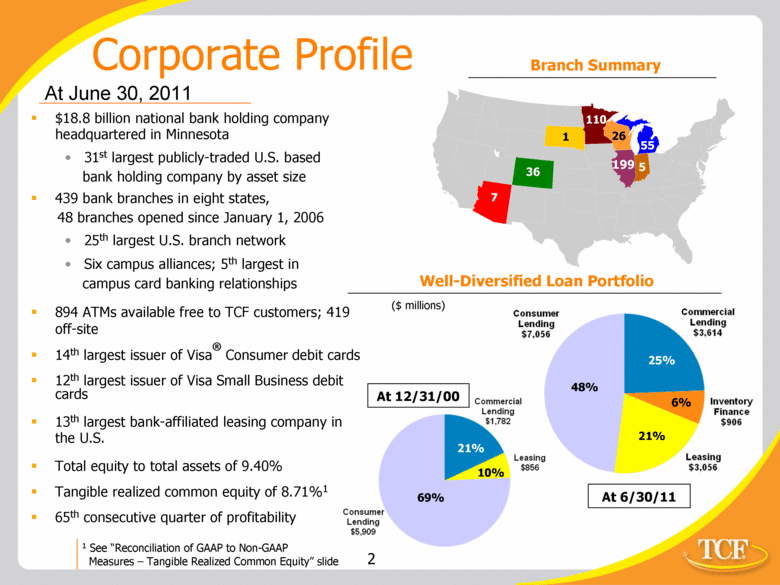
$18.8 billion national bank holding company headquartered in Minnesota 31st largest publicly-traded U.S. based bank holding company by asset size 439 bank branches in eight states, 48 branches opened since January 1, 2006 25th largest U.S. branch network Six campus alliances; 5th largest in campus card banking relationships 894 ATMs available free to TCF customers; 419 off-site 14th largest issuer of Visa® Consumer debit cards 12th largest issuer of Visa Small Business debit cards 13th largest bank-affiliated leasing company in the U.S. Total equity to total assets of 9.40% Tangible realized common equity of 8.71%1 65th consecutive quarter of profitability Corporate Profile At June 30, 2011 1 36 7 110 26 55 199 5 Well-Diversified Loan Portfolio ($ millions) 6% 48% 25% 21% At 12/31/00 69% 21% 10% 1 See “Reconciliation of GAAP to Non-GAAP Measures – Tangible Realized Common Equity” slide At 6/30/11 Branch Summary |
|
|
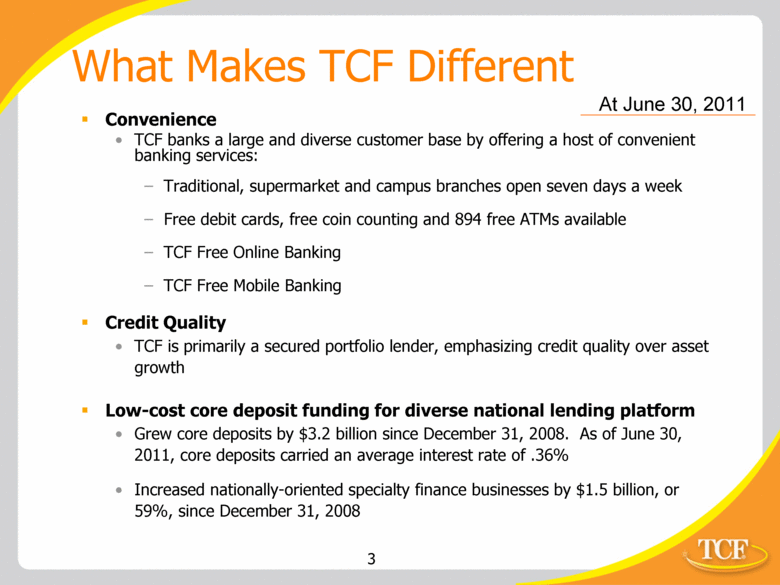
What Makes TCF Different Convenience TCF banks a large and diverse customer base by offering a host of convenient banking services: Traditional, supermarket and campus branches open seven days a week Free debit cards, free coin counting and 894 free ATMs available TCF Free Online Banking TCF Free Mobile Banking Credit Quality TCF is primarily a secured portfolio lender, emphasizing credit quality over asset growth Low-cost core deposit funding for diverse national lending platform Grew core deposits by $3.2 billion since December 31, 2008. As of June 30, 2011, core deposits carried an average interest rate of .36% Increased nationally-oriented specialty finance businesses by $1.5 billion, or 59%, since December 31, 2008 At June 30, 2011 |
|
|
No deficient foreclosure procedures No mortgage repurchase risk No non-agency mortgage-backed securities No option ARM loans No teaser rate or subprime lending programs No low-doc/no-doc loans No Freddie Mac or Fannie Mae preferred stock No mortgage servicing rights No off-balance-sheet funding or securitizations No bank-owned life insurance What Makes TCF Different |
|
|
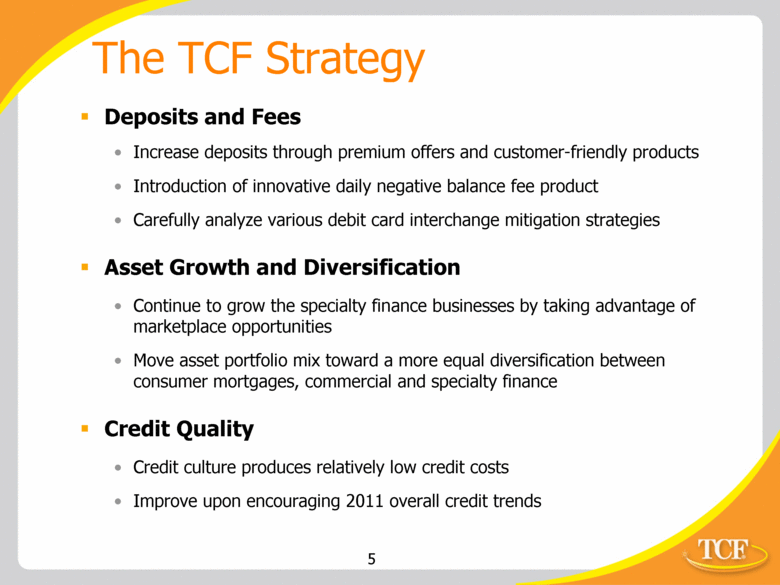
The TCF Strategy Deposits and Fees Increase deposits through premium offers and customer-friendly products Introduction of innovative daily negative balance fee product Carefully analyze various debit card interchange mitigation strategies Asset Growth and Diversification Continue to grow the specialty finance businesses by taking advantage of marketplace opportunities Move asset portfolio mix toward a more equal diversification between consumer mortgages, commercial and specialty finance Credit Quality Credit culture produces relatively low credit costs Improve upon encouraging 2011 overall credit trends |
|
|
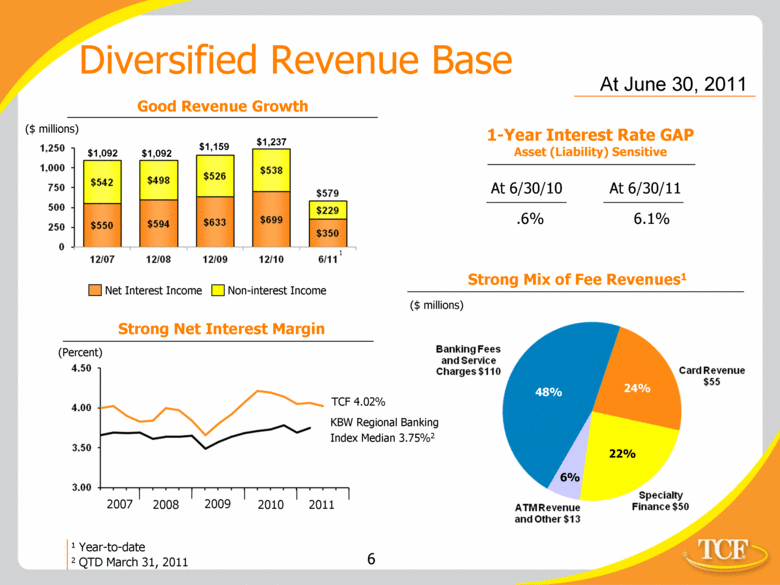
At 6/30/10 At 6/30/11 .6% 6.1% Diversified Revenue Base Good Revenue Growth Strong Net Interest Margin Non-interest Income Net Interest Income Strong Mix of Fee Revenues1 ($ millions) ($ millions) (Percent) TCF 4.02% KBW Regional Banking Index Median 3.75%2 48% 24% 6% 22% 1 Year-to-date 2 QTD March 31, 2011 At June 30, 2011 1-Year Interest Rate GAP Asset (Liability) Sensitive 2008 2009 2010 2011 2007 1 $1,092 $1,092 $1,159 $1,237 Banking Fees and Service Charges $110 ATM Revevenue and Other $13 Specialty Financial $50 Card Revenue 55 1,250 1,000 750 500 250 0 $542 $550 $498 $594 $526 $633 $538 $699 $229 $350 |
|
|
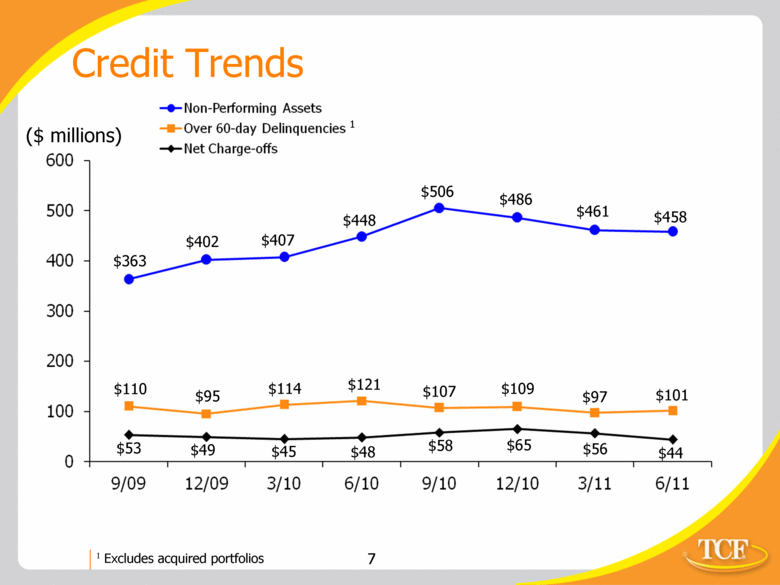
Credit Trends $402 1 Excludes acquired portfolios 1 $461 $363 $407 $448 $506 $486 $458 ($ millions) $65 $58 $45 $48 $49 $53 $110 $95 $114 $121 $107 $109 $97 $101 $44 $56 Non-Performing Assets Over 60-day Delinquencies Net Charge-offs 600 500 400 300 200 100 0 9/09 12/09 3/10 6/10 9/10 12/10 3/11 6/11 |
|
|
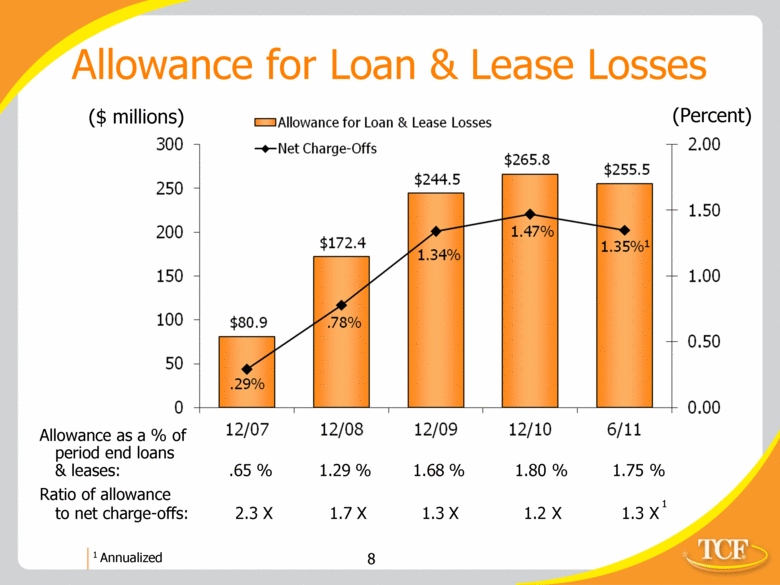
Allowance as a % of period end loans & leases: .65 % 1.29 % 1.68 % 1.80 % 1.75 % Ratio of allowance to net charge-offs: 2.3 X 1.7 X 1.3 X 1.2 X 1.3 X Allowance for Loan & Lease Losses ($ millions) (Percent) 1 Annualized 1 $80.9 $172.4 $244.5 $265.8 $255.5 .29% .78% 1.34% 1.47% 1.35% 1 300 250 200 150 100 50 0 12/07 12/08 12/09 12/10 6/11 2.00 1.50 1.00 0.50 0.00 |
|
|
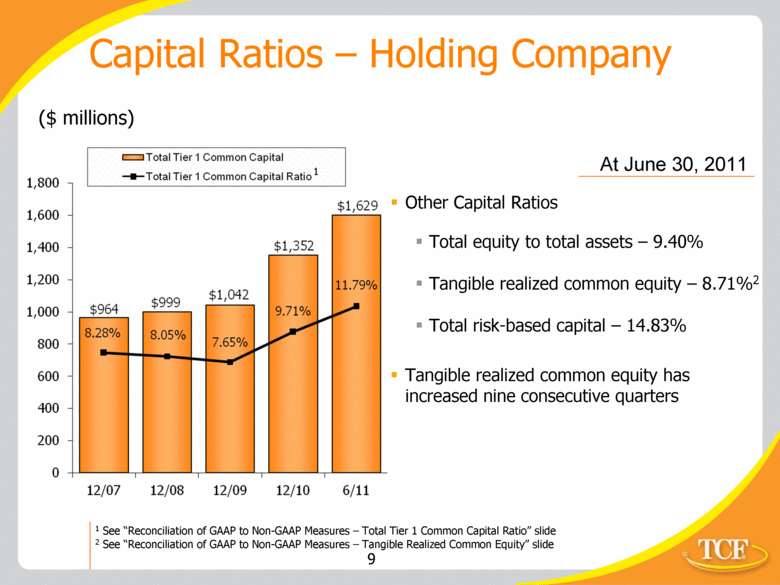
1 See “Reconciliation of GAAP to Non-GAAP Measures – Total Tier 1 Common Capital Ratio” slide 2 See “Reconciliation of GAAP to Non-GAAP Measures – Tangible Realized Common Equity” slide Capital Ratios – Holding Company ($ millions) At June 30, 2011 Other Capital Ratios Total equity to total assets – 9.40% Tangible realized common equity – 8.71%2 Total risk-based capital – 14.83% Tangible realized common equity has increased nine consecutive quarters 1 1,800 1,600 1,400 1,200 1,000 800 600 400 200 0 12/07 12/08 12/09 12/10 6/11 Total Tier 1 Common Capital Total Tier 1 Common Capital Ratio 1 $964 $999 $1,042 $1,352 $1,629 8.28% 8.05% 7.65% 9.71% 11.79% |
|
|
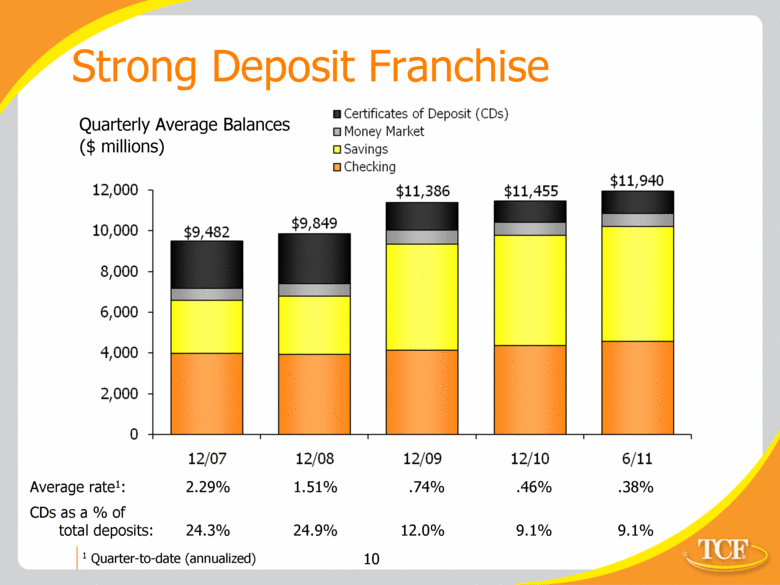
Strong Deposit Franchise Quarterly Average Balances ($ millions) Average rate1: 2.29% 1.51% .74% .46% .38% CDs as a % of total deposits: 24.3% 24.9% 12.0% 9.1% 9.1% 1 Quarter-to-date (annualized) 12,000 10,000 8,000 6,000 4,000 2,000 0 12/07 12/08 12/09 12/10 6/11 $9,482 $9,849 $11,386 $11,455 $11,940 Certificates of Desposit (CDs) Money Market Savings Checking |
|
|
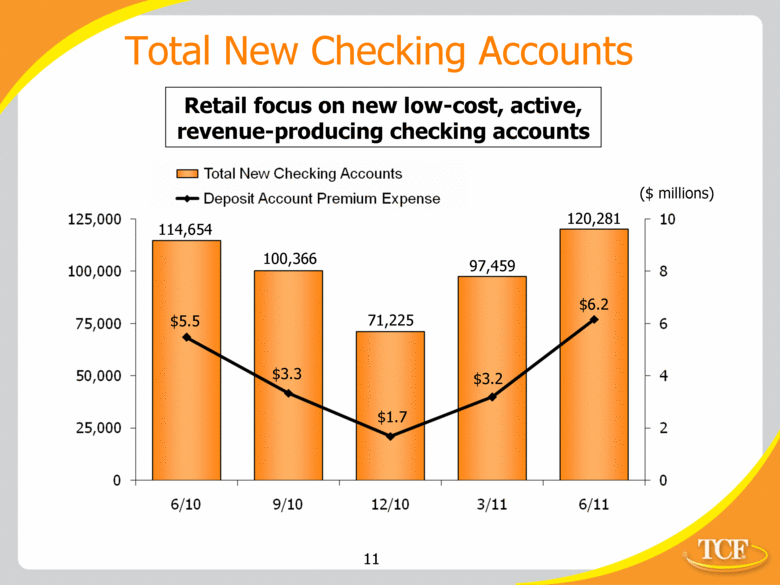
Total New Checking Accounts 114,654 120,281 97,459 71,225 100,366 Retail focus on new low-cost, active, revenue-producing checking accounts $6.2 $5.5 $3.2 $1.7 $3.3 ($ millions) Total New Checking Accounts Deposit Account Premium Expense 125,000 100,000 75,000 50,000 25,000 0 6/10 9/10 12/10 3/11 6/11 10 8 6 4 2 0 |
|
|
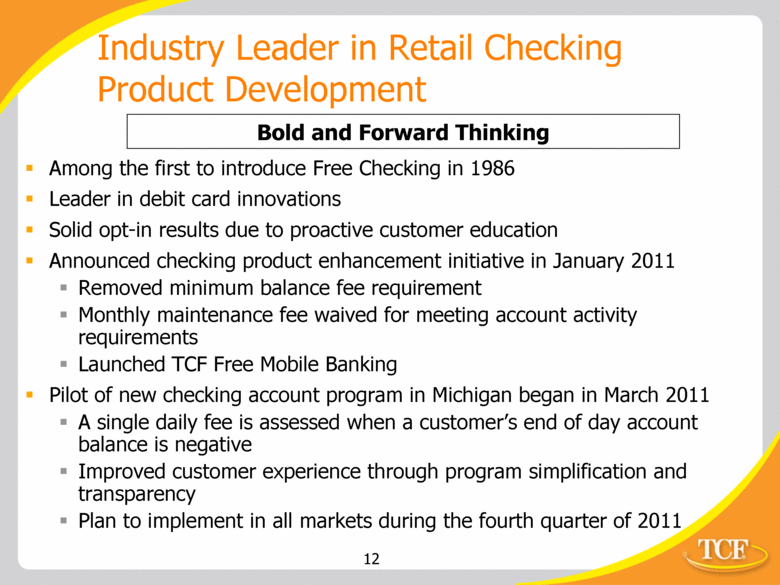
Among the first to introduce Free Checking in 1986 Leader in debit card innovations Solid opt-in results due to proactive customer education Announced checking product enhancement initiative in January 2011 Removed minimum balance fee requirement Monthly maintenance fee waived for meeting account activity requirements Launched TCF Free Mobile Banking Pilot of new checking account program in Michigan began in March 2011 A single daily fee is assessed when a customer’s end of day account balance is negative Improved customer experience through program simplification and transparency Plan to implement in all markets during the fourth quarter of 2011 Industry Leader in Retail Checking Product Development Bold and Forward Thinking |
|
|
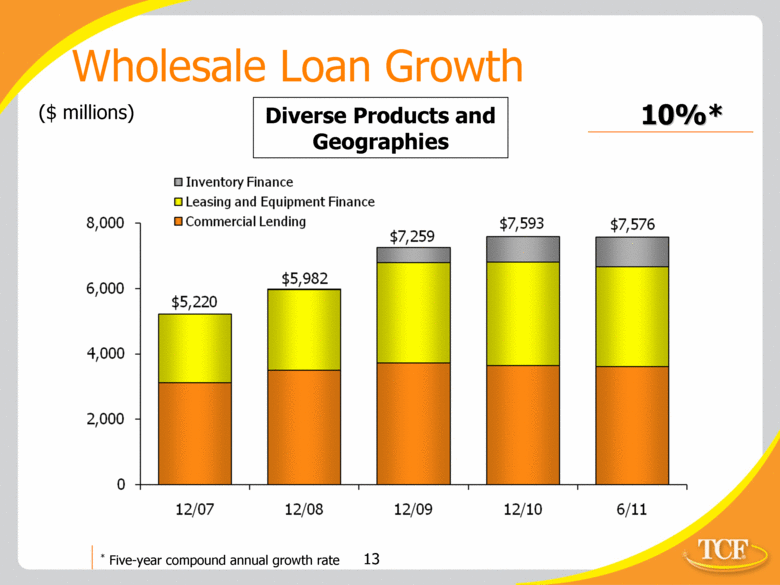
Wholesale Loan Growth ($ millions) Diverse Products and Geographies 10%* * Five-year compound annual growth rate Inventory Finance Leasing and Equipment Finance Commercial Lending 8,000 6,000 4,000 2,000 0 12/07 12/08 12/09 12/10 6/11 $5,220 $5,982 $7,259 $7,593 $7,576 |
|
|
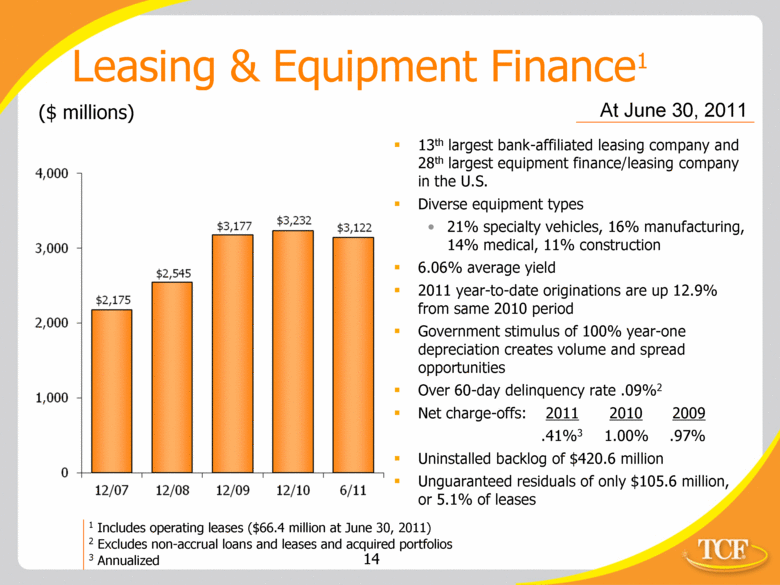
Leasing & Equipment Finance1 1 Includes operating leases ($66.4 million at June 30, 2011) 2 Excludes non-accrual loans and leases and acquired portfolios 3 Annualized ($ millions) At June 30, 2011 13th largest bank-affiliated leasing company and 28th largest equipment finance/leasing company in the U.S. Diverse equipment types 21% specialty vehicles, 16% manufacturing, 14% medical, 11% construction 6.06% average yield 2011 year-to-date originations are up 12.9% from same 2010 period Government stimulus of 100% year-one depreciation creates volume and spread opportunities Over 60-day delinquency rate .09%2 Net charge-offs: 2011 2010 2009 .41%3 1.00% .97% Uninstalled backlog of $420.6 million Unguaranteed residuals of only $105.6 million, or 5.1% of leases 4,000 3,000 2,000 1,000 0 12/07 12/08 12/09 12/10 6/11 $2,175 $2,545 $3,177 $3,232 $3,122 |
|
|
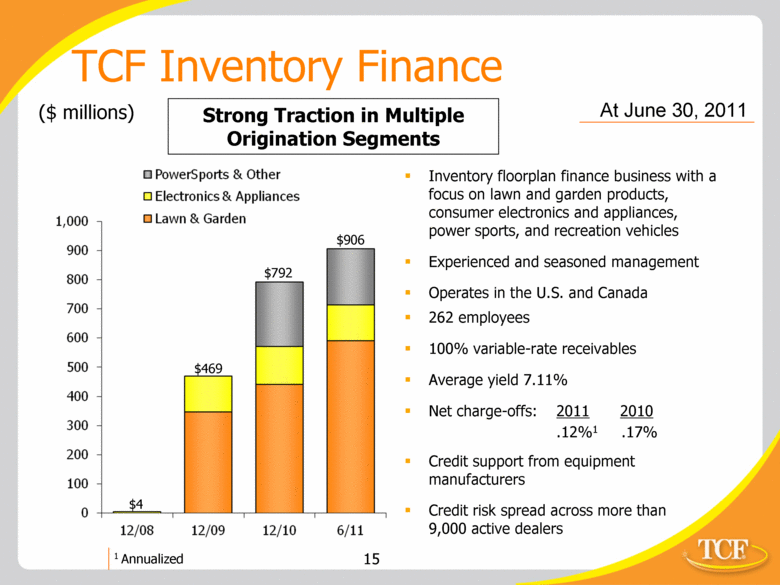
TCF Inventory Finance ($ millions) $4 $469 $906 At June 30, 2011 Inventory floorplan finance business with a focus on lawn and garden products, consumer electronics and appliances, power sports, and recreation vehicles Experienced and seasoned management Operates in the U.S. and Canada 262 employees 100% variable-rate receivables Average yield 7.11% Net charge-offs: 2011 2010 .12%1 .17% Credit support from equipment manufacturers Credit risk spread across more than 9,000 active dealers Strong Traction in Multiple Origination Segments $792 1 Annualized 1,000 900 800 700 600 500 400 300 200 100 0 12/10 12/08 12/09 6/11 $469 $792 $906 $4 PowerSports & Other Electronics & Appliances Lawn & Garden |
|
|
Bombardier Recreational Products Inc. (BRP) Agreement BRP multi-year strategic alliance launched in September 2011, potential for approximately $600 million in average net receivables Includes dealers in the U.S. and Canada Expect to start originating loans in 1Q2012 TCF Inventory Finance Gaining momentum: with the signing of Jayco, Alumacraft and BRP, we now have entered the recreational vehicle and marine product industries and have a strong foothold in the powersports industry Continue to pursue future programs as well as renew contracts with existing manufacturers in a very competitive market Relationship oriented business with manufacturers and their dealers The sales cycle for new manufacturer arrangements is long – can be as much as two years With the addition of BRP we will significantly increase our dealer customer base, strengthening TCF’s credibility in the marketplace Potential to become a multi-billion dollar business over time Inventory Finance Update |
|
|
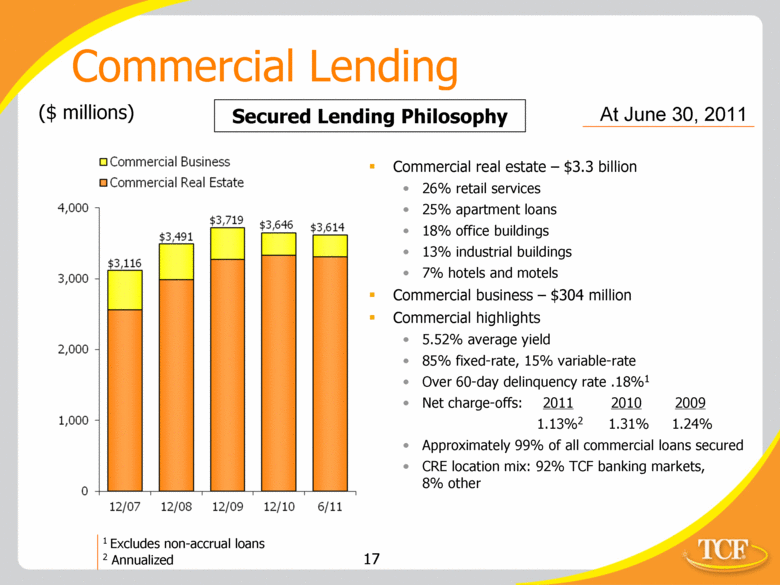
Commercial Lending ($ millions) At June 30, 2011 Commercial real estate – $3.3 billion 26% retail services 25% apartment loans 18% office buildings 13% industrial buildings 7% hotels and motels Commercial business – $304 million Commercial highlights 5.52% average yield 85% fixed-rate, 15% variable-rate Over 60-day delinquency rate .18%1 Net charge-offs: 2011 2010 2009 1.13%2 1.31% 1.24% Approximately 99% of all commercial loans secured CRE location mix: 92% TCF banking markets, 8% other 1 Excludes non-accrual loans 2 Annualized Secured Lending Philosophy Commercial Business Commercial Real Estate 4,000 3,000 2,000 1,000 0 12/07 12/08 12/09 12/10 6/11 $3,116 $3,491 $3,719 $3,646 $3,614 |
|
|
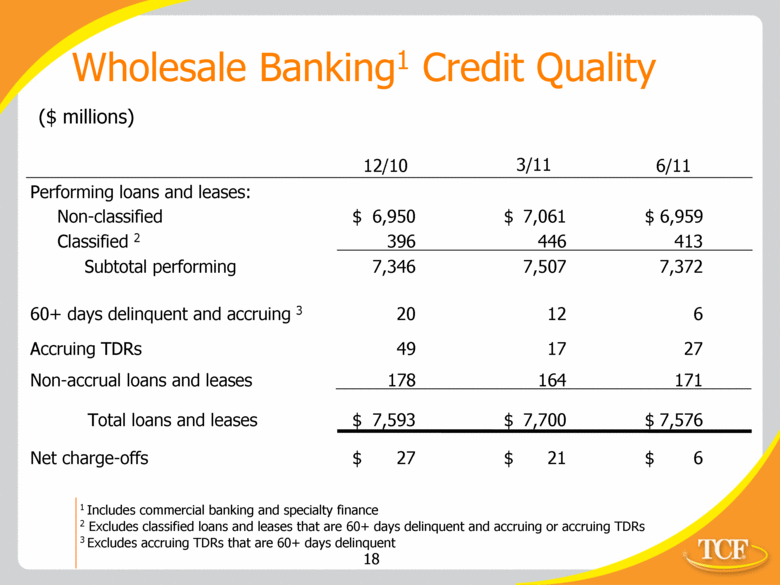
Performing loans and leases: Non-classified $ 6,950 $ 7,061 $ 6,959 Classified 2 396 446 413 Subtotal performing 7,346 7,507 7,372 60+ days delinquent and accruing 3 20 12 6 Accruing TDRs 49 17 27 Non-accrual loans and leases 178 164 171 Total loans and leases $ 7,593 $ 7,700 $ 7,576 Net charge-offs $ 27 $ 21 $ 6 Wholesale Banking1 Credit Quality ($ millions) 3/11 6/11 1 Includes commercial banking and specialty finance 2 Excludes classified loans and leases that are 60+ days delinquent and accruing or accruing TDRs 3 Excludes accruing TDRs that are 60+ days delinquent 12/10 |
|
|
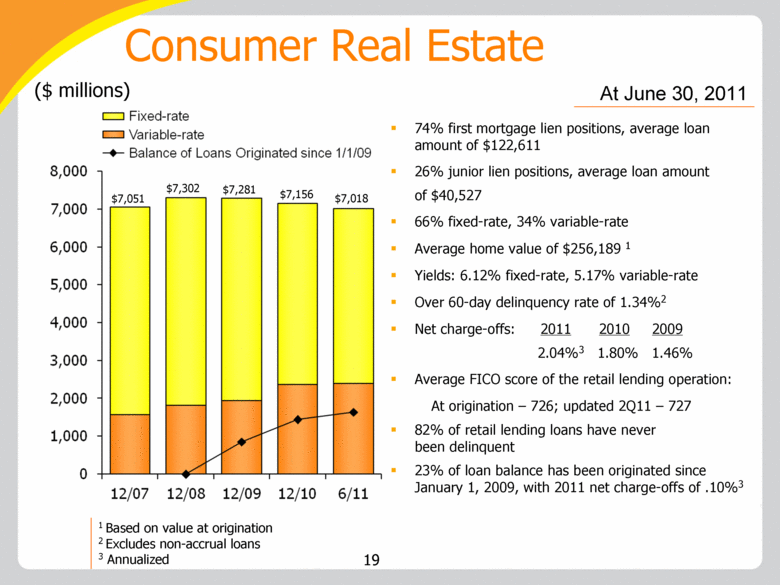
74% first mortgage lien positions, average loan amount of $122,611 26% junior lien positions, average loan amount of $40,527 66% fixed-rate, 34% variable-rate Average home value of $256,189 1 Yields: 6.12% fixed-rate, 5.17% variable-rate Over 60-day delinquency rate of 1.34%2 Net charge-offs: 2011 2010 2009 2.04% 3 1.80% 1.46% Average FICO score of the retail lending operation: At origination – 726; updated 2Q11 – 727 82% of retail lending loans have never been delinquent 23% of loan balance has been originated since January 1, 2009, with 2011 net charge-offs of .10%3 Consumer Real Estate ($ millions) 1 Based on value at origination 2 Excludes non-accrual loans 3 Annualized At June 30, 2011 $7,018 $7,051 $7,281 $7,156 $7,302 19 Fixed-rate Variable-rate Balance of Loans Originated since 1/1/09 8,000 7,000 6,000 5,000 4,000 3,000 2,000 1,000 0 12/07 12/08 12/09 12/10 6/11 |
|
|
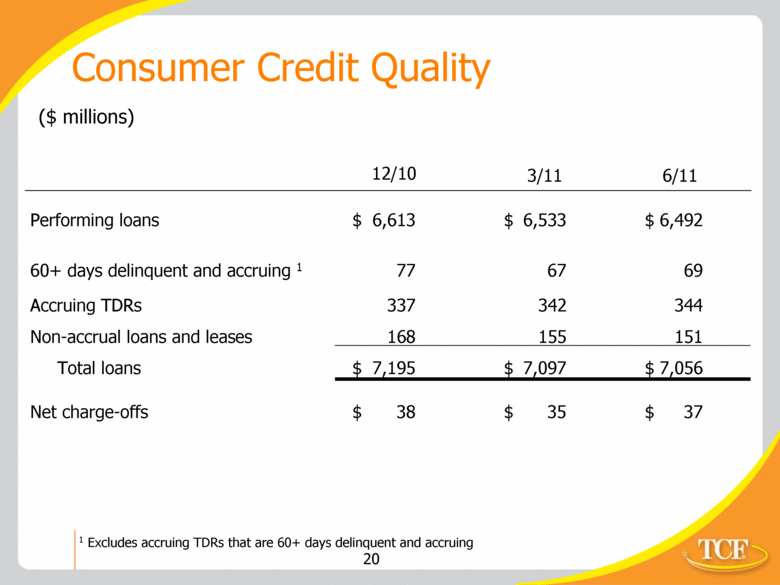
Performing loans $ 6,613 $ 6,533 $ 6,492 60+ days delinquent and accruing 1 77 67 69 Accruing TDRs 337 342 344 Non-accrual loans and leases 168 155 151 Total loans $ 7,195 $ 7,097 $ 7,056 Net charge-offs $ 38 $ 35 $ 37 Consumer Credit Quality ($ millions) 12/10 3/11 1 Excludes accruing TDRs that are 60+ days delinquent and accruing 6/11 |
|
|
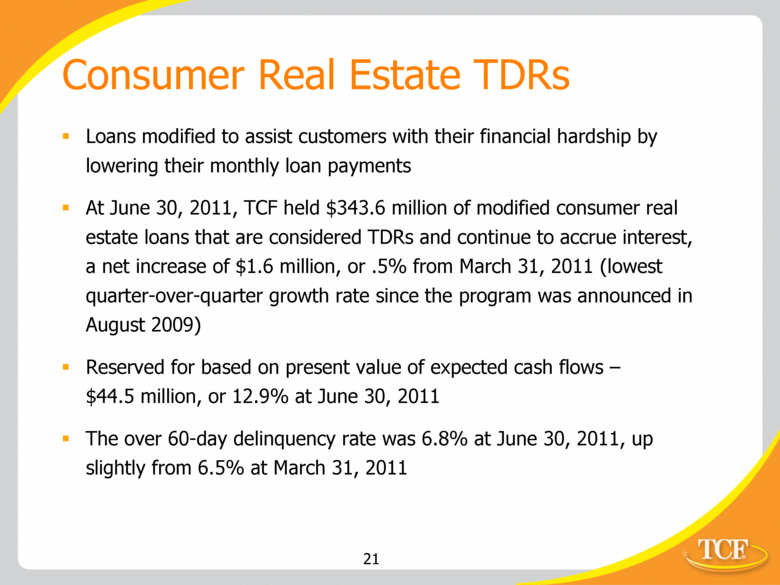
Consumer Real Estate TDRs Loans modified to assist customers with their financial hardship by lowering their monthly loan payments At June 30, 2011, TCF held $343.6 million of modified consumer real estate loans that are considered TDRs and continue to accrue interest, a net increase of $1.6 million, or .5% from March 31, 2011 (lowest quarter-over-quarter growth rate since the program was announced in August 2009) Reserved for based on present value of expected cash flows – $44.5 million, or 12.9% at June 30, 2011 The over 60-day delinquency rate was 6.8% at June 30, 2011, up slightly from 6.5% at March 31, 2011 |
|
|
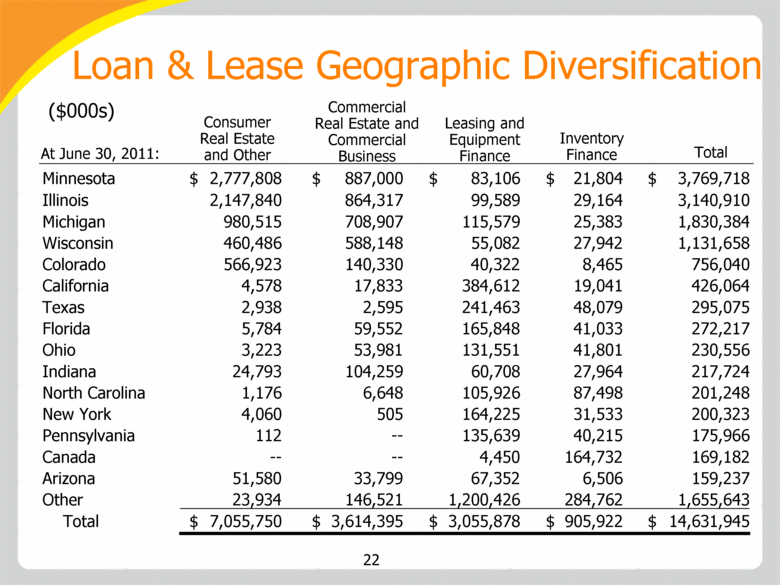
Loan & Lease Geographic Diversification Consumer Real Estate and Other At June 30, 2011: ($000s) Commercial Real Estate and Commercial Business Leasing and Equipment Finance Inventory Finance Total Minnesota $ 2,777,808 $ 887,000 $ 83,106 $ 21,804 $ 3,769,718 Illinois 2,147,840 864,317 99,589 29,164 3,140,910 Michigan 980,515 708,907 115,579 25,383 1,830,384 Wisconsin 460,486 588,148 55,082 27,942 1,131,658 Colorado 566,923 140,330 40,322 8,465 756,040 California 4,578 17,833 384,612 19,041 426,064 Texas 2,938 2,595 241,463 48,079 295,075 Florida 5,784 59,552 165,848 41,033 272,217 Ohio 3,223 53,981 131,551 41,801 230,556 Indiana 24,793 104,259 60,708 27,964 217,724 North Carolina 1,176 6,648 105,926 87,498 201,248 New York 4,060 505 164,225 31,533 200,323 Pennsylvania 112 -- 135,639 40,215 175,966 Canada -- -- 4,450 164,732 169,182 Arizona 51,580 33,799 67,352 6,506 159,237 Other 23,934 146,521 1,200,426 284,762 1,655,643 Total $ 7,055,750 $ 3,614,395 $ 3,055,878 $ 905,922 $ 14,631,945 22 |
|
|
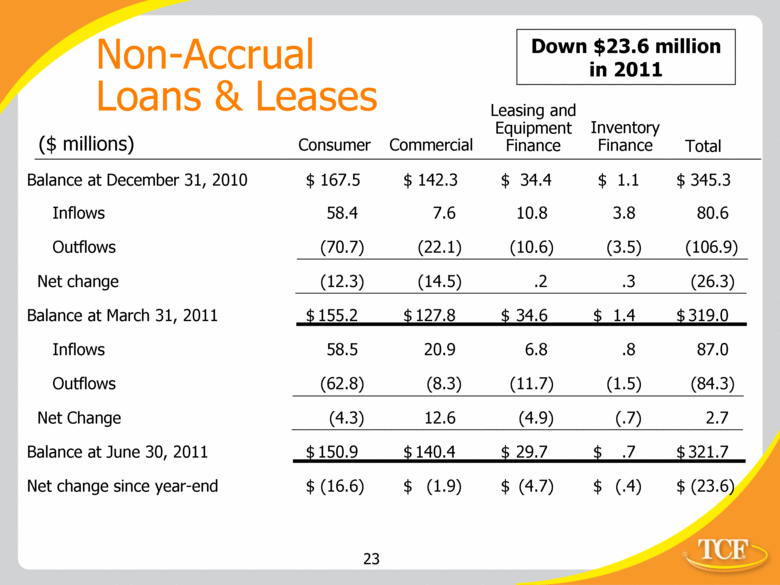
Non-Accrual Loans & Leases ($ millions) Consumer Commercial Leasing and Equipment Finance Inventory Finance Total Balance at December 31, 2010 $ 167.5 $ 142.3 $ 34.4 $ 1.1 $ 345.3 Inflows 58.4 7.6 10.8 3.8 80.6 Outflows (70.7) (22.1) (10.6) (3.5) (106.9) Net change (12.3) (14.5) .2 .3 (26.3) Balance at March 31, 2011 $ 155.2 $ 127.8 $ 34.6 $ 1.4 $ 319.0 Inflows 58.5 20.9 6.8 .8 87.0 Outflows (62.8) (8.3) (11.7) (1.5) (84.3) Net Change (4.3) 12.6 (4.9) (.7) 2.7 Balance at June 30, 2011 $ 150.9 $ 140.4 $ 29.7 $ .7 $ 321.7 Net change since year-end $ (16.6) $ (1.9) $ (4.7) $ (.4) $ (23.6) Down $23.6 million in 2011 |
|
|
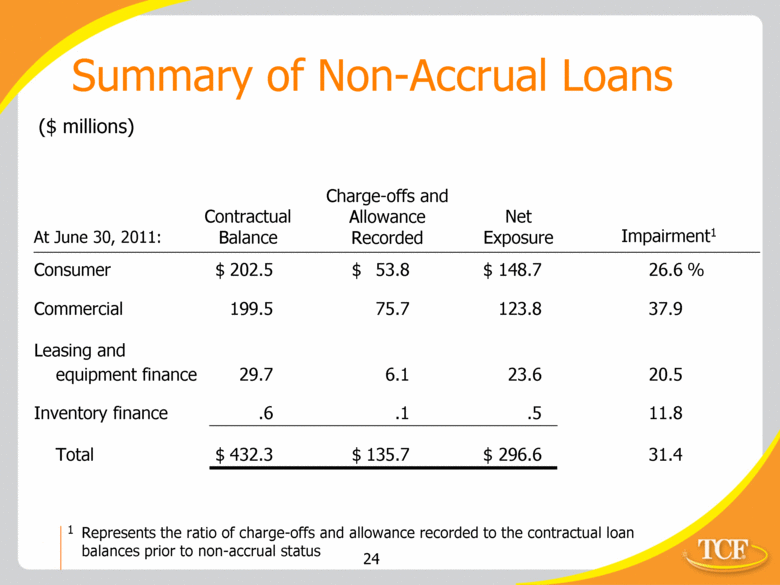
Summary of Non-Accrual Loans Charge-offs and Allowance Recorded Net Exposure Contractual Balance ($ millions) Impairment1 At June 30, 2011: Represents the ratio of charge-offs and allowance recorded to the contractual loan balances prior to non-accrual status 1 Consumer $ 202.5 $ 53.8 $ 148.7 26.6 % Commercial 199.5 75.7 123.8 37.9 Leasing and equipment finance 29.7 6.1 23.6 20.5 Inventory finance .6 .1 .5 11.8 Total $ 432.3 $ 135.7 $ 296.6 31.4 |
|
|
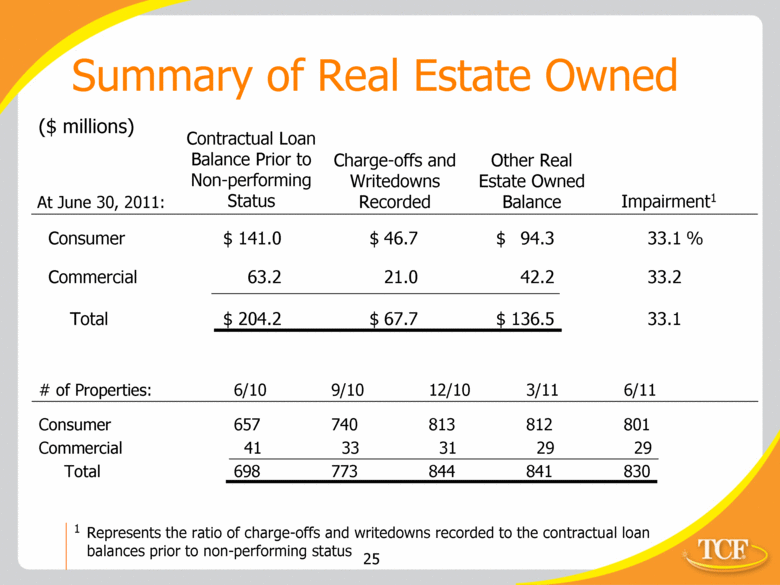
Summary of Real Estate Owned Charge-offs and Writedowns Recorded Other Real Estate Owned Balance ($ millions) Contractual Loan Balance Prior to Non-performing Status At June 30, 2011: Impairment1 Represents the ratio of charge-offs and writedowns recorded to the contractual loan balances prior to non-performing status 1 Consumer $ 141.0 $ 46.7 $ 94.3 33.1 % Commercial 63.2 21.0 42.2 33.2 Total $ 204.2 $ 67.7 $ 136.5 33.1 # of Properties: 6/10 9/10 12/10 3/11 6/11 Consumer 657 740 813 812 801 Commercial 41 33 31 29 29 Total 698 773 844 841 830 |
|
|
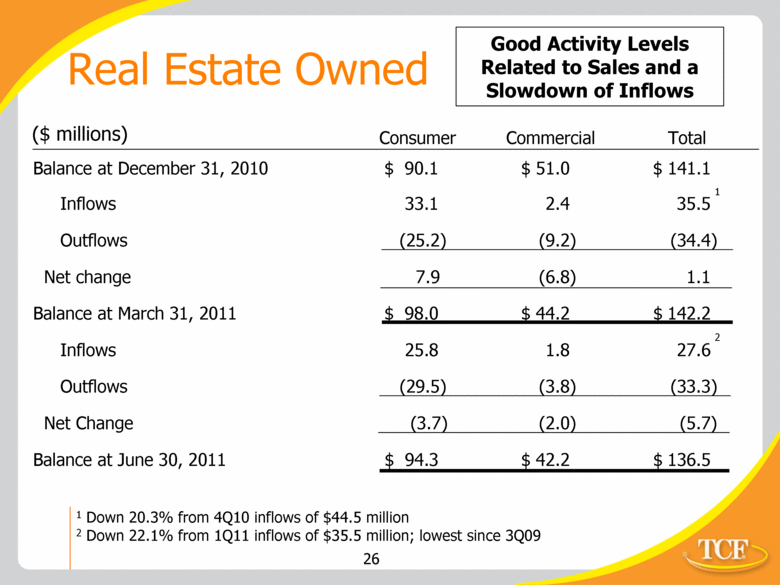
Real Estate Owned ($ millions) Consumer Commercial Total Good Activity Levels Related to Sales and a Slowdown of Inflows Balance at December 31, 2010 $ 90.1 $ 51.0 $ 141.1 Inflows 33.1 2.4 35.5 Outflows (25.2) (9.2) (34.4) Net change 7.9 (6.8) 1.1 Balance at March 31, 2011 $ 98.0 $ 44.2 $ 142.2 Inflows 25.8 1.8 27.6 Outflows (29.5) (3.8) (33.3) Net Change (3.7) (2.0) (5.7) Balance at June 30, 2011 $ 94.3 $ 42.2 $ 136.5 1 Down 20.3% from 4Q10 inflows of $44.5 million 2 Down 22.1% from 1Q11 inflows of $35.5 million; lowest since 3Q09 1 2 |
|
|
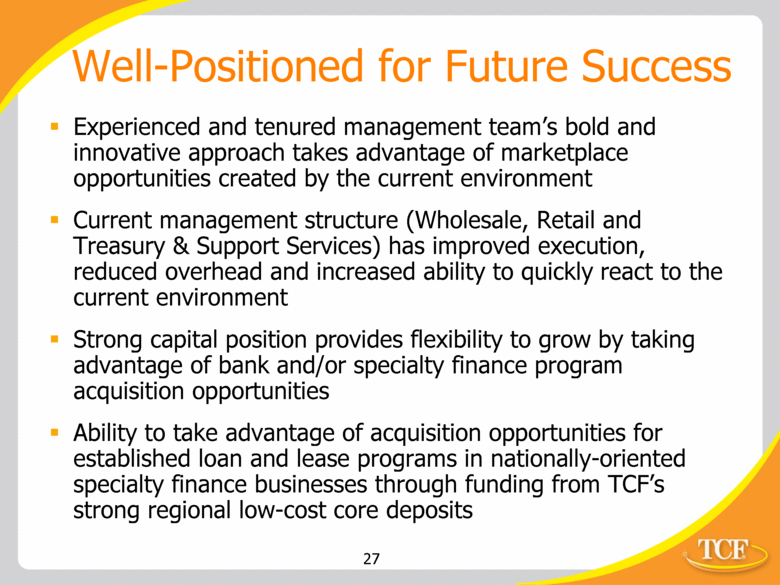
Well-Positioned for Future Success Experienced and tenured management team’s bold and innovative approach takes advantage of marketplace opportunities created by the current environment Current management structure (Wholesale, Retail and Treasury & Support Services) has improved execution, reduced overhead and increased ability to quickly react to the current environment Strong capital position provides flexibility to grow by taking advantage of bank and/or specialty finance program acquisition opportunities Ability to take advantage of acquisition opportunities for established loan and lease programs in nationally-oriented specialty finance businesses through funding from TCF’s strong regional low-cost core deposits |
|
|
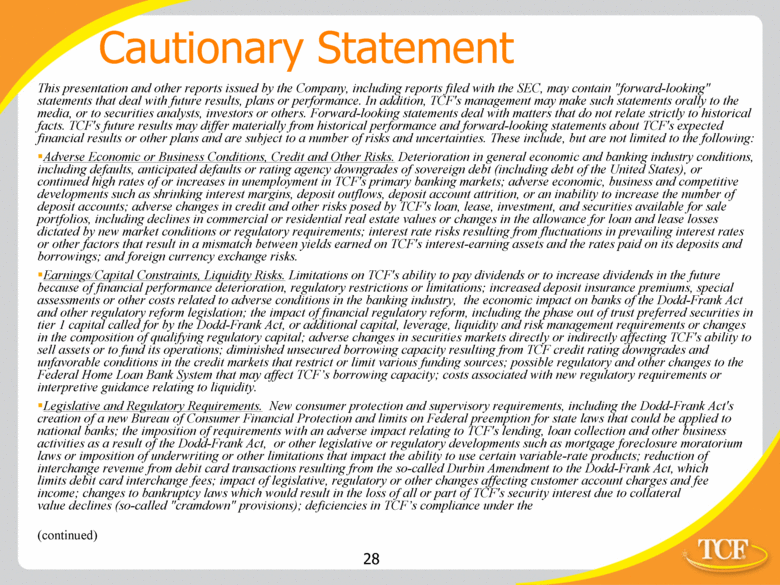
Cautionary Statement This presentation and other reports issued by the Company, including reports filed with the SEC, may contain "forward-looking" statements that deal with future results, plans or performance. In addition, TCF's management may make such statements orally to the media, or to securities analysts, investors or others. Forward-looking statements deal with matters that do not relate strictly to historical facts. TCF's future results may differ materially from historical performance and forward-looking statements about TCF's expected financial results or other plans and are subject to a number of risks and uncertainties. These include, but are not limited to the following: Adverse Economic or Business Conditions, Credit and Other Risks. Deterioration in general economic and banking industry conditions, including defaults, anticipated defaults or rating agency downgrades of sovereign debt (including debt of the United States), or continued high rates of or increases in unemployment in TCF's primary banking markets; adverse economic, business and competitive developments such as shrinking interest margins, deposit outflows, deposit account attrition, or an inability to increase the number of deposit accounts; adverse changes in credit and other risks posed by TCF's loan, lease, investment, and securities available for sale portfolios, including declines in commercial or residential real estate values or changes in the allowance for loan and lease losses dictated by new market conditions or regulatory requirements; interest rate risks resulting from fluctuations in prevailing interest rates or other factors that result in a mismatch between yields earned on TCF's interest-earning assets and the rates paid on its deposits and borrowings; and foreign currency exchange risks. Earnings/Capital Constraints, Liquidity Risks. Limitations on TCF's ability to pay dividends or to increase dividends in the future because of financial performance deterioration, regulatory restrictions or limitations; increased deposit insurance premiums, special assessments or other costs related to adverse conditions in the banking industry, the economic impact on banks of the Dodd-Frank Act and other regulatory reform legislation; the impact of financial regulatory reform, including the phase out of trust preferred securities in tier 1 capital called for by the Dodd-Frank Act, or additional capital, leverage, liquidity and risk management requirements or changes in the composition of qualifying regulatory capital; adverse changes in securities markets directly or indirectly affecting TCF's ability to sell assets or to fund its operations; diminished unsecured borrowing capacity resulting from TCF credit rating downgrades and unfavorable conditions in the credit markets that restrict or limit various funding sources; possible regulatory and other changes to the Federal Home Loan Bank System that may affect TCF’s borrowing capacity; costs associated with new regulatory requirements or interpretive guidance relating to liquidity. Legislative and Regulatory Requirements. New consumer protection and supervisory requirements, including the Dodd-Frank Act's creation of a new Bureau of Consumer Financial Protection and limits on Federal preemption for state laws that could be applied to national banks; the imposition of requirements with an adverse impact relating to TCF's lending, loan collection and other business activities as a result of the Dodd-Frank Act, or other legislative or regulatory developments such as mortgage foreclosure moratorium laws or imposition of underwriting or other limitations that impact the ability to use certain variable-rate products; reduction of interchange revenue from debit card transactions resulting from the so-called Durbin Amendment to the Dodd-Frank Act, which limits debit card interchange fees; impact of legislative, regulatory or other changes affecting customer account charges and fee income; changes to bankruptcy laws which would result in the loss of all or part of TCF's security interest due to collateral value declines (so-called "cramdown" provisions); deficiencies in TCF’s compliance under the (continued) |
|
|
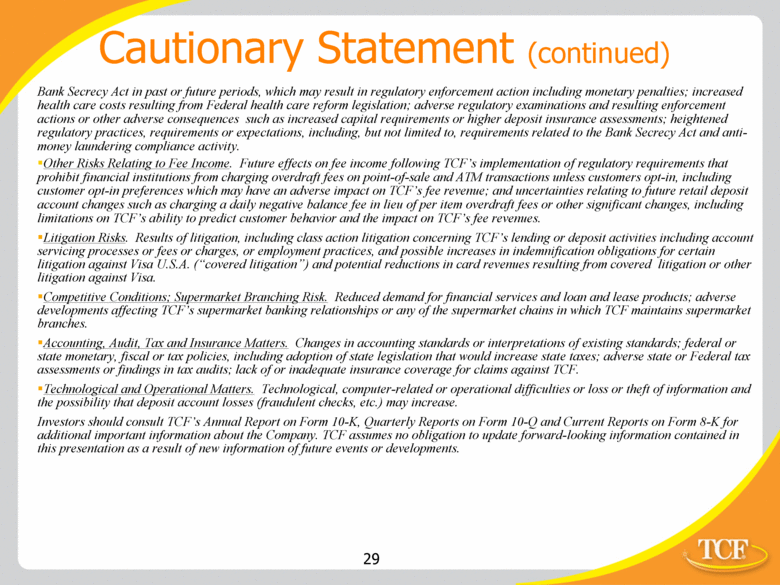
Cautionary Statement (continued) Bank Secrecy Act in past or future periods, which may result in regulatory enforcement action including monetary penalties; increased health care costs resulting from Federal health care reform legislation; adverse regulatory examinations and resulting enforcement actions or other adverse consequences such as increased capital requirements or higher deposit insurance assessments; heightened regulatory practices, requirements or expectations, including, but not limited to, requirements related to the Bank Secrecy Act and anti-money laundering compliance activity. Other Risks Relating to Fee Income. Future effects on fee income following TCF’s implementation of regulatory requirements that prohibit financial institutions from charging overdraft fees on point-of-sale and ATM transactions unless customers opt-in, including customer opt-in preferences which may have an adverse impact on TCF’s fee revenue; and uncertainties relating to future retail deposit account changes such as charging a daily negative balance fee in lieu of per item overdraft fees or other significant changes, including limitations on TCF’s ability to predict customer behavior and the impact on TCF’s fee revenues. Litigation Risks. Results of litigation, including class action litigation concerning TCF’s lending or deposit activities including account servicing processes or fees or charges, or employment practices, and possible increases in indemnification obligations for certain litigation against Visa U.S.A. (“covered litigation”) and potential reductions in card revenues resulting from covered litigation or other litigation against Visa. Competitive Conditions; Supermarket Branching Risk. Reduced demand for financial services and loan and lease products; adverse developments affecting TCF’s supermarket banking relationships or any of the supermarket chains in which TCF maintains supermarket branches. Accounting, Audit, Tax and Insurance Matters. Changes in accounting standards or interpretations of existing standards; federal or state monetary, fiscal or tax policies, including adoption of state legislation that would increase state taxes; adverse state or Federal tax assessments or findings in tax audits; lack of or inadequate insurance coverage for claims against TCF. Technological and Operational Matters. Technological, computer-related or operational difficulties or loss or theft of information and the possibility that deposit account losses (fraudulent checks, etc.) may increase. Investors should consult TCF’s Annual Report on Form 10-K, Quarterly Reports on Form 10-Q and Current Reports on Form 8-K for additional important information about the Company. TCF assumes no obligation to update forward-looking information contained in this presentation as a result of new information of future events or developments. |
|
|
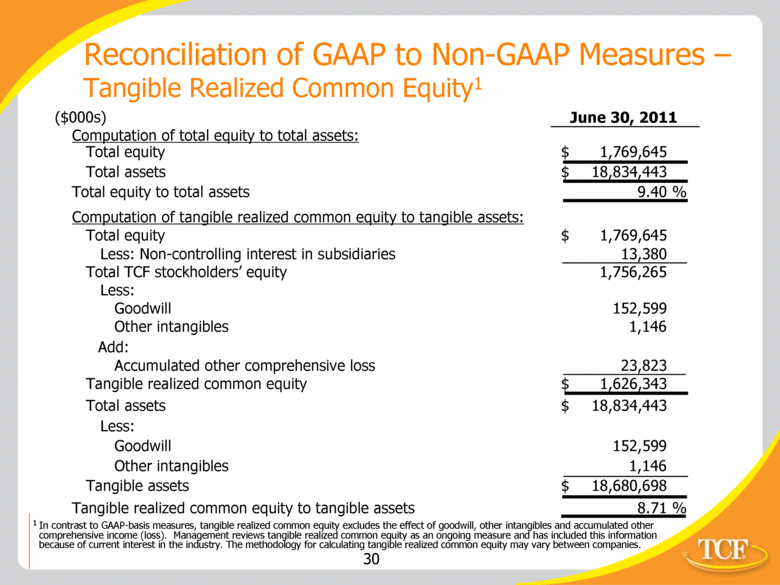
1 In contrast to GAAP-basis measures, tangible realized common equity excludes the effect of goodwill, other intangibles and accumulated other comprehensive income (loss). Management reviews tangible realized common equity as an ongoing measure and has included this information because of current interest in the industry. The methodology for calculating tangible realized common equity may vary between companies. Reconciliation of GAAP to Non-GAAP Measures –Tangible Realized Common Equity1 ($000s) June 30, 2011 Computation of total equity to total assets: Total equity $ 1,769,645 Total assets $ 18,834,443 Total equity to total assets 9.40 % Computation of tangible realized common equity to tangible assets: Total equity $ 1,769,645 Less: Non-controlling interest in subsidiaries 13,380 Total TCF stockholders’ equity 1,756,265 Less: Goodwill 152,599 Other intangibles 1,146 Add: Accumulated other comprehensive loss 23,823 Tangible realized common equity $ 1,626,343 Total assets $ 18,834,443 Less: Goodwill 152,599 Other intangibles 1,146 Tangible assets $ 18,680,698 Tangible realized common equity to tangible assets 8.71 % |
|
|
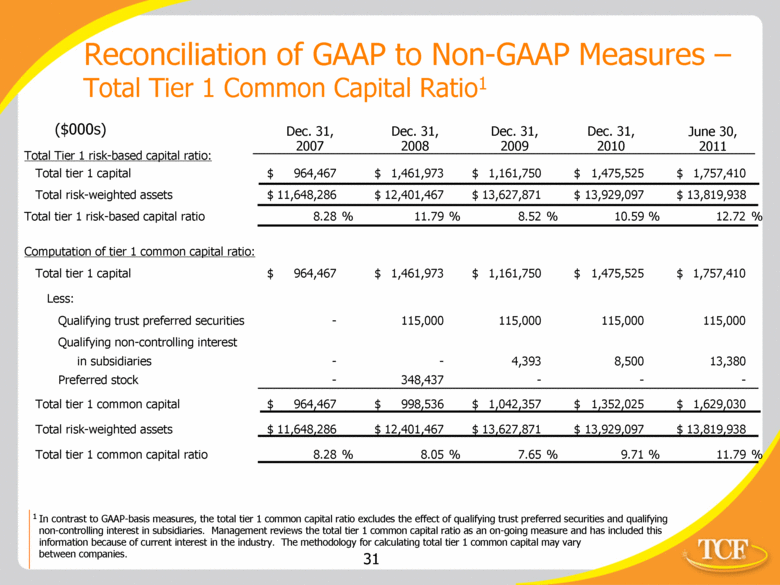
June 30, 2011 1 In contrast to GAAP-basis measures, the total tier 1 common capital ratio excludes the effect of qualifying trust preferred securities and qualifying non-controlling interest in subsidiaries. Management reviews the total tier 1 common capital ratio as an on-going measure and has included this information because of current interest in the industry. The methodology for calculating total tier 1 common capital may vary between companies. Reconciliation of GAAP to Non-GAAP Measures – Total Tier 1 Common Capital Ratio1 ($000s) Dec. 31, 2010 Dec. 31, 2009 Dec. 31, 2008 Dec. 31, 2007 Total Tier 1 risk-based capital ratio: Total tier 1 capital $ 964,467 $ 1,461,973 $ 1,161,750 $ 1,475,525 $ 1,757,410 Total risk-weighted assets $ 11,648,286 $ 12,401,467 $ 13,627,871 $ 13,929,097 $ 13,819,938 Total tier 1 risk-based capital ratio 8.28 % 11.79 % 8.52 % 10.59 % 12.72 % Computation of tier 1 common capital ratio: Total tier 1 capital $ 964,467 $ 1,461,973 $ 1,161,750 $ 1,475,525 $ 1,757,410 Less: Qualifying trust preferred securities - 115,000 115,000 115,000 115,000 Qualifying non-controlling interest in subsidiaries - - 4,393 8,500 13,380 Preferred stock - 348,437 - - - Total tier 1 common capital $ 964,467 $ 998,536 $ 1,042,357 $ 1,352,025 $ 1,629,030 Total risk-weighted assets $ 11,648,286 $ 12,401,467 $ 13,627,871 $ 13,929,097 $ 13,819,938 Total tier 1 common capital ratio 8.28 % 8.05 % 7.65 % 9.71 % 11.79 % |
|
|
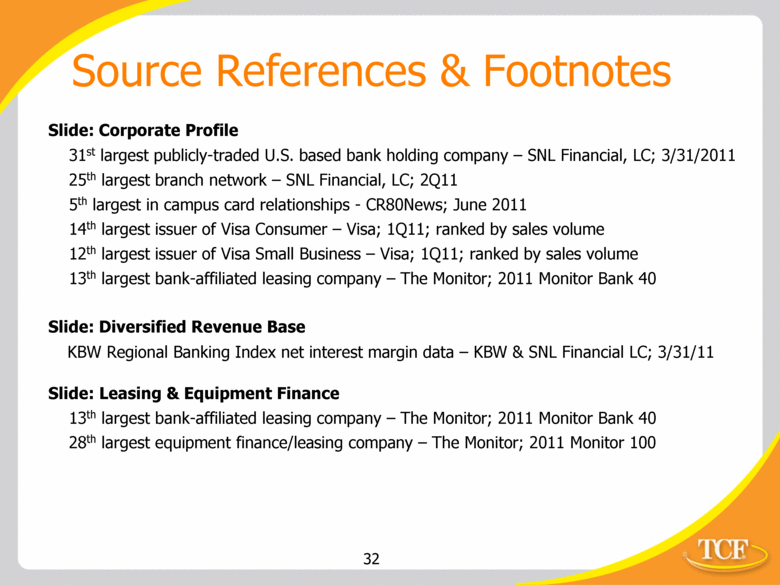
Source References & Footnotes Slide: Corporate Profile 31st largest publicly-traded U.S. based bank holding company – SNL Financial, LC; 3/31/2011 25th largest branch network – SNL Financial, LC; 2Q11 5th largest in campus card relationships - CR80News; June 2011 14th largest issuer of Visa Consumer – Visa; 1Q11; ranked by sales volume 12th largest issuer of Visa Small Business – Visa; 1Q11; ranked by sales volume 13th largest bank-affiliated leasing company – The Monitor; 2011 Monitor Bank 40 Slide: Diversified Revenue Base KBW Regional Banking Index net interest margin data – KBW & SNL Financial LC; 3/31/11 Slide: Leasing & Equipment Finance 13th largest bank-affiliated leasing company – The Monitor; 2011 Monitor Bank 40 28th largest equipment finance/leasing company – The Monitor; 2011 Monitor 100 |

