Attached files
| file | filename |
|---|---|
| 8-K - FORM 8-K - Oasis Petroleum Inc. | h77725e8vk.htm |
| EX-99.1 - EX-99.1 - Oasis Petroleum Inc. | h77725exv99w1.htm |
Exhibit 99.2

| November 2010 Oasis Petroleum Investor Presentation |
| Forward-Looking Statements This presentation contains forward-looking statements within the meaning of Section 27A of the Securities Act of 1933 and Section 21E of the Securities Exchange Act of 1934. All statements, other than statements of historical facts, included in this presentation that address activities, events or developments that the Company expects, believes or anticipates will or may occur in the future are forward-looking statements. Without limiting the generality of the foregoing, forward-looking statements contained in this presentation specifically include the expectations of plans, strategies, objectives and anticipated financial and operating results of the Company, including the Company's drilling program, production, derivatives activities, capital expenditure levels and other guidance included in this presentation. These statements are based on certain assumptions made by the Company based on management's experience and perception of historical trends, current conditions, anticipated future developments and other factors believed to be appropriate. Such statements are subject to a number of assumptions, risks and uncertainties, many of which are beyond the control of the Company, which may cause actual results to differ materially from those implied or expressed by the forward-looking statements. These include changes in oil and natural gas prices, the timing of planned capital expenditures, availability of acquisitions, uncertainties in estimating proved reserves and forecasting production results, operational factors affecting the commencement or maintenance of producing wells, the condition of the capital markets generally, as well as the Company's ability to access them, the proximity to and capacity of transportation facilities, and uncertainties regarding environmental regulations or litigation and other legal or regulatory developments affecting the Company's business and other important factors that could cause actual results to differ materially from those projected as described in the Company's reports filed with the SEC. Any forward-looking statement speaks only as of the date on which such statement is made and the Company undertakes no obligation to correct or update any forward-looking statement, whether as a result of new information, future events or otherwise, except as required by applicable law. |
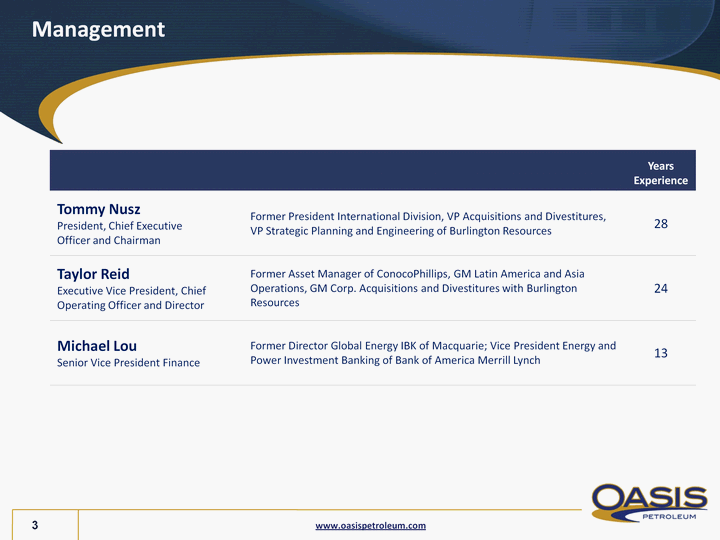
| Management Years Experience Tommy NuszPresident, Chief Executive Officer and Chairman Former President International Division, VP Acquisitions and Divestitures, VP Strategic Planning and Engineering of Burlington Resources 28 Taylor ReidExecutive Vice President, Chief Operating Officer and Director Former Asset Manager of ConocoPhillips, GM Latin America and Asia Operations, GM Corp. Acquisitions and Divestitures with Burlington Resources 24 Michael LouSenior Vice President Finance Former Director Global Energy IBK of Macquarie; Vice President Energy and Power Investment Banking of Bank of America Merrill Lynch 13 |
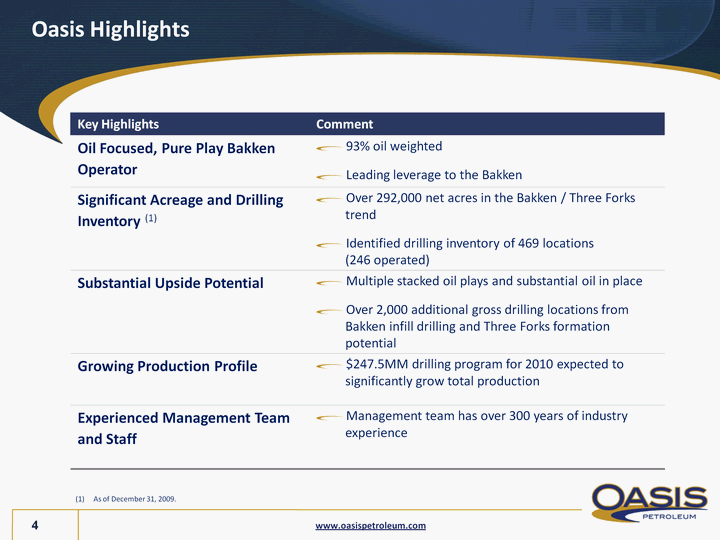
| As of December 31, 2009. Oasis Highlights Key Highlights Comment Oil Focused, Pure Play Bakken Operator 93% oil weightedLeading leverage to the Bakken Significant Acreage and Drilling Inventory (1) Over 292,000 net acres in the Bakken / Three Forks trendIdentified drilling inventory of 469 locations (246 operated) Substantial Upside Potential Multiple stacked oil plays and substantial oil in placeOver 2,000 additional gross drilling locations from Bakken infill drilling and Three Forks formation potential Growing Production Profile $247.5MM drilling program for 2010 expected to significantly grow total production Experienced Management Team and Staff Management team has over 300 years of industry experience |
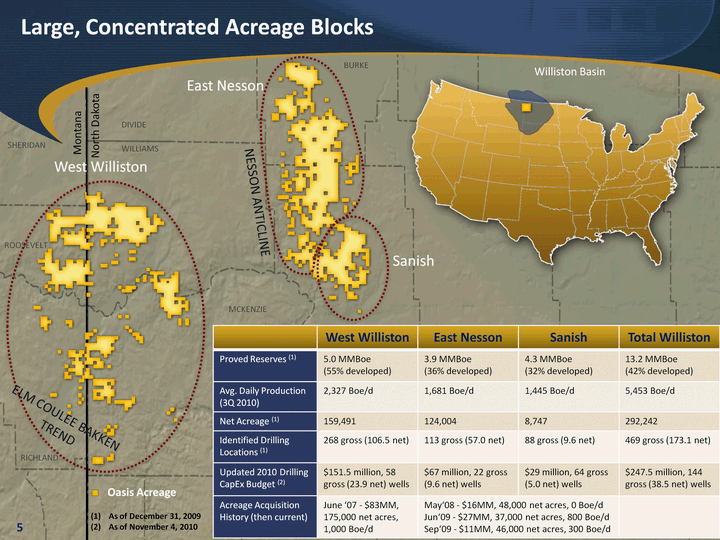
| 5 As of December 31, 2009 As of November 4, 2010 Williston Basin SHERIDAN MCKENZIE WILLIAMS BURKE East Nesson West Williston RICHLAND ROOSEVELT Sanish DIVIDE NESSON ANTICLINE ELM COULEE BAKKEN TREND Oasis Acreage Large, Concentrated Acreage Blocks Montana North Dakota West Williston East Nesson Sanish Total Williston Proved Reserves (1) 5.0 MMBoe (55% developed) 3.9 MMBoe (36% developed) 4.3 MMBoe (32% developed) 13.2 MMBoe (42% developed) Avg. Daily Production (3Q 2010) 2,327 Boe/d 1,681 Boe/d 1,445 Boe/d 5,453 Boe/d Net Acreage (1) 159,491 124,004 8,747 292,242 Identified Drilling Locations (1) 268 gross (106.5 net) 113 gross (57.0 net) 88 gross (9.6 net) 469 gross (173.1 net) Updated 2010 Drilling CapEx Budget (2) $151.5 million, 58 gross (23.9 net) wells $67 million, 22 gross (9.6 net) wells $29 million, 64 gross (5.0 net) wells $247.5 million, 144 gross (38.5 net) wells Acreage Acquisition History (then current) June '07 - $83MM,175,000 net acres,1,000 Boe/d May'08 - $16MM, 48,000 net acres, 0 Boe/dJun'09 - $27MM, 37,000 net acres, 800 Boe/dSep'09 - $11MM, 46,000 net acres, 300 Boe/d May'08 - $16MM, 48,000 net acres, 0 Boe/dJun'09 - $27MM, 37,000 net acres, 800 Boe/dSep'09 - $11MM, 46,000 net acres, 300 Boe/d |
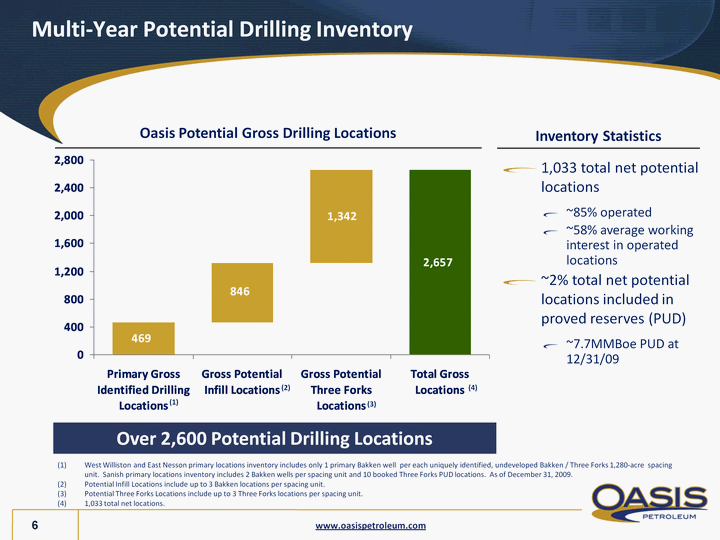
| Multi-Year Potential Drilling Inventory Oasis Potential Gross Drilling Locations Drivers Inc Primary Gross Identified Drilling Locations 469 Gross Potential Infill Locations 469 846 Gross Potential Three Forks Locations 1315 1342 Total Gross Locations 2657 Over 2,600 Potential Drilling Locations (4) West Williston and East Nesson primary locations inventory includes only 1 primary Bakken well per each uniquely identified, undeveloped Bakken / Three Forks 1,280-acre spacing unit. Sanish primary locations inventory includes 2 Bakken wells per spacing unit and 10 booked Three Forks PUD locations. As of December 31, 2009. Potential Infill Locations include up to 3 Bakken locations per spacing unit. Potential Three Forks Locations include up to 3 Three Forks locations per spacing unit. 1,033 total net locations. (3) (2) (1) 1,033 total net potential locations ~85% operated ~58% average working interest in operated locations ~2% total net potential locations included in proved reserves (PUD) ~7.7MMBoe PUD at 12/31/09 Inventory Statistics |
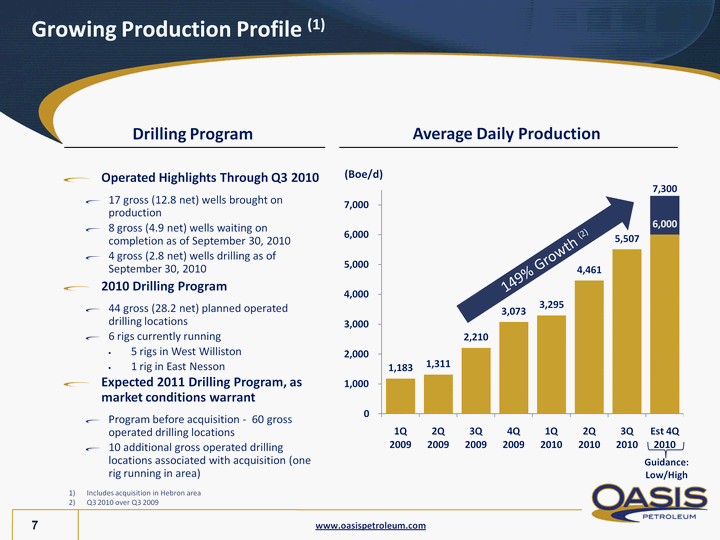
| Growing Production Profile (1) Average Daily Production Operated Highlights Through Q3 2010 17 gross (12.8 net) wells brought on production 8 gross (4.9 net) wells waiting on completion as of September 30, 2010 4 gross (2.8 net) wells drilling as of September 30, 2010 2010 Drilling Program 44 gross (28.2 net) planned operated drilling locations 6 rigs currently running 5 rigs in West Williston 1 rig in East Nesson Expected 2011 Drilling Program, as market conditions warrant Program before acquisition - 60 gross operated drilling locations 10 additional gross operated drilling locations associated with acquisition (one rig running in area) Drilling Program 149% Growth (2) Includes acquisition in Hebron area Q3 2010 over Q3 2009 (CHART) (Boe/d) Guidance: Low/High |
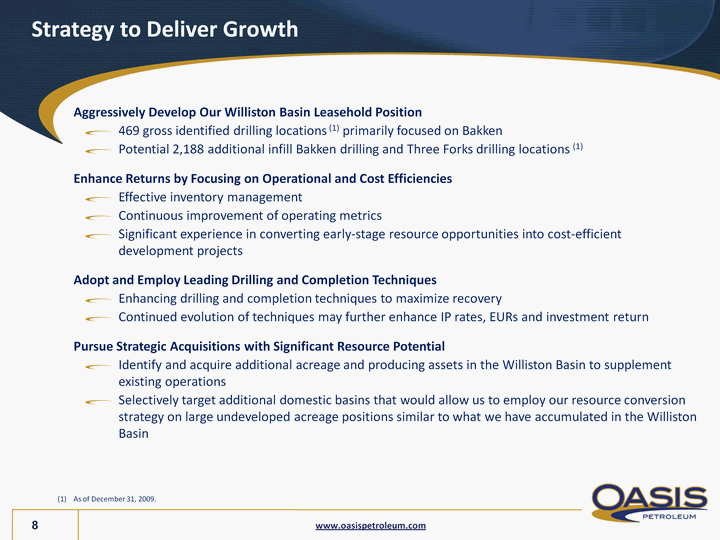
| Aggressively Develop Our Williston Basin Leasehold Position 469 gross identified drilling locations (1) primarily focused on Bakken Potential 2,188 additional infill Bakken drilling and Three Forks drilling locations (1) Enhance Returns by Focusing on Operational and Cost Efficiencies Effective inventory management Continuous improvement of operating metrics Significant experience in converting early-stage resource opportunities into cost-efficient development projects Adopt and Employ Leading Drilling and Completion Techniques Enhancing drilling and completion techniques to maximize recovery Continued evolution of techniques may further enhance IP rates, EURs and investment return Pursue Strategic Acquisitions with Significant Resource Potential Identify and acquire additional acreage and producing assets in the Williston Basin to supplement existing operations Selectively target additional domestic basins that would allow us to employ our resource conversion strategy on large undeveloped acreage positions similar to what we have accumulated in the Williston Basin As of December 31, 2009. Strategy to Deliver Growth |
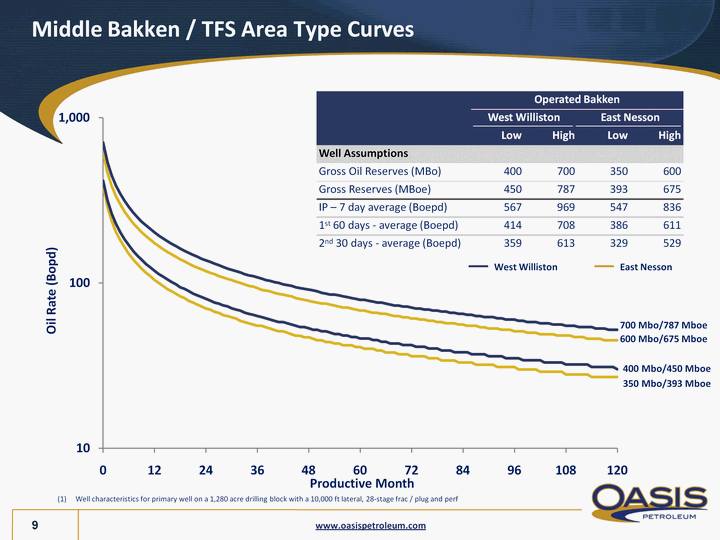
| Middle Bakken / TFS Area Type Curves Operated Bakken Operated Bakken Operated Bakken Operated Bakken West Williston West Williston East Nesson East Nesson Low High Low High Well Assumptions Gross Oil Reserves (MBo) 400 700 350 600 Gross Reserves (MBoe) 450 787 393 675 IP - 7 day average (Boepd) 567 969 547 836 1st 60 days - average (Boepd) 414 708 386 611 2nd 30 days - average (Boepd) 359 613 329 529 Well characteristics for primary well on a 1,280 acre drilling block with a 10,000 ft lateral, 28-stage frac / plug and perf Oil Rate (Bopd) Productive Month (CHART) 700 Mbo/787 Mboe 600 Mbo/675 Mboe 400 Mbo/450 Mboe 350 Mbo/393 Mboe West Williston East Nesson |
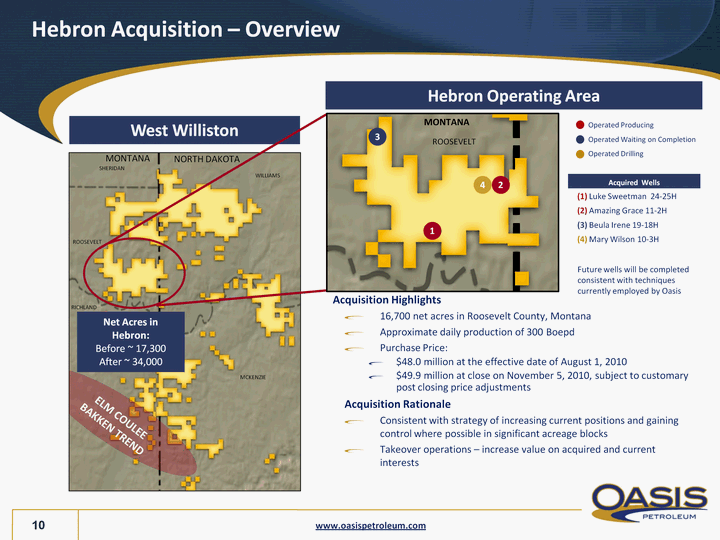
| West Williston Hebron Acquisition - Overview WILLIAMS MCKENZIE SHERIDAN MONTANA NORTH DAKOTA ELM COULEE BAKKEN TREND RICHLAND ROOSEVELT Hebron Operating Area Operated Producing Operated Waiting on Completion Operated Drilling Acquired Wells Acquired Wells (1) Luke Sweetman 24-25H (2) Amazing Grace 11-2H (3) Beula Irene 19-18H (4) Mary Wilson 10-3H Future wells will be completed consistent with techniques currently employed by Oasis Future wells will be completed consistent with techniques currently employed by Oasis Acquisition Highlights 16,700 net acres in Roosevelt County, Montana Approximate daily production of 300 Boepd Purchase Price: $48.0 million at the effective date of August 1, 2010 $49.9 million at close on November 5, 2010, subject to customary post closing price adjustments Acquisition Rationale Consistent with strategy of increasing current positions and gaining control where possible in significant acreage blocks Takeover operations - increase value on acquired and current interests Net Acres in Hebron: Before ~ 17,300 After ~ 34,000 ROOSEVELT 3 1 2 4 MONTANA |
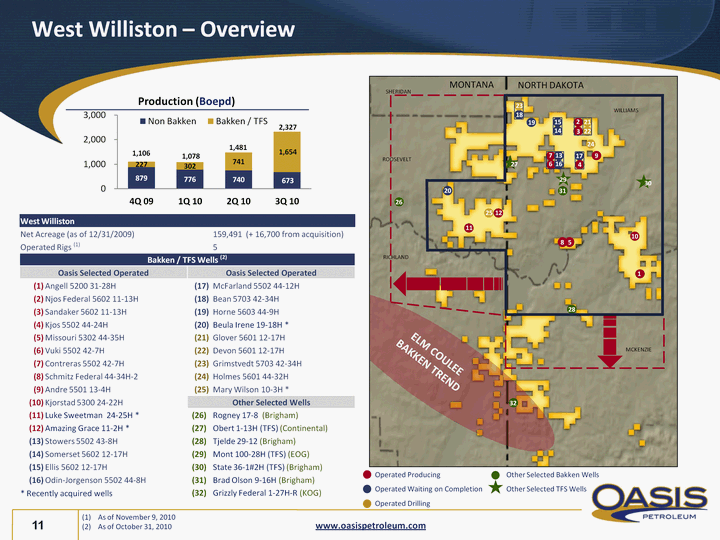
| West Williston - Overview (CHART) Production (Boepd) WILLIAMS MCKENZIE SHERIDAN MONTANA NORTH DAKOTA ELM COULEE BAKKEN TREND 27 1 2 26 28 5 As of November 9, 2010 As of October 31, 2010 8 RICHLAND ROOSEVELT 1,106 1,078 1,481 7 13 6 16 29 31 Operated Producing Other Selected Bakken Wells Operated Waiting on Completion Other Selected TFS Wells Operated Drilling 32 3 18 19 9 17 4 10 22 20 11 12 25 30 21 23 15 14 24 West Williston West Williston West Williston West Williston Net Acreage (as of 12/31/2009) Net Acreage (as of 12/31/2009) 159,491 (+ 16,700 from acquisition) Operated Rigs (1) Operated Rigs (1) 5 Bakken / TFS Wells (2) Bakken / TFS Wells (2) Bakken / TFS Wells (2) Bakken / TFS Wells (2) Oasis Selected Operated Oasis Selected Operated Oasis Selected Operated Oasis Selected Operated (1) Angell 5200 31-28H (17) McFarland 5502 44-12H (2) Njos Federal 5602 11-13H (18) Bean 5703 42-34H (3) Sandaker 5602 11-13H (19) Horne 5603 44-9H (4) Kjos 5502 44-24H (20) Beula Irene 19-18H * (5) Missouri 5302 44-35H (21) Glover 5601 12-17H (6) Vuki 5502 42-7H (22) Devon 5601 12-17H (7) Contreras 5502 42-7H (23) Grimstvedt 5703 42-34H (8) Schmitz Federal 44-34H-2 (24) Holmes 5601 44-32H (9) Andre 5501 13-4H (25) Mary Wilson 10-3H * (10) Kjorstad 5300 24-22H Other Selected Wells Other Selected Wells (11) Luke Sweetman 24-25H * (26) Rogney 17-8 (Brigham) (12) Amazing Grace 11-2H * (27) Obert 1-13H (TFS) (Continental) (13) Stowers 5502 43-8H (28) Tjelde 29-12 (Brigham) (14) Somerset 5602 12-17H (29) Mont 100-28H (TFS) (EOG) (15) Ellis 5602 12-17H (30) State 36-1#2H (TFS) (Brigham) (16) Odin-Jorgenson 5502 44-8H (31) Brad Olson 9-16H (Brigham) * Recently acquired wells * Recently acquired wells (32) Grizzly Federal 1-27H-R (KOG) 2,327 |
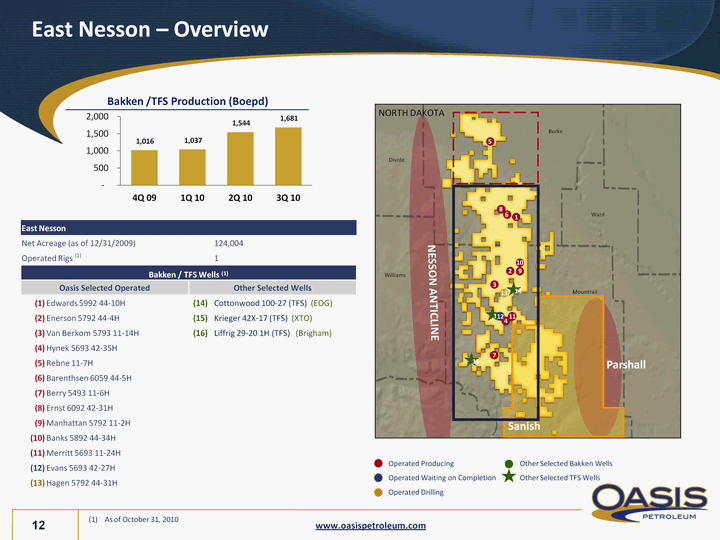
| East Nesson - Overview 1 2 3 5 6 15 NORTH DAKOTA Divide Burke Ward Williams Mountrail NESSON ANTICLINE Sanish Parshall 16 14 7 8 Bakken /TFS Production (Boepd) As of October 31, 2010 (CHART) 9 10 East Nesson East Nesson East Nesson East Nesson Net Acreage (as of 12/31/2009) Net Acreage (as of 12/31/2009) 124,004 Operated Rigs (1) Operated Rigs (1) 1 Bakken / TFS Wells (1) Bakken / TFS Wells (1) Bakken / TFS Wells (1) Bakken / TFS Wells (1) Oasis Selected Operated Oasis Selected Operated Other Selected Wells Other Selected Wells (1) Edwards 5992 44-10H (14) Cottonwood 100-27 (TFS) (EOG) (2) Enerson 5792 44-4H (15) Krieger 42X-17 (TFS) (XTO) (3) Van Berkom 5793 11-14H (16) Liffrig 29-20 1H (TFS) (Brigham) (4) Hynek 5693 42-35H (5) Rebne 11-7H (6) Barenthsen 6059 44-5H (7) Berry 5493 11-6H (8) Ernst 6092 42-31H (9) Manhattan 5792 11-2H (10) Banks 5892 44-34H (11) Merritt 5693 11-24H (12) Evans 5693 42-27H (13) Hagen 5792 44-31H Operated Producing Other Selected Bakken Wells Operated Waiting on Completion Other Selected TFS Wells Operated Drilling 11 4 12 13 |
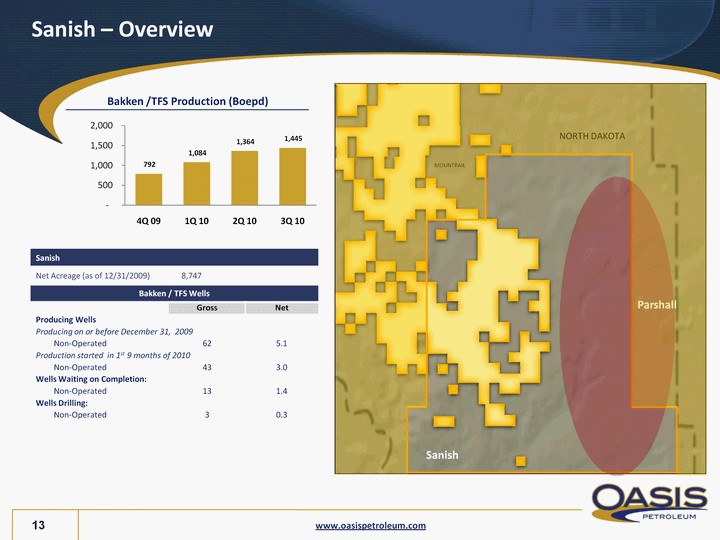
| Sanish - Overview NORTH DAKOTA MOUNTRAIL Parshall Sanish Sanish Sanish Sanish Sanish Net Acreage (as of 12/31/2009) Net Acreage (as of 12/31/2009) 8,747 8,747 Bakken / TFS Wells Bakken / TFS Wells Bakken / TFS Wells Bakken / TFS Wells Gross Gross Net Producing Wells Producing on or before December 31, 2009 Producing on or before December 31, 2009 Producing on or before December 31, 2009 Non-Operated 62 62 5.1 Production started in 1st 9 months of 2010 Production started in 1st 9 months of 2010 Production started in 1st 9 months of 2010 Non-Operated 43 43 3.0 Wells Waiting on Completion: Wells Waiting on Completion: Wells Waiting on Completion: Non-Operated 13 13 1.4 Wells Drilling: Wells Drilling: Wells Drilling: Non-Operated 3 3 0.3 (CHART) Bakken /TFS Production (Boepd) |
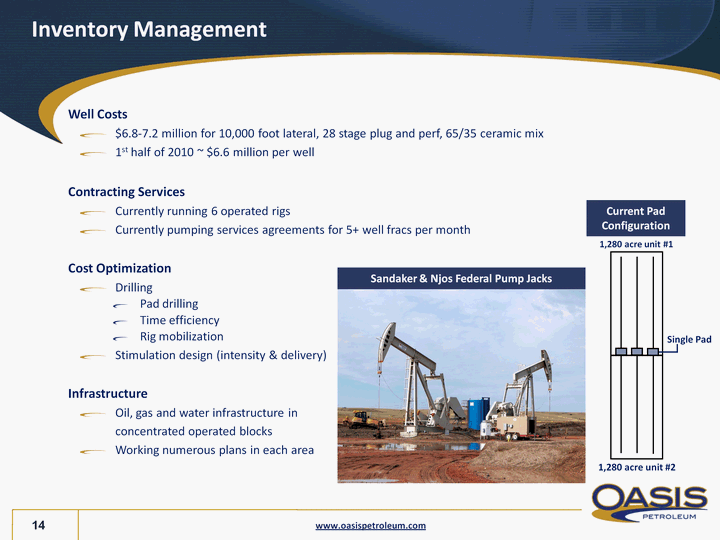
| Inventory Management Well Costs $6.8-7.2 million for 10,000 foot lateral, 28 stage plug and perf, 65/35 ceramic mix 1st half of 2010 ~ $6.6 million per well Contracting Services Currently running 6 operated rigs Currently pumping services agreements for 5+ well fracs per month Cost Optimization Drilling Pad drilling Time efficiency Rig mobilization Stimulation design (intensity & delivery) Infrastructure Oil, gas and water infrastructure in concentrated operated blocks Working numerous plans in each area Current Pad Configuration Single Pad 1,280 acre unit #2 1,280 acre unit #1 Sandaker & Njos Federal Pump Jacks |
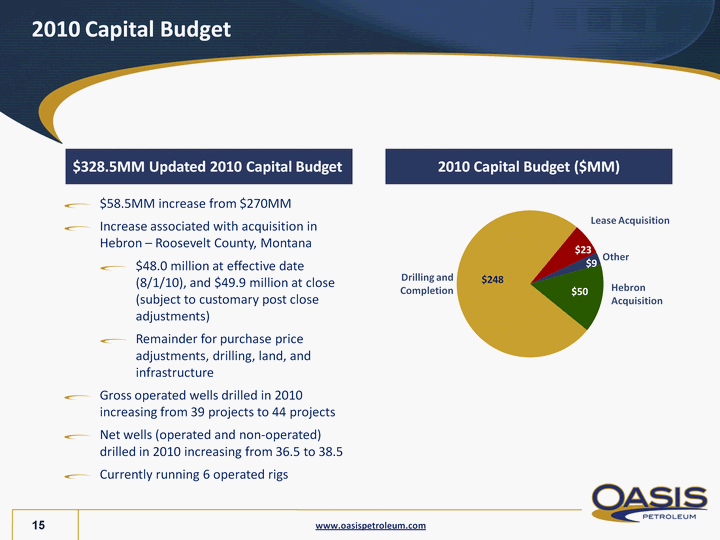
| 2010 Capital Budget $58.5MM increase from $270MM Increase associated with acquisition in Hebron - Roosevelt County, Montana $48.0 million at effective date (8/1/10), and $49.9 million at close (subject to customary post close adjustments) Remainder for purchase price adjustments, drilling, land, and infrastructure Gross operated wells drilled in 2010 increasing from 39 projects to 44 projects Net wells (operated and non-operated) drilled in 2010 increasing from 36.5 to 38.5 Currently running 6 operated rigs 2010 Capital Budget ($MM) (CHART) Drilling and Completion Lease Acquisition Other $328.5MM Updated 2010 Capital Budget Hebron Acquisition |
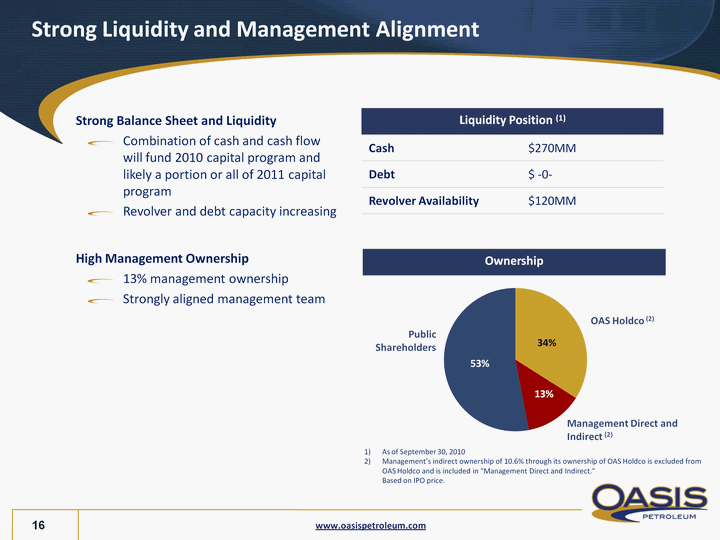
| Strong Liquidity and Management Alignment Liquidity Position (1) Liquidity Position (1) Cash $270MM Debt $ -0- Revolver Availability $120MM Ownership (CHART) Public Shareholders OAS Holdco (2) Management Direct and Indirect (2) 1) As of September 30, 2010 Management's indirect ownership of 10.6% through its ownership of OAS Holdco is excluded from OAS Holdco and is included in "Management Direct and Indirect." Based on IPO price. Strong Balance Sheet and Liquidity Combination of cash and cash flow will fund 2010 capital program and likely a portion or all of 2011 capital program Revolver and debt capacity increasing High Management Ownership 13% management ownership Strongly aligned management team |
| Investment Highlights Oil focused, pure play in the Williston Basin Large, concentrated acreage position with identified drilling inventory Substantial upside potential with known catalysts Growing production profile Management with resource play execution experience |
| Appendix |
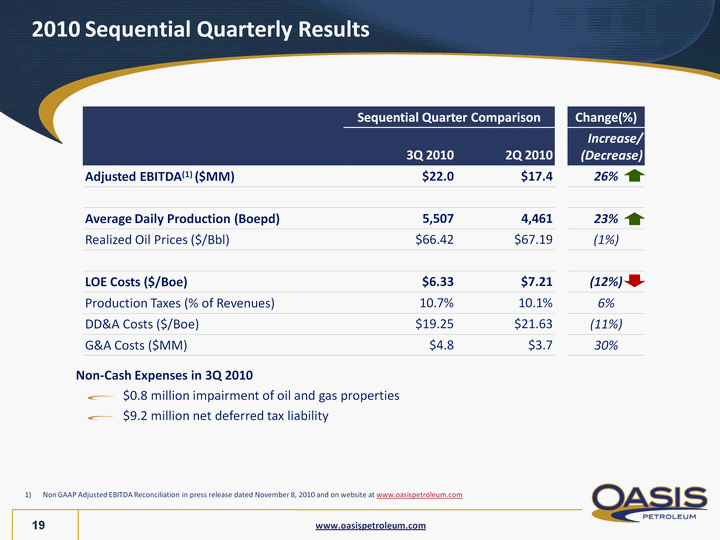
| 2010 Sequential Quarterly Results Sequential Quarter Comparison Sequential Quarter Comparison Change(%) 3Q 2010 2Q 2010 Increase/ (Decrease) Adjusted EBITDA(1) ($MM) $22.0 $17.4 26% Average Daily Production (Boepd) 5,507 4,461 23% Realized Oil Prices ($/Bbl) $66.42 $67.19 (1%) LOE Costs ($/Boe) $6.33 $7.21 (12%) Production Taxes (% of Revenues) 10.7% 10.1% 6% DD&A Costs ($/Boe) $19.25 $21.63 (11%) G&A Costs ($MM) $4.8 $3.7 30% Non GAAP Adjusted EBITDA Reconciliation in press release dated November 8, 2010 and on website at www.oasispetroleum.com Non-Cash Expenses in 3Q 2010 $0.8 million impairment of oil and gas properties $9.2 million net deferred tax liability |
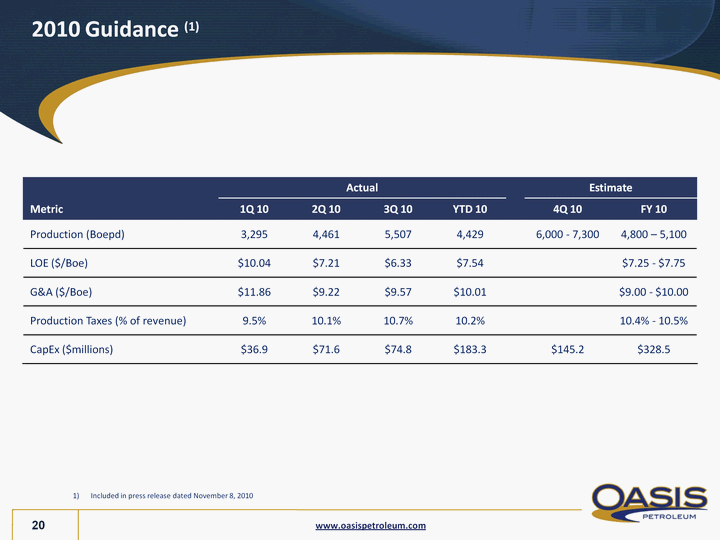
| 2010 Guidance (1) Actual Actual Actual Actual Estimate Estimate Metric 1Q 10 2Q 10 3Q 10 YTD 10 4Q 10 FY 10 Production (Boepd) 3,295 4,461 5,507 4,429 6,000 - 7,300 4,800 - 5,100 LOE ($/Boe) $10.04 $7.21 $6.33 $7.54 $7.25 - $7.75 G&A ($/Boe) $11.86 $9.22 $9.57 $10.01 $9.00 - $10.00 Production Taxes (% of revenue) 9.5% 10.1% 10.7% 10.2% 10.4% - 10.5% CapEx ($millions) $36.9 $71.6 $74.8 $183.3 $145.2 $328.5 Included in press release dated November 8, 2010 |
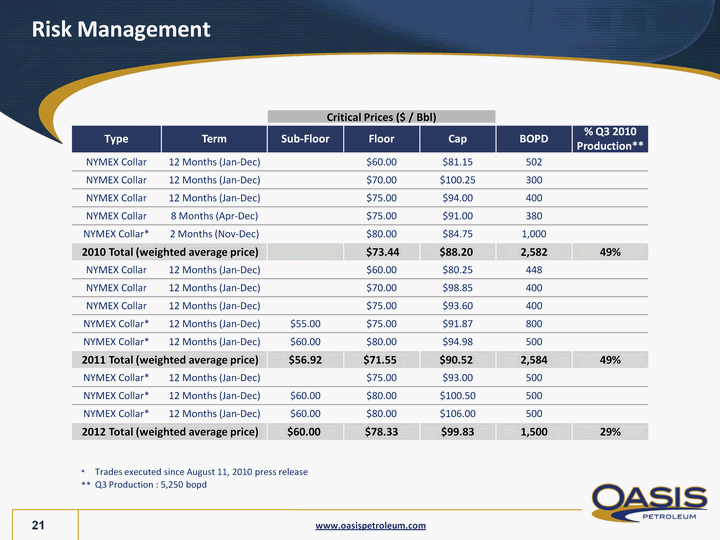
| Risk Management Critical Prices ($ / Bbl) Critical Prices ($ / Bbl) Critical Prices ($ / Bbl) Type Term Sub-Floor Floor Cap BOPD % Q3 2010 Production** NYMEX Collar 12 Months (Jan-Dec) $60.00 $81.15 502 NYMEX Collar 12 Months (Jan-Dec) $70.00 $100.25 300 NYMEX Collar 12 Months (Jan-Dec) $75.00 $94.00 400 NYMEX Collar 8 Months (Apr-Dec) $75.00 $91.00 380 NYMEX Collar* 2 Months (Nov-Dec) $80.00 $84.75 1,000 2010 Total (weighted average price) 2010 Total (weighted average price) $73.44 $88.20 2,582 49% NYMEX Collar 12 Months (Jan-Dec) $60.00 $80.25 448 NYMEX Collar 12 Months (Jan-Dec) $70.00 $98.85 400 NYMEX Collar 12 Months (Jan-Dec) $75.00 $93.60 400 NYMEX Collar* 12 Months (Jan-Dec) $55.00 $75.00 $91.87 800 NYMEX Collar* 12 Months (Jan-Dec) $60.00 $80.00 $94.98 500 2011 Total (weighted average price) 2011 Total (weighted average price) $56.92 $71.55 $90.52 2,584 49% NYMEX Collar* 12 Months (Jan-Dec) $75.00 $93.00 500 NYMEX Collar* 12 Months (Jan-Dec) $60.00 $80.00 $100.50 500 NYMEX Collar* 12 Months (Jan-Dec) $60.00 $80.00 $106.00 500 2012 Total (weighted average price) 2012 Total (weighted average price) $60.00 $78.33 $99.83 1,500 29% * ** Trades executed since August 11, 2010 press release Trades executed since August 11, 2010 press release Q3 Production : 5,250 bopd |
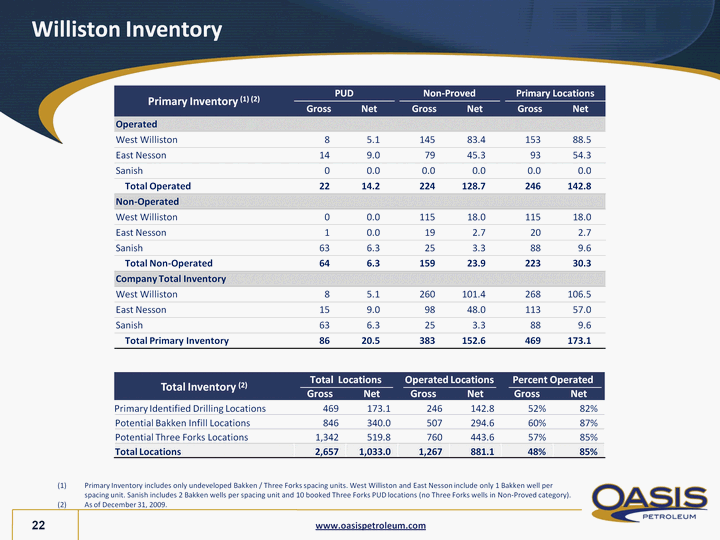
| Williston Inventory Primary Inventory (1) (2) PUD PUD Non-Proved Non-Proved Primary Locations Primary Locations Primary Inventory (1) (2) Gross Net Gross Net Gross Net Operated West Williston 8 5.1 145 83.4 153 88.5 East Nesson 14 9.0 79 45.3 93 54.3 Sanish 0 0.0 0.0 0.0 0.0 0.0 Total Operated 22 14.2 224 128.7 246 142.8 Non-Operated West Williston 0 0.0 115 18.0 115 18.0 East Nesson 1 0.0 19 2.7 20 2.7 Sanish 63 6.3 25 3.3 88 9.6 Total Non-Operated 64 6.3 159 23.9 223 30.3 Company Total Inventory West Williston 8 5.1 260 101.4 268 106.5 East Nesson 15 9.0 98 48.0 113 57.0 Sanish 63 6.3 25 3.3 88 9.6 Total Primary Inventory 86 20.5 383 152.6 469 173.1 Primary Inventory includes only undeveloped Bakken / Three Forks spacing units. West Williston and East Nesson include only 1 Bakken well per spacing unit. Sanish includes 2 Bakken wells per spacing unit and 10 booked Three Forks PUD locations (no Three Forks wells in Non-Proved category). As of December 31, 2009. Total Inventory (2) Total Locations Total Locations Operated Locations Operated Locations Percent Operated Percent Operated Total Inventory (2) Gross Net Gross Net Gross Net Primary Identified Drilling Locations 469 173.1 246 142.8 52% 82% Potential Bakken Infill Locations 846 340.0 507 294.6 60% 87% Potential Three Forks Locations 1,342 519.8 760 443.6 57% 85% Total Locations 2,657 1,033.0 1,267 881.1 48% 85% www.oasispetroleum.com |
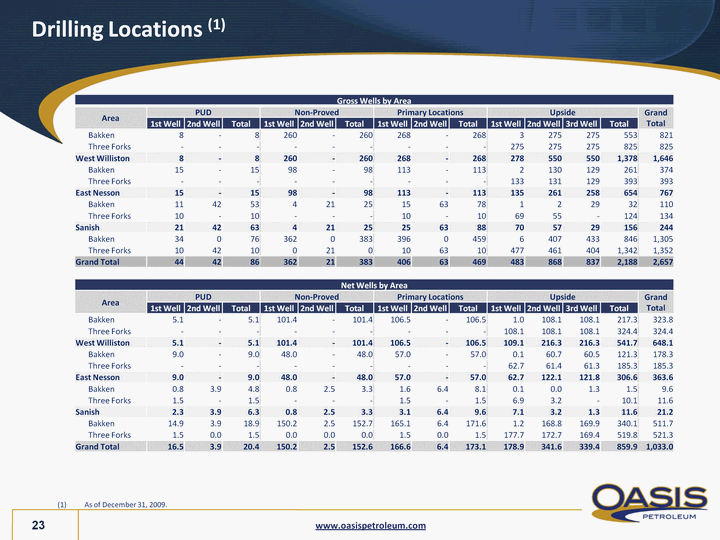
| Drilling Locations (1) Gross Wells by Area Gross Wells by Area Gross Wells by Area Gross Wells by Area Gross Wells by Area Gross Wells by Area Gross Wells by Area Gross Wells by Area Gross Wells by Area Gross Wells by Area Gross Wells by Area Gross Wells by Area Gross Wells by Area Gross Wells by Area Gross Wells by Area Area PUD PUD PUD Non-Proved Non-Proved Non-Proved Primary Locations Primary Locations Primary Locations Upside Upside Upside Upside Grand Total Area 1st Well 2nd Well Total 1st Well 2nd Well Total 1st Well 2nd Well Total 1st Well 2nd Well 3rd Well Total Grand Total Bakken 8 - 8 260 - 260 268 - 268 3 275 275 553 821 Three Forks - - - - - - - - - 275 275 275 825 825 West Williston 8 - 8 260 - 260 268 - 268 278 550 550 1,378 1,646 Bakken 15 - 15 98 - 98 113 - 113 2 130 129 261 374 Three Forks - - - - - - - - - 133 131 129 393 393 East Nesson 15 - 15 98 - 98 113 - 113 135 261 258 654 767 Bakken 11 42 53 4 21 25 15 63 78 1 2 29 32 110 Three Forks 10 - 10 - - - 10 - 10 69 55 - 124 134 Sanish 21 42 63 4 21 25 25 63 88 70 57 29 156 244 Bakken 34 0 76 362 0 383 396 0 459 6 407 433 846 1,305 Three Forks 10 42 10 0 21 0 10 63 10 477 461 404 1,342 1,352 Grand Total 44 42 86 362 21 383 406 63 469 483 868 837 2,188 2,657 Net Wells by Area Net Wells by Area Net Wells by Area Net Wells by Area Net Wells by Area Net Wells by Area Net Wells by Area Net Wells by Area Net Wells by Area Net Wells by Area Net Wells by Area Net Wells by Area Net Wells by Area Net Wells by Area Net Wells by Area Area PUD PUD PUD Non-Proved Non-Proved Non-Proved Primary Locations Primary Locations Primary Locations Upside Upside Upside Upside Grand Total Area 1st Well 2nd Well Total 1st Well 2nd Well Total 1st Well 2nd Well Total 1st Well 2nd Well 3rd Well Total Grand Total Bakken 5.1 - 5.1 101.4 - 101.4 106.5 - 106.5 1.0 108.1 108.1 217.3 323.8 Three Forks - - - - - - - - - 108.1 108.1 108.1 324.4 324.4 West Williston 5.1 - 5.1 101.4 - 101.4 106.5 - 106.5 109.1 216.3 216.3 541.7 648.1 Bakken 9.0 - 9.0 48.0 - 48.0 57.0 - 57.0 0.1 60.7 60.5 121.3 178.3 Three Forks - - - - - - - - - 62.7 61.4 61.3 185.3 185.3 East Nesson 9.0 - 9.0 48.0 - 48.0 57.0 - 57.0 62.7 122.1 121.8 306.6 363.6 Bakken 0.8 3.9 4.8 0.8 2.5 3.3 1.6 6.4 8.1 0.1 0.0 1.3 1.5 9.6 Three Forks 1.5 - 1.5 - - - 1.5 - 1.5 6.9 3.2 - 10.1 11.6 Sanish 2.3 3.9 6.3 0.8 2.5 3.3 3.1 6.4 9.6 7.1 3.2 1.3 11.6 21.2 Bakken 14.9 3.9 18.9 150.2 2.5 152.7 165.1 6.4 171.6 1.2 168.8 169.9 340.1 511.7 Three Forks 1.5 0.0 1.5 0.0 0.0 0.0 1.5 0.0 1.5 177.7 172.7 169.4 519.8 521.3 Grand Total 16.5 3.9 20.4 150.2 2.5 152.6 166.6 6.4 173.1 178.9 341.6 339.4 859.9 1,033.0 (1) As of December 31, 2009. www.oasispetroleum.com |
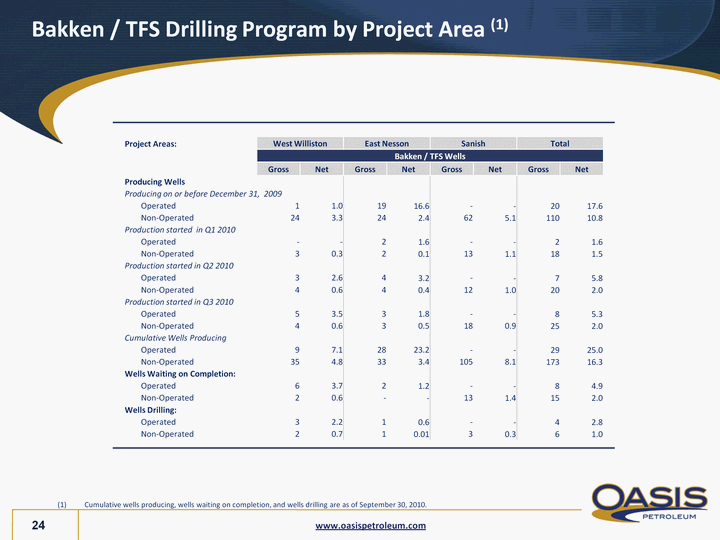
| Bakken / TFS Drilling Program by Project Area (1) Project Areas: West Williston West Williston East Nesson East Nesson Sanish Sanish Total Total Bakken / TFS Wells Bakken / TFS Wells Bakken / TFS Wells Bakken / TFS Wells Bakken / TFS Wells Bakken / TFS Wells Bakken / TFS Wells Bakken / TFS Wells Gross Net Gross Net Gross Net Gross Net Producing Wells Producing on or before December 31, 2009 Producing on or before December 31, 2009 Operated 1 1.0 19 16.6 - - 20 17.6 Non-Operated 24 3.3 24 2.4 62 5.1 110 10.8 Production started in Q1 2010 Operated - - 2 1.6 - - 2 1.6 Non-Operated 3 0.3 2 0.1 13 1.1 18 1.5 Production started in Q2 2010 Operated 3 2.6 4 3.2 - - 7 5.8 Non-Operated 4 0.6 4 0.4 12 1.0 20 2.0 Production started in Q3 2010 Operated 5 3.5 3 1.8 - - 8 5.3 Non-Operated 4 0.6 3 0.5 18 0.9 25 2.0 Cumulative Wells Producing Operated 9 7.1 28 23.2 - - 29 25.0 Non-Operated 35 4.8 33 3.4 105 8.1 173 16.3 Wells Waiting on Completion: Operated 6 3.7 2 1.2 - - 8 4.9 Non-Operated 2 0.6 - - 13 1.4 15 2.0 Wells Drilling: Operated 3 2.2 1 0.6 - - 4 2.8 Non-Operated 2 0.7 1 0.01 3 0.3 6 1.0 (1) Cumulative wells producing, wells waiting on completion, and wells drilling are as of September 30, 2010. www.oasispetroleum.com |
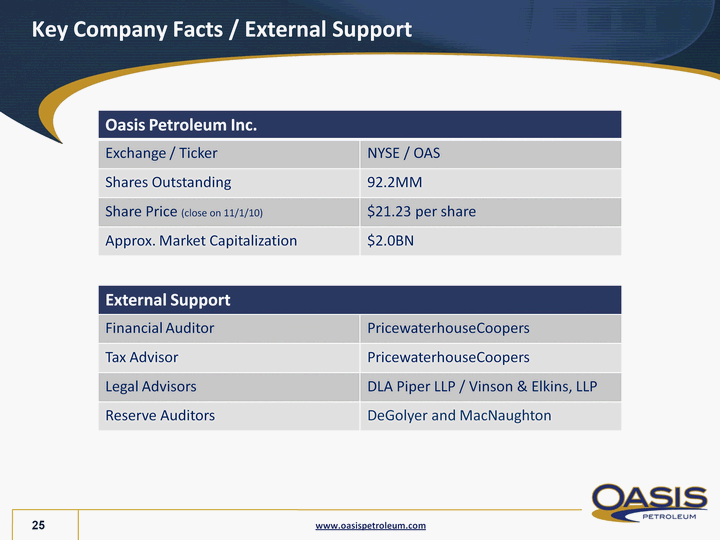
| Key Company Facts / External Support Oasis Petroleum Inc. Oasis Petroleum Inc. Exchange / Ticker NYSE / OAS Shares Outstanding 92.2MM Share Price (close on 11/1/10) $21.23 per share Approx. Market Capitalization $2.0BN External Support External Support Financial Auditor PricewaterhouseCoopers Tax Advisor PricewaterhouseCoopers Legal Advisors DLA Piper LLP / Vinson & Elkins, LLP Reserve Auditors DeGolyer and MacNaughton www.oasispetroleum.com |
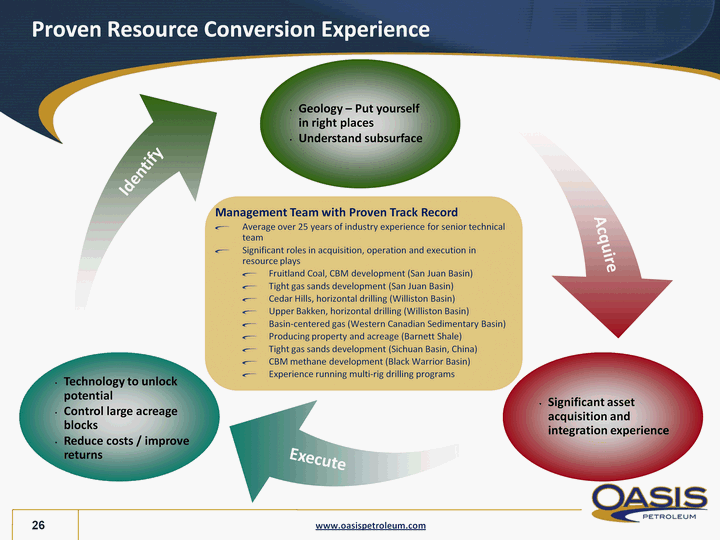
| Proven Resource Conversion Experience Geology - Put yourself in right places Understand subsurface Technology to unlock potential Control large acreage blocks Reduce costs / improve returns Significant asset acquisition and integration experience Management Team with Proven Track Record Average over 25 years of industry experience for senior technical team Significant roles in acquisition, operation and execution in resource plays Fruitland Coal, CBM development (San Juan Basin) Tight gas sands development (San Juan Basin) Cedar Hills, horizontal drilling (Williston Basin) Upper Bakken, horizontal drilling (Williston Basin) Basin-centered gas (Western Canadian Sedimentary Basin) Producing property and acreage (Barnett Shale) Tight gas sands development (Sichuan Basin, China) CBM methane development (Black Warrior Basin) Experience running multi-rig drilling programs Identify Acquire Execute |
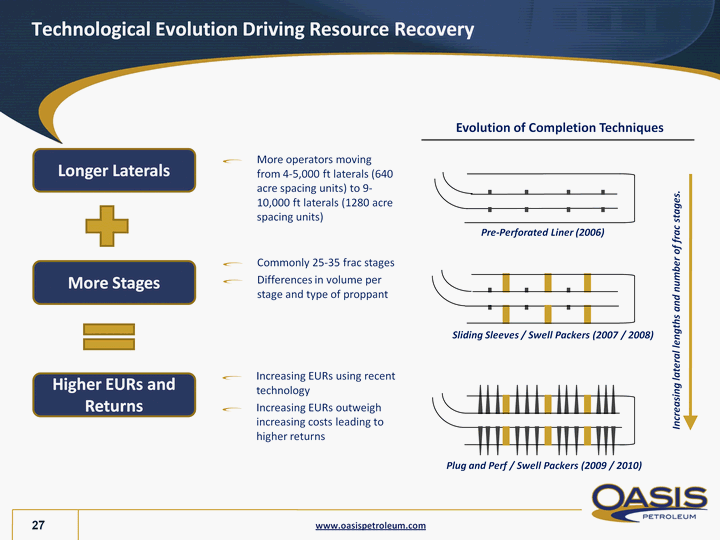
| Technological Evolution Driving Resource Recovery More operators moving from 4-5,000 ft laterals (640 acre spacing units) to 9- 10,000 ft laterals (1280 acre spacing units) Pre-Perforated Liner (2006) Sliding Sleeves / Swell Packers (2007 / 2008) Plug and Perf / Swell Packers (2009 / 2010) Increasing lateral lengths and number of frac stages. Longer Laterals More Stages Higher EURs and Returns Commonly 25-35 frac stages Differences in volume per stage and type of proppant Increasing EURs using recent technology Increasing EURs outweigh increasing costs leading to higher returns Evolution of Completion Techniques |
