Attached files
| file | filename |
|---|---|
| EX-31.1 - EXHIBIT 31.1 - Oasis Petroleum Inc. | oas-12312016xex311.htm |
| EX-99.1 - EXHIBIT 99.1 - Oasis Petroleum Inc. | oas-12312016xex991.htm |
| EX-32.2 - EXHIBIT 32.2 - Oasis Petroleum Inc. | oas-12312016xex322.htm |
| EX-32.1 - EXHIBIT 32.1 - Oasis Petroleum Inc. | oas-12312016xex321.htm |
| EX-31.2 - EXHIBIT 31.2 - Oasis Petroleum Inc. | oas-12312016xex312.htm |
| EX-23.2 - EXHIBIT 23.2 - Oasis Petroleum Inc. | oas-12312016xex232.htm |
| EX-23.1 - EXHIBIT 23.1 - Oasis Petroleum Inc. | oas-12312016xex231.htm |
| EX-21.1 - EXHIBIT 21.1 - Oasis Petroleum Inc. | oas-12312016xex211.htm |
| EX-12.1 - EXHIBIT 12.1 - Oasis Petroleum Inc. | oas-12312016xex121.htm |
UNITED STATES
SECURITIES AND EXCHANGE COMMISSION
Washington, D.C. 20549
_______________________________________
FORM 10-K
_______________________________________
ý | ANNUAL REPORT PURSUANT TO SECTION 13 OR 15(d) OF THE SECURITIES EXCHANGE ACT OF 1934 |
For the fiscal year ended December 31, 2016
OR
¨ | TRANSITION REPORT PURSUANT TO SECTION 13 OR 15(d) OF THE SECURITIES EXCHANGE ACT OF 1934 |
Commission file number: 1-34776
_______________________________________
Oasis Petroleum Inc.
(Exact name of registrant as specified in its charter)
_______________________________________
Delaware | 80-0554627 | |
(State or other jurisdiction of incorporation or organization) | (I.R.S. Employer Identification No.) | |
1001 Fannin Street, Suite 1500 | ||
Houston, Texas | 77002 | |
(Address of principal executive offices) | (Zip Code) | |
(281) 404-9500
(Registrant’s telephone number, including area code)
Securities Registered Pursuant to Section 12(b) of the Act:
Common Stock, par value $0.01 per share | New York Stock Exchange | |
(Title of Class) | (Name of Exchange) | |
Securities Registered Pursuant to Section 12(g) of the Act:
None
_______________________________________
Indicate by check mark if the Registrant is a well-known seasoned issuer, as defined in Rule 405 of the Securities Act. Yes ý No ¨
Indicate by check mark if the Registrant is not required to file reports pursuant to Section 13 or Section 15(d) of the Act. Yes ¨ No ý
Indicate by check mark whether the Registrant (1) has filed all reports required to be filed by Section 13 or 15(d) of the Securities Exchange Act of 1934 during the preceding 12 months (or for such shorter period that the Registrant was required to file such reports), and (2) has been subject to such filing requirements for the past 90 days. Yes ý No ¨
Indicate by check mark whether the registrant has submitted electronically and posted on its corporate Web site, if any, every Interactive Data File required to be submitted and posted pursuant to Rule 405 of Regulation S T (§ 232.405 of this chapter) during the preceding 12 months (or for such shorter period that the registrant was required to submit and post such files). Yes ý No ¨
Indicate by check mark if disclosure of delinquent filers pursuant to Item 405 of Regulation S-K is not contained herein, and will not be contained, to the best of Registrant’s knowledge, in definitive proxy or information statements incorporated by reference in Part III of this Form 10-K or any amendment to this Form 10-K. ý
Indicate by check mark whether the registrant is a large accelerated filer, an accelerated filer, a non-accelerated filer, or a smaller reporting company. See the definitions of “large accelerated filer”, “accelerated filer” and “smaller reporting company” in Rule 12b-2 of the Exchange Act.
Large accelerated filer | ý | Accelerated filer | ¨ |
Non-accelerated filer | ¨ (do not check if a smaller reporting company) | Smaller reporting company | ¨ |
Indicate by check mark whether the Registrant is a shell company (as defined in Rule 12b-2 of the Act). Yes ¨ No ý
Aggregate market value of the voting and non-voting common equity held by non-affiliates computed by reference to the price at which the common equity was last sold, or the average bid and asked price of such common equity, as of the last business day of the registrant’s most recently completed second fiscal quarter: $1,684,927,220
Number of shares of registrant’s common stock outstanding as of February 17, 2017: 237,484,249
_______________________________________
Documents Incorporated By Reference:
Portions of the registrant’s definitive proxy statement for its 2017 Annual Meeting of Stockholders, which will be filed with the Securities and Exchange Commission within 120 days of December 31, 2016, are incorporated by reference into Part III of this report for the year ended December 31, 2016.
OASIS PETROLEUM INC.
FORM 10-K
FOR THE YEAR ENDED DECEMBER 31, 2016
TABLE OF CONTENTS
2
CAUTIONARY NOTE REGARDING FORWARD-LOOKING STATEMENTS
This Annual Report on Form 10-K contains forward-looking statements within the meaning of Section 27A of the Securities Act of 1933, as amended (the “Securities Act”), and Section 21E of the Securities Exchange Act of 1934, as amended (the “Exchange Act”). These forward-looking statements are subject to a number of risks and uncertainties, many of which are beyond our control. All statements, other than statements of historical fact included in this Annual Report on Form 10-K, regarding our strategy, future operations, financial position, estimated revenues and losses, projected costs, prospects, plans and objectives of management are forward-looking statements. When used in this Annual Report on Form 10-K, the words “could,” “believe,” “anticipate,” “intend,” “estimate,” “expect,” “may,” “continue,” “predict,” “potential,” “project” and similar expressions are intended to identify forward-looking statements, although not all forward-looking statements contain such identifying words.
Forward-looking statements may include statements about:
• | our business strategy; |
• | estimated future net reserves and present value thereof; |
• | timing and amount of future production of oil and natural gas; |
• | drilling and completion of wells; |
• | estimated inventory of wells remaining to be drilled and completed; |
• | costs of exploiting and developing our properties and conducting other operations; |
• | availability of drilling, completion and production equipment and materials; |
• | availability of qualified personnel; |
• | owning and operating a midstream company; |
• | owning and operating a well services company; |
• | infrastructure for salt water gathering and disposal; |
• | gathering, transportation and marketing of oil and natural gas, both in the Williston Basin and other regions in the United States; |
• | property acquisitions, including our recent acquisition of oil and gas properties in the Williston Basin; |
• | integration and benefits of property acquisitions or the effects of such acquisitions on our cash position and levels of indebtedness; |
• | the amount, nature and timing of capital expenditures; |
• | availability and terms of capital; |
• | our financial strategy, budget, projections, execution of business plan and operating results; |
• | cash flows and liquidity; |
• | oil and natural gas realized prices; |
• | general economic conditions; |
• | operating environment, including inclement weather conditions; |
• | effectiveness of risk management activities; |
• | competition in the oil and natural gas industry; |
• | counterparty credit risk; |
• | environmental liabilities; |
• | governmental regulation and the taxation of the oil and natural gas industry; |
• | developments in oil-producing and natural gas-producing countries; |
• | technology; |
• | uncertainty regarding future operating results; and |
• | plans, objectives, expectations and intentions contained in this report that are not historical. |
All forward-looking statements speak only as of the date of this Annual Report on Form 10-K. We disclaim any obligation to update or revise these statements unless required by securities law, and you should not place undue reliance on these forward-looking statements. Although we believe that our plans, intentions and expectations reflected in or suggested by the forward-looking statements we make in this Annual Report on Form 10-K are reasonable, we can give no assurance that these plans, intentions or expectations will be achieved. We disclose important factors that could cause our actual results to differ materially from our expectations under “Item 1A. Risk Factors” and “Item 7. Management’s Discussion and Analysis of Financial Condition and Results of Operations” and elsewhere in this Annual Report on Form 10-K. These cautionary statements qualify all forward-looking statements attributable to us or persons acting on our behalf.
3
PART I
Item 1. Business
Overview
Oasis Petroleum Inc. (together with our consolidated subsidiaries, the “Company,” “we,” “us,” or “our”) was originally formed in 2007 and was incorporated pursuant to the laws of the State of Delaware in 2010. We are an independent exploration and production company focused on the acquisition and development of unconventional oil and natural gas resources in the North Dakota and Montana regions of the Williston Basin. Oasis Petroleum North America LLC (“OPNA”) conducts our exploration and production activities and owns our proved and unproved oil and natural gas properties. We also operate a midstream services business through Oasis Midstream Services LLC (“OMS”) and a well services business through Oasis Well Services LLC (“OWS”).
As of December 31, 2016, we have accumulated 517,801 net leasehold acres in the Williston Basin, of which approximately 94% is held by production. We are currently exploiting significant resource potential from the Bakken and Three Forks formations, which are present across a substantial portion of our acreage. We believe the location, size and concentration of our acreage create an opportunity for us to achieve cost, recovery and production efficiencies through the development of our project inventory. Our management team has a proven track record in identifying, acquiring and executing large, repeatable development drilling programs, which we refer to as “resource conversion” opportunities, and has substantial Williston Basin experience.
In 2016, we completed and placed on production 57 gross operated wells in the Williston Basin and had average daily production of 50,372 Boe per day. As of December 31, 2016, we had 1,413 gross (756.5 net) producing wells in the Bakken and Three Forks formations. DeGolyer and MacNaughton, our independent reserve engineers, estimated our net proved reserves to be 305.1 MMBoe as of December 31, 2016, of which 62% were classified as proved developed and 78% were oil.
Our business strategy
Our goal is to enhance value by investing capital to build reserves, production and cash flows at attractive rates of return through the following strategies:
• | Efficiently develop our Williston Basin leasehold position. We are developing our acreage position to maximize the value of our resource potential, while maintaining flexibility to preserve future value when oil prices are low. During 2016, when the NYMEX West Texas Intermediate crude oil index price (“WTI”) averaged $43.40 per barrel for the year, we completed and brought on production 57 gross (37.6 net) operated Bakken and Three Forks wells. As of December 31, 2016, we had 83 gross operated wells waiting on completion in the Bakken and Three Forks formations. Our 2017 capital plan contemplates completing and placing on production approximately 76 gross (51.7 net) operated wells. We have the ability to increase or decrease the number of wells drilled and the number of wells completed during 2017 based on market conditions and program results. |
• | Enhance returns by focusing on operational and cost efficiencies. Our management team is focused on continuous improvement of our operations and has significant experience in successfully operating cost-efficient development programs. We believe the magnitude and concentration of our acreage within the Williston Basin, particularly in the core of the play, has and will continue to provide us with the opportunity to capture economies of scale, including the ability to drill multiple wells from a single drilling pad into multiple formations, utilize centralized production and oil, gas and water fluid handling facilities and infrastructure, and reduce the time and cost of rig mobilization. In addition, we expect OMS and OWS to continue to provide operational synergies going forward compared to third party providers. |
• | Adopt and employ leading drilling and completion techniques. Our team is focused on enhancing our drilling and completion techniques to maximize overall well economics. We have continued to reduce the number of days that it takes to drill wells, and we believe completion techniques have significantly evolved over the past decade, resulting in increased initial production rates and recoverable hydrocarbons per well. High intensity completion techniques continue to deliver production performance greater than prior completion techniques. We continuously evaluate our internal drilling and completion results and monitor the results of other operators to improve our operating practices. This ongoing evolution may enhance our initial production rates, increase ultimate recovery factors, lower well capital costs and improve rates of return on invested capital. |
• | Maintain financial flexibility. Based on current market conditions, we have a strong liquidity position. We have no short-term debt maturities, and as of December 31, 2016, we had $785.9 million of liquidity available, including $11.2 million of cash and cash equivalents and $774.7 million of unused borrowing base capacity available under our revolving credit facility. Our liquidity position, along with internally generated cash flows from operations, will provide continued financial flexibility as we actively manage the pace of development on our acreage position in the Williston Basin. We currently believe we have access to the public and private capital markets, and we intend to maintain a |
4
balanced capital structure by prudently raising proceeds from future offerings as additional capital needs arise. We also continue to evaluate options to monetize certain assets in our portfolio, which could result in increased liquidity and lower leverage.
• | Pursue strategic acquisitions with significant resource potential. As opportunities arise, we intend to identify and acquire additional acreage and producing assets in the Williston Basin to supplement our existing operations. In 2016, we acquired approximately 55,000 net acres in the Williston Basin. Going forward, we may selectively target additional basins that would allow us to employ our resource conversion strategy on large undeveloped acreage positions similar to what we have accumulated in the Williston Basin. |
Our competitive strengths
We have a number of competitive strengths that we believe will help us to successfully execute our business strategies:
• | Substantial leasehold position in one of North America’s leading unconventional oil-resource plays. We believe our acreage is one of the largest concentrated leasehold positions that is prospective in the Bakken and Three Forks formations. As of December 31, 2016, substantially all of our 517,801 net leasehold acres in the Williston Basin were highly prospective in the Bakken and Three Forks formations, and 78% of our 305.1 MMBoe estimated net proved reserves in this area were comprised of oil. In addition, we have 484,321 net acres held by production as of December 31, 2016. In 2016, we increased per well capital efficiency through our focused development efforts in our core acreage and improved operational efficiency, coupled with lower service costs from third-party vendors, OMS and OWS. In 2017, we will continue to concentrate our drilling and completion activities in our core acreage. |
• | Large, multi-year project inventory. We believe we have a large inventory of potential drilling locations that we have not yet drilled, a majority of which are operated by us. We plan to complete 76 gross (51.7 net) operated wells in the Williston Basin in 2017. |
• | Management team with proven operating and acquisition skills. Our senior management team has extensive expertise in the oil and gas industry with an average of more than 25 years of industry experience, including experience in multiple North American resource plays as well as experience in international basins. We believe our management and technical team is one of our principal competitive strengths relative to our industry peers due to our team’s proven track record in identification, acquisition and execution of resource conversion opportunities. In addition, our technical team possesses substantial expertise in horizontal drilling techniques and managing and acquiring large development programs. |
• | Incentivized management team. In 2016, an average of 45% of our executive officers’ overall compensation was in long-term equity-based incentive awards, and such officers owned over 3.6 million shares of our outstanding common stock as of December 31, 2016. We believe our executive officers’ ownership interest in us provides them with significant incentives to grow the value of our business for the benefit of all stakeholders. |
• | Operating control over the majority of our portfolio. In order to maintain better control over our asset portfolio, we have established a leasehold position comprised primarily of properties that we expect to operate. As of December 31, 2016, 95% of our estimated net proved reserves were attributable to properties that we expect to operate, and our average working interest in our 2017 operated completion plan is expected to be 68%. Approximately 95% of our 2017 drilling and completion capital expenditure budget is related to operated wells. Controlling operations will allow us to dictate the pace of development and better manage the costs, type and timing of exploration and development activities. We believe that maintaining operational control over the majority of our acreage will allow us to better pursue our strategies of enhancing returns through operational and cost efficiencies and maximizing hydrocarbon recovery through continuous improvement of drilling and completion techniques. We are also better able to control infrastructure investment to drive down operating costs, optimize oil price realizations and increase the monetization of gas production. |
• | Vertical integration. Our investments in and operational control of OMS and OWS provide us with additional operational efficiencies and cost savings compared to our peers. This vertical integration helps us control capital dollars being spent in advance of production to ensure volumes flow, improve uptime performance of our producing wells, protect against rising service costs, increase transparency in the planning process and increase communications with vendors by purchasing directly from them. |
5
Our operations
Proved reserves
Our estimated net proved reserves and related PV-10 at December 31, 2016, 2015 and 2014 are based on reports prepared by DeGolyer and MacNaughton, our independent reserve engineers. In preparing its reports, DeGolyer and MacNaughton evaluated 100% of the reserves and discounted values at December 31, 2016, 2015 and 2014 in accordance with the rules and regulations of the Securities and Exchange Commission (“SEC”) applicable to companies involved in oil and natural gas producing activities. Our estimated net proved reserves and related future net revenues, PV-10 and Standardized Measure do not include probable or possible reserves and were determined using the preceding twelve months’ unweighted arithmetic average of the first-day-of-the-month index prices for oil and natural gas, which were held constant throughout the life of the properties. The unweighted arithmetic average first-day-of-the-month prices for the prior twelve months were $42.60 per Bbl for oil and $2.47 per MMBtu for natural gas, $50.16 per Bbl for oil and $2.63 per MMBtu for natural gas and $95.28 per Bbl for oil and $4.35 per MMBtu for natural gas for the years ended December 31, 2016, 2015 and 2014, respectively. These prices were adjusted by lease for quality, transportation fees, geographical differentials, marketing bonuses or deductions and other factors affecting the price received at the wellhead. The information in the following table does not give any effect to or reflect our commodity derivatives. Future operating costs, production taxes and capital costs were based on current costs as of each year-end. For a definition of proved reserves under the SEC rules, please see the “Glossary of oil and natural gas terms” included at the end of this report. For more information regarding our independent reserve engineers, please see “Independent petroleum engineers” below. Future net revenues represent projected revenues from the sale of our estimated net proved reserves (excluding derivative contracts) net of production and development costs (including operating expenses and production taxes). PV-10 and Standardized Measure represent the present value of the future net revenues discounted at 10%, before and after income taxes, respectively.
There are numerous uncertainties inherent in estimating reserves and related information, and different reservoir engineers often arrive at different estimates for the same properties. There can be no assurance that our estimated net proved reserves will be produced within the periods indicated or that prices and costs will remain constant. An extended period of low prices for oil could result in a significant decrease in our estimated net proved reserves and related future net revenues, PV-10 and Standardized Measure in the future.
The following table summarizes our estimated net proved reserves and related future net revenues, PV-10 and Standardized Measure:
At December 31, | |||||||||||
2016 | 2015 | 2014 | |||||||||
Estimated proved reserves: | |||||||||||
Oil (MMBbls) | 236.6 | 184.9 | 235.4 | ||||||||
Natural gas (Bcf) | 411.1 | 199.8 | 220.1 | ||||||||
Total estimated proved reserves (MMBoe) | 305.1 | 218.2 | 272.1 | ||||||||
Percent oil | 78 | % | 85 | % | 87 | % | |||||
Estimated proved developed reserves: | |||||||||||
Oil (MMBbls) | 152.3 | 127.4 | 127.3 | ||||||||
Natural gas (Bcf) | 229.6 | 120.8 | 114.0 | ||||||||
Total estimated proved developed reserves (MMBoe) | 190.6 | 147.6 | 146.3 | ||||||||
Percent proved developed | 62 | % | 68 | % | 54 | % | |||||
Estimated proved undeveloped reserves: | |||||||||||
Oil (MMBbls) | 84.3 | 57.5 | 108.1 | ||||||||
Natural gas (Bcf) | 181.5 | 79.0 | 106.1 | ||||||||
Total estimated proved undeveloped reserves (MMBoe) | 114.5 | 70.7 | 125.7 | ||||||||
Future net revenues (in millions) | $ | 4,645.6 | $ | 3,827.9 | $ | 11,999.3 | |||||
PV-10 (in millions)(1) | $ | 2,627.8 | $ | 2,022.7 | $ | 5,481.4 | |||||
Standardized Measure (in millions)(2) | $ | 2,483.1 | $ | 1,914.3 | $ | 3,981.7 | |||||
__________________
(1) | PV-10 is a non-GAAP financial measure and generally differs from Standardized Measure, the most directly comparable financial measure under accounting principles generally accepted in the United States of America (“GAAP”), because it does not include the effect of income taxes on discounted future net cash flows. Neither PV-10 |
6
nor Standardized Measure represents an estimate of the fair market value of our oil and natural gas reserves. The oil and gas industry uses PV-10 as a measure to compare the relative size and value of proved reserves held by companies without regard to the specific tax characteristics of such entities. See “Reconciliation of PV-10 to Standardized Measure” below.
(2) | Standardized Measure represents the present value of estimated future net cash flows from proved oil and natural gas reserves, less estimated future development, production, plugging and abandonment costs and income tax expenses, discounted at 10% per annum to reflect timing of future cash flows. |
Estimated net proved reserves at December 31, 2016 were 305.1 MMBoe, a 40% increase from estimated net proved reserves of 218.2 MMBoe at December 31, 2015 primarily due to acquisitions and revisions related to larger completion designs, partially offset by lower commodity prices and the 2016 divestiture of certain legacy wells that were producing from conventional reservoirs such as the Madison, Red River and other formations in the Williston Basin other than the Bakken or Three Forks formations. Our proved developed reserves increased 43.0 MMBoe, or 29%, to 190.6 MMBoe for the year ended December 31, 2016 from 147.6 MMBoe for the year ended December 31, 2015, primarily due to acquisitions and our 2016 drilling program, including the completion of 57 gross (37.6 net) operated wells, partially offset by production and higher abandonment rates resulting from lower commodity price assumptions. Our proved undeveloped reserves increased to 114.5 MMBoe for the year ended December 31, 2016 from 70.7 MMBoe for the year ended December 31, 2015 due to acquisitions and positive revisions related to larger completion designs, partially offset by conversions of wells to proved developed as a result of our 2016 drilling program and the removal of proved undeveloped reserves that are no longer aligned with our anticipated five-year drilling plan as of December 31, 2016.
Estimated net proved reserves at December 31, 2015 were 218.2 MMBoe, a 20% decrease from estimated net proved reserves of 272.1 MMBoe at December 31, 2014 primarily due to revisions related to lower commodity prices, partially offset by our 2015 drilling program and well completions as well as lower estimated future operating and capital costs. Our proved developed reserves increased 1.3 MMBoe, or 1%, to 147.6 MMBoe for the year ended December 31, 2015 from 146.3 MMBoe for the year ended December 31, 2014, primarily due to our 2015 drilling program, including the completion of 80 gross (62.4 net) operated wells, partially offset by production and higher abandonment rates resulting from lower commodity price assumptions. Our proved undeveloped reserves decreased to 70.7 MMBoe for the year ended December 31, 2015 from 125.7 MMBoe for the year ended December 31, 2014 due to increases from our 2015 drilling program offset by the removal of proved undeveloped reserves that were not economic at the lower oil price or were no longer aligned with our anticipated five-year drilling plan as of December 31, 2015.
Reconciliation of PV-10 to Standardized Measure
PV-10 is derived from the Standardized Measure of discounted future net cash flows, which is the most directly comparable GAAP financial measure. PV-10 is a computation of the Standardized Measure of discounted future net cash flows on a pre-tax basis. PV-10 is equal to the Standardized Measure of discounted future net cash flows at the applicable date, before deducting future income taxes, discounted at 10%. We believe that the presentation of PV-10 is relevant and useful to investors because it presents the discounted future net cash flows attributable to our estimated net proved reserves prior to taking into account future corporate income taxes, and it is a useful measure for evaluating the relative monetary significance of our oil and natural gas properties. Further, investors may utilize the measure as a basis for comparison of the relative size and value of our reserves to other companies. We use this measure when assessing the potential return on investment related to our oil and natural gas properties. PV-10, however, is not a substitute for the Standardized Measure of discounted future net cash flows. Our PV-10 measure and the Standardized Measure of discounted future net cash flows do not purport to represent the fair value of our oil and natural gas reserves.
The following table provides a reconciliation of PV-10 to the Standardized Measure of discounted future net cash flows:
At December 31, | |||||||||||
2016 | 2015 | 2014 | |||||||||
(In millions) | |||||||||||
PV-10 | $ | 2,627.8 | $ | 2,022.7 | $ | 5,481.4 | |||||
Present value of future income taxes discounted at 10% | 144.7 | 108.4 | 1,499.7 | ||||||||
Standardized Measure of discounted future net cash flows | $ | 2,483.1 | $ | 1,914.3 | $ | 3,981.7 | |||||
The PV-10 of our estimated net proved reserves at December 31, 2016 was $2,627.8 million, a 30% increase from PV-10 of $2,022.7 million at December 31, 2015. This increase was primarily due to an increase in reserves and a reduction in future development costs, partially offset by lower commodity price assumptions year over year.
7
Proved undeveloped reserves
At December 31, 2016, we had approximately 114.5 MMBoe of proved undeveloped reserves as compared to 70.7 MMBoe at December 31, 2015.
The following table summarizes the changes in our proved undeveloped reserves during 2016:
Year Ended December 31, 2016 | ||
(in MBoe) | ||
Proved undeveloped reserves, beginning of period | 70,656 | |
Extensions, discoveries and other additions | 6,493 | |
Purchases of minerals in place | 33,449 | |
Sales of minerals in place | (4,603 | ) |
Revisions of previous estimates | 30,030 | |
Conversion to proved developed reserves | (21,513 | ) |
Proved undeveloped reserves, end of period | 114,512 | |
During 2016, we spent a total of $155.1 million related to the development of proved undeveloped reserves, $39.5 million of which was spent on proved undeveloped reserves that represent wells in progress at year-end. The remaining $115.6 million resulted in the conversion of 21,513 MBoe of proved undeveloped reserves, or 30% of our proved undeveloped reserves balance at the beginning of 2016, to proved developed reserves. We added 6,493 MBoe of proved undeveloped reserves in the Williston Basin as a result of our 2016 operated and non-operated drilling program and anticipated five-year drilling plan. We participated in 64 gross (38.1 net) wells that were completed and brought on production during 2016. In addition, we purchased 33,449 MBoe of proved undeveloped reserves as a result of acquisitions and traded acreage during the year ended December 31, 2016. As a result of traded acreage in 2016, we divested 4,603 MBoe of proved undeveloped reserves. In 2016, our net positive revision of 30,030 MBoe, or 43% of our December 31, 2015 proved undeveloped reserves balance, is primarily due to larger completion designs and a higher gas to oil ratio, partially offset by the removal of proved undeveloped reserves, including 28 gross (20.2 net) proved undeveloped locations with 9,455 MBoe of reserves that are no longer aligned with our anticipated five-year drilling plan and lower commodity prices.
We expect to develop all of our proved undeveloped reserves as of December 31, 2016 within five years after the initial year booked. The future development of such proved undeveloped reserves is dependent on future commodity prices, costs and economic assumptions that align with our internal forecasts as well as access to liquidity sources, such as capital markets, our revolving credit facility and derivative contracts. All proved undeveloped locations are located on properties where the leases are held by existing production or continuous drilling operations. Approximately 33% of our proved undeveloped reserves at December 31, 2016 are attributable to wells that have been drilled but not yet completed, and 100% of our undrilled reserves are within our core acreage in the Williston Basin.
Reserves sensitivity
Our estimated net proved reserves at December 31, 2016 were prepared using SEC pricing for crude oil of $42.60 per barrel and natural gas of $2.47 per MMBtu. Based on low commodity prices in recent years and expected continued commodity price volatility, the following sensitivity table is provided to illustrate the potential impact on our estimated net proved reserves, PV-10 and Standardized Measure if the commodity prices were to decrease to levels in line with the first quarter of 2016, which were the lowest quarterly average commodity prices during the recent downturn. Management cannot predict future commodity prices and is not currently forecasting such a decrease in prices, but based on market volatility, the uncertainty of price assumptions and historical precedence, management believes it is reasonably possible that these prices could occur again in the future. The reduction in net proved reserves in the sensitivity case provided is attributable to reaching the economic limit sooner as a result of the decreased prices.
8
Actual at December 31, 2016 | Sensitivity Case | ||||||
Oil price (per Bbl)(1) | $ | 42.60 | $ | 35.00 | |||
Natural gas price (per MMBtu)(1) | 2.47 | 2.00 | |||||
Estimated proved developed reserves (MMBoe) | 190.6 | 175.8 | |||||
Estimated proved undeveloped reserves (MMBoe) | 114.5 | 111.5 | |||||
Total estimated proved reserves (MMBoe) | 305.1 | 287.3 | |||||
PV-10 (in millions) | $ | 2,627.8 | $ | 1,784.9 | |||
Present value of future income taxes discounted at 10% (in millions) | 144.7 | — | |||||
Standardized Measure of discounted future net cash flows (in millions) | $ | 2,483.1 | $ | 1,784.9 | |||
__________________
(1) | Our estimated net proved reserves, PV-10 and Standardized Measure were determined using prices for oil and natural gas, without giving effect to derivative transactions, which were held constant throughout the life of the properties. The prices were adjusted by lease for quality, transportation fees, geographical differentials, marketing bonuses or deductions and other factors affecting the price received at the wellhead. The actual reserve estimates at December 31, 2016 were prepared using SEC pricing, calculated as the unweighted arithmetic average first-day-of-the-month prices for the prior twelve months, which was $42.60 per Bbl for oil and $2.47 per MMBtu for natural gas for the year ended December 31, 2016. The price for the sensitivity case is in line with historical lows experienced during the first quarter of 2016. |
Independent petroleum engineers
Our estimated net proved reserves and related future net revenues and PV-10 at December 31, 2016, 2015 and 2014 are based on reports prepared by DeGolyer and MacNaughton, our independent reserve engineers, by the use of appropriate geologic, petroleum engineering and evaluation principles and techniques that are in accordance with practices generally recognized by the petroleum industry as presented in the publication of the Society of Petroleum Engineers entitled Standards Pertaining to the Estimating and Auditing of Oil and Gas Reserves Information (Revision as of February 19, 2007) and definitions and current guidelines established by the SEC. DeGolyer and MacNaughton is a Delaware corporation with offices in Dallas, Houston, Calgary, Moscow and Algiers. The firm’s more than 100 professionals include engineers, geologists, geophysicists, petrophysicists and economists engaged in the appraisal of oil and gas properties, evaluation of hydrocarbon and other mineral prospects, basin evaluations, comprehensive field studies and equity studies related to the domestic and international energy industry. DeGolyer and MacNaughton has provided such services for over 75 years. The Senior Vice President at DeGolyer and MacNaughton primarily responsible for overseeing the preparation of the reserve estimates is a Registered Professional Engineer in the State of Texas with over 30 years of experience in oil and gas reservoir studies and reserve evaluations. He graduated with a Bachelor of Science degree in Petroleum Engineering from The University of Texas at Austin in 1984, and he is a member of the International Society of Petroleum Engineers and the Society of Petroleum Evaluation Engineers. DeGolyer and MacNaughton restricts its activities exclusively to consultation; it does not accept contingency fees, nor does it own operating interests in any oil, gas or mineral properties, or securities or notes of clients. The firm subscribes to a code of professional conduct, and its employees actively support their related technical and professional societies. The firm is a Texas Registered Engineering Firm.
Technology used to establish proved reserves
In accordance with rules and regulations of the SEC applicable to companies involved in oil and natural gas producing activities, proved reserves are those quantities of oil and natural gas, which, by analysis of geoscience and engineering data, can be estimated with reasonable certainty to be economically producible from a given date forward, from known reservoirs, and under existing economic conditions, operating methods and government regulations. The term “reasonable certainty” means deterministically, the quantities of oil and/or natural gas are much more likely to be achieved than not, and probabilistically, there should be at least a 90% probability of recovering volumes equal to or exceeding the estimate. Reasonable certainty can be established using techniques that have been proved effective by actual production from projects in the same reservoir or an analogous reservoir or by using reliable technology. Reliable technology is a grouping of one or more technologies (including computational methods) that has been field tested and has been demonstrated to provide reasonably certain results with consistency and repeatability in the formation being evaluated or in an analogous formation.
9
Estimates of reserves were prepared by the use of appropriate geologic, petroleum engineering, and evaluation principles and techniques that are in accordance with practices generally recognized by the petroleum industry as presented in the publication of the Society of Petroleum Engineers entitled Standards Pertaining to the Estimating and Auditing of Oil and Gas Reserves Information (Revision as of February 19, 2007). The method or combination of methods used in the analysis of each reservoir was tempered by experience with similar reservoirs, stage of development, quality and completeness of basic data, and production history.
Based on the current stage of field development, production performance, the development plans provided by us to DeGolyer and MacNaughton and the analyses of areas offsetting existing wells with test or production data, reserves were classified as proved.
For depletion-type reservoirs or those whose performance disclosed a reliable decline in producing-rate trends or other diagnostic characteristics, reserves were estimated by the application of appropriate decline curves or other performance relationships. In the analyses of production decline curves, reserves were estimated only to the limits of economic production.
Undeveloped reserves were estimated for locations adjacent to existing wells and are based on consideration of lateral length, completion and production profiles compared by appropriate target reservoir. In certain cases, when the previously named methods could not be used, reserves were estimated by analogy with similar wells or reservoirs for which more complete data was available.
Internal controls over reserves estimation process
We employ DeGolyer and MacNaughton as the independent reserves evaluator for 100% of our reserves base. We maintain an internal staff of petroleum engineers and geoscience professionals who work closely with the independent reserve engineers to ensure the integrity, accuracy and timeliness of data furnished for the reserves estimation process. Brett Newton, Senior Vice President of Asset Management and Chief Engineer, is the technical person primarily responsible for overseeing our reserves evaluation process. He has over 25 years of industry experience with positions of increasing responsibility in engineering and management. He holds both a Bachelor of Science degree and Master of Science degree in petroleum engineering. Mr. Newton reports directly to our President and Chief Operating Officer.
Throughout each fiscal year, our technical team meets with the independent reserve engineers to review properties and discuss evaluation methods and assumptions used in the proved reserves estimates, in accordance with our prescribed internal control procedures. Our internal controls over the reserves estimation process include verification of input data into our reserves evaluation software as well as management review, such as, but not limited to the following:
• | Comparison of historical expenses from the lease operating statements and workover authorizations for expenditure to the operating costs input in our reserves database; |
• | Review of working interests and net revenue interests in our reserves database against our well ownership system; |
• | Review of historical realized prices and differentials from index prices as compared to the differentials used in our reserves database; |
• | Review of updated capital costs prepared by our operations team; |
• | Review of internal reserve estimates by well and by area by our internal reservoir engineers; |
• | Discussion of material reserve variances among our internal reservoir engineers and our Senior Vice President of Asset Management and Chief Engineer; |
• | Review of a preliminary copy of the reserve report by our President and Chief Operating Officer with our internal technical staff; and |
• | Review of our reserves estimation process by our Audit Committee on an annual basis. |
Production, revenues and price history
We produce and market oil and natural gas, which are commodities. The price that we receive for the oil and natural gas we produce is largely a function of market supply and demand. Demand is impacted by general economic conditions, weather and other seasonal conditions, including hurricanes and tropical storms. Over or under supply of oil or natural gas can result in substantial price volatility. Oil supply in the United States grew dramatically over the past several years, and this contributed to a global oversupply of crude oil, which caused a sharp decline in oil prices beginning in mid-2014. In 2015 and 2016, oil inventories continued to build as global oil supply continued to outpace demand. On November 30, 2016, members of the Organization of Petroleum Exporting Countries (“OPEC”) agreed to reduce oil production in the first half of 2017, and in December 2016, non-OPEC countries, including Russia, also agreed to reduce output in early 2017 as part of an effort with
10
OPEC countries to accelerate rebalancing the oil market. These agreements contributed to the increase in oil prices at the end of 2016. Historically, commodity prices have been volatile, and we expect that volatility to continue in the future. Further declines in oil and natural gas prices, extended low oil and natural gas prices or poor drilling results could have a material adverse effect on our financial position, results of operations, cash flows, quantities of oil and natural gas reserves that may be economically produced and our ability to access capital markets. Please see “Item 1A. Risk Factors—Risks related to the oil and natural gas industry and our business—Further declines, or extended low commodity prices, in oil and, to a lesser extent, natural gas prices may adversely affect our business, financial condition or results of operations and our ability to meet our capital expenditure obligations and financial commitments.”
The following table sets forth information regarding our oil and natural gas production, realized prices and production costs for the periods indicated. For additional information on price calculations, please see information set forth in “Item 7. Management’s Discussion and Analysis of Financial Condition and Results of Operations.”
Year Ended December 31, | |||||||||||
2016 | 2015 | 2014 | |||||||||
Net production volumes: | |||||||||||
Oil (MBbls) | 15,174 | 16,091 | 14,883 | ||||||||
Natural gas (MMcf) | 19,573 | 14,002 | 10,691 | ||||||||
Oil equivalents (MBoe) | 18,436 | 18,424 | 16,664 | ||||||||
Average daily production (Boe per day) | 50,372 | 50,477 | 45,656 | ||||||||
Average sales prices: | |||||||||||
Oil, without derivative settlements (per Bbl)(1) | $ | 38.64 | $ | 43.04 | $ | 82.73 | |||||
Oil, with derivative settlements (per Bbl)(1)(2) | 46.68 | 66.06 | 83.19 | ||||||||
Natural gas (per Mcf)(3) | 1.99 | 2.08 | 6.81 | ||||||||
Costs and expenses (per Boe of production): | |||||||||||
Lease operating expenses | $ | 7.35 | $ | 7.84 | $ | 10.18 | |||||
Marketing, transportation and gathering expenses | 2.19 | 1.72 | 1.75 | ||||||||
Production taxes | 3.07 | 3.78 | 7.66 | ||||||||
Depreciation, depletion and amortization | 25.84 | 26.34 | 24.74 | ||||||||
General and administrative expenses | 5.04 | 5.02 | 5.54 | ||||||||
__________________
(1) | For the year ended December 31, 2016, average sales prices for oil are calculated using total oil revenues, excluding bulk oil sales of $10.3 million, divided by oil production. |
(2) | Realized prices include gains or losses on cash settlements for our commodity derivatives, which do not qualify for and were not designated as hedging instruments for accounting purposes. Cash settlements represent the cumulative gains and losses on our derivative instruments for the periods presented and do not include a recovery of costs that were paid to acquire or modify the derivative instruments that were settled. |
(3) | Natural gas prices include the value for natural gas and natural gas liquids. |
Net production volumes for the year ended December 31, 2016 were 18,436 MBoe as compared to net production of 18,424 MBoe for the year ended December 31, 2015. Our net production volumes remained relatively consistent from 2015 to 2016 primarily due to a successful operated and non-operated drilling and completion program and our recent acquisition of producing properties in December 2016, offset by the natural decline in production in wells that were producing as of December 31, 2015. Average oil sales prices, without derivative settlements, decreased by $4.40 per barrel, or 10%, to an average of $38.64 per barrel for the year ended December 31, 2016 as compared to the year ended December 31, 2015. Giving effect to our derivative transactions in both periods, our oil sales prices decreased $19.38 per barrel to $46.68 per barrel for the year ended December 31, 2016 from $66.06 per barrel for the year ended December 31, 2015.
Net production volumes for the year ended December 31, 2015 were 18,424 MBoe, an 11% increase from net production of 16,664 MBoe for the year ended December 31, 2014. Our net production volumes increased 1,760 MBoe over 2014 primarily due to a successful operated and non-operated drilling and completion program. Average oil sales prices, without derivative settlements, decreased by $39.69 per barrel, or 48%, to an average of $43.04 per barrel for the year ended December 31, 2015 as compared to the year ended December 31, 2014. Giving effect to our derivative transactions in both periods, our oil sales prices decreased $17.13 per barrel to $66.06 per barrel for the year ended December 31, 2015 from $83.19 per barrel for the year ended December 31, 2014.
11
Productive wells
The following table presents the total and operated gross and net productive wells as of December 31, 2016:
Total wells | Operated wells | ||||||||||
Gross | Net | Gross | Net | ||||||||
Bakken and Three Forks | 1,413 | 756.5 | 909 | 693.3 | |||||||
Other | 84 | 54.5 | 66 | 51.8 | |||||||
Total wells | 1,497 | 811.0 | 975 | 745.1 | |||||||
All of our productive wells are oil wells. Gross wells are the number of wells, operated and non-operated, in which we own a working interest and net wells are the total of our working interests owned in gross wells.
Acreage
The following table sets forth certain information regarding the developed and undeveloped acreage in which we own a working interest as of December 31, 2016. Acreage related to royalty, overriding royalty and other similar interests is excluded from this summary.
Gross | Net | ||||
Developed acres | 558,564 | 417,220 | |||
Undeveloped acres | 171,703 | 100,581 | |||
Total acres | 730,267 | 517,801 | |||
We increased our acreage that is held by production to 484,321 net acres at December 31, 2016 from 442,292 net acres at December 31, 2015 primarily due to our acquisitions during 2016.
Undeveloped acreage
The following table sets forth the number of gross and net undeveloped acres as of December 31, 2016 that will expire over the next three years unless production is established within the spacing units covering the acreage prior to the expiration dates:
Undeveloped acres expiring | |||||
Gross | Net | ||||
Year ending December 31, | |||||
2017 | 13,935 | 9,970 | |||
2018 | 12,252 | 8,864 | |||
2019 | 3,054 | 2,923 | |||
Drilling and completion activity
The following table summarizes our completion activity for the years ended December 31, 2016, 2015 and 2014. Gross wells reflect the sum of all productive and dry wells, operated and non-operated, in which we own a working interest. Net wells reflect the sum of our working interests in gross wells. The gross and net wells represent wells completed during the periods presented, regardless of when drilling was initiated.
12
Year ended December 31, | |||||||||||||||||
2016 | 2015 | 2014 | |||||||||||||||
Gross | Net | Gross | Net | Gross | Net | ||||||||||||
Development wells: | |||||||||||||||||
Oil | 64 | 38.1 | 115 | 59.1 | 188 | 102.6 | |||||||||||
Gas | — | — | — | — | — | — | |||||||||||
Dry | — | — | — | — | — | — | |||||||||||
Total development wells | 64 | 38.1 | 115 | 59.1 | 188 | 102.6 | |||||||||||
Exploratory wells: | |||||||||||||||||
Oil | — | — | 6 | 5.2 | 81 | 48.5 | |||||||||||
Gas | — | — | — | — | — | — | |||||||||||
Dry | — | — | — | — | — | — | |||||||||||
Total exploratory wells | — | — | 6 | 5.2 | 81 | 48.5 | |||||||||||
Total wells | 64 | 38.1 | 121 | 64.3 | 269 | 151.1 | |||||||||||
Since 2014, we have focused on full field development and have concentrated on improving capital efficiency and completing more wells using high-intensity completion techniques in 2015 and 2016. We also continued to participate in a number of wells on a non-operated basis.
We did not drill any dry hole wells in 2016, 2015 or 2014.
As of December 31, 2016, we had two operated rigs running, 2 gross (1.3 net) operated wells drilling and an inventory of 83 gross operated wells waiting on completion. We expect to continue to concentrate drilling activities in the Bakken and Three Forks formations within our core acreage in 2017.
Capital expenditure budget
In 2016, we spent $1,181.5 million on capital expenditures, which represented a 94% increase over the $610.0 million spent during 2015. Excluding acquisitions of $781.5 million in 2016 and $28.7 million in 2015, our capital expenditures decreased 31% to $400.0 million from the $581.3 million spent during 2015. This reduction was primarily due to reduced drilling and completion activity as a result of lower commodity prices in 2016 coupled with lower well costs as a result of both improved operational efficiency and lower service costs, partially offset by higher capital expenditures for OMS, primarily related to the construction of midstream infrastructure, including a natural gas processing plant and crude oil system, in our Wild Basin area in North Dakota. See “Item 7. Management’s Discussion and Analysis of Financial Condition and Results of Operations—Liquidity and capital resources—Cash flows used in investing activities.”
We have increased our planned 2017 capital expenditures as compared to 2016, excluding acquisitions, as a result of current commodity prices. Our total 2017 capital expenditure budget is $605 million, which includes $410 million of drilling and completion capital expenditures (including expected savings from services provided by OWS and OMS), $110 million for midstream infrastructure and $85 million of other capital expenditures, including other E&P capital, capitalized interest, well services equipment and administrative capital. We plan to complete approximately 76 gross (51.7 net) operated wells and participate in 2.4 net non-operated wells that are expected to be completed and brought on production in 2017.
While we have budgeted $605 million in 2017 for these purposes, the ultimate amount of capital we will expend may fluctuate materially based on market conditions and the success of our drilling results as the year progresses. Additionally, if we acquire additional acreage, our capital expenditures may be higher than budgeted. See “Item 7. Management’s Discussion and Analysis of Financial Condition and Results of Operations—Liquidity and capital resources.”
Description of properties
Our operations are focused in the North Dakota and Montana areas of the Williston Basin. While we have interests in a substantial number of wells in the Williston Basin that target several different zones, our development activities are currently concentrated in the Bakken and Three Forks formations. Our management team originally targeted the Williston Basin because of its oil-prone nature, multiple producing horizons, substantial resource potential and management’s previous professional history in the basin. The Williston Basin also generally has established infrastructure and access to materials and services.
The entire Williston Basin is spread across North Dakota, South Dakota, Montana and parts of southern Canada. The basin produces oil and natural gas from numerous producing horizons including, but not limited to, the Bakken, Three Forks,
13
Madison and Red River formations. A report issued by the United States Geological Survey in April 2008 classified these formations as the largest continuous oil accumulation ever assessed by it in the contiguous United States. The Williston Basin has been one of the most actively drilled unconventional oil resource plays in the United States, reaching over 200 rigs drilling in the basin in 2014. The active rig count decreased throughout 2015 and 2016 due to low oil prices and fell to fewer than 25 rigs drilling in the basin in the second quarter of 2016. In the second half of 2016, the active rig count slightly increased to over 30 rigs currently drilling. Most rigs that are running in the Williston Basin are focused on drilling areas with the highest estimated ultimate recoveries that have attractive economics even in depressed oil price environments. Our development activity is focused in the deepest part of the Williston Basin, which we call the core.
The Devonian-age Bakken formation is found within the Williston Basin underlying portions of North Dakota and Montana and is comprised of three lithologic members including the upper shale, middle Bakken and lower shale. The formation ranges up to 150 feet thick. The upper and lower shales are highly organic, thermally mature and over pressured and can act as both a source and reservoir for the oil. The middle Bakken, which varies in composition from a silty dolomite to shaley limestone or sand, also serves as a reservoir and is a critical component for commercial production. Generally, the Bakken formation is found at vertical depths of 8,500 to 11,500 feet. Based on our geologic interpretation of the Bakken formation, the evolution of completion techniques, our own drilling results and publicly available drilling results for other operators in the basin, we believe that a substantial portion of our Williston Basin acreage is prospective in the Bakken formation.
The Three Forks formation, generally found immediately under the Bakken formation, has also proven to contain productive reservoir rock. The Three Forks formation typically consists of interbedded dolomites and shale with local development of a discontinuous sandy member at the top, known as Sanish sand. The Three Forks formation is an unconventional carbonate play. Based on our geologic interpretation of the Three Forks formation, the evolution of completion techniques, our own drilling results and publicly available drilling results for other operators in the basin, we believe that much of our Williston Basin acreage is prospective in the Three Forks formation.
Our total leasehold position in the Williston Basin as of December 31, 2016 consisted of 517,801 net acres. Our estimated net proved reserves in the Williston Basin were 305.1 MMBoe at December 31, 2016. Of our estimated net proved reserves in the Williston Basin, approximately 190.6 MMBoe were proved developed reserves, which are comprised of a combination of wells drilled to conventional reservoirs, Bakken and Three Forks wells drilled with older completion techniques, and to a much larger extent, Bakken and Three Forks wells drilled with completion techniques similar to those we currently employ. Of our estimated net proved reserves, 114.5 MMBoe were proved undeveloped reserves, all of which consisted of Bakken and Three Forks wells to be drilled with more recent completion techniques, which incorporates the impact of high intensity completion techniques. As of December 31, 2016, we had a total of 811.0 net operated and non-operated producing wells and 745.1 net operated producing wells in the Williston Basin. We had average daily production of 50,372 net Boe per day for the year ended December 31, 2016 in the Williston Basin. During 2016, our Bakken and Three Forks wells produced a daily average of 50,131 net Boe per day with 756.5 net producing wells on December 31, 2016. Accordingly, our 756.5 net Bakken and Three Forks wells were responsible for nearly 100% of our average daily production during 2016. As of December 31, 2016, our working interest for all producing wells averaged 54% and in the wells we operate averaged 76%. As of December 31, 2016, we had 141 gross (65.2 net) wells in the process of being drilled or completed in the Williston Basin, which includes two gross operated wells drilling, 83 gross operated wells waiting on completion and 56 gross non-operated wells drilling or completing. We participated in 64 gross (38.1 net) wells that were completed and brought on production during 2016.
Marketing, transportation and major customers
The Williston Basin crude oil rail and pipeline transportation and refining infrastructure has grown substantially over the past decade, largely in response to drilling activity in the Bakken and Three Forks formations. In December 2016, oil production in North Dakota was approximately 942,000 barrels per day. According to the North Dakota Pipeline Authority website’s data last updated January 13, 2017, there was approximately 851,000 barrels per day of crude oil pipeline transportation capacity and approximately 1,520,000 barrels per day of specifically dedicated rail loading capacity in the Williston Basin as of December 31, 2016. In 2016, we continued to sell a significant amount of our crude oil production through gathering systems connected to multiple pipeline and rail facilities. These gathering systems, which typically originate at the wellhead, reduce the need to transport barrels by truck from the wellhead. As of December 31, 2016, we were flowing over 90% of our gross operated oil production through these gathering systems.
Crude oil produced and sold in the Williston Basin has historically sold at a discount to WTI due to transportation costs and takeaway capacity. In the past, there have been periods when this discount has substantially increased due to the production of oil in the area increasing to a point that it temporarily surpasses the available pipeline transportation, rail transportation and refining capacity in the area. Expansions of both rail and pipeline facilities have reduced the prior constraint on oil transportation out of the Williston Basin and improved netback pricing received at the lease. In 2015, our price differentials relative to WTI strengthened as new pipelines opened to eastern Canada and U.S. markets and transportation on rail gradually
14
declined. Since the third quarter of 2015, our price differentials have averaged less than $5.00 per barrel discount to WTI. We expect differentials to improve as takeaway capacity in the Williston Basin will increase by over 500,000 barrels of oil per day if the Dakota Access Pipeline is completed and put in service. Our market optionality on the crude oil gathering systems allows us to shift volumes between pipeline and rail markets in order to optimize price realizations. For a discussion of the potential risks to our business that could result from transportation and refining infrastructure constraints in the Williston Basin, please see “Item 1A. Risk Factors—Risks related to the oil and natural gas industry and our business—Insufficient transportation or refining capacity in the Williston Basin could cause significant fluctuations in our realized oil and natural gas prices.”
We principally sell our oil and natural gas production to refiners, marketers and other purchasers that have access to nearby pipeline and rail facilities. Our marketing of oil and natural gas can be affected by factors beyond our control, the effects of which cannot be accurately predicted. For a description of some of these factors, please see “Item 1A. Risk Factors—Risks related to the oil and natural gas industry and our business—Market conditions or operational impediments may hinder our access to oil and natural gas markets or delay our production” and “Item 1A. Risk Factors—Risks related to the oil and natural gas industry and our business—Insufficient transportation or refining capacity in the Williston Basin could cause significant fluctuations in our realized oil and natural gas prices.” At the end of 2015, the U.S. government lifted the long-standing ban on crude oil exports. While we believe this could have a positive impact on the long-term value of Bakken crude oil, current market conditions are not expected to result in sizable quantities of U.S. crude oil being exported out of the country.
In an effort to improve price realizations from the sale of our oil and natural gas, we manage our commodities marketing activities in-house, which enables us to market and sell our oil and natural gas to a broader array of potential purchasers. As of December 31, 2016, we sold a substantial majority of our oil and condensate through bulk sales at delivery points on crude oil gathering systems or directly at the wellhead to a variety of purchasers at prevailing market prices under short-term contracts that normally provide for us to receive a market-based price, which incorporates regional differentials that include, but are not limited to, transportation costs and adjustments for product quality. We also entered into various short-term sales contracts for a portion of our portfolio at fixed differentials. Due to the availability of other markets and pipeline connections, we do not believe that the loss of any single oil or natural gas customer would have a material adverse effect on our results of operations or cash flows.
For the year ended December 31, 2016, sales to PBF Holding Company LLC accounted for approximately 10% of our total sales. For the year ended December 31, 2015, sales to Shell Trading (US) Company accounted for approximately 10% of our total sales. For the year ended December 31, 2014, sales to Musket Corporation accounted for approximately 13% of our total sales. No other purchasers accounted for more than 10% of our total oil and natural gas sales for the years ended December 31, 2016, 2015 and 2014. We believe that the loss of any of these purchasers would not have a material adverse effect on our operations, as there are a number of alternative crude oil and natural gas purchasers in the Williston Basin.
Since most of our oil and natural gas production is sold under market-based or spot market contracts, the revenues generated by our operations are highly dependent upon the prices of and demand for oil and natural gas. The price we receive for our oil and natural gas production depends upon numerous factors beyond our control, including but not limited to seasonality, weather, competition, availability of transportation and gathering capabilities, worldwide and regional economic conditions, global and domestic oil supply, foreign imports, political conditions in other oil-producing and natural gas-producing regions, the actions of OPEC and domestic government regulation, legislation and policies. Please see “Item 1A. Risk Factors—Risks related to the oil and natural gas industry and our business—Further declines, or extended low commodity prices, in oil and, to a lesser extent, natural gas prices may adversely affect our business, financial condition or results of operations and our ability to meet our capital expenditure obligations and financial commitments.” Furthermore, a decrease in the price of oil and natural gas could have an adverse effect on the carrying value of our estimated proved reserves and on our revenues, profitability and cash flows. Please see “Item 1A. Risk Factors—Risks related to the oil and natural gas industry and our business—If oil and natural gas prices remain at their current level for an extended period of time or continue to decline, we may be required to take write-downs of the carrying values of our oil and natural gas properties.”
Market, economic, transportation and regulatory factors may in the future materially affect our ability to market our oil or natural gas production. Please see “Item 1A. Risk Factors—Risks related to the oil and natural gas industry and our business—Market conditions or operational impediments may hinder our access to oil and natural gas markets or delay our production.”
Competition
The oil and natural gas industry is worldwide and highly competitive in all phases. We encounter competition from other oil and natural gas companies in all areas of operation, including the acquisition of leasing options on oil and natural gas properties to the exploration and development of those properties. Our competitors include major integrated oil and natural gas companies, numerous independent oil and natural gas companies, individuals and drilling and income programs. Many of our competitors are large, well established companies that have substantially larger operating staffs and greater capital resources
15
than we do. Such companies may be able to pay more for lease options on oil and natural gas properties and exploratory locations and to define, evaluate, bid for and purchase a greater number of properties and locations than our financial or human resources permit. Our ability to acquire additional properties and to discover reserves in the future will depend upon our ability to evaluate and select suitable properties and to consummate transactions in a highly competitive environment. Please see “Item 1A. Risk Factors—Risks related to the oil and natural gas industry and our business—Competition in the oil and natural gas industry is intense, making it more difficult for us to acquire properties, market oil and natural gas and secure trained personnel.”
Title to properties
As is customary in the oil and gas industry, we initially conduct a preliminary review of the title to our properties on which we do not have proved reserves. Prior to the commencement of drilling operations on those properties, we conduct a thorough title examination and perform curative work with respect to significant title defects. To the extent title opinions or other investigations reflect title defects on those properties, we are typically responsible for curing any title defects at our expense. We generally will not commence drilling operations on a property until we have cured any material title defects on such property. We have obtained title opinions on substantially all of our producing properties and believe that we have satisfactory title to our producing properties in accordance with general industry standards. Prior to completing an acquisition of producing oil and natural gas leases, we perform title reviews on the most significant leases and, depending on the materiality of the properties, we may obtain a title opinion or review previously obtained title opinions. Our oil and natural gas properties are subject to customary royalty and other interests, liens to secure borrowings under our revolving credit facility, liens for current taxes and other burdens, which we believe do not materially interfere with the use or affect our carrying value of the properties. Please see “Item 1A. Risk Factors—Risks related to the oil and natural gas industry and our business—We may incur losses as a result of title defects in the properties in which we invest.”
Seasonality
Winter weather conditions and lease stipulations can limit or temporarily halt our drilling, completion and producing activities and other oil and natural gas operations. These constraints and the resulting shortages or high costs could delay or temporarily halt our operations and materially increase our operating and capital costs. Such seasonal anomalies can also pose challenges for meeting our well drilling objectives and may increase competition for equipment, supplies and personnel during the spring and summer months, which could lead to shortages and increase costs or delay or temporarily halt our operations.
Regulation of the oil and natural gas industry
Our producing, midstream and well services operations are substantially affected by federal, state and local laws and regulations. In particular, oil and natural gas production, oil gathering and transportation, natural gas processing and related operations are, or have been, subject to price controls, taxes and numerous other laws and regulations. All of the jurisdictions in which we own or operate properties for oil and natural gas production or otherwise provide midstream services have statutory provisions regulating the exploration for and production of oil and natural gas or the gathering, transportation and processing of those commodities, including provisions related to permits for the drilling of wells or processing of natural gas, bonding requirements to drill or operate producing or injection wells, the location of wells, the method of drilling and casing wells, the surface use and restoration of properties upon which wells are drilled or processing plants are constructed, sourcing and disposal of water used in the drilling and completion process and the abandonment of wells. Our operations are also subject to various conservation laws and regulations. These include regulation of the size of drilling and spacing units or proration units, the number of wells which may be drilled in an area, the siting of processing plants, disposal wells and gathering or transportation lines, and the unitization or pooling of oil and natural gas wells, as well as regulations that generally prohibit the venting or flaring of natural gas and impose certain requirements regarding the ratability or fair apportionment of production from fields and individual wells.
Failure to comply with applicable laws and regulations can result in substantial penalties. The regulatory burden on the industry increases the cost of doing business and affects profitability. Historically, our compliance costs with applicable laws and regulations have not had a material adverse effect on our financial position, cash flow and results of operations; however, there can be no assurance that such costs will not be material in the future as these laws and regulations are subject to amendment or reinterpretation. Additionally, currently unforeseen environmental incidents such as spills or other releases may occur or past non-compliance with environmental laws or regulations may be discovered. Therefore, we are unable to predict the future costs or impact of compliance. Additional proposals and proceedings that affect the oil and natural gas industry are regularly considered by Congress, the states, the Federal Energy Regulatory Commission (“FERC”) and the courts. We cannot predict when or whether any such proposals may become effective.
16
Regulation of transportation of oil
Sales of crude oil, condensate and natural gas liquids are not currently regulated and are made at negotiated prices. Nevertheless, Congress could reenact price controls in the future.
Our sales of crude oil are affected by the availability, terms and cost of transportation. The transportation of oil by common carrier pipelines is also subject to rate and access regulation. The FERC regulates interstate oil pipeline transportation rates under the Interstate Commerce Act. In general, interstate oil pipeline rates must be cost-based, although settlement rates agreed to by all shippers are permitted and market-based rates may be permitted in certain circumstances. Effective January 1, 1995, the FERC implemented regulations establishing an indexing system (based on inflation) for transportation rates for oil pipelines that allows a pipeline to increase its rates annually up to a prescribed ceiling, without making a cost of service filing. Every five years, the FERC reviews the appropriateness of the index level in relation to changes in industry costs. Most recently, on December 16, 2010, the FERC established a new price index for the five-year period beginning July 1, 2011.
Intrastate oil pipeline transportation rates are subject to regulation by state regulatory commissions. The basis for intrastate oil pipeline regulation, and the degree of regulatory oversight and scrutiny given to intrastate oil pipeline rates, varies from state to state. Insofar as effective interstate and intrastate rates are equally applicable to all comparable shippers, we believe that the regulation of oil transportation rates will not affect our operations in any way that is of material difference from those of our competitors who are similarly situated.
Further, interstate and intrastate common carrier oil pipelines must provide service on a non-discriminatory basis. Under this open access standard, common carriers must offer service to all similarly situated shippers requesting service on the same terms and under the same rates. When oil pipelines operate at full capacity, access is generally governed by prorationing provisions set forth in the pipelines’ published tariffs. Accordingly, we believe that access to oil pipeline transportation services generally will be available to us to the same extent as to our similarly situated competitors.
We sell a significant amount of our crude oil production through gathering systems connected to rail facilities. Several derailments of freight trains have led transportation safety regulators in the United States and Canada to examine whether the hazardous nature of crude oil from the Bakken shale is being assessed properly prior to its shipment. In particular, there are concerns that the testing and ensuing designations of crude oil on the shipping documentation do not in all cases accurately capture the flammability of the Bakken shale crude oil. In January 2014, the Pipeline and Hazardous Materials Safety Administration (“PHMSA”) released a Safety Alert alerting regulators, emergency responders, transporters and shippers that crude oil from the Bakken shale may have flammability characteristics that are different from other forms of crude oil and that it was vital that all shipments of crude oil be tested and properly characterized on all shipping documentation. The Safety Alert also notified the regulated community that PHMSA and the Federal Railroad Administration (“FRA”) had launched an enforcement initiative that involved unannounced inspections on crude oil shipments to test the contents of the shipments in order to ensure that they are properly characterized. In August 2014, the U.S. Department of Transportation released a report finding that, based on the results of this enforcement initiative from August 2013 to May 2014, Bakken shale crude oil tended to be more volatile and flammable than other crude oils, and thus posed an increased risk for a significant accident.
These events have also spurred efforts to improve the safety of tank cars that are used in transporting crude oil by rail. Since 2011, all new railroad tank cars that have been built to transport crude oil or other petroleum type fluids, including ethanol, have been built to more stringent safety standards. In May 2015, PHMSA adopted a final rule that includes, among other things, additional requirements to enhance tank car standards for certain trains carrying crude oil and ethanol, a classification and testing program for crude oil, and a requirement that older DOT-111 tank cars be phased out by as early as October 1, 2017 if they are not already retrofitted to comply with new tank car design standards. The rule also includes a new braking standard for certain trains, designates new operational protocols for trains transporting large volumes of flammable liquids, such as routing analyses, speed restrictions and information for local government agencies, and provides new sampling and testing requirements to improve classification of energy products placed into transport. In August 2016, PHMSA released a final rule mandating a phase-out schedule for all DOT-111 tank cars used to transport Class 3 flammable liquids, including crude oil and ethanol, between 2018 and 2029. Additionally, in July 2016, PHMSA proposed a new rule that would expand the applicability of comprehensive oil spill response plans so that any railroad that transports a single train carrying 20 or more loaded tanks of liquid petroleum oil in a continuous block or a single train carrying 35 or more loaded tank cars of liquid petroleum oil throughout the train must have a current, comprehensive, written plan. In response to a petition from the New York Attorney General, PHMSA issued an advance notice of proposed rulemaking (“ANPR”) in January 2017 stating that it is considering revising the Hazardous Materials Regulations (“HMR”) to establish vapor pressure limits for unrefined petroleum-based products and potentially all Class 3 flammable liquid hazardous materials that would apply during the transportation of the products or materials by any mode. In addition, in February 2016, the FRA modified its accident and incident reports to gather additional data concerning rail cars carrying crude oil in any train involved in an FRA-reportable accident. In addition to action taken or proposed by federal agencies, a number of states proposed or enacted laws in recent years that encourage safer rail operations or urge the federal government to strengthen requirements for these operations.
17
Safety improvements or updates to existing tank cars that are imposed under the May 2015 PHMSA requirements could drive up the cost of transport and lead to shortages in availability of tank cars. We do not currently own or operate rail transportation facilities or rail cars; however, we cannot assure that costs incurred by the railroad industry to comply with these enhanced standards resulting from PHMSA’s final rule will not increase our costs of doing business or limit our ability to transport and sell our crude oil at favorable prices, the consequences of which could be material to our business, financial condition or results of operations. However, we believe that any such consequences would not affect our operations in any way that is of material difference from those of our competitors who are similarly situated.
Efforts are likewise underway in Canada to assess and address risks from the transport of crude oil by rail. For example, in April 2014, Transport Canada issued a protective order prohibiting oil shippers from using 5,000 of the DOT 111 tank cars and imposing a three year phase out period for approximately 65,000 tank cars that do not meet certain safety requirements. Transport Canada also imposed a 50 mile per hour speed limit on trains carrying hazardous materials and required all crude oil shipments in Canada to have an emergency response plan. At the same time that PHMSA released its 2015 rule, Canada’s Minister of Transport announced Canada’s new tank car standards, which largely align with the requirements in the PHMSA rule. Likewise, Transport Canada’s rail car retrofitting and phase out timeline largely aligns with the timeline introduced under the 2015 and 2016 PHMSA rules. Transport Canada has also introduced new requirements that railways carry minimum levels of insurance depending on the quantity of crude oil or dangerous goods that they transport as well as a final report recommending additional practices for the transportation of dangerous goods.
Historically, our hazardous materials transportation compliance costs have not had a material adverse effect on our results of operations; however, these, and future laws, regulatory changes, or initiatives regarding hazardous material transportation, could directly and indirectly increase our operation, compliance and transportation costs and lead to shortages in availability of tank cars. We cannot assure that costs incurred to comply with standards and regulations emerging from these and future rulemakings will not be material to our business, financial condition or results of operations. Moreover, we may incur significant constraints on transportation capacity during the period while tank cars are being retrofitted or newly constructed to comply with the new regulations. In addition, any derailment of crude oil from the Bakken shale involving crude oil that we have sold or are shipping may result in claims being brought against us that may involve significant liabilities. Although we believe that we are adequately insured against such events, we cannot assure you that our insurance policies will cover the entirety of any damages that may arise from such an event. Nonetheless, we believe that any such consequences would not affect our operations in any way that is of material difference from those of our competitors who are similarly situated.
Regulation of transportation and sales of natural gas
Historically, the transportation and sale for resale of natural gas in interstate commerce has been regulated by the FERC under the Natural Gas Act of 1938 (“NGA”), the Natural Gas Policy Act of 1978 (“NGPA”) and regulations issued under those statutes. In the past, the federal government has regulated the prices at which natural gas could be sold. While sales by producers of natural gas can currently be made at market prices, Congress could reenact price controls in the future. Deregulation of wellhead natural gas sales began with the enactment of the NGPA and culminated in adoption of the Natural Gas Wellhead Decontrol Act which removed all price controls affecting wellhead sales of natural gas effective January 1, 1993.
FERC regulates interstate natural gas transportation rates, and terms and conditions of service, which affects the marketing of natural gas that we produce, as well as the revenues we receive for sales of our natural gas. Since 1985, the FERC has endeavored to make natural gas transportation more accessible to natural gas buyers and sellers on an open and non-discriminatory basis. The FERC has stated that open access policies are necessary to improve the competitive structure of the interstate natural gas pipeline industry and to create a regulatory framework that will put natural gas sellers into more direct contractual relations with natural gas buyers by, among other things, unbundling the sale of natural gas from the sale of transportation and storage services. Beginning in 1992, the FERC issued a series of orders, beginning with Order No. 636, to implement its open access policies. As a result, the interstate pipelines’ traditional role of providing the sale and transportation of natural gas as a single service has been eliminated and replaced by a structure under which pipelines provide transportation and storage service on an open access basis to others who buy and sell natural gas. Although the FERC’s orders do not directly regulate natural gas producers, they are intended to foster increased competition within all phases of the natural gas industry.
In 2000, the FERC issued Order No. 637 and subsequent orders, which imposed a number of additional reforms designed to enhance competition in natural gas markets. Among other things, Order No. 637 revised the FERC’s pricing policy by waiving price ceilings for short-term released capacity for a two-year experimental period, and effected changes in FERC regulations relating to scheduling procedures, capacity segmentation, penalties, rights of first refusal and information reporting. The natural gas industry historically has been very heavily regulated. Therefore, we cannot provide any assurance that the less stringent regulatory approach recently established by the FERC under Order No. 637 will continue. However, we do not believe that any action taken will affect us in a way that materially differs from the way it affects other natural gas producers.
The price at which we sell natural gas is not currently subject to federal rate regulation and, for the most part, is not subject to state regulation. However, with regard to our physical sales of energy commodities, we are required to observe anti-market
18
manipulation laws and related regulations enforced by the FERC and/or the Commodity Futures Trading Commission (“CFTC”) and the Federal Trade Commission (“FTC”). Please see below the discussion of “Other federal laws and regulations affecting our industry—Energy Policy Act of 2005.” Should we violate the anti-market manipulation laws and regulations, we could also be subject to related third party damage claims by, among others, sellers, royalty owners and taxing authorities. In addition, pursuant to Order No. 704, some of our operations may be required to annually report to FERC on May 1 of each year for the previous calendar year. Order No. 704 requires certain natural gas market participants to report information regarding their reporting of transactions to price index publishers and their blanket sales certificate status, as well as certain information regarding their wholesale, physical natural gas transactions for the previous calendar year depending on the volume of natural gas transacted. Please see below the discussion of “Other federal laws and regulations affecting our industry—FERC market transparency rules.”
Gathering services, which occur upstream of FERC jurisdictional transmission services, are regulated by the states onshore and in state waters. Although the FERC has set forth a general test for determining whether facilities perform a non-jurisdictional gathering function or a jurisdictional transmission function, the FERC’s determinations as to the classification of facilities is done on a case by case basis. State regulation of natural gas gathering facilities generally includes various safety, environmental and, in some circumstances, nondiscriminatory take requirements. Although such regulation has not generally been affirmatively applied by state agencies, natural gas gathering may receive greater regulatory scrutiny in the future.
Intrastate natural gas transportation and facilities are also subject to regulation by state regulatory agencies, and certain transportation services provided by intrastate pipelines are also regulated by FERC. The basis for intrastate regulation of natural gas transportation and the degree of regulatory oversight and scrutiny given to intrastate natural gas pipeline rates and services varies from state to state. Insofar as such regulation within a particular state will generally affect all intrastate natural gas shippers within the state on a comparable basis, we believe that the regulation of similarly situated intrastate natural gas transportation in any states in which we operate and ship natural gas on an intrastate basis will not affect our operations in any way that is of material difference from those of our competitors. Like the regulation of interstate transportation rates, the regulation of intrastate transportation rates affects the marketing of natural gas that we produce, as well as the revenues we receive for sales of our natural gas.
Regulation of production
The production of oil and natural gas is subject to regulation under a wide range of local, state and federal statutes, rules, orders and regulations. Federal, state and local statutes and regulations require permits for drilling operations, drilling bonds and reports concerning operations. We own and operate properties in North Dakota and Montana, which have regulations governing conservation matters, including provisions for the unitization or pooling of oil and natural gas properties, the establishment of maximum allowable rates of production from oil and natural gas wells, the regulation of well spacing, and plugging and abandonment of wells. The effect of these regulations is to limit the amount of oil and natural gas that we can produce from our wells and to limit the number of wells or the locations at which we can drill, although we can apply for exceptions to such regulations or to have reductions in well spacing. Moreover, both states impose a production or severance tax with respect to the production and sale of oil, natural gas and natural gas liquids within their jurisdictions.
The failure to comply with these rules and regulations can result in substantial penalties. Our competitors in the oil and natural gas industry are subject to the same regulatory requirements and restrictions that affect our operations.
Other federal laws and regulations affecting our industry
Energy Policy Act of 2005. On August 8, 2005, President Bush signed into law the Energy Policy Act of 2005 (“EPAct 2005”). EPAct 2005 is a comprehensive compilation of tax incentives, authorized appropriations for grants and guaranteed loans and significant changes to the statutory policy that affects all segments of the energy industry. Among other matters, EPAct 2005 amends the NGA to add an anti-manipulation provision which makes it unlawful for any entity to engage in prohibited behavior to be prescribed by FERC, and furthermore provides FERC with additional civil penalty authority. EPAct 2005 provides the FERC with the power to assess civil penalties of up to $1 million per day for violations of the NGA and increases the FERC’s civil penalty authority under the NGPA from $5,000 per violation per day to $1 million per violation per day. The civil penalty provisions are applicable to entities that engage in the sale of natural gas for resale in interstate commerce. On January 19, 2006, FERC issued Order No. 670, a rule implementing the anti-manipulation provision of EPAct 2005, and subsequently denied rehearing. The rule makes it unlawful for any entity, directly or indirectly, in connection with the purchase or sale of natural gas subject to the jurisdiction of FERC, or the purchase or sale of transportation services subject to the jurisdiction of FERC, to (1) use or employ any device, scheme or artifice to defraud; (2) make any untrue statement of material fact or omit to make any such statement necessary to make the statements made not misleading; or (3) engage in any act, practice or course of business that operates as a fraud or deceit upon any person. The new anti-manipulation rules do not apply to activities that relate only to intrastate or other non-jurisdictional sales or gathering, but do apply to activities of gas pipelines and storage companies that provide interstate services, such as Section 311 service, as well as otherwise non-jurisdictional entities to the
19
extent the activities are conducted “in connection with” gas sales, purchases or transportation subject to FERC jurisdiction, which now includes the annual reporting requirements under Order No. 704, as described below. The anti-manipulation rules and enhanced civil penalty authority reflect an expansion of FERC’s NGA enforcement authority. Should we fail to comply with all applicable FERC administered statutes, rules, regulations and orders, we could be subject to substantial penalties and fines.
FERC market transparency rules. On December 26, 2007, FERC issued a final rule on the annual natural gas transaction reporting requirements, as amended by subsequent orders on rehearing, or Order No. 704. Under Order No. 704, wholesale buyers and sellers of more than 2.2 million MMBtu of physical natural gas in the previous calendar year, including interstate and intrastate natural gas pipelines, natural gas gatherers, natural gas processors, natural gas marketers and natural gas producers, are required to report, on May 1 of each year, aggregate volumes of natural gas purchased or sold at wholesale in the prior calendar year to the extent such transactions utilize, contribute to or may contribute to the formation of price indices. It is the responsibility of the reporting entity to determine which individual transactions should be reported based on the guidance of Order No. 704. Order No. 704 also requires market participants to indicate whether they report prices to any index publishers and, if so, whether their reporting complies with FERC’s policy statement on price reporting.
Effective November 4, 2009, pursuant to the Energy Independence and Security Act of 2007, the FTC issued a rule prohibiting market manipulation in the petroleum industry. The FTC rule prohibits any person, directly or indirectly, in connection with the purchase or sale of crude oil, gasoline or petroleum distillates at wholesale from: (a) knowingly engaging in any act, practice or course of business, including the making of any untrue statement of material fact, that operates or would operate as a fraud or deceit upon any person; or (b) intentionally failing to state a material fact that under the circumstances renders a statement made by such person misleading, provided that such omission distorts or is likely to distort market conditions for any such product. A violation of this rule may result in civil penalties of up to $1 million per day per violation, in addition to any applicable penalty under the Federal Trade Commission Act.
North Dakota Industrial Commission oil and natural gas rules. The North Dakota Industrial Commission (“NDIC”) regulates the drilling and production of oil and natural gas in North Dakota. Beginning in 2012, the NDIC has adopted more stringent rule changes to its existing oil and natural gas regulations, imposing relatively higher bonding amounts for the drilling of wells, severely restricting the discharge and storage of production wastes such as produced water, drilling mud, waste oil and other wastes in earthen pits, implementing more stringent hydraulic fracturing requirements and requiring the provision of public disclosure on the national website, FracFocus.org, regarding chemicals used in the hydraulic fracturing process. During 2016, the NDIC approved a suite of additional rules for the conservation of crude oil and natural gas. New requirements relating to site construction, underground gathering pipelines and spill containment became effective on October 1, 2016 while other requirements relating to bonding requirements for underground gathering pipelines, and construction of berms around facilities became effective on January 1, 2017. Responding to these recent rule changes by oil and natural gas E&P operators in general, and us in particular, increased our well costs from 2012 to 2016, and we expect to continue to incur these increased costs as well as added costs with respect to the 2016 rule changes in order to respond to currently required requirements.
Furthermore, in 2014, the NDIC adopted an order intended to reduce natural gas flaring, which order was subsequently modified in late 2015. Please see below the discussion of “Environmental protection and natural gas flaring initiatives” for more information on this order. In addition, on December 9, 2014, the NDIC adopted new conditioning standards to improve the safety of Bakken crude oil for transport. The rule became effective April 1, 2015 and sets operating standards for conditioning equipment to properly separate production fluids. The rule includes parameters for temperatures and pressures for production equipment. The rule also addresses limits to vapor pressure of produced crude oil.
Additional proposals and proceedings that might affect the natural gas industry are pending before Congress, FERC and the courts. We cannot predict the ultimate impact of these or the above regulatory changes to our natural gas operations. We do not believe that we would be affected by any such action materially differently than similarly situated competitors.
Pipeline safety regulation
Certain of our pipelines are subject to regulation by PHMSA under the Hazardous Liquids Pipeline Safety Act (“HLPSA”) with respect to oil and condensates and the Natural Gas Pipeline Safety Act (“NGPSA”) with respect to natural gas. The HLPSA and NGPSA govern the design, installation, testing, construction, operation, replacement and management of oil and natural gas pipeline facilities. These laws have resulted in the adoption of rules by PHMSA, that, among other things, require transportation pipeline operators to implement integrity management programs, including more frequent inspections, correction of identified anomalies and other measures to ensure pipeline safety in high consequence areas (“HCAs”), such as high population areas, areas unusually sensitive to environmental damage and commercially navigable waterways. In addition, states have adopted regulations similar to existing PHMSA regulations for certain intrastate natural gas and hazardous liquid pipelines, which regulations may impose more stringent requirements than found under federal law. Historically, our pipeline safety compliance costs have not had a material adverse effect on our results of operations; however, there can be no assurance that such costs will not be material in the future or that such future compliance costs will not have a material adverse effect on
20
our business and operating results. New laws or regulations adopted by PHMSA may impose more stringent requirements applicable to integrity management programs and other pipeline safety aspects of our operations, which could cause us to incur increased capital and operating costs and operational delays.
The HLPSA and NGPSA were amended by the Pipeline, Safety, Regulatory Certainty and Job Creation Act of 2011 (the “2011 Pipeline Safety Act”), which became law in January 2012. The 2011 Pipeline Safety Act increased the penalties for safety violations, established additional safety requirements for newly constructed pipelines and required studies of safety issues that could result in the adoption of new regulatory requirements by PHMSA for existing pipelines. More recently, in June 2016, the Protecting Our Infrastructure of Pipelines and Enhancing Safety Act of 2016 (the “2016 Pipeline Safety Act “) was passed, extending PHMSA’s statutory mandate through 2019 and, among other things, requiring PHMSA to complete certain of its outstanding mandates under the 2011 Pipeline Safety Act and developing new safety standards for natural gas storage facilities by June 22, 2018. The 2016 Pipeline Safety Act also empowers PHMSA to address imminent hazards by imposing emergency restrictions, prohibitions and safety measures on owners and operators of hazardous liquid or natural gas pipeline facilities without prior notice or an opportunity for a hearing. PHMSA issued interim regulations in October 2016 to implement the agency's expanded authority to address unsafe pipeline conditions or practices that pose an imminent hazard to life, property, or the environment.
The adoption of new or amended regulations by PHMSA that result in more stringent or costly pipeline integrity management or safety standards could have a significant adverse effect on our results of operations. For example, in April 2015, PHMSA proposed rulemaking that would require leak detection for all hazardous liquid pipelines, including those conveying oil, and require periodic assessment of hazardous liquid pipelines not already covered by the integrity management requirements. In a second example, in March 2016, PHMSA announced a proposed rulemaking that would impose new or more stringent requirements for certain natural gas lines and gathering lines including, among other things, expanding certain of PHMSA’s current regulatory safety programs for natural gas pipelines in newly defined “moderate consequence areas” that contain as few as 5 dwellings within a potential impact area; requiring natural gas pipelines installed before 1970 and thus excluded from certain pressure testing obligations to be tested to determine their maximum allowable operating pressures (“MAOP”); and requiring certain onshore and offshore gathering lines in Class I areas to comply with damage prevention, corrosion control, public education, MAOP limits, line markers and emergency planning standards. Additional requirements proposed by this proposed rulemaking would increase PHMSA’s integrity management requirements for natural gas pipelines and also require consideration of seismicity in evaluating threats to pipelines. New laws or regulations adopted by PHMSA may impose more stringent requirements applicable to integrity management programs and other pipeline safety aspects of our operations, which could cause us to incur increased capital and operating costs and operational delays. In the absence of the PHMSA pursuing any legal requirements, state agencies, to the extent authorized, may pursue state standards, including standards for rural gathering lines.
Environmental and occupational health and safety regulation
Our exploration, development and production operations, oil gathering and transportation activities, natural gas processing services and related operations are subject to stringent federal, regional, state and local laws and regulations governing occupational health and safety, the discharge of materials into the environment or otherwise relating to environmental protection. These laws and regulations may, among other things, require the acquisition of permits to conduct drilling, provide midstream services; govern the amounts and types of substances that may be released into the environment; limit or prohibit construction or drilling activities in environmentally-sensitive areas such as wetlands, wilderness areas or areas inhabited by endangered species; require investigatory and remedial actions to mitigate pollution conditions; impose obligations to reclaim and abandon well sites, pits, processing plants and pipelines; and impose specific criteria addressing worker protection. Failure to comply with these laws and regulations may result in the assessment of sanctions, including administrative, civil and criminal penalties, the imposition of investigatory, remedial and corrective action obligations or the incurrence of capital expenditures, the occurrence of delays in the permitting or development or expansion of projects and the issuance of orders enjoining some or all of our operations in affected areas. These laws and regulations may also restrict the rate of oil and natural gas production below the rate that would otherwise be possible. The regulatory burden on the oil and gas industry increases the cost of doing business in the industry and consequently affects profitability.
The trend in environmental regulation is to place more restrictions and limitations on activities that may affect the environment, and thus, any changes in federal or state environmental laws and regulations or reinterpretation of applicable enforcement policies that result in more stringent and costly well construction, drilling, water management or completion activities, or waste handling, storage, transport, disposal or remediation requirements could have a material adverse effect on our results of operations and financial position. We may be unable to pass on such increased compliance costs to our customers. Moreover, accidental spills or other releases may occur in the course of our operations, and we cannot assure you that we will not incur significant costs and liabilities as a result of such spills or releases, including any third-party claims for damage to property, natural resources or persons. While, historically, our compliance costs with environmental laws and regulations have not had a material adverse effect on our financial position, cash flow and results of operations, there can be no assurance that such costs
21
will not be material in the future as a result of such existing laws and regulations or any new laws and regulations, or that such future compliance will not have a material adverse effect on our business and operating results.
The following is a summary of the more significant existing environmental and occupational health and safety laws, as amended from time to time, to which our business operations are subject and for which compliance may have a material adverse impact on our capital expenditures, results of operations or financial position.
Hazardous substances and wastes
The Comprehensive Environmental Response, Compensation, and Liability Act (“CERCLA”), also known as the Superfund law, and comparable state laws impose liability without regard to fault or the legality of the original conduct on certain classes of persons who are considered to be responsible for the release of a “hazardous substance” into the environment. These classes of persons include current and prior owners or operators of the site where the release occurred and entities that disposed or arranged for the disposal of the hazardous substances released at the site. Under CERCLA, these “responsible persons” may be subject to joint and several, strict liability for the costs of cleaning up the hazardous substances that have been released into the environment, for damages to natural resources and for the costs of certain health studies. CERCLA also authorizes the U.S. Environmental Protection Agency (“EPA”) and, in some instances, third parties to act in response to threats to the public health or the environment and to seek to recover from the responsible classes of persons the costs they incur. It is not uncommon for neighboring landowners and other third parties to file claims for personal injury and property damage allegedly caused by the release of hazardous substances or other pollutants into the environment. We generate materials in the course of our operations that may be regulated as hazardous substances.
We are also subject to the requirements of the Resource Conservation and Recovery Act (“RCRA”) and comparable state statutes. RCRA imposes strict requirements on the generation, storage, treatment, transportation, disposal and cleanup of hazardous and nonhazardous wastes. Under the authority of the EPA, most states administer some or all of the provisions of RCRA, sometimes in conjunction with their own, more stringent requirements. In the course of our operations, we generate ordinary industrial wastes that may be regulated as hazardous wastes. RCRA currently exempts certain drilling fluids, produced waters and other wastes associated with exploration, development and production of oil and natural gas from regulation as hazardous wastes. These wastes, instead, are regulated under RCRA’s less stringent nonhazardous waste provisions, state laws or other federal laws. However, it is possible that certain oil and natural gas exploration, development and production wastes now classified as nonhazardous wastes could be classified as hazardous wastes in the future. For example, following the filing of a lawsuit in the U.S. District Court for the District of Columbia in May 2016 by several non-governmental environmental groups against the EPA for the agency’s failure to timely assess its RCRA Subtitle D criteria regulations for oil and natural gas wastes, the EPA and the environmental groups entered into an agreement that was finalized in a consent decree issued by the District Court on December 28, 2016. Under the decree, the EPA is required to propose no later than March 15, 2019, a rulemaking for revision of certain Subtitle D criteria regulations pertaining to oil and natural gas wastes or sign a determination that revision of the regulations is not necessary. If the EPA proposes a rulemaking for revised oil and natural gas waste regulations, the Consent Decree requires that the EPA take final action following notice and comment rulemaking no later than July 15, 2021. Repeal or modification of the current RCRA exclusion or similar exemptions under state law could increase the amount of hazardous waste we are required to manage and dispose of and could cause us or our customers to incur increased operating costs, which could have a significant impact on us as well as reduce demand for our midstream services.
We currently own or lease, and have in the past owned or leased, properties that have been used for numerous years to explore and produce oil and natural gas or for conducting midstream services. Although we have utilized operating and disposal practices that were standard in the industry at the time, petroleum hydrocarbons, hazardous substances and wastes may have been released on, under or from the properties owned or leased by us or on, under or from, other locations where these petroleum hydrocarbons and wastes have been taken for recycling or disposal. In addition, certain of these properties have been operated by third parties whose treatment and disposal or release of petroleum hydrocarbons, hazardous substances and wastes were not under our control. These properties and the substances disposed or released thereon may be subject to CERCLA, RCRA and analogous state laws. Under these laws, we could be required to remove or remediate previously disposed wastes (including wastes disposed of or released by prior owners or operators), to clean up contaminated property (including contaminated groundwater) and to perform remedial plugging or pit, processing plant or pipeline closure operations to prevent future contamination.
Air emissions
The federal Clean Air Act (“CAA”) and comparable state laws and regulations restrict the emission of various air pollutants from many sources through air emissions standards, construction and operating permitting programs, and the imposition of other monitoring and reporting requirements. These laws and regulations may require us to obtain pre-approval for the construction or modification of certain projects or facilities expected to produce or significantly increase air emissions, obtain and strictly comply with stringent air permit requirements or utilize specific equipment or technologies to control emissions of
22
certain pollutants. Obtaining permits has the potential to delay the development of oil and natural gas projects. Over the next several years, we may be required to incur certain capital expenditures for air pollution control equipment or other air emissions-related issues. For example, in October 2015, the EPA issued a final rule under the CAA, lowering the National Ambient Air Quality Standard (“NAAQS”) for ground-level ozone to 70 parts per billion under both the primary and secondary standards. State implementation of these revised standards could result in stricter permitting requirements, delay or prohibit our ability to obtain such permits, and result in increased expenditures for pollution control equipment, the costs of which could be significant. Additionally, the EPA issued final CAA regulations in 2012 that include New Source Performance Standards (“NSPS”) for completions of hydraulically fractured natural gas wells and issued added CAA regulations in June 2016 that include new emissions standards for methane and additional standards for volatile organic compounds from certain new, modified and reconstructed equipment and processes in the oil and natural gas source category, including production activities. Compliance with this final rule or any other new legal requirements could, among other things, require installation of new emission controls on some of our equipment, result in longer permitting timelines, significantly increase our capital expenditures and operating costs, and reduce demand for the oil and natural gas that we produce, which one or more developments could adversely impact our business.
Environmental protection and natural gas flaring initiatives
We attempt to conduct our operations in a manner that protects the health, safety and welfare of the public, our employees and the environment. We are focused on the reduction of air emissions produced from our operations, particularly with respect to flaring of natural gas from our operated well sites. The rapid growth of crude oil production in North Dakota in recent years, coupled with a historical lack of natural gas gathering infrastructure in the state, has led to efforts to reduce flaring of natural gas produced in association with crude oil production. We recognize the environmental and financial risks associated with natural gas flaring, and we seek to manage these risks on an ongoing basis, consistent with applicable requirements.
We believe that one of the leading causes of natural gas flaring from the Bakken and Three Forks formations is the inability of operators to promptly connect their wells to natural gas processing and gathering infrastructure due to external factors out of the control of the operator, such as, for example, the granting of right-of-way access by land owners, investment from third parties in the development of gas gathering systems and processing facilities, and the development and adoption of regulations. However, we have allocated significant resources to connect our Bakken and Three Forks wells to natural gas infrastructure to reduce our flared volumes. We have exceeded a goal that we voluntarily set in 2014 to maintain well connections for an average of 90% of our operated Bakken and Three Forks wells, by having approximately 98% of our operated Bakken and Three Forks wells connected to gathering systems as of both December 31, 2016 and 2015. We believe that achieving this goal helps us to minimize our flared volumes of natural gas.
On July 1, 2014, the NDIC adopted Order No. 24665 (the “July 2014 Order”), pursuant to which the agency adopted legally enforceable “gas capture percentage goals” targeting the capture of 74% of natural gas produced in the state by October 1, 2014, 77% of such gas by January 1, 2015, 85% of such gas by January 1, 2016 and 90% of such gas by October 1, 2020. Modification of the July 2014 Order was announced by the NDIC in the fourth quarter of 2015, resulting in the existing January 1, 2015 gas capture rate of 77% being extended to April 1, 2016 and updated gas capture rates of 80% by April 1, 2016, 85% by November 1, 2016, 88% by November 1, 2018 and 91% by November 1, 2020. The July 2014 Order established an enforcement mechanism for policy recommendations that were previously adopted by the NDIC in March 2014. Those recommendations required all E&P operators applying for new drilling permits in the state after June 1, 2014 to develop Gas Capture Plans that provide measures for reducing the amount of natural gas flared by those operators so as to be consistent with the agency’s gas capture percentage goals. In particular, the July 2014 Order provided that after an initial 90-day period, wells must meet or exceed the NDIC’s gas capture percentage goals on a per-well, per-field, county or statewide basis. Failure to comply with the gas capture percentage goals will result in an operator having to restrict its production to 200 barrels of oil per day if at least 60% of the monthly volume of associated natural gas produced from the well is captured, or 100 barrels of oil per day if less than 60% of such monthly volume of natural gas is captured. As of December 31, 2016, we were capturing approximately 87% of our natural gas production in North Dakota. While we were in compliance with these requirements as of December 31, 2016 and expect to remain in compliance in the future, there is no assurance that we will remain in compliance in the future or that such future compliance will not have a material adverse effect on our business and results of operations.
Climate change
Climate change continues to attract considerable public and scientific attention. As a result, numerous proposals have been made and are likely to continue to be made at the international, national, regional and state levels of government to monitor and limit emissions of greenhouse gases (“GHGs”). These efforts have included consideration by states or groupings of states of cap-and-trade programs, carbon taxes, GHG reporting and tracking programs, and regulations that directly limit GHG emissions from certain sources.
23
At the federal level, no comprehensive climate change legislation has been implemented to date. However, the EPA has determined that emissions of carbon dioxide, methane and other GHGs present an endangerment to public health and the environment and has adopted regulations under existing provisions of the CAA that establish Prevention of Significant Deterioration (“PSD”) construction and Title V operating permit reviews for GHG emissions from certain large stationary sources that already are potential major sources of certain principal, or criteria, pollutant emissions. Facilities required to obtain PSD permits for their GHG emissions also will be required to meet “best available control technology” standards. The EPA has also adopted rules requiring the monitoring and reporting of GHG emissions from specified sources in the United States on an annual basis, including, among others, onshore and offshore oil and natural gas production facilities and onshore processing, transmission, storage and distribution facilities, which include certain of our operations. In October 2015, the EPA amended and expanded the GHG reporting requirements to all segments of the oil and natural gas industry, including gathering and boosting facilities and blowdowns of natural gas transmission pipelines, and in January 2016, the EPA proposed additional revisions to leak detection methodology to align the reporting rules with the NSPS.
Federal agencies also have begun directly regulating emissions of methane, a GHG, from oil and natural gas operations. In June 2016, the EPA published NSPS, known as Subpart OOOOa, that require certain new, modified or reconstructed facilities in the oil and natural gas sector to reduce these methane gas and volatile organic compound emissions. These Subpart OOOOa standards will expand the previously issued NSPS Subpart OOOO requirements issued in 2012 by using certain equipment-specific emissions control practices, requiring additional controls for pneumatic controllers and pumps as well as compressors, and imposing leak detection and repair requirements for natural gas compressor and booster stations. Moreover, in November 2016, the EPA issued a final information collection request (“ICR”) seeking information about methane emissions from facilities and operations in the oil and natural gas industry. The EPA has indicated that it intends to use the information from this request to develop Existing Source Performance Standards for the oil and natural gas industry. Additionally, in December 2015, the United States joined the international community at the 21st Conference of the Parties of the United Nations Framework Convention on Climate Change in Paris, France to prepare an agreement requiring member countries to review and "represent a progression" in their intended nationally determined contributions, which set GHG emission reduction goals every five years beginning in 2020. This “Paris Agreement” was signed by the United States in April 2016 and entered into force in November 2016. The United States is one of more than 120 nations having ratified or otherwise consented to the agreement; however, this agreement does not create any binding obligations for nations to limit their GHG emissions but, rather, includes pledges to voluntarily limit or reduce future emissions.
The adoption and implementation of any international, federal or state legislation, regulations or other regulatory initiatives that require reporting of GHGs or otherwise restricts emissions of GHGs from our equipment and operations could require us to incur increased costs, such as costs to purchase and operate emissions control systems, acquire emissions allowances or comply with new regulatory or reporting requirements, including the imposition of a carbon tax, which one or more developments could have an adverse effect on our business, financial condition and results of operations. Moreover, such new legislation or regulatory programs could also increase the cost to the consumer, and thereby reduce demand for oil and gas, which could reduce the demand for the oil and natural gas we or our customers produce and lower the value of our reserves as well as reduce demand for our midstream services.
Finally, it should be noted that increasing concentrations of GHGs in the Earth’s atmosphere may produce climate changes that have significant physical effects, such as increased frequency and severity of storms, floods and other climatic events. If such effects were to occur, our development and production operations have the potential to be adversely affected. Potential adverse effects could include damages to our facilities from powerful winds or rising waters in low lying areas, disruption of our production activities because of climate related damages to our facilities, our costs of operations potentially arising from such climatic effects, less efficient or non-routine operating practices necessitated by such climate effects, or increased costs for insurance coverage in the aftermath of such effects. At this time, we have not developed a comprehensive plan to address the legal, economic, social or physical impacts of climate change on our operations.
Water discharges
The Federal Water Pollution Control Act (the “Clean Water Act”) and analogous state laws impose restrictions and strict controls regarding the discharge of pollutants into state waters and waters of the United States. The discharge of pollutants into regulated waters is prohibited, except in accordance with the terms of a permit issued by the EPA or the analogous state agency. Federal and state regulatory agencies can impose administrative, civil and criminal penalties for non-compliance with discharge permits or other requirements of the Clean Water Act and analogous state laws and regulations. Spill prevention, control and countermeasure requirements under federal law require appropriate containment berms and similar structures to help prevent the contamination of navigable waters in the event of a petroleum hydrocarbon tank spill, rupture or leak. In addition, the Clean Water Act and analogous state laws require individual permits or coverage under general permits for discharges of storm water runoff from certain types of facilities. The Clean Water Act also prohibits the discharge of dredge and fill material in regulated waters, including wetlands, unless authorized by permit. The EPA has issued final rules outlining its position on the federal jurisdictional reach over waters of the United States. This interpretation by the EPA may constitute an expansion of federal
24
jurisdiction over waters of the United States. The rule was stayed nationwide by the U.S. Sixth Circuit Court of Appeals in October 2015 as that appellate court and several other courts review lawsuits opposing implementation of the rule. In January 2017, the United States Supreme Court accepted review of the rule to determine whether jurisdiction rests with the federal district or appellate courts. Litigation surrounding this rule is ongoing. To the extent this rule expands the scope of the Clean Water Act’s jurisdiction, drilling programs could incur increased costs and delays with respect to obtaining permits for dredge and fill activities in wetland areas.
The Oil Pollution Act of 1990 (“OPA”) amends the Clean Water Act, and sets minimum standards for prevention, containment and cleanup of oil spills. The OPA applies to vessels, offshore facilities and onshore facilities, including E&P facilities that may affect waters of the United States. Under the OPA, responsible parties including owners and operators of onshore facilities may be held strictly liable for oil cleanup costs and natural resource damages as well as a variety of public and private damages that may result from oil spills. The OPA also requires owners or operators of certain onshore facilities to prepare Facility Response Plans for responding to a worst-case discharge of oil into waters of the United States.
Operations associated with our production and development activities generate drilling muds, produced waters and other waste streams, some of which may be disposed of by means of injection into underground wells situated in non-producing subsurface formations. These injection wells are regulated pursuant to the federal Safe Drinking Water Act (“SDWA”) Underground Injection Control (“UIC”) program and analogous state laws. The UIC program requires permits from the EPA or analogous state agency for disposal wells that we operate, establishes minimum standards for injection well operations and restricts the types and quantities of fluids that may be injected. Any leakage from the subsurface portions of the injection wells may cause degradation of fresh water, potentially resulting in cancellation of operations of a well, imposition of fines and penalties from governmental agencies, incurrence of expenditures for remediation of affected resources and imposition of liability by landowners or other parties claiming damages for alternative water supplies, property damages and personal injuries. Moreover, any changes in the laws or regulations or the inability to obtain permits for new injection wells in the future may affect our ability to dispose of produced waters and ultimately increase the cost of our operations, which costs could be significant. Furthermore, in response to recent seismic events near underground injection wells used for the disposal of produced water from oil and natural gas activities, federal and some state agencies are investigating whether such wells have caused increased seismic activity, and some states have restricted, suspended or shut down the use of such injection wells. If new regulatory initiatives are implemented that restrict or prohibit the use of underground injection wells in areas where we rely upon the use of such wells in operational activities, our or our customers’ costs to operate may significantly increase and our ability to continue production or conduct midstream services or dispose of produced water may be delayed or limited, which could have a material adverse effect on our results of operations and financial position.
Hydraulic fracturing activities
Hydraulic fracturing is an important and common practice that is used to stimulate production of hydrocarbons from unconventional formations, including shales. The process involves the injection of water, sand and chemicals under pressure into targeted subsurface formations to fracture the surrounding rock and stimulate production. We routinely use hydraulic fracturing techniques in many of our drilling and completion programs.
The hydraulic fracturing process is typically regulated by state oil and natural gas commissions or similar agencies, but several federal agencies have asserted regulatory authority over certain aspects of the process. For example, in February 2014, the EPA asserted regulatory authority pursuant to the SDWA’s UIC program over hydraulic fracturing activities involving the use of diesel and issued guidance covering such activities. The EPA also issued final CAA regulations in 2012 that include NSPS for completions of hydraulically fractured natural gas wells, compressors, controls, dehydrators, storage tanks, natural gas processing plants, and certain other equipment. In June 2016, the EPA published final rules establishing new emissions standards for methane and additional standards for volatile organic compounds from certain new, modified and reconstructed equipment and processes in the oil and natural gas source category, including production, processing, transmission and storage activities and is formally seeking additional information from oil and natural gas producing companies as necessary to eventually expand these final rules to include existing equipment and processes. In addition, in June 2016, the EPA published an effluent limit guideline final rule prohibiting the discharge of wastewater from onshore unconventional oil and gas extraction facilities to publicly owned wastewater treatment plants and, in May 2014, published an ANPR regarding Toxic Substances Control Act reporting of the chemical substances and mixtures used in hydraulic fracturing. Also, the federal Bureau of Land Management (“BLM”) published a final rule in March 2015 that established new or more stringent standards relating to hydraulic fracturing on federal and American Indian lands but, in June 2016, a Wyoming federal judge struck down this final rule, finding that the BLM lacked authority to promulgate the rule. That decision is currently being appealed by the federal government.
From time to time Congress has considered legislation to provide for federal regulation of hydraulic fracturing under the SDWA and to require disclosure of the chemicals used in the hydraulic fracturing process. In addition, some states, including North Dakota where we primarily operate, have adopted, and other states are considering adopting, legal requirements that
25
could impose more stringent permitting, public disclosure or well construction requirements on hydraulic fracturing activities. States could elect to prohibit high-volume hydraulic fracturing altogether, following the approach taken by the State of New York in 2015. Local government also may seek to adopt ordinances within their jurisdictions regulating the time, place and manner of drilling activities in general or hydraulic fracturing activities in particular. Nevertheless, if new or more stringent federal, state or local legal restrictions relating to the hydraulic fracturing process are adopted in areas where we operate, we could incur potentially significant added costs to comply with such requirements, experience delays or curtailment in the pursuit of exploration, development, or production activities and perhaps even be precluded from drilling wells.
Additionally, in December 2016, the EPA released its final report on the potential impacts of hydraulic fracturing on drinking water resources. The final report concluded that “water cycle” activities associated with hydraulic fracturing may impact drinking water resources “under some circumstances,” noting that the following hydraulic fracturing water cycle activities and local- or regional-scale factors are more likely than others to result in more frequent or more severe impacts: water withdrawals for fracturing in times or areas of low water availability; surface spills during the management of fracturing fluids, chemicals or produced water; injection of fracturing fluids into wells with inadequate mechanical integrity; injection of fracturing fluids directly into groundwater resources; discharge of inadequately treated fracturing wastewater to surface waters; and disposal or storage of fracturing wastewater in unlined pits.
Increased regulation and attention given to the hydraulic fracturing process could lead to greater opposition to, and litigation concerning, oil and natural gas production activities using hydraulic fracturing techniques. Additional legislation or regulation could also lead to added delays for our operations or increased operating costs in our or our customers’ production of oil and natural gas. The adoption of any federal, state or local laws or the implementation of regulations regarding hydraulic fracturing could potentially cause a decrease in the completion of new oil and natural gas wells, which could have a material adverse effect on our business or results of operations with respect to E&P activities and midstream services. We may not be insured for, or our insurance may be inadequate to protect us against, these risks.
Endangered Species Act considerations
The federal Endangered Species Act (“ESA”) may restrict exploration, development and production activities that may affect endangered and threatened species or their habitats. The ESA provides broad protection for species of fish, wildlife and plants that are listed as threatened or endangered in the United States and prohibits the taking of endangered species. Similar protections are offered to migratory birds under the Migratory Bird Treaty Act. Federal agencies are required to ensure that any action authorized, funded or carried out by them is not likely to jeopardize the continued existence of listed species or modify their critical habitats. Some of our facilities may be located in areas that are designated as habitat for endangered or threatened species. If endangered or threatened species are located in areas of the underlying properties where we or our customers wish to conduct seismic surveys, development activities or abandonment operations, such work could be prohibited or delayed or expensive mitigation may be required. Moreover, as a result of one or more settlements entered into by the U.S. Fish and Wildlife Service (“FWS”), the agency is required to make determinations on the listing of numerous species as endangered or threatened under the ESA pursuant to specific timelines. The designation of previously unprotected species as threatened or endangered in areas where underlying property operations are conducted could cause us or our customers to incur increased costs arising from species protection measures or could result in delays or limitations on our or our customers’ E&P activities that could have an adverse impact on our ability to develop and produce reserves or an indirect adverse impact on our midstream services.
Operations on federal lands
Performance of oil and natural gas E&P activities on federal lands, including Indian lands and lands administered by the federal BLM are subject to the National Environmental Policy Act (“NEPA”). NEPA requires federal agencies, including the BLM and the federal Bureau of Indian Affairs, to evaluate major agency actions, such as the issuance of permits that have the potential to significantly impact the environment. In the course of such evaluations, an agency will prepare an environmental assessment that assesses the potential direct, indirect and cumulative impacts of a proposed project and, if necessary, will prepare a more detailed environmental impact statement that may be made available for public review and comment. Depending on any mitigation strategies recommended in such environmental assessments or environmental impact statements, we could incur added costs, which could be substantial, and be subject to delays or limitations in the scope of oil and natural gas projects or performance of midstream services. Authorizations under NEPA are also subject to protest, appeal or litigation, any or all of which may delay or halt our or our customers’ E&P activities. Moreover, depending on the mitigation strategies recommended in the Environmental Assessments or Environmental Impact Statement, we or our customers could incur added costs, which may be significant.
26
Employee health and safety
We are subject to a number of federal and state laws and regulations, including the federal Occupational Safety and Health Act (“OSHA”) and comparable state statutes, whose purpose is to protect the health and safety of workers. In addition, the OSHA hazard communication standard, the EPA community right-to-know regulations under Title III of the federal Superfund Amendment and Reauthorization Act and comparable state statutes require that information be maintained concerning hazardous materials used or produced in our operations and that this information be provided to employees, state and local government authorities and citizens.
Employees
As of December 31, 2016, we employed 477 people. Our future success will depend partially on our ability to attract, retain and motivate qualified personnel. We are not a party to any collective bargaining agreements and have not experienced any strikes or work stoppages. We consider our relations with our employees to be satisfactory. From time to time we utilize the services of independent contractors to perform various field and other services.
Offices
As of December 31, 2016, we leased 111,628 square feet of office space in Houston, Texas at 1001 Fannin Street, where our principal offices are located. The lease for our Houston office expires in September 2020. We also own field offices in the North Dakota communities of Williston, Powers Lake and Alexander.
Available information
We are required to file annual, quarterly and current reports, proxy statements and other information with the SEC. You may read and copy any documents filed by us with the SEC at the SEC’s Public Reference Room at 100 F Street, N.E., Washington, D.C. 20549. You may obtain information on the operation of the Public Reference Room by calling the SEC at 1-800-SEC-0330. Our filings with the SEC are also available to the public from commercial document retrieval services and at the SEC’s website at http://www.sec.gov.
Our common stock is listed and traded on the New York Stock Exchange (“NYSE”) under the symbol “OAS.” Our reports, proxy statements and other information filed with the SEC can also be inspected and copied at the New York Stock Exchange, 20 Broad Street, New York, New York 10005.
We also make available on our website at http://www.oasispetroleum.com all of the documents that we file with the SEC, free of charge, as soon as reasonably practicable after we electronically file such material with the SEC. Information contained on our website is not incorporated by reference into this Annual Report on Form 10-K.
27
Item 1A. Risk Factors
Our business involves a high degree of risk. If any of the following risks, or any risk described elsewhere in this Annual Report on Form 10-K, actually occurs, our business, financial condition or results of operations could suffer. The risks described below are not the only ones facing us. Additional risks not presently known to us or which we currently consider immaterial also may adversely affect us.
Risks related to the oil and natural gas industry and our business
Further declines, or extended low commodity prices, in oil and, to a lesser extent, natural gas prices may adversely affect our business, financial condition or results of operations and our ability to meet our capital expenditure obligations and financial commitments.
The price we receive for our oil and, to a lesser extent, natural gas, heavily influences our revenue, profitability, access to capital and future rate of growth. Oil and natural gas are commodities and, therefore, their prices are subject to wide fluctuations in response to relatively minor changes in supply and demand. For example, average daily prices for WTI crude oil ranged from a high of $52.99 per barrel to a low of $26.19 per barrel during 2016. Average daily prices for NYMEX Henry Hub natural gas ranged from a high of $3.80 per MMBtu to a low of $1.49 per MMBtu during 2016. Historically, the markets for oil and natural gas have been volatile. These markets will likely continue to be volatile in the future. The prices we receive for our production, and the levels of our production, depend on numerous factors beyond our control. These factors include the following:
• | worldwide and regional economic conditions impacting the global supply and demand for oil and natural gas; |
• | the actions of OPEC; |
• | the price and quantity of imports of foreign oil and natural gas; |
• | political conditions in or affecting other oil-producing and natural gas-producing countries, including the current conflicts in the Middle East and conditions in South America, China, India and Russia; |
• | the level of global oil and natural gas E&P activities; |
• | the level of global oil and natural gas inventories; |
• | localized supply and demand fundamentals and regional, domestic and international transportation availability; |
• | weather conditions and natural disasters; |
• | domestic and foreign governmental regulations; |
• | speculation as to the future price of oil and the speculative trading of oil and natural gas futures contracts; |
• | shareholder activism or activities by non-governmental organizations to restrict the exploration, development and production of oil and natural gas and related infrastructure; |
• | price and availability of competitors’ supplies of oil and natural gas; |
• | technological advances affecting energy consumption; and |
• | the price and availability of alternative fuels. |
Substantially all of our production is sold to purchasers under short-term (less than twelve-month) contracts at market-based prices. Low oil and natural gas prices will reduce our cash flows, borrowing ability, the present value of our reserves and our ability to develop future reserves. See “Our exploration, development and exploitation projects require substantial capital expenditures. We may be unable to obtain needed capital or financing on satisfactory terms, which could lead to expiration of our leases or a decline in our estimated net oil and natural gas reserves” below. Low oil and natural gas prices may also reduce the amount of oil and natural gas that we can produce economically and may affect our proved reserves. See also “The present value of future net revenues from our estimated net proved reserves will not necessarily be the same as the current market value of our estimated oil and natural gas reserves” below.
Increased costs of capital could adversely affect our business.
Our business and operating results can be harmed by factors such as the availability, terms and cost of capital, increases in interest rates or a reduction in credit rating. Changes in any one or more of these factors could cause our cost of doing business to increase, limit our access to capital, limit our ability to pursue acquisition opportunities, reduce our cash flows available for drilling and place us at a competitive disadvantage. Recent and continuing disruptions and volatility in the global financial markets may lead to an increase in interest rates or a contraction in credit availability impacting our ability to finance our
28
operations. We require continued access to capital. A significant reduction in the availability of credit could materially and adversely affect our ability to achieve our planned operating results.
We may not be able to generate enough cash flow to meet our debt obligations.
We expect our earnings and cash flow to vary significantly from year to year due to the nature of our industry. As a result, the amount of debt that we can manage in some periods may not be appropriate for us in other periods. Additionally, our future cash flow may be insufficient to meet our debt obligations and other commitments. Any insufficiency could negatively impact our business. A range of economic, competitive, business and industry factors will affect our future financial performance, and, as a result, our ability to generate cash flow from operations and to pay our debt obligations. Many of these factors, such as oil and natural gas prices, economic and financial conditions in our industry and the global economy and initiatives of our competitors, are beyond our control. If we do not generate enough cash flow from operations to satisfy our debt obligations, we may have to undertake alternative financing plans, such as:
• | selling assets; |
• | reducing or delaying capital investments; |
• | seeking to raise additional capital; or |
• | refinancing or restructuring our debt. |
If for any reason we are unable to meet our debt service and repayment obligations, we would be in default under the terms of the agreements governing our debt, which would allow our creditors at that time to declare all outstanding indebtedness to be due and payable, which would in turn trigger cross-acceleration or cross-default rights between the relevant agreements. In addition, our lenders could compel us to apply all of our available cash to repay our borrowings or they could prevent us from making payments on our Notes (as defined in “Item 7. Management’s Discussion and Analysis of Financial Condition and Results of Operations-Liquidity and capital resources”). If amounts outstanding under our revolving credit facility or our Notes were to be accelerated, we cannot be certain that our assets would be sufficient to repay in full the money owed to the lenders or to our other debt holders. Please see “Item 7. Management’s Discussion and Analysis of Financial Condition and Results of Operations—Liquidity and capital resources.”
Our revolving credit facility and the indentures governing our Senior Notes all contain operating and financial restrictions that may restrict our business and financing activities.
Our revolving credit facility and the indentures governing our Senior Notes (as defined in “Item 7. Management’s Discussion and Analysis of Financial Condition and Results of Operations—Liquidity and capital resources”) contain a number of restrictive covenants that impose significant operating and financial restrictions on us, including restrictions on our ability to, among other things:
• | sell assets, including equity interests in our subsidiaries; |
• | pay distributions on, redeem or repurchase our common stock or redeem or repurchase our debt; |
• | make investments; |
• | incur or guarantee additional indebtedness or issue preferred stock; |
• | create or incur certain liens; |
• | make certain acquisitions and investments; |
• | redeem or prepay other debt; |
• | enter into agreements that restrict distributions or other payments from our restricted subsidiaries to us; |
• | consolidate, merge or transfer all or substantially all of our assets; |
• | engage in transactions with affiliates; |
• | create unrestricted subsidiaries; |
• | enter into sale and leaseback transactions; and |
• | engage in certain business activities. |
As a result of these covenants, we are limited in the manner in which we conduct our business, and we may be unable to engage in favorable business activities or finance future operations or capital needs.
29
Our ability to comply with some of the covenants and restrictions contained in our revolving credit facility and the indentures governing our Senior Notes may be affected by events beyond our control. If market or other economic conditions deteriorate or if oil and natural gas prices remain at their current level for an extended period of time or continue to decline, our ability to comply with these covenants may be impaired. A failure to comply with the covenants, ratios or tests in our revolving credit facility, the indentures governing our Senior Notes or any future indebtedness could result in an event of default under our revolving credit facility, the indentures governing our Senior Notes or our future indebtedness, which, if not cured or waived, could have a material adverse effect on our business, financial condition and results of operations.
If an event of default under our revolving credit facility occurs and remains uncured, the lenders thereunder:
• | would not be required to lend any additional amounts to us; |
• | could elect to declare all borrowings outstanding, together with accrued and unpaid interest and fees, to be due and payable; |
• | may have the ability to require us to apply all of our available cash to repay these borrowings; or |
• | may prevent us from making debt service payments under our other agreements. |
A payment default or an acceleration under our revolving credit facility could result in an event of default and an acceleration under the indentures for our Notes. If the indebtedness under the Notes were to be accelerated, there can be no assurance that we would have, or be able to obtain, sufficient funds to repay such indebtedness in full. In addition, our obligations under our revolving credit facility are collateralized by perfected first priority liens and security interests on substantially all of our assets, including mortgage liens on oil and natural gas properties having at least 90% of the reserve value as determined by reserve reports, and if we are unable to repay our indebtedness under the revolving credit facility, the lenders could seek to foreclose on our assets. Please see “Item 7. Management’s Discussion and Analysis of Financial Condition and Results of Operations—Liquidity and capital resources.”
Our level of indebtedness may increase and reduce our financial flexibility.
As of December 31, 2016, we had $363.0 million of outstanding borrowings and had $12.3 million of outstanding letters of credit under our revolving credit facility, $774.7 million available for future secured borrowings under our revolving credit facility and $2,053.0 million outstanding in Notes. Please see “Item 7. Management’s Discussion and Analysis of Financial Condition and Results of Operations—Liquidity and capital resources—Senior secured revolving line of credit”, “Item 7. Management’s Discussion and Analysis of Financial Condition and Results of Operations—Liquidity and capital resources—Senior unsecured notes” and “Item 7. Management’s Discussion and Analysis of Financial Condition and Results of Operations—Liquidity and capital resources—Senior unsecured convertible notes.” In the future, we may incur significant indebtedness in order to make future acquisitions or to develop our properties.
Our level of indebtedness could affect our operations in several ways, including the following:
• | a significant portion of our cash flows could be used to service our indebtedness; |
• | a high level of debt would increase our vulnerability to general adverse economic and industry conditions; |
• | the covenants contained in the agreements governing our outstanding indebtedness limit our ability to borrow additional funds, dispose of assets, pay dividends and make certain investments; |
• | our debt covenants may also affect our flexibility in planning for, and reacting to, changes in the economy and in our industry; |
• | a high level of debt may place us at a competitive disadvantage compared to our competitors that are less leveraged and therefore, may be able to take advantage of opportunities that our indebtedness would prevent us from pursuing; |
• | a high level of debt may make it more likely that a reduction in our borrowing base following a periodic redetermination could require us to repay a portion of our then-outstanding bank borrowings; and |
• | a high level of debt may impair our ability to obtain additional financing in the future for working capital, capital expenditures, acquisitions, general corporate or other purposes. |
A high level of indebtedness increases the risk that we may default on our debt obligations. Our ability to meet our debt obligations and to reduce our level of indebtedness depends on our future performance. General economic conditions, oil and natural gas prices and financial, business and other factors affect our operations and our future performance. Many of these factors are beyond our control. If oil and natural gas prices remain at their current level for an extended period of time or continue to decline, we may not be able to generate sufficient cash flows to pay the interest on our debt and future working capital, and borrowings or equity financing may not be available to pay or refinance such debt. Factors that will affect our
30
ability to raise cash through an offering of our capital stock or a refinancing of our debt include financial market conditions, the value of our assets and our performance at the time we need capital.
In addition, our bank borrowing base is subject to periodic redeterminations. We could be forced to repay a portion of our bank borrowings due to redeterminations of our borrowing base. If we are forced to do so, we may not have sufficient funds to make such repayments. If we do not have sufficient funds and are otherwise unable to negotiate renewals of our borrowings or arrange new financing, we may have to sell significant assets. Any such sale could have a material adverse effect on our business and financial results.
Our derivative activities could result in financial losses or could reduce our income.
To achieve more predictable cash flows and to reduce our exposure to adverse fluctuations in the prices of oil and natural gas, we currently, and may in the future, enter into derivative arrangements for a portion of our oil and natural gas production, including collars and fixed-price swaps. We have not designated any of our derivative instruments as hedges for accounting purposes and record all derivative instruments on our balance sheet at fair value. Changes in the fair value of our derivative instruments are recognized in earnings. Accordingly, our earnings may fluctuate significantly as a result of changes in the fair value of our derivative instruments.
Derivative arrangements also expose us to the risk of financial loss in some circumstances, including when:
• | production is less than the volume covered by the derivative instruments; |
• | the counterparty to the derivative instrument defaults on its contract obligations; or |
• | there is an increase in the differential between the underlying price in the derivative instrument and actual price received. |
In addition, some of these types of derivative arrangements limit the benefit we would receive from increases in the prices for oil and natural gas and may expose us to cash margin requirements.
Drilling for and producing oil and natural gas are high-risk activities with many uncertainties that could adversely affect our business, financial condition or results of operations.
Our future financial condition and results of operations will depend on the success of our exploitation, exploration, development and production activities. Our oil and natural gas E&P activities are subject to numerous risks beyond our control, including the risk that drilling will not result in commercially viable oil or natural gas production. Our decisions to purchase, explore, develop or otherwise exploit drilling locations or properties will depend in part on the evaluation of data obtained through geophysical and geological analyses, production data and engineering studies, the results of which are often inconclusive or subject to varying interpretations. For a discussion of the uncertainty involved in these processes, see “Our estimated net proved reserves are based on many assumptions that may turn out to be inaccurate. Any significant inaccuracies in these reserve estimates or underlying assumptions will materially affect the quantities and present value of our reserves” below. Our cost of drilling, completing and operating wells is often uncertain before drilling commences. Overruns in budgeted expenditures are common risks that can make a particular project uneconomical. Further, many factors may curtail, delay or cancel our scheduled drilling projects, including the following:
• | shortages of or delays in obtaining equipment and qualified personnel; |
• | facility or equipment malfunctions and/or failure; |
• | unexpected operational events, including accidents; |
• | pressure or irregularities in geological formations; |
• | adverse weather conditions, such as blizzards, ice storms and floods; |
• | reductions in oil and natural gas prices; |
• | delays imposed by or resulting from compliance with regulatory requirements; |
• | proximity to and capacity of transportation facilities; |
• | title problems; and |
• | limitations in the market for oil and natural gas. |
31
Our estimated net proved reserves are based on many assumptions that may turn out to be inaccurate. Any significant inaccuracies in these reserve estimates or underlying assumptions will materially affect the quantities and present value of our reserves.
The process of estimating oil and natural gas reserves is complex. It requires interpretations of available technical data and many assumptions, including assumptions relating to current and future economic conditions and commodity prices. Any significant inaccuracies in these interpretations or assumptions could materially affect the estimated quantities and present value of reserves shown in this Annual Report on Form 10-K. See “Item 1. Business—Our operations” for information about our estimated oil and natural gas reserves and the PV-10 and Standardized Measure of discounted future net revenues as of December 31, 2016, 2015 and 2014.
In order to prepare our estimates, we must project production rates and the timing of development expenditures. We must also analyze available geological, geophysical, production and engineering data. The extent, quality and reliability of this data can vary. The process also requires economic assumptions about matters such as oil and natural gas prices, drilling and operating expenses, capital expenditures, taxes and availability of funds. Although the reserve information contained herein is reviewed by our independent reserve engineers, estimates of oil and natural gas reserves are inherently imprecise.
Actual future production, oil and natural gas prices, revenues, taxes, development expenditures, operating expenses and quantities of recoverable oil and natural gas reserves will vary from our estimates. Any significant variance could materially affect the estimated quantities and present value of reserves shown in this Annual Report on Form 10-K. In addition, we may adjust estimates of net proved reserves to reflect production history, results of exploration and development, prevailing oil and natural gas prices and other factors, many of which are beyond our control. Due to the limited production history of our undeveloped acreage, the estimates of future production associated with such properties may be subject to greater variance to actual production than would be the case with properties having a longer production history.
The present value of future net revenues from our estimated net proved reserves will not necessarily be the same as the current market value of our estimated oil and natural gas reserves.
You should not assume that the present value of future net revenues from our estimated net proved reserves is the current market value of our estimated net oil and natural gas reserves. In accordance with SEC requirements for the years ended December 31, 2016, 2015 and 2014, we based the estimated discounted future net revenues from our estimated net proved reserves on the twelve-month unweighted arithmetic average of the first-day-of-the-month price for the preceding twelve months without giving effect to derivative transactions. Actual future net revenues from our oil and natural gas properties will be affected by factors such as:
• | actual prices we receive for oil and natural gas; |
• | actual cost of development and production expenditures; |
• | the amount and timing of actual production; and |
• | changes in governmental regulations or taxation. |
The timing of both our production and our incurrence of expenses in connection with the development and production of oil and natural gas properties will affect the timing and amount of actual future net revenues from estimated net proved reserves, and thus their actual present value. In addition, the 10% discount factor we use when calculating discounted future net revenues may not be the most appropriate discount factor based on interest rates in effect from time to time and risks associated with us or the oil and natural gas industry in general.
Actual future prices and costs may differ materially from those used in the present value estimates included in this Annual Report on Form 10-K. Any significant future price changes will have a material effect on the quantity and present value of our estimated net proved reserves.
If oil and natural gas prices remain at their current level for an extended period of time or decline, we may be required to take write-downs of the carrying values of our oil and natural gas properties.
We review our proved oil and natural gas properties for impairment whenever events and circumstances indicate that a decline in the recoverability of their carrying value may have occurred. In addition, we assess our unproved properties periodically for impairment on a property-by-property basis based on remaining lease terms, drilling results or future plans to develop acreage. Based on specific market factors and circumstances at the time of prospective impairment reviews, and the continuing evaluation of development plans, production data, economics and other factors, we may be required to write down the carrying value of our oil and natural gas properties, which may result in a decrease in the amount available under our revolving credit facility. A write-down constitutes a non-cash charge to earnings. A further decline in oil and natural gas prices may cause us to
32
incur impairment charges in the future, which could have a material adverse effect on our ability to borrow under our revolving credit facility and our results of operations for the periods in which such charges are taken. Due to lower expected future oil prices, we reviewed our proved oil and natural gas properties for impairment as of December 31, 2016 and 2015. For the years ended December 31, 2016 and 2015, we recorded an impairment loss of $1.1 million and $9.4 million, respectively, to adjust the carrying values of our proved oil and natural gas properties held for sale to their estimated fair values. For the year ended December 31, 2014, we determined that the carrying value exceeded expected undiscounted cash flows for certain legacy wells that have been producing from conventional reservoirs such as the Madison, Red River and other formations in the Williston Basin other than the Bakken or Three Forks formations. As a result, we recorded an impairment loss of $40.0 million to adjust the carrying amount of these assets to fair value. During the years ended December 31, 2016, 2015 and 2014, we recorded non-cash impairment charges of $1.1 million, $36.6 million and $7.3 million, respectively, on our unproved properties due to expiring leases and periodic assessments of our unproved properties.
The unavailability or high cost of additional drilling rigs, equipment, supplies, personnel and oilfield services or the unavailability of sufficient transportation for our production could adversely affect our ability to execute our exploration and development plans within our budget and on a timely basis.
Our industry is cyclical and, from time to time, there is a shortage of drilling rigs, equipment, supplies or qualified personnel. During these periods, the costs of rigs, equipment, supplies and personnel are substantially greater and their availability to us may be limited. Additionally, these services may not be available on commercially reasonable terms.
Shortages or the high cost of drilling rigs, equipment, supplies, personnel or oilfield services or the unavailability of sufficient transportation for our production could delay or adversely affect our development and exploration operations or cause us to incur significant expenditures that are not provided for in our capital budget, which could have a material adverse effect on our business, financial condition or results of operations. Additionally, compliance with new or emerging legal requirements that affect midstream operations in North Dakota may reduce the availability of transportation for our production. For example, the NDIC adopted regulations in late 2013 that impose more rigorous pipeline development standards on midstream operators, some of whom we rely on to construct and operate pipeline infrastructure to transport the oil and natural gas we produce.
Part of our strategy involves drilling in existing or emerging shale plays using some of the latest available horizontal drilling and completion techniques. The results of our planned exploratory drilling in these plays are subject to drilling and completion technique risks and drilling results may not meet our expectations for reserves or production. As a result, we may incur material write-downs and the value of our undeveloped acreage could decline if drilling results are unsuccessful.
Operations in the Bakken and the Three Forks formations involve utilizing the latest drilling and completion techniques as developed by us and our service providers in order to maximize cumulative recoveries and therefore generate the highest possible returns. Risks that we face while drilling include, but are not limited to, landing our well bore in the desired drilling zone, staying in the desired drilling zone while drilling horizontally through the formation, running our casing the entire length of the well bore and being able to run tools and other equipment consistently through the horizontal well bore. Risks that we face while completing our wells include, but are not limited to, being able to fracture stimulate the planned number of stages, being able to run tools the entire length of the well bore during completion operations, successfully cleaning out the well bore after completion of the final fracture stimulation stage and successfully protecting nearby producing wells from the impact of fracture stimulation.
Our experience with horizontal drilling utilizing the latest drilling and completion techniques specifically in the Bakken and Three Forks formations began in late 2009. Ultimately, the success of these drilling and completion techniques can only be evaluated over time as more wells are drilled and production profiles are established over a sufficiently long time period. If our drilling results are less than anticipated or we are unable to execute our drilling program because of capital constraints, lease expirations, access to gathering systems and limited takeaway capacity or otherwise, and/or oil and natural gas prices decline, the return on our investment in these areas may not be as attractive as we anticipate. We could incur material write-downs of unevaluated properties, and the value of our undeveloped acreage could decline in the future.
Our exploration, development and exploitation projects require substantial capital expenditures. We may be unable to obtain needed capital or financing on satisfactory terms, which could lead to expiration of our leases or a decline in our estimated net oil and natural gas reserves.
Our exploration and development activities are capital intensive. We make and expect to continue to make substantial capital expenditures in our business for the development, exploitation, production and acquisition of oil and natural gas reserves. Excluding acquisitions of $781.5 million in 2016 and $28.7 million in 2015, we spent $400.0 million and $581.3 million related to capital expenditures for the years ended December 31, 2016 and 2015, respectively. Our capital expenditure budget for 2017 is approximately $605 million, with approximately $410 million allocated for drilling and completion operations. Since our initial public offering, our capital expenditures have been financed with proceeds from public equity offerings,
33
proceeds from our issuance of Notes, borrowings under our revolving credit facility, net cash provided by operating activities, the sale of non-core oil and gas properties and cash settlements of derivative contracts. DeGolyer and MacNaughton projects that we will incur capital costs of $702.0 million over the next five years to develop the proved undeveloped reserves in the Williston Basin covered by its December 31, 2016 reserve report. The actual amount and timing of our future capital expenditures may differ materially from our estimates as a result of, among other things, commodity prices, actual drilling results, the availability of drilling rigs and other services and equipment, and regulatory, technological and competitive developments.
A significant increase in product prices could result in an increase in our capital expenditures. We intend to finance our future capital expenditures primarily through cash flows provided by operating activities, borrowings under our revolving credit facility and cash settlements of derivative contracts; however, our financing needs may require us to alter or increase our capitalization substantially through the issuance of additional debt or equity securities or the sale of non-strategic assets. The issuance of additional debt or equity may require that a portion of our cash flows provided by operating activities be used for the payment of principal and interest on our debt, thereby reducing our ability to use cash flows to fund working capital, capital expenditures and acquisitions. The issuance of additional equity securities could have a dilutive effect on the value of our common stock. In addition, upon the issuance of certain debt securities (other than on a borrowing base redetermination date), our borrowing base under our revolving credit facility will be automatically reduced by an amount equal to 25% of the aggregate principal amount of such debt securities.
Our cash flows provided by operating activities and access to capital are subject to a number of variables, including:
• | our estimated net proved reserves; |
• | the level of oil and natural gas we are able to produce from existing wells and new projected wells; |
• | the prices at which our oil and natural gas are sold; |
• | the costs of developing and producing our oil and natural gas production; |
• | our ability to acquire, locate and produce new reserves; |
• | the ability and willingness of our banks to lend; and |
• | our ability to access the equity and debt capital markets. |
If the borrowing base under our revolving credit facility or our revenues decrease as a result of low oil or natural gas prices, operating difficulties, declines in reserves or for any other reason, we may have limited ability to obtain the capital necessary to sustain our operations at current levels. If additional capital is needed, we may not be able to obtain debt or equity financing on terms favorable to us, or at all. If cash generated by operations or cash available under our revolving credit facility is not sufficient to meet our capital requirements, the failure to obtain additional financing could result in a curtailment of our operations relating to development of our drilling locations, which in turn could lead to a possible expiration of our leases and a decline in our estimated net proved reserves, and could adversely affect our business, financial condition and results of operations.
We will not be the operator on all of our drilling locations, and, therefore, we will not be able to control the timing of exploration or development efforts, associated costs, or the rate of production of any non-operated assets.
We may enter into arrangements with respect to existing or future drilling locations that result in a greater proportion of our locations being operated by others. As a result, we may have limited ability to exercise influence over the operations of the drilling locations operated by our partners. Dependence on the operator could prevent us from realizing our target returns for those locations. The success and timing of exploration and development activities operated by our partners will depend on a number of factors that will be largely outside of our control, including:
• | the timing and amount of capital expenditures; |
• | the operator’s expertise and financial resources; |
• | approval of other participants in drilling wells; |
• | selection of technology; and |
• | the rate of production of reserves, if any. |
This limited ability to exercise control over the operations of some of our drilling locations may cause a material adverse effect on our results of operations and financial condition.
34
All of our producing properties and operations are located in the Williston Basin region, making us vulnerable to risks associated with operating in one major geographic area.
As of December 31, 2016, 100% of our proved reserves and production were located in the Williston Basin in northwestern North Dakota and northeastern Montana. As a result, we may be disproportionately exposed to the impact of economics in the Williston Basin or delays or interruptions of production from these wells caused by transportation capacity constraints, curtailment of production, availability of equipment, facilities, personnel or services, significant governmental regulation, natural disasters, adverse weather conditions, plant closures for scheduled maintenance or interruption of transportation of oil or natural gas produced from the wells in this area. In addition, the effect of fluctuations on supply and demand may become more pronounced within specific geographic oil and natural gas producing areas such as the Williston Basin, which may cause these conditions to occur with greater frequency or magnify the effect of these conditions. Due to the concentrated nature of our portfolio of properties, a number of our properties could experience any of the same conditions at the same time, resulting in a relatively greater impact on our results of operations than they might have on other companies that have a more diversified portfolio of properties. Such delays or interruptions could have a material adverse effect on our financial condition and results of operations.
Our business depends on oil and natural gas gathering and transportation facilities, most of which are owned by third parties.
The marketability of our oil and natural gas production depends in part on the availability, proximity and capacity of gathering and pipeline systems owned by third parties. The unavailability of, or lack of, available capacity on these systems and facilities could result in the shut-in of producing wells or the delay, or discontinuance of, development plans for properties. See also “Market conditions or operational impediments may hinder our access to oil and natural gas markets or delay our production” and “Insufficient transportation or refining capacity in the Williston Basin could cause significant fluctuations in our realized oil and natural gas prices.” We generally do not purchase firm transportation on third party pipeline facilities, and therefore, the transportation of our production can be interrupted by other customers that have firm arrangements. In addition, these third parties may also impose specifications for the products that they are willing to accept. If the total mix of a product fails to meet the applicable product quality specifications, the third parties may refuse to accept all or a part of the products or may invoice us for the costs to handle or damages from receiving the out-of-specification products. In those circumstances, we may be required to delay the delivery of or find alternative markets for that product, or shut-in the producing wells that are causing the products to be out of specification, potentially reducing our revenues.
The disruption of third-party facilities due to maintenance, weather or other interruptions of service could also negatively impact our ability to market and deliver our products. We have no control over when or if such facilities are restored. A total shut-in of our production could materially affect us due to a resulting lack of cash flow, and if a substantial portion of the production is hedged at lower than market prices, those financial hedges would have to be paid from borrowings absent sufficient cash flow. Potential crude oil rail derailments or crashes could also impact our ability to market and deliver our products and cause significant fluctuations in our realized oil and natural gas prices due to tighter safety regulations imposed on crude-by-rail transportation and interruptions in service.
Insufficient transportation or refining capacity in the Williston Basin could cause significant fluctuations in our realized oil and natural gas prices.
The Williston Basin crude oil business environment has historically been characterized by periods when oil production has surpassed local transportation and refining capacity, resulting in substantial discounts in the price received for crude oil versus prices quoted for WTI crude oil. In the past, there have been periods when this discount has substantially increased due to the production of oil in the area increasing to a point that it temporarily surpasses the available pipeline transportation, rail transportation and refining capacity in the area. Recent expansions of both rail and pipeline facilities have reduced the prior constraint on oil transportation out of the Williston Basin and improved netback pricing received at the lease. On barrels that we transport and sell outside of the basin, our realized price for crude oil is generally the quoted price at the point of sale less transportation costs. In 2015 and 2016, our price differentials relative to WTI strengthened as new pipelines opened to eastern Canada and U.S. markets and transportation on rail gradually declined. Since the third quarter of 2015, our price differentials have remained less than $5.00 per barrel discount to WTI on a quarterly basis. Even as WTI improved in 2016, our price differentials averaged $4.76 per barrel of oil for the year ended December 31, 2016. We expect differentials to improve as takeaway capacity in the Williston Basin will increase by over 500,000 barrels of oil per day if the Dakota Access Pipeline is completed and put in service.
35
Market conditions or operational impediments may hinder our access to oil and natural gas markets or delay our production.
Market conditions or the unavailability of satisfactory oil and natural gas transportation arrangements may hinder our access to oil and natural gas markets or delay our production. The availability of a ready market for our oil and natural gas production depends on a number of factors, including the demand for and supply of oil and natural gas and the proximity of reserves to pipelines and terminal facilities. Our ability to market our production depends, in substantial part, on the availability and capacity of gathering systems, pipelines and processing facilities owned and operated by third-parties. Our failure to obtain such services on acceptable terms could materially harm our business. We may be required to shut in wells due to lack of a market or inadequacy or unavailability of crude oil or natural gas pipelines or gathering system capacity. If our production becomes shut-in for any of these or other reasons, we would be unable to realize revenue from those wells until other arrangements were made to deliver the products to market.
The development of our proved undeveloped reserves in the Williston Basin and other areas of operation may take longer and may require higher levels of capital expenditures than we currently anticipate. Therefore, our undeveloped reserves may not be ultimately developed or produced.
Approximately 38% of our estimated net proved reserves were classified as proved undeveloped as of December 31, 2016. Development of these reserves may take longer and require higher levels of capital expenditures than we currently anticipate. The future development of our proved undeveloped reserves is dependent on future commodity prices, costs and economic assumptions that align with our internal forecasts as well as access to liquidity sources, such as capital markets, our revolving credit facility and derivative contracts. Delays in the development of our reserves or increases in costs to drill and develop such reserves will reduce the PV-10 value of our estimated proved undeveloped reserves and future net revenues estimated for such reserves and may result in some projects becoming uneconomic. In addition, delays in the development of reserves could cause us to have to reclassify our proved reserves as unproved reserves.
Unless we replace our oil and natural gas reserves, our reserves and production will decline, which would adversely affect our business, financial condition and results of operations.
Unless we conduct successful development, exploitation and exploration activities or acquire properties containing proved reserves, our estimated net proved reserves will decline as those reserves are produced. Producing oil and natural gas reservoirs generally are characterized by declining production rates that vary depending upon reservoir characteristics and other factors. Our future oil and natural gas reserves and production, and therefore our cash flows and income, are highly dependent on our success in efficiently developing and exploiting our current reserves and economically finding or acquiring additional recoverable reserves. We may not be able to develop, exploit, find or acquire additional reserves to replace our current and future production at acceptable costs. If we are unable to replace our current and future production, the value of our reserves will decrease, and our business, financial condition and results of operations would be adversely affected.
We may incur substantial losses and be subject to substantial liability claims as a result of our operations. Additionally, we may not be insured for, or our insurance may be inadequate to protect us against, these risks.
We are not insured against all risks. Losses and liabilities arising from uninsured and underinsured events could materially and adversely affect our business, financial condition or results of operations. Our oil and natural gas E&P activities are subject to all of the operating risks associated with drilling for and producing oil and natural gas, including the possibility of:
• | environmental hazards, such as natural gas leaks, oil spills, pipeline and tank ruptures, encountering naturally occurring radioactive materials and unauthorized discharges of brine, well stimulation and completion fluids, toxic gas or other pollutants into the environment; |
• | abnormally pressured formations; |
• | shortages of, or delays in, obtaining water for hydraulic fracturing activities; |
• | mechanical difficulties, such as stuck oilfield drilling and service tools and casing failure; |
• | personal injuries and death; and |
• | natural disasters. |
Any of these risks could adversely affect our ability to conduct operations or result in substantial losses to us as a result of:
• | injury or loss of life; |
• | damage to and destruction of property, natural resources and equipment; |
• | pollution and other environmental damage; |
36
• | regulatory investigations and penalties; |
• | suspension of our operations; and |
• | repair and remediation costs. |
Insurance against all operational risk is not available to us. We are not fully insured against all risks, including development and completion risks that are generally not recoverable from third parties or insurance. In addition, pollution and environmental risks generally are not fully insurable. Also, we may elect not to obtain insurance if we believe that the cost of available insurance is excessive relative to the risks presented. The occurrence of an event that is not fully covered by insurance could have a material adverse effect on our business, financial condition and results of operations.
We have incurred losses in 2016 and prior years and may do so again in the future.
For the years ended December 31, 2016 and 2015, we incurred net losses of $243.0 million and $40.2 million, respectively. For the year ended December 31, 2014, we had net income of $506.9 million. Our development of and participation in an increasingly larger number of drilling locations has required and will continue to require substantial capital expenditures, including planned capital expenditures for 2017 of approximately $605 million.
The uncertainty and risks described in this Annual Report on Form 10-K may impede our ability to economically find, develop, exploit and acquire oil and natural gas reserves. As a result, we may not be able to achieve or sustain profitability or positive cash flows provided by operating activities in the future.
Drilling locations that we decide to drill may not yield oil or natural gas in commercially viable quantities.
Our drilling locations are in various stages of evaluation, ranging from a location which is ready to drill to a location that will require substantial additional interpretation. There is no way to predict in advance of drilling and testing whether any particular location will yield oil or natural gas in sufficient quantities to recover drilling or completion costs or to be economically viable. The use of technologies and the study of producing fields in the same area will not enable us to know conclusively prior to drilling whether oil or natural gas will be present or, if present, whether oil or natural gas will be present in sufficient quantities to be economically viable. Even if sufficient amounts of oil or natural gas exist, we may damage the potentially productive hydrocarbon bearing formation or experience mechanical difficulties while drilling or completing the well, resulting in a reduction in production from the well or abandonment of the well. If we drill additional wells that we identify as dry holes in our current and future drilling locations, our drilling success rate may decline and materially harm our business. We cannot assure you that the analogies we draw from available data from other wells, more fully explored locations or producing fields will be applicable to our drilling locations. Further, initial production rates reported by us or other operators in the Williston Basin may not be indicative of future or long-term production rates. In sum, the cost of drilling, completing and operating any well is often uncertain, and new wells may not be productive.
Our potential drilling location inventories are scheduled to be drilled over several years, making them susceptible to uncertainties that could materially alter the occurrence or timing of their drilling. In addition, we may not be able to raise the substantial amount of capital that would be necessary to drill a substantial portion of our potential drilling locations.
Our management has identified and scheduled drilling locations as an estimation of our future multi-year drilling activities on our existing acreage. These potential drilling locations, including those without proved undeveloped reserves, represent a significant part of our execution strategy. Our ability to drill and develop these locations is subject to a number of uncertainties, including the availability of capital, seasonal conditions, regulatory approvals, oil and natural gas prices, costs and drilling results. Because of these uncertainties, we do not know if the numerous potential drilling locations we have identified will ever be drilled or if we will be able to produce oil or natural gas from these or any other potential drilling locations. Pursuant to existing SEC rules and guidance, subject to limited exceptions, proved undeveloped reserves may only be booked if they relate to wells scheduled to be drilled within five years of the date of booking. These rules and guidance may limit our potential to book additional proved undeveloped reserves as we pursue our drilling program.
Our acreage must be drilled before lease expiration, generally within three to five years, in order to hold the acreage by production. In the highly competitive market for acreage, failure to drill sufficient wells in order to hold acreage will result in a substantial lease renewal cost, or if renewal is not feasible, loss of our lease and prospective drilling opportunities.
Unless production is established within the spacing units covering the undeveloped acres on which some of the locations are identified, the leases for such acreage will expire. As of December 31, 2016, we had leases representing 9,970 net acres expiring in 2017, 8,864 net acres expiring in 2018 and 2,923 net acres expiring in 2019. The cost to renew such leases may increase significantly, and we may not be able to renew such leases on commercially reasonable terms or at all. In addition, on certain portions of our acreage, third-party leases become immediately effective if our leases expire. As such, our actual drilling
37
activities may materially differ from our current expectations, which could adversely affect our business. During the years ended December 31, 2016, 2015 and 2014, we recorded non-cash impairment charges of $1.1 million, $36.6 million and $7.3 million on our unproved properties due to expiring leases and periodic assessments of our unproved properties.
Our operations are subject to environmental and occupational health and safety laws and regulations that may expose us to significant costs and liabilities.
Our oil and natural gas E&P operations, oil gathering and transportation activities, natural gas processing services and related operations are subject to stringent federal, regional, state and local laws and regulations governing occupational health and safety aspects, the discharge of materials into the environment or otherwise relating to environmental protection. These laws and regulations may impose numerous obligations that are applicable to our operations and services including the acquisition of a permit before conducting drilling, providing midstream services or other regulated activities; the restriction on types, quantities and concentration of materials that may be released into the environment; the limitation or prohibition of drilling activities on certain lands lying within wilderness, wetlands and other protected areas; the application of specific health and safety criteria addressing worker protection; and the imposition of substantial liabilities for pollution resulting from our operations. Numerous governmental authorities, such as the EPA, and analogous state agencies have the power to enforce compliance with these laws and regulations and the permits issued under them, which may cause us to incur significant capital or operating expenditures or costly actions to achieve and maintain compliance. Failure to comply with these laws and regulations may result in the assessment of sanctions, including administrative, civil or criminal penalties; the imposition of investigatory, remedial or corrective action obligations or the incurrence of capital expenditures; the occurrence of delays in the permitting or development or expansion of projects; and the issuance of injunctions limiting or preventing some or all of our operations in affected areas.
Our operations risk incurring significant environmental costs and liabilities as a result of our handling of petroleum hydrocarbons and wastes, because of air emissions and waste water discharges related to our operations and due to historical industry operations and waste disposal practices. Under certain environmental laws and regulations, we could be subject to joint and several, strict liability for the removal or remediation of previously released materials or property contamination regardless of whether we were responsible for the release or contamination or if the operations were in compliance with all applicable laws at the time those actions were taken. Private parties, including the owners of properties upon which our wells are drilled or processing facilities or pipelines are located and facilities where our petroleum hydrocarbons or wastes are taken for reclamation or disposal, may also have the right to pursue legal actions to enforce compliance as well as to seek damages for non-compliance with environmental laws and regulations or for personal injury or property damage. In addition, accidental spills or other releases could expose us to significant costs and liabilities that could have a material adverse effect on our financial condition or results of operations.
Changes in environmental laws and regulations occur frequently, and any changes that result in delayed, restricted or more stringent or costly well drilling, plant or pipeline construction, completion or water management activities or waste handling, storage, transport, disposal or cleanup requirements could require us to make significant expenditures to attain and maintain compliance and may otherwise have a material adverse effect on our own results of operations, competitive position or financial condition. For example, following the filing of a lawsuit in the U.S. District Court for the District of Columbia in May 2016 by several non-governmental environmental groups against the EPA for the agency’s failure to timely assess its RCRA Subtitle D criteria regulations for oil and natural gas wastes, EPA and the environmental groups entered into an agreement that was finalized in a consent decree issued by the District Court on December 28, 2016. Under the decree, the EPA is required to propose no later than March 15, 2019, a rulemaking for revision of certain Subtitle D criteria regulations pertaining to oil and natural gas wastes or sign a determination that revision of the regulations is not necessary. If EPA proposes a rulemaking for revised oil and natural gas waste regulations, the Consent Decree requires that the EPA take final action following notice and comment rulemaking no later than July 15, 2021. In another example, The EPA has issued final rules outlining its position on the federal jurisdictional reach over waters of the United States, which may constitute an expansion of EPA’s federal jurisdiction over waters of the United States. The rule was stayed nationwide by the U.S. Sixth Circuit Court of Appeals in October 2015 as that appellate court and several other courts ponder lawsuits opposing implementation of the rule and, in January 2017, the United States Supreme Court accepted review of the rule to determine whether jurisdiction rests with the federal district or appellate courts. Also, in October 2015, the EPA issued a final rule lowering the NAAQS for ground-level ozone to 70 parts per billion for the 8-hour primary and secondary ozone standards. State implementation of these revised NAAQS standards could result in stricter permitting requirements, delay or prohibit our ability to obtain such permits, and result in increased expenditures for pollution control equipment, the costs of which could be significant. Compliance with any of these rules or any other new or amended legal requirements could, among other things, require installation of new emission controls on some of our equipment, result in longer permitting timelines, and significantly increase our capital expenditures and operating costs, which could adversely impact our business.
We may not be able to recover some or any of these costs from insurance.
38
Failure to comply with federal, state and local laws could adversely affect our ability to produce, gather and transport our oil and natural gas and may result in substantial penalties.
Our operations are substantially affected by federal, state and local laws and regulations, particularly as they relate to the regulation of oil and natural gas production and transportation. These laws and regulations include regulation of oil and natural gas E&P and related operations, including a variety of activities related to the drilling of wells, the interstate transportation of oil and natural gas by federal agencies such as the FERC, as well as state agencies. In addition, federal laws prohibit market manipulation in connection with the purchase or sale of oil and/or natural gas. Failure to comply with federal, state and local laws could adversely affect our ability to produce, gather and transport our oil and natural gas and may result in substantial penalties. Please see “Item 1. Business—Other federal laws and regulations affecting our industry.”
Our business involves the selling and shipping by rail of crude oil, including from the Bakken shale, which involves risks of derailment, accidents and liabilities associated with cleanup and damages, as well as potential regulatory changes that may adversely impact our business, financial condition or results of operations.
A portion of our crude oil production is transported to market centers by rail. Past derailments in North America of trains transporting crude oil have caused various regulatory agencies and industry organizations, as well as federal, state and municipal governments, to focus attention on transportation by rail of flammable materials. Transportation safety regulators in the United States and Canada are concerned that crude oil from the Bakken shale may be more flammable than crude oil from other producing regions and are investigating that issue and are also considering changes to existing regulations to address those possible risks. In May 2015, PHMSA adopted a final rule that includes, among other things, additional requirements to enhance tank car standard for certain trains carrying crude oil and ethanol, a classification and testing program for crude oil, and a requirement that older DOT-111 tank cars be phased out by as early as October 1, 2017 if they are not already retrofitted to comply with new tank car design standards. The rule also includes a new braking standard for certain trains, designates new operational protocols for trains transporting large volumes of flammable liquids, such as routing analyses, speed restrictions and information for local government agencies, and provides new sampling and testing requirements to improve classification of energy products placed into transport.
In August 2016, PHMSA released a final rule mandating a phase-out schedule for all DOT-111 tank cars used to transport Class 3 flammable liquids, including crude oil and ethanol, between 2018 and 2029. Additionally, in July 2016, PHMSA proposed a new rule that would expand the applicability of comprehensive oil spill response plans so that any railroad that transports a single train carrying 20 or more loaded tanks of liquid petroleum oil in a continuous block or a single train carrying 35 or more loaded tank cars of liquid petroleum oil throughout the train must have a current, comprehensive, written plan. In response to a petition from the New York Attorney General, PHMSA issued an ANPR in January 2017 stating that it is considering revising the HMR to establish vapor pressure limits for unrefined petroleum-based products and potentially all Class 3 flammable liquid hazardous materials that would apply during the transportation of the products or materials by any mode. In addition, in February 2016, the FRA modified its accident and incident reports to gather additional data concerning rail cars carrying crude oil in any train involved in a FRA-reportable accident. In addition to action taken or proposed by federal agencies, a number of states proposed or enacted laws in recent years that encourage safer rail operations or urge the federal government to strengthen requirements for these operations.
Efforts are likewise underway in Canada to assess and address risks from the transport of crude oil by rail. For example, in April 2014, Transport Canada issued a protective order prohibiting oil shippers from using 5,000 of the DOT 111 tank cars and imposing a three year phase out period for approximately 65,000 tank cars that do not meet certain safety requirements. Transport Canada also imposed a 50 mile per hour speed limit on trains carrying hazardous materials and required all crude oil shipments in Canada to have an emergency response plan. At the same time that PHMSA released its 2015 rule, Canada’s Minister of Transport announced Canada’s new tank car standards, which largely align with the requirements in the PHMSA rule. Likewise, Transport Canada’s rail car retrofitting and phase out timeline largely aligns with the timeline introduced under the 2015 and 2016 PHMSA rules. Transport Canada has also introduced new requirements that railways carry minimum levels of insurance depending on the quantity of crude oil or dangerous goods that they transport as well as a final report recommending additional practices for the transportation of dangerous goods.
These, and future laws, regulatory changes, or initiatives regarding hazardous material transportation, could directly and indirectly increase our operation, compliance and transportation costs and lead to shortages in availability of tank cars. We cannot assure that costs incurred to comply with standards and regulations emerging from these and future rulemakings will not be material to our business, financial condition or results of operations. Moreover, we may incur significant constraints on transportation capacity during the period while tank cars are being retrofitted or newly constructed to comply with the new regulations. In addition, any derailment of crude oil from the Bakken shale involving crude oil that we have sold or are shipping may result in claims being brought against us that may involve significant liabilities. Although we believe that we are adequately insured against such events, we cannot assure you that our insurance policies will cover the entirety of any damages that may arise from such an event.
39
Climate change legislation and regulatory initiatives restricting emissions of GHGs could result in increased operating costs and reduced demand for the oil and natural gas that we produce while the physical effects of climate change could disrupt our production and cause us to incur significant costs in preparing for or responding to those effects.
Climate change continues to attract considerable public and scientific attention. As a result, numerous proposals have been made and are likely to continue to be made at the international, national, regional and state levels of government to monitor and limit emissions of GHGs. These efforts have included consideration by states or groupings of states of cap-and-trade programs, carbon taxes, GHG reporting and tracking programs, and regulations that directly limit GHG emissions from certain sources.
At the federal level, no comprehensive climate change legislation has been implemented to date. However, the EPA has determined that emissions of GHGs present an endangerment to public health and the environment and has adopted regulations under existing provisions of the CAA that establish PSD construction and Title V operating permit reviews for GHG emissions from certain large stationary sources that already are potential major sources of certain principal, or criteria, pollutant emissions. Facilities required to obtain PSD permits for their GHG emissions also will be required to meet “best available control technology” standards. The EPA has also adopted rules requiring the monitoring and reporting of GHG emissions from specified sources in the United States on an annual basis, including, among others, certain onshore and offshore oil and natural gas production facilities, and onshore processing, transmission, storage and distribution facilities, which includes certain of our operations. In October 2015, the EPA amended and expanded the GHG reporting requirements to all segments of the oil and natural gas industry, including gathering and boosting facilities and blowdowns of natural gas transmission pipelines, and in January 2016, the EPA proposed additional revisions to leak detection methodology to align the reporting rules with the NSPS.
Federal agencies also have begun directly regulating emissions of methane, a GHG, from oil and natural gas operations. In June 2016, the EPA published Subpart OOOOa that requires certain new, modified or reconstructed facilities in the oil and natural gas sector to reduce these methane gas and volatile organic compound emissions. These Subpart OOOOa standards will expand the previously issued Subpart OOOO requirements issued in 2012 by using certain equipment-specific emissions control practices, requiring additional controls for pneumatic controllers and pumps as well as compressors, and imposing leak detection and repair requirements for natural gas compressor and booster stations. Moreover, in November 2016, the EPA issued a final ICR seeking information about methane emissions from facilities and operations in the oil and natural gas industry. The EPA has indicated that it intends to use the information from this request to develop Existing Source Performance Standards for the oil and natural gas industry. Additionally, in December 2015, the United States joined the international community at the 21st Conference of the Parties of the United Nations Framework Convention on Climate Change in Paris, France to prepare an agreement requiring member countries to review and "represent a progression" in their intended nationally determined contributions, which set GHG emission reduction goals every five years beginning in 2020. This “Paris Agreement” was signed by the United States in April 2016 and entered into force in November 2016. The United States is one of more than 120 nations having ratified or otherwise consented to the agreement; however, this agreement does not create any binding obligations for nations to limit their GHG emissions but, rather, includes pledges to voluntarily limit or reduce future emissions.
The adoption and implementation of any international, federal or state legislation, regulations or other regulatory initiatives imposing reporting obligations on, or limiting emissions of GHGs from, our equipment and operations could require us to incur increased costs, such as costs to purchase and operate emissions control systems, acquire emissions allowances or comply with new regulatory or reporting requirements, including the imposition of a carbon tax, which one or more developments could have an adverse effect on our or our customers’ business, financial condition and results of operations. Moreover, such new legislation or regulatory programs could also increase the cost to the consumer, and thereby reduce demand for oil and gas, which could reduce the demand for the oil and natural gas we or our customer produce and lower the value of our reserves as well as reduce demand for our midstream services.
Finally, it should be noted that increasing concentrations of GHGs in the Earth’s atmosphere may produce climate changes that have significant physical effects, such as increased frequency and severity of storms, floods and other climatic events. If such effects were to occur, our development and production operations have the potential to be adversely affected. Potential adverse effects could include damages to our facilities from powerful winds or rising waters in low lying areas, disruption of our production activities because of climate related damages to our facilities, our costs of operations potentially arising from such climatic effects, less efficient or non-routine operating practices necessitated by such climate effects, or increased costs for insurance coverage in the aftermath of such effects. At this time, we have not developed a comprehensive plan to address the legal, economic, social or physical impacts of climate change on our operations.
Federal or state legislative and regulatory initiatives related to induced seismicity could result in operating restrictions or delays that could adversely affect the drilling program’s production of oil and natural gas.
Operations associated with our production and development activities generate drilling muds, produced waters and other waste streams, some of which may be disposed of by means of injection into underground wells situated in non-producing subsurface formations. These injection wells are regulated pursuant to the UIC program established under the SDWA. In response to recent
40
seismic events near underground injection wells used for the disposal of produced water from oil and natural gas activities, federal and some state agencies are investigating whether such wells have caused increased seismic activity, and some states have restricted, suspended or shut down the use of such injection wells. Increased regulation and attention given to induced seismicity also could lead to greater opposition, including litigation, to oil and natural gas activities utilizing injection wells for waste disposal. If new regulatory initiatives are implemented that restrict or prohibit the use of underground injection wells in areas where we rely upon the use of such wells in operational activities, our or our customers’ costs to operate may significantly increase and our or our customers’ ability to continue production or conduct midstream services or dispose of produced water may be delayed or limited, which could have a material adverse effect on our business, financial condition and results of operations.
Federal, state and local legislative and regulatory initiatives relating to hydraulic fracturing as well as governmental reviews of such activities could result in increased costs and additional operating restrictions or delays in the completion of oil and natural gas wells and adversely affect our production.
Hydraulic fracturing is an important and common practice that is used to stimulate production of natural gas and/or oil from dense subsurface rock formations. The process involves the injection of water, sand and chemicals under pressure into the targeted subsurface formations to fracture the surrounding rock and stimulate production. We routinely use hydraulic fracturing techniques in many of our drilling and completion programs.
The process is typically regulated by state oil and natural gas commissions or similar agencies, but several federal agencies have asserted regulatory authority or conducted investigations over certain aspects of the process. For example, in February 2014, the EPA asserted regulatory authority under the SDWA over hydraulic fracturing activities involving the use of diesel; in 2012 and again in June 2016, the EPA issued final CAA regulations that include NSPS for completions of hydraulically fractured natural gas wells and new emissions standards for methane from certain new, modified and reconstructed equipment and processes in the oil and natural gas source category and the agency is currently seeking additional information from oil and natural gas producing companies as necessary to expand these rules to include existing equipment and processes; in June 2016, the EPA published an effluent limit guideline final rule prohibiting the discharge of wastewater from onshore unconventional oil and gas extraction facilities to publicly owned wastewater treatment plants; and in May 2014, the EPA published an ANPR regarding Toxic Substances Control Act reporting of the chemical substances and mixtures used in hydraulic fracturing. Also, in 2015, the BLM published a final rule establishing new or more stringent standards relating to hydraulic fracturing on federal and American Indian lands but, in June 2016, a Wyoming federal judge struck down this final rule, finding that the BLM lacked authority to promulgate the rule. That decision on the BLM rule is currently being appealed by the federal government. Also, in December 2016, the EPA released its final report on the potential impacts of hydraulic fracturing on drinking water resources. The final report concluded that “water cycle” activities associated with hydraulic fracturing may impact drinking water resources “under some circumstances,” noting that the following hydraulic fracturing water cycle activities and local- or regional-scale factors are more likely than others to result in more frequent or more severe impacts: water withdrawals for fracturing in times or areas of low water availability; surface spills during the management of fracturing fluids, chemicals or produced water; injection of fracturing fluids into wells with inadequate mechanical integrity; injection of fracturing fluids directly into groundwater resources; discharge of inadequately treated fracturing wastewater to surface waters; and disposal or storage of fracturing wastewater in unlined pits.
In addition, from time to time Congress has considered legislation to provide for federal regulation of hydraulic fracturing under the SDWA and to require disclosure of the chemicals used in the hydraulic fracturing process. At the state level, some states, including North Dakota where we primarily operate, have adopted, and other states are considering adopting, legal requirements that could impose more stringent permitting, public disclosure or well construction requirements on hydraulic fracturing activities. States could elect to prohibit high volume hydraulic fracturing altogether, following the approach taken by the State of New York in 2015. Local government also may seek to adopt ordinances within their jurisdictions regulating the time, place and manner of drilling activities in general or hydraulic fracturing activities in particular. Increased regulation and attention given to the hydraulic fracturing process could lead to greater opposition to, and litigation concerning, oil and natural gas production activities using hydraulic fracturing techniques. Also, new or more stringent legislation or regulation adopted in areas where we operate could also lead to delays in, or curtailment of, our or our customers’ operations, result in increased operating costs in our or our customers’ production of oil and natural gas, and perhaps cause a decrease in the completion of new oil and natural gas wells, which could have a material adverse effect on our business or results of operations with respect to E&P activities and midstream services. We may not be insured for, or our insurance may be inadequate to protect us against, these risks.
41
Operations using hydraulic fracturing are substantially dependent on the availability of water. Restrictions on the ability to obtain water for E&P activities and the disposal of flowback and produced water may impact operations and have a corresponding adverse effect on our business, financial conditions and results of operations.
Water is an essential component of shale oil and natural gas production during both the drilling and hydraulic fracturing processes. Our access to water to be used in these processes may be adversely affected due to reasons such as periods of extended drought, private, third party competition for water in localized areas or the implementation of local or state governmental programs to monitor or restrict the beneficial use of water subject to their jurisdiction for hydraulic fracturing to assure adequate local water supplies. The occurrence of these or similar developments may result in limitations being placed on allocations of water due to needs by third party businesses with more senior contractual or permitting rights to the water. Our inability to locate or contractually acquire and sustain the receipt of sufficient amounts of water could adversely impact our E&P operations or midstream services and have a corresponding adverse effect on our business, financial condition and results of operations.
Moreover, the imposition of new environmental regulations and other regulatory initiatives could include increased restrictions on our or our customers’ ability to dispose of flowback and produced water generated in hydraulic fracturing or other fluids resulting from E&P activities. Applicable laws, including the Clean Water Act, impose restrictions and strict controls regarding the discharge of pollutants into waters of the United States and require that permits or other approvals be obtained to discharge pollutants to such waters. In May 2015, the EPA released a final rule outlining its position on the federal jurisdictional reach over waters of the United States. This interpretation by the EPA may constitute an expansion of federal jurisdiction over waters of the United States. The rule was stayed nationwide by the U.S. Sixth Circuit Court of Appeals in October 2015 as that appellate court and several other courts ponder lawsuits opposing implementation of the rule. In January 2017, the United States Supreme Court accepted review of the rule to determine whether jurisdiction rests with the federal district or appellate courts. Litigation surrounding this rule is on-going. Additionally, regulations implemented under the Clean Water Act and similar state laws prohibit the discharge of produced water and sand, drilling fluids, drill cuttings and certain other substances related to the natural gas and oil industry into coastal waters. In June 2016, the EPA published final regulations prohibiting wastewater discharges from hydraulic fracturing and certain other natural gas operations to publicly-owned wastewater treatment plants. The Clean Water Act and analogous state laws provide for civil, criminal and administrative penalties for any unauthorized discharges of pollutants and unauthorized discharges of reportable quantities of oil and hazardous substances. Compliance with current and future environmental regulations and permit requirements governing the withdrawal, storage and use of surface water or groundwater necessary for hydraulic fracturing of wells and any inability to secure transportation and access to disposal wells with sufficient capacity to accept all of our or our customers’ flowback and produced water on economic terms may increase our or our customers’ operating costs and cause delays, interruptions or termination of our or our customers’ operations, the extent of which cannot be predicted.
Federal and state legislative and regulatory initiatives relating to pipeline safety that require the use of new or more stringent safety controls, substantial changes to existing integrity management programs, or more stringent enforcement of applicable legal requirements could subject us to increased capital and operating costs and operational delays.
Certain of our pipelines are subject to regulation by PHMSA under the HLPSA with respect to oil and condensate and the NGPSA with respect to natural gas. The HLPSA and NGPSA govern the design, installation, testing, construction, operation, replacement and management of oil and natural gas pipeline facilities. These laws have resulted in the adoption of rules by PHMSA, that, among other things, require transportation pipeline operators to implement integrity management programs, including more frequent inspections, correction of identified anomalies and other measures to ensure pipeline safety in HCAs, such as high population areas, areas unusually sensitive to environmental damage and commercially navigable waterways. In addition, states have adopted regulations similar to existing PHMSA regulations for certain intrastate natural gas and hazardous liquid pipelines, which regulations may impose more stringent requirements than found under federal law. Historically, our pipeline safety compliance costs have not had a material adverse effect on our results of operations; however, there can be no assurance that such costs will not be material in the future or that such future compliance costs will not have a material adverse effect on our business and operating results. New laws or regulations adopted by PHMSA may impose more stringent requirements applicable to integrity management programs and other pipeline safety aspects of our operations, which could cause us to incur increased capital and operating costs and operational delays.
The HLPSA and NGPSA were amended by the 2011 Pipeline Safety Act which became law in January 2012. The 2011 Act increased the penalties for safety violations, established additional safety requirements for newly constructed pipelines and required studies of safety issues that could result in the adoption of new regulatory requirements by PHMSA for existing pipelines. More recently, in June 2016, the 2016 Pipeline Safety Act was passed, extending PHMSA’s statutory mandate through 2019 and, among other things, requiring PHMSA to complete certain of its outstanding mandates under the 2011 Pipeline Safety Act and developing new safety standards for natural gas storage facilities by June 22, 2018. The 2016 Act also empowers PHMSA to address imminent hazards by imposing emergency restrictions, prohibitions and safety measures on owners and operators of hazardous liquid or natural gas pipeline facilities without prior notice or an opportunity for a hearing.
42
PHMSA issued interim regulations in October 2016 to implement the agency's expanded authority to address unsafe pipeline conditions or practices that pose an imminent hazard to life, property, or the environment.
The adoption of new or amended regulations by PHMSA that result in more stringent or costly pipeline integrity management or safety standards could have a significant adverse effect on our results of operations. For example, in April 2015, PHMSA proposed rulemaking that would require leak detection for all hazardous liquid pipelines, including those conveying oil, and require periodic assessment of hazardous liquid pipelines not already covered by the integrity management requirements. In a second example, in March 2016, PHMSA announced a proposed rulemaking that would impose new or more stringent requirements for certain natural gas lines and gathering lines including, among other things, expanding certain of PHMSA’s current regulatory safety programs for natural gas pipelines in newly defined “moderate consequence areas” that contain as few as 5 dwellings within a potential impact area; requiring natural gas pipelines installed before 1970 and thus excluded from certain pressure testing obligations to be tested to determine their MAOP; and requiring certain onshore and offshore gathering lines in Class I areas to comply with damage prevention, corrosion control, public education, MAOP limits, line markers and emergency planning standards. Additional requirements proposed by this proposed rulemaking would increase PHMSA’s integrity management requirements for natural gas pipelines and also require consideration of seismicity in evaluating threats to pipelines. New laws or regulations adopted by PHMSA may impose more stringent requirements applicable to integrity management programs and other pipeline safety aspects of our operations, which could cause us to incur increased capital and operating costs and operational delays. In the absence of the PHMSA pursuing any legal requirements, state agencies, to the extent authorized, may pursue state standards, including standards for rural gathering lines.
Competition in the oil and natural gas industry is intense, making it more difficult for us to acquire properties, market oil and natural gas and secure trained personnel.
Our ability to acquire additional drilling locations and to find and develop reserves in the future will depend on our ability to evaluate and select suitable properties and to consummate transactions in a highly competitive environment for acquiring properties, marketing oil and natural gas and securing equipment and trained personnel. Also, there is substantial competition for capital available for investment in the oil and natural gas industry. Many of our competitors possess and employ financial, technical and personnel resources substantially greater than ours. Those companies may be able to pay more for productive oil and natural gas properties and exploratory drilling locations or to identify, evaluate, bid for and purchase a greater number of properties and locations than our financial or personnel resources permit. Furthermore, these companies may also be better able to withstand the financial pressures of unsuccessful drilling attempts, sustained periods of volatility in financial markets and generally adverse global and industry-wide economic conditions, and may be better able to absorb the burdens resulting from changes in relevant laws and regulations, which would adversely affect our competitive position. In addition, companies may be able to offer better compensation packages to attract and retain qualified personnel than we are able to offer. The cost to attract and retain qualified personnel has increased over the past few years due to competition and may increase substantially in the future. We may not be able to compete successfully in the future in acquiring prospective reserves, developing reserves, marketing hydrocarbons, attracting and retaining quality personnel and raising additional capital, which could have a material adverse effect on our business.
The loss of senior management or technical personnel could adversely affect our operations.
To a large extent, we depend on the services of our senior management and technical personnel. The loss of the services of our senior management or technical personnel, including Thomas B. Nusz, our Chairman and Chief Executive Officer, and Taylor L. Reid, our President and Chief Operating Officer, could have a material adverse effect on our operations. We do not maintain, nor do we plan to obtain, any insurance against the loss of any of these individuals.
Seasonal weather conditions adversely affect our ability to conduct drilling activities in some of the areas where we operate.
Oil and natural gas operations in the Williston Basin are adversely affected by seasonal weather conditions. In the Williston Basin, drilling and other oil and natural gas activities cannot be conducted as effectively during the winter months. Severe winter weather conditions limit and may temporarily halt our ability to operate during such conditions. These constraints and the resulting shortages or high costs could delay or temporarily halt our operations and materially increase our operating and capital costs.
The inability of one or more of our customers or affiliates to meet their obligations to us may adversely affect our financial results.
Our principal exposures to credit risk are through receivables resulting from the sale of our oil and natural gas production ($137.1 million in receivables at December 31, 2016), which we market to energy marketing companies, refineries and affiliates, and joint interest receivables ($40.3 million at December 31, 2016).
43
We are subject to credit risk due to the concentration of our oil and natural gas receivables with several significant customers. This concentration of customers may impact our overall credit risk since these entities may be similarly affected by changes in economic and other conditions. For the year ended December 31, 2016, sales to PBF Holding Company LLC accounted for approximately 10% of our total sales. For the year ended December 31, 2015, sales to Shell Trading (US) Company accounted for approximately 10% of our total sales. For the year ended December 31, 2014, sales to Musket Corporation accounted for approximately 13% of our total sales. No other purchasers accounted for more than 10% of our total oil and natural gas sales for the years ended December 31, 2016, 2015 and 2014. We do not require all of our customers to post collateral. The inability or failure of our significant customers to meet their obligations to us or their insolvency or liquidation may adversely affect our financial results.
Joint interest receivables arise from billing entities who own a partial interest in the wells we operate. These entities participate in our wells primarily based on their ownership in leases on which we choose to drill. We have limited ability to control participation in our wells. For the year ended December 31, 2016, we recorded bad debt expense of $1.8 million as a result of our assessment that it is probable certain receivables may not be collected.
In addition, our oil and natural gas derivative arrangements expose us to credit risk in the event of nonperformance by counterparties. Derivative assets and liabilities arising from derivative contracts with the same counterparty are reported on a net basis, as all counterparty contracts provide for net settlement. At December 31, 2016, we had derivatives in place with nine counterparties and a total net derivative liability of $71.8 million.
We may be subject to risks in connection with acquisitions because of uncertainties in evaluating recoverable reserves, well performance and potential liabilities, as well as uncertainties in forecasting oil and gas prices and future development, production and marketing costs, and the integration of significant acquisitions may be difficult.
We periodically evaluate acquisitions of reserves, properties, prospects and leaseholds and other strategic transactions that appear to fit within our overall business strategy. The successful acquisition of producing properties requires an assessment of several factors, including:
• | recoverable reserves; |
• | future oil and natural gas prices and their appropriate differentials; |
• | development and operating costs; |
• | potential for future drilling and production; |
• | validity of the seller’s title to the properties, which may be less than expected at the time of signing the purchase agreement; and |
• | potential environmental and other liabilities, together with associated litigation of such matters. |
The accuracy of these assessments is inherently uncertain. In connection with these assessments, we perform a review of the subject properties that we believe to be generally consistent with industry practices. Our review will not reveal all existing or potential problems nor will it permit us to become sufficiently familiar with the properties to fully assess their deficiencies and potential recoverable reserves. Inspections may not always be performed on every well, and environmental problems are not necessarily observable even when an inspection is undertaken. Even when problems are identified, the seller may be unwilling or unable to provide effective contractual protection against all or part of the problems. We often are not entitled to contractual indemnification for environmental liabilities or title defects in excess of the amounts claimed by us before closing and acquire properties on an “as is” basis. Indemnification from the sellers will generally be effective only during a limited time period after the closing and subject to certain dollar limitations and minimums. We may not be able to collect on such indemnification because of disputes with the sellers or their inability to pay. Moreover, there is a risk that we could ultimately be liable for unknown obligations related to acquisitions, which could materially adversely affect our financial condition, results of operations or cash flows.
Significant acquisitions and other strategic transactions may involve other risks, including:
• | diversion of our management’s attention to evaluating, negotiating and integrating significant acquisitions and strategic transactions; |
• | the challenge and cost of integrating acquired operations, information management and other technology systems and business cultures with those of our operations while carrying on our ongoing business; |
• | difficulty associated with coordinating geographically separate organizations; |
44
• | an inability to secure, on acceptable terms, sufficient financing that may be required in connection with expanded operations and unknown liabilities; and |
• | the challenge of attracting and retaining personnel associated with acquired operations. |
The process of integrating assets could cause an interruption of, or loss of momentum in, the activities of our business. Members of our senior management may be required to devote considerable amounts of time to this integration process, which will decrease the time they will have to manage our business. If our senior management is not able to effectively manage the integration process, or if any significant business activities are interrupted as a result of the integration process, our business could suffer. In addition, even if we successfully integrate the assets acquired in an acquisition, it may not be possible to realize the full benefits we may expect in estimated proved reserves, production volume, cost savings from operating synergies or other benefits anticipated from an acquisition or realize these benefits within the expected time frame.
If we fail to realize the anticipated benefits of a significant acquisition, our results of operations may be lower than we expect.
The success of a significant acquisition will depend, in part, on our ability to realize anticipated opportunities from combining the acquired assets or operations with those of ours. Even if a combination is successful, it may not be possible to realize the full benefits we may expect in estimated net proved reserves, production volume, cost savings from operating synergies or other benefits anticipated from an acquisition or realize these benefits within the expected time frame. Anticipated benefits of an acquisition may be offset by operating losses relating to changes in commodity prices, in oil and natural gas industry conditions, by risks and uncertainties relating to the exploratory prospects of the combined assets or operations, failure to retain key personnel, an increase in operating or other costs or other difficulties. If we fail to realize the benefits we anticipate from an acquisition, our results of operations and stock price may be adversely affected.
We may incur losses as a result of title defects in the properties in which we invest.
It is our practice in acquiring oil and gas leases or interests not to incur the expense of retaining lawyers to examine the title to the mineral interest. Rather, we rely upon the judgment of oil and gas lease brokers or landmen who perform the fieldwork in examining records in the appropriate governmental office before attempting to acquire a lease in a specific mineral interest.
Prior to the drilling of an oil or gas well, however, it is the normal practice in our industry for the person or company acting as the operator of the well to obtain a preliminary title review to ensure there are no obvious defects in the title to the well. Frequently, as a result of such examinations, certain curative work must be done to correct defects in the marketability of the title, and such curative work entails expense. Our failure to cure any title defects may adversely impact our ability in the future to increase production and reserves. There is no assurance that we will not suffer a monetary loss from title defects or title failure. Additionally, undeveloped acreage has greater risk of title defects than developed acreage. If there are any title defects or defects in assignment of leasehold rights in properties in which we hold an interest, we will suffer a financial loss.
The enactment of derivatives legislation and regulation could have an adverse effect on our ability to use derivative instruments to reduce the negative effect of commodity price changes, interest rate and other risks associated with our business.
On July 21, 2010, new comprehensive financial reform legislation, known as the Dodd-Frank Wall Street Reform and Consumer Protection Act (the “Dodd-Frank Act”), was enacted that establishes federal oversight and regulation of the over-the-counter derivatives market and entities, such as us, that participate in that market. The Dodd-Frank Act requires the CFTC, the SEC and other regulators to promulgate rules and regulations implementing the new legislation. In its rulemaking under the Dodd-Frank Act, the CFTC has proposed new regulations to set position limits for certain futures, options and swap contracts in designated physical commodities, including, among others, oil and natural gas. Certain bona fide hedging transactions positions would be exempt from the position limits as currently proposed. It is not possible at this time to predict when the CFTC will finalize these regulations or whether the proposed rules will be modified prior to becoming effective, so the impact of those provisions on us is uncertain at this time. The Dodd-Frank Act and CFTC rules have also designated certain types of swaps (thus far, only certain interest rate swaps and credit default swaps) for mandatory clearing and exchange trading, and may designate other types of swaps for mandatory clearing and exchange trading in the future. To the extent that we engage in such transactions or transactions that become subject to such rules in the future, we will be required to comply with the clearing and exchange trading requirements or to take steps to qualify for an exemption to such requirements. In addition, certain banking regulators and the CFTC have adopted final rules establishing minimum margin requirements for uncleared swaps. Although we expect to qualify for the end-user exception from margin requirements for swaps to other market participants, such as swap dealers, these rules may change the cost and availability of the swaps we use for hedging. If any of our swaps do not qualify for the commercial end-user exception, we could be required to post initial or variation margin, which would impact liquidity and reduce our cash. This would in turn reduce our ability to execute hedges to reduce risk and protect cash flows.
45
Other regulations to be promulgated under the Dodd-Frank Act also remain to be finalized. As a result, it is not possible at this time to predict with certainty the full effects of the Dodd-Frank Act and CFTC rules on us and the timing of such effects. The Dodd-Frank Act and regulations could significantly increase the cost of derivative contracts, materially alter the terms of derivative contracts, reduce the availability of derivatives to protect against risks we encounter, reduce our ability to monetize or restructure our existing derivative contracts, and increase our exposure to less creditworthy counterparties. If we reduce our use of derivatives as a result of the Dodd-Frank Act and regulations, our results of operations may become more volatile and our cash flows may be less predictable, which could adversely affect our ability to plan for and fund capital expenditures. Further, to the extent our revenues are unhedged, they could be adversely affected if a consequence of the Dodd-Frank Act and implementing regulations is to lower commodity prices. Any of these consequences could have a material adverse effect on our financial position, results of operations and cash flows. In addition, the European Union and other non-U.S. jurisdictions are implementing regulations with respect to the derivatives market. To the extent we transact with counterparties in foreign jurisdictions, we may become subject to such regulations. At this time, the impact of such regulations is not clear.
Certain U.S. federal income tax deductions currently available with respect to natural gas and oil exploration and development may be eliminated as a result of future legislation.
In past years, legislation has been proposed that would, if enacted into law, make significant changes to U.S. tax laws, including to certain key U.S. federal income tax provisions currently available to oil and gas companies. Such legislative changes have included, but not been limited to, (i) the repeal of the percentage depletion allowance for oil and gas properties, (ii) the elimination of current deductions for intangible drilling and development costs, (iii) the elimination of the deduction for certain domestic production activities, and (iv) an extension of the amortization period for certain geological and geophysical expenditures. Congress could consider, and could include, some or all of these proposals as part of tax reform legislation, to accompany lower federal income tax rates. Moreover, other more general features of tax reform legislation, including changes to cost recovery rules and to the deductibility of interest expense, may be developed that also would change the taxation of oil and gas companies. It is unclear whether these or similar changes will be enacted and, if enacted, how soon any such changes could take effect. The passage of any legislation as a result of these proposals or any similar changes in U.S. federal income tax laws could eliminate or postpone certain tax deductions that currently are available with respect to oil and gas development, or increase costs, and any such changes could have an adverse effect on the Company’s financial position, results of operations and cash flows.
Risks Relating to our Common Stock
We do not intend to pay, and we are currently prohibited from paying, dividends on our common stock and, consequently, our shareholders’ only opportunity to achieve a return on their investment is if the price of our stock appreciates.
We do not plan to declare dividends on shares of our common stock in the foreseeable future. Additionally, we are currently prohibited from making any cash dividends pursuant to the terms of our revolving credit facility and the indentures governing our Senior Notes. Consequently, our shareholders’ only opportunity to achieve a return on their investment in us will be if the market price of our common stock appreciates, which may not occur, and the shareholder sells their shares at a profit. There is no guarantee that the price of our common stock will ever exceed the price that the shareholder paid.
Our amended and restated certificate of incorporation, as amended, and amended and restated bylaws, as well as Delaware law, contain provisions that could discourage acquisition bids or merger proposals, which may adversely affect the market price of our common stock.
Our amended and restated certificate of incorporation, as amended, authorizes our Board of Directors to issue preferred stock without stockholder approval. If our Board of Directors elects to issue preferred stock, it could be more difficult for a third party to acquire us. In addition, some provisions of our amended and restated certificate of incorporation, as amended, and amended and restated bylaws could make it more difficult for a third party to acquire control of us, even if the change of control would be beneficial to our stockholders, including:
• | a classified Board of Directors, so that only approximately one-third of our directors are elected each year; |
• | limitations on the removal of directors; and |
• | limitations on the ability of our stockholders to call special meetings and establish advance notice provisions for stockholder proposals and nominations for elections to the Board of Directors to be acted upon at meetings of stockholders. |
Delaware law prohibits us from engaging in any business combination with any “interested stockholder,” meaning generally that a stockholder who beneficially owns more than 15% of our stock cannot acquire us for a period of three years from the date this person became an interested stockholder, unless various conditions are met, such as approval of the transaction by our Board of Directors.
46
Conversion of the Senior Convertible Notes may dilute the ownership interest of existing stockholders, or may otherwise depress the market price of our common stock.
The conversion of some or all of the Senior Convertible Notes (as defined in “Item 7. Management’s Discussion and Analysis of Financial Condition and Results of Operations—Liquidity and capital resources”) may dilute the ownership interests of existing stockholders of our common stock. Any sales in the public market of the shares of our common stock issuable upon such conversion could adversely affect prevailing market prices of our common stock. In addition, the existence of the Senior Convertible Notes may encourage short selling by market participants because the conversion of the Senior Convertible Notes could be used to satisfy short positions, and anticipated conversion of the Senior Convertible Notes into shares of our common stock could depress the market price of our common stock.
Item 1B. Unresolved Staff Comments
None.
Item 2. Properties
The information required by Item 2. is contained in Item 1. Business.
Item 3. Legal Proceedings
Although we may, from time to time, be involved in litigation and claims arising out of our operations in the normal course of business, we are not currently a party to any material legal proceeding. In addition, we are not aware of any material legal or governmental proceedings against us, or contemplated to be brought against us.
Item 4. Mine Safety Disclosures
Not applicable.
47
PART II
Item 5. Market for Registrant’s Common Equity, Related Stockholder Matters and Issuer Purchases of Equity Securities
Market for Registrant’s Common Equity. Our common stock is listed on the NYSE under the symbol “OAS.”
The following table sets forth the range of high and low sales prices of our common stock for the two most recent fiscal years as reported by the NYSE:
2016 | 2015 | ||||||||||||||
High | Low | High | Low | ||||||||||||
1st Quarter | $ | 8.78 | $ | 3.40 | $ | 19.63 | $ | 12.05 | |||||||
2nd Quarter | $ | 11.54 | $ | 6.70 | $ | 18.86 | $ | 14.23 | |||||||
3rd Quarter | $ | 11.83 | $ | 6.56 | $ | 15.85 | $ | 8.04 | |||||||
4th Quarter | $ | 17.08 | $ | 9.00 | $ | 14.15 | $ | 6.34 | |||||||
Holders. As of February 17, 2017, the number of record holders of our common stock was 525. Based on inquiry, management believes that the number of beneficial owners of our common stock is approximately 51,275.
Dividends. We have not paid any cash dividends since our inception. Covenants contained in our revolving credit facility and the indentures governing our Senior Notes restrict the payment of cash dividends on our common stock. We currently intend to retain all future earnings for the development of our business, and we do not anticipate declaring or paying any cash dividends to holders of our common stock in the foreseeable future.
On February 22, 2017, the last sale price of our common stock, as reported on the NYSE, was $13.66 per share.
Unregistered Sales of Securities. There were no sales of unregistered securities during the year ended December 31, 2016.
Issuer Purchases of Equity Securities. The following table contains information about our acquisition of equity securities during the three months ended December 31, 2016:
Period | Total Number of Shares Exchanged(1) | Average Price Paid per Share | Total Number of Shares Purchased as Part of Publicly Announced Plans or Programs | Maximum Number (or Approximate Dollar Value) of Shares that May Be Purchased Under the Plans or Programs | ||||||||
October 1 – October 31, 2016 | 3,042 | $ | 11.47 | — | — | |||||||
November 1 – November 30, 2016 | 1,325 | 10.15 | — | — | ||||||||
December 1 – December 31, 2016 | 441 | 15.05 | — | — | ||||||||
Total | 4,808 | $ | 11.43 | — | — | |||||||
__________________
(1) | Represent shares that employees surrendered back to us that equaled in value the amount of taxes needed for payroll tax withholding obligations upon the vesting of restricted stock awards. These repurchases were not part of a publicly announced program to repurchase shares of our common stock, nor do we have a publicly announced program to repurchase shares of our common stock. |
Stock Performance Graph. The following performance graph and related information is “furnished” with the SEC and shall not be deemed “soliciting material” or to be “filed” with the SEC, nor shall such information be incorporated by reference into any future filing under the Securities Act or the Exchange Act, except to the extent that we specifically request that such information be treated as “soliciting material” or specifically incorporate such information by reference into such a filing.
The performance graph shown below compares the cumulative total return to our common stockholders as compared to the cumulative total returns on the Standard and Poor’s 500 Index (“S&P 500”) and the Standard and Poor’s 500 Oil & Gas Exploration & Production Index (“S&P 500 O&G E&P”) for the period of December 2011 through December 2016. The comparison was prepared based upon the following assumptions:
1. $100 was invested in our common stock, the S&P 500 and the S&P 500 O&G E&P on December 31, 2011 at the closing price on such date; and
2. Dividends were reinvested.
48
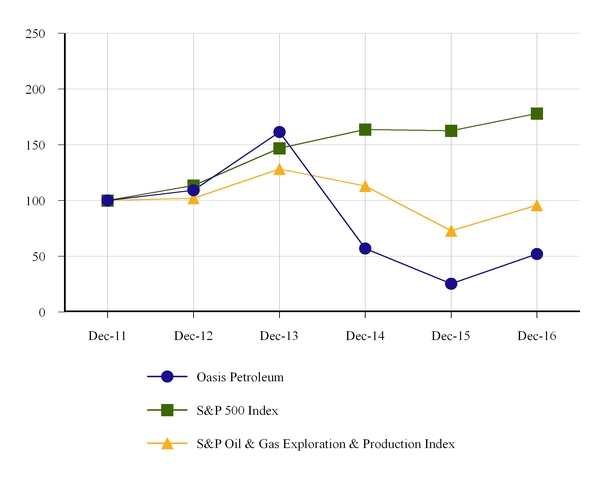
Item 6. Selected Financial Data
Set forth below is our summary historical consolidated financial data for the years ended December 31, 2012 through 2016. This information may not be indicative of our future results of operations, financial position and cash flows and should be read in conjunction with the consolidated financial statements and notes thereto and “Item 7. Management’s Discussion and Analysis of Financial Condition and Results of Operations” presented elsewhere in this Annual Report on Form 10-K. We believe that the assumptions underlying the preparation of our historical consolidated financial statements are reasonable.
49
Year ended December 31, | |||||||||||||||||||
2016(1) | 2015 | 2014 | 2013(1) | 2012 | |||||||||||||||
(In thousands, except per share data) | |||||||||||||||||||
Statement of operations data: | |||||||||||||||||||
Revenues: | |||||||||||||||||||
Oil and gas revenues | $ | 635,505 | $ | 721,672 | $ | 1,304,004 | $ | 1,084,412 | $ | 670,491 | |||||||||
Midstream revenues | 35,406 | 23,769 | 11,614 | 5,742 | — | ||||||||||||||
Well services revenues | 33,754 | 44,294 | 74,610 | 51,845 | 16,177 | ||||||||||||||
Total revenues | 704,665 | 789,735 | 1,390,228 | 1,141,999 | 686,668 | ||||||||||||||
Expenses: | |||||||||||||||||||
Lease operating expenses(2) | 135,444 | 144,481 | 169,600 | 94,634 | 54,924 | ||||||||||||||
Midstream operating expenses | 9,003 | 6,198 | 4,647 | 1,454 | — | ||||||||||||||
Well services operating expenses | 17,009 | 21,833 | 45,605 | 29,259 | 11,774 | ||||||||||||||
Marketing, transportation and gathering expenses | 40,366 | 31,610 | 29,133 | 25,924 | 9,257 | ||||||||||||||
Production taxes | 56,565 | 69,584 | 127,648 | 100,537 | 62,965 | ||||||||||||||
Depreciation, depletion and amortization | 476,331 | 485,322 | 412,334 | 307,055 | 206,734 | ||||||||||||||
Exploration expenses | 1,785 | 2,369 | 3,064 | 2,260 | 3,250 | ||||||||||||||
Rig termination(3) | — | 3,895 | — | — | — | ||||||||||||||
Impairment(4) | 4,684 | 46,109 | 47,238 | 1,168 | 3,581 | ||||||||||||||
General and administrative expenses | 93,008 | 92,498 | 92,306 | 75,310 | 57,190 | ||||||||||||||
Total expenses | 834,195 | 903,899 | 931,575 | 637,601 | 409,675 | ||||||||||||||
Gain (loss) on sale of properties | (1,303 | ) | — | 186,999 | — | — | |||||||||||||
Operating income (loss) | (130,833 | ) | (114,164 | ) | 645,652 | 504,398 | 276,993 | ||||||||||||
Other income (expense): | |||||||||||||||||||
Net gain (loss) on derivative instruments | (105,317 | ) | 210,376 | 327,011 | (35,432 | ) | 34,164 | ||||||||||||
Interest expense, net of capitalized interest | (140,305 | ) | (149,648 | ) | (158,390 | ) | (107,165 | ) | (70,143 | ) | |||||||||
Gain on extinguishment of debt | 4,741 | — | — | — | — | ||||||||||||||
Other income (expense) | 160 | (2,935 | ) | 195 | 1,216 | 4,860 | |||||||||||||
Total other income (expense) | (240,721 | ) | 57,793 | 168,816 | (141,381 | ) | (31,119 | ) | |||||||||||
Income (loss) before income taxes | (371,554 | ) | (56,371 | ) | 814,468 | 363,017 | 245,874 | ||||||||||||
Income tax benefit (expense) | 128,538 | 16,123 | (307,591 | ) | (135,058 | ) | (92,486 | ) | |||||||||||
Net income (loss) | $ | (243,016 | ) | $ | (40,248 | ) | $ | 506,877 | $ | 227,959 | $ | 153,388 | |||||||
Earnings (loss) per share: | |||||||||||||||||||
Basic | $ | (1.32 | ) | $ | (0.31 | ) | $ | 5.09 | $ | 2.45 | $ | 1.66 | |||||||
Diluted | (1.32 | ) | (0.31 | ) | 5.05 | 2.44 | 1.66 | ||||||||||||
__________________
(1) | Our statement of operations data for the years ended December 31, 2016 and 2013 does not include the full twelve months effects of our acquisitions for 2016 and 2013, respectively. We acquired such interests on December 1, 2016 for our 2016 acquisition, and September 26, 2013 and October 1, 2013 for our 2013 acquisitions. See Note 6 to our audited consolidated financial statements for more information on the 2016 acquisition. |
(2) | For the year ended December 31, 2012, lease operating expenses include midstream income and operating expenses, which are included in midstream revenues and midstream operating expenses, respectively, for the years ended December 31, 2016, 2015, 2014 and 2013. |
(3) | During the year ended December 31, 2015, we elected to early terminate certain drilling rig contracts and recorded rig termination expenses of $3.9 million. |
(4) | For the years ended December 31, 2016, 2015 and 2014, impairment includes $1.1 million, $9.4 million and $40.0 million, respectively, related to our proved properties. See Note 5 to our audited consolidated financial statements. |
50
At December 31, | |||||||||||||||||||
2016 | 2015 | 2014 | 2013 | 2012 | |||||||||||||||
(In thousands) | |||||||||||||||||||
Balance sheet data: | |||||||||||||||||||
Cash and cash equivalents | $ | 11,226 | $ | 9,730 | $ | 45,811 | $ | 91,901 | $ | 213,447 | |||||||||
Net property, plant and equipment | 5,919,567 | 5,218,242 | 5,186,786 | 4,079,750 | 2,006,600 | ||||||||||||||
Total assets(1) | 6,178,632 | 5,649,375 | 5,909,076 | 4,678,041 | 2,508,146 | ||||||||||||||
Long-term debt(1) | 2,297,214 | 2,302,584 | 2,670,664 | 2,501,687 | 1,179,352 | ||||||||||||||
Total stockholders’ equity | 2,923,157 | 2,319,342 | 1,872,301 | 1,348,549 | 795,005 | ||||||||||||||
__________________
(1) | Prior to 2015, we presented deferred financing costs related to our Senior Notes in other assets on our Consolidated Balance Sheet. Upon the adoption of new accounting guidance in 2015, such costs are presented as a deduction from the carrying value of long-term debt. As of December 31, 2016 and 2015, deferred financing costs related to our Notes totaling $28.3 million and $35.4 million, respectively, were included in long-term debt on our Consolidated Balance Sheet. Prior periods have been adjusted retrospectively to reflect the period-specific effects of applying the new guidance. Reclassified amounts total $29.3 million, $33.9 million and $20.6 million for the years ended December 31, 2014, 2013 and 2012, respectively. |
Year ended December 31, | |||||||||||||||||||
2016 | 2015 | 2014 | 2013 | 2012 | |||||||||||||||
(In thousands) | |||||||||||||||||||
Other financial data: | |||||||||||||||||||
Net cash provided by operating activities | $ | 228,018 | $ | 359,815 | $ | 872,516 | $ | 697,856 | $ | 392,386 | |||||||||
Net cash used in investing activities | (1,070,828 | ) | (479,148 | ) | (1,077,452 | ) | (2,445,076 | ) | (1,038,605 | ) | |||||||||
Net cash provided by financing activities | 844,306 | 83,252 | 158,846 | 1,625,674 | 388,794 | ||||||||||||||
51
Item 7. Management’s Discussion and Analysis of Financial Condition and Results of Operations
The following discussion and analysis of our financial condition and results of operations should be read in conjunction with our consolidated financial statements and related notes appearing elsewhere in this Annual Report on Form 10-K. The following discussion contains “forward-looking statements” that reflect our future plans, estimates, beliefs and expected performance. We caution that assumptions, expectations, projections, intentions or beliefs about future events may, and often do, vary from actual results, and the differences can be material. Some of the key factors which could cause actual results to vary from our expectations include changes in oil and natural gas prices, weather and environmental conditions, the timing of planned capital expenditures, availability of acquisitions, uncertainties in estimating proved reserves and forecasting production results, operational factors affecting the commencement or maintenance of producing wells, the condition of the capital markets generally, as well as our ability to access them, the proximity to and capacity of transportation facilities, and uncertainties regarding environmental regulations or litigation and other legal or regulatory developments affecting our business, as well as those factors discussed below and elsewhere in this Annual Report on Form 10-K, all of which are difficult to predict. In light of these risks, uncertainties and assumptions, the forward-looking events discussed may not occur. See “Cautionary note regarding forward-looking statements.”
Overview
We are an independent E&P company focused on the acquisition and development of unconventional oil and natural gas resources primarily in the North Dakota and Montana regions of the Williston Basin. Since our inception, we have acquired properties that provide current production and significant upside potential through further development. Our drilling activity is primarily directed toward projects that we believe can provide us with repeatable successes in the Bakken and Three Forks formations. OPNA conducts our domestic oil and natural gas E&P activities. We also operate a midstream services business through OMS and a well services business through OWS, both of which are separate reportable business segments that are complementary to our primary development and production activities. The revenues and expenses related to work performed by OMS and OWS for OPNA’s working interests are eliminated in consolidation and, therefore, do not directly contribute to our consolidated results of operations.
Our use of capital for acquisitions and development allows us to direct our capital resources to what we believe to be the most attractive opportunities as market conditions evolve. We have historically acquired properties that we believe will meet or exceed our rate of return criteria. We built our Williston Basin assets through acquisitions and development activities, which were financed with a combination of capital from private investors, borrowings under our revolving credit facility, cash flows provided by operating activities, proceeds from our Notes, proceeds from our public equity offerings, the sale of certain non-core oil and gas properties and cash settlements of derivative contracts. For acquisitions of properties with additional development, exploitation and exploration potential, we have focused on acquiring properties that we expect to operate so that we can control the timing and implementation of capital spending. In some instances, we have acquired non-operated property interests at what we believe to be attractive rates of return either because they provided an entry into a new area of interest or complemented our existing operations. In addition, the acquisition of non-operated properties in new areas provides us with geophysical and geologic data that may lead to further acquisitions in the same area, whether on an operated or non-operated basis. We intend to continue to acquire both operated and non-operated properties to the extent we believe they meet our return objectives.
Due to the geographic concentration of our oil and natural gas properties in the Williston Basin, we believe the primary sources of opportunities, challenges and risks related to our business for both the short and long-term are:
• | commodity prices for oil and natural gas; |
• | transportation capacity; |
• | availability and cost of services; and |
• | availability of qualified personnel. |
Our revenue, profitability and future growth rate depend substantially on factors beyond our control, such as economic, political and regulatory developments as well as competition from other sources of energy. Prices for oil and natural gas can fluctuate widely in response to relatively minor changes in the global and regional supply of and demand for oil and natural gas, as well as market uncertainty, economic conditions and a variety of additional factors. Since the inception of our oil and natural gas activities, commodity prices have experienced significant fluctuations and may fluctuate widely in the future. As a result of current oil prices, we have increased our planned 2017 capital expenditures as compared to 2016, excluding acquisitions, and we are continuing to concentrate our drilling activities in certain areas that are the most economic in the Williston Basin. Extended periods of low prices for oil or natural gas could materially and adversely affect our financial position, our results of operations, the quantities of oil and natural gas reserves that we can economically produce and our access to capital.
In an effort to improve price realizations from the sale of our oil and natural gas, we manage our commodities marketing activities in-house, which enables us to market and sell our oil and natural gas to a broader array of potential purchasers. We enter into crude oil sales contracts with purchasers who have access to crude oil transportation capacity, utilize derivative financial
52
instruments to manage our commodity price risk and enter into physical delivery contracts to manage our price differentials. Due to the availability of other markets and pipeline connections, we do not believe that the loss of any single oil or natural gas customer would have a material adverse effect on our results of operations or cash flows. Additionally, we sell a significant amount of our crude oil production through gathering systems connected to multiple pipeline and rail facilities. These gathering systems, which originate at the wellhead, reduce the need to transport barrels by truck from the wellhead. Currently, we are flowing approximately 90% of our gross operated oil production through these gathering systems. Please see “Item 1. Business—Marketing, transportation and major customers.”
Our quarterly average net realized oil prices and average price differentials are shown in the tables below.
2016 | Year ended December 31, 2016 | ||||||||||||||||||
Q1 | Q2 | Q3 | Q4 | ||||||||||||||||
Average Realized Oil Prices ($/Bbl)(1) | $ | 28.74 | $ | 40.81 | $ | 40.54 | $ | 44.57 | $ | 38.64 | |||||||||
Average Price Differential(2) | 14 | % | 11 | % | 10 | % | 10 | % | 11 | % | |||||||||
2015 | Year ended December 31, 2015 | ||||||||||||||||||
Q1 | Q2 | Q3 | Q4 | ||||||||||||||||
Average Realized Oil Prices ($/Bbl)(1) | $ | 40.73 | $ | 52.04 | $ | 41.61 | $ | 37.77 | $ | 43.04 | |||||||||
Average Price Differential(2) | 16 | % | 10 | % | 10 | % | 10 | % | 12 | % | |||||||||
2014 | Year ended December 31, 2014 | ||||||||||||||||||
Q1 | Q2 | Q3 | Q4 | ||||||||||||||||
Average Realized Oil Prices ($/Bbl)(1) | $ | 89.66 | $ | 94.48 | $ | 87.17 | $ | 62.79 | $ | 82.73 | |||||||||
Average Price Differential(2) | 9 | % | 8 | % | 10 | % | 13 | % | 10 | % | |||||||||
__________________
(1) | Realized oil prices do not include the effect of derivative contract settlements. |
(2) | Price differential reflects the difference between realized oil prices and WTI crude oil index prices. |
Our market optionality on the crude oil gathering systems allows us to shift volumes between pipeline and rail markets in order to optimize price realizations. Crude oil produced and sold in the Williston Basin has historically sold at a discount to WTI due to transportation costs and takeaway capacity. In the past, there have been periods when this discount has substantially increased due to oil production in the area increasing to a point that it temporarily surpassed the available pipeline transportation, rail transportation and refining capacity in the area. Expansions of both rail and pipeline facilities have reduced the prior constraint on oil transportation out of the Williston Basin and improved our price differentials received at the lease. In the first quarter of 2014, our average price differentials relative to WTI increased due to the pipeline market weakening as a result of refinery down time and increased U.S. and Canadian production. In the second and third quarters of 2014, stronger pipeline prices shifted more of our barrels towards the pipelines, but rail buyers had to compete with pipeline prices despite weaker Brent differentials, resulting in price differentials relative to WTI of approximately 9% to 11%. In the fourth quarter of 2014, as WTI crude oil prices declined, our price differentials increased as a percentage of WTI but remained relatively flat in terms of the dollar per barrel discount to WTI in the range of $9.00 to $10.50 per barrel of oil. In 2015, our price differentials relative to WTI strengthened as new pipelines opened to eastern Canada and U.S. markets and transportation on rail gradually declined. In the first quarter of 2015, as WTI further declined, our price differentials continued to increase as a percentage of WTI but decreased in terms of the dollar per barrel discount to WTI to an average of $7.85 per barrel of oil. In the second quarter of 2015, as WTI improved, our price differentials returned to approximately 10% as a percentage of WTI and continued to decrease in terms of the dollar per barrel discount to WTI to an average of $5.90 per barrel of oil. Since the third quarter of 2015, our price differentials have averaged less than $5.00 per barrel discount to WTI. We expect differentials to improve as takeaway capacity in the Williston Basin will increase by over 500,000 barrels of oil per day if the Dakota Access Pipeline is completed and put in service.
We believe our large concentrated acreage position provides us with a multi-year inventory of drilling projects and requires forward planning visibility for obtaining services and necessary permits to drill wells. As a result of current oil prices, we are planning to increase our well completions from 57 gross (37.6 net) operated wells in 2016 to 76 gross (51.7 net) operated wells in 2017. Additionally, we have the ability to control the pace of completions to allow for additional financial flexibility. In 2016, we wrote off $0.9 million of leases that we do not expect to develop before their 2017 contract expirations, as we continue to focus our 2017 drilling activities in the deepest part of our acreage in the Williston Basin.
Our 2016, 2015 and 2014 activities included development and exploration drilling in the Williston Basin. Our current activities are focused on evaluating and developing our asset base and optimizing our operations. Based on the reserve reports prepared by our independent reserve engineers, we had 305.1 MMBoe of estimated net proved reserves with a PV-10 of $2,627.8 million and a Standardized Measure of $2,483.1 million at December 31, 2016, 218.2 MMBoe of estimated net proved reserves with a PV-10 of $2,022.7 million and a Standardized Measure of $1,914.3 million at December 31, 2015 and 272.1 MMBoe of estimated net proved reserves with a PV-10 of $5,481.4 million and a Standardized Measure of $3,981.7 million at December 31, 2014. Our
53
estimated net proved reserves and related future net revenues, PV-10 and Standardized Measure were determined using index prices for oil and natural gas, without giving effect to derivative transactions, and were held constant throughout the life of the properties. The unweighted arithmetic average first-day-of-the-month prices for the prior twelve months for the years ended December 31, 2016, 2015 and 2014 were $42.60 per Bbl for oil and $2.47 per MMBtu for natural gas, $50.16 per Bbl for oil and $2.63 per MMBtu for natural gas and $95.28 per Bbl for oil and $4.35 per MMBtu for natural gas, respectively. These prices were adjusted by lease for quality, transportation fees, geographical differentials, marketing bonuses or deductions and other factors affecting the price received at the wellhead. Future operating costs, production taxes and capital costs were based on current costs as of each year-end. Changes in commodity prices and future operating costs may significantly affect the economic viability of drilling projects as well as the economic valuation and economic recovery of oil and gas reserves. An extended period of low oil prices could result in a significant decrease in our estimated net proved reserves and related future net revenues, PV-10 and Standardized Measure in the future.
Forward commodity prices and estimates of future production also play a significant role in determining impairment. As a result of lower commodity prices and their impact on our estimated future cash flows, we have continued to review our proved oil and natural gas properties for impairment. In 2014, we recorded a proved impairment loss of $40.0 million due to lower oil prices. In 2015 and 2016, we recorded an impairment charge of $9.4 million and $1.1 million to write down our proved properties held for sale to their estimated fair value, less costs to sell. No other proved impairment charges were recorded during the year ended December 31, 2016. In addition, the excess of our expected undiscounted future cash flows over the carrying value of our proved oil and natural gas properties in the Bakken and Three Forks formations has increased to $4,111.9 million as of December 31, 2016, an increase of approximately 225% as compared to an excess of $1,264.8 million at December 31, 2015. The underlying commodity prices embedded in our expected undiscounted cash flows were determined using NYMEX forward strip prices for five years, escalating 3% per year thereafter. Our expected undiscounted estimated cash flows also included a 3% inflation factor applied to the future operating and development costs after five years. If expected future commodity prices decline by approximately 30% as compared to December 31, 2016, holding all other factors constant, the expected undiscounted cash flows may not exceed the carrying value of our proved oil and natural gas properties in the Bakken and Three Forks formations, and as a result, we may recognize additional proved impairment charges in the future, and such impairment charges could exceed $2.5 billion assuming a discount rate of 10%.
2016 Highlights
• | Average daily production was 50,372 Boe per day in 2016. |
• | We completed and placed on production 57 gross (37.6 net) operated wells during 2016. As of December 31, 2016, the Company had 83 gross operated wells awaiting completion. |
• | We closed on an accretive acquisition of approximately 55,000 net acres on December 1, 2016 in the Williston Basin (the “Williston Basin Acquisition”) for a purchase price of $765.8 million, subject to further customary post-close purchase price adjustments. |
• | We completed and brought online our natural gas processing plant and other midstream infrastructure in Wild Basin. |
• | Excluding acquisitions, capital expenditures were $400.0 million for the year ended December 31, 2016, a 31% decrease as compared to 2015. |
• | We increased total net proved oil and natural gas reserves at December 31, 2016 by 40% to 305.1 MMBoe, which included an increase of almost 30% in net proved developed reserves and more than 60% in net proved undeveloped reserves year over year. |
• | We ended the year with a leasehold position of 517,801 total net acres in the Williston Basin, primarily targeting the Bakken and Three Forks formations. In addition, we increased our acreage that is held by production to 484,321 net acres as of December 31, 2016. |
• | We decreased lease operating expenses per Boe to $7.35 per Boe for the year ended December 31, 2016. |
• | We completed a $300.0 million public offering of senior unsecured convertible notes due 2023 and repurchased an aggregate principal amount of $447.0 million of our outstanding Senior Notes. |
• | At December 31, 2016, we had $11.2 million of cash and cash equivalents and had total liquidity of $785.9, including the availability under our revolving credit facility. |
• | Net cash provided by operating activities was $228.0 million for the year ended December 31, 2016. Adjusted EBITDA, a non-GAAP financial measure, was $500.3 million for the year ended December 31, 2016. For a definition of Adjusted EBITDA and a reconciliation of Adjusted EBITDA to net loss and net cash provided by operating activities, see “Non-GAAP Financial Measures” below. |
54
Results of Operations
Revenues
Our oil and gas revenues are derived from the sale of oil and natural gas production. These revenues do not include the effects of derivative instruments and may vary significantly from period to period as a result of changes in volumes of production sold or changes in commodity prices. Our midstream revenues are primarily derived from salt water pipeline transport, salt water disposal, natural gas gathering and processing, fresh water sales and crude oil gathering and transportation. Our well services revenues are derived from well services, product sales and equipment rentals. A substantial majority of our midstream revenues and well services revenues are from services for third-party working interest owners in OPNA’s operated wells. Intercompany revenues for work performed by OMS and OWS for OPNA’s working interests are eliminated in consolidation and are therefore not included in midstream and well services revenue.
The following table summarizes our revenues and production data for the periods presented:
Year ended December 31, | |||||||||||
2016 | 2015 | 2014 | |||||||||
Operating results (in thousands): | |||||||||||
Revenues | |||||||||||
Oil | $ | 596,580 | $ | 692,497 | $ | 1,231,251 | |||||
Natural gas | 38,925 | 29,175 | 72,753 | ||||||||
Midstream | 35,406 | 23,769 | 11,614 | ||||||||
Well services | 33,754 | 44,294 | 74,610 | ||||||||
Total revenues | $ | 704,665 | $ | 789,735 | $ | 1,390,228 | |||||
Production data: | |||||||||||
Oil (MBbls) | 15,174 | 16,091 | 14,883 | ||||||||
Natural gas (MMcf) | 19,573 | 14,002 | 10,691 | ||||||||
Oil equivalents (MBoe) | 18,436 | 18,424 | 16,664 | ||||||||
Average daily production (Boe per day) | 50,372 | 50,477 | 45,656 | ||||||||
Average sales prices: | |||||||||||
Oil, without derivative settlements (per Bbl)(1) | $ | 38.64 | $ | 43.04 | $ | 82.73 | |||||
Oil, with derivative settlements (per Bbl)(1)(2) | 46.68 | 66.06 | 83.19 | ||||||||
Natural gas (per Mcf)(3) | 1.99 | 2.08 | 6.81 | ||||||||
__________________
(1) | For the year ended December 31, 2016, average sales prices for oil are calculated using total oil revenues, excluding bulk oil sales of $10.3 million, divided by oil production. |
(2) | Realized prices include gains or losses on cash settlements for our commodity derivatives, which do not qualify for and were not designated as hedging instruments for accounting purposes. Cash settlements represent the cumulative gains and losses on our derivative instruments for the periods presented and do not include a recovery of costs that were paid to acquire or modify the derivative instruments that were settled. |
(3) | Natural gas prices include the value for natural gas and natural gas liquids. |
Year ended December 31, 2016 as compared to year ended December 31, 2015
Oil and gas revenues. Our oil and gas revenues decreased $86.2 million, or 12%, to $635.5 million during the year ended December 31, 2016 as compared to the year ended December 31, 2015. The lower oil and natural gas sales prices decreased revenues by $72.1 million coupled with a $35.4 million decrease due to lower oil production amounts sold, partially offset by an $11.1 million increase due to higher natural gas production amounts sold during the year ended December 31, 2016 as compared to the year ended December 31, 2015. In addition, oil and gas revenues included $10.3 million of bulk oil sales related to marketing activities during the year ended December 31, 2016. Average oil sales prices, without derivative settlements, decreased by $4.40 per barrel to an average of $38.64 per barrel, and average natural gas sales prices, which include the value for natural gas and natural gas liquids, decreased by $0.09 per Mcf to an average of $1.99 per Mcf for the year ended December 31, 2016 as compared to the year ended December 31, 2015. Average daily production sold decreased by 105 Boe per day to 50,372 Boe per day during the year ended December 31, 2016 as compared to the year ended December 31, 2015. The decrease in average daily production sold was primarily a result of the natural decline in production in wells that were producing as of December 31, 2015, coupled with the divestiture completed on April 1, 2016, which resulted in a decrease in average daily production of approximately 411 Boe per day during the year ended December 31, 2016. This decrease was
55
offset by our 38.1 total net well completions in the core of the Williston Basin, which had higher gas to oil ratios that resulted in a 40% increase in natural gas production sold year over year, and the Williston Basin Acquisition completed on December 1, 2016. See Note 6 to our audited consolidated financial statements for a description of our acquisitions and divestitures.
Midstream revenues. Midstream revenues were $35.4 million for the year ended December 31, 2016, which was a $11.6 million increase year over year. This increase was driven by a $6.1 million increase related to higher natural gas volumes gathered and processed with the start up of our natural gas processing plant in the third quarter of 2016, coupled with a $6.0 million increase related to increased water volumes flowing through our salt water disposal systems as a result of new well connections and capacity additions.
Well services revenues. In response to the low commodity price environment, we decreased the pace of our well completions and reduced OWS to one fracturing fleet during the first quarter of 2016. As a result, our well services revenues decreased by $10.5 million to $33.8 million for the year ended December 31, 2016 as compared to the year ended December 31, 2015. Well completion revenue decreased $7.8 million year over year due to the decreased activity, partially offset by the impact of OWS completing OPNA wells with a higher average third-party working interest year over year. In addition, product sales to third parties decreased $1.7 million as a result of OWS completing all of OPNA’s operated wells and equipment rentals decreased $1.0 million in 2016 as compared to 2015.
Year ended December 31, 2015 as compared to year ended December 31, 2014
Oil and gas revenues. Our oil and gas revenues decreased $582.3 million, or 45%, to $721.7 million during the year ended December 31, 2015 compared to the year ended December 31, 2014, primarily due to lower realized oil and natural gas sales prices, partially offset by increased production volumes sold. Average daily production sold increased by 4,821 Boe per day, or 11%, to 50,477 Boe per day during the year ended December 31, 2015 as compared to the year ended December 31, 2014. The increase in average daily production sold was primarily a result of our 64.3 total net well completions in the Williston Basin during 2015, offset by the natural decline in production in wells that were producing as of December 31, 2014. Production from wells completed contributed to average daily production during 2015 by approximately 11,366 Boe per day. Average oil sales prices, without derivative settlements, decreased by $39.69 per barrel, or 48%, to an average of $43.04 per barrel, and average natural gas sales prices, which include the value for natural gas and natural gas liquids, decreased by $4.73 per Mcf, or 69%, to an average of $2.08 per Mcf for the year ended December 31, 2015 as compared to the year ended December 31, 2014. The lower oil and natural gas sales prices decreased revenues by $641.2 million, partially offset by higher production amounts sold, which increased revenues by $58.9 million during the year ended December 31, 2015.
Midstream revenues. Midstream revenues totaled $23.8 million for the year ended December 31, 2015, a $12.2 million increase year over year, primarily due to a $9.1 million increase in salt water disposal revenue due to increased water volumes flowing through our salt water disposal systems as a result of increased well connections and capacity additions coupled with a $1.9 million increase in fresh water sales revenue.
Well services revenues. Well services revenues decreased $30.3 million for the year ended December 31, 2015 as compared to the year ended December 31, 2014 primarily due to a $26.8 million decrease in product sales to third parties as a result of OWS completing substantially all of OPNA’s operated wells in 2015, coupled with a decrease of $3.1 million in equipment rentals as a result of running fewer rigs in 2015 as compared to 2014. Well completion activity increased year over year, but OWS completed OPNA wells with a lower average third-party working interest in 2015 as compared to 2014, resulting in a net decrease of $0.3 million in well completion revenue. While a lower average third-party working interest decreases the well completion revenue recognized in our consolidated results of operations, it improves our capital expenditures by reducing OPNA well costs.
56
Expenses and other income
The following table summarizes our operating expenses, gain on sale of properties and other income and expenses for the periods presented:
Year ended December 31, | |||||||||||
2016 | 2015 | 2014 | |||||||||
(In thousands, except per Boe of production) | |||||||||||
Expenses: | |||||||||||
Lease operating expenses | $ | 135,444 | $ | 144,481 | $ | 169,600 | |||||
Midstream operating expenses | 9,003 | 6,198 | 4,647 | ||||||||
Well services operating expenses | 17,009 | 21,833 | 45,605 | ||||||||
Marketing, transportation and gathering expenses | 40,366 | 31,610 | 29,133 | ||||||||
Production taxes | 56,565 | 69,584 | 127,648 | ||||||||
Depreciation, depletion and amortization | 476,331 | 485,322 | 412,334 | ||||||||
Exploration expenses | 1,785 | 2,369 | 3,064 | ||||||||
Rig termination | — | 3,895 | — | ||||||||
Impairment | 4,684 | 46,109 | 47,238 | ||||||||
General and administrative expenses | 93,008 | 92,498 | 92,306 | ||||||||
Total expenses | 834,195 | 903,899 | 931,575 | ||||||||
Gain (loss) on sale of properties | (1,303 | ) | — | 186,999 | |||||||
Operating income (loss) | (130,833 | ) | (114,164 | ) | 645,652 | ||||||
Other income (expense): | |||||||||||
Net gain (loss) on derivative instruments | (105,317 | ) | 210,376 | 327,011 | |||||||
Interest expense, net of capitalized interest | (140,305 | ) | (149,648 | ) | (158,390 | ) | |||||
Gain on extinguishment of debt | 4,741 | — | — | ||||||||
Other income (expense) | 160 | (2,935 | ) | 195 | |||||||
Total other income (expense) | (240,721 | ) | 57,793 | 168,816 | |||||||
Income (loss) before income taxes | (371,554 | ) | (56,371 | ) | 814,468 | ||||||
Income tax benefit (expense) | 128,538 | 16,123 | (307,591 | ) | |||||||
Net income (loss) | $ | (243,016 | ) | $ | (40,248 | ) | $ | 506,877 | |||
Costs and expenses (per Boe of production): | |||||||||||
Lease operating expenses | $ | 7.35 | $ | 7.84 | $ | 10.18 | |||||
Marketing, transportation and gathering expenses | 2.19 | 1.72 | 1.75 | ||||||||
Production taxes | 3.07 | 3.78 | 7.66 | ||||||||
Depreciation, depletion and amortization | 25.84 | 26.34 | 24.74 | ||||||||
General and administrative expenses | 5.04 | 5.02 | 5.54 | ||||||||
Year ended December 31, 2016 as compared to year ended December 31, 2015
Lease operating expenses. Lease operating expenses decreased $9.0 million to $135.4 million for the year ended December 31, 2016 as compared to the year ended December 31, 2015. The decrease was primarily due to an increase in salt water disposal volumes being transported on OMS pipelines and injected in OMS salt water disposal wells coupled with the completion of wells in the core that had lower water to oil ratios, partially offset by higher costs associated with operating an increased number of producing wells. Utilizing our own infrastructure for salt water disposal enables us to lower operating costs through increased operational efficiency. We completed and placed on production 38.1 total net wells in the Williston Basin during the year ended December 31, 2016 as compared to 64.3 total net wells completed and placed on production during the year ended December 31, 2015. Lease operating expenses decreased from $7.84 per Boe for the year ended December 31, 2015 to $7.35 per Boe for the year ended December 31, 2016 due to the lower costs.
Midstream operating expenses. Midstream operating expenses represent third-party working interest owners’ share of operating expenses incurred by OMS. The $2.9 million increase for the year ended December 31, 2016 as compared to the year ended December 31, 2015 was primarily related to the start up of our natural gas processing plant in the third quarter of 2016 coupled
57
with an increase in water trucking expenses due to produced water from OPNA exceeding OMS salt water disposal capacity in certain areas and at certain times.
Well services operating expenses. Well services operating expenses represent third-party working interest owners’ share of completion service costs, cost of goods sold and operating expenses incurred by OWS. The $4.8 million decrease for the year ended December 31, 2016 as compared to the year ended December 31, 2015 was primarily attributable to the lower well completion activity, partially offset by OWS completing OPNA wells with a higher average third-party working interest in the year ended December 31, 2016 as compared to December 31, 2015.
Marketing, transportation and gathering expenses. Marketing, transportation and gathering expenses increased $8.8 million year over year, or a $0.47 increase per Boe, which was primarily attributable to a $10.3 million increase in costs related to bulk purchases coupled with a $0.4 million increase in natural gas gathering and processing expenses related to additional well connections on OMS infrastructure and the start up of our natural gas processing plant in the third quarter of 2016, offset by a decrease year over year of $1.2 million in the write down of our crude oil inventory to the lower of cost or market value at year-end and a $0.8 million decrease in oil transportation costs, primarily driven by lower trucking costs. Excluding non-cash valuation adjustments and bulk purchases, our marketing, transportation and gathering expenses on a per Boe basis remained relatively consistent at $1.60 and $1.62 for the years ended December 31, 2016 and 2015, respectively.
Production taxes. Our production taxes for the years ended December 31, 2016 and 2015 were 9.0% and 9.6%, respectively, as a percentage of oil and natural gas sales. The production tax rate decreased year over year primarily due to reduced extraction tax rates in North Dakota beginning in January 2016. For the years ended December 31, 2016 and 2015, the percentage of our total production located in North Dakota was approximately 92% and 88%, respectively. In 2015, North Dakota had a crude oil tax structure based on a 5% production tax and a 6.5% oil extraction tax, resulting in a combined tax rate of 11.5% of crude oil revenues. In 2016, the North Dakota oil extraction tax was reduced to 5%, resulting in a combined tax rate of 10% of crude oil revenues.
Depreciation, depletion and amortization (“DD&A”). DD&A expense decreased $9.0 million to $476.3 million for the year ended December 31, 2016 as compared to the year ended December 31, 2015. The decrease in DD&A expense for the year ended December 31, 2016 was primarily due to a decrease in the average DD&A rate to $25.84 per Boe for the year ended December 31, 2016 as compared to $26.34 per Boe for the year ended December 31, 2015. The decrease in the DD&A rate was primarily due to lower well costs and higher recoverable reserves.
Rig termination. We did not early terminate any drilling rig contracts during the year ended December 31, 2016. As a result of our lowered 2015 capital expenditure program, we elected to early terminate certain drilling rig contracts and recorded a rig termination expense of $3.9 million for the year ended December 31, 2015.
Impairment. During the years ended December 31, 2016 and 2015, we recorded total impairment charges of $4.7 million and $46.1 million, respectively. To adjust the carrying value of our properties held for sale to their estimated fair value, determined based on the expected sales price less costs to sell, we recorded impairment charges of $3.6 million and $9.4 million for the years ended December 31, 2016 and 2015, respectively. No other impairment charges of proved oil and gas or other properties were recorded in 2016 or 2015. We also recorded non-cash impairment charges of $0.2 million and $14.4 million during the years ended December 31, 2016 and 2015, respectively, for unproved properties due to leases that expired during the period. As a result of periodic assessments of unproved properties not held-by-production, we recorded additional impairment charges of $0.9 million and $22.2 million related to acreage expiring in future periods because there were no plans to drill or extend the leases prior to their expiration. During the year ended December 31, 2015, these impairment charges included $15.2 million related to leases that expired during the year ended December 31, 2016. Consequently, lower impairment charges for unproved properties were recorded during the year ended December 31, 2016 as most leases that expired during the period had been previously impaired. In determining the amount of non-cash impairment charges for such periods, we considered the application of the factors described under “Critical accounting policies and estimates—Impairment of proved properties” and “Critical accounting policies and estimates—Impairment of unproved properties.”
General and administrative (“G&A”) expenses. Our G&A expenses increased $0.5 million for the year ended December 31, 2016 from $92.5 million for the year ended December 31, 2015. OWS G&A increased by $3.6 million primarily due to OWS completing OPNA wells with a higher average third-party working interest during the year ended December 31, 2016 as compared to the year ended December 31, 2015. Excluding our intercompany elimination, gross OWS G&A decreased $11.9 million. E&P G&A was $79.0 million and $83.0 million for the years ended December 31, 2016 and 2015, respectively. The decreases in gross OWS G&A and E&P G&A were primarily due to lower compensation expenses due to a decrease in employee headcount. OMS G&A increased $0.9 million for the year ended December 31, 2016 as compared to December 31, 2015 primarily due to increased employee compensation due to organizational growth within this segment due to the start up of our natural gas processing plant in the third quarter of 2016. Consolidated G&A expenses included non-cash amortization
58
for stock-based compensation of $24.1 million and $25.3 million in 2016 and 2015, respectively. Our full-time employee headcount decreased to 477 as of December 31, 2016 from 535 as of December 31, 2015.
Loss on sale of properties. For the year ended December 31, 2016, we recognized a $1.3 million loss related to the sale of certain legacy wells that have been producing from conventional reservoirs such as the Madison, Red River and other formations in the Williston Basin other than the Bakken or Three Forks formations. No gain or loss on sale of properties was recorded in the year ended December 31, 2015.
Derivatives. As a result of entering into derivative contracts and the effect of the forward strip oil price changes, we incurred a $105.3 million net loss on derivative instruments, including net cash settlement receipts of $122.0 million, for the year ended December 31, 2016, and a $210.4 million net gain on derivative instruments, including net cash settlement receipts of $370.4 million, for the year ended December 31, 2015. Cash settlements represent the cumulative gains and losses on our derivative instruments for the periods presented and do not include a recovery of costs that were paid to acquire or modify the derivative instruments that were settled.
Interest expense. Interest expense decreased $9.3 million to $140.3 million for the year ended December 31, 2016 as compared to the year ended December 31, 2015. The decrease was primarily due to the repurchase of Senior Notes, which decreased interest costs, and a decrease in interest expense incurred on borrowings under our revolving credit facility. These decreases were partially offset by interest expense related to our senior unsecured convertible notes issued in September 2016, which includes debt discount amortization, and a decrease in capitalized interest due to lower work in progress as a result of the completion of our natural gas processing plant in the third quarter of 2016. Interest expense incurred on borrowings under our revolving credit facility decreased by $2.9 million during 2016 as compared to 2015 due to a lower average borrowings year over year. For the year ended December 31, 2016, the weighted average debt outstanding under our revolving credit facility was $258.3 million, and the weighted average interest rate incurred on the outstanding borrowings was 2.3%. For the year ended December 31, 2015, the weighted average debt outstanding under our revolving credit facility was $261.2 million, and the weighted average interest rate incurred on the outstanding borrowings was 1.8%. We capitalized $16.8 million and $18.6 million of interest costs for the years ended December 31, 2016 and 2015, respectively, which will be amortized over the life of the related assets.
Gain on extinguishment of debt. During the year ended December 31, 2016, we repurchased an aggregate principal amount of $447.0 million of our outstanding senior unsecured notes for an aggregate cost of $435.9 million, including accrued interest and fees. For the year ended December 31, 2016, we recognized a pre-tax gain related to the repurchase of $4.7 million, which included unamortized deferred financing costs write-offs of $6.4 million. During the year ended December 31, 2015, we did not repurchase any portion of our outstanding senior unsecured notes.
Income tax benefit. Our income tax benefit for the years ended December 31, 2016 and 2015 was recorded at 34.6% and 28.6%, respectively, of pre-tax loss. The effective tax rates for both years were lower than the combined federal statutory rate and the statutory rates for the states in which we conduct business due to the impact of permanent differences on our pre-tax loss. The permanent differences were primarily for compensation amounts expensed for book purposes versus the amounts deductible for income tax purposes related to stock-based compensation vesting during years ended December 31, 2016 and 2015 at stock prices lower than the grant date values. During the year ended December 31, 2016, we recorded a valuation allowance of $0.8 million and $0.6 million for Montana net operating losses and federal charitable contribution carryovers, respectively, based on management’s assessment that it is more likely than not that these net deferred tax assets will not be realized prior to their expiration due to their short carryover periods, current economic conditions and expectations for the future.
Year ended December 31, 2015 as compared to year ended December 31, 2014
Lease operating expenses. Lease operating expenses decreased $25.1 million to $144.5 million for the year ended December 31, 2015 as compared to the year ended December 31, 2014. This decrease was primarily due to lower workover costs and an increase in salt water disposal volumes being transported on OMS pipelines and injected in OMS salt water disposal wells, partially offset by higher costs associated with operating an increased number of producing wells. We completed and placed on production 64.3 total net wells in the Williston Basin during the year ended December 31, 2015 as compared to 151.1 total net wells completed and placed on production during the year ended December 31, 2014. Lease operating expenses decreased from $10.18 per Boe for the year ended December 31, 2014 to $7.84 per Boe for the year ended December 31, 2015 due to the lower costs and increase in oil and natural gas production.
Midstream operating expenses. The $1.6 million increase in midstream operating expenses for the year ended December 31, 2015 as compared to the year ended December 31, 2014 was primarily related to salt water pipeline and disposal operating expenses and fresh water purchases.
59
Well services operating expenses. The $23.8 million decrease in well services operating expenses for the year ended December 31, 2015 as compared to the year ended December 31, 2014 was attributable to a decrease in well completion costs as a result of lower well completion product sales to third parties due to OWS completing substantially all of OPNA’s operated wells, coupled with OWS completing OPNA wells with a lower average third-party working interest in the year ended December 31, 2015 as compared to December 31, 2014.
Marketing, transportation and gathering expenses. Marketing, transportation and gathering expenses increased $2.5 million year over year, or a $0.03 decrease per Boe, which was primarily attributable to a $1.4 million increase in natural gas gathering charges related to additional well connections on OMS infrastructure, a $1.4 million increase in oil transportation costs associated with having additional wells connected to third-party infrastructure and a $0.3 million increase in our pipeline imbalance. These increases were partially offset by a decrease year over year of $0.9 million in the write down of our crude oil inventory to the lower of cost or market value at year-end. Excluding non-cash valuation adjustments, our marketing, transportation and gathering expenses on a per Boe basis would have remained constant at $1.62 and $1.61 for the years ended December 31, 2015 and 2014, respectively. The transporting of volumes through third-party oil gathering pipelines increases marketing, transportation and gathering expenses but improves oil price realizations by reducing transportation costs included in our oil price differential for sales at the wellhead.
Production taxes. Our production taxes for the years ended December 31, 2015 and 2014 were 9.6% and 9.8%, respectively, as a percentage of oil and natural gas sales. The production tax rate decreased slightly year over year primarily due to reduced extraction tax rates triggered by lower oil prices on certain North Dakota wells, partially offset by an increased weighting of wells in North Dakota, which has a higher average production tax rate as compared to Montana. For the years ended December 31, 2015 and 2014, the percentage of our total production located in North Dakota was approximately 88% and 86%, respectively. In 2015 and 2014, North Dakota had a crude oil tax structure based on a 5% production tax and a 6.5% oil extraction tax, resulting in a combined tax rate of 11.5% of crude oil revenues.
Depreciation, depletion and amortization. DD&A expense increased $73.0 million to $485.3 million for the year ended December 31, 2015 as compared to the year ended December 31, 2014. The increase in DD&A expense for the year ended December 31, 2015 was primarily due to an increase in the average DD&A rate per Boe year over year coupled with production increases from our wells completed during 2015. The DD&A rate for the year ended December 31, 2015 was $26.34 per Boe as compared to $24.74 per Boe for the year ended December 31, 2014. The increase in the DD&A rate was primarily due to lower recoverable reserves related to lower oil and natural gas prices and increased exploratory and delineation drilling in the Three Forks formation.
Rig termination. As a result of our lowered 2015 capital expenditure program, we elected to early terminate certain drilling rig contracts and recorded a rig termination expense of $3.9 million for the year ended December 31, 2015. We did not early terminate any drilling rig contracts during the year ended December 31, 2014 or 2013.
Impairment. Due to lower expected future oil prices, we reviewed our proved oil and natural gas properties for impairment as of December 31, 2015 and 2014. For the year ended December 31, 2015, we recorded an impairment loss of $9.4 million to adjust the carrying value of our proved oil and natural gas properties held for sale to their estimated fair value. For the year ended December 31, 2014, we determined that the carrying value exceeded expected undiscounted cash flows for certain legacy wells that have been producing from conventional reservoirs such as the Madison, Red River and other formations in the Williston Basin other than the Bakken or Three Forks formations. As a result, we recorded an impairment loss of $40.0 million to adjust the carrying amount of these assets to fair value. During the years ended December 31, 2015 and 2014, we also recorded non-cash impairment charges of $36.6 million and $7.3 million, respectively, for unproved properties due to leases that expired during the period and periodic assessments of unproved properties. The 2015 and 2014 impairment charges included $22.2 million related to acreage expiring in 2016 and 2017 and $2.9 million related to acreage expiring in 2015 and 2016, respectively, as a result of periodic assessments because there were no plans to drill or extend the leases prior to their expiration. In determining the amount of non-cash impairment charges for such periods, we considered the application of the factors described under “Critical accounting policies and estimates—Impairment of proved properties” and “Critical accounting policies and estimates—Impairment of unproved properties.”
General and administrative expenses. Our G&A expenses increased $0.2 million to $92.5 million for the year ended December 31, 2015 as compared to the year ended December 31, 2014. E&P G&A was $83.0 million and $80.4 million for the years ended December 31, 2015 and 2014, respectively. The $2.6 million increase in E&P G&A was primarily due to increased employee compensation expenses, partially offset by increased shared services allocations to our OWS and OMS segments. OMS G&A increased $1.3 million for the year ended December 31, 2015 as compared to December 31, 2014 primarily due to increased employee compensation due to organizational growth within this segment. OWS G&A decreased by $3.6 million primarily due to OWS completing OPNA wells with a lower average third-party working interest in the year ended December 31, 2015 as compared to 2014. Consolidated G&A expenses included non-cash amortization for stock-based compensation of
60
$25.3 million and $21.3 million in 2015 and 2014, respectively. While our full-time employee headcount decreased to 535 as of December 31, 2015 from 558 as of December 31, 2014, our average employee headcount was higher during 2015 as compared to 2014.
Gain on sale of properties. No gain or loss on sale of properties was recorded in the year ended December 31, 2015. In the year ended December 31, 2014, we recognized a $187.0 million gain related to the divestiture of certain non-operated properties in and around our Sanish position.
Derivatives. As a result of entering into derivative contracts and the effect of the forward strip oil price changes, we incurred a $210.4 million net gain on derivative instruments, including net cash settlement receipts of $370.4 million, for the year ended December 31, 2015, and a $327.0 million net gain on derivative instruments, including net cash settlement receipts of $6.8 million, for the year ended December 31, 2014.
Interest expense. Interest expense decreased $8.7 million to $149.6 million for the year ended December 31, 2015 as compared to the year ended December 31, 2014. The decrease was primarily due to increased interest costs capitalized due to increased work in progress, including the natural gas processing plant we were constructing in Wild Basin and 85 wells waiting on completion as of December 31, 2015. Interest expense incurred on borrowings under our revolving credit facility remained relatively constant during 2015 as compared to 2014. For the year ended December 31, 2015, the weighted average debt outstanding under our revolving credit facility was $261.2 million and the weighted average interest rate incurred on the outstanding borrowings was 1.8%. For the year ended December 31, 2014, the weighted average debt outstanding under our revolving credit facility was $272.3 million and the weighted average interest rate incurred on the outstanding borrowings was 1.8%. We capitalized $18.6 million and $8.8 million of interest costs for the years ended December 31, 2015 and 2014, respectively, which will be amortized over the life of the related assets.
Income tax benefit (expense). Income tax benefit for the year ended December 31, 2015 was recorded at 28.6% of pre-tax loss, and income tax expense for the year ended December 31, 2014 was recorded at 37.8% of pre-tax net income. While our 2014 effective tax rate was consistent with the statutory tax rate applicable to the U.S. and the blended state rate for the states in which we conduct business, our effective tax rate for the year ended December 31, 2015 was lower due to permanent differences between the amounts expensed for book purposes versus the amounts deductible for income tax purposes related to stock-based compensation vesting during the year ended December 31, 2015 at stock prices lower than the grant date values, partially offset by a reduction in the North Dakota statutory tax rate in 2015.
Liquidity and capital resources
Our primary sources of liquidity as of the date of this report have been proceeds from our Notes, borrowings under our revolving credit facility, proceeds from public equity offerings, cash flows from operations, the sale of certain non-core oil and gas properties and cash settlements of derivative contracts. Our primary uses of cash have been for the acquisition and development of oil and natural gas properties and midstream infrastructure, payment of operating and general and administrative costs, interest payments on outstanding debt and repurchases of Senior Notes. We continually monitor potential capital sources, including equity and debt financings and potential asset monetizations, in order to enhance liquidity and decrease leverage. Our future success in growing proved reserves and production will be highly dependent on our ability to access outside sources of capital.
Our cash flows for the years ended December 31, 2016, 2015 and 2014 are presented below:
Year ended December 31, | |||||||||||
2016 | 2015 | 2014 | |||||||||
(In thousands) | |||||||||||
Net cash provided by operating activities | $ | 228,018 | $ | 359,815 | $ | 872,516 | |||||
Net cash used in investing activities | (1,070,828 | ) | (479,148 | ) | (1,077,452 | ) | |||||
Net cash provided by financing activities | 844,306 | 83,252 | 158,846 | ||||||||
Net change in cash and cash equivalents | $ | 1,496 | $ | (36,081 | ) | $ | (46,090 | ) | |||
Our cash flows depend on many factors, including the price of oil and natural gas and the success of our development and exploration activities as well as future acquisitions. Prices for oil have declined significantly since mid-2014, which has substantially decreased our cash flows provided by operating activities. We actively manage our exposure to commodity price fluctuations by executing derivative transactions to mitigate the change in oil and natural gas prices on a portion of our production, thereby mitigating our exposure to oil and natural gas price declines, but these transactions may also limit our cash
61
flow in periods of rising oil and natural gas prices. As of December 31, 2016, our derivative contracts in place cover 12.0 MMBbls of crude oil and 5.5 MMBtus of natural gas in 2017.
On February 2, 2016, we completed a public equity offering resulting in net proceeds of $182.8 million, after deducting underwriting discounts and commissions and estimated offering expenses, which was used for general corporate purposes.
In September 2016, we issued $300.0 million of 2.625% senior unsecured convertible notes due September 15, 2023 (the “Senior Convertible Notes”), which resulted in aggregate net proceeds to us of $291.9 million, which we used to fund the tender offers to repurchase certain outstanding Senior Notes (as defined below) (the “Tender Offers”). As a result of the Tender Offers, we repurchased an aggregate principal amount of $362.4 million of our outstanding Senior Notes, for an aggregate cost of $371.4 million, including accrued interest and fees. In addition to the Tender Offers, we repurchased an aggregate principal amount of $84.6 million of the outstanding Senior Notes for an aggregate cost of $64.5 million, including accrued interest and fees, during the year ended December 31, 2016.
On October 21, 2016, we completed a public equity offering resulting in net proceeds of $584.0 million, after deducting underwriting discounts and commissions and estimated offering expenses, which was used to fund a portion of the Williston Basin Acquisition, which closed on December 1, 2016.
Our existing revolving credit facility provides additional liquidity, with a current borrowing base and elected commitment amount of $1,150.0 million. The next redetermination of the borrowing base is scheduled for April 1, 2017.
We believe we have adequate liquidity to fund planned 2017 capital expenditures and to meet our near-term future obligations. For additional information on the impact of changing prices on our financial position, see “Item 7A. Quantitative and Qualitative Disclosures about Market Risk.”
Cash flows provided by operating activities
Net cash provided by operating activities was $228.0 million, $359.8 million and $872.5 million for the years ended December 31, 2016, 2015 and 2014, respectively. The decrease in cash flows provided by operating activities for the year ended December 31, 2016 as compared to 2015 was primarily the result of the 10% decrease in realized prices for oil and a 6% decrease in oil production coupled with decreased well services activity, partially offset by a 40% increase in natural gas production and increases in natural gas gathering and processing, salt water pipeline transport and salt water disposal. The decrease in cash flows provided by operating activities for the year ended December 31, 2015 as compared to 2014 was primarily the result of the 48% decrease in realized prices for oil and the 69% decrease in realized prices for natural gas coupled with decreases in well completion product sales to third parties, offset by our 11% increase in oil and natural gas production and increases in salt water pipeline transport, salt water disposal and fresh water sales.
Working capital. Our working capital fluctuates primarily as a result of changes in commodity pricing and production volumes, capital spending to fund our exploratory and development initiatives and acquisitions and the impact of our outstanding derivative instruments. We had a working capital deficit of $142.6 million at December 31, 2016, however, we believe we have adequate liquidity to meet our working capital requirements. As of December 31, 2016, we had $785.9 million of liquidity available, including $11.2 million in cash and cash equivalents and $774.7 million of unused borrowing base committed capacity available under our revolving credit facility. As of December 31, 2015, we had a working capital deficit of $5.3 million. The year over year increase in our working capital deficit was primarily driven by a decrease in the fair value of our outstanding short-term derivative instruments at December 31, 2016 as compared to December 31, 2015 due to increases in forward strip oil prices.
Cash flows used in investing activities
We had net cash flows used in investing activities of $1,070.8 million, $479.1 million and $1,077.5 million during the years ended December 31, 2016, 2015 and 2014, respectively, primarily as a result of our capital expenditures for acquisition, drilling and development costs. The increase in cash used in investing activities for the year ended December 31, 2016 as compared to the year ended December 31, 2015 was primarily attributable to an increase in cash used for acquisitions year over year, primarily due to the Williston Basin Acquisition in 2016, partially offset by a 48% decrease in cash capital expenditures for the development of our properties as a result of lower commodity prices. Net cash used in investing activities during the year ended December 31, 2016 was primarily attributable to $781.5 million for acquisitions, $426.3 million in other capital expenditures for the development of our properties, including E&P capital, the natural gas processing plant and other OMS infrastructure, partially offset by $122.0 million for derivative settlements received as a result of lower crude oil prices. Net cash used in investing activities during the year ended December 31, 2015 was primarily attributable to $819.8 million in capital expenditures, which were primarily for the development of our properties, including E&P capital, OMS pipelines, salt water disposal wells and natural gas processing plant construction, partially offset by $370.4 million for derivative settlements
62
received as a result of lower crude oil prices. Net cash used in investing activities during the year ended December 31, 2014 was primarily attributable to $1,354.3 million in capital expenditures for the development of our properties, including E&P capital, OMS pipelines and salt water disposal wells and the addition of a second fracturing fleet for OWS, partially offset by $324.9 million in proceeds from the sale of certain non-operated properties in and around our Sanish position.
Expenditures for the acquisition and development of oil and natural gas properties are the primary use of our capital resources. Our capital expenditures for the years ended December 31, 2016, 2015 and 2014 are summarized in the following table:
Year ended December 31, | |||||||||||
2016 | 2015 | 2014 | |||||||||
(In thousands) | |||||||||||
Capital expenditures | |||||||||||
E&P | $ | 208,437 | $ | 436,959 | $ | 1,399,684 | |||||
OMS | 170,386 | 96,947 | 68,939 | ||||||||
OWS | 680 | 21,711 | 37,292 | ||||||||
Other capital expenditures(1) | 20,502 | 25,643 | 29,440 | ||||||||
Total capital expenditures before acquisitions | $ | 400,005 | $ | 581,260 | $ | 1,535,355 | |||||
Acquisitions | 781,522 | 28,739 | 37,238 | ||||||||
Total capital expenditures(2) | $ | 1,181,527 | $ | 609,999 | $ | 1,572,593 | |||||
__________________
(1) | Other capital expenditures include such items as administrative capital and capitalized interest. |
(2) | Capital expenditures (including acquisitions) reflected in the table above differ from the amounts for capital expenditures and acquisitions of oil and gas properties shown in the statement of cash flows in our consolidated financial statements because amounts reflected in the table include changes in accrued liabilities from the previous reporting period for capital expenditures, while the amounts presented in the statement of cash flows are presented on a cash basis. |
In 2016, we spent $1,181.5 million on capital expenditures, which represented a 94% increase as compared to the $610.0 million spent during 2015. This increase was primarily due to $781.5 million for acquisitions in 2016, including the Williston Basin Acquisition. Excluding acquisitions, capital expenditures decreased 31% as compared to 2015. The decrease was attributable to reduced drilling and completion activity as a result of lower commodity prices in 2016, offset by higher capital expenditures for OMS, primarily related to the natural gas processing plant constructed in our Wild Basin area in North Dakota.
During 2016, we participated in 64 gross wells (38.1 net) that were completed and placed on production, and, as operator, we completed and placed on production 57 gross (37.6 net) of these wells. In addition, as of December 31, 2016, we had 83 gross operated wells awaiting completion in the Bakken and Three Forks formations. Our land leasing and acquisition activity is focused in and around our existing core consolidated land positions.
As a result of current oil prices, we have increased our planned 2017 capital expenditures as compared to 2016 capital expenditures, excluding acquisitions. We anticipate investing $605 million in 2017 as follows:
Budget for the year ended December 31, 2017 | |||
(In thousands) | |||
Drilling and completion | $ | 410,000 | |
OMS | 110,000 | ||
Other(1) | 85,000 | ||
Total capital expenditures | $ | 605,000 | |
__________________
(1) | Other capital expenditures include other E&P, capitalized interest, OWS and administrative capital. |
While we have budgeted $605 million for total capital expenditures in 2017, the ultimate amount of capital we will expend may fluctuate materially based on market conditions and the success of our drilling and operations results as the year progresses. Furthermore, if we acquire additional acreage, our capital expenditures may be higher than budgeted. We believe that cash on hand, including cash flows from operating activities, proceeds from cash settlements under our derivative contracts and availability under our revolving credit facility should be sufficient to fund our 2017 capital expenditure budget. However, because the operated wells funded by our 2017 drilling plan represent only a small percentage of our potential drilling
63
locations, we will be required to generate or raise multiples of this amount of capital to develop our entire inventory of potential drilling locations should we elect to do so.
Our capital budget may further be adjusted as business conditions warrant. The amount, timing and allocation of capital expenditures is largely discretionary and within our control. If oil prices decline for an extended period of time, we could defer a significant portion of our budgeted capital expenditures until later periods to prioritize capital projects that we believe have the highest expected returns and potential to generate near-term cash flows. We routinely monitor and adjust our capital expenditures in response to changes in prices, availability of financing, drilling and acquisition costs, industry conditions, the timing of regulatory approvals, the availability of rigs, success or lack of success in drilling activities, contractual obligations, internally generated cash flows and other factors both within and outside our control. We actively review acquisition opportunities on an ongoing basis. Our ability to make significant acquisitions for cash would require us to obtain additional equity or debt financing, which we may not be able to obtain on terms acceptable to us or at all.
Cash flows provided by financing activities
Net cash provided by financing activities was $844.3 million, $83.3 million and $158.8 million for the years ended December 31, 2016, 2015 and 2014, respectively. For the year ended December 31, 2016, cash sourced through financing activities was provided by net proceeds from the issuance of our common stock, the issuance of our Senior Convertible Notes, and the borrowings under our revolving credit facility, partially offset by the repurchase of a portion of our Senior Notes. For the year ended December 31, 2015, cash sourced through financing activities was provided by net proceeds from the issuance of our common stock, partially offset by net repayments on our revolving credit facility. For the year ended December 31, 2014, cash sourced through financing activities was provided by borrowings under our revolving credit facility.
Sale of common stock. On February 2, 2016, we completed a public offering of 39,100,000 shares of our common stock (including 5,100,000 shares issued pursuant to the underwriters’ option to purchase additional common stock) at a purchase price of $4.685 per share. We used the net proceeds from the offering of $182.8 million, after deducting underwriting discounts and commissions and offering expenses, for general corporate purposes.
On October 21, 2016, we completed a public offering of 55,200,000 shares of our common stock (including 7,200,000 shares issued pursuant to the underwriters’ option to purchase additional common stock) at a purchase price to the public of $10.80 per share. We used the net proceeds of $584.0 million, after deducting underwriting discounts and commissions and estimated offering expenses, to fund a portion of the Williston Basin Acquisition.
Senior secured revolving line of credit. We have a revolving credit facility (the “Credit Facility”) with an overall senior secured line of credit of $2,500.0 million as of December 31, 2016. The Credit Facility is restricted to the borrowing base, which is reserve-based and subject to semi-annual redeterminations on April 1 and October 1 of each year. The maturity date of the Credit Facility is April 13, 2020, provided that the 7.25% senior unsecured notes due February 2019 (the “2019 Notes”) are retired or refinanced 90 days prior to their maturity date. On February 23, 2016, the lenders under the Credit Facility (the “Lenders”) completed their regular semi-annual redetermination of the borrowing base scheduled for April 1, 2016, resulting in a decrease in the borrowing base and aggregate elected commitment from $1,525.0 million to $1,150.0 million. On October 14, 2016, the borrowing base and aggregate elected commitment were reaffirmed at $1,150.0 million as a result of the semi-annual redetermination of the borrowing base scheduled for October 1, 2016. The next redetermination of the borrowing base is scheduled for April 1, 2017.
As of December 31, 2016, we had $363.0 million of borrowings at a weighted average interest rate of 2.5% and $12.3 million of outstanding letters of credit issued under the Credit Facility, resulting in an unused borrowing base committed capacity of $774.7 million. As of December 31, 2015, we had $138.0 million of borrowings at a weighted average interest rate of 1.9% and $5.2 million of outstanding letters of credit issued under the Credit Facility, resulting in an unused borrowing base committed capacity of $1,381.8 million.
The Credit Facility contains covenants that include, among others:
• | a prohibition against incurring debt, subject to permitted exceptions; |
• | a prohibition against making dividends, distributions and redemptions, subject to permitted exceptions; |
• | a prohibition against making investments, loans and advances, subject to permitted exceptions; |
• | restrictions on creating liens and leases on our assets and our subsidiaries, subject to permitted exceptions; |
• | restrictions on merging and selling assets outside the ordinary course of business; |
• | restrictions on use of proceeds, investments, transactions with affiliates or change of principal business; |
64
• | a provision limiting oil and natural gas derivative financial instruments; |
• | a requirement that we maintain a ratio of consolidated EBITDAX (as defined in the Credit Facility) to consolidated Interest Expense (as defined in the Credit Facility) of no less than 2.5 to 1.0 for the four quarters ended on the last day of each quarter; and |
• | a requirement that we maintain a Current Ratio (as defined in the Credit Facility) of consolidated current assets (including unused borrowing base committed capacity and with exclusions as described in the Credit Facility) to consolidated current liabilities (with exclusions as described in the Credit Facility) of no less than 1.0 to 1.0 as of the last day of any fiscal quarter. |
The Credit Facility contains customary events of default. If an event of default occurs and is continuing, the lenders may declare all amounts outstanding under the Credit Facility to be immediately due and payable. We were in compliance with the financial covenants of the Credit Facility as of December 31, 2016 and 2015. As of December 31, 2016, our consolidated EBITDAX was $500.3 million and our consolidated Interest Expense was $144.7 million, resulting in a ratio of 3.5 as compared to a minimum required ratio of 2.5. In addition, as of December 31, 2016, our consolidated current assets and consolidated current liabilities (as described above) were $1,012.9 million and $320.6 million, respectively, resulting in a Current Ratio of 3.2 as compared to a minimum required ratio of 1.0. Given the possible fluctuation in commodity prices, we continue to closely monitor our financial covenants and do not anticipate a covenant violation in the next twelve months.
Senior unsecured notes. As of December 31, 2016, our long-term debt includes outstanding senior unsecured note obligations of $1,753.0 million for senior unsecured notes (the “Senior Notes”), including $54.3 million of the 2019 Notes, $395.5 million of 6.5% senior unsecured notes due November 1, 2021 (the “2021 Notes”), $937.0 million of 6.875% senior unsecured notes due March 15, 2022 (the “2022 Notes”) and $366.1 million of 6.875% senior unsecured notes due January 15, 2023 (the “2023 Notes”).
Prior to certain dates, we have the option to redeem some or all of the Senior Notes for cash at certain redemption prices equal to a certain percentage of their principal amount plus an applicable make-whole premium and accrued and unpaid interest to the redemption date. The 2019 Notes are currently redeemable for cash at a redemption price equal to par plus accrued and unpaid interest to the redemption date. We may from time to time seek to retire or purchase our outstanding Senior Notes through cash purchases and/or exchanges for other debt or equity securities, in open market purchases, privately negotiated transactions or otherwise. Such repurchases or exchanges, if any, will depend on prevailing market conditions, our liquidity requirements, contractual restrictions and other factors. The amounts involved may be material.
The indentures governing the Senior Notes restrict our ability and the ability of certain of our subsidiaries to: (i) incur additional debt or enter into sale and leaseback transactions; (ii) pay distributions on, redeem or repurchase equity interests; (iii) make certain investments; (iv) incur liens; (v) enter into transactions with affiliates; (vi) merge or consolidate with another company; and (vii) transfer and sell assets. These covenants are subject to a number of important exceptions and qualifications. If at any time when our Senior Notes are rated investment grade by both Moody’s Investors Service, Inc. and Standard & Poor’s Ratings Services and no default (as defined in the indentures) has occurred and is continuing, many of such covenants will terminate and we will cease to be subject to such covenants.
Repurchases of senior unsecured notes. As a result of the Tender Offers, we repurchased an aggregate principal amount of $362.4 million of the outstanding Senior Notes, consisting of $344.7 million principal amount of the 2019 Notes, $2.2 million principal amount of the 2021 Notes, $3.4 million principal amount of the 2022 Notes and $12.1 million principal amount of the 2023 Notes, for an aggregate cost of $371.4 million, including accrued interest and fees.
In addition to the Tender Offers, we repurchased an aggregate principal amount of $84.6 million of the outstanding Senior Notes, consisting of $1.0 million principal amount of the 2019 Notes, $2.3 million principal amount of the 2021 Notes, $59.5 million principal amount of the 2022 Notes and $21.8 million principal amount of the 2023 Notes, for an aggregate cost of $64.5 million, including accrued interest and fees, during the year ended December 31, 2016.
For the year ended December 31, 2016, the Company recognized a pre-tax gain of $4.7 million related to these repurchases, including the Tender Offers, which were net of unamortized deferred financing costs write-offs of $6.4 million, and are reflected in gain on extinguishment of debt in the Company’s Consolidated Statement of Operations.
Senior unsecured convertible notes. In September 2016, we issued $300.0 million of 2.625% Senior Convertible Notes due September 2023, which resulted in aggregate net proceeds to us of $291.9 million, after deducting underwriting discounts and commissions and estimated offering expenses. We used the proceeds from the Senior Convertible Notes to fund the repurchase of certain outstanding Senior Notes through the Tender Offers. The Senior Convertible Notes will mature on September 15, 2023 unless earlier converted in accordance with their terms.
65
We have the option to settle conversions of these notes with cash, shares of common stock or a combination of cash and common stock at out election. Our intent is to settle the principal amount of the Senior Convertible Notes in cash upon conversion. Prior to March 15, 2023, the Senior Convertible Notes will be convertible only under the following circumstances: (i) during any calendar quarter commencing after the calendar quarter ending on September 30, 2016 (and only during such calendar quarter), if the last reported sale price of our common stock for at least 20 trading days (whether or not consecutive) during the period of 30 consecutive trading days ending on the last trading day of the immediately preceding calendar quarter is greater than or equal to 130% of the conversion price on each applicable trading day; (ii) during the five business day period after any five consecutive trading day period (the “Measurement Period”) in which the trading price per $1,000 principal amount of the Senior Convertible Notes for each trading day of the Measurement Period is less than 98% of the product of the last reported sale price of our common stock and the conversion rate on each such trading day; or (iii) upon the occurrence of specified corporate events. On or after March 15, 2023, the Senior Convertible Notes will be convertible at any time until the second scheduled trading day immediately preceding the September 15, 2023 maturity date. The Senior Convertible Notes will be convertible at an initial conversion rate of 76.3650 shares of our common stock per $1,000 principal amount of the notes, which is equivalent to an initial conversion price of approximately $13.10. The conversion rate will be subject to adjustment in some events but will not be adjusted for any accrued and unpaid interest. In addition, following certain corporate events that occur prior to the maturity date or a notice of redemption, we will increase the conversion rate for a holder who elects to convert the Senior Convertible Notes in connection with such corporate event or redemption in certain circumstances. As of December 31, 2016, none of the contingent conditions allowing holders of the Senior Convertible Notes to convert these notes had been met.
Interest on the Senior Notes and the Senior Convertible Notes (collectively, the “Notes”) is payable semi-annually in arrears. The Notes are guaranteed on a senior unsecured basis by our material subsidiaries.
Obligations and commitments
We have the following contractual obligations and commitments as of December 31, 2016:
Payments due by period | |||||||||||||||||||
Contractual obligations | Total | Within 1 year | 1-3 years | 3-5 years | More than 5 years | ||||||||||||||
(In thousands) | |||||||||||||||||||
Senior unsecured notes(1) | $ | 2,052,950 | $ | — | $ | 54,275 | $ | 395,501 | $ | 1,603,174 | |||||||||
Interest payments on senior unsecured notes(1) | 724,635 | 127,004 | 252,265 | 247,066 | 98,300 | ||||||||||||||
Borrowings under revolving credit facility(1) | 363,000 | — | — | 363,000 | — | ||||||||||||||
Interest payments on borrowings under revolving credit facility(1) | 766 | 766 | — | — | — | ||||||||||||||
Asset retirement obligations(2) | 49,687 | 702 | 3,169 | 647 | 45,169 | ||||||||||||||
Operating leases(3) | 19,186 | 5,530 | 9,921 | 3,735 | — | ||||||||||||||
Volume commitment agreements(3) | 472,236 | 33,103 | 121,159 | 123,745 | 194,229 | ||||||||||||||
Total contractual cash obligations | $ | 3,716,791 | $ | 168,036 | $ | 457,489 | $ | 1,150,394 | $ | 1,940,872 | |||||||||
__________________
(1) | See Note 8 to our audited consolidated financial statements for a description of our senior unsecured notes, revolving credit facility and related interest payments. As of December 31, 2016, we had $363.0 million of borrowings and $12.3 million of outstanding letters of credit issued under our Credit Facility. |
(2) | Amounts represent the present value of estimated costs expected to be incurred in the future to plug, abandon and remediate our oil and gas properties and salt water disposal wells at the end of their productive lives. Because these costs typically extend many years into the future, estimating these future costs requires management to make estimates and judgments that are subject to future revisions based upon numerous factors, including the rate of inflation, changing technology and the political and regulatory environment. See Note 9 to our audited consolidated financial statements. |
(3) | See Note 16 to our audited consolidated financial statements for a description of our operating leases and volume commitment agreements. |
Critical accounting policies and estimates
The discussion and analysis of our financial condition and results of operations are based upon our audited consolidated financial statements, which have been prepared in accordance with GAAP. The preparation of our consolidated financial statements requires us to make estimates and assumptions that affect the reported amounts of assets, liabilities, revenues and
66
expenses and related disclosure of contingent assets and liabilities. Certain accounting policies involve judgments and uncertainties to such an extent that there is reasonable likelihood that materially different amounts could have been reported under different conditions, or if different assumptions had been used. We evaluate our estimates and assumptions on a regular basis. We base our estimates on historical experience and various other assumptions that are believed to be reasonable under the circumstances, the results of which form the basis for making judgments about the carrying values of assets and liabilities that are not readily apparent from other sources. Actual results may differ from these estimates and assumptions used in preparation of our consolidated financial statements. We provide expanded discussion of our more significant accounting policies, estimates and judgments used in preparation of our consolidated financial statements below. See Note 2 to our audited consolidated financial statements for a discussion of additional accounting policies and estimates made by management.
Method of accounting for oil and natural gas properties
Oil and natural gas exploration and development activities are accounted for using the successful efforts method. Under this method, all property acquisition costs and costs of exploratory and development wells are capitalized when incurred, pending determination of whether the well has found proved reserves. If an exploratory well does not find proved reserves, the costs of drilling the well are charged to expense. The costs of development wells are capitalized whether productive or nonproductive.
The provision for DD&A of oil and natural gas properties is calculated using the unit-of-production method. All capitalized well costs and leasehold costs of proved properties are amortized on a unit-of-production basis over the remaining life of proved developed reserves and total proved reserves, respectively. Natural gas is converted to barrel equivalents at the rate of six thousand cubic feet of natural gas to one barrel of oil. The calculation for the unit-of-production DD&A method takes into consideration estimated future dismantlement, restoration and abandonment costs, which are net of estimated salvage values.
Costs of retired, sold or abandoned properties that constitute a part of an amortization base are charged or credited, net of proceeds, to accumulated DD&A unless doing so significantly affects the unit-of-production amortization rate in which case a gain or loss is recognized currently.
Expenditures for maintenance, repairs and minor renewals necessary to maintain properties in operating condition are expensed as incurred. Major betterments, replacements and renewals are capitalized to the appropriate property and equipment accounts. Estimated dismantlement and abandonment costs for oil and natural gas properties are capitalized, net of salvage, at their estimated net present value and amortized on a unit-of-production basis over the remaining life of the related proved developed reserves.
Unproved properties consist of costs incurred to acquire unproved leases, or lease acquisition costs. Lease acquisition costs are capitalized until the leases expire or when we specifically identify leases that will revert to the lessor, at which time we expense the associated lease acquisition costs. The expensing of the lease acquisition costs is recorded as impairment in our Consolidated Statement of Operations. Lease acquisition costs related to successful exploratory drilling are reclassified to proved properties and depleted on a unit-of-production basis.
For sales of entire working interests in unproved properties, gain or loss is recognized to the extent of the difference between the proceeds received and the net carrying value of the property. Proceeds from sales of partial interests in unproved properties are accounted for as a recovery of costs unless the proceeds exceed the entire cost of the property.
Oil and natural gas reserve quantities and standardized measure of future net revenue
Our independent reserve engineers and technical staff prepare our estimates of oil and natural gas reserves and associated future net revenues. While the SEC rules allow us to disclose proved, probable and possible reserves, we have elected to disclose only proved reserves in this Annual Report on Form 10-K. The SEC’s rules define proved reserves as the quantities of oil and gas, which, by analysis of geoscience and engineering data, can be estimated with reasonable certainty to be economically producible from a given date forward, from known reservoirs, and under existing economic conditions, operating methods and government regulations prior to the time at which contracts providing the right to operate expire, unless evidence indicates that renewal is reasonably certain, regardless of whether deterministic or probabilistic methods are used for the estimation. The project to extract the hydrocarbons must have commenced or the operator must be reasonably certain that it will commence the project within a reasonable time. Our independent reserve engineers and technical staff must make a number of subjective assumptions based on their professional judgment in developing reserve estimates. Reserve estimates are updated annually and consider recent production levels and other technical information about each field. Oil and natural gas reserve engineering is a subjective process of estimating underground accumulations of oil and natural gas that cannot be precisely measured. The accuracy of any reserve estimate is a function of the quality of available data and of engineering and geological interpretation and judgment.
67
Periodic revisions to the estimated reserves and related future net cash flows may be necessary as a result of a number of factors, including reservoir performance, new drilling, oil and natural gas prices, cost changes, technological advances, new geological or geophysical data or other economic factors. Accordingly, reserve estimates are generally different from the quantities of oil and natural gas that are ultimately recovered. We cannot predict the amounts or timing of future reserve revisions. If such revisions are significant, they could significantly affect future amortization of capitalized costs and result in impairment of assets that may be material.
Revenue recognition
Oil and gas revenue from our interests in producing wells is recognized when the product is delivered, at which time the customer has taken title and assumed the risks and rewards of ownership, and collectability is reasonably assured. Substantially all of our production is sold to purchasers under short-term (less than twelve month) contracts at market-based prices. The sales prices for oil and natural gas are adjusted for transportation and other related deductions. These deductions are based on contractual or historical data and do not require significant judgment. Subsequently, these revenue deductions are adjusted to reflect actual charges based on third-party documents. Since there is a ready market for oil and natural gas, we sell the majority of production soon after it is produced at various locations. As a result, we maintain a minimum amount of product inventory in storage.
Midstream revenues consist primarily of revenues from salt water pipeline transport, salt water disposal, fresh water sales, natural gas gathering and processing and crude oil gathering for OPNA’s operated wells. OWS provides well services and sells well completion products and equipment rentals primarily to OPNA. Midstream and well services revenue is recognized when services have been performed or related volumes or products have been delivered. The revenues related to OPNA’s working interests are eliminated in consolidation, and only the revenues related to other working interest owners in OPNA’s wells are included in our Consolidated Statement of Operations.
Impairment of proved properties
We review our proved oil and natural gas properties for impairment whenever events and circumstances indicate that a decline in the recoverability of their carrying value may have occurred. We estimate the expected undiscounted future cash flows of our oil and natural gas properties and compare such undiscounted future cash flows to the carrying amount of the oil and natural gas properties to determine if the carrying amount is recoverable. If the carrying amount exceeds the estimated undiscounted future cash flows, we will adjust the carrying amount of the oil and natural gas properties to fair value. The factors used to determine fair value are subject to our judgment and expertise and include, but are not limited to, recent sales prices of comparable properties, the present value of future cash flows, net of estimated operating and development costs using estimates of proved reserves, future commodity pricing, future production estimates, anticipated capital expenditures, and various discount rates commensurate with the risk and current market conditions associated with realizing the expected cash flows projected. Because of the uncertainty inherent in these factors, we cannot predict when or if future impairment charges for proved oil and natural gas properties will be recorded. Please see “Overview” for a discussion of potential future impairment charges.
Impairment of unproved properties
The assessment of unproved properties to determine any possible impairment requires significant judgment. We assess our unproved properties periodically for impairment on a property-by-property basis based on remaining lease terms, drilling results or future plans to develop acreage.
We recognize impairment expense for unproved properties at the time when the lease term has expired or sooner based on management’s periodic assessments. We consider the following factors in our assessment of the impairment of unproved properties:
• | the remaining amount of unexpired term under our leases; |
• | our ability to actively manage and prioritize our capital expenditures to drill leases and to make payments to extend leases that may be close to expiration; |
• | our ability to exchange lease positions with other companies that allow for higher concentrations of ownership and development; |
• | our ability to convey partial mineral ownership to other companies in exchange for their drilling of leases; and |
68
• | our evaluation of the continuing successful results from the application of completion technology in the Bakken and Three Forks formations by us or by other operators in areas adjacent to or near our unproved properties. |
Business combinations
We account for business combinations under the acquisition method of accounting. Accordingly, we recognize amounts for identifiable assets acquired and liabilities assumed equal to their estimated acquisition date fair values. Transaction and integration costs associated with business combinations are expensed as incurred.
We make various assumptions in estimating the fair values of assets acquired and liabilities assumed. As fair value is a market-based measurement, it is determined based on the assumptions that market participants would use. The most significant assumptions relate to the estimated fair values of proved and unproved oil and natural gas properties. The fair values of these properties are measured using valuation techniques that convert future cash flows to a single discounted amount. Significant inputs to the valuation include estimates of reserves, future operating and development costs, future commodity prices and a market-based weighted average cost of capital rate. The market-based weighted average cost of capital rate is subjected to additional project-specific risking factors. In addition, when appropriate, we review comparable purchases and sales of oil and natural gas properties within the same regions, and use that data as a proxy for fair market value; for example, the amount a willing buyer and seller would enter into in exchange for such properties.
Any excess of the acquisition price over the estimated fair value of net assets acquired is recorded as goodwill. Any excess of the estimated fair value of net assets acquired over the acquisition price is recorded in current earnings as a gain on bargain purchase. Deferred taxes are recorded for any differences between the assigned values and the tax basis of assets and liabilities. Estimated deferred taxes are based on available information concerning the tax basis of assets acquired and liabilities assumed and loss carryforwards at the acquisition date, although such estimates may change in the future as additional information becomes known.
Asset retirement obligations
We record the fair value of a liability for a legal obligation to retire an asset in the period in which the liability is incurred and can be reasonably estimated with the corresponding cost capitalized by increasing the carrying amount of the related long-lived asset. For oil and gas properties, this is the period in which the well is drilled or acquired. The asset retirement obligation (“ARO”) represents the estimated amount we will incur to plug, abandon and remediate the properties at the end of their productive lives, in accordance with applicable state laws. The liability is accreted to its present value each period, and the capitalized costs are amortized on the unit-of-production method. The accretion expense is recorded as a component of depreciation, depletion and amortization in our Consolidated Statement of Operations.
Some of our midstream assets, including certain pipelines and our natural gas processing plant, have contractual or regulatory obligations to perform remediation and, in some instances, dismantlement and removal activities, when the assets are abandoned. We are not able to reasonably estimate the fair value of the asset retirement obligations for these assets because the settlement dates are indeterminable given our expected continued use of the assets with proper maintenance. We will record asset retirement obligations for these assets in the periods in which the settlement dates are reasonably determinable.
We determine the ARO by calculating the present value of estimated future cash flows related to the liability. Estimating the future ARO requires management to make estimates and judgments regarding timing and existence of a liability, as well as what constitutes adequate restoration. Inherent in the fair value calculation are numerous assumptions and judgments including the ultimate costs, inflation factors, credit adjusted discount rates, timing of settlement and changes in the legal, regulatory, environmental and political environments. If actual results are not consistent with our assumptions and estimates or our assumptions and estimates change due to new information, we may be exposed to future revisions, which could result in an increase to the existing ARO liability and could ultimately result in a higher potential impact on our operations and cash flows for settlement charges. To the extent future revisions to these assumptions impact the fair value of the existing ARO liability, a corresponding adjustment is made to the related asset.
Derivatives
We record all derivative instruments on the Consolidated Balance Sheet as either assets or liabilities measured at their estimated fair value. The significant inputs used to estimate fair value are crude oil prices, volatility, skew, discount rate and the contract terms of the derivative instruments. Derivative assets and liabilities arising from derivative contracts with the same counterparty are reported on a net basis, as all counterparty contracts provide for net settlement. We have not designated any derivative instruments as hedges for accounting purposes, and we do not enter into such instruments for speculative trading purposes. Gains and losses from valuation changes in commodity derivative instruments are reported under other income (expense) in our Consolidated Statement of Operations. Our cash flow is only impacted when the actual settlements under the
69
derivative contracts result in making or receiving a payment to or from the counterparty. These cash settlements represent the cumulative gains and losses on our derivative instruments and do not include a recovery of costs that were paid to acquire or modify the derivative instruments that were settled. Cash settlements are reflected as investing activities in our Consolidated Statement of Cash Flows.
Stock-based compensation
Restricted stock awards. We recognize compensation expense for all restricted stock awards made to employees and directors. Stock-based compensation expense is measured at the grant date based on the fair value of the award and is recognized as expense on a straight-line basis over the requisite service period, which is generally the vesting period. The fair value of restricted stock grants is based on the value of our common stock on the date of grant. Assumptions regarding forfeiture rates are subject to change. Any such changes could result in different valuations and thus impact the amount of stock-based compensation expense recognized. Stock-based compensation expense recorded for restricted stock awards is included in general and administrative expenses on our Consolidated Statement of Operations.
Performance share units. We recognize compensation expense for our performance share units (“PSUs”) granted to our officers. Stock-based compensation expense is measured at the grant date based on the fair value of the award and is recognized as expense on a straight-line basis over the performance period, which is generally the vesting period. The fair value of the PSUs is based on the calculation derived from a Monte Carlo simulation model. The Monte Carlo simulation model uses assumptions regarding random projections and must be repeated numerous times to achieve a probable assessment (see Note 11 to our audited consolidated financial statements for a description of the inputs used in this model). Stock-based compensation expense recorded for PSUs is included in general and administrative expenses on our Consolidated Statement of Operations.
Income taxes
Our provision for taxes includes both federal and state taxes. We record our federal income taxes in accordance with accounting for income taxes under GAAP, which results in the recognition of deferred tax assets and liabilities for the expected future tax consequences of temporary differences between the book carrying amounts and the tax basis of assets and liabilities. Deferred tax assets and liabilities are measured using enacted tax rates expected to apply to taxable income in the years in which those temporary differences and carryforwards are expected to be recovered or settled. The effect on deferred tax assets and liabilities of a change in tax rates is recognized in income in the period that includes the enactment date. A valuation allowance is established to reduce deferred tax assets if it is more likely than not that the related tax benefits will not be realized.
We apply significant judgment in evaluating our tax positions and estimating our provision for income taxes. During the ordinary course of business, there are many transactions and calculations for which the ultimate tax determination is uncertain. The actual outcome of these future tax consequences could differ significantly from our estimates, which could impact our financial position, results of operations and cash flows.
We also account for uncertainty in income taxes recognized in the financial statements in accordance with GAAP by prescribing a recognition threshold and measurement attribute for a tax position taken or expected to be taken in a tax return. Authoritative guidance for accounting for uncertainty in income taxes requires that we recognize the financial statement benefit of a tax position only after determining that the relevant tax authority would more likely than not sustain the position following an audit. For tax positions meeting the more-likely-than-not threshold, the amount recognized in the financial statements is the largest benefit that has a greater than 50% likelihood of being realized upon ultimate settlement with the relevant tax authority.
Recent accounting pronouncements
Revenue recognition. In May 2014, the Financial Accounting Standards Board (“FASB”) issued Accounting Standards Update No. 2014-09, Revenue from Contracts with Customers (“ASU 2014-09”). The objective of ASU 2014-09 is greater consistency and comparability across industries by using a five-step model to recognize revenue from customer contracts. ASU 2014-09 also contains some new disclosure requirements under GAAP. In August 2015, the FASB issued Accounting Standards Update No. 2015-14, Deferral of the Effective Date (“ASU 2015-14”). ASU 2015-14 defers the effective date of the new revenue standard by one year, making it effective for annual reporting periods beginning after December 15, 2017, including interim periods within that reporting period. In 2016, the FASB issued additional accounting standards updates to clarify the implementation guidance of ASU 2014-09. We are currently evaluating the effect that adopting this guidance will have on our financial position, cash flows and results of operations.
Inventory. In July 2015, the FASB issued Accounting Standards Update No. 2015-11, Simplifying the Measurement of Inventory (“ASU 2015-11”). ASU 2015-11 changes the inventory measurement principle from lower of cost or market to lower of cost and net realizable value for entities using the first-in, first-out or average cost methods. ASU 2015-11 is effective for fiscal
70
years beginning after December 15, 2016, including interim periods within those years. We do not expect the adoption of this guidance to have a material impact on our financial position, cash flows or results of operations.
Financial instruments. In January 2016, the FASB issued Accounting Standards Update No. 2016-01, Recognition and Measurement of Financial Assets and Financial Liabilities (“ASU 2016-01”), which requires that most equity instruments be measured at fair value with subsequent changes in fair value recognized in net income. ASU 2016-01 also impacts financial liabilities under the fair value option and the presentation and disclosure requirements for financial instruments. ASU 2016-01 does not apply to equity method investments or investments in consolidated subsidiaries. ASU 2016-01 is effective for fiscal years beginning after December 15, 2017, including interim periods within those years. We are currently evaluating the effect that adopting this guidance will have on our financial position, cash flows and results of operations.
Leases. In February 2016, the FASB issued Accounting Standards Update No. 2016-02, Leases (“ASU 2016-02”), which requires a lessee to recognize lease payment obligations and a corresponding right-of-use asset to be measured at fair value on the balance sheet. ASU 2016-02 also requires certain qualitative and quantitative disclosures about the amount, timing and uncertainty of cash flows arising from leases. ASU 2016-02 is effective for fiscal years beginning after December 15, 2018, including interim periods within those years. We are currently evaluating the effect that adopting this guidance will have on our financial position, cash flows and results of operations.
Embedded derivatives. In March 2016, the FASB issued Accounting Standards Update No. 2016-06, Contingent Put and Call Options in Debt Instruments (“ASU 2016-06”), which clarifies what steps are required when assessing whether the economic characteristics and risks of call (put) options are clearly and closely related to the economic characteristics and risks of their debt hosts, which is one of the criteria for bifurcating an embedded derivative. ASU 2016-06 is effective for fiscal years beginning after December 15, 2016, including interim periods within those years. We do not expect the adoption of this guidance to have a material impact on our financial position, cash flows or results of operations.
Stock-based compensation. In March 2016, the FASB issued Accounting Standards Update No. 2016-09, Improvements to Employee Share-Based Payment Accounting (“ASU 2016-09”), which updates several aspects of the accounting for share-based payment transactions, including recognition of excess tax benefits and deficiencies, the classification of those excess tax benefits on the statement of cash flows, an accounting policy election for forfeitures, the amount an employer can withhold to cover income taxes and still qualify for equity classification and the classification of those taxes paid on the statement of cash flows. ASU 2016-09 is effective for fiscal years beginning after December 15, 2016, including interim periods within those years. We will elect to remove forfeiture rates and record a cumulative-effect adjustment to equity at the beginning of 2017 when the guidance is adopted and do not expect the adoption of this guidance to have a material impact on our cash flows or results of operations.
Statement of cash flows. In August 2016, the FASB issued Accounting Standards Update No. 2016-15, Statement of Cash Flows (“ASU 2016-15”), which is intended to reduce diversity in practice in how certain transactions are
classified in the statement of cash flows. ASU 2016-15 is effective for fiscal years beginning after December 15, 2017, including interim periods within those years. The adoption of this guidance will not impact our financial position or results of operations but could result in presentation changes on our statement of cash flows.
Business combinations. In January 2017, the FASB issued Accounting Standards Update No. 2017-01, Clarifying the Definition of a Business (“ASU 2017-01”), which provides guidance to assist entities with evaluating whether transactions should be accounted for as acquisitions (or disposals) of assets or businesses. ASU 2017-01 requires entities to use a screen test to determine when an integrated set of assets and activities is not a business or if the integrated set of assets and activities needs to be further evaluated against the framework. ASU 2017-01 is effective for fiscal years beginning after December 15, 2017, including interim periods within those years. We are currently evaluating the effect that adopting this guidance will have on our financial position, cash flows and results of operations.
Inflation
Inflation in the United States has been relatively low in recent years and did not have a material impact on our results of operations for the years ended December 31, 2016, 2015 and 2014. Although the impact of inflation has been insignificant in recent years, it is still a factor in the United States economy, and in the past, we have tended to experience inflationary pressure on the cost of midstream and oilfield services and equipment as increasing oil and natural gas prices increased drilling activity in our areas of operations. In 2016 and 2015, we experienced service cost reductions as a result of lower oil prices and decreased drilling activity in the Williston Basin. We expect service costs to increase in 2017 due to higher demand resulting from the recent improvement in oil prices.
Off-balance sheet arrangements
Currently, we do not have any off-balance sheet arrangements as defined by the SEC. In the ordinary course of business, we enter into various commitment agreements and other contractual obligations, some of which are not recognized in our
71
consolidated financial statements in accordance with GAAP. See “Obligations and commitments” above and Note 16 to our audited consolidated financial statements for a description of our commitments and contingencies.
Non-GAAP Financial Measures
Cash Interest, Adjusted EBITDA, Free Cash Flow, Adjusted Net Income (Loss) and Adjusted Diluted Earnings (Loss) Per Share are supplemental non-GAAP financial measures that are used by management and external users of our financial statements, such as industry analysts, investors, lenders and rating agencies. These non-GAAP measures should not be considered in isolation or as a substitute for interest expense, net income (loss), operating income (loss), net cash provided by (used in) operating activities, earnings (loss) per share or any other measures prepared under GAAP. Because Cash Interest, Adjusted EBITDA, Free Cash Flow, Adjusted Net Income (Loss) and Adjusted Diluted Earnings (Loss) Per Share exclude some but not all items that affect net income (loss) and may vary among companies, the amounts presented may not be comparable to similar metrics of other companies.
Cash Interest
We define Cash Interest as interest expense plus capitalized interest less amortization and write-offs of deferred financing costs and debt discounts included in interest expense. Cash Interest is not a measure of interest expense as determined by GAAP. Management believes that the presentation of Cash Interest provides useful additional information to investors and analysts for assessing the interest charges incurred on our debt, excluding non-cash amortization, and our ability to maintain compliance with our debt covenants.
The following table presents a reconciliation of the GAAP financial measure of interest expense to the non-GAAP financial measure of Cash Interest for the periods presented:
Year Ended December 31, | |||||||||||
2016 | 2015 | 2014 | |||||||||
(In thousands) | |||||||||||
Interest Expense | $ | 140,305 | $ | 149,648 | $ | 158,390 | |||||
Capitalized interest | 16,848 | 18,582 | 8,850 | ||||||||
Amortization of deferred financing costs | (9,757 | ) | (7,238 | ) | (6,437 | ) | |||||
Amortization of debt discount | (2,709 | ) | — | — | |||||||
Cash Interest | $ | 144,687 | $ | 160,992 | $ | 160,803 | |||||
Adjusted EBITDA and Free Cash Flow
We define Adjusted EBITDA as earnings (loss) before interest expense, income taxes, DD&A, exploration expenses and other similar non-cash or nonrecurring charges. Adjusted EBITDA is not a measure of net income (loss) or cash flows as determined by GAAP. Management believes that the presentation of Adjusted EBITDA provides useful additional information to investors and analysts for assessing our results of operations, financial performance and our ability to generate cash from our business operations without regard to our financing methods or capital structure coupled with our ability to maintain compliance with our debt covenants.
We define Free Cash Flow as Adjusted EBITDA less Cash Interest and capital expenditures, excluding capitalized interest. Free Cash Flow is not a measure of net income (loss) or cash flows as determined by GAAP. Management believes that the presentation of Free Cash Flow provides useful additional information to investors and analysts for assessing our financial performance as compared to our peers and our ability to generate cash from our business operations after interest and capital spending. In addition, Free Cash Flow excludes changes in operating assets and liabilities that relate to the timing of cash receipts and disbursements, which we may not control, and changes in operating assets and liabilities may not relate to the period in which the operating activities occurred.
The following table presents reconciliations of the GAAP financial measures of net income (loss) and net cash provided by (used in) operating activities to the non-GAAP financial measures of Adjusted EBITDA and Free Cash Flow for the periods presented:
72
Year Ended December 31, | |||||||||||
2016 | 2015 | 2014 | |||||||||
(In thousands) | |||||||||||
Net income (loss) | $ | (243,016 | ) | $ | (40,248 | ) | $ | 506,877 | |||
(Gain) loss on sale of properties | 1,303 | — | (186,999 | ) | |||||||
Gain on extinguishment of debt | (4,741 | ) | — | — | |||||||
Net (gain) loss on derivative instruments | 105,317 | (210,376 | ) | (327,011 | ) | ||||||
Derivative settlements(1) | 121,977 | 370,410 | 6,774 | ||||||||
Interest expense, net of capitalized interest | 140,305 | 149,648 | 158,390 | ||||||||
Depreciation, depletion and amortization | 476,331 | 485,322 | 412,334 | ||||||||
Impairment | 4,684 | 46,109 | 47,238 | ||||||||
Exploration expenses | 1,785 | 2,369 | 3,064 | ||||||||
Rig termination | — | 3,895 | — | ||||||||
Stock-based compensation expenses | 24,103 | 25,272 | 21,302 | ||||||||
Income tax (benefit) expense | (128,538 | ) | (16,123 | ) | 307,591 | ||||||
Other non-cash adjustments | 790 | 3,956 | 3,284 | ||||||||
Adjusted EBITDA | 500,300 | 820,234 | 952,844 | ||||||||
Cash Interest | (144,687 | ) | (160,992 | ) | (160,803 | ) | |||||
Capital expenditures(2) | (1,181,527 | ) | (610,000 | ) | (1,572,593 | ) | |||||
Capitalized interest | 16,848 | 18,582 | 8,850 | ||||||||
Free Cash Flow | $ | (809,066 | ) | $ | 67,824 | $ | (771,702 | ) | |||
Net cash provided by operating activities | $ | 228,018 | $ | 359,815 | $ | 872,516 | |||||
Derivative settlements(1) | 121,977 | 370,410 | 6,774 | ||||||||
Interest expense, net of capitalized interest | 140,305 | 149,648 | 158,390 | ||||||||
Exploration expenses | 1,785 | 2,369 | 3,064 | ||||||||
Rig termination | — | 3,895 | — | ||||||||
Deferred financing costs amortization and other | (14,334 | ) | (12,299 | ) | (11,028 | ) | |||||
Current tax (benefit) expense | — | (9 | ) | 134 | |||||||
Changes in working capital | 21,759 | (57,551 | ) | (80,290 | ) | ||||||
Other non-cash adjustments | 790 | 3,956 | 3,284 | ||||||||
Adjusted EBITDA | 500,300 | 820,234 | 952,844 | ||||||||
Cash Interest | (144,687 | ) | (160,992 | ) | (160,803 | ) | |||||
Capital expenditures(2) | (1,181,527 | ) | (610,000 | ) | (1,572,593 | ) | |||||
Capitalized interest | 16,848 | 18,582 | 8,850 | ||||||||
Free Cash Flow | $ | (809,066 | ) | $ | 67,824 | $ | (771,702 | ) | |||
____________________
(1) | Cash settlements represent the cumulative gains and losses on our derivative instruments for the periods presented and do not include a recovery of costs that were paid to acquire or modify the derivative instruments that were settled. |
(2) | Capital expenditures (including acquisitions) reflected in the table above differ from the amounts for capital expenditures and acquisitions of oil and gas properties shown in the statement of cash flows in our consolidated financial statements because amounts reflected in the table include changes in accrued liabilities from the previous reporting period for capital expenditures, while the amounts presented in the statement of cash flows are presented on a cash basis. Acquisitions totaled $781.5 million, $28.7 million and $37.2 million for the years ended December 31, 2016, 2015 and 2014, respectively. |
The following tables present reconciliations of the GAAP financial measure of income (loss) before income taxes to the non-GAAP financial measure of Adjusted EBITDA for our three reportable business segments on a gross basis for the periods presented:
73
Exploration and Production | |||||||||||
Year Ended December 31, | |||||||||||
2016 | 2015 | 2014 | |||||||||
(In thousands) | |||||||||||
Income (loss) before income taxes | $ | (436,469 | ) | $ | (118,970 | ) | $ | 779,591 | |||
(Gain) loss on sale of properties | 1,661 | — | (186,999 | ) | |||||||
Gain on extinguishment of debt | (4,741 | ) | — | — | |||||||
Net (gain) loss on derivative instruments | 105,317 | (210,376 | ) | (327,011 | ) | ||||||
Derivative settlements(1) | 121,977 | 370,410 | 6,774 | ||||||||
Interest expense, net of capitalized interest | 140,305 | 149,648 | 158,390 | ||||||||
Depreciation, depletion and amortization | 467,894 | 479,693 | 406,960 | ||||||||
Impairment | 2,253 | 46,109 | 47,238 | ||||||||
Exploration expenses | 1,785 | 2,369 | 3,064 | ||||||||
Rig termination | — | 3,895 | — | ||||||||
Stock-based compensation expenses | 23,346 | 24,762 | 20,701 | ||||||||
Other non-cash adjustments | 718 | 3,719 | 2,314 | ||||||||
Adjusted EBITDA | $ | 424,046 | $ | 751,259 | $ | 911,022 | |||||
____________________
(1) | Cash settlements represent the cumulative gains and losses on our derivative instruments for the periods presented and do not include a recovery of costs that were paid to acquire or modify the derivative instruments that were settled. |
Midstream Services | |||||||||||
Year Ended December 31, | |||||||||||
2016 | 2015 | 2014 | |||||||||
(In thousands) | |||||||||||
Income before income taxes | $ | 68,394 | $ | 59,867 | $ | 22,730 | |||||
Gain on sale of properties | (358 | ) | — | — | |||||||
Depreciation, depletion and amortization | 8,525 | 5,764 | 3,744 | ||||||||
Impairment | 2,431 | — | — | ||||||||
Stock-based compensation expenses | 911 | 692 | — | ||||||||
Other non-cash adjustments | 10 | — | — | ||||||||
Adjusted EBITDA | $ | 79,913 | $ | 66,323 | $ | 26,474 | |||||
Well Services | |||||||||||
Year Ended December 31, | |||||||||||
2016 | 2015 | 2014 | |||||||||
(In thousands) | |||||||||||
Income before income taxes | $ | 3,471 | $ | 49,197 | $ | 70,953 | |||||
Depreciation, depletion and amortization | 14,892 | 19,073 | 14,080 | ||||||||
Stock-based compensation expenses | 1,515 | 1,952 | 1,658 | ||||||||
Other non-cash adjustments | 62 | 237 | 970 | ||||||||
Adjusted EBITDA | $ | 19,940 | $ | 70,459 | $ | 87,661 | |||||
Adjusted Net Income and Adjusted Diluted Earnings Per Share
We define Adjusted Net Income (Loss) as net income (loss) after adjusting first for (1) the impact of certain non-cash items, including non-cash changes in the fair value of derivative instruments, impairment and other similar non-cash charges, and non-recurring items, and then (2) the non-cash and non-recurring items’ impact on taxes based on our effective tax rate applicable to those adjusting items in the same period. Adjusted Net Income (Loss) is not a measure of net income (loss) as determined by GAAP. We define Adjusted Diluted Earnings (Loss) Per Share as Adjusted Net Income (Loss) divided by
diluted weighted average shares outstanding. Management believes that the presentation of Adjusted Net Income (Loss) and Adjusted Diluted Earnings (Loss) Per Share provides useful additional information to investors and analysts for evaluating our operational trends and performance in comparison to our peers. This measure is more comparable to earnings estimates provided by securities analysts, and charges or amounts excluded cannot be reasonably estimated and are excluded from guidance provided by the Company.
74
The following table presents reconciliations of the GAAP financial measure of net income (loss) to the non-GAAP financial measure of Adjusted Net Income (Loss) and the GAAP financial measure of diluted earnings (loss) per share to the non-GAAP financial measure of Adjusted Diluted Earnings Per Share for the periods presented:
Year Ended December 31, | |||||||||||
2016 | 2015 | 2014 | |||||||||
(In thousands, except per share data) | |||||||||||
Net income (loss) | $ | (243,016 | ) | $ | (40,248 | ) | $ | 506,877 | |||
(Gain) loss on sale of properties | 1,303 | — | (186,999 | ) | |||||||
Gain on extinguishment of debt | (4,741 | ) | — | — | |||||||
Net (gain) loss on derivative instruments | 105,317 | (210,376 | ) | (327,011 | ) | ||||||
Derivative settlements(1) | 121,977 | 370,410 | 6,774 | ||||||||
Impairment | 4,684 | 46,109 | 47,238 | ||||||||
Rig termination | — | 3,895 | — | ||||||||
Amortization of deferred financing costs(2) | 9,757 | 7,238 | 6,437 | ||||||||
Amortization of debt discount | 2,709 | — | — | ||||||||
Other non-cash adjustments | 790 | 3,956 | 3,284 | ||||||||
Tax impact(3) | (90,480 | ) | (82,697 | ) | 170,205 | ||||||
Adjusted Net Income (Loss) | $ | (91,700 | ) | $ | 98,287 | $ | 226,805 | ||||
Diluted earnings (loss) per share | $ | (1.32 | ) | $ | (0.31 | ) | $ | 5.05 | |||
(Gain) loss on sale of properties | 0.01 | — | (1.86 | ) | |||||||
Gain on extinguishment of debt | (0.03 | ) | — | — | |||||||
Net (gain) loss on derivative instruments | 0.57 | (1.62 | ) | (3.26 | ) | ||||||
Derivative settlements(1) | 0.66 | 2.85 | 0.07 | ||||||||
Impairment | 0.03 | 0.35 | 0.47 | ||||||||
Rig termination | — | 0.03 | — | ||||||||
Amortization of deferred financing costs(2) | 0.05 | 0.06 | 0.06 | ||||||||
Amortization of debt discount | 0.01 | — | — | ||||||||
Other non-cash adjustments | — | 0.03 | 0.03 | ||||||||
Tax impact(3) | (0.48 | ) | (0.64 | ) | 1.70 | ||||||
Adjusted Diluted Earnings (Loss) Per Share | $ | (0.50 | ) | $ | 0.75 | $ | 2.26 | ||||
Diluted weighted average shares outstanding | 183,615 | 130,186 | 100,365 | ||||||||
Effective tax rate applicable to adjustment items | 37.4 | % | 37.4 | % | 37.8 | % | |||||
____________________
(1) | Cash settlements represent the cumulative gains and losses on our derivative instruments for the periods presented and do not include a recovery of costs that were paid to acquire or modify the derivative instruments that were settled. |
(2) | As of December 31, 2016, Adjusted Net Income (Loss) includes the non-cash adjustment for amortization of deferred financing costs. Comparative periods have been conformed. The amortization of deferred financing costs is included in interest expense on our Consolidated Statement of Operations. |
(3) | The tax impact is computed utilizing our effective tax rate applicable to the adjustments for certain non-cash and non-recurring items. |
Item 7A. Quantitative and Qualitative Disclosures about Market Risk
We are exposed to a variety of market risks including commodity price risk, interest rate risk and counterparty and customer risk. We address these risks through a program of risk management, including the use of derivative instruments.
The primary objective of the following information is to provide forward-looking quantitative and qualitative information about our potential exposure to market risk. The term “market risk” refers to the risk of loss arising from adverse changes in natural gas, natural gas liquids, and oil prices, and interest rates. The disclosures are not meant to be precise indicators of expected future losses, but rather indicators of reasonably possible losses. This forward-looking information provides indicators of how we view
75
and manage our ongoing market risk exposures. All of our market risk sensitive instruments were entered into for hedging purposes, rather than for speculative trading.
Commodity price exposure risk. We are exposed to market risk as the prices of oil and natural gas fluctuate as a result of changes in supply and demand and other factors. To partially reduce price risk caused by these market fluctuations, we have entered into derivative instruments in the past and expect to enter into derivative instruments in the future to cover a significant portion of our future production.
We utilize derivative financial instruments to manage risks related to changes in oil and natural gas prices. Our crude oil and natural gas contracts will settle monthly based on the average WTI and the average NYMEX Henry Hub natural gas index price, respectively. As of December 31, 2016, we utilized swaps and two-way and three-way costless collar options to reduce the volatility of oil and natural gas prices on a significant portion of its future expected oil and natural gas production. A swap is a sold call and a purchased put established at the same price (both ceiling and floor), which we will receive for the volumes under contract. A two-way collar is a combination of options: a sold call and a purchased put. The purchased put establishes a minimum price (floor) and the sold call establishes a maximum price (ceiling) we will receive for the volumes under contract. A three-way collar is a combination of options: a sold call, a purchased put and a sold put. The purchased put establishes a minimum price (floor), unless the market price falls below the sold put (sub-floor), at which point the minimum price would be the NYMEX index price plus the difference between the purchased put and the sold put strike price. The sold call establishes a maximum price (ceiling) we will receive for the volumes under contract.
We recognize all derivative instruments at fair value. The credit standing of our counterparties is analyzed and factored into the fair value amounts recognized on the balance sheet. Derivative assets and liabilities arising from our derivative contracts with the same counterparty are also reported on a net basis, as all counterparty contracts provide for net settlement.
The following is a summary of our derivative contracts as of December 31, 2016:
Commodity | Settlement Period | Derivative Instrument | Volumes | Weighted Average Prices | Fair Value Asset (Liability) | |||||||||||||||||||||||
Swap | Sub-Floor | Floor | Ceiling | |||||||||||||||||||||||||
(In thousands) | ||||||||||||||||||||||||||||
Crude oil | 2017 | Swaps | 7,369,000 | Bbl | $ | 49.48 | $ | (44,830 | ) | |||||||||||||||||||
Crude oil | 2017 | Two-way collar | 2,672,000 | Bbl | $ | 46.25 | $ | 54.37 | (10,674 | ) | ||||||||||||||||||
Crude oil | 2017 | Three-way collar | 2,004,000 | Bbl | $ | 31.67 | $ | 45.83 | $ | 59.94 | (3,077 | ) | ||||||||||||||||
Crude oil | 2018 | Swaps | 2,440,000 | Bbl | $ | 52.93 | (8,475 | ) | ||||||||||||||||||||
Crude oil | 2018 | Two-way collar | 582,000 | Bbl | $ | 48.40 | $ | 55.13 | (2,101 | ) | ||||||||||||||||||
Crude oil | 2018 | Three-way collar | 186,000 | Bbl | $ | 31.67 | $ | 45.83 | $ | 59.94 | (446 | ) | ||||||||||||||||
Crude oil | 2019 | Swaps | 155,000 | Bbl | $ | 53.88 | (332 | ) | ||||||||||||||||||||
Crude oil | 2019 | Two-way collar | 31,000 | Bbl | $ | 50.00 | $ | 55.70 | (86 | ) | ||||||||||||||||||
Natural gas | 2017 | Swaps | 5,475,000 | MMBtu | $ | 3.32 | (1,697 | ) | ||||||||||||||||||||
Natural gas | 2018 | Swaps | 730,000 | MMBtu | $ | 2.99 | (103 | ) | ||||||||||||||||||||
$ | (71,821 | ) | ||||||||||||||||||||||||||
A 10% increase in crude oil prices would decrease the fair value of our derivative position by approximately $75.3 million, while a 10% decrease in crude oil prices would increase the fair value by approximately $70.9 million.
Interest rate risk. At December 31, 2016, we had (i) $54.3 million of Senior Notes at a fixed cash interest rate of 7.25% per annum, (ii) $395.5 million of Senior Notes at a fixed cash interest rate of 6.5% per annum, (iii) $1,303.2 million of Senior Notes at a fixed cash interest rate of 6.875% per annum and (iv) $300.00 million of Senior Convertible Notes at a fixed cash interest rate of 2.625% per annum outstanding. At December 31, 2016, we also had $363.0 million of borrowings and $12.3 million of outstanding letters of credit issued under our Credit Facility, which were subject to varying rates of interest based on (1) the total outstanding borrowings (including the value of all outstanding letters of credit) in relation to the borrowing base and (2) whether the loan is a LIBOR loan or a domestic bank prime interest rate loan (defined in the Credit Facility as an Alternate Based Rate or “ABR” loan). At December 31, 2016, the outstanding borrowings under our Credit Facility bore interest at LIBOR plus a 1.5% margin. We do not currently, but may in the future, utilize interest rate derivatives to alter
76
interest rate exposure in an attempt to reduce interest rate expense related to debt issued under our Credit Facility. Interest rate derivatives would be used solely to modify interest rate exposure and not to modify the overall leverage of the debt portfolio.
Counterparty and customer credit risk. Joint interest receivables arise from billing entities which own partial interest in the wells we operate. These entities participate in our wells primarily based on their ownership in leases on which we choose to drill. We have limited ability to control participation in our wells. For the year ended December 31, 2016, we recorded bad debt expense of $1.8 million related to our joint interest receivables. We are also subject to credit risk due to concentration of our oil and natural gas receivables with several significant customers. The inability or failure of our significant customers to meet their obligations to us or their insolvency or liquidation may adversely affect our financial results.
While we do not require all of our customers to post collateral and we do not have a formal process in place to evaluate and assess the credit standing of our significant customers for oil and natural gas receivables and the counterparties on our derivative instruments, we do evaluate the credit standing of such counterparties as we deem appropriate under the circumstances. This evaluation may include reviewing a counterparty’s credit rating, latest financial information and, in the case of a customer with which we have receivables, their historical payment record, the financial ability of the customer’s parent company to make payment if the customer cannot and undertaking the due diligence necessary to determine credit terms and credit limits. Several of our significant customers for oil and natural gas receivables have a credit rating below investment grade or do not have rated debt securities. In these circumstances, we have considered the lack of investment grade credit rating in addition to the other factors described above.
As permitted under our investments policy, we may purchase commercial paper instruments from high credit quality counterparties. These counterparties may include issuers in a variety of industries including the domestic and foreign financial sector. This risk is managed by our investment policy including minimum credit ratings thresholds and maximum counterparty exposure values. Although we do not anticipate any of our commercial paper issuers failing to pay us upon maturity, we take a risk in purchasing the commercial paper instruments available in the marketplace. If an issuer fails to repay us at maturity from commercial paper proceeds, it could take a significant amount of time to recover a portion of or all of the assets originally invested. Our commercial paper balance was $36,000 at December 31, 2016.
In addition, our oil and natural gas derivative arrangements expose us to credit risk in the event of nonperformance by counterparties. However, in order to mitigate the risk of nonperformance, we only enter into derivative contracts with counterparties that are high credit-quality financial institutions. Most of the counterparties on our derivative instruments currently in place are Lenders under our Credit Facility with investment grade ratings. We are likely to enter into any future derivative instruments with these or other Lenders under our Credit Facility, which also carry investment grade ratings. This risk is also managed by spreading our derivative exposure across several institutions and limiting the volumes placed under individual contracts. Furthermore, the agreements with each of the counterparties on our derivative instruments contain netting provisions. As a result of these netting provisions, our maximum amount of loss due to credit risk is limited to the net amounts due to and from the counterparties under the derivative contracts. We had a net derivative asset position of $0.4 million and a net derivative liability position of $72.2 million at December 31, 2016.
77
Item 8. Financial Statements and Supplementary Data
Index to Financial Statements
78
Report of Independent Registered Public Accounting Firm
To the Board of Directors and Stockholders of Oasis Petroleum Inc.:
In our opinion, the accompanying consolidated balance sheets and the related consolidated statements of operations, of changes in stockholders’ equity and of cash flows present fairly, in all material respects, the financial position of Oasis Petroleum Inc. and its subsidiaries (the “Company”) at December 31, 2016 and 2015, and the results of their operations and their cash flows for each of the three years in the period ended December 31, 2016 in conformity with accounting principles generally accepted in the United States of America. Also in our opinion, the Company maintained, in all material respects, effective internal control over financial reporting as of December 31, 2016, based on criteria established in Internal Control—Integrated Framework (2013) issued by the Committee of Sponsoring Organizations of the Treadway Commission (COSO). The Company’s management is responsible for these financial statements, for maintaining effective internal control over financial reporting and for its assessment of the effectiveness of internal control over financial reporting, included in Management’s Report on Internal Control Over Financial Reporting appearing under Item 9A. Our responsibility is to express opinions on these financial statements and on the Company’s internal control over financial reporting based on our integrated audits. We conducted our audits in accordance with the standards of the Public Company Accounting Oversight Board (United States). Those standards require that we plan and perform the audits to obtain reasonable assurance about whether the financial statements are free of material misstatement and whether effective internal control over financial reporting was maintained in all material respects. Our audits of the financial statements included examining, on a test basis, evidence supporting the amounts and disclosures in the financial statements, assessing the accounting principles used and significant estimates made by management, and evaluating the overall financial statement presentation. Our audit of internal control over financial reporting included obtaining an understanding of internal control over financial reporting, assessing the risk that a material weakness exists, and testing and evaluating the design and operating effectiveness of internal control based on the assessed risk. Our audits also included performing such other procedures as we considered necessary in the circumstances. We believe that our audits provide a reasonable basis for our opinions.
A company’s internal control over financial reporting is a process designed to provide reasonable assurance regarding the reliability of financial reporting and the preparation of financial statements for external purposes in accordance with generally accepted accounting principles. A company’s internal control over financial reporting includes those policies and procedures that (i) pertain to the maintenance of records that, in reasonable detail, accurately and fairly reflect the transactions and dispositions of the assets of the company; (ii) provide reasonable assurance that transactions are recorded as necessary to permit preparation of financial statements in accordance with generally accepted accounting principles, and that receipts and expenditures of the company are being made only in accordance with authorizations of management and directors of the company; and (iii) provide reasonable assurance regarding prevention or timely detection of unauthorized acquisition, use, or disposition of the company’s assets that could have a material effect on the financial statements.
Because of its inherent limitations, internal control over financial reporting may not prevent or detect misstatements. Also, projections of any evaluation of effectiveness to future periods are subject to the risk that controls may become inadequate because of changes in conditions, or that the degree of compliance with the policies or procedures may deteriorate.
/s/PricewaterhouseCoopers LLP
Houston, Texas
February 23, 2017
79
Oasis Petroleum Inc.
Consolidated Balance Sheet
December 31, | |||||||
2016 | 2015 | ||||||
(In thousands, except share data) | |||||||
ASSETS | |||||||
Current assets | |||||||
Cash and cash equivalents | $ | 11,226 | $ | 9,730 | |||
Accounts receivable, net | 204,335 | 197,409 | |||||
Inventory | 10,648 | 11,072 | |||||
Prepaid expenses | 7,623 | 7,328 | |||||
Derivative instruments | 362 | 139,697 | |||||
Other current assets | 4,355 | 50 | |||||
Total current assets | 238,549 | 365,286 | |||||
Property, plant and equipment | |||||||
Oil and gas properties (successful efforts method) | 7,296,568 | 6,284,401 | |||||
Other property and equipment | 618,790 | 443,265 | |||||
Less: accumulated depreciation, depletion, amortization and impairment | (1,995,791 | ) | (1,509,424 | ) | |||
Total property, plant and equipment, net | 5,919,567 | 5,218,242 | |||||
Assets held for sale | — | 26,728 | |||||
Derivative instruments | — | 15,776 | |||||
Other assets | 20,516 | 23,343 | |||||
Total assets | $ | 6,178,632 | $ | 5,649,375 | |||
LIABILITIES AND STOCKHOLDERS’ EQUITY | |||||||
Current liabilities | |||||||
Accounts payable | $ | 4,645 | $ | 9,983 | |||
Revenues and production taxes payable | 139,737 | 132,356 | |||||
Accrued liabilities | 119,173 | 167,669 | |||||
Accrued interest payable | 39,004 | 49,413 | |||||
Derivative instruments | 60,469 | — | |||||
Advances from joint interest partners | 7,597 | 4,647 | |||||
Other current liabilities | 10,490 | 6,500 | |||||
Total current liabilities | 381,115 | 370,568 | |||||
Long-term debt | 2,297,214 | 2,302,584 | |||||
Deferred income taxes | 513,529 | 608,155 | |||||
Asset retirement obligations | 48,985 | 35,338 | |||||
Liabilities held for sale | — | 10,228 | |||||
Derivative instruments | 11,714 | — | |||||
Other liabilities | 2,918 | 3,160 | |||||
Total liabilities | 3,255,475 | 3,330,033 | |||||
Commitments and contingencies (Note 16) | |||||||
Stockholders’ equity | |||||||
Common stock, $0.01 par value: 450,000,000 and 300,000,000 shares authorized at December 31, 2016 and 2015, respectively; 237,201,064 shares issued and 236,344,172 shares outstanding at December 31, 2016 and 139,583,990 shares issued and 139,076,064 shares outstanding at December 31, 2015 | 2,331 | 1,376 | |||||
Treasury stock, at cost: 856,892 shares and 507,926 shares at December 31, 2016 and 2015, respectively | (15,950 | ) | (13,620 | ) | |||
Additional paid-in-capital | 2,345,271 | 1,497,065 | |||||
Retained earnings | 591,505 | 834,521 | |||||
Total stockholders’ equity | 2,923,157 | 2,319,342 | |||||
Total liabilities and stockholders’ equity | $ | 6,178,632 | $ | 5,649,375 | |||
The accompanying notes are an integral part of these consolidated financial statements.
80
Oasis Petroleum Inc.
Consolidated Statement of Operations
Year Ended December 31, | |||||||||||
2016 | 2015 | 2014 | |||||||||
(In thousands, except per share data) | |||||||||||
Revenues | |||||||||||
Oil and gas revenues | $ | 635,505 | $ | 721,672 | $ | 1,304,004 | |||||
Midstream revenues | 35,406 | 23,769 | 11,614 | ||||||||
Well services revenues | 33,754 | 44,294 | 74,610 | ||||||||
Total revenues | 704,665 | 789,735 | 1,390,228 | ||||||||
Operating expenses | |||||||||||
Lease operating expenses | 135,444 | 144,481 | 169,600 | ||||||||
Midstream operating expenses | 9,003 | 6,198 | 4,647 | ||||||||
Well services operating expenses | 17,009 | 21,833 | 45,605 | ||||||||
Marketing, transportation and gathering expenses | 40,366 | 31,610 | 29,133 | ||||||||
Production taxes | 56,565 | 69,584 | 127,648 | ||||||||
Depreciation, depletion and amortization | 476,331 | 485,322 | 412,334 | ||||||||
Exploration expenses | 1,785 | 2,369 | 3,064 | ||||||||
Rig termination | — | 3,895 | — | ||||||||
Impairment | 4,684 | 46,109 | 47,238 | ||||||||
General and administrative expenses | 93,008 | 92,498 | 92,306 | ||||||||
Total operating expenses | 834,195 | 903,899 | 931,575 | ||||||||
Gain (loss) on sale of properties | (1,303 | ) | — | 186,999 | |||||||
Operating income (loss) | (130,833 | ) | (114,164 | ) | 645,652 | ||||||
Other income (expense) | |||||||||||
Net gain (loss) on derivative instruments | (105,317 | ) | 210,376 | 327,011 | |||||||
Interest expense, net of capitalized interest | (140,305 | ) | (149,648 | ) | (158,390 | ) | |||||
Gain on extinguishment of debt | 4,741 | — | — | ||||||||
Other income (expense) | 160 | (2,935 | ) | 195 | |||||||
Total other income (expense) | (240,721 | ) | 57,793 | 168,816 | |||||||
Income (loss) before income taxes | (371,554 | ) | (56,371 | ) | 814,468 | ||||||
Income tax benefit (expense) | 128,538 | 16,123 | (307,591 | ) | |||||||
Net income (loss) | $ | (243,016 | ) | $ | (40,248 | ) | $ | 506,877 | |||
Earnings (loss) per share: | |||||||||||
Basic (Note 13) | $ | (1.32 | ) | $ | (0.31 | ) | $ | 5.09 | |||
Diluted (Note 13) | (1.32 | ) | (0.31 | ) | 5.05 | ||||||
Weighted average shares outstanding: | |||||||||||
Basic (Note 13) | 183,615 | 130,186 | 99,677 | ||||||||
Diluted (Note 13) | 183,615 | 130,186 | 100,365 | ||||||||
The accompanying notes are an integral part of these consolidated financial statements.
81
Oasis Petroleum Inc.
Consolidated Statement of Changes in Stockholders’ Equity
Common Stock | Treasury Stock | Additional Paid-in-Capital | Retained Earnings (Deficit) | Total Stockholders’ Equity | |||||||||||||||||||||
Shares | Amount | Shares | Amount | ||||||||||||||||||||||
(In thousands) | |||||||||||||||||||||||||
Balance as of December 31, 2013 | 100,699 | $ | 996 | 167 | $ | (5,362 | ) | $ | 985,023 | $ | 367,892 | $ | 1,348,549 | ||||||||||||
Fees (2013 issuance of common stock) | — | — | — | — | (176 | ) | — | (176 | ) | ||||||||||||||||
Stock-based compensation | 762 | 5 | — | — | 22,355 | — | 22,360 | ||||||||||||||||||
Treasury stock – tax withholdings | (119 | ) | — | 119 | (5,309 | ) | — | — | (5,309 | ) | |||||||||||||||
Net income | — | — | — | — | — | 506,877 | 506,877 | ||||||||||||||||||
Balance as of December 31, 2014 | 101,342 | 1,001 | 286 | (10,671 | ) | 1,007,202 | 874,769 | 1,872,301 | |||||||||||||||||
Issuance of common stock | 36,800 | 368 | — | — | 462,465 | — | 462,833 | ||||||||||||||||||
Stock-based compensation | 1,156 | 7 | — | — | 27,398 | — | 27,405 | ||||||||||||||||||
Treasury stock – tax withholdings | (222 | ) | — | 222 | (2,949 | ) | — | — | (2,949 | ) | |||||||||||||||
Net loss | — | — | — | — | — | (40,248 | ) | (40,248 | ) | ||||||||||||||||
Balance as of December 31, 2015 | 139,076 | 1,376 | 508 | (13,620 | ) | 1,497,065 | 834,521 | 2,319,342 | |||||||||||||||||
Issuance of common stock | 94,300 | 943 | — | — | 765,727 | — | 766,670 | ||||||||||||||||||
Stock-based compensation | 3,317 | 12 | — | — | 25,759 | — | 25,771 | ||||||||||||||||||
Equity component of senior unsecured convertible notes, net | — | — | — | — | 56,720 | — | 56,720 | ||||||||||||||||||
Treasury stock – tax withholdings | (349 | ) | — | 349 | (2,330 | ) | — | — | (2,330 | ) | |||||||||||||||
Net loss | — | — | — | — | — | (243,016 | ) | (243,016 | ) | ||||||||||||||||
Balance as of December 31, 2016 | 236,344 | $ | 2,331 | 857 | $ | (15,950 | ) | $ | 2,345,271 | $ | 591,505 | $ | 2,923,157 | ||||||||||||
The accompanying notes are an integral part of these consolidated financial statements.
82
Oasis Petroleum Inc.
Consolidated Statement of Cash Flows
Year Ended December 31, | |||||||||||
2016 | 2015 | 2014 | |||||||||
(In thousands) | |||||||||||
Cash flows from operating activities: | |||||||||||
Net income (loss) | $ | (243,016 | ) | $ | (40,248 | ) | $ | 506,877 | |||
Adjustments to reconcile net income (loss) to net cash provided by operating activities: | |||||||||||
Depreciation, depletion and amortization | 476,331 | 485,322 | 412,334 | ||||||||
Gain on extinguishment of debt | (4,741 | ) | — | — | |||||||
(Gain) loss on sale of properties | 1,303 | — | (186,999 | ) | |||||||
Impairment | 4,684 | 46,109 | 47,238 | ||||||||
Deferred income taxes | (128,538 | ) | (16,114 | ) | 307,457 | ||||||
Derivative instruments | 105,317 | (210,376 | ) | (327,011 | ) | ||||||
Stock-based compensation expenses | 24,103 | 25,272 | 21,302 | ||||||||
Deferred financing costs amortization and other | 14,334 | 12,299 | 11,028 | ||||||||
Working capital and other changes: | |||||||||||
Change in accounts receivable, net | (11,923 | ) | 108,461 | 16,702 | |||||||
Change in inventory | 254 | 6,873 | (3,776 | ) | |||||||
Change in prepaid expenses | (295 | ) | 1,828 | (3,199 | ) | ||||||
Change in other current assets | (305 | ) | 6,489 | (6,135 | ) | ||||||
Change in other assets | (151 | ) | (950 | ) | 114 | ||||||
Change in accounts payable and accrued liabilities | (13,839 | ) | (71,617 | ) | 76,723 | ||||||
Change in other current liabilities | 4,490 | 6,500 | — | ||||||||
Change in other liabilities | 10 | (33 | ) | (139 | ) | ||||||
Net cash provided by operating activities | 228,018 | 359,815 | 872,516 | ||||||||
Cash flows from investing activities: | |||||||||||
Capital expenditures | (426,256 | ) | (819,847 | ) | (1,354,281 | ) | |||||
Acquisitions of oil and gas properties | (781,522 | ) | (28,817 | ) | (46,247 | ) | |||||
Proceeds from sale of properties | 12,333 | 1,075 | 324,852 | ||||||||
Costs related to sale of properties | (310 | ) | — | (2,337 | ) | ||||||
Derivative settlements | 121,977 | 370,410 | 6,774 | ||||||||
Advances from joint interest partners | 2,950 | (1,969 | ) | (6,213 | ) | ||||||
Net cash used in investing activities | (1,070,828 | ) | (479,148 | ) | (1,077,452 | ) | |||||
Cash flows from financing activities: | |||||||||||
Proceeds from revolving credit facility | 1,407,000 | 630,000 | 620,000 | ||||||||
Principal payments on revolving credit facility | (1,182,000 | ) | (992,000 | ) | (455,570 | ) | |||||
Repurchase of senior unsecured notes | (435,907 | ) | — | — | |||||||
Proceeds from issuance of senior unsecured convertible notes | 300,000 | — | — | ||||||||
Deferred financing costs | (9,127 | ) | (14,632 | ) | (99 | ) | |||||
Proceeds from sale of common stock | 766,670 | 462,833 | — | ||||||||
Purchases of treasury stock | (2,330 | ) | (2,949 | ) | (5,309 | ) | |||||
Other | — | — | (176 | ) | |||||||
Net cash provided by financing activities | 844,306 | 83,252 | 158,846 | ||||||||
Increase (decrease) in cash and cash equivalents | 1,496 | (36,081 | ) | (46,090 | ) | ||||||
Cash and cash equivalents: | |||||||||||
Beginning of period | 9,730 | 45,811 | 91,901 | ||||||||
End of period | $ | 11,226 | $ | 9,730 | $ | 45,811 | |||||
Supplemental cash flow information: | |||||||||||
Cash paid for interest, net of capitalized interest | $ | 138,248 | $ | 145,333 | $ | 150,181 | |||||
Cash paid for taxes | — | — | 5,329 | ||||||||
Cash received for income tax refunds | 5 | 5,548 | — | ||||||||
Supplemental non-cash transactions: | |||||||||||
Change in accrued capital expenditures | $ | (43,415 | ) | $ | (260,060 | ) | $ | 169,710 | |||
Change in asset retirement obligations | 3,810 | 3,972 | 6,182 | ||||||||
Note receivable from divestiture | 4,000 | — | — | ||||||||
The accompanying notes are an integral part of these consolidated financial statements.
83
Oasis Petroleum Inc.
Notes to Consolidated Financial Statements
1. Organization and Operations of the Company
Oasis Petroleum Inc. (together with its consolidated subsidiaries, “Oasis” or the “Company”) was originally formed in 2007 and was incorporated pursuant to the laws of the State of Delaware in 2010. The Company is an independent exploration and production company focused on the acquisition and development of unconventional oil and natural gas resources in the North Dakota and Montana regions of the Williston Basin. Oasis Petroleum North America LLC (“OPNA”) conducts the Company’s exploration and production activities and owns its proved and unproved oil and natural gas properties. The Company also operates a midstream services business through Oasis Midstream Services LLC (“OMS”) and a well services business through Oasis Well Services LLC (“OWS”), both of which are separate reportable business segments that are complementary to its primary development and production activities.
2. Summary of Significant Accounting Policies
Basis of Presentation
The accompanying consolidated financial statements of the Company include the accounts of Oasis and its wholly-owned subsidiaries. All significant intercompany transactions have been eliminated in consolidation. These statements have been prepared in accordance with accounting principles generally accepted in the United States of America (“GAAP”). Certain reclassifications of prior year balances have been made to conform such amounts to current year classifications. These reclassifications have no impact on net income.
Use of Estimates
Preparation of the Company’s consolidated financial statements in accordance with GAAP requires management to make estimates and assumptions that affect the reported amounts of assets and liabilities at the date of the consolidated financial statements and the reported amounts of revenues and expenses during the reporting period. The most significant estimates pertain to proved oil and natural gas reserves and related cash flow estimates used in impairment tests of long-lived assets, estimates of future development, dismantlement and abandonment costs, estimates relating to certain oil and natural gas revenues and expenses and estimates of expenses related to legal, environmental and other contingencies. Certain of these estimates require assumptions regarding future commodity prices, future costs and expenses and future production rates. Actual results could differ from those estimates.
Estimates of oil and natural gas reserves and their values, future production rates and future costs and expenses are inherently uncertain for numerous reasons, including many factors beyond the Company’s control. Reservoir engineering is a subjective process of estimating underground accumulations of oil and natural gas that cannot be measured in an exact manner. The accuracy of any reserve estimate is a function of the quality of data available and of engineering and geological interpretation and judgment. In addition, estimates of reserves may be revised based on actual production, results of subsequent exploration and development activities, prevailing commodity prices, operating costs and other factors. These revisions may be material and could materially affect future depreciation, depletion and amortization (“DD&A”) expense, dismantlement and abandonment costs, and impairment expense.
Risks and Uncertainties
As an oil and natural gas producer, the Company’s revenue, profitability and future growth are substantially dependent upon the prevailing and future prices for oil and natural gas, which are dependent upon numerous factors beyond its control such as economic, political and regulatory developments and competition from other energy sources. The energy markets have historically been very volatile and there can be no assurance that oil and natural gas prices will not be subject to wide fluctuations in the future. As a result of current commodity prices, the Company plans to increase its 2017 capital expenditures, excluding acquisitions, as compared to 2016, while continuing to concentrate its drilling activities in certain areas that are the most economic in the Williston Basin. An extended period of low prices for oil and, to a lesser extent, natural gas could have a material adverse effect on the Company’s financial position, results of operations, cash flows and quantities of oil and natural gas reserves that may be economically produced.
Cash Equivalents
The Company invests in certain money market funds, commercial paper and time deposits, all of which are stated at fair value or cost which approximates fair value due to the short-term maturity of these investments. The Company classifies all such investments with original maturity dates less than 90 days as cash equivalents.
84
Accounts Receivable
Accounts receivable are carried at cost on a gross basis, with no discounting, which approximates fair value due to their short-term maturities. The Company’s accounts receivable consist mainly of receivables from oil and gas purchasers and joint interest owners on properties the Company operates.
The Company regularly assesses the recoverability of all material trade and other receivables to determine their collectability. The Company accrues a reserve on a receivable when, based on management’s judgment, it is probable that a receivable will not be collected and the amount of such reserve may be reasonably estimated. For receivables from joint interest owners, the Company typically has the ability to withhold future revenue disbursements to recover non-payment of joint interest billings. Generally, the Company’s oil and gas receivables are collected within two months, and to date, the Company has had minimal bad debts. At December 31, 2016, the Company had an allowance for doubtful accounts of $1.3 million. No allowance for doubtful accounts was recorded for the year ended December 31, 2015.
Inventory
Crude oil inventory includes oil in tank and linefill. Equipment and materials consist primarily of proppant, chemicals, tubular goods, well equipment to be used in future drilling or repair operations and well fracturing equipment. Inventory is stated at the lower of cost or market value with cost determined on an average cost method.
Joint Interest Partner Advances
The Company participates in the drilling of oil and natural gas wells with other working interest partners. Due to the capital intensive nature of oil and natural gas drilling activities, the working interest partner responsible for conducting the drilling operations may request advance payments from other working interest partners for their share of the costs. The Company expects such advances to be applied by working interest partners against joint interest billings for its share of drilling operations within 90 days from when the advance is paid. Advances to joint interest partners are included in other current assets on the Company’s Consolidated Balance Sheet.
Property, Plant and Equipment
Proved Oil and Gas Properties
Oil and natural gas exploration and development activities are accounted for using the successful efforts method. Under this method, all property acquisition costs and costs of exploratory and development wells are capitalized when incurred, pending determination of whether the well has found proved reserves. If an exploratory well does not find proved reserves, the costs of drilling the well are charged to expense. The costs of development wells are capitalized whether productive or nonproductive.
The provision for DD&A of oil and natural gas properties is calculated using the unit-of-production method. All capitalized well costs and leasehold costs of proved properties are amortized on a unit-of-production basis over the remaining life of proved developed reserves and total proved reserves, respectively. Natural gas is converted to barrel equivalents at the rate of six thousand cubic feet of natural gas to one barrel of oil. The calculation for the unit-of-production DD&A method takes into consideration estimated future dismantlement, restoration and abandonment costs, which are net of estimated salvage values.
Costs of retired, sold or abandoned properties that constitute a part of an amortization base are charged or credited, net of proceeds, to accumulated DD&A unless doing so significantly affects the unit-of-production amortization rate, in which case a gain or loss is recognized currently.
Expenditures for maintenance, repairs and minor renewals necessary to maintain properties in operating condition are expensed as incurred. Major betterments, replacements and renewals are capitalized to the appropriate property and equipment accounts. Estimated dismantlement and abandonment costs for oil and natural gas properties are capitalized, net of salvage, at their estimated net present value and amortized on a unit-of-production basis over the remaining life of the related proved developed reserves.
The Company reviews its proved oil and natural gas properties for impairment whenever events and circumstances indicate that a decline in the recoverability of their carrying value may have occurred. The Company estimates the expected undiscounted future cash flows of its oil and natural gas properties and compares such undiscounted future cash flows to the carrying amount of the oil and natural gas properties to determine if the carrying amount is recoverable. If the carrying amount exceeds the estimated undiscounted future cash flows, the Company will adjust the carrying amount of the oil and natural gas properties to fair value. The factors used to determine fair value are subject to management’s judgment and expertise and include, but are not limited to, recent sales prices of comparable properties, the present value of future cash flows, net of
85
estimated operating and development costs using estimates of proved reserves, future commodity pricing, future production estimates, anticipated capital expenditures and various discount rates commensurate with the risk and current market conditions associated with realizing the expected cash flows projected.
Unproved Oil and Gas Properties
Unproved properties consist of costs incurred to acquire unproved leases, or lease acquisition costs. Lease acquisition costs are capitalized until the leases expire or when the Company specifically identifies leases that will revert to the lessor, at which time the Company expenses the associated lease acquisition costs. The expensing of the lease acquisition costs is recorded as impairment in the Consolidated Statement of Operations. Lease acquisition costs related to successful exploratory drilling are reclassified to proved properties and depleted on a unit-of-production basis.
The Company assesses its unproved properties periodically for impairment on a property-by-property basis based on remaining lease terms, drilling results or future plans to develop acreage. The Company considers the following factors in its assessment of the impairment of unproved properties:
• | the remaining amount of unexpired term under its leases; |
• | its ability to actively manage and prioritize its capital expenditures to drill leases and to make payments to extend leases that may be close to expiration; |
• | its ability to exchange lease positions with other companies that allow for higher concentrations of ownership and development; |
• | its ability to convey partial mineral ownership to other companies in exchange for their drilling of leases; and |
• | its evaluation of the continuing successful results from the application of completion technology in the Bakken and Three Forks formations by the Company or by other operators in areas adjacent to or near the Company’s unproved properties. |
For sales of entire working interests in unproved properties, a gain or loss is recognized to the extent of the difference between the proceeds received and the net carrying value of the property. Proceeds from sales of partial interests in unproved properties are accounted for as a recovery of costs unless the proceeds exceed the entire cost of the property.
Capitalized Interest
The Company capitalizes a portion of its interest expense incurred on its outstanding debt. The amount capitalized is determined by multiplying the capitalization rate by the average amount of eligible accumulated capital expenditures and is limited to actual interest costs incurred during the period. The accumulated capital expenditures included in the capitalized interest calculation begin when the first costs are incurred and end when the asset is either placed into production or written off. The Company capitalized $16.8 million, $18.6 million and $8.8 million of interest costs for the years ended December 31, 2016, 2015 and 2014, respectively. These amounts are amortized over the life of the related assets.
Other Property and Equipment
The Company’s salt water disposal facilities, natural gas processing plant, pipelines, buildings, furniture, software, equipment and leasehold improvements are recorded at cost and are depreciated on the straight-line method based on expected lives of the individual assets. The Company uses estimated lives of 30 years for its salt water disposal facilities, natural gas processing plant and pipelines, 20 years for its buildings, two to seven years for its furniture, software and equipment and the remaining lease term for its leasehold improvements. The calculation for the straight-line DD&A method for its salt water disposal facilities takes into consideration estimated future dismantlement, restoration and abandonment costs, which are net of estimated salvage values. The cost of assets disposed of and the associated accumulated DD&A are removed from the Company’s Consolidated Balance Sheet with any gain or loss realized upon the sale or disposal included in the Company’s Consolidated Statement of Operations.
Exploration Expenses
Exploration costs, including certain geological and geophysical expenses and the costs of carrying and retaining undeveloped acreage, are charged to expense as incurred.
Costs from drilling exploratory wells are initially capitalized, but charged to expense if and when a well is determined to be unsuccessful. Determination is usually made on or shortly after drilling or completing the well, however, in certain situations a determination cannot be made when drilling is completed. The Company defers capitalized exploratory drilling costs for wells that have found a sufficient quantity of producible hydrocarbons but cannot be classified as proved because they
86
are located in areas that require major capital expenditures or governmental or other regulatory approvals before production can begin. These costs continue to be deferred as wells-in-progress as long as development is underway, is firmly planned for in the near future or the necessary approvals are actively being sought.
Net changes in capitalized exploratory well costs are reflected in the following table for the periods presented:
December 31, | |||||||||||
2016 | 2015 | 2014 | |||||||||
(In thousands) | |||||||||||
Beginning of period | $ | 2,097 | $ | 34,522 | $ | 123,215 | |||||
Exploratory well cost additions (pending determination of proved reserves) | — | 51,803 | 336,344 | ||||||||
Exploratory well cost reclassifications (successful determination of proved reserves) | — | (84,228 | ) | (425,037 | ) | ||||||
Exploratory well dry hole costs (unsuccessful in adding proved reserves) | — | — | — | ||||||||
End of period | $ | 2,097 | $ | 2,097 | $ | 34,522 | |||||
As of December 31, 2016, the Company had no exploratory well costs that were capitalized for a period of greater than one year after the completion of drilling.
Business Combinations
The Company accounts for business combinations under the acquisition method of accounting. Accordingly, the Company recognizes amounts for identifiable assets acquired and liabilities assumed equal to their estimated acquisition date fair values. Transaction and integration costs associated with business combinations are expensed as incurred.
The Company makes various assumptions in estimating the fair values of assets acquired and liabilities assumed. As fair value is a market-based measurement, it is determined based on the assumptions that market participants would use. The most significant assumptions relate to the estimated fair values of proved and unproved oil and natural gas properties. The fair values of these properties are measured using valuation techniques that convert future cash flows to a single discounted amount. Significant inputs to the valuation include estimates of reserves, future operating and development costs, future commodity prices and a market-based weighted average cost of capital rate. The market-based weighted average cost of capital rate is subjected to additional project-specific risking factors. In addition, when appropriate, the Company reviews comparable purchases and sales of oil and natural gas properties within the same regions and uses that data as a proxy for fair market value; for example, the amount a willing buyer and seller would enter into in exchange for such properties.
Any excess of the acquisition price over the estimated fair value of net assets acquired is recorded as goodwill. Any excess of the estimated fair value of net assets acquired over the acquisition price is recorded in current earnings as a gain on bargain purchase. Deferred taxes are recorded for any differences between the assigned values and the tax basis of assets and liabilities. Estimated deferred taxes are based on available information concerning the tax basis of assets acquired and liabilities assumed and loss carryforwards at the acquisition date, although such estimates may change in the future as additional information becomes known.
Assets Held for Sale
The Company occasionally markets non-core oil and natural gas properties. At the end of each reporting period, the Company evaluates the properties being marketed to determine whether any should be reclassified as held-for-sale. The held-for-sale criteria include: management commits to a plan to sell; the asset is available for immediate sale; an active program to locate a buyer exists; the sale of the asset is probable and expected to be completed within one year; the asset is being actively marketed for sale; and it is unlikely that significant changes to the plan will be made. If each of these criteria is met, the property is reclassified as held-for-sale on the Company’s Consolidated Balance Sheet and measured at the lower of their carrying amount or estimated fair value less costs to sell. DD&A expense is not recorded on assets to be divested once they are classified as held for sale.
Deferred Financing Costs
The Company capitalizes costs incurred in connection with obtaining financing. These costs are amortized over the term of the related financing using the straight-line method, which approximates the effective interest method. The amortization expense is recorded as a component of interest expense in the Company’s Consolidated Statement of Operations. The deferred financing costs related to the Company’s senior unsecured notes and revolving credit facility are included in long-term debt and other assets, respectively, on the Company’s Consolidated Balance Sheet.
87
Asset Retirement Obligations
In accordance with the Financial Accounting Standard Board’s (“FASB”) authoritative guidance on asset retirement obligations (“ARO”), the Company records the fair value of a liability for a legal obligation to retire an asset in the period in which the liability is incurred and can be reasonably estimated with the corresponding cost capitalized by increasing the carrying amount of the related long-lived asset. For oil and gas properties, this is the period in which the well is drilled or acquired. The ARO represents the estimated amount the Company will incur to plug, abandon and remediate the properties at the end of their productive lives, in accordance with applicable state laws. The liability is accreted to its present value each period and the capitalized costs are amortized using the unit-of-production method. The accretion expense is recorded as a component of depreciation, depletion and amortization in the Company’s Consolidated Statement of Operations.
Some of the Company’s midstream assets, including certain pipelines and the natural gas processing plant, have contractual or regulatory obligations to perform remediation and, in some instances, dismantlement and removal activities, when the assets are abandoned. The Company is not able to reasonably estimate the fair value of the asset retirement obligations for these assets because the settlement dates are indeterminable given the expected continued use of the assets with proper maintenance. The Company will record asset retirement obligations for these assets in the periods in which the settlement dates are reasonably determinable.
The Company determines the ARO by calculating the present value of estimated cash flows related to the liability. Estimating the future ARO requires management to make estimates and judgments regarding timing and existence of a liability, as well as what constitutes adequate restoration. Inherent in the fair value calculation are numerous assumptions and judgments including the ultimate costs, inflation factors, credit adjusted discount rates, timing of settlement and changes in the legal, regulatory, environmental and political environments. These assumptions represent Level 3 inputs, as further discussed in Note 3 — Fair Value Measurements. To the extent future revisions to these assumptions impact the fair value of the existing ARO liability, a corresponding adjustment is made to the related asset.
Revenue Recognition
Oil and gas revenue from the Company’s interests in producing wells is recognized when the product is delivered, at which time the customer has taken title and assumed the risks and rewards of ownership, and collectability is reasonably assured. Substantially all of the Company’s production is sold to purchasers under short-term (less than twelve months) contracts at market-based prices. The sales prices for oil and natural gas are adjusted for transportation and other related deductions. These deductions are based on contractual or historical data and do not require significant judgment. Subsequently, these revenue deductions are adjusted to reflect actual charges based on third-party documents. Since there is a ready market for oil and natural gas, the Company sells the majority of its production soon after it is produced at various locations. As a result, the Company maintains a minimum amount of product inventory in storage.
Midstream revenues consist of revenues from salt water gathering and disposal services, fresh water services, natural gas gathering and processing and crude oil gathering and transportation and other midstream services provided by OMS primarily for OPNA’s operated wells. Well services revenues result from well services, product sales and equipment rentals provided by OWS primarily for OPNA’s operated wells. Midstream and well services revenues are recognized when services have been performed or related volumes or products have been delivered. The revenues related to OPNA’s working interests are eliminated in consolidation, and only the revenues related to other working interest owners in OPNA’s wells are included in the Company’s Consolidated Statement of Operations.
Revenues and Production Taxes Payable
The Company calculates and pays taxes and royalties on oil and natural gas in accordance with the particular contractual provisions of the lease, license or concession agreements and the laws and regulations applicable to those agreements.
Concentrations of Market and Credit Risk
The future results of the Company’s oil and natural gas operations will be affected by the market prices of oil and natural gas. The availability of a ready market for oil and natural gas products in the future will depend on numerous factors beyond the control of the Company, including weather, imports, marketing of competitive fuels, proximity and capacity of oil and natural gas pipelines and other transportation facilities, any oversupply or undersupply of oil, natural gas and liquid products, the regulatory environment, the economic environment, and other regional and political events, none of which can be predicted with certainty. The current global oversupply of crude oil has caused a sharp decline in oil prices since mid-2014, and an extended period of low prices for oil could have a material adverse effect on the Company’s financial position, cash flows and results of operations.
88
The Company operates in the exploration, development and production sector of the oil and gas industry. The Company’s receivables include amounts due from purchasers of its oil and natural gas production and amounts due from joint interest partners for their respective portions of operating expenses and exploration and development costs. While certain of these customers and joint interest partners are affected by periodic downturns in the economy in general or in their specific segment of the oil or natural gas industry, including the current period of low commodity prices, the Company believes that its level of credit-related losses due to such economic fluctuations has been and will continue to be immaterial to the Company’s results of operations over the long-term. In addition, a portion of the Company’s trade receivables are collateralized.
The Company manages and controls market and counterparty credit risk. In the normal course of business, collateral is not required for financial instruments with credit risk. Financial instruments which potentially subject the Company to credit risk consist principally of temporary cash balances and derivative financial instruments. The Company maintains cash and cash equivalents in bank deposit accounts which, at times, may exceed the federally insured limits. The Company has not experienced any significant losses from such investments. The Company attempts to limit the amount of credit exposure to any one financial institution or company. The Company believes the credit quality of its customers is generally high. In the normal course of business, letters of credit or parent guarantees are required for counterparties which management perceives to have a higher credit risk.
Risk Management
The Company utilizes derivative financial instruments to manage risks related to changes in oil and natural gas prices. As of December 31, 2016, the Company utilized swaps and two-way and three-way costless collar options to reduce the volatility of oil and natural gas prices on a significant portion of its future expected oil and natural gas production (see Note 4 — Derivative Instruments).
The Company records all derivative instruments on the Consolidated Balance Sheet as either assets or liabilities measured at their estimated fair value. Derivative assets and liabilities arising from derivative contracts with the same counterparty are reported on a net basis, as all counterparty contracts provide for net settlement. The Company has not designated any derivative instruments as hedges for accounting purposes and does not enter into such instruments for speculative trading purposes. Gains and losses from valuation changes in commodity derivative instruments are reported in the other income (expense) section of the Company’s Consolidated Statement of Operations. The Company’s cash flow is only impacted when the actual settlements under the derivative contracts result in making or receiving a payment to or from the counterparty. These cash settlements represent the cumulative gains and losses on the Company’s derivative instruments for the periods presented and do not include a recovery of costs that were paid to acquire or modify the derivative instruments that were settled. Cash settlements are reflected as investing activities in the Company’s Consolidated Statement of Cash Flows.
Derivative financial instruments that hedge the price of oil and natural gas are executed with major financial institutions that expose the Company to market and credit risks and which may, at times, be concentrated with certain counterparties or groups of counterparties. The Company has derivatives in place with nine counterparties. Although notional amounts are used to express the volume of these contracts, the amounts potentially subject to credit risk in the event of nonperformance by the counterparties are substantially smaller. The credit worthiness of the counterparties is subject to continual review. The Company believes the risk of nonperformance by its counterparties is low. Full performance is anticipated, and the Company has no past-due receivables from its counterparties. The Company’s policy is to execute financial derivatives only with major, credit-worthy financial institutions.
The Company’s derivative contracts are documented with industry standard contracts known as a Schedule to the Master Agreement and International Swaps and Derivatives Association, Inc. Master Agreement (“ISDA”). Typical terms for the ISDAs include credit support requirements, cross default provisions, termination events and set-off provisions. The Company is not required to provide any credit support to its counterparties other than cross collateralization with the properties securing the Company’s revolving credit facility (see Note 8— Long-Term Debt). As of December 31, 2016, the Company had limitations under its revolving credit facility, including a provision limiting the total amount of production that may be hedged by the Company to the lesser of projected production or 110% of Current Production (as defined in the revolving credit facility) for the period from 1 to 12 months, 100% of Current Production for the period from 13 to 24 months, 75% of Current Production for the period from 25 to 36 months, and 50% of Current Production for the period from 37 to 60 months after the date of each derivative. As of December 31, 2016, the Company was in compliance with these limitations.
89
Environmental Costs
Environmental expenditures are expensed or capitalized, as appropriate, depending on their future economic benefit. Expenditures that relate to an existing condition caused by past operations, and which do not have future economic benefit, are expensed. Liabilities related to future costs are recorded on an undiscounted basis when environmental assessments and/or remediation activities are probable and the costs can be reasonably estimated.
Stock-Based Compensation
Restricted Stock Awards
The Company has granted restricted stock awards to employees and directors under its Amended and Restated 2010 Long Term Incentive Plan, the majority of which vest over a three-year period. The fair value of restricted stock grants is based on the value of the Company’s common stock on the date of grant. Compensation expense is recognized ratably over the requisite service period. The Company assumed annual forfeiture rates by employee group ranging from 0% to 20% based on the Company’s forfeiture history for this type of award. Stock-based compensation expense recorded for restricted stock awards is included in general and administrative expenses on the Company’s Consolidated Statement of Operations.
Performance Share Units
The Company recognizes compensation expense for its performance share units (“PSUs”) granted to its officers under its Amended and Restated 2010 Long Term Incentive Plan. Stock-based compensation expense is measured at the grant date based on the fair value of the award and is recognized as expense on a straight-line basis over the performance period, which is generally the vesting period. The fair value of the PSUs is based on the calculation derived from a Monte Carlo simulation model. The Monte Carlo simulation model uses assumptions regarding random projections and must be repeated numerous times to achieve a probable assessment (see Note 11 — Stock-Based Compensation for a description of the inputs used in this model). The Company assumed annual forfeiture rates by employee group ranging from 3.3% to 4.6% based on the Company’s forfeiture history for the employee groups receiving PSUs. Stock-based compensation expense recorded for PSUs is included in general and administrative expenses on the Company’s Consolidated Statement of Operations.
Associated Excess Tax Benefits
Any excess tax benefit arising from the Company’s stock-based compensation plan is recognized as a credit to additional paid-in-capital when realized and is calculated as the amount by which the tax benefit related to the tax deduction received exceeds the deferred tax asset associated with the recorded stock-based compensation expense. As of December 31, 2016, the excess federal tax deduction related to stock-based compensation was $10.6 million and the excess state tax deduction related to stock-based compensation was $8.6 million. Since the Company has been in and continues to be in a net operating loss position for tax purposes, none of the excess tax deduction is reflected in additional paid-in-capital. Pursuant to GAAP, the Company’s deferred tax asset related to net operating loss carryforward is net of the unrealized tax benefit from stock-based compensation.
Treasury Stock
Treasury stock shares represent shares withheld by the Company equivalent to the payroll tax withholding obligations due from employees upon the vesting of restricted stock awards. The Company includes the withheld shares as treasury stock on its Consolidated Balance Sheet and separately pays the payroll tax obligation. These retained shares are not part of a publicly announced program to repurchase shares of the Company’s common stock and are accounted for at cost. The Company does not have a publicly announced program to repurchase shares of its common stock.
Income Taxes
The Company’s provision for taxes includes both federal and state taxes. The Company records its federal income taxes in accordance with accounting for income taxes under GAAP which results in the recognition of deferred tax assets and liabilities for the expected future tax consequences of temporary differences between the book carrying amounts and the tax basis of assets and liabilities. Deferred tax assets and liabilities are measured using enacted tax rates expected to apply to taxable income in the years in which those temporary differences and carryforwards are expected to be recovered or settled. The effect on deferred tax assets and liabilities of a change in tax rates is recognized in income in the period that includes the enactment date. A valuation allowance is established to reduce deferred tax assets if it is more likely than not that the related tax benefits will not be realized.
The Company applies significant judgment in evaluating its tax positions and estimating its provision for income taxes. During the ordinary course of business, there are many transactions and calculations for which the ultimate tax
90
determination is uncertain. The actual outcome of these future tax consequences could differ significantly from the Company’s estimates, which could impact its financial position, results of operations and cash flows.
The Company also accounts for uncertainty in income taxes recognized in the financial statements in accordance with GAAP by prescribing a recognition threshold and measurement attribute for a tax position taken or expected to be taken in a tax return. Authoritative guidance for accounting for uncertainty in income taxes requires that the Company recognize the financial statement benefit of a tax position only after determining that the relevant tax authority would more likely than not sustain the position following an audit. For tax positions meeting the more-likely-than-not threshold, the amount recognized in the financial statements is the largest benefit that has a greater than 50% likelihood of being realized upon ultimate settlement with the relevant tax authority. The Company did not have any uncertain tax positions outstanding and, as such, did not record a liability for the years ended December 31, 2016 and 2015. All deferred tax assets and liabilities, along with any related valuation allowance, are classified as noncurrent on the Company’s Consolidated Balance Sheet.
Recent Accounting Pronouncements
Revenue Recognition
In May 2014, the FASB issued Accounting Standards Update No. 2014-09, Revenue from Contracts with Customers (“ASU 2014-09”). The objective of ASU 2014-09 is greater consistency and comparability across industries by using a five-step model to recognize revenue from customer contracts. ASU 2014-09 also contains some new disclosure requirements under GAAP. In August 2015, the FASB issued Accounting Standards Update No. 2015-14, Deferral of the Effective Date (“ASU 2015-14”). ASU 2015-14 defers the effective date of the new revenue standard by one year, making it effective for annual reporting periods beginning after December 15, 2017, including interim periods within that reporting period. In 2016, the FASB issued additional accounting standards updates to clarify the implementation guidance of ASU 2014-09. The Company is currently evaluating the effect that adopting this guidance will have on its financial position, cash flows and results of operations.
Inventory
In July 2015, the FASB issued Accounting Standards Update No. 2015-11, Simplifying the Measurement of Inventory (“ASU 2015-11”). ASU 2015-11 changes the inventory measurement principle from lower of cost or market to lower of cost and net realizable value for entities using the first-in, first out (FIFO) or average cost methods. ASU 2015-11 is effective for fiscal years beginning after December 15, 2016, including interim periods within those years. The Company does not expect the adoption of this guidance to have a material impact on its financial position, cash flows or results of operations.
Financial Instruments
In January 2016, the FASB issued Accounting Standards Update No. 2016-01, Recognition and Measurement of Financial Assets and Financial Liabilities (“ASU 2016-01”), which requires that most equity instruments be measured at fair value with subsequent changes in fair value recognized in net income. ASU 2016-01 also impacts financial liabilities under the fair value option and the presentation and disclosure requirements for financial instruments. ASU 2016-01 does not apply to equity method investments or investments in consolidated subsidiaries. ASU 2016-01 is effective for fiscal years beginning after December 15, 2017, including interim periods within those years. The Company is currently evaluating the effect that adopting this guidance will have on its financial position, cash flows and results of operations.
Leases
In February 2016, the FASB issued Accounting Standards Update No. 2016-02, Leases (“ASU 2016-02”), which requires a lessee to recognize lease payment obligations and a corresponding right-of-use asset to be measured at fair value on the balance sheet. ASU 2016-02 also requires certain qualitative and quantitative disclosures about the amount, timing and uncertainty of cash flows arising from leases. ASU 2016-02 is effective for fiscal years beginning after December 15, 2018, including interim periods within those years. The Company is currently evaluating the effect that adopting this guidance will have on its financial position, cash flows and results of operations.
Embedded Derivatives
In March 2016, the FASB issued Accounting Standards Update No. 2016-06, Contingent Put and Call Options in Debt Instruments (“ASU 2016-06”), which clarifies what steps are required when assessing whether the economic characteristics and risks of call (put) options are clearly and closely related to the economic characteristics and risks of their debt hosts, which is one of the criteria for bifurcating an embedded derivative. ASU 2016-06 is effective for fiscal years beginning after December 15, 2016, including interim periods within those years. The Company does not expect the adoption of this guidance to have a material impact on its financial position, cash flows or results of operations.
91
Stock-Based Compensation
In March 2016, the FASB issued Accounting Standards Update No. 2016-09, Improvements to Employee Share-Based Payment Accounting (“ASU 2016-09”), which updates several aspects of the accounting for share-based payment transactions, including recognition of excess tax benefits and deficiencies, the classification of those excess tax benefits on the statement of cash flows, an accounting policy election for forfeitures, the amount an employer can withhold to cover income taxes and still qualify for equity classification and the classification of those taxes paid on the statement of cash flows. ASU 2016-09 is effective for fiscal years beginning after December 15, 2016, including interim periods within those years. The Company will elect to remove forfeiture rates and record a cumulative-effect adjustment to equity at the beginning of 2017 when the guidance is adopted and does not expect the adoption of this guidance to have a material impact on its cash flows or results of operations.
Statement of Cash Flows
In August 2016, the FASB issued Accounting Standards Update No. 2016-15, Statement of Cash Flows (“ASU 2016-15”), which is intended to reduce diversity in practice in how certain transactions are classified in the statement of cash flows. ASU 2016-15 is effective for fiscal years beginning after December 15, 2017, including interim periods within those years. The adoption of this guidance will not impact the Company’s financial position or results of operations but could result in presentation changes on its statement of cash flows.
Business Combinations
In January 2017, the FASB issued Accounting Standards Update No. 2017-01, Clarifying the Definition of a Business (“ASU 2017-01”), which provides guidance to assist entities with evaluating whether transactions should be accounted for as acquisitions (or disposals) of assets or businesses. ASU 2017-01 requires entities to use a screen test to determine when an integrated set of assets and activities is not a business or if the integrated set of assets and activities needs to be further evaluated against the framework. ASU 2017-01 is effective for fiscal years beginning after December 15, 2017, including interim periods within those years. The Company is currently evaluating the effect that adopting this guidance will have on its financial position, cash flows and results of operations.
3. Fair Value Measurements
In accordance with the FASB’s authoritative guidance on fair value measurements, the Company’s financial assets and liabilities are measured at fair value on a recurring basis. The Company’s financial instruments, including certain cash and cash equivalents, accounts receivable, accounts payable and other payables, are carried at cost, which approximates their respective fair market values due to their short-term maturities. The Company recognizes its non-financial assets and liabilities, such as ARO (see Note 9 — Asset Retirement Obligations) and proved oil and natural gas properties upon impairment (see Note 5 — Property, Plant and Equipment), at fair value on a non-recurring basis.
As defined in the authoritative guidance, fair value is the price that would be received to sell an asset or paid to transfer a liability in an orderly transaction between market participants at the measurement date (exit price). To estimate fair value, the Company utilizes market data or assumptions that market participants would use in pricing the asset or liability, including assumptions about risk and the risks inherent in the inputs to the valuation technique. These inputs can be readily observable, market corroborated or generally unobservable.
The authoritative guidance establishes a fair value hierarchy that prioritizes the inputs used to measure fair value. The hierarchy gives the highest priority to unadjusted quoted prices in active markets for identical assets or liabilities (“Level 1” measurements) and the lowest priority to unobservable inputs (“Level 3” measurements). The three levels of the fair value hierarchy are as follows:
Level 1 — Unadjusted quoted prices are available in active markets for identical assets or liabilities as of the reporting date. Active markets are those in which transactions for the asset or liability occur in sufficient frequency and volume to provide pricing information on an ongoing basis.
Level 2 — Pricing inputs, other than unadjusted quoted prices in active markets included in Level 1, are either directly or indirectly observable as of the reporting date. Level 2 includes those financial instruments that are valued using models or other valuation methodologies. These models are primarily industry-standard models that consider various assumptions, including quoted forward prices for commodities, time value, volatility factors and current market and contractual prices for the underlying instruments, as well as other relevant economic measures. Substantially all of these assumptions are observable in the marketplace throughout the full term of the instrument and can be derived from observable data or are supported by observable levels at which transactions are executed in the marketplace.
Level 3 — Pricing inputs are generally less observable from objective sources, requiring internally developed valuation methodologies that result in management’s best estimate of fair value.
92
Financial Assets and Liabilities
Financial assets and liabilities are classified in their entirety based on the lowest level of input that is significant to the fair value measurement. The Company’s assessment of the significance of a particular input requires judgment and may affect the valuation of fair value assets and liabilities and their placement within the fair value hierarchy levels. The following tables set forth by level within the fair value hierarchy the Company’s financial assets and liabilities that were accounted for at fair value on a recurring basis:
Fair value at December 31, 2016 | |||||||||||||||
Level 1 | Level 2 | Level 3 | Total | ||||||||||||
(In thousands) | |||||||||||||||
Assets: | |||||||||||||||
Money market funds | $ | 141 | $ | — | $ | — | $ | 141 | |||||||
Commodity derivative instruments (see Note 4) | — | 362 | — | 362 | |||||||||||
Total assets | $ | 141 | $ | 362 | $ | — | $ | 503 | |||||||
Liabilities: | |||||||||||||||
Commodity derivative instruments (see Note 4) | — | 72,183 | — | 72,183 | |||||||||||
Total liabilities | $ | — | $ | 72,183 | $ | — | $ | 72,183 | |||||||
Fair value at December 31, 2015 | |||||||||||||||
Level 1 | Level 2 | Level 3 | Total | ||||||||||||
(In thousands) | |||||||||||||||
Assets: | |||||||||||||||
Money market funds | $ | 742 | $ | — | $ | — | $ | 742 | |||||||
Commodity derivative instruments (see Note 4) | — | 155,473 | — | 155,473 | |||||||||||
Total assets | $ | 742 | $ | 155,473 | $ | — | $ | 156,215 | |||||||
The Level 1 instruments presented in the tables above consist of money market funds included in cash and cash equivalents on the Company’s Consolidated Balance Sheet at December 31, 2016 and 2015. The Company’s money market funds represent cash equivalents backed by the assets of high-quality major banks and financial institutions. The Company identifies the money market funds as Level 1 instruments because the money market funds have daily liquidity, quoted prices for the underlying investments can be obtained, and there are active markets for the underlying investments.
The Level 2 instruments presented in the tables above consist of commodity derivative instruments, which include oil and natural gas swaps and collars. The fair values of the Company’s commodity derivative instruments are based upon a third-party preparer’s calculation using mark-to-market valuation reports provided by the Company’s counterparties for monthly settlement purposes to determine the valuation of its derivative instruments. The Company has the third-party preparer evaluate other readily available market prices for its derivative contracts as there is an active market for these contracts. The third-party preparer performs its independent valuation using a moment matching method similar to Turnbull-Wakeman for Asian options. The significant inputs used are crude oil prices, volatility, skew, discount rate and the contract terms of the derivative instruments. However, the Company does not have access to the specific proprietary valuation models or inputs used by its counterparties or third-party preparer. The Company compares the third-party preparer’s valuation to counterparty valuation statements, investigating any significant differences, and analyzes monthly valuation changes in relation to movements in crude oil and natural gas forward price curves. The determination of the fair value for derivative instruments also incorporates a credit adjustment for non-performance risk, as required by GAAP. The Company calculates the credit adjustment for derivatives in an asset position using current credit default swap values for each counterparty. The credit adjustment for derivatives in a net liability position is based on the Company’s market credit spread. Based on these calculations, the Company recorded an adjustment to reduce the fair value of its net derivative liability by $2.0 million at December 31, 2016 and an adjustment to reduce the fair value of its net derivative asset by $0.3 million at December 31, 2015.
There were no transfers between fair value levels during the years ended December 31, 2016 and 2015.
4. Derivative Instruments
The Company utilizes derivative financial instruments to manage risks related to changes in crude oil and natural gas prices. The Company’s crude oil and natural gas contracts will settle monthly based on the average NYMEX West Texas Intermediate crude oil index price (“WTI”) and the average NYMEX Henry Hub natural gas index price (“Henry Hub”), respectively. At December 31, 2016, the Company utilized swaps and two-way and three-way costless collar options to reduce the volatility of oil and natural gas prices on a significant portion of its future expected oil and natural gas production. A swap
93
is a sold call and a purchased put established at the same price (both ceiling and floor), which the Company will receive for the volumes under contract. A two-way collar is a combination of options: a sold call and a purchased put. The purchased put establishes a minimum price (floor) and the sold call establishes a maximum price (ceiling) the Company will receive for the volumes under contract. A three-way collar is a combination of options: a sold call, a purchased put and a sold put. The purchased put establishes a minimum price (floor), unless the market price falls below the sold put (sub-floor), at which point the minimum price would be the NYMEX index price plus the difference between the purchased put and the sold put strike price. The sold call establishes a maximum price (ceiling) the Company will receive for the volumes under contract.
All derivative instruments are recorded on the Company’s Consolidated Balance Sheet as either assets or liabilities measured at their fair value (see Note 3 – Fair Value Measurements). The Company has not designated any derivative instruments as hedges for accounting purposes and does not enter into such instruments for speculative trading purposes. If a derivative does not qualify as a hedge or is not designated as a hedge, the changes in fair value are recognized in the other income (expense) section of the Company’s Consolidated Statement of Operations as a net gain or loss on derivative instruments. The Company’s cash flow is only impacted when the actual settlements under the derivative contracts result in making a payment to or receiving a payment from the counterparty. These cash settlements represent the cumulative gains and losses on the Company’s derivative instruments and do not include a recovery of costs that were paid to acquire or modify the derivative instruments that were settled. Cash settlements are reflected as investing activities in the Company’s Consolidated Statement of Cash Flows.
At December 31, 2016, the Company had the following outstanding commodity derivative instruments:
Commodity | Settlement Period | Derivative Instrument | Volumes | Weighted Average Prices | Fair Value Asset (Liability) | |||||||||||||||||||||||
Swap | Sub-Floor | Floor | Ceiling | |||||||||||||||||||||||||
(In thousands) | ||||||||||||||||||||||||||||
Crude oil | 2017 | Swaps | 7,369,000 | Bbl | $ | 49.48 | $ | (44,830 | ) | |||||||||||||||||||
Crude oil | 2017 | Two-way collar | 2,672,000 | Bbl | $ | 46.25 | $ | 54.37 | (10,674 | ) | ||||||||||||||||||
Crude oil | 2017 | Three-way collar | 2,004,000 | Bbl | $ | 31.67 | $ | 45.83 | $ | 59.94 | (3,077 | ) | ||||||||||||||||
Crude oil | 2018 | Swaps | 2,440,000 | Bbl | $ | 52.93 | (8,475 | ) | ||||||||||||||||||||
Crude oil | 2018 | Two-way collar | 582,000 | Bbl | $ | 48.40 | $ | 55.13 | (2,101 | ) | ||||||||||||||||||
Crude oil | 2018 | Three-way collar | 186,000 | Bbl | $ | 31.67 | $ | 45.83 | $ | 59.94 | (446 | ) | ||||||||||||||||
Crude oil | 2019 | Swaps | 155,000 | Bbl | $ | 53.88 | (332 | ) | ||||||||||||||||||||
Crude oil | 2019 | Two-way collar | 31,000 | Bbl | $ | 50.00 | $ | 55.70 | (86 | ) | ||||||||||||||||||
Natural gas | 2017 | Swaps | 5,475,000 | MMBtu | $ | 3.32 | (1,697 | ) | ||||||||||||||||||||
Natural gas | 2018 | Swaps | 730,000 | MMBtu | $ | 2.99 | (103 | ) | ||||||||||||||||||||
$ | (71,821 | ) | ||||||||||||||||||||||||||
The following table summarizes the location and amounts of gains and losses from the Company’s commodity derivative instruments recorded in the Company’s Consolidated Statement of Operations for the periods presented:
Year Ended December 31, | ||||||||||||
Statement of Operations Location | 2016 | 2015 | 2014 | |||||||||
(In thousands) | ||||||||||||
Net gain (loss) on derivative instruments | $ | (105,317 | ) | $ | 210,376 | $ | 327,011 | |||||
In accordance with the FASB’s authoritative guidance on disclosures about offsetting assets and liabilities, the Company is required to disclose both gross and net information about instruments and transactions eligible for offset in the statement of financial position as well as instruments and transactions subject to an agreement similar to a master netting agreement. The Company’s derivative instruments are presented as assets and liabilities on a net basis by counterparty, as all counterparty contracts provide for net settlement. No margin or collateral balances are deposited with counterparties, and as such, gross amounts are offset to determine the net amounts presented in the Company’s Consolidated Balance Sheet.
94
The following tables summarize the location and fair value of all outstanding commodity derivative instruments recorded in the Company’s Consolidated Balance Sheet:
December 31, 2016 | ||||||||||||||
Commodity | Balance Sheet Location | Gross Recognized Asset/Liabilities | Gross Amount Offset | Net Recognized Fair Value Asset/Liability | ||||||||||
(In thousands) | ||||||||||||||
Derivative assets: | ||||||||||||||
Commodity contracts | Derivative instruments — current assets | $ | 482 | $ | (120 | ) | $ | 362 | ||||||
Total derivatives assets | $ | 482 | $ | (120 | ) | $ | 362 | |||||||
Derivative liabilities: | ||||||||||||||
Commodity contracts | Derivative instruments — current liabilities | $ | 66,838 | $ | (6,369 | ) | $ | 60,469 | ||||||
Commodity contracts | Derivative instruments — non-current liabilities | 14,164 | (2,450 | ) | 11,714 | |||||||||
Total derivatives liabilities | $ | 81,002 | $ | (8,819 | ) | $ | 72,183 | |||||||
December 31, 2015 | ||||||||||||||
Commodity | Balance Sheet Location | Gross Recognized Asset/Liabilities | Gross Amount Offset | Net Recognized Fair Value Asset/Liability | ||||||||||
(In thousands) | ||||||||||||||
Derivative assets: | ||||||||||||||
Commodity contracts | Derivative instruments — current assets | $ | 139,697 | $ | — | $ | 139,697 | |||||||
Commodity contracts | Derivative instruments — non-current assets | 15,776 | — | 15,776 | ||||||||||
Total derivatives assets | $ | 155,473 | $ | — | $ | 155,473 | ||||||||
5. Property, Plant and Equipment
The following table sets forth the Company’s property, plant and equipment:
December 31, | |||||||
2016 | 2015 | ||||||
(In thousands) | |||||||
Proved oil and gas properties(1) | $ | 6,476,833 | $ | 5,655,759 | |||
Less: Accumulated depreciation, depletion, amortization and impairment | (1,886,732 | ) | (1,428,427 | ) | |||
Proved oil and gas properties, net | 4,590,101 | 4,227,332 | |||||
Unproved oil and gas properties | 819,735 | 628,642 | |||||
Other property and equipment | 618,790 | 443,265 | |||||
Less: Accumulated depreciation | (109,059 | ) | (80,997 | ) | |||
Other property and equipment, net | 509,731 | 362,268 | |||||
Total property, plant and equipment, net | $ | 5,919,567 | $ | 5,218,242 | |||
(1) | Included in the Company’s proved oil and gas properties are estimates of future asset retirement costs of $42.9 million and $30.7 million at December 31, 2016 and 2015, respectively. |
Impairment. The Company reviews its proved oil and natural gas properties for impairment whenever events and circumstances indicate that a decline in the recoverability of their carrying value may have occurred. The Company estimates the expected undiscounted future cash flows of its proved oil and natural gas properties and then compares such amount to the carrying amount of the proved oil and natural gas properties to determine if the carrying amount is recoverable. If the carrying amount exceeds the estimated undiscounted future cash flows, the Company will adjust the carrying amount of the proved oil and natural gas properties to fair value. The factors used to determine fair value are subject to management’s judgment and expertise and include, but are not limited to, recent sales prices of comparable properties, the present value of future cash flows net of estimated operating and development costs using estimates of proved reserves, future commodity pricing, future production estimates, anticipated capital expenditures and various discount rates commensurate with the risk and current
95
market conditions associated with realizing the expected cash flows projected. These assumptions represent Level 3 inputs, as further discussed under Note 3 — Fair Value Measurements.
As of December 31, 2016, the Company sold certain proved oil and natural gas properties and other midstream properties (see Note 6 – Acquisitions and Divestiture). For the year ended December 31, 2016, the Company recorded an impairment charge of $3.6 million, of which $2.4 million was included in its midstream services segment and $1.1 million was included in its exploration and production segment, to adjust the carrying amount of these assets, net of the associated ARO liabilities, to their estimated fair value. For the year ended December 31, 2015, the Company had certain proved oil and natural gas properties held for sale (see Note 6 – Acquisitions and Divestitures). The Company recorded an impairment loss of $9.4 million, which was included in earnings in its exploration and production segment for the year ended December 31, 2015, to adjust the carrying amount of these assets, net of the associated ARO liabilities, of $25.9 million to their estimated fair value of $16.5 million. The fair value was determined based on the expected sales price, less costs to sell.
Due to lower expected commodity prices, the Company determined that the carrying amount exceeded expected undiscounted cash flows for certain legacy wells that were producing from conventional reservoirs such as the Madison, Red River and other formations in the Williston Basin other than the Bakken or Three Forks formations for the year ended December 31, 2014. As a result, these assets, with a carrying amount of $76.4 million, were written down to their fair value of $36.4 million, resulting in an impairment charge of $40.0 million, which was included in earnings in the Company’s exploration and production segment for the year ended December 31, 2014. The fair value of these assets was measured using valuation techniques that convert future cash flows to a single discounted amount. Significant inputs used to determine the fair value included estimates of: (i) reserves, (ii) future operating and development costs, (iii) future commodity prices, and (iv) a weighted average cost of capital rate based on the assumptions of a market participant. The market-based weighted average cost of capital rate is subjected to additional project-specific risking factors. For the year ended December 31, 2014, the underlying commodity prices embedded in the Company’s estimated cash flows were determined using NYMEX forward swap prices for five years, holding the fifth year price constant thereafter. As of December 31, 2015, a 3% inflation factor was applied to the underlying commodity prices and future operating and development costs after five years in the Company’s estimated cash flows.
In addition, as a result of expiring leases and periodic assessments of unproved properties, the Company recorded non-cash impairment charges on its unproved oil and gas properties of $1.1 million, $36.6 million, and $7.3 million for the years ended December 31, 2016, 2015 and 2014, respectively.
6. Acquisitions and Divestitures
Williston Basin Acquisition. On December 1, 2016, the Company completed a purchase and sale agreement with SM Energy Company (“SM Energy”), pursuant to which the Company agreed to purchase approximately 55,000 net acres in the Williston Basin for aggregate consideration of $765.8 million in cash, subject to further customary post-closing purchase price adjustments (the “Williston Basin Acquisition”). The Company funded the Williston Basin Acquisition with proceeds from the Company’s October 2016 issuance of its common shares and borrowings under its revolving credit facility.
The Williston Basin Acquisition qualified as a business combination, and as such, the Company estimated the fair value of the assets acquired and liabilities assumed as of the December 1, 2016 acquisition date. The fair value is the price that would be received to sell an asset or paid to transfer a liability in an orderly transaction between market participants at the measurement date (exit price). Fair value measurements also utilize assumptions of market participants. The Company used a discounted cash flow model and made market assumptions as to future commodity prices, projections of estimated quantities of oil and natural gas reserves, expectations for timing and amount of future development and operating costs, projections of future rates of production, expected recovery rates and risk adjusted discount rates. These assumptions represent Level 3 inputs, as further discussed under Note 3 — Fair Value Measurements. The Company recorded the assets acquired and liabilities assumed in the Williston Basin Acquisition at their estimated fair value of $765.8 million, which the Company considers to be representative of the price paid by a typical market participant. This measurement resulted in no goodwill or bargain purchase being recognized. The Williston Basin Acquisition is considered a taxable transaction; therefore, no deferred tax amounts were recognized at the acquisition date as the tax basis of the assets acquired and liabilities assumed were also recorded at fair value.
The following table summarizes the consideration paid, including customary close adjustments, for the Company’s acquisition and the fair value of the assets acquired and liabilities assumed as of the acquisition date. The purchase price allocation is preliminary and subject to adjustment, as the final closing statement will be completed in the second quarter of 2017.
96
At December 1, 2016 | |||
(In thousands) | |||
Consideration given to SM Energy: | |||
Cash | $ | 765,752 | |
Recognized amounts of identifiable assets acquired and liabilities assumed: | |||
Proved developed properties | $ | 421,138 | |
Proved undeveloped properties | 154,146 | ||
Unproved lease acquisition costs | 200,244 | ||
Other property and equipment | 204 | ||
Inventory | 974 | ||
Asset retirement obligations | (10,954 | ) | |
$ | 765,752 | ||
The results of operations for the Williston Basin Acquisition have been included in the Company’s consolidated financial statements since the December 1, 2016 closing date, including $14.6 million of total revenue and $5.9 million of operating income for the year ended December 31, 2016. In addition, the Company included $0.3 million of costs related to the Williston Basin Acquisition in general and administrative expenses on its Consolidated Statement of Operations for the year ended December 31, 2016.
Summarized below are the consolidated results of operations for the year ended December 31, 2016, on an unaudited pro forma basis, as if the acquisition and related financing had occurred on January 1, 2015. The unaudited pro forma financial information was derived from the historical consolidated statement of operations of the Company and the statement of revenues and direct operating expenses for the Williston Basin Acquisition properties, which were derived from the historical accounting records of the SM Energy. The unaudited pro forma financial information does not purport to be indicative of results of operations that would have occurred had the acquisition and related financing occurred on the basis assumed above, nor is such information indicative of the Company’s expected future results of operations.
Year Ended December 31, | |||||||
2016 | 2015 | ||||||
(In thousands) | |||||||
Unaudited | |||||||
Revenues | $ | 844,148 | $ | 991,722 | |||
Net income | (210,575 | ) | 265 | ||||
Acquisitions. The Company actively reviews acquisition opportunities on an ongoing basis and acquires additional acreage and producing assets in the Williston Basin to supplement our existing operations. In addition to the Williston Basin Acquisition, the Company spent $15.8 million, $28.8 million and $46.2 million to purchase certain acreage and producing assets through multiple transactions during the years ended December 31, 2016, 2015 and 2014, respectively.
2016 Divestiture. On April 1, 2016, the Company completed the sale of certain legacy wells that have been producing from conventional reservoirs such as the Madison, Red River and other formations in the Williston Basin other than the Bakken or Three Forks formations for cash proceeds of $12.3 million, which includes customary post close adjustments, and a $4.0 million 10% secured promissory note due in March 2017 (the “2016 Divestiture”). The 2016 Divestiture primarily consisted of oil and gas properties in the Company’s exploration and production segment and included certain other property and equipment in the Company’s midstream segment.
For the years ended December 31, 2016 and 2015, the Company recorded impairment charges of $3.6 million and $9.4 million, respectively, which were included in impairment on the Company’s Consolidated Statement of Operations, to adjust the carrying amount of these assets to their estimated fair value, determined based on the expected sales price, less costs to sell.
Net assets held for sale represent the assets that were expected to be sold, net of liabilities, which were expected to be assumed by the purchaser. As of December 31, 2015, the assets sold in the 2016 Divestiture were classified as held for sale in the Company’s exploration and production segment. The Company did not have assets classified as held for sale as of December 31, 2016. The following table presents balance sheet data related to the assets held for sale as of December 31, 2015:
97
December 31, 2015 | |||
(In thousands) | |||
Assets: | |||
Oil and gas properties | $ | 120,926 | |
Less: accumulated depreciation, depletion, amortization and impairment | (94,198 | ) | |
Total assets | $ | 26,728 | |
Liabilities: | |||
Asset retirement obligation | $ | (10,228 | ) |
Total liabilities | $ | (10,228 | ) |
Net assets | $ | 16,500 | |
2014 Divestiture. On March 5, 2014, the Company completed the sale of certain non-operated properties in and around its Sanish position for cash proceeds of $324.9 million, which includes customary post close adjustments. The Company recognized a $187.0 million gain on sale of properties in its Consolidated Statement of Operations for the year ended December 31, 2014. The transaction was structured as an Internal Revenue Code Section 1031 like-kind exchange for tax purposes, and as such did not give rise to any current taxable gain.
7. Additional Balance Sheet Information
Certain balance sheet amounts are comprised of the following:
December 31, | |||||||
2016 | 2015 | ||||||
(In thousands) | |||||||
Accounts receivable, net | |||||||
Trade accounts | $ | 137,065 | $ | 96,495 | |||
Joint interest accounts | 40,322 | 64,344 | |||||
Other accounts | 28,257 | 36,570 | |||||
Total | 205,644 | 197,409 | |||||
Allowance for doubtful accounts | (1,309 | ) | — | ||||
Total accounts receivable, net | $ | 204,335 | $ | 197,409 | |||
Inventories | |||||||
Crude oil inventory | $ | 7,086 | $ | 6,152 | |||
Equipment and materials | 3,562 | 4,920 | |||||
Total inventory | $ | 10,648 | $ | 11,072 | |||
Accrued liabilities | |||||||
Accrued capital costs | $ | 69,311 | $ | 110,313 | |||
Accrued lease operating expenses | 22,221 | 18,448 | |||||
Accrued general and administrative expenses | 19,061 | 18,404 | |||||
Accrued midstream and well services operating expenses | 2,365 | 13,517 | |||||
Other accrued liabilities | 6,215 | 6,987 | |||||
Total accrued liabilities | $ | 119,173 | $ | 167,669 | |||
Revenues and production payable | |||||||
Revenue suspense | $ | 55,484 | $ | 65,828 | |||
Royalties payable | 73,033 | 52,715 | |||||
Production taxes payable | 11,220 | 13,813 | |||||
Total revenue and production payables | $ | 139,737 | $ | 132,356 | |||
8. Long-Term Debt
The Company’s long-term debt consists of the following:
December 31, | |||||||
2016 | 2015 | ||||||
(In thousands) | |||||||
Senior secured revolving line of credit | $ | 363,000 | $ | 138,000 | |||
Senior unsecured notes | |||||||
7.25% senior unsecured notes due February 1, 2019 | 54,275 | 400,000 | |||||
6.5% senior unsecured notes due November 1, 2021 | 395,501 | 400,000 | |||||
6.875% senior unsecured notes due March 15, 2022 | 937,080 | 1,000,000 | |||||
6.875% senior unsecured notes due January 15, 2023 | 366,094 | 400,000 | |||||
2.625% senior unsecured convertible notes due September 15, 2023 | 300,000 | — | |||||
Total principal of senior unsecured notes | 2,052,950 | 2,200,000 | |||||
Less: unamortized deferred financing costs on senior unsecured notes | (28,268 | ) | (35,416 | ) | |||
Less: unamortized debt discount on senior unsecured convertible notes | (90,468 | ) | — | ||||
Total long-term debt | $ | 2,297,214 | $ | 2,302,584 | |||
The carrying amount of the Company’s long-term debt reported in the Consolidated Balance Sheet at December 31, 2016 is $2,297.2 million, which includes $2,053.0 million of senior unsecured notes, reductions for the unamortized debt discount related to the equity component of the senior unsecured convertible notes and the unamortized deferred financing costs on the senior unsecured notes of $90.5 million and $28.3 million, respectively, and $363.0 million of borrowings under the Company’s revolving credit facility. The Company’s revolving credit facility is recorded at a value that approximates its fair value since its variable interest rate is tied to current market rates. The fair value of the Company’s senior unsecured notes, which are publicly traded and therefore categorized as Level 1 liabilities, is $2,209.9 million at December 31, 2016.
The Company has $54.3 million and $395.5 million of Notes maturing in 2019 and 2021, respectively, and indebtedness under its revolving credit facility that becomes due in 2020. The Company does not have any other debt that matures within the five years ending December 31, 2022.
Senior secured revolving line of credit. The Company has a senior secured revolving line of credit (the “Credit Facility”) of $2,500.0 million as of December 31, 2016, which has a maturity date of April 13, 2020, provided that the 7.25% senior unsecured notes due February 1, 2019 (the “2019 Notes”), of which $54.3 million is outstanding, are retired or refinanced 90 days prior to their maturity. The Credit Facility is restricted to the borrowing base, which is reserve-based and subject to semi-annual redeterminations on April 1 and October 1 of each year. On February 23, 2016, the lenders under the Credit Facility (the “Lenders”) completed their regular semi-annual redetermination of the borrowing base scheduled for April 1, 2016, resulting in a decrease in the borrowing base and aggregate elected commitment from $1,525.0 million to $1,150.0 million.
Borrowings under the Credit Facility are collateralized by perfected first priority liens and security interests on substantially all of the Company’s assets, including mortgage liens on oil and natural gas properties having at least 90% (as of December 31, 2016) of the reserve value as determined by reserve reports.
Borrowings under the Credit Facility are subject to varying rates of interest based on (1) the total outstanding borrowings (including the value of all outstanding letters of credit) in relation to the borrowing base and (2) whether the loan is a London interbank offered rate (“LIBOR”) loan or a domestic bank prime interest rate loan (defined in the Credit Facility as an Alternate Based Rate or “ABR” loan). As of December 31, 2016, any outstanding LIBOR and ABR loans would have borne their respective interest rates plus the applicable margin indicated in the following table:
98
Ratio of Total Outstanding Borrowings to Borrowing Base | Applicable Margin for LIBOR Loans | Applicable Margin for ABR Loans | |||
Less than .25 to 1 | 1.50 | % | 0.00 | % | |
Greater than or equal to .25 to 1 but less than .50 to 1 | 1.75 | % | 0.25 | % | |
Greater than or equal to .50 to 1 but less than .75 to 1 | 2.00 | % | 0.50 | % | |
Greater than or equal to .75 to 1 but less than .90 to 1 | 2.25 | % | 0.75 | % | |
Greater than or equal to .90 to 1 | 2.50 | % | 1.00 | % | |
An ABR loan may be repaid at any time before the scheduled maturity of the Credit Facility upon the Company providing advance notification to the Lenders. Interest is paid quarterly on ABR loans based on the number of days an ABR loan is outstanding as of the last business day in March, June, September and December. The Company has the option to convert an ABR loan to a LIBOR-based loan upon providing advance notification to the Lenders. The minimum available loan term is one month and the maximum available loan term is six months for LIBOR-based loans. Interest for LIBOR loans is paid upon maturity of the loan term. Interim interest is paid every three months for LIBOR loans that have loan terms greater than three months. At the end of a LIBOR loan term, the Credit Facility allows the Company to elect to repay the borrowing, continue a LIBOR loan with the same or differing loan term or convert the borrowing to an ABR loan.
On a quarterly basis, the Company also pays a 0.375% (as of December 31, 2016) annualized commitment fee on the average amount of borrowing base capacity not utilized during the quarter and fees calculated on the average amount of letter of credit balances outstanding during the quarter.
As of December 31, 2016, the Credit Facility contained covenants that included, among others:
• | a prohibition against incurring debt, subject to permitted exceptions; |
• | a prohibition against making dividends, distributions and redemptions, subject to permitted exceptions; |
• | a prohibition against making investments, loans and advances, subject to permitted exceptions; |
• | restrictions on creating liens and leases on the assets of the Company and its subsidiaries, subject to permitted exceptions; |
• | restrictions on merging and selling assets outside the ordinary course of business; |
• | restrictions on use of proceeds, investments, transactions with affiliates or change of principal business; |
• | a provision limiting oil and natural gas derivative financial instruments; |
• | a requirement that the Company maintain a ratio of consolidated EBITDAX (as defined in the Credit Facility) to consolidated Interest Expense (as defined in the Credit Facility) of no less than 2.5 to 1.0 for the four quarters ended on the last day of each quarter; and |
• | a requirement that the Company maintain a Current Ratio (as defined in the Credit Facility) of consolidated current assets (including unused borrowing base committed capacity and with exclusions as described in the Credit Facility) to consolidated current liabilities (with exclusions as described in the Credit Facility) of no less than 1.0 to 1.0 as of the last day of any fiscal quarter. |
The Credit Facility contains customary events of default. If an event of default occurs and is continuing, the Lenders may declare all amounts outstanding under the Credit Facility to be immediately due and payable.
As of December 31, 2016, the Company had $363.0 million of borrowings and $12.3 million of outstanding letters of credit issued under the Credit Facility, resulting in an unused borrowing base capacity of $774.7 million. As of December 31, 2016 and 2015, the weighted average interest rate on borrowings under the Credit Facility was 2.5% and 1.9%, respectively. The Company was in compliance with the financial covenants of the Credit Facility as of December 31, 2016.
Senior unsecured notes. At December 31, 2016, the Company had $1,753.0 million principal amount of senior unsecured notes outstanding with maturities ranging from February 2019 to January 2023 and coupons ranging from 6.50% to 7.25% (the “Senior Notes”). Prior to certain dates, the Company has the option to redeem some or all of the Senior Notes for cash at certain redemption prices equal to a certain percentage of their principal amount plus an applicable make-whole premium and accrued and unpaid interest to the redemption date. The 2019 Notes are currently redeemable for cash at a redemption price equal to par. The Company estimates that the fair value of these redemption options is immaterial at December 31, 2016 and 2015.
99
The indentures governing the Senior Notes restrict the Company’s ability and the ability of certain of the Company’s subsidiaries to: (i) incur additional debt or enter into sale and leaseback transactions; (ii) pay distributions on, redeem or repurchase equity interests; (iii) make certain investments; (iv) incur liens; (v) enter into transactions with affiliates; (vi) merge or consolidate with another company; and (vii) transfer and sell assets. These covenants are subject to a number of important exceptions and qualifications. If at any time when the Company’s Senior Notes are rated investment grade by both Moody’s Investors Service, Inc. and Standard & Poor’s Ratings Services and no default (as defined in the indentures) has occurred and is continuing, many of such covenants will terminate and the Company will cease to be subject to such covenants.
Repurchases of senior unsecured notes. On September 28, 2016, the Company completed its tender offers to repurchase certain outstanding Senior Notes (the “Tender Offers”). As a result of the Tender Offers, the Company repurchased an aggregate principal amount of $362.4 million of its outstanding Senior Notes, consisting of $344.7 million principal amount of its 2019 Notes, $2.2 million principal amount of its 6.5% senior unsecured notes due November 2021 (the “2021 Notes”), $3.4 million principal amount of its 6.875% senior unsecured notes due March 2022 (the “2022 Notes”) and $12.1 million principal amount of its 6.875% senior unsecured notes due January 2023 (the “2023 Notes”), for an aggregate cost of $371.4 million, including accrued interest and fees for the year ended December 31, 2016.
In addition to the Tender Offers, the Company repurchased an aggregate principal amount of $84.6 million of its outstanding Senior Notes, consisting of $1.0 million principal amount of its 2019 Notes, $2.3 million principal amount of its 2021 Notes, $59.5 million principal amount of its 2022 Notes and $21.8 million principal amount of its 2023 Notes, for an aggregate cost of $64.5 million, including accrued interest and fees, for the year ended December 31, 2016.
For the year ended December 31, 2016, the Company recognized a pre-tax gain of $4.7 million related to these repurchases, including the Tender Offers, which were net of unamortized deferred financing costs write-offs of $6.4 million, and are reflected in gain on extinguishment of debt in the Company’s Consolidated Statement of Operations.
Senior unsecured convertible notes. In September 2016, the Company issued $300.0 million of 2.625% senior unsecured convertible notes due September 2023 (the “Senior Convertible Notes”), which resulted in aggregate net proceeds to the Company of $291.9 million, after deducting underwriting discounts and commissions and estimated offering expenses. The Company used the proceeds from the Senior Convertible Notes to fund the repurchase of certain outstanding Senior Notes through the Tender Offers. The Senior Convertible Notes will mature on September 15, 2023 unless earlier converted in accordance with their terms.
The Company has the option to settle conversions of these notes with cash, shares of common stock or a combination of cash and common stock at its election. The Company’s intent is to settle the principal amount of the Senior Convertible Notes in cash upon conversion. Prior to March 15, 2023, the Senior Convertible Notes will be convertible only under the following circumstances: (i) during any calendar quarter commencing after the calendar quarter ending on September 30, 2016 (and only during such calendar quarter), if the last reported sale price of the Company’s common stock for at least 20 trading days (whether or not consecutive) during the period of 30 consecutive trading days ending on the last trading day of the immediately preceding calendar quarter is greater than or equal to 130% of the conversion price on each applicable trading day; (ii) during the five business day period after any five consecutive trading day period (the “Measurement Period”) in which the trading price per $1,000 principal amount of the Senior Convertible Notes for each trading day of the Measurement Period is less than 98% of the product of the last reported sale price of the Company’s common stock and the conversion rate on each such trading day; or (iii) upon the occurrence of specified corporate events, including certain distributions or a fundamental change. On or after March 15, 2023, the Senior Convertible Notes will be convertible at any time until the second scheduled trading day immediately preceding their September 15, 2023 maturity date. The Senior Convertible Notes will be convertible at an initial conversion rate of 76.3650 shares of the Company’s common stock per $1,000 principal amount of the Senior Convertible Notes, which is equivalent to an initial conversion price of approximately $13.10. The conversion rate will be subject to adjustment in some events but will not be adjusted for any accrued and unpaid interest. In addition, following certain corporate events that occur prior to the maturity date or a notice of redemption, the Company will increase the conversion rate for a holder who elects to convert its Senior Convertible Notes in connection with such corporate event or redemption in certain circumstances. As of December 31, 2016, none of the contingent conditions allowing holders of the Senior Convertible Notes to convert these notes had been met.
Upon issuance, the Company separately accounted for the liability and equity components of the Senior Convertible Notes in accordance with Accounting Standards Codification 470-20. The liability component was recorded at the estimated fair value of a similar debt instrument without the conversion feature. The difference between the principal amount of the Senior Convertible Notes and the estimated fair value of the liability component was recorded as a debt discount and will be amortized to interest expense over the term of the notes using the effective interest method, with an effective interest rate of 8.97% per annum. The fair value of the Senior Convertible Notes as of the issuance date was estimated at $206.8 million, resulting in a debt discount at inception of $93.2 million. The equity component, representing the value of the conversion option, was computed by deducting the fair value of the liability component from the initial proceeds of the Senior Convertible
100
Notes issuance. This equity component was recorded, net of deferred taxes and issuance costs, in additional paid-in capital and will not be remeasured as long as it continues to meet the conditions for equity classification.
Transaction costs related to the Senior Convertible Notes issuance were allocated to the liability and equity components based on their relative fair values. Issuance costs attributable to the liability component of $5.4 million were recorded in deferred financing costs within long-term debt on the Company’s Consolidated Balance Sheet and are being amortized to interest expense over the term of the Senior Convertible Notes using the effective interest method. Issuance costs attributable to the equity component of $2.4 million were recorded as a charge to additional paid-in capital on the Company’s Consolidated Balance Sheet.
Interest on the Senior Notes and the Senior Convertible Notes (collectively, the “Notes”) is payable semi-annually in arrears. The Notes are guaranteed on a senior unsecured basis by the Company, along with its material subsidiaries (the “Guarantors”), which are 100% owned by the Company. These guarantees are full and unconditional and joint and several among the Guarantors, subject to certain customary release provisions. The indentures governing the Notes contain customary events of default.
Deferred financing costs. As of December 31, 2016, the Company had $33.3 million of deferred financing costs related to the Notes and the Credit Facility. Deferred financing costs of $28.3 million related to the Notes are included in long-term debt on the Company’s Consolidated Balance Sheet as of December 31, 2016, and are being amortized over the respective terms of the Notes. Deferred financing costs of $5.1 million related to the Credit Facility are included in other assets on the Company’s Consolidated Balance Sheet at December 31, 2016, and are being amortized over the term of the Credit Facility. Amortization of deferred financing costs recorded for the year ended December 31, 2016, 2015 and 2014 was $9.8 million, $7.2 million and $6.4 million, respectively. These costs are included in interest expense on the Company’s Consolidated Statement of Operations. For the years ended December 31, 2016 and 2015, the Company’s interest expense also included $1.8 million and $0.5 million, respectively, for unamortized deferred financing costs related to the Credit Facility, which were written off in proportion to the decreases in the borrowing base. No deferred financing costs related to the Credit Facility were written off during the year ended December 31, 2014. Aforementioned, the gain on extinguishment of debt in the Company’s Consolidated Statement of Operations included unamortized deferred financing costs write-offs of $6.4 million related to the repurchased Notes for the year ended December 31, 2016. No deferred financing costs related to the Notes were written off during the years ended December 31, 2015 and 2014.
9. Asset Retirement Obligations
The following table reflects the changes in the Company’s ARO during the years ended December 31, 2016 and 2015:
Year Ended December 31, | |||||||
2016 | 2015 | ||||||
(In thousands) | |||||||
Asset retirement obligation — beginning of period | $ | 35,812 | $ | 42,549 | |||
Liabilities incurred during period(1) | 11,811 | 1,245 | |||||
Liabilities settled during period(2) | (480 | ) | (218 | ) | |||
Accretion expense during period(1)(3) | 1,973 | 2,223 | |||||
Revisions to estimates | 571 | 241 | |||||
Liabilities held for sale(4) | — | (10,228 | ) | ||||
Asset retirement obligation — end of period | $ | 49,687 | $ | 35,812 | |||
__________________
(1) | Includes costs for wells acquired in the Williston Basin Acquisition (see Note 6 – Acquisitions and Divestitures) as of December 31, 2016. |
(2) | Liabilities settled during the year ended December 31, 2016 included ARO related to the sold properties (see Note 6 – Acquisitions and Divestitures). |
(3) | Included in depreciation, depletion and amortization on the Company’s Consolidated Statement of Operations. |
(4) | Represents ARO related to the properties held for sale as of December 31, 2015 (see Note 6 – Acquisitions and Divestitures). |
At December 31, 2016 and 2015, the current portion of the total ARO balance was approximately $0.7 million and $0.5 million, respectively, and is included in accrued liabilities on the Company’s Consolidated Balance Sheet.
101
10. Income Taxes
The Company’s income tax expense (benefit) consists of the following:
Year Ended December 31, | |||||||||||
2016 | 2015 | 2014 | |||||||||
(In thousands) | |||||||||||
Current: | |||||||||||
Federal | $ | — | $ | (9 | ) | $ | 134 | ||||
State | — | — | — | ||||||||
— | (9 | ) | 134 | ||||||||
Deferred: | |||||||||||
Federal | (117,781 | ) | (11,667 | ) | 273,576 | ||||||
State | (10,757 | ) | (4,447 | ) | 33,881 | ||||||
(128,538 | ) | (16,114 | ) | 307,457 | |||||||
Total income tax expense (benefit) | $ | (128,538 | ) | $ | (16,123 | ) | $ | 307,591 | |||
The reconciliation of income taxes calculated at the U.S. federal tax statutory rate to the Company’s effective tax rate for the years ended December 31, 2016, 2015 and 2014, is set forth below:
Year Ended December 31, | ||||||||||||||||||||
2016 | 2015 | 2014 | ||||||||||||||||||
(%) | (In thousands) | (%) | (In thousands) | (%) | (In thousands) | |||||||||||||||
U.S. federal tax statutory rate | 35.00 | % | $ | (130,044 | ) | 35.00 | % | $ | (19,730 | ) | 35.00 | % | $ | 285,064 | ||||||
State income taxes, net of federal income tax benefit | 2.27 | % | (8,435 | ) | 5.11 | % | (2,883 | ) | 2.81 | % | 22,901 | |||||||||
Non-deductible stock-based compensation (shortfall) | (1.83 | )% | 6,808 | (10.17 | )% | 5,734 | — | % | — | |||||||||||
Other | (0.85 | )% | 3,133 | (1.34 | )% | 756 | (0.05 | )% | (374 | ) | ||||||||||
Annual effective tax expense (benefit) | 34.59 | % | $ | (128,538 | ) | 28.60 | % | $ | (16,123 | ) | 37.76 | % | $ | 307,591 | ||||||
The effective tax rate was lower for the years ended December 31, 2016 and 2015 due to the Company’s pre-tax loss and the impact of permanent differences. The permanent differences were primarily amounts expensed for book purposes versus the amounts deductible for income tax purposes related to stock-based compensation vesting during the year ended December 31, 2015 at stock prices lower than the grant date values. The impact of these permanent differences was partially offset by a reduction in the North Dakota statutory tax rate in 2015. For the year ended December 31, 2014, the Company’s effective tax rate differed from the federal statutory rate of 35% primarily due to state income taxes.
102
Significant components of the Company’s deferred tax assets and liabilities as of December 31, 2016 and 2015, were as follows:
Year Ended December 31, | |||||||
2016 | 2015 | ||||||
(In thousands) | |||||||
Deferred tax assets | |||||||
Net operating loss carryforward | $ | 228,279 | $ | 121,248 | |||
Bonus and stock-based compensation | 9,483 | 11,222 | |||||
Derivative instruments | 25,738 | — | |||||
Other tax attribute carryovers | 1,712 | 1,601 | |||||
Total deferred tax assets | 265,212 | 134,071 | |||||
Less valuation allowance | (1,344 | ) | — | ||||
Net deferred tax assets | 263,868 | 134,071 | |||||
Deferred tax liabilities | |||||||
Oil and natural gas properties | 744,977 | 696,498 | |||||
Derivative instruments | — | 45,728 | |||||
Other deferred tax liabilities | 32,420 | — | |||||
Total deferred tax liabilities | 777,397 | 742,226 | |||||
Total net deferred tax liabilities | $ | 513,529 | $ | 608,155 | |||
The Company generated a federal net operating tax loss of $411.1 million for the year ended December 31, 2016. The net operating loss carryforwards consist of $620.7 million of federal net operating loss carryforwards, which expire between 2030 and 2036, and $505.1 million of state net operating loss carryforwards, which expire between 2017 and 2036. The tax benefits of carryforwards are recorded as an asset to the extent that management assesses the utilization of such carryforwards to be more likely than not. When the future utilization of some portion of the carryforwards is determined not to be more likely than not, a valuation allowance is provided to reduce the recorded tax benefits from such assets. During the year ended December 31, 2016, the Company recorded a valuation allowance of $0.8 million and $0.6 million for Montana net operating losses and for federal charitable contribution carryovers, respectively, based on management’s assessment that it is more likely than not that these net deferred tax assets will not be realized prior to their expiration due to their short carryover periods, current economic conditions and expectations for the future. Management determined that a valuation allowance was not required for its U.S. federal and North Dakota tax net operating loss carryforwards as they are expected to be fully utilized before their expiration.
Pursuant to authoritative guidance, the Company’s $228.3 million deferred tax asset related to net operating loss carryforwards is net of $4.0 million of unrealized excess tax benefits related to excess stock-based compensation on federal and state net operating losses of $10.6 million and $8.6 million, respectively.
Accounting for uncertainty in income taxes prescribes a recognition threshold and measurement methodology for the financial statement recognition and measurement of a tax position taken or expected to be taken in a tax return. As of December 31, 2016, the Company had no unrecognized tax benefits. With respect to income taxes, the Company’s policy is to account for interest charges as interest expense and any penalties as tax expense in its Consolidated Statement of Operations. The Company files income tax returns in the U.S. federal jurisdiction and in North Dakota, Montana and Texas. The statute of limitation for the year ended December 31, 2016 will expire in 2020. The Company’s earliest open year in its key jurisdictions is 2014 for both the U.S. federal jurisdiction and various U.S. states, however, net operating losses originating in prior years are subject to examination when utilized.
11. Stock-Based Compensation
Restricted stock awards. The Company has granted restricted stock awards to employees and directors under its Amended and Restated 2010 Long Term Incentive Plan, the majority of which vest over a three-year period. The maximum number of shares available for grant under the Amended and Restated 2010 Long Term Incentive Plan is 16,050,000. The fair value of restricted stock grants is based on the closing sales price of the Company’s common stock on the date of grant. Compensation expense is recognized ratably over the requisite service period. The Company assumed annual forfeiture rates by employee group ranging from 0% to 20% based on the Company’s forfeiture history for this type of award.
103
The following table summarizes information related to restricted stock held by the Company’s employees and directors for the periods presented:
Shares | Weighted Average Grant Date Fair Value per Share | |||||
Non-vested shares outstanding December 31, 2015 | 1,841,149 | $ | 24.03 | |||
Granted | 3,407,900 | 5.63 | ||||
Vested | (1,046,521 | ) | 22.31 | |||
Forfeited | (221,755 | ) | 10.66 | |||
Non-vested shares outstanding December 31, 2016 | 3,980,773 | $ | 9.48 | |||
Stock-based compensation expense recorded for restricted stock awards was $20.0 million, $21.4 million and $18.2 million, respectively, for each of the years ended December 31, 2016, 2015 and 2014, and is included in general and administrative expenses on the Company’s Consolidated Statement of Operations. The fair value of awards vested was $6.9 million, $9.5 million and $18.3 million for the years ended December 31, 2016, 2015 and 2014, respectively. The weighted average grant date fair value of restricted stock awards granted was $5.63 per share, $14.28 per share and $42.55 per share for the years ended December 31, 2016, 2015 and 2014, respectively. Unrecognized expense as of December 31, 2016 for all outstanding restricted stock awards was $23.2 million and will be recognized over a weighted average period of 1.8 years.
Performance share units. The Company has granted PSUs to officers of the Company under its Amended and Restated 2010 Long Term Incentive Plan. The PSUs are awards of restricted stock units, and each PSU that is earned represents the right to receive one share of the Company’s common stock. The Company assumed annual forfeiture rates by employee group ranging from 3.3% to 4.6% based on the Company’s forfeiture history for the employee groups receiving PSUs.
The Company accounted for these PSUs as equity awards pursuant to the FASB’s authoritative guidance for share-based payments. The number of PSUs to be earned is subject to a market condition, which is based on a comparison of the total shareholder return (“TSR”) achieved with respect to shares of the Company’s common stock against the TSR achieved by a defined peer group at the end of the performance periods. Depending on the Company’s TSR performance relative to the defined peer group, award recipients will earn between 0% and 200% of the initial PSUs granted. The grant date fair value for each grant of PSUs is recognized on a straight-line basis over a four-year total performance period. All compensation expense related to the PSUs will be recognized if the requisite performance period is fulfilled, even if the market condition is not achieved.
The following table summarizes information related to PSUs held by the Company’s officers for the periods presented:
Units | Weighted Average Grant Date Fair Value per Unit | |||||
Non-vested PSUs at December 31, 2015 | 664,254 | $ | 22.96 | |||
Granted | 910,000 | 3.00 | ||||
Vested | (104,310 | ) | 37.98 | |||
Forfeited | (82,325 | ) | 9.83 | |||
Non-vested PSUs at December 31, 2016 | 1,387,619 | $ | 9.52 | |||
Stock-based compensation expense recorded for PSUs for the years ended December 31, 2016, 2015 and 2014 was $4.2 million, $3.9 million and $3.1 million, respectively, and is included in general and administrative expenses on the Company’s Consolidated Statement of Operations. The fair value of PSUs vested was $1.0 million and $0.8 million for the years ended December 31, 2016 and 2015, respectively. No PSUs vested during the year ended December 31, 2014. The weighted average grant date fair value of PSUs granted was $3.00 per share, $11.20 per share and $41.71 per share for the years ended December 31, 2016, 2015 and 2014, respectively. Unrecognized expense as of December 31, 2016 for all outstanding PSUs was $6.6 million and will be recognized over a weighted average period of 2.0 years.
The aggregate grant date fair value of the market-based awards was determined using a Monte Carlo simulation model, which results in an expected percentage of PSUs to be earned during the performance period. The Monte Carlo simulation model uses assumptions regarding random projections and must be repeated numerous times to achieve a probabilistic assessment. The key valuation assumptions for the Monte Carlo model are the forecast period, initial value, risk-free interest rate, volatility and correlation coefficients. The risk-free interest rate is the U.S. Treasury bond rate on the date of grant that corresponds to the total performance period. The initial value is the average of the volume weighted average prices
104
for the 30 trading days prior to the start of the performance cycle for the Company and each of its peers. Volatility is the standard deviation of the average percentage change in stock price over a historical period for the Company and each of its peers. The correlation coefficients are measures of the strength of the linear relationship between and amongst the Company and its peers estimated based on historical stock price data.
The following assumptions were used for the Monte Carlo model to determine the grant date fair value and associated stock-based compensation expense of the PSUs granted during the periods presented:
2016 | 2015 | 2014 | ||||||
Forecast period (years) | 4 | 4 | 4 | |||||
Risk-free interest rate | 1.25 | % | 0.99 | % | 1.12 | % | ||
Oasis stock price volatility | 59.38 | % | 50.11 | % | 44.49 | % | ||
The Monte Carlo simulation model resulted in an expected percentage of PSUs to be earned of 69%, 86% and 98% for the 2016, 2015 and 2014 grants, respectively.
Associated tax benefit. For the years ended December 31, 2016, 2015 and 2014, the Company had an associated tax benefit of $8.3 million, $8.7 million and $8.4 million, respectively, related to all stock-based compensation.
12. Common Stock
On October 21, 2016, the Company completed a public offering of 55,200,000 shares of its common stock (including 7,200,000 shares issued pursuant to the underwriters’ option to purchase additional common stock) at a purchase price to the public of $10.80 per share. Net proceeds from the offering were $583.9 million, after deducting underwriting discounts and commissions and offering expenses, of which $0.6 million is included in common stock and $583.3 million is included in additional paid-in capital on the Company’s Consolidated Balance Sheet. The Company used the net proceeds to fund a portion of the Williston Basin Acquisition.
On February 2, 2016, the Company completed a public offering of 39,100,000 shares of its common stock (including 5,100,000 shares issued pursuant to the underwriters’ option to purchase additional common stock) at an offering price of $4.685 per share. Net proceeds from the offering were $182.8 million, after deducting underwriting discounts and commissions and offering expenses, of which $0.4 million is included in common stock and $182.4 million is included in additional paid-in capital on the Company’s Consolidated Balance Sheet. The Company used the net proceeds for general corporate purposes.
On March 9, 2015, the Company completed a public offering of 36,800,000 shares of its common stock (including 4,800,000 shares issued pursuant to the underwriters’ option to purchase additional common stock) at an offering price of $12.80 per share. Net proceeds from the offering were $462.8 million, after deducting underwriting discounts and commissions and offering expenses, of which $0.4 million is included in common stock and $462.4 million is included in additional paid-in capital on the Company’s Consolidated Balance Sheet. The Company used the net proceeds to repay outstanding indebtedness under its Credit Facility and for general corporate purposes.
These offerings were made pursuant to an effective shelf registration statement on Form S-3 filed with the Securities and Exchange Commission (the “SEC”) on July 15, 2014.
13. Earnings (Loss) Per Share
Basic earnings (loss) per share is computed by dividing income available to common stockholders by the weighted average number of shares outstanding for the periods presented. The calculation of diluted earnings (loss) per share includes the potential dilutive impact of non-vested restricted shares, PSUs outstanding and contingently issuable shares of convertible debt during the periods presented, unless their effect is anti-dilutive. There are no adjustments made to income (loss) available to common stockholders in the calculation of diluted earnings (loss) per share.
The following is a calculation of the basic and diluted weighted average shares outstanding for the periods presented:
105
Year Ended December 31, | ||||||||
2016 | 2015 | 2014 | ||||||
(In thousands) | ||||||||
Basic weighted average common shares outstanding | 183,615 | 130,186 | 99,677 | |||||
Dilution effect of stock awards at end of period(1) | — | — | 688 | |||||
Diluted weighted average common shares outstanding | 183,615 | 130,186 | 100,365 | |||||
__________________
(1) | No unvested stock awards were included in computing loss per share for the years ended December 31, 2016 and 2015 because the effect was anti-dilutive. |
During the years ended December 31, 2016 and 2015, the Company incurred a net loss and therefore the diluted loss per share calculation for those periods excludes the anti-dilutive effect of 5,075,301 and 2,842,144 unvested stock awards, respectively. In addition, the diluted earnings per share calculation for the year ended December 31, 2014 excludes the dilutive effect of 979,795 unvested stock awards that were anti-dilutive under the treasury stock method.
The Company has the option to settle conversions of its Senior Convertible Notes with cash, shares of common stock or a combination of cash and common stock at its election (see Note 8 — Long-Term Debt). The Company’s intent is to settle the principal amount of the Senior Convertible Notes in cash upon conversion. As a result, only the amount by which the conversion value exceeds the aggregate principal amount of the notes (conversion spread) is considered in the diluted earnings per share computation under the treasury stock method. As of December 31, 2016, the conversion value did not exceed the principal amount of the notes, and accordingly, there was no impact to diluted earnings per share for the year ended December 31, 2016.
14. Business Segment Information
The Company’s exploration and production segment is engaged in the acquisition and development of oil and natural gas properties. Revenues for the exploration and production segment are derived from the sale of oil and natural gas production. The Company’s midstream services business segment (OMS) performs salt water gathering and disposal services, fresh water services, natural gas gathering and processing and crude oil gathering and transportation and other midstream services for the Company’s oil and natural gas wells operated by OPNA. Revenues for the midstream segment are primarily derived from salt water pipeline transport, salt water disposal, fresh water sales, natural gas gathering and processing and crude oil gathering. The Company’s well services business segment (OWS) performs completion services for the Company’s oil and natural gas wells operated by OPNA. Revenues for the well services segment are derived from providing well services, product sales and equipment rentals. The revenues and expenses related to work performed by OMS and OWS for OPNA’s working interests are eliminated in consolidation, and only the revenues and expenses related to non-affiliated working interest owners are included in the Company’s Consolidated Statement of Operations. These segments represent the Company’s three operating units, each offering different products and services. The Company’s corporate activities have been allocated to the supported business segments accordingly.
Management evaluates the performance of the Company’s business segments based on operating income, which is defined as segment operating revenues less operating expenses, including DD&A. The following table summarizes financial information for the Company’s three business segments for the periods presented:
106
Exploration and Production | Midstream Services | Well Services | Eliminations | Consolidated | |||||||||||||||
Year Ended December 31, 2016 | |||||||||||||||||||
Revenues from external customers | $ | 635,505 | $ | 35,406 | $ | 33,754 | $ | — | $ | 704,665 | |||||||||
Inter-segment revenues | — | 85,447 | 59,595 | (145,042 | ) | — | |||||||||||||
Total revenues | 635,505 | 120,853 | 93,349 | (145,042 | ) | 704,665 | |||||||||||||
Operating income (loss) | (196,179 | ) | 68,868 | 3,428 | (6,950 | ) | (130,833 | ) | |||||||||||
Other income (expense) | (240,290 | ) | (474 | ) | 43 | — | (240,721 | ) | |||||||||||
Income (loss) before income taxes | $ | (436,469 | ) | $ | 68,394 | $ | 3,471 | $ | (6,950 | ) | $ | (371,554 | ) | ||||||
Total assets(1) | $ | 5,868,747 | $ | 431,095 | $ | 51,167 | $ | (172,377 | ) | $ | 6,178,632 | ||||||||
Property, plant and equipment, net | 5,620,558 | 424,197 | 47,189 | (172,377 | ) | 5,919,567 | |||||||||||||
Capital expenditures(2) | 1,017,411 | 170,386 | 680 | (6,950 | ) | 1,181,527 | |||||||||||||
Depreciation, depletion and amortization | 467,894 | 8,525 | 14,892 | (14,980 | ) | 476,331 | |||||||||||||
Impairment | 2,253 | 2,431 | — | — | 4,684 | ||||||||||||||
Year Ended December 31, 2015 | |||||||||||||||||||
Revenues from external customers | $ | 721,672 | $ | 23,769 | $ | 44,294 | $ | — | $ | 789,735 | |||||||||
Inter-segment revenues | — | 80,926 | 177,184 | (258,110 | ) | — | |||||||||||||
Total revenues | 721,672 | 104,695 | 221,478 | (258,110 | ) | 789,735 | |||||||||||||
Operating income (loss) | (177,512 | ) | 60,668 | 49,145 | (46,465 | ) | (114,164 | ) | |||||||||||
Other income (expense) | 58,542 | (801 | ) | 52 | — | 57,793 | |||||||||||||
Income (loss) before income taxes | $ | (118,970 | ) | $ | 59,867 | $ | 49,197 | $ | (46,465 | ) | $ | (56,371 | ) | ||||||
Total assets(1)(3) | $ | 5,478,439 | $ | 409,635 | $ | 470,614 | $ | (709,313 | ) | $ | 5,649,375 | ||||||||
Property, plant and equipment, net | 5,057,311 | 264,956 | 61,402 | (165,427 | ) | 5,218,242 | |||||||||||||
Capital expenditures(2) | 537,806 | 96,947 | 21,711 | (46,465 | ) | 609,999 | |||||||||||||
Depreciation, depletion and amortization | 479,693 | 5,764 | 19,073 | (19,208 | ) | 485,322 | |||||||||||||
Impairment | 46,109 | — | — | — | 46,109 | ||||||||||||||
Year Ended December 31, 2014 | |||||||||||||||||||
Revenues from external customers | $ | 1,304,004 | $ | 11,614 | $ | 74,610 | $ | — | $ | 1,390,228 | |||||||||
Inter-segment revenues | — | 39,344 | 192,774 | (232,118 | ) | — | |||||||||||||
Total revenues | 1,304,004 | 50,958 | 267,384 | (232,118 | ) | 1,390,228 | |||||||||||||
Operating income | 610,850 | 22,730 | 70,878 | (58,806 | ) | 645,652 | |||||||||||||
Other income (expense) | 168,741 | — | 75 | — | 168,816 | ||||||||||||||
Income before income taxes | $ | 779,591 | $ | 22,730 | $ | 70,953 | $ | (58,806 | ) | $ | 814,468 | ||||||||
Total assets(1) | $ | 5,772,959 | $ | 212,685 | $ | 281,844 | $ | (358,412 | ) | $ | 5,909,076 | ||||||||
Property, plant and equipment, net | 5,074,588 | 172,394 | 58,767 | (118,963 | ) | 5,186,786 | |||||||||||||
Capital expenditures(2) | 1,525,168 | 68,939 | 37,292 | (58,806 | ) | 1,572,593 | |||||||||||||
Depreciation, depletion and amortization | 406,960 | 3,744 | 14,080 | (12,450 | ) | 412,334 | |||||||||||||
Impairment | 47,238 | — | — | — | 47,238 | ||||||||||||||
__________________
(1) | Intercompany receivables (payables) for all segments were reclassified to capital contributions from (distributions to) parent and not included in total assets. |
(2) | Capital expenditures (including acquisitions) reflected in the table above differ from the amounts for capital expenditures and acquisitions of oil and gas properties shown in the Company’s Consolidated Statement of Cash Flows because amounts reflected in the table include changes in accrued liabilities from the previous reporting period for capital expenditures, while the amounts presented in the Consolidated Statement of Cash Flows are presented on a cash |
107
basis. Acquisitions totaled $781.5 million, $28.7 million and $37.2 million for the years ended December 31, 2016, 2015 and 2014, respectively, in the exploration and production segment.
(3) | Total assets for the exploration and production segment include $26.7 million of assets held for sale as of December 31, 2015. |
15. Significant Concentrations
Major customers. For the year ended December 31, 2016, sales to PBF Holding Company LLC accounted for approximately 10% of the Company’s total sales. For the year ended December 31, 2015, sales to Shell Trading (US) Company accounted for approximately 10% of the Company’s total sales. For the year ended December 31, 2014, sales to Musket Corporation accounted for approximately 13% of the Company’s total sales. No other purchasers accounted for more than 10% of the Company’s total sales for the years ended December 31, 2016, 2015 and 2014. Total sales include revenues from the Company’s exploration and production segment only, as OMS and OWS provide services to OPNA.
Substantially all of the Company’s accounts receivable result from sales of oil and natural gas as well as joint interest billings (“JIB”) to third-party companies who have working interest payment obligations in projects completed by the Company. Exxon Mobil Corporation and XTO Energy, Inc. accounted for approximately 22% and 17%, respectively, of the Company’s JIB receivables balance at December 31, 2016. Statoil Oil & Gas LP and HRG, Inc. accounted for approximately 17% and 10%, respectively, of the Company’s JIB receivables balance at December 31, 2015.
This concentration of customers and joint interest owners may impact the Company’s overall credit risk, either positively or negatively, in that these entities may be similarly affected by changes in economic or other conditions, including the current downturn in oil prices. Management believes that the loss of any of these purchasers would not have a material adverse effect on the Company’s operations, as there are a number of alternative oil and natural gas purchasers in the Company’s producing regions.
16. Commitments and Contingencies
Included below is a discussion of various future commitments of the Company as of December 31, 2016. The commitments under these arrangements are not recorded in the accompanying Consolidated Balance Sheet. The amounts disclosed represent undiscounted cash flows on a gross basis, and no inflation elements have been applied.
Lease obligations. The Company has operating leases for office space and other property and equipment. The Company incurred rental expense of $6.3 million, $7.2 million and $5.0 million for the years ended December 31, 2016, 2015 and 2014, respectively, included in general and administrative expenses on its Consolidated Statement of Operations.
Future minimum annual rental commitments under non-cancelable leases at December 31, 2016 are as follows:
(In thousands) | |||
2017 | $ | 5,530 | |
2018 | 4,935 | ||
2019 | 4,986 | ||
2020 | 3,735 | ||
$ | 19,186 | ||
Volume commitment agreements. As of December 31, 2016, the Company had certain agreements with an aggregate requirement to deliver, transport or purchase a minimum quantity of approximately 41.1 MMBbl of crude oil, 23.0 MMBbl of natural gas liquids, 211.1 Bcf of natural gas and 31.7 MMBbl of fresh water, prior to any applicable volume credits, within specified timeframes, all of which are ten years or less. For the years ended December 31, 2016, 2015 and 2014, the Company incurred transportation and purchase costs of $16.1 million, $7.3 million and $5.6 million related to the these agreements. The future commitments under certain agreements cannot be estimated as they are based on fixed differentials relative to WTI under the agreements as compared to the differential relative to WTI for the Williston Basin for the production month.
The estimable future commitments under these volume commitment agreements as of December 31, 2016 are as follows:
108
(In thousands) | |||
2017 | $ | 33,103 | |
2018 | 57,654 | ||
2019 | 63,505 | ||
2020 | 61,653 | ||
2021 | 62,092 | ||
Thereafter | 194,229 | ||
$ | 472,236 | ||
Litigation. The Company is party to various legal and/or regulatory proceedings from time to time arising in the ordinary course of business. While the ultimate outcome and impact to the Company cannot be predicted with certainty, the Company believes that all such matters are without merit and involve amounts which, if resolved unfavorably, either individually or in the aggregate, will not have a material adverse effect on its financial condition, results of operations or cash flows. When the Company determines that a loss is probable of occurring and is reasonably estimable, the Company accrues an undiscounted liability for such contingencies based on its best estimate using information available at the time. The Company discloses contingencies where an adverse outcome may be material, or in the judgment of management, the matter should otherwise be disclosed.
17. Subsequent Events
The Company has evaluated the period after the balance sheet date, noting no subsequent events or transactions that required recognition or disclosure in the financial statements.
18. Condensed Consolidating Financial Statements
The Notes (see Note 8 — Long-Term Debt) are guaranteed on a senior unsecured basis by the Guarantors, which are 100% owned by the Company. These guarantees are full and unconditional and joint and several among the Guarantors. Certain of the Company’s immaterial wholly-owned subsidiaries do not guarantee the Notes (“Non-Guarantor Subsidiaries”).
The following financial information reflects consolidating financial information of the parent company, Oasis Petroleum Inc. (“Issuer”), and its Guarantors on a combined basis, prepared on the equity basis of accounting. The Non-Guarantor Subsidiaries are immaterial and, therefore, not presented separately. The information is presented in accordance with the requirements of Rule 3-10 under the SEC’s Regulation S-X. The financial information may not necessarily be indicative of results of operations, cash flows or financial position had the Guarantors operated as independent entities. The Company has not presented separate financial and narrative information for each of the Guarantors because it believes such financial and narrative information would not provide any additional information that would be material in evaluating the sufficiency of the Guarantors.
109
Condensed Consolidating Balance Sheet
December 31, 2016 | |||||||||||||||
Parent/ Issuer | Combined Guarantor Subsidiaries | Intercompany Eliminations | Consolidated | ||||||||||||
(In thousands, except share data) | |||||||||||||||
ASSETS | |||||||||||||||
Current assets | |||||||||||||||
Cash and cash equivalents | $ | 166 | $ | 11,060 | $ | — | $ | 11,226 | |||||||
Accounts receivables, net | — | 204,335 | — | 204,335 | |||||||||||
Accounts receivable – affiliates | 252,000 | 27,619 | (279,619 | ) | — | ||||||||||
Inventory | — | 10,648 | — | 10,648 | |||||||||||
Prepaid expenses | 275 | 7,348 | — | 7,623 | |||||||||||
Derivative instruments | — | 362 | — | 362 | |||||||||||
Other current assets | — | 4,355 | — | 4,355 | |||||||||||
Total current assets | 252,441 | 265,727 | (279,619 | ) | 238,549 | ||||||||||
Property, plant and equipment | |||||||||||||||
Oil and gas properties (successful efforts method) | — | 7,296,568 | — | 7,296,568 | |||||||||||
Other property and equipment | — | 618,790 | — | 618,790 | |||||||||||
Less: accumulated depreciation, depletion, amortization and impairment | — | (1,995,791 | ) | — | (1,995,791 | ) | |||||||||
Total property, plant and equipment, net | — | 5,919,567 | — | 5,919,567 | |||||||||||
Assets held for sale | — | — | — | — | |||||||||||
Investments in and advances to subsidiaries | 4,451,192 | — | (4,451,192 | ) | — | ||||||||||
Derivative instruments | — | — | — | ||||||||||||
Deferred income taxes | 220,058 | — | (220,058 | ) | — | ||||||||||
Other assets | — | 20,516 | — | 20,516 | |||||||||||
Total assets | $ | 4,923,691 | $ | 6,205,810 | $ | (4,950,869 | ) | $ | 6,178,632 | ||||||
LIABILITIES AND STOCKHOLDERS’ EQUITY | |||||||||||||||
Current liabilities | |||||||||||||||
Accounts payable | $ | — | $ | 4,645 | $ | — | $ | 4,645 | |||||||
Accounts payable – affiliates | 27,619 | 252,000 | (279,619 | ) | — | ||||||||||
Revenues and production taxes payable | — | 139,737 | — | 139,737 | |||||||||||
Accrued liabilities | 12 | 119,161 | — | 119,173 | |||||||||||
Accrued interest payable | 38,689 | 315 | — | 39,004 | |||||||||||
Derivative instruments | — | 60,469 | — | 60,469 | |||||||||||
Advances from joint interest partners | — | 7,597 | — | 7,597 | |||||||||||
Other current liabilities | — | 10,490 | — | 10,490 | |||||||||||
Total current liabilities | 66,320 | 594,414 | (279,619 | ) | 381,115 | ||||||||||
Long-term debt | 1,934,214 | 363,000 | — | 2,297,214 | |||||||||||
Deferred income taxes | — | 733,587 | (220,058 | ) | 513,529 | ||||||||||
Asset retirement obligations | — | 48,985 | — | 48,985 | |||||||||||
Derivative instruments | — | 11,714 | — | 11,714 | |||||||||||
Other liabilities | — | 2,918 | — | 2,918 | |||||||||||
Total liabilities | 2,000,534 | 1,754,618 | (499,677 | ) | 3,255,475 | ||||||||||
Stockholders’ equity | |||||||||||||||
Capital contributions from affiliates | — | 3,388,893 | (3,388,893 | ) | — | ||||||||||
Common stock, $0.01 par value: 450,000,000 shares authorized; 237,201,064 shares issued and 236,344,172 shares outstanding | 2,331 | — | — | 2,331 | |||||||||||
Treasury stock, at cost: 856,892 shares | (15,950 | ) | — | — | (15,950 | ) | |||||||||
Additional paid-in-capital | 2,345,271 | 8,743 | (8,743 | ) | 2,345,271 | ||||||||||
Retained earnings | 591,505 | 1,053,556 | (1,053,556 | ) | 591,505 | ||||||||||
Total stockholders’ equity | 2,923,157 | 4,451,192 | (4,451,192 | ) | 2,923,157 | ||||||||||
Total liabilities and stockholders’ equity | $ | 4,923,691 | $ | 6,205,810 | $ | (4,950,869 | ) | $ | 6,178,632 | ||||||
110
Condensed Consolidating Balance Sheet
December 31, 2015 | |||||||||||||||
Parent/ Issuer | Combined Guarantor Subsidiaries | Intercompany Eliminations | Consolidated | ||||||||||||
(In thousands, except share data) | |||||||||||||||
ASSETS | |||||||||||||||
Current assets | |||||||||||||||
Cash and cash equivalents | $ | 777 | $ | 8,953 | $ | — | $ | 9,730 | |||||||
Accounts receivable, net | 15 | 197,394 | — | 197,409 | |||||||||||
Accounts receivable – affiliates | 1,248 | 247,488 | (248,736 | ) | — | ||||||||||
Inventory | — | 11,072 | — | 11,072 | |||||||||||
Prepaid expenses | 278 | 7,050 | — | 7,328 | |||||||||||
Derivative instruments | — | 139,697 | — | 139,697 | |||||||||||
Other current assets | — | 50 | — | 50 | |||||||||||
Total current assets | 2,318 | 611,704 | (248,736 | ) | 365,286 | ||||||||||
Property, plant and equipment | |||||||||||||||
Oil and gas properties (successful efforts method) | — | 6,284,401 | — | 6,284,401 | |||||||||||
Other property and equipment | — | 443,265 | — | 443,265 | |||||||||||
Less: accumulated depreciation, depletion, amortization and impairment | — | (1,509,424 | ) | — | (1,509,424 | ) | |||||||||
Total property, plant and equipment, net | — | 5,218,242 | — | 5,218,242 | |||||||||||
Assets held for sale | — | 26,728 | — | 26,728 | |||||||||||
Investments in and advances to subsidiaries | 4,573,172 | — | (4,573,172 | ) | — | ||||||||||
Derivative instruments | — | 15,776 | — | 15,776 | |||||||||||
Deferred income taxes | 205,174 | — | (205,174 | ) | — | ||||||||||
Other assets | 100 | 23,243 | — | 23,343 | |||||||||||
Total assets | $ | 4,780,764 | $ | 5,895,693 | $ | (5,027,082 | ) | $ | 5,649,375 | ||||||
LIABILITIES AND STOCKHOLDERS’ EQUITY | |||||||||||||||
Current liabilities | |||||||||||||||
Accounts payable | $ | — | $ | 9,983 | $ | — | $ | 9,983 | |||||||
Accounts payable - affiliates | 247,488 | 1,248 | (248,736 | ) | — | ||||||||||
Revenues and production taxes payable | — | 132,356 | — | 132,356 | |||||||||||
Accrued liabilities | 10 | 167,659 | — | 167,669 | |||||||||||
Accrued interest payable | 49,340 | 73 | — | 49,413 | |||||||||||
Deferred income taxes | — | — | — | — | |||||||||||
Advances from joint interest partners | — | 4,647 | — | 4,647 | |||||||||||
Other current liabilities | — | 6,500 | — | 6,500 | |||||||||||
Total current liabilities | 296,838 | 322,466 | (248,736 | ) | 370,568 | ||||||||||
Long-term debt | 2,164,584 | 138,000 | — | 2,302,584 | |||||||||||
Deferred income taxes | — | 813,329 | (205,174 | ) | 608,155 | ||||||||||
Asset retirement obligations | — | 35,338 | — | 35,338 | |||||||||||
Liabilities held for sale | — | 10,228 | — | 10,228 | |||||||||||
Other liabilities | — | 3,160 | — | 3,160 | |||||||||||
Total liabilities | 2,461,422 | 1,322,521 | (453,910 | ) | 3,330,033 | ||||||||||
Stockholders’ equity | |||||||||||||||
Capital contributions from affiliates | — | 3,369,895 | (3,369,895 | ) | — | ||||||||||
Common stock, $0.01 par value: 300,000,000 shares authorized; 139,583,990 shares issued and 139,076,064 shares outstanding | 1,376 | — | — | 1,376 | |||||||||||
Treasury stock, at cost: 507,926 shares | (13,620 | ) | — | — | (13,620 | ) | |||||||||
Additional paid-in-capital | 1,497,065 | 8,743 | (8,743 | ) | 1,497,065 | ||||||||||
Retained earnings | 834,521 | 1,194,534 | (1,194,534 | ) | 834,521 | ||||||||||
Total stockholders’ equity | 2,319,342 | 4,573,172 | (4,573,172 | ) | 2,319,342 | ||||||||||
Total liabilities and stockholders’ equity | $ | 4,780,764 | $ | 5,895,693 | $ | (5,027,082 | ) | $ | 5,649,375 | ||||||
111
Condensed Consolidating Statement of Operations
Year Ended December 31, 2016 | |||||||||||||||
Parent/ Issuer | Combined Guarantor Subsidiaries | Intercompany Eliminations | Consolidated | ||||||||||||
(In thousands) | |||||||||||||||
Revenues | |||||||||||||||
Oil and gas revenues | $ | — | $ | 635,505 | $ | — | $ | 635,505 | |||||||
Midstream revenues | — | 35,406 | — | 35,406 | |||||||||||
Well services revenues | — | 33,754 | — | 33,754 | |||||||||||
Total revenues | — | 704,665 | — | 704,665 | |||||||||||
Operating expenses | |||||||||||||||
Lease operating expenses | — | 135,444 | — | 135,444 | |||||||||||
Midstream operating expenses | — | 9,003 | — | 9,003 | |||||||||||
Well services operating expenses | — | 17,009 | — | 17,009 | |||||||||||
Marketing, transportation and gathering expenses | — | 40,366 | — | 40,366 | |||||||||||
Production taxes | — | 56,565 | — | 56,565 | |||||||||||
Depreciation, depletion and amortization | — | 476,331 | — | 476,331 | |||||||||||
Exploration expenses | — | 1,785 | — | 1,785 | |||||||||||
Rig termination | — | — | — | — | |||||||||||
Impairment | — | 4,684 | — | 4,684 | |||||||||||
General and administrative expenses | 25,356 | 67,652 | — | 93,008 | |||||||||||
Total operating expenses | 25,356 | 808,839 | — | 834,195 | |||||||||||
Loss on sale of properties | — | (1,303 | ) | — | (1,303 | ) | |||||||||
Operating loss | (25,356 | ) | (105,477 | ) | — | (130,833 | ) | ||||||||
Other income (expense) | |||||||||||||||
Equity in loss of subsidiaries | (140,978 | ) | — | 140,978 | — | ||||||||||
Net loss on derivative instruments | — | (105,317 | ) | — | (105,317 | ) | |||||||||
Interest expense, net of capitalized interest | (130,356 | ) | (9,949 | ) | — | (140,305 | ) | ||||||||
Gain on extinguishment of debt | 4,741 | — | — | 4,741 | |||||||||||
Other income | 137 | 23 | — | 160 | |||||||||||
Total other income (expense) | (266,456 | ) | (115,243 | ) | 140,978 | (240,721 | ) | ||||||||
Loss before income taxes | (291,812 | ) | (220,720 | ) | 140,978 | (371,554 | ) | ||||||||
Income tax benefit | 48,796 | 79,742 | — | 128,538 | |||||||||||
Net loss | $ | (243,016 | ) | $ | (140,978 | ) | $ | 140,978 | $ | (243,016 | ) | ||||
112
Condensed Consolidating Statement of Operations
Year Ended December 31, 2015 | |||||||||||||||
Parent/ Issuer | Combined Guarantor Subsidiaries | Intercompany Eliminations | Consolidated | ||||||||||||
(In thousands) | |||||||||||||||
Revenues | |||||||||||||||
Oil and gas revenues | $ | — | $ | 721,672 | $ | — | $ | 721,672 | |||||||
Midstream revenues | — | 23,769 | — | 23,769 | |||||||||||
Well services and midstream revenues | — | 44,294 | — | 44,294 | |||||||||||
Total revenues | — | 789,735 | — | 789,735 | |||||||||||
Operating expenses | |||||||||||||||
Lease operating expenses | — | 144,481 | — | 144,481 | |||||||||||
Midstream operating expenses | — | 6,198 | — | 6,198 | |||||||||||
Well services operating expenses | — | 21,833 | — | 21,833 | |||||||||||
Marketing, transportation and gathering expenses | — | 31,610 | — | 31,610 | |||||||||||
Production taxes | — | 69,584 | — | 69,584 | |||||||||||
Depreciation, depletion and amortization | — | 485,322 | — | 485,322 | |||||||||||
Exploration expenses | — | 2,369 | — | 2,369 | |||||||||||
Rig termination | — | 3,895 | — | 3,895 | |||||||||||
Impairment | — | 46,109 | — | 46,109 | |||||||||||
General and administrative expenses | 27,930 | 64,568 | — | 92,498 | |||||||||||
Total operating expenses | 27,930 | 875,969 | — | 903,899 | |||||||||||
Operating loss | (27,930 | ) | (86,234 | ) | — | (114,164 | ) | ||||||||
Other income (expense) | |||||||||||||||
Equity in earnings of subsidiaries | 69,986 | — | (69,986 | ) | — | ||||||||||
Net gain on derivative instruments | — | 210,376 | — | 210,376 | |||||||||||
Interest expense, net of capitalized interest | (138,166 | ) | (11,482 | ) | — | (149,648 | ) | ||||||||
Other income (expense) | 5 | (2,940 | ) | — | (2,935 | ) | |||||||||
Total other income (expense) | (68,175 | ) | 195,954 | (69,986 | ) | 57,793 | |||||||||
Income (loss) before income taxes | (96,105 | ) | 109,720 | (69,986 | ) | (56,371 | ) | ||||||||
Income tax benefit (expense) | 55,857 | (39,734 | ) | — | 16,123 | ||||||||||
Net income (loss) | $ | (40,248 | ) | $ | 69,986 | $ | (69,986 | ) | $ | (40,248 | ) | ||||
113
Condensed Consolidating Statement of Operations
Year Ended December 31, 2014 | |||||||||||||||
Parent/ Issuer | Combined Guarantor Subsidiaries | Intercompany Eliminations | Consolidated | ||||||||||||
(In thousands) | |||||||||||||||
Revenues | |||||||||||||||
Oil and gas revenues | $ | — | $ | 1,304,004 | $ | — | $ | 1,304,004 | |||||||
Midstream revenues | — | 11,614 | — | 11,614 | |||||||||||
Well services and midstream revenues | — | 74,610 | — | 74,610 | |||||||||||
Total revenues | — | 1,390,228 | — | 1,390,228 | |||||||||||
Operating expenses | |||||||||||||||
Lease operating expenses | — | 169,600 | — | 169,600 | |||||||||||
Midstream operating expenses | — | 4,647 | — | 4,647 | |||||||||||
Well services operating expenses | — | 45,605 | — | 45,605 | |||||||||||
Marketing, transportation and gathering expenses | — | 29,133 | — | 29,133 | |||||||||||
Production taxes | — | 127,648 | — | 127,648 | |||||||||||
Depreciation, depletion and amortization | — | 412,334 | — | 412,334 | |||||||||||
Exploration expenses | — | 3,064 | — | 3,064 | |||||||||||
Impairment | — | 47,238 | — | 47,238 | |||||||||||
General and administrative expenses | 23,528 | 68,778 | — | 92,306 | |||||||||||
Total operating expenses | 23,528 | 908,047 | — | 931,575 | |||||||||||
Gain on sale of properties | — | 186,999 | — | 186,999 | |||||||||||
Operating income (loss) | (23,528 | ) | 669,180 | — | 645,652 | ||||||||||
Other income (expense) | |||||||||||||||
Equity in earnings of subsidiaries | 613,601 | — | (613,601 | ) | — | ||||||||||
Net gain on derivative instruments | — | 327,011 | — | 327,011 | |||||||||||
Interest expense, net of capitalized interest | (147,230 | ) | (11,160 | ) | — | (158,390 | ) | ||||||||
Other income | 5 | 190 | — | 195 | |||||||||||
Total other income (expense) | 466,376 | 316,041 | (613,601 | ) | 168,816 | ||||||||||
Income before income taxes | 442,848 | 985,221 | (613,601 | ) | 814,468 | ||||||||||
Income tax benefit (expense) | 64,029 | (371,620 | ) | — | (307,591 | ) | |||||||||
Net income | $ | 506,877 | $ | 613,601 | $ | (613,601 | ) | $ | 506,877 | ||||||
114
Condensed Consolidating Statement of Cash Flows
Year Ended December 31, 2016 | |||||||||||||||
Parent/ Issuer | Combined Guarantor Subsidiaries | Intercompany Eliminations | Consolidated | ||||||||||||
(In thousands) | |||||||||||||||
Cash flows from operating activities: | |||||||||||||||
Net loss | $ | (243,016 | ) | $ | (140,978 | ) | $ | 140,978 | $ | (243,016 | ) | ||||
Adjustments to reconcile net loss to net cash provided by (used in) operating activities: | |||||||||||||||
Equity in loss of subsidiaries | 140,978 | — | (140,978 | ) | — | ||||||||||
Depreciation, depletion and amortization | — | 476,331 | — | 476,331 | |||||||||||
Gain on extinguishment of debt | (4,741 | ) | — | — | (4,741 | ) | |||||||||
Loss on sale of properties | — | 1,303 | — | 1,303 | |||||||||||
Impairment | — | 4,684 | — | 4,684 | |||||||||||
Deferred income taxes | (48,796 | ) | (79,742 | ) | — | (128,538 | ) | ||||||||
Derivative instruments | — | 105,317 | — | 105,317 | |||||||||||
Stock-based compensation expenses | 23,346 | 757 | — | 24,103 | |||||||||||
Deferred financing costs amortization and other | 9,107 | 5,227 | — | 14,334 | |||||||||||
Working capital and other changes: | |||||||||||||||
Change in accounts receivable | (250,737 | ) | 207,931 | 30,883 | (11,923 | ) | |||||||||
Change in inventory | — | 254 | — | 254 | |||||||||||
Change in prepaid expenses | 3 | (298 | ) | — | (295 | ) | |||||||||
Change in other current assets | — | (305 | ) | — | (305 | ) | |||||||||
Change in other assets | 100 | (251 | ) | — | (151 | ) | |||||||||
Change in accounts payable and accrued liabilities | (230,518 | ) | 247,562 | (30,883 | ) | (13,839 | ) | ||||||||
Change in other current liabilities | — | 4,490 | — | 4,490 | |||||||||||
Change in other liabilities and deferred credits | — | 10 | — | 10 | |||||||||||
Net cash provided by (used in) operating activities | (604,274 | ) | 832,292 | — | 228,018 | ||||||||||
Cash flows from investing activities: | |||||||||||||||
Capital expenditures | — | (426,256 | ) | — | (426,256 | ) | |||||||||
Acquisitions of oil and gas properties | — | (781,522 | ) | — | (781,522 | ) | |||||||||
Proceeds from sale of properties | — | 12,333 | — | 12,333 | |||||||||||
Costs related to sale of properties | — | (310 | ) | — | (310 | ) | |||||||||
Derivative settlements | — | 121,977 | — | 121,977 | |||||||||||
Advances from joint interest partners | — | 2,950 | — | 2,950 | |||||||||||
Net cash used in investing activities | — | (1,070,828 | ) | — | (1,070,828 | ) | |||||||||
Cash flows from financing activities: | |||||||||||||||
Proceeds from revolving credit facility | — | 1,407,000 | — | 1,407,000 | |||||||||||
Principal payments on revolving credit facility | — | (1,182,000 | ) | — | (1,182,000 | ) | |||||||||
Repurchase of senior unsecured notes | (435,907 | ) | — | — | (435,907 | ) | |||||||||
Proceeds from issuance of senior unsecured convertible notes | 300,000 | — | — | 300,000 | |||||||||||
Deferred financing costs | (8,197 | ) | (930 | ) | — | (9,127 | ) | ||||||||
Proceeds from sale of common stock | 766,670 | — | — | 766,670 | |||||||||||
Purchases of treasury stock | (2,330 | ) | — | — | (2,330 | ) | |||||||||
Investment in / capital contributions from subsidiaries | (16,573 | ) | 16,573 | — | — | ||||||||||
115
Net cash provided by financing activities | 603,663 | 240,643 | — | 844,306 | |||||||||||
Increase (decrease) in cash and cash equivalents | (611 | ) | 2,107 | — | 1,496 | ||||||||||
Cash and cash equivalents at beginning of period | 777 | 8,953 | — | 9,730 | |||||||||||
Cash and cash equivalents at end of period | $ | 166 | $ | 11,060 | $ | — | $ | 11,226 | |||||||
116
Condensed Consolidating Statement of Cash Flows
Year Ended December 31, 2015 | |||||||||||||||
Parent/ Issuer | Combined Guarantor Subsidiaries | Intercompany Eliminations | Consolidated | ||||||||||||
(In thousands) | |||||||||||||||
Cash flows from operating activities: | |||||||||||||||
Net income (loss) | $ | (40,248 | ) | $ | 69,986 | $ | (69,986 | ) | $ | (40,248 | ) | ||||
Adjustments to reconcile net income (loss) to net cash provided by operating activities: | |||||||||||||||
Equity in earnings of subsidiaries | (69,986 | ) | — | 69,986 | — | ||||||||||
Depreciation, depletion and amortization | — | 485,322 | — | 485,322 | |||||||||||
Impairment | — | 46,109 | — | 46,109 | |||||||||||
Deferred income taxes | (55,857 | ) | 39,743 | — | (16,114 | ) | |||||||||
Derivative instruments | — | (210,376 | ) | — | (210,376 | ) | |||||||||
Stock-based compensation expenses | 24,762 | 510 | — | 25,272 | |||||||||||
Deferred financing costs amortization and other | 4,964 | 7,335 | — | 12,299 | |||||||||||
Working capital and other changes: | |||||||||||||||
Change in accounts receivable | (482 | ) | (47,553 | ) | 156,496 | 108,461 | |||||||||
Change in inventory | — | 6,873 | — | 6,873 | |||||||||||
Change in prepaid expenses | 19 | 1,809 | — | 1,828 | |||||||||||
Change in other current assets | — | 6,489 | — | 6,489 | |||||||||||
Change in other assets | — | (950 | ) | — | (950 | ) | |||||||||
Change in accounts payable and accrued liabilities | 156,039 | (71,160 | ) | (156,496 | ) | (71,617 | ) | ||||||||
Change in other liabilities | — | 6,500 | — | 6,500 | |||||||||||
Change in other liabilities and deferred credits | — | (33 | ) | — | (33 | ) | |||||||||
Net cash provided by operating activities | 19,211 | 340,604 | — | 359,815 | |||||||||||
Cash flows from investing activities: | |||||||||||||||
Capital expenditures | — | (819,847 | ) | — | (819,847 | ) | |||||||||
Acquisitions of oil and gas properties | — | (28,817 | ) | — | (28,817 | ) | |||||||||
Proceeds from sale of properties | — | 1,075 | — | 1,075 | |||||||||||
Derivative settlements | — | 370,410 | — | 370,410 | |||||||||||
Advances from joint interest partners | — | (1,969 | ) | — | (1,969 | ) | |||||||||
Net cash used in investing activities | — | (479,148 | ) | — | (479,148 | ) | |||||||||
Cash flows from financing activities: | |||||||||||||||
Proceeds from revolving credit facility | — | 630,000 | — | 630,000 | |||||||||||
Principal payments on revolving credit facility | — | (992,000 | ) | — | (992,000 | ) | |||||||||
Deferred financing costs | (11,045 | ) | (3,587 | ) | — | (14,632 | ) | ||||||||
Proceeds from sale of common stock | 462,833 | — | — | 462,833 | |||||||||||
Purchases of treasury stock | (2,949 | ) | — | — | (2,949 | ) | |||||||||
Investment in / capital contributions from subsidiaries | (468,049 | ) | 468,049 | — | — | ||||||||||
Net cash provided by (used in) financing activities | (19,210 | ) | 102,462 | — | 83,252 | ||||||||||
Increase (decrease) in cash and cash equivalents | 1 | (36,082 | ) | — | (36,081 | ) | |||||||||
Cash and cash equivalents at beginning of period | 776 | 45,035 | — | 45,811 | |||||||||||
Cash and cash equivalents at end of period | $ | 777 | $ | 8,953 | $ | — | $ | 9,730 | |||||||
117
Condensed Consolidating Statement of Cash Flows
Year Ended December 31, 2014 | |||||||||||||||
Parent/ Issuer | Combined Guarantor Subsidiaries | Intercompany Eliminations | Consolidated | ||||||||||||
(In thousands) | |||||||||||||||
Cash flows from operating activities: | |||||||||||||||
Net income | $ | 506,877 | $ | 613,601 | $ | (613,601 | ) | $ | 506,877 | ||||||
Adjustments to reconcile net income to net cash provided by (used in) operating activities: | |||||||||||||||
Equity in earnings of subsidiaries | (613,601 | ) | — | 613,601 | — | ||||||||||
Depreciation, depletion and amortization | — | 412,334 | — | 412,334 | |||||||||||
Gain on sale of properties | — | (186,999 | ) | — | (186,999 | ) | |||||||||
Impairment | — | 47,238 | — | 47,238 | |||||||||||
Deferred income taxes | (64,029 | ) | 371,486 | — | 307,457 | ||||||||||
Derivative instruments | — | (327,011 | ) | — | (327,011 | ) | |||||||||
Stock-based compensation expenses | 20,701 | 601 | — | 21,302 | |||||||||||
Deferred financing costs amortization and other | 4,549 | 6,479 | — | 11,028 | |||||||||||
Working capital and other changes: | |||||||||||||||
Change in accounts receivable | (11 | ) | (65,657 | ) | 82,370 | 16,702 | |||||||||
Change in inventory | — | (3,776 | ) | — | (3,776 | ) | |||||||||
Change in prepaid expenses | 21 | (3,220 | ) | — | (3,199 | ) | |||||||||
Change in other current assets | — | (6,135 | ) | — | (6,135 | ) | |||||||||
Change in other assets | — | 114 | — | 114 | |||||||||||
Change in accounts payable and accrued liabilities | 84,044 | 75,049 | (82,370 | ) | 76,723 | ||||||||||
Change in other liabilities | — | (139 | ) | — | (139 | ) | |||||||||
Net cash provided by (used in) operating activities | (61,449 | ) | 933,965 | — | 872,516 | ||||||||||
Cash flows from investing activities: | |||||||||||||||
Capital expenditures | — | (1,354,281 | ) | — | (1,354,281 | ) | |||||||||
Acquisitions of oil and gas properties | — | (46,247 | ) | — | (46,247 | ) | |||||||||
Proceeds from sale of properties | — | 324,852 | — | 324,852 | |||||||||||
Costs related to sale of properties | — | (2,337 | ) | — | (2,337 | ) | |||||||||
Derivative settlements | — | 6,774 | — | 6,774 | |||||||||||
Advances from joint interest partners | — | (6,213 | ) | — | (6,213 | ) | |||||||||
Net cash used in investing activities | — | (1,077,452 | ) | — | (1,077,452 | ) | |||||||||
Cash flows from financing activities: | |||||||||||||||
Proceeds from revolving credit facility | — | 620,000 | — | 620,000 | |||||||||||
Principal payments on revolving credit facility | — | (455,570 | ) | — | (455,570 | ) | |||||||||
Deferred financing costs | — | (99 | ) | — | (99 | ) | |||||||||
Purchases of treasury stock | (5,309 | ) | — | — | (5,309 | ) | |||||||||
Investment in / capital contributions from subsidiaries | 33,433 | (33,433 | ) | — | — | ||||||||||
Other | (176 | ) | — | — | (176 | ) | |||||||||
Net cash provided by financing activities | 27,948 | 130,898 | — | 158,846 | |||||||||||
Decrease in cash and cash equivalents | (33,501 | ) | (12,589 | ) | — | (46,090 | ) | ||||||||
Cash and cash equivalents at beginning of period | 34,277 | 57,624 | — | 91,901 | |||||||||||
Cash and cash equivalents at end of period | $ | 776 | $ | 45,035 | $ | — | $ | 45,811 | |||||||
118
19. Supplemental Oil and Gas Disclosures
The supplemental data presented below reflects information for all of the Company’s oil and natural gas producing activities.
Capitalized Costs
The following table sets forth the capitalized costs related to the Company’s oil and natural gas producing activities:
At December 31, | |||||||
2016 | 2015(1) | ||||||
(In thousands) | |||||||
Proved oil and gas properties(2) | $ | 6,476,833 | $ | 5,655,759 | |||
Less: Accumulated depreciation, depletion, amortization and impairment | (1,886,732 | ) | (1,428,427 | ) | |||
Proved oil and gas properties, net | 4,590,101 | 4,227,332 | |||||
Unproved oil and gas properties | 819,735 | 628,642 | |||||
Total oil and gas properties, net | $ | 5,409,836 | $ | 4,855,974 | |||
__________________
(1) | At December 31, 2015, oil and gas properties exclude capitalized costs related to certain non-core assets that were held for sale (see Note 6 — Acquisitions and Divestitures). |
(2) | Included in the Company’s proved oil and gas properties are estimates of future asset retirement costs of $42.9 million and $30.7 million at December 31, 2016 and 2015, respectively. |
Costs Incurred in Oil and Natural Gas Property Acquisition, Exploration and Development Activities
The following table sets forth costs incurred related to the Company’s oil and natural gas activities for the periods presented:
Year Ended December 31, | |||||||||||
2016 | 2015 | 2014 | |||||||||
(In thousands) | |||||||||||
Acquisition costs: | |||||||||||
Proved oil and gas properties | $ | 781,522 | $ | 28,737 | $ | 37,048 | |||||
Unproved oil and gas properties | 672 | 3,226 | 30,891 | ||||||||
Exploration costs | 1,792 | 2,369 | 3,064 | ||||||||
Development costs | 207,766 | 433,735 | 1,437,923 | ||||||||
Asset retirement costs | 26,795 | 1,474 | 6,278 | ||||||||
Total costs incurred | $ | 1,018,547 | $ | 469,541 | $ | 1,515,204 | |||||
Results of Operations for Oil and Natural Gas Producing Activities
The following table sets forth the results of operations for oil and natural gas producing activities, which exclude straight-line depreciation, general and administrative expenses and interest expense, for the periods presented:
119
Year Ended December 31, | |||||||||||
2016 | 2015 | 2014 | |||||||||
(In thousands) | |||||||||||
Revenues(1) | $ | 625,233 | $ | 721,672 | $ | 1,304,004 | |||||
Production costs(1) | 222,117 | 245,675 | 326,381 | ||||||||
Depreciation, depletion and amortization | 462,320 | 472,800 | 400,118 | ||||||||
Exploration costs | 1,785 | 2,369 | 3,064 | ||||||||
Rig termination | — | 3,895 | — | ||||||||
Impairment | 2,252 | 46,109 | 47,238 | ||||||||
Income tax expense (benefit) | (23,665 | ) | (18,382 | ) | 197,701 | ||||||
Results of operations for oil and natural gas producing activities | $ | (39,576 | ) | $ | (30,794 | ) | $ | 329,502 | |||
(1) | For the year ended December 31, 2016, revenues and production costs exclude bulk oil sales and purchases, respectively, of $10.3 million each. |
120
20. Supplemental Oil and Gas Reserve Information — Unaudited
The reserve estimates at December 31, 2016, 2015 and 2014 presented in the table below are based on reports prepared by DeGolyer and MacNaughton, the Company’s independent reserve engineers, in accordance with the FASB’s authoritative guidance on oil and gas reserve estimation and disclosures. At December 31, 2016, 2015 and 2014, all of the Company’s oil and natural gas producing activities were conducted within the continental United States.
The Company emphasizes that reserve estimates are inherently imprecise and that estimates of new discoveries and undeveloped locations are more imprecise than estimates of established proved producing oil and natural gas properties. Accordingly, these estimates are expected to change as future information becomes available.
Proved oil and natural gas reserves are the estimated quantities of oil and natural gas that geological and engineering data demonstrate, with reasonable certainty, to be recoverable in future years from known reservoirs under economic and operating conditions (i.e., prices and costs) existing at the time the estimate is made. Proved developed oil and natural gas reserves are proved reserves that can be expected to be recovered through existing wells and equipment in place and under operating methods being utilized at the time the estimates were made.
Estimated Quantities of Proved Oil and Natural Gas Reserves — Unaudited
The following table sets forth the Company’s estimated net proved, proved developed and proved undeveloped reserves at December 31, 2016, 2015 and 2014:
121
Oil (MBbl) | Gas (MMcf) | MBoe | ||||||
2014 | ||||||||
Proved reserves | ||||||||
Beginning balance | 198,590 | 175,979 | 227,920 | |||||
Revisions of previous estimates | (23,069 | ) | (12,290 | ) | (25,117 | ) | ||
Extensions, discoveries and other additions | 80,855 | 70,449 | 92,596 | |||||
Sales of reserves in place | (7,640 | ) | (4,850 | ) | (8,448 | ) | ||
Purchases of reserves in place | 1,546 | 1,523 | 1,799 | |||||
Production | (14,883 | ) | (10,691 | ) | (16,664 | ) | ||
Net proved reserves at December 31, 2014 | 235,399 | 220,120 | 272,086 | |||||
Proved developed reserves, December 31, 2014 | 127,340 | 114,016 | 146,343 | |||||
Proved undeveloped reserves, December 31, 2014 | 108,059 | 106,104 | 125,743 | |||||
2015 | ||||||||
Proved reserves | ||||||||
Beginning balance | 235,399 | 220,120 | 272,086 | |||||
Revisions of previous estimates | (75,458 | ) | (55,065 | ) | (84,635 | ) | ||
Extensions, discoveries and other additions | 38,962 | 46,072 | 46,640 | |||||
Sales of reserves in place | — | — | — | |||||
Purchases of reserves in place | 2,115 | 2,702 | 2,565 | |||||
Production | (16,090 | ) | (14,001 | ) | (18,423 | ) | ||
Net proved reserves at December 31, 2015 | 184,928 | 199,828 | 218,233 | |||||
Proved developed reserves, December 31, 2015 | 127,445 | 120,789 | 147,577 | |||||
Proved undeveloped reserves, December 31, 2015 | 57,483 | 79,039 | 70,656 | |||||
2016 | ||||||||
Proved reserves | ||||||||
Beginning balance | 184,928 | 199,828 | 218,233 | |||||
Revisions of previous estimates | 11,713 | 116,539 | 31,136 | |||||
Extensions, discoveries and other additions | 10,790 | 24,520 | 14,876 | |||||
Sales of reserves in place | (5,828 | ) | (10,839 | ) | (7,635 | ) | ||
Purchases of reserves in place | 50,164 | 100,629 | 66,936 | |||||
Production | (15,174 | ) | (19,573 | ) | (18,436 | ) | ||
Net proved reserves at December 31, 2016 | 236,593 | 411,104 | 305,110 | |||||
Proved developed reserves, December 31, 2016 | 152,337 | 229,568 | 190,598 | |||||
Proved undeveloped reserves, December 31, 2016 | 84,256 | 181,536 | 114,512 | |||||
Revisions of Previous Estimates
In 2016, the Company had a net positive revision of 31,136 MBoe, or 14% of the beginning of the year estimated net proved reserves balance. This net positive revision was primarily due to larger completion designs and a higher gas to oil ratio, partially offset by the removal of proved undeveloped reserves that are no longer aligned with our anticipated five-year drilling plan and lower commodity prices.
In 2015, the Company had a net negative revision of 84,635 MBoe, or 31% of the beginning of the year estimated net proved reserves balance. This net negative revision was primarily due to the removal of proved undeveloped reserves that were not economic at the lower oil price or were no longer aligned with the Company’s anticipated five-year drilling plan. This resulted in 259 gross (190.8 net) proved undeveloped locations with 71,495 MBoe of reserves being removed from the December 31, 2015 estimated net proved reserves balance, most significantly, removing proved undeveloped reserves outside of the Company’s core acreage within the Williston Basin that were uneconomic as of December 31, 2015 due to the lower oil price. The remaining negative revision was primarily attributable to the impact of price on producing life, partially offset by positive revisions due to performance and operating costs.
In 2014, the Company had a net negative revision of 25,117 MBoe, or 11% of the beginning of the year estimated net proved reserves balance. This net negative revision was primarily due to the removal of proved undeveloped reserves not aligned with the Company’s anticipated five-year drilling plan, which was adjusted to allocate a greater focus on higher rates-
122
of-return areas of the Bakken and Three Forks formations. This resulted in 80 gross (56.2 net) proved undeveloped locations with 21,411 MBoe of reserves being removed from the December 31, 2014 estimated net proved reserves balance.
Extensions, Discoveries and Other Additions
In 2016, the Company had a total of 14,876 MBoe of additions due to extensions and discoveries. An estimated 6,214 MBoe of these extensions and discoveries were associated with new producing wells at December 31, 2016, with 100% of these reserves from wells producing in the Bakken or Three Forks formations. An additional 6,493 MBoe of proved undeveloped reserves were added in the Williston Basin associated with the Company’s 2016 operated and non-operated drilling program and anticipated five-year drilling plan, with 100% of these proved undeveloped reserves in the Bakken or Three Forks formations.
In 2015, the Company had a total of 46,640 MBoe of additions due to extensions and discoveries. An estimated 20,362 MBoe of these extensions and discoveries were associated with new producing wells at December 31, 2015, with 100% of these reserves from wells producing in the Bakken or Three Forks formations. An additional 26,278 MBoe of proved undeveloped reserves were added in the Williston Basin associated with the Company’s 2015 operated and non-operated drilling program and anticipated five-year drilling plan, with 100% of these proved undeveloped reserves in the Bakken or Three Forks formations.
In 2014, the Company had a total of 92,596 MBoe of additions due to extensions and discoveries. An estimated 34,404 MBoe of these extensions and discoveries were associated with new producing wells at December 31, 2014, with 100% of these reserves from wells producing in the Bakken or Three Forks formations. An additional 58,192 MBoe of proved undeveloped reserves were added in the Williston Basin associated with the Company’s 2014 operated and non-operated drilling program and anticipated five-year drilling plan, with 100% of these proved undeveloped reserves in the Bakken or Three Forks formations.
Sales of Reserves in Place
In 2016 and 2014, the Company divested 7,635 MBoe and 8,448 MBoe, respectively, of reserves associated with its traded acreage and sold wells (see Note 6 — Acquisitions and Divestitures). In 2015, the Company did not have any sales of reserves.
Purchases of Reserves in Place
In 2016, the Company purchased 66,936 MBoe of estimated net proved reserves from acquisitions (see Note 6 — Acquisitions and Divestitures). In 2015 and 2014, the Company purchased estimated net proved reserves of 2,565 MBoe and 1,799, respectively, from acquisitions of additional working interests in its existing properties in the Williston Basin.
Standardized Measure of Discounted Future Net Cash Flows Relating to Proved Oil and Natural Gas Reserves — Unaudited
The Standardized Measure represents the present value of estimated future net cash flows from estimated net proved oil and natural gas reserves, less future development, production, plugging and abandonment costs and income tax expenses, discounted at 10% per annum to reflect timing of future cash flows. Production costs do not include DD&A of capitalized acquisition, exploration and development costs.
The Company’s estimated net proved reserves and related future net revenues and Standardized Measure were determined using index prices for oil and natural gas, without giving effect to derivative transactions, and were held constant throughout the life of the properties. The unweighted arithmetic average first-day-of-the-month prices for the prior twelve months were $42.60/Bbl for oil and $2.47/MMBtu for natural gas, $50.16/Bbl for oil and $2.63/MMBtu for natural gas and $95.28/Bbl for oil and $4.35/MMBtu for natural gas for the years ended December 31, 2016, 2015 and 2014, respectively. These prices were adjusted by lease for quality, transportation fees, geographical differentials, marketing bonuses or deductions and other factors affecting the price received at the wellhead. Future operating costs, production taxes and capital costs were based on current costs as of each year-end.
The following table sets forth the Standardized Measure of discounted future net cash flows from projected production of the Company’s estimated net proved reserves at December 31, 2016, 2015 and 2014:
123
At December 31, | |||||||||||
2016 | 2015 | 2014 | |||||||||
(In thousands) | |||||||||||
Future cash inflows | $ | 9,426,963 | $ | 8,582,831 | $ | 21,656,832 | |||||
Future production costs | (3,996,657 | ) | (3,842,517 | ) | (7,094,426 | ) | |||||
Future development costs | (784,727 | ) | (909,562 | ) | (2,563,062 | ) | |||||
Future income tax expense | (279,345 | ) | (225,662 | ) | (3,188,389 | ) | |||||
Future net cash flows | 4,366,234 | 3,605,090 | 8,810,955 | ||||||||
10% annual discount for estimated timing of cash flows | (1,883,169 | ) | (1,690,760 | ) | (4,829,294 | ) | |||||
Standardized measure of discounted future net cash flows | $ | 2,483,065 | $ | 1,914,330 | $ | 3,981,661 | |||||
The following table sets forth the changes in the Standardized Measure of discounted future net cash flows applicable to estimated net proved reserves for the periods presented:
2016 | 2015 | 2014 | |||||||||
(In thousands) | |||||||||||
January 1 | $ | 1,914,330 | $ | 3,981,661 | $ | 3,727,559 | |||||
Net changes in prices and production costs | (367,527 | ) | (3,201,195 | ) | (588,212 | ) | |||||
Net changes in future development costs | 69,992 | 150,333 | (61,760 | ) | |||||||
Sales of oil and natural gas, net | (403,739 | ) | (477,755 | ) | (979,938 | ) | |||||
Extensions | 165,926 | 409,838 | 1,751,007 | ||||||||
Discoveries | — | — | — | ||||||||
Purchases of reserves in place | 533,505 | 14,378 | 38,035 | ||||||||
Sales of reserves in place | (57,770 | ) | — | (251,002 | ) | ||||||
Revisions of previous quantity estimates | 333,398 | (946,729 | ) | (604,651 | ) | ||||||
Previously estimated development costs incurred | 91,518 | 216,981 | 249,926 | ||||||||
Accretion of discount | (36,303 | ) | 548,141 | 548,690 | |||||||
Net change in income taxes | 202,272 | 1,391,358 | 259,592 | ||||||||
Changes in timing and other | 37,463 | (172,681 | ) | (107,585 | ) | ||||||
December 31 | $ | 2,483,065 | $ | 1,914,330 | $ | 3,981,661 | |||||
124
21. Quarterly Financial Data — Unaudited
The Company’s results of operations by quarter for the years ended December 31, 2016 and 2015 are as follows:
For the Year Ended December 31, 2016 | |||||||||||||||
First Quarter | Second Quarter | Third Quarter | Fourth Quarter | ||||||||||||
(In thousands) | |||||||||||||||
Revenues | $ | 130,283 | $ | 179,080 | $ | 177,311 | $ | 217,991 | |||||||
Operating loss | (75,215 | ) | (28,214 | ) | (25,702 | ) | (1,702 | ) | |||||||
Net loss | (64,455 | ) | (89,931 | ) | (33,942 | ) | (54,688 | ) | |||||||
Basic loss per share | (0.40 | ) | (0.51 | ) | (0.19 | ) | (0.25 | ) | |||||||
Diluted loss per share | (0.40 | ) | (0.51 | ) | (0.19 | ) | (0.25 | ) | |||||||
For the Year Ended December 31, 2015 | |||||||||||||||
First Quarter | Second Quarter | Third Quarter | Fourth Quarter | ||||||||||||
(In thousands) | |||||||||||||||
Revenues | $ | 180,387 | $ | 230,046 | $ | 197,235 | $ | 182,067 | |||||||
Operating loss | (33,635 | ) | (7,437 | ) | (19,926 | ) | (53,166 | ) | |||||||
Net income (loss) | (18,041 | ) | (53,230 | ) | 27,055 | 3,968 | |||||||||
Basic earnings (loss) per share | (0.17 | ) | (0.39 | ) | 0.20 | 0.03 | |||||||||
Diluted earnings (loss) per share | (0.17 | ) | (0.39 | ) | 0.20 | 0.03 | |||||||||
Item 9. Changes in and Disagreements with Accountants on Accounting and Financial Disclosure
None.
Item 9A. Controls and Procedures
Evaluation of disclosure controls and procedures. As required by Rule 13a-15(b) of the Securities Exchange Act of 1934, as amended (the “Exchange Act”), we have evaluated, under the supervision and with the participation of our management, including our Chief Executive Officer (“CEO”), our principal executive officer, and our Chief Financial Officer (“CFO”), our principal financial officer, the effectiveness of the design and operation of our disclosure controls and procedures (as defined in Rules 13a-15(e) and 15d-15(e) under the Exchange Act) as of December 31, 2016. Our disclosure controls and procedures are designed to provide reasonable assurance that information required to be disclosed by us in the reports filed or submitted by us under the Exchange Act is recorded, processed, summarized and reported within the time periods specified in the SEC’s rules and forms, and that such information is accumulated and communicated to our management, including our CEO and CFO as appropriate, to allow timely decisions regarding required disclosure. Based on the evaluation, our CEO and CFO have concluded that our disclosure controls and procedures were effective at December 31, 2016 at the reasonable assurance level.
Management’s report on internal control over financial reporting. Management, including our CEO and CFO, is responsible for establishing and maintaining adequate internal control over financial reporting (as defined in Rule 13a-15(f) and Rule 15d-15(f) under the Exchange Act). Our internal control over financial reporting is a process designed to provide reasonable assurance regarding the reliability of financial reporting and the preparation of our financial statements for external purposes in accordance with generally accepted accounting principles.
Because of its inherent limitations, internal control over financial reporting may not prevent or detect misstatements. Also, projections of any evaluation of effectiveness to future periods are subject to the risk that controls may become inadequate because of changes in conditions, or that the degree of compliance with the policies or procedures may deteriorate.
As of December 31, 2016, management assessed the effectiveness of our internal control over financial reporting. In making this assessment, management, including our CEO and CFO, used the criteria set forth by the Internal Control — Integrated Framework (2013) issued by the Committee of Sponsoring Organizations of the Treadway Commission (“COSO”). Based on this assessment, management concluded that our internal control over financial reporting was effective as of December 31, 2016.
125
PricewaterhouseCoopers LLP, the independent registered public accounting firm that audited our consolidated financial statements included in this annual report on Form 10-K, has also audited the effectiveness of our internal control over financial reporting at December 31, 2016. Their “Report of Independent Registered Public Accounting Firm,” which expresses an unqualified opinion on the effectiveness of our internal control over financial reporting at December 31, 2016, is included in Item 8.
Changes in internal control over financial reporting. There were no changes in our internal control over financial reporting (as defined in Rule 13a-15(f) and Rule 15d-15(f) under the Exchange Act) that occurred during the three months ended December 31, 2016 that have materially affected, or are reasonably likely to materially affect, our internal control over financial reporting.
Item 9B. Other Information
None.
126
PART III
Item 10. Directors, Executive Officers and Corporate Governance
Pursuant to General Instruction G(3) to Form 10-K, we incorporate by reference into this Item the information to be disclosed in our definitive proxy statement for our 2017 Annual Meeting of Stockholders.
Item 11. Executive Compensation
Pursuant to General Instruction G(3) to Form 10-K, we incorporate by reference into this Item the information to be disclosed in our definitive proxy statement for our 2017 Annual Meeting of Stockholders.
Item 12. Security Ownership of Certain Beneficial Owners and Management and Related Stockholder Matters
Pursuant to General Instruction G(3) to Form 10-K, we incorporate by reference into this Item the information to be disclosed in our definitive proxy statement for our 2017 Annual Meeting of Stockholders.
Item 13. Certain Relationships and Related Transactions and Director Independence
Pursuant to General Instruction G(3) to Form 10-K, we incorporate by reference into this Item the information to be disclosed in our definitive proxy statement for our 2017 Annual Meeting of Stockholders.
Item 14. Principal Accountant Fees and Services
Pursuant to General Instruction G(3) to Form 10-K, we incorporate by reference into this Item the information to be disclosed in our definitive proxy statement for our 2017 Annual Meeting of Stockholders.
127
PART IV
Item 15. Exhibits, Financial Statement Schedules
a. The following documents are filed as a part of this Annual Report on Form 10-K or incorporated herein by reference:
(1) | Financial Statements: |
See Item 8. Financial Statements and Supplementary Data.
(2) | Financial Statement Schedules: |
None.
(3) | Exhibits: |
The following documents are included as exhibits to this report:
Exhibit No. | Description of Exhibit |
2.1 | Purchase and Sale Agreement, dated October 17, 2016, by and among Oasis Petroleum North America LLC and SM Energy Company (filed as Exhibit 2.1 to the Company’s Current Report on Form 8-K on October 18, 2016, and incorporated herein by reference). |
3.1 | Conformed version of Amended and Restated Certificate of Incorporation of Oasis Petroleum Inc., as amended by amendment filed on June 30, 2016 (filed as Exhibit 3.1 to the Company’s Quarterly Report on Form 10-Q on August 9, 2016, and incorporated herein by reference). |
3.2 | Amended and Restated Bylaws of Oasis Petroleum Inc. (filed as Exhibit 3.2 to the Company’s Current Report on Form 8-K on June 24, 2010, and incorporated herein by reference). |
4.1 | Specimen Common Stock Certificate (filed as Exhibit 4.1 to the Company’s Registration Statement on Form S-1/A on May 19, 2010, and incorporated herein by reference). |
4.2 | Indenture dated as of February 2, 2011 among the Company and U.S. Bank National Association, as trustee (filed as Exhibit 4.1 to the Company’s Current Report on Form 8-K on February 2, 2011, and incorporated herein by reference). |
4.3 | First Supplemental Indenture dated as of February 2, 2011 among the Company, the Guarantors and U.S. Bank National Association, as trustee (filed as Exhibit 4.2 to the Company’s Current Report on Form 8-K on February 2, 2011, and incorporated herein by reference). |
4.4 | Second Supplemental Indenture dated as of September 19, 2011 among the Company, the Guarantors and U.S. Bank National Association, as trustee (filed as Exhibit 4.4 to the Company’s Registration Statement on Form S-4 on September 23, 2011, and incorporated herein by reference). |
4.5 | Indenture dated as of November 10, 2011 among the Company, the Guarantors and U.S. Bank National Association, as trustee (filed as Exhibit 4.1 to the Company’s Current Report on Form 8-K on November 10, 2011, and incorporated herein by reference). |
4.6 | First Supplemental Indenture dated as of November 10, 2011 among the Company, the Guarantors and U.S. Bank National Association, as trustee (filed as Exhibit 4.2 to the Company’s Current Report on Form 8-K on November 10, 2011, and incorporated herein by reference). |
4.7 | Second Supplemental Indenture dated as of July 2, 2012 among the Company, the Guarantors and U.S. Bank National Association, as trustee (filed as Exhibit 4.1 to the Company’s Current Report on Form 8-K on July 2, 2012, and incorporated herein by reference). |
4.8 | Third Supplemental Indenture (to the Indenture dated as of February 2, 2011) dated as of June 18, 2013 among the Company, the Guarantors and U.S. Bank National Association, as trustee (filed as Exhibit 4.1 to the Company’s Quarterly Report on Form 10-Q on August 7, 2013, and incorporated herein by reference). |
4.9 | Third Supplemental Indenture (to the Indenture dated as of November 10, 2011) dated as of June 18, 2013 among the Company, the Guarantors and U.S. Bank National Association, as trustee (filed as Exhibit 4.2 to the Company’s Quarterly Report on Form 10-Q on August 7, 2013, and incorporated herein by reference). |
4.10 | Fourth Supplemental Indenture dated as of September 24, 2013 among the Company, the Guarantors and U.S. Bank National Association, as trustee (filed as Exhibit 4.1 to the Company’s Current Report on Form 8-K filed on September 25, 2013, and incorporated herein by reference). |
128
Exhibit No. | Description of Exhibit |
4.11 | Fifth Supplemental Indenture (to the Indenture dated as of February 2, 2011) dated as of October 26, 2015 among the Company, the Guarantors and U.S. Bank National Association, as trustee (filed as Exhibit 4.1 to the Company’s Current Report on Form 8-K filed on October 30, 2015, and incorporated herein by reference). |
4.12 | Fourth Supplemental Indenture (to the Indenture dated as of November 10, 2011) dated as of October 26, 2015 among the Company, the Guarantors and U.S. Bank National Association, as trustee (filed as Exhibit 4.2 to the Company’s Current Report on Form 8-K filed on October 30, 2015, and incorporated herein by reference). |
4.13 | Fifth Supplemental Indenture (to the Indenture dated as of November 10, 2011) dated as of October 26, 2015 among the Company, the Guarantors and U.S. Bank National Association, as trustee (filed as Exhibit 4.3 to the Company’s Current Report on Form 8-K filed on October 30, 2015, and incorporated herein by reference). |
4.14 | Sixth Supplemental Indenture (to the Indenture dated as of November 10, 2011) dated as of September 19, 2016 to Senior Indenture among the Company, the Guarantors and U.S. Bank National Association, as trustee (filed as Exhibit 4.1 to the Company’s Current Report on Form 8-K on September 19, 2016, and incorporated herein by reference). |
10.1 | Business Opportunities Agreement dated as of June 22, 2010 by and among Oasis Petroleum Inc., EnCap Investments L.P., Douglas E. Swanson, Jr. and Robert L. Zorich (filed as Exhibit 10.2 to the Company’s Current Report on Form 8-K on June 24, 2010, and incorporated herein by reference). |
10.2 | Second Amended and Restated Credit Agreement, dated as of April 5, 2013, among Oasis Petroleum Inc., as parent, Oasis Petroleum North America LLC, as borrower, the other credit parties party thereto, Wells Fargo Bank, N.A., as administrative agent and the lenders party thereto (filed as Exhibit 10.1 to the Company’s Current Report on Form 8-K on April 9, 2013, and incorporated herein by reference). |
10.3 | First Amendment to Second Amended and Restated Credit Agreement dated as of September 3, 2013 among Oasis Petroleum Inc., as Parent, Oasis Petroleum North America LLC, as Borrower, the Other Credit Parties thereto, Wells Fargo Bank, N.A., as Administrative Agent and the Lenders party thereto (filed as Exhibit 10.1 to the Company’s Current Report on Form 8-K on September 5, 2013, and incorporated herein by reference). |
10.4** | Amended and Restated 2010 Long Term Incentive Plan of Oasis Petroleum Inc. (filed as Exhibit 10.1 to the Company’s Quarterly Report on Form 10-Q on August 6, 2014, and incorporated herein by reference). |
10.5** | Form of Indemnification Agreement between Oasis Petroleum Inc. and each of the directors and executive officers thereof (filed as Exhibit 10.5 to the Company’s Annual Report on Form 10-K on February 25, 2015, and incorporated herein by reference). |
10.6** | Amended and Restated 2010 Annual Incentive Compensation Plan of Oasis Petroleum Inc. (filed as Exhibit 10.2 to the Company’s Quarterly Report on Form 10-Q on August 6, 2014, and incorporated herein by reference). |
10.7** | Form of Notice of Grant of Restricted Stock (filed as Exhibit 10.10 to the Company’s Registration Statement on Form S-1/A on May 19, 2010, and incorporated herein by reference). |
10.8** | Form of Restricted Stock Agreement (filed as Exhibit 10.11 to the Company’s Registration Statement on Form S-1/A on May 19, 2010, and incorporated herein by reference). |
10.9** | Form of Notice of Grant of Restricted Stock Unit (filed as Exhibit 10.12 to the Company’s Registration Statement on Form S-1/A on May 19, 2010, and incorporated herein by reference). |
10.10** | Form of Notice of Grant of Restricted Stock Unit Designated as a Performance Share Unit (filed as Exhibit 10.13 to the Company’s Registration Statement on Form S-1/A on May 19, 2010, and incorporated herein by reference). |
10.11** | Form of Restricted Stock Unit Agreement (filed as Exhibit 10.14 to the Company’s Registration Statement on Form S-1/A on May 19, 2010, and incorporated herein by reference). |
10.12** | Form of Notice of Grant of Performance Share Units (filed as Exhibit 10.1 to the Company’s Current Report on Form 8-K on August 3, 2012, and incorporated herein by reference). |
10.13** | Form of Performance Share Unit Agreement (filed as Exhibit 10.2 to the Company’s Current Report on Form 8-K on August 3, 2012, and incorporated herein by reference). |
10.14** | April 20, 2012 Resignation, Consent and Appointment Agreement and Amendment Agreement (filed as Exhibit 10.1 to the Company’s Current Report on Form 8-K on April 23, 2012, and incorporated herein by reference). |
129
Exhibit No. | Description of Exhibit |
10.15** | Amended and Restated Executive Change in Control and Severance Benefit Plan dated as of March 1, 2012 (filed as Exhibit 10.4 to the Company’s Current Report on Form 8-K on March 2, 2012, and incorporated herein by reference). |
10.16 | Purchase and Sale Agreement, dated September 4, 2013, by and among Oasis Petroleum North America LLC and two undisclosed private sellers (filed as Exhibit 2.1 to the Company’s Current Report on Form 8-K on September 5, 2013, and incorporated herein by reference). |
10.17 | Second Amendment to Second Amended and Restated Credit Agreement dated as of September 30, 2014 among Oasis Petroleum Inc., as Parent, Oasis Petroleum North America LLC, as Borrower, the Other Credit Parties thereto, Wells Fargo Bank, N.A., as Administrative Agent and the Lenders party thereto (filed as Exhibit 10.1 to the Company’s Current Report on Form 8-K on October 2, 2014, and incorporated herein by reference). |
10.18 | Letter Agreement dated as of March 4, 2015 between the Company and SPO Advisory Corp. (filed as Exhibit 10.1 to the Company’s Current Report on Form 8-K on March 9, 2015, and incorporated herein by reference). |
10.19** | Third Amended and Restated Employment Agreement effective as of March 20, 2015 between Oasis Petroleum Inc. and Thomas B. Nusz (filed as Exhibit 10.1 to the Company’s Current Report on Form 8-K on March 20, 2015, and incorporated herein by reference). |
10.20** | Fourth Amended and Restated Employment Agreement effective as of March 20, 2015 between Oasis Petroleum Inc. and Taylor L. Reid (filed as Exhibit 10.2 to the Company’s Current Report on Form 8-K on March 20, 2015, and incorporated herein by reference). |
10.21** | Second Amended and Restated Employment Agreement effective as of March 20, 2015 between Oasis Petroleum Inc. and Michael H. Lou (filed as Exhibit 10.3 to the Company’s Current Report on Form 8-K on March 20, 2015, and incorporated herein by reference). |
10.22** | Second Amended and Restated Employment Agreement effective as of March 20, 2015 between Oasis Petroleum Inc. and Nickolas J. Lorentzatos (filed as Exhibit 10.4 to the Company’s Current Report on Form 8-K on March 20, 2015, and incorporated herein by reference). |
10.23 | Third Amendment to Second Amended and Restated Credit Agreement dated as of April 13, 2015 among Oasis Petroleum Inc., as Parent, Oasis Petroleum North America LLC, as Borrower, the Other Credit Parties party thereto, Wells Fargo Bank, N.A., as Administrative Agent, and the Lenders party thereto (filed as Exhibit 10.1 to the Company's Current Report on Form 8-K on April 14, 2015, and incorporated herein by reference). |
10.24 | Fourth Amendment to Second Amended and Restated Credit Agreement dated as of November 13, 2015 among Oasis Petroleum Inc., as Parent, Oasis Petroleum North America LLC, as Borrower, the Other Credit Parties party thereto, Wells Fargo Bank, N.A., as Administrative Agent and the Lenders party thereto (filed as Exhibit 10.1 to the Company’s Current Report on Form 8-K on November 18, 2015, and incorporated herein by reference). |
10.25** | First Amendment to the Amended and Restated 2010 Long Term Incentive Plan of Oasis Petroleum Inc. (filed as Exhibit 10.1 to the Company’s Current Report on Form 8-K on May 6, 2015 and incorporated herein by reference). |
10.26 | Fifth Amendment to Second Amended and Restated Credit Agreement dated as of February 23, 2016 among Oasis Petroleum Inc., as Parent, Oasis Petroleum North America LLC, as Borrower, the Other Credit Parties party thereto, Wells Fargo Bank, N.A., as Administrative Agent and the Lenders party thereto (filed as Exhibit 10.35 to the Company’s Annual Report on Form 10-K on February 25, 2016, and incorporated herein by reference). |
10.27** | Form of Notice of Grant of Performance Share Units (filed as Exhibit 10.2 to the Company’s Quarterly Report on Form 10-Q on May 10, 2016, and incorporated herein by reference). |
10.28 | Second Amendment to the Amended and Restated 2010 Long Term Incentive Plan of Oasis Petroleum Inc. (filed as Exhibit 10.1 to the Company’s Current Report on Form 8-K on May 10, 2016 and incorporated herein by reference). |
10.29 | Sixth Amendment to Second Amended and Restated Credit Agreement dated as of August 8, 2016 among Oasis Petroleum Inc., as Parent, Oasis Petroleum North America LLC, as Borrower, the Other Credit Parties party thereto, Wells Fargo Bank, N.A., as Administrative Agent and the Lenders party thereto (filed as Exhibit 10.2 to the Company’s Quarterly Report on Form 10-Q on August 9, 2016, and incorporated herein by reference). |
10.30** | Indemnification Agreement, dated July 27, 2016, between Oasis Petroleum Inc. and Mr. John E. Hagale (filed as Exhibit 10.1 to the Company’s Current Report on Form 8-K on July 29, 2016, and incorporated herein by reference). |
130
Exhibit No. | Description of Exhibit |
10.31 | Seventh Amendment to Second Amended and Restated Credit Agreement dated as of October 14, 2016 among Oasis Petroleum Inc., as Parent, Oasis Petroleum North America LLC, as Borrower, the Other Credit Parties party thereto, Wells Fargo Bank, N.A., as Administrative Agent and the Lenders party thereto (filed as Exhibit 10.1 to the Company’s Current Report on Form 8-K on October 18, 2016, and incorporated herein by reference). |
12.1(a) | Computation of Ratio of Earnings to Fixed Charges. |
21.1(a) | List of Subsidiaries of Oasis Petroleum Inc. |
23.1(a) | Consent of PricewaterhouseCoopers LLP. |
23.2(a) | Consent of DeGolyer and MacNaughton. |
31.1(a) | Sarbanes-Oxley Section 302 certification of Principal Executive Officer. |
31.2(a) | Sarbanes-Oxley Section 302 certification of Principal Financial Officer. |
32.1(b) | Sarbanes-Oxley Section 906 certification of Principal Executive Officer. |
32.2(b) | Sarbanes-Oxley Section 906 certification of Principal Financial Officer. |
99.1 | Report of DeGolyer and MacNaughton (filed as Exhibit 99.2 to the Company’s Current Report on Form 8-K on January 28, 2016 and incorporated herein by reference). |
101.INS(a) | XBRL Instance Document. |
101.SCH(a) | XBRL Schema Document. |
101.CAL(a) | XBRL Calculation Linkbase Document. |
101.DEF(a) | XBRL Definition Linkbase Document. |
101.LAB(a) | XBRL Labels Linkbase Document. |
101.PRE(a) | XBRL Presentation Linkbase Document. |
__________________
(a) | Filed herewith. |
(b) | Furnished herewith. |
** | Management contract or compensatory plan or arrangement. |
Item 16. Form 10-K Summary
Not applicable.
131
SIGNATURES
Pursuant to the requirements of Section 13 or 15(d) of the Securities Exchange Act of 1934, the registrant has duly caused this report to be signed on its behalf by the undersigned thereunto duly authorized, on February 23, 2017.
OASIS PETROLEUM INC. | ||
By: | /s/ Thomas B. Nusz | |
Thomas B. Nusz Chairman of the Board and Chief Executive Officer | ||
Pursuant to the requirements of the Securities Exchange Act of 1934, this report has been signed below by the following persons on behalf of the registrant and in the capacity and on the dates indicated:
Signature | Title | Date | ||
/s/ Thomas B. Nusz | Chairman of the Board and Chief Executive Officer (Principal Executive Officer) | February 23, 2017 | ||
Thomas B. Nusz | ||||
/s/ Taylor L. Reid | Director, President and Chief Operating Officer | February 23, 2017 | ||
Taylor L. Reid | ||||
/s/ Michael H. Lou | Executive Vice President and Chief Financial Officer (Principal Financial Officer and Principal Accounting Officer) | February 23, 2017 | ||
Michael H. Lou | ||||
/s/ William J. Cassidy | Director | February 23, 2017 | ||
William J. Cassidy | ||||
/s/ Ted Collins, Jr. | Director | February 23, 2017 | ||
Ted Collins, Jr. | ||||
/s/ John E. Hagale | Director | February 23, 2017 | ||
John E. Hagale | ||||
/s/ Michael McShane | Director | February 23, 2017 | ||
Michael McShane | ||||
/s/ Bobby S. Shackouls | Director | February 23, 2017 | ||
Bobby S. Shackouls | ||||
/s/ Douglas E. Swanson, Jr. | Director | February 23, 2017 | ||
Douglas E. Swanson, Jr. | ||||
132
GLOSSARY OF OIL AND NATURAL GAS TERMS
The terms defined in this section are used throughout this Annual Report on Form 10-K:
“Bbl.” One stock tank barrel, of 42 U.S. gallons liquid volume, used herein in reference to crude oil, condensate, natural gas liquids or fresh water.
“Bcf.” One billion cubic feet of natural gas.
“Boe.” Barrels of oil equivalent, with 6,000 cubic feet of natural gas being equivalent to one barrel of oil.
“British thermal unit.” The heat required to raise the temperature of a one-pound mass of water from 58.5 to 59.5 degrees Fahrenheit.
“Basin.” A large natural depression on the earth’s surface in which sediments generally brought by water accumulate.
“Completion.” The process of treating a drilled well followed by the installation of permanent equipment for the production of natural gas or oil, or in the case of a dry hole, the reporting of abandonment to the appropriate agency.
“Developed acreage.” The number of acres that are allocated or assignable to productive wells or wells capable of production.
“Developed reserves.” Reserves of any category that can be expected to be recovered through existing wells with existing equipment and operating methods or for which the cost of required equipment is relatively minor when compared to the cost of a new well.
“Development well.” A well drilled within the proved area of a natural gas or oil reservoir to the depth of a stratigraphic horizon known to be productive.
“Dry hole.” A well found to be incapable of producing hydrocarbons in sufficient quantities such that proceeds from the sale of such production exceed production expenses and taxes.
“Economically producible.” A resource that generates revenue that exceeds, or is reasonably expected to exceed, the costs of the operation.
“Environmental assessment.” An environmental assessment, a study that can be required pursuant to federal law to assess the potential direct, indirect and cumulative impacts of a project.
“Exploratory well.” A well drilled to find and produce natural gas or oil reserves not classified as proved, to find a new reservoir in a field previously found to be productive of natural gas or oil in another reservoir or to extend a known reservoir.
“Field.” An area consisting of a single reservoir or multiple reservoirs all grouped on, or related to, the same individual geological structural feature or stratigraphic condition. The field name refers to the surface area, although it may refer to both the surface and the underground productive formations.
“Formation.” A layer of rock which has distinct characteristics that differ from nearby rock.
“Horizontal drilling.” A drilling technique used in certain formations where a well is drilled vertically to a certain depth and then drilled at a right angle within a specified interval.
“Infill wells.” Wells drilled into the same pool as known producing wells so that oil or natural gas does not have to travel as far through the formation.
“MBbl.” One thousand barrels of crude oil, condensate, natural gas liquids or fresh water.
“MBoe.” One thousand barrels of oil equivalent.
“Mcf.” One thousand cubic feet of natural gas.
“MMBbl.” One million barrels of crude oil, condensate, natural gas liquids or fresh water.
“MMBoe.” One million barrels of oil equivalent.
133
“MMBtu.” One million British thermal units.
“MMcf.” One million cubic feet of natural gas.
“NYMEX.” The New York Mercantile Exchange.
“Net acres.” The percentage of total acres an owner has out of a particular number of acres, or a specified tract. An owner who has 50% interest in 100 acres owns 50 net acres.
“PV-10.” When used with respect to oil and natural gas reserves, PV-10 means the estimated future gross revenue to be generated from the production of proved reserves, net of estimated production and future development and abandonment costs, using prices and costs in effect at the determination date, before income taxes, and without giving effect to non-property-related expenses, discounted to a present value using an annual discount rate of 10% in accordance with the guidelines of the Commission.
“Productive well.” A well that is found to be capable of producing hydrocarbons in sufficient quantities such that proceeds from the sale of the production exceed production expenses and taxes.
“Proved developed reserves.” Proved reserves that can be expected to be recovered through existing wells with existing equipment and operating methods.
“Proved reserves.” Those quantities of oil and gas, which, by analysis of geoscience and engineering data, can be estimated with reasonable certainty to be economically producible — from a given date forward, from known reservoirs, and under existing economic conditions, operating methods, and government regulations — prior to the time at which contracts providing the right to operate expire, unless evidence indicates that renewal is reasonably certain, regardless of whether deterministic or probabilistic methods are used for the estimation. The project to extract the hydrocarbons must have commenced or the operator must be reasonably certain that it will commence the project within a reasonable time. The area of the reservoir considered as proved includes (i) the area identified by drilling and limited by fluid contacts, if any, and (ii) adjacent undrilled portions of the reservoir that can, with reasonable certainty, be judged to be continuous with it and to contain economically producible oil or gas on the basis of available geoscience and engineering data. In the absence of data on fluid contacts, proved quantities in a reservoir are limited by the lowest known hydrocarbons, LKH, as seen in a well penetration unless geoscience, engineering, or performance data and reliable technology establishes a lower contact with reasonable certainty. Where direct observation from well penetrations has defined a highest known oil, HKO, elevation and the potential exists for an associated gas cap, proved oil reserves may be assigned in the structurally higher portions of the reservoir only if geoscience, engineering, or performance data and reliable technology establish the higher contact with reasonable certainty. Reserves which can be produced economically through application of improved recovery techniques (including, but not limited to, fluid injection) are included in the proved classification when (i) successful testing by a pilot project in an area of the reservoir with properties no more favorable than in the reservoir as a whole, the operation of an installed program in the reservoir or an analogous reservoir, or other evidence using reliable technology establishes the reasonable certainty of the engineering analysis on which the project or program was based; and (ii) the project has been approved for development by all necessary parties and entities, including governmental entities. Existing economic conditions include prices and costs at which economic producibility from a reservoir is to be determined. The price shall be the average price during the 12-month period prior to the ending date of the period covered by the report, determined as an unweighted arithmetic average of the first-day-of-the-month price for each month within such period, unless prices are defined by contractual arrangements, excluding escalations based upon future conditions.
“Proved undeveloped reserves.” Proved reserves that are expected to be recovered from new wells on undrilled acreage or from existing wells where a relatively major expenditure is required for recompletion.
“Reasonable certainty.” A high degree of confidence.
“Recompletion.” The process of re-entering an existing wellbore that is either producing or not producing and completing new reservoirs in an attempt to establish or increase existing production.
“Reserves.” Estimated remaining quantities of oil and natural gas and related substances anticipated to be economically producible as of a given date by application of development prospects to known accumulations.
“Reservoir.” A porous and permeable underground formation containing a natural accumulation of producible natural gas and/or oil that is confined by impermeable rock or water barriers and is separate from other reservoirs.
“Spacing.” The distance between wells producing from the same reservoir. Spacing is often expressed in terms of acres, e.g., 40-acre spacing, and is often established by regulatory agencies.
134
“Unit.” The joining of all or substantially all interests in a reservoir or field, rather than a single tract, to provide for development and operation without regard to separate property interests. Also, the area covered by a unitization agreement.
“Wellbore.” The hole drilled by the bit that is equipped for oil or gas production on a completed well. Also called well or borehole.
“Working interest.” The right granted to the lessee of a property to explore for and to produce and own oil, gas, or other minerals. The working interest owners bear the exploration, development, and operating costs on either a cash, penalty, or carried basis.
“Workover.” The repair or stimulation of an existing productive well for the purpose of restoring, prolonging or enhancing the production of hydrocarbons.
135