Attached files
| file | filename |
|---|---|
| EX-99.1 - AAA COOPER ACQUISITION PRESS RELEASE - Knight-Swift Transportation Holdings Inc. | knx-exhibit9917062021.htm |
| 8-K - 8-K - Knight-Swift Transportation Holdings Inc. | knx-20210705.htm |

AAA Cooper Acquisition Investor Call July 6, 2021 Exhibit 99.2

2 Disclosure This presentation contains forward-looking statements within the meaning of Section 27A of the Securities Act of 1933, as amended, and Section 21E of the Securities Exchange Act of 1934, as amended. Such forward-looking statements are made pursuant to the safe harbor provisions of the Private Securities Litigation Reform Act of 1995. Forward-looking statements generally may be identified by words such as “anticipates,” “believes,” “estimates,” “plans,” “projects,” “expects,” “hopes,” “intends,” “will,” “could,” “may,” and terms and phrases of similar substance. In this presentation, forward-looking statements cover matters such as the future operations and financial performance of AAA Cooper Transportation “AAA Cooper” and Knight-Swift Transportation Holding Inc. “Knight-Swift”. Forward-looking statements are based upon the current beliefs and expectations of our management and are inherently subject to risks and uncertainties, some of which cannot be predicted or quantified, which could cause future events and actual results to differ materially from those set forth in, contemplated by, or underlying the forward- looking statements. Accordingly, actual results may differ from those set forth in the forward- looking statements. Readers should review and consider the factors that may affect future results and other disclosures by Knight Swift in its press releases, stockholder reports, Annual Report on Form 10-K, and other filings with the Securities and Exchange Commission. Knight-Swift disclaims any obligation to update or revise any forward-looking statements to reflect actual results or changes in the factors affecting the forward-looking information.

3 Non-GAAP Financial Data This presentation includes the use of adjusted earnings per share, EBITDA, and adjusted leverage ratio which are not presented in accordance with GAAP. These financial measures supplement our GAAP results in evaluating certain aspects of our business. We believe that using these measures improves comparability in analyzing our performance because they remove the impact of items from our operating results that, in our opinion, do not reflect our core operating performance. Management and the board of directors focus on these measures as key measures of our performance. We believe our presentation of these non-GAAP financial measures is useful because it provides investors and securities analysts the same information that we use internally for purposes of assessing our core operating performance. These measures are not substitutes for their comparable GAAP financial measures, such as earnings per share, net income, or other measures prescribed by GAAP. There are limitations to using non-GAAP financial measures. Although we believe that they improve comparability in analyzing our period to period performance, they could limit comparability to other companies in our industry if those companies define these measures differently. Because of these limitations, our non-GAAP financial measures should not be considered measures of income generated by our business or discretionary cash available to us to invest in the growth of our business. Management compensates for these limitations by primarily relying on GAAP results and using non-GAAP financial measures on a supplemental basis.

4 About AAA Cooper • Founded in 1950 • Headquartered in Dothan, Alabama • #15 on Transport Topics list of 2021 Top LTL carriers • Operations include less-than-truckload, dedicated, and other services • Approximately 70 Service Centers, with a terminal door count of over 3,400 • Nearly 3,000 Tractors and 7,000 Trailers • Approximately 4,800 non-unionized employees Full Year 2021 Forecast (without synergies) Revenue: $780 million EBITDA(1): $140 million Operating Income: $80 million (1) EBITDA is a non-GAAP measure. EBITDA is defined as net income (loss) before interest, income taxes, depreciation, and amortization. We cannot estimate on a forward-looking basis, the impact of certain income and expense items on EBITDA, because these items, which could be significant, may be infrequent, are difficult to predict, and may be highly variable. As a result, we do not provide a reconciliation to our estimate of EBITDA.

5 About AAA Cooper Highly respected LTL carrier • Safety leader • Recognized for service • Innovative visibility and tracking • Awarded for sustainability effort • Awarded for culture and people development

6 Structure of the Deal • Acquisition expected to be accretive to adjusted EPS by $0.13 in the second half of 2021 and $0.29 in 2022, before synergies; updated guidance will be provided during the Q2 earnings release • New Term Loan A has similar terms to Knight-Swift’s existing credit facility, Oct 2022 maturity to match existing facility Transaction Terms Transaction Value: $1.35 billion Consideration Paid: Cash $1.30 billion Knight-Swift Stock $10 million Estimated Net Debt (1) Assumed $40 million Cash Funded Through: Existing Liquidity $0.1 billion New Term Loan $1.2 billion Tax Election (Internal Rev. Code) Section 338(h)(10) (1) Net Debt is defined as amounts outstanding on revolvers, loans and notes payable, finance leases, and similar amounts outstanding under debt agreements, less unrestricted cash.

7 Knight-Swift Capital Allocation Share Buybacks and Dividends Net Capital Expenditures Acquisitions & Investments Capital Allocation 2018 – 2021(2) $1.4 Billion of Free Cash Flow(1) Supports Shareholder-Focused Capital Allocation $1.58B $1.56B $652M (1) Free cash flow is defined as cash provided by operations less net cash capital expenditures (2) Net Capital Expenditures amounts are from Q1 2018 through Q1 2021, share buyback and dividend amounts are from Q1 2018 through Q2 2021 and acquisition amounts are from Q1 2018 through Q2 2021 and include UTXL and AAA Cooper (3) Leverage Ratio is calculated in accordance with the provisions of Knight-Swift’s senior credit facility. (4) Estimated pro forma Leverage at closing (5) Leverage ratio excludes non-finance leases of $995M as of 12/31/2017, $245M as of 3/31/202021, and approximately $199M proforma close amount 1.24 0.54 1.44 0.0 0.2 0.4 0.6 0.8 1.0 1.2 1.4 1.6 12/31/2017 3/31/2021 Proforma (4) Knight-Swift Leverage History(5) Leverage Ratio(3)

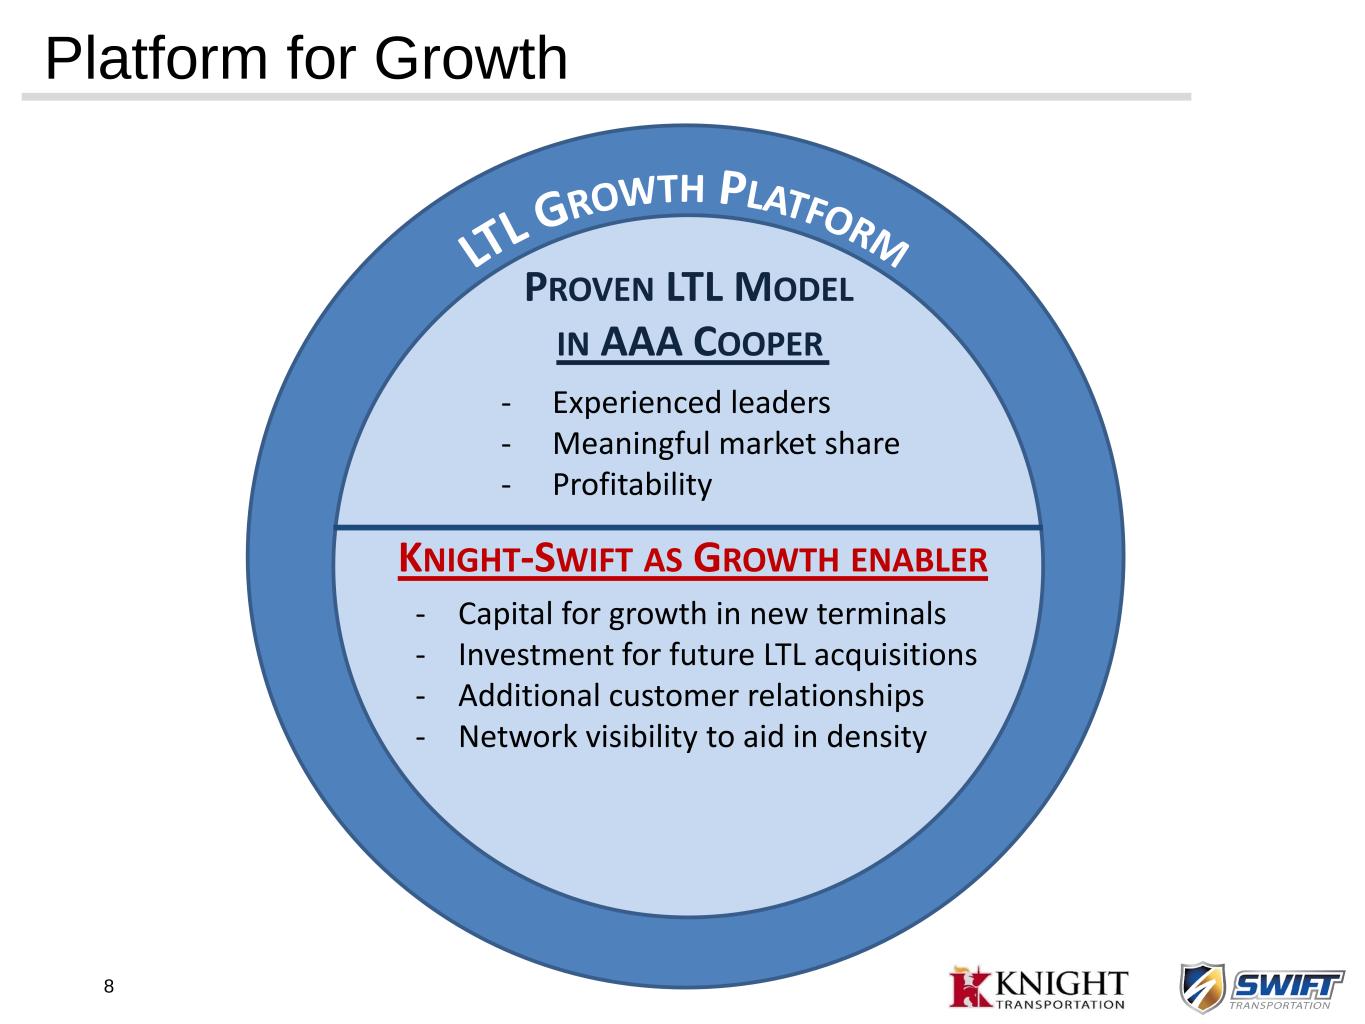
8 Platform for Growth - Experienced leaders - Meaningful market share - Profitability KNIGHT-SWIFT AS GROWTH ENABLER - Capital for growth in new terminals - Investment for future LTL acquisitions - Additional customer relationships - Network visibility to aid in density PROVEN LTL MODEL IN AAA COOPER

9 AAA Cooper Leadership • AAA Cooper will continue to run as a separate brand • Seasoned and experienced leadership team will remain • Reid Dove has also been appointed to the Knight-Swift board of directors Reid Dove • Chief Executive Officer • 27 years of transportation experience • 20 years leading the company Charlie Prickett • President and Chief Operating Officer • 32 years of transportation experience • 11 years as an Executive of AAA Cooper Michelle Lewis • Chief Financial Officer • 14 years of transportation experience • 21 years in financial leadership roles

10 Growth and Diversification • LTL will be the 2nd largest segment for Knight-Swift • Non-Truckload Trucking revenue as a percent of total expected revenue has increased from 22% to 37% Trucking Revenue, 78% Intermodal Revenue, 10% Logistics Revenue, 9% Other, 3% 2018 Segment Percentage of Revenue Trucking Revenue, 63% Intermodal Revenue, 9% Logistics Revenue, 11% Other, 3% LTL Revenue, 14% Proforma 2021 Segment Percentage of Revenue (1) (1) Assumes full year expected revenue for AAA Cooper

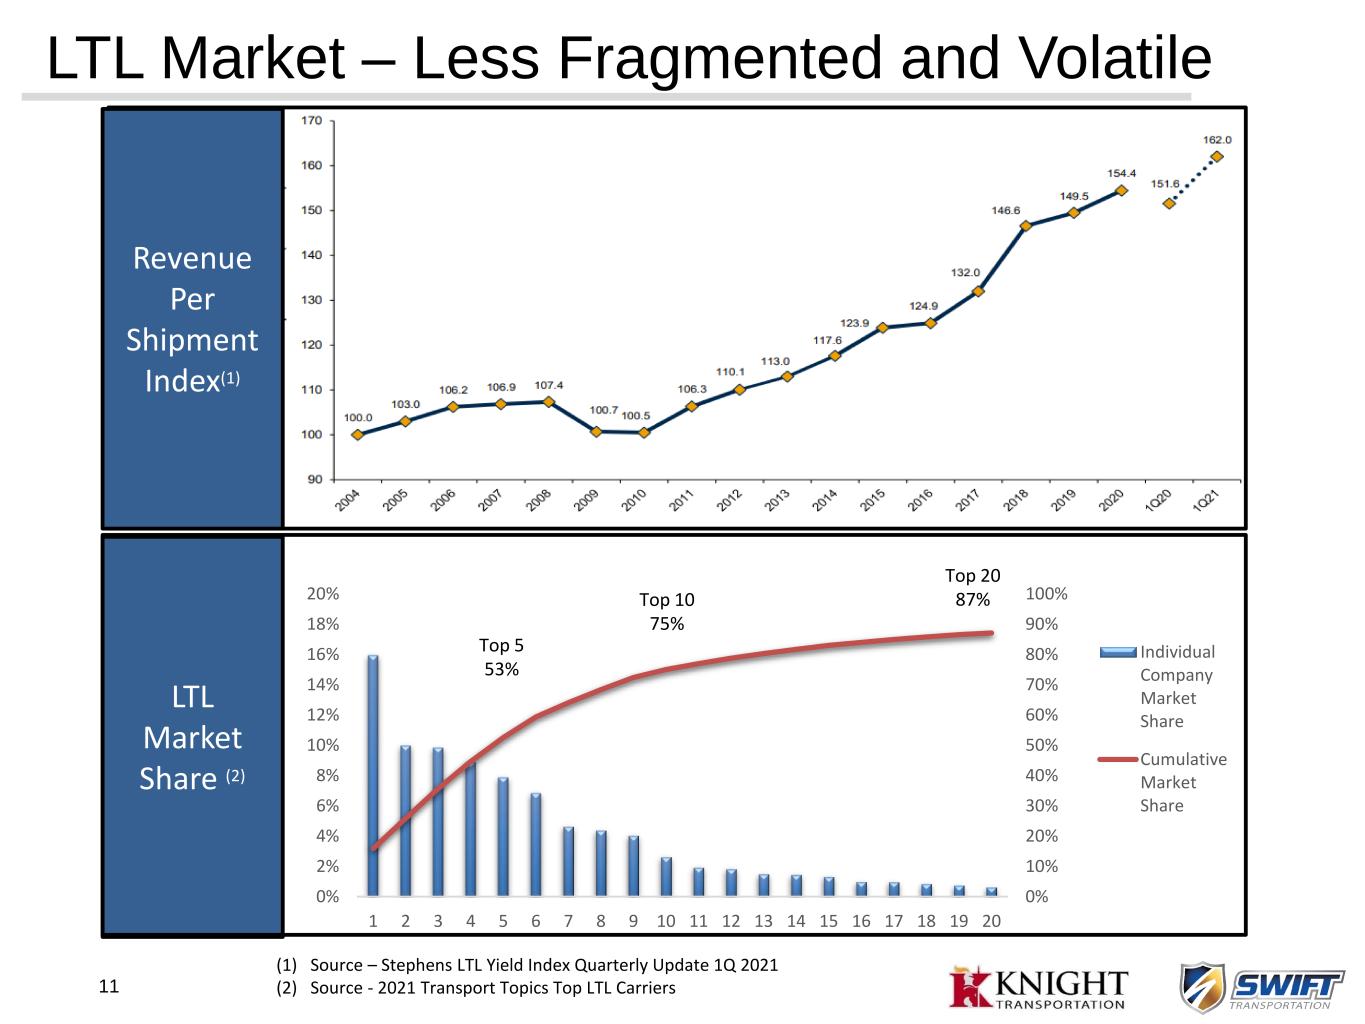
11 LTL Market – Less Fragmented and Volatile 0% 10% 20% 30% 40% 50% 60% 70% 80% 90% 100% 0% 2% 4% 6% 8% 10% 12% 14% 16% 18% 20% 1 2 3 4 5 6 7 8 9 10 11 12 13 14 15 16 17 18 19 20 Individual Company Market Share Cumulative Market Share Top 5 53% Top 10 75% Top 20 87% LTL Market Share (2) (1) Source – Stephens LTL Yield Index Quarterly Update 1Q 2021 (2) Source - 2021 Transport Topics Top LTL Carriers Revenue Per Shipment Index(1)

12 Compelling Strategic and Financial Rationale • AAA Cooper offers the scale to be a platform, the runway to improve profitability, and unmatched culture and leadership fit • LTL sector well-positioned for supply chain trends toward forward-positioned inventory and e- commerce • KNX to have leading positions across TL, Dedicated, Intermodal, Brokerage, 3rd Party Carrier Services, and now LTL services – continuing to lower cycle volatility, add growth, and deploy capital toward strong returns

Questions

14 Appendix

15 Non-GAAP Reconciliation (Unaudited): Net Leverage and Leverage Ratio 1 2 Non-GAAP Reconciliation December 31, 2017 March 31, 2021 (Dollars in thousands) Term loan $ 365,000 $ 300,000 Revolving line of credit 125,000 115,000 Accounts receivable securitization 305,000 199,000 Other secured debt and finance leases 176,549 212,376 Total face value of debt 971,549 826,376 Unrestricted cash and cash equivalents (76,649) (194,650) Non-GAAP: Net Leverage $ 894,900 $ 631,726 Non-GAAP: Adjusted EBITDA $ 721,460 $ 1,179,735 Non-GAAP: Leverage Ratio 1.24 0.54 1. Pursuant to the requirements of Regulation G, these tables reconcile consolidated GAAP net income attributable to Knight-Swift to non-GAAP consolidated EBITDA, Adjusted EBITDA, Net Leverage, and Leverage Ratio 2. Leverage Ratio is calculated in accordance with the provisions of Knight-Swift's senior credit facility.

16 1. Pursuant to the requirements of Regulation G, this table reconciles consolidated GAAP net income to consolidated non-GAAP EBITDA and Adjusted EBITDA. 2. Impairment related to the termination of Swift's implementation of a new ERP system during the quarter ended September 30, 2017. Additionally, during the quarter ended December 31, 2017, management reassessed the fair value of certain tractors within the Company's leasing subsidiary, Interstate Equipment Leasing, LLC, determining that there was a pre-tax impairment loss. 3. "Other non-cash gains, net" includes unrealized positions on equity securities, and other various items. Non-GAAP Reconciliation (Unaudited): Earnings before Interest, Taxes, Depreciation and Amortization ("EBITDA") and Adjusted EBITDA 1 Non-GAAP Reconciliation Pro-Forma December 31, 2017 GAAP: Net income $ 531,055 Adjusted for: Depreciation and amortization of property and equipment 357,705 Amortization of intangibles 52,219 Interest expense 28,398 Interest income (2,701) Income tax expense (279,468) Non-GAAP: EBITDA 687,208 Impairments 2 22,318 Stock compensation expense 16,434 Other non-cash gains, net 3 (4,500) Non-GAAP: Adjusted EBITDA $ 721,460

17 1 Pursuant to the requirements of Regulation G, this table reconciles consolidated GAAP net income to consolidated non-GAAP EBITDA and Adjusted EBITDA. 2 "Impairments" reflects the non-cash impairments: • Year-to-date 2020 includes impairments related to investments in certain alternative fuel technology (within the non-reportable segments), certain tractors (within the Trucking segment), certain legacy trailers (within the non-reportable segments) as a result of a softer used equipment market, and trailer tracking equipment (within the Trucking segment). 3 "Other non-cash gains, net" includes unrealized positions on equity securities, and other various items. Non-GAAP Reconciliation (Unaudited): Earnings before Interest, Taxes, Depreciation and Amortization ("EBITDA") and Adjusted EBITDA 1 Non-GAAP Reconciliation Year-to-Date March 31, 2021 Year-to-Date December 31, 2020 Year-to-Date March 31, 2020 TTM March 31, 2021 (Dollars in thousands) GAAP: Net income $ 129,843 $ 410,635 $ 65,783 $ 474,695 Adjusted for: Depreciation and amortization of property and equipment 119,915 460,775 110,221 470,469 Amortization of intangibles 11,749 45,895 11,474 46,170 Interest expense 3,486 17,309 6,107 14,688 Interest income (294) (1,928) (832) (1,390) Income tax expense 45,329 149,676 24,554 170,451 Non-GAAP: EBITDA 310,028 1,082,362 217,307 1,175,083 Impairments 2 — 5,335 902 4,433 Stock compensation expense 5,662 19,639 3,536 21,765 Other non-cash gains, net 3 (11,785) (4,083) 5,678 (21,546) Non-GAAP: Adjusted EBITDA $ 303,905 $ 1,103,253 $ 227,423 $ 1,179,735
