Attached files
| file | filename |
|---|---|
| EX-99.1 - EX-99.1 - BLACKSTONE MORTGAGE TRUST, INC. | d175466dex991.htm |
| 8-K - 8-K - BLACKSTONE MORTGAGE TRUST, INC. | d175466d8k.htm |
 Blackstone Mortgage Trust, Inc. First Quarter 2021 Results APRIL 28, 2021 Exhibit 99.2 |
 Blackstone | Blackstone Mortgage Trust, Inc. 1 BXMT HIGHLIGHTS (1) Represents net fundings of $693 million for the three months ended March 31, 2021.
(2) Includes $890 million of Non-Consolidated Senior Interests and investment exposure to the $696 million 2018 Single Asset
Securitization through a $79 million subordinate interest.
(3) See Appendix for a definition and reconciliation to GAAP net income.
(4) Total liquidity of $1.1 billion primarily includes $280 million of cash and $837 million of available borrowings under credit facilities. BXMT closed $1.7 billion of new loans in the first quarter, surpassing 2020 total originations and
driving nearly $700 million (1) of portfolio growth to a record $18.7 billion (2) at quarter-end 1Q ’21 GAAP EPS of $0.54 and Distributable EPS (3) of $0.59, with elevated liquidity levels positioning BXMT well for future investment opportunities $1.7B 1Q originations $1.1B total liquidity (4) 100% interest collection Focus on high conviction sectors with well-capitalized sponsors Substantial liquidity to capitalize on growing origination volume Current cash income generated from low-leverage first mortgage portfolio Strong Portfolio Growth Significant Dry Powder |
 Blackstone | Blackstone Mortgage Trust, Inc. 2 FIRST QUARTER 2021 RESULTS (1) See Appendix for a definition and reconciliation to GAAP net income.
(2) Reflects ratio of annualized first quarter Distributable Earnings to BXMT book value. GAAP Yield on Book was 8.2% for the first
quarter 2021. (3)
Includes $890 million of Non-Consolidated Senior Interests and
investment exposure to the $696 million 2018 Single Asset Securitization through a $79 million subordinate interest. (4) Reflects weighted average LTV as of the date investments were originated or acquired by BXMT.
Earnings
1Q GAAP earnings per share of $0.54 and Distributable Earnings (1) per share of $0.59; paid $0.62 per share dividend Current income from stable first mortgage portfolio generated an attractive 9.0%
yield on book
(2) relative to USD LIBOR of 0.1% 1Q GAAP EPS includes a $0.01 release of prior CECL reserves; book value per share
of $26.35 is net of a $1.25 CECL reserve primarily recorded at the
onset of COVID Portfolio
$1.7 billion of originations focused on industrial, multifamily, and
life sciences Net fundings of $693 million; $1.5 billion
of fundings outpacing $799 million of repayments during
the quarter $18.7 billion
(3) senior loan portfolio secured by institutional quality real estate in
top markets, with a weighted average origination LTV (3)(4) of 65% Consistently strong credit performance, with 100% interest collection in 1Q
Capitalization
Priced $200 million senior secured term loan add-on at L+2.25%,
in-line with highly attractive 2019 term loan
pricing Closed $1.3 billion of accretive credit facility
financing on increasingly favorable terms across multiple
counterparties and currencies Issued $1.0 billion CLO post
quarter-end, adding well-structured and efficiently
priced asset-level leverage and increasing total CLOs outstanding
to $3.5 billion |
 Blackstone | Blackstone Mortgage Trust, Inc. 3 EARNINGS 1Q GAAP earnings per share of $0.54 and Distributable Earnings (1) per share of $0.59 $1.1 billion (2) of liquidity supports significant potential portfolio growth within existing capital base which represents
embedded earnings power
(1) See Appendix for a definition and reconciliation to GAAP net income.
(2) Total liquidity of $1.1 billion primarily includes $280 million of cash and $837 million of available borrowings under credit
facilities. Track Record of Portfolio
Growth ($ in billions)
Historical Portfolio
Growth Potential
with Existing Capital |
 Blackstone | Blackstone Mortgage Trust, Inc. 4 PORTFOLIO $1.7 billion of loans originated in 1Q; 83% new acquisition loans as transaction activity increases
92% of loans backed by assets in industrial, multifamily and life
sciences sectors Origination Volume
($ in billions)
1Q Originations Collateral Profile
$1.3 $1.7 1Q '20 1Q '21 +33% Industrial 33% Multifamily 31% Life Sciences 28% Office 8% $1.7B 1Q originations |
 Blackstone | Blackstone Mortgage Trust, Inc. 5 PORTFOLIO (1) Includes $890 million of Non-Consolidated Senior Interests and investment exposure to the $696 million 2018 Single Asset
Securitization through a $79 million subordinate interest.
(2) States and countries comprising less than 1% of total loan portfolio are excluded.
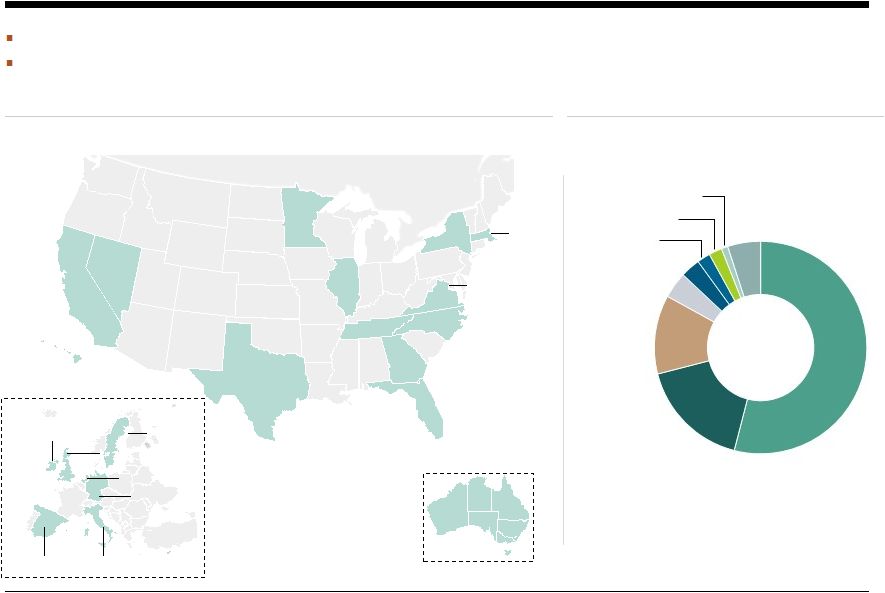
$18.7 billion
(1) senior loan portfolio comprising 122 investments Continued strong portfolio credit with 98% of loans performing and 100% interest collected when due
Major Market Focus
(1)(2)
Collateral Diversification
(1)
$18.7B portfolio AU, 1% CA 14% MN 1% NV 1% TX 3% IL 4% TN, 1% GA 4% FL 5% NY 20% VA, 4% DC, 2% HI, 3% DEU, 1% IT, 1% NL, 1% UK, 12% IR, 7% ES, 6% SE, 2% NC, 1% MA, 2% Office 54% Other 5% Condo 1% Self-Storage 2% Life Sciences 2% Retail 3% Industrial 4% Multifamily 12% Hospitality 17% |
 Blackstone | Blackstone Mortgage Trust, Inc. (1) Excludes notes sold from the $1 billion CLO issuance in April 2021.
6 CAPITALIZATION BXMT continues to diversify and optimize its balance sheet with market leading financing executions
Favorable terms achieved are reflective of return to pre-pandemic
levels of liquidity and pricing for top-tier issuers
$14.9B financings Diversified Financing Sources (outstanding balance) Capital Markets Activity Term Loan B: Priced $200 million add-on to $737 million A-1 tranche (L+2.25% / 2026) at level consistent with previous best execution in 4Q 2019 Securitizations: Post quarter-end, closed $1.0 billion BXMT 2021 FL-4 transaction, the fourth in BXMT’s uniquely tailored CLO program Secured Debt Agreements: Closed $1.3 billion of credit facility financings across multiple counterparties and currencies driving increasingly favorable economics and structure Convertibles Notes, 4% Term Loan B, 8% Asset-Specific Financings, 9% Securitizations (1) 24% Secured Debt Agreements 55% |
 Blackstone | Blackstone Mortgage Trust, Inc. Appendix 7 |
 Blackstone | Blackstone Mortgage Trust, Inc. $18.0 $18.7 $1.5 $0.8 4Q ’20 Loans Outstanding Fundings Repayments 1Q ’21 Loans Outstanding 8 APPENDIX (1) Primarily represents the repatriation of net interest income earned during the quarter from non-USD investments. The difference
between the value of such income on the date of conversion to USD and our cumulative basis in such income is not included in GAAP net income, but rather as a component of Other Comprehensive Income
on our consolidated balance sheet. (2)
Adjusted to reflect $0.2 billion of non-cash fluctuations in foreign
currency rates during the period for comparability to our total loan portfolio as of March 31, 2021. (3) Includes $802 million of Non-Consolidated Senior Interests and investment exposure to the $736 million 2018 Single Asset
Securitization through a $79 million subordinate interest.
(4) Includes $890 million of Non-Consolidated Senior Interests and investment exposure to the $696 million 2018 Single Asset
Securitization through a $79 million subordinate interest. Net Fundings ($ in billions) 1Q 2021 Operating Results ($ in millions) $0.54 net income per share $0.59 distributable earnings per share (2)(3) (4) GAAP Net Income Adjustments Distributable Earnings Interest income $187.5 $ - $187.5 Interest expense (78.4) - (78.4) Management and incentive fees (19.2) - (19.2) General and administrative expenses and taxes (2.6) - (2.6) Decrease in current expected credit loss reserve 1.3 (1.3) - Non-cash compensation (8.1) 8.1 - Realized hedging and foreign currency income, net (1) - 0.2 0.2 Net income attributable to non- controlling interests (0.6) - (0.6) Total $79.9 $7.0 $86.9 |
 Blackstone | Blackstone Mortgage Trust, Inc. APPENDIX (1) Portfolio excludes our $79 million subordinate interest in the $696 million 2018 Single Asset Securitization.
(2) Date loan was originated or acquired by us, and the LTV as of such date. Origination dates are subsequently updated to reflect
material loan modifications. (3)
In certain instances, loans are financed through the non-recourse
sale of a senior loan interest that is not included in the consolidated financial statements. As of March 31, 2021, five loans in the portfolio have been financed with an aggregate $890 million of Non-Consolidated Senior Interests, which are included in the
table above. (4)
Maximum maturity assumes all extension options are exercised; however,
floating rate loans generally may be repaid prior to their final maturity without penalty. (5) This loan is accounted for under the cost recovery method. (6) Consists of both floating and fixed rates. Coupon and all-in yield assume applicable floating benchmark rates for
weighted-average calculation. Excludes loans under the cost-recovery method. 9 Portfolio Details (1) ($ in millions) Origination Total Principal Net Book Maximum Property Loan Per Origination Loan Type Date (2) Loan (3) Balance (3) Value Maturity (4) Location Type SQFT / Unit / Key LTV (2) Loan 1 Senior loan 8/14/2019 $ 1,265 $ 1,265 $ 1,259 L + 2.50 % L + 2.84 % 12/23/2024 Dublin - IE Office $460 / sqft 74 % Loan 2 Senior loan 3/22/2018 922 922 920 L + 3.25 % L + 3.42 % 3/15/2023 Diversified - Spain Mixed-Use n/a 71 % Loan 3 Senior loan 11/25/2019 724 655 656 L + 2.30 % L + 2.59 % 12/9/2024 New York Office $939 / sqft 65 % Loan 4 Senior loan 5/11/2017 647 620 620 L + 3.40 % L + 3.57 % 6/10/2023 Washington DC Office $304 / sqft 62 % Loan 5 Senior loan 8/22/2018 363 363 362 L + 3.15 % L + 3.49 % 8/9/2023 Maui Hospitality $471,391 / key 61 % Loan 6 Senior loan 3/30/2021 572 360 356 L + 3.20 % L + 3.41 % 5/15/2026 Diversified - SE Industrial $66 / sqft 76 % Loan 7 Senior loan 10/23/2018 352 349 349 L + 3.40 % L + 3.53 % 1/24/2022 New York Mixed-Use $591 / sqft 65 % Loan 8 Senior loan 4/11/2018 355 345 344 L + 2.85 % L + 3.10 % 5/1/2023 New York Office $437 / sqft 71 % Loan 9 Senior loan (3) 8/7/2019 746 341 67 L + 3.12 % L + 3.55 % 9/9/2025 Los Angeles Office $230 / sqft 59 % Loan 10 Senior loan (3) 8/6/2015 334 334 61 5.74 % 5.85 % 10/29/2022 Diversified - EUR Other n/a 71 % Loan 11 Senior loan 1/11/2019 331 331 328 L + 4.35 % L + 4.70 % 1/11/2026 Diversified - UK Other $327 / sqft 74 % Loan 12 Senior loan 3/16/2021 491 307 303 L + 3.85 % L + 4.15 % 4/9/2026 Boston Life Sciences $759 / sqft 66 % Loan 13 Senior loan 2/27/2020 300 288 286 L + 2.70 % L + 3.03 % 3/9/2025 New York Mixed-Use $904 / sqft 59 % Loan 14 Senior loan 11/30/2018 286 286 285 n/m (5) n/m (5) 8/9/2025 New York Hospitality $306,870 / key 73 % Loan 15 Senior loan 9/30/2019 306 280 280 L + 3.66 % L + 3.75 % 9/9/2024 Chicago Office $243 / sqft 58 % Loans 16 - 121 Senior loans (3) Various 14,213 10,988 10,585 L + 3.35 % (6) L + 3.71 % (6) Various Various Various Various 63 % CECL reserve (172) Total/Wtd. avg. $ 22,207 $ 18,033 $ 16,888 L + 3.28 % (6) L + 3.62 % (6) 3.1 yrs 65 % Cash All-in Coupon Yield |
 Blackstone | Blackstone Mortgage Trust, Inc. APPENDIX 10 Consolidated Balance Sheets ($ in thousands, except per share data) March 31, 2021 December 31, 2020 Assets Cash and cash equivalents $280,126 $289,970 Loans receivable 17,060,102 16,572,715 Current expected credit loss reserve (172,100) (173,549) Loans receivable, net 16,888,002 16,399,166 Other assets 186,582 269,819 Total assets $17,354,710 $16,958,955 Liabilities and equity Secured debt agreements, net $8,124,787 $7,880,536 Securitized debt obligations, net 2,875,241 2,922,499 Asset-specific debt agreements, net 430,448 391,269 Secured term loans, net 1,235,808 1,041,704 Convertible notes, net 617,242 616,389 Other liabilities 167,091 202,327 Total liabilities 13,450,617 13,054,724 Commitments and contingencies — — Equity Class A common stock, $0.01 par value 1,470 1,468 Additional paid-in capital 4,710,986 4,702,713 Accumulated other comprehensive income 11,284 11,170 Accumulated deficit (840,717) (829,284) Total Blackstone Mortgage Trust, Inc. stockholders’equity 3,883,023 3,886,067 Non-controlling interests 21,070 18,164 Total equity 3,904,093 3,904,231 Total liabilities and equity $17,354,710 $16,958,955 |
 Blackstone | Blackstone Mortgage Trust, Inc. APPENDIX 11 Consolidated Statements of Operations ($ in thousands, except per share data) 2021 2020 Income from loans and other investments Interest and related income $187,524 $204,875 Less: Interest and related expenses 78,372 104,239 Income from loans and other investments, net 109,152 100,636 Other expenses Management and incentive fees 19,207 19,277 General and administrative expenses 10,597 11,791 Total other expenses 29,804 31,068 Decrease (increase) in current expected credit loss reserve 1,293 (122,702) Income (loss) before income taxes 80,641 (53,134) Income tax provision 101 149 Net income (loss) 80,540 (53,283) Net income attributable to non-controlling interests (638) (67) Net income (loss) attributable to Blackstone Mortgage Trust, Inc. $79,902 $(53,350) Per share information (basic and diluted) Weighted-average shares of common stock outstanding 147,336,936 135,619,264 Three Months Ended March 31, Net income (loss) per share of common stock $0.54 $(0.39) |
 Blackstone | Blackstone Mortgage Trust, Inc. APPENDIX (1) Represents net income attributable to Blackstone Mortgage Trust, Inc.
(2) Primarily represents the repatriation of net interest income earned during the quarter from non-USD investments. The difference
between the value of such income on the date of conversion to USD and our cumulative basis in such income is not included in GAAP net income, but rather as a component of Other Comprehensive Income
on our consolidated balance sheet. 12
Per Share Calculations
(in thousands, except per share data)
Distributable Earnings
Reconciliation
Book Value
per Share
Earnings
per Share
March 31, 2021
December 31, 2020
Net income
(1) $79,902 $83,616 Decrease in current expected credit loss reserve (1,293) (5,813) Non-cash compensation expense 8,085 8,554 Realized hedging and foreign currency income, net (2) 172 582 Other items 130 921 Adjustments attributable to non-controlling interests, net (47) 74 Distributable Earnings $86,949 $87,934 Weighted-average shares outstanding, basic and diluted 147,337 146,675 Distributable Earnings per share, basic and diluted $0.59 $0.60 Three Months Ended March 31, 2021 December 31, 2020 Stockholders' equity $3,883,023 $3,886,067 Shares Class A common stock 147,031 146,780 Deferred stock units 318 307 Total outstanding 147,349 147,087 Book value per share $26.35 $26.42 Three Months Ended March 31, 2021 December 31, 2020 Net income (1) $79,902 $83,616 Weighted-average shares outstanding, basic and diluted 147,337 146,675 Per share amount, basic and diluted $0.54 $0.57 Three Months Ended |
 Blackstone | Blackstone Mortgage Trust, Inc. DEFINITIONS 13 Distributable Earnings: Blackstone Mortgage Trust, Inc. (“BXMT”) discloses Distributable Earnings in this presentation. Distributable Earnings is a financial measure that is calculated and presented on the basis of methodologies other than in accordance with generally accepted accounting principles in the United States of America (“GAAP”). Distributable Earnings is a non-GAAP measure, which we define as GAAP net income (loss), including realized gains and losses not otherwise included in GAAP net income (loss), and excluding (i) non-cash equity compensation expense, (ii) depreciation and amortization, (iii) unrealized gains (losses), and (iv) certain non-cash items. Distributable Earnings may also be adjusted from time to time to exclude one-time events pursuant to changes in GAAP and certain other non-cash charges as determined by our Manager, subject to approval by a majority of our independent directors. During the three months ended March 31, 2021, we recorded an $1.3 million decrease in current expected credit loss reserve, or CECL reserve, which has been excluded from Distributable Earnings consistent with other unrealized gains (losses) pursuant to our existing policy for reporting Distributable Earnings and the terms of the management agreement between our Manager and us. We believe that Distributable Earnings provides meaningful information to consider in addition to our net income and cash flow from operating activities determined in accordance with GAAP. This adjusted measure helps us to evaluate our performance excluding the effects of certain transactions and GAAP adjustments that we believe are not necessarily indicative of our current loan portfolio and operations. We believe Distributable Earnings is a useful financial metric for existing and potential future holders of our class A common stock as historically, over time, Distributable Earnings has been a strong indicator of our dividends per share. Distributable Earnings mirrors the terms of our management agreement between our Manager and us for purposes of calculating our incentive fee expense. Distributable Earnings does not represent net income or cash generated from operating activities and should not be considered as an alternative to GAAP net income, or an indication of our GAAP cash flows from operations, a measure of our liquidity, or an indication of funds available for our cash needs. In addition, our methodology for calculating Distributable Earnings may differ from the methodologies employed by other companies to calculate the same or similar supplemental performance measures, and accordingly, our reported Distributable Earnings may not be comparable to the Distributable Earnings reported by other companies. Non-Consolidated Senior Interests: Senior interests in loans originated and syndicated to third parties. These non-recourse loan participations, which are excluded from the GAAP balance sheet, constitute additional financing capacity and are included in discussions of the loan portfolio. Non-Consolidated Securitized Debt Obligations: Senior securitized debt held by third-parties in the 2018 Single Asset Securitization. These non-recourse securitized debt obligations, which are excluded from the GAAP balance sheet, constitute additional financing capacity and are included in discussions of the loan portfolio. |
 Blackstone | Blackstone Mortgage Trust, Inc. FORWARD-LOOKING STATEMENTS 14 This presentation may contain forward-looking statements within the meaning of Section 27A of the Securities Act of 1933, as amended, and Section 21E of the Securities Exchange Act of 1934, as amended, which reflect BXMT’s current views with respect to, among other things, its operations and financial performance, its business plans and the impact of the COVID-19 pandemic. You can identify these forward-looking statements by the use of words such as “outlook,” “objective,” “indicator,” “believes,” “expects,” “potential,” “continues,” “may,” “will,” “should,” “seeks,” “predicts,” “intends,” “plans,” “estimates,” “anticipates” or the negative version of these words or other comparable words. Such forward-looking statements are subject to various risks and uncertainties. Accordingly, there are or will be important factors that could cause actual outcomes or results to differ materially from those indicated in these statements. BXMT believes these factors include but are not limited to those described under the section entitled “Risk Factors” in its Annual Report on Form 10-K for the fiscal year ended December 31, 2020, as such factors may be further updated from time to time in its periodic filings with the Securities and Exchange Commission (“SEC”) which are accessible on the SEC’s website at www.sec.gov. These factors should not be construed as exhaustive and should be read in conjunction with the other cautionary statements that are included in this presentation and in the filings. BXMT assumes no obligation to update or supplement forward-looking statements that become untrue because of subsequent events or circumstances. |