Attached files
| file | filename |
|---|---|
| EX-32.2 - EX-32.2 - BLACKSTONE MORTGAGE TRUST, INC. | d598720dex322.htm |
| EX-32.1 - EX-32.1 - BLACKSTONE MORTGAGE TRUST, INC. | d598720dex321.htm |
| EX-31.2 - EX-31.2 - BLACKSTONE MORTGAGE TRUST, INC. | d598720dex312.htm |
| EX-31.1 - EX-31.1 - BLACKSTONE MORTGAGE TRUST, INC. | d598720dex311.htm |
| EX-10.2 - EX-10.2 - BLACKSTONE MORTGAGE TRUST, INC. | d598720dex102.htm |
| EX-10.1 - EX-10.1 - BLACKSTONE MORTGAGE TRUST, INC. | d598720dex101.htm |
Table of Contents
UNITED STATES
SECURITIES AND EXCHANGE COMMISSION
WASHINGTON, D.C. 20549
FORM 10-Q
(Mark One)
| ☒ | QUARTERLY REPORT PURSUANT TO SECTION 13 OR 15(d) OF THE SECURITIES EXCHANGE ACT OF 1934 |
FOR THE QUARTERLY PERIOD ENDED JUNE 30, 2018
OR
| ☐ | TRANSITION REPORT PURSUANT TO SECTION 13 OR 15(d) OF THE SECURITIES EXCHANGE ACT OF 1934 |
FOR THE TRANSITION PERIOD FROM TO
Commission File Number: 001-14788

Blackstone Mortgage Trust, Inc.
(Exact name of Registrant as specified in its charter)
| Maryland | 94-6181186 | |
| (State or other jurisdiction of incorporation or organization) |
(I.R.S. Employer Identification No.) |
345 Park Avenue, 42nd Floor
New York, New York 10154
(Address of principal executive offices)(Zip Code)
(212) 655-0220
(Registrant’s telephone number, including area code)
N/A
(Former name, former address and former fiscal year, if changed since last report)
Indicate by check mark whether the Registrant (1) has filed all reports required to be filed by Section 13 or 15(d) of the Securities Exchange Act of 1934 during the preceding 12 months (or for such shorter period that the Registrant was required to file such reports), and (2) has been subject to such filing requirements for the past 90 days. Yes ☒ No ☐
Indicate by check mark whether the Registrant has submitted electronically and posted on its corporate Web site, if any, every Interactive Data File required to be submitted and posted pursuant to Rule 405 of Regulation S-T (§232.405 of this chapter) during the preceding 12 months (or for such shorter period that the registrant was required to submit and post such files). Yes ☒ No ☐
Indicate by check mark whether the Registrant is a large accelerated filer, an accelerated filer, a non-accelerated filer, a smaller reporting company, or an emerging growth company. See the definitions of “large accelerated filer,” “accelerated filer,” “smaller reporting company” and “emerging growth company” in Rule 12b-2 of the Exchange Act.
| Large accelerated filer | ☒ | Accelerated filer | ☐ | |||
| Non-accelerated filer | ☐ (Do not check if a smaller reporting company) | Smaller reporting company | ☐ | |||
| Emerging growth company | ☐ | |||||
If an emerging growth company, indicate by check mark if the Registrant has elected not to use the extended transition period for complying with any new or revised financial accounting standards provided pursuant to Section 13(a) of the Exchange Act. ☐
Indicate by check mark whether the Registrant is a shell company (as defined in Rule 12b-2 of the Exchange Act). Yes ☐ No ☒
The number of the Registrant’s outstanding shares of class A common stock, par value $0.01 per share, outstanding as of July 17, 2018 was 111,442,291.
Table of Contents
| PART I. |
||||||
| ITEM 1. |
2 | |||||
| Consolidated Financial Statements (Unaudited): |
||||||
| Consolidated Balance Sheets as of June 30, 2018 and December 31, 2017 |
2 | |||||
| Consolidated Statements of Operations for the Three and Six Months Ended June 30, 2018 and 2017 |
3 | |||||
| 4 | ||||||
| Consolidated Statements of Changes in Equity for the Six Months Ended June 30, 2018 and 2017 |
5 | |||||
| Consolidated Statements of Cash Flows for the Six Months Ended June 30, 2018 and 2017 |
6 | |||||
| 8 | ||||||
| ITEM 2. |
MANAGEMENT’S DISCUSSION AND ANALYSIS OF FINANCIAL CONDITION AND RESULTS OF OPERATIONS |
40 | ||||
| ITEM 3. |
59 | |||||
| ITEM 4. |
61 | |||||
| PART II. |
||||||
| ITEM 1. |
62 | |||||
| ITEM 1A. |
62 | |||||
| ITEM 2. |
62 | |||||
| ITEM 3. |
62 | |||||
| ITEM 4. |
62 | |||||
| ITEM 5. |
62 | |||||
| ITEM 6. |
63 | |||||
| 65 | ||||||
Table of Contents
Blackstone Mortgage Trust, Inc.
Consolidated Balance Sheets (Unaudited)
(in thousands, except share data)
| June 30, | December 31, | |||||||
| 2018 | 2017 | |||||||
| Assets |
||||||||
| Cash and cash equivalents |
$ | 107,057 | $ | 69,654 | ||||
| Restricted cash |
— | 32,864 | ||||||
| Loans receivable, net |
12,214,565 | 10,056,732 | ||||||
| Other assets |
60,725 | 99,575 | ||||||
|
|
|
|
|
|||||
| Total Assets |
$ | 12,382,347 | $ | 10,258,825 | ||||
|
|
|
|
|
|||||
| Liabilities and Equity |
||||||||
| Secured debt agreements, net |
$ | 7,022,500 | $ | 5,273,855 | ||||
| Loan participations sold, net |
152,855 | 80,415 | ||||||
| Securitized debt obligations, net |
1,283,311 | 1,282,412 | ||||||
| Convertible notes, net |
779,416 | 563,911 | ||||||
| Other liabilities |
115,603 | 140,826 | ||||||
|
|
|
|
|
|||||
| Total Liabilities |
9,353,685 | 7,341,419 | ||||||
|
|
|
|
|
|||||
| Commitments and contingencies |
— | — | ||||||
| Equity |
||||||||
| Class A common stock, $0.01 par value, 200,000,000 shares authorized, 111,441,888 and 107,883,860 shares issued and outstanding as of June 30, 2018 and December 31, 2017, respectively |
1,114 | 1,079 | ||||||
| Additional paid-in capital |
3,624,767 | 3,506,861 | ||||||
| Accumulated other comprehensive loss |
(32,136 | ) | (29,706 | ) | ||||
| Accumulated deficit |
(570,265 | ) | (567,168 | ) | ||||
|
|
|
|
|
|||||
| Total Blackstone Mortgage Trust, Inc. stockholders’ equity |
3,023,480 | 2,911,066 | ||||||
| Non-controlling interests |
5,182 | 6,340 | ||||||
|
|
|
|
|
|||||
| Total Equity |
3,028,662 | 2,917,406 | ||||||
|
|
|
|
|
|||||
| Total Liabilities and Equity |
$ | 12,382,347 | $ | 10,258,825 | ||||
|
|
|
|
|
|||||
Note: The consolidated balance sheets as of June 30, 2018 and December 31, 2017 include assets of consolidated variable interest entities, or VIEs, that can only be used to settle obligations of each respective VIE, and liabilities of consolidated VIEs for which creditors do not have recourse to Blackstone Mortgage Trust, Inc. As of both June 30, 2018 and December 31, 2017, assets of the VIEs totaled $1.5 billion and liabilities of the VIEs totaled $1.3 billion. Refer to Note 15 for additional discussion of the VIEs.
See accompanying notes to consolidated financial statements.
2
Table of Contents
Blackstone Mortgage Trust, Inc.
Consolidated Statements of Operations (Unaudited)
(in thousands, except share and per share data)
| Three Months Ended June 30, |
Six Months Ended June 30, |
|||||||||||||||
| 2018 | 2017 | 2018 | 2017 | |||||||||||||
| Income from loans and other investments |
||||||||||||||||
| Interest and related income |
$ | 191,479 | $ | 126,825 | $ | 346,904 | $ | 245,341 | ||||||||
| Less: Interest and related expenses |
87,733 | 54,352 | 157,722 | 101,026 | ||||||||||||
|
|
|
|
|
|
|
|
|
|||||||||
| Income from loans and other investments, net |
103,746 | 72,473 | 189,182 | 144,315 | ||||||||||||
| Other expenses |
||||||||||||||||
| Management and incentive fees |
22,388 | 14,393 | 37,880 | 27,314 | ||||||||||||
| General and administrative expenses |
8,747 | 7,373 | 17,454 | 14,800 | ||||||||||||
|
|
|
|
|
|
|
|
|
|||||||||
| Total other expenses |
31,135 | 21,766 | 55,334 | 42,114 | ||||||||||||
|
|
|
|
|
|
|
|
|
|||||||||
| Income before income taxes |
72,611 | 50,707 | 133,848 | 102,201 | ||||||||||||
| Income tax provision |
104 | 94 | 224 | 183 | ||||||||||||
|
|
|
|
|
|
|
|
|
|||||||||
| Net income |
72,507 | 50,613 | 133,624 | 102,018 | ||||||||||||
|
|
|
|
|
|
|
|
|
|||||||||
| Net income attributable to non-controlling interests |
(195 | ) | — | (353 | ) | — | ||||||||||
| Net income attributable to Blackstone Mortgage Trust, Inc. |
$ | 72,312 | $ | 50,613 | $ | 133,271 | $ | 102,018 | ||||||||
|
|
|
|
|
|
|
|
|
|||||||||
| Net income per share of common stock basic and diluted |
$ | 0.66 | $ | 0.53 | $ | 1.23 | $ | 1.07 | ||||||||
|
|
|
|
|
|
|
|
|
|||||||||
| Weighted-average shares of common stock outstanding, basic and diluted |
109,069,078 | 95,005,873 | 108,735,193 | 94,999,664 | ||||||||||||
|
|
|
|
|
|
|
|
|
|||||||||
| Dividends declared per share of common stock |
$ | 0.62 | $ | 0.62 | $ | 1.24 | $ | 1.24 | ||||||||
|
|
|
|
|
|
|
|
|
|||||||||
See accompanying notes to consolidated financial statements.
3
Table of Contents
Blackstone Mortgage Trust, Inc.
Consolidated Statements of Comprehensive Income (Unaudited)
(in thousands)
| Three Months Ended June 30, |
Six Months Ended June 30, |
|||||||||||||||
| 2018 | 2017 | 2018 | 2017 | |||||||||||||
| Net income |
$ | 72,507 | $ | 50,613 | $ | 133,624 | $ | 102,018 | ||||||||
| Other comprehensive income |
||||||||||||||||
| Unrealized (loss) gain on foreign currency remeasurement |
(35,088 | ) | 20,045 | (24,350 | ) | 27,815 | ||||||||||
| Realized and unrealized gain (loss) on derivative financial instruments |
24,855 | (8,196 | ) | 21,920 | (12,121 | ) | ||||||||||
|
|
|
|
|
|
|
|
|
|||||||||
| Other comprehensive (loss) income |
(10,233 | ) | 11,849 | (2,430 | ) | 15,694 | ||||||||||
|
|
|
|
|
|
|
|
|
|||||||||
| Comprehensive income |
62,274 | 62,462 | 131,194 | 117,712 | ||||||||||||
| Comprehensive income attributable to non-controlling interests |
(195 | ) | — | (353 | ) | — | ||||||||||
|
|
|
|
|
|
|
|
|
|||||||||
| Comprehensive income attributable to Blackstone Mortgage Trust, Inc. |
$ | 62,079 | $ | 62,462 | $ | 130,841 | $ | 117,712 | ||||||||
|
|
|
|
|
|
|
|
|
|||||||||
See accompanying notes to consolidated financial statements.
4
Table of Contents
Blackstone Mortgage Trust, Inc.
Consolidated Statements of Changes in Equity (Unaudited)
(in thousands)
| Blackstone Mortgage Trust, Inc. | ||||||||||||||||||||||||||||
| Class A Common Stock |
Additional Paid-In Capital |
Accumulated Other Comprehensive (Loss) Income |
Accumulated Deficit |
Stockholders’ Equity |
Non-controlling Interests |
Total Equity |
||||||||||||||||||||||
| Balance at December 31, 2016 |
$ | 945 | $ | 3,089,997 | $ | (56,202 | ) | $ | (541,137 | ) | $ | 2,493,603 | $ | — | $ | 2,493,603 | ||||||||||||
| Shares of class A common stock issued, net |
3 | — | — | — | 3 | — | 3 | |||||||||||||||||||||
| Restricted class A common stock earned |
— | 11,675 | — | — | 11,675 | — | 11,675 | |||||||||||||||||||||
| Issuance of convertible notes |
— | 856 | — | — | 856 | — | 856 | |||||||||||||||||||||
| Dividends reinvested |
— | 213 | — | (197 | ) | 16 | — | 16 | ||||||||||||||||||||
| Deferred directors’ compensation |
— | 188 | — | — | 188 | — | 188 | |||||||||||||||||||||
| Other comprehensive income |
— | — | 15,694 | — | 15,694 | — | 15,694 | |||||||||||||||||||||
| Net income |
— | — | — | 102,018 | 102,018 | — | 102,018 | |||||||||||||||||||||
| Dividends declared on common stock |
— | — | — | (117,580 | ) | (117,580 | ) | — | (117,580 | ) | ||||||||||||||||||
|
|
|
|
|
|
|
|
|
|
|
|
|
|
|
|||||||||||||||
| Balance at June 30, 2017 |
$ | 948 | $ | 3,102,929 | $ | (40,508 | ) | $ | (556,896 | ) | $ | 2,506,473 | $ | — | $ | 2,506,473 | ||||||||||||
|
|
|
|
|
|
|
|
|
|
|
|
|
|
|
|||||||||||||||
| Balance at December 31, 2017 |
$ | 1,079 | $ | 3,506,861 | $ | (29,706 | ) | $ | (567,168 | ) | $ | 2,911,066 | $ | 6,340 | $ | 2,917,406 | ||||||||||||
| Shares of class A common stock issued, net |
35 | 102,463 | — | — | 102,498 | — | 102,498 | |||||||||||||||||||||
| Restricted class A common stock earned |
— | 13,501 | — | — | 13,501 | — | 13,501 | |||||||||||||||||||||
| Issuance of convertible notes |
— | 1,462 | — | — | 1,462 | — | 1,462 | |||||||||||||||||||||
| Conversion of convertible notes |
— | (20 | ) | — | — | (20 | ) | — | (20 | ) | ||||||||||||||||||
| Dividends reinvested |
— | 250 | — | (223 | ) | 27 | — | 27 | ||||||||||||||||||||
| Deferred directors’ compensation |
— | 250 | — | — | 250 | — | 250 | |||||||||||||||||||||
| Other comprehensive income |
— | — | (2,430 | ) | — | (2,430 | ) | — | (2,430 | ) | ||||||||||||||||||
| Net income |
— | — | — | 133,271 | 133,271 | 353 | 133,624 | |||||||||||||||||||||
| Dividends declared on common stock |
— | — | — | (136,145 | ) | (136,145 | ) | — | (136,145 | ) | ||||||||||||||||||
| Contributions from non-controlling interests |
— | — | — | — | — | 2,475 | 2,475 | |||||||||||||||||||||
| Distributions to non-controlling interests |
— | — | — | — | — | (3,986 | ) | (3,986 | ) | |||||||||||||||||||
|
|
|
|
|
|
|
|
|
|
|
|
|
|
|
|||||||||||||||
| Balance at June 30, 2018 |
$ | 1,114 | $ | 3,624,767 | $ | (32,136 | ) | $ | (570,265 | ) | $ | 3,023,480 | $ | 5,182 | $ | 3,028,662 | ||||||||||||
|
|
|
|
|
|
|
|
|
|
|
|
|
|
|
|||||||||||||||
See accompanying notes to consolidated financial statements.
5
Table of Contents
Blackstone Mortgage Trust, Inc.
Consolidated Statements of Cash Flows (Unaudited)
(in thousands)
| Six Months Ended June 30, |
||||||||
| 2018 | 2017 | |||||||
| Cash flows from operating activities |
||||||||
| Net income |
$ | 133,624 | $ | 102,018 | ||||
| Adjustments to reconcile net income to net cash provided by operating activities |
||||||||
| Non-cash compensation expense |
13,754 | 11,866 | ||||||
| Amortization of deferred fees on loans |
(24,161 | ) | (16,796 | ) | ||||
| Amortization of deferred financing costs and premiums/discount on debt obligations |
13,631 | 9,488 | ||||||
| Changes in assets and liabilities, net |
||||||||
| Other assets |
(16,582 | ) | (1,255 | ) | ||||
| Other liabilities |
14,745 | 5,492 | ||||||
|
|
|
|
|
|||||
| Net cash provided by operating activities |
135,011 | 110,813 | ||||||
|
|
|
|
|
|||||
| Cash flows from investing activities |
||||||||
| Origination and fundings of loans receivable |
(4,200,035 | ) | (1,464,994 | ) | ||||
| Principal collections and sales proceeds from loans receivable |
1,966,125 | 1,097,022 | ||||||
| Origination and exit fees received on loans receivable |
62,200 | 25,228 | ||||||
| Receipts under derivative financial instruments |
20,784 | 6,115 | ||||||
| Payments under derivative financial instruments |
(7,452 | ) | (9,398 | ) | ||||
| Return of collateral deposited under derivative agreements |
21,870 | — | ||||||
| Collateral deposited under derivative agreements |
(17,750 | ) | — | |||||
|
|
|
|
|
|||||
| Net cash used in investing activities |
(2,154,258 | ) | (346,027 | ) | ||||
|
|
|
|
|
|||||
continued…
See accompanying notes to consolidated financial statements.
6
Table of Contents
Blackstone Mortgage Trust, Inc.
Consolidated Statements of Cash Flows (Unaudited)
(in thousands)
| Six Months Ended June 30, |
||||||||
| 2018 | 2017 | |||||||
| Cash flows from financing activities |
||||||||
| Borrowings under secured debt agreements |
$ | 4,602,835 | $ | 1,744,766 | ||||
| Repayments under secured debt agreements |
(2,824,358 | ) | (1,673,886 | ) | ||||
| Proceeds from sale of loan participations |
72,384 | — | ||||||
| Payment of deferred financing costs |
(15,815 | ) | (9,800 | ) | ||||
| Contributions from non-controlling interests |
2,475 | — | ||||||
| Distributions to non-controlling interests |
(3,986 | ) | — | |||||
| Net proceeds from issuance of convertible notes |
214,775 | 280,473 | ||||||
| Repayment of convertible notes |
(192 | ) | — | |||||
| Net proceeds from issuance of class A common stock |
102,496 | 16 | ||||||
| Dividends paid on class A common stock |
(133,968 | ) | (117,402 | ) | ||||
|
|
|
|
|
|||||
| Net cash provided by financing activities |
2,016,646 | 224,167 | ||||||
|
|
|
|
|
|||||
| Net decrease in cash, cash equivalents, and restricted cash |
(2,601 | ) | (11,047 | ) | ||||
| Cash, cash equivalents, and restricted cash at beginning of period |
102,518 | 75,567 | ||||||
| Effects of currency translation on cash, cash equivalents, and restricted cash |
7,140 | 3,279 | ||||||
|
|
|
|
|
|||||
| Cash, cash equivalents, and restricted cash at end of period |
$ | 107,057 | $ | 67,799 | ||||
|
|
|
|
|
|||||
| Supplemental disclosure of cash flows information |
||||||||
| Payments of interest |
$ | (138,451 | ) | $ | (88,519 | ) | ||
|
|
|
|
|
|||||
| Payments of income taxes |
$ | (263 | ) | $ | (141 | ) | ||
|
|
|
|
|
|||||
| Supplemental disclosure of non-cash investing and financing activities |
|
|||||||
| Dividends declared, not paid |
$ | (69,094 | ) | $ | (58,793 | ) | ||
|
|
|
|
|
|||||
| Loan principal payments held by servicer, net |
$ | 1,330 | $ | 5,082 | ||||
|
|
|
|
|
|||||
| Consolidation of loans receivable of a VIE |
$ | — | $ | 500,000 | ||||
|
|
|
|
|
|||||
| Consolidation of securitized debt obligations of a VIE |
$ | — | $ | (474,620 | ) | |||
|
|
|
|
|
|||||
See accompanying notes to consolidated financial statements.
7
Table of Contents
Blackstone Mortgage Trust, Inc.
Notes to Consolidated Financial Statements
(Unaudited)
1. ORGANIZATION
References herein to “Blackstone Mortgage Trust,” “Company,” “we,” “us” or “our” refer to Blackstone Mortgage Trust, Inc. and its subsidiaries unless the context specifically requires otherwise.
Blackstone Mortgage Trust is a real estate finance company that originates senior loans collateralized by commercial real estate in North America and Europe. Our investment objective is to preserve and protect shareholder capital while producing attractive risk-adjusted returns primarily through dividends generated from current income from our loan portfolio. We are externally managed by BXMT Advisors L.L.C., or our Manager, a subsidiary of The Blackstone Group L.P., or Blackstone, and are a real estate investment trust, or REIT, traded on the New York Stock Exchange, or NYSE, under the symbol “BXMT.” Our principal executive offices are located at 345 Park Avenue, 42nd Floor, New York, New York 10154. We were incorporated in Maryland in 1998, when we reorganized from a California common law business trust into a Maryland corporation.
We conduct our operations as a REIT for U.S. federal income tax purposes. We generally will not be subject to U.S. federal income taxes on our taxable income to the extent that we annually distribute all of our net taxable income to stockholders and maintain our qualification as a REIT. We also operate our business in a manner that permits us to maintain an exclusion from registration under the Investment Company Act of 1940, as amended. We are organized as a holding company and conduct our business primarily through our various subsidiaries.
2. SUMMARY OF SIGNIFICANT ACCOUNTING POLICIES
The accompanying unaudited consolidated financial statements have been prepared in accordance with accounting principles generally accepted in the United States of America, or GAAP, for interim financial information and the instructions to Form 10-Q and Rule 10-01 of Regulation S-X. The consolidated financial statements, including the notes thereto, are unaudited and exclude some of the disclosures required in audited financial statements. Management believes it has made all necessary adjustments, consisting of only normal recurring items, so that the consolidated financial statements are presented fairly and that estimates made in preparing its consolidated financial statements are reasonable and prudent. The operating results presented for interim periods are not necessarily indicative of the results that may be expected for any other interim period or for the entire year. The accompanying unaudited consolidated interim financial statements should be read in conjunction with the audited consolidated financial statements included in our Annual Report on Form 10-K for the fiscal year ended December 31, 2017 filed with the Securities and Exchange Commission, or the SEC.
Basis of Presentation
The accompanying consolidated financial statements include, on a consolidated basis, our accounts, the accounts of our wholly-owned subsidiaries, majority-owned subsidiaries, and variable interest entities, or VIEs, of which we are the primary beneficiary. All intercompany balances and transactions have been eliminated in consolidation.
Principles of Consolidation
We consolidate all entities that we control through either majority ownership or voting rights. In addition, we consolidate all VIEs of which we are considered the primary beneficiary. VIEs are defined as entities in which equity investors (i) do not have the characteristics of a controlling financial interest and/or (ii) do not have sufficient equity at risk for the entity to finance its activities without additional subordinated financial support from other parties. The entity that consolidates a VIE is known as its primary beneficiary and is generally the entity with (i) the power to direct the activities that most significantly affect the VIE’s economic performance and (ii) the right to receive benefits from the VIE or the obligation to absorb losses of the VIE that could be significant to the VIE. Refer to Note 15 for additional discussion of our consolidated VIEs.
In April 2017, we entered into a joint venture, or our Multifamily Joint Venture, with Walker & Dunlop Inc. to originate, hold, and finance multifamily bridge loans. Pursuant to the terms of the agreements governing the joint venture, Walker & Dunlop contributed 15% of the venture’s equity capital and we contributed 85%. We consolidate the Multifamily Joint Venture as we have a controlling financial interest. The non-controlling interests included on our consolidated balance sheets represent the equity interests in our Multifamily Joint Venture that are owned by Walker & Dunlop. A portion of our Multifamily Joint Venture’s consolidated equity and results of operations are allocated to these non-controlling interests based on Walker & Dunlop’s pro rata ownership of our Multifamily Joint Venture.
8
Table of Contents
Blackstone Mortgage Trust, Inc.
Notes to Consolidated Financial Statements (continued)
(Unaudited)
Use of Estimates
The preparation of consolidated financial statements in conformity with GAAP requires us to make estimates and assumptions that affect the reported amounts of assets and liabilities and disclosure of contingent assets and liabilities as of the date of the consolidated financial statements and the reported amounts of revenues and expenses during the reporting period. Actual results may ultimately differ from those estimates.
Revenue Recognition
Interest income from our loans receivable portfolio is recognized over the life of each investment using the effective interest method and is recorded on the accrual basis. Recognition of fees, premiums, and discounts associated with these investments is deferred until the loan is advanced and is then recorded over the term of the loan as an adjustment to yield. Income accrual is generally suspended for loans at the earlier of the date at which payments become 90 days past due or when, in the opinion of our Manager, recovery of income and principal becomes doubtful. Income is then recorded on the basis of cash received until accrual is resumed when the loan becomes contractually current and performance is demonstrated to be resumed. In addition, for loans we originate, the related origination expenses are deferred and recognized as a component of interest income, however expenses related to loans we acquire are included in general and administrative expenses as incurred.
Cash, Cash Equivalents, and Restricted Cash
Cash and cash equivalents represent cash held in banks and liquid investments with original maturities of three months or less. We may have bank balances in excess of federally insured amounts; however, we deposit our cash and cash equivalents with high credit-quality institutions to minimize credit risk exposure. We have not experienced, and do not expect, any losses on our cash or cash equivalents.
Restricted cash represents cash held in a segregated bank account related to a letter of credit.
The following table provides a reconciliation of cash, cash equivalents, and restricted cash in our consolidated balance sheets to the total amount shown in our consolidated statements of cash flows ($ in thousands):
| June 30, 2018 | June 30, 2017 | |||||||
| Cash and cash equivalents |
$ | 107,057 | $ | 33,521 | ||||
| Restricted cash |
— | 34,278 | ||||||
|
|
|
|
|
|||||
| Total cash, cash equivalents, and restricted cash shown in our consolidated statements of cash flows |
$ | 107,057 | $ | 67,799 | ||||
|
|
|
|
|
|||||
Loans Receivable and Provision for Loan Losses
We originate and purchase commercial real estate debt and related instruments generally to be held as long-term investments at amortized cost. We are required to periodically evaluate each of these loans for possible impairment. Impairment is indicated when it is deemed probable that we will not be able to collect all amounts due to us pursuant to the contractual terms of the loan. If a loan is determined to be impaired, we write down the loan through a charge to the provision for loan losses. Impairment of these loans, which are collateral dependent, is measured by comparing the estimated fair value of the underlying collateral, less costs to sell, to the book value of the respective loan. These valuations require significant judgments, which include assumptions regarding capitalization rates, leasing, creditworthiness of major tenants, occupancy rates, availability of financing, exit plan, loan sponsorship, actions of other lenders, and other factors deemed necessary by our Manager. Actual losses, if any, could ultimately differ from these estimates.
9
Table of Contents
Blackstone Mortgage Trust, Inc.
Notes to Consolidated Financial Statements (continued)
(Unaudited)
Our Manager performs a quarterly review of our portfolio of loans. In conjunction with this review, our Manager assesses the risk factors of each loan, and assigns a risk rating based on a variety of factors, including, without limitation, loan-to-value ratio, or LTV, debt yield, property type, geographic and local market dynamics, physical condition, cash flow volatility, leasing and tenant profile, loan structure and exit plan, and project sponsorship. Based on a 5-point scale, our loans are rated “1” through “5,” from less risk to greater risk, which ratings are defined as follows:
| 1 - | Very Low Risk | |||
| 2 - | Low Risk | |||
| 3 - | Medium Risk | |||
| 4 - | High Risk/Potential for Loss: A loan that has a risk of realizing a principal loss. | |||
| 5 - | Impaired/Loss Likely: A loan that has a very high risk of realizing a principal loss or has otherwise incurred a principal loss. | |||
During the second quarter of 2015, we acquired a portfolio of loans from General Electric Capital Corporation and certain of its affiliates, or the GE portfolio, for a total purchase price of $4.7 billion. We allocated the aggregate purchase price between each loan based on its fair value relative to the overall portfolio, which allocation resulted in purchase discounts or premiums determined on an asset-by-asset basis. Each loan accretes from its allocated purchase price to its expected collection value over the life of the loan, consistent with the other loans in our portfolio.
Derivative Financial Instruments
We classify all derivative financial instruments as either other assets or other liabilities on our consolidated balance sheets at fair value.
On the date we enter into a derivative contract, we designate each contract as (i) a hedge of a net investment in a foreign operation, or net investment hedge, (ii) a hedge of a forecasted transaction or of the variability of cash flows to be received or paid related to a recognized asset or liability, or cash flow hedge, (iii) a hedge of a recognized asset or liability, or fair value hedge, or (iv) a derivative instrument not to be designated as a hedging derivative, or non-designated hedge. For all derivatives other than those designated as non-designated hedges, we formally document our hedge relationships and designation at the contract’s inception. This documentation includes the identification of the hedging instruments and the hedged items, its risk management objectives, strategy for undertaking the hedge transaction and our evaluation of the effectiveness of its hedged transaction.
On a quarterly basis, we also formally assess whether the derivative we designated in each hedging relationship is expected to be, and has been, highly effective in offsetting changes in the value or cash flows of the hedged items. If it is determined that a derivative is not highly effective at hedging the designated exposure, hedge accounting is discontinued and the changes in fair value of the instrument are included in net income prospectively. Changes in the fair value of our derivative instruments that qualify as hedges are reported as a component of accumulated other comprehensive income (loss) on our consolidated financial statements. Deferred gains and losses are reclassified out of accumulated other comprehensive income (loss) and into net income in the same period or periods during which the hedged transaction affects earnings, and are presented in the same line item as the earnings effect of the hedged item. For cash flow hedges, this is typically when the periodic swap settlements are made, while for net investment hedges, this occurs when the hedged item is sold or substantially liquidated. To the extent a derivative does not qualify for hedge accounting and is deemed a non-designated hedge, the changes in its fair value are included in net income concurrently.
Secured Debt Agreements
Where applicable, we record investments financed with repurchase agreements as separate assets and the related borrowings under any repurchase agreements are recorded as separate liabilities on our consolidated balance sheets. Interest income earned on the investments and interest expense incurred on the repurchase agreements are reported separately on our consolidated statements of operations.
10
Table of Contents
Blackstone Mortgage Trust, Inc.
Notes to Consolidated Financial Statements (continued)
(Unaudited)
Senior Loan Participations
In certain instances, we finance our loans through the non-recourse syndication of a senior loan interest to a third-party. Depending on the particular structure of the syndication, the senior loan interest may remain on our GAAP balance sheet or, in other cases, the sale will be recognized and the senior loan interest will no longer be included in our consolidated financial statements. When these sales are not recognized under GAAP we reflect the transaction by recording a loan participations sold liability on our consolidated balance sheet, however this gross presentation does not impact stockholders’ equity or net income. When the sales are recognized, our balance sheet only includes our remaining subordinate loan and not the non-consolidated senior interest we sold.
Convertible Notes
The “Debt with Conversion and Other Options” Topic of the Financial Accounting Standards Board, or FASB, Accounting Standards Codification, or ASC, requires the liability and equity components of convertible debt instruments that may be settled in cash upon conversion, including partial cash settlement, to be separately accounted for in a manner that reflects the issuer’s nonconvertible debt borrowing rate. The initial proceeds from the sale of convertible notes are allocated between a liability component and an equity component in a manner that reflects interest expense at the rate of similar nonconvertible debt that could have been issued at such time. The equity component represents the excess initial proceeds received over the fair value of the liability component of the notes as of the date of issuance. We measured the estimated fair value of the debt component of our convertible notes as of the respective issuance dates based on our nonconvertible debt borrowing rate. The equity component of each series of our convertible notes is reflected within additional paid-in capital on our consolidated balance sheet, and the resulting debt discount is amortized over the period during which such convertible notes are expected to be outstanding (through the maturity date) as additional non-cash interest expense. The additional non-cash interest expense attributable to such convertible notes will increase in subsequent periods through the maturity date as the notes accrete to their par value over the same period.
Deferred Financing Costs
The deferred financing costs that are included as a reduction in the net book value of the related liability on our consolidated balance sheets include issuance and other costs related to our debt obligations. These costs are amortized as interest expense using the effective interest method over the life of the related obligations.
Fair Value of Financial Instruments
The “Fair Value Measurements and Disclosures” Topic of the FASB, or ASC 820, defines fair value, establishes a framework for measuring fair value, and requires certain disclosures about fair value measurements under GAAP. Specifically, this guidance defines fair value based on exit price, or the price that would be received upon the sale of an asset or the transfer of a liability in an orderly transaction between market participants at the measurement date.
ASC 820 also establishes a fair value hierarchy that prioritizes and ranks the level of market price observability used in measuring financial instruments. Market price observability is affected by a number of factors, including the type of financial instrument, the characteristics specific to the financial instrument, and the state of the marketplace, including the existence and transparency of transactions between market participants. Financial instruments with readily available quoted prices in active markets generally will have a higher degree of market price observability and a lesser degree of judgment used in measuring fair value.
Financial instruments measured and reported at fair value are classified and disclosed based on the observability of inputs used in the determination, as follows:
| • | Level 1: Generally includes only unadjusted quoted prices that are available in active markets for identical financial instruments as of the reporting date. |
| • | Level 2: Pricing inputs include quoted prices in active markets for similar instruments, quoted prices in less active or inactive markets for identical or similar instruments where multiple price quotes can be obtained, and other observable inputs, such as interest rates, yield curves, credit risks, and default rates. |
| • | Level 3: Pricing inputs are unobservable for the financial instruments and include situations where there is little, if any, market activity for the financial instrument. These inputs require significant judgment or estimation by management of third-parties when determining fair value and generally represent anything that does not meet the criteria of Levels 1 and 2. |
11
Table of Contents
Blackstone Mortgage Trust, Inc.
Notes to Consolidated Financial Statements (continued)
(Unaudited)
The estimated value of each asset reported at fair value using Level 3 inputs is determined by an internal committee composed of members of senior management of our Manager, including our Chief Executive Officer, Chief Financial Officer, and other senior officers.
Certain of our other assets are reported at fair value either (i) on a recurring basis, as of each quarter-end, or (ii) on a nonrecurring basis, as a result of impairment or other events. Our assets that are recorded at fair value are discussed further in Note 14. We generally value our assets recorded at fair value by either (i) discounting expected cash flows based on assumptions regarding the collection of principal and interest and estimated market rates, or (ii) obtaining assessments from third-party dealers. For collateral-dependent loans that are identified as impaired, we measure impairment by comparing our Manager’s estimation of the fair value of the underlying collateral, less costs to sell, to the book value of the respective loan. These valuations may require significant judgments, which include assumptions regarding capitalization rates, leasing, creditworthiness of major tenants, occupancy rates, availability of financing, exit plan, loan sponsorship, actions of other lenders, and other factors deemed necessary by our Manager.
We are also required by GAAP to disclose fair value information about financial instruments, that are not otherwise reported at fair value in our consolidated balance sheet, to the extent it is practicable to estimate a fair value for those instruments. These disclosure requirements exclude certain financial instruments and all non-financial instruments.
The following methods and assumptions are used to estimate the fair value of each class of financial instruments, for which it is practicable to estimate that value:
| • | Cash and cash equivalents: The carrying amount of cash and cash equivalents approximates fair value. |
| • | Restricted cash: The carrying amount of restricted cash approximates fair value. |
| • | Loans receivable, net: The fair values of these loans were estimated by our Manager based on a discounted cash flow methodology, taking into consideration various factors including capitalization rates, discount rates, leasing, occupancy rates, availability and cost of financing, exit plan, sponsorship, actions of other lenders, and indications of market value from other market participants. |
| • | Derivative financial instruments: The fair value of our foreign currency and interest rate contracts was estimated using advice from a third-party derivative specialist, based on contractual cash flows and observable inputs comprising foreign currency rates and credit spreads. |
| • | Secured debt agreements, net: The fair value of these instruments was estimated based on the rate at which a similar credit facility would currently be priced. |
| • | Loan participations sold, net: The fair value of these instruments was estimated based on the value of the related loan receivable asset. |
| • | Securitized debt obligations, net: The fair value of these instruments was estimated by utilizing third-party pricing service providers. In determining the value of a particular investment, pricing service providers may use broker-dealer quotations, reported trades, or valuation estimates from their internal pricing models to determine the reported price. |
| • | Convertible notes, net: Each series of the convertible notes is actively traded and their fair values were obtained using quoted market prices. |
Income Taxes
Our financial results generally do not reflect provisions for current or deferred income taxes on our REIT taxable income. We believe that we operate in a manner that will continue to allow us to be taxed as a REIT and, as a result, we generally do not expect to pay substantial corporate level taxes other than those payable by our taxable REIT subsidiaries. If we were to fail to meet these requirements, we may be subject to federal, state, and local income tax on current and past income, and penalties. Refer to Note 12 for additional information.
12
Table of Contents
Blackstone Mortgage Trust, Inc.
Notes to Consolidated Financial Statements (continued)
(Unaudited)
Stock-Based Compensation
Our stock-based compensation consists of awards issued to our Manager and certain individuals employed by an affiliate of our Manager that vest over the life of the awards, as well as deferred stock units issued to certain members of our Board of Directors. Stock-based compensation expense is recognized for these awards in net income on a variable basis over the applicable vesting period of the awards, based on the value of our class A common stock. Refer to Note 13 for additional information.
Earnings per Share
Basic earnings per share, or Basic EPS, is computed in accordance with the two-class method and is based on the net earnings allocable to our class A common stock, including restricted class A common stock and deferred stock units, divided by the weighted-average number of shares of our class A common stock, including restricted class A common stock and deferred stock units outstanding during the period. Our restricted class A common stock is considered a participating security, as defined by GAAP, and has been included in our Basic EPS under the two-class method as these restricted shares have the same rights as our other shares of class A common stock, including participating in any gains or losses.
Diluted earnings per share, or Diluted EPS, is determined using the treasury stock method, and is based on the net earnings allocable to our class A common stock, including restricted class A common stock and deferred stock units, divided by the weighted-average number of shares of our class A common stock, including restricted class A common stock and deferred stock units. Refer to Note 10 for additional discussion of earnings per share.
Foreign Currency
In the normal course of business, we enter into transactions not denominated in United States, or U.S., dollars. Foreign exchange gains and losses arising on such transactions are recorded as a gain or loss in our consolidated statements of operations. In addition, we consolidate entities that have a non-U.S. dollar functional currency. Non-U.S. dollar denominated assets and liabilities are translated to U.S. dollars at the exchange rate prevailing at the reporting date and income, expenses, gains, and losses are translated at the average exchange rate over the applicable period. Cumulative translation adjustments arising from the translation of non-U.S. dollar denominated subsidiaries are recorded in other comprehensive income (loss).
Underwriting Commissions and Offering Costs
Underwriting commissions and offering costs incurred in connection with common stock offerings are reflected as a reduction of additional paid-in capital. Costs incurred that are not directly associated with the completion of a common stock offering are expensed when incurred.
Recent Accounting Pronouncements
In June 2018, the FASB issued ASU 2018-07 “Compensation – Stock Compensation (Topic 718): Improvements to Nonemployee Share-Based Payment Accounting,” or ASU 2018-07. ASU 2018-07 expands the scope of Topic 718 to include share-based payment transactions for acquiring goods and services from nonemployees. The guidance is intended to align the accounting for such payments to nonemployees with the existing requirements for share-based payments granted to employees. ASU 2018-07 is effective for fiscal years beginning after December 15, 2018 and is to be adopted through a cumulative-effect adjustment to retained earnings as of January 1, 2019 for then outstanding share-based payments to nonemployees. While we are currently evaluating the impact ASU 2018-07 will have on our consolidated financial statements, it will change the cost we recognize related to our long-term incentive plans. Upon adoption of ASU 2018-07, the cost of such plans will be a fixed amount determined based on the grant date fair value of shares granted, rather than the current methodology that recognizes a variable cost based on the fair value of such shares as of their vesting dates.
In November 2016, the FASB issued ASU 2016-18 “Statement of Cash Flows (Topic 230): Restricted Cash,” or ASU 2016-18. ASU 2016-18 is intended to clarify how entities present restricted cash in the statement of cash flows. The guidance requires entities to show the changes in the total of cash and cash equivalents and restricted cash in the statement of cash flows. As a result, entities will no longer present transfers between cash and cash equivalents and restricted cash in the statement of cash flows. We adopted ASU 2016-18 in the second quarter of 2017 and applied the guidance retrospectively to our prior period consolidated statement of cash flows.
13
Table of Contents
Blackstone Mortgage Trust, Inc.
Notes to Consolidated Financial Statements (continued)
(Unaudited)
In June 2016, the FASB issued ASU 2016-13 “Financial Instruments – Credit Losses – Measurement of Credit Losses on Financial Instruments (Topic 326),” or ASU 2016-13. ASU 2016-13 significantly changes how entities will measure credit losses for most financial assets and certain other instruments that are not measured at fair value through net income. ASU 2016-13 will replace the “incurred loss” model under existing guidance with an “expected loss” model for instruments measured at amortized cost, and require entities to record allowances for available-for-sale debt securities rather than reduce the carrying amount, as they do today under the other-than-temporary impairment model. It also simplifies the accounting model for purchased credit-impaired debt securities and loans. ASU 2016-13 is effective for fiscal years beginning after December 15, 2019 and is to be adopted through a cumulative-effect adjustment to retained earnings as of January 1, 2020. While we are currently evaluating the impact ASU 2016-13 will have on our consolidated financial statements, we expect that the adoption will result in an increased amount of provisions for potential loan losses as well as the recognition of such provisions earlier in the lending cycle. We currently do not have any provision for loan losses in our consolidated financial statements.
In May 2014, the FASB issued ASU 2014-09, “Revenue from Contracts with Customers (Topic 606),” or ASU 2014-09. ASU 2014-09 broadly amends the accounting guidance for revenue recognition. ASU 2014-09 is effective for the first interim or annual period beginning after December 15, 2017, and is to be applied retrospectively. We adopted ASU 2014-09 in the first quarter of 2018 and it did not have a material impact on our consolidated financial statements.
14
Table of Contents
Blackstone Mortgage Trust, Inc.
Notes to Consolidated Financial Statements (continued)
(Unaudited)
3. LOANS RECEIVABLE, NET
The following table details overall statistics for our loans receivable portfolio ($ in thousands):
| June 30, 2018 | December 31, 2017 | |||||||
| Number of loans |
107 | 110 | ||||||
| Principal balance |
$ | 12,303,596 | $ | 10,108,226 | ||||
| Net book value |
$ | 12,214,565 | $ | 10,056,732 | ||||
| Unfunded loan commitments(1) |
$ | 2,990,380 | $ | 1,573,107 | ||||
| Weighted-average cash coupon(2) |
5.52 | % | 5.55 | % | ||||
| Weighted-average all-in yield(2) |
5.85 | % | 5.95 | % | ||||
| Weighted-average maximum maturity (years)(3) |
4.1 | 3.5 | ||||||
|
|
||||||||
| (1) |
Unfunded commitments will primarily be funded to finance our borrowers’ construction or development of real estate-related assets, capital improvements of existing assets, or lease-related expenditures. These commitments will generally be funded over the term of each loan, subject in certain cases to an expiration date. | |||||
| (2) |
Our floating rate loans are indexed to various benchmark rates, with 84% and 92% of our floating rate loans by principal balance indexed to USD LIBOR as of June 30, 2018 and December 31, 2017, respectively. In addition to cash coupon, all-in yield includes the amortization of deferred origination and extension fees, loan origination costs, and purchase discounts, as well as the accrual of exit fees. Cash coupon and all-in yield assume applicable floating benchmark rates for weighted-average calculation. | |||||
| (3) |
Maximum maturity assumes all extension options are exercised by the borrower, however our loans may be repaid prior to such date. As of June 30, 2018, 77% of our loans by principal balance were subject to yield maintenance or other prepayment restrictions and 23% were open to repayment by the borrower without penalty. As of December 31, 2017, 75% of our loans were subject to yield maintenance or other prepayment restrictions and 25% were open to repayment by the borrower without penalty. | |||||
Activity relating to our loans receivable portfolio was as follows ($ in thousands):
| Principal Balance |
Deferred Fees / Other Items(1) |
Net Book Value |
||||||||||
| December 31, 2017 |
$ | 10,108,226 | $ | (51,494) | $ | 10,056,732 | ||||||
| Loan fundings |
4,200,035 | — | 4,200,035 | |||||||||
| Loan repayments |
(1,913,236 | ) | — | (1,913,236 | ) | |||||||
| Unrealized gain (loss) on foreign currency translation |
(91,429 | ) | 502 | (90,927 | ) | |||||||
| Deferred fees and other items |
— | (62,200 | ) | (62,200 | ) | |||||||
| Amortization of fees and other items |
— | 24,161 | 24,161 | |||||||||
|
|
|
|
|
|
|
|||||||
| June 30, 2018 |
$ | 12,303,596 | $ | (89,031 | ) | $ | 12,214,565 | |||||
|
|
|
|
|
|
|
|||||||
|
|
||||||||||||
| (1) |
Other items primarily consist of purchase discounts or premiums, exit fees, and deferred origination expenses. | |||||
15
Table of Contents
Blackstone Mortgage Trust, Inc.
Notes to Consolidated Financial Statements (continued)
(Unaudited)
The tables below detail the property type and geographic distribution of the properties securing the loans in our portfolio ($ in thousands):
| June 30, 2018 | ||||||||||||
| Property Type |
Number of Loans |
Net Book Value | Total Loan Exposure(1) |
Percentage of Portfolio | ||||||||
| Office |
49 | $ | 5,938,663 | $ | 5,990,592 | 47% | ||||||
| Hotel |
14 | 2,211,798 | 2,292,082 | 18 | ||||||||
| Multifamily |
27 | 1,553,570 | 1,561,517 | 12 | ||||||||
| Spanish Assets |
1 | 1,159,765 | 1,168,400 | 9 | ||||||||
| Retail |
5 | 423,951 | 424,841 | 3 | ||||||||
| Condominium |
2 | 124,777 | 216,634 | 2 | ||||||||
| Other |
9 | 802,041 | 1,138,853 | 9 | ||||||||
|
|
|
|
|
|
| |||||||
| 107 | $ | 12,214,565 | $ | 12,792,919 | 100% | |||||||
|
|
|
|
|
|
| |||||||
| Geographic Location |
Number of Loans |
Net Book Value | Total Loan Exposure(1) |
Percentage of Portfolio | ||||||||
| United States |
||||||||||||
| Northeast |
33 | $ | 4,188,084 | $ | 4,226,766 | 32% | ||||||
| West |
24 | 2,355,486 | 2,463,864 | 19 | ||||||||
| Southeast |
18 | 2,121,488 | 2,133,466 | 17 | ||||||||
| Midwest |
6 | 827,600 | 833,003 | 7 | ||||||||
| Southwest |
11 | 505,127 | 508,564 | 4 | ||||||||
| Northwest |
1 | 128,109 | 128,607 | 1 | ||||||||
|
|
|
|
|
|
| |||||||
| Subtotal |
93 | 10,125,894 | 10,294,270 | 80 | ||||||||
| International |
||||||||||||
| Spain |
1 | 1,159,765 | 1,168,400 | 9 | ||||||||
| United Kingdom |
5 | 499,028 | 848,918 | 7 | ||||||||
| Canada |
5 | 331,975 | 329,004 | 3 | ||||||||
| Belgium |
1 | 71,926 | 72,441 | 1 | ||||||||
| Germany |
1 | 11,958 | 65,864 | — | ||||||||
| Netherlands |
1 | 14,019 | 14,022 | — | ||||||||
|
|
|
|
|
|
| |||||||
| Subtotal |
14 | 2,088,671 | 2,498,649 | 20 | ||||||||
|
|
|
|
|
|
| |||||||
| Total |
107 | $ | 12,214,565 | $ | 12,792,919 | 100% | ||||||
|
|
|
|
|
|
| |||||||
|
| ||||||||||||
| (1) |
In certain instances, we finance our loans through the non-recourse sale of a senior loan interest that is not included in our consolidated financial statements. See Note 2 for further discussion. Total loan exposure encompasses the entire loan we originated and financed, including $489.3 million of such non-consolidated senior interests as of June 30, 2018. | |||||
16
Table of Contents
Blackstone Mortgage Trust, Inc.
Notes to Consolidated Financial Statements (continued)
(Unaudited)
| December 31, 2017 |
||||||||||||||||
| Property Type |
Number of Loans |
Net Book Value | Total Loan Exposure(1) |
Percentage of Portfolio |
||||||||||||
| Office |
53 | $ | 5,773,972 | $ | 5,807,170 | 53% | ||||||||||
| Hotel |
15 | 1,830,568 | 1,905,497 | 17 | ||||||||||||
| Multifamily |
25 | 1,220,423 | 1,228,959 | 11 | ||||||||||||
| Retail |
6 | 487,473 | 940,980 | 8 | ||||||||||||
| Condominium |
2 | 142,342 | 268,751 | 2 | ||||||||||||
| Other |
9 | 601,954 | 942,251 | 9 | ||||||||||||
|
|
|
|
|
|
|
|
|
|||||||||
| 110 | $ | 10,056,732 | $ | 11,093,608 | 100% | |||||||||||
|
|
|
|
|
|
|
|
|
|||||||||
| Geographic Location |
Number of Loans |
Net Book Value | Total Loan Exposure(1) |
Percentage of Portfolio |
||||||||||||
| United States |
||||||||||||||||
| Northeast |
26 | $ | 2,857,948 | $ | 2,871,219 | 26% | ||||||||||
| West |
29 | 2,672,069 | 2,816,276 | 24 | ||||||||||||
| Southeast |
17 | 2,007,202 | 2,470,992 | 22 | ||||||||||||
| Midwest |
9 | 856,559 | 862,578 | 8 | ||||||||||||
| Southwest |
10 | 380,204 | 380,120 | 3 | ||||||||||||
| Northwest |
2 | 283,381 | 286,221 | 3 | ||||||||||||
|
|
|
|
|
|
|
|
|
|||||||||
| Subtotal |
93 | 9,057,363 | 9,687,406 | 86 | ||||||||||||
| International |
||||||||||||||||
| United Kingdom |
6 | 440,317 | 794,789 | 7 | ||||||||||||
| Canada |
7 | 415,893 | 412,343 | 4 | ||||||||||||
| Belgium |
1 | 73,779 | 74,431 | 1 | ||||||||||||
| Germany |
1 | 12,237 | 67,399 | 1 | ||||||||||||
| Netherlands |
2 | 57,143 | 57,240 | 1 | ||||||||||||
|
|
|
|
|
|
|
|
|
|||||||||
| Subtotal |
17 | 999,369 | 1,406,202 | 14 | ||||||||||||
|
|
|
|
|
|
|
|
|
|||||||||
| Total |
110 | $ | 10,056,732 | $ | 11,093,608 | 100% | ||||||||||
|
|
|
|
|
|
|
|
|
|||||||||
|
|
||||||||||||||||
| (1) |
In certain instances, we finance our loans through the non-recourse sale of a senior loan interest that is not included in our consolidated financial statements. See Note 2 for further discussion. Total loan exposure encompasses the entire loan we originated and financed, including $985.4 million of such non-consolidated senior interests as of December 31, 2017. | |||||
Loan Risk Ratings
As further described in Note 2, our Manager evaluates our loan portfolio on a quarterly basis. In conjunction with our quarterly loan portfolio review, our Manager assesses the risk factors of each loan, and assigns a risk rating based on several factors. Factors considered in the assessment include, but are not limited to, risk of loss, current LTV, debt yield, collateral performance, structure, exit plan, and sponsorship. Loans are rated “1” (less risk) through “5” (greater risk), which ratings are defined in Note 2.
17
Table of Contents
Blackstone Mortgage Trust, Inc.
Notes to Consolidated Financial Statements (continued)
(Unaudited)
The following table allocates the principal balance and net book value of our loans receivable based on our internal risk ratings ($ in thousands):
| June 30, 2018 | December 31, 2017 | |||||||||||||||||||||||||||
| Risk Rating |
Number of Loans | Net Book Value | Total Loan Exposure(1) | Risk Rating | Number of Loans | Net Book Value | Total Loan Exposure(1) | |||||||||||||||||||||
| 1 | 1 | $ | 52,476 | $ | 52,500 | 1 | 1 | $ | 31,842 | $ | 31,890 | |||||||||||||||||
| 2 | 36 | 3,807,971 | 3,826,692 | 2 | 41 | 3,512,709 | 3,521,701 | |||||||||||||||||||||
| 3 | 70 | 8,354,118 | 8,913,727 | 3 | 67 | 6,491,617 | 7,519,465 | |||||||||||||||||||||
| 4 | — | — | — | 4 | 1 | 20,564 | 20,552 | |||||||||||||||||||||
| 5 | — | — | — | 5 | — | — | — | |||||||||||||||||||||
|
|
|
|
|
|
|
|
|
|
|
|||||||||||||||||||
| 107 | $ | 12,214,565 | $ | 12,792,919 | 110 | $ | 10,056,732 | $ | 11,093,608 | |||||||||||||||||||
|
|
|
|
|
|
|
|
|
|
|
|||||||||||||||||||
| (1) | In certain instances, we finance our loans through the non-recourse sale of a senior loan interest that is not included in our consolidated financial statements. See Note 2 for further discussion. Total loan exposure encompasses the entire loan we originated and financed, including $489.3 million and $985.4 million of such non-consolidated senior interests as of June 30, 2018 and December 31, 2017, respectively. |
The weighted-average risk rating of our total loan exposure was 2.7 as of both June 30, 2018 and December 31, 2017. We had one loan with a risk rating of “4” in our portfolio as of December 31, 2017, which was repaid in full in April 2018.
We did not have any impaired loans, nonaccrual loans, or loans in maturity default as of June 30, 2018 or December 31, 2017.
Multifamily Joint Venture
As discussed in Note 2, we entered into a Multifamily Joint Venture in April 2017. As of June 30, 2018 and December 31, 2017, our Multifamily Joint Venture held $119.1 million and $182.2 million of loans, respectively, which are included in the loan disclosures above. Refer to Note 2 for additional discussion of our Multifamily Joint Venture.
4. OTHER ASSETS AND LIABILITIES
The following table details the components of our other assets ($ in thousands):
| June 30, 2018 | December 31, 2017 | |||||||
| Accrued interest receivable |
$ | 52,481 | $ | 38,573 | ||||
| Derivative assets |
6,276 | 1,214 | ||||||
| Loan portfolio payments held by servicer(1) |
1,549 | 54,759 | ||||||
| Prepaid expenses |
364 | 798 | ||||||
| Prepaid taxes |
28 | 31 | ||||||
| Collateral deposited under derivative agreements |
— | 4,120 | ||||||
| Other |
27 | 80 | ||||||
|
|
|
|
|
|||||
| Total |
$ | 60,725 | $ | 99,575 | ||||
|
|
|
|
|
|||||
|
|
||||||||
| (1) |
Represents loan principal and interest payments held by our third-party loan servicer as of the balance sheet date which were remitted to us during the subsequent remittance cycle. | |||||
18
Table of Contents
Blackstone Mortgage Trust, Inc.
Notes to Consolidated Financial Statements (continued)
(Unaudited)
The following table details the components of our other liabilities ($ in thousands):
| June 30, 2018 | December 31, 2017 | |||||||
| Accrued dividends payable |
$ | 69,094 | $ | 66,888 | ||||
| Accrued management and incentive fees payable |
22,388 | 14,284 | ||||||
| Accrued interest payable |
19,294 | 14,162 | ||||||
| Derivative liabilities |
1,250 | 4,911 | ||||||
| Accounts payable and other liabilities |
3,577 | 2,125 | ||||||
| Secured debt repayments pending servicer remittance(1) |
— | 38,456 | ||||||
|
|
|
|
|
|||||
| Total |
$ | 115,603 | $ | 140,826 | ||||
|
|
|
|
|
|||||
|
|
||||||||
| (1) |
Represents pending transfers from our third-party loan servicer that were remitted to our banking counterparties during the subsequent remittance cycle. | |||||
5. SECURED DEBT AGREEMENTS, NET
Our secured debt agreements include credit facilities, the GE portfolio acquisition facility, asset-specific financings, and a revolving credit agreement. The following table details our secured debt agreements ($ in thousands):
| Secured Debt Agreements | ||||||||
| Borrowings Outstanding | ||||||||
| June 30, 2018 | December 31, 2017 | |||||||
| Credit facilities |
$ | 4,649,246 | $ | 4,068,249 | ||||
| Asset-specific financings |
1,885,863 | 518,864 | ||||||
| GE portfolio acquisition facility |
509,441 | 703,423 | ||||||
| Revolving credit agreement |
— | — | ||||||
|
|
|
|
|
|||||
| Total secured debt agreements |
$ | 7,044,550 | $ | 5,290,536 | ||||
|
|
|
|
|
|||||
| Deferred financing costs(1) |
(22,050 | ) | (16,681 | ) | ||||
|
|
|
|
|
|||||
| Net book value of secured debt |
$ | 7,022,500 | $ | 5,273,855 | ||||
|
|
|
|
|
|||||
|
|
||||||||
| (1) |
Costs incurred in connection with our secured debt agreements are recorded on our consolidated balance sheet when incurred and recognized as a component of interest expense over the life of each related agreement. | |||||
Credit Facilities
During the six months ended June 30, 2018, we added one new credit facility, providing an additional $1.0 billion of credit capacity, and increased the maximum facility size of one of our existing credit facilities, providing an additional $250.0 million of credit capacity.
19
Table of Contents
Blackstone Mortgage Trust, Inc.
Notes to Consolidated Financial Statements (continued)
(Unaudited)
The following tables detail our credit facilities ($ in thousands):
| June 30, 2018 | ||||||||||||||||||||
| Maximum | Credit Borrowings | Collateral | ||||||||||||||||||
| Lender |
Facility Size(1) | Potential(2) | Outstanding | Available(2) | Assets(3) | |||||||||||||||
| Bank of America |
$ | 1,000,000 | $ | 863,592 | $ | 863,592 | $ | — | $ | 1,083,385 | ||||||||||
| Wells Fargo |
2,000,000 | 1,348,240 | 852,431 | 495,809 | 1,822,275 | |||||||||||||||
| MetLife |
1,000,000 | 793,130 | 793,130 | — | 1,041,540 | |||||||||||||||
| Barclays |
1,000,000 | 496,480 | 496,480 | — | 620,600 | |||||||||||||||
| Citibank(4) |
750,000 | 572,341 | 459,827 | 112,514 | 719,177 | |||||||||||||||
| JP Morgan |
500,000 | 359,114 | 296,058 | 63,056 | 474,407 | |||||||||||||||
| Morgan Stanley(5) |
660,350 | 344,960 | 280,847 | 64,114 | 460,991 | |||||||||||||||
| Deutsche Bank |
500,000 | 277,247 | 277,247 | — | 373,042 | |||||||||||||||
| Société Générale(6) |
467,360 | 235,229 | 235,229 | — | 294,654 | |||||||||||||||
| Goldman Sachs - Multi. JV(7) |
250,000 | 55,085 | 55,085 | — | 69,974 | |||||||||||||||
| Bank of America - Multi. JV(7) |
200,000 | 39,320 | 39,320 | — | 49,150 | |||||||||||||||
|
|
|
|
|
|
|
|
|
|
|
|||||||||||
| $ | 8,327,710 | $ | 5,384,738 | $ | 4,649,246 | $ | 735,493 | $ | 7,009,195 | |||||||||||
|
|
|
|
|
|
|
|
|
|
|
|||||||||||
| December 31, 2017 | ||||||||||||||||||||
| Maximum | Credit Borrowings | Collateral | ||||||||||||||||||
| Lender |
Facility Size(1) | Potential(2) | Outstanding | Available(2) | Assets(3) | |||||||||||||||
| Wells Fargo |
$ | 2,000,000 | $ | 1,289,135 | $ | 1,170,801 | $ | 118,334 | $ | 1,680,325 | ||||||||||
| MetLife |
1,000,000 | 807,164 | 807,164 | — | 1,039,231 | |||||||||||||||
| Bank of America |
750,000 | 573,542 | 573,542 | — | 765,049 | |||||||||||||||
| JP Morgan |
500,000 | 443,496 | 319,755 | 123,741 | 579,218 | |||||||||||||||
| Société Générale(6) |
480,200 | 300,871 | 300,871 | — | 373,181 | |||||||||||||||
| Deutsche Bank |
500,000 | 295,743 | 295,743 | — | 399,203 | |||||||||||||||
| Citibank(4) |
800,125 | 354,354 | 240,881 | 113,473 | 455,433 | |||||||||||||||
| Morgan Stanley(5) |
675,650 | 456,344 | 216,044 | 240,300 | 591,168 | |||||||||||||||
| Bank of America - Multi. JV(7) |
200,000 | 85,560 | 85,560 | — | 106,950 | |||||||||||||||
| Goldman Sachs - Multi. JV(7) |
250,000 | 57,888 | 57,888 | — | 75,225 | |||||||||||||||
|
|
|
|
|
|
|
|
|
|
|
|||||||||||
| $ | 7,155,975 | $ | 4,664,097 | $ | 4,068,249 | $ | 595,848 | $ | 6,064,983 | |||||||||||
|
|
|
|
|
|
|
|
|
|
|
|||||||||||
|
|
||||||||||||||||||||
| (1) |
Maximum facility size represents the largest amount of borrowings available under a given facility once sufficient collateral assets have been approved by the lender and pledged by us. | |||||||||||
| (2) |
Potential borrowings represents the total amount we could draw under each facility based on collateral already approved and pledged. When undrawn, these amounts are immediately available to us at our sole discretion under the terms of each credit facility. | |||||||||||
| (3) |
Represents the principal balance of the collateral assets. | |||||||||||
| (4) |
As of June 30, 2018, the Citibank facility was denominated in U.S. dollars. As of December 31, 2017, the maximum facility size was composed of a $500.0 million facility denominated in U.S. dollars plus a €250.0 million facility, which translated to $300.1 million as of such date. | |||||||||||
| (5) |
As of June 30, 2018 and December 31, 2017, the Morgan Stanley maximum facility size was £500.0 million, which translated to $660.4 million and $675.7 million, respectively. | |||||||||||
| (6) |
As of June 30, 2018 and December 31, 2017, the Société Générale maximum facility size was €400.0 million, which translated to $467.4 million and $480.2 million, respectively. | |||||||||||
| (7) |
These facilities finance the loan investments of our consolidated Multifamily Joint Venture. Refer to Note 2 to our consolidated financial statements for additional discussion of our Multifamily Joint Venture. | |||||||||||
20
Table of Contents
Blackstone Mortgage Trust, Inc.
Notes to Consolidated Financial Statements (continued)
(Unaudited)
The weighted-average outstanding balance of our credit facilities was $4.3 billion for the six months ended June 30, 2018. As of June 30, 2018, we had aggregate borrowings of $4.6 billion outstanding under our credit facilities, with a weighted-average cash coupon of LIBOR plus 1.79% per annum, a weighted-average all-in cost of credit, including associated fees and expenses, of LIBOR plus 1.98% per annum, and a weighted-average advance rate of 79.1%. As of June 30, 2018, outstanding borrowings under these facilities had a weighted-average maturity, excluding extension options and term-out provisions, of 1.6 years.
The weighted-average outstanding balance of our credit facilities was $4.4 billion for the six months ended December 31, 2017. As of December 31, 2017, we had aggregated borrowings of $4.1 billion outstanding under our credit facilities, with a weighted-average cash coupon of LIBOR plus 1.90% per annum, a weighted-average all-in cost of credit, including associated fees and expenses, of LIBOR plus 2.12% per annum, and a weighted-average advance rate of 78.7%. As of December 31, 2017, outstanding borrowings under these facilities had a weighted-average maturity, excluding extension options and term-out provisions, of 1.5 years.
Borrowings under each facility are subject to the initial approval of eligible collateral loans by the lender and the maximum advance rate and pricing rate of individual advances are determined with reference to the attributes of the respective collateral loan.
The following tables outline the key terms of our credit facilities as of June 30, 2018:
| Lender |
Currency | Guarantee(1) | Margin Call(2) | Term/Maturity | ||||
| Morgan Stanley |
$ / £ / € | 25% | Collateral marks only | March 3, 2020 | ||||
| Goldman Sachs - Multi. JV(3) |
$ | 25% | Collateral marks only | July 12, 2020(4) | ||||
| JP Morgan |
$ / £ | 50% | Collateral marks only | January 7, 2021 | ||||
| Bank of America - Multi. JV(3) |
$ | 43% | Collateral marks only | July 19, 2021 | ||||
| Deutsche Bank |
$ | 33% | Collateral marks only | August 9, 2021(5) | ||||
| Barclays |
$ | 25% | Collateral marks only | March 29, 2023(6) | ||||
| MetLife |
$ | 50% | Collateral marks only | April 22, 2023(7) | ||||
| Bank of America |
$ | 50% | Collateral marks only | May 21, 2023(8) | ||||
| Citibank |
$ / £ / € | 25% | Collateral marks only | Term matched(9) | ||||
| Société Générale |
$ / £ / € | 25% | Collateral marks only | Term matched(9) | ||||
| Wells Fargo |
$ | 25% | Collateral marks only | Term matched(9) | ||||
|
| ||||||||
| (1) |
Other than amounts guaranteed based on specific collateral asset types, borrowings under our credit facilities are non-recourse to us. | |||||||||
| (2) |
Margin call provisions under our credit facilities do not permit valuation adjustments based on capital markets events, and are limited to collateral-specific credit marks. | |||||||||
| (3) |
These facilities finance the loan investments of our consolidated Multifamily Joint Venture. Refer to Note 2 for additional discussion of our Multifamily Joint Venture. | |||||||||
| (4) |
Includes one one-year extension option which may be exercised at our sole discretion. | |||||||||
| (5) |
Includes two one-year extension options which may be exercised at our sole discretion. | |||||||||
| (6) |
Includes four one-year extension options which may be exercised at our sole discretion. | |||||||||
| (7) |
Includes four one-year extension options which may be exercised at our sole discretion. | |||||||||
| (8) |
Includes two one-year extension options which may be exercised at our sole discretion. | |||||||||
| (9) |
These credit facilities have various availability periods during which new advances can be made and which are generally subject to each lender’s discretion. Maturity dates for advances outstanding are tied to the term of each respective collateral asset. | |||||||||
21
Table of Contents
Blackstone Mortgage Trust, Inc.
Notes to Consolidated Financial Statements (continued)
(Unaudited)
| Currency |
Outstanding Borrowings |
Potential Borrowings(1) |
Index |
Rate(2) |
Advance Rate(3) | |||||||||
| $ |
$ 4,339,522 | $ 5,055,273 | 1-month USD LIBOR | L+1.77% | 79.1% | |||||||||
| € |
€ 49,600 | € 59,201 | 3-month EURIBOR | L+2.28% | 80.0% | |||||||||
| £ |
£ 117,994 | £ 124,449 | 3-month GBP LIBOR | L+2.23% | 78.5% | |||||||||
|
|
|
|
|
|
| |||||||||
| $ 4,649,246 | $ 5,384,738 | L+1.79% | 79.1% | |||||||||||
|
| ||||||||||||||
| (1) |
Potential borrowings represents the total amount we could draw under each facility based on collateral already approved and pledged. When undrawn, these amounts are immediately available to us at our sole discretion under the terms of each credit facility. | |||||||
| (2) |
Represents weighted-average cash coupon based on borrowings outstanding. | |||||||
| (3) |
Represents weighted-average advance rate based on the approved outstanding principal balance of the collateral assets pledged. | |||||||
Asset-Specific Financings
During the six months ended June 30, 2018, we entered into an €800.0 million asset-specific financing and a $414.0 million asset-specific financing, secured by a €1.0 billion senior loan and a $517.5 million senior loan, respectively. The following tables detail our asset-specific financings ($ in thousands):
| June 30, 2018 |
||||||||||||||||||||||
| Asset-Specific Financings |
Count |
Principal Balance |
Book Value |
Wtd. Avg. Yield/Cost(1) |
Guarantee(2) | Wtd. Avg. Term(3) |
||||||||||||||||
| Collateral assets |
6 | $ | 2,384,093 | $ | 2,367,275 | L+3.44 | % | n/a | Nov. 2021 | |||||||||||||
| Financing provided(4) |
6 | $ | 1,885,863 | $ | 1,878,776 | L+1.73 | % | $ | 1,392,274 | Nov. 2021 | ||||||||||||
| December 31, 2017 |
||||||||||||||||||||||
| Asset-Specific Financings |
Count |
Principal Balance |
Book Value |
Wtd. Avg. Yield/Cost(1) |
Guarantee(2) | Wtd. Avg. Term(3) |
||||||||||||||||
| Collateral assets |
6 | $ | 682,259 | $ | 677,296 | L+4.76 | % | n/a | Dec. 2020 | |||||||||||||
| Financing provided(4) |
6 | $ | 518,864 | $ | 517,088 | L+2.50 | % | $ | 162,475 | Dec. 2020 | ||||||||||||
|
|
||||||||||||||||||||||
| (1) |
These floating rate loans and related liabilities are indexed to the various benchmark rates relevant in each arrangement in terms of currency and payment frequency. Therefore the net exposure to each benchmark rate is in direct proportion to our net assets indexed to that rate. In addition to cash coupon, yield/cost includes the amortization of deferred origination fees / financing costs. | |||||||||||||
| (2) |
Other than amounts guaranteed on an asset-by-asset basis, borrowings under our asset-specific financings are non-recourse to us. | |||||||||||||
| (3) |
The weighted-average term is determined based on the maximum maturity of the corresponding loans, assuming all extension options are exercised by the borrower. Each of our asset-specific financings are term-matched to the corresponding collateral loans. | |||||||||||||
| (4) |
As June 30, 2018 and December 31, 2017, borrowings of $931.8 million and $394.8 million, respectively, under these asset specific financings are cross collateralized with related credit facilities with the same lenders. | |||||||||||||
The weighted-average outstanding balance of our asset-specific financings was $1.1 billion for the six months ended June 30, 2018 and $525.5 million for the six months ended December 31, 2017.
22
Table of Contents
Blackstone Mortgage Trust, Inc.
Notes to Consolidated Financial Statements (continued)
(Unaudited)
GE Portfolio Acquisition Facility
During the second quarter of 2015, concurrently with our acquisition of the GE portfolio, we entered into an agreement with Wells Fargo to provide us with secured financing for the acquired portfolio. The GE portfolio acquisition facility is non-revolving and consists of a single master repurchase agreement providing for asset-specific borrowings for each collateral asset. The following tables detail our asset-specific borrowings related to the GE portfolio acquisition ($ in thousands):
| June 30, 2018 |
||||||||||||||||||||||
|
GE Portfolio Acquisition Facility |
Count |
Principal Balance(1) |
Book Value | Wtd. Avg. Yield/Cost(2) |
Guarantee(3) | Wtd. Avg. Term(4) |
||||||||||||||||
| Collateral assets |
11 | $ | 645,107 | $ | 646,554 | 5.99 | % | n/a | May 2021 | |||||||||||||
| Financing provided |
11 | $ | 509,441 | $ | 508,615 | L+1.78 | % | $ | 250,000 | May 2021 | ||||||||||||
| December 31, 2017 |
||||||||||||||||||||||
|
GE Portfolio Acquisition Facility |
Count |
Principal Balance(1) |
Book Value | Wtd. Avg. Yield/Cost(2) |
Guarantee(3) | Wtd. Avg. Term(4) |
||||||||||||||||
| Collateral assets |
16 | $ | 906,707 | $ | 911,092 | 5.74 | % | n/a | Jul. 2020 | |||||||||||||
| Financing provided |
16 | $ | 703,423 | $ | 702,337 | L+1.72 | % | $ | 250,000 | Jul. 2020 | ||||||||||||
|
|
||||||||||||||||||||||
| (1) |
As of June 30, 2018, this facility provided for $606.0 million of financing, of which $509.4 million was outstanding and an additional $96.6 million was available to finance future loan fundings in the GE portfolio. As of December 31, 2017, this facility provided for $816.3 million of financing, of which $703.4 million was outstanding and an additional $112.9 million was available to finance future loan fundings in the GE portfolio. | |||||||||||
| (2) |
Includes fixed and floating rate loans and related liabilities which are indexed to the various benchmark rates relevant in each arrangement in terms of currency and payment frequency. Therefore, the net exposure to each benchmark rate is in direct proportion to our net assets indexed to that rate. In addition to cash coupon, yield/cost includes the amortization of deferred origination fees / financing costs. | |||||||||||
| (3) |
We guarantee obligations under the GE portfolio acquisition facility in an amount equal to the greater of (i) 25% of outstanding asset-specific borrowings, and (ii) $250.0 million. | |||||||||||
| (4) |
The weighted-average term is determined based on the maximum maturity of the corresponding loans, assuming all extension options are exercised by the borrower. Each of our asset-specific financings are term-matched to the corresponding collateral loans. | |||||||||||
Revolving Credit Agreement
We have entered into a $250.0 million full recourse secured revolving credit agreement with Barclays that is designed to finance first mortgage originations for up to six months as a bridge to term financing or syndication. Advances under the agreement are subject to availability under a specified borrowing base and accrue interest at a per annum pricing rate equal to the sum of (i) an applicable base rate or Eurodollar rate and (ii) an applicable margin, in each case, dependent on the applicable type of loan collateral. The maturity date of the facility is April 4, 2020.
During the six months ended June 30, 2018, the weighted-average outstanding borrowings under the revolving credit agreement were $57.0 million and we recorded interest expense of $885,000, including $511,000 of amortization of deferred fees and expenses. As of June 30, 2018, we had no outstanding borrowings under the agreement.
During the six months ended December 31, 2017, the weighted-average outstanding borrowings under the revolving credit agreement were $59.9 million and we recorded interest expense of $2.2 million, including $497,000 of amortization of deferred fees and expenses. As of December 31, 2017, we had no outstanding borrowings under the agreement.
Debt Covenants
Each of the guarantees related to our secured debt agreements contain the following uniform financial covenants: (i) our ratio of earnings before interest, taxes, depreciation, and amortization, or EBITDA, to fixed charges, as defined in the agreements, shall be not less than 1.4 to 1.0; (ii) our tangible net worth, as defined in the agreements, shall not be less than $2.2 billion as of each measurement date plus 75% of the net cash proceeds of future equity issuances subsequent to June 30, 2018; (iii) cash liquidity shall not be less than the greater of (x) $10.0 million or (y) 5% of our recourse indebtedness; and (iv) our indebtedness shall not exceed 83.33% of our total assets. As of June 30, 2018 and December 31, 2017, we were in compliance with these covenants.
23
Table of Contents
Blackstone Mortgage Trust, Inc.
Notes to Consolidated Financial Statements (continued)
(Unaudited)
6. LOAN PARTICIPATIONS SOLD, NET
The financing of a loan by the non-recourse sale of a senior interest in the loan through a participation agreement generally does not qualify as a sale under GAAP. Therefore, in the instance of such sales, we present the whole loan as an asset and the loan participation sold as a liability on our consolidated balance sheet until the loan is repaid. The obligation to pay principal and interest on these liabilities is generally based on the performance of the related loan obligation. The gross presentation of loan participations sold does not impact stockholders’ equity or net income.
The following tables detail our loan participations sold ($ in thousands):
| June 30, 2018 |
||||||||||||||||||||||
| Loan Participations Sold |
Count |
Principal Balance |
Book Value | Yield/Cost(1) | Guarantee(2) | Term | ||||||||||||||||
| Total loan |
1 | $ | 200,409 | $ | 198,197 | L+5.99 | % | n/a | Feb. 2022 | |||||||||||||
| Senior participation(3)(4) |
1 | 153,090 | 152,855 | L+4.07 | % | n/a | Feb. 2022 | |||||||||||||||
| December 31, 2017 |
||||||||||||||||||||||
| Loan Participations Sold |
Count |
Principal Balance |
Book Value | Yield/Cost(1) | Guarantee(2) | Term | ||||||||||||||||
| Total loan |
1 | $ | 141,119 | $ | 138,907 | L+5.94 | % | n/a | Feb. 2022 | |||||||||||||
| Senior participation(3)(4) |
1 | 80,706 | 80,415 | L+4.14 | % | n/a | Feb. 2022 | |||||||||||||||
|
|
||||||||||||||||||||||
| (1) |
Our floating rate loans and related liabilities are indexed to the various benchmark rates relevant in each arrangement in terms of currency and payment frequency. Therefore the net exposure to each benchmark rate is in direct proportion to our net assets indexed to that rate. In addition to cash coupon, yield/cost includes the amortization of deferred fees / financing costs. | |||||||||||||
| (2) |
As of June 30, 2018 and December 31, 2017, our loan participations sold was non-recourse to us. | |||||||||||||
| (3) |
During the three and six months ended June 30, 2018, we recorded $2.0 million and $3.5 million, respectively, of interest expense related to our loan participations sold. During the three and six months ended June 30, 2017, we recorded $2.7 million and $5.3 million, respectively, of interest expense related to our loan participations sold. | |||||||||||||
| (4) |
The difference between principal balance and book value of loan participations sold is due to deferred financing costs of $235,000 and $291,000 as of June 30, 2018 and December 31, 2017, respectively. | |||||||||||||
7. SECURITIZED DEBT OBLIGATIONS, NET
We have financed a pool of our loans through a collateralized loan obligation, or the CLO, and have also financed one of our loans through a single asset securitization vehicle, or the Single Asset Securitization. The CLO and the Single Asset Securitization have issued securitized debt obligations that are non-recourse to us. Both the CLO and the Single Asset Securitization are consolidated in our financial statements. Refer to Note 15 for further discussion of our CLO and Single Asset Securitization.
24
Table of Contents
Blackstone Mortgage Trust, Inc.
Notes to Consolidated Financial Statements (continued)
(Unaudited)
The following tables detail our securitized debt obligations ($ in thousands):
| June 30, 2018 | ||||||||||||||||||||
| Securitized Debt Obligations |
Count | Principal Balance |
Book Value | Wtd. Avg. Yield/Cost(1) |
Term(2) | |||||||||||||||
| Collateralized Loan Obligation |
||||||||||||||||||||
| Collateral assets |
29 | $ | 1,000,000 | $ | 1,000,000 | 5.63 | % | Jan. 2022 | ||||||||||||
| Financing provided |
1 | 817,500 | 808,923 | L+1.74 | % | June 2035 | ||||||||||||||
| Single Asset Securitization |
||||||||||||||||||||
| Collateral assets(3) |
1 | 675,001 | 671,475 | L+3.60 | % | June 2023 | ||||||||||||||
| Financing provided |
1 | 474,620 | 474,388 | L+1.65 | % | June 2033 | ||||||||||||||
| Total |
||||||||||||||||||||
| Collateral assets |
30 | $ | 1,675,001 | $ | 1,671,475 | 5.65 | % | |||||||||||||
|
|
|
|
|
|
|
|
|
|||||||||||||
| Financing provided(4) |
2 | $ | 1,292,120 | $ | 1,283,311 | L+1.71 | % | |||||||||||||
|
|
|
|
|
|
|
|
|
|||||||||||||
| December 31, 2017 | ||||||||||||||||||||
| Securitized Debt Obligations |
Count | Principal Balance |
Book Value | Wtd. Avg. Yield/Cost(1) |
Term(2) | |||||||||||||||
| Collateralized Loan Obligation |
||||||||||||||||||||
| Collateral assets |
31 | $ | 1,000,000 | $ | 1,000,000 | 5.16 | % | Nov. 2021 | ||||||||||||
| Financing provided |
1 | 817,500 | 808,083 | L+1.76 | % | June 2035 | ||||||||||||||
| Single Asset Securitization |
||||||||||||||||||||
| Collateral assets(3) |
1 | 656,406 | 652,880 | L+3.60 | % | June 2023 | ||||||||||||||
| Financing provided |
1 | 474,620 | 474,328 | L+1.94 | % | June 2033 | ||||||||||||||
| Total |
||||||||||||||||||||
| Collateral assets |
32 | $ | 1,656,406 | $ | 1,652,880 | 5.17 | % | |||||||||||||
|
|
|
|
|
|
|
|
|
|||||||||||||
| Financing provided(4) |
2 | $ | 1,292,120 | $ | 1,282,411 | L+1.83 | % | |||||||||||||
|
|
|
|
|
|
|
|
|
|||||||||||||
|
|
||||||||||||||||||||
| (1) |
As of June 30, 2018, 98% of our loans financed by securitized debt obligations earned a floating rate of interest. As of December 31, 2017, 98% of our loans financed by securitized debt obligations earned a floating rate of interest. In addition to cash coupon, all-in yield includes the amortization of deferred origination and extension fees, loan origination costs, purchase discounts, and accrual of exit fees. All-in yield for the total portfolio assume applicable floating benchmark rates for weighted-average calculation. | |||||||||
| (2) |
Loan term represents weighted-average final maturity, assuming all extension options are exercised by the borrower. Repayments of securitized debt obligations are tied to timing of the related collateral loan asset repayments. The term of these obligations represents the rated final distribution date of the securitizations. | |||||||||
| (3) |
The collateral assets for the Single Asset Securitization include the total loan amount, of which we securitized $500.0 million. | |||||||||
| (4) |
During the three and six months ended June 30, 2018, we recorded $12.0 million and $23.1 million of interest expense, respectively, related to our securitized debt obligations. During both the three and six months ended June 30, 2017, we recorded $37,000 of interest expense related to our securitized debt obligations. | |||||||||
25
Table of Contents
Blackstone Mortgage Trust, Inc.
Notes to Consolidated Financial Statements (continued)
(Unaudited)
8. CONVERTIBLE NOTES, NET
As of June 30, 2018, the following convertible senior notes, or Convertible Notes, were outstanding ($ in thousands):
| Convertible Notes Issuance |
Face Value | Coupon Rate | All-in Cost(1) | Conversion Rate(2) | Maturity | |||||||||||||||
| November 2013 |
$ | 172,328 | 5.25 | % | 5.87 | % | 36.5472 | December 1, 2018 | ||||||||||||
| May 2017 |
402,500 | 4.38 | % | 4.85 | % | 28.0324 | May 5, 2022 | |||||||||||||
| March 2018 |
220,000 | 4.75 | % | 5.33 | % | 27.6052 | March 15, 2023 | |||||||||||||
|
|
||||||||||||||||||||
| (1) |
Includes issuance costs that are amortized through interest expense over the life of the Convertible Notes using the effective interest method. | |||||||||
| (2) |
Represents the shares of class A common stock per $1,000 principal amount of Convertible Notes, which is equivalent to a conversion price of $27.36, $35.67, and $36.23 per share of class A common stock, respectively, for the November 2013, May 2017, and March 2018 convertible notes. As a result of exceeding the cumulative dividend threshold, as defined in the November 2013 convertible notes supplemental indenture, the conversion rate on the November 2013 convertible notes was most recently adjusted on March 28, 2018 from the prior conversion rate of 36.1380 shares of class A common stock per $1,000 principal amount of convertible notes, which was equivalent to a conversion price of $27.67 per share of class A common stock. The cumulative dividend threshold as defined in the respective May 2017 and March 2018 convertible notes supplemental indentures have not been exceeded as of June 30, 2018. | |||||||||
The Convertible Notes are convertible at the holders’ option into shares of our class A common stock, only under specific circumstances, prior to the close of business on August 31, 2018, January 31, 2022, and December 14, 2022 for the November 2013, May 2017, and March 2018 convertible notes, respectively, at the applicable conversion rate in effect on the conversion date. Thereafter, the Convertible Notes are convertible at the option of the holder at any time until the second scheduled trading day immediately preceding the maturity date. We may not redeem the Convertible Notes prior to maturity. The last reported sale price of our class A common stock of $31.43 on June 29, 2018, the last trading day in the quarter ended June 30, 2018, was greater than the per share conversion price of the November 2013 convertible notes but less than the per share conversion price of the May 2017 and March 2018 convertible notes. We have the intent and ability to settle each series of the Convertible Notes in cash and, as a result, the Convertible Notes did not have any impact on our diluted earnings per share. During the three months ended June 30, 2018, holders of $172,000 of our November 2013 convertible notes elected to convert their notes pursuant to the terms of the November 2013 convertible notes supplemental indenture. The conversions were settled entirely in cash.
Upon our issuance of the November 2013 convertible notes, we recorded a $9.1 million discount based on the implied value of the conversion option and an assumed effective interest rate of 6.50%, as well as $4.1 million of initial issuance costs. Including the amortization of this discount and the issuance costs, our total cost of the November 2013 convertible notes issuance is 7.16% per annum.
Upon our issuance of the May 2017 convertible notes, we recorded a $979,000 discount based on the implied value of the conversion option and an assumed effective interest rate of 4.57%, as well as $8.4 million of initial debt discount and issuance costs. Including the amortization of the discount and issuance costs, our total cost of the May 2017 convertible notes issuance is 4.91% per annum.
Upon our issuance of the March 2018 convertible notes, we recorded a $1.5 million discount based on the implied value of the conversion option and an assumed effective interest rate of 5.25%, as well as $5.2 million of initial debt discount and issuance costs. Including the amortization of the discount and issuance costs, our total cost of the March 2018 convertible notes issuance is 5.49% per annum.
26
Table of Contents
Blackstone Mortgage Trust, Inc.
Notes to Consolidated Financial Statements (continued)
(Unaudited)
The following table details the net book value of our Convertible Notes on our consolidated balance sheets ($ in thousands):
| June 30, 2018 | December 31, 2017 | |||||||
| Face value |
$ | 794,828 | $ | 575,000 | ||||
| Unamortized discount |
(14,410 | ) | (10,279 | ) | ||||
| Deferred financing costs |
(1,002 | ) | (810 | ) | ||||
|
|
|
|
|
|||||
| Net book value |
$ | 779,416 | $ | 563,911 | ||||
|
|
|
|
|
|||||
The following table details our interest expense related to the Convertible Notes ($ in thousands):
| Three Months Ended | Six Months Ended | |||||||||||||||
| June 30, | June 30, | |||||||||||||||
| 2018 | 2017 | 2018 | 2017 | |||||||||||||
| Cash coupon |
$ | 9,274 | $ | 4,221 | $ | 16,056 | $ | 6,485 | ||||||||
| Discount and issuance cost amortization |
1,206 | 955 | 2,395 | 1,668 | ||||||||||||
|
|
|
|
|
|
|
|
|
|||||||||
| Total interest expense |
$ | 10,480 | $ | 5,176 | $ | 18,451 | $ | 8,153 | ||||||||
|
|
|
|
|
|
|
|
|
|||||||||
Accrued interest payable for the Convertible Notes was $6.4 million and $3.7 million as of June 30, 2018 and December 31, 2017, respectively. Refer to Note 2 for additional discussion of our accounting policies for the Convertible Notes.
9. DERIVATIVE FINANCIAL INSTRUMENTS
The sole objective of our use of derivative financial instruments is to minimize the risks and/or costs associated with our investments and/or financing transactions. These derivatives may or may not qualify as net investment, cash flow, or fair value hedges under the hedge accounting requirements of ASC 815 – “Derivatives and Hedging.” Derivatives not designated as hedges are not speculative and are used to manage our exposure to interest rate movements and other identified risks. For more information on the accounting for designated and non-designated hedges, refer to Note 2.
The use of derivative financial instruments involves certain risks, including the risk that the counterparties to these contractual arrangements do not perform as agreed. To mitigate this risk, we only enter into derivative financial instruments with counterparties that have appropriate credit ratings and are major financial institutions with which we and our affiliates may also have other financial relationships. We do not anticipate that any of the counterparties will fail to meet their obligations.
Net Investment Hedges of Foreign Currency Risk
Certain of our international investments expose us to fluctuations in foreign interest rates and currency exchange rates. These fluctuations may impact the value of our cash receipts and payments in terms of our functional currency, the U.S. dollar. We use foreign currency forward contracts to protect the value or fix the amount of certain investments or cash flows in terms of the U.S. dollar.
27
Table of Contents
Blackstone Mortgage Trust, Inc.
Notes to Consolidated Financial Statements (continued)
(Unaudited)
The following table details our outstanding foreign exchange derivatives that were designated as net investment hedges of foreign currency risk (notional amount in thousands):
| June 30, 2018 |
December 31, 2017 |
|||||||||||||||||
| Foreign Currency Derivatives |
Number of |
Notional Amount |
Foreign Currency Derivatives |
Number of Instruments |
Notional Amount |
|||||||||||||
| Sell EUR Forward |
1 | € | 185,000 | Sell GBP Forward | 1 | £ | 112,700 | |||||||||||
| Sell GBP Forward |
2 | £ | 133,100 | Sell CAD Forward | 1 | C$ | 95,100 | |||||||||||
| Sell CAD Forward |
1 | C$ | 73,100 | |||||||||||||||
Cash Flow Hedges of Interest Rate Risk
Certain of our financing transactions expose us to a fixed versus floating rate mismatch between our assets and liabilities. We use derivative financial instruments, which include interest rate caps and swaps, and may also include interest rate options, floors, and other interest rate derivative contracts, to hedge interest rate risk associated with our borrowings where there is potential for an index mismatch.
The following tables detail our outstanding interest rate derivatives that were designated as cash flow hedges of interest rate risk (notional amount in thousands):
| June 30, 2018 | ||||||||||||
| Interest Rate |
Number of Instrument |
Notional Amount |
Strike | Index | Wtd.-Avg. Maturity (Years) | |||||||
| Interest Rate Swaps |
4 | C$ | 107,913 | 1.0% | CDOR | 0.9 | ||||||
| Interest Rate Caps |
9 | $ | 204,248 | 2.4% | USD LIBOR | 1.0 | ||||||
| Interest Rate Caps |
3 | C$ | 22,765 | 2.0% | CDOR | 0.6 | ||||||
| December 31, 2017 | ||||||||||||
| Interest Rate |
Number of Instrument |
Notional Amount |
Strike | Index | Wtd.-Avg. Maturity (Years) | |||||||
| Interest Rate Swaps |
4 | C$ | 108,094 | 1.0% | CDOR | 1.4 | ||||||
| Interest Rate Caps |
9 | $ | 204,248 | 2.4% | USD LIBOR | 1.5 | ||||||
| Interest Rate Caps |
3 | C$ | 23,370 | 2.0% | CDOR | 0.3 | ||||||
Amounts reported in accumulated other comprehensive income (loss) related to derivatives will be reclassified to interest expense as interest payments are made on our floating rate debt. During the twelve months following June 30, 2018, we estimate that an additional $525,000 will be reclassified from accumulated other comprehensive income (loss) as an increase to interest income.
Non-designated Hedges
During the three and six months ended June 30, 2018, we recorded losses of $69,000 and gains of $146,000, respectively, related to non-designated hedges that were reported as a component of interest expense in our consolidated financial statements. During the three and six months ended June 30, 2017, we recorded losses of $403,000 and $313,000, respectively.
28
Table of Contents
Blackstone Mortgage Trust, Inc.
Notes to Consolidated Financial Statements (continued)
(Unaudited)
The following tables summarize our non-designated hedges (notional amount in thousands):
| June 30, 2018 |
||||||
| Non-designated Hedges |
Number of Instrument |
Notional Amount |
||||
| Buy GBP / Sell EUR Forward |
1 | € | 12,857 | |||
| December 31, 2017 |
||||||
| Non-designated Hedges |
Number of Instrument |
Notional Amount |
||||
| Buy GBP / Sell EUR Forward |
1 | € | 12,857 | |||
Valuation of Derivative Instruments
The following table summarizes the fair value of our derivative financial instruments ($ in thousands):
| Fair Value of Derivatives in an Asset Position(1) as of |
Fair Value of Derivatives in a Liability Position(2) as of |
|||||||||||||||
| June 30, 2018 | December 31, 2017 | June 30, 2018 | December 31, 2017 | |||||||||||||
| Derivatives designated as hedging instruments: |
||||||||||||||||
| Foreign exchange contracts |
$ | 5,151 | $ | — | $ | 1,104 | $ | 4,872 | ||||||||
| Interest rate derivatives |
1,125 | 1,214 | — | — | ||||||||||||
|
|
|
|
|
|
|
|
|
|||||||||
| Total |
$ | 6,276 | $ | 1,214 | $ | 1,104 | $ | 4,872 | ||||||||
|
|
|
|
|
|
|
|
|
|||||||||
| Derivatives not designated as hedging instruments: |
||||||||||||||||
| Foreign exchange contracts |
$ | — | $ | — | $ | 146 | $ | 39 | ||||||||
| Interest rate derivatives |
— | — | — | — | ||||||||||||
|
|
|
|
|
|
|
|
|
|||||||||
| Total |
$ | — | $ | — | $ | 146 | $ | 39 | ||||||||
|
|
|
|
|
|
|
|
|
|||||||||
| Total Derivatives |
$ | 6,276 | $ | 1,214 | $ | 1,250 | $ | 4,911 | ||||||||
|
|
|
|
|
|
|
|
|
|||||||||
|
|
||||||||||||||||
| (1) | Included in other assets in our consolidated balance sheets. |
| (2) | Included in other liabilities in our consolidated balance sheets. |
29
Table of Contents
Blackstone Mortgage Trust, Inc.
Notes to Consolidated Financial Statements (continued)
(Unaudited)
The following table presents the effect of our derivative financial instruments on our consolidated statements of operations ($ in thousands):
| Amount of Gain (Loss) Recognized in OCI on Derivatives |
Location of Gain (Loss) Reclassified from Accumulated OCI into Income |
Amount of Gain (Loss) Reclassified from Accumulated OCI into Income |
||||||||||||||||||
| Derivatives in Hedging Relationships |
Three Months Ended June 30, 2018 |
Six Months Ended June 30, 2018 |
Three Months Ended June 30, 2018 |
Six Months Ended June 30, 2018 |
||||||||||||||||
| Net Investment Hedges |
||||||||||||||||||||
| Foreign exchange contracts(1) |
$ | 24,973 | $ | 22,019 | Interest Expense | $ | — | $ | — | |||||||||||
| Cash Flow Hedges |
||||||||||||||||||||
| Interest rate derivatives |
9 | 135 | Interest Income | (2) | 127 | 234 | ||||||||||||||
|
|
|
|
|
|
|
|
|
|||||||||||||
| Total |
$ | 24,982 | $ | 22,154 | $ | 127 | $ | 234 | ||||||||||||
|
|
|
|
|
|
|
|
|
|||||||||||||
|
| ||||||||||
| (1) |
During the three and six months ended June 30, 2018, we received net cash settlements of $20.7 million and $13.4 million, respectively, on our foreign currency forward contracts. Those amounts are included as a component of accumulated other comprehensive loss on our consolidated balance sheets. | |
| (2) |
During the three months ended June 30, 2018, we recorded total interest and related income of $191.5 million which included interest income of $127,000 related to our cash flow hedges. During the six months ended June 30, 2018, we recorded total interest and related income of $346.9 million which included $234,000 related to our cash flow hedges. |
Credit-Risk Related Contingent Features
We have entered into agreements with certain of our derivative counterparties that contain provisions where if we were to default on any of our indebtedness, including default where repayment of the indebtedness has not been accelerated by the lender, we may also be declared in default on our derivative obligations. In addition, certain of our agreements with our derivative counterparties require that we post collateral to secure net liability positions. As of June 30, 2018, we were in a net asset position with each such derivative counterparty and did not have any collateral posted under these derivative contracts. As of December 31, 2017, we were in a net asset position with one of our derivative counterparties and in a net liability position with our other derivative counterparty, and posted collateral of $4.1 million under these derivative contracts.
10. EQUITY
Stock and Stock Equivalents
Authorized Capital
As of June 30, 2018, we had the authority to issue up to 300,000,000 shares of stock, consisting of 200,000,000 shares of class A common stock and 100,000,000 shares of preferred stock. Subject to applicable NYSE listing requirements, our board of directors is authorized to cause us to issue additional shares of authorized stock without stockholder approval. In addition, to the extent not issued, currently authorized stock may be reclassified between class A common stock and preferred stock. We did not have any shares of preferred stock issued and outstanding as of June 30, 2018.
Class A Common Stock and Deferred Stock Units
Holders of shares of our class A common stock are entitled to vote on all matters submitted to a vote of stockholders and are entitled to receive such dividends as may be authorized by our board of directors and declared by us, in all cases subject to the rights of the holders of shares of outstanding preferred stock, if any.
30
Table of Contents
Blackstone Mortgage Trust, Inc.
Notes to Consolidated Financial Statements (continued)
(Unaudited)
The following table details our issuance of class A common stock during the three months ended June 30, 2018 ($ in thousands, except share and per share data):
| Three Months Ended June 30, 2018 |
||||
| Shares issued(1) |
3,251,449 | |||
| Share issue price(2) |
$ | 32.13 | ||
| Net proceeds(3) |
$ | 102,496 | ||
|
|
||||
| (1) | Issuance represents shares issued under our at-the-market program. |
| (2) | Represents the weighted-average price per share paid by the sales agents. Net proceeds after sales discounts and commissions were $31.57 per share. |
| (3) | Net proceeds represents proceeds received from the underwriters less applicable transaction costs. |
We also issue restricted class A common stock under our stock-based incentive plans. Refer to Note 13 for additional discussion of these long-term incentive plans. In addition to our class A common stock, we also issue deferred stock units to certain members of our board of directors in lieu of cash compensation for services rendered. These deferred stock units are non-voting, but carry the right to receive dividends in the form of additional deferred stock units in an amount equivalent to the cash dividends paid to holders of shares of class A common stock.
The following table details the movement in our outstanding shares of class A common stock, including restricted class A common stock and deferred stock units:
| Six Months Ended June 30, | ||||||||
| Common Stock Outstanding(1) |
2018 | 2017 | ||||||
| Beginning balance |
108,081,077 | 94,709,290 | ||||||
| Issuance of class A common stock(2) |
3,252,325 | 543 | ||||||
| Issuance of restricted class A common stock, net |
305,703 | 286,773 | ||||||
| Issuance of deferred stock units |
15,919 | 12,904 | ||||||
|
|
|
|
|
|||||
| Ending balance |
111,655,024 | 95,009,510 | ||||||
|
|
|
|
|
|||||
|
|
||||||||
| (1) | Includes deferred stock units held by members of our board of directors of 213,136 and 181,931 as of June 30, 2018 and 2017, respectively. |
| (2) | Includes 876 and 543 shares issued under our dividend reinvestment program during the six months ended June 30, 2018 and 2017, respectively. |
Dividend Reinvestment and Direct Stock Purchase Plan
On March 25, 2014, we adopted a dividend reinvestment and direct stock purchase plan, under which we registered and reserved for issuance, in the aggregate, 10,000,000 shares of class A common stock. Under the dividend reinvestment component of this plan, our class A common stockholders can designate all or a portion of their cash dividends to be reinvested in additional shares of class A common stock. The direct stock purchase component allows stockholders and new investors, subject to our approval, to purchase shares of class A common stock directly from us. During the three and six months ended June 30, 2018, we issued 421 shares and 876 shares, respectively, of class A common stock under the dividend reinvestment component of the plan compared to 273 shares and 543 shares for the same periods in 2017. As of June 30, 2018, a total of 9,996,050 shares of class A common stock remained available for issuance under the dividend reinvestment and direct stock purchase plan.
At the Market Stock Offering Program
On May 9, 2014, we entered into equity distribution agreements, or ATM Agreements, pursuant to which we may sell, from time to time, up to an aggregate sales price of $200.0 million of our class A common stock. On July 29, 2016, in connection with filing a new universal shelf registration statement on Form S-3, we entered into amendments to each of the ATM Agreements. Sales of class A common stock made pursuant to the ATM Agreements may be made in negotiated transactions or transactions that are deemed to be “at the market” offerings as defined in Rule 415 under the Securities Act of 1933, as amended. Actual sales will depend on a variety of factors
31
Table of Contents
Blackstone Mortgage Trust, Inc.
Notes to Consolidated Financial Statements (continued)
(Unaudited)
including market conditions, the trading price of our class A common stock, our capital needs, and our determination of the appropriate sources of funding to meet such needs. During the six months ended June 30, 2018, we issued and sold 3,251,449 shares of class A common stock under the ATM Agreements, with net proceeds totaling $102.5 million. We did not sell any shares of our class A common stock under the ATM Agreements during the six months ended June 30, 2017. As of June 30, 2018, sales of our class A common stock with an aggregate sales price of $84.1 million remained available for issuance under the ATM Agreements.
Dividends
We generally intend to distribute substantially all of our taxable income, which does not necessarily equal net income as calculated in accordance with GAAP, to our stockholders each year to comply with the REIT provisions of the Internal Revenue Code of 1986, as amended, or the Internal Revenue Code. Our dividend policy remains subject to revision at the discretion of our board of directors. All distributions will be made at the discretion of our board of directors and will depend upon our taxable income, our financial condition, our maintenance of REIT status, applicable law, and other factors as our board of directors deems relevant.
On June 15, 2018, we declared a dividend of $0.62 per share, or $69.1 million, that was paid on July 16, 2018, to stockholders of record as of June 29, 2018. The following table details our dividend activity ($ in thousands, except per share data):
| Three Months Ended June 30, | Six Months Ended June 30, | |||||||||||||||
| 2018 | 2017 | 2018 | 2017 | |||||||||||||
| Dividends declared per share of common stock |
$ | 0.62 | $ | 0.62 | $ | 1.24 | $ | 1.24 | ||||||||
| Total dividends declared |
$ | 69,094 | $ | 58,793 | $ | 136,174 | $ | 117,580 | ||||||||
Earnings Per Share
We calculate our basic and diluted earnings per share using the two-class method for all periods presented as the unvested shares of our restricted class A common stock qualify as participating securities, as defined by GAAP. These restricted shares have the same rights as our other shares of class A common stock, including participating in any dividends, and therefore have been included in our basic and diluted net income per share calculation. Our Convertible Notes are excluded from dilutive earnings per share as we have the intent and ability to settle these instruments in cash.
The following table sets forth the calculation of basic and diluted net income per share of class A common stock based on the weighted-average of both restricted and unrestricted class A common stock outstanding ($ in thousands, except per share data):
| Three Months Ended June 30, | Six Months Ended June 30, | |||||||||||||||
| 2018 | 2017 | 2018 | 2017 | |||||||||||||
| Net income(1) |
$ | 72,312 | $ | 50,613 | $ | 133,271 | $ | 102,018 | ||||||||
| Weighted-average shares outstanding, basic and diluted |
109,069,078 | 95,005,873 | 108,735,193 | 94,999,664 | ||||||||||||
|
|
|
|
|
|
|
|
|
|||||||||
| Per share amount, basic and diluted |
$ | 0.66 | $ | 0.53 | $ | 1.23 | $ | 1.07 | ||||||||
|
|
|
|
|
|
|
|
|
|||||||||
|
|
||||||||||||||||
| (1) |
Represents net income attributable to Blackstone Mortgage Trust, Inc. | |||||
Other Balance Sheet Items
Accumulated Other Comprehensive Loss
As of June 30, 2018, total accumulated other comprehensive loss was $32.1 million, primarily representing (i) $84.7 million of cumulative unrealized currency translation adjustments on assets and liabilities denominated in foreign currencies and (ii) an offsetting $52.6 million of net realized and unrealized gains related to changes in the fair value of derivative instruments. As of December 31, 2017, total accumulated other comprehensive loss was $29.7 million, primarily representing (i) $60.3 million of cumulative unrealized currency translation adjustments on assets and liabilities denominated in foreign currencies and (ii) an offsetting $30.6 million of net realized and unrealized gains related to changes in the fair value of derivative instruments.
32
Table of Contents
Blackstone Mortgage Trust, Inc.
Notes to Consolidated Financial Statements (continued)
(Unaudited)
Non-Controlling Interests
The non-controlling interests included on our consolidated balance sheets represent the equity interests in our Multifamily Joint Venture that are not owned by us. A portion of our Multifamily Joint Venture’s consolidated equity and results of operations are allocated to these non-controlling interests based on their pro rata ownership of our Multifamily Joint Venture. As of June 30, 2018, our Multifamily Joint Venture’s total equity was $34.5 million, of which $29.3 million was owned by us, and $5.2 million was allocated to non-controlling interests. As of December 31, 2017, our Multifamily Joint Venture’s total equity was $42.3 million, of which $36.0 million was owned by us, and $6.3 million was allocated to non-controlling interests.
11. OTHER EXPENSES
Our other expenses consist of the management and incentive fees we pay to our Manager and our general and administrative expenses.
Management and Incentive Fees
Pursuant to a management agreement between our Manager and us, or our Management Agreement, our Manager earns a base management fee in an amount equal to 1.50% per annum multiplied by our outstanding equity balance, as defined in the Management Agreement. In addition, our Manager is entitled to an incentive fee in an amount equal to the product of (i) 20% and (ii) the excess of (a) our Core Earnings (as defined in our Management Agreement) for the previous 12-month period over (b) an amount equal to 7.00% per annum multiplied by our outstanding Equity, provided that our Core Earnings over the prior three-year period is greater than zero. Core Earnings, as defined in our Management Agreement, is generally equal to our net income (loss) prepared in accordance with GAAP, excluding (i) certain non-cash items (ii) the net income (loss) related to our legacy portfolio and (iii) incentive management fees.
During the three and six months ended June 30, 2018, we incurred $11.1 million and $22.2 million, respectively, of management fees payable to our Manager, compared to $9.6 million and $19.1 million during the same periods in 2017. In addition, during the three and six months ended June 30, 2018, we incurred $11.3 million and $15.7 million, respectively, of incentive fees payable to our Manager, compared to $4.8 million and $8.2 million during the same periods in 2017.
As of June 30, 2018 and December 31, 2017 we had accrued management and incentive fees payable to our Manager of $22.4 million and $14.3 million, respectively.
33
Table of Contents
Blackstone Mortgage Trust, Inc.
Notes to Consolidated Financial Statements (continued)
(Unaudited)
General and Administrative Expenses
General and administrative expenses consisted of the following ($ in thousands):
| Three Months Ended June 30, | Six Months Ended June 30, | |||||||||||||||
| 2018 | 2017 | 2018 | 2017 | |||||||||||||
| Professional services(1) |
$ | 1,139 | $ | 862 | $ | 2,361 | $ | 1,878 | ||||||||
| Operating and other costs(1) |
830 | 489 | 1,339 | 934 | ||||||||||||
|
|
|
|
|
|
|
|
|
|||||||||
| Subtotal |
1,969 | 1,351 | 3,700 | 2,812 | ||||||||||||
| Non-cash compensation expenses |
||||||||||||||||
| Restricted class A common stock earned |
6,653 | 5,865 | 13,504 | 11,678 | ||||||||||||
| Director stock-based compensation |
125 | 94 | 250 | 188 | ||||||||||||
|
|
|
|
|
|
|
|
|
|||||||||
| Subtotal |
6,778 | 5,959 | 13,754 | 11,866 | ||||||||||||
|
|
|
|
|
|
|
|
|
|||||||||
| Total BXMT expenses |
8,747 | 7,310 | 17,454 | 14,678 | ||||||||||||
| Other expenses |
— | 63 | — | 122 | ||||||||||||
|
|
|
|
|
|
|
|
|
|||||||||
| Total general and administrative expenses |
$ | 8,747 | $ | 7,373 | $ | 17,454 | $ | 14,800 | ||||||||
|
|
|
|
|
|
|
|
|
|||||||||
|
|
||||||||||||||||
| (1) | During the six months ended June 30, 2018, we recognized an aggregate $225,000 of expenses related to our Multifamily Joint Venture. We did not recognize any expenses related to our Multifamily Joint Venture during the six months ended June 30, 2017. |
12. INCOME TAXES
We elected to be taxed as a REIT, effective January 1, 2003, under the Internal Revenue Code for U.S. federal income tax purposes. We generally must distribute annually at least 90% of our net taxable income, subject to certain adjustments and excluding any net capital gain, in order for U.S. federal income tax not to apply to our earnings that we distribute. To the extent that we satisfy this distribution requirement, but distribute less than 100% of our net taxable income, we will be subject to U.S. federal income tax on our undistributed taxable income. In addition, we will be subject to a 4% nondeductible excise tax if the actual amount that we pay out to our stockholders in a calendar year is less than a minimum amount specified under U.S. federal tax laws.
Our qualification as a REIT also depends on our ability to meet various other requirements imposed by the Internal Revenue Code, which relate to organizational structure, diversity of stock ownership, and certain restrictions with regard to the nature of our assets and the sources of our income. Even if we qualify as a REIT, we may be subject to certain U.S. federal income and excise taxes and state and local taxes on our income and assets. If we fail to maintain our qualification as a REIT for any taxable year, we may be subject to material penalties as well as federal, state, and local income tax on our taxable income at regular corporate rates and we would not be able to qualify as a REIT for the subsequent four full taxable years. As of June 30, 2018 and December 31, 2017, we were in compliance with all REIT requirements.
Securitization transactions could result in the creation of taxable mortgage pools for federal income tax purposes. As a REIT, so long as we own 100% of the equity interests in a taxable mortgage pool, we generally would not be adversely affected by the characterization of the securitization as a taxable mortgage pool. Certain categories of stockholders, however, such as foreign stockholders eligible for treaty or other benefits, stockholders with net operating losses, and certain tax-exempt stockholders that are subject to unrelated business income tax, or UBTI, could be subject to increased taxes on a portion of their dividend income from us that is attributable to the taxable mortgage pool. We currently own no UBTI producing assets and we do not intend to purchase or generate assets that produce UBTI distributions in the future.
During the three and six months ended June 30, 2018, we recorded a current income tax provision of $104,000 and $224,000, respectively, primarily related to activities of our taxable REIT subsidiaries and various state and local taxes. During the three and six months ended June 30, 2017, we recorded a current income tax provision of $94,000 and $183,000, respectively. We did not have any deferred tax assets or liabilities as of June 30, 2018 or December 31, 2017.
34
Table of Contents
Blackstone Mortgage Trust, Inc.
Notes to Consolidated Financial Statements (continued)
(Unaudited)
Effective January 1, 2018, under legislation from the Tax Cuts and Jobs Act of 2017, the maximum U.S. federal corporate income tax rate was reduced from 35% to 21%. Accordingly, to the extent that the activities of our taxable REIT subsidiaries generate taxable income in future periods, they may be subject to lower U.S. federal income tax rates.
We have net operating losses, or NOLs, generated by our predecessor business that may be carried forward and utilized in current or future periods. As a result of our issuance of 25,875,000 shares of class A common stock in May 2013, the availability of our NOLs is generally limited to $2.0 million per annum by change of control provisions promulgated by the Internal Revenue Service with respect to the ownership of Blackstone Mortgage Trust. As of December 31, 2017, we had estimated NOLs of $159.0 million that will expire in 2029, unless they are utilized by us prior to expiration.
As of June 30, 2018, tax years 2014 through 2017 remain subject to examination by taxing authorities.
13. STOCK-BASED INCENTIVE PLANS
We are externally managed by our Manager and do not currently have any employees. However, as of June 30, 2018, our Manager, certain individuals employed by an affiliate of our Manager, and certain members of our board of directors were compensated, in part, through the issuance of stock-based instruments.
We had stock-based incentive awards outstanding or available to be awarded under nine benefit plans as of June 30, 2018: (i) our amended and restated 1997 non-employee director stock plan, or 1997 Plan; (ii) our 2007 long-term incentive plan, or 2007 Plan; (iii) our 2011 long-term incentive plan, or 2011 Plan; (iv) our 2013 stock incentive plan, or 2013 Plan; (v) our 2013 manager incentive plan, or 2013 Manager Plan; (vi) our 2016 stock incentive plan, or 2016 Plan; (vii) our 2016 manager incentive plan, or 2016 Manager Plan; (viii) our 2018 stock incentive plan, or 2018 Plan; and (ix) our 2018 manager incentive plan, or 2018 Manager Plan. We refer to our 1997 Plan, our 2007 Plan, our 2011 Plan, our 2013 Plan, our 2013 Manager Plan, our 2016 Plan, and our 2016 Manager Plan, collectively, as our Expired Plans and we refer to our 2018 Plan and 2018 Manager Plan, collectively, as our Current Plans.
Our Expired Plans have expired and no new awards may be issued under them. Under our Current Plans, a maximum of 5,000,000 shares of our class A common stock may be issued to our Manager, our directors and officers, and certain employees of affiliates of our Manager. As of June 30, 2018, we have not granted any shares under the Current Plans.
The following table details the movement in our outstanding shares of restricted class A common stock and the weighted-average grant date fair value per share:
| Restricted Class A Common Stock |
Weighted-Average Grant Date Fair Value Per Share |
|||||||
| Balance as of December 31, 2017 |
1,484,175 | $ | 30.61 | |||||
| Granted |
318,741 | 31.83 | ||||||
| Vested |
(271,211 | ) | 28.90 | |||||
| Forfeited |
(13,038 | ) | 30.19 | |||||
|
|
|
|
|
|||||
| Balance as of June 30, 2018 |
1,518,667 | $ | 31.18 | |||||
|
|
|
|
|
|||||
These shares generally vest in installments over a three-year period, pursuant to the terms of the respective award agreements and the terms of the Current Plans. The 1,518,667 shares of restricted class A common stock outstanding as of June 30, 2018 will vest as follows: 583,286 shares will vest in 2018; 618,168 shares will vest in 2019; and 317,213 shares will vest in 2020. As of June 30, 2018, total unrecognized compensation cost relating to nonvested share-based compensation arrangements was $39.0 million based on the closing price of our class A common stock of $31.43 on June 29, 2018, the last trading day in the quarter ended June 30, 2018. This cost is expected to be recognized over a weighted average period of 1.0 years from June 30, 2018.
35
Table of Contents
Blackstone Mortgage Trust, Inc.
Notes to Consolidated Financial Statements (continued)
(Unaudited)
14. FAIR VALUES
Assets and Liabilities Measured at Fair Value
The following table summarizes our assets and liabilities measured at fair value on a recurring basis ($ in thousands):
| June 30, 2018 | December 31, 2017 | |||||||||||||||||||||||||||||||
| Level 1 | Level 2 | Level 3 | Total | Level 1 | Level 2 | Level 3 | Total | |||||||||||||||||||||||||
| Assets |
||||||||||||||||||||||||||||||||
| Derivatives |
$ | — | $ | 6,276 | $ | — | $ | 6,276 | $ | — | $ | 1,214 | $ | — | $ | 1,214 | ||||||||||||||||
| Liabilities |
||||||||||||||||||||||||||||||||
| Derivatives |
$ | — | $ | 1,250 | $ | — | $ | 1,250 | $ | — | $ | 4,911 | $ | — | $ | 4,911 | ||||||||||||||||
Refer to Note 2 for further discussion regarding fair value measurement.
Fair Value of Financial Instruments
As discussed in Note 2, GAAP requires disclosure of fair value information about financial instruments, whether or not recognized in the statement of financial position, for which it is practicable to estimate that value. The following table details the book value, face amount, and fair value of the financial instruments described in Note 2 ($ in thousands):
| June 30, 2018 | December 31, 2017 | |||||||||||||||||||||||
| Book | Face | Fair | Book | Face | Fair | |||||||||||||||||||
| Value | Amount | Value | Value | Amount | Value | |||||||||||||||||||
| Financial assets |
||||||||||||||||||||||||
| Cash and cash equivalents |
$ | 107,057 | $ | 107,057 | $ | 107,057 | $ | 69,654 | $ | 69,654 | $ | 69,654 | ||||||||||||
| Restricted cash |
— | — | — | 32,864 | 32,864 | 32,864 | ||||||||||||||||||
| Loans receivable, net |
12,214,565 | 12,303,596 | 12,304,909 | 10,056,732 | 10,108,226 | 10,112,331 | ||||||||||||||||||
| Financial liabilities |
||||||||||||||||||||||||
| Secured debt agreements, net |
7,022,500 | 7,044,550 | 7,044,550 | 5,273,855 | 5,290,536 | 5,290,536 | ||||||||||||||||||
| Loan participations sold, net |
152,855 | 153,090 | 153,090 | 80,415 | 80,706 | 80,706 | ||||||||||||||||||
| Securitized debt obligations, net |
1,283,311 | 1,292,120 | 1,294,444 | 1,282,412 | 1,292,120 | 1,292,589 | ||||||||||||||||||
| Convertible notes, net |
779,416 | 794,828 | 808,331 | 563,911 | 575,000 | 610,201 | ||||||||||||||||||
Estimates of fair value for cash and cash equivalents, restricted cash, and convertible notes are measured using observable, quoted market prices, or Level 1 inputs. Estimates of fair value for securitized debt obligations are measured using observable, quoted market prices, in inactive markets, or Level 2 inputs. All other fair value significant estimates are measured using unobservable inputs, or Level 3 inputs. See Note 2 for further discussion regarding fair value measurement of certain of our assets and liabilities.
15. VARIABLE INTEREST ENTITIES
We have financed a portion of our loans through the CLO and the Single Asset Securitization, both of which are VIEs. We are the primary beneficiary and consolidate the CLO and the Single Asset Securitization on our balance sheet as we (i) control the relevant interests of the CLO and the Single Asset Securitization that give us power to direct the activities that most significantly affect the CLO and the Single Asset Securitization, and (ii) have the right to receive benefits and obligation to absorb losses of the CLO and the Single Asset Securitization through the subordinate interests we own.
36
Table of Contents
Blackstone Mortgage Trust, Inc.
Notes to Consolidated Financial Statements (continued)
(Unaudited)
The following table details the assets and liabilities of our consolidated CLO and Single Asset Securitization VIEs ($ in thousands):
| June 30, 2018 | December 31, 2017 | |||||||
| Assets: |
||||||||
| Loans receivable, net |
$ | 1,500,000 | $ | 1,500,000 | ||||
| Other assets |
4,809 | 2,407 | ||||||
|
|
|
|
|
|||||
| Total assets |
$ | 1,504,809 | $ | 1,502,407 | ||||
|
|
|
|
|
|||||
| Liabilities: |
||||||||
| Securitized debt obligations, net |
$ | 1,283,311 | $ | 1,282,412 | ||||
| Other liabilities |
1,977 | 1,379 | ||||||
|
|
|
|
|
|||||
| Total liabilities |
$ | 1,285,288 | $ | 1,283,791 | ||||
|
|
|
|
|
|||||
Assets held by these VIEs are restricted and can be used only to settle obligations of the VIEs, including the subordinate interests owned by us. The liabilities of these VIEs are non-recourse to us and can only be satisfied from the assets of the VIEs. The consolidation of these VIEs results in an increase in our gross assets, liabilities, interest income and interest expense, however it does not affect our stockholders’ equity or net income. We are not obligated to provide, have not provided, and do not intend to provide financial support to these VIEs.
16. TRANSACTIONS WITH RELATED PARTIES
We are managed by our Manager pursuant to the Management Agreement, the current term of which expires on December 19, 2018, and will be automatically renewed for a one-year term upon such date and each anniversary thereafter unless earlier terminated.
As of June 30, 2018 and December 31, 2017, our consolidated balance sheet included $22.4 million and $14.3 million of accrued management and incentive fees payable to our Manager, respectively. During the three and six months ended June 30, 2018, we paid management and incentive fees of $15.5 million and $29.8 million, respectively, to our Manager, compared to $12.9 million and $25.7 million during the same periods of 2017. In addition, during the three and six months ended June 30, 2018, we reimbursed our Manager for expenses incurred on our behalf of $215,000 and $405,000, respectively, compared to $174,000 and $266,000 during the same periods of 2017.
As of June 30, 2018, our Manager held 739,908 shares of unvested restricted class A common stock, which had an aggregate grant date fair value of $23.1 million, and vest in installments over three years from the date of issuance. During the three and six months ended June 30, 2018, we recorded non-cash expenses related to shares held by our Manager of $3.2 million and $6.4 million, respectively, compared to $2.9 million and $5.8 million during the same periods of 2017. We did not issue any shares of restricted class A common stock to our Manager during the six months ended June 30, 2018 or 2017, respectively. Refer to Note 13 for further details on our restricted class A common stock.
An affiliate of our Manager is the special servicer of the CLO. This affiliate did not earn any special servicing fees related to the CLO during the six months ended June 30, 2018 or 2017.
In March of 2018, we originated €1.0 billion of a total €7.3 billion senior term facility, or the Senior Term Facility, for the acquisition of a portfolio of Spanish real estate assets and a Spanish real estate management and loan servicing company by a joint venture between Banco Santander S.A. and certain Blackstone-advised investment vehicles. These investment vehicles own 51% of the joint venture, and we will forgo all non-economic rights under the Senior Term Facility, including voting rights, so long as Blackstone-advised investment vehicles control the joint venture. The Senior Term Facility was negotiated by the joint venture with third-party investment banks without our involvement, and our 14% interest in the Senior Term Facility was made on such market terms.
In the first quarter of 2018, we originated a $330.0 million senior loan, the proceeds of which were used by the borrower to repay an existing loan owned by a Blackstone-advised investment vehicle.
37
Table of Contents
Blackstone Mortgage Trust, Inc.
Notes to Consolidated Financial Statements (continued)
(Unaudited)
In the second quarter of 2018, we acquired from an unaffiliated third-party a 50% interest in a $1.0 billion senior loan to a borrower that is partially owned by a Blackstone-advised investment vehicle. We will forgo all non-economic rights under the loan, including voting rights, so long as Blackstone-advised investment vehicles own the borrower above a certain threshold.
During the six months ended June 30, 2018 and 2017, we originated two loans and three loans, respectively, whereby each respective borrower engaged an affiliate of our Manager to act as title insurance agent in connection with each transaction. We did not incur any expenses or receive any revenues as a result of these transactions.
During the three and six months ended June 30, 2018, we incurred $153,000 and $293,000, respectively, of expenses for various administrative, compliance, and capital market data services to third-party service providers that are affiliates of our Manager, compared to $79,000 and $167,000 during the same periods of 2017.
On June 30, 2017, in a fully subscribed offering totaling $474.6 million, certain Blackstone-advised investment vehicles purchased, in the aggregate, $72.9 million of securitized debt obligations issued by the Single Asset Securitization. These investments by the Blackstone-advised investment vehicles represented minority participations in any individual tranche and were purchased by the Blackstone-advised investment vehicles from third-party investment banks on market terms negotiated by the majority third-party investors.
17. COMMITMENTS AND CONTINGENCIES
Unfunded Commitments Under Loans Receivable
As of June 30, 2018, we had unfunded commitments of $3.0 billion related to 72 loans receivable, which amounts will generally be funded to finance our borrowers’ construction or development of real estate-related assets, capital improvements of existing assets, or lease-related expenditures. These commitments will generally be funded over the term of each loan, subject in certain cases to an expiration date.
Principal Debt Repayments
Our contractual principal debt repayments as of June 30, 2018 were as follows ($ in thousands):
| Payment Timing | ||||||||||||||||||||
| Total | Less Than | 1 to 3 | 3 to 5 | More Than | ||||||||||||||||
| Obligation | 1 Year | Years | Years | 5 Years | ||||||||||||||||
| Principal repayments under secured debt agreements(1) |
$ | 7,044,550 | $ | 651,163 | $ | 2,217,243 | $ | 4,092,944 | $ | 83,200 | ||||||||||
| Principal repayments of convertible notes |
794,828 | 172,328 | — | 622,500 | — | |||||||||||||||
|
|
|
|
|
|
|
|
|
|
|
|||||||||||
| Total(2) |
$ | 7,839,378 | $ | 823,491 | $ | 2,217,243 | $ | 4,715,444 | $ | 83,200 | ||||||||||
|
|
|
|
|
|
|
|
|
|
|
|||||||||||
|
| ||||||||||
| (1) |
The allocation of repayments under our secured debt agreements is based on the earlier of (i) the maturity date of each facility, or (ii) the maximum maturity date of the collateral loans, assuming all extension options are exercised by the borrower. | |
| (2) |
As of June 30, 2018, the total does not include $153.1 million of loan participations sold, $489.3 million of non-consolidated senior interests, and $1.3 billion of securitized debt obligations, as the satisfaction of these liabilities will not require cash outlays from us. |
Litigation
From time to time, we may be involved in various claims and legal actions arising in the ordinary course of business. As of June 30, 2018, we were not involved in any material legal proceedings.
Board of Directors’ Compensation
As of June 30, 2018, of the eight members of our board of directors, our five independent directors are entitled to annual compensation of $175,000 each, $75,000 of which will be paid in the form of cash and $100,000 in the form of deferred stock units. The other three board members, including our chairman and our chief executive officer, serve as directors with no compensation. In addition, (i) the chair of our audit committee receives additional annual cash compensation of $20,000, (ii) the other members of our audit committee receive additional annual cash compensation of $10,000, and (iii) the chairs of each of our compensation and corporate governance committees receive additional annual cash compensation of $10,000.
38
Table of Contents
Blackstone Mortgage Trust, Inc.
Notes to Consolidated Financial Statements (continued)
(Unaudited)
18. SUBSEQUENT EVENTS
On July 6, 2018, we contributed a $517.5 million loan to a $1.0 billion single asset securitization vehicle, and invested in the related $99.0 million subordinate risk retention position.
39
Table of Contents
| ITEM 2. | MANAGEMENT’S DISCUSSION AND ANALYSIS OF FINANCIAL CONDITION AND RESULTS OF OPERATIONS |
References herein to “Blackstone Mortgage Trust,” “Company,” “we,” “us,” or “our” refer to Blackstone Mortgage Trust, Inc. and its subsidiaries unless the context specifically requires otherwise.
The following discussion should be read in conjunction with the unaudited consolidated financial statements and notes thereto appearing elsewhere in this quarterly report on Form 10-Q. In addition to historical data, this discussion contains forward-looking statements within the meaning of Section 27A of the Securities Act of 1933, as amended, and Section 21E of the Securities Exchange Act of 1934, as amended, which reflect our current views with respect to, among other things, our business, operations and financial performance. You can identify these forward-looking statements by the use of words such as “intend,” “goal,” “estimate,” “expect,” “project,” “projections,” “plans,” “seeks,” “anticipates,” “should,” “could,” “may,” “designed to,” “foreseeable future,” “believe,” “scheduled,” and similar expressions. Such forward-looking statements are subject to various risks, uncertainties and assumptions. Our actual results or outcomes may differ materially from those in this discussion as a result of various factors, including but not limited to those discussed in Item 1A. Risk Factors in our annual report on Form 10-K for the year ended December 31, 2017 and elsewhere in this quarterly report on Form 10-Q.
Introduction
Blackstone Mortgage Trust is a real estate finance company that originates senior loans collateralized by commercial real estate in North America and Europe. Our investment objective is to preserve and protect shareholder capital while producing attractive risk-adjusted returns primarily through dividends generated from current income from our loan portfolio. We are externally managed by BXMT Advisors L.L.C., or our Manager, a subsidiary of The Blackstone Group L.P., or Blackstone, and are a real estate investment trust, or REIT, traded on the New York Stock Exchange, or NYSE, under the symbol “BXMT.” We are headquartered in New York City.
We conduct our operations as a REIT for U.S. federal income tax purposes. We generally will not be subject to U.S. federal income taxes on our taxable income to the extent that we annually distribute all of our net taxable income to stockholders and maintain our qualification as a REIT. We also operate our business in a manner that permits us to maintain an exclusion from registration under the Investment Company Act of 1940, as amended. We are organized as a holding company and conduct our business primarily through our various subsidiaries.
I. Key Financial Measures and Indicators
As a real estate finance company, we believe the key financial measures and indicators for our business are earnings per share, dividends declared, Core Earnings, and book value per share. For the three months ended June 30, 2018 we recorded earnings per share of $0.66, declared a dividend of $0.62 per share, and reported $0.83 per share of Core Earnings. In addition, our book value per share as of June 30, 2018 was $27.08. As further described below, Core Earnings is a measure that is not prepared in accordance with accounting principles generally accepted in the United States of America, or GAAP. We use Core Earnings to evaluate our performance excluding the effects of certain transactions and GAAP adjustments that we believe are not necessarily indicative of our current loan activity and operations.
Earnings Per Share and Dividends Declared
The following table sets forth the calculation of basic and diluted net income per share and dividends declared per share ($ in thousands, except per share data):
| Three Months Ended | ||||||||
| June 30, 2018 | March 31, 2018 | |||||||
| Net income (1) |
$ | 72,312 | $ | 60,958 | ||||
| Weighted-average shares outstanding, basic and diluted |
109,069,078 | 108,397,598 | ||||||
|
|
|
|
|
|||||
| Net income per share, basic and diluted |
$ | 0.66 | $ | 0.56 | ||||
|
|
|
|
|
|||||
| Dividends declared per share |
$ | 0.62 | $ | 0.62 | ||||
|
|
|
|
|
|||||
|
|
||||||||
| (1) | Represents net income attributable to Blackstone Mortgage Trust, Inc. |
40
Table of Contents
Core Earnings
Core Earnings is a non-GAAP measure, which we define as GAAP net income (loss), including realized gains and losses not otherwise included in GAAP net income (loss), and excluding (i) net income (loss) attributable to our CT Legacy Portfolio, (ii) non-cash equity compensation expense, (iii) depreciation and amortization, (iv) unrealized gains (losses), and (v) certain non-cash items. Core Earnings may also be adjusted from time to time to exclude one-time events pursuant to changes in GAAP and certain other non-cash charges as determined by our Manager, subject to approval by a majority of our independent directors.
We believe that Core Earnings provides meaningful information to consider in addition to our net income and cash flow from operating activities determined in accordance with GAAP. This adjusted measure helps us to evaluate our performance excluding the effects of certain transactions and GAAP adjustments that we believe are not necessarily indicative of our current loan portfolio and operations. Although, according to the management agreement between our Manager and us, or our Management Agreement, we calculate the incentive and base management fees due to our Manager using Core Earnings before incentive fees expense, we report Core Earnings after incentive fee expense, as we believe this is a more meaningful presentation of the economic performance of our class A common stock.
Core Earnings does not represent net income or cash generated from operating activities and should not be considered as an alternative to GAAP net income, or an indication of our GAAP cash flows from operations, a measure of our liquidity, or an indication of funds available for our cash needs. In addition, our methodology for calculating Core Earnings may differ from the methodologies employed by other companies to calculate the same or similar supplemental performance measures, and accordingly, our reported Core Earnings may not be comparable to the Core Earnings reported by other companies.
The following table provides a reconciliation of Core Earnings to GAAP net income ($ in thousands, except per share data):
| Three Months Ended | ||||||||
| June 30, 2018 | March 31, 2018 | |||||||
| Net income(1) |
$ | 72,312 | $ | 60,958 | ||||
| GE purchase discount accretion adjustment(2) |
8,723 | (17 | ) | |||||
| Non-cash compensation expense |
6,778 | 6,976 | ||||||
| Realized foreign currency gain, net(3) |
1,998 | 854 | ||||||
| Other items |
565 | 534 | ||||||
|
|
|
|
|
|||||
| Core Earnings |
$ | 90,376 | $ | 69,305 | ||||
|
|
|
|
|
|||||
| Weighted-average shares outstanding, basic and diluted |
109,069,078 | 108,397,598 | ||||||
|
|
|
|
|
|||||
| Core Earnings per share, basic and diluted |
$ | 0.83 | $ | 0.64 | ||||
|
|
|
|
|
|||||
|
|
||||||||
| (1) | Represents net income attributable to Blackstone Mortgage Trust. |
| (2) | Historically, we have deferred in Core Earnings the accretion of purchase discount attributable to a certain pool of GE portfolio loans acquired in May 2015, until repayment in full of the remaining loans in the pool was substantially assured. During the three months ended June 30, 2018, it was determined that repayment of the remaining loans in the deferral pool was substantially assured. As such, the $8.7 million of deferred purchase discount, which has been previously recognized in GAAP net income, was realized in Core Earnings during the three months ended June 30, 2018. |
| (3) | Primarily represents the forward points earned on our foreign currency forward contracts, which reflect the interest rate differentials between the applicable base rate for our foreign currency investments and USD LIBOR. These forward contracts effectively convert the rate exposure to USD LIBOR, resulting in additional interest income earned in U.S. dollar terms. These amounts are not included in GAAP net income, but rather as a component of Other Comprehensive Income in our consolidated financial statements. |
41
Table of Contents
Book Value Per Share
The following table calculates our book value per share ($ in thousands, except per share data):
| June 30, 2018 | March 31, 2018 | |||||||
| Stockholders’ equity |
$ | 3,023,480 | $ | 2,921,213 | ||||
| Shares |
||||||||
| Class A common stock |
111,441,888 | 108,194,090 | ||||||
| Deferred stock units |
213,136 | 205,088 | ||||||
|
|
|
|
|
|||||
| Total outstanding |
111,655,024 | 108,399,178 | ||||||
|
|
|
|
|
|||||
| Book value per share |
$ | 27.08 | $ | 26.95 | ||||
|
|
|
|
|
|||||
II. Loan Portfolio
During the quarter ended June 30, 2018, we originated $3.9 billion of loans. Loan fundings during the quarter totaled $2.2 billion and repayments totaled $1.4 billion. We generated interest income of $191.5 million and incurred interest expense of $87.7 million during the quarter, which resulted in $103.7 million of net interest income during the three months ended June 30, 2018.
Portfolio Overview
The following table details our loan origination activity ($ in thousands):
| Three Months Ended | Six Months Ended | |||||||
| June 30, 2018 | June 30, 2018 | |||||||
| Loan originations(1) |
$ | 3,916,759 | $ | 5,803,499 | ||||
| Loan fundings(2) |
$ | 2,223,416 | $ | 4,210,139 | ||||
| Loan repayments(3) |
(1,444,778 | ) | (2,410,158 | ) | ||||
|
|
|
|
|
|||||
| Total net fundings |
$ | 778,638 | $ | 1,799,981 | ||||
|
|
|
|
|
|||||
|
|
||||||||
| (1) | Includes new loan originations and additional commitments made under existing loans. |
| (2) | Loan fundings during the three and six months ended June 30, 2018 include $1.6 million and $10.1 million, respectively, of additional fundings under related non-consolidated senior interests. |
| (3) | Loan repayments during the three and six months ended June 30, 2018 include $483.7 million and $496.9 million, respectively, of additional repayments or reduction of loan exposure under related non-consolidated senior interests. |
42
Table of Contents
The following table details overall statistics for our loan portfolio as of June 30, 2018 ($ in thousands):
| Total Loan Exposure(1) | ||||||||||||||||
| Balance Sheet Portfolio |
Total Loan Portfolio |
Floating Rate Loans |
Fixed Rate Loans |
|||||||||||||
| Number of loans |
107 | 107 | 101 | 6 | ||||||||||||
| Principal balance |
$ | 12,303,596 | $ | 12,792,919 | $ | 12,138,300 | $ | 654,619 | ||||||||
| Net book value |
$ | 12,214,565 | $ | 12,701,579 | $ | 12,047,342 | $ | 654,237 | ||||||||
| Unfunded loan commitments(2) |
$ | 2,990,380 | $ | 3,061,030 | $ | 3,061,030 | $ | — | ||||||||
| Weighted-average cash coupon(3) |
5.52 | % | 5.43 | % | L + 3.66 | % | 4.63 | % | ||||||||
| Weighted-average all-in yield(3) |
5.85 | % | 5.81 | % | L + 3.99 | % | 5.71 | % | ||||||||
| Weighted-average maximum maturity (years)(4) |
4.1 | 4.1 | 4.1 | 3.6 | ||||||||||||
| Loan to value (LTV)(5) |
62.5 | % | 62.8 | % | 62.4 | % | 70.2 | % | ||||||||
|
|
||||||||||||||||
| (1) |
In certain instances, we finance our loans through the non-recourse sale of a senior loan interest that is not included in our consolidated financial statements. Total loan exposure encompasses the entire loan we originated and financed, including $489.3 million of such non-consolidated senior interests that are not included in our balance sheet portfolio. | |
| (2) |
Unfunded commitments will primarily be funded to finance our borrowers’ construction or development of real estate-related assets, capital improvements of existing assets, or lease-related expenditures. These commitments will generally be funded over the term of each loan, subject in certain cases to an expiration date. | |
| (3) |
As of June 30, 2018, our floating rate loans were indexed to various benchmark rates, with 84% of floating rate loans by total loan exposure indexed to USD LIBOR based on total loan exposure. In addition to cash coupon, all-in yield includes the amortization of deferred origination and extension fees, loan origination costs, and purchase discounts, as well as the accrual of exit fees. Cash coupon and all-in yield for the total loan portfolio assume applicable floating benchmark rates as of June 30, 2018 for weighted-average calculation. | |
| (4) |
Maximum maturity assumes all extension options are exercised by the borrower, however our loans may be repaid prior to such date. As of June 30, 2018, based on total loan exposure, 78% of our loans were subject to yield maintenance or other prepayment restrictions and 22% were open to repayment by the borrower without penalty. | |
| (5) |
Based on LTV as of the dates loans were originated or acquired by us. |
The charts below detail the geographic distribution and types of properties securing these loans, as of June 30, 2018:
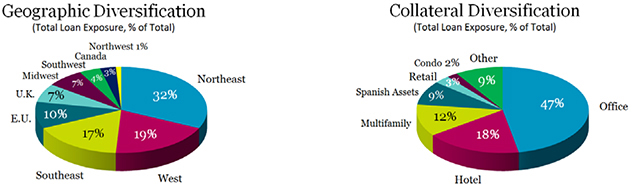
Refer to section VI of this Item 2 for details of our loan portfolio, on a loan-by-loan basis.
Asset Management
We actively manage the investments in our loan portfolio and exercise the rights afforded to us as a lender, including collateral level budget approvals, lease approvals, loan covenant enforcement, escrow/reserve management, collateral release approvals and other rights that we may negotiate.
43
Table of Contents
As discussed in Note 2 to our consolidated financial statements, our Manager performs a quarterly review of our loan portfolio, assesses the performance of each loan, and assigns it a risk rating between “1” and “5,” from less risk to greater risk. The following table allocates the principal balance and total loan exposure balances based on our internal risk ratings ($ in thousands):
| June 30, 2018 | ||||||||||
| Risk Rating |
Number of Loans |
Net Book Value |
Total Loan Exposure(1) |
|||||||
| 1 | 1 | $ | 52,476 | $ | 52,500 | |||||
| 2 | 36 | 3,807,971 | 3,826,692 | |||||||
| 3 | 70 | 8,354,118 | 8,913,727 | |||||||
| 4 | — | — | — | |||||||
| 5 | — | — | — | |||||||
|
|
|
|
|
|
||||||
| 107 | $ | 12,214,565 | $ | 12,792,919 | ||||||
|
|
|
|
|
|
||||||
|
| ||||||
| (1) | In certain instances, we finance our loans through the non-recourse sale of a senior loan interest that is not included in our consolidated financial statements. See Note 2 to our consolidated financial statements for further discussion. Total loan exposure encompasses the entire loan we originated and financed, including $489.3 million of such non-consolidated senior interests as of June 30, 2018. |
The weighted-average risk rating of our total loan exposure was 2.7 as of both June 30, 2018 and December 31, 2017.
Multifamily Joint Venture
As of June 30, 2018, our Walker & Dunlop Multifamily Joint Venture held $119.1 million of loans, which are included in the loan disclosures above. Refer to Note 2 to our consolidated financial statements for additional discussion of our Multifamily Joint Venture.
Portfolio Financing
Our portfolio financing arrangements include credit facilities, the GE portfolio acquisition facility, asset-specific financings, a revolving credit agreement, loan participations sold, non-consolidated senior interests, and securitized debt obligations.
The following table details our portfolio financing ($ in thousands):
| Portfolio Financing | ||||||||
| Outstanding Principal Balance | ||||||||
| June 30, 2018 | December 31, 2017 | |||||||
| Credit facilities |
$ | 4,649,246 | $ | 4,068,249 | ||||
| Asset-specific financings |
1,885,863 | 518,864 | ||||||
| GE portfolio acquisition facility |
509,441 | 703,423 | ||||||
| Revolving credit agreement |
— | — | ||||||
| Loan participations sold |
153,090 | 80,706 | ||||||
| Non-consolidated senior interests |
489,324 | 985,382 | ||||||
| Securitized debt obligations |
1,292,120 | 1,292,120 | ||||||
|
|
|
|
|
|||||
| Total portfolio financing |
$ | 8,979,084 | $ | 7,648,744 | ||||
|
|
|
|
|
|||||
44
Table of Contents
Credit Facilities
The following table details our credit facilities ($ in thousands):
| June 30, 2018 | ||||||||||||||||||||
| Maximum | Credit Borrowings | Collateral | ||||||||||||||||||
| Lender |
Facility Size(1) | Potential(2) | Outstanding | Available(2) | Assets(3) | |||||||||||||||
| Bank of America |
$ | 1,000,000 | $ | 863,592 | $ | 863,592 | $ | — | $ | 1,083,385 | ||||||||||
| Wells Fargo |
2,000,000 | 1,348,240 | 852,431 | 495,809 | 1,822,275 | |||||||||||||||
| MetLife |
1,000,000 | 793,130 | 793,130 | — | 1,041,540 | |||||||||||||||
| Barclays |
1,000,000 | 496,480 | 496,480 | — | 620,600 | |||||||||||||||
| Citibank |
750,000 | 572,341 | 459,827 | 112,514 | 719,177 | |||||||||||||||
| JP Morgan |
500,000 | 359,114 | 296,058 | 63,056 | 474,407 | |||||||||||||||
| Morgan Stanley(4) |
660,350 | 344,960 | 280,847 | 64,114 | 460,991 | |||||||||||||||
| Deutsche Bank |
500,000 | 277,247 | 277,247 | — | 373,042 | |||||||||||||||
| Société Générale(5) |
467,360 | 235,229 | 235,229 | — | 294,654 | |||||||||||||||
| Goldman Sachs - Multi. JV(6) |
250,000 | 55,085 | 55,085 | — | 69,974 | |||||||||||||||
| Bank of America - Multi. JV(6) |
200,000 | 39,320 | 39,320 | — | 49,150 | |||||||||||||||
|
|
|
|
|
|
|
|
|
|
|
|||||||||||
| $ | 8,327,710 | $ | 5,384,738 | $ | 4,649,246 | $ | 735,493 | $ | 7,009,195 | |||||||||||
|
|
|
|
|
|
|
|
|
|
|
|||||||||||
|
|
||||||||||||||||||||
| (1) |
Maximum facility size represents the largest amount of borrowings available under a given facility once sufficient collateral assets have been approved by the lender and pledged by us. | |
| (2) |
Potential borrowings represents the total amount we could draw under each facility based on collateral already approved and pledged. When undrawn, these amounts are immediately available to us at our sole discretion under the terms of each credit facility. | |
| (3) |
Represents the principal balance of the collateral assets. | |
| (4) |
As of June 30, 2018, the Morgan Stanley maximum facility size was £500.0 million, which translated to $660.4 million as of such date. | |
| (5) |
As of June 30, 2018, the Société Générale maximum facility size was €400.0 million, which translated to $467.4 million as of such date. | |
| (6) |
These facilities finance the loan investments of our consolidated Multifamily Joint Venture. Refer to Note 2 to our consolidated financial statements for additional discussion of our Multifamily Joint Venture. |
The weighted-average outstanding balance of our credit facilities was $4.3 billion for the six months ended June 30, 2018. As of June 30, 2018, we had aggregate borrowings of $4.6 billion outstanding under our credit facilities, with a weighted-average cash coupon of LIBOR plus 1.79% per annum, a weighted-average all-in cost of credit, including associated fees and expenses, of LIBOR plus 1.98% per annum, and a weighted-average advance rate of 79.1%. As of June 30, 2018, outstanding borrowings under these facilities had a weighted-average maturity, excluding extension options and term-out provisions, of 1.6 years.
Borrowings under each facility are subject to the initial approval of eligible collateral loans by the lender and the maximum advance rate and pricing rate of individual advances are determined with reference to the attributes of the respective collateral loan.
45
Table of Contents
Asset-Specific Financings
The following tables detail our asset-specific financings ($ in thousands):
| June 30, 2018 | ||||||||||||||||||||||
| Asset-Specific Financings |
Count | Principal Balance |
Book Value | Wtd. Avg. Yield/Cost(1) |
Guarantee(2) | Wtd. Avg. Term(3) |
||||||||||||||||
| Collateral assets |
6 | $ | 2,384,093 | $ | 2,367,275 | L+3.44 | % | n/a | Nov. 2021 | |||||||||||||
| Financing provided(4) |
6 | $ | 1,885,863 | $ | 1,878,776 | L+1.73 | % | $ | 1,392,274 | Nov. 2021 | ||||||||||||
|
| ||||||||||
| (1) |
These floating rate loans and related liabilities are indexed to the various benchmark rates relevant in each arrangement in terms of currency and payment frequency. Therefore the net exposure to each benchmark rate is in direct proportion to our net assets indexed to that rate. In addition to cash coupon, yield/cost includes the amortization of deferred origination fees / financing costs. | |
| (2) |
Other than amounts guaranteed on an asset-by-asset basis, borrowings under our asset-specific financings are non-recourse to us. | |
| (3) |
The weighted-average term is determined based on the maximum maturity of the corresponding loans, assuming all extension options are exercised by the borrower. Each of our asset-specific financings are term-matched to the corresponding collateral loans. | |
| (4) |
Borrowings of $931.8 million under these asset specific financings are cross collateralized with related credit facilities with the same lenders. |
GE Portfolio Acquisition Facility
During the second quarter of 2015, concurrently with our acquisition of the GE portfolio, we entered into an agreement with Wells Fargo to provide us with secured financing for the acquired portfolio. The GE portfolio acquisition facility is non-revolving and consists of a single master repurchase agreement providing for asset-specific borrowings for each collateral asset. The following table details our asset-specific borrowings related to the GE portfolio acquisition ($ in thousands):
| June 30, 2018 | ||||||||||||||||||||||
| Principal | Book | Wtd. Avg. | Wtd. Avg. | |||||||||||||||||||
| GE Portfolio Acquisition Facility |
Count | Balance(1) | Value | Yield/Cost(2) | Guarantee(3) | Term(4) | ||||||||||||||||
| Collateral assets |
11 | $ | 645,107 | $ | 646,554 | 5.99 | % | n/a | May 2021 | |||||||||||||
| Financing provided |
11 | $ | 509,441 | $ | 508,615 | L+1.78 | % | $ | 250,000 | May 2021 | ||||||||||||
|
| ||||||||||
| (1) |
As of June 30, 2018, this facility provided for $606.0 million of financing, of which $509.4 million was outstanding and an additional $96.6 million was available to finance future loan fundings in the GE portfolio. | |
| (2) |
Includes fixed and floating rate loans and related liabilities which are indexed to the various benchmark rates relevant in each arrangement in terms of currency and payment frequency. Therefore, the net exposure to each benchmark rate is in direct proportion to our net assets indexed to that rate. In addition to cash coupon, yield/cost includes the amortization of deferred origination fees / financing costs. | |
| (3) |
We guarantee obligations under the GE portfolio acquisition facility in an amount equal to the greater of (i) 25% of outstanding asset-specific borrowings, and (ii) $250.0 million. | |
| (4) |
The weighted-average term is determined based on the maximum maturity of the corresponding loans, assuming all extension options are exercised by the borrower. Each of our asset-specific financings are term-matched to the corresponding collateral loans. |
Refer to Note 5 to our consolidated financial statements for additional terms and details of our secured debt agreements, including certain financial covenants.
Revolving Credit Agreement
We have entered into a $250.0 million full recourse secured revolving credit agreement with Barclays that is designed to finance first mortgage originations for up to six months as a bridge to term financing or syndication. Advances under the agreement are subject to availability under a specified borrowing base and accrue interest at a per annum pricing rate equal to the sum of (i) an applicable base rate or Eurodollar rate and (ii) an applicable margin, in each case, dependent on the applicable type of loan collateral. The maturity date of the facility is April 4, 2020.
During the six months ended June 30, 2018, the weighted-average outstanding borrowings under the revolving credit agreement were $57.0 million and we recorded interest expense of $885,000, including $511,000 of amortization of deferred fees and expenses. As of June 30, 2018 we had no outstanding borrowings under the agreement.
46
Table of Contents
Loan Participations Sold
The following table details our loan participations sold ($ in thousands):
| June 30, 2018 | ||||||||||||||||||||||
| Principal | Book | |||||||||||||||||||||
| Loan Participations Sold |
Count | Balance | Value | Yield/Cost(1) | Guarantee(2) | Term | ||||||||||||||||
| Total loan |
1 | $ | 200,409 | $ | 198,197 | L+5.99 | % | n/a | Feb. 2022 | |||||||||||||
| Senior participation(3)(4) |
1 | 153,090 | 152,855 | L+4.07 | % | n/a | Feb. 2022 | |||||||||||||||
|
| ||||||||||
| (1) |
Our floating rate loans and related liabilities are indexed to the various benchmark rates relevant in each arrangement in terms of currency and payment frequency. Therefore the net exposure to each benchmark rate is in direct proportion to our net assets indexed to that rate. In addition to cash coupon, yield/cost includes the amortization of deferred fees / financing costs. | |
| (2) |
As of June 30, 2018, our loan participations sold was non-recourse to us. | |
| (3) |
During the three and six months ended June 30, 2018, we recorded $2.0 million and $3.5 million, respectively, of interest expense related to our loan participations sold. | |
| (4) |
The difference between principal balance and book value of loan participations sold is due to deferred financing costs of $235,000 as of June 30, 2018. |
Refer to Note 6 to our consolidated financial statements for additional details of our loan participations sold.
Non-Consolidated Senior Interests
In certain instances, we finance our loans through the non-recourse sale of a senior loan interest that is not included in our consolidated financial statements. These non-consolidated senior interests provide structural leverage for our net investments which are reflected in the form of mezzanine loans or other subordinate interests on our balance sheet and in our results of operations. The following table details the subordinate interests retained on our balance sheet and the related non-consolidated senior interests as of June 30, 2018 ($ in thousands):
| June 30, 2018 | ||||||||||||||||||||||
| Principal | Book | Wtd. Avg. | Wtd. Avg. | |||||||||||||||||||
| Non-Consolidated Senior Interests |
Count | Balance | Value | Yield/Cost(1) | Guarantee | Term | ||||||||||||||||
| Total loan |
3 | $ | 600,904 | n/a | 6.13 | % | n/a | Oct. 2022 | ||||||||||||||
| Senior participation |
3 | 489,324 | n/a | 4.66 | % | n/a | Oct. 2022 | |||||||||||||||
|
| ||||||||||
| (1) |
Our floating rate loans and related liabilities were indexed to the various benchmark rates relevant in each arrangement in terms of currency and payment frequency. Therefore the net exposure to each benchmark rate is in direct proportion to our net assets indexed to that rate. In addition to cash coupon, all-in yield/cost includes the amortization of deferred fees / financing costs. |
47
Table of Contents
Securitized Debt Obligations
The following table details our securitized debt obligations ($ in thousands):
| June 30, 2018 | ||||||||||||||||||
| Principal | Book | Wtd. Avg. | ||||||||||||||||
| Securitized Debt Obligations |
Count | Balance | Value | Yield/Cost(1) | Term(2) | |||||||||||||
| Collateralized Loan Obligation |
||||||||||||||||||
| Collateral assets |
29 | $ | 1,000,000 | $ | 1,000,000 | 5.63 | % | Jan. 2022 | ||||||||||
| Financing provided |
1 | 817,500 | 808,923 | L+1.74 | % | June 2035 | ||||||||||||
| Single Asset Securitization |
||||||||||||||||||
| Collateral assets(3) |
1 | 675,001 | 671,475 | L+3.60 | % | June 2023 | ||||||||||||
| Financing provided |
1 | 474,620 | 474,388 | L+1.65 | % | June 2033 | ||||||||||||
| Total |
||||||||||||||||||
| Collateral assets |
30 | $ | 1,675,001 | $ | 1,671,475 | 5.65 | % | |||||||||||
|
|
|
|
|
|
|
|
||||||||||||
| Financing provided(4) |
2 | $ | 1,292,120 | $ | 1,283,311 | L+1.71 | % | |||||||||||
|
|
|
|
|
|
|
|
||||||||||||
|
| ||||||||||
| (1) |
As of June 30, 2018, 98% of our loans financed by securitized debt obligations earned a floating rate of interest. In addition to cash coupon, all-in yield includes the amortization of deferred origination and extension fees, loan origination costs, purchase discounts, and accrual of exit fees. All-in yield for the total portfolio assume applicable floating benchmark rates for weighted-average calculation. | |
| (2) |
Loan term represents weighted-average final maturity, assuming all extension options are exercised by the borrower. Repayments of securitized debt obligations are tied to timing of the related collateral loan asset repayments. The term of these obligations represents the rated final distribution date of the securitizations. | |
| (3) |
The collateral assets for the Single Asset Securitization include the total loan amount, of which we securitized $500.0 million. | |
| (4) |
During the three and six months ended June 30, 2018, we recorded $12.0 million and $23.1 million, respectively, of interest expense related to our securitized debt obligations. |
Refer to Notes 7 and 15 to our consolidated financial statements for additional details of our securitized debt obligations.
Floating Rate Portfolio
Generally, our business model is such that rising interest rates will increase our net income, while declining interest rates will decrease net income. As of June 30, 2018, 95% of our loans by total loan exposure earned a floating rate of interest and were financed with liabilities that pay interest at floating rates, which resulted in an amount of net equity that is positively correlated to rising interest rates, subject to the impact of interest rate floors on certain of our floating rate loans. As of June 30, 2018, the remaining 5% of our loans by total loan exposure earned a fixed rate of interest, but are financed with liabilities that pay interest at floating rates, which resulted in a negative correlation to rising interest rates to the extent of our financing. In certain instances where we have financed fixed rate assets with floating rate liabilities, we have purchased interest rate swaps or caps to limit our exposure to increases in interest rates on such liabilities.
48
Table of Contents
Our liabilities are generally currency and index-matched to each collateral asset, resulting in a net exposure to movements in benchmark rates that varies by currency silo based on the relative proportion of floating rate assets and liabilities. The following table details our loan portfolio’s net exposure to interest rates by currency as of June 30, 2018 ($/£/€/C$ in thousands):
| USD | GBP | EUR | CAD | |||||||||||||
| Floating rate loans(1) |
$ | 10,249,471 | £ | 323,317 | € | 1,074,001 | C$ | 271,803 | ||||||||
| Floating rate debt(1)(2)(3) |
(7,062,997 | ) | (190,634 | ) | (849,600 | ) | (250,383 | ) | ||||||||
|
|
|
|
|
|
|
|
|
|||||||||
| Net floating rate exposure(4) |
$ | 3,186,474 | £ | 132,683 | € | 224,401 | C$ | 21,420 | ||||||||
|
|
|
|
|
|
|
|
|
|||||||||
|
|
||||||||||||||||
| (1) |
Our floating rate loans and related liabilities are indexed to the various benchmark rates relevant in each case in terms of currency and payment frequency. Therefore the net exposure to each benchmark rate is in direct proportion to our net assets indexed to that rate. | |
| (2) |
Includes borrowings under secured debt agreements, loan participations sold, non-consolidated senior interests, and securitized debt obligations. | |
| (3) |
Liabilities balance includes four interest rate swaps totaling C$107.9 million ($82.2 million as of June 30, 2018) that are used to hedge a portion of our fixed rate debt. | |
| (4) |
In addition, we have interest rate caps of $204.2 million and C$22.8 million to limit our exposure to increases in interest rates. |
Convertible Notes
As of June 30, 2018, the following convertible senior notes, or Convertible Notes, were outstanding ($ in thousands):
| Convertible Notes Issuance |
Face Value | Coupon Rate | All-in Cost(1) | Maturity | ||||||||||||
| November 2013 |
$ | 172,328 | 5.25 | % | 5.87 | % | December 1, 2018 | |||||||||
| May 2017 |
402,500 | 4.38 | % | 4.85 | % | May 5, 2022 | ||||||||||
| March 2018 |
220,000 | 4.75 | % | 5.33 | % | March 15, 2023 | ||||||||||
|
|
||||||||||||||||
| (1) |
Includes issuance costs that are amortized through interest expense over the life of the Convertible Notes using the effective interest method. |
Refer to Notes 2 and 8 to our consolidated financial statements for additional discussion of our Convertible Notes.
49
Table of Contents
III. Our Results of Operations
Operating Results
The following table sets forth information regarding our consolidated results of operations ($ in thousands, except per share data):
| Three Months Ended | 2018 vs | Six Months Ended | 2018 vs | |||||||||||||||||||||
| June 30, | 2017 | June 30, | 2017 | |||||||||||||||||||||
| 2018 | 2017 | $ | 2018 | 2017 | $ | |||||||||||||||||||
| Income from loans and other investments |
||||||||||||||||||||||||
| Interest and related income |
$ | 191,479 | $ | 126,825 | $ | 64,654 | $ | 346,904 | $ | 245,341 | $ | 101,563 | ||||||||||||
| Less: Interest and related expenses |
87,733 | 54,352 | 33,381 | 157,722 | 101,026 | 56,696 | ||||||||||||||||||
|
|
|
|
|
|
|
|
|
|
|
|
|
|||||||||||||
| Income from loans and other investments, net |
103,746 | 72,473 | 31,273 | 189,182 | 144,315 | 44,867 | ||||||||||||||||||
| Other expenses |
||||||||||||||||||||||||
| Management and incentive fees |
22,388 | 14,393 | 7,995 | 37,880 | 27,314 | 10,566 | ||||||||||||||||||
| General and administrative expenses |
8,747 | 7,373 | 1,374 | 17,454 | 14,800 | 2,654 | ||||||||||||||||||
|
|
|
|
|
|
|
|
|
|
|
|
|
|||||||||||||
| Total other expenses |
31,135 | 21,766 | 9,369 | 55,334 | 42,114 | 13,220 | ||||||||||||||||||
|
|
|
|
|
|
|
|
|
|
|
|
|
|||||||||||||
| Income before income taxes |
72,611 | 50,707 | 21,904 | 133,848 | 102,201 | 31,647 | ||||||||||||||||||
| Income tax provision |
104 | 94 | 10 | 224 | 183 | 41 | ||||||||||||||||||
|
|
|
|
|
|
|
|
|
|
|
|
|
|||||||||||||
| Net income |
72,507 | 50,613 | 21,894 | 133,624 | 102,018 | 31,606 | ||||||||||||||||||
|
|
|
|
|
|
|
|
|
|
|
|
|
|||||||||||||
| Net income attributable to non-controlling interests |
(195 | ) | — | (195 | ) | (353 | ) | — | (353 | ) | ||||||||||||||
|
|
|
|
|
|
|
|
|
|
|
|
|
|||||||||||||
| Net income attributable to Blackstone |
||||||||||||||||||||||||
| Mortgage Trust, Inc. |
$ | 72,312 | $ | 50,613 | $ | 21,699 | $ | 133,271 | $ | 102,018 | $ | 31,253 | ||||||||||||
|
|
|
|
|
|
|
|
|
|
|
|
|
|||||||||||||
| Net income per share - basic and diluted |
$ | 0.66 | $ | 0.53 | $ | 0.13 | $ | 1.23 | $ | 1.07 | $ | 0.16 | ||||||||||||
| Dividends declared per share |
$ | 0.62 | $ | 0.62 | $ | — | $ | 1.24 | $ | 1.24 | $ | — | ||||||||||||
Income from loans and other investments, net
Income from loans and other investments, net increased $31.3 million and $44.9 million during the three and six months ended June 30, 2018, respectively, as compared to the corresponding period in 2017. The increases in both periods were primarily due to an increase in non-recurring prepayment fee income. Additionally, the weighted-average principal balance of our loan portfolio increased by $2.9 billion and $2.3 billion during the three and six months ended June 30, 2018, respectively, as compared to the corresponding periods in 2017. This was offset by the increase in the weighted-average principal balance of our outstanding financing arrangements, which increased by $2.5 billion and $1.9 billion during the three and six months ended June 30, 2018, respectively, as compared to the corresponding periods in 2017.
Other expenses
Other expenses are composed of management and incentive fees payable to our Manager and general and administrative expenses. Other expenses increased by $9.4 million during the three months ended June 30, 2018 compared to the corresponding period in 2017 due to (i) an increase of $6.4 million of incentive fees payable to our Manager as a result of an increase in Core Earnings, (ii) an increase of $1.6 million of management fees payable to our Manager, primarily as a result of net proceeds received from the sale of our class A common stock in the fourth quarter of 2017 and the second quarter of 2018, (iii) $788,000 of additional non-cash restricted stock amortization related to shares awarded under our long-term incentive plans, and (iv) an increase of $586,000 of general operating expenses.
Other expenses increased by $13.2 million during the six months ended June 30, 2018 compared to the six months ended June 30, 2017 due to (i) an increase of $7.5 million of incentive fees payable to our Manager as a result of an increase in Core Earnings, (ii) an increase of $3.1 million of management fees payable to our Manager, primarily as a result of net proceeds received from the sale of our class A common stock in the fourth quarter of 2017 and the second quarter of 2018, (iii) $1.8 million of additional non-cash restricted stock amortization related to shares awarded under our long-term incentive plans, and (iv) an increase of $828,000 of general operating expenses.
50
Table of Contents
Net income attributable to non-controlling interests
During the three and six months ended June 30, 2018, we recognized $195,000 and $353,000, respectively, of net income attributable to non-controlling interests related to our Multifamily Joint Venture.
Dividends per share
During the three months ended June 30, 2018, we declared a dividend of $0.62 per share, or $69.1 million, which was paid on July 16, 2018 to common stockholders of record as of June 29, 2018. During the three months ended June 30, 2017, we declared a dividend of $0.62 per share, or $58.8 million.
During the six months ended June 30, 2018, we declared aggregate dividends of $1.24 per share, or $136.2 million. During the six months ended June 30, 2017, we declared aggregate dividends of $1.24 per share, or $117.6 million.
IV. Liquidity and Capital Resources
Capitalization
We have capitalized our business to date through, among other things, the issuance and sale of shares of our class A common stock, borrowings under secured debt agreements, and the issuance and sale of Convertible Notes. As of June 30, 2018, we had 111,441,888 shares of our class A common stock outstanding representing $3.0 billion of stockholders’ equity, $7.0 billion of outstanding borrowings under secured debt agreements, and $794.8 million of Convertible Notes outstanding.
As of June 30, 2018, our secured debt agreements consisted of credit facilities with an outstanding balance of $4.6 billion, $1.9 billion of asset-specific financings, and the GE portfolio acquisition facility with an outstanding balance of $509.4 million. We also finance our business through the sale of loan participations and non-consolidated senior interests. As of June 30, 2018, we had $153.1 million of loan participations sold and $489.3 million of non-consolidated senior interests outstanding. In addition, as of June 30, 2018, our consolidated balance sheet included $1.3 billion of securitized debt obligations related to our CLO and our Single Asset Securitization.
See Notes 5, 6, 7, and 8 to our consolidated financial statements for additional details regarding our secured debt agreements, loan participations sold, securitized debt obligations, and Convertible Notes, respectively.
Debt-to-Equity Ratio and Total Leverage Ratio
The following table presents our debt-to-equity ratio and total leverage ratio:
| June 30, 2018 | December 31, 2017 | |||
| Debt-to-equity ratio(1) |
2.6x | 2.0x | ||
| Total leverage ratio(2) |
3.2x | 2.8x | ||
|
| ||||
| (1) |
Represents (i) total outstanding secured debt agreements and convertible notes, less cash, to (ii) total equity, in each case at period end. | |
| (2) |
Represents (i) total outstanding secured debt agreements, convertible notes, loan participations sold, non-consolidated senior interests, and securitized debt obligations, less cash, to (ii) total equity, in each case at period end. |
Sources of Liquidity
Our primary sources of liquidity include cash and cash equivalents, available borrowings under our credit facilities and revolving credit agreement, and net receivables from servicers related to loan repayments which are set forth in the following table ($ in thousands):
| June 30, 2018 | December 31, 2017 | |||||||
| Cash and cash equivalents |
$ | 107,057 | $ | 69,654 | ||||
| Available borrowings under secured debt agreements |
735,493 | 595,848 | ||||||
| Loan principal payments held by servicer, net(1) |
1,330 | 15,763 | ||||||
|
|
|
|
|
|||||
| $ | 843,880 | $ | 681,265 | |||||
|
|
|
|
|
|||||
|
|
||||||||
| (1) |
Represents loan principal payments held by our third-party servicer as of the balance sheet date which were remitted to us during the subsequent remittance cycle, net of the related secured debt balance. |
51
Table of Contents
In addition to our current sources of liquidity, we have access to liquidity through public offerings of debt and equity securities. To facilitate such offerings, in July 2016, we filed a shelf registration statement with the Securities and Exchange Commission, or the SEC, that is effective for a term of three years and expires in July 2019. The amount of securities to be issued pursuant to this shelf registration statement was not specified when it was filed and there is no specific dollar limit on the amount of securities we may issue. The securities covered by this registration statement include: (i) class A common stock; (ii) preferred stock; (iii) debt securities; (iv) depositary shares representing preferred stock; (v) warrants; (vi) subscription rights; (vii) purchase contracts; and (viii) units consisting of one or more of such securities or any combination of these securities. The specifics of any future offerings, along with the use of proceeds of any securities offered, will be described in detail in a prospectus supplement, or other offering materials, at the time of any offering.
We may also access liquidity through a dividend reinvestment plan and direct stock purchase plan, under which 9,996,050 shares of class A common stock were available for issuance as of June 30, 2018, and our at-the-market stock offering program, pursuant to which we may sell, from time to time, up to $84.1 million of additional shares of our class A common stock as of June 30, 2018. Refer to Note 10 to our consolidated financial statements for additional details.
Our existing loan portfolio also provides us with liquidity as loans are repaid or sold, in whole or in part, and the proceeds from such repayments become available for us to reinvest.
Liquidity Needs
In addition to our ongoing loan origination activity, our primary liquidity needs include interest and principal payments under our $7.0 billion of outstanding borrowings under secured debt agreements, our Convertible Notes, our unfunded loan commitments, dividend distributions to our stockholders, and operating expenses.
Contractual Obligations and Commitments
Our contractual obligations and commitments as of June 30, 2018 were as follows ($ in thousands):
| Payment Timing | ||||||||||||||||||||
| Total | Less Than | 1 to 3 | 3 to 5 | More Than | ||||||||||||||||
| Obligation | 1 Year | Years | Years | 5 Years | ||||||||||||||||
| Unfunded loan commitments(1) |
$ | 2,990,380 | $ | 156,151 | $ | 1,114,433 | $ | 1,719,796 | $ | — | ||||||||||
| Principal repayments under secured debt agreements(2) |
7,044,550 | 651,163 | 2,217,243 | 4,092,944 | 83,200 | |||||||||||||||
| Principal repayments of convertible notes |
794,828 | 172,328 | — | 622,500 | — | |||||||||||||||
| Interest payments(2)(3) |
1,033,099 | 305,343 | 483,069 | 242,570 | 2,117 | |||||||||||||||
|
|
|
|
|
|
|
|
|
|
|
|||||||||||
| Total(4) |
$ | 11,862,857 | $ | 1,284,985 | $ | 3,814,745 | $ | 6,677,810 | $ | 85,317 | ||||||||||
|
|
|
|
|
|
|
|
|
|
|
|||||||||||
|
| ||
| (1) |
The allocation of our unfunded loan commitments is based on the earlier of the commitment expiration date or the loan maturity date. | |
| (2) |
The allocation of repayments under our secured debt agreements for both principal and interest payments is based on the earlier of (i) the maturity date of each facility, or (ii) the maximum maturity date of the collateral loans, assuming all extension options are exercised by the borrower. | |
| (3) |
Represents interest payments on our secured debt agreements and convertible notes. Future interest payment obligations are estimated assuming the amounts outstanding and the interest rates in effect as of June 30, 2018 will remain constant into the future. This is only an estimate as actual amounts borrowed and interest rates will vary over time. | |
| (4) |
Total does not include $153.1 million of loan participations sold, $489.3 million of non-consolidated senior interests, and $1.3 billion of securitized debt obligations, as the satisfaction of these liabilities will not require cash outlays from us. | |
We are also required to settle our foreign currency forward contracts and interest rate swaps with our derivative counterparties upon maturity which, depending on foreign exchange and interest rate movements, may result in cash received from or due to the respective counterparty. The table above does not include these amounts as they are not fixed and determinable. Refer to Note 9 to our consolidated financial statements for details regarding our derivative contracts.
We are required to pay our Manager a base management fee, an incentive fee, and reimbursements for certain expenses pursuant to our Management Agreement. The table above does not include the amounts payable to our Manager under our Management Agreement as they are not fixed and determinable. Refer to Note 11 to our consolidated financial statements for additional terms and details of the fees payable under our Management Agreement.
52
Table of Contents
As a REIT, we generally must distribute substantially all of our net taxable income to stockholders in the form of dividends to comply with the REIT provisions of the Internal Revenue Code of 1986, as amended, or the Internal Revenue Code. Our taxable income does not necessarily equal our net income as calculated in accordance with GAAP, or our Core Earnings as described above.
Cash Flows
The following table provides a breakdown of the net change in our cash, cash equivalents, and restricted cash ($ in thousands):
| Six Months Ended June 30, | ||||||||
| 2018 | 2017 | |||||||
| Cash flows provided by operating activities |
$ | 135,011 | $ | 110,813 | ||||
| Cash flows used in investing activities |
(2,154,258 | ) | (346,027 | ) | ||||
| Cash flows provided by financing activities |
2,016,646 | 224,167 | ||||||
|
|
|
|
|
|||||
| Net decrease in cash, cash equivalents, and restricted cash |
$ | (2,601 | ) | $ | (11,047 | ) | ||
|
|
|
|
|
|||||
We experienced a net decrease in cash, cash equivalents, and restricted cash of $2.6 million for the six months ended June 30, 2018, compared to a net decrease of $11.0 million for the six months ended June 30, 2017. During the six months ended June 30, 2018, we (i) received $2.0 billion of proceeds from loan principal collections, (ii) borrowed a net $1.8 billion under our secured debt agreements, (iii) received $214.8 million of net proceeds from the issuance of a convertible notes offering, and (iv) received $102.5 million in net proceeds from the issuance of class A common stock. We used the proceeds from our debt and equity financing activities to fund $4.2 billion of new loans during the six months ended June 30, 2018.
Refer to Note 3 to our consolidated financial statements for further discussion of our loan activity. Refer to Notes 5, 8, and 10 to our consolidated financial statements for additional discussion of our secured debt agreements, convertible notes, and equity.
V. Other Items
Income Taxes
We elected to be taxed as a REIT, effective January 1, 2003, under the Internal Revenue Code for U.S. federal income tax purposes. We generally must distribute annually at least 90% of our net taxable income, subject to certain adjustments and excluding any net capital gain, in order for U.S. federal income tax not to apply to our earnings that we distribute. To the extent that we satisfy this distribution requirement, but distribute less than 100% of our net taxable income, we will be subject to U.S. federal income tax on our undistributed taxable income. In addition, we will be subject to a 4% nondeductible excise tax if the actual amount that we pay out to our stockholders in a calendar year is less than a minimum amount specified under U.S. federal tax laws.
Our qualification as a REIT also depends on our ability to meet various other requirements imposed by the Internal Revenue Code, which relate to organizational structure, diversity of stock ownership, and certain restrictions with regard to the nature of our assets and the sources of our income. Even if we qualify as a REIT, we may be subject to certain U.S. federal income and excise taxes and state and local taxes on our income and assets. If we fail to maintain our qualification as a REIT for any taxable year, we may be subject to material penalties as well as federal, state and local income tax on our taxable income at regular corporate rates and we would not be able to qualify as a REIT for the subsequent four full taxable years. As of June 30, 2018 and December 31, 2017, we were in compliance with all REIT requirements.
Refer to Note 12 to our consolidated financial statements for additional discussion of our income taxes.
Off-Balance Sheet Arrangements
We have no off-balance sheet arrangements.
53
Table of Contents
Critical Accounting Policies
Our discussion and analysis of our financial condition and results of operations is based upon our consolidated financial statements, which have been prepared in accordance with GAAP. The preparation of these financial statements requires our Manager to make estimates and assumptions that affect the reported amounts of assets, liabilities, revenue and expenses, and related disclosure of contingent assets and liabilities. Actual results could differ from these estimates. There have been no material changes to our Critical Accounting Policies described in our annual report on Form 10-K filed with the SEC on February 13, 2018.
Refer to Note 2 to our consolidated financial statements for the description of our significant accounting policies.
54
Table of Contents
VI. Loan Portfolio Details
The following table provides details of our loan portfolio, on a loan-by-loan basis, as of June 30, 2018 ($ in millions):
| Loan Type(1) |
Origination Date(2) |
Total Loan(3) |
Principal Balance(3) |
Net Book Value |
Cash Coupon(4) |
All-in Yield(4) |
Maximum Maturity(5) |
Location |
Property Type |
Loan Per SQFT / Unit / Key |
LTV(2) | Risk Rating | ||||||||||||||||||||||||||
| 1 |
Senior loan | 3/22/2018 | $ | 1,168.4 | $ | 1,168.4 | $ | 1,159.8 | L + 3.15% | L + 3.40% | 3/15/2023 | Diversified - Spain | Spanish Assets | n/a | 71% | 3 | ||||||||||||||||||||||
| 2 |
Senior loan |
5/11/2017 | 752.6 | 675.0 | 671.5 | L + 3.40% | L + 3.60% | 6/10/2023 | Northern Virginia |
Office |
$ 330 / sqft | 62% | 3 | |||||||||||||||||||||||||
| 3 |
Senior loan |
5/30/2018 | 517.5 | 517.5 | 512.1 | L + 2.75% | L + 2.99% | 6/9/2025 | Diversified - US |
Hotel |
12,857 / key | 43% | 2 | |||||||||||||||||||||||||
| 4 |
Senior loan(3) |
8/6/2015 | 487.8 | 487.8 | 88.6 | 4.49% | 5.82% | 10/29/2022 | Diversified - EUR |
Other |
n/a | 71% | 3 | |||||||||||||||||||||||||
| 5 |
Senior loan |
5/1/2015 | 355.0 | 335.0 | 334.0 | L + 2.85% | L + 3.02% | 5/1/2023 | New York |
Office |
425 / sqft | 68% | 3 | |||||||||||||||||||||||||
| 6 |
Senior loan |
2/13/2018 | 330.0 | 306.7 | 306.2 | L + 3.42% | L + 3.54% | 3/9/2023 | New York |
Multi |
742,643 / unit | 62% | 3 | |||||||||||||||||||||||||
| 7 |
Senior loan |
1/7/2015 | 315.0 | 301.3 | 301.0 | L + 3.50% | L + 3.71% | 1/9/2021 | New York |
Office |
258 / sqft | 53% | 2 | |||||||||||||||||||||||||
| 8 |
Senior loan |
3/31/2017 | 258.4 | 241.5 | 239.9 | L + 4.15% | L + 4.54% | 4/9/2022 | Maui |
Hotel |
318,182 / key | 75% | 3 | |||||||||||||||||||||||||
| 9 |
Senior loan |
12/22/2017 | 225.0 | 225.0 | 223.1 | L + 2.80% | L + 3.16% | 1/9/2023 | Chicago |
Multi |
326,087 / unit | 65% | 3 | |||||||||||||||||||||||||
| 10 |
Senior loan |
8/3/2016 | 275.9 | 220.6 | 219.6 | L + 4.66% | L + 5.24% | 8/9/2021 | New York |
Office |
304 / sqft | 57% | 3 | |||||||||||||||||||||||||
| 11 |
Senior loan |
5/9/2018 | 219.0 | 219.0 | 217.2 | L + 3.00% | L + 3.24% | 5/9/2023 | New York |
Industrial |
62 / sqft | 70% | 3 | |||||||||||||||||||||||||
| 12 |
Senior loan |
6/23/2015 | 221.1 | 214.2 | 214.0 | L + 3.65% | L + 4.01% | 5/8/2022 | Washington DC |
Office |
240 / sqft | 72% | 2 | |||||||||||||||||||||||||
| 13 |
Senior loan |
6/4/2015 | 205.9 | 205.9 | 208.1 | L + 4.19% | L + 4.37% | 5/20/2021 | Diversified - CAN |
Hotel |
43,468 / key | 54% | 2 | |||||||||||||||||||||||||
| 14 |
Senior loan |
1/26/2017 | 288.0 | 200.4 | 198.2 | L + 5.50% | L + 5.99% | 2/9/2022 | Boston |
Office |
773 / sqft | 42% | 2 | |||||||||||||||||||||||||
| 15 |
Senior loan |
4/15/2016 | 225.0 | 200.0 | 197.9 | L + 3.25% | L + 3.84% | 4/9/2023 | New York |
Office |
186 / sqft | 40% | 3 | |||||||||||||||||||||||||
| 16 |
Senior loan |
8/19/2016 | 200.0 | 200.0 | 200.2 | L + 3.64% | L + 4.10% | 9/9/2021 | New York |
Office |
606 / sqft | 69% | 3 | |||||||||||||||||||||||||
| 17 |
Senior loan |
2/25/2014 | 195.0 | 195.0 | 194.4 | L + 4.01% | L + 4.46% | 3/9/2021 | Diversified - US |
Hotel |
102,470 / key | 55% | 2 | |||||||||||||||||||||||||
| 18 |
Senior loan |
6/4/2018 | 190.0 | 190.0 | 188.1 | L + 3.50% | L + 3.86% | 6/9/2024 | New York |
Hotel |
313,015 / key | 72% | 3 | |||||||||||||||||||||||||
| 19 |
Senior loan |
4/9/2018 | 1,792.0 | 185.0 | 167.1 | L + 8.50% | L + 8.76% | 6/9/2025 | New York |
Office |
633 / sqft | 48% | 3 | |||||||||||||||||||||||||
| 20 |
Senior loan |
12/22/2016 | 204.1 | 180.6 | 180.0 | L + 3.50% | L + 4.07% | 1/9/2022 | New York |
Office |
254 / sqft | 66% | 3 | |||||||||||||||||||||||||
| 21 |
Senior loan |
4/3/2018 | 178.6 | 176.6 | 175.1 | L + 2.75% | L + 3.08% | 4/9/2024 | Dallas |
Various |
500 / sqft | 64% | 3 | |||||||||||||||||||||||||
| 22 |
Senior loan |
3/8/2016 | 181.2 | 174.4 | 173.6 | L + 3.55% | L + 3.81% | 3/9/2021 | Orange County |
Office |
219 / sqft | 52% | 3 | |||||||||||||||||||||||||
| 23 |
Senior loan |
4/12/2018 | 259.3 | 170.3 | 169.2 | L + 2.93% | L + 3.30% | 11/20/2022 | New York |
Various |
32 / sqft | 58% | 2 | |||||||||||||||||||||||||
| 24 |
Senior loan |
5/16/2017 | 189.2 | 170.2 | 168.9 | L + 3.90% | L + 4.29% | 5/16/2021 | Chicago |
Office |
128 / sqft | 59% | 3 | |||||||||||||||||||||||||
| 25 |
Senior loan |
8/31/2017 | 183.0 | 168.2 | 166.9 | L + 3.00% | L + 3.40% | 9/9/2022 | Orange County |
Office |
199 / sqft | 64% | 3 | |||||||||||||||||||||||||
| 26 |
Senior loan |
11/30/2017 | 197.4 | 159.5 | 157.9 | L + 3.80% | L + 4.20% | 12/9/2022 | San Jose |
Office |
264 / sqft | 64% | 2 | |||||||||||||||||||||||||
| 27 |
Senior loan |
8/23/2017 | 165.0 | 137.2 | 136.0 | L + 3.25% | L + 3.64% | 10/9/2022 | Los Angeles |
Office |
278 / sqft | 74% | 3 | |||||||||||||||||||||||||
| 28 |
Senior loan |
6/24/2015 | 135.0 | 134.3 | 133.7 | L + 4.25% | L + 3.72% | 4/9/2023 | Honolulu |
Hotel |
225,285 / key | 67% | 3 | |||||||||||||||||||||||||
| 29 |
Senior loan |
1/30/2014 | 133.4 | 133.4 | 132.4 | L + 4.30% | L + 5.83% | 12/1/2018 | New York |
Hotel |
212,341 / key | 38% | 2 | |||||||||||||||||||||||||
| 30 |
Senior loan |
10/5/2016 | 134.8 | 131.3 | 130.8 | L + 4.35% | L + 4.80% | 10/9/2021 | Diversified - US |
Hotel |
66,527 / key | 61% | 2 | |||||||||||||||||||||||||
continued…
55
Table of Contents
| Loan Type(1) |
Origination Date(2) |
Total Loan(3) |
Principal Balance(3) |
Net Book Value |
Cash Coupon(4) |
All-in Yield(4) |
Maximum Maturity(5) |
Location |
Property Type |
Loan Per SQFT / Unit / Key |
LTV(2) | Risk Rating | ||||||||||||||||||||||||||
| 31 |
Senior loan | 10/26/2016 | 129.4 | 129.4 | 128.8 | L + 4.20% | L + 4.57% | 11/9/2021 | Oakland | Office | 136 / sqft | 72% | 2 | |||||||||||||||||||||||||
| 32 |
Senior loan | 11/14/2017 | 128.5 | 128.5 | 127.5 | L + 3.80% | L + 4.16% | 12/9/2022 | Huntington Beach | Hotel | 514,000 / key | 57% | 3 | |||||||||||||||||||||||||
| 33 |
Senior loan | 12/21/2017 | 182.5 | 127.5 | 125.9 | L + 3.25% | L + 3.68% | 1/9/2023 | Atlanta | Office | 96 / sqft | 51% | 2 | |||||||||||||||||||||||||
| 34 |
Senior loan | 6/29/2017 | 141.1 | 126.9 | 126.0 | L + 3.35% | L + 3.77% | 7/9/2022 | Torrance | Multi | 250,790 / unit | 68% | 2 | |||||||||||||||||||||||||
| 35 |
Senior loan | 11/2/2017 | 140.0 | 123.2 | 122.1 | L + 3.20% | L + 3.62% | 11/9/2022 | Boston | Industrial | 162 / sqft | 69% | 2 | |||||||||||||||||||||||||
| 36 |
Senior loan | 4/30/2018 | 169.2 | 119.9 | 118.3 | L + 3.25% | L + 3.51% | 4/30/2023 | London - UK | Office | 540 / sqft | 60% | 3 | |||||||||||||||||||||||||
| 37 |
Senior loan | 10/17/2016 | 113.6 | 113.6 | 113.1 | L + 3.95% | L + 3.98% | 10/21/2021 | Diversified - UK | Other | 156 / sqft | 73% | 3 | |||||||||||||||||||||||||
| 38 |
Senior loan(3) | 6/30/2015 | 116.1 | 113.1 | 22.3 | L + 4.75% | L + 5.37% | 8/15/2022 | San Francisco | Condo | 766 / sqft | 60% | 3 | |||||||||||||||||||||||||
| 39 |
Senior loan | 2/20/2014 | 110.0 | 110.0 | 109.8 | L + 3.95% | L + 4.16% | 3/9/2021 | Long Island | Office | 161 / sqft | 74% | 2 | |||||||||||||||||||||||||
| 40 |
Senior loan | 7/28/2016 | 119.0 | 109.1 | 108.6 | L + 3.60% | L + 4.00% | 8/9/2021 | Atlanta | Office | 173 / sqft | 70% | 3 | |||||||||||||||||||||||||
| 41 |
Senior loan | 3/21/2018 | 113.2 | 104.0 | 103.1 | L + 3.10% | L + 3.36% | 3/21/2024 | Jacksonville | Office | 104 / sqft | 72% | 3 | |||||||||||||||||||||||||
| 42 |
Senior loan | 3/13/2018 | 123.0 | 103.0 | 101.9 | L + 3.50% | L + 3.83% | 4/9/2025 | Honolulu | Hotel | 159,690 / key | 50% | 3 | |||||||||||||||||||||||||
| 43 |
Senior loan | 1/31/2017 | 134.8 | 100.5 | 99.6 | L + 5.00% | L + 5.49% | 2/9/2022 | Boston | Other | 730 / sqft | 60% | 3 | |||||||||||||||||||||||||
| 44 |
Senior loan | 1/22/2016 | 128.5 | 100.1 | 99.9 | L + 4.25% | L + 4.69% | 2/9/2021 | Los Angeles | Retail | 260 / sqft | 64% | 3 | |||||||||||||||||||||||||
| 45 |
Senior loan | 2/9/2017 | 100.1 | 100.1 | 99.2 | L + 4.50% | L + 4.86% | 5/29/2023 | London | Office | 976 / sqft | 69% | 3 | |||||||||||||||||||||||||
| 46 |
Senior loan | 2/27/2015 | 102.2 | 99.7 | 99.2 | L + 3.55% | L + 3.88% | 4/28/2022 | Chicago | Office | 204 / sqft | 65% | 2 | |||||||||||||||||||||||||
| 47 |
Senior loan | 5/22/2014 | 100.0 | 97.6 | 97.5 | L + 3.75% | L + 3.92% | 6/15/2021 | Orange County | Office | 171 / sqft | 74% | 2 | |||||||||||||||||||||||||
| 48 |
Senior loan | 5/16/2014 | 100.0 | 95.2 | 95.0 | L + 3.85% | L + 4.21% | 4/9/2022 | Miami | Office | 205 / sqft | 67% | 3 | |||||||||||||||||||||||||
| 49 |
Senior loan | 3/10/2016 | 98.5 | 94.9 | 94.7 | L + 4.10% | L + 4.52% | 4/9/2021 | Chicago | Multi | 654,558 / unit | 63% | 3 | |||||||||||||||||||||||||
| 50 |
Senior loan | 6/1/2018 | 133.4 | 93.4 | 91.9 | L + 3.40% | L + 3.75% | 5/28/2023 | London - UK | Office | 633 / sqft | 66% | 3 | |||||||||||||||||||||||||
| 51 |
Senior loan | 12/9/2014 | 104.5 | 88.6 | 88.4 | L + 3.65% | L + 3.80% | 12/9/2021 | Diversified - US | Office | 76 / sqft | 65% | 2 | |||||||||||||||||||||||||
| 52 |
Senior loan | 2/18/2015 | 89.9 | 86.3 | 86.0 | L + 3.75% | L + 4.17% | 3/9/2020 | Diversified - CA | Office | 178 / sqft | 71% | 2 | |||||||||||||||||||||||||
| 53 |
Senior loan | 5/11/2017 | 135.9 | 84.4 | 83.4 | L + 3.40% | L + 3.91% | 6/10/2023 | Northern Virginia | Office | 194 / sqft | 38% | 2 | |||||||||||||||||||||||||
| 54 |
Senior loan | 2/12/2016 | 100.0 | 83.5 | 83.3 | L + 4.15% | L + 4.46% | 3/9/2021 | Long Island | Office | 124 / sqft | 65% | 3 | |||||||||||||||||||||||||
| 55 |
Senior loan | 4/12/2018 | 103.1 | 82.5 | 81.5 | L + 2.75% | L + 3.14% | 5/9/2023 | Daly City | Office | 215 / sqft | 72% | 3 | |||||||||||||||||||||||||
| 56 |
Senior loan | 7/11/2014 | 87.2 | 82.2 | 81.9 | L + 3.55% | L + 3.83% | 8/9/2020 | Chicago | Office | 157 / sqft | 65% | 2 | |||||||||||||||||||||||||
| 57 |
Senior loan | 10/28/2014 | 85.0 | 82.2 | 82.1 | L + 3.75% | L + 4.01% | 11/9/2019 | New York | Retail | 1,536 / sqft | 78% | 3 | |||||||||||||||||||||||||
| 58 |
Senior loan | 5/1/2015 | 79.4 | 79.4 | 79.2 | L + 3.95% | L + 4.21% | 5/9/2020 | Maryland | Hotel | 203,634 / key | 67% | 3 | |||||||||||||||||||||||||
| 59 |
Senior loan | 3/31/2017 | 91.2 | 73.6 | 73.1 | L + 4.30% | L + 4.90% | 4/9/2022 | New York | Office | 361 / sqft | 64% | 3 | |||||||||||||||||||||||||
| 60 |
Senior loan | 8/18/2017 | 72.4 | 72.4 | 71.9 | L + 4.10% | L + 4.46% | 8/18/2022 | Brussels | Office | 115 / sqft | 59% | 3 | |||||||||||||||||||||||||
continued…
56
Table of Contents
| Loan Type(1) |
Origination Date(2) |
Total Loan(3) |
Principal Balance(3) |
Net Book Value |
Cash Coupon(4) |
All-in Yield(4) |
Maximum Maturity(5) |
Location |
Property Type |
Loan Per SQFT / Unit / Key |
LTV(2) | Risk Rating | ||||||||||||||||||||||||||
| 61 |
Senior loan |
6/29/2016 | 75.4 | 70.7 | 70.4 | L + 3.65% | L + 4.02% | 7/9/2021 | Fort Lauderdale |
Office |
272 / sqft | 64% | 2 | |||||||||||||||||||||||||
| 62 |
Senior loan |
6/4/2015 | 73.0 | 69.7 | 70.5 | 5.14% | (6) | 5.42% | (6) | 3/28/2019 | Diversified - CAN |
Retail |
40 / sqft | 74% | 3 | |||||||||||||||||||||||
| 63 |
Senior loan |
10/6/2014 | 67.0 | 67.0 | 67.0 | L + 4.35% | L + 4.61% | 10/9/2019 | Long Island |
Hotel |
108,943 / key | 56% | 3 | |||||||||||||||||||||||||
| 64 |
Senior loan |
11/30/2016 | 79.0 | 66.6 | 66.2 | L + 3.95% | L + 4.39% | 12/9/2021 | Chicago |
Retail |
1,317 / sqft | 54% | 3 | |||||||||||||||||||||||||
| 65 |
Senior loan |
5/9/2017 | 73.7 | 62.7 | 62.2 | L + 3.85% | L + 4.30% | 5/9/2022 | New York |
Multi |
377,423 / unit | 67% | 3 | |||||||||||||||||||||||||
| 66 |
Senior loan |
3/11/2014 | 65.0 | 62.3 | 62.2 | L + 4.50% | L + 4.77% | 4/9/2019 | New York |
Multi |
700,290 / unit | 65% | 3 | |||||||||||||||||||||||||
| 67 |
Senior loan |
7/13/2017 | 86.3 | 60.0 | 59.4 | L + 3.75% | L + 4.18% | 8/9/2022 | Honolulu |
Hotel |
192,926 / key | 66% | 3 | |||||||||||||||||||||||||
| 68 |
Senior loan |
1/13/2014 | 60.0 | 60.0 | 59.9 | L + 3.45% | L + 3.71% | 6/9/2020 | New York |
Office |
284 / sqft | 53% | 2 | |||||||||||||||||||||||||
| 69 |
Senior loan |
6/29/2017 | 64.2 | 59.7 | 59.2 | L + 3.40% | L + 3.71% | 7/9/2023 | New York |
Multi |
173,998 / unit | 69% | 3 | |||||||||||||||||||||||||
| 70 |
Senior loan |
4/5/2018 | 72.5 | 55.7 | 55.1 | L + 3.10% | L + 3.57% | 4/9/2023 | Diversified - US |
Industrial |
23 / sqft | 54% | 3 | |||||||||||||||||||||||||
| 71 |
Senior loan |
10/6/2017 | 55.9 | 55.3 | 55.0 | L + 2.95% | L + 3.21% | 10/9/2022 | Nashville |
Multi |
98,784 / unit | 74% | 3 | |||||||||||||||||||||||||
| 72 |
Senior loan |
9/9/2014 | 56.0 | 52.5 | 52.5 | L + 4.00% | L + 4.25% | 9/9/2019 | Ft. Lauderdale |
Office |
151 / sqft | 71% | 1 | |||||||||||||||||||||||||
| 73 |
Senior loan |
11/23/2016 | 55.4 | 51.9 | 51.6 | L + 3.50% | L + 3.80% | 12/9/2022 | New York |
Multi |
216,432 / unit | 65% | 3 | |||||||||||||||||||||||||
| 74 |
Senior loan |
11/1/2017 | 52.1 | 51.5 | 51.2 | L + 2.95% | L + 3.21% | 11/9/2022 | Denver |
Multi |
153,157 / unit | 74% | 3 | |||||||||||||||||||||||||
| 75 |
Senior loan |
5/20/2015 | 58.0 | 51.2 | 51.2 | 5.36% | (6) | 5.63% | (6) | 6/30/2019 | Charlotte |
Office |
101 / sqft | 71% | 3 | |||||||||||||||||||||||
| 76 |
Senior loan |
12/27/2016 | 57.2 | 49.5 | 49.2 | L + 4.65% | L + 5.08% | 1/9/2022 | New York |
Multi |
1,260,476 / unit | 64% | 3 | |||||||||||||||||||||||||
| 77 |
Senior loan |
11/19/2015 | 48.7 | 45.9 | 45.9 | L + 4.00% | L + 4.50% | 10/9/2018 | New York |
Office |
1,178 / sqft | 57% | 3 | |||||||||||||||||||||||||
| 78 |
Senior loan |
9/22/2016 | 46.0 | 45.5 | 45.5 | L + 4.25% | L + 4.90% | 10/9/2019 | New York |
Office |
456 / sqft | 51% | 3 | |||||||||||||||||||||||||
| 79 |
Senior loan |
7/20/2017 | 193.2 | 44.3 | 42.4 | L + 5.10% | L + 6.15% | 8/9/2022 | Oakland |
Office |
321 / sqft | 58% | 3 | |||||||||||||||||||||||||
| 80 |
Senior loan |
5/20/2015 | 45.0 | 44.0 | 43.9 | L + 3.00% | L + 3.35% | 11/1/2022 | Los Angeles |
Office |
205 / sqft | 59% | 2 | |||||||||||||||||||||||||
| 81 |
Senior loan |
8/29/2017 | 51.2 | 43.5 | 43.1 | L + 3.10% | L + 3.52% | 10/9/2022 | Southern California |
Industrial |
91 / sqft | 65% | 3 | |||||||||||||||||||||||||
| 82 |
Senior loan |
5/24/2018 | 81.3 | 42.2 | 41.4 | L + 4.10% | L + 4.59% | 6/9/2023 | Boston |
Office |
82 / sqft | 55% | 3 | |||||||||||||||||||||||||
| 83 |
Senior loan |
10/6/2017 | 41.1 | 41.0 | 40.8 | L + 2.95% | L + 3.20% | 10/9/2022 | Las Vegas |
Multi |
138,527 / unit | 77% | 3 | |||||||||||||||||||||||||
| 84 |
Senior loan |
6/26/2015 | 42.1 | 39.4 | 39.4 | L + 3.75% | L + 3.76% | 7/9/2020 | San Diego |
Office |
180 / sqft | 73% | 2 | |||||||||||||||||||||||||
| 85 |
Senior loan |
5/8/2017 | 80.0 | 37.4 | 36.6 | L + 3.75% | L + 4.68% | 5/8/2022 | Washington DC |
Office |
373 / sqft | 73% | 3 | |||||||||||||||||||||||||
| 86 |
Senior loan |
9/1/2017 | 44.2 | 37.4 | 37.0 | L + 4.15% | L + 4.57% | 9/9/2021 | New York |
Condo |
590 / sqft | 64% | 3 | |||||||||||||||||||||||||
| 87 |
Senior loan |
10/6/2017 | 34.8 | 34.7 | 34.5 | L + 2.95% | L + 3.20% | 10/9/2022 | Las Vegas |
Multi |
120,456 / unit | 75% | 3 | |||||||||||||||||||||||||
| 88 |
Senior loan |
6/12/2014 | 34.2 | 34.2 | 34.1 | L + 4.00% | L + 4.23% | 6/30/2020 | Los Angeles |
Office |
39 / sqft | 44% | 2 | |||||||||||||||||||||||||
| 89 |
Senior loan |
5/28/2015 | 48.6 | 31.6 | 31.5 | L + 4.00% | L + 4.58% | 6/30/2020 | Los Angeles |
Office |
36 / sqft | 53% | 2 | |||||||||||||||||||||||||
| 90 |
Senior loan |
9/1/2016 | 31.2 | 31.2 | 31.3 | L + 4.20% | L + 4.79% | 9/1/2022 | Atlanta |
Multi |
201,598 / unit | 72% | 2 | |||||||||||||||||||||||||
continued…
57
Table of Contents
| Loan Type(1) |
Origination Date(2) |
Total Loan(3) |
Principal Balance(3) |
Net Book Value |
Cash Coupon(4) |
All-in Yield(4) |
Maximum Maturity(5) |
Location |
Property Type |
Loan Per SQFT / Unit / Key |
LTV(2) | Risk Rating | ||||||||||||||||||||||||||
| 91 |
Senior loan |
3/1/2018 | 28.0 | 28.0 | 27.8 | L + 2.95% | L + 3.31% | 3/9/2023 | Houston |
Multi |
102,564 / unit | 72% | 3 | |||||||||||||||||||||||||
| 92 |
Senior loan |
1/30/2018 | 28.0 | 28.0 | 27.8 | L + 2.90% | L + 3.26% | 2/9/2023 | Houston |
Multi |
135,266 / unit | 66% | 3 | |||||||||||||||||||||||||
| 93 |
Senior loan |
12/15/2017 | 22.5 | 22.5 | 22.2 | L + 3.25% | L + 4.31% | 12/9/2020 | Diversified - US |
Hotel |
8,465 / key | 50% | 2 | |||||||||||||||||||||||||
| 94 |
Senior loan |
6/4/2015 | 20.0 | 20.0 | 19.8 | 4.50% | 5.05% | 12/23/2021 | Montreal - CAN |
Office |
54 / sqft | 45% | 2 | |||||||||||||||||||||||||
| 95 |
Senior loan |
6/4/2018 | 22.0 | 18.5 | 18.5 | L + 3.35% | L + 4.04% | 7/1/2022 | Phoenix |
Multi |
64,685 / unit | 78% | 3 | |||||||||||||||||||||||||
| 96 |
Senior loan |
6/4/2015 | 17.1 | 17.1 | 17.1 | 4.63% | 5.01% | 3/1/2019 | Ontario - CAN |
Other |
50,234 / unit | 59% | 2 | |||||||||||||||||||||||||
| 97 |
Senior loan |
11/2/2017 | 17.9 | 16.4 | 16.4 | L + 3.90% | L + 4.26% | 11/1/2020 | Phoenix |
Multi |
63,071 / unit | 59% | 2 | |||||||||||||||||||||||||
| 98 |
Senior loan |
6/4/2015 | 16.4 | 16.4 | 16.4 | 5.20% | 5.54% | 9/4/2020 | Diversified - CAN |
Other |
3,567 / unit | 61% | 2 | |||||||||||||||||||||||||
| 99 |
Senior loan |
3/9/2018 | 17.8 | 16.3 | 16.3 | L + 3.75% | L + 4.01% | 4/1/2023 | Los Angeles |
Multi |
125,385 / unit | 75% | 3 | |||||||||||||||||||||||||
| 100 |
Senior loan |
10/20/2017 | 17.2 | 14.0 | 13.9 | L + 4.25% | L + 4.63% | 11/1/2021 | Houston |
Multi |
110,714 / unit | 56% | 3 | |||||||||||||||||||||||||
| 101 |
Senior loan |
6/18/2014 | 14.0 | 14.0 | 14.0 | L + 4.00% | L + 4.38% | 7/20/2019 | Diversified - NL |
Office |
36 / sqft | 69% | 2 | |||||||||||||||||||||||||
| 102 |
Senior loan |
9/6/2017 | 13.3 | 13.3 | 13.3 | L + 4.25% | L + 5.09% | 4/1/2019 | Austin |
Multi |
127,644 / unit | 67% | 3 | |||||||||||||||||||||||||
| 103 |
Senior loan |
7/13/2017 | 13.1 | 13.1 | 13.1 | L + 4.50% | L + 4.91% | 2/1/2020 | Orlando |
Multi |
60,648 / unit | 72% | 2 | |||||||||||||||||||||||||
| 104 |
Senior loan |
6/29/2018 | 11.6 | 11.6 | 11.5 | L + 2.95% | L + 3.83% | 7/1/2020 | Washington DC |
Multi |
61,053 / unit | 60% | 2 | |||||||||||||||||||||||||
| 105 |
Senior loan |
5/30/2018 | 10.1 | 8.7 | 8.7 | L + 3.90% | L + 4.23% | 6/1/2021 | Scottsdale |
Multi |
96,667 / unit | 84% | 3 | |||||||||||||||||||||||||
| 106 |
Senior loan |
7/21/2017 | 7.3 | 7.3 | 7.3 | L + 5.00% | L + 5.36% | 7/1/2019 | Phoenix |
Multi |
56,154 / unit | 78% | 3 | |||||||||||||||||||||||||
| 107 |
Senior loan(3) | 9/22/2017 | 91.0 | 0.0 | (0.4 | ) | L + 5.25% | L + 6.03% | 10/9/2022 | Oakland | Multi | 446,078 / unit | 46% | 3 | ||||||||||||||||||||||||
|
|
|
|
|
|
|
|
|
|
|
|
|
|
| |||||||||||||||||||||||||
| $ | 15,853.9 | $12,792.9 | $ | 12,214.6 | 5.43% | 5.81% | 4.1 yrs | 63% | 2.7 | |||||||||||||||||||||||||||||
|
|
|
|
|
|
|
|
|
|
|
|
|
|
| |||||||||||||||||||||||||
| (1) | Senior loans include senior mortgages and similar credit quality loans, including related contiguous subordinate loans and pari passu participations in senior mortgage loans. |
| (2) | Date loan was originated or acquired by us, and the LTV as of such date. Dates are not updated for subsequent loan modifications or upsizes. |
| (3) | In certain instances, we finance our loans through the non-recourse sale of a senior loan interest that is not included in our consolidated financial statements. As of June 30, 2018, three loans in our portfolio have been financed with an aggregate $489.3 million of non-consolidated senior interest, which are included in the table above. |
| (4) | As of June 30, 2018, our floating rate loans were indexed to various benchmark rates, with 84% of floating rate loans by loan exposure indexed to USD LIBOR. In addition to cash coupon, all-in yield includes the amortization of deferred origination and extension fees, loan origination costs, and purchase discounts, as well as the accrual of exit fees. |
| (5) | Maximum maturity assumes all extension options are exercised, however our loans may be repaid prior to such date. |
| (6) | Loan consists of one or more floating and fixed rate tranches. Coupon and all-in yield assume applicable floating benchmark rates for weighted-average calculation. |
58
Table of Contents
| ITEM 3. | QUANTITATIVE AND QUALITATIVE DISCLOSURES ABOUT MARKET RISK |
Interest Rate Risk
Loan Portfolio Net Interest Income
Generally, our business model is such that rising interest rates will increase our net income, while declining interest rates will decrease net income. As of June 30, 2018, 95% of our loans by total loan exposure earned a floating rate of interest and were financed with liabilities that pay interest at floating rates, which resulted in an amount of net equity that is positively correlated to rising interest rates, subject to the impact of interest rate floors on certain of our floating rate loans. As of June 30, 2018, the remaining 5% of our loans by total loan exposure earned a fixed rate of interest, but are financed with liabilities that pay interest at floating rates, which resulted in a negative correlation to rising interest rates to the extent of our financing. In certain instances where we have financed fixed rate assets with floating rate liabilities, we have purchased interest rate swaps or caps to limit our exposure to increases in interest rates on such liabilities.
The following table projects the impact on our interest income and expense, net of incentive fees, for the twelve-month period following June 30, 2018, assuming an immediate increase or decrease of both 25 and 50 basis points in the applicable interest rate benchmark by currency ($ in thousands):
| Currency |
Assets (Liabilities) Subject to Interest Rate Sensitivity(1)(2) |
25 Basis Point Increase |
25 Basis Point Decrease |
50 Basis Point Increase |
50 Basis Point Decrease |
|||||||||||||||||||
| USD |
$ | 10,249,471 | Interest income | $ | 20,499 | $ | (20,284 | ) | $ | 40,998 | $ | (39,935 | ) | |||||||||||
| (7,062,997 | ) | Interest expense | (13,570 | ) | 14,126 | (27,288 | ) | 28,252 | ||||||||||||||||
|
|
|
|
|
|
|
|
|
|
|
|||||||||||||||
| $ | 3,186,474 | Total | $ | 6,929 | $ | (6,158 | ) | $ | 13,710 | $ | (11,683 | ) | ||||||||||||
|
|
|
|
|
|
|
|
|
|
|
|||||||||||||||
| GBP |
$ | 427,005 | Interest income | $ | 854 | $ | (797 | ) | $ | 1,708 | $ | (1,465 | ) | |||||||||||
| (251,770 | ) | Interest expense | (504 | ) | 504 | (1,007 | ) | 1,007 | ||||||||||||||||
|
|
|
|
|
|
|
|
|
|
|
|||||||||||||||
| $ | 175,235 | Total | $ | 350 | $ | (293 | ) | $ | 701 | $ | (458 | ) | ||||||||||||
|
|
|
|
|
|
|
|
|
|
|
|||||||||||||||
| EUR |
$ | 1,254,863 | Interest income | $ | — | $ | — | $ | 1,339 | $ | — | |||||||||||||
| (992,673 | ) | Interest expense | — | — | (1,055 | ) | — | |||||||||||||||||
|
|
|
|
|
|
|
|
|
|
|
|||||||||||||||
| $ | 262,190 | Total | $ | — | $ | — | $ | 284 | $ | — | ||||||||||||||
|
|
|
|
|
|
|
|
|
|
|
|||||||||||||||
| CAD(3) |
$ | 206,962 | Interest income | $ | 414 | $ | (414 | ) | $ | 828 | $ | (828 | ) | |||||||||||
| (190,652 | ) | Interest expense | (378 | ) | 381 | (725 | ) | 763 | ||||||||||||||||
|
|
|
|
|
|
|
|
|
|
|
|||||||||||||||
| $ | 16,310 | Total | $ | 36 | $ | (33 | ) | $ | 103 | $ | (65 | ) | ||||||||||||
|
|
|
|
|
|
|
|
|
|
|
|||||||||||||||
|
|
|
|
|
|
|
|
|
|||||||||||||||||
| Total | $ | 7,315 | $ | (6,484 | ) | $ | 14,798 | $ | (12,206 | ) | ||||||||||||||
|
|
|
|
|
|
|
|
|
|||||||||||||||||
| (1) | Our floating rate loans and related liabilities are indexed to the various benchmark rates relevant in each case in terms of currency and payment frequency. Therefore the net exposure to each benchmark rate is in direct proportion to our net assets indexed to that rate. Increases (decreases) in interest income and expense are presented net of incentive fees. Refer to Note 11 to our consolidated financial statements for additional details of our incentive fee calculation. |
| (2) | Includes borrowings under secured debt agreements, loan participations sold, non-consolidated senior interests, and securitized debt obligations. |
| (3) | Liabilities balance includes four interest rate swaps totaling C$107.9 million ($82.2 million as of June 30, 2018) that are used to hedge a portion of our fixed rate debt. |
Loan Portfolio Value
As of June 30, 2018, 5% of our loans by total loan exposure earned a fixed rate of interest and as such, the values of such loans are sensitive to changes in interest rates. We generally hold all of our loans to maturity and so do not expect to realize gains or losses on our fixed rate loan portfolio as a result of movements in market interest rates.
59
Table of Contents
Risk of Non-Performance
In addition to the risks related to fluctuations in cash flows and asset values associated with movements in interest rates, there is also the risk of non-performance on floating rate assets. In the case of a significant increase in interest rates, the additional debt service payments due from our borrowers may strain the operating cash flows of the collateral real estate assets and, potentially, contribute to non-performance or, in severe cases, default. This risk is partially mitigated by various facts we consider during our underwriting process, which in certain cases include a requirement for our borrower to purchase an interest rate cap contract.
Credit Risks
Our loans and investments are also subject to credit risk. The performance and value of our loans and investments depend upon the sponsors’ ability to operate the properties that serve as our collateral so that they produce cash flows adequate to pay interest and principal due to us. To monitor this risk, our Manager’s asset management team reviews our investment portfolios and in certain instances is in regular contact with our borrowers, monitoring performance of the collateral and enforcing our rights as necessary.
In addition, we are exposed to the risks generally associated with the commercial real estate market, including variances in occupancy rates, capitalization rates, absorption rates, and other macroeconomic factors beyond our control. We seek to manage these risks through our underwriting and asset management processes.
Capital Market Risks
We are exposed to risks related to the equity capital markets, and our related ability to raise capital through the issuance of our class A common stock or other equity instruments. We are also exposed to risks related to the debt capital markets, and our related ability to finance our business through borrowings under credit facilities or other debt instruments. As a REIT, we are required to distribute a significant portion of our taxable income annually, which constrains our ability to accumulate operating cash flow and therefore requires us to utilize debt or equity capital to finance our business. We seek to mitigate these risks by monitoring the debt and equity capital markets to inform our decisions on the amount, timing, and terms of capital we raise.
Counterparty Risk
The nature of our business requires us to hold our cash and cash equivalents and obtain financing from various financial institutions. This exposes us to the risk that these financial institutions may not fulfill their obligations to us under these various contractual arrangements. We mitigate this exposure by depositing our cash and cash equivalents and entering into financing agreements with high credit-quality institutions.
The nature of our loans and investments also exposes us to the risk that our counterparties do not make required interest and principal payments on scheduled due dates. We seek to manage this risk through a comprehensive credit analysis prior to making an investment and active monitoring of the asset portfolios that serve as our collateral.
Currency Risk
Our loans and investments that are denominated in a foreign currency are also subject to risks related to fluctuations in currency rates. We mitigate this exposure by matching the currency of our foreign currency assets to the currency of the borrowings that finance those assets. As a result, we substantially reduce our exposure to changes in portfolio value related to changes in foreign currency rates. In certain circumstances, we may also enter into foreign currency derivative contracts to further mitigate this exposure.
60
Table of Contents
The following table outlines our assets and liabilities that are denominated in a foreign currency (£/€/C$ in thousands):
| June 30, 2018 | ||||||||||||
| Foreign currency assets(1) |
£ | 722,710 | € | 1,117,244 | C$ | 441,818 | ||||||
| Foreign currency liabilities(1) |
(494,299 | ) | (846,218 | ) | (358,841 | ) | ||||||
| Foreign currency contracts - notional |
(133,100 | ) | (185,000 | ) | (73,100 | ) | ||||||
|
|
|
|
|
|
|
|||||||
| Net exposure to exchange rate fluctuations |
£ | 95,311 | € | 86,026 | C$ | 9,877 | ||||||
|
|
|
|
|
|
|
|||||||
|
|
||||||||||||
| (1) |
Balances include non-consolidated senior interests of £302.0 million. |
We estimate that a 10% appreciation of the United States dollar relative to the British Pound Sterling and the Euro would result in a decline in our net assets in U.S. dollar terms of $30.2 million and $31.7 million, respectively, as of June 30, 2018. Substantially all of our net asset exposure to the Canadian dollar has been hedged with foreign currency forward contracts.
| ITEM 4. | CONTROLS AND PROCEDURES |
Evaluation of Disclosure Controls and Procedures
An evaluation of the effectiveness of the design and operation of our “disclosure controls and procedures” (as defined in Rule 13a-15(e) under the Securities Exchange Act of 1934, as amended (the “Exchange Act”)), as of the end of the period covered by this quarterly report on Form 10-Q was made under the supervision and with the participation of our management, including our Chief Executive Officer and Chief Financial Officer. Based upon this evaluation, our Chief Executive Officer and Chief Financial Officer have concluded that our disclosure controls and procedures (a) are effective to ensure that information required to be disclosed by us in reports filed or submitted under the Exchange Act is recorded, processed, summarized and reported within the time periods specified by SEC rules and forms and (b) include, without limitation, controls and procedures designed to ensure that information required to be disclosed by us in reports filed or submitted under the Exchange Act is accumulated and communicated to our management, including our Chief Executive Officer and Chief Financial Officer, as appropriate to allow timely decisions regarding required disclosure.
Changes in Internal Controls over Financial Reporting
There have been no changes in our “internal control over financial reporting” (as defined in Rule 13a-15(f) of the Exchange Act) that occurred during the period covered by this quarterly report on Form 10-Q that have materially affected, or are reasonably likely to materially affect, our internal control over financial reporting.
61
Table of Contents
| ITEM 1. | LEGAL PROCEEDINGS |
From time to time, we may be involved in various claims and legal actions arising in the ordinary course of business. As of June 30, 2018, we were not involved in any material legal proceedings.
| ITEM 1A. | RISK FACTORS |
There have been no material changes to the risk factors previously disclosed under Item 1A of our Annual Report on Form 10-K for the year ended December 31, 2017.
| ITEM 2. | UNREGISTERED SALES OF EQUITY SECURITIES AND USE OF PROCEEDS |
None.
| ITEM 3. | DEFAULTS UPON SENIOR SECURITIES |
None.
| ITEM 4. | MINE SAFETY DISCLOSURES |
Not applicable.
| ITEM 5. | OTHER INFORMATION |
None.
62
Table of Contents
| ITEM 6. | EXHIBITS |
| + | This exhibit shall not be deemed “filed” for purposes of Section 18 of the Securities Exchange Act of 1934, as amended (the “Exchange Act”) or otherwise subject to the liability of that Section. Such exhibit shall not be deemed incorporated into any filing under the Securities Act of 1933, as amended (the “Securities Act”), or the Exchange Act. |
63
Table of Contents
The agreements and other documents filed as exhibits to this report are not intended to provide factual information or other disclosure other than with respect to the terms of the agreements or other documents themselves, and you should not rely on them for that purpose. In particular, any representations and warranties made by us in these agreements or other documents were made solely within the specific context of the relevant agreement or document and may not describe the actual state of affairs as of the date they were made or at any other time.
64
Table of Contents
Pursuant to the requirements of the Securities Exchange Act of 1934, the registrant has duly caused this report to be signed on its behalf by the undersigned thereunto duly authorized.
| BLACKSTONE MORTGAGE TRUST, INC. | ||||
| July 24, 2018 |
/s/ Stephen D. Plavin | |||
| Date |
Stephen D. Plavin | |||
| Chief Executive Officer | ||||
| (Principal Executive Officer) | ||||
| July 24, 2018 |
/s/ Anthony F. Marone, Jr. | |||
| Date |
Anthony F. Marone, Jr. | |||
| Chief Financial Officer | ||||
| (Principal Financial Officer and | ||||
| Principal Accounting Officer) | ||||
65