Attached files
Table of Contents
UNITED STATES
SECURITIES AND EXCHANGE COMMISSION
WASHINGTON, D.C. 20549
FORM 10-Q
(Mark One)
| x | QUARTERLY REPORT PURSUANT TO SECTION 13 OR 15(d) OF THE SECURITIES EXCHANGE ACT OF 1934 |
FOR THE QUARTERLY PERIOD ENDED March 31, 2015
OR
| ¨ | TRANSITION REPORT PURSUANT TO SECTION 13 OR 15(d) OF THE SECURITIES EXCHANGE ACT OF 1934 |
FOR THE TRANSITION PERIOD FROM TO
Commission File Number: 001-14788

Blackstone Mortgage Trust, Inc.
(Exact name of Registrant as specified in its charter)
| Maryland | 94-6181186 | |
| (State or other jurisdiction of incorporation or organization) |
(I.R.S. Employer Identification No.) |
345 Park Avenue, 42nd Floor
New York, New York 10154
(Address of principal executive offices)(Zip Code)
(212) 655-0220
(Registrant’s telephone number, including area code)
Indicate by check mark whether the Registrant (1) has filed all reports required to be filed by Section 13 or 15(d) of the Securities Exchange Act of 1934 during the preceding 12 months (or for such shorter period that the Registrant was required to file such reports), and (2) has been subject to such filing requirements for the past 90 days. Yes x No ¨
Indicate by check mark whether the registrant has submitted electronically and posted on its corporate Web site, if any, every Interactive Data File required to be submitted and posted pursuant to Rule 405 of Regulation S-T (§232.405 of this chapter) during the preceding 12 months (or for such shorter period that the registrant was required to submit and post such files). Yes x No ¨
Indicate by check mark whether the Registrant is a large accelerated filer, an accelerated filer, a non-accelerated filer, or a smaller reporting company. See the definitions of “large accelerated filer,” “accelerated filer” and “smaller reporting company” in Rule 12b-2 of the Exchange Act.
| Large accelerated filer | x | Accelerated filer | ¨ | |||
| Non-accelerated filer | ¨ (Do not check if a smaller reporting company) | Smaller reporting company | ¨ | |||
Indicate by check mark whether the Registrant is a shell company (as defined in Rule 12b-2 of the Exchange Act). Yes ¨ No x
The number of the Registrant’s outstanding shares of class A common stock, par value $0.01 per share, as of April 21, 2015 was 81,451,211.
Table of Contents
Table of Contents
Blackstone Mortgage Trust, Inc.
Consolidated Balance Sheets (Unaudited)
(in thousands, except share and per share data)
| March 31, | December 31, | |||||||
| 2015 | 2014 | |||||||
| Assets |
||||||||
| Cash and cash equivalents |
$ | 18,474 | $ | 51,810 | ||||
| Restricted cash |
26,890 | 11,591 | ||||||
| Loans receivable, net |
4,943,383 | 4,428,500 | ||||||
| Equity investments in unconsolidated subsidiaries |
11,570 | 10,604 | ||||||
| Accrued interest receivable, prepaid expenses, and other assets |
85,381 | 86,016 | ||||||
|
|
|
|
|
|||||
| Total assets |
$ | 5,085,698 | $ | 4,588,521 | ||||
|
|
|
|
|
|||||
| Liabilities and Equity |
||||||||
| Accounts payable, accrued expenses, and other liabilities |
$ | 62,862 | $ | 61,013 | ||||
| Revolving repurchase facilities |
2,241,630 | 2,040,783 | ||||||
| Asset-specific repurchase agreements |
407,203 | 324,553 | ||||||
| Loan participations sold |
708,845 | 499,433 | ||||||
| Convertible notes, net |
162,460 | 161,853 | ||||||
|
|
|
|
|
|||||
| Total liabilities |
3,583,000 | 3,087,635 | ||||||
|
|
|
|
|
|||||
| Equity |
||||||||
| Class A common stock, $0.01 par value, 100,000,000 shares authorized, 58,451,077 and 58,269,889 shares issued and outstanding as of March 31, 2015 and December 31, 2014, respectively |
585 | 583 | ||||||
| Additional paid-in capital |
2,030,760 | 2,027,404 | ||||||
| Accumulated other comprehensive loss |
(31,756 | ) | (15,024 | ) | ||||
| Accumulated deficit |
(542,654 | ) | (547,592 | ) | ||||
|
|
|
|
|
|||||
| Total Blackstone Mortgage Trust, Inc. stockholders’ equity |
1,456,935 | 1,465,371 | ||||||
| Non-controlling interests |
45,763 | 35,515 | ||||||
|
|
|
|
|
|||||
| Total equity |
1,502,698 | 1,500,886 | ||||||
|
|
|
|
|
|||||
| Total liabilities and equity |
$ | 5,085,698 | $ | 4,588,521 | ||||
|
|
|
|
|
|||||
See accompanying notes to consolidated financial statements.
2
Table of Contents
Blackstone Mortgage Trust, Inc.
Consolidated Statements of Operations (Unaudited)
(in thousands, except share and per share data)
| Three Months Ended March 31, | ||||||||
| 2015 | 2014 | |||||||
| Income from loans and other investments |
||||||||
| Interest and related income |
$ | 63,407 | $ | 33,656 | ||||
| Less: Interest and related expenses |
24,161 | 12,074 | ||||||
|
|
|
|
|
|||||
| Income from loans and other investments, net |
39,246 | 21,582 | ||||||
| Other expenses |
||||||||
| Management and incentive fees |
6,671 | 3,397 | ||||||
| General and administrative expenses |
7,663 | 3,199 | ||||||
|
|
|
|
|
|||||
| Total other expenses |
14,334 | 6,596 | ||||||
| Unrealized gain (loss) on investments at fair value |
17,476 | (1,339 | ) | |||||
| Income from equity investments in unconsolidated subsidiaries |
3,950 | — | ||||||
|
|
|
|
|
|||||
| Income before income taxes |
46,338 | 13,647 | ||||||
| Income tax provision |
245 | 531 | ||||||
|
|
|
|
|
|||||
| Net income |
46,093 | 13,116 | ||||||
|
|
|
|
|
|||||
| Net income attributable to non-controlling interests |
(10,700 | ) | (51 | ) | ||||
|
|
|
|
|
|||||
| Net income attributable to Blackstone Mortgage Trust, Inc. |
$ | 35,393 | $ | 13,065 | ||||
|
|
|
|
|
|||||
| Net income per share of common stock |
||||||||
| Basic |
$ | 0.60 | $ | 0.34 | ||||
|
|
|
|
|
|||||
| Diluted |
$ | 0.60 | $ | 0.34 | ||||
|
|
|
|
|
|||||
| Weighted-average shares of common stock outstanding |
||||||||
| Basic |
58,576,025 | 37,967,365 | ||||||
|
|
|
|
|
|||||
| Diluted |
58,576,025 | 37,967,365 | ||||||
|
|
|
|
|
|||||
| Dividends Declared per share of common stock |
$ | 0.52 | $ | 0.48 | ||||
|
|
|
|
|
|||||
See accompanying notes to consolidated financial statements.
3
Table of Contents
Blackstone Mortgage Trust, Inc.
Consolidated Statements of Comprehensive Income (Unaudited)
(in thousands)
| Three Months Ended March 31, | ||||||||
| 2015 | 2014 | |||||||
| Net income |
$ | 46,093 | $ | 13,116 | ||||
| Other comprehensive income: |
||||||||
| Unrealized (loss) gain on foreign currency remeasurement |
(16,732 | ) | 36 | |||||
|
|
|
|
|
|||||
| Comprehensive income |
29,361 | 13,152 | ||||||
| Comprehensive income attributable to non-controlling interests |
(10,700 | ) | (51 | ) | ||||
|
|
|
|
|
|||||
| Comprehensive income attributable to Blackstone Mortgage Trust, Inc. |
$ | 18,661 | $ | 13,101 | ||||
|
|
|
|
|
|||||
See accompanying notes to consolidated financial statements.
4
Table of Contents
Blackstone Mortgage Trust, Inc.
Consolidated Statements of Changes in Equity (Unaudited)
(in thousands)
| Blackstone Mortgage Trust, Inc. | ||||||||||||||||||||||||||||
| Class A Common Stock |
Additional Paid-In Capital |
Accumulated Other Comprehensive Income (loss) |
Accumulated Deficit |
Stockholders’ Equity |
Non-Controlling Interests |
Total Equity | ||||||||||||||||||||||
| Balance at December 31, 2013 |
$ | 295 | $ | 1,252,986 | $ | 798 | $ | (536,170 | ) | $ | 717,909 | $ | 38,841 | $ | 756,750 | |||||||||||||
| Shares of class A common stock issued, net |
99 | 255,994 | — | — | 256,093 | — | 256,093 | |||||||||||||||||||||
| Restricted class A common stock earned |
(1 | ) | 1,741 | — | — | 1,740 | — | 1,740 | ||||||||||||||||||||
| Deferred directors’ compensation |
— | 139 | — | — | 139 | — | 139 | |||||||||||||||||||||
| Other comprehensive income |
— | — | 36 | — | 36 | — | 36 | |||||||||||||||||||||
| Net income |
— | — | — | 13,065 | 13,065 | 51 | 13,116 | |||||||||||||||||||||
| Dividends declared on common stock |
— | — | — | (18,899 | ) | (18,899 | ) | — | (18,899 | ) | ||||||||||||||||||
| Distributions to non-controlling interests |
— | — | — | — | — | (575 | ) | (575 | ) | |||||||||||||||||||
|
|
|
|
|
|
|
|
|
|
|
|
|
|
|
|||||||||||||||
| Balance at March 31, 2014 |
$ | 393 | $ | 1,510,860 | $ | 834 | $ | (542,004 | ) | $ | 970,083 | $ | 38,317 | $ | 1,008,400 | |||||||||||||
|
|
|
|
|
|
|
|
|
|
|
|
|
|
|
|||||||||||||||
| Balance at December 31, 2014 |
$ | 583 | $ | 2,027,404 | $ | (15,024 | ) | $ | (547,592 | ) | $ | 1,465,371 | $ | 35,515 | $ | 1,500,886 | ||||||||||||
| Shares of class A common stock issued, net |
2 | — | — | — | 2 | — | 2 | |||||||||||||||||||||
| Restricted class A common stock earned |
— | 3,202 | — | — | 3,202 | — | 3,202 | |||||||||||||||||||||
| Dividends reinvested |
— | 60 | — | (57 | ) | 3 | — | 3 | ||||||||||||||||||||
| Deferred directors’ compensation |
— | 94 | — | — | 94 | — | 94 | |||||||||||||||||||||
| Other comprehensive loss |
— | — | (16,732 | ) | — | (16,732 | ) | — | (16,732 | ) | ||||||||||||||||||
| Net income |
— | — | — | 35,393 | 35,393 | 10,700 | 46,093 | |||||||||||||||||||||
| Dividends declared on common stock |
— | — | — | (30,398 | ) | (30,398 | ) | — | (30,398 | ) | ||||||||||||||||||
| Distributions to non-controlling interests |
— | — | — | — | — | (452 | ) | (452 | ) | |||||||||||||||||||
|
|
|
|
|
|
|
|
|
|
|
|
|
|
|
|||||||||||||||
| Balance at March 31, 2015 |
$ | 585 | $ | 2,030,760 | $ | (31,756 | ) | $ | (542,654 | ) | $ | 1,456,935 | $ | 45,763 | $ | 1,502,698 | ||||||||||||
|
|
|
|
|
|
|
|
|
|
|
|
|
|
|
|||||||||||||||
See accompanying notes to consolidated financial statements.
5
Table of Contents
Blackstone Mortgage Trust, Inc.
Consolidated Statements of Cash Flows (Unaudited)
(in thousands)
| Three Months Ended March 31, | ||||||||
| 2015 | 2014 | |||||||
| Cash flows from operating activities |
||||||||
| Net income |
$ | 46,093 | $ | 13,116 | ||||
| Adjustments to reconcile net income to net cash provided by operating activities |
||||||||
| Unrealized (gain) loss on investments at fair value |
(17,476 | ) | 1,339 | |||||
| Income from equity investments in unconsolidated subsidiaries |
(3,950 | ) | — | |||||
| Non-cash compensation expense |
6,104 | 1,970 | ||||||
| Amortization of deferred interest on loans |
(5,717 | ) | (3,470 | ) | ||||
| Amortization of deferred financing costs and premiums/discount on debt obligations |
3,519 | 1,625 | ||||||
| Changes in assets and liabilities, net |
||||||||
| Accrued interest receivable, prepaid expenses, and other assets |
2,021 | (2,051 | ) | |||||
| Accounts payable, accrued expenses, and other liabilities |
1,819 | 2,510 | ||||||
|
|
|
|
|
|||||
| Net cash provided by operating activities |
32,413 | 15,039 | ||||||
|
|
|
|
|
|||||
| Cash flows from investing activities |
||||||||
| Originations and fundings of loans receivable |
(903,152 | ) | (740,236 | ) | ||||
| Origination and exit fees received on loans receivable |
6,078 | 7,121 | ||||||
| Principal collections and proceeds from the sale of loans receivable and other assets |
348,153 | 76,562 | ||||||
| Increase in restricted cash |
(15,299 | ) | (581 | ) | ||||
|
|
|
|
|
|||||
| Net cash used in investing activities |
(564,220 | ) | (657,134 | ) | ||||
|
|
|
|
|
|||||
| Cash flows from financing activities |
||||||||
| Borrowings under revolving repurchase facilities |
588,980 | 760,462 | ||||||
| Repayments under revolving repurchase facilities |
(379,235 | ) | (315,862 | ) | ||||
| Borrowings under asset-specific repurchase agreements |
99,162 | — | ||||||
| Repayments under asset-specific repurchase agreements |
(8,320 | ) | (23,250 | ) | ||||
| Repayment of other liabilities |
— | (787 | ) | |||||
| Proceeds from sales of loan participations |
256,000 | — | ||||||
| Repayment of loan participations |
(28,164 | ) | — | |||||
| Payment of deferred financing costs |
(3,053 | ) | (2,217 | ) | ||||
| Settlement of forward contracts |
4,141 | — | ||||||
| Distributions to non-controlling interests |
(452 | ) | (575 | ) | ||||
| Proceeds from issuance of class A common stock |
3 | 256,093 | ||||||
| Dividends paid on class A common stock |
(30,300 | ) | (13,276 | ) | ||||
|
|
|
|
|
|||||
| Net cash provided by financing activities |
498,762 | 660,588 | ||||||
|
|
|
|
|
|||||
| Net (decrease) increase in cash and cash equivalents |
(33,045 | ) | 18,493 | |||||
| Cash and cash equivalents at beginning of period |
51,810 | 52,342 | ||||||
| Effects of currency translation on cash and cash equivalents |
(291 | ) | (1 | ) | ||||
|
|
|
|
|
|||||
| Cash and cash equivalents at end of period |
$ | 18,474 | $ | 70,834 | ||||
|
|
|
|
|
|||||
| Supplemental disclosure of cash flows information |
||||||||
| Payments of interest |
$ | (18,996 | ) | $ | (7,629 | ) | ||
|
|
|
|
|
|||||
| Payments of income taxes |
$ | (129 | ) | $ | (1,160 | ) | ||
|
|
|
|
|
|||||
| Supplemental disclosure of non-cash investing and financing activities |
||||||||
| Dividends declared, not paid |
$ | (30,398 | ) | $ | (18,899 | ) | ||
|
|
|
|
|
|||||
| Participations sold, net |
$ | 227,836 | $ | — | ||||
|
|
|
|
|
|||||
See accompanying notes to consolidated financial statements.
6
Table of Contents
Blackstone Mortgage Trust, Inc.
Notes to Consolidated Financial Statements
(Unaudited)
1. ORGANIZATION
References herein to “Blackstone Mortgage Trust,” “Company,” “we,” “us” or “our” refer to Blackstone Mortgage Trust, Inc. and its subsidiaries unless the context specifically requires otherwise.
Blackstone Mortgage Trust is a real estate finance company that originates and purchases senior loans collateralized by properties in North America and Europe. We are externally managed by BXMT Advisors L.L.C., or our Manager, a subsidiary of The Blackstone Group L.P., or Blackstone, and are a real estate investment trust, or REIT, traded on the New York Stock Exchange, or NYSE, under the symbol “BXMT.” We are headquartered in New York City.
We conduct our operations as a REIT for U.S. federal income tax purposes. We generally will not be subject to U.S. federal income taxes on our taxable income to the extent that we annually distribute all of our net taxable income to stockholders and maintain our qualification as a REIT. We also operate our business in a manner that permits us to maintain our exemption from registration under the Investment Company Act of 1940, as amended, or the Investment Company Act. We are organized as a holding company and conduct our business primarily through our various subsidiaries.
2. SUMMARY OF SIGNIFICANT ACCOUNTING POLICIES
The accompanying unaudited consolidated financial statements have been prepared in accordance with accounting principles generally accepted in the United States of America, or GAAP, for interim financial information and the instructions to Form 10-Q and Rule 10-01 of Regulation S-X. The consolidated financial statements, including the notes thereto, are unaudited and exclude some of the disclosures required in audited financial statements. Management believes it has made all necessary adjustments, consisting of only normal recurring items, so that the consolidated financial statements are presented fairly and that estimates made in preparing its consolidated financial statements are reasonable and prudent. The operating results presented for interim periods are not necessarily indicative of the results that may be expected for any other interim period or for the entire year. The accompanying unaudited consolidated interim financial statements should be read in conjunction with the audited consolidated financial statements included in our Annual Report on Form 10-K for the fiscal year ended December 31, 2014 filed with the Securities and Exchange Commission.
Basis of Presentation
The accompanying consolidated financial statements include, on a consolidated basis, our accounts, the accounts of our wholly-owned subsidiaries, majority-owned subsidiaries, and variable interest entities, or VIEs, of which we are the primary beneficiary. All intercompany balances and transactions have been eliminated in consolidation. Certain of the assets and credit of our consolidated subsidiaries are not available to satisfy the debt or other obligations of us, our affiliates, or other entities.
One of our subsidiaries, CT Legacy Partners, LLC, or CT Legacy Partners, accounts for its operations in accordance with industry-specific GAAP accounting guidance for investment companies, pursuant to which it reports its investments at fair value. We have retained this accounting treatment in consolidation and, accordingly, report the loans and other investments of CT Legacy Partners at fair value on our consolidated balance sheets.
Certain reclassifications have been made in the presentation of the prior period consolidated statement of cash flows to conform to the current period presentation.
Principles of Consolidation
We consolidate all entities that we control through either majority ownership or voting rights. In addition, we consolidate all VIEs of which we are considered the primarily beneficiary. VIEs are defined as entities in which equity investors (i) do not have the characteristics of a controlling financial interest and/or (ii) do not have sufficient equity at risk for the entity to finance its activities without additional subordinated financial support from other parties. The entity that consolidates a VIE is known as its primary beneficiary and is generally the entity with (i) the power to direct the activities that most significantly affect the VIE’s economic performance and (ii) the right to receive benefits from the VIE or the obligation to absorb losses of the VIE that could be significant to the VIE.
As of December 31, 2014, we no longer had any assets or liabilities on our consolidated balance sheet attributable to a consolidated VIE.
7
Table of Contents
Blackstone Mortgage Trust, Inc.
Notes to Consolidated Financial Statements (continued)
(Unaudited)
Use of Estimates
The preparation of financial statements in conformity with GAAP requires us to make estimates and assumptions that affect the reported amounts of assets and liabilities and disclosure of contingent assets and liabilities as of the date of the consolidated financial statements and the reported amounts of revenues and expenses during the reporting period. Actual results may ultimately differ from those estimates.
Revenue Recognition
Interest income from our loans receivable is recognized over the life of each investment using the effective interest method and is recorded on the accrual basis. Recognition of fees, premiums, discounts, and direct costs associated with these investments is deferred until the loan is advanced and is then recorded over the term of the loan as an adjustment to yield. Income accrual is generally suspended for loans at the earlier of the date at which payments become 90 days past due or when, in the opinion of our Manager, recovery of income and principal becomes doubtful. Income is then recorded on the basis of cash received until accrual is resumed when the loan becomes contractually current and performance is demonstrated to be resumed.
Cash and Cash Equivalents
Cash and cash equivalents represent cash held in banks, cash on hand, and liquid investments with original maturities of three months or less. We may have bank balances in excess of federally insured amounts; however, we deposit our cash and cash equivalents with high credit-quality institutions to minimize credit risk exposure. We have not experienced, and do not expect, any losses on our cash or cash equivalents.
Restricted Cash
We classify the cash balances held by CT Legacy Partners as restricted because, while these cash balances are available for use by CT Legacy Partners for its operations, they cannot be used by us until our allocable share is distributed from CT Legacy Partners and cannot be commingled with any of our unrestricted cash balances.
Loans Receivable and Provision for Loan Losses
We originate and purchase commercial real estate debt and related instruments generally to be held as long-term investments at amortized cost. We are required to periodically evaluate each of these loans for possible impairment. Impairment is indicated when it is deemed probable that we will not be able to collect all amounts due to us pursuant to the contractual terms of the loan. If a loan is determined to be impaired, we write down the loan through a charge to the provision for loan losses. Impairment of these loans, which are collateral dependent, is measured by comparing the estimated fair value of the underlying collateral to the book value of the respective loan. These valuations require significant judgments, which include assumptions regarding capitalization rates, leasing, creditworthiness of major tenants, occupancy rates, availability of financing, exit plan, loan sponsorship, actions of other lenders, and other factors deemed necessary by our Manager. Actual losses, if any, could ultimately differ from these estimates.
Our Manager performs a quarterly review of our portfolio of loans. In conjunction with this review, our Manager assesses the risk factors of each loan, and assigns a risk rating based on a variety of factors, including, without limitation, loan-to-value ratio, debt yield, property type, geographic and local market dynamics, physical condition, cash flow volatility, leasing and tenant profile, loan structure and exit plan, and project sponsorship. Based on a 5-point scale, our loans are rated “1” through “5,” from less risk to greater risk, which ratings are defined as follows:
| 1 | - | Very Low Risk | ||
| 2 | - | Low Risk | ||
| 3 | - | Medium Risk | ||
| 4 | - | High Risk/Potential for Loss: A loan that has a risk of realizing a principal loss. | ||
| 5 | - | Impaired/Loss Likely: A loan that has a very high risk of realizing a principal loss or has otherwise incurred a principal loss. | ||
8
Table of Contents
Blackstone Mortgage Trust, Inc.
Notes to Consolidated Financial Statements (continued)
(Unaudited)
Equity Investments in Unconsolidated Subsidiaries
Our carried interest in CT Opportunity Partners I, LP, or CTOPI, is accounted for using the equity method. CTOPI’s assets and liabilities are not consolidated into our financial statements due to our determination that (i) it is not a VIE and (ii) the other investors in CTOPI have sufficient rights to preclude consolidation by us. As such, we report our allocable percentage of the net assets of CTOPI on our consolidated balance sheets. The recognition of income from CTOPI is generally deferred until cash is collected or appropriate contingencies have been eliminated.
Derivative Financial Instruments
We classify all derivative financial instruments as other assets or other liabilities on our consolidated balance sheets at fair value.
On the date we enter into a derivative contract, we designate each contract as (i) a hedge of a net investment in a foreign operation, or net investment hedge, (ii) a hedge of a forecasted transaction or of the variability of cash flows to be received or paid related to a recognized asset or liability, or cash flow hedge, (iii) a hedge of a recognized asset or liability, or fair value hedge, or (iv) a derivative instrument not to be designated as a hedging derivative, or freestanding derivative. For all derivatives other than those designated as freestanding derivatives, we formally document our hedge relationships and designation at inception. This documentation includes the identification of the hedging instruments and the hedged items, its risk management objectives, strategy for undertaking the hedge transaction and our evaluation of the effectiveness of its hedged transaction.
On a quarterly basis, we also formally assess whether the derivative we designated in each hedging relationship is expected to be, and has been, highly effective in offsetting changes in the value or cash flows of the hedged items. If it is determined that a derivative is not highly effective at hedging the designated exposure, hedge accounting is discontinued. Changes in the fair value of the effective portion of our hedges are reflected in accumulated other comprehensive income (loss) on our consolidated financial statements. Changes in the fair value of the ineffective portion of our hedges are included in net income (loss). Amounts are reclassified out of accumulated other comprehensive income (loss) and into net income (loss) when the hedged item is either sold or substantially liquidated. To the extent a derivative does not qualify for hedge accounting and is deemed a freestanding derivative, the changes in its value are included in net income (loss).
Repurchase Agreements
We record investments financed with repurchase agreements as separate assets and the related borrowings under any repurchase agreements are recorded as separate liabilities on our consolidated balance sheets. Interest income earned on the investments and interest expense incurred on the repurchase agreements are reported separately on our consolidated statements of operations.
Loan Participations Sold
Loan participations sold represent senior interests in certain loans that we sold, however, we present such loan participations sold as liabilities because these arrangements do not qualify as sales under GAAP. These participations are non-recourse and remain on our consolidated balance sheet until the loan is repaid. The gross presentation of loan participations sold does not impact stockholders’ equity or net income.
Convertible Notes
The “Debt with Conversion and Other Options” Topic of the Financial Accounting Standards Board, or FASB, Accounting Standards Codification, or Codification, requires the liability and equity components of convertible debt instruments that may be settled in cash upon conversion, including partial cash settlement, to be separately accounted for in a manner that reflects the issuer’s nonconvertible debt borrowing rate. The initial proceeds from the sale of convertible notes are allocated between a liability component and an equity component in a manner that reflects interest expense at the rate of similar nonconvertible debt that could have been issued at such time. The equity component represents the excess initial proceeds received over the fair value of the liability component of the notes as of the date of issuance. We measured the estimated fair value of the debt component of our convertible notes as of the issuance date based on our nonconvertible debt borrowing rate. The equity component of the convertible notes is reflected within additional paid-in capital on our consolidated balance sheet, and the resulting debt discount is amortized over the period during which the convertible notes are expected to be outstanding (through the maturity date) as additional non-cash interest expense. The additional non-cash interest expense attributable to the convertible notes will increase in subsequent periods through the maturity date as the notes accrete to their par value over the same period.
9
Table of Contents
Blackstone Mortgage Trust, Inc.
Notes to Consolidated Financial Statements (continued)
(Unaudited)
Deferred Financing Costs
The deferred financing costs that are included in accrued interest receivable, prepaid expenses, and other assets on our consolidated balance sheets include issuance and other costs related to our debt obligations. These costs are amortized as interest expense using the effective interest method over the life of the related obligations.
Fair Value of Financial Instruments
The Codification defines fair value, establishes a framework for measuring fair value, and requires certain disclosures about fair value measurements under GAAP. Specifically, this guidance defines fair value based on exit price, or the price that would be received upon the sale of an asset or the transfer of a liability in an orderly transaction between market participants at the measurement date.
The “Fair Value Measurement and Disclosures” Topic of the Codification also establishes a fair value hierarchy that prioritizes and ranks the level of market price observability used in measuring financial instruments. Market price observability is affected by a number of factors, including the type of financial instrument, the characteristics specific to the financial instrument, and the state of the marketplace, including the existence and transparency of transactions between market participants. Financial instruments with readily available quoted prices in active markets generally will have a higher degree of market price observability and a lesser degree of judgment used in measuring fair value.
Financial instruments measured and reported at fair value are classified and disclosed based on the observability of inputs used in the determination, as follows:
| • | Level 1: Generally includes only unadjusted quoted prices that are available in active markets for identical financial instruments as of the reporting date. |
| • | Level 2: Pricing inputs include quoted prices in active markets for similar instruments, quoted prices in less active or inactive markets for identical or similar instruments where multiple price quotes can be obtained, and other observable inputs, such as interest rates, yield curves, credit risks, and default rates. |
| • | Level 3: Pricing inputs are unobservable for the financial instruments and include situations where there is little, if any, market activity for the financial instrument. These inputs require significant judgment or estimation by management of third parties when determining fair value and generally represent anything that does not meet the criteria of Levels 1 and 2. |
The estimated value of each asset reported at fair value using Level 3 inputs is determined by an internal committee composed of members of senior management of our Manager, including our Chief Executive Officer, Chief Financial Officer, and other senior officers.
Certain of our other assets are reported at fair value either (i) on a recurring basis, as of each quarter-end, or (ii) on a nonrecurring basis, as a result of impairment or other events. Our assets that are recorded at fair value are discussed further in Note 12. We generally value our assets recorded at fair value by either (i) discounting expected cash flows based on assumptions regarding the collection of principal and interest and estimated market rates, or (ii) obtaining assessments from third-party dealers. For collateral-dependent loans that are identified as impaired, we measure impairment by comparing our Manager’s estimation of fair value of the underlying collateral, less costs to sell, to the book value of the respective loan. These valuations may require significant judgments, which include assumptions regarding capitalization rates, leasing, creditworthiness of major tenants, occupancy rates, availability of financing, exit plan, loan sponsorship, actions of other lenders, and other factors deemed necessary by our Manager.
We are also required by GAAP to disclose fair value information about financial instruments, that are not otherwise reported at fair value in our consolidated balance sheet, to the extent it is practicable to estimate a fair value for those instruments. These disclosure requirements exclude certain financial instruments and all non-financial instruments.
10
Table of Contents
Blackstone Mortgage Trust, Inc.
Notes to Consolidated Financial Statements (continued)
(Unaudited)
The following methods and assumptions are used to estimate the fair value of each class of financial instruments, for which it is practicable to estimate that value:
| • | Cash and cash equivalents: The carrying amount of cash on deposit and in money market funds approximates fair value. |
| • | Restricted cash: The carrying amount of restricted cash approximates fair value. |
| • | Loans receivable, net: The fair values for these loans were estimated by our Manager taking into consideration factors, including capitalization rates, leasing, occupancy rates, availability and cost of financing, exit plan, sponsorship, actions of other lenders, and indications of market value from other market participants. In the case of impaired loans receivable, fair value was determined based on the lower of amortized cost and the value of the underlying real estate collateral. |
| • | Derivative financial instruments: The fair value of our foreign currency contracts was valued using advice from a third party derivative specialist, based on contractual cash flows and observable inputs comprising foreign currency rates and credit spreads. |
| • | Repurchase obligations: The fair values for these instruments were estimated based on the rate at which a similar credit facility would have currently priced. |
| • | Convertible notes, net: The convertible notes are actively traded and their fair values were obtained using quoted market prices based on recent transactions. |
| • | Participations sold: The fair value of these instruments were estimated based on the value of the related loan receivable asset. |
Income Taxes
Our financial results generally do not reflect provisions for current or deferred income taxes on our REIT taxable income. We believe that we operate in a manner that will continue to allow us to be taxed as a REIT and, as a result, we generally do not expect to pay substantial corporate level taxes other than those payable by our taxable REIT subsidiaries. If we were to fail to meet these requirements, we may be subject to federal, state, and local income tax on current and past income, and penalties. Refer to Note 10 for additional information.
Stock-Based Compensation
Our stock-based compensation consists of awards issued to our Manager and certain of its employees that vest over the life of the awards as well as deferred stock units issued to certain members of our Board of Directors. Stock-based compensation expense is recognized for these awards in net income on a variable basis over the applicable vesting period of the awards, based on the value of our class A common stock. Refer to Note 11 for additional information.
Earnings per Share
Basic earnings per share, or Basic EPS, is computed in accordance with the two-class method and is based on the net earnings allocable to our class A common stock, including restricted class A common stock and deferred stock units, divided by the weighted-average number of shares of class A common stock, including restricted class A common stock and deferred stock units outstanding during the period. Our restricted class A common stock is considered a participating security, as defined by GAAP, and has been included in our Basic EPS under the two-class method as these restricted shares have the same rights as our other shares of class A common stock, including participating in any gains or losses.
Diluted earnings per share, or Diluted EPS, is determined using the treasury stock method, and is based on the net earnings allocable to our class A common stock, including restricted class A common stock and deferred stock units, divided by the weighted-average number of shares of class A common stock, including restricted class A common stock and deferred stock units. Refer to Note 8 for additional discussion of earnings per share.
Foreign Currency
In the normal course of business, we enter into transactions not denominated in United States, or U.S., dollars. Foreign exchange gains and losses arising on such transactions are recorded as a gain or loss in our consolidated
11
Table of Contents
Blackstone Mortgage Trust, Inc.
Notes to Consolidated Financial Statements (continued)
(Unaudited)
statements of operations. In addition, we consolidate entities that have a non-U.S. dollar functional currency. Non-U.S. dollar denominated assets and liabilities are translated to U.S. dollars at the exchange rate prevailing at the reporting date and income, expenses, gains, and losses are translated at the prevailing exchange rate on the dates that they were recorded. Cumulative translation adjustments arising from the translation of non-U.S. dollar denominated subsidiaries are recorded in other comprehensive income.
Underwriting Commissions and Offering Costs
Underwriting commissions and offering costs incurred in connection with common stock offerings are reflected as a reduction of additional paid-in capital. Costs incurred that are not directly associated with the completion of a common stock offering are expensed when incurred.
Segment Reporting
We previously operated our business through two segments, the Loan Origination segment and the CT Legacy Portfolio segment. In the first quarter of 2015, as a result of asset resolutions in our CT Legacy Portfolio, our Manager determined that the CT Legacy Portfolio segment was no longer a distinct and separately managed business. Accordingly, we no longer present segment reporting.
Recent Accounting Pronouncements
In April 2015, the FASB issued ASU 2015-03, “Interest – Imputation of Interest (Subtopic 835-30): Simplifying the Presentation of Debt Issuance Costs,” or ASU 2015-03. ASU 2015-03 simplifies the presentation of debt issuance costs by amending the accounting guidance to require that debt issuance costs related to a recognized debt liability be presented in the balance sheet as a direct deduction from the carrying amount of the related debt liability. The amendments presented in ASU 2015-03 are consistent with the accounting guidance related to debt discounts. ASU 2015-03 is effective for the first interim or annual period beginning after December 15, 2015. Early adoption is permitted, and we are currently assessing the impact of ASU 2015-03 on our consolidated financial statements.
In February 2015, the FASB issued ASU 2015-02, “Consolidation (Topic 810): Amendments to the Consolidation Analysis,” or ASU 2015-02. ASU 2015-02 amends the guidance related to accounting for the consolidation of certain legal entities. The modifications made in ASU 2015-02 impact limited partnerships and similar legal entities, the evaluation of (i) fees paid to a decision maker or a service provider as a variable interest, (ii) fee arrangements, and (iii) related parties on the primary beneficiary determination. ASU 2015-02 is effective for the first interim or annual period beginning after December 15, 2015. We do not anticipate that the adoption of ASU 2015-02 will have a material impact on our consolidated financial statements.
In August 2014, the FASB issued ASU 2014-15, “Presentation of Financial Statements – Going Concern (Subtopic 2015-40): Disclosure of Uncertainties about an Entity’s Ability to Continue as a Going Concern,” or ASU 2014-15. ASU 2014-15 introduces an explicit requirement for management to assess and provide certain disclosures if there is substantial doubt about an entity’s ability to continue as a going concern. ASU 2014-15 is effective for the annual period ending after December 15, 2016. We do not anticipate that the adoption of ASU 2014-15 will have a material impact on our consolidated financial statements.
In June 2014, the FASB issued ASU 2014-11, “Transfers and Servicing (Topic 860): Repurchase-to-Maturity Transactions, Repurchase Financings, and Disclosures,” or ASU 2014-11. ASU 2014-11 amends the accounting guidance for repurchase-to-maturity transactions and repurchase agreements executed as repurchase financings, and requires additional disclosure about certain transactions by the transferor. ASU 2014-11 is effective for certain transactions that qualify for sales treatment for the first interim or annual period beginning after December 15, 2014. The new disclosure requirements for repurchase agreements, securities lending transactions, and repurchase-to-maturity transactions that qualify for secured borrowing treatment is effective for annual periods beginning after December 15, 2014, and for interim periods beginning after March 15, 2015. We have historically recorded our repurchase arrangements as secured borrowings and, accordingly, the adoption of ASU 2014-11 did not have a material impact on our consolidated financial statements.
In May 2014, the FASB issued ASU 2014-09, “Revenue from Contracts with Customers (Topic 606),” or ASU 2014-09. ASU 2014-09 broadly amends the accounting guidance for revenue recognition. ASU 2014-09 is effective for the first interim or annual period beginning after December 15, 2016, and is to be applied prospectively. We do not anticipate that the adoption of ASU 2014-09 will have a material impact on our consolidated financial statements.
12
Table of Contents
Blackstone Mortgage Trust, Inc.
Notes to Consolidated Financial Statements (continued)
(Unaudited)
3. LOANS RECEIVABLE
The following table details overall statistics for our loans receivable portfolio ($ in thousands):
| March 31, 2015 | December 31, 2014 | |||||||
| Number of loans |
60 | 60 | ||||||
| Principal balance |
$ | 4,977,468 | $ | 4,462,897 | ||||
| Net book value |
$ | 4,943,383 | $ | 4,428,500 | ||||
| Unfunded loan commitments(1) |
$ | 550,012 | $ | 513,229 | ||||
| Weighted-average cash coupon(2) |
L+4.26 | % | L+4.36 | % | ||||
| Weighted-average all-in yield(2) |
L+4.68 | % | L+4.81 | % | ||||
| Weighted-average maximum maturity (years)(3) |
3.7 | 3.9 | ||||||
| (1) | Unfunded commitments will primarily be funded to finance property improvements or lease-related expenditures by the borrowers. These future commitments will expire over the next four years. |
| (2) | As of March 31, 2015, our floating rate loans and related liabilities were indexed to the various benchmark rates relevant in each case in terms of currency and payment frequency. Therefore the net exposure to each benchmark rate is in direct proportion to our net assets indexed to that rate. In addition, 8% of our loans earned interest based on LIBOR floors, with an average floor of 0.24%, as of March 31, 2015. In addition to cash coupon, all-in yield includes the amortization of deferred origination fees, loan origination costs, and accrual of both extension and exit fees. |
| (3) | Maximum maturity assumes all extension options are exercised by the borrower, however our loans may be repaid prior to such date. As of March 31, 2015, 83% of our loans are subject to yield maintenance, lock-out provisions, or other prepayment restrictions and 17% are open to repayment by the borrower. |
Activity relating to our loans receivable was ($ in thousands):
| Principal Balance |
Deferred Fees and Other Items |
Net Book Value |
||||||||||
| December 31, 2014 |
$ | 4,462,897 | $ | (34,397 | ) | $ | 4,428,500 | |||||
| Loan fundings |
903,152 | — | 903,152 | |||||||||
| Loan repayments and sales |
(333,113 | ) | — | (333,113 | ) | |||||||
| Unrealized loss on foreign currency translation |
(55,468 | ) | 673 | (54,795 | ) | |||||||
| Deferred origination fees and expenses |
— | (6,078 | ) | (6,078 | ) | |||||||
| Amortization of deferred fees and expenses |
— | 5,717 | 5,717 | |||||||||
|
|
|
|
|
|
|
|||||||
| March 31, 2015 |
$ | 4,977,468 | $ | (34,085 | ) | $ | 4,943,383 | |||||
|
|
|
|
|
|
|
|||||||
13
Table of Contents
Blackstone Mortgage Trust, Inc.
Notes to Consolidated Financial Statements (continued)
(Unaudited)
The tables below detail the types of loans in our loan portfolio, as well as the property type and geographic distribution of the properties securing these loans ($ in thousands):
| March 31, 2015 | December 31, 2014 | |||||||||||||||
| Asset Type |
Net Book Value |
Percentage | Net Book Value |
Percentage | ||||||||||||
| Senior loans(1) |
$ | 4,909,214 | 99 | % | $ | 4,340,586 | 98 | % | ||||||||
| Subordinate loans(2) |
34,169 | 1 | 87,914 | 2 | ||||||||||||
|
|
|
|
|
|
|
|
|
|||||||||
| $ | 4,943,383 | 100 | % | $ | 4,428,500 | 100 | % | |||||||||
|
|
|
|
|
|
|
|
|
|||||||||
| Property Type |
Net Book Value |
Percentage | Net Book Value |
Percentage | ||||||||||||
| Office |
$ | 2,516,133 | 51 | % | $ | 1,878,605 | 42 | % | ||||||||
| Hotel |
1,269,408 | 26 | 1,267,486 | 29 | ||||||||||||
| Multifamily |
414,807 | 8 | 426,094 | 10 | ||||||||||||
| Condominium |
252,065 | 5 | 315,686 | 7 | ||||||||||||
| Retail |
218,620 | 4 | 270,812 | 6 | ||||||||||||
| Other |
272,350 | 6 | 269,817 | 6 | ||||||||||||
|
|
|
|
|
|
|
|
|
|||||||||
| $ | 4,943,383 | 100 | % | $ | 4,428,500 | 100 | % | |||||||||
|
|
|
|
|
|
|
|
|
|||||||||
| Geographic Location |
Net Book Value |
Percentage | Net Book Value |
Percentage | ||||||||||||
| United States |
||||||||||||||||
| Northeast |
$ | 1,508,339 | 31 | % | $ | 1,383,258 | 31 | % | ||||||||
| West |
756,791 | 15 | 628,275 | 14 | ||||||||||||
| Southeast |
666,938 | 13 | 657,484 | 15 | ||||||||||||
| Northwest |
416,234 | 8 | 138,796 | 3 | ||||||||||||
| Midwest |
389,586 | 8 | 335,406 | 8 | ||||||||||||
| Southwest |
377,964 | 8 | 405,741 | 9 | ||||||||||||
|
|
|
|
|
|
|
|
|
|||||||||
| Subtotal |
4,115,852 | 83 | 3,548,960 | 80 | ||||||||||||
| International |
||||||||||||||||
| United Kingdom |
603,306 | 12 | 622,692 | 14 | ||||||||||||
| Canada |
117,355 | 2 | 137,024 | 3 | ||||||||||||
| Spain |
76,954 | 2 | 86,289 | 2 | ||||||||||||
| Netherlands |
29,916 | 1 | 33,535 | 1 | ||||||||||||
|
|
|
|
|
|
|
|
|
|||||||||
| Subtotal |
827,531 | 17 | 879,540 | 20 | ||||||||||||
|
|
|
|
|
|
|
|
|
|||||||||
| Total |
$ | 4,943,383 | 100 | % | $ | 4,428,500 | 100 | % | ||||||||
|
|
|
|
|
|
|
|
|
|||||||||
| (1) | Includes senior mortgages and similar credit quality loans, including related contiguous subordinate loans, and pari passu participations in senior mortgage loans. |
| (2) | Includes subordinate interests in mortgages and mezzanine loans. |
14
Table of Contents
Blackstone Mortgage Trust, Inc.
Notes to Consolidated Financial Statements (continued)
(Unaudited)
Loan Risk Ratings
As further described in Note 2, our Manager evaluates our loan portfolio on a quarterly basis. In conjunction with our quarterly loan portfolio review, our Manager assesses the risk factors of each loan, and assigns a risk rating based on several factors. Factors considered in the assessment include, but are not limited to, risk of loss, current LTV, collateral performance, structure, exit plan, and sponsorship. Loans are rated “1” (less risk) through “5” (greater risk), which ratings are defined in Note 2.
The following table allocates the principal balance and net book value of our loans receivable based on our internal risk ratings ($ in thousands):
| March 31, 2015 | December 31, 2014 | |||||||||||||||||||||||
| Risk Rating |
Number of Loans |
Principal Balance |
Net Book Value |
Number of Loans |
Principal Balance |
Net Book Value |
||||||||||||||||||
| 1 |
4 | $ | 405,957 | $ | 401,840 | 5 | $ | 209,961 | $ | 209,112 | ||||||||||||||
| 2 |
45 | 3,741,108 | 3,717,453 | 44 | 3,339,972 | 3,313,906 | ||||||||||||||||||
| 3 |
11 | 830,403 | 824,090 | 11 | 912,964 | 905,482 | ||||||||||||||||||
| 4 - 5 |
— | — | — | — | — | — | ||||||||||||||||||
|
|
|
|
|
|
|
|
|
|
|
|
|
|||||||||||||
| 60 | $ | 4,977,468 | $ | 4,943,383 | 60 | $ | 4,462,897 | $ | 4,428,500 | |||||||||||||||
|
|
|
|
|
|
|
|
|
|
|
|
|
|||||||||||||
We do not have any loan impairments, nonaccrual loans, or loans in maturity default as of March 31, 2015 or December 31, 2014.
4. EQUITY INVESTMENTS IN UNCONSOLIDATED SUBSIDIARIES
As of March 31, 2015, our equity investments in unconsolidated subsidiaries consisted solely of our carried interest in CTOPI, a fund sponsored and managed by an affiliate of our Manager. Activity relating to our equity investments in unconsolidated subsidiaries was ($ in thousands):
| CTOPI Carried Interest |
||||
| Total as of December 31, 2014 |
$ | 10,604 | ||
| Deferred income allocation(1) |
966 | |||
|
|
|
|||
| Total as of March 31, 2015 |
$ | 11,570 | ||
|
|
|
|||
| (1) | In instances where we have not received cash or all appropriate contingencies have not been eliminated, we have deferred the recognition of promote revenue allocated to us from CTOPI in respect of our carried interest in CTOPI, and recorded an offsetting liability as a component of accounts payable, accrued expenses, and other liabilities on our consolidated balance sheets. |
Our carried interest in CTOPI entitles us to earn promote revenue in an amount equal to 17.7% of the fund’s profits, after a 9% preferred return and 100% return of capital to the CTOPI partners. As of March 31, 2015, we had been allocated $11.6 million of promote revenue from CTOPI based on a hypothetical liquidation of the fund at its net asset value. Accordingly, we have recognized this allocation as an equity investment in CTOPI on our consolidated balance sheets. Generally, we defer recognition of income from CTOPI until cash is received or earned, pending distribution, and appropriate contingencies have been eliminated. During the three months ended March 31, 2015, we recognized $3.9 million of promote income from CTOPI in respect of our carried interest and recorded such amount as income in our consolidated statement of operations. This carried interest was earned and was available in cash at CTOPI pending distribution as of March 31, 2015.
CTOPI Incentive Management Fee Grants
In January 2011, we created a management compensation pool for employees equal to 45% of the CTOPI promote distributions received by us. As of March 31, 2015, we had granted 96% of the pool, and the remainder was unallocated. If any awards remain unallocated at the time promote distributions are received by us, any amounts otherwise payable to the unallocated awards will be distributed pro rata to the plan participants then employed by an affiliate of our Manager.
15
Table of Contents
Blackstone Mortgage Trust, Inc.
Notes to Consolidated Financial Statements (continued)
(Unaudited)
Approximately 65% of these grants have the following vesting schedule: (i) one-third on the date of grant; (ii) one-third on September 13, 2012; and (iii) the remainder is contingent on continued employment with an affiliate of our Manager and upon our receipt of promote distributions from CTOPI. Of the remaining 35% of these grants, 31% are fully vested as a result of an acceleration event, and 4% vest solely upon our receipt of promote distributions from CTOPI or the disposition of certain investments owned by CTOPI.
During the three months ended March 31, 2015, we accrued $1.8 million under the CTOPI incentive plan, which amount was recognized as a component of general and administrative expenses in our consolidated statement of operations.
5. SECURED FINANCINGS
As of March 31, 2015, our secured financings included revolving repurchase facilities, asset-specific financings, and senior loan participations sold. During the three months ended March 31, 2015, we increased the maximum facility size of three of our revolving repurchase facilities, entered into one asset-specific repurchase agreement, and sold one senior loan participation, providing an additional $1.1 billion of credit capacity.
Repurchase Agreements
Revolving Repurchase Facilities
The following table details our revolving repurchase facilities ($ in thousands):
| March 31, 2015 | Dec. 31, 2014 Borrowings Outstanding |
|||||||||||||||||||||||
| Maximum Facility Size(1) |
Collateral Assets(2) |
Repurchase Borrowings(3) | ||||||||||||||||||||||
| Lender |
Potential | Outstanding | Available | |||||||||||||||||||||
| Wells Fargo |
$ | 1,000,000 | $ | 837,372 | $ | 654,656 | $ | 515,103 | $ | 139,553 | $ | 484,365 | ||||||||||||
| JP Morgan(4) |
739,147 | 741,916 | 580,899 | 513,813 | 67,086 | 341,487 | ||||||||||||||||||
| Bank of America |
750,000 | 501,041 | 397,700 | 397,033 | 667 | 389,347 | ||||||||||||||||||
| MetLife |
750,000 | 527,611 | 409,178 | 347,943 | 61,235 | 305,889 | ||||||||||||||||||
| Citibank |
500,000 | 625,053 | 474,103 | 340,511 | 133,592 | 392,455 | ||||||||||||||||||
| Morgan Stanley(5) |
370,250 | 171,590 | 135,125 | 127,227 | 7,898 | 127,240 | ||||||||||||||||||
|
|
|
|
|
|
|
|
|
|
|
|
|
|||||||||||||
| $ | 4,109,397 | $ | 3,404,583 | $ | 2,651,661 | $ | 2,241,630 | $ | 410,031 | $ | 2,040,783 | |||||||||||||
|
|
|
|
|
|
|
|
|
|
|
|
|
|||||||||||||
| (1) | Maximum facility size represents the total amount of borrowings in each repurchase agreement, however these borrowings are only available to us once sufficient collateral assets have been pledged under each facility at the discretion of the lender. |
| (2) | Represents the principal balance of the collateral assets. |
| (3) | Potential borrowings represent the total amount we could draw under each facility based on collateral already approved and pledged. When undrawn, these amounts are immediately available to us at our sole discretion under the terms of each revolving credit facility. |
| (4) | The JP Morgan maximum facility size is composed of a $250.0 million facility and a £153.0 million ($226.6 million) facility, and $262.5 million related solely to a specific asset with a repurchase date of January 9, 2018. |
| (5) | The Morgan Stanley maximum facility size represents a £250.0 million ($370.3 million) facility. |
The weighted-average outstanding balance of our revolving repurchase facilities was $2.3 billion for the three months ended March 31, 2015. As of March 31, 2015, we had aggregate borrowings of $2.2 billion outstanding under our revolving repurchase facilities, with a weighted-average cash coupon of LIBOR plus 1.87% per annum and a weighted-average all-in cost of credit, including associated fees and expenses, of LIBOR plus 2.09% per annum. As of March 31, 2015, outstanding borrowings under these facilities had a weighted-average maturity, excluding extension options and term-out provisions, of 1.7 years. Borrowings under each facility are subject to the initial approval of eligible collateral loans by the lender and the maximum advance rate and pricing rate of individual advances are determined with reference to the attributes of the respective collateral loan.
16
Table of Contents
Blackstone Mortgage Trust, Inc.
Notes to Consolidated Financial Statements (continued)
(Unaudited)
The following table outlines the key terms of our revolving repurchase facilities:
| Lender |
Rate(1)(2) |
Guarantee(1)(3) | Advance Rate(1) | Margin Call(4) |
Term/Maturity | |||||
| Wells Fargo |
L+1.82% | 25% | 79.18% | Collateral marks only | Term matched(5) | |||||
| JP Morgan |
L+1.87% | 25% | 80.09% | Collateral marks only | Term matched(5)(6) | |||||
| Bank of America |
L+1.80% | 50% | 79.54% | Collateral marks only | May 21, 2019(7) | |||||
| MetLife |
L+1.81% | 50% | 77.82% | Collateral marks only | February 24, 2021(8) | |||||
| Citibank |
L+1.92% | 25% | 76.64% | Collateral marks only | Term matched(5) | |||||
| Morgan Stanley |
L+2.32% | 25% | 78.75% | Collateral marks only | March 3, 2017 |
| (1) | Represents a weighted-average based on collateral assets pledged and borrowings outstanding as of March 31, 2015. |
| (2) | Represents weighted-average cash coupon on borrowings outstanding as of March 31, 2015. As of March 31, 2015, our floating rate loans and related liabilities were indexed to the various benchmark rates relevant in each case in terms of currency and payment frequency. Therefore the net exposure to each benchmark rate is in direct proportion to our net assets indexed to that rate. |
| (3) | Other than amounts guaranteed based on specific collateral asset types, borrowings under our revolving repurchase facilities are not recourse to us. |
| (4) | Margin call provisions under our revolving repurchase facilities do not permit valuation adjustments based on capital markets activity, and are limited to collateral-specific credit marks. |
| (5) | These revolving repurchase facilities have various availability periods during which new advances can be made and which are generally subject to each lender’s discretion. Maturity dates for advances outstanding are tied to the term of each respective collateral asset. |
| (6) | Borrowings denominated in British pound sterling under this facility mature on January 7, 2018. |
| (7) | Includes two one-year extension options which may be exercised at our sole discretion. |
| (8) | Includes five one-year extension options which may be exercised at our sole discretion. |
Asset-Specific Repurchase Agreements
The following table details statistics for our asset-specific repurchase agreements ($ in thousands):
| March 31, 2015 | December 31, 2014 | |||||||||||||||
| Repurchase Agreements |
Collateral Assets |
Repurchase Agreements |
Collateral Assets |
|||||||||||||
| Number of loans |
4 | 5 | 3 | 4 | ||||||||||||
| Principal balance |
$ | 407,203 | $ | 539,043 | $ | 324,553 | $ | 429,197 | ||||||||
| Weighted-average cash coupon(1) |
L+2.75 | % | L+5.21 | % | L+2.68 | % | L+5.07 | % | ||||||||
| Weighted-average cost / all-in yield(1) |
L+3.20 | % | L+5.70 | % | L+3.16 | % | L+5.53 | % | ||||||||
| (1) | As of March 31, 2015, our floating rate loans and related liabilities were indexed to the various benchmark rates relevant in each case in terms of currency and payment frequency. Therefore the net exposure to each benchmark rate is in direct proportion to our net assets indexed to that rate. In addition to cash coupon, all-in yield / cost includes the amortization of deferred origination fees / financing costs. |
The weighted-average outstanding balance of our asset-specific repurchase agreements was $338.6 million for the three months ended March 31, 2015.
Debt Covenants
Each of the guarantees related to our revolving repurchase facilities and asset-specific repurchase agreements contain the following uniform financial covenants: (i) our ratio of earnings before interest, taxes, depreciation, and amortization, or EBITDA, to fixed charges shall be not less than 1.40 to 1.0; (ii) our tangible net worth, as defined in the agreements, shall not be less than $1.1 billion as of March 31, 2015 plus 75% of the net cash proceeds of future equity issuances subsequent to March 31, 2015; (iii) cash liquidity shall not be less than the greater of (x) $10.0 million or (y) 5% of our recourse indebtedness; and (iv) our indebtedness shall not exceed 83.33% of our total assets. As of March 31, 2015 and December 31, 2014, we were in compliance with these covenants.
17
Table of Contents
Blackstone Mortgage Trust, Inc.
Notes to Consolidated Financial Statements (continued)
(Unaudited)
Loan Participations Sold
The financing of a loan by the non-recourse sale of a senior interest in the loan through a participation agreement does not qualify as a sale under GAAP. Therefore, in the instance of such sales, we present the whole loan as an asset and the loan participation sold as a liability on our consolidated balance sheet until the loan is repaid. The gross presentation of loan participations sold does not impact stockholders’ equity or net income.
The following table details statistics for our loan participations sold ($ in thousands):
| March 31, 2015 | December 31, 2014 | |||||||||||||||
| Participations Sold |
Underlying Loans |
Participations Sold |
Underlying Loans |
|||||||||||||
| Number of loans |
4 | 4 | 4 | 4 | ||||||||||||
| Principal balance |
$ | 708,845 | $ | 879,043 | $ | 499,433 | $ | 635,701 | ||||||||
| Weighted-average cash coupon(1) |
L+2.40 | % | L+4.06 | % | L+2.51 | % | L+4.10 | % | ||||||||
| Weighted-average all-in cost / yield(1) |
L+2.68 | % | L+4.36 | % | L+2.71 | % | L+4.71 | % | ||||||||
| (1) | As of March 31, 2015, our floating rate loans and related liabilities were indexed to the various benchmark rates relevant in each case in terms of currency and payment frequency. Therefore the net exposure to each benchmark rate is in direct proportion to our net assets indexed to that rate. In addition to cash coupon, all-in cost / yield includes the amortization of deferred origination fees / financing costs. |
6. CONVERTIBLE NOTES, NET
In November 2013, we issued $172.5 million of 5.25% convertible senior notes due on December 1, 2018, or Convertible Notes. The Convertible Notes’ issuance costs are amortized through interest expense over the life of the Convertible Notes using the effective interest method. Including this amortization, our all-in cost of the Convertible Notes is 5.87% per annum. As of March 31, 2015, the Convertible Notes were carried on our consolidated balance sheet at $162.5 million, net of an unamortized discount of $6.9 million.
The Convertible Notes are convertible at the holders’ option into shares of our class A common stock, only under specific circumstances, prior to the close of business on August 31, 2018, at the applicable conversion rate in effect on the conversion date. Thereafter, the Convertible Notes are convertible at the option of the holder at any time until the second scheduled trading day immediately preceding the maturity date. The Convertible Notes were not convertible as of March 31, 2015. The conversion rate was initially set to equal 34.8943 shares of class A common stock per $1,000 principal amount of Convertible Notes, which is equivalent to an initial conversion price of $28.66 per share of class A common stock, subject to adjustment upon the occurrence of certain events. We may not redeem the Convertible Notes prior to maturity. As of March 31, 2015, the conversion option value was zero based on the price of our class A common stock of $28.37. In addition, we had the intent and ability to settle the Convertible Notes in cash. As a result, the Convertible Notes did not have any impact on our diluted earnings per share.
We recorded a $9.1 million discount upon issuance of the Convertible Notes based on the implied value of the conversion option and an assumed effective interest rate of 6.50%. Including the amortization of this discount and the issuance costs, our total cost of the Convertible Notes is 7.16% per annum. During the three months ended March 31, 2015, we incurred total interest on our convertible notes of $2.9 million, of which $2.3 million related to cash coupon and $630,000 related to the amortization of discount and certain issuance costs. During the three months ended March 31, 2014, we incurred total interest on our convertible notes of $2.9 million, of which $2.3 million related to cash coupon and $592,000 related to the amortization of discount and certain issuance costs. Refer to Note 2 for additional discussion of our accounting policies for the Convertible Notes.
7. DERIVATIVE FINANCIAL INSTRUMENTS
We enter into derivative financial instruments to achieve certain risk management objectives. Currently, we use derivative financial instruments to manage, or hedge, the variability in the carrying value of certain of our net investments in consolidated, foreign currency-denominated subsidiaries caused by the fluctuations in foreign currency exchange rates. For derivatives that are designated and qualify as a hedge of net investment in a foreign currency, the gain or loss is reported in other comprehensive income as part of the cumulative translation adjustment to the extent it is effective. Any ineffective portion of a net investment hedge is recognized in the consolidated statement of operations. For derivatives that are not designated as hedging instruments, the gain or loss is recognized in the consolidated statement of operations during the current period.
18
Table of Contents
Blackstone Mortgage Trust, Inc.
Notes to Consolidated Financial Statements (continued)
(Unaudited)
As of and during the three months ended March 31, 2015, we had net investment hedges related to our investment in a Canadian dollar-denominated subsidiary which consisted of two forward contracts to sell Canadian dollars for United States dollars at agreed upon rates in May 2015. These foreign currency contracts had an aggregate notional value of CAD 44.0 million, and a fair value of $351,000 which is included as a component of accrued interest receivable, prepaid expenses, and other assets on our consolidated balance sheet. In addition, we had offsetting contracts to both sell and buy Canadian dollars in an amount of CAD 4.46 million in exchange for United States dollars in May 2015. The purpose of this contract was to effectively terminate part of a pre-existing contract. Due to the fact that these contracts offset, there was no gain or loss recognized in the consolidated statement of operations related to these contracts.
The following table summarizes the fair value of our derivative financial instruments ($ in thousands):
| Fair Value of Derivatives in an Asset Position as of(1) |
Fair Value of Derivatives in a Liability Position as of(2) |
|||||||||||||||
| March 31, 2015 | December 31, 2014 | March 31, 2015 | December 31, 2014 | |||||||||||||
| Derivatives designated as hedging instruments: |
||||||||||||||||
| Foreign exchange contracts |
$ | 351 | $ | 1,138 | $ | — | $ | — | ||||||||
|
|
|
|
|
|
|
|
|
|||||||||
| Total derivatives designated as hedging instruments |
351 | 1,138 | — | — | ||||||||||||
|
|
|
|
|
|
|
|
|
|||||||||
| Derivatives not designated as hedging instruments: |
||||||||||||||||
| Foreign exchange contracts(3) |
36 | — | 52 | — | ||||||||||||
|
|
|
|
|
|
|
|
|
|||||||||
| Total derivatives not designated as hedging instruments |
— | — | 52 | — | ||||||||||||
|
|
|
|
|
|
|
|
|
|||||||||
| Total Derivatives |
$ | 387 | $ | 1,138 | $ | 52 | $ | — | ||||||||
|
|
|
|
|
|
|
|
|
|||||||||
| (1) | Included in accrued interest receivable, prepaid expenses, and other assets in our consolidated balance sheet. |
| (2) | Included in accounts payable, accrued expenses, and other liabilities in our consolidated balance sheet. |
| (3) | Balances represent offsetting contracts with the same counterparty, both with a settlement date of May 11, 2015. |
The following table summarizes the impact of our derivative financial instruments on our consolidated statement of operations and consolidated statement of comprehensive income for the three months ended March 31, 2015 and 2014 ($ in thousands):
| Derivatives in Net Investment Hedging Relationships |
Amount of Gain (Loss) Recognized in OCI on Derivative (Effective Portion)(1) |
Location of Gain (Loss) Reclassified from Accumulated OCI into Income (Effective Portion) |
Amount of Gain (Loss) Reclassified from Accumulated OCI into Income (Effective Portion) |
|||||||||||||||
| 2015 | 2014 | 2015 | 2014 | |||||||||||||||
| Foreign Exchange contracts |
$ | 3,337 | $ | — | Gain (Loss) on Sale of Subsidiary |
$ | — | $ | — | |||||||||
|
|
|
|
|
|
|
|
|
|||||||||||
| Total |
$ | 3,337 | $ | — | $ | — | $ | — | ||||||||||
|
|
|
|
|
|
|
|
|
|||||||||||
| (1) | During the three months ended March 31, 2015 we received a cash settlement of $4.1 million on our foreign currency forward contracts. |
We have entered into agreements with certain of our derivative counterparties that contain provisions where if we were to default on any of our indebtedness, including default where repayment of the indebtedness has not been accelerated by the lender, we may also be declared in default on our derivative obligations. In addition, certain of our agreements with our derivative counterparties require that we post collateral to secure net liability positions. As of March 31, 2015, we were in net asset positions with all of our derivative counterparties.
19
Table of Contents
Blackstone Mortgage Trust, Inc.
Notes to Consolidated Financial Statements (continued)
(Unaudited)
8. EQUITY
Share and Share Equivalents
Authorized Capital
As of March 31, 2015, we had the authority to issue up to 200,000,000 shares of stock, consisting of 100,000,000 shares of class A common stock and 100,000,000 shares of preferred stock. Subject to applicable NYSE listing requirements, our board of directors is authorized to cause us to issue additional shares of authorized stock without stockholder approval. In addition, to the extent not issued, currently authorized stock may be reclassified between class A common stock and preferred stock. We do not have any shares of preferred stock issued and outstanding as of March 31, 2015. Refer to Note 15 for additional discussion of our authorized capital.
Class A Common Stock and Deferred Stock Units
Holders of shares of our class A common stock are entitled to vote on all matters submitted to a vote of stockholders and are entitled to receive such dividends as may be authorized by our board of directors and declared by us, in all cases subject to the rights of the holders of shares of outstanding preferred stock, if any.
We also issue restricted class A common stock under our stock-based incentive plans. Refer to Note 11 for additional discussion of these long-term incentive plans.
In addition to our class A common stock, we also issue deferred stock units to certain members of our board of directors in lieu of cash compensation for services rendered. These deferred stock units are non-voting, but carry the right to receive dividends in the form of additional deferred stock units in an amount equivalent to the cash dividends paid to holders of shares of class A common stock.
The following table details the movement in our outstanding shares of class A common stock, including restricted class A common stock and deferred stock units:
| Three Months Ended March 31, | ||||||||
| Common Stock Outstanding(1) |
2015 | 2014 | ||||||
| Beginning balance |
58,388,808 | 29,602,884 | ||||||
| Issuance of class A common stock |
139 | 9,775,000 | ||||||
| Issuance of restricted class A common stock, net |
181,049 | — | ||||||
| Issuance of deferred stock units |
5,414 | 4,955 | ||||||
|
|
|
|
|
|||||
| Ending balance |
58,575,410 | 39,382,839 | ||||||
|
|
|
|
|
|||||
| (1) | Deferred stock units held by members of our board of directors totalled 124,333 and 106,188 as of March 31, 2015 and 2014, respectively. |
Dividend Reinvestment and Direct Stock Purchase Plan
On March 25, 2014, we adopted a dividend reinvestment and direct stock purchase plan, under which we registered and reserved for issuance, in the aggregate, 10,000,000 shares of class A common stock. Under the dividend reinvestment component of this plan, our class A common stockholders can designate all or a portion of their cash dividends to be reinvested in additional shares of class A common stock. The direct stock purchase component allows stockholders and new investors, subject to our approval, to purchase shares of class A common stock directly from us. During the three months ended March 31, 2015, we issued 139 shares of class A common stock under the dividend reinvestment component and zero shares under the direct stock purchase plan component. As of March 31, 2015, 9,999,855 shares of class A common stock, in the aggregate, remain available for issuance under the dividend reinvestment and direct stock purchase plan.
At the Market Stock Offering Program
On May 9, 2014, we entered into equity distribution agreements, or ATM Agreements, pursuant to which we may sell, from time to time, up to an aggregate sales price of $200.0 million of our class A common stock. Sales of class A common stock made pursuant to the ATM Agreements, if any, may be made in negotiated transactions or transactions that are deemed to be “at the market” offerings as defined in Rule 415 under the Securities Act of 1933, as amended. Actual sales will depend on a variety of factors including market conditions, the trading price of our
20
Table of Contents
Blackstone Mortgage Trust, Inc.
Notes to Consolidated Financial Statements (continued)
(Unaudited)
class A common stock, our capital needs, and our determination of the appropriate sources of funding to meet such needs. We did not sell any shares of our class A common stock under the ATM Agreements during the three months ended March 31, 2015. As of March 31, 2015, sales of our class A common stock with an aggregate sales price of $197.2 million remain available for issuance under the ATM Agreements.
Dividends
We generally intend to distribute substantially all of our taxable income, which does not necessarily equal net income as calculated in accordance with GAAP, to our stockholders each year to comply with the REIT provisions of the Internal Revenue Code of 1986, as amended, or the Internal Revenue Code.
Our dividend policy remains subject to revision at the discretion of our board of directors. All distributions will be made at the discretion of our board of directors and will depend upon our taxable income, our financial condition, our maintenance of REIT status, applicable law, and other factors as our board of directors deems relevant.
On March 16, 2015, we declared a dividend of $0.52 per share, or $30.4 million, which was paid on April 15, 2015 to stockholders of record as of March 31, 2015. On March 14, 2014, we declared dividends of $0.48 per share, or $18.9 million, which was paid on April 15, 2014 to stockholders of record as of March 31, 2014.
Earnings Per Share
We calculate our basic and diluted earnings per share using the two-class method for all periods presented as the unvested shares of our restricted class A common stock qualify as participating securities, as defined by GAAP. These restricted shares have the same rights as our other shares of class A common stock, including participating in any gains and losses, and therefore have been included in our basic and diluted net income per share calculation.
The following table sets forth the calculation of basic and diluted net income per share of class A common stock based on the weighted-average of both restricted and unrestricted class A common stock outstanding for the indicated periods ($ in thousands, except per share data):
| Three Months Ended March 31, | ||||||||
| 2015 | 2014 | |||||||
| Net income(1) |
$ | 35,393 | $ | 13,065 | ||||
| Weighted-average shares outstanding, basic and diluted |
58,576,025 | 37,967,365 | ||||||
|
|
|
|
|
|||||
| Per share amount, basic and diluted |
$ | 0.60 | $ | 0.34 | ||||
|
|
|
|
|
|||||
| (1) | Represents net income attributable to Blackstone Mortgage Trust, Inc. |
Other Balance Sheet Items
Accumulated Other Comprehensive Loss
As of March 31, 2015, total accumulated other comprehensive loss was $31.8 million, representing the cumulative currency translation adjustment on assets and liabilities denominated in foreign currencies. As of December 31, 2014, total accumulated other comprehensive loss was $15.0 million, representing the cumulative currency translation adjustment on assets and liabilities denominated in a foreign currency.
Non-controlling Interests
The non-controlling interests included on our consolidated balance sheets represent the equity interests in CT Legacy Partners that are not owned by us. A portion of CT Legacy Partners’ consolidated equity and results of operations are allocated to these non-controlling interests based on their pro rata ownership of CT Legacy Partners. As of March 31, 2015, CT Legacy Partners’ total equity was $78.4 million, of which $32.6 million was owned by Blackstone Mortgage Trust, Inc., and $45.8 million was allocated to non-controlling interests.
21
Table of Contents
Blackstone Mortgage Trust, Inc.
Notes to Consolidated Financial Statements (continued)
(Unaudited)
9. OTHER EXPENSES
Our other expenses consist of the management and incentive fees we pay to our Manager and our general and administrative expenses.
Management and Incentive Fees
Pursuant to our management agreement, our Manager earns a base management fee in an amount equal to 1.50% per annum multiplied by our outstanding Equity balance, as defined in the management agreement. In addition, our Manager is entitled to an incentive fee in an amount equal to the product of (i) 20% and (ii) the excess of (a) our Core Earnings (as defined in the management agreement) for the previous 12-month period over (b) an amount equal to 7.00% per annum multiplied by our outstanding Equity, provided that our Core Earnings over the prior three-year period (or the period since the date of the first offering of our class A common stock following December 19, 2012, whichever is shorter) is greater than zero. Core Earnings is generally equal to our net income (loss) prepared in accordance with GAAP, excluding (i) certain non-cash items and (ii) the net income (loss) related to our legacy portfolio.
During the three months ended March 31, 2015 and 2014, we incurred $5.5 million and $3.4 million of management fees payable to our Manager, respectively. During the three months ended March 31, 2015, we incurred $1.2 million of incentive fees payable to our Manager. We did not incur any incentive fees payable to our Manager during the three months ended March 31, 2014.
General and Administrative Expenses
General and administrative expenses consisted of the following ($ in thousands):
| Three Months Ended | ||||||||
| March 31, | ||||||||
| 2015 | 2014 | |||||||
| Professional services |
$ | 795 | $ | 525 | ||||
| Operating and other costs |
764 | 570 | ||||||
|
|
|
|
|
|||||
| 1,559 | 1,095 | |||||||
|
|
|
|
|
|||||
| Non-cash and CT Legacy Portfolio compensation expenses |
||||||||
| Management incentive awards plan - CTOPI(1) |
1,777 | — | ||||||
| Management incentive awards plan - CT Legacy Partners(2) |
1,030 | 136 | ||||||
| Restricted class A common stock earned |
3,203 | 1,740 | ||||||
| Director stock-based compensation |
94 | 94 | ||||||
|
|
|
|
|
|||||
| 6,104 | 1,970 | |||||||
|
|
|
|
|
|||||
| Expenses of consolidated securitization vehicles |
— | 134 | ||||||
|
|
|
|
|
|||||
| $ | 7,663 | $ | 3,199 | |||||
|
|
|
|
|
|||||
| (1) | Represents the portion of CTOPI promote revenue accrued under compensation awards. See Note 4 for further discussion. |
| (2) | Represents the accrual of amounts payable under the CT Legacy Partners management incentive awards during the period. See below for discussion of the CT Legacy Partners management incentive awards plan. |
CT Legacy Partners Management Incentive Awards Plan
In conjunction with our March 2011 restructuring, we created an employee pool for up to 6.75% of the distributions paid to the common equity holders of CT Legacy Partners (subject to certain caps and priority distributions). As of March 31, 2015, incentive awards for 94% of the pool have been granted, and the remainder was unallocated. If any awards remain unallocated at the time distributions are paid, any amounts otherwise payable to the unallocated awards will be distributed pro rata to the plan participants then employed by an affiliate of our Manager.
Approximately 53% of these grants have the following vesting schedule: (i) 25% on the date of grant; (ii) 25% in March 2013; (iii) 25% in March 2014; and (iv) the remainder is contingent on continued employment with an
22
Table of Contents
Blackstone Mortgage Trust, Inc.
Notes to Consolidated Financial Statements (continued)
(Unaudited)
affiliate of our Manager and our receipt of distributions from CT Legacy Partners. Of the remaining 47% of these grants, 29% are fully vested as a result of an acceleration event, and 18% vest only upon our receipt of distributions from CT Legacy Partners.
We accrue a liability for the amounts due under these grants based on the value of CT Legacy Partners and the periodic vesting of the awards granted. Accrued payables for these awards were $3.8 million and $2.8 million as of March 31, 2015 and December 31, 2014, respectively.
10. INCOME TAXES
We elected to be taxed as a REIT, effective January 1, 2003, under the Internal Revenue Code for U.S. federal income tax purposes. We generally must distribute annually at least 90% of our net taxable income, subject to certain adjustments and excluding any net capital gain, in order for U.S. federal income tax not to apply to our earnings that we distribute. To the extent that we satisfy this distribution requirement, but distribute less than 100% of our net taxable income, we will be subject to U.S. federal income tax on our undistributed taxable income. In addition, we will be subject to a 4% nondeductible excise tax if the actual amount that we pay out to our stockholders in a calendar year is less than a minimum amount specified under U.S. federal tax laws.
Our qualification as a REIT also depends on our ability to meet various other requirements imposed by the Internal Revenue Code, which relate to organizational structure, diversity of stock ownership, and certain restrictions with regard to the nature of our assets and the sources of our income. Even if we qualify as a REIT, we may be subject to certain U.S. federal income and excise taxes and state and local taxes on our income and assets. If we fail to maintain our qualification as a REIT for any taxable year, we may be subject to material penalties as well as federal, state, and local income tax on our taxable income at regular corporate rates and we would not be able to qualify as a REIT for the subsequent four full taxable years. As of March 31, 2015 and December 31, 2014, we were in compliance with all REIT requirements.
During the three months ended March 31, 2015 and 2014, we recorded a current income tax provision of $245,000 and $531,000, respectively, related to our taxable REIT subsidiaries as well as various state and local taxes. We did not have any deferred tax assets or liabilities as of March 31, 2015 or December 31, 2014.
As a result of our issuance of 25,875,000 shares of class A common stock in May 2013, the availability of our net operating losses, or NOLs, and net capital losses, or NCLs, is generally limited to $2.0 million per annum by change of control provisions promulgated by the Internal Revenue Service, or the IRS, with respect to the ownership of Blackstone Mortgage Trust. As of December 31, 2014, we had NOLs of $159.0 million and NCLs of $32.0 million available to be carried forward and utilized in current or future periods. If we are unable to utilize our NOLs, they will expire in 2029. If we are unable to utilize our NCLs, $31.4 million will expire in 2015, and $602,000 will expire in 2016 or later.
As of March 31, 2015, tax years 2010 through 2014 remain subject to examination by taxing authorities.
11. STOCK-BASED INCENTIVE PLANS
We do not have any employees as we are externally managed by our Manager. However, as of March 31, 2015, our Manager, certain individuals employed by an affiliate of our Manager, and certain members of our board of directors are compensated, in part, through the issuance of stock-based instruments.
We had stock-based incentive awards outstanding under five benefit plans as of March 31, 2015: (i) our amended and restated 1997 non-employee director stock plan, or 1997 Plan; (ii) our 2007 long-term incentive plan, or 2007 Plan; (iii) our 2011 long-term incentive plan, or 2011 Plan; (iv) our 2013 stock incentive plan, or 2013 Plan; and (v) our 2013 manager incentive plan, or 2013 Manager Plan. We refer to our 1997 Plan, our 2007 Plan, and our 2011 Plan collectively as our Expired Plans and we refer to our 2013 Plan and 2013 Manager Plan collectively as our Current Plans.
Our Expired Plans have expired and no new awards may be issued under them. Under our Current Plans, a maximum of 2,160,106 shares of our class A common stock may be issued to our Manager, our directors and officers, and certain employees of affiliates of our Manager. As of March 31, 2015, there were 752,856 shares available under the Current Plans.
23
Table of Contents
Blackstone Mortgage Trust, Inc.
Notes to Consolidated Financial Statements (continued)
(Unaudited)
During the three months ended March 31, 2015, we issued 187,674 shares of restricted class A common stock under our Current Plans. These shares generally vest in quarterly installments over a three-year period, pursuant to the terms of the respective award agreements and the terms of the Current Plans. The 1,045,330 shares of restricted class A common stock outstanding as of March 31, 2015 will vest as follows: 402,559 shares will vest in 2015; 416,756 shares will vest in 2016; and 226,015 shares will vest in 2017.
The following table details the movement in our outstanding shares of restricted class A common stock and the weighted-average grant date fair value per share:
| Restricted Class A Common Stock |
Weighted-Average Grant Date Fair Value Per Share |
|||||||
| Balance as of December 31, 2014 |
919,719 | $ | 26.86 | |||||
| Granted |
187,674 | 29.38 | ||||||
| Vested |
(55,438 | ) | 25.61 | |||||
| Forfeited |
(6,625 | ) | 27.14 | |||||
|
|
|
|
|
|||||
| Balance as of March 31, 2015 |
1,045,330 | $ | 27.38 | |||||
|
|
|
|
|
|||||
12. FAIR VALUES
Assets Recorded at Fair Value
The following table summarizes our assets measured at fair value on a recurring basis ($ in thousands):
| Level 1 | Level 2 | Level 3 | Fair Value(1) | |||||||||||||
| March 31, 2015 |
||||||||||||||||
| Other assets, at fair value(1) |
$ | — | $ | 1,712 | $ | 49,967 | $ | 51,679 | ||||||||
| December 31, 2014 |
||||||||||||||||
| Other assets, at fair value(1) |
$ | — | $ | 2,648 | $ | 47,507 | $ | 50,155 | ||||||||
| (1) | Other assets include loans, securities, equity investments, and other receivables carried at fair value, as well as derivative financial instruments. |
The following table reconciles the beginning and ending balances of assets measured at fair value on a recurring basis using Level 3 inputs ($ in thousands):
| Three Months Ended March 31, | ||||||||
| 2015 | 2014 | |||||||
| January 1, |
$ | 47,507 | $ | 54,461 | ||||
| Proceeds from investments |
(15,038 | ) | (113 | ) | ||||
| Adjustments to fair value included in earnings |
||||||||
| Unrealized gain (loss) on investments at fair value |
17,498 | (1,331 | ) | |||||
|
|
|
|
|
|||||
| March 31, |
$ | 49,967 | $ | 53,017 | ||||
|
|
|
|
|
|||||
Our other assets include loans, securities, equity investments, and other receivables that are carried at fair value. The following describes the key assumptions used in arriving at the fair value of each of these assets as of March 31, 2015 and December 31, 2014.
Securities: As of March 31, 2015, our securities, which had a book value of $9.9 million, were valued by obtaining assessments from third-party dealers.
Loans: As of March 31, 2015, we had one loan with a fair value of $4.0 million and as of December 31, 2014, we had two loans with an aggregate fair value of $19.0 million. The discount rate used to value the remaining loan was 15% as of both March 31, 2015 and December 31, 2014. The discount rate used to value the loan that was outstanding as of December 31, 2014, but that repaid during 2015, was 7% as of December 31, 2014. A 100 bp discount rate increase would result in a decrease in fair value of 0.9% and 0.5% as of March 31, 2015 and December 31, 2014, respectively.
24
Table of Contents
Blackstone Mortgage Trust, Inc.
Notes to Consolidated Financial Statements (continued)
(Unaudited)
Equity investments and other receivables: As of March 31, 2015, equity investments and other receivables, which had an aggregate book value of $36.1 million, were generally valued by discounting expected cash flows.
There were no material liabilities recorded at fair value as of March 31, 2015 or December 31, 2014. Refer to Note 2 for further discussion regarding fair value measurement.
Fair Value of Financial Instruments
As discussed in Note 2, GAAP requires disclosure of fair value information about financial instruments, whether or not recognized in the statement of financial position, for which it is practicable to estimate that value. The following table details the carrying amount, face amount, and fair value of the financial instruments described in Note 2 ($ in thousands):
| March 31, 2015 | December 31, 2014 | |||||||||||||||||||||||
| Carrying Amount |
Face Amount |
Fair Value |
Carrying Amount |
Face Amount |
Fair Value |
|||||||||||||||||||
| Financial assets |
||||||||||||||||||||||||
| Cash and cash equivalents |
$ | 18,474 | $ | 18,474 | $ | 18,474 | $ | 51,810 | $ | 51,810 | $ | 51,810 | ||||||||||||
| Restricted cash |
26,890 | 26,890 | 26,890 | 11,591 | 11,591 | 11,591 | ||||||||||||||||||
| Loans receivable, net |
4,943,383 | 4,977,468 | 4,977,468 | 4,428,500 | 4,462,897 | 4,462,897 | ||||||||||||||||||
| Financial liabilities |
||||||||||||||||||||||||
| Revolving repurchase facilities |
2,241,630 | 2,241,630 | 2,241,630 | 2,040,783 | 2,040,783 | 2,040,783 | ||||||||||||||||||
| Asset-specific repurchase agreements |
407,203 | 407,203 | 407,203 | 324,553 | 324,553 | 324,553 | ||||||||||||||||||
| Loan participations sold |
708,845 | 708,845 | 708,845 | 499,433 | 499,433 | 499,433 | ||||||||||||||||||
| Convertible notes, net |
162,460 | 172,500 | 180,852 | 161,853 | 172,500 | 181,341 | ||||||||||||||||||
Estimates of fair value for cash, cash equivalents and convertible notes are measured using observable, quoted market prices, or Level 1 inputs. All other fair value significant estimates are measured using unobservable inputs, or Level 3 inputs. See Note 2 for further discussion regarding fair value measurement of certain of our assets and liabilities.
13. TRANSACTIONS WITH RELATED PARTIES
We are managed by our Manager pursuant to a management agreement, the initial term of which expires on December 19, 2015 and will be automatically renewed for a one-year term each anniversary thereafter unless earlier terminated.
As of March 31, 2015, our consolidated balance sheet included $6.7 million of accrued management and incentive fees payable to our Manager. During the three months ended March 31, 2015, we paid $6.3 million of management and incentive fees to our Manager and reimbursed our Manager for $139,000 of expenses incurred on our behalf. In addition, as of March 31, 2015, our consolidated balance sheet includes $151,000 of preferred distributions payable by CT Legacy Partners to an affiliate of our Manager. During the three months ended March 31, 2015, CT Legacy Partners made aggregate preferred distributions of $452,000 to such affiliate.
On October 23, 2014, we issued 337,941 shares of restricted class A common stock with a fair value of $9.4 million as of the grant date to our Manager under the 2013 Manager Plan. On October 3, 2013, we issued 339,431 shares of restricted class A common stock with a grant date fair value of $8.5 million to our Manager under the 2013 Manager Plan. The shares of restricted class A common stock vest ratably in quarterly installments over three years from the date of issuance. During the three months ended March 31, 2015 and 2014, we recorded a non-cash expense related to these shares of $1.4 million and $859,000, respectively. Refer to Note 11 for further discussion of our restricted class A common stock.
25
Table of Contents
Blackstone Mortgage Trust, Inc.
Notes to Consolidated Financial Statements (continued)
(Unaudited)
During the three months ended March 31, 2015, we incurred $18,000 of expenses to a third-party service provider for equity capital markets data services. This service provider was acquired by an affiliate of our Manager on August 6, 2014.
During the three months ended March 31, 2015, we incurred $37,000 of expenses to a third-party service provider for various administrative services that was owned by an affiliate of our Manager.
During the three months ended March 31, 2015, we incurred $20,000 of expenses to an affiliate of our Manager for various administrative services.
During the three months ended March 31, 2015, we originated a $320.0 million loan to a third-party. In conjunction with the origination, an affiliate of our Manager earned a modification fee of $354,000.
On March 27, 2015, a joint venture of CT Legacy Partners, certain affiliates of our Manager, and other non-affiliated parties, which we refer to as the Three-Pack JV, executed a binding agreement, subject to customary closing conditions, to sell a hotel portfolio it owns to an investment vehicle managed by an affiliate of our Manager. We consented to the sale of the hotel portfolio by the Three-Pack JV, which sale will result in the liquidation of the Three-Pack JV and distribution of net sale proceeds to CT Legacy Partners in respect of its investment therein. As of December 31, 2014, CT Legacy Partners carried its investment in the Three-Pack JV at $18.5 million. During the three months ended March 31, 2015, we recognized $17.6 million of unrealized gain on investments at fair value on our consolidated statement of operations to reflect the expected net sales proceeds to be received by CT Legacy Partners. Upon completion of the sale transaction certain former employees, including certain of our executive officers, will receive incentive compensation payments of an aggregate $2.4 million under the CT Legacy Partners Management Incentive Awards Plan, assuming net sale proceeds to CT Legacy Partners are equivalent to its $36.1 million carrying value as of March 31, 2015. See Note 9 for further discussion of the CT Legacy Partners Management Incentive Awards Plan.
Refer to Note 15 for a discussion of related party transactions subsequent to March 31, 2015.
14. COMMITMENTS AND CONTINGENCIES
Unfunded Commitments Under Loans Receivable
As of March 31, 2015, we had unfunded commitments of $550.0 million related to 40 loans receivable, which amounts will generally be funded to finance lease-related or capital expenditures by our borrowers. These future commitments will expire over the next four years.
Income Tax Audit of CTIMCO
The IRS is currently undergoing an examination of the federal income tax returns for the year ended December 31, 2012 of our former subsidiary, CT Investment Management Co., LLC, or CTIMCO. The examination is on-going, and no adjustments have been communicated to us by the IRS. When we sold CTIMCO in December 2012, we provided certain indemnifications related to its operations, and any amounts determined by the IRS to be owed by CTIMCO would ultimately be paid by us. As of March 31, 2015, there are no reserves recorded for the CTIMCO examination.
Litigation
In the normal course of business, we are subject to various legal proceedings and claims, the resolution of which, in our Manager’s opinion, will not have a material adverse effect on our consolidated financial position or results of operations. As of March 31, 2015, there are no reserves recorded for pending litigation.
Board of Director’s Compensation
As of March 31, 2015, of the eight members of our board of directors, five are entitled to annual compensation of $125,000 each. The other three board members, including our chairman and our chief executive officer, serve as directors with no compensation. As of March 31, 2015, the annual compensation for our directors was paid 40% in cash and 60% in the form of deferred stock units. In addition, the member of our board of directors that serves as the chairperson of the audit committee of our board of directors receives additional annual cash compensation of $12,000. Compensation to the board of directors is payable in four equal quarterly installments.
26
Table of Contents
Blackstone Mortgage Trust, Inc.
Notes to Consolidated Financial Statements (continued)
(Unaudited)
15. SUBSEQUENT EVENTS
On April 8, 2015, our Board of Directors approved an amendment to our charter to increase the number of authorized shares of our stock from 200,000,000 to 300,000,000, including an increase in the authorized number of shares of our class A common stock from 100,000,000 to 200,000,000.
On April 10, 2015, we entered into an agreement, which we refer to as the Designation Agreement, to acquire a $4.6 billion portfolio of commercial mortgage loans, secured by properties located in North America and Europe, which we refer to as the Loan Portfolio, from General Electric Capital Corporation and certain of its affiliates. The purchase price for the Loan Portfolio is $4.4 billion, subject to certain adjustments, and we have agreed to assume $223.9 million of unfunded commitments. The acquisition is expected to close in stages beginning in the second quarter of 2015, subject to regulatory approval and the satisfaction or waiver of various closing conditions. Concurrently with our entry into the Designation Agreement, we also entered into an agreement with Wells Fargo that will, subject to customary terms and conditions, provide for $4.0 billion of secured financing. The closing of the Wells Fargo facility is subject to the negotiation, in good faith, and the execution and delivery of definitive documentation acceptable to the parties and certain other customary terms and conditions.
On April 17, 2015, we completed an underwritten public offering of 23,000,000 shares of our class A common stock, including 3,000,000 shares sold pursuant to the underwriters’ full exercise of their 30-day option to purchase additional sales. Net proceeds from the offering totaled $681.8 million and were received on April 17, 2015. We plan to use substantially all of the net proceeds from this offering to fund a portion of the purchase price for the Loan Portfolio acquisition, and for working capital and other general corporate purposes. In conjunction with the offering, affiliates of our Manager purchased 1,229,508 shares of our class A common stock, and employees of affiliates of our Manager, including certain of our executive officers and directors, purchased 655,737 shares of our class A common stock, in each case, at the same $30.50 per share price offered to the public. We did not, however, pay the underwriters any fees for these affiliate share purchases. Blackstone Capital Markets acted as a co-manager of the offering, for which it was compensated approximately $750,000.
27
Table of Contents
| ITEM 2. | MANAGEMENT’S DISCUSSION AND ANALYSIS OF FINANCIAL CONDITION AND RESULTS OF OPERATIONS |
References herein to “Blackstone Mortgage Trust,” “Company,” “we,” “us,” or “our” refer to Blackstone Mortgage Trust, Inc. and its subsidiaries unless the context specifically requires otherwise.
The following discussion should be read in conjunction with the unaudited consolidated financial statements and notes thereto appearing elsewhere in this quarterly report on Form 10-Q. In addition to historical data, this discussion contains forward-looking statements about our business, operations and financial performance based on current expectations that involve risks, uncertainties and assumptions. Our actual results may differ materially from those in this discussion as a result of various factors, including but not limited to those discussed in Item 1A. Risk Factors in our annual report on Form 10-K for the year ended December 31, 2014 and elsewhere in this quarterly report on Form 10-Q.
Introduction
Blackstone Mortgage Trust is a real estate finance company that originates and purchases senior loans collateralized by properties in North America and Europe. We are externally managed by BXMT Advisors L.L.C., or our Manager, a subsidiary of The Blackstone Group L.P., or Blackstone, and are a real estate investment trust, or REIT, traded on the New York Stock Exchange, or NYSE, under the symbol “BXMT.” We are headquartered in New York City.
We conduct our operations as a REIT for U.S. federal income tax purposes. We generally will not be subject to U.S. federal income taxes on our taxable income to the extent that we annually distribute all of our net taxable income to stockholders and maintain our qualification as a REIT. We also operate our business in a manner that permits us to maintain an exclusion from registration under the Investment Company Act of 1940, as amended. We are organized as a holding company and conduct our business primarily through our various subsidiaries.
Loan Portfolio Acquisition
On April 17, 2015, we entered into an agreement, which we refer to as the Designation Agreement, to acquire a $4.6 billion portfolio of commercial mortgage loans, secured by properties located in North America and Europe, which we refer to as the Loan Portfolio, from General Electric Capital Corporation and certain of its affiliates. The purchase price for the Loan Portfolio is $4.4 billion, subject to certain adjustments, and we have agreed to assume $223.9 million of unfunded commitments. The acquisition is expected to close in stages beginning in the second quarter of 2015, subject to regulatory approval and the satisfaction or waiver of various closing conditions. Concurrently with our entry into the Designation Agreement, we also entered into an agreement with Wells Fargo that will, subject to customary terms and conditions, provide for $4.0 billion of secured financing. However, the closing of the Wells Fargo facility is subject to the negotiation, in good faith, and the execution and delivery of definitive documentation acceptable to the parties and certain other customary terms and conditions.
I. Key Financial Measures and Indicators
As a real estate finance company, we believe the key financial measures and indicators for our business are earnings per share, dividends declared, Core Earnings, and book value per share. For the three months ended March 31, 2015 we recorded earnings per share of $0.60, declared a dividend of $0.52 per share, and reported $0.54 per share of Core Earnings. In addition, our book value per share as of March 31, 2015 was $24.87. As further described below, Core Earnings is a measure that is not prepared in accordance with accounting principles generally accepted in the United States of America, or GAAP. We use Core Earnings to evaluate our performance excluding the effects of certain transactions and GAAP adjustments that are not necessarily indicative of our current loan origination activity and operations.
28
Table of Contents
Earnings Per Share and Dividends Declared
The following table sets forth the calculation of basic and diluted net income per share and the allocation of basic and diluted net income per share based on the weighted-average of our shares of class A common stock, restricted class A common stock, and deferred stock units outstanding ($ in thousands, except per share data):
| Three Months Ended | ||||||||
| March 31, 2015 | December 31, 2014 | |||||||
| Net income(1) |
$ | 35,393 | $ | 21,490 | ||||
| Weighted-average shares outstanding, basic and diluted |
58,576,025 | 58,190,324 | ||||||
|
|
|
|
|
|||||
| Net income per share, basic and diluted |
$ | 0.60 | $ | 0.37 | ||||
|
|
|
|
|
|||||
| Dividends per share |
$ | 0.52 | $ | 0.52 | ||||
|
|
|
|
|
|||||
| (1) | Represents net income attributable to Blackstone Mortgage Trust, Inc. |
Core Earnings
Core Earnings is a non-GAAP measure, which we define as GAAP net income (loss), including realized gains and losses not otherwise included in GAAP net income (loss), and excluding (i) net income (loss) attributable to our CT Legacy Portfolio, (ii) non-cash equity compensation expense, (iii) incentive management fees, (iv) depreciation and amortization, (v) unrealized gains (losses), and (vi) certain non-cash items. Core Earnings may also be adjusted from time to time to exclude one-time events pursuant to changes in GAAP and certain other non-cash charges as determined by our Manager, subject to approval by a majority of our independent directors.
We believe that Core Earnings provides meaningful information to consider in addition to our net income and cash flow from operating activities determined in accordance with GAAP. This adjusted measure helps us to evaluate our performance excluding the effects of certain transactions and GAAP adjustments that we believe are not necessarily indicative of our current Loan Origination portfolio and operations. We also use Core Earnings to calculate the incentive and base management fees due to our Manager under our management agreement and, as such, we believe that the disclosure of Core Earnings is useful to our investors.
Core Earnings does not represent net income or cash generated from operating activities and should not be considered as an alternative to GAAP net income, or an indication of our GAAP cash flows from operations, a measure of our liquidity, or an indication of funds available for our cash needs. In addition, our methodology for calculating Core Earnings may differ from the methodologies employed by other companies to calculate the same or similar supplemental performance measures, and accordingly, our reported Core Earnings may not be comparable to the Core Earnings reported by other companies.
The following table provides a reconciliation of Core Earnings to GAAP net income ($ in thousands, except share and per share data):
| Three Months Ended | ||||||||
| March 31, 2015 | December 31, 2014 | |||||||
| Net income(1) |
$ | 35,393 | $ | 21,490 | ||||
| CT Legacy Portfolio net (income) loss |
(8,400 | ) | 4,833 | |||||
| Non-cash compensation expense |
3,297 | 2,528 | ||||||
| Incentive management fees |
1,212 | 817 | ||||||
| Other items |
342 | 408 | ||||||
|
|
|
|
|
|||||
| Core Earnings |
$ | 31,844 | $ | 30,076 | ||||
|
|
|
|
|
|||||
| Weighted-average shares outstanding, basic and diluted |
58,576,025 | 58,190,324 | ||||||
|
|
|
|
|
|||||
| Core Earnings per share, basic and diluted |
$ | 0.54 | $ | 0.52 | ||||
|
|
|
|
|
|||||
| (1) | Represents net income attributable to Blackstone Mortgage Trust, Inc. |
29
Table of Contents
Book Value Per Share
The following table calculates our book value per share ($ in thousands, except share and per share data):
| March 31, 2015 | December 31, 2014 | |||||||
| Stockholders’ equity |
$ | 1,456,935 | $ | 1,465,371 | ||||
| Shares |
||||||||
| Class A common stock |
57,405,747 | 57,350,170 | ||||||
| Restricted class A common stock |
1,045,330 | 919,719 | ||||||
| Deferred stock units |
124,333 | 118,919 | ||||||
|
|
|
|
|
|||||
| 58,575,410 | 58,388,808 | |||||||
|
|
|
|
|
|||||
| Book value per share |
$ | 24.87 | $ | 25.10 | ||||
|
|
|
|
|
|||||
II. Loan Portfolio
During the quarter ended March 31, 2015, we funded $903.2 million under new and existing loan commitments and generated interest income of $63.4 million. Our loan originations were financed with $528.4 million of secured financings and $333.1 million of proceeds from loan principal repayments. We incurred interest expense of $24.2 million during the quarter, which resulted in $39.2 million of net interest income during the three months ended March 31, 2015.
Portfolio Overview
The following table details our loan origination activity ($ in thousands):
| Three Months Ended March 31, 2015 |
Three Months Ended December 31, 2014 |
|||||||||||||||
| Loan Commitments(2) |
Loan Fundings(3) |
Loan Commitments(2) |
Loan Fundings(3) |
|||||||||||||
| Senior loans(1) |
$ | 937,050 | $ | 903,049 | $ | 780,880 | $ | 769,613 | ||||||||
| Subordinate loans |
— | 103 | — | 105 | ||||||||||||
|
|
|
|
|
|
|
|
|
|||||||||
| Total |
$ | 937,050 | $ | 903,152 | $ | 780,880 | $ | 769,718 | ||||||||
|
|
|
|
|
|
|
|
|
|||||||||
| (1) | Includes senior mortgages and similar credit quality loans, including related contiguous subordinate loans, and pari passu participations in senior mortgage loans. |
| (2) | Includes new originations and additional commitments made under existing loan agreements. |
| (3) | Loan fundings during the three months ended March 31, 2015 include $118.1 million of additional fundings under existing loan commitments as of December 31, 2014, and loan fundings during the three months ended December 31, 2014 include $108.4 million of additional fundings under existing loan commitments as of September 30, 2014. |
30
Table of Contents
As of March 31, 2015, the majority of our loans were senior mortgages and similar credit quality loans. The following table details overall statistics for our loan portfolio ($ in thousands):
| March 31, 2015 | December 31, 2014 | |||||||
| Number of loans |
60 | 60 | ||||||
| Principal balance |
$ | 4,977,468 | $ | 4,462,897 | ||||
| Net book value |
$ | 4,943,383 | $ | 4,428,500 | ||||
| Unfunded loan commitments(1) |
$ | 550,012 | $ | 513,229 | ||||
| Weighted-average cash coupon(2) |
L+4.26 | % | L+4.36 | % | ||||
| Weighted-average all-in yield(2) |
L+4.68 | % | L+4.81 | % | ||||
| Weighted-average maximum maturity (years)(3) |
3.7 | 3.9 | ||||||
| (1) | Unfunded commitments will primarily be funded to finance property improvements or lease-related expenditures by the borrowers. These future commitments will expire over the next four years. |
| (2) | As of March 31, 2015, our floating rate loans and related liabilities were indexed to the various benchmark rates relevant in each case in terms of currency and payment frequency. Therefore the net exposure to each benchmark rate is in direct proportion to our net assets indexed to that rate. In addition, 8% of our loans earned interest based on LIBOR floors, with an average floor of 0.24%, as of March 31, 2015. In addition to cash coupon, all-in yield includes the amortization of deferred origination fees, loan origination costs, and accrual of both extension and exit fees. |
| (3) | Maximum maturity assumes all extension options are exercised by the borrower, however our loans may be repaid prior to such date. As of March 31, 2015, 83% of our loans are subject to yield maintenance, lock-out provisions, or other prepayment restrictions and 17% are open to repayment by the borrower. |
The charts below detail the geographic distribution and types of properties securing these loans, as of March 31, 2015 ($ in millions):
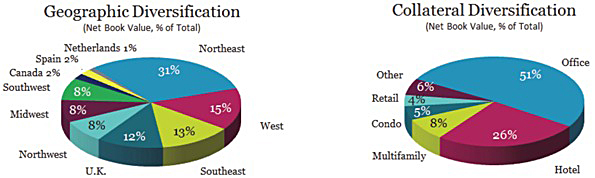
Refer to section VI of this Item 2 for details of our loan portfolio, on a loan-by-loan basis.
Asset Management
We actively manage the investments in our loan portfolio and exercise the rights afforded to us as a lender, including collateral level budget approvals, lease approvals, loan covenant enforcement, escrow/reserve management/collection, collateral release approvals and other rights that we may negotiate.
As discussed in Note 2 to our consolidated financial statements, our Manager performs a quarterly review of our loan portfolio, assesses the performance of each loan, and assigns it a risk rating between “1” and “5,” from less risk to greater risk. As of March 31, 2015, all of the investments in the loan portfolio are performing as expected and the weighted-average risk rating of our loan portfolio is 2.1.
31
Table of Contents
Secured Financings
Our secured financings included revolving repurchase facilities, asset-specific repurchase agreements, and loan participations sold. The following table details our revolving repurchase facilities outstanding ($ in thousands):
| March 31, 2015 | Dec. 31, 2014 | |||||||||||||||||||||||
| Maximum | Collateral | Repurchase Borrowings(3) | Borrowings | |||||||||||||||||||||
| Lender |
Facility Size(1) | Assets(2) | Potential | Outstanding | Available | Outstanding | ||||||||||||||||||
| Wells Fargo |
$ | 1,000,000 | $ | 837,372 | $ | 654,656 | $ | 515,103 | $ | 139,553 | $ | 484,365 | ||||||||||||
| JP Morgan(4) |
739,147 | 741,916 | 580,899 | 513,813 | 67,086 | 341,487 | ||||||||||||||||||
| Bank of America |
750,000 | 501,041 | 397,700 | 397,033 | 667 | 389,347 | ||||||||||||||||||
| MetLife |
750,000 | 527,611 | 409,178 | 347,943 | 61,235 | 305,889 | ||||||||||||||||||
| Citibank |
500,000 | 625,053 | 474,103 | 340,511 | 133,592 | 392,455 | ||||||||||||||||||
| Morgan Stanley(5) |
370,250 | 171,590 | 135,125 | 127,227 | 7,898 | 127,240 | ||||||||||||||||||
|
|
|
|
|
|
|
|
|
|
|
|
|
|||||||||||||
| $ | 4,109,397 | $ | 3,404,583 | $ | 2,651,661 | $ | 2,241,630 | $ | 410,031 | $ | 2,040,783 | |||||||||||||
|
|
|
|
|
|
|
|
|
|
|
|
|
|||||||||||||
| (1) | Maximum facility size represents the total amount of borrowings in each repurchase agreement; however these borrowings are only available to us once sufficient collateral assets have been pledged under each facility at the discretion of the lender. |
| (2) | Represents the principal balance of the collateral assets. |
| (3) | Potential borrowings represent the total amount we could draw under each facility based on collateral already approved and pledged. When undrawn, these amounts are immediately available to us at our sole discretion under the terms of each revolving credit facility. |
| (4) | The JP Morgan maximum facility size is composed of a $250.0 million facility and a £153.0 million ($226.6 million) facility, and $262.5 million related solely to a specific asset with a repurchase date of January 9, 2018. |
| (5) | The Morgan Stanley maximum facility size represents a £250.0 million ($370.3 million) facility. |
As of March 31, 2015, we had aggregate borrowings of $2.2 billion outstanding under our revolving repurchase facilities, with a weighted-average cash coupon of LIBOR plus 1.87% per annum and a weighted-average all-in cost of credit, including associated fees and expenses, of LIBOR plus 2.09% per annum. As of March 31, 2015, outstanding borrowings under these facilities had a weighted-average maturity, excluding extension options and term-out provisions, of 1.7 years.
The following table details our asset-specific repurchase agreements and loan participations sold as of March 31, 2015 ($ in thousands):
| Asset-specific Repurchase Agreements |
Loan Participations Sold(2)(3) | |||||||||||||||
| Repurchase Agreements |
Collateral Assets |
Participations Sold |
Underlying Loans |
|||||||||||||
| Number of loans |
4 | 5 | 4 | 4 | ||||||||||||
| Principal balance |
$ | 407,203 | $ | 539,043 | $ | 708,845 | $ | 879,043 | ||||||||
| Weighted-average cash coupon(1) |
L+2.75 | % | L+5.21 | % | L+2.40 | % | L+4.06 | % | ||||||||
| Weighted-average all-in cost / yield(1) |
L+3.20 | % | L+5.70 | % | L+2.68 | % | L+4.36 | % | ||||||||
| (1) | As of March 31, 2015, our floating rate loans and related liabilities were indexed to the various benchmark rates relevant in each case in terms of currency and payment frequency. Therefore the net exposure to each benchmark rate is in direct proportion to our net assets indexed to that rate. In addition to cash coupon, all-in cost / yield includes the amortization of deferred origination fees / financing costs. |
| (2) | We also sold a $110.7 million senior interest in a loan that qualified for sale accounting under GAAP and is therefore no longer included on our consolidated balance sheet. Accordingly, the information detailed in the table excludes such participation. |
| (3) | During 2015, we recorded $4.3 million of interest expense related to our loan participations sold. |
Refer to Note 5 to our consolidated financial statements for additional terms and details of our secured financings, including certain financial covenants.
32
Table of Contents
Floating Rate Portfolio
Our loan portfolio as of March 31, 2015 was comprised of floating rate loans financed by floating rate secured debt, which results in a return on equity that is correlated to LIBOR. Generally, our business model is such that rising interest rates will increase our net income, while declining interest rates will decrease net income. Subsequent to the quarter-ended March 31, 2015, we entered into an agreement to acquire a $4.6 billion portfolio of commercial real estate loans, a significant portion of which earn a fixed rate of interest. Accordingly, while the net interest income generated by our loan portfolio as a whole will continue to have a positive correlation to increases in LIBOR and we may enter into hedging transactions with respect to our fixed rate loans, the magnitude of positive correlations to increases in LIBOR is expected to decrease subsequent to the acquisition of this portfolio. See Note 15 to our consolidated financial statements for additional discussion of the loan portfolio acquisition and related financing thereof.
Excluding the April loan portfolio acquisition, as of March 31, 2015, a 100 basis point increase in LIBOR would have increased our net income by $16.0 million per annum, or $0.27 per share, while a 10 basis point decrease in LIBOR would have decreased our net income by $1.1 million per annum, or $0.02 per share.
The following table details our loan portfolio’s sensitivity to interest rates ($ in thousands):
| March 31, 2015 | ||||
| Floating rate loans(1) |
$ | 4,977,468 | ||
| Floating rate debt(1)(2) |
(3,357,678 | ) | ||
|
|
|
|||
| Net floating rate exposure |
$ | 1,619,790 | ||
|
|
|
|||
| Net income impact from 100 bps increase in LIBOR(3) |
$ | 15,963 | ||
|
|
|
|||
| Per share amount, basic and diluted |
$ | 0.27 | ||
|
|
|
|||
| (1) | As of March 31, 2015, our floating rate loans and related liabilities were indexed to the various benchmark rates relevant in each case in terms of currency and payment frequency. Therefore the net exposure to each benchmark rate is in direct proportion to our net assets indexed to that rate. |
| (2) | Includes borrowings under revolving repurchase facilities, asset-specific repurchase agreements, and loan participations sold. |
| (3) | Annualized net income includes the impact of LIBOR floors for our loan receivable investments where such floors are paying relative to LIBOR of 0.18% as of March 31, 2015. |
Convertible Notes
In November 2013, we issued $172.5 million of 5.25% convertible senior notes due on December 1, 2018, or the Convertible Notes. The Convertible Notes issuance costs, including underwriter discounts, are amortized through interest expense over the life of the Convertible Notes using the effective interest method. Including this amortization, our all-in cash cost of the Convertible Notes is 5.87%.
Refer to Notes 2 and 6 to our consolidated financial statements for additional discussion of our Convertible Notes.
CT Legacy Portfolio
As of March 31, 2015, Our CT Legacy Portfolio consists of: (i) our interests in CT Legacy Partners, LLC, or CT Legacy Partners and (ii) our carried interest in CTOPI, a private investment fund that was previously under our management and is now managed by an affiliate of our Manager.
During the quarter ended March 31, 2015 we recognized $17.5 million of unrealized gain on investments at fair value and $3.9 million of income from equity investments in unconsolidated subsidiaries related to assets in the CT Legacy Portfolio.
33
Table of Contents
III. Our Results of Operations
Operating Results
The following table sets forth information regarding our consolidated results of operations and certain key operating metrics ($ in thousands, except per share data):
| Three Months Ended March 31, | Variance | |||||||||||||||
| 2015 | 2014 | $ | % | |||||||||||||
| Income from loans and other investments |
||||||||||||||||
| Interest and related income |
$ | 63,407 | $ | 33,656 | $ | 29,751 | 88.4 | % | ||||||||
| Less: Interest and related expenses |
24,161 | 12,074 | 12,087 | 100.1 | % | |||||||||||
|
|
|
|
|
|
|
|
|
|||||||||
| Income from loans and other investments, net |
39,246 | 21,582 | 17,664 | 81.8 | % | |||||||||||
| Other expenses |
||||||||||||||||
| Management and incentive fees |
6,671 | 3,397 | 3,274 | 96.4 | % | |||||||||||
| General and administrative expenses |
7,663 | 3,199 | 4,464 | 139.5 | % | |||||||||||
| Total other expenses |
14,334 | 6,596 | 7,738 | 117.3 | % | |||||||||||
|
|
|
|
|
|
|
|
|
|||||||||
| Impairments, provisions, and valuation adjustments |
17,476 | (1,339 | ) | 18,815 | N/M | |||||||||||
| Income from equity investments in unconsolidated subsidiaries |
3,950 | — | 3,950 | 100.0 | % | |||||||||||
| Income tax provision |
245 | 531 | (286 | ) | (53.9 | )% | ||||||||||
|
|
|
|
|
|
|
|
|
|||||||||
| Net income |
$ | 46,093 | $ | 13,116 | $ | 32,977 | 251.4 | % | ||||||||
|
|
|
|
|
|
|
|
|
|||||||||
| Net income attributable to non-controlling interests |
(10,700 | ) | (51 | ) | (10,649 | ) | N/M | |||||||||
|
|
|
|
|
|
|
|
|
|||||||||
| Net income attributable to Blackstone Mortgage Trust, Inc. |
$ | 35,393 | $ | 13,065 | $ | 22,328 | 170.9 | % | ||||||||
|
|
|
|
|
|
|
|
|
|||||||||
| Net income per share, basic and diluted |
$ | 0.60 | $ | 0.34 | ||||||||||||
| Dividends per share |
$ | 0.52 | $ | 0.48 | ||||||||||||
Income from loans and other investments, net
Income from loans and other investments, net increased $17.7 million, or 81.8%, during the three months ended March 31, 2015 compared to the three months ended March 31, 2014. The increase was primarily due to the interest income earned on our loan portfolio, the principal balance of which increased $2.2 billion as of March 31, 2015 compared with March 31, 2014. This was partially offset by additional interest expense incurred on our secured financings, the principal balance of which increased $1.1 billion as of March 31, 2015 compared with March 31, 2014.
Other expenses
Other expenses are comprised of management and incentive fees payable to our Manager and general and administrative expenses. Other expenses increased by $7.7 million during the three months ended March 31, 2015 compared to the three months ended March 31, 2014 due to (i) an increase of $3.3 million of management and incentive fees payable to our Manager, primarily as a result of additional net proceeds received from the sale of our class A common stock, (ii) an increase of $2.7 million of compensation expenses associated with our CT Legacy Portfolio incentive plans, (iii) $1.5 million of additional non-cash restricted stock amortization related to shares awarded under our long-term incentive plans, and (iv) $329,000 of additional general operating expenses.
Impairments, provisions, and valuation adjustments
During the three months ended March 31, 2015, we recognized $17.5 million of net unrealized gains on investments held by CT Legacy Partners. During the three months ended March 31, 2014, we recognized $1.3 million of net unrealized losses on investments held by CT Legacy Partners.
34
Table of Contents
Income from equity investments in unconsolidated subsidiaries
During the three months ended March 31, 2015, we recognized $3.9 million of promote income from CTOPI. No such income was recognized during the three months ended March 31, 2014.
Net income attributable to non-controlling interests
During the three months ended March 31, 2015, we recognized $10.7 million of net income attributable to non-controlling interest compared with $51,000 during the three months ended March 31, 2014. The non-controlling interest represents the portion of CT Legacy Partners net income that is not owned by us. The increase in non-controlling interest is primarily a result of the $17.5 million unrealized gain on investments at fair value recognized by CT Legacy Partners during the three months ended March 31, 2015.
Dividends per share
During the three months ended March 31, 2015, we declared a dividend of $0.52 per share, or $30.4 million, which was paid on April 15, 2015 to common stockholders of record as of March 31, 2015. During the three months ended March 31, 2014, we declared a dividend of $0.48 per share, or $18.9 million, which was paid on April 15, 2014 to common stockholders of record as of March 31, 2014.
IV. Liquidity and Capital Resources
Capitalization
During the three months ended March 31, 2015, we increased the maximum facility size of three of our revolving repurchase facilities, entered into one asset-specific repurchase agreements, and sold one senior loan participation, providing $1.1 billion of financing capacity. As of March 31, 2015, we had aggregate borrowings of $2.2 billion outstanding under our revolving repurchase facilities, with a weighted-average cash coupon of LIBOR plus 1.87% per annum and a weighted-average all-in cost of credit, including associated fees and expenses, of LIBOR plus 2.09% per annum. We also had four asset-specific repurchase agreements outstanding with an aggregate outstanding balance of $407.2 million, a cash coupon of LIBOR plus 2.75%, and an all-in cost of LIBOR plus 3.20%, as well as loan participations sold outstanding with an aggregate book balance of $708.8 million, a cash coupon of LIBOR plus 2.40%, and an all-in cost of LIBOR plus 2.68%.
See Note 5 to our consolidated financial statements for additional details regarding our secured financings.
As of March 31, 2015, we also had $172.5 million aggregate principal amount of convertible notes with a net book value of $162.5 million, which carry a cash coupon of 5.25% and an all-in cost of 7.16%. These notes mature in December 2018.
Sources of Liquidity
Our primary sources of liquidity include cash and cash equivalents and available borrowings under our repurchase facilities, which are set forth in the following table ($ in thousands):
| March 31, 2015 |
December 31, 2014 |
|||||||
| Cash and cash equivalents |
$ | 18,474 | $ | 51,810 | ||||
| Available borrowings under repurchase facilities |
410,031 | 218,555 | ||||||
|
|
|
|
|
|||||
| $ | 428,505 | $ | 270,365 | |||||
|
|
|
|
|
|||||
In addition to our current sources of liquidity, we have access to liquidity through public offerings of debt and equity securities. To facilitate such offerings, in July 2013, we filed a shelf registration statement with the Securities and Exchange Commission, or the SEC, that is effective for a term of three years and will expire in July 2016. The amount of securities to be issued pursuant to this shelf registration statement was not specified when it was filed and there is no specific dollar limit on the amount of securities we may issue. The securities covered by this registration statement include: (i) class A common stock, (ii) preferred stock, (iii) debt securities, (iv) depositary shares representing preferred stock, (v) warrants, (vi) subscription rights, (vii) purchase contracts, and (viii) units consisting of one or more of such securities or any combination of these securities. The specifics of any future offerings, along with the use of proceeds of any securities offered, will be described in detail in a prospectus supplement, or other offering materials, at the time of any offering.
35
Table of Contents
We may also access liquidity through a dividend reinvestment plan and direct stock purchase plan, under which we registered and reserved for issuance, in the aggregate, 10,000,000 shares of class A common stock, and our at-the-market stock offering program, pursuant to which we may sell, from time to time, up to an aggregate of $200.0 million of our class A common stock.
Our existing loan portfolio also provides us with liquidity as loans are repaid or sold, in whole or in part, and the proceeds from such repayments become available for us to reinvest. During the three months ended March 31, 2015, we received $333.1 million of proceeds from loan principal repayments and sales.
Liquidity Needs
In addition to our ongoing loan origination activity, our primary liquidity needs include interest and principal payments under our $2.8 billion of outstanding repurchase obligations and convertible notes, our $550.0 million of unfunded loan commitments, dividend distributions to our stockholders, and operating expenses.
Contractual Obligations and Commitments
Our contractual obligations and commitments as of March 31, 2015 were as follows ($ in thousands):
| Total | Less than 1 year |
1 to 3 years |
3 to 5 years |
More than 5 years |
||||||||||||||||
| Unfunded loan commitments(1) |
$ | 550,012 | $ | 59,855 | $ | 426,716 | $ | 63,441 | $ | — | ||||||||||
| Revolving repurchase facilities(2) |
2,241,630 | 250,187 | 1,937,217 | 54,226 | — | |||||||||||||||
| Asset-specific repurchase agreements(3) |
429,726 | 59,217 | 370,509 | — | — | |||||||||||||||
| Loan participations sold(3) |
765,470 | 276,499 | 112,531 | 376,440 | — | |||||||||||||||
| Convertible notes, net |
209,228 | 12,201 | 18,364 | 178,663 | — | |||||||||||||||
|
|
|
|
|
|
|
|
|
|
|
|||||||||||
| Total |
$ | 4,196,066 | $ | 657,959 | $ | 2,865,337 | $ | 672,770 | $ | — | ||||||||||
|
|
|
|
|
|
|
|
|
|
|
|||||||||||
| (1) | The allocation of our unfunded loan commitments is based on the earlier of the commitment expiration date or the loan maturity date. |
| (2) | The allocation of our revolving repurchase facilities is based on the initial maturity date of each individual borrowing under our revolving repurchase facilities. Excludes the related future interest payment obligations, which are not fixed and determinable due to the revolving nature of these facilities. |
| (3) | Obligations were indexed to the various benchmark rates relevant in each case in terms of currency and payment frequency. Future interest payment obligations are determined using the relevant benchmark rates in effect as of March 31, 2015. Assumes repayment date based on the initial maturity of each instrument. |
We are also required to pay our Manager a base management fee, an incentive fee, and reimbursements for certain expenses pursuant to our Management Agreement. The table above does not include the amounts payable to our Manager under our Management Agreement as they are not fixed and determinable. Refer to Note 9 to our consolidated financial statements for additional terms and details of the fees payable under our Management Agreement.
As a REIT, we generally must distribute substantially all of our net taxable income to shareholders in the form of dividends to comply with the REIT provisions of the Internal Revenue Code. Our taxable income does not necessarily equal our net income as calculated in accordance with GAAP, or our Core Earnings as described above.
36
Table of Contents
Cash Flows
The following table provides a breakdown of the net change in our cash and cash equivalents ($ in thousands):
| Three Months Ended March 31, | ||||||||
| 2015 | 2014 | |||||||
| Cash flows from operating activities |
$ | 32,413 | $ | 15,039 | ||||
| Cash flows from investing activities |
(564,220 | ) | (657,134 | ) | ||||
| Cash flows from financing activities |
498,762 | 660,588 | ||||||
|
|
|
|
|
|||||
| Net (decrease) increase in cash and cash equivalents |
$ | (33,045 | ) | $ | 18,493 | |||
|
|
|
|
|
|||||
We experienced a net decrease in cash of $33.0 million for the quarter ended March 31, 2015, compared to a net increase of $18.5 million for the quarter ended March 31, 2014. During the three months ended March 31, 2015, we (i) borrowed $209.7 million under our repurchase facilities, (ii) received $348.2 million of proceeds from loan sales and principal collections, and (iii) sold $256.0 million of loan participations. We used the proceeds from our debt and equity financing activities to originate $903.2 million of new loans during the year ended March 31, 2015. Refer to Note 5 to our consolidated financial statements for additional discussion of our debt obligations. Refer to Note 3 to our consolidated financial statements for further discussion of our loan origination activity.
V. Other Items
Income Taxes
We elected to be taxed as a REIT, effective January 1, 2003, under the Internal Revenue Code for U.S. federal income tax purposes. We generally must distribute annually at least 90% of our net taxable income, subject to certain adjustments and excluding any net capital gain, in order for U.S. federal income tax not to apply to our earnings that we distribute. To the extent that we satisfy this distribution requirement, but distribute less than 100% of our net taxable income, we will be subject to U.S. federal income tax on our undistributed taxable income. In addition, we will be subject to a 4% nondeductible excise tax if the actual amount that we pay out to our stockholders in a calendar year is less than a minimum amount specified under U.S. federal tax laws.
Our qualification as a REIT also depends on our ability to meet various other requirements imposed by the Internal Revenue Code, which relate to organizational structure, diversity of stock ownership, and certain restrictions with regard to the nature of our assets and the sources of our income. Even if we qualify as a REIT, we may be subject to certain U.S. federal income and excise taxes and state and local taxes on our income and assets. If we fail to maintain our qualification as a REIT for any taxable year, we may be subject to material penalties as well as federal, state and local income tax on our taxable income at regular corporate rates and we would not be able to qualify as a REIT for the subsequent four full taxable years. As of March 31, 2015 and December 31, 2014, we were in compliance with all REIT requirements.
Refer to Note 10 to our consolidated financial statements for additional discussion of our income taxes.
Off-Balance Sheet Arrangements
We have no off-balance sheet arrangements.
Critical Accounting Policies
Our discussion and analysis of our financial condition and results of operations is based upon our consolidated financial statements, which have been prepared in accordance with GAAP. The preparation of these financial statements requires our Manager to make estimates and assumptions that affect the reported amounts of assets, liabilities, revenue and expenses, and related disclosure of contingent assets and liabilities. Actual results could differ from these estimates. There have been no material changes to our Critical Accounting Policies described in our annual report on Form 10-K filed with the SEC on February 17, 2015.
Refer to Note 2 to our consolidated financial statements for the description of our Significant Accounting Policies.
37
Table of Contents
VI. Loan Portfolio Details
The following table provides details of our loan portfolio, on a loan-by-loan basis, as of March 31, 2015 ($ in millions):
|
Loan Type(1) |
Origination Date |
Total Commitment |
Principal Balance |
Book Balance |
Cash Coupon(2) |
All-in Yield(2) |
Maximum Maturity(3) |
Geographic |
Property |
Origination LTV |
Risk Rating | |||||||||||||||||||||||||||||
| 1 | Senior loan |
3/4/2015 | $ | 320.0 | $ | 320.0 | $ | 320.0 | L+4.25 | % | L+4.51 | % | 3/9/2017 | WA | Office | 64 | % | 2 | ||||||||||||||||||||||
| 2 | Senior loan |
5/22/2014 | 296.2 | 296.2 | 292.4 | L+4.00 | % | L+4.34 | % | 5/22/2019 | UK | Hotel | 57 | % | 1 | |||||||||||||||||||||||||
| 3 | Senior loan |
1/7/2015 | 315.0 | 251.7 | 248.8 | L+3.50 | % | L+3.95 | % | 1/9/2020 | NY | Office | 53 | % | 2 | |||||||||||||||||||||||||
| 4 | Senior loan |
11/21/2013 | 181.0 | 181.0 | 180.0 | L+4.50 | % | L+4.86 | % | 11/9/2018 | NY | Condo | 68 | % | 3 | |||||||||||||||||||||||||
| 5 | Senior loan |
12/9/2014 | 210.7 | 163.3 | 162.0 | L+3.80 | % | L+4.31 | % | 12/9/2019 | Diversified-US | Office | 65 | % | 2 | |||||||||||||||||||||||||
| 6 | Senior loan |
7/31/2014 | 190.0 | 155.9 | 154.9 | L+3.50 | % | L+4.01 | % | 8/9/2019 | IL | Office | 71 | % | 2 | |||||||||||||||||||||||||
| 7 | Senior loan |
1/7/2014 | 160.0 | 154.1 | 153.1 | L+4.75 | % | L+5.14 | % | 1/7/2019 | Diversified-US | Other | 71 | % | 2 | |||||||||||||||||||||||||
| 8 | Senior loan |
11/20/2014 | 142.2 | 142.2 | 140.9 | L+3.40 | % | L+3.62 | % | 11/20/2019 | UK | Hotel | 62 | % | 2 | |||||||||||||||||||||||||
| 9 | Senior loan |
12/17/2013 | 139.6 | 139.6 | 139.0 | L+4.75 | % | L+5.27 | % | 1/9/2019 | NY | Office | 70 | % | 2 | |||||||||||||||||||||||||
| 10 | Senior loan |
2/25/2014 | 166.0 | 134.9 | 133.7 | L+4.40 | % | L+4.82 | % | 3/9/2019 | Diversified-US | Hotel | 54 | % | 2 | |||||||||||||||||||||||||
| 11 | Senior loan |
1/30/2014 | 145.9 | 133.4 | 133.1 | L+4.30 | % | L+4.63 | % | 12/1/2017 | NY | Hotel | 39 | % | 2 | |||||||||||||||||||||||||
| 12 | Senior loan |
10/30/2013 | 130.0 | 127.8 | 127.3 | L+4.38 | % | L+4.62 | % | 11/9/2018 | CA | Hotel | 72 | % | 2 | |||||||||||||||||||||||||
| 13 | Senior loan |
6/20/2014 | 137.5 | 124.7 | 123.8 | L+5.75 | % | L+6.39 | % | 6/20/2016 | CA | Hotel | 45 | % | 3 | |||||||||||||||||||||||||
| 14 | Senior loan |
11/17/2014 | 142.9 | 118.6 | 117.4 | L+5.50 | % | L+5.94 | % | 12/9/2019 | CAN | Office | 52 | % | 3 | |||||||||||||||||||||||||
| 15 | Senior loan |
2/20/2014 | 100.0 | 98.8 | 98.5 | L+4.40 | % | L+4.58 | % | 3/9/2019 | NY | Office | 70 | % | 2 | |||||||||||||||||||||||||
| 16 | Senior loan |
3/4/2014 | 115.5 | 98.3 | 97.4 | L+4.00 | % | L+4.58 | % | 3/4/2018 | UK | Office | 57 | % | 2 | |||||||||||||||||||||||||
| 17 | Senior loan |
8/28/2014 | 125.0 | 93.0 | 92.5 | L+4.35 | % | L+4.71 | % | 12/9/2018 | NY | Office | 68 | % | 3 | |||||||||||||||||||||||||
| 18 | Senior loan |
9/30/2013 | 111.1 | 89.5 | 89.5 | L+3.70 | % | L+3.83 | % | 9/30/2020 | NY | Multifamily | 62 | % | 3 | |||||||||||||||||||||||||
| 19 | Senior loan |
10/28/2014 | 85.0 | 81.8 | 81.0 | L+3.75 | % | L+4.12 | % | 11/9/2019 | NY | Diversified | 78 | % | 2 | |||||||||||||||||||||||||
| 20 | Senior loan |
2/18/2015 | 89.9 | 81.8 | 80.9 | L+3.75 | % | L+4.30 | % | 3/9/2020 | CA | Office | 71 | % | 2 | |||||||||||||||||||||||||
| 21 | Senior loan |
3/12/2015 | 101.1 | 81.3 | 80.3 | L+3.25 | % | L+3.69 | % | 3/11/2020 | CA | Office | 68 | % | 2 | |||||||||||||||||||||||||
| 22 | Senior loan |
5/20/2014 | 82.0 | 80.0 | 79.5 | L+4.00 | % | L+4.54 | % | 6/9/2019 | DC | Office | 79 | % | 2 | |||||||||||||||||||||||||
| 23 | Senior loan |
5/16/2014 | 86.8 | 78.8 | 78.3 | L+3.85 | % | L+4.15 | % | 6/9/2019 | FL | Office | 74 | % | 2 | |||||||||||||||||||||||||
| 24 | Senior loan |
10/2/2013 | 78.2 | 78.2 | 77.8 | L+5.00 | % | L+5.38 | % | 9/14/2018 | Diversified-US | Other | 64 | % | 2 | |||||||||||||||||||||||||
| 25 | Senior loan |
9/8/2014 | 78.0 | 78.0 | 77.0 | L+4.00 | % | L+4.34 | % | 11/20/2019 | ES | Retail | 71 | % | 2 | |||||||||||||||||||||||||
| 26 | Senior loan |
7/11/2014 | 82.2 | 76.0 | 75.4 | L+3.65 | % | L+4.03 | % | 8/9/2019 | IL | Office | 64 | % | 2 | |||||||||||||||||||||||||
| 27 | Senior loan |
5/22/2014 | 79.7 | 70.2 | 69.6 | L+4.50 | % | L+4.92 | % | 6/15/2019 | CA | Office | 67 | % | 2 | |||||||||||||||||||||||||
| 28 | Senior loan |
8/8/2013 | 68.0 | 68.0 | 68.0 | L+4.00 | % | L+4.23 | % | 6/10/2016 | NY | Office | 68 | % | 2 | |||||||||||||||||||||||||
| 29 | Senior loan |
6/27/2013 | 64.7 | 64.5 | 64.4 | L+3.85 | % | L+4.02 | % | 7/9/2018 | GA | Multifamily | 70 | % | 2 | |||||||||||||||||||||||||
| 30 | Senior loan |
7/26/2013 | 76.8 | 63.4 | 63.3 | L+5.00 | % | L+5.61 | % | 8/9/2018 | VA | Office | 70 | % | 2 | |||||||||||||||||||||||||
continued…
38
Table of Contents
|
Loan Type(1) |
Origination Date |
Total Commitment |
Principal Balance |
Book Balance |
Cash Coupon(2) |
All-in Yield(2) |
Maximum Maturity(3) |
Geographic |
Property |
Origination LTV |
Risk Rating | |||||||||||||||||||||||||||||
| 31 |
Senior loan |
9/27/2013 | 63.2 | 61.0 | 60.7 | L+3.85 | % | L+4.23 | % | 10/10/2018 | Diversified-US | Multifamily | 76 | % | 2 | |||||||||||||||||||||||||
| 32 |
Senior loan |
1/13/2014 | 60.5 | 60.5 | 60.1 | L+4.35 | % | L+4.71 | % | 1/9/2019 | NY | Office | 70 | % | 2 | |||||||||||||||||||||||||
| 33 |
Senior loan |
8/8/2013 | 59.3 | 58.2 | 58.1 | L+4.25 | % | L+4.67 | % | 8/10/2018 | Diversified-US | Diversified | 60 | % | 2 | |||||||||||||||||||||||||
| 34 |
Senior loan |
3/11/2014 | 65.0 | 57.4 | 57.0 | L+4.50 | % | L+4.92 | % | 4/9/2019 | NY | Multifamily | 66 | % | 3 | |||||||||||||||||||||||||
| 35 |
Senior loan |
7/17/2013 | 60.0 | 53.1 | 53.0 | L+4.50 | % | L+5.34 | % | 7/16/2017 | NY | Retail | 72 | % | 2 | |||||||||||||||||||||||||
| 36 |
Senior loan |
10/6/2014 | 60.0 | 51.0 | 50.5 | L+4.15 | % | L+4.56 | % | 10/9/2019 | NY | Hotel | 68 | % | 2 | |||||||||||||||||||||||||
| 37 |
Senior loan |
4/1/2014 | 50.0 | 50.0 | 49.7 | L+4.20 | % | L+4.73 | % | 4/9/2019 | HI | Hotel | 69 | % | 2 | |||||||||||||||||||||||||
| 38 |
Senior loan |
2/27/2015 | 71.0 | 50.2 | 49.5 | L+3.50 | % | L+4.00 | % | 2/26/2020 | IL | Office | 64 | % | 2 | |||||||||||||||||||||||||
| 39 |
Senior loan |
9/4/2013 | 51.8 | 49.4 | 49.1 | L+3.85 | % | L+4.25 | % | 9/10/2018 | Diversified-US | Multifamily | 76 | % | 3 | |||||||||||||||||||||||||
| 40 |
Senior loan |
6/25/2013 | 48.4 | 48.4 | 48.7 | L+4.25 | % | L+5.90 | % | 12/9/2016 | IL | Hotel | 50 | % | 2 | |||||||||||||||||||||||||
| 41 |
Senior loan |
9/9/2014 | 56.0 | 48.5 | 48.2 | L+4.00 | % | L+4.31 | % | 9/9/2019 | FL | Office | 71 | % | 2 | |||||||||||||||||||||||||
| 42 |
Senior loan |
7/2/2013 | 50.0 | 46.3 | 46.1 | L+4.25 | % | L+4.64 | % | 7/10/2018 | CO | Hotel | 69 | % | 2 | |||||||||||||||||||||||||
| 43 |
Senior loan |
10/31/2013 | 46.0 | 46.0 | 45.9 | L+4.25 | % | L+4.78 | % | 10/9/2018 | CA | Hotel | 51 | % | 1 | |||||||||||||||||||||||||
| 44 |
Senior loan |
12/30/2013 | 51.0 | 45.9 | 45.6 | L+4.50 | % | L+4.89 | % | 1/9/2019 | AZ | Office | 69 | % | 2 | |||||||||||||||||||||||||
| 45 |
Senior loan |
12/19/2014 | 44.0 | 44.0 | 43.6 | L+4.25 | % | L+4.94 | % | 1/9/2017 | NY | Multifamily | 50 | % | 2 | |||||||||||||||||||||||||
| 46 |
Senior loan |
6/5/2014 | 42.9 | 42.9 | 42.6 | L+4.50 | % | L+4.86 | % | 6/5/2019 | UK | Retail | 80 | % | 2 | |||||||||||||||||||||||||
| 47 |
Senior loan |
3/26/2014 | 43.3 | 40.6 | 40.3 | L+4.30 | % | L+4.70 | % | 4/9/2019 | CA | Office | 71 | % | 2 | |||||||||||||||||||||||||
| 48 |
Senior loan |
9/26/2014 | 51.0 | 40.1 | 39.7 | L+4.00 | % | L+4.67 | % | 10/9/2019 | TX | Office | 70 | % | 2 | |||||||||||||||||||||||||
| 49 |
Senior loan |
7/12/2013 | 40.0 | 39.4 | 39.1 | L+3.85 | % | L+4.04 | % | 8/9/2018 | IL | Office | 69 | % | 1 | |||||||||||||||||||||||||
| 50 |
Senior loan |
6/12/2014 | 40.0 | 40.0 | 39.0 | L+4.00 | % | L+6.14 | % | 6/30/2018 | CA | Office | 71 | % | 3 | |||||||||||||||||||||||||
| 51 |
Senior loan |
12/20/2013 | 46.5 | 35.6 | 35.4 | L+4.10 | % | L+4.51 | % | 1/9/2019 | CA | Office | 46 | % | 2 | |||||||||||||||||||||||||
| 52 |
Mezzanine loan(4) |
12/13/2013 | 35.2 | 34.1 | 34.2 | L+12.56 | % | L+12.35 | % | 12/13/2017 | NY | Condo | 75 | % | 3 | |||||||||||||||||||||||||
| 53 |
Senior loan |
11/28/2013 | 42.5 | 30.4 | 30.0 | L+4.63 | % | L+5.49 | % | 11/27/2018 | UK | Office | 68 | % | 2 | |||||||||||||||||||||||||
| 54 |
Senior loan |
6/18/2014 | 30.3 | 30.3 | 29.9 | L+4.00 | % | L+4.46 | % | 7/20/2019 | NL | Office | 69 | % | 2 | |||||||||||||||||||||||||
| 55 |
Senior loan |
4/4/2014 | 30.7 | 28.1 | 27.9 | L+4.25 | % | L+4.66 | % | 4/9/2019 | CA | Office | 64 | % | 2 | |||||||||||||||||||||||||
| 56 |
Senior loan |
12/9/2013 | 28.0 | 28.0 | 27.8 | L+4.35 | % | L+4.71 | % | 12/9/2018 | CA | Hotel | 55 | % | 2 | |||||||||||||||||||||||||
| 57 |
Senior loan |
2/28/2014 | 26.0 | 26.0 | 25.9 | L+4.00 | % | L+4.27 | % | 3/9/2019 | AZ | Other | 69 | % | 2 | |||||||||||||||||||||||||
| 58 |
Senior loan |
9/23/2014 | 25.0 | 25.0 | 24.9 | L+6.82 | % | L+7.58 | % | 10/1/2017 | NY | Condo | 48 | % | 3 | |||||||||||||||||||||||||
| 59 |
Senior loan |
3/17/2014 | 28.9 | 24.4 | 24.4 | L+4.75 | % | L+5.17 | % | 12/28/2016 | NY | Condo | 62 | % | 1 | |||||||||||||||||||||||||
| 60 |
Senior loan |
7/23/2014 | 80.0 | 17.7 | 16.7 | L+5.00 | % | L+5.81 | % | 8/9/2019 | GA | Office | 43 | % | 3 | |||||||||||||||||||||||||
|
|
|
|
|
|
|
|
|
|
|
|
|
|
|
| ||||||||||||||||||||||||||
| $ | 5,527.5 | $ | 4,977.5 | $ | 4,943.4 | L+4.26 | % | L+4.68 | % | 3.7 years | 63.9 | % | 2.1 | |||||||||||||||||||||||||||
|
|
|
|
|
|
|
|
|
|
|
|
|
|
|
| ||||||||||||||||||||||||||
| (1) | Senior loans include senior mortgages and similar credit quality loans, including related contiguous subordinate loans and pari passu participations in senior mortgage loans. |
| (2) | As of March 31, 2015, our floating rate loans and related liabilities were indexed to the various benchmark rates relevant in each case in terms of currency and payment frequency. Therefore the net exposure to each benchmark rate is in direct proportion to our net assets indexed to that rate. In addition, 8% of our loans currently earn interest based on LIBOR floors, with an average floor of 0.24%, as of March 31, 2015. In addition to cash coupon, all-in yield includes the amortization of deferred origination fees, loan origination costs, and accrual of exit fees. |
| (3) | Maximum maturity assumes all extension options are exercised, however our loans may be repaid prior to such date. |
| (4) | We originated the loan directly senior to this subordinate loan, but sold the senior loan to finance our overall investment. |
39
Table of Contents
| ITEM 3. | QUANTITATIVE AND QUALITATIVE DISCLOSURES ABOUT MARKET RISK |
Interest Rate Risk
Our business is exposed to the risks related to interest rate fluctuations. We generally originate floating rate assets and finance those assets with index-matched floating rate liabilities. As a result, we significantly reduce our exposure to changes in portfolio value and cash flow variability related to changes in interest rates. Subsequent to the quarter-ended March 31, 2015, we entered into an agreement to acquire a $4.6 billion portfolio of commercial real estate loans, a significant portion of which earn a fixed rate of interest. Accordingly, while the net interest income generated by our loan portfolio as a whole will continue to have a positive correlation to increases in LIBOR and we may enter into hedging transactions with respect to our fixed rate loans, the magnitude of positive correlations to increases in LIBOR is expected to decrease subsequent to the acquisition of this portfolio. See Note 15 to our consolidated financial statements for additional discussion of the loan portfolio acquisition and related financing thereof.
Loan Portfolio
Our loan portfolio investments are exposed to the risks related to interest rate fluctuations discussed above. Excluding the April loan portfolio acquisition, as of March 31, 2015, a 100 basis point increase in LIBOR would have increased our net income by $16.0 million per annum, or $0.27 per share, while a 10 basis point decrease in LIBOR would have decreased our net income by $1.1 million per annum, or $0.02 per share. The table below details our interest rate exposure to this portfolio ($ in thousands):
| March 31, 2015 | ||||
| Floating rate loans(1) |
$ | 4,977,468 | ||
| Floating rate debt(1)(2) |
(3,357,678 | ) | ||
|
|
|
|||
| Net floating rate exposure |
$ | 1,619,790 | ||
|
|
|
|||
| Net income impact from 100 bps increase in LIBOR(3) |
$ | 15,963 | ||
|
|
|
|||
| Per share amount, basic and diluted |
$ | 0.27 | ||
|
|
|
|||
| (1) | As of March 31, 2015, our floating rate loans and related liabilities were indexed to the various benchmark rates relevant in each case in terms of currency and payment frequency. Therefore the net exposure to each benchmark rate is in direct proportion to our net assets indexed to that rate. |
| (2) | Includes borrowings under revolving repurchase facilities, asset-specific repurchase agreements, and loan participations sold. |
| (3) | Annualized net income includes the impact of LIBOR floors for our loan receivable investments where such floors are paying relative to LIBOR of 0.18% as of March 31, 2015. |
Risk of Non-Performance
In addition to the risks related to fluctuations in asset values and cash flows associated with movements in interest rates, there is also the risk of non-performance on floating rate assets. In the case of a significant increase in interest rates, the additional debt service payments due from our borrowers may strain the operating cash flows of the collateral real estate assets and, potentially, contribute to non-performance or, in severe cases, default. This risk is partially mitigated by various facts we consider during our underwriting process, which in certain cases include a requirement for our borrower to purchase an interest rate cap contract.
Credit Risks
Our loans and investments are also subject to credit risk. The performance and value of our loans and investments depend upon the owners’ ability to operate the properties that serve as our collateral so that they produce cash flows adequate to pay interest and principal due to us. To monitor this risk, our Manager’s asset management team reviews our investment portfolios and in certain instances is in regular contact with our borrowers, monitoring performance of the collateral and enforcing our rights as necessary.
In addition, we are exposed to the risks generally associated with the commercial real estate market, including variances in occupancy rates, capitalization rates, absorption rates, and other macroeconomic factors beyond our control. We seek to manage these risks through our underwriting and asset management processes.
40
Table of Contents
Capital Market Risks
We are exposed to risks related to the equity capital markets, and our related ability to raise capital through the issuance of our class A common stock or other equity instruments. We are also exposed to risks related to the debt capital markets, and our related ability to finance our business through borrowings under credit facilities or other debt instruments. As a REIT, we are required to distribute a significant portion of our taxable income annually, which constrains our ability to accumulate operating cash flow and therefore requires us to utilize debt or equity capital to finance our business. We seek to mitigate these risks by monitoring the debt and equity capital markets to inform our decisions on the amount, timing, and terms of capital we raise.
Counterparty Risk
The nature of our business requires us to hold our cash and cash equivalents and obtain financing from various financial institutions. This exposes us to the risk that these financial institutions may not fulfill their obligations to us under these various contractual arrangements. We mitigate this exposure by depositing our cash and cash equivalents and entering into financing agreements with high credit-quality institutions.
The nature of our loans and investments also exposes us to the risk that our counterparties do not make required interest and principal payments on scheduled due dates. We seek to manage this risk through a comprehensive credit analysis prior to making an investment and active monitoring of the asset portfolios that serve as our collateral.
Currency Risk
Our loans and investments that are denominated in a foreign currency are also subject to risks related to fluctuations in currency rates. We mitigate this exposure by matching the currency of our foreign currency assets to the currency of the borrowings that finance those assets. As a result, we substantially reduce our exposure to changes in portfolio value related to changes in foreign currency rates. In certain circumstances, we may also enter into foreign currency derivative contracts to further mitigate this exposure.
The following table outlines our assets and liabilities that are denominated in a foreign currency (£/€ in thousands):
| March 31, 2015 | ||||||||||||
| Foreign currency assets |
£ | 412,151 | € | 101,963 | C$ | 150,965 | ||||||
| Foreign currency liabilities |
(329,324 | ) | (22,632 | ) | (105,807 | ) | ||||||
| Foreign currency contracts—notional |
— | — | (44,036 | ) | ||||||||
|
|
|
|
|
|
|
|||||||
| Net exposure to exchange rate fluctuations |
£ | 82,827 | € | 79,331 | C$ | 1,122 | ||||||
|
|
|
|
|
|
|
|||||||
We estimate that a 10% appreciation of the United States dollar relative to the British Pound Sterling and the Euro would result in a decline in our net assets in U.S. dollar terms of $12.3 million and $8.6 million, respectively, as of March 31, 2015. The majority of our net asset exposure to the Canadian Dollar has been hedged with foreign currency forward contracts.
41
Table of Contents
| ITEM 4. | CONTROLS AND PROCEDURES |
Evaluation of Disclosure Controls and Procedures
An evaluation of the effectiveness of the design and operation of our “disclosure controls and procedures” (as defined in Rule 13a-15(e) under the Securities Exchange Act of 1934, as amended (the “Exchange Act”)), as of the end of the period covered by this quarterly report on Form 10-Q was made under the supervision and with the participation of our management, including our Chief Executive Officer and Chief Financial Officer. Based upon this evaluation, our Chief Executive Officer and Chief Financial Officer have concluded that our disclosure controls and procedures (a) are effective to ensure that information required to be disclosed by us in reports filed or submitted under the Exchange Act is recorded, processed, summarized and reported within the time periods specified by SEC rules and forms and (b) include, without limitation, controls and procedures designed to ensure that information required to be disclosed by us in reports filed or submitted under the Exchange Act is accumulated and communicated to our management, including our Chief Executive Officer and Chief Financial Officer, as appropriate to allow timely decisions regarding required disclosure.
Changes in Internal Controls over Financial Reporting
There have been no significant changes in our “internal control over financial reporting” (as defined in Rule 13a-15(f) of the Exchange Act) that occurred during the period covered by this quarterly report on Form 10-Q that have materially affected, or are reasonably likely to materially affect, our internal control over financial reporting.
42
Table of Contents
| ITEM 1. | LEGAL PROCEEDINGS |
From time to time, we may be involved in various claims and legal actions arising in the ordinary course of business. As of March 31, 2015, we were not involved in any material legal proceedings.
| ITEM 1A. | RISK FACTORS |
Except as set forth below, there have been no material changes to the risk factors disclosed under Item 1A of our Annual Report on Form 10-K for the year ended December 31, 2014. The information below updates, and should be read in conjunction with, the risk factors and information disclosed under Item 1A of our Annual Report on Form 10-K for the year ended December 31, 2014.
Risks Related to the Loan Portfolio Acquisition
Blackstone’s, our Manager’s and third party service providers’ due diligence of the Loan Portfolio may not reveal all of the liabilities or negative conditions associated with the assets in the Loan Portfolio, which could lead to losses.
Affiliates of Blackstone, including our Manager, have reviewed and assessed various factors and characteristics that are material to the performance of the $4.6 billion portfolio of commercial mortgage loans secured by properties located in North America and Europe, or the Loan Portfolio, we propose to acquire from General Electric Capital Corporation and certain of its affiliates, which we refer to collectively as GE Capital. In making the assessment and otherwise conducting due diligence, Blackstone and our Manager will rely on the resources and information available to them. There can be no assurance that Blackstone’s and our Manager’s due diligence process will uncover all relevant facts or risks. It is possible that negative conditions will be revealed after the Loan Portfolio acquisition is consummated that adversely affect the value of our portfolio and financial performance.
If our Manager has overestimated the yields or incorrectly priced the risks of the Loan Portfolio, we may experience losses.
Our Manager has valued the Loan Portfolio based on expected yields and risks, taking into account estimated future losses on the mortgage loans and the underlying collateral, and the estimated impact of these losses on expected future cash flows and returns. Our Manager’s loss estimates may not prove accurate, as actual results may vary from estimates. In the event that our Manager has underestimated the asset level losses relative to the price we pay for a particular asset in the Loan Portfolio, we may experience losses with respect to such asset.
If any portion of our financing for the Loan Portfolio is unavailable, we may be forced to liquidate certain assets to pay for the Loan Portfolio acquisition or we may be unable to close the Loan Portfolio acquisition.
We intend to finance a substantial portion of the purchase price for the Loan Portfolio with equity and debt financing. We recently completed an underwritten registered offering of shares of our class A common stockr the Offering, in order to raise funds which we expect will be used to finance a portion of the purchase price for the Loan Portfolio, and we also expect to enter into a financing facility with Wells Fargo that will, subject to customary terms and conditions, provide for $4.0 billion of secured financing, or the Wells Fargo facility. Although we have entered into an agreement with Wells Fargo with respect to the Wells Fargo facility, we have not yet executed definitive documentation. Even after we have entered into definitive documentation for the Wells Fargo facility, there will be certain conditions that must be satisfied or waived in order for closing of such financing to occur, and there is a risk these conditions will not be satisfied. In the event that the financing contemplated by the Wells Fargo facility or any other suitable financing is not available to us, we may be required to obtain alternative financing on terms that are less favorable to us than those contemplated by the Wells Fargo facility. If other financing becomes necessary and we are unable to secure such other financing on acceptable terms or in a timely manner, we may be forced to liquidate certain of the loans in our existing portfolio in order to pay the purchase price of the Loan Portfolio acquisition, which could have an adverse effect on our results of operations and financial condition, or we may be unable to close the acquisition at all. In addition, in the event we are unable to close the acquisition at all, we may be liable for damages to other purchasers under the Purchase and Sale Agreement, including certain affiliates of Blackstone for an amount not to exceed the $1.5 billion termination fee.
43
Table of Contents
To the extent the acquired loans in the Loan Portfolio are repaid on or before their maturity dates, we will bear reinvestment risk.
Of the assets we are purchasing in the Loan Portfolio, approximately 41.3% (by unpaid principal balance as of March 31, 2015) are open to repayment and an additional 4.6% (by unpaid principal balance as of March 31, 2015) are scheduled to mature in 2015. In addition, borrowers may repay their loans prior to their stated maturities. As such loans are repaid, we will have to redeploy the proceeds we receive in repayment. It is possible that we will fail to identify reinvestment options that would provide returns or a risk profile that is comparable to the asset that was repaid. We would expect to either redeploy the proceeds we receive to originate and acquire loans that meet our investment criteria or repay borrowings under our credit facilities. If we fail to redeploy the proceeds we receive in repayment of a loan in equivalent or better alternatives, our financial performance and returns to investors could suffer.
The Loan Portfolio acquisition will significantly increase the size and change the mix of our portfolio of assets, and we may be unable to successfully integrate the new assets or manage our growth effectively, which could have a material adverse effect on our results of operations and financial condition.
The Loan Portfolio acquisition will significantly increase the size and change the mix of our portfolio of assets. We may be unable to successfully and efficiently integrate the newly-acquired assets into our existing portfolio or otherwise effectively manage our assets or our growth effectively. We may prove to lack the resources required to effectively manage our assets, particularly to the extent the assets become stressed. Under these circumstances, our results of operations and financial condition may be materially adversely affected.
Certain loans in the Loan Portfolio are concentrated in terms of geography, asset types, and sponsors.
The Loan Portfolio acquisition contemplates the purchase by us of certain assets that are concentrated in certain property types which may be subject to a higher risk of default or foreclosure, or are secured by properties concentrated in a limited number of geographic locations. To the extent that assets in the Loan Portfolio are concentrated in any one region or type of asset, downturns generally relating to such type of asset or region may result in defaults on a number of our investments within a short time period, which could adversely affect our results of operations and financial condition. In addition, because of this asset concentration, even modest changes in the value of the underlying real estate assets could have a significant impact on the value of our stockholders’ investment. As a result of this high level of concentration, any adverse economic, political or other conditions that disproportionately affects those geographic areas or asset classes could have a magnified adverse effect on our results of operations and financial condition, and the value of our stockholders’ investments could vary more widely than if we invested in a more diverse portfolio of loans. Please refer to exhibit 99.1 to our Current Report on Form 8-K filed on April 13, 2015 for further details on the property type and geographic distribution of properties securing the Loan Portfolio.
We may need to foreclose on certain of the loans we will acquire as part of the Loan Portfolio acquisition, which could result in losses that harm our results of operations and financial condition.
If we foreclose on an asset, we may take title to the property securing that asset, and if we do not or cannot sell the property, we would then come to own and operate it as “real estate owned.” Owning and operating real property involves risks that are different (and in many ways more significant) than the risks faced in owning an asset secured by that property. In addition, we may end up owning a property that we would not otherwise have decided to acquire directly at the price of our original investment or at all, and the liquidation proceeds upon sale of the underlying real estate may not be sufficient to recover our cost basis in the loan, resulting in a loss to us. For example, approximately 30.6% of the loans comprising the Loan Portfolio are secured by mobile home parks. Housing communities such as mobile home parks are “special purpose” properties that cannot be readily converted to general residential, retail or office use, and this may adversely affect the liquidation value of the property if its operation as a mobile home park becomes unprofitable due to competition, age of the improvements or other factors. As a result, if we foreclose on and come to own certain of these properties, our financial performance and returns to investors could suffer.
A substantial portion of the Loan Portfolio consists of fixed-rate loans that may be subject to fluctuations in interest rates that may not be adequately protected, or protected at all, by our hedging strategies.
Approximately $2.2 billion of the aggregate principal amount of the Loan Portfolio consists of loans with fixed interest rates. Fixed interest rate investments do not have adjusting interest rates and the relative value of the fixed
44
Table of Contents
cash flows from these investments will decrease as prevailing interest rates rise or increase as prevailing interest rates fall, causing potentially significant changes in value. We may employ various hedging strategies to limit the effects of changes in interest rates (and in some cases credit spreads), including engaging in interest rate swaps, caps, floors and other interest rate derivative products. We cannot make assurances that we will be able to enter into hedging transactions or that such hedging transactions will adequately protect us against the foregoing risks.
Certain of the assets in the Loan Portfolio consists of assets denominated in foreign currencies and subject us to increased foreign currency risks.
Approximately 15.1%, 9.5%, and 7.2% of the loans in the Loan Portfolio by value are denominated in Canadian dollars, British pounds sterling and Euros, respectively, which exposes us to increased foreign currency risk. As a result, a change in foreign currency exchange rates may have an adverse impact on the valuation of our assets, as well as our income and distributions. Any such changes in foreign currency exchange rates may impact the measurement of such assets or income for the purposes of our real estate investment trust tests and may affect the amounts available for payment of dividends on our class A common stock.
We must manage our portfolio so that we do not become an investment company that is subject to regulation under the Investment Company Act of 1940, as amended, or the Investment Company Act. Although we expect that following the Loan Portfolio acquisition we will continue to not be an investment company that is subject to regulation under the Investment Company Act, there can be no assurance that this will be the case.
We conduct our operations so that we avail ourselves of the statutory exclusion provided in Section 3(c)(5)(C) for companies engaged primarily in investment in mortgages and other liens on or interests in real estate. In order to qualify for this exclusion, we must maintain, on the basis of positions taken by the SEC’s Division of Investment Management (the “Division”), in interpretive and no-action letters, a minimum of 55% of the value of our total assets in mortgage loans and other related assets that are considered “mortgages and other liens on and interests in real estate,” which we refer to as Qualifying Interests, and a minimum of 80% in Qualifying Interests and real estate-related assets. In the absence of SEC or Division guidance that supports the treatment of other investments as Qualifying Interests, we will treat those other investments appropriately as real estate-related assets or miscellaneous assets depending on the circumstances.
Because registration as an investment company would significantly affect our ability to engage in certain transactions or be structured in the manner we currently are, we intend to conduct our business so that we will continue to satisfy the requirements to avoid regulation as an investment company. If, however, as a result of the assets to be acquired by us upon consummation of the Loan Portfolio acquisition, we do not meet these requirements, we could be forced to find alternative buyers for the non-Qualifying Interest assets subject to the Loan Portfolio acquisition or alter our investment portfolios by selling or otherwise disposing of a substantial portion of the assets that do not satisfy the applicable requirements or by acquiring a significant position in assets that are Qualifying Interests. In the past, when required due to the mix of assets in our balance sheet portfolio, and in connection with our reliance on the Section 3(c)(5)(C) exclusion, we have purchased agency residential mortgage-backed securities that represent the entire beneficial interests in the underlying pools of whole residential mortgage loans, which are treated as Qualifying Interests based on the Division’s positions. Such investments may not represent an optimum use of capital when compared to the available investments we and our subsidiaries target pursuant to our investment strategy. These investments present additional risks to us, and these risks are compounded by our inexperience with such investments. We continue to analyze our investments and may acquire other pools of whole loan residential mortgage-backed securities when and if required for compliance purposes. To the extent we must find alternative buyers for the non-Qualifying Interest assets, we may not realize all of the benefits of the Loan Portfolio acquisition. Altering our portfolio in this manner may have an adverse effect on our investments if we are forced to dispose of or acquire assets in an unfavorable market, and may adversely affect our stock price.
If it were established that, following the consummation of the Loan Portfolio acquisition, we were an unregistered investment company, there would be a risk that we would be subject to monetary penalties and injunctive relief in an action brought by the SEC, that we would be unable to enforce contracts with third parties, that third parties could seek to obtain rescission of transactions undertaken during the period it was established that we were an unregistered investment company, and that we would be subject to limitations on corporate leverage that would have an adverse impact on our investment returns. In order to comply with provisions that allow us to avoid the consequences of
45
Table of Contents
registration under the Investment Company Act, we may need to forego otherwise attractive opportunities and limit the manner in which we conduct our operations. Thus, compliance with the requirements of the Investment Company Act may hinder our ability to operate solely on the basis of maximizing profits.
The Loan Portfolio acquisition could place strains on the Manager, its employees, its information systems and its internal controls, which may adversely impact our business.
The Loan Portfolio acquisition may place significant demands on our Manager’s administrative, operational, asset management, financial and other resources. Any failure to manage our increased size effectively could seriously harm our business. To be successful, we will need to continue to implement management information systems and improve our operating, asset management, administrative, financial and accounting systems and controls. These processes are time-consuming and expensive, increase management responsibilities and divert management attention, and we may not realize a return on our investment in these processes.
Consummation of the Loan Portfolio acquisition is subject to conditions precedent and dependent in part on the actions of third parties we do not control and whose actions may subject us to liability. Failure to consummate the Loan Portfolio acquisition could materially impede our growth prospects, negatively impact our stock price or future business and financial results, and require us to find alternative uses for the proceeds of the Offering.
Consummation of the Loan Portfolio acquisition is subject to conditions precedent and dependent in part on the actions of third parties to the Transaction Agreements who we do not control, and if we or the other parties to the Transaction Agreements fail to fulfill these conditions, it is possible that the closing of the Loan Portfolio acquisition could be delayed or might not occur at all. In addition, actions or failures to act by such third parties, including certain affiliates of our Manager, could expose us to claims for damages, financial penalties and reputational harm.
The Offering was not conditioned upon the closing of the Loan Portfolio acquisition. Accordingly, if the Loan Portfolio acquisition does not close and we do not purchase the Loan Portfolio and recognize the benefits that we believe the Loan Portfolio acquisition presents, a purchaser of our class A common stock will not receive any refund of its investment. Instead, we would be required to deploy the proceeds of the Offering to one or more alternative investments or repay certain indebtedness, and our decisions in respect of these investments would generally not be subject to stockholder approval. These alternative investments may not be readily available to us, especially in light of the size of the Offering relative to our previous offerings, or may yield lower returns than the Loan Portfolio assets. Further, if the closing of the Loan Portfolio acquisition is delayed, we are likely to invest the proceeds of the Offering in instruments that do not offer the returns we expect to achieve from the Loan Portfolio, which would cause our near term financial performance to suffer. We may also use the proceeds of the Offering to engage in repurchases of our outstanding shares of class A common stock. Under the circumstances described above, our growth prospects may be materially impeded.
In addition, if the Loan Portfolio acquisition is not completed, we will still be required to pay certain costs relating to the Loan Portfolio acquisition, whether or not the Loan Portfolio acquisition is completed, such as legal, accounting and financial advisor fees, and matters relating to the Loan Portfolio acquisition may require substantial commitments of time and resources by our Manager, which could otherwise have been devoted to other opportunities that may have been beneficial to us. In addition, we may experience negative reactions from the financial markets. We also could be subject in some circumstances to stockholder or other litigation relating to the failure to complete the acquisition.
46
Table of Contents
| ITEM 2. | UNREGISTERED SALES OF EQUITY SECURITIES AND USE OF PROCEEDS |
None.
| ITEM 3. | DEFAULTS UPON SENIOR SECURITIES |
None.
| ITEM 4. | MINE SAFETY DISCLOSURES |
Not applicable.
| ITEM 5. | OTHER INFORMATION |
Section 13(r) Disclosure
Pursuant to Section 219 of the Iran Threat Reduction and Syria Human Rights Act of 2012, or ITRA, which added Section 13(r) of the Exchange Act, we hereby incorporate by reference herein Exhibit 99.1 of this report, which includes disclosures publicly filed by Travelport Worldwide Limited, which may be considered an affiliate of Blackstone and therefore our affiliate.
47
Table of Contents
| 10.1 | Amendment No. 2 to Master Repurchase Agreement, dated as of June 30, 2014, by and among Parlex 1 Finance, LLC, Parlex 3 Finance, LLC, and Bank of America, N.A. | |
| 10.2 | Amendment No. 3 to Master Repurchase Agreement, dated as of March 27, 2015, by and among Parlex 1 Finance, LLC, Parlex 3 Finance, LLC, and Bank of America, N.A. | |
| 10.3 | Amendment No. 2 to Master Repurchase Agreement, dated as of June 27, 2014, between Parlex 4 Finance, LLC and JPMorgan Chase Bank, National Association | |
| 10.4 | Amendment No. 1 to Master Repurchase Agreement, dated as of June 27, 2014, among Parlex 4 UK Finco, LLC, Parlex 4 Finance, LLC, and JPMorgan Chase Bank, National Association | |
| 10.5 | Amendment No. 2 to Master Repurchase Agreement, dated as of January 14, 2015, among Parlex 4 UK Finco, LLC, Parlex 4 Finance, LLC, and JPMorgan Chase Bank, National Association | |
| 10.6 | Amendment No. 1 to Master Repurchase Agreement, dated as of February 24, 2015, by and between Parlex 7 Finco, LLC and Metropolitan Life Insurance Company | |
| 10.7 | Amended and Restated Master Repurchase and Securities Contract, dated as of April 4, 2014, between Parlex 5 Finco, LLC and Wells Fargo Bank, National Association | |
| 10.8 | Amendment No. 1 to Amended and Restated Master Repurchase and Securities Contract, dated as of October 23, 2014, between Parlex 5 Finco, LLC and Wells Fargo Bank, National Association | |
| 10.9 | Amendment No. 2 to Amended and Restated Master Repurchase and Securities Contract, dated as of March 13, 2015, between Parlex 5 Finco, LLC and Wells Fargo Bank, National Association | |
| 31.1 | Certification of Chief Executive Officer, as adopted pursuant to Section 302 of the Sarbanes-Oxley Act of 2002 | |
| 31.2 | Certification of Chief Financial Officer, as adopted pursuant to Section 302 of the Sarbanes-Oxley Act of 2002 | |
| 32.1 + | Certification of Chief Executive Officer, pursuant to 18 U.S.C. Section 1350, as adopted pursuant to Section 906 of the Sarbanes-Oxley Act of 2002 | |
| 32.2 + | Certification of Chief Financial Officer, pursuant to 18 U.S.C. Section 1350, as adopted pursuant to Section 906 of the Sarbanes-Oxley Act of 2002 | |
| 99.1 | Section 13(r) Disclosure | |
| 101.INS | XBRL Instance Document | |
| 101.SCH | XBRL Taxonomy Extension Schema Document | |
| 101.CAL | XBRL Taxonomy Extension Calculation Linkbase Document | |
| 101.LAB |
XBRL Taxonomy Extension Label Linkbase Document | |
| 101.PRE | XBRL Taxonomy Extension Presentation Linkbase Document | |
| 101.DEF |
XBRL Taxonomy Extension Definition Linkbase Document | |
| + | This exhibit shall not be deemed “filed” for purposes of Section 18 of the Securities Exchange Act of 1934, as amended (the “Exchange Act”) or otherwise subject to the liability of that Section. Such exhibit shall not be deemed incorporated into any filing under the Securities Act of 1933, as amended (the “Securities Act”), or the Exchange Act. |
The agreements and other documents filed as exhibits to this report are not intended to provide factual information or other disclosure other than with respect to the terms of the agreements or other documents themselves, and you should not rely on them for that purpose. In particular, any representations and warranties made by us in these agreements or other documents were made solely within the specific context of the relevant agreement or document and may not describe the actual state of affairs as of the date they were made or at any other time.
48
Table of Contents
Pursuant to the requirements of the Securities Exchange Act of 1934, the registrant has duly caused this report to be signed on its behalf by the undersigned thereunto duly authorized.
| BLACKSTONE MORTGAGE TRUST, INC. | ||||
| April 28, 2015 |
/s/ Stephen D. Plavin | |||
| Date | Stephen D. Plavin | |||
| Chief Executive Officer | ||||
| (Principal Executive Officer) | ||||
| April 28, 2015 |
/s/ Paul D. Quinlan | |||
| Date | Paul D. Quinlan | |||
| Chief Financial Officer | ||||
| (Principal Financial Officer) | ||||
| April 28, 2015 |
/s/ Anthony F. Marone, Jr. | |||
| Date | Anthony F. Marone, Jr. | |||
| Principal Accounting Officer | ||||
49