Attached files
| file | filename |
|---|---|
| EX-32.2 - EX-32.2 - BLACKSTONE MORTGAGE TRUST, INC. | d470827dex322.htm |
| EX-32.1 - EX-32.1 - BLACKSTONE MORTGAGE TRUST, INC. | d470827dex321.htm |
| EX-31.2 - EX-31.2 - BLACKSTONE MORTGAGE TRUST, INC. | d470827dex312.htm |
| EX-31.1 - EX-31.1 - BLACKSTONE MORTGAGE TRUST, INC. | d470827dex311.htm |
| EX-23.1 - EX-23.1 - BLACKSTONE MORTGAGE TRUST, INC. | d470827dex231.htm |
| EX-21.1 - EX-21.1 - BLACKSTONE MORTGAGE TRUST, INC. | d470827dex211.htm |
| EX-10.2 - EX-10.2 - BLACKSTONE MORTGAGE TRUST, INC. | d470827dex102.htm |
Table of Contents
UNITED STATES
SECURITIES AND EXCHANGE COMMISSION
WASHINGTON, D.C. 20549
FORM 10-K
| ☒ | ANNUAL REPORT PURSUANT TO SECTION 13 OR 15(d) OF THE SECURITIES EXCHANGE ACT OF 1934 For the fiscal year ended December 31, 2017 |
| ☐ | TRANSITION REPORT PURSUANT TO SECTION 13 OR 15(d) OF THE SECURITIES EXCHANGE ACT OF 1934 For the Transition period from to |
Commission file number 1-14788

Blackstone Mortgage Trust, Inc.
(Exact name of Registrant as specified in its charter)
| Maryland | 94-6181186 | |
| (State or other jurisdiction of incorporation or organization) |
(I.R.S. Employer Identification No.) |
345 Park Avenue, 42nd Floor
New York, New York 10154
(Address of principal executive offices)(Zip Code)
Registrant’s telephone number, including area code: (212) 655-0220
Securities registered pursuant to Section 12(b) of the Act:
| Title of each class |
Name of each exchange on which registered | |
| Class A common stock, par value $0.01 per share | New York Stock Exchange |
Securities registered pursuant to Section 12(g) of the Act: None
Indicate by check mark if the registrant is a well-known seasoned issuer, as defined in Rule 405 of the Securities Act. Yes ☒ No ☐
Indicate by check mark if the registrant is not required to file reports pursuant to Section 13 or Section 15(d) of the Act. Yes ☐ No ☒
Indicate by check mark whether the registrant (1) has filed all reports required to be filed by Section 13 or 15(d) of the Securities Exchange Act of 1934 during the preceding 12 months (or for such shorter period that the registrant was required to file such reports), and (2) has been subject to such filing requirements for the past 90 days. Yes ☒ No ☐
Indicate by check mark whether the registrant has submitted electronically and posted on its corporate Website, if any, every Interactive Data File required to be submitted and posted pursuant to Rule 405 of Regulation S-T (§232.405 of this chapter) during the preceding 12 months (or for such shorter period that the registrant was required to submit and post such files). Yes ☒ No ☐ (not required)
Indicate by check mark if disclosure of delinquent filers pursuant to Item 405 of Regulation S-K (§229.405 of this chapter) is not contained herein, and will not be contained, to the best of registrant’s knowledge, in definitive proxy or information statements incorporated by reference in Part III of this Form 10-K or any amendment to this Form 10-K. ☐
Indicate by check mark whether the registrant is a large accelerated filer, an accelerated filer, a non-accelerated filer, a smaller reporting company, or an emerging growth company. See the definitions of “large accelerated filer,” “accelerated filer,” “smaller reporting company,” and “emerging growth company” in Rule 12b-2 of the Exchange Act. (Check one):
| Large accelerated filer | ☒ | Accelerated filer | ☐ | |||
| Non-accelerated filer | ☐ | Smaller reporting company | ☐ | |||
| Emerging growth company | ☐ | |||||
If an emerging growth company, indicate by check mark if the registrant has elected not to use the extended transition period for complying with any new or revised financial accounting standards provided pursuant to Section 13(a) of the Exchange Act. ☐
Indicate by check mark whether the registrant is a shell company (as defined in Rule 12b-2 of the Act). Yes ☐ No ☒
The aggregate market value of the outstanding class A common stock held by non-affiliates of the registrant was approximately $2.8 billion as of June 30, 2017 (the last business day of the registrant’s most recently completed second fiscal quarter) based on the closing sale price on the New York Stock Exchange on that date.
As of February 6, 2018, there were 108,194,090 outstanding shares of class A common stock. The class A common stock is listed on the New York Stock Exchange (trading symbol “BXMT”).
DOCUMENTS INCORPORATED BY REFERENCE
Part III of this annual report on Form 10-K incorporates information by reference from the registrant’s definitive proxy statement with respect to its 2018 annual meeting of stockholders to be filed with the Securities and Exchange Commission within 120 days after the close of the registrant’s fiscal year.
Table of Contents
Table of Contents
| ITEM 1. | BUSINESS |
References herein to “Blackstone Mortgage Trust,” “company,” “we,” “us,” or “our” refer to Blackstone Mortgage Trust, Inc., a Maryland corporation, and its subsidiaries unless the context specifically requires otherwise.
Our Company
Blackstone Mortgage Trust is a real estate finance company that originates senior loans collateralized by commercial real estate in North America and Europe. Our investment objective is to preserve and protect shareholder capital while producing attractive risk-adjusted returns primarily through dividends generated from current income from our loan portfolio. We are externally managed by BXMT Advisors L.L.C., or our Manager, a subsidiary of The Blackstone Group L.P., or Blackstone, and are a real estate investment trust, or REIT, traded on the New York Stock Exchange, or NYSE, under the symbol “BXMT.” Our principal executive offices are located at 345 Park Avenue, 42nd Floor, New York, New York 10154. We were incorporated in Maryland in 1998, when we reorganized from a California common law business trust into a Maryland corporation.
We conduct our operations as a REIT for U.S. federal income tax purposes. We generally will not be subject to U.S. federal income taxes on our taxable income to the extent that we annually distribute all of our net taxable income to stockholders and maintain our qualification as a REIT. We also operate our business in a manner that permits us to maintain an exclusion from registration under the Investment Company Act of 1940, as amended, or the Investment Company Act. We are organized as a holding company and conduct our business primarily through our various subsidiaries. We operate our business as one segment, which originates and acquires commercial mortgage loans and related investments.
Our Manager
We are externally managed and advised by our Manager, which is responsible for administering our business activities, day-to-day operations, and providing us the services of our executive management team, investment team, and appropriate support personnel.
Our Manager is a part of Blackstone’s alternative asset management business, which includes the management of investment vehicles focused on private equity, real estate, public debt and equity, non-investment grade credit, real assets, and secondary funds, all on a global basis. Through its different businesses, Blackstone had total assets under management of $434.1 billion as of December 31, 2017.
In connection with the performance of its duties, our Manager benefits from the resources, relationships, and expertise of the 426 professionals in Blackstone’s global real estate group, which is the largest private equity real estate manager in the world with $115.3 billion of investor capital under management as of December 31, 2017. Jonathan D. Gray, who is the global head of Blackstone’s real estate group, is a member of the board of directors of Blackstone and is a member of our Manager’s investment committee.
Blackstone Real Estate Debt Strategies, or BREDS, was launched in 2008 within Blackstone’s global real estate group to pursue opportunities relating to debt and preferred equity investments globally, with a focus on North America and Europe. Michael B. Nash, the global chairman of BREDS, serves as the executive chairman of our board of directors and is a member of our Manager’s investment committee. In addition, Jonathan Pollack, the global head of BREDS, serves as one of our directors and is also a member of our Manager’s investment committee. As of December 31, 2017, 97 dedicated BREDS professionals, including 12 investment professionals based in London and Australia, managed $15.4 billion of investor capital.
Our chief executive officer, chief financial officer, and other executive officers are senior Blackstone real estate professionals. None of our Manager, our executive officers, or other personnel supplied to us by our Manager is
1
Table of Contents
obligated to dedicate any specific amount of time to our business. Our Manager is subject to the supervision and oversight of our board of directors and has only such functions and authority as our board of directors delegates to it. Pursuant to a management agreement between our Manager and us, or our Management Agreement, our Manager is entitled to receive a base management fee, an incentive fee, and expense reimbursements. See Notes 12 and 17 to our consolidated financial statements and Item 13 “Certain Relationships and Related Transactions, and Director Independence” in this Annual Report on Form 10-K for more detail on the terms of the Management Agreement.
Our Investment Strategy
Our investment strategy is to originate loans and invest in debt and related instruments supported by institutional quality commercial real estate in attractive locations. Through our Manager, we draw on Blackstone’s extensive real estate debt investment platform and its established sourcing, underwriting, and structuring capabilities in order to execute our investment strategy. In addition, we have access to Blackstone’s extensive network and Blackstone’s substantial real estate and other investment holdings, which provide our Manager access to market data on a scale not available to many competitors. While the majority of our capital will likely continue to be invested in North America and Europe, we expect to benefit from Blackstone’s global real estate debt platform.
We directly originate, co-originate, and acquire debt instruments in conjunction with acquisitions, refinancings, and recapitalizations of commercial real estate in North America and Europe. In the case of loans we acquire, we focus on performing loans that are supported by well-capitalized properties and portfolios. We believe that the scale and flexibility of our capital, as well as our Manager’s and Blackstone’s relationships, enables us to target opportunities with strong sponsorship and invest in large loans or other debt that is collateralized by high-quality assets and portfolios.
As market conditions evolve over time, we expect to adapt as appropriate. We believe our current investment strategy will produce significant opportunities to make investments with attractive risk-return profiles. However, to capitalize on the investment opportunities that may be present at various other points of an economic cycle, we may expand or change our investment strategy by targeting assets such as subordinate mortgage loans, mezzanine loans, preferred equity, real estate securities and note financings.
We believe that the diversification of our investment portfolio, our ability to actively manage those investments, and the flexibility of our strategy positions us to generate attractive returns for our stockholders in a variety of market conditions over the long term.
Our Portfolio
Our business is currently focused on originating or acquiring senior, floating rate mortgage loans that are secured by a first priority mortgage on commercial real estate assets primarily in the office, lodging, retail, residential, and industrial sectors in North America and Europe. These investments may be in the form of whole loans, pari passu participations within mortgage loans, or other similar structures. Although originating senior, floating rate mortgage loans is our primary area of focus, we also originate and acquire fixed rate loans and subordinate loans, including subordinate mortgage interests and mezzanine loans. This focused lending strategy is designed to generate attractive current income while protecting investors’ capital.
2
Table of Contents
During the year ended December 31, 2017, we originated and acquired $4.8 billion of loans. Loan fundings during the year totaled $4.1 billion, with repayments of $3.0 billion, for net fundings of $1.1 billion. The following table details the overall statistics of our current loan portfolio as of December 31, 2017 ($ in thousands):
| Total Loan Exposure(1) | ||||||||||||||||
| Balance Sheet Portfolio |
Total Loan Portfolio |
Floating Rate Loans |
Fixed Rate Loans |
|||||||||||||
| Number of loans |
110 | 110 | 104 | 6 | ||||||||||||
| Principal balance |
$ | 10,108,226 | $ | 11,093,608 | $ | 10,421,270 | $ | 672,338 | ||||||||
| Net book value |
$ | 10,056,732 | $ | 11,039,365 | $ | 10,367,655 | $ | 671,710 | ||||||||
| Unfunded loan commitments(2) |
$ | 1,573,107 | $ | 1,612,772 | $ | 1,612,772 | $ | — | ||||||||
| Weighted-average cash coupon(3) |
5.55 | % | 5.38 | % | L+3.92 | % | 4.64 | % | ||||||||
| Weighted-average all-in yield(3) |
5.95 | % | 5.83 | % | L+4.33 | % | 5.71 | % | ||||||||
| Weighted-average maximum |
3.5 | 3.5 | 3.5 | 4.0 | ||||||||||||
| Loan to value (LTV)(5) |
61.7 | % | 61.0 | % | 60.4 | % | 70.2 | % | ||||||||
| (1) | In certain instances, we finance our loans through the non-recourse sale of a senior loan interest that is not included in our consolidated financial statements. Total loan exposure encompasses the entire loan we originated and financed, including $985.4 million of such non-consolidated senior interests that are not included in our balance sheet portfolio. |
| (2) | Unfunded commitments will primarily be funded to finance property improvements or lease-related expenditures by the borrowers. These future commitments will be funded over the term of each loan, subject in certain cases to an expiration date. |
| (3) | As of December 31, 2017, our floating rate loans were indexed to various benchmark rates, with 93% of floating rate loans by loan exposure indexed to USD LIBOR based on total loan exposure. In addition to cash coupon, all-in yield includes the amortization of deferred origination and extension fees, loan origination costs, and purchase discounts, as well as the accrual of exit fees. Cash coupon and all-in yield for the total portfolio assume applicable floating benchmark rates as of December 31, 2017 for weighted-average calculation. |
| (4) | Maximum maturity assumes all extension options are exercised by the borrower, however our loans may be repaid prior to such date. As of December 31, 2017, based on total loan exposure, 73% of our loans were subject to yield maintenance or other prepayment restrictions and 27% were open to repayment by the borrower without penalty. |
| (5) | Based on LTV as of the dates loans were originated or acquired by us. |
3
Table of Contents
The charts below detail the geographic distribution and types of properties securing these loans, as of December 31, 2017:
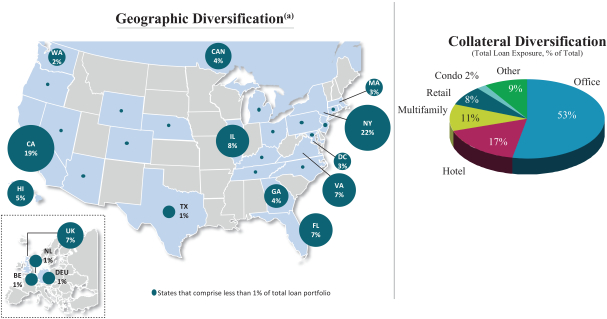
For additional information regarding our loan portfolio as of December 31, 2017, see Item 7 – “Management’s Discussion and Analysis of Financial Condition and Results of Operations – II. Loan Portfolio” and – “VI. Loan Portfolio Details” in this Annual Report on Form 10-K.
Financing Strategy
In addition to raising capital through public offerings of our equity and debt securities, our financing strategy includes credit facilities, the GE portfolio acquisition facility, asset-specific financings, a revolving credit agreement, loan participations sold, non-consolidated senior interests, and securitized debt obligations. In addition to our current mix of financing sources, we may also access additional forms of financings including resecuritizations and public and private, secured and unsecured debt issuances by us or our subsidiaries.
During the year ended December 31, 2017, we completed an underwritten public offering of 12,420,000 shares of our class A common stock, providing aggregate net proceeds of $391.6 million, and we issued $402.5 million aggregate principal amount of convertible notes with a coupon rate of 4.375% and an initial conversion price of $35.67.
4
Table of Contents
During the year ended December 31, 2017, we also (i) financed a portion of our loans through the issuance of collateralized loan obligations and a single asset securitization vehicle, providing an aggregate $1.3 billion of financing, (ii) added two new credit facilities, providing an aggregate $450.0 million of credit capacity, (iii) increased the maximum facility size of two of our existing credit facilities, providing an additional £250.0 million and €250.0 million of credit capacity, respectively, and (iv) converted one of our asset-specific financings to a $500.0 million credit facility. The following table details our outstanding financing arrangements as of December 31, 2017 ($ in thousands):
| Portfolio Financing Outstanding Principal Balance |
||||
| December 31, 2017 | ||||
| Credit facilities |
$ | 4,068,249 | ||
| GE portfolio acquisition facility |
703,423 | |||
| Asset-specific financings |
518,864 | |||
| Revolving credit agreement |
— | |||
| Loan participations sold |
80,706 | |||
| Non-consolidated senior interests(1) |
985,382 | |||
| Securitized debt obligations |
1,292,120 | |||
|
|
|
|||
| Total portfolio financing |
$ | 7,648,744 | ||
|
|
|
|||
| (1) | These non-consolidated senior interests provide structural leverage for our net investments which are reflected in the form of mezzanine loans or other subordinate interests on our balance sheet and in our results of operations. |
The amount of leverage we employ for particular assets will depend upon our Manager’s assessment of the credit, liquidity, price volatility, and other risks of those assets and the related financing counterparties, the availability of particular types of financing at the time, and the financial covenants under our credit facilities. Our decision to use leverage to finance our assets will be at the discretion of our Manager and will not be subject to the approval of our stockholders. We currently expect that our leverage will not exceed, on a debt to equity basis, a ratio of 4-to-1. We will endeavor to match the terms, currency, and indices of our assets and liabilities, including in certain instances through the use of derivatives. We will also seek to limit the risks associated with recourse borrowing.
Subject to maintaining our qualification as a REIT, from time to time, we engage in hedging transactions that seek to mitigate the effects of fluctuations in interest rates or currencies and their effects on our cash flows. These hedging transactions could take a variety of forms, including interest rate or currency swaps or cap agreements, options, futures contracts, forward rate or currency agreements or similar financial instruments.
5
Table of Contents
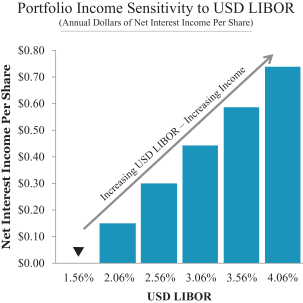
Floating Rate Portfolio
Generally, our business model is such that rising interest rates will increase our net income, while declining interest rates will decrease net income. As of December 31, 2017, 94% of our loans by total loan exposure earned a floating rate of interest and were financed with liabilities that pay interest at floating rates, which resulted in an amount of net equity that is positively correlated to rising interest rates, subject to the impact of interest rate floors on certain of our floating rate loans. As of December 31, 2017, the remaining 6% of our loans by total loan exposure earned a fixed rate of interest, but are financed with liabilities that pay interest at floating rates, which resulted in a negative correlation to rising interest rates to the extent of our financing. In certain instances where we have financed fixed rate assets with floating rate liabilities, we have purchased interest rate swaps or caps to limit our exposure to increases in interest rates on such liabilities. The following table shows how an increase in the USD LIBOR rate would affect our net interest income per share per annum:
Investment Guidelines
Our board of directors has approved the following investment guidelines:
| • | our Manager shall seek to invest our capital in a broad range of investments in, or relating to, public and/or private debt, non-controlling equity, loans and/or other interests (including “mezzanine” interests and/or options or derivatives) relating to real estate assets (including pools thereof), real estate companies, and/or real estate-related holdings; |
| • | prior to the deployment of capital into investments, our Manager may cause our capital to be invested in any short-term investments in money market funds, bank accounts, overnight repurchase agreements with primary federal reserve bank dealers collateralized by direct U.S. government obligations and other instruments or investments reasonable determined by our Manager to be of high quality; |
| • | not more than 25% of our equity, as defined in the Management Agreement with our Manager, will be invested in any individual investment without the approval of a majority of the investment risk management committee of our board of directors (it being understood, however, that for purposes of the foregoing concentration limit, in the case of any investment that is comprised (whether through a structured investment vehicle or other arrangement) of securities, instruments or assets of multiple portfolio issuers, such investment for purposes of the foregoing limitation shall be deemed to be multiple investments in such underlying securities, instruments and assets and not such particular vehicle, product or other arrangement in which they are aggregated); |
6
Table of Contents
| • | any investment in excess of $300.0 million shall require the approval of a majority of the investment risk management committee of our board of directors; |
| • | no investment shall be made that would cause us to fail to qualify as a REIT under the Internal Revenue Code of 1986, as amended, or the Internal Revenue Code; and |
| • | no investment shall be made that would cause us or any of our subsidiaries to be regulated as an investment company under the Investment Company Act. |
These investment guidelines may be amended, restated, modified, supplemented or waived upon the approval of a majority of our board of directors, which must include a majority of the independent directors, without the approval of our stockholders.
Competition
We are engaged in a competitive business. In our lending and investing activities, we compete for opportunities with a variety of institutional lenders and investors, including other REITs, specialty finance companies, public and private funds (including other funds managed by Blackstone and its affiliates), commercial and investment banks, commercial finance and insurance companies and other financial institutions. Several other REITs and other investment vehicles have raised significant amounts of capital, and may have investment objectives that overlap with ours, which may create additional competition for lending and investment opportunities. Some competitors may have a lower cost of funds and access to funding sources, such as the U.S. Government, that are not available to us. Many of our competitors are not subject to the operating constraints associated with REIT compliance or maintenance of an exclusion from regulation under the Investment Company Act. We could face increased competition from banks due to future legislative developments, such as amendments to key provisions of the Dodd-Frank Act, including provisions setting forth capital and risk retention requirements. In addition, some of our competitors may have higher risk tolerances or different risk assessments, which could allow them to consider a wider variety of loans and investments and offer more attractive pricing or other terms than we would. Furthermore, competition for originations of and investments in assets we target may lead to decreasing yields, which may further limit our ability to generate targeted returns.
In the face of this competition, we have access to our Manager’s and Blackstone’s professionals and their industry expertise and relationships, which we believe provide us with a competitive advantage and help us assess risks and determine appropriate pricing for potential investments. We believe these relationships will enable us to compete more effectively for attractive investment opportunities. However, we may not be able to achieve our business goals or expectations due to the competitive risks that we face. For additional information concerning these competitive risks, see Item 1A—“Risk Factors—Risks Related to Our Lending and Investment Activities.”
Employees
We do not have any employees. We are externally managed by our Manager pursuant to the Management Agreement. Our executive officers serve as officers of our Manager, and are employed by an affiliate of our Manager.
Government Regulation
Our operations in North America and Europe are subject, in certain instances, to supervision and regulation by U.S. and other governmental authorities, and may be subject to various laws and judicial and administrative decisions imposing various requirements and restrictions, which, among other things: (i) regulate credit-granting activities; (ii) establish maximum interest rates, finance charges and other charges; (iii) require disclosures to customers; (iv) govern secured transactions; and (v) set collection, foreclosure, repossession and claims-handling procedures and other trade practices. We are also required to comply with certain provisions of the Equal Credit Opportunity Act that are applicable to commercial loans. We intend to conduct our business so that neither we nor any of our subsidiaries are required to register as an investment company under the Investment Company Act.
7
Table of Contents
In our judgment, existing statutes and regulations have not had a material adverse effect on our business. In recent years, legislators in the United States and in other countries have said that greater regulation of financial services firms is needed, particularly in areas such as risk management, leverage, and disclosure. While we expect that additional new regulations in these areas will be adopted and existing ones may change in the future, it is not possible at this time to forecast the exact nature of any future legislation, regulations, judicial decisions, orders or interpretations, nor their impact upon our future business, financial condition, or results of operations or prospects.
Taxation of the Company
We elected to be taxed as a REIT, effective January 1, 2003, under the Internal Revenue Code for U.S. federal income tax purposes. We generally must distribute annually at least 90% of our net taxable income, subject to certain adjustments and excluding any net capital gain, in order for U.S. federal income tax not to apply to our earnings that we distribute. To the extent that we satisfy this distribution requirement, but distribute less than 100% of our net taxable income, we will be subject to U.S. federal income tax on our undistributed taxable income. In addition, we will be subject to a 4% nondeductible excise tax if the actual amount that we pay out to our stockholders in a calendar year is less than a minimum amount specified under U.S. federal tax laws.
Our qualification as a REIT also depends on our ability to meet various other requirements imposed by the Internal Revenue Code, which relate to organizational structure, diversity of stock ownership, and certain restrictions with regard to the nature of our assets and the sources of our income. Even if we qualify as a REIT, we may be subject to certain U.S. federal income and excise taxes and state and local taxes on our income and assets. If we fail to maintain our qualification as a REIT for any taxable year, we may be subject to material penalties as well as federal, state, and local income tax on our taxable income at regular corporate rates and we would not be able to qualify as a REIT for the subsequent four full taxable years.
Furthermore, we have one or more taxable REIT subsidiaries, or TRS, which pay federal, state, and local income tax on their net taxable income. See Item 1A—“Risk Factors—Risks Related to our REIT Status and Certain Other Tax Items” for additional tax status information.
Taxation of REIT Dividends
Under recent legislation from the Tax Cuts and Jobs Act of 2017, REIT dividends (other than capital gain dividends) received by non-corporate taxpayers may be eligible for a 20% deduction beginning in 2018. This deduction is only applicable to investors in BXMT that receive dividends and does not have any impact on us. Investors should consult their own tax advisors regarding the effect of this change on their effective tax rate with respect to REIT dividends.
Website Access to Reports
We maintain a website at www.blackstonemortgagetrust.com. We are providing the address to our website solely for the information of investors. The information on our website is not a part of, nor is it incorporated by reference into this report. Through our website, we make available, free of charge, our annual proxy statement, annual reports on Form 10-K, quarterly reports on Form 10-Q, current reports on Form 8-K and amendments to those reports filed or furnished pursuant to Section 13(a) or 15(d) of the Securities Exchange Act of 1934, as amended, or the Exchange Act, as soon as reasonably practicable after we electronically file such material with, or furnish them to, the Securities and Exchange Commission, or the SEC. The SEC maintains a website that contains these reports at www.sec.gov. You may also read and copy any filed document at the SEC’s public reference room in Washington, D.C. at 100 F Street, N.E., Washington, D.C. 20549. Please call the SEC at 1-800-SEC-0330 for further information about public reference rooms.
8
Table of Contents
| ITEM 1A. | RISK FACTORS |
FORWARD-LOOKING INFORMATION
This Annual Report on Form 10-K contains forward-looking statements within the meaning of Section 27A of the Securities Act of 1933, as amended, or Securities Act, and Section 21E of the Exchange Act, which involve certain known and unknown risks and uncertainties. Forward-looking statements predict or describe our future operations, business plans, business and investment strategies and portfolio management and the performance of our investments. These forward-looking statements are generally identified by their use of such terms and phrases as “intend,” “goal,” “estimate,” “expect,” “project,” “projections,” “plans,” “seeks,” “anticipates,” “should,” “could,” “may,” “designed to,” “foreseeable future,” “believe,” “scheduled” and similar expressions. Our actual results or outcomes may differ materially from those anticipated. You are cautioned not to place undue reliance on these forward-looking statements, which speak only as of the date the statement was made. We assume no obligation to publicly update or revise any forward-looking statements, whether as a result of new information, future events or otherwise, except as required by law.
Our actual results may differ significantly from any results expressed or implied by these forward-looking statements. Some, but not all, of the factors that might cause such a difference include, but are not limited to:
| • | the general political, economic, capital markets and competitive conditions in the United States and foreign jurisdictions where we invest; |
| • | the level and volatility of prevailing interest rates and credit spreads; |
| • | adverse changes in the real estate and real estate capital markets; |
| • | difficulty in obtaining financing or raising capital; |
| • | reductions in the yield on our investments and an increase in the cost of our financing; |
| • | defaults by borrowers in paying debt service on outstanding indebtedness; |
| • | increased competition from entities engaged in mortgage lending and, or investing in our target assets; |
| • | adverse legislative or regulatory developments, including with respect to tax laws; |
| • | acts of God such as hurricanes, earthquakes and other natural disasters, acts of war and/or terrorism and other events that may cause unanticipated and uninsured performance declines and/or losses to us or the owners and operators of the real estate securing our investments; |
| • | deterioration in the performance of the property securing our investments that may cause deterioration in the performance of our investments and, potentially, principal losses to us; |
| • | adverse developments in the availability of desirable investment opportunities whether they are due to competition, regulation, or otherwise; |
| • | difficulty in redeploying the proceeds from repayments of our existing investments; |
| • | difficulty in successfully managing our growth, including integrating new assets into our existing systems; |
| • | authoritative generally accepted accounting principles, or GAAP, or policy changes from such standard-setting bodies as the Financial Accounting Standards Board, or FASB, the SEC, the Internal Revenue Service, or IRS, the New York Stock Exchange, or NYSE, and other authorities that we are subject to, as well as their counterparts in any foreign jurisdictions where we might do business; and |
| • | other factors, including those items discussed in the risk factors set forth below. |
Although we believe that the expectations reflected in the forward-looking statements are reasonable, we cannot guarantee future results, levels of activity, performance, or achievements. We caution you not to place undue
9
Table of Contents
reliance on these forward-looking statements. All written and oral forward-looking statements attributable to us or persons acting on our behalf are qualified in their entirety by these cautionary statements. Moreover, unless we are required by law to update these statements, we will not necessarily update or revise any forward-looking statements included or incorporated by reference in this Annual Report after the date hereof, either to conform them to actual results or to changes in our expectations.
Risks Related to Our Lending and Investment Activities
Our loans and investments expose us to risks associated with debt-oriented real estate investments generally.
We seek to invest primarily in debt instruments relating to real estate-related assets. As such, we are subject to, among other things, risk of defaults by borrowers in paying debt service on outstanding indebtedness and to other impairments of our loans and investments. Any deterioration of real estate fundamentals generally, and in North America and Europe in particular, could negatively impact our performance by making it more difficult for borrowers of our mortgage loans, or borrower entities, to satisfy their debt payment obligations, increasing the default risk applicable to borrower entities, and/or making it more difficult for us to generate attractive risk-adjusted returns. Changes in general economic conditions will affect the creditworthiness of borrower entities and/or the value of underlying real estate collateral relating to our investments and may include economic and/or market fluctuations, changes in environmental, zoning and other laws, casualty or condemnation losses, regulatory limitations on rents, decreases in property values, changes in the appeal of properties to tenants, changes in supply and demand, fluctuations in real estate fundamentals, the financial resources of borrower entities, energy supply shortages, various uninsured or uninsurable risks, natural disasters, political events, terrorism and acts of war, changes in government regulations, changes in real property tax rates and/or tax credits, changes in operating expenses, changes in interest rates, changes in inflation rates, changes in the availability of debt financing and/or mortgage funds which may render the sale or refinancing of properties difficult or impracticable, increased mortgage defaults, increases in borrowing rates, negative developments in the economy and/or adverse changes in real estate values generally and other factors that are beyond our control.
We cannot predict the degree to which economic conditions generally, and the conditions for real estate debt investing in particular, will improve or decline. Any declines in the performance of the U.S. and global economies or in the real estate debt markets could have a material adverse effect on our business, financial condition, and results of operations.
Commercial real estate-related investments that are secured, directly or indirectly, by real property are subject to delinquency, foreclosure and loss, which could result in losses to us.
Commercial real estate debt instruments (e.g., mortgages, mezzanine loans and preferred equity) that are secured by commercial property are subject to risks of delinquency and foreclosure and risks of loss that are greater than similar risks associated with loans made on the security of single-family residential property. The ability of a borrower to repay a loan secured by an income-producing property typically is dependent primarily upon the successful operation of the property rather than upon the existence of independent income or assets of the borrower. If the net operating income of the property is reduced, the borrower’s ability to repay the loan may be impaired. Net operating income of an income-producing property can be affected by, among other things:
| • | tenant mix and tenant bankruptcies; |
| • | success of tenant businesses; |
| • | property management decisions, including with respect to capital improvements, particularly in older building structures; |
| • | property location and condition; |
| • | competition from other properties offering the same or similar services; |
| • | changes in laws that increase operating expenses or limit rents that may be charged; |
10
Table of Contents
| • | any need to address environmental contamination at the property; |
| • | changes in global, national, regional, or local economic conditions and/or specific industry segments; |
| • | declines in global, national, regional or local real estate values; |
| • | declines in global, national, regional or local rental or occupancy rates; |
| • | changes in interest rates, foreign exchange rates, and in the state of the credit and securitization markets and debt and equity capital markets, including diminished availability or lack of debt financing for commercial real estate; |
| • | changes in real estate tax rates, tax credits and other operating expenses; |
| • | changes in governmental rules, regulations and fiscal policies, including income tax regulations and environmental legislation; |
| • | acts of God, terrorism, social unrest and civil disturbances, which may decrease the availability of or increase the cost of insurance or result in uninsured losses; and |
| • | adverse changes in zoning laws. |
In addition, we are exposed to the risk of judicial proceedings with our borrowers and entities we invest in, including bankruptcy or other litigation, as a strategy to avoid foreclosure or enforcement of other rights by us as a lender or investor. In the event that any of the properties or entities underlying or collateralizing our loans or investments experiences any of the foregoing events or occurrences, the value of, and return on, such investments could be reduced, which would adversely affect our results of operations and financial condition.
Fluctuations in interest rates and credit spreads could reduce our ability to generate income on our loans and other investments, which could lead to a significant decrease in our results of operations, cash flows and the market value of our investments.
Our primary interest rate exposures relate to the yield on our loans and other investments and the financing cost of our debt, as well as our interest rate swaps that we may utilize for hedging purposes. Changes in interest rates and credit spreads may affect our net income from loans and other investments, which is the difference between the interest and related income we earn on our interest-earning investments and the interest and related expense we incur in financing these investments. Interest rate and credit spread fluctuations resulting in our interest and related expense exceeding interest and related income would result in operating losses for us. Changes in the level of interest rates and credit spreads also may affect our ability to make loans or investments, the value of our loans and investments and our ability to realize gains from the disposition of assets. Increases in interest rates and credit spreads may also negatively affect demand for loans and could result in higher borrower default rates.
Our operating results depend, in part, on differences between the income earned on our investments, net of credit losses, and our financing costs. The yields we earn on our floating-rate assets and our borrowing costs tend to move in the same direction in response to changes in interest rates. However, one can rise or fall faster than the other, causing our net interest margin to expand or contract. In addition, we could experience reductions in the yield on our investments and an increase in the cost of our financing. Although we seek to match the terms of our liabilities to the expected lives of loans that we acquire or originate, circumstances may arise in which our liabilities are shorter in duration than our assets, resulting in their adjusting faster in response to changes in interest rates. For any period during which our investments are not match-funded, the income earned on such investments may respond more slowly to interest rate fluctuations than the cost of our borrowings. Consequently, changes in interest rates, particularly short-term interest rates, may immediately and significantly decrease our results of operations and cash flows and the market value of our investments. In addition, unless we enter into hedging or similar transactions with respect to the portion of our assets that we fund using our balance sheet, returns we achieve on such assets will generally increase as interest rates for those assets rise and decrease as interest rates for those assets decline.
11
Table of Contents
We operate in a competitive market for lending and investment opportunities which may intensify, and competition may limit our ability to originate or acquire desirable loans and investments or dispose of assets we target, and could also affect the yields of these assets and have a material adverse effect on our business, financial condition, and results of operation.
We operate in a competitive market for lending and investment opportunities, which may intensify. Our profitability depends, in large part, on our ability to originate or acquire our target assets on attractive terms. In originating or acquiring our target assets, we compete for opportunities with a variety of institutional lenders and investors, including other REITs, specialty finance companies, public and private funds (including funds managed by affiliates of Blackstone), commercial and investment banks, commercial finance and insurance companies and other financial institutions. Several other competitors have raised, or are expected to raise, significant amounts of capital, and may have investment objectives that overlap with ours, which may create additional competition for lending and investment opportunities. Some competitors may have a lower cost of funds and access to funding sources that are not available to us, such as the U.S. Government. Many of our competitors are not subject to the operating constraints associated with REIT tax compliance or maintenance of an exclusion from regulation under the Investment Company Act. In addition, some of our competitors may have higher risk tolerances or different risk assessments, which could allow them to consider a wider variety of loans and investments, offer more attractive pricing or other terms and establish more relationships than us. Furthermore, competition for originations of and investments in our target assets may lead to decreasing yields, which may further limit our ability to generate desired returns. Also, as a result of this competition, desirable loans and investments in our target assets may be limited in the future and we may not be able to take advantage of attractive lending and investment opportunities from time to time, thereby limiting our ability to identify and originate or acquire loans or make investments that are consistent with our investment objectives. We cannot assure you that the competitive pressures we face will not have a material adverse effect on our business, financial condition and results of operations.
Prepayment rates may adversely affect our financial performance and the value of certain of our assets.
Our business is currently focused on originating floating-rate mortgage loans secured by commercial real estate assets. Generally, our mortgage loan borrowers may repay their loans prior to their stated maturities. In periods of declining interest rates and/or credit spreads, prepayment rates on loans generally increase. If general interest rates or credit spreads decline at the same time, the proceeds of such prepayments received during such periods may not be reinvested for some period of time or may be reinvested by us in assets yielding less than the yields on the assets that were prepaid.
Because our mortgage loans are generally not originated or acquired at a premium to par value, prepayment rates do not materially affect the value of such assets. However, the value of certain other assets may be affected by prepayment rates. For example, if we originate or acquire mortgage-related securities or a pool of mortgage securities in the future, we would anticipate that the underlying mortgages would prepay at a projected rate generating an expected yield. If we were to purchase such assets at a premium to par value, if borrowers prepay their loans faster than expected, the corresponding prepayments on any such mortgage-related securities would likely reduce the expected yield. Conversely, if we were to purchase such assets at a discount to par value, when borrowers prepay their loans slower than expected, the decrease in corresponding prepayments on the mortgage-related securities would likely reduce the expected yield.
Prepayment rates on loans may be affected by a number of factors including, but not limited to, the then-current level of interest rates and credit spreads, the availability of mortgage credit, the relative economic vitality of the area in which the related properties are located, the servicing of the loans, possible changes in tax laws, other opportunities for investment, and other economic, social, geographic, demographic and legal factors beyond our control. Consequently, such prepayment rates cannot be predicted with certainty and no strategy can completely insulate us from prepayment or other such risks.
12
Table of Contents
Difficulty in redeploying the proceeds from repayments of our existing loans and investments may cause our financial performance and returns to investors to suffer.
As our loans and investments are repaid, we will have to redeploy the proceeds we receive into new loans and investments, repay borrowings under our credit facilities, pay dividends to our stockholders or repurchase outstanding shares of our class A common stock. It is possible that we will fail to identify reinvestment options that would provide returns or a risk profile that is comparable to the asset that was repaid. If we fail to redeploy the proceeds we receive from repayment of a loan in equivalent or better alternatives, our financial performance and returns to investors could suffer.
If we are unable to successfully integrate new assets and manage our growth, our results of operations and financial condition may suffer.
We have in the past and may in the future significantly increase the size and/or change the mix of our portfolio of assets. We may be unable to successfully and efficiently integrate newly-acquired assets into our existing portfolio or otherwise effectively manage our assets or our growth effectively. In addition, increases in our portfolio of assets and/or changes in the mix of our assets may place significant demands on our Manager’s administrative, operational, asset management, financial and other resources. Any failure to manage increases in size effectively could adversely affect our results of operations and financial condition.
The lack of liquidity in certain of our assets may adversely affect our business.
The illiquidity of certain of our assets may make it difficult for us to sell such investments if the need or desire arises. Certain assets such as mortgages, B-Notes, mezzanine and other loans (including participations) and preferred equity, in particular, are relatively illiquid investments due to their short life, their potential unsuitability for securitization and the greater difficulty of recovery in the event of a borrower’s default. In addition, certain of our investments may become less liquid after our investment as a result of periods of delinquencies or defaults or turbulent market conditions, which may make it more difficult for us to dispose of such assets at advantageous times or in a timely manner. Moreover, many of the loans and securities we invest in are not registered under the relevant securities laws, resulting in limitations or prohibitions against their transfer, sale, pledge or their disposition except in transactions that are exempt from registration requirements or are otherwise in accordance with such laws. As a result, many of our investments are illiquid, and if we are required to liquidate all or a portion of our portfolio quickly, for example as a result of margin calls, we may realize significantly less than the value at which we have previously recorded our investments. Further, we may face other restrictions on our ability to liquidate an investment to the extent that we or our Manager (and/or its affiliates) has or could be attributed as having material, non-public information regarding the borrower entity. As a result, our ability to vary our portfolio in response to changes in economic and other conditions may be relatively limited, which could adversely affect our results of operations and financial condition.
Any distressed loans or investments we make, or loans and investments that later become distressed, may subject us to losses and other risks relating to bankruptcy proceedings.
While our loans and investments focus primarily on “performing” real estate-related interests, our loans and investments may also include making distressed investments from time to time (e.g., investments in defaulted, out-of-favor or distressed loans and debt securities) or may involve investments that become “sub-performing” or “non-performing” following our acquisition thereof. Certain of our investments may include properties that typically are highly leveraged, with significant burdens on cash flow and, therefore, involve a high degree of financial risk. During an economic downturn or recession, loans or securities of financially or operationally troubled borrowers or issuers are more likely to go into default than loans or securities of other borrowers or issuers. Loans or securities of financially or operationally troubled issuers are less liquid and more volatile than loans or securities of borrowers or issuers not experiencing such difficulties. The market prices of such securities are subject to erratic and abrupt market movements and the spread between bid and ask prices may be greater than normally expected. Investment in the loans or securities of financially or operationally troubled borrowers or issuers involves a high degree of credit and market risk.
13
Table of Contents
In certain limited cases (e.g., in connection with a workout, restructuring and/or foreclosing proceedings involving one or more of our investments), the success of our investment strategy will depend, in part, on our ability to effectuate loan modifications and/or restructure and improve the operations of our borrower entities. The activity of identifying and implementing successful restructuring programs and operating improvements entails a high degree of uncertainty. There can be no assurance that we will be able to identify and implement successful restructuring programs and improvements with respect to any distressed loans or investments we may have from time to time.
These financial or operating difficulties may never be overcome and may cause borrower entities to become subject to bankruptcy or other similar administrative proceedings. There is a possibility that we may incur substantial or total losses on our investments and in certain circumstances, become subject to certain additional potential liabilities that may exceed the value of our original investment therein. For example, under certain circumstances, a lender that has inappropriately exercised control over the management and policies of a debtor may have its claims subordinated or disallowed or may be found liable for damages suffered by parties as a result of such actions. In any reorganization or liquidation proceeding relating to our investments, we may lose our entire investment, may be required to accept cash or securities with a value less than our original investment and/or may be required to accept different terms, including payment over an extended period of time. In addition, under certain circumstances, payments to us may be reclaimed if any such payment or distribution is later determined to have been a fraudulent conveyance, preferential payment, or similar transaction under applicable bankruptcy and insolvency laws. Furthermore, bankruptcy laws and similar laws applicable to administrative proceedings may delay our ability to realize value from collateral for loan positions held by us, may adversely affect the economic terms and priority of such loans through doctrines such as equitable subordination or may result in a restructuring of the debt through principles such as the “cramdown” provisions of the bankruptcy laws.
We may not have control over certain of our loans and investments.
Our ability to manage our portfolio of loans and investments may be limited by the form in which they are made. In certain situations, we may:
| • | acquire investments subject to rights of senior classes, special servicers or collateral managers under intercreditor, servicing agreements or securitization documents; |
| • | pledge our investments as collateral for financing arrangements; |
| • | acquire only a minority and/or a non-controlling participation in an underlying investment; |
| • | co-invest with others through partnerships, joint ventures or other entities, thereby acquiring non-controlling interests; or |
| • | rely on independent third party management or servicing with respect to the management of an asset. |
Therefore, we may not be able to exercise control over all aspects of our loans or investments. Such financial assets may involve risks not present in investments where senior creditors, junior creditors, servicers or third-party controlling investors are not involved. Our rights to control the process following a borrower default may be subject to the rights of senior or junior creditors or servicers whose interests may not be aligned with ours. A partner or co-venturer may have financial difficulties resulting in a negative impact on such asset, may have economic or business interests or goals that are inconsistent with ours, or may be in a position to take action contrary to our investment objectives. In addition, we will generally pay all or a portion of the expenses relating to our joint ventures and we may, in certain circumstances, be liable for the actions of our partners or co-venturers.
B-Notes, mezzanine loans, and other investments that are subordinated or otherwise junior in an issuer’s capital structure and that involve privately negotiated structures will expose us to greater risk of loss.
We may originate or acquire B-Notes, mezzanine loans and other investments (such as preferred equity) that are subordinated or otherwise junior in an issuer’s capital structure and that involve privately negotiated structures.
14
Table of Contents
To the extent we invest in subordinated debt or mezzanine tranches of an entity’s capital structure, such investments and our remedies with respect thereto, including the ability to foreclose on any collateral securing such investments, will be subject to the rights of holders of more senior tranches in the issuer’s capital structure and, to the extent applicable, contractual intercreditor, co-lender and/or participation agreement provisions. Significant losses related to such loans or investments could adversely affect our results of operations and financial condition.
As the terms of such loans and investments are subject to contractual relationships among lenders, co-lending agents and others, they can vary significantly in their structural characteristics and other risks. For example, the rights of holders of B-Notes to control the process following a borrower default may vary from transaction to transaction.
Like B-Notes, mezzanine loans are by their nature structurally subordinated to more senior property-level financings. If a borrower defaults on our mezzanine loan or on debt senior to our loan, or if the borrower is in bankruptcy, our mezzanine loan will be satisfied only after the property-level debt and other senior debt is paid in full. As a result, a partial loss in the value of the underlying collateral can result in a total loss of the value of the mezzanine loan. In addition, even if we are able to foreclose on the underlying collateral following a default on a mezzanine loan, we would be substituted for the defaulting borrower and, to the extent income generated on the underlying property is insufficient to meet outstanding debt obligations on the property, may need to commit substantial additional capital and/or deliver a replacement guarantee by a credit worthy entity, which may include us, to stabilize the property and prevent additional defaults to lenders with existing liens on the property. In addition, mezzanine loans may have higher loan-to-value ratios than conventional mortgage loans, resulting in less equity in the property and increasing the risk of loss of principal. Significant losses related to our B-Notes and mezzanine loans would result in operating losses for us and may limit our ability to make distributions to our stockholders.
Loans on properties in transition will involve a greater risk of loss than conventional mortgage loans.
We have in the past and may in the future invest in transitional loans to borrowers who are typically seeking relatively short-term capital to be used in an acquisition or rehabilitation of a property. The typical borrower in a transitional loan has usually identified an undervalued asset that has been under-managed and/or is located in a recovering market. If the market in which the asset is located fails to improve according to the borrower’s projections, or if the borrower fails to improve the quality of the asset’s management and/or the value of the asset, the borrower may not receive a sufficient return on the asset to satisfy the transitional loan, and we bear the risk that we may not recover some or all of our investment.
In addition, borrowers usually use the proceeds of a conventional mortgage to repay a transitional loan. Transitional loans therefore are subject to the risk of a borrower’s inability to obtain permanent financing to repay the transitional loan. In the event of any default under transitional loans that may be held by us, we bear the risk of loss of principal and non-payment of interest and fees to the extent of any deficiency between the value of the mortgage collateral and the principal amount and unpaid interest of the transitional loan. To the extent we suffer such losses with respect to these transitional loans, it could adversely affect our results of operations and financial condition.
Risks of cost overruns and noncompletion of renovations of properties in transition may result in significant losses.
The renovation, refurbishment or expansion of a property by a borrower involves risks of cost overruns and noncompletion. Estimates of the costs of improvements to bring an acquired property up to standards established for the market position intended for that property may prove inaccurate. Other risks may include rehabilitation costs exceeding original estimates, possibly making a project uneconomical, environmental risks, delays in legal and other approvals (e.g., for condominiums) and rehabilitation and subsequent leasing of the property not being
15
Table of Contents
completed on schedule. If such renovation is not completed in a timely manner, or if it costs more than expected, the borrower may experience a prolonged reduction of net operating income and may not be able to make payments on our investment on a timely basis or at all, which could result in significant losses.
There are increased risks involved with our construction lending activities.
Our construction lending activities, which include our investment in loans that fund the construction or development of real estate-related assets, may expose us to increased lending risks. Construction lending generally is considered to involve a higher degree of risk of non-payment and loss than other types of lending due to a variety of factors, including the difficulties in estimating construction costs and anticipating construction delays and, generally, the dependency on timely, successful completion and the lease-up and commencement of operations post-completion. In addition, since such loans generally entail greater risk than mortgage loans collateralized by income-producing property, we may need to increase our allowance for loan losses in the future to account for the likely increase in probable incurred credit losses associated with such loans. Further, as the lender under a construction loan, we may be obligated to fund all or a significant portion of the loan at one or more future dates. We may not have the funds available at such future date(s) to meet our funding obligations under the loan. In that event, we would likely be in breach of the loan unless we are able to raise the funds from alternative sources, which we may not be able to achieve on favorable terms or at all.
If a borrower fails to complete the construction of a project or experiences cost overruns, there could be adverse consequences associated with the loan, including a decline in the value of the property securing the loan, a borrower claim against us for failure to perform under the loan documents if we choose to stop funding, increased costs to the borrower that the borrower is unable to pay, a bankruptcy filing by the borrower, and abandonment by the borrower of the collateral for the loan.
Loans or investments involving international real estate-related assets are subject to special risks that we may not manage effectively, which could have a material adverse effect on our results of operations and financial condition and our ability to make distributions to our stockholders.
We invest a material portion of our capital in assets outside the United States and may increase the percentage of our investments outside the United States if our Manager deems such investments appropriate in its discretion. To the extent that we invest in non-domestic real estate-related assets, we may be subject to certain risks associated with international investments generally, including, among others:
| • | currency exchange matters, including fluctuations in currency exchange rates and costs associated with conversion of investment principal and income from one currency into another, which may have an adverse impact on the valuation of our assets or income, including for purposes of our REIT requirements; |
| • | less developed or efficient financial markets than in the United States, which may lead to potential price volatility and relative illiquidity; |
| • | the burdens of complying with international regulatory requirements and prohibitions that differ between jurisdictions; |
| • | changes in laws or clarifications to existing laws that could impact our tax treaty positions, which could adversely impact the returns on our investments; |
| • | a less developed legal or regulatory environment, differences in the legal and regulatory environment or enhanced legal and regulatory compliance; |
| • | political hostility to investments by foreign investors; |
| • | higher rates of inflation; |
| • | higher transaction costs; |
16
Table of Contents
| • | greater difficulty enforcing contractual obligations; |
| • | fewer investor protections; |
| • | certain economic and political risks, including potential exchange control regulations and restrictions on our non-U.S. investments and repatriation of profits from investments or of capital invested, the risks of political, economic or social instability, the possibility of expropriation or confiscatory taxation and adverse economic and political developments; and |
| • | potentially adverse tax consequences. |
If any of the foregoing risks were to materialize, they could adversely affect our results of operations and financial condition and our ability to make distributions to our stockholders.
Concerns regarding the stability of the sovereign debt of certain European countries and other geopolitical issues and market perceptions concerning the instability of the Euro, the potential re-introduction of individual currencies within the Eurozone, or the potential dissolution of the Euro entirely, could adversely affect our business, results of operations and financial condition.
A portion of our investments consists of assets secured by European collateral. Concerns persist with respect to the sovereign debt situation of several countries, including Greece, Ireland, Italy, Spain and Portugal, which, together with the risk of contagion to other more financially stable countries, has also raised a number of uncertainties regarding the stability and overall standing of the European Monetary Union. Concern over such uncertainties has been exacerbated by other geopolitical issues that may affect the Eurozone, including the vote by the United Kingdom (U.K.) to exit the European Union (E.U.). Any further deterioration in the global or Eurozone economy could have a significant adverse effect on our activities and the value of any European collateral.
In addition, we currently hold assets and may acquire additional assets that are denominated in British Pounds Sterling and in Euros. Further deterioration in the Eurozone economy could have a material adverse effect on the value of our investment in such assets and amplify the currency risks faced by us.
If any country were to leave the Eurozone, or if the Eurozone were to break up entirely, the treatment of debt obligations previously denominated in Euros is uncertain. A number of issues would be raised, such as whether obligations that are expressed to be payable in Euros would be re-denominated into a new currency. The answer to this and other questions is uncertain and would depend on the way in which the break-up occurred and also on the nature of the transaction; the law governing it; which courts have jurisdiction in relation to it; the place of payment; and the place of incorporation of the payor. If we were to hold any investments in Euros at the time of any Eurozone exits or break-up, this uncertainty and potential re-denomination could have a material adverse effect on the value of our investments and the income from them.
The vote by the U.K. to exit the E.U. could adversely affect us.
On June 23, 2016, voters in the U.K. approved a withdrawal of the U.K. from the E.U., commonly referred to as “Brexit.” In March 2017, the U.K. government initiated the exit process under Article 50 of the Treaty of the European Union, commencing a period of up to two years for the U.K. and the other E.U. member states to negotiate the terms of the withdrawal. Uncertainty over the terms of the U.K.’s withdrawal from the E.U. could cause political and economic uncertainty in the U.K. and the rest of Europe, which could harm our business and financial results. In particular, Brexit caused significant volatility in global stock markets and currency exchange fluctuations. Consequently, our loans and investments denominated in British Pounds Sterling are subject to increased risks related to these currency rate fluctuations and our net assets in U.S. Dollar terms may decline. In addition, Brexit may also adversely affect commercial real estate fundamentals in the U.K. and E.U., including greater uncertainty for leasing prospects for properties with transitional loans, which could negatively impact the ability of our U.K and E.U.-based borrowers to satisfy their debt payment obligations to us, increasing default risk and/or making it more difficult for us to generate attractive risk-adjusted returns for our operations in the U.K.
17
Table of Contents
The long-term effects of Brexit are expected to depend on, among other things, any agreements the U.K. makes to retain access to E.U. markets either during a transitional period or more permanently. Brexit could adversely affect European or worldwide economic or market conditions and could contribute to instability in global financial and real estate markets. In addition, Brexit could lead to legal uncertainty and potentially divergent national laws and regulations as the U.K. determines which E.U. laws to replace or replicate. Until the terms and timing of the U.K’s exit from the E.U. become more clear, it is not possible to determine the impact that the U.K.’s departure from the E.U. and/or any related matters may have on us; however, any of these effects of Brexit, and others we cannot anticipate, could adversely affect our business, business opportunities, results of operations, financial condition and cash flows. Likewise, similar actions taken by other European and other countries in which we operate could have a similar or even more profound impact.
Changes to, or the elimination of, LIBOR may adversely affect interest expense related to our loans and investments.
Regulators and law-enforcement agencies from a number of governments, including entities in the United States, Japan, Canada and the United Kingdom, have been conducting civil and criminal investigations into whether the banks that contributed to the British Bankers’ Association, or the BBA, in connection with the calculation of daily LIBOR may have underreported or otherwise manipulated or attempted to manipulate LIBOR. Several financial institutions have reached settlements with the U.S. Commodity Futures Trading Commission, the U.S. Department of Justice Fraud Section and the U.K. Financial Services Authority in connection with investigations by such authorities into submissions made by such financial institutions to the bodies that set LIBOR and other interbank offered rates. In such settlements, such financial institutions admitted to submitting rates to the BBA that were lower than the actual rates at which such financial institutions could borrow funds from other banks. Additional investigations remain ongoing with respect to other major banks and no assurance can be made that there will not be further admissions or findings of rate setting manipulation or that improper manipulation of LIBOR or other similar inter-bank lending rates will not occur in the future.
Based on a review conducted by the Financial Conduct Authority of the U.K., or the FCA, and a consultation conducted by the European Commission, proposals have been made for governance and institutional reform, regulation, technical changes and contingency planning. In particular: (a) new legislation has been enacted in the United Kingdom pursuant to which LIBOR submissions and administration are now “regulated activities” and manipulation of LIBOR has been brought within the scope of the market abuse regime; (b) legislation has been proposed which if implemented would, among other things, alter the manner in which LIBOR is determined, compel more banks to provide LIBOR submissions, and require these submissions to be based on actual transaction data; and (c) LIBOR rates for certain currencies and maturities are no longer published daily. In addition, pursuant to authorization from the FCA, ICE Benchmark Administration Limited (formerly NYSE Euronext Rate Administration Limited), or the IBA, took over the administration of LIBOR from the BBA on February 1, 2014. Any new administrator of LIBOR may make methodological changes to the way in which LIBOR is calculated or may alter, discontinue or suspend calculation or dissemination of LIBOR.
In a speech on July 27, 2017, Andrew Bailey, the Chief Executive of the FCA, announced the FCA’s intention to cease sustaining LIBOR after 2021. The FCA has statutory powers to require panel banks to contribute to LIBOR where necessary. The FCA has decided not to ask, or to require, that panel banks continue to submit contributions to LIBOR beyond the end of 2021. The FCA has indicated that it expects that the current panel banks will voluntarily sustain LIBOR until the end of 2021. The FCA’s intention is that after 2021, it will no longer be necessary for the FCA to ask, or to require, banks to submit contributions to LIBOR. The FCA does not intend to sustain LIBOR through using its influence or legal powers beyond that date. It is possible that the IBA and the panel banks could continue to produce LIBOR on the current basis after 2021, if they are willing and able to do so, but we cannot make assurances that LIBOR will survive in its current form, or at all. We cannot predict the effect of the FCA’s decision not to sustain LIBOR, or, if changes are ultimately made to LIBOR, the effect of those changes. Any such changes could increase our financing costs, which could impact our results of operations, cash flows and the market value of our investments.
18
Table of Contents
Transactions denominated in foreign currencies subject us to foreign currency risks.
We hold assets denominated in British Pounds Sterling, Euros, and Canadian Dollars, and may acquire assets denominated in other foreign currencies, which exposes us to foreign currency risk. As a result, a change in foreign currency exchange rates may have an adverse impact on the valuation of our assets, as well as our income and cash flows. Any such changes in foreign currency exchange rates may impact the measurement of such assets or income for the purposes of our REIT tests and may affect the amounts available for payment of dividends on our class A common stock.
Our success depends on the availability of attractive investments and our Manager’s ability to identify, structure, consummate, leverage, manage and realize returns on our investments.
Our operating results are dependent upon the availability of, as well as our Manager’s ability to identify, structure, consummate, leverage, manage and realize returns on our investments. In general, the availability of favorable investment opportunities and, consequently, our returns, will be affected by the level and volatility of interest rates and credit spreads, conditions in the financial markets, general economic conditions, the demand for investment opportunities in our target assets and the supply of capital for such investment opportunities. We cannot assure you that our Manager will be successful in identifying and consummating investments that satisfy our rate of return objectives or that such investments, once made, will perform as anticipated.
Real estate valuation is inherently subjective and uncertain.
The valuation of real estate and therefore the valuation of any collateral underlying our loans is inherently subjective due to, among other factors, the individual nature of each property, its location, the expected future rental revenues from that particular property and the valuation methodology adopted. In addition, where we invest in construction loans, initial valuations will assume completion of the project. As a result, the valuations of the real estate assets against which we will make or acquire loans are subject to a large degree of uncertainty and are made on the basis of assumptions and methodologies that may not prove to be accurate, particularly in periods of volatility, low transaction flow or restricted debt availability in the commercial or residential real estate markets.
Our loans and investments may be concentrated in terms of geography, asset types, and sponsors.
We are not required to observe specific diversification criteria, except as may be set forth in the investment guidelines adopted by our board of directors. Therefore, our investments may be concentrated in certain property types that may be subject to higher risk of default or foreclosure, or secured by properties concentrated in a limited number of geographic locations.
To the extent that our assets are concentrated in any one region or type of asset, downturns generally relating to such type of asset or region may result in defaults on a number of our investments within a short time period, which could adversely affect our results of operations and financial condition. In addition, because of asset concentrations, even modest changes in the value of the underlying real estate assets could have a significant impact on the value of our investment. As a result of any high levels of concentration, any adverse economic, political or other conditions that disproportionately affects those geographic areas or asset classes could have a magnified adverse effect on our results of operations and financial condition, and the value of our stockholders’ investments could vary more widely than if we invested in a more diverse portfolio of loans.
The due diligence process that our Manager undertakes in regard to investment opportunities may not reveal all facts that may be relevant in connection with an investment and if our Manager incorrectly evaluates the risks of our investments we may experience losses.
Before making investments for us, our Manager conducts due diligence that it deems reasonable and appropriate based on the facts and circumstances relevant to each potential investment. When conducting due diligence, our
19
Table of Contents
Manager may be required to evaluate important and complex business, financial, tax, accounting, environmental and legal issues. Outside consultants, legal advisors, accountants and investment banks may be involved in the due diligence process in varying degrees depending on the type of potential investment. Our Manager’s loss estimates may not prove accurate, as actual results may vary from estimates. If our Manager underestimates the asset-level losses relative to the price we pay for a particular investment, we may experience losses with respect to such investment.
Moreover, investment analyses and decisions by our Manager may frequently be required to be undertaken on an expedited basis to take advantage of investment opportunities. In such cases, the information available to our Manager at the time of making an investment decision may be limited, and they may not have access to detailed information regarding such investment. Therefore, we cannot assure you that our Manager will have knowledge of all circumstances that may adversely affect such investment.
Insurance on loans and real estate securities collateral may not cover all losses.
There are certain types of losses, generally of a catastrophic nature, such as earthquakes, floods, hurricanes, terrorism or acts of war, which may be uninsurable or not economically insurable. Inflation, changes in building codes and ordinances, environmental considerations and other factors also might result in insurance proceeds insufficient to repair or replace a property if it is damaged or destroyed. Under these circumstances, the insurance proceeds received with respect to a property relating to one of our investments might not be adequate to restore our economic position with respect to our investment. Any uninsured loss could result in the corresponding nonperformance of or loss on our investment related to such property.
The impact of any future terrorist attacks and the availability of affordable terrorism insurance expose us to certain risks.
Terrorist attacks, the anticipation of any such attacks, and the consequences of any military or other response by the United States and its allies may have an adverse impact on the U.S. financial markets and the economy in general. We cannot predict the severity of the effect that any such future events would have on the U.S. financial markets, the economy or our business. Any future terrorist attacks could adversely affect the credit quality of some of our loans and investments. Some of our loans and investments will be more susceptible to such adverse effects than others, particularly those secured by properties in major cities or properties that are prominent landmarks or public attractions. We may suffer losses as a result of the adverse impact of any future terrorist attacks and these losses may adversely impact our results of operations.
In addition, the enactment of the Terrorism Risk Insurance Act of 2002, or TRIA, and the subsequent enactment of the Terrorism Risk Insurance Program Reauthorization Act of 2015, which extended TRIA through the end of 2020, requires insurers to make terrorism insurance available under their property and casualty insurance policies and provides federal compensation to insurers for insured losses. However, this legislation does not regulate the pricing of such insurance and there is no assurance that this legislation will be extended beyond 2020. The absence of affordable insurance coverage may adversely affect the general real estate lending market, lending volume and the market’s overall liquidity and may reduce the number of suitable investment opportunities available to us and the pace at which we are able to make investments. If the properties that we invest in are unable to obtain affordable insurance coverage, the value of those investments could decline and in the event of an uninsured loss, we could lose all or a portion of our investment.
We may need to foreclose on certain of the loans we originate or acquire, which could result in losses that harm our results of operations and financial condition.
We may find it necessary or desirable to foreclose on certain of the loans we originate or acquire, and the foreclosure process may be lengthy and expensive. If we foreclose on an asset, we may take title to the property securing that asset, and if we do not or cannot sell the property, we would then come to own and operate it as
20
Table of Contents
“real estate owned.” Owning and operating real property involves risks that are different (and in many ways more significant) than the risks faced in owning an asset secured by that property. In addition, we may end up owning a property that we would not otherwise have decided to acquire directly at the price of our original investment or at all, and the liquidation proceeds upon sale of the underlying real estate may not be sufficient to recover our cost basis in the loan, resulting in a loss to us.
Whether or not we have participated in the negotiation of the terms of any such loans, we cannot assure you as to the adequacy of the protection of the terms of the applicable loan, including the validity or enforceability of the loan and the maintenance of the anticipated priority and perfection of the applicable security interests. Furthermore, claims may be asserted by lenders or borrowers that might interfere with enforcement of our rights. Borrowers may resist foreclosure actions by asserting numerous claims, counterclaims and defenses against us, including, without limitation, lender liability claims and defenses, even when the assertions may have no basis in fact, in an effort to prolong the foreclosure action and seek to force the lender into a modification of the loan or a favorable buy-out of the borrower’s position in the loan. In some states, foreclosure actions can take several years or more to litigate. At any time prior to or during the foreclosure proceedings, the borrower may file for bankruptcy, which would have the effect of staying the foreclosure actions and further delaying the foreclosure process, and could potentially result in a reduction or discharge of a borrower’s debt. Foreclosure may create a negative public perception of the related property, resulting in a diminution of its value. Even if we are successful in foreclosing on a loan, the liquidation proceeds upon sale of the underlying real estate may not be sufficient to recover our cost basis in the loan, resulting in a loss to us. Furthermore, any costs or delays involved in the foreclosure of the loan or a liquidation of the underlying property will further reduce the net sale proceeds and, therefore, increase any such losses to us.
The properties underlying our investments may be subject to unknown liabilities, including environmental liabilities, that could affect the value of these properties and as a result, our investments.
Collateral properties underlying our investments may be subject to unknown or unquantifiable liabilities that may adversely affect the value of our investments. Such defects or deficiencies may include title defects, title disputes, liens, servitudes or other encumbrances on the mortgaged properties. The discovery of such unknown defects, deficiencies and liabilities could affect the ability of our borrowers to make payments to us or could affect our ability to foreclose and sell the underlying properties, which could adversely affect our results of operations and financial condition.
Furthermore, to the extent we foreclose on properties with respect to which we have extended loans, we may be subject to environmental liabilities arising from such foreclosed properties. Under various U.S. federal, state and local laws, an owner or operator of real property may become liable for the costs of removal of certain hazardous substances released on its property. These laws often impose liability without regard to whether the owner or operator knew of, or was responsible for, the release of such hazardous substances.
If we foreclose on any properties underlying our investments, the presence of hazardous substances on a property may adversely affect our ability to sell the property and we may incur substantial remediation costs, therefore the discovery of material environmental liabilities attached to such properties could adversely affect our results of operations and financial condition.
We may be subject to lender liability claims, and if we are held liable under such claims, we could be subject to losses.
In recent years, a number of judicial decisions have upheld the right of borrowers to sue lending institutions on the basis of various evolving legal theories, collectively termed “lender liability.” Generally, lender liability is founded on the premise that a lender has either violated a duty, whether implied or contractual, of good faith and fair dealing owed to the borrower or has assumed a degree of control over the borrower resulting in the creation of a fiduciary duty owed to the borrower or its other creditors or stockholders. We cannot assure prospective
21
Table of Contents
investors that such claims will not arise or that we will not be subject to significant liability if a claim of this type did arise.
Our investments in CMBS, CLOs, CDOs and other similar structured finance investments, as well as those we structure, sponsor or arrange, pose additional risks, including the risks of the securitization process and the risk that the special servicer, CT Investment Management Co., LLC, or CTIMCO, a subsidiary of Blackstone, may take actions that could adversely affect our interests.
We have invested in, and may from time to time invest in, CMBS, CLOs, CDOs and other similar securities, which may be subordinated classes of securities in a structure of securities secured by a pool of mortgages or loans. Accordingly, such securities may be the first or among the first to bear the loss upon a restructuring or liquidation of the underlying collateral and the last to receive payment of interest and principal, with only a nominal amount of equity or other debt securities junior to such positions. The estimated fair values of such subordinated interests tend to be much more sensitive to adverse economic downturns and underlying borrower developments than more senior securities. A projection of an economic downturn, for example, could cause a decline in the price of lower credit quality CMBS, CLOs or CDOs because the ability of borrowers to make principal and interest payments on the mortgages or loans underlying such securities may be impaired.
Subordinate interests such as CMBS, CLOs, CDOs and similar structured finance investments generally are not actively traded and are relatively illiquid investments. Volatility in CMBS, CLO and CDO trading markets may cause the value of these investments to decline. In addition, if the underlying mortgage portfolio has been overvalued by the originator, or if the values subsequently decline and, as a result, less collateral value is available to satisfy interest and principal payments and any other fees in connection with the trust or other conduit arrangement for such securities, we may incur significant losses.
With respect to the CMBS, CLOs and CDOs in which we have invested and may invest in the future, control over the related underlying loans will be exercised through CTIMCO, or another special servicer or collateral manager designated by a “directing certificateholder” or a “controlling class representative,” or otherwise pursuant to the related securitization documents. We may acquire classes of CMBS, CLOs or CDOs, for which we may not have the right to appoint the directing certificateholder or otherwise direct the special servicing or collateral management. With respect to the management and servicing of those loans, the related special servicer or collateral manager may take actions that could adversely affect our interests. See “—Risks Related to Our Financing and Hedging—We have utilized and may utilize in the future non-recourse securitizations to finance our loans and investments, which may expose us to risks that could result in losses” for a discussion of additional risks related to our securitization transactions.
Any credit ratings assigned to our investments will be subject to ongoing evaluations and revisions and we cannot assure you that those ratings will not be downgraded.
Some of our investments, including the notes issued in our securitization transactions for which we are required to retain a portion of the credit risk, may be rated by rating agencies. Any credit ratings on our investments are subject to ongoing evaluation by credit rating agencies, and we cannot assure you that any such ratings will not be changed or withdrawn by a rating agency in the future if, in its judgment, circumstances warrant. If rating agencies assign a lower-than-expected rating or reduce or withdraw, or indicate that they may reduce or withdraw, their ratings of our investments in the future, the value and liquidity of our investments could significantly decline, which would adversely affect the value of our investment portfolio and could result in losses upon disposition or the failure of borrowers to satisfy their debt service obligations to us.
Investments in non-conforming and non-investment grade rated loans or securities involve increased risk of loss.
Many of our investments may not conform to conventional loan standards applied by traditional lenders and either will not be rated (as is typically the case for private loans) or will be rated as non-investment grade by the
22
Table of Contents
rating agencies. Private loans often are not rated by credit rating agencies. Non-investment grade ratings typically result from the overall leverage of the loans, the lack of a strong operating history for the properties underlying the loans, the borrowers’ credit history, the underlying properties’ cash flow or other factors. As a result, these investments should be expected to have a higher risk of default and loss than investment-grade rated assets. Any loss we incur may be significant and may adversely affect our results of operations and financial condition. There are no limits on the percentage of unrated or non-investment grade rated assets we may hold in our investment portfolio.
We may invest in derivative instruments, which would subject us to increased risk of loss.
Subject to maintaining our qualification as a REIT, we may invest in derivative instruments. A derivative instrument, especially one of a large notional size or referencing a less common underlying rate, index, instrument or asset, may not be liquid in all circumstances, so that in volatile markets we may not be able to close out a position without incurring a loss. The prices of derivative instruments, which commonly include swaps, futures, forwards and options, may be highly volatile and such instruments may subject us to significant losses. The value of such derivatives also depends upon the price of the underlying instrument or asset or the level of the reference market rate or index. Derivative instruments also are subject to the risk of non-performance by the relevant counterparty. In addition, actual or implied daily limits on price fluctuations and position limits on the exchanges or over-the-counter, or OTC, markets in which we may conduct our transactions in derivative instruments may prevent prompt liquidation of positions, subjecting us to the potential of greater losses. Derivative instruments that may be purchased or sold by us may include instruments that are purchased or sold OTC as bilateral transactions and not traded on an exchange. The risk of nonperformance by the obligor on such an OTC derivative instrument may be greater and the ease with which we can dispose of or enter into closing transactions with respect to such an instrument may be less than in the case of an exchange-traded instrument. In addition, significant disparities may exist between “bid” and “asked” prices for OTC derivative instruments. Such OTC derivatives are also subject to types and levels of investor protections or governmental regulation that may differ from exchange traded instruments.
In addition, we may invest in derivative instruments that are neither presently contemplated nor currently available, but which may be developed in the future, to the extent such opportunities are both consistent with our investment objectives and legally permissible. Any such investments may expose us to unique and presently indeterminate risks, the impact of which may not be capable of determination until such instruments are developed and/or we determine to make such an investment.
Provisions for loan losses are difficult to estimate.
Our provision for loan losses is evaluated on a quarterly basis. The determination of our provision for loan losses requires us to make certain estimates and judgments, which may be difficult to determine. Our estimates and judgments are based on a number of factors, including projected cash flow from the collateral securing our loans, debt structure, including the availability of reserves and recourse guarantees, likelihood of repayment in full at the maturity of a loan, potential for refinancing and expected market discount rates for varying property types, all of which remain uncertain and are subjective. Our estimates and judgments may not be correct and, therefore, our results of operations and financial condition could be severely impacted.
In addition, in June 2016, the FASB, issued Accounting Standards Update 2016-13, “Financial Instruments-Credit Losses, Measurement of Credit Losses on Financial Instruments (Topic 326),” which replaces the current “incurred loss” model for recognizing credit losses with an “expected loss” model referred to as the Current Expected Credit Loss model, or CECL. Under the CECL model, which will become effective for us for fiscal years beginning after December 15, 2019 and for interim periods within those fiscal years, we will be required to present certain financial assets carried at amortized cost, such as loans held for investment, at the net amount expected to be collected. The measurement of expected credit losses is to be based on information about past events, including historical experience, current conditions, and reasonable and supportable forecasts that affect
23
Table of Contents
the collectability of the reported amount. This measurement will take place at the time the financial asset is first added to the balance sheet and updated quarterly thereafter. This differs significantly from the “incurred loss” model required under current GAAP, which delays recognition until it is probable a loss has been incurred. Accordingly, we expect that the adoption of the CECL model will materially affect how we determine our allowance for loan losses and could require us to significantly increase our allowance and recognize provisions for loan losses earlier in the lending cycle. Moreover, the CECL model may create more volatility in the level of our allowance for loan losses. If we are required to materially increase our level of allowance for loan losses for any reason, such increase could adversely affect our business, financial condition and results of operations.
Some of our portfolio investments may be recorded at fair value and, as a result, there will be uncertainty as to the value of these investments.
Some of our portfolio investments may be in the form of positions or securities that are not publicly traded, but are recorded at estimated fair value. The fair value of securities and other investments that are not publicly traded may not be readily determinable. We will value these investments quarterly at fair value, which may include unobservable inputs. Because such valuations are subjective, the fair value of certain of our assets may fluctuate over short periods of time and our determinations of fair value may differ materially from the values that would have been used if a ready market for these securities existed. Our results of operations and financial condition could be adversely affected if our determinations regarding the fair value of these investments were materially higher than the values that we ultimately realize upon their disposal.
Risks Related to Our Financing and Hedging
Our significant amount of debt may subject us to increased risk of loss and could adversely affect our results of operations and financial condition.
We currently have outstanding indebtedness and, subject to market conditions and availability, we may incur a significant amount of additional debt through repurchase agreements, bank credit facilities (including term loans and revolving facilities), warehouse facilities and structured financing arrangements, public and private debt issuances (including through securitizations) and derivative instruments, in addition to transaction or asset specific funding arrangements. We may also issue additional debt or equity securities to fund our growth. The percentage of leverage we employ will vary depending on our available capital, our ability to obtain and access financing arrangements with lenders, the type of asset we are funding, whether the financing is recourse or non-recourse, debt restrictions contained in those financing arrangements and the lenders’ and rating agencies’ estimate of the stability of our investment portfolio’s cash flow. We may significantly increase the amount of leverage we utilize at any time without approval of our board of directors. In addition, we may leverage individual assets at substantially higher levels. Incurring substantial debt could subject us to many risks that, if realized, would materially and adversely affect us, including the risk that:
| • | our cash flow from operations may be insufficient to make required payments of principal of and interest on our debt or we may fail to comply with covenants contained in our debt agreements, which is likely to result in (a) acceleration of such debt (and any other debt containing a cross-default or cross-acceleration provision), which we then may be unable to repay from internal funds or to refinance on favorable terms, or at all, (b) our inability to borrow undrawn amounts under our financing arrangements, even if we are current in payments on borrowings under those arrangements, which would result in a decrease in our liquidity, and/or (c) the loss of some or all of our collateral assets to foreclosure or sale; |
| • | our debt may increase our vulnerability to adverse economic and industry conditions with no assurance that investment yields will increase in an amount sufficient to offset the higher financing costs; |
| • | we may be required to dedicate a substantial portion of our cash flow from operations to payments on our debt, thereby reducing funds available for operations, future business opportunities, stockholder distributions or other purposes; and |
24
Table of Contents
| • | we may not be able to refinance any debt that matures prior to the maturity (or realization) of an underlying investment it was used to finance on favorable terms or at all. |
There can be no assurance that a leveraging strategy will be successful, and such strategy may subject us to increased risk of loss and could adversely affect our results of operations and financial condition.
Our master repurchase agreements impose, and additional lending facilities may impose, restrictive covenants, which may restrict our flexibility to determine our operating policies and investment strategy.
We borrow funds under master repurchase agreements with various counterparties. The documents that govern these master repurchase agreements and the related guarantees contain, and additional lending facilities may contain, customary affirmative and negative covenants, including financial covenants applicable to us that may restrict our flexibility to determine our operating policies and investment strategy. In particular, these agreements may require us to maintain specified minimum levels of capacity under our credit facilities and cash. As a result, we may not be able to leverage our assets as fully as we would otherwise choose, which could reduce our return on assets. If we are unable to meet these collateral obligations, our financial condition and prospects could deteriorate significantly. In addition, lenders may require that our Manager or one or more of our Manager’s executives continue to serve in such capacity. If we fail to meet or satisfy any of these covenants, we would be in default under these agreements, and our lenders could elect to declare outstanding amounts due and payable, terminate their commitments, require the posting of additional collateral and enforce their interests against existing collateral. We may also be subject to cross-default and acceleration rights in our other debt arrangements. Further, this could also make it difficult for us to satisfy the distribution requirements necessary to maintain our qualification as a REIT for U.S. federal income tax purposes.
Our master repurchase agreements require, and bank credit facilities, repurchase agreements or other financing that we may use in the future to finance our assets may require, us to provide additional collateral or pay down debt.
Our master repurchase agreements with various counterparties, any bank credit facilities (including term loans and revolving facilities), and additional repurchase agreements or other financing we may enter into in the future, involve the risk that the market value of the assets pledged or sold by us to the provider of the financing may decline in value, in which case the lender or counterparty may require us to provide additional collateral or lead to margin calls that may require us to repay all or a portion of the funds advanced. We may not have the funds available to repay our debt at that time, which would likely result in defaults unless we are able to raise the funds from alternative sources, including by selling assets at a time when we might not otherwise choose to do so, which we may not be able to achieve on favorable terms or at all. Posting additional margin would reduce our cash available to make other, higher yielding investments, thereby decreasing our return on equity. If we cannot meet these requirements, the lender or counterparty could accelerate our indebtedness, increase the interest rate on advanced funds and terminate our ability to borrow funds from it, which could materially and adversely affect our financial condition and ability to implement our investment strategy. In the case of repurchase transactions, if the value of the underlying security has declined as of the end of that term, or if we default on our obligations under the repurchase agreement, we will likely incur a loss on our repurchase transactions.
Our use of leverage may create a mismatch with the duration and interest rate of the investments that we are financing.
We intend to structure our leverage such that we minimize the difference between the term of our investments and the leverage we use to finance such investments. In the event that our leverage is for a shorter term than the financed investment, we may not be able to extend or find appropriate replacement leverage and that would have an adverse impact on our liquidity and our returns. In the event that our leverage is for a longer term than the financed investment, we may not be able to repay such leverage or replace the financed investment with an optimal substitute or at all, which will negatively impact our desired leveraged returns.
25
Table of Contents
We attempt to structure our leverage such that we minimize the variability between the interest rate of our investments and the interest rate of our leverage – financing floating rate investments with floating rate leverage and fixed rate investments with fixed rate leverage. If such a product is not available to us from our lenders on reasonable terms, we may use hedging instruments to effectively create such a match. For example, in the case of fixed rate investments, we may finance such investments with floating rate leverage, but effectively convert all or a portion of the attendant leverage to fixed rate using hedging strategies.
Our attempts to mitigate such risk are subject to factors outside of our control, such as the availability to us of favorable financing and hedging options, which is subject to a variety of factors, of which duration and term matching are only two. A duration mismatch may also occur when borrowers prepay their loans faster or slower than expected. The risks of a duration mismatch are also magnified by the potential for the extension of loans in order to maximize the likelihood and magnitude of their recovery value in the event the loans experience credit or performance challenges. Employment of this asset management practice would effectively extend the duration of our investments, while our hedges or liabilities may have set maturity dates.
Interest rate fluctuations could increase our financing costs, which could lead to a significant decrease in our results of operations, cash flows and the market value of our investments.
To the extent that our financing costs are determined by reference to floating rates, such as LIBOR or a Treasury index, the amount of such costs will depend on the level and movement of interest rates. In a period of rising interest rates, our interest expense on floating rate debt would increase, while any additional interest income we earn on our floating rate investments may be subject to caps and may not compensate for such increase in interest expense. At the same time, the interest income we earn on our fixed rate investments would not change, the duration and weighted average life of our fixed rate investments would increase and the market value of our fixed rate investments would decrease. Similarly, in a period of declining interest rates, our interest income on floating rate investments would decrease, while any decrease in the interest we are charged on our floating rate debt may be subject to floors and may not compensate for such decrease in interest income and interest we are charged on our fixed rate debt would not change. Any such scenario could adversely affect our results of operations and financial condition.
Our loans and investments may be subject to fluctuations in interest rates that may not be adequately protected, or protected at all, by our hedging strategies.
Our assets include loans with either floating interest rates or fixed interest rates. Floating rate loans earn interest at rates that adjust from time to time (typically monthly) based upon an index (typically one-month LIBOR). These floating rate loans are insulated from changes in value specifically due to changes in interest rates; however, the coupons they earn fluctuate based upon interest rates (again, typically one-month LIBOR) and, in a declining and/or low interest rate environment, these loans will earn lower rates of interest and this will impact our operating performance. Fixed interest rate loans, however, do not have adjusting interest rates and the relative value of the fixed cash flows from these loans will decrease as prevailing interest rates rise or increase as prevailing interest rates fall, causing potentially significant changes in value. We may employ various hedging strategies to limit the effects of changes in interest rates (and in some cases credit spreads), including engaging in interest rate swaps, caps, floors and other interest rate derivative products. We believe that no strategy can completely insulate us from the risks associated with interest rate changes and there is a risk that such strategies may provide no protection at all and potentially compound the impact of changes in interest rates. Hedging transactions involve certain additional risks such as counterparty risk, leverage risk, the legal enforceability of hedging contracts, the early repayment of hedged transactions and the risk that unanticipated and significant changes in interest rates may cause a significant loss of basis in the contract and a change in current period expense. We cannot make assurances that we will be able to enter into hedging transactions or that such hedging transactions will adequately protect us against the foregoing risks.
Accounting for derivatives under GAAP may be complicated. Any failure by us to meet the requirements for applying hedge accounting in accordance with GAAP could adversely affect our earnings. In particular,
26
Table of Contents
derivatives are required to be highly effective in offsetting changes in the value or cash flows of the hedged items (and appropriately designated and/or documented as such). If it is determined that a derivative is not highly effective at hedging the designated exposure, hedge accounting is discontinued and the changes in fair value of the instrument are included in our reported net income.
Inability to access funding could have a material adverse effect on our results of operations, financial condition and business.
Our ability to fund our loans and investments may be impacted by our ability to secure bank credit facilities (including term loans and revolving facilities), warehouse facilities and structured financing arrangements, public and private debt issuances and derivative instruments, in addition to transaction or asset specific funding arrangements and additional repurchase agreements on acceptable terms. We may also rely on short-term financing that would be especially exposed to changes in availability. Our access to sources of financing will depend upon a number of factors, over which we have little or no control, including:
| • | general economic or market conditions; |
| • | the market’s view of the quality of our assets; |
| • | the market’s perception of our growth potential; |
| • | our current and potential future earnings and cash distributions; and |
| • | the market price of the shares of our class A common stock. |
We may need to periodically access the capital markets to raise cash to fund new loans and investments. Unfavorable economic or capital market conditions may increase our funding costs, limit our access to the capital markets or could result in a decision by our potential lenders not to extend credit. An inability to successfully access the capital markets could limit our ability to grow our business and fully execute our business strategy and could decrease our earnings and liquidity. In addition, any dislocation or weakness in the capital and credit markets could adversely affect our lenders and could cause one or more of our lenders to be unwilling or unable to provide us with financing or to increase the costs of that financing. In addition, as regulatory capital requirements imposed on our lenders are increased, they may be required to limit, or increase the cost of, financing they provide to us. In general, this could potentially increase our financing costs and reduce our liquidity or require us to sell assets at an inopportune time or price. We cannot make assurances that we will be able to obtain any additional financing on favorable terms or at all.
Any warehouse facilities that we may obtain in the future may limit our ability to originate or acquire assets, and we may incur losses if the collateral is liquidated.
We may utilize, if available, warehouse facilities pursuant to which we would accumulate loans in anticipation of a securitization or other financing, which assets would be pledged as collateral for such facilities until the securitization or other transaction is consummated. In order to borrow funds to originate or acquire assets under any future warehouse facilities, we expect that our lenders thereunder would have the right to review the potential assets for which we are seeking financing. We may be unable to obtain the consent of a lender to originate or acquire assets that we believe would be beneficial to us and we may be unable to obtain alternate financing for such assets. In addition, no assurance can be given that a securitization or other financing would be consummated with respect to the assets being warehoused. If the securitization or other financing is not consummated, the lender could demand repayment of the facility, and in the event that we were unable to timely repay, could liquidate the warehoused collateral and we would then have to pay any amount by which the original purchase price of the collateral assets exceeds its sale price, subject to negotiated caps, if any, on our exposure. In addition, regardless of whether the securitization or other financing is consummated, if any of the warehoused collateral is sold before the completion, we would have to bear any resulting loss on the sale.
27
Table of Contents
We have utilized and may utilize in the future non-recourse securitizations to finance our loans and investments, which may expose us to risks that could result in losses.
We have utilized and may utilize in the future, non-recourse securitizations of certain of our portfolio investments to generate cash for funding new loans and investments and other purposes. These transactions generally involve us creating a special-purpose vehicle, contributing a pool of our assets to the entity, and selling interests in the entity on a non-recourse basis to purchasers (whom we would expect to be willing to accept a lower interest rate to invest in investment-grade loan pools). We would expect to retain all or a portion of the equity and potentially other tranches in the securitized pool of loans or investments. In addition, we have retained in the past and may in the future retain a pari passu participation in the securitized pool of loans. Because of the interests we retain, in particular with respect to equity or similar tranches, actions taken by CTIMCO or any other entity that acts as special servicer may in the future conflict with our interests. See “—Risks Related to Our Lending and Investment Activities—Our investments in CMBS, CLOs, CDOs and other similar structured finance investments, as well as those we structure, sponsor or arrange, pose additional risks, including the risks of the securitization process and the risk that the special servicer, CT Investment Management Co., LLC, or CTIMCO, a subsidiary of Blackstone, may take actions that could adversely affect our interests.”
Prior to any such financing, we may use short-term facilities to finance the acquisition of securities until a sufficient quantity of investments had been accumulated, at which time we would refinance these facilities through a securitization, such as a CMBS, or issuance of CLOs, or the private placement of loan participations or other long-term financing. As a result, we would be subject to the risk that we would not be able to acquire, during the period that our short-term facilities are available, a sufficient amount of eligible investments to maximize the efficiency of a CMBS, CLO or private placement issuance. We also would be subject to the risk that we would not be able to obtain short-term credit facilities or would not be able to renew any short-term credit facilities after they expire should we find it necessary to extend our short-term credit facilities to allow more time to seek and acquire the necessary eligible investments for a long-term financing. The inability to consummate securitizations of our portfolio to finance our loans and investments on a long-term basis could require us to seek other forms of potentially less attractive financing or to liquidate assets at an inopportune time or price, which could adversely affect our performance and our ability to grow our business. Moreover, conditions in the capital markets, including volatility and disruption in the capital and credit markets, may not permit a non-recourse securitization at any particular time or may make the issuance of any such securitization less attractive to us even when we do have sufficient eligible assets. We may also suffer losses if the value of the mortgage loans we acquire declines prior to securitization. Declines in the value of a mortgage loan can be due to, among other things, changes in interest rates and changes in the credit quality of the loan. In addition, we may suffer a loss due to the incurrence of transaction costs related to executing these transactions. To the extent that we incur a loss executing or participating in future securitizations for the reasons described above or for other reasons, it could materially and adversely impact our business and financial condition.
In addition, the securitization of our portfolio might magnify our exposure to losses because any equity interest we retain in the issuing entity would be subordinate to the notes issued to investors and we would, therefore, absorb all of the losses sustained with respect to a securitized pool of assets before the owners of the notes experience any losses. The inability to securitize our portfolio may hurt our performance and our ability to grow our business. At the same time, the securitization of our loans or investments might expose us to losses, as the residual loans or investments in which we do not sell interests will tend to be riskier and more likely to generate losses. Moreover, the Dodd-Frank Act Wall Street Reform and Consumer Protection Act of 2010, or Dodd-Frank Act, contains a risk retention requirement for all asset-backed securities, which requires both public and private securitizers to retain not less than 5% of the credit risk of the assets collateralizing any asset-backed security issuance. Significant restrictions exist, and additional restrictions may be added in the future, regarding who may hold risk retention interests, the structure of the entities that hold risk retention interests and when and how such risk retention interests may be transferred. Therefore such risk retention interests will generally be illiquid. As a result of the risk retention requirements, we have and may in the future be required to purchase and retain certain interests in a securitization into which we sell mortgage loans and/or when we act as issuer, may be required to
28
Table of Contents
sell certain interests in a securitization at prices below levels that such interests have historically yielded and/or may be required to enter into certain arrangements related to risk retention that we have not historically been required to enter into. Accordingly, the risk retention rules may increase our potential liabilities and/or reduce our potential profits in connection with securitization of mortgage loans. It is likely, therefore, that these risk retention rules will increase the administrative and operational costs of asset securitizations.
We may be subject to losses arising from current and future guarantees of debt and contingent obligations of our subsidiaries or joint venture or co-investment partners.
We currently guarantee certain obligations of our subsidiaries under various arrangements that provide for significant aggregate borrowings and we may in the future guarantee the performance of additional subsidiaries’ obligations, including, but not limited to, additional repurchase agreements, derivative agreements and unsecured indebtedness. We also currently guarantee certain indebtedness incurred by our joint venture with Walker & Dunlop Inc. and in the future may agree to guarantee other indebtedness incurred by other joint venture or co-investment partners. Such guarantees may be on a joint and several basis with such joint venture or co-investment partner, in which case we may be liable in the event such partner defaults on its guarantee obligation. The non-performance of such obligations may cause losses to us in excess of the capital we initially may have invested or committed under such obligations and there is no assurance that we will have sufficient capital to cover any such losses.
We are subject to counterparty risk associated with our debt obligations.
Our counterparties for critical financial relationships may include both domestic and international financial institutions. These institutions could be severely impacted by credit market turmoil, changes in legislation, allegations of civil or criminal wrongdoing and may as a result experience financial or other pressures. In addition, if a lender or counterparty files for bankruptcy or becomes insolvent, our borrowings under financing agreements with them may become subject to bankruptcy or insolvency proceedings, therefore depriving us, at least temporarily, of the benefit of these assets. Such an event could restrict our access to financing and increase our cost of capital. If any of our counterparties were to limit or cease operation, it could lead to financial losses for us.
Hedging may adversely affect our earnings, which could reduce our cash available for distribution to our stockholders.
Subject to maintaining our qualification as a REIT, we may pursue various hedging strategies to seek to reduce our exposure to adverse changes in interest rates and fluctuations in currencies. Our hedging activity will vary in scope based on the level and volatility of interest rates, exchange rates, the type of assets held and other changing market conditions. Interest rate and currency hedging may fail to protect or could adversely affect us because, among other things:
| • | interest rate, currency and/or credit hedging can be expensive and may result in us generating less net income; |
| • | available interest rate or currency hedges may not correspond directly with the interest rate or currency risk for which protection is sought; |
| • | due to a credit loss, prepayment or asset sale, the duration of the hedge may not match the duration of the related asset or liability; |
| • | the amount of income that a REIT may earn from hedging transactions (other than hedging transactions that satisfy certain requirements of the Internal Revenue Code or that are done through a taxable REIT subsidiary, or TRS) to offset interest rate losses is limited by U.S. federal income tax provisions governing REITs; |
29
Table of Contents
| • | the credit quality of the hedging counterparty owing money on the hedge may be downgraded to such an extent that it impairs our ability to sell or assign our side of the hedging transaction; |
| • | the hedging counterparty owing money in the hedging transaction may default on its obligation to pay; |
| • | we may fail to recalculate, readjust and execute hedges in an efficient manner; and |
| • | legal, tax and regulatory changes could occur and may adversely affect our ability to pursue our hedging strategies and/or increase the costs of implementing such strategies. |
Any hedging activity in which we engage may materially and adversely affect our results of operations and cash flows. Therefore, while we may enter into such transactions seeking to reduce risks, unanticipated changes in interest rates, credit spreads or currencies may result in poorer overall investment performance than if we had not engaged in any such hedging transactions. In addition, the degree of correlation between price movements of the instruments used in a hedging strategy and price movements in the portfolio positions or liabilities being hedged may vary materially. Moreover, for a variety of reasons, we may not seek to establish a perfect correlation between such hedging instruments and the portfolio positions or liabilities being hedged. Any such imperfect correlation may prevent us from achieving the intended hedge and furthermore may expose us to risk of loss.
In addition, some hedging instruments involve additional risk because they are not traded on regulated exchanges, guaranteed by an exchange or its clearing house, or regulated by any U.S. or foreign governmental authorities. Consequently, we cannot make assurances that a liquid secondary market will exist for hedging instruments purchased or sold, and we may be required to maintain a position until exercise or expiration, which could result in significant losses. In addition, regulatory requirements with respect to derivatives, including eligibility of counterparties, reporting, recordkeeping, exchange of margin, financial responsibility or segregation of customer funds and positions are still under development and could impact our hedging transactions and how we and our counterparty must manage such transactions.
We are subject to counterparty risk associated with our hedging activities.
We are subject to credit risk with respect to the counterparties to derivative contracts (whether a clearing corporation in the case of exchange-traded instruments or another third party in the case of OTC instruments). If a counterparty becomes bankrupt or otherwise fails to perform its obligations under a derivative contract due to financial difficulties, we may experience significant delays in obtaining any recovery under the derivative contract in a dissolution, assignment for the benefit of creditors, liquidation, winding-up, bankruptcy, or other analogous proceeding. In the event of the insolvency of a counterparty to a derivative transaction, the derivative transaction would typically be terminated at its fair market value. If we are owed this fair market value in the termination of the derivative transaction and its claim is unsecured, we will be treated as a general creditor of such counterparty, and will not have any claim with respect to the underlying security. We may obtain only a limited recovery or may obtain no recovery in such circumstances. In addition, the business failure of a counterparty with whom we enter into a hedging transaction will most likely result in its default, which may result in the loss of potential future value and the loss of our hedge and force us to cover our commitments, if any, at the then current market price.
We may enter into hedging transactions that could expose us to contingent liabilities in the future.
Subject to maintaining our qualification as a REIT, part of our investment strategy may involve entering into hedging transactions that could require us to fund cash payments in certain circumstances (such as the early termination of the hedging instrument caused by an event of default or other early termination event, or the decision by a counterparty to request margin securities it is contractually owed under the terms of the hedging instrument). The amount due with respect to an early termination would generally be equal to the unrealized loss of such open transaction positions with the respective counterparty and could also include other fees and charges. These economic losses will be reflected in our results of operations, and our ability to fund these obligations will depend on the liquidity of our assets and access to capital at the time, and the need to fund these obligations could adversely affect our results of operations and financial condition.
30
Table of Contents
We may fail to qualify for, or choose not to elect, hedge accounting treatment.
We generally account for derivative and hedging transactions in accordance with Topic 815 of the Financial Accounting Standards Board’s Accounting Standard Codification, or Topic 815. Under these standards, we may fail to qualify for, or choose not to elect, hedge accounting treatment for a number of reasons, including if we fail to satisfy Topic 815 hedge documentation and hedge effectiveness assessment requirements or our instruments are not highly effective. If we fail to qualify for, or choose not to elect, hedge accounting treatment, our operating results may suffer because losses on the derivatives that we enter into may not be offset by a change in the fair value of the related hedged transaction or item.
If we enter into certain hedging transactions or otherwise invest in certain derivative instruments, failure to obtain and maintain an exemption from being regulated as a commodity pool operator could subject us to additional regulation and compliance requirements which could materially adversely affect our business and financial condition.
Rules under the Dodd-Frank Act establish a comprehensive regulatory framework for derivative contracts commonly referred to as “swaps.” Under this regulatory framework, mortgage real estate investment trusts, or mREITs, that trade in commodity interest positions (including swaps) are considered “commodity pools” and the operators of such mREITs would be considered “commodity pool operators,” or CPOs. Absent relief, a CPO must register with the U.S. Commodity Futures Trading Commission, or CFTC, and become a member of the National Futures Association, or NFA, which requires compliance with NFA’s rules and renders such CPO subject to regulation by the CFTC, including with respect to disclosure, reporting, recordkeeping and business conduct. We may from time to time, directly or indirectly, invest in instruments that meet the definition of “swap” under the Dodd-Frank Act rules, which may subject us to oversight by the CFTC. Our board of directors has appointed our Manager to act as our CPO in the event we are deemed a commodity pool.
In the event that we invest in commodity interests, absent relief, our Manager would be required to register as a CPO. Our Manager is exempt from registration as a CPO with the CFTC pursuant to certain no-action letters for the CPO of a qualifying mortgage REIT (and in that regard, we intend to identify as a “mortgage REIT” for U.S. federal income tax purposes). In addition, our Manager may in the future claim a different exemption from registration as a CPO with the CFTC. Therefore, unlike a registered CPO, our Manager will not be required to provide prospective investors with a CFTC compliant disclosure document, nor will our Manager be required to provide investors with periodic account statements or certified annual reports that satisfy the requirements of CFTC rules applicable to registered CPOs, in connection with any offerings of shares.
As an alternative to an exemption from registration, our Manager may register as a CPO with the CFTC and avail itself of certain disclosure, reporting and record-keeping relief under CFTC Rule 4.7.
The CFTC has substantial enforcement power with respect to violations of the laws over which it has jurisdiction, including anti-fraud and anti-manipulation provisions. Among other things, the CFTC may suspend or revoke the registration of a person who fails to comply, prohibit such a person from trading or doing business with registered entities, impose civil money penalties, require restitution and seek fines or imprisonment for criminal violations. Additionally, a private right of action exists against those who violate the laws over which the CFTC has jurisdiction or who willfully aid, abet, counsel, induce or procure a violation of those laws. In the event we fail to receive interpretive relief from the CFTC on this matter, are unable to claim an exemption from registration and fail to comply with the regulatory requirements of these new rules, we may be unable to use certain types of hedging instruments or we may be subject to significant fines, penalties and other civil or governmental actions or proceedings, any of which could adversely affect our results of operations and financial condition.
31
Table of Contents
Risks Related to Our Relationship with Our Manager and its Affiliates
We depend on our Manager and its personnel for our success. We may not find a suitable replacement for our Manager if the Management Agreement is terminated, or if key personnel cease to be employed by our Manager or Blackstone or otherwise become unavailable to us.
We are externally managed and advised by our Manager, an affiliate of Blackstone. We currently have no employees and all of our officers are employees of Blackstone or its affiliates. We are completely reliant on our Manager, which has significant discretion as to the implementation of our investment and operating policies and strategies.
Our success will depend to a significant extent upon the efforts, experience, diligence, skill, and network of business contacts of the executive officers and key personnel of our Manager and its affiliates. Our Manager is managed by senior professionals of Blackstone. These individuals will evaluate, negotiate, execute and monitor our loans and investments and advise us regarding maintenance of our REIT status and exclusion from regulation under the Investment Company Act; therefore, our success will depend on their continued service with our Manager and its affiliates.
In addition, we can offer no assurance that our Manager will remain our investment manager or that we will continue to have access to our Manager’s officers and key personnel. The current term of the Management Agreement extends to December 19, 2018 and may be renewed for additional one-year terms thereafter; provided, however, that our Manager may terminate the Management Agreement annually upon 180 days’ prior notice. If the Management Agreement is terminated and no suitable replacement is found to manage us, we may not be able to execute our business plan. Furthermore, we may incur certain costs in connection with a termination of the Management Agreement.
The personnel of our Manager, as our external manager, are not required to dedicate a specific portion of their time to the management of our business.
Neither our Manager nor any other Blackstone affiliate is obligated to dedicate any specific personnel exclusively to us, nor are they or their personnel obligated to dedicate any specific portion of their time to the management of our business. As a result, we cannot provide any assurances regarding the amount of time our Manager or its affiliates will dedicate to the management of our business and our Manager may have conflicts in allocating its time, resources and services among our business and any other investment vehicles and accounts our Manager (or its personnel) may manage. Each of our officers is also an employee of our Manager or another Blackstone affiliate, who has now or may be expected to have significant responsibilities for other investment vehicles currently managed by Blackstone and its affiliates. Consequently, we may not receive the level of support and assistance that we otherwise might receive if we were internally managed. Our Manager and its affiliates are not restricted from entering into other investment advisory relationships or from engaging in other business activities.
Our Manager manages our portfolio pursuant to very broad investment guidelines and is not required to seek the approval of our board of directors for each investment, financing, asset allocation or hedging decision made by it, which may result in our making riskier loans and investments and which could adversely affect our results of operations and financial condition.
Our Manager is authorized to follow very broad investment guidelines that provide it with broad discretion over investment, financing, asset allocation and hedging decisions. Our board of directors will periodically review our investment guidelines and our loan and investment portfolio but will not, and will not be required to, review and approve in advance all of our proposed loans and investments or the Manager’s financing, asset allocation or hedging decisions. In addition, in conducting periodic reviews, our directors may rely primarily on information provided to them by our Manager or its affiliates. Subject to maintaining our REIT qualification and our exclusion from regulation under the Investment Company Act, our Manager has significant latitude within the
32
Table of Contents
broad investment guidelines in determining the types of loans and investments it makes for us, and how such loans and investments are financing or hedged, which could result in investment returns that are substantially below expectations or that result in losses, which could adversely affect our results of operations and financial condition.
Our Manager’s fee structure may not create proper incentives or may induce our Manager and its affiliates to make certain loans or investments, including speculative investments, which increase the risk of our loan and investment portfolio.
We pay our Manager base management fees regardless of the performance of our portfolio. Our Manager’s entitlement to base management fees, which is not based upon performance metrics or goals, might reduce its incentive to devote its time and effort to seeking loans and investments that provide attractive risk-adjusted returns for our portfolio. Because the base management fees are also based in part on our outstanding equity, our Manager may also be incentivized to advance strategies that increase our equity, and there may be circumstances where increasing our equity will not optimize the returns for our stockholders. Consequently, we are required to pay our Manager base management fees in a particular period despite experiencing a net loss or a decline in the value of our portfolio during that period.
In addition, our Manager has the ability to earn incentive fees each quarter based on our earnings, which may create an incentive for our Manager to invest in assets with higher yield potential, which are generally riskier or more speculative, or sell an asset prematurely for a gain, in an effort to increase our short-term net income and thereby increase the incentive fees to which it is entitled. If our interests and those of our Manager are not aligned, the execution of our business plan and our results of operations could be adversely affected, which could adversely affect our results of operations and financial condition.
We may compete with existing and future private and public investment vehicles established and/or managed by Blackstone or its affiliates, which may present various conflicts of interest that restrict our ability to pursue certain investment opportunities or take other actions that are beneficial to our business and result in decisions that are not in the best interests of our stockholders.
We are subject to conflicts of interest arising out of our relationship with Blackstone, including our Manager and its affiliates. Three Blackstone employees serve on our board of directors, including Michael B. Nash, the executive chairman of our board of directors and chairman of Blackstone Real Estate Debt Strategies, or BREDS, Stephen D. Plavin, our chief executive officer and president, and Jonathan Pollack, the global head of BREDS. In addition, our chief financial officer and our other executive officers are also employees of Blackstone and/or one or more of its affiliates, and we are managed by our Manager, a Blackstone affiliate. There is no guarantee that the policies and procedures adopted by us, the terms and conditions of the Management Agreement or the policies and procedures adopted by our Manager, Blackstone and their affiliates, will enable us to identify, adequately address or mitigate these conflicts of interest. Some examples of conflicts of interest that may arise by virtue of our relationship with our Manager and Blackstone include:
| • | Broad and Wide-Ranging Activities. Our Manager, Blackstone and their affiliates engage in a broad spectrum of activities, including a broad range of activities relating to investments in the real estate industry, and have invested or committed billions of dollars in capital through various investment funds, managed accounts and other vehicles affiliated with Blackstone. In the ordinary course of their business activities, our Manager, Blackstone and their affiliates may engage in activities where the interests of certain divisions of Blackstone and its affiliates, including our Manager, or the interests of their clients may conflict with the interests of our stockholders. Certain of these divisions and entities affiliated with our Manager have or may have an investment strategy similar to our investment strategy and therefore may compete with us. In particular, Blackstone Real Estate Debt Strategies, or BREDS, part of Blackstone’s real estate investment business, invests in a broad range of real estate-related debt investments via numerous different investment funds, managed accounts and other vehicles. |
33
Table of Contents
| • | Blackstone’s Policies and Procedures. Specified policies and procedures implemented by Blackstone and its affiliates, including our Manager, to mitigate potential conflicts of interest and address certain regulatory requirements and contractual restrictions may reduce the advantages across Blackstone’s and its affiliates’ various businesses that Blackstone expects to draw on for purposes of pursuing attractive investment opportunities. Because Blackstone has many different businesses, including the Blackstone Capital Markets Group, which Blackstone investment teams and portfolio entities may engage to advise on and to execute debt and equity financings, it is subject to a number of actual and potential conflicts of interest, greater regulatory oversight and more legal and contractual restrictions than that to which it would otherwise be subject if it had just one line of business. In addressing these conflicts and regulatory, legal and contractual requirements across its various businesses, Blackstone has implemented certain policies and procedures (e.g., information walls) that may reduce the positive firm-wide synergies Blackstone could otherwise expect to utilize for purposes of identifying and managing attractive investments. For example, Blackstone may come into possession of material non-public information with respect to companies that are clients of Blackstone or its affiliates, in which our Manager may be considering making an investment. As a consequence, that information, which could be of benefit to our Manager, might become restricted to those other businesses and otherwise be unavailable to our Manager, and could also restrict our Manager’s activities. Additionally, the terms of confidentiality or other agreements with or related to companies in which any investment vehicle of Blackstone has or has considered making an investment or which is otherwise a client of Blackstone and its affiliates may restrict or otherwise limit the ability of Blackstone or its affiliates, including our Manager, to engage in businesses or activities competitive with such companies. |
| • | Allocation of Investment Opportunities. Certain inherent conflicts of interest arise from the fact that Blackstone and its affiliates, including our Manager, will provide investment management and other services both to us and to any other person or entity, whether or not the investment objectives or guidelines of any such other person or entity are similar to ours, including, without limitation, the sponsoring, closing and/or managing of any investment funds, vehicles, REITs, accounts, products and/or other similar arrangements sponsored, advised, and/or managed by Blackstone or its affiliates, whether currently in existence or subsequently established (in each case, including any related successor funds, alternative vehicles, supplemental capital vehicles, surge funds, over-flow funds, co-investment vehicles, other entities formed in connection with Blackstone or its affiliates side-by-side or additional general partner investments with respect thereto, and portfolio companies/entities), which we refer to as the Blackstone Vehicles. The respective investment guidelines and programs of our business and the Blackstone Vehicles may or may not overlap, in whole or in part, and if there is any such overlap, investment opportunities will be allocated between us and the Blackstone Vehicles in a manner that may result in fewer investment opportunities being allocated to us than would have otherwise been the case in the absence of such Blackstone Vehicles. In particular, while our primary investment strategies differ from those of Blackstone’s latest flagship real estate debt fund, Blackstone Real Estate Debt Strategies III L.P. and related separately managed accounts, or BREDS III, and Blackstone Real Estate Debt Strategies High-Grade L.P, or BREDS HG, in that we generally seek to invest primarily in senior mortgage loans and other similar interests, BREDS III generally seeks to invest primarily in junior mortgage debt and mezzanine debt and BREDS HG generally seeks to invest primarily in senior mezzanine debt, a significant portion of the capital of BREDS III and BREDS HG (and/or other BREDS funds) may nonetheless be invested in investments that would also be appropriate for us. The allocation methodology applied between us and one or more of the Blackstone Vehicles may result in us not participating (and/or not participating to the same extent) in certain investment opportunities in which we would have otherwise participated had the related allocations been determined without regard to such guidelines and/or based only on the circumstances of those particular investments. Our Manager, Blackstone or their affiliates may also give advice to the Blackstone Vehicles that may differ from advice given to us even though their investment objectives may be the same or similar to ours. |
34
Table of Contents
As a result, we may invest in real estate-related debt investments alongside certain Blackstone Vehicles that are part of the BREDS program and other vehicles focusing on real estate-related debt investments, including, but not limited to, BREDS III and BREDS HG. To the extent any other Blackstone Vehicles otherwise have investment objectives or guidelines that overlap with ours, in whole or in part, investment opportunities that fall within such common objectives or guidelines will generally be allocated among one or more of us and such other Blackstone Vehicles on a basis that our Manager and applicable Blackstone affiliates determines to be fair and reasonable in its sole discretion, subject to (i) any applicable investment parameters, limitations and other contractual provisions applicable to us and such other Blackstone Vehicles, (ii) us and such other Blackstone Vehicles having available capital with respect thereto, and (iii) legal, tax, accounting, regulatory and other considerations deemed relevant by our Manager and its affiliates (including, without limitation, the relative risk-return profile of such investment and instrument type, the specific nature and terms of the investment, size and type of the investment, relative investment strategies and primary investment mandates, portfolio diversification concerns, the investment focus, guidelines, limitations, and strategy of each investment fund or vehicle, co-investment arrangements, the different liquidity positions and requirements in each fund or vehicle, underwritten leverage levels of a loan, portfolio concentration considerations, contractual obligations, other anticipated uses of capital, the source of the investment opportunity, credit ratings, the ability of a client, fund and/or vehicle to employ leverage, hedging, derivatives, syndication strategies or other similar strategies in connection with acquiring, holding or disposing of the particular investment opportunity, and any requirements or other terms of any existing leverage facilities, geographic focus, remaining investment period, the credit/default profile of an issuer, the extent of involvement of the respective teams of investment professionals dedicated to the Manager and other Blackstone Vehicles, the likelihood/immediacy of foreclosure or conversion to an equity or control opportunity, and other considerations deemed relevant in good faith in their sole discretion). With respect to BREDS III, our Manager and its affiliates may allocate certain opportunities falling within an overlapping investment focus with us in a manner such that 50% of the amount of the investment opportunity is allocated to BREDS III, on the one hand, and to us, on the other hand, subject to variation on a case-by-case basis in circumstances where our Manager and its affiliates determine in good faith that doing so is appropriate or more equitable under the circumstances. There is no assurance, however, that any such conflicts arising out of the foregoing will be resolved in our favor. Our Manager is entitled to amend its investment objectives or guidelines at any time without prior notice or our consent.
| • | Investments in Different Levels or Classes of an Issuer’s Securities. We and the Blackstone Vehicles have made and in the future will likely make investments at different levels of an issuer’s or borrower’s capital structure (e.g., an investment by a Blackstone Vehicle in an equity, debt or mezzanine interest with respect to the same portfolio entity in which we own a debt interest or vice versa) or otherwise in different classes of the same issuer’s securities. We may make investments that are senior or junior to, or have rights and interests different from or adverse to, the investments made by the Blackstone Vehicles. Such investments may conflict with the interests of such Blackstone Vehicles in related investments, and the potential for any such conflicts of interests may be heightened in the event of a default or restructuring of any such investments. Actions may be taken for the Blackstone Vehicles that are adverse to us, including with respect to the timing and manner of sale and actions taken in circumstances of financial distress. In addition, in connection with such investments, Blackstone will generally seek to implement certain procedures to mitigate conflicts of interest which typically involve us maintaining a non-controlling interest in any such investment and a forbearance of rights, including certain non-economic rights, relating to the Blackstone Vehicles, such as where Blackstone may cause us to decline to exercise certain control- and/or foreclosure-related rights with respect to a portfolio entity (including following the vote of other third party lenders generally or otherwise recusing itself with respect to decisions), including with respect to defaults, foreclosures, workouts, restructurings and/or exit opportunities, subject to certain limitations. Our Management Agreement requires our Manager to keep our board of directors reasonably informed on a periodic basis in connection with the |
35
Table of Contents
| foregoing, including with respect to transactions that involve investments at different levels of an issuer’s or borrower’s capital structure, as to which our Manager has agreed to provide our board of directors with quarterly updates. We currently hold mortgage and mezzanine loans and other investments in which Blackstone affiliates have interests in the collateral securing or backing such investments. While Blackstone will seek to resolve any conflicts in a fair and equitable manner with respect to conflicts resolution among the Blackstone Vehicles generally, such transactions are not required to be presented to our board of directors for approval, and there can be no assurance that any conflicts will be resolved in our favor. |
| • | Assignment and Sharing or Limitation of Rights. We may invest alongside other Blackstone Vehicles and in connection therewith may, for legal, tax, regulatory or other reasons which may be unrelated to us, share with or assign to such other Blackstone Vehicles certain of our rights, in whole or in part, or to limit our rights, including certain control- and/or foreclosure-related rights with respect to such shared investments and/or otherwise agree to implement certain procedures to mitigate conflicts of interest which typically involve maintaining a non-controlling interest in any such investment and a forbearance of our rights, including certain non-economic rights (including following the vote of other third party lenders generally or otherwise being recused with respect to certain decisions, including with respect to defaults, foreclosures, workouts, restructurings and/or exit opportunities), subject to certain limitations. While it is expected that our participation in connection with any such investments and transactions would be negotiated by third parties on market prices, such investments and transactions will give rise to potential or actual conflicts of interest. We cannot make assurances that any such conflict will be resolved in our favor. To the extent we hold an interest in a loan or security that is different (including with respect to their relative seniority) than those held by such other Blackstone Vehicles (and vice versa), our Manager and its affiliates may be presented and/or may have limited or no rights with respect to decisions when the interests of the funds/vehicles are in conflict. Such sharing or assignment of rights could make it more difficult for us to protect our interests and could give rise to a conflict (which may be exacerbated in the case of financial distress) and could result in another Blackstone Vehicle exercising such rights in a way adverse to us. |
| • | Providing Debt Financings in connection with Assets Owned by Other Blackstone Vehicles. We have, and in the future are likely to provide financing (1) as part of the bid or acquisition by a third party to acquire interests in (or otherwise make an investment in the underlying assets of) a portfolio entity owned by one or more Blackstone Vehicles or their affiliates of assets or interests (and/or portfolios thereof) owned by a third party), (2) with respect to one or more portfolio entities or borrowers in connection with a proposed acquisition or investment by one or more Blackstone Vehicles or affiliates relating to such portfolio entities and/or their underlying assets and/or (3) in other transactions or in the ordinary course, with respect to portfolio entities in which other Blackstone Vehicles and/or affiliates currently hold or propose to acquire an interest. This may include making commitments to provide financing at, prior to or around the time that any such purchaser commits to or makes such investments. While the terms and conditions of any such debt commitments and related arrangements will generally be on market terms, the involvement of us and/or such other Blackstone Vehicles or affiliates in such transactions may affect the terms of such transactions or arrangements and/or may otherwise influence Blackstone’s decisions with respect to the management of us and/or such other Blackstone Vehicles and/or the relevant portfolio entity, which will give rise to potential or actual conflicts of interests and which may adversely impact us. |
| • | Pursuit of Differing Strategies. At times, the investment professionals employed by our Manager or its affiliates and other investment vehicles affiliated with our Manager and/or Blackstone may determine that an investment opportunity may be appropriate for only some of the accounts, clients, entities, funds and/or investment vehicles for which he or she exercises investment responsibility, or may decide that certain of the accounts, clients, entities, funds and/or investment vehicles should take differing positions with respect to a particular security. In these cases, the investment professionals may place separate transactions for one or more accounts, clients, entities, funds and/or investment |
36
Table of Contents
| vehicles which may affect the market price of the security or the execution of the transaction, or both, to the detriment or benefit of one or more other accounts, clients, entities, funds and/or investment vehicles. For example, an investment professional may determine that it would be in the interest of another account to sell a security that we hold long, potentially resulting in a decrease in the market value of the security held by us. |
| • | Variation in Financial and Other Benefits. A conflict of interest arises where the financial or other benefits available to our Manager or its affiliates differ among the accounts, clients, entities, funds and/or investment vehicles that it manages. If the amount or structure of the base management fee, incentive fee and/or our Manager’s or its affiliates’ compensation differs among accounts, clients, entities, funds and/or investment vehicles (such as where certain funds or accounts pay higher base management fees, incentive fees, performance-based management fees or other fees), our Manager might be motivated to help certain accounts, clients, entities, funds and/or investment vehicles over us. Similarly, the desire to maintain assets under management or to enhance our Manager’s performance record or to derive other rewards, financial or otherwise, could influence our Manager in affording preferential treatment to those accounts, clients, entities, funds and/or investment vehicles that could most significantly benefit our Manager or its affiliates. Our Manager may, for example, have an incentive to allocate favorable or limited opportunity investments or structure the timing of investments to favor such accounts, clients, entities, funds and/or investment vehicles over us. Additionally, our Manager might be motivated to favor accounts, clients, entities, funds and/or investment vehicles in which it has an ownership interest or in which Blackstone and/or its affiliates have ownership interests. Conversely, if an investment professional at our Manager or its affiliates does not personally hold an investment in the fund but holds investments in other Blackstone affiliated vehicles, such investment professional’s conflicts of interest with respect to us may be more acute. |
| • | Underwriting, Advisory and Other Relationships. As part of its regular business, Blackstone provides a broad range of underwriting, investment banking, placement agent services and other services. In connection with selling investments by way of a public offering, a Blackstone broker-dealer may act as the managing underwriter or a member of the underwriting syndicate on a firm commitment basis and purchase securities on that basis. Blackstone may retain any commissions, remuneration, or other profits and receive compensation from such underwriting activities, which have the potential to create conflicts of interest. Blackstone may also participate in underwriting syndicates from time to time with respect to us or portfolio companies/entities of Blackstone Vehicles, or may otherwise be involved in the private placement of debt or equity securities issued by us or such portfolio companies/entities, or otherwise in arranging financings with respect thereto or advising on such transactions. Subject to applicable law, Blackstone may receive underwriting fees, placement commissions, or other compensation with respect to such activities, which will not be shared with us or our stockholders. Where Blackstone serves as underwriter with respect to the securities of a portfolio company/entity, we or the applicable Blackstone Vehicle holding such securities may be subject to a “lock-up” period following the offering under applicable regulations during which time our ability to sell any securities that we continue to hold is restricted. This may prejudice our ability to dispose of such securities at an opportune time. |
In the regular course of its investment banking business, Blackstone represents potential purchasers, sellers and other involved parties, including corporations, financial buyers, management, shareholders and institutions, with respect to assets that are suitable for investment by us. In such case, Blackstone’s client would typically require Blackstone to act exclusively on its behalf, thereby precluding us from acquiring such assets. Blackstone is under no obligation to decline any such engagement to make the investment opportunity available to us.
Blackstone has long-term relationships with a significant number of corporations and their senior management. In determining whether to invest in a particular transaction on our behalf, our Manager may consider those relationships (subject to its obligations under the Management Agreement), which
37
Table of Contents
may result in certain transactions that our Manager will not undertake on our behalf in view of such relationships.
| • | Service Providers. Certain of our service providers, or their affiliates (including accountants, administrators, lenders, brokers, attorneys, consultants, title agents, property managers and investment banking or commercial banking firms) also provide goods or services to or have business, personal or other relationships with Blackstone. For example, Blackstone may hold equity or other investments in companies or businesses in the real estate related information technology and other industries that may provide products or services to or otherwise contract with us or other Blackstone Vehicles. In connection with any such investment, Blackstone or other Blackstone Vehicles (or their respective portfolio companies/entities) may make referrals or introductions to other portfolio companies/entities in an effort, in part, to increase the customer base of such companies or businesses, and therefore the value of the investment, or because such referrals or introductions may result in financial incentives (including additional equity ownership) and/or milestones benefitting the referring or introducing party that are tied or related to participation by portfolio companies/entities. We will not share in any fees, economics or equity accruing to Blackstone or such other Blackstone Vehicles as a result of these relationships. In addition, we may enter into agreements regarding group procurement (such as a group purchasing organization), benefits management, purchase of title and/or other insurance policies (which will from time to time be pooled and discounted due to scale) from a third party or a Blackstone affiliate, and other similar operational, administrative, or management related initiatives that result in commissions, discounts or similar payments to Blackstone or its affiliates (including personnel), including related to a portion of the savings achieved. Such service providers may be sources of investment opportunities or co-investors or commercial counterparties. Such relationships may influence our Manager in deciding whether to select such service provider. In certain circumstances, service providers, or their affiliates, may charge different rates (including below-market rates or at no cost) or have different arrangements for services provided to Blackstone or its affiliates as compared to services provided to us, which in certain circumstances may result in more favorable rates or arrangements than those payable by us. In addition, in instances where multiple Blackstone businesses may be exploring a potential individual investment, certain of these service providers may choose to be engaged by other Blackstone affiliates rather than us. |
In addition, certain advisors and service providers (including law firms) may temporarily provide their personnel to Blackstone, us or other funds advised by Blackstone or their portfolio companies pursuant to various arrangements including at cost or at no cost. While often we and such other Blackstone-advised funds and their portfolio companies are the beneficiaries of these types of arrangements, Blackstone is from time to time a beneficiary of these arrangements as well, including in circumstances where the advisor or service provider also provides services to us in the ordinary course. Such personnel may provide services in respect of multiple matters, including in respect of matters related to Blackstone, its affiliates and/or portfolio companies and any costs of such personnel may be allocated accordingly.
CTIMCO, a subsidiary of Blackstone, acts as special servicer in connection with our recent CLO transaction and may act as special servicer in future securitization financing transactions. CTIMCO, in its capacity as special servicer, may be required to enforce obligations or undertake certain other actions that may conflict with our interests.
Blackstone partnered with a leading national title agency to create Lexington National Land Services, or LNLS, a title agent company. LNLS acts as an agent for one or more underwriters in issuing title policies and/or providing support services in connection with investments by us, other Blackstone Vehicles and third parties, including, from time to time, our borrowers. LNLS focuses on transactions in rate-regulated states where the cost of title insurance is non-negotiable. LNLS will not perform services in nonregulated states related to our or other Blackstone Vehicles’ investments unless (i) it is in the context of a portfolio transaction that includes properties in rate regulated states, (ii) as part of a syndicate of title insurance companies where the rate is negotiated by other insurers or their agents,
38
Table of Contents
(iii) when a third party is paying all or a material portion of the premium or (iv) when providing only support services to the underwriter and not negotiating the title policy or issuing it to the insured. LNLS earns fees, which would have otherwise been paid to third parties, by providing title agency services and facilitating the placement of title insurance with underwriters. Blackstone receives distributions from LNLS in connection with our investments based on its equity interest in LNLS. In each case, there will be no related offset to us. As a result, while Blackstone believes the venture will provide services at or better than those provided by third parties (even in jurisdictions where insurance rates are regulated), there is an inherent conflict of interest that would incentivize us to recommend that our borrowers engage LNLS over a third party. We will not incur any expenses or receive any revenues when our borrowers engage LNLS.
| • | Material, Non-Public Information. We, directly or through Blackstone, our Manager or certain of their respective affiliates may come into possession of material non-public information with respect to an issuer in which we have invested or may invest. Should this occur, our Manager may be restricted from buying or selling securities, derivatives or loans of the issuer on our behalf until such time as the information becomes public or is no longer deemed material. Disclosure of such information to the personnel responsible for management of our business may be on a need-to-know basis only, and we may not be free to act upon any such information. Therefore, we and/or our Manager may not have access to material non-public information in the possession of Blackstone which might be relevant to an investment decision to be made by our Manager on our behalf, and our Manager may initiate a transaction or purchase or sell an investment which, if such information had been known to it, may not have been undertaken. Due to these restrictions, our Manager may not be able to initiate a transaction on our behalf that it otherwise might have initiated and may not be able to purchase or sell an investment that it otherwise might have purchased or sold, which could negatively affect our operations. |
| • | Possible Future Activities. Our Manager and its affiliates may expand the range of services that they provide over time. Except as and to the extent expressly provided in the Management Agreement, our Manager and its affiliates will not be restricted in the scope of its business or in the performance of any such services (whether now offered or undertaken in the future) even if such activities could give rise to conflicts of interest, and whether or not such conflicts are described herein. Our Manager, Blackstone and their affiliates continue to develop relationships with a significant number of companies, financial sponsors and their senior managers, including relationships with clients who may hold or may have held investments similar to those intended to be made by us. These clients may themselves represent appropriate investment opportunities for us or may compete with us for investment opportunities. |
| • | Transactions with Blackstone Vehicles. From time to time, we may enter into purchase and sale transactions with Blackstone Vehicles. Such transactions will be conducted in accordance with, and subject to, the terms and conditions of the Management Agreement (including the requirement that sales to or acquisitions of investments from Blackstone, any Blackstone Vehicle or any of their affiliates be approved in advance by a majority of our independent directors) and our code of business conduct and ethics and applicable laws and regulations. |
| • | Loan Refinancings. We may from time to time seek to participate in investments relating to the refinancing of loans held by the Blackstone Vehicles (including the BREDS funds). While it is expected that our participation in connection with such refinancing transactions will be at arms’ length and on market/contract terms, such transactions may give rise to potential or actual conflicts of interest. |
| • | Other Affiliate Transactions. Our Manager may on our behalf acquire debt issued by a borrower in which a separate equity or another debt investment has been made by Blackstone or its other affiliates, including the BREDS funds. In connection with investments in which we participate alongside other Blackstone Vehicles (including the BREDS funds), we may from time to time share certain rights with such other Blackstone Vehicles relating to such investments for legal, tax, regulatory or other similar |
39
Table of Contents
| reasons, including, in certain instances, certain control-related rights with respect to jointly-held investments. When making any such investments, there may be conflicting interests. There can be no assurance that the return on our investment will be equivalent to or better than the returns obtained by Blackstone or its other affiliates. |
| • | Family Relationships. Certain employees and other professionals of Blackstone have family members or relatives that are actively involved in the real estate industry and/or have business, personal, financial or other relationships with companies in the real estate industry, which gives rise to potential or actual conflicts of interest. For example, such family members or relatives might be employees, officers, directors or owners of companies or assets which are actual or potential investments of us or our other counterparties. Moreover, in certain instances, we may transact with companies that are owned by such family members or relatives or in respect of which such family members or relatives have other involvement. To the extent Blackstone determines appropriate, it may put in place conflict mitigation strategies with respect to a particular circumstance, such as internal information barriers or recusal, disclosure or other steps determined appropriate by the Manager. |
Blackstone may enter into one or more strategic relationships in certain regions or with respect to certain types of investments that, although intended to provide greater opportunities for us, may require us to share such opportunities or otherwise limit the amount of an opportunity we can otherwise take.
Further conflicts could arise once we and Blackstone or its affiliates have made their respective investments. For example, if a company goes into bankruptcy or reorganization, becomes insolvent or otherwise experiences financial distress or is unable to meet its payment obligations or comply with covenants relating to securities held by us or by the Blackstone or its affiliates, Blackstone or its affiliates may have an interest that conflicts with our interests or Blackstone or its affiliates may have information regarding the company that we do not have access to. If additional financing is necessary as a result of financial or other difficulties, it may not be in our best interests to provide such additional financing. If Blackstone or its affiliates were to lose their respective investments as a result of such difficulties, the ability of our Manager to recommend actions in our best interests might be impaired.
Termination of the Management Agreement would be costly.
Termination of the Management Agreement without cause will be difficult and costly. Our independent directors review our Manager’s performance annually and the Management Agreement may be terminated each year upon the affirmative vote of at least two-thirds of our independent directors, based upon a determination that (i) our Manager’s performance is unsatisfactory and materially detrimental to us or (ii) the base management fee and incentive fee payable to our Manager are not fair (provided that in this instance, our Manager will be afforded the opportunity to renegotiate the management fee and incentive fees prior to termination). We are required to provide our Manager with 180 days prior notice of any such termination. Additionally, upon such a termination, or if we materially breach the Management Agreement and our Manager terminates the Management Agreement, the Management Agreement provides that we will pay our Manager a termination fee equal to three times the sum of the average annual base management fee and the average annual incentive fee earned during the 24-month period immediately preceding the date of termination, calculated as of the end of the most recently completed fiscal quarter prior to the date of termination. These provisions increase the cost to us of terminating the Management Agreement and adversely affect our ability to terminate our Manager without cause.
Our Manager maintains a contractual as opposed to a fiduciary relationship with us. Our Manager’s liability is limited under the Management Agreement and we have agreed to indemnify our Manager against certain liabilities.
Pursuant to the Management Agreement, our Manager does not assume any responsibility other than to render the services called for thereunder and is not responsible for any action of our board of directors in following or
40
Table of Contents
declining to follow its advice or recommendations. Our Manager maintains a contractual as opposed to a fiduciary relationship with us. Under the terms of the Management Agreement, our Manager and its affiliates and their respective directors, officers, employees and stockholders are not liable to us, our directors, our stockholders or any subsidiary of ours, or their directors, officers, employees or stockholders for any acts or omissions performed in accordance with and pursuant to the Management Agreement, except by reason of acts or omissions constituting bad faith, willful misconduct, gross negligence, or reckless disregard of their duties under the Management Agreement. We have agreed to indemnify our Manager and its affiliates and their respective directors, officers, employees and stockholders with respect to all expenses, losses, damages, liabilities, demands, charges and claims arising from acts or omissions of our Manager not constituting bad faith, willful misconduct, gross negligence, or reckless disregard of duties, performed or not performed in good faith in accordance with and pursuant to the Management Agreement. As a result, we could experience poor performance or losses for which our Manager would not be liable.
We do not own the Blackstone or BXMT name, but we may use it as part of our corporate name pursuant to a trademark license agreement with an affiliate of Blackstone. Use of the name by other parties or the termination of our trademark license agreement may harm our business.
We have entered into an amended and restated trademark license agreement, or Trademark License Agreement, with an affiliate of Blackstone pursuant to which it has granted us a fully paid-up, royalty-free, non-exclusive, non-transferable license to use the names “Blackstone Mortgage Trust, Inc.” and “BXMT”. Under this agreement, we have a right to use these names for so long as our Manager (or another affiliate of Blackstone TM L.L.C., or Licensor) serves as our Manager (or another managing entity) and our Manager remains an affiliate of the Licensor under the Trademark License Agreement. The Trademark License Agreement may also be earlier terminated by either party as a result of certain breaches or for convenience upon 90 days’ prior written notice; provided that upon notification of such termination by us, the Licensor may elect to effect termination of the Trademark License Agreement immediately at any time after 30 days from the date of such notification. The Licensor and its affiliates, such as Blackstone, will retain the right to continue using the “Blackstone” and “BXMT” names. We will further be unable to preclude the Licensor from licensing or transferring the ownership of the “Blackstone” or “BXMT” names to third parties, some of whom may compete with us. Consequently, we will be unable to prevent any damage to goodwill that may occur as a result of the activities of the Licensor, Blackstone or others. Furthermore, in the event that the Trademark License Agreement is terminated, we would be required to, among other things, change our name and NYSE ticker symbol. Any of these events could disrupt our recognition in the market place, damage any goodwill we may have generated and otherwise harm our business.
Risks Related to Our Company
Our investment strategy or guidelines, asset allocation and financing strategy may be changed without stockholder consent.
Our Manager is authorized to follow broad investment guidelines that have been approved by our board of directors. Those investment guidelines, as well as our financing strategy or hedging policies with respect to investments, originations, acquisitions, growth, operations, indebtedness, capitalization and distributions, may be changed at any time without the consent of our stockholders. This could result in an investment portfolio with a different risk profile. A change in our investment strategy may increase our exposure to interest rate risk, default risk and real estate market fluctuations. Furthermore, a change in our asset allocation could result in our making investments in asset categories different from those described in this report. These changes could adversely affect our results of operations and financial condition.
We must manage our portfolio so that we do not become an investment company that is subject to regulation under the Investment Company Act.
We conduct our operations so that we avail ourselves of the statutory exclusion provided in Section 3(c)(5)(C) for companies engaged primarily in investment in mortgages and other liens on or interests in real estate. In order
41
Table of Contents
to qualify for this exclusion, we must maintain, on the basis of positions taken by the SEC’s Division of Investment Management, or the Division, in interpretive and no-action letters, a minimum of 55% of the value of our total assets in mortgage loans and other related assets that are considered “mortgages and other liens on and interests in real estate,” which we refer to as Qualifying Interests, and a minimum of 80% in Qualifying Interests and real estate-related assets. In the absence of SEC or Division guidance that supports the treatment of other investments as Qualifying Interests, we will treat those other investments appropriately as real estate-related assets or miscellaneous assets depending on the circumstances.
In August 2011, the SEC staff commenced an advance notice rulemaking initiative, indicating that it is reconsidering its interpretive policy under Section 3(c)(5)(C) and whether to advance rulemaking to define the basis for the exclusion. We cannot predict the outcome of this reconsideration or potential rulemaking initiative and its impact on our ability to rely on the exclusion. To the extent that the SEC or its staff provides more specific guidance regarding any of the matters bearing upon the requirements of Section 3(c)(5)(C) of the Investment Company Act, we may be required to adjust our strategy accordingly. Any additional guidance from the SEC or its staff could further inhibit our ability to pursue the strategies we have chosen.
Because registration as an investment company would significantly affect our ability to engage in certain transactions or be structured in the manner we currently are, we intend to conduct our business so that we will continue to satisfy the requirements to avoid regulation as an investment company. If we do not meet these requirements, we could be forced to alter our investment portfolios by selling or otherwise disposing of a substantial portion of the assets that do not satisfy the applicable requirements or by acquiring a significant position in assets that are Qualifying Interests. In the past, when required due to the mix of assets in our balance sheet portfolio, and in connection with our reliance on the Section 3(c)(5)(C) exclusion, we have purchased agency residential mortgage-backed securities that represent the entire beneficial interests in the underlying pools of whole residential mortgage loans, which are treated as Qualifying Interests based on the Division’s positions. Such investments may not represent an optimum use of capital when compared to the available investments we and our subsidiaries target pursuant to our investment strategy and present additional risks to us. We continue to analyze our investments and may acquire other pools of whole loan residential mortgage-backed securities when and if required for compliance purposes. Altering our portfolio in this manner may have an adverse effect on our investments if we are forced to dispose of or acquire assets in an unfavorable market, and may adversely affect our stock price.
If it were established that we were an unregistered investment company, there would be a risk that we would be subject to monetary penalties and injunctive relief in an action brought by the SEC, that we would be unable to enforce contracts with third parties, that third parties could seek to obtain rescission of transactions undertaken during the period it was established that we were an unregistered investment company, and that we would be subject to limitations on corporate leverage that would have an adverse impact on our investment returns. In order to comply with provisions that allow us to avoid the consequences of registration under the Investment Company Act, we may need to forego otherwise attractive opportunities and limit the manner in which we conduct our operations. Therefore, compliance with the requirements of the Investment Company Act may hinder our ability to operate solely on the basis of maximizing profits.
Rapid changes in the values of our other real estate-related investments may make it more difficult for us to maintain our qualification as a REIT or exclusion from regulation under the Investment Company Act.
If the market value or income potential of real estate-related investments declines, we may need to increase our real estate investments and income and/or liquidate our non-qualifying assets in order to maintain our REIT qualification or exclusion from the Investment Company Act regulation. If the decline in real estate asset values and/or income occurs quickly, this may be especially difficult to accomplish. This difficulty may be exacerbated by the illiquid nature of any non-qualifying assets that we may own. We may have to make investment decisions that we otherwise would not make absent the REIT qualification and Investment Company Act considerations.
42
Table of Contents
Changes in laws or regulations governing our operations, changes in the interpretation thereof or newly enacted laws or regulations and any failure by us to comply with these laws or regulations, could require changes to certain of our business practices, negatively impact our operations, cash flow or financial condition, impose additional costs on us or otherwise adversely affect our business.
The laws and regulations governing our operations, as well as their interpretation, may change from time to time, and new laws and regulations may be enacted. Accordingly, any change in these laws or regulations, changes in their interpretation, or newly enacted laws or regulations and any failure by us to comply with these laws or regulations, could require changes to certain of our business practices, negatively impact our operations, cash flow or financial condition, impose additional costs on us or otherwise adversely affect our business. Furthermore, if regulatory capital requirements—whether under the Dodd-Frank Act, Basel III (i.e., the framework for a comprehensive set of capital and liquidity standards for internationally active banking organizations, which was adopted in June 2011 by the Basel Committee on Banking Supervision, an international body comprised of senior representatives of bank supervisory authorities and central banks from 27 countries, including the United States) or other regulatory action—are imposed on private lenders that provide us with funds, or were to be imposed on us, they or we may be required to limit, or increase the cost of, financing they provide to us or that we provide to others. Among other things, this could potentially increase our financing costs, reduce our ability to originate or acquire loans and reduce our liquidity or require us to sell assets at an inopportune time or price.
Over the last several years, there also has been an increase in regulatory attention to the extension of credit outside of the traditional banking sector, raising the possibility that some portion of the non-bank financial sector will be subject to new regulation. While it cannot be known at this time whether any regulation will be implemented or what form it will take, increased regulation of non-bank credit extension could negatively impact our operations, cash flows or financial condition, impose additional costs on us, intensify the regulatory supervision of us or otherwise adversely affect our business.
In addition, the Iran Threat Reduction and Syria Human Rights Act of 2012, or ITRA, expands the scope of U.S. sanctions against Iran and Syria. In particular, Section 219 of the ITRA amended the Exchange Act to require companies subject to SEC reporting obligations under Section 13 of the Exchange Act to disclose in their periodic reports specified dealings or transactions involving Iran or other individuals and entities targeted by certain sanctions promulgated by the Office of Foreign Assets Control of the U.S. Department of the Treasury, or Treasury, engaged in by the reporting company or any of its affiliates during the period covered by the relevant periodic report. These companies are required to separately file with the SEC a notice that such activities have been disclosed in the relevant periodic reports, and the SEC is required to post this notice of disclosure on its website and send the report to the U.S. President and certain U.S. Congressional committees. The U.S. President thereafter is required to initiate an investigation and, within 180 days of initiating such an investigation with respect to certain disclosed activities, to determine whether sanctions should be imposed. Disclosure of such activity, even if such activity is not subject to sanctions under applicable law, and any sanctions actually imposed on us or our affiliates as a result of these activities, could harm our reputation and have a negative impact on our business.
State and foreign licensing requirements will cause us to incur expenses and our failure to be properly licensed may have a material adverse effect on us and our operations.
Non-bank companies are generally required to hold licenses in a number of U.S. states and foreign jurisdictions to conduct lending activities. These licensing statutes vary from jurisdiction to jurisdiction and prescribe or impose various recordkeeping requirements; restrictions on loan origination and servicing practices, including limits on finance charges and the type, amount and manner of charging fees; disclosure requirements; requirements that licensees submit to periodic examination; surety bond and minimum specified net worth requirements; periodic financial reporting requirements; notification requirements for changes in principal officers, stock ownership or corporate control; restrictions on advertising; and requirements that loan forms be
43
Table of Contents
submitted for review. Obtaining and maintaining licenses will cause us to incur expenses and failure to be properly licensed under such laws or otherwise may have a material adverse effect on us and our operations.
Actions of the U.S. government, including the U.S. Congress, Federal Reserve Board, Treasury and other governmental and regulatory bodies, to stabilize or reform the financial markets, or market response to those actions, may not achieve the intended effect and may adversely affect our business.
In July 2010, the Dodd-Frank Act was signed into law, which imposes significant investment restrictions and capital requirements on banking entities and other organizations that are significant to U.S. financial stability. For instance, the so-called “Volcker Rule” provisions of the Dodd-Frank Act impose significant restrictions on the proprietary trading activities of banking entities and on their ability to sponsor or invest in private equity and hedge funds. It also subjects nonbank financial companies that have been designated as “systemically important” by the Financial Stability Oversight Council to increased capital requirements and quantitative limits for engaging in such activities, as well as consolidated supervision by the Federal Reserve Board. The Dodd-Frank Act also seeks to reform the asset-backed securitization market (including the mortgage-backed securities market) by requiring the retention of a portion of the credit risk inherent in the pool of securitized assets and by imposing additional registration and disclosure requirements. In October 2014, five federal banking and housing agencies and the SEC issued final credit risk retention rules, which generally require sponsors of asset-backed securities to retain at least 5% of the credit risk relating to the assets that underlie such asset-backed securities. These rules, which generally became effective in December 2016 with respect to new securitization transactions backed by mortgage loans other than residential mortgage loans, could restrict credit availability and could negatively affect the terms and availability of credit to fund our investments. While the full impact of the Dodd-Frank Act cannot be fully assessed, the Dodd-Frank Act’s extensive requirements may have a significant effect on the financial markets and may affect the availability or terms of financing from our lender counterparties and the availability or terms of mortgage-backed securities, which may, in turn, have an adverse effect on our business.
On December 16, 2015, the CFTC published a final rule governing margin requirements for uncleared swaps entered into by registered swap dealers and major swap participants who are not supervised by the Federal Reserve Board, the Office of the Comptroller of the Currency, the Federal Deposit Insurance Corporation, the Farm Credit Administration and the Federal Housing Finance Agency (collectively, the “Prudential Regulators”), referred to as “covered swap entities”. The final rule generally requires covered swap entities, subject to certain thresholds and exemptions, to collect and post margin in respect of uncleared swap transactions with other covered swap entities and financial end-users. In particular, the final rule requires covered swap entities and financial end-users having “material swaps exposure,” defined as an average aggregate daily notional amount of uncleared swaps exceeding a certain specified amount, to collect and/or post (as applicable) a minimum amount of “initial margin” in respect of each uncleared swap; the specified amounts for material swaps exposure differ subject to a phase-in schedule until September 1, 2020, when the average aggregate daily notional amount will thenceforth be $8 billion as calculated from June, July and August of the previous calendar year. In addition, the final rule requires covered swap entities entering into uncleared swaps with other covered swap entities or financial-end users, regardless of swaps exposure, to post and/or collect (as applicable) “variation margin” in reflection of changes in the mark-to-market value of an uncleared swap since the swap was executed or the last time such margin was exchanged. The CFTC final rule is broadly consistent with a similar rule requiring the exchange of initial and variation margin adopted by the Prudential Regulators in October 2015, which apply to registered swap dealers, major swap participants, security-based swap dealers and major security-based swap participants that are supervised by one or more of the Prudential Regulators. These newly adopted rules on margin requirements for uncleared swaps could adversely affect our business, including our ability to enter such swaps or our available liquidity.
The current regulatory environment may be impacted by future legislative developments, such as amendments to key provisions of the Dodd-Frank Act, including provisions setting forth capital and risk retention requirements. On February 3, 2017, President Trump signed an executive order calling for the administration to review U.S.
44
Table of Contents
financial laws and regulations in order to determine their consistency with a set of core principles identified in the order. The full scope of President Trump’s short-term legislative agenda is not yet fully known, but it may include certain deregulatory measures for the U.S. financial services industry, including changes to Financial Stability Oversight Council, the Volcker Rule and credit risk retention requirements, among other areas. In particular, on June 8, 2017, one pending bill, called the Financial CHOICE Act, or the CHOICE Act, was passed by the U.S. House of Representatives. If passed by the U.S. Senate and signed into law by President Trump, the CHOICE Act would, among other things, remove risk retention requirements for non-residential mortgage securitizations.
Operational risks may disrupt our businesses, result in losses or limit our growth.
We rely heavily on our and Blackstone’s financial, accounting, treasury, communications and other data processing systems. Such systems may fail to operate properly or become disabled as a result of tampering or a breach of the network security systems or otherwise. In addition, such systems are from time to time subject to cyberattacks, which may continue to increase in sophistication and frequency in the future. Breaches of our network security systems could involve attacks that are intended to obtain unauthorized access to our proprietary information, destroy data or disable, degrade or sabotage our systems, often through the introduction of computer viruses and other malicious code, cyberattacks and other means and could originate from a wide variety of sources, including unknown third parties outside the firm. Although Blackstone takes various measures to ensure the integrity of such systems, there can be no assurance that these measures will provide protection. If such systems are compromised, do not operate properly or are disabled, we could suffer financial loss, a disruption of our businesses, liability to investors, regulatory intervention or reputational damage.
In addition, we are highly dependent on information systems and technology. Our information systems and technology may not continue to be able to accommodate our growth, and the cost of maintaining such systems may increase from its current level. Such a failure to accommodate growth, or an increase in costs related to such information systems, could have a material adverse effect on us.
Furthermore, we depend on our headquarters in New York City, where most of our Manager’s personnel are located, for the continued operation of our business. A disaster or a disruption in the infrastructure that supports our business, including a disruption involving electronic communications or other services used by us or third parties with whom we conduct business, or directly affecting our headquarters, could have a material adverse impact on our ability to continue to operate our business without interruption. Blackstone’s disaster recovery programs may not be sufficient to mitigate the harm that may result from such a disaster or disruption. In addition, insurance and other safeguards might only partially reimburse us for our losses, if at all.
Finally, we rely on third party service providers for certain aspects of our business, including for certain information systems, technology and administration. Any interruption or deterioration in the performance of these third parties or failures of their information systems and technology could impair the quality of our operations and could affect our reputation and hence adversely affect our business.
Under the agreements that govern our 2012 strategic transactions with Blackstone, we have retained responsibility for certain liabilities of our historical investment management and special servicing business, which could be substantial.
Under the purchase and sale agreement, dated September 27, 2012, or Purchase Agreement, by and between us and Huskies Acquisition, LLC, or Huskies Acquisition, an affiliate of Blackstone, relating to our December 19, 2012 disposition of our investment management and special servicing business, including CTIMCO, and related private investment fund co-investments, we are required to indemnify Huskies Acquisition and its affiliates for all pre-closing liabilities relating to our prior ownership, management and operation of our historical investment management and special servicing business. The Purchase Agreement does not limit the duration of our obligations to Huskies Acquisition or its affiliates with respect to these indemnities. In the event that the amount
45
Table of Contents
of these liabilities were to exceed our expectations, we could be responsible to Huskies Acquisition and its affiliates for substantial indemnification obligations, which could adversely affect our results of operations and financial condition. In addition, claims for indemnification could result in conflicts with our Manager.
Accounting rules for certain of our transactions are highly complex and involve significant judgment and assumptions. Changes in accounting interpretations or assumptions could impact our ability to timely prepare consolidated financial statements.
Accounting rules for transfers of financial assets, securitization transactions, consolidation of variable interest entities, loan loss reserves and other aspects of our operations are highly complex and involve significant judgment and assumptions. These complexities could lead to a delay in preparation of financial information and the delivery of this information to our stockholders. Changes in accounting interpretations or assumptions could impact our consolidated financial statements and our ability to timely prepare our consolidated financial statements. Our inability to timely prepare our consolidated financial statements in the future would likely have a significant adverse effect on our stock price.
Risks Related to our REIT Status and Certain Other Tax Items
If we do not maintain our qualification as a REIT, we will be subject to tax as a regular corporation and could face a substantial tax liability. Our taxable REIT subsidiaries are subject to income tax.
We expect to continue to operate so as to qualify as a REIT under the Internal Revenue Code. However, qualification as a REIT involves the application of highly technical and complex Internal Revenue Code provisions for which only a limited number of judicial or administrative interpretations exist. Notwithstanding the availability of cure provisions in the Internal Revenue Code, we could fail to meet various compliance requirements, which could jeopardize our REIT status. Furthermore, new tax legislation, administrative guidance or court decisions, in each instance potentially with retroactive effect, could make it more difficult or impossible for us to qualify as a REIT. If we fail to qualify as a REIT in any tax year, then:
| • | we would be taxed as a regular domestic corporation, which under current laws, among other things, means being unable to deduct distributions to stockholders in computing taxable income and being subject to federal income tax on our taxable income at regular corporate income tax rates; |
| • | any resulting tax liability could be substantial and could have a material adverse effect on our book value; |
| • | unless we were entitled to relief under applicable statutory provisions, we would be required to pay taxes, and therefore, our cash available for distribution to stockholders would be reduced for each of the years during which we did not qualify as a REIT and for which we had taxable income; and |
| • | we generally would not be eligible to requalify as a REIT for the subsequent four full taxable years. |
REITs, in certain circumstances, may incur tax liabilities that would reduce our cash available for distribution to our stockholders.
Even if we qualify and maintain our status as a REIT, we may become subject to U.S. federal income taxes and related state and local taxes. For example, net income from the sale of properties that are “dealer” properties sold by a REIT (a “prohibited transaction” under the Internal Revenue Code) will be subject to a 100% tax. We may not make sufficient distributions to avoid excise taxes applicable to REITs. Similarly, if we were to fail an income test (and did not lose our REIT status because such failure was due to reasonable cause and not willful neglect) we would be subject to tax on the income that does not meet the income test requirements. We also may decide to retain net capital gain we earn from the sale or other disposition of our investments and pay income tax directly on such income. In that event, our stockholders would be treated as if they earned that income and paid the tax on it directly. However, stockholders that are tax-exempt, such as charities or qualified pension plans,
46
Table of Contents
would have no benefit from their deemed payment of such tax liability unless they file U.S. federal income tax returns and thereon seek a refund of such tax. We also may be subject to state and local taxes on our income or property, including franchise, payroll, mortgage recording and transfer taxes, either directly or at the level of the other companies through which we indirectly own our assets, such as our TRSs, which are subject to full U.S. federal, state, local and foreign corporate-level income taxes. Any taxes we pay directly or indirectly will reduce our cash available for distribution to our stockholders.
Complying with REIT requirements may cause us to forego otherwise attractive opportunities and limit our expansion opportunities.
In order to qualify as a REIT for U.S. federal income tax purposes, we must continually satisfy tests concerning, among other things, our sources of income, the nature of our investments in commercial real estate loans and related assets, the amounts we distribute to our stockholders and the ownership of our stock. We may also be required to make distributions to stockholders at disadvantageous times or when we do not have funds readily available for distribution. Therefore, compliance with REIT requirements may hinder our ability to operate solely on the basis of maximizing profits.
Complying with REIT requirements may force us to liquidate or restructure otherwise attractive investments.
In order to qualify as a REIT, we must ensure that at the end of each calendar quarter, at least 75% of the value of our assets consists of cash, cash items, government securities and qualified REIT real estate assets. The remainder of our investments in securities cannot include more than 10% of the outstanding voting securities of any one issuer or 10% of the total value of the outstanding securities (other than securities that qualify for the straight debt safe harbor) of any one issuer unless we and such issuer jointly elect for such issuer to be treated as a “taxable REIT subsidiary” under the Internal Revenue Code. Debt will generally meet the “straight debt” safe harbor if the debt is a written unconditional promise to pay on demand or on a specified date a certain sum of money, the debt is not convertible, directly or indirectly, into stock, and the interest rate and the interest payment dates of the debt are not contingent on the profits, the borrower’s discretion or similar factors. The total value of all of our investments in taxable REIT subsidiaries cannot exceed 20% of the value of our total assets. In addition, in general, no more than 5% of the value of our assets (other than government securities and qualified real estate assets) can consist of the securities of any one issuer other than a taxable REIT subsidiary. If we fail to comply with these requirements at the end of any calendar quarter, we must correct the failure within 30 days after the end of such calendar quarter or qualify for certain statutory relief provisions to avoid losing our REIT qualification and suffering adverse tax consequences. As a result, we may be required to liquidate assets from our portfolio or not make otherwise attractive investments in order to maintain our qualification as a REIT. These actions could have the effect of reducing our income and amounts available for distribution to our stockholders.
Complying with REIT requirements may limit our ability to hedge effectively and may cause us to incur tax liabilities.
The REIT provisions of the Internal Revenue Code substantially limit our ability to hedge our liabilities. Any income from a properly and timely identified hedging transaction we enter into to manage risk of interest rate changes with respect to borrowings made or to be made to acquire or carry real estate assets does not constitute “gross income” for purposes of the 75% or 95% gross income tests that we must satisfy in order to maintain our qualification as a REIT. To the extent that we enter into other types of hedging transactions, the income from those transactions is likely to be treated as non-qualifying income for purposes of both of these gross income tests. As a result of these rules, we intend to limit our use of advantageous hedging techniques or implement those hedges through a domestic TRS. This could increase the cost of our hedging activities because our TRS would be subject to tax on gains or expose us to greater risks associated with changes in interest rates than we would otherwise want to bear. In addition, losses in our TRS will generally not provide any tax benefit, except for being carried forward against future taxable income in the TRS.
47
Table of Contents
Complying with REIT requirements may force us to borrow to make distributions to stockholders.
From time to time, our taxable income may be greater than our cash flow available for distribution to stockholders. If we do not have other funds available in these situations, we may be unable to distribute substantially all of our taxable income as required by the REIT provisions of the Internal Revenue Code. Therefore, we could be required to borrow funds, sell a portion of our assets at disadvantageous prices or find another alternative. These options could increase our costs or reduce our equity.
Our charter does not permit any individual (including certain entities treated as individuals for this purpose) to own more than 9.9% of our class A common stock or of our capital stock, and attempts to acquire our class A common stock or any of our capital stock in excess of this 9.9% limit would not be effective without a prior exemption from those prohibitions by our board of directors.
For us to qualify as a REIT under the Internal Revenue Code, not more than 50% of the value of our outstanding stock may be owned, directly or indirectly, by five or fewer individuals (including certain entities treated as individuals for this purpose) during the last half of a taxable year. For the purpose of preserving our qualification as a REIT for federal income tax purposes, among other purposes, our charter prohibits beneficial or constructive ownership by any individual (including certain entities treated as individuals for this purpose) of more than a certain percentage, currently 9.9%, by value or number of shares, whichever is more restrictive, of the outstanding shares of our class A common stock or our capital stock, which we refer to as the “Ownership Limit.” The constructive ownership rules under the Internal Revenue Code and our charter are complex and may cause shares of the outstanding class A common stock owned by a group of related individuals or entities to be deemed to be constructively owned by one individual. As a result, the acquisition of less than 9.9% of our outstanding class A common stock or our capital stock by an individual or entity could cause an individual to constructively own in excess of 9.9% of our outstanding class A common stock or our capital stock, respectively, and thus violate the Ownership Limit. There can be no assurance that our board of directors, as permitted in the charter, will increase, or will not decrease, this Ownership Limit in the future. Any attempt to own or transfer shares of our class A common stock in excess of the Ownership Limit without the consent of our board of directors will result in either the shares being transferred by operation of our charter to a charitable trust, and the person who attempted to acquire such excess shares not having any rights in such excess shares, or in the transfer being void.
The Ownership Limit may have the effect of precluding a change in control of us by a third party, even if such change in control would be in the best interests of our stockholders or would result in receipt of a premium to the price of our class A common stock (and even if such change in control would not reasonably jeopardize our REIT status).
We may choose to make distributions in our own stock, in which case you may be required to pay income taxes without receiving any cash dividends.
In connection with our qualification as a REIT, we are required to annually distribute to our stockholders at least 90% of our REIT taxable income (which does not equal net income, as calculated in accordance with GAAP), determined without regard to the deduction for dividends paid and excluding net capital gain. In order to satisfy this requirement, we may make distributions that are payable in cash and/or shares of our class A common stock (at the election of each stockholder. As a publicly offered REIT, if at least 20% of the total dividend is available to be paid in cash and certain other requirements are satisfied, the IRS will treat the stock distribution as a dividend (to the extent applicable rules treat such distribution as being made out of our current or accumulated earnings and profits, as determined for U.S. federal income tax purposes). Taxable stockholders receiving such distributions will be required to include the full amount of such distributions as ordinary dividend income. As a result, U.S. stockholders may be required to pay income taxes with respect to such distributions in excess of the cash portion of the distribution received. Accordingly, U.S. stockholders receiving a distribution of our shares may be required to sell shares received in such distribution or may be required to sell other stock or assets owned
48
Table of Contents
by them, at a time that may be disadvantageous, in order to satisfy any tax imposed on such distribution. If a U.S. stockholder sells the stock that it receives as part of the distribution in order to pay this tax, the sales proceeds may be less than the amount it must include in income with respect to the distribution, depending on the market price of our stock at the time of the sale. Furthermore, with respect to certain non-U.S. stockholders, we may be required to withhold U.S. tax with respect to such distribution, including in respect of all or a portion of such distribution that is payable in stock, by withholding or disposing of part of the shares included in such distribution and using the proceeds of such disposition to satisfy the withholding tax imposed. In addition, if a significant number of our stockholders determine to sell shares of our class A common stock in order to pay taxes owed on dividend income, such sale may put downward pressure on the market price of our class A common stock.
Although the IRS recently addressed some of the tax aspects of such a taxable cash/stock distribution in a 2017 Revenue Procedure, no assurance can be given that the IRS will not impose requirements in the future with respect to taxable cash/stock distributions, including on a retroactive basis, or assert that the requirements for such taxable cash/stock distributions have not been met.
Dividends payable by REITs do not qualify for the reduced tax rates available for some dividends.
Currently, the maximum tax rate applicable to qualified dividend income payable to certain non-corporate U.S. stockholders is 20%. Dividends payable by REITs, however, generally are not eligible for the reduced rate. Although this does not adversely affect the taxation of REITs or dividends payable by REITs, the more favorable rates applicable to regular corporate qualified dividends could cause certain non-corporate investors to perceive investments in REITs to be relatively less attractive than investments in the stocks of non-REIT corporations that pay dividends, which could adversely affect the value of the shares of REITs, including our class A common stock.
Under the Tax Cuts and Jobs Act, REIT dividends (other than capital gain dividends and qualified dividends) received by non-corporate taxpayers may be eligible for a 20% deduction. Prospective investors should consult their own tax advisors regarding the effect of this change on their effective tax rate with respect to REIT dividends.
We are largely dependent on external sources of capital to finance our growth.
As with other REITs, but unlike corporations generally, our ability to finance our growth must largely be funded by external sources of capital because we generally will have to distribute to our stockholders 90% of our taxable income in order to qualify as a REIT, including taxable income where we do not receive corresponding cash. Our access to external capital will depend upon a number of factors, including general market conditions, the market’s perception of our growth potential, our current and potential future earnings, cash distributions and the market price of our class A common stock.
We may be subject to adverse legislative or regulatory tax changes that could increase our tax liability, reduce our operating flexibility and reduce the price of our class A common stock.
In recent years, numerous legislative, judicial and administrative changes have been made in the provisions of U.S. federal income tax laws applicable to investments similar to an investment in shares of our class A common stock. Additional changes to the tax laws are likely to continue to occur, and we cannot make assurances that any such changes will not adversely affect the taxation of a stockholder. Any such changes could have an adverse effect on an investment in our shares or on the market value or the resale potential of our assets. Stockholders are urged to consult with their tax advisors with respect to the impact of recent legislation on investments in our shares and the status of legislative, regulatory or administrative developments and proposals and their potential effect on an investment in our shares. Although REITs generally receive certain tax advantages compared to entities taxed as regular corporations, it is possible that future legislation would result in a REIT having fewer tax
49
Table of Contents
advantages, and it could become more advantageous for a company that invests in real estate to elect to be treated for U.S. federal income tax purposes as a corporation. As a result, our charter provides our board of directors with the power, under certain circumstances, to revoke or otherwise terminate our REIT election and cause us to be taxed as a regular corporation, without the vote of our stockholders. Our board of directors has duties to us and could only cause such changes in our tax treatment if it determines that such changes are in the best interest of our company.
Recently enacted tax reform legislation under the Tax Cuts and Jobs Act (the “Tax Act”) includes significant changes to the taxation of business entities. Among the numerous changes included in the legislation is a 20% deduction available to non-corporate taxpayers with respect to REIT dividends (other than capital gains dividends and qualified dividends). Moreover, under the Tax Act, we generally will be required to take certain amounts in income no later than the time such amounts are reflected on certain financial statements. The application of this rule may require the accrual of income with respect to our debt instruments, such as original issue discount or market discount, earlier than would be the case under the general tax rules, although the precise application of this rule is unclear at this time. This rule generally will be effective for tax years beginning after December 31, 2017 or, for debt instruments issued with original issue discount, for tax years beginning after December 31, 2018. To the extent that this rule requires the accrual of income earlier than under the general tax rules, it could increase our “phantom income,” which may make it more likely that we could be required to borrow funds or take other action to satisfy the REIT distribution requirements for the taxable year in which this “phantom income” is recognized. The impact of tax reform on your investment in us is uncertain. Prospective investors should consult their own tax advisors regarding changes in tax laws.
Our investments in certain debt instruments may cause us to recognize “phantom income” for U.S. federal income tax purposes even though no cash payments have been received on the debt instruments, and certain modifications of such debt by us could cause the modified debt to not qualify as a good REIT asset, thereby jeopardizing our REIT qualification.
Our taxable income may substantially exceed our net income as determined under GAAP, and differences in timing between the recognition of taxable income and the actual receipt of cash may occur. For example, we may acquire assets, including debt securities requiring us to accrue original issue discount, or OID, or recognize market discount income, that generate taxable income in excess of economic income or in advance of the corresponding cash flow from the assets referred to as “phantom income.” In addition, if a borrower with respect to a particular debt instrument encounters financial difficulty rendering it unable to pay stated interest as due, we may nonetheless be required to continue to recognize the unpaid interest as taxable income with the effect that we will recognize income but will not have a corresponding amount of cash available for distribution to our stockholders.
As a result of the foregoing, we may generate less cash flow than taxable income in a particular year and find it difficult or impossible to meet the REIT distribution requirements in certain circumstances. In such circumstances, we may be required to (a) sell assets in adverse market conditions, (b) borrow on unfavorable terms, (c) distribute amounts that would otherwise be used for future acquisitions or used to repay debt, or (d) make a taxable distribution of our shares of class A common stock as part of a distribution in which stockholders may elect to receive shares of class A common stock or (subject to a limit measured as a percentage of the total distribution) cash, in order to comply with the REIT distribution requirements.
Moreover, we may acquire distressed loans or other distressed debt investments that require subsequent modification by agreement with the borrower. If the amendments to the outstanding debt are “significant modifications” under the applicable Treasury Regulations, the modified debt may be considered to have been reissued to us in a debt-for-debt taxable exchange with the borrower. In certain circumstances, this deemed reissuance may prevent a portion of the modified debt from qualifying as a good REIT asset if the underlying security has declined in value and would cause us to recognize income to the extent the principal amount of the modified debt exceeds our adjusted tax basis in the unmodified debt.
50
Table of Contents
The “taxable mortgage pool” rules may increase the taxes that we or our stockholders may incur, and may limit the manner in which we effect future securitizations.
Securitizations could result in the creation of taxable mortgage pools for federal income tax purposes. As a REIT, so long as we own 100% of the equity interests in a taxable mortgage pool, we generally would not be adversely affected by the characterization of the securitization as a taxable mortgage pool. Certain categories of stockholders, however, such as foreign stockholders eligible for treaty or other benefits, stockholders with net operating losses, and certain tax-exempt stockholders that are subject to unrelated business income tax, could be subject to increased taxes on a portion of their dividend income from us that is attributable to the taxable mortgage pool. In addition, to the extent that our stock is owned by tax-exempt “disqualified organizations,” such as certain government-related entities and charitable remainder trusts that are not subject to tax on unrelated business income, we may incur a corporate level tax on a portion of our income from the taxable mortgage pool. In that case, we may reduce the amount of our distributions to any disqualified organization whose stock ownership gave rise to the tax. Moreover, we would be precluded from selling equity interests in these securitizations to outside investors, or selling any debt securities issued in connection with these securitizations that might be considered to be equity interests for tax purposes. These limitations may prevent us from using certain techniques to maximize our returns from securitization transactions.
The failure of a mezzanine loan to qualify as a real estate asset could adversely affect our ability to qualify as a REIT.
We may originate or acquire mezzanine loans, for which the IRS has provided a safe harbor but not rules of substantive law. Pursuant to the safe harbor, if a mezzanine loan meets certain requirements, it will be treated by the IRS as a real estate asset for purposes of the REIT asset tests, and interest derived from the mezzanine loan will be treated as qualifying mortgage interest for purposes of the REIT 75% income test. We may originate or acquire mezzanine loans that do not meet all of the requirements of this safe harbor. In the event we own a mezzanine loan that does not meet the safe harbor, the IRS could challenge such loan’s treatment as a real estate asset for purposes of the REIT asset and income tests and, if such a challenge were sustained, we could fail to qualify as a REIT.
The failure of assets subject to repurchase agreements to qualify as real estate assets could adversely affect our ability to qualify as a REIT.
We have entered into financing arrangements that are structured as sale and repurchase agreements pursuant to which we would nominally sell certain of our assets to a counterparty and simultaneously enter into an agreement to repurchase these assets at a later date in exchange for a purchase price. Economically, these agreements are financings which are secured by the assets sold pursuant thereto. We believe that we would be treated for REIT asset and income test purposes as the owner of the assets that are the subject of any such sale and repurchase agreement notwithstanding that such agreements may transfer record ownership of the assets to the counterparty during the term of the agreement. It is possible, however, that the IRS could assert that we did not own the assets during the term of the sale and repurchase agreement, in which case we could fail to qualify as a REIT.
Liquidation of assets may jeopardize our REIT qualification.
To qualify as a REIT, we must comply with requirements regarding our assets and our sources of income. If we are compelled to liquidate our investments to repay obligations to our lenders, we may be unable to comply with these requirements, ultimately jeopardizing our qualification as a REIT, or we may be subject to a 100% tax on any resultant gain if we sell assets that are treated as dealer property or inventory.
Our ownership of and relationship with any TRS will be restricted, and a failure to comply with the restrictions would jeopardize our REIT status and may result in the application of a 100% excise tax.
A REIT may own up to 100% of the stock of one or more TRSs. A TRS may earn income that would not be qualifying income if earned directly by the parent REIT. Both the subsidiary and the REIT must jointly elect to
51
Table of Contents
treat the subsidiary as a TRS. A corporation of which a TRS directly or indirectly owns more than 35% of the voting power or value of the stock will automatically be treated as a TRS. Overall, no more than 20% of the value of a REIT’s assets may consist of stock or securities of one or more TRSs. The value of our interests in and, therefore, the amount of assets held in a TRS may also be restricted by our need to qualify for an exclusion from regulation as an investment company under the Investment Company Act. A TRS will pay federal, state and local income tax at regular corporate rates on any income that it earns. In addition, the TRS rules limit the deductibility of interest paid or accrued by a TRS to its parent REIT to assure that the TRS is subject to an appropriate level of corporate taxation. Further, recently enacted tax reform legislation imposes a disallowance of deductions for business interest expense (even if paid to third parties) in excess of the sum of a taxpayer’s business interest income and 30% of the adjusted taxable income of the business, which is its taxable income computed without regard to business interest income or expense, net operating losses or the pass-through income deduction (and for taxable years before 2022, excludes depreciation and amortization). The TRS rules also impose a 100% excise tax on certain transactions between a TRS and its parent REIT that are not conducted on an arm’s-length basis.
Any domestic TRS we own will pay federal, state and local income tax on its taxable income, and its after-tax net income is available for distribution to us. Although we plan to monitor our investments in TRSs, there can be no assurance that we will be able to comply with the limitations discussed above or to avoid application of the 100% excise tax discussed above.
Risks Related to Our Class A Common Stock
The market price of our class A common stock may fluctuate significantly.
Our class A common stock is listed on the NYSE under the trading symbol “BXMT.” The capital and credit markets have on occasion experienced periods of extreme volatility and disruption. The market price and liquidity of the market for shares of our class A common stock may be significantly affected by numerous factors, some of which are beyond our control and may not be directly related to our operating performance. Some of the factors that could negatively affect the market price of our class A common stock include:
| • | our actual or projected operating results, financial condition, cash flows and liquidity, or changes in business strategy or prospects; |
| • | actual or perceived conflicts of interest with our Manager or other affiliates of Blackstone and individuals, including our executives; |
| • | equity issuances by us, or share resales by our stockholders, or the perception that such issuances or resales may occur; |
| • | loss of a major funding source; |
| • | actual or anticipated accounting problems; |
| • | publication of research reports about us or the real estate industry; |
| • | changes in market valuations of similar companies; |
| • | adverse market reaction to the level of leverage we employ; |
| • | additions to or departures of our Manager’s or Blackstone’s key personnel; |
| • | speculation in the press or investment community; |
| • | our failure to meet, or the lowering of, our earnings estimates or those of any securities analysts; |
| • | increases in market interest rates, which may lead investors to demand a higher distribution yield for our class A common stock, and would result in increased interest expenses on our debt; |
| • | a compression of the yield on our investments and an increase in the cost of our liabilities; |
52
Table of Contents
| • | failure to maintain our REIT qualification or exclusion from Investment Company Act regulation; |
| • | price and volume fluctuations in the overall stock market from time to time; |
| • | general market and economic conditions, and trends including inflationary concerns, and the current state of the credit and capital markets; |
| • | significant volatility in the market price and trading volume of securities of publicly traded REITs or other companies in our sector, including us, which is not necessarily related to the operating performance of these companies; |
| • | changes in law, regulatory policies or tax guidelines, or interpretations thereof, particularly with respect to REITs; |
| • | changes in the value of our portfolio; |
| • | any shortfall in revenue or net income or any increase in losses from levels expected by investors or securities analysts; |
| • | operating performance of companies comparable to us; |
| • | short-selling pressure with respect to shares of our class A common stock or REITs generally; and |
| • | uncertainty surrounding the strength of the U.S. economy particularly in light of budget deficit concerns and other U.S. and international political and economic affairs. |
As noted above, market factors unrelated to our performance could also negatively impact the market price of our class A common stock. One of the factors that investors may consider in deciding whether to buy or sell our class A common stock is our distribution rate as a percentage of our stock price relative to market interest rates. If market interest rates increase, prospective investors may demand a higher distribution rate or seek alternative investments paying higher dividends or interest. As a result, interest rate fluctuations and conditions in the capital markets may affect the market value of our class A common stock.
Some provisions of our charter and bylaws and Maryland law may deter takeover attempts, which may limit the opportunity of our stockholders to sell their shares at a favorable price.
Some of the provisions of Maryland law and our charter and bylaws discussed below could make it more difficult for a third party to acquire us, even if doing so might be beneficial to our stockholders by providing them with the opportunity to sell their shares at a premium to the then current market price.
Issuance of Stock Without Stockholder Approval. Our charter authorizes our board of directors, without stockholder approval, to authorize the issuance of up to 200,000,000 shares of class A common stock and up to 100,000,000 shares of preferred stock. Our charter also authorizes our board of directors, without stockholder approval, to classify or reclassify any unissued shares of our class A common stock and preferred stock into other classes or series of stock and to amend our charter to increase or decrease the aggregate number of shares of stock or the number of shares of stock of any class or series that are authorized by the charter to be issued. Preferred stock may be issued in one or more classes or series, the terms of which may be determined by our board of directors without further action by stockholders. Prior to issuance of any such class or series, our board of directors will set the terms of any such class or series, including the preferences, conversion or other rights, voting powers, restrictions, limitations as to dividends or other distributions, qualifications and terms or conditions of redemption. The issuance of any preferred stock could materially adversely affect the rights of holders of our class A common stock and, therefore, could reduce the value of the class A common stock. In addition, specific rights granted to future holders of our preferred stock could be used to restrict our ability to merge with, or sell assets to, a third party. The power of our board of directors to cause us to issue preferred stock could, in certain circumstances, make it more difficult, delay, discourage, prevent or make it more costly to acquire or effect a change in control, thereby preserving the current stockholders’ control.
53
Table of Contents
Advance Notice Bylaw. Our bylaws contain advance notice procedures for the introduction by a stockholder of new business and the nomination of directors by a stockholder. These provisions could, in certain circumstances, discourage proxy contests and make it more difficult for you and other stockholders to elect stockholder-nominated directors and to propose and, consequently, approve stockholder proposals opposed by management.
Maryland Takeover Statutes. We are subject to the Maryland Business Combination Act, which could delay or prevent an unsolicited takeover of us. The statute substantially restricts the power of third parties who acquire, or seek to acquire, control of us to complete mergers and other business combinations without the approval of our board of directors even if such transaction would be beneficial to stockholders. “Business combinations” between such a third party acquirer or its affiliate and us are prohibited for five years after the most recent date on which the acquirer becomes an “interested stockholder.” An “interested stockholder” is defined as any person who beneficially owns 10% or more of the voting power of our outstanding voting stock or an affiliate or associate of ours who, at any time within the two-year period immediately prior to the date in question, was the beneficial owner of 10% or more of the voting power of our then outstanding stock. If our board of directors approved in advance the transaction that would otherwise give rise to the acquirer attaining such status, the acquirer would not become an interested stockholder and, as a result, it could enter into a business combination with us. Our board of directors may, however, provide that its approval is subject to compliance, at or after the time of approval, with any terms and conditions determined by it. Even after the lapse of the five-year prohibition period, any business combination with an interested stockholder must be recommended by our board of directors and approved by the affirmative vote of at least:
| • | 80% of the votes entitled to be cast by stockholders; and |
| • | two-thirds of the votes entitled to be cast by stockholders other than the interested stockholder and affiliates and associates thereof. |
The super-majority vote requirements do not apply if the transaction complies with a minimum price and form of consideration requirements prescribed by the statute.
The statute permits various exemptions from its provisions, including business combinations that are exempted by the board of directors prior to the time that an interested stockholder becomes an interested stockholder. Our board of directors has exempted any business combination involving a limited liability company indirectly controlled by a trust for the benefit of Samuel Zell, our former chairman of the board, and his family and approved in advance the issuance of shares to W.R. Berkley. In addition, our board of directors has exempted any business combination involving Huskies Acquisition, an affiliate of Blackstone, or its affiliates as of September 27, 2012 or Blackstone and its affiliates; provided, however, that Huskies Acquisition or any of its affiliates as of September 27, 2012 and Blackstone and any of its affiliates may not enter into any “business combination” with us without the prior approval of at least a majority of the members of our board of directors who are not affiliates or associates of Huskies Acquisition or Blackstone. As a result, these parties may enter into business combinations with us without compliance with the five-year prohibition or the super-majority vote requirements and the other provisions of the statute.
We are also subject to the Maryland Control Share Acquisition Act. With certain exceptions, the Maryland General Corporation Law provides that a holder of “control shares” of a Maryland corporation acquired in a “control share acquisition” has no voting rights with respect to those shares except to the extent approved by a vote of two-thirds of the votes entitled to be cast on the matter, excluding shares owned by the acquiring person or by our officers or by our directors who are our employees.
Control shares are voting shares of stock which, if aggregated with all other shares of stock owned or entitled to be voted (except solely by virtue of a revocable proxy) by the acquirer, would entitle the acquirer to exercise voting power in electing directors within one of the specified ranges of voting power. Control shares do not include shares the acquirer is then entitled to vote as a result of having previously obtained stockholder approval or shares acquired directly from the corporation. A control share acquisition means the acquisition of issued and outstanding control
54
Table of Contents
shares subject to certain exceptions. A person who has made or proposes to make a control share acquisition, upon satisfaction of certain conditions, including an undertaking to pay expenses, may compel our board to call a special meeting of stockholders to be held within 50 days of demand to consider the voting rights of the control shares in question. If no request for a meeting is made, we may present the question at any stockholders meeting.
If voting rights are not approved at a stockholders meeting or if the acquiring person does not deliver the statement required by Maryland law, then, subject to certain conditions and limitations, we may redeem for fair value (determined without regard to the absence of voting rights) any or all of the control shares, except those for which voting rights have previously been approved. If voting rights for control shares are approved at a stockholders meeting and the acquirer may then vote a majority of the shares entitled to vote, then all other stockholders may exercise appraisal rights, unless our charter or bylaws provide otherwise, which they currently do not. The fair value of the shares for purposes of these appraisal rights may not be less than the highest price per share paid by the acquirer in the control share acquisition. The control share acquisition statute does not apply to shares acquired in a merger, consolidation or share exchange if we are a party to the transaction, nor does it apply to acquisitions approved or exempted by our charter or bylaws. Our bylaws contain a provision exempting the following persons from this statute: (i) a limited liability company indirectly controlled by a trust for the benefit of Samuel Zell and his family; (ii) W.R. Berkley Corporation and any of its controlled affiliates; and (iii) Huskies Acquisition, or any person or entity that was an affiliate of Huskies Acquisition as of September 27, 2012 or by Blackstone or any of its affiliates.
We are also eligible to elect to be subject to the Maryland Unsolicited Takeovers Act, which permits our board of directors, without stockholder approval, to, among other things and notwithstanding any provision in our charter or bylaws, elect on our behalf to classify the terms of directors and to increase the stockholder vote required to remove a director and to provide that each vacancy on our board may be filled only by a majority of the remaining directors even if the remaining directors do not constitute a quorum and each director elected to fill a vacancy shall serve for the remainder of the full term of the class of directors in which the vacancy occurred. Such an election may significantly restrict the ability of third parties to wage a proxy fight for control of our board of directors as a means of advancing a takeover offer. If an acquirer were discouraged from offering to acquire us, or prevented from successfully completing a hostile acquisition, you could lose the opportunity to sell your shares at a favorable price.
Our charter contains provisions that are designed to reduce or eliminate duties of Blackstone and our directors with respect to corporate opportunities and competitive activities.
Our charter contains provisions designed to reduce or eliminate duties of Blackstone and its affiliates (as such term is defined in the charter), and of our directors or any person our directors control to refrain from competing with us or to present to us business opportunities that otherwise may exist in the absence of such charter provisions. Under our charter, Blackstone and its affiliates and our directors or any person our directors control will not be obligated to present to us opportunities unless those opportunities are expressly offered to such person in his or her capacity as a director or officer of Blackstone Mortgage Trust and those persons will be able to engage in competing activities without any restriction imposed as a result of Blackstone’s or its affiliates’ status as a stockholder or Blackstone’s affiliates’ status as officers or directors of Blackstone Mortgage Trust.
We have not established a minimum distribution payment level and we cannot assure you of our ability to pay distributions in the future.
We are generally required to distribute to our stockholders at least 90% of our REIT taxable income each year for us to qualify as a REIT under the Internal Revenue Code, which requirement we currently intend to satisfy through quarterly distributions of all or substantially all of our REIT taxable income in such year, subject to certain adjustments. Although we generally intend to distribute each year substantially all of our taxable income to holders of our class A common stock so as to comply with the REIT provisions of the Internal Revenue Code, we have not established a minimum distribution payment level and our ability to pay distributions may be
55
Table of Contents
adversely affected by a number of factors, including the risk factors described in this report. All distributions will be made at the discretion of our board of directors and will depend on our earnings, our financial condition, debt covenants, maintenance of our REIT qualification, applicable law and other factors as our board of directors may deem relevant from time to time. We believe that a change in any one of the following factors could adversely affect our results of operations and impair our ability to pay distributions to our stockholders:
| • | our ability to make profitable investments; |
| • | margin calls or other expenses that reduce our cash flow; |
| • | defaults in our asset portfolio or decreases in the value of our portfolio; and |
| • | the fact that anticipated operating expense levels may not prove accurate, as actual results may vary from estimates. |
As a result, no assurance can be given that the level of any distributions we make to our stockholders will achieve a market yield or increase or even be maintained over time, any of which could materially and adversely affect the market price of our class A common stock. We may use our net operating losses, to the extent available, carried forward to offset future REIT taxable income, and therefore reduce our dividend requirements. In addition, some of our distributions may include a return of capital, which would reduce the amount of capital available to operate our business.
In addition, distributions that we make to our stockholders will generally be taxable to our stockholders as ordinary income. However, a portion of our distributions may be designated by us as long-term capital gains to the extent that they are attributable to capital gain income recognized by us or may constitute a return of capital to the extent that they exceed our earnings and profits as determined for U.S. federal income tax purposes. A return of capital is not taxable, but has the effect of reducing the basis of a stockholder’s investment in our class A common stock.
Investing in our class A common stock may involve a high degree of risk.
The investments that we make in accordance with our investment objectives may result in a high amount of risk when compared to alternative investment options and volatility or loss of principal. Our investments may be highly speculative and aggressive, and therefore an investment in our class A common stock may not be suitable for someone with lower risk tolerance.
Future issuances of equity or debt securities, which may include securities that would rank senior to our class A common stock, may adversely affect the market price of the shares of our class A common stock.
The issuance of additional shares of our class A common stock, including in connection with the conversion of our outstanding 5.25% Convertible Senior Notes due 2018, our outstanding 4.375% Convertible Senior Notes due 2022, or other future issuances of our class A common stock or shares of preferred stock or securities convertible or exchangeable into equity securities, may dilute the ownership interest of our existing holders of our class A common stock. If we decide to issue debt or equity securities which would rank senior to our class A common stock, it is likely that they will be governed by an indenture or other instrument containing covenants restricting our operating flexibility. Additionally, any convertible or exchangeable securities that we issue may have rights, preferences and privileges more favorable than those of our class A common stock and may result in dilution to owners of our class A common stock. We and, indirectly, our stockholders will bear the cost of issuing and servicing such securities. Because our decision to issue additional equity or debt securities in any future offering will depend on market conditions and other factors beyond our control, we cannot predict or estimate the amount, timing or nature of our future issuances. Also, we cannot predict the effect, if any, of future sales of our class A common stock, or the availability of shares for future sales, on the market price of our class A common stock. Sales of substantial amounts of class A common stock or the perception that such sales could occur may adversely affect the prevailing market price for the shares of our class A common stock. Therefore holders of our class A common stock will bear the risk of our future issuances reducing the market price of our class A common stock and diluting the value of their stock holdings in us.
56
Table of Contents
| ITEM 1B. | UNRESOLVED STAFF COMMENTS |
None.
| ITEM 2. | PROPERTIES |
Our principal executive and administrative offices are located in leased space at 345 Park Avenue, 42nd Floor, New York, New York 10154. We do not own any real property. We consider these facilities to be suitable and adequate for the management and operations of our business.
| ITEM 3. | LEGAL PROCEEDINGS |
From time to time, we may be involved in various claims and legal actions arising in the ordinary course of business. As of December 31, 2017, we were not involved in any material legal proceedings.
| ITEM 4. | MINE SAFETY DISCLOSURES |
Not applicable.
57
Table of Contents
| ITEM 5. | MARKET FOR REGISTRANT’S COMMON EQUITY, RELATED STOCKHOLDER MATTERS AND ISSUER PURCHASES OF EQUITY SECURITIES |
Our class A common stock is listed for trading on the NYSE under the symbol “BXMT.” The table below sets forth, for the calendar quarters indicated, the reported high and low sale prices for our class A common stock as reported on the NYSE composite transaction tape, and the per share cash dividends declared on our class A common stock.
| 2017 | 2016 | |||||||||||||||||||||||
| High | Low | Dividend | High | Low | Dividend | |||||||||||||||||||
| First Quarter |
$ | 31.53 | $ | 29.76 | $ | 0.62 | $ | 27.20 | $ | 22.13 | $ | 0.62 | ||||||||||||
| Second Quarter |
$ | 32.47 | $ | 29.81 | $ | 0.62 | $ | 28.90 | $ | 26.02 | $ | 0.62 | ||||||||||||
| Third Quarter |
$ | 31.88 | $ | 30.46 | $ | 0.62 | $ | 30.46 | $ | 26.82 | $ | 0.62 | ||||||||||||
| Fourth Quarter |
$ | 33.08 | $ | 30.96 | $ | 0.62 | $ | 31.35 | $ | 27.89 | $ | 0.62 | ||||||||||||
|
|
|
|
|
|||||||||||||||||||||
| Total |
$ | 2.48 | $ | 2.48 | ||||||||||||||||||||
|
|
|
|
|
|||||||||||||||||||||
The last reported sale price of our class A common stock on February 6, 2018 as reported on the NYSE composite transaction tape was $30.23. As of February 6, 2018 there were 270 holders of record of our class A common stock. This does not include the number of stockholders that hold shares in “street name” through banks or broker-dealers.
We generally intend to distribute each year substantially all of our taxable income (which does not necessarily equal net income as calculated in accordance with generally accepted accounting principles, or GAAP) to our stockholders so as to comply with the REIT provisions of the Internal Revenue Code, as amended. In addition, our dividend policy remains subject to revision at the discretion of our board of directors. All distributions will be made at the discretion of our board of directors and will depend upon, among other things, our actual results of operations and liquidity. These results and our ability to pay distributions will be affected by various factors, including our taxable income, our financial condition, our maintenance of REIT status, applicable law, and other factors as our board of directors deems relevant.
Equity Compensation Plan Information
The following table summarizes information, as of December 31, 2017, relating to our equity compensation plans pursuant to which shares of our class A common stock or other equity securities may be granted from time to time:
| Plan category |
(a) Number of securities to be issued upon exercise of outstanding options, warrants, and rights |
(b) Weighted-average exercise price of outstanding options, warrants, and rights |
(c) Number of securities remaining available for future issuance under equity compensation plans (excluding securities reflected in column (a)) |
|||||||||
| Equity compensation plans approved by security holders(1) |
— | $ | — | 805,799 | ||||||||
| Equity compensation plans not approved by security holders(2) |
— | — | — | |||||||||
|
|
|
|
|
|
|
|||||||
| Total |
— | $ | — | 805,799 | ||||||||
| (1) | The number of securities remaining for future issuances consists of an aggregate 805,799 shares issuable under our 2016 stock incentive plan and our 2016 manager incentive plan. Awards under the plans may include restricted stock, unrestricted stock, stock options, stock units, stock appreciation rights, performance shares, performance units, deferred share units, or other equity-based awards, as the board of directors may determine. |
| (2) | All of our equity compensation plans have been approved by security holders. |
Issuer Purchases of Equity Securities
We did not purchase any shares of our class A common stock during the three months ended December 31, 2017.
58
Table of Contents
| ITEM 6. | SELECTED FINANCIAL DATA |
The following selected consolidated historical financial data should be read in conjunction with the information set forth under “Item 7. Management’s Discussion and Analysis of Financial Condition and Results of Operations” and the consolidated financial statements and the related notes thereto that appear on pages F-2 to F-46 of this report.
| Years ended December 31,(1) | ||||||||||||||||||||
| (in thousands, except per share data) | 2017 | 2016 | 2015 | 2014 | 2013 | |||||||||||||||
| Operating Data: |
||||||||||||||||||||
| Interest and related income |
$ | 537,915 | $ | 497,974 | $ | 410,635 | $ | 184,766 | $ | 53,164 | ||||||||||
| Interest and related expense |
234,870 | 184,270 | 152,416 | 69,143 | 18,017 | |||||||||||||||
|
|
|
|
|
|
|
|
|
|
|
|||||||||||
| Income from loans and other investments, net |
$ | 303,045 | $ | 313,704 | $ | 258,219 | $ | 115,623 | $ | 35,147 | ||||||||||
| Net income |
$ | 217,968 | $ | 246,440 | $ | 211,885 | $ | 100,494 | $ | 25,424 | ||||||||||
| Net income attributable to Blackstone Mortgage Trust, Inc. |
$ | 217,631 | $ | 238,297 | $ | 196,829 | $ | 90,045 | $ | 15,032 | ||||||||||
| Per Share Data: |
||||||||||||||||||||
| Net income from continuing operations per share of common stock |
||||||||||||||||||||
| Basic and diluted |
$ | 2.27 | $ | 2.53 | $ | 2.41 | $ | 1.86 | $ | 0.81 | ||||||||||
| Net income per share of common stock |
||||||||||||||||||||
| Basic and diluted |
$ | 2.27 | $ | 2.53 | $ | 2.41 | $ | 1.86 | $ | 0.81 | ||||||||||
| Dividends declared per share of common stock |
$ | 2.48 | $ | 2.48 | $ | 2.28 | $ | 1.98 | $ | 0.72 | ||||||||||
| As of December 31, | ||||||||||||||||||||
| 2017 | 2016 | 2015 | 2014 | 2013 | ||||||||||||||||
| Balance Sheet Data: |
||||||||||||||||||||
| Total assets |
$ | 10,258,825 | $ | 8,812,615 | $ | 9,376,573 | $ | 4,572,713 | $ | 2,205,782 | ||||||||||
| Secured debt agreements, net |
5,273,855 | 5,716,354 | 6,116,105 | 2,353,279 | 1,102,998 | |||||||||||||||
| Convertible notes, net |
563,911 | 166,762 | 164,026 | 161,455 | 159,038 | |||||||||||||||
| Total liabilities |
7,341,419 | 6,319,012 | 6,870,842 | 3,071,827 | 1,449,032 | |||||||||||||||
| Total equity |
2,917,406 | 2,493,603 | 2,505,731 | 1,500,886 | 756,750 | |||||||||||||||
| (1) | On May 6, 2013, we effected a one-for-ten reverse stock split of our class A common stock. As a result, share and per share amounts have been retroactively updated to reflect the one-for-ten reverse stock split. |
59
Table of Contents
| ITEM 7. | MANAGEMENT’S DISCUSSION AND ANALYSIS OF FINANCIAL CONDITION AND RESULTS OF OPERATIONS |
The following discussion should be read in conjunction with the consolidated financial statements and notes thereto appearing elsewhere in this Annual Report on Form 10-K. In addition to historical data, this discussion contains forward-looking statements about our business, operations and financial performance based on current expectations that involve risks, uncertainties and assumptions. Our actual results may differ materially from those in this discussion as a result of various factors, including but not limited to those discussed in Part, 1. Item 1A, “Risk Factors” in this Annual Report on Form 10-K.
Introduction
Blackstone Mortgage Trust is a real estate finance company that originates and purchases senior loans collateralized by properties in North America and Europe. We are externally managed by BXMT Advisors L.L.C., or our Manager, a subsidiary of The Blackstone Group L.P., or Blackstone, and are a real estate investment trust, or REIT, traded on the New York Stock Exchange, or NYSE, under the symbol “BXMT.” We are headquartered in New York City.
We conduct our operations as a REIT for U.S. federal income tax purposes. We generally will not be subject to U.S. federal income taxes on our taxable income to the extent that we annually distribute all of our net taxable income to stockholders and maintain our qualification as a REIT. We also operate our business in a manner that permits us to maintain an exclusion from registration under the Investment Company Act of 1940, as amended. We are organized as a holding company and conduct our business primarily through our various subsidiaries.
2017 Highlights
Operating results:
| • | Net income of $217.6 million, or $2.27 per share and Core Earnings of $245.1 million, or $2.55 per share. |
| • | Declared aggregate dividends of $2.48 per share in 2017. The fourth quarter dividend of $0.62 per share produced an annualized yield of 9.2% on our December 31, 2017 book value of $26.93. |
Loan originations and acquisitions:
| • | Loan originations and acquisitions totaled $4.8 billion during 2017, with an average loan size of $111.1 million. |
| • | Portfolio of 110 loans as of December 31, 2017, with a weighted-average loan-to-value ratio (as of the dates such loans were originated or acquired by us) of 61.0% and weighted-average all-in yield of 5.83%. |
| • | Entered into a joint venture with Walker & Dunlop to originate, hold, and finance multifamily bridge loans. The joint venture held $182.2 million of loans as of December 31, 2017. |
Capital markets activity:
| • | Completed an underwritten public offering of 12,420,000 shares of our class A common stock, providing aggregate net proceeds of $391.6 million. |
| • | Issued $402.5 million aggregate principal amount of convertible notes with a coupon rate of 4.375% and an initial conversion price of $35.67. |
Portfolio financing:
| • | Financing capacity of $11.7 billion as of December 31, 2017, which includes credit facilities with 9 credit providers, as well as various asset-specific financings and senior loan interests. |
| • | Issued collateralized loan obligations and a single asset securitization vehicle, providing an aggregate $1.3 billion of financing. |
| • | All-in cost of revolving repurchase facilities of L+2.12% as of December 31, 2017, providing stable, non-capital markets based mark-to-market financings. |
60
Table of Contents
I. Key Financial Measures and Indicators
As a real estate finance company, we believe the key financial measures and indicators for our business are earnings per share, dividends declared, Core Earnings, and book value per share. For the three months ended December 31, 2017 we recorded earnings per share of $0.59, declared a dividend of $0.62 per share, and reported $0.65 per share of Core Earnings. In addition, our book value per share as of December 31, 2017 was $26.93, an increase of $0.60 per share relative to December 31, 2016. For the year ended December 31, 2017, we recorded earnings per share of $2.27, declared aggregate dividends of $2.48 per share, and reported $2.55 per share of Core Earnings.
As further described below, Core Earnings is a measure that is not prepared in accordance with accounting principles generally accepted in the United States of America, or GAAP. We use Core Earnings to evaluate our performance excluding the effects of certain transactions and GAAP adjustments that we believe are not necessarily indicative of our current loan activity and operations.
Earnings Per Share and Dividends Declared
The following table sets forth the calculation of basic and diluted net income per share and dividends declared per share ($ in thousands, except per share data):
| Three Months Ended December 31, 2017 |
Year Ended December 31, |
|||||||||||
| 2017 | 2016 | |||||||||||
| Net income(1) |
$ | 57,891 | $ | 217,631 | $ | 238,297 | ||||||
| Weighted-average shares outstanding, basic and diluted |
98,810,617 | 95,963,616 | 94,165,351 | |||||||||
|
|
|
|
|
|
|
|||||||
| Net income per share, basic and diluted |
$ | 0.59 | $ | 2.27 | $ | 2.53 | ||||||
|
|
|
|
|
|
|
|||||||
| Dividends declared per share |
$ | 0.62 | $ | 2.48 | $ | 2.48 | ||||||
|
|
|
|
|
|
|
|||||||
| (1) | Represents net income attributable to Blackstone Mortgage Trust, Inc. |
Core Earnings
Core Earnings is a non-GAAP measure, which we define as GAAP net income (loss), including realized gains and losses not otherwise included in GAAP net income (loss), and excluding (i) net income (loss) attributable to our CT Legacy Portfolio, (ii) non-cash equity compensation expense, (iii) depreciation and amortization, (iv) unrealized gains (losses), and (v) certain non-cash items. Core Earnings may also be adjusted from time to time to exclude one-time events pursuant to changes in GAAP and certain other non-cash charges as determined by our Manager, subject to approval by a majority of our independent directors.
We believe that Core Earnings provides meaningful information to consider in addition to our net income and cash flow from operating activities determined in accordance with GAAP. This adjusted measure helps us to evaluate our performance excluding the effects of certain transactions and GAAP adjustments that we believe are not necessarily indicative of our current loan portfolio and operations. Although, according to our Management Agreement, we calculate the incentive and base management fees due to our Manager using Core Earnings before incentive fees expense, we report Core Earnings after incentive fee expense, as we believe this is a more meaningful presentation of the economic performance of our class A common stock.
61
Table of Contents
Core Earnings does not represent net income or cash generated from operating activities and should not be considered as an alternative to GAAP net income, or an indication of our GAAP cash flows from operations, a measure of our liquidity, or an indication of funds available for our cash needs. In addition, our methodology for calculating Core Earnings may differ from the methodologies employed by other companies to calculate the same or similar supplemental performance measures, and accordingly, our reported Core Earnings may not be comparable to the Core Earnings reported by other companies.
The following table provides a reconciliation of Core Earnings to GAAP net income ($ in thousands, except per share data):
| Three Months Ended December 31, 2017 |
Year Ended December 31, | |||||||||||
| 2017 | 2016 | |||||||||||
| Net income(1) |
$ | 57,891 | $ | 217,631 | $ | 238,297 | ||||||
| Non-cash compensation expense |
6,221 | 24,031 | 19,427 | |||||||||
| GE purchase discount accretion adjustment(2) |
(483 | ) | (1,035 | ) | (3,662 | ) | ||||||
| CT Legacy Portfolio net income |
— | — | (5,949 | ) | ||||||||
| Other items |
874 | 4,509 | 1,373 | |||||||||
|
|
|
|
|
|
|
|||||||
| Core Earnings |
$ | 64,503 | $ | 245,136 | $ | 249,486 | ||||||
|
|
|
|
|
|
|
|||||||
| Weighted-average shares outstanding, basic and diluted |
98,810,617 | 95,963,616 | 94,165,351 | |||||||||
|
|
|
|
|
|
|
|||||||
| Core Earnings per share, basic and diluted |
$ | 0.65 | $ | 2.55 | $ | 2.65 | ||||||
|
|
|
|
|
|
|
|||||||
| (1) | Represents net income attributable to Blackstone Mortgage Trust. |
| (2) | Adjustment in respect of the deferral in Core Earnings of the accretion of a total $9.1 million of purchase discount attributable to a certain pool of GE portfolio loans pending the repayment of those loans. |
Book Value Per Share
The following table calculates our book value per share ($ in thousands, except per share data):
| December 31, 2017 | December 31, 2016 | |||||||
| Stockholders’ equity |
$ | 2,911,066 | $ | 2,493,603 | ||||
| Shares |
||||||||
| Class A common stock |
107,883,860 | 94,540,263 | ||||||
| Deferred stock units |
197,217 | 169,027 | ||||||
|
|
|
|
|
|||||
| Total outstanding |
108,081,077 | 94,709,290 | ||||||
|
|
|
|
|
|||||
| Book value per share |
$ | 26.93 | $ | 26.33 | ||||
|
|
|
|
|
|||||
II. Loan Portfolio
During the year ended December 31, 2017, we originated and acquired $4.8 billion of loans. Loan fundings during the year totaled $4.1 billion, including $60.4 million of non-consolidated senior interests. Loan repayments during the year totaled $3.0 billion, including $140.0 million of non-consolidated senior interests. We generated interest income of $537.9 million and incurred interest expense of $234.9 million during the year, which resulted in $303.0 million of net interest income during the year ended December 31, 2017.
62
Table of Contents
Portfolio Overview
The following table details our loan origination activity ($ in thousands):
| Three Months Ended December 31, 2017 |
Year Ended December 31, 2017 |
|||||||
| Loan originations(1) |
$ | 1,235,678 | $ | 4,804,578 | ||||
| Loan fundings(2) |
$ | 1,294,863 | $ | 4,133,183 | ||||
| Loan repayments(3) |
(874,998 | ) | (2,968,565 | ) | ||||
|
|
|
|
|
|||||
| Total net fundings |
$ | 419,865 | $ | 1,164,618 | ||||
|
|
|
|
|
|||||
| (1) | Includes new loan originations and additional commitments made under existing loans. Loan originations during the year ended December 31, 2017 include $4.0 million of additional commitments under related non-consolidated senior interests. |
| (2) | Loan fundings during the three months and year ended December 31, 2017 include $11.4 million and $60.4 million, respectively, of additional fundings under related non-consolidated senior interests. |
| (3) | Loan repayments during the three months and year ended December 31, 2017 include $17.1 million and $140.0 million, respectively, of additional repayments under related non-consolidated senior interests. |
The following table details overall statistics for our loan portfolio as of December 31, 2017 ($ in thousands):
| Total Loan Exposure(1) | ||||||||||||||||
| Balance Sheet Portfolio |
Total Loan Portfolio |
Floating Rate Loans |
Fixed Rate Loans |
|||||||||||||
| Number of loans |
110 | 110 | 104 | 6 | ||||||||||||
| Principal balance |
$ | 10,108,226 | $ | 11,093,608 | $ | 10,421,270 | $ | 672,338 | ||||||||
| Net book value |
$ | 10,056,732 | $ | 11,039,365 | $ | 10,367,655 | $ | 671,710 | ||||||||
| Unfunded loan commitments(2) |
$ | 1,573,107 | $ | 1,612,772 | $ | 1,612,772 | $ | — | ||||||||
| Weighted-average cash coupon(3) |
5.55 | % | 5.38 | % | L+3.92 | % | 4.64 | % | ||||||||
| Weighted-average all-in yield(3) |
5.95 | % | 5.83 | % | L+4.33 | % | 5.71 | % | ||||||||
| Weighted-average maximum maturity (years)(4) |
3.5 | 3.5 | 3.5 | 4.0 | ||||||||||||
| Loan to value (LTV)(5) |
61.7 | % | 61.0 | % | 60.4 | % | 70.2 | % | ||||||||
| (1) | In certain instances, we finance our loans through the non-recourse sale of a senior loan interest that is not included in our consolidated financial statements. Total loan exposure encompasses the entire loan we originated and financed, including $985.4 million of such non-consolidated senior interests that are not included in our balance sheet portfolio. |
| (2) | Unfunded commitments will primarily be funded to finance property improvements or lease-related expenditures by the borrowers. These future commitments will be funded over the term of each loan, subject in certain cases to an expiration date. |
| (3) | As of December 31, 2017, our floating rate loans were indexed to various benchmark rates, with 93% of floating rate loans by loan exposure indexed to USD LIBOR based on total loan exposure. In addition to cash coupon, all-in yield includes the amortization of deferred origination and extension fees, loan origination costs, and purchase discounts, as well as the accrual of exit fees. Cash coupon and all-in yield for the total portfolio assume applicable floating benchmark rates as of December 31, 2017 for weighted-average calculation. |
| (4) | Maximum maturity assumes all extension options are exercised by the borrower, however our loans may be repaid prior to such date. As of December 31, 2017, based on total loan exposure, 73% of our loans were subject to yield maintenance or other prepayment restrictions and 27% were open to repayment by the borrower without penalty. |
| (5) | Based on LTV as of the dates loans were originated or acquired by us. |
63
Table of Contents
The charts below detail the geographic distribution and types of properties securing these loans, as of December 31, 2017:
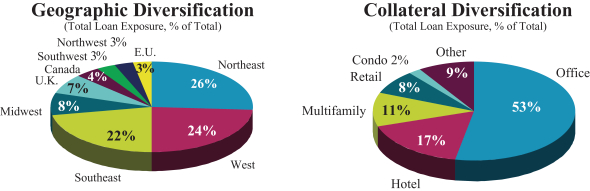
Refer to section VI of this Item 7 for details of our loan portfolio, on a loan-by-loan basis.
Asset Management
We actively manage the investments in our loan portfolio and exercise the rights afforded to us as a lender, including collateral level budget approvals, lease approvals, loan covenant enforcement, escrow/reserve management, collateral release approvals, and other rights that we may negotiate.
As discussed in Note 2 to our consolidated financial statements, our Manager performs a quarterly review of our loan portfolio, assesses the performance of each loan, and assigns it a risk rating between “1” and “5,” from less risk to greater risk. The following table allocates the principal balance and total loan exposure balances based on our internal risk ratings ($ in thousands):
| December 31, 2017 | ||||||||||
| Risk Rating |
Number of Loans |
Net Book Value |
Total Loan Exposure(1) |
|||||||
| 1 |
1 | $ | 31,842 | $ | 31,890 | |||||
| 2 |
41 | 3,512,709 | 3,521,701 | |||||||
| 3 |
67 | 6,491,617 | 7,519,465 | |||||||
| 4 |
1 | 20,564 | 20,552 | |||||||
| 5 |
— | — | — | |||||||
|
|
|
|
|
|
||||||
| 110 | $ | 10,056,732 | $ | 11,093,608 | ||||||
|
|
|
|
|
|
||||||
| (1) | In certain instances, we finance our loans through the non-recourse sale of a senior loan interest that is not included in our consolidated financial statements. See Note 2 to our consolidated financial statements for further discussion. Total loan exposure encompasses the entire loan we originated and financed, including $985.4 million of such non-consolidated senior interests as of December 31, 2017. |
The weighted-average risk rating of our total loan exposure was 2.7 and 2.5 as of December 31, 2017 and 2016, respectively. The increase in weighted-average risk rating was primarily driven by repayments of loans with lower risk ratings, and not rating downgrades in the existing portfolio.
64
Table of Contents
Multifamily Joint Venture
As of December 31, 2017, our Walker & Dunlop Multifamily Joint Venture held $182.2 million of loans, which are included in the loan disclosures above. Refer to Note 2 to our consolidated financial statements for additional discussion of our Multifamily Joint Venture.
Portfolio Financing
Our portfolio financing arrangements include credit facilities, the GE portfolio acquisition facility, asset-specific financings, a revolving credit agreement, loan participations sold, non-consolidated senior interests, and securitized debt obligations.
The following table details our portfolio financing ($ in thousands):
| Portfolio Financing Outstanding Principal Balance |
||||||||
| December 31, 2017 | December 31, 2016 | |||||||
| Credit facilities |
$ | 4,068,249 | $ | 3,572,837 | ||||
| GE portfolio acquisition facility |
703,423 | 1,479,582 | ||||||
| Asset-specific financings |
518,864 | 679,207 | ||||||
| Revolving credit agreement |
— | — | ||||||
| Loan participations sold |
80,706 | 349,633 | ||||||
| Non-consolidated senior interests |
985,382 | 1,029,516 | ||||||
| Securitized debt obligations |
1,292,120 | — | ||||||
|
|
|
|
|
|||||
| Total portfolio financing |
$ | 7,648,744 | $ | 7,110,775 | ||||
|
|
|
|
|
|||||
65
Table of Contents
Credit Facilities
The following table details our credit facilities ($ in thousands):
| December 31, 2017 | ||||||||||||||||||||
| Maximum Facility Size(1) |
Collateral Assets(2) |
Credit Borrowings | ||||||||||||||||||
|
Lender |
Potential(3) | Outstanding | Available(3) | |||||||||||||||||
| Wells Fargo |
$ | 2,000,000 | $ | 1,680,325 | $ | 1,289,135 | $ | 1,170,801 | $ | 118,334 | ||||||||||
| MetLife |
1,000,000 | 1,039,231 | 807,164 | 807,164 | — | |||||||||||||||
| Bank of America |
750,000 | 765,049 | 573,542 | 573,542 | — | |||||||||||||||
| JP Morgan(4) |
500,000 | 579,218 | 443,496 | 319,755 | 123,741 | |||||||||||||||
| Société Générale(5) |
480,200 | 373,181 | 300,871 | 300,871 | — | |||||||||||||||
| Deutsche Bank |
500,000 | 399,203 | 295,743 | 295,743 | — | |||||||||||||||
| Citibank(6) |
800,125 | 455,433 | 354,354 | 240,881 | 113,473 | |||||||||||||||
| Morgan Stanley(7) |
675,650 | 591,168 | 456,344 | 216,044 | 240,300 | |||||||||||||||
| Bank of America – Multi. JV(8) |
200,000 | 106,950 | 85,560 | 85,560 | — | |||||||||||||||
| Goldman Sachs – Multi. JV(8) |
250,000 | 75,225 | 57,888 | 57,888 | — | |||||||||||||||
|
|
|
|
|
|
|
|
|
|
|
|||||||||||
| $ | 7,155,975 | $ | 6,064,983 | $ | 4,664,097 | $ | 4,068,249 | $ | 595,848 | |||||||||||
|
|
|
|
|
|
|
|
|
|
|
|||||||||||
| (1) | Maximum facility size represents the largest amount of borrowings available under a given facility once sufficient collateral assets have been approved by the lender and pledged by us. |
| (2) | Represents the principal balance of the collateral assets. |
| (3) | Potential borrowings represents the total amount we could draw under each facility based on collateral already approved and pledged. When undrawn, these amounts are immediately available to us at our sole discretion under the terms of each credit facility. |
| (4) | As of December 31, 2017, the JP Morgan maximum facility size was composed of a general $500.0 million facility size, under which U.S. Dollars and British Pounds Sterling borrowings are contemplated. |
| (5) | As of December 31, 2017, the Société Générale maximum facility size was composed of a €400.0 million facility size, which translated to $480.2 million as of such date. Borrowings denominated in U.S. Dollars, British Pounds Sterling, and Euros are contemplated under this facility. |
| (6) | As of December 31, 2017, the Citibank maximum facility size was composed of a $500.0 million facility denominated in U.S. Dollars plus a €250.0 million facility, which translated to $300.1 million as of such date, which contemplated borrowings denominated in British Pounds Sterling and Euros. |
| (7) | As of December 31, 2017, the Morgan Stanley maximum facility size was composed of a £500.0 million facility size, which translated to $675.7 million as of such date. Borrowings denominated in U.S. Dollars, British Pounds Sterling, and Euros are contemplated under this facility. |
| (8) | These facilities finance the loan investments of our consolidated Multifamily Joint Venture. Refer to Note 2 to our consolidated financial statements for additional discussion of our Multifamily Joint Venture. |
The weighted-average outstanding balance of our credit facilities was $4.1 billion for the year ended December 31, 2017. As of December 31, 2017, we had aggregate borrowings of $4.1 billion outstanding under our credit facilities, with a weighted-average cash coupon of LIBOR plus 1.90% per annum, a weighted-average all-in cost of credit, including associated fees and expenses, of LIBOR plus 2.12% per annum, and a weighted-average advance rate of 78.7%. As of December 31, 2017, outstanding borrowings under these facilities had a weighted-average maturity, excluding extension options and term-out provisions, of 1.5 years.
Borrowings under each facility are subject to the initial approval of eligible collateral loans by the lender and the maximum advance rate and pricing rate of individual advances are determined with reference to the attributes of the respective collateral loan.
66
Table of Contents
GE Portfolio Acquisition Facility
During the second quarter of 2015, concurrently with our acquisition of a portfolio of loans from GE, we entered into an agreement with Wells Fargo to provide us with secured financing for the acquired portfolio. As of December 31, 2017, this facility provided for $816.3 million of financing, of which $703.4 million was outstanding and an additional $112.9 million was available to finance future loan fundings in the GE portfolio. The GE portfolio acquisition facility is non-revolving and consists of a single master repurchase agreement providing for asset-specific borrowings for each collateral asset.
The asset-specific borrowings under the GE portfolio acquisition facility were advanced at a weighted-average rate of 80% of our purchase price of the collateral assets and are repaid pro rata from collateral asset repayment proceeds. The asset-specific borrowings are currency matched to the collateral assets and accrue interest at a rate equal to the sum of (i) the applicable base rate plus (ii) a margin of 1.75%, which will increase to 1.80% and 1.85% in year four and year five, respectively. As of December 31, 2017, those borrowings were denominated in U.S. Dollars and Canadian Dollars. The asset-specific borrowings are term matched to the underlying collateral assets with an outside maturity date of May 20, 2020, which may be extended pursuant to two one-year extension options. We guarantee obligations under the GE portfolio acquisition facility in an amount equal to the greater of (i) 25% of outstanding asset-specific borrowings, and (ii) $250.0 million. We had outstanding asset-specific borrowings under the GE portfolio acquisition facility of $703.4 million and a weighted-average all-in cost of credit, including associated fees and expenses, of LIBOR plus 1.72% per annum as of December 31, 2017.
Asset-Specific Financings
The following table details our asset-specific financings ($ in thousands):
| December 31, 2017 | ||||||||||||||||||||||
| Asset-Specific Financings |
Count | Principal Balance |
Book Value | Wtd. Avg. Yield/Cost(1) |
Guarantee(2) | Wtd. Avg. Term(3) |
||||||||||||||||
| Collateral assets |
6 | $ | 682,259 | $ | 677,296 | L+4.76 | % | n/a | Dec. 2020 | |||||||||||||
| Financing provided(4) |
6 | $ | 518,864 | $ | 517,088 | L+2.50 | % | $ | 162,475 | Dec. 2020 | ||||||||||||
| (1) | These floating rate loans and related liabilities are indexed to the various benchmark rates relevant in each arrangement in terms of currency and payment frequency. Therefore the net exposure to each benchmark rate is in direct proportion to our net assets indexed to that rate. In addition to cash coupon, yield/cost includes the amortization of deferred origination fees / financing costs. |
| (2) | Other than amounts guaranteed on an asset-by-asset basis, borrowings under our asset-specific financings are non-recourse to us. |
| (3) | The weighted-average term is determined based on the maximum maturity of the corresponding loans, assuming all extension options are exercised by the borrower. Each of our asset-specific financings are term-matched to the corresponding collateral loans. |
| (4) | Borrowings of $394.8 million under these asset specific financings are cross collateralized with related credit facilities with the same lenders. |
Refer to Note 6 to our consolidated financial statements for additional terms and details of our secured debt agreements, including certain financial covenants.
Revolving Credit Agreement
During the second quarter of 2017, we increased the borrowing capacity under our secured revolving credit agreement with Barclays by $125.0 million to $250.0 million. This full recourse facility is designed to finance first mortgage originations for up to six months as a bridge to term financing or syndication. Advances under the agreement are subject to availability under a specified borrowing base and accrue interest at a per annum pricing rate equal to the sum of (i) an applicable base rate or Eurodollar rate and (ii) an applicable margin, in each case, dependent on the applicable type of loan collateral. The maturity date of the facility is April 4, 2020.
67
Table of Contents
During the year ended December 31, 2017, the weighted-average outstanding borrowings under the revolving credit agreement were $30.7 million and we recorded interest expense of $3.0 million, including $829,000 of amortization of deferred fees and expenses. As of December 31, 2017, we had no borrowings outstanding under the agreement.
Loan Participations Sold
The following table details our loan participations sold ($ in thousands):
| December 31, 2017 | ||||||||||||||||||||||
| Loan Participations Sold |
Count | Principal Balance |
Book Value | Yield/Cost(1) | Guarantee(2) | Term | ||||||||||||||||
| Total loan |
1 | $ | 141,119 | $ | 138,907 | L+5.94 | % | n/a | Feb. 2022 | |||||||||||||
| Senior participation(3) |
1 | 80,706 | 80,415 | L+4.14 | % | n/a | Feb. 2022 | |||||||||||||||
| (1) | Our floating rate loans and related liabilities are indexed to the various benchmark rates relevant in each arrangement in terms of currency and payment frequency. Therefore the net exposure to each benchmark rate is in direct proportion to our net assets indexed to that rate. In addition to cash coupon, yield/cost includes the amortization of deferred fees / financing costs. |
| (2) | As of December 31, 2017, our loan participation sold was non-recourse to us. |
| (3) | During the year ended December 31, 2017, we recorded $10.1 million of interest expense related to our loan participations sold, of which $8.4 million was paid in cash. |
Refer to Note 7 to our consolidated financial statements for additional details of our loan participations sold.
Non-Consolidated Senior Interests
In certain instances, we finance our loans through the non-recourse sale of a senior loan interest that is not included in our consolidated financial statements. These non-consolidated senior interests provide structural leverage for our net investments, which are reflected in the form of mezzanine loans or other subordinate interests on our balance sheet and in our results of operations. The following table details the subordinate interests retained on our balance sheet and the related non-consolidated senior interests as of December 31, 2017 ($ in thousands):
| December 31, 2017 | ||||||||||||||||||||||
| Non-Consolidated Senior Interests |
Count | Principal Balance |
Book Value |
Wtd. Avg. Yield/Cost(1) |
Guarantee | Wtd. Avg. Term |
||||||||||||||||
| Total loan |
3 | $ | 1,200,003 | n/a | 6.14 | % | n/a | Sept. 2021 | ||||||||||||||
| Senior participation |
3 | 985,382 | n/a | 4.54 | % | n/a | Sept. 2021 | |||||||||||||||
| (1) | Our floating rate loans and related liabilities were indexed to the various benchmark rates relevant in each arrangement in terms of currency and payment frequency. Therefore the net exposure to each benchmark rate is in direct proportion to our net assets indexed to that rate. In addition to cash coupon, all-in yield/cost includes the amortization of deferred fees / financing costs. |
68
Table of Contents
Securitized Debt Obligations
The following table details our securitized debt obligations ($ in thousands):
| December 31, 2017 | ||||||||||||||||||||
| Securitized Debt Obligations |
Count | Principal Balance |
Book Value | Wtd. Avg. Yield/Cost(1) |
Term(2) | |||||||||||||||
| Collateralized Loan Obligation |
||||||||||||||||||||
| Collateral assets |
31 | $ | 1,000,000 | $ | 1,000,000 | 5.16 | % | Nov. 2021 | ||||||||||||
| Financing provided |
1 | 817,500 | 808,083 | L+1.76 | % | June 2035 | ||||||||||||||
| Single Asset Securitization |
||||||||||||||||||||
| Collateral assets(3) |
1 | 656,406 | 652,880 | L+3.60 | % | June 2023 | ||||||||||||||
| Financing provided |
1 | 474,620 | 474,328 | L+1.94 | % | June 2033 | ||||||||||||||
| Total |
||||||||||||||||||||
| Collateral assets |
32 | $ | 1,656,406 | $ | 1,652,880 | 5.17 | % | |||||||||||||
|
|
|
|
|
|
|
|
|
|||||||||||||
| Financing provided(4) |
2 | $ | 1,292,120 | $ | 1,282,411 | L+1.83 | % | |||||||||||||
|
|
|
|
|
|
|
|
|
|||||||||||||
| (1) | As of December 31, 2017, 98% of our loans financed by securitized debt obligations earned a floating rate of interest. In addition to cash coupon, all-in yield includes the amortization of deferred origination and extension fees, loan origination costs, purchase discounts, and accrual of exit fees. All-in yield for the total portfolio assume applicable floating benchmark rates for weighted-average calculation. |
| (2) | Loan term represents final maturity, assuming all extension options are exercised by the borrower. Repayments of securitized debt obligations are tied to timing of the related collateral loan asset repayments. The term of these obligations represents the rated final distribution date of the securitizations. |
| (3) | The collateral assets for the Single Asset Securitization include the total loan amount, of which we securitized $500.0 million. |
| (4) | During the year ended December 31, 2017, we recorded $8.5 million of interest expense related to our securitized debt obligations. |
Refer to Notes 8 and 16 to our consolidated financial statements for additional details of our securitized debt obligations.
Floating Rate Portfolio
Generally, our business model is such that rising interest rates will increase our net income, while declining interest rates will decrease net income. As of December 31, 2017, 94% of our loans by total loan exposure earned a floating rate of interest and were financed with liabilities that pay interest at floating rates, which resulted in an amount of net equity that is positively correlated to rising interest rates, subject to the impact of interest rate floors on certain of our floating rate loans. As of December 31, 2017, the remaining 6% of our loans by total loan exposure earned a fixed rate of interest, but are financed with liabilities that pay interest at floating rates, which resulted in a negative correlation to rising interest rates to the extent of our financing. In certain instances where we have financed fixed rate assets with floating rate liabilities, we have purchased interest rate swaps or caps to limit our exposure to increases in interest rates on such liabilities.
69
Table of Contents
Our liabilities are generally currency and index-matched to each collateral asset, resulting in a net exposure to movements in benchmark rates that varies by currency silo based on the relative proportion of floating rate assets and liabilities. The following table details our loan portfolio’s net exposure to interest rates by currency as of December 31, 2017 ($/£/€/C$ in thousands):
| USD | GBP | EUR | CAD | |||||||||||||
| Floating rate loans(1) |
$ | 9,642,606 | £ | 268,663 | € | 109,680 | C$ | 356,950 | ||||||||
| Floating rate debt(1)(2)(3) |
(6,635,529 | ) | (140,771 | ) | (66,144 | ) | (313,692 | ) | ||||||||
|
|
|
|
|
|
|
|
|
|||||||||
| Net floating rate exposure(4) |
$ | 3,007,077 | £ | 127,892 | € | 43,536 | C$ | 43,258 | ||||||||
|
|
|
|
|
|
|
|
|
|||||||||
| (1) | Our floating rate loans and related liabilities are indexed to the various benchmark rates relevant in each case in terms of currency and payment frequency. Therefore the net exposure to each benchmark rate is in direct proportion to our net assets indexed to that rate. |
| (2) | Includes borrowings under secured debt agreements, loan participations sold, non-consolidated senior interests, and securitized debt obligations. |
| (3) | Liabilities balance includes four interest rate swaps totaling C$108.1 million ($86.0 million as of December 31, 2017) that are used to hedge a portion of our fixed rate debt. |
| (4) | In addition, we have interest rate caps of $204.2 million and C$23.4 million to limit our exposure to increases in interest rates. |
Convertible Notes
As of December 31, 2017, the following convertible senior notes, or Convertible Notes, were outstanding ($ in thousands):
| Convertible Notes Issuance |
Face Value | Coupon Rate | All-in Cost(1) | Maturity | ||||||||||
| November 2013 |
$ | 172,500 | 5.25 | % | 5.87 | % | December 1, 2018 | |||||||
| May 2017 |
402,500 | 4.38 | % | 4.85 | % | May 5, 2022 | ||||||||
| (1) | Includes issuance costs that are amortized through interest expense over the life of the Convertible Notes using the effective interest method. |
Refer to Notes 2 and 9 to our consolidated financial statements for additional discussion of our Convertible Notes.
70
Table of Contents
III. Our Results of Operations
Operating Results
The following table sets forth information regarding our consolidated results of operations for the years ended December 31, 2017, 2016, and 2015 ($ in thousands, except per share data):
| Year Ended December 31, |
2017 vs 2016 |
Year Ended December 31, |
2016 vs 2015 |
|||||||||||||||||||||
| 2017 | 2016 | $ | 2016 | 2015 | $ | |||||||||||||||||||
| Income from loans and other investments |
||||||||||||||||||||||||
| Interest and related income |
$ | 537,915 | $ | 497,974 | $ | 39,941 | $ | 497,974 | $ | 410,635 | $ | 87,339 | ||||||||||||
| Less: Interest and related expenses |
234,870 | 184,270 | 50,600 | 184,270 | 152,416 | 31,854 | ||||||||||||||||||
|
|
|
|
|
|
|
|
|
|
|
|
|
|||||||||||||
| Income from loans and other investments, net |
303,045 | 313,704 | (10,659 | ) | 313,704 | 258,219 | 55,485 | |||||||||||||||||
| Other expenses |
||||||||||||||||||||||||
| Management and incentive fees |
54,841 | 55,959 | (1,118 | ) | 55,959 | 42,886 | 13,073 | |||||||||||||||||
| General and administrative expenses |
29,922 | 27,716 | 2,206 | 27,716 | 36,709 | (8,993 | ) | |||||||||||||||||
|
|
|
|
|
|
|
|
|
|
|
|
|
|||||||||||||
| Total other expenses |
84,763 | 83,675 | 1,088 | 83,675 | 79,595 | 4,080 | ||||||||||||||||||
| Gain on investments at fair value |
— | 13,420 | (13,420 | ) | 13,420 | 21,967 | (8,547 | ) | ||||||||||||||||
| Income from equity investment in unconsolidated subsidiary |
— | 3,187 | (3,187 | ) | 3,187 | 11,798 | (8,611 | ) | ||||||||||||||||
|
|
|
|
|
|
|
|
|
|
|
|
|
|||||||||||||
| Income before income taxes |
218,282 | 246,636 | (28,354 | ) | 246,636 | 212,389 | 34,247 | |||||||||||||||||
| Income tax provision |
314 | 196 | 118 | 196 | 504 | (308 | ) | |||||||||||||||||
|
|
|
|
|
|
|
|
|
|
|
|
|
|||||||||||||
| Net income |
217,968 | 246,440 | (28,472 | ) | 246,440 | 211,885 | 34,555 | |||||||||||||||||
|
|
|
|
|
|
|
|
|
|
|
|
|
|||||||||||||
| Net income attributable to non-controlling interests |
(337 | ) | (8,143 | ) | 7,806 | (8,143 | ) | (15,056 | ) | 6,913 | ||||||||||||||
|
|
|
|
|
|
|
|
|
|
|
|
|
|||||||||||||
| Net income attributable to Blackstone Mortgage Trust, Inc. |
$ | 217,631 | $ | 238,297 | $ | (20,666 | ) | $ | 238,297 | $ | 196,829 | $ | 41,468 | |||||||||||
|
|
|
|
|
|
|
|
|
|
|
|
|
|||||||||||||
| Net income per share – basic and diluted |
$ | 2.27 | $ | 2.53 | $ | (0.26 | ) | $ | 2.53 | $ | 2.41 | $ | 0.12 | |||||||||||
| Dividends declared per share |
$ | 2.48 | $ | 2.48 | $ | — | $ | 2.48 | $ | 2.28 | $ | 0.20 | ||||||||||||
Income from loans and other investments, net
Income from loans and other investments, net decreased $10.7 million during the year ended December 31, 2017 compared to the year ended December 31, 2016. The decrease was primarily due to the decrease in non-recurring prepayment fee income and an increase in interest expense as a result of the convertible debt we issued in 2017.
Income from loans and other investments, net increased $55.5 million during the year ended December 31, 2016 compared to the year ended December 31, 2015. The increase was primarily due to the increase in the weighted-average principal balance of our loan portfolio, which increased by $2.4 billion for the year ended December 31, 2016 compared with December 31, 2015. This was partially offset by additional interest expense incurred on our secured debt agreements, the weighted-average principal balance of which increased by $2.0 billion for the year ended December 31, 2016 compared with December 31, 2015.
Other expenses
Other expenses are composed of management and incentive fees payable to our Manager and general and administrative expenses. Other expenses increased by $1.1 million during the year ended December 31, 2017 compared to the year ended December 31, 2016 due to (i) $4.5 million of additional non-cash restricted stock amortization related to shares awarded under our long-term incentive plans, (ii) an increase of $650,000 of
71
Table of Contents
management fees payable to our Manager, and (iii) an increase of $243,000 of general operating expenses. These were offset by (i) a decrease of $2.6 million of compensation expenses associated with our CT Legacy Portfolio incentive plans, and (ii) a decrease of $1.8 million of incentive fees payable to our Manager, primarily as a result of a decrease in Core Earnings.
Other expenses increased by $4.1 million during the year ended December 31, 2016 compared to the year ended December 31, 2015 due to (i) an increase of $7.3 million of incentive fees payable to our Manager, primarily as a result of Core Earnings (before any incentive fees) exceeding the performance hurdle, (ii) $6.1 million of additional non-cash restricted stock amortization related to shares awarded under our long-term incentive plans, and (iii) an increase of $5.8 million of management fees payable to our Manager, primarily as a result of additional net proceeds received from the sale of our class A common stock in 2015. These were offset by (i) a decrease of $9.6 million of transaction costs related the GE loan portfolio acquisition, (ii) a decrease of $4.9 million of compensation expenses associated with our CT Legacy Portfolio incentive plans, and (iii) a decrease of $570,000 of general operating expenses.
Gain on investments at fair value
During the years ended December 31, 2016 and 2015, we recognized $13.4 million and $22.0 million, respectively, of net gains on investments held by CT Legacy Partners. Our investment in CT Legacy Partners was substantially realized as of December 31, 2016.
Income from equity investment in unconsolidated subsidiary
During the years ended December 31, 2016 and 2015, we recognized a $3.2 million gain and an $11.8 million gain, respectively, related to our promote interest from CTOPI. The investment in CTOPI was fully realized as of December 31, 2016.
Net income attributable to non-controlling interests
During the year ended December 31, 2017, our non-controlling interests related to our Multifamily Joint Venture. During the years ended December 31, 2016 and 2015, our non-controlling interests related to CT Legacy Partners. In each case, the non-controlling interests represent the portion of the consolidated entity’s net income that is not owned by us.
During the year ended December 31, 2017, we recorded $337,000 of net income attributable to non-controlling interests related to our Multifamily Joint Venture. During the years ended December 31, 2016 and 2015, we recorded $8.1 million and $15.1 million, respectively, of net income attributable to non-controlling interests which related to the gain on investments at fair value recognized by CT Legacy Partners during both periods.
Dividends per share
During the year ended December 31, 2017, we declared aggregate dividends of $2.48 per share, or $243.3 million. During 2016, we declared aggregate dividends of $2.48 per share, or $233.3 million. During 2015, we declared aggregate dividends of $2.28 per share, or $194.8 million.
72
Table of Contents
The following table sets forth information regarding our consolidated results of operations for the three months ended December 31, 2017 and 2016 ($ in thousands, except per share data):
| Three Months Ended December 31, |
2017 vs 2016 |
|||||||||||
| 2017 | 2016 | $ | ||||||||||
| Income from loans and other investments |
||||||||||||
| Interest and related income |
$ | 146,127 | $ | 116,288 | $ | 29,839 | ||||||
| Less: Interest and related expenses |
65,953 | 44,451 | 21,502 | |||||||||
|
|
|
|
|
|
|
|||||||
| Income from loans and other investments, net |
80,174 | 71,837 | 8,337 | |||||||||
| Other expenses |
||||||||||||
| Management and incentive fees |
14,284 | 12,798 | 1,486 | |||||||||
| General and administrative expenses |
7,702 | 6,726 | 976 | |||||||||
|
|
|
|
|
|
|
|||||||
| Total other expenses |
21,986 | 19,524 | 2,462 | |||||||||
| Gain on investments at fair value |
— | 6 | (6 | ) | ||||||||
| Income from equity investment in unconsolidated subsidiary |
— | 995 | (995 | ) | ||||||||
|
|
|
|
|
|
|
|||||||
| Income before income taxes |
58,188 | 53,314 | 4,874 | |||||||||
| Income tax provision (benefit) |
48 | (85 | ) | 133 | ||||||||
|
|
|
|
|
|
|
|||||||
| Net income |
58,140 | 53,399 | 4,741 | |||||||||
|
|
|
|
|
|
|
|||||||
| Net income attributable to non-controlling interests |
(249 | ) | (24 | ) | (225 | ) | ||||||
|
|
|
|
|
|
|
|||||||
| Net income attributable to Blackstone Mortgage Trust, Inc. |
$ | 57,891 | $ | 53,375 | $ | 4,516 | ||||||
|
|
|
|
|
|
|
|||||||
| Net income per share – basic and diluted |
$ | 0.59 | $ | 0.57 | $ | 0.02 | ||||||
| Dividends declared per share |
$ | 0.62 | $ | 0.62 | $ | — | ||||||
Income from loans and other investments, net
Income from loans and other investments, net increased $8.3 million during the three months ended December 31, 2017 compared to the three months ended December 31, 2016. The increase was primarily due to the increase in the weighted-average principal balance of our loan portfolio, which increased by $1.2 billion for the three months ended December 31, 2017 compared to the three months ended December 31, 2016. This was partially offset by additional interest expense incurred on our financing arrangements, the weighted-average principal balance of which increased by $1.1 billion for the three months ended December 31, 2017 compared to the three months ended December 31, 2016.
Other expenses
Other expenses are composed of management and incentive fees payable to our Manager and general and administrative expenses. Other expenses increased by $2.5 million during the three months ended December 31, 2017 compared to the three months ended December 31, 2016 due to (i) $1.2 million of additional non-cash restricted stock amortization related to shares awarded under our long-term incentive plans, (ii) an increase of $1.0 million of incentive fees payable to our Manager as a result of an increase in Core Earnings, (iii) an increase of $438,000 of management fees payable to our Manager, and (iv) an increase of $155,000 of general operating expenses. These were offset by a decrease of $444,000 of compensation expenses associated with our CT Legacy Portfolio incentive plans.
Gain on investments at fair value
During the three months ended December 31, 2016 we recognized $6,000 of net gains on investments held by CT Legacy Partners. Our investment in CT Legacy Partners was substantially realized as of December 31, 2016.
73
Table of Contents
Income from equity investment in unconsolidated subsidiary
During the three months ended December 31, 2016 we recognized a $995,000 gain related to our promote interest from CTOPI. The investment in CTOPI was fully realized as of December 31, 2016.
Net income attributable to non-controlling interests
During the three months ended December 31, 2017, our non-controlling interests related to our Multifamily Joint Venture. During the three months ended December 31, 2016 our non-controlling interests related to CT Legacy Partners. In each case, the non-controlling interests represent the portion of the consolidated entity’s net income that is not owned by us.
During the three months ended December 31, 2017, we recorded $249,000 of net income attributable to non-controlling interests related to our Multifamily Joint Venture. During the three months ended December 31, 2016 we recorded $24,000 of net income attributable to non-controlling interests which related to the gain on investments at fair value recognized by CT Legacy Partners.
Dividends per share
During the three months ended December 31, 2017, we declared aggregate dividends of $0.62 per share, or $66.9 million. During the three months ended December 31, 2016, we declared aggregate dividends of $0.62 per share, or $58.6 million.
IV. Liquidity and Capital Resources
Capitalization
We have capitalized our business to date through, among other things, the issuance and sale of shares of our class A common stock, borrowings under secured debt agreements, and the issuance and sale of Convertible Notes. As of December 31, 2017, we had 107,883,860 shares of our class A common stock outstanding representing $2.9 billion of stockholders’ equity, $5.3 billion of outstanding borrowings under secured debt agreements, and $575.0 million of Convertible Notes outstanding.
As of December 31, 2017, our secured debt agreements consisted of credit facilities with an outstanding balance of $4.1 billion, the GE portfolio acquisition facility with an outstanding balance of $703.4 million, and $518.9 million of asset-specific financings. We also finance our business through the sale of loan participations and non-consolidated senior interests. As of December 31, 2017 we had $80.7 million of loan participations sold and $985.4 million of non-consolidated senior interests outstanding. In addition, as of December 31, 2017, our consolidated balance sheet included $1.3 billion of securitized debt obligations related to our collateralized loan obligation, or the CLO, and our single asset securitization vehicle, or Single Asset Securitization.
See Notes 6, 7, 8 and 9 to our consolidated financial statements for additional details regarding our secured debt agreements, loan participations sold, securitized debt obligations, and Convertible Notes, respectively.
Debt-to-Equity Ratio and Total Leverage Ratio
The following table presents our debt-to-equity ratio and total leverage ratio:
| December 31, 2017 | December 31, 2016 | |||
| Debt-to-equity ratio(1) |
2.0x | 2.3x | ||
| Total leverage ratio(2) |
2.8x | 2.9x |
| (1) | Represents (i) total outstanding secured debt agreements and convertible notes, less cash, to (ii) total equity, in each case at period end. |
| (2) | Represents (i) total outstanding secured debt agreements, convertible notes, loan participations sold, non-consolidated senior interests, and securitized debt obligations, less cash, to (ii) total equity, in each case at period end. |
74
Table of Contents
Sources of Liquidity
Our primary sources of liquidity include cash and cash equivalents, available borrowings under our credit facilities and revolving credit agreement, and net receivables from servicers related to loan repayments which are set forth in the following table ($ in thousands):
| December 31, 2017 | December 31, 2016 | |||||||
| Cash and cash equivalents |
$ | 69,654 | $ | 75,567 | ||||
| Available borrowings under secured debt agreements |
595,848 | 578,096 | ||||||
| Loan principal payments held by servicer, net(1) |
15,763 | 670 | ||||||
|
|
|
|
|
|||||
| $ | 681,265 | $ | 654,333 | |||||
|
|
|
|
|
|||||
| (1) | Represents loan principal payments held by our third-party servicer as of the balance sheet date which were remitted to us during the subsequent remittance cycle, net of the related secured debt balance. |
In addition to our current sources of liquidity, we have access to liquidity through public offerings of debt and equity securities. To facilitate such offerings, in July 2016, we filed a shelf registration statement with the Securities and Exchange Commission, or the SEC, that is effective for a term of three years and expires in July 2019. The amount of securities to be issued pursuant to this shelf registration statement was not specified when it was filed and there is no specific dollar limit on the amount of securities we may issue. The securities covered by this registration statement include: (i) class A common stock; (ii) preferred stock; (iii) debt securities; (iv) depositary shares representing preferred stock; (v) warrants; (vi) subscription rights; (vii) purchase contracts; and (viii) units consisting of one or more of such securities or any combination of these securities. The specifics of any future offerings, along with the use of proceeds of any securities offered, will be described in detail in a prospectus supplement, or other offering materials, at the time of any offering.
We may also access liquidity through a dividend reinvestment plan and direct stock purchase plan, under which 9,996,926 shares of class A common stock were available for issuance as of December 31, 2017, and our at-the-market stock offering program, pursuant to which we may sell, from time to time, up to $188.6 million of additional shares of our class A common stock as of December 31, 2017. Refer to Note 11 to our consolidated financial statements for additional details.
Our existing loan portfolio also provides us with liquidity as loans are repaid or sold, in whole or in part, and the proceeds from such repayments become available for us to reinvest.
Liquidity Needs
In addition to our ongoing loan origination activity, our primary liquidity needs include interest and principal payments under our $5.3 billion of outstanding borrowings under secured debt agreements, our Convertible Notes, our unfunded loan commitments, dividend distributions to our stockholders, and operating expenses.
75
Table of Contents
Contractual Obligations and Commitments
Our contractual obligations and commitments as of December 31, 2017 were as follows ($ in thousands):
| Total Obligation |
Payment Timing | |||||||||||||||||||
| Less Than 1 Year |
1 to 3 Years |
3 to 5 Years |
More Than 5 Years |
|||||||||||||||||
| Unfunded loan commitments(1) |
$ | 1,573,107 | $ | 177,518 | $ | 1,340,589 | $ | $55,000 | $ | — | ||||||||||
| Principal payments under secured debt agreements(2) |
5,290,536 | 1,602,081 | 3,624,897 | 63,558 | — | |||||||||||||||
| Principal payments on convertible notes |
575,000 | 172,500 | — | 402,500 | — | |||||||||||||||
| Interest payments(2)(3) |
364,731 | 192,426 | 146,813 | 25,492 | — | |||||||||||||||
|
|
|
|
|
|
|
|
|
|
|
|||||||||||
| Total(4) |
$ | 7,803,374 | $ | 2,144,525 | $ | 5,112,299 | $ | 546,550 | $ | — | ||||||||||
|
|
|
|
|
|
|
|
|
|
|
|||||||||||
| (1) | The allocation of our unfunded loan commitments is based on the earlier of the commitment expiration date or the loan maturity date. |
| (2) | The allocation of our secured debt agreements for both principal and interest payments is based on the current maturity date of each individual borrowing under the respective agreement. |
| (3) | Represents interest payments on our secured debt agreements and convertible notes. Future interest payment obligations are estimated assuming the amounts outstanding and the interest rates in effect as of December 31, 2017 will remain constant into the future. This is only an estimate as actual amounts borrowed and rates will vary over time. |
| (4) | Total does not include $80.7 million of loan participations sold, $985.4 million of non-consolidated senior interests, and $1.3 billion of securitized debt obligations, as the satisfaction of these liabilities will not require cash outlays from us. |
We are also required to settle our foreign currency forward contracts and interest rate swaps with our derivative counterparties upon maturity which, depending on foreign exchange and interest rate movements, may result in cash received from or due to the respective counterparty. The table above does not include these amounts as they are not fixed and determinable. Refer to Note 10 to our consolidated financial statement for details regarding our derivative contracts.
We are required to pay our Manager a base management fee, an incentive fee, and reimbursements for certain expenses pursuant to our Management Agreement. The table above does not include the amounts payable to our Manager under our Management Agreement as they are not fixed and determinable. Refer to Note 12 to our consolidated financial statements for additional terms and details of the fees payable under our Management Agreement.
As a REIT, we generally must distribute substantially all of our net taxable income to stockholders in the form of dividends to comply with the REIT provisions of the Internal Revenue Code. Our taxable income does not necessarily equal our net income as calculated in accordance with GAAP, or our Core Earnings as described above.
Cash Flows
The following table provides a breakdown of the net change in our cash, cash equivalents, and restricted cash ($ in thousands):
| For the years ended December 31, | ||||||||||||
| 2017 | 2016 | 2015 | ||||||||||
| Cash flows provided by operating activities |
$ | 227,461 | $ | 236,652 | $ | 171,394 | ||||||
| Cash flows (used in) provided by investing activities |
(780,752 | ) | 434,087 | (4,823,020 | ) | |||||||
| Cash flows provided by (used in) financing activities |
574,742 | (699,597 | ) | 4,694,118 | ||||||||
|
|
|
|
|
|
|
|||||||
| Net increase (decrease) in cash, cash equivalents, and restricted cash |
$ | 21,451 | $ | (28,858 | ) | $ | 42,492 | |||||
|
|
|
|
|
|
|
|||||||
76
Table of Contents
We experienced a net increase in cash, cash equivalents, and restricted cash of $21.5 million for the year ended December 31, 2017, compared to a net decrease of $28.9 million for the year ended December 31, 2016. During 2017, we (i) collected $2.8 billion of proceeds from loan principal repayments, (ii) received $817.5 million of proceeds from the issuance of collateralized loan obligations, (iii) received $394.6 million of net proceeds from the issuance of convertible notes, and (iv) received $391.6 million of net proceeds from the issuance of class A common stock. We used the proceeds from our loan repayments and financing activities to (i) fund $3.6 billion of new loans during 2017 and (ii) repay a net $471.9 million under secured debt agreements.
We experienced a net decrease in cash, cash equivalents, and restricted cash of $28.9 million for the year ended December 31, 2016, compared to a net increase of $42.5 million for the year ended December 31, 2015. During 2016, we collected $3.5 billion of proceeds from loan principal repayments. We used the proceeds from our loan repayments to (i) originate $3.2 billion of new loans during 2016 and (ii) repay a net $348.9 million under secured debt agreements.
Refer to Note 3 to our consolidated financial statements for further discussion of our loan activity. Refer to Notes 6 and 7 to our consolidated financial statements for additional discussion of our secured debt agreements and loan participations sold.
V. Other Items
Income Taxes
We elected to be taxed as a REIT, effective January 1, 2003, under the Internal Revenue Code for U.S. federal income tax purposes. We generally must distribute annually at least 90% of our net taxable income, subject to certain adjustments and excluding any net capital gain, in order for U.S. federal income tax not to apply to our earnings that we distribute. To the extent that we satisfy this distribution requirement, but distribute less than 100% of our net taxable income, we will be subject to U.S. federal income tax on our undistributed taxable income. In addition, we will be subject to a 4% nondeductible excise tax if the actual amount that we pay out to our stockholders in a calendar year is less than a minimum amount specified under U.S. federal tax laws.
Our qualification as a REIT also depends on our ability to meet various other requirements imposed by the Internal Revenue Code, which relate to organizational structure, diversity of stock ownership, and certain restrictions with regard to the nature of our assets and the sources of our income. Even if we qualify as a REIT, we may be subject to certain U.S. federal income and excise taxes and state and local taxes on our income and assets. If we fail to maintain our qualification as a REIT for any taxable year, we may be subject to material penalties as well as federal, state and local income tax on our taxable income at regular corporate rates and we would not be able to qualify as a REIT for the subsequent four full taxable years. As of December 31, 2017 and 2016, we were in compliance with all REIT requirements.
Refer to Note 13 to our consolidated financial statements for additional discussion of our income taxes.
Off-Balance Sheet Arrangements
We have no off-balance sheet arrangements.
Critical Accounting Policies
Our discussion and analysis of our financial condition and results of operations is based upon our consolidated financial statements, which have been prepared in accordance with GAAP. The preparation of these financial statements requires our Manager to make estimates and assumptions that affect the reported amounts of assets, liabilities, revenue and expenses, and related disclosure of contingent assets and liabilities. Actual results could differ from these estimates. During 2017, our Manager reviewed and evaluated our critical accounting policies
77
Table of Contents
and believes them to be appropriate. The following is a summary of our significant accounting policies that we believe are the most affected by our Manager’s judgments, estimates, and assumptions:
Revenue Recognition
Interest income from our loans receivable portfolio is recognized over the life of each investment using the effective interest method and is recorded on the accrual basis. Recognition of fees, premiums, and discounts associated with these investments is deferred until the loan is advanced and is then recorded over the term of the loan as an adjustment to yield. Income accrual is generally suspended for loans at the earlier of the date at which payments become 90 days past due or when, in the opinion of our Manager, recovery of income and principal becomes doubtful. Income is then recorded on the basis of cash received until accrual is resumed when the loan becomes contractually current and performance is demonstrated to be resumed. In addition, for loans we originate, the related origination expenses are similarly deferred, however expenses related to loans acquired are included in general and administrative expenses as incurred.
Loans Receivable and Provision for Loan Losses
We originate and purchase commercial real estate debt and related instruments generally to be held as long-term investments at amortized cost. We are required to periodically evaluate each of these loans for possible impairment. Impairment is indicated when it is deemed probable that we will not be able to collect all amounts due to us pursuant to the contractual terms of the loan. If a loan is determined to be impaired, we write down the loan through a charge to the provision for loan losses. Impairment of these loans, which are collateral dependent, is measured by comparing the estimated fair value of the underlying collateral, less costs to sell, to the book value of the respective loan. These valuations require significant judgments, which include assumptions regarding capitalization rates, leasing, creditworthiness of major tenants, occupancy rates, availability of financing, exit plan, loan sponsorship, actions of other lenders, and other factors deemed necessary by our Manager. Actual losses, if any, could ultimately differ from these estimates.
Our Manager performs a quarterly review of our portfolio of loans. In conjunction with this review, our Manager assesses the risk factors of each loan, and assigns a risk rating based on a variety of factors, including, without limitation, loan-to-value ratio, or LTV, debt yield, property type, geographic and local market dynamics, physical condition, cash flow volatility, leasing and tenant profile, loan structure and exit plan, and project sponsorship. Based on a 5-point scale, our loans are rated “1” through “5,” from less risk to greater risk, which ratings are defined as follows:
| 1 - | Very Low Risk |
| 2 - | Low Risk |
| 3 - | Medium Risk |
| 4 - | High Risk/Potential for Loss: A loan that has a risk of realizing a principal loss. |
| 5 - | Impaired/Loss Likely: A loan that has a very high risk of realizing a principal loss or has otherwise incurred a principal loss. |
Refer to Note 2 to our consolidated financial statements for the complete listing and description of our significant accounting policies.
78
Table of Contents
VI. Loan Portfolio Details
The following table provides details of our loan portfolio, on a loan-by-loan basis, as of December 31, 2017 ($ in millions):
| Loan Type(1) |
Origination Date(2) |
Total Loan(3) |
Principal Balance(3) |
Net Book Value |
Cash Coupon(4) |
All-in Yield(4) |
Maximum Maturity(5) |
Location |
Property Type |
Loan Per SQFT / Unit / Key |
LTV(2) | Risk Rating | ||||||||||||||||||||||||||||||||
| 1 | Senior loan |
5/11/2017 | $ | 752.6 | $ | 656.4 | $ | 652.9 | L + 3.40 | % | L + 3.60 | % | 6/10/2023 | Northern Virginia |
Office | $ | 321 / sqft | 62 | % | 3 | ||||||||||||||||||||||||
| 2 | Senior loan(3) |
5/15/2015 | 590.0 | 545.1 | 92.3 | L + 4.25 | % | L + 4.69 | % | 5/15/2020 | Miami |
Retail | 691 / sqft | 36 | % | 3 | ||||||||||||||||||||||||||||
| 3 | Senior loan(3) |
8/6/2015 | 499.1 | 499.1 | 90.6 | 4.49 | % | 5.82 | % | 10/29/2022 | Diversified-EUR |
Other | n/a | 71 | % | 3 | ||||||||||||||||||||||||||||
| 4 | Senior loan |
1/7/2015 | 315.0 | 294.6 | 294.0 | L + 3.50 | % | L + 3.71 | % | 1/9/2021 | New York |
Office | 252 / sqft | 53 | % | 2 | ||||||||||||||||||||||||||||
| 5 | Senior loan |
5/1/2015 | 320.3 | 294.5 | 294.2 | L + 3.45 | % | L + 3.83 | % | 5/1/2020 | New York |
Office | 375 / sqft | 68 | % | 3 | ||||||||||||||||||||||||||||
| 6 | Senior loan |
3/31/2017 | 258.4 | 241.5 | 239.5 | L + 4.15 | % | L + 4.54 | % | 4/9/2022 | Maui |
Hotel | 318,182 / key | 75 | % | 3 | ||||||||||||||||||||||||||||
| 7 | Senior loan |
6/4/2015 | 229.9 | 229.9 | 232.4 | L + 4.20 | % | L + 4.22 | % | 3/18/2021 | Diversified-CAN |
Hotel | 38,623 / key | 54 | % | 2 | ||||||||||||||||||||||||||||
| 8 | Senior loan |
12/22/2017 | 225.0 | 225.0 | 222.8 | L + 2.80 | % | L + 3.16 | % | 1/9/2023 | Chicago |
Multi | 326,087 / unit | 65 | % | 3 | ||||||||||||||||||||||||||||
| 9 | Senior loan |
6/23/2015 | 222.1 | 215.3 | 214.9 | L + 3.65 | % | L + 3.98 | % | 5/8/2022 | Washington DC |
Office | 241 / sqft | 72 | % | 2 | ||||||||||||||||||||||||||||
| 10 | Senior loan |
2/25/2014 | 210.0 | 210.0 | 208.9 | L + 4.25 | % | L + 4.70 | % | 3/9/2021 | Diversified-US |
Hotel | 110,352 / key | 58 | % | 2 | ||||||||||||||||||||||||||||
| 11 | Senior loan |
8/3/2016 | 275.9 | 199.7 | 198.2 | L + 4.66 | % | L + 5.22 | % | 8/9/2021 | New York |
Office | 275 / sqft | 57 | % | 3 | ||||||||||||||||||||||||||||
| 12 | Senior loan |
8/19/2016 | 200.0 | 189.8 | 189.7 | L + 3.64 | % | L + 4.10 | % | 9/9/2021 | New York |
Office | 580 / sqft | 69 | % | 3 | ||||||||||||||||||||||||||||
| 13 | Senior loan |
4/15/2016 | 200.0 | 188.8 | 188.4 | L + 4.25 | % | L + 4.86 | % | 5/9/2021 | New York |
Office | 176 / sqft | 40 | % | 3 | ||||||||||||||||||||||||||||
| 14 | Senior loan |
12/22/2016 | 204.5 | 175.0 | 173.9 | L + 3.50 | % | L + 4.07 | % | 1/9/2022 | New York |
Office | 246 / sqft | 66 | % | 3 | ||||||||||||||||||||||||||||
| 15 | Senior loan |
8/17/2016 | 187.0 | 169.0 | 167.9 | L + 3.75 | % | L + 4.13 | % | 9/9/2021 | San Francisco |
Office | 498 / sqft | 65 | % | 3 | ||||||||||||||||||||||||||||
| 16 | Senior loan |
3/8/2016 | 181.1 | 168.7 | 167.2 | L + 3.55 | % | L + 3.85 | % | 3/9/2021 | Orange County |
Office | 211 / sqft | 52 | % | 3 | ||||||||||||||||||||||||||||
| 17 | Senior loan |
8/31/2017 | 183.0 | 165.5 | 163.9 | L + 3.00 | % | L + 3.40 | % | 9/9/2022 | Orange County |
Office | 196 / sqft | 64 | % | 3 | ||||||||||||||||||||||||||||
| 18 | Senior loan |
5/16/2017 | 189.2 | 165.1 | 163.5 | L + 3.90 | % | L + 4.29 | % | 5/16/2021 | Chicago |
Office | 124 / sqft | 59 | % | 3 | ||||||||||||||||||||||||||||
| 19 | Senior loan |
6/3/2016 | 160.0 | 160.0 | 160.0 | L + 4.42 | % | L + 4.42 | % | 6/9/2021 | Los Angeles |
Office | 86 / sqft | 41 | % | 2 | ||||||||||||||||||||||||||||
| 20 | Senior loan |
11/30/2017 | 197.4 | 159.1 | 157.2 | L + 3.80 | % | L + 4.20 | % | 12/9/2022 | San Jose |
Office | 264 / sqft | 64 | % | 3 | ||||||||||||||||||||||||||||
| 21 | Senior loan(3) |
6/30/2015 | 158.7 | 155.7 | 30.7 | L + 4.75 | % | L + 5.21 | % | 8/15/2022 | San Francisco |
Condo | 788 / sqft | 60 | % | 3 | ||||||||||||||||||||||||||||
| 22 | Senior loan |
2/17/2017 | 150.0 | 150.0 | 148.9 | L + 4.65 | % | L + 5.04 | % | 3/9/2022 | Honolulu |
Hotel | 240,770 / key | 65 | % | 3 | ||||||||||||||||||||||||||||
| 23 | Senior loan |
10/5/2016 | 145.5 | 142.3 | 141.6 | L + 4.35 | % | L + 4.84 | % | 10/9/2021 | Diversified-US |
Hotel | 53,669 / key | 61 | % | 2 | ||||||||||||||||||||||||||||
| 24 | Senior loan |
2/12/2016 | 225.0 | 141.3 | 139.0 | L + 5.75 | % | L + 7.17 | % | 2/11/2021 | Seattle |
Office | 187 / sqft | 48 | % | 3 | ||||||||||||||||||||||||||||
| 25 | Senior loan |
1/26/2017 | 288.0 | 141.1 | 138.9 | L + 5.50 | % | L + 5.94 | % | 2/9/2022 | Boston |
Office | 379 / sqft | 42 | % | 2 | ||||||||||||||||||||||||||||
| 26 | Senior loan |
10/30/2013 | 140.0 | 140.0 | 139.9 | L + 4.38 | % | L + 4.54 | % | 9/9/2020 | San Francisco |
Hotel | 209,581 / key | 66 | % | 2 | ||||||||||||||||||||||||||||
| 27 | Senior loan |
8/23/2017 | 165.0 | 135.9 | 134.4 | L + 3.25 | % | L + 3.64 | % | 10/9/2022 | Los Angeles |
Office | 276 / sqft | 74 | % | 3 | ||||||||||||||||||||||||||||
| 28 | Senior loan |
1/30/2014 | 133.4 | 133.4 | 132.5 | L + 4.30 | % | L + 5.83 | % | 6/1/2018 | New York |
Hotel | 212,341 / key | 38 | % | 2 | ||||||||||||||||||||||||||||
| 29 | Senior loan |
10/26/2016 | 129.4 | 129.4 | 128.6 | L + 4.20 | % | L + 4.57 | % | 11/9/2021 | Oakland |
Office | 136 / sqft | 72 | % | 2 | ||||||||||||||||||||||||||||
| 30 | Senior loan | 11/14/2017 | 128.5 | 128.5 | 127.3 | L + 3.80 | % | L + 4.16 | % | 12/9/2022 | Huntington Beach |
Hotel | 514,000 / key | 57 | % | 3 | ||||||||||||||||||||||||||||
| 31 | Senior loan | 12/21/2017 | 182.5 | 127.5 | 125.7 | L + 3.25 | % | L + 3.68 | % | 1/9/2023 | Atlanta |
Office | 96 / sqft | 51 | % | 3 | ||||||||||||||||||||||||||||
| 32 | Senior loan | 6/29/2017 | 141.1 | 122.3 | 121.2 | L + 3.35 | % | L + 3.77 | % | 7/9/2022 | Torrance |
Multi | 241,781 / unit | 68 | % | 3 | ||||||||||||||||||||||||||||
| 33 | Senior loan | 11/2/2017 | 140.0 | 120.0 | 118.7 | L + 3.20 | % | L + 3.62 | % | 11/9/2022 | Boston |
Industrial | 158 / sqft | 69 | % | 3 | ||||||||||||||||||||||||||||
| 34 | Senior loan | 10/17/2016 | 116.2 | 116.2 | 115.5 | L + 3.95 | % | L + 3.98 | % | 10/21/2021 | Diversified-UK |
Other | 160 / sqft | 73 | % | 3 | ||||||||||||||||||||||||||||
| 35 | Senior loan | 12/9/2014 | 131.2 | 111.2 | 110.9 | L + 3.65 | % | L + 3.80 | % | 12/9/2021 | Diversified-US |
Office | 79 / sqft | 65 | % | 2 | ||||||||||||||||||||||||||||
| 36 | Senior loan | 2/20/2014 | 110.0 | 110.0 | 109.7 | L + 3.95 | % | L + 4.16 | % | 3/9/2021 | Long Island |
Office | 161 / sqft | 74 | % | 2 | ||||||||||||||||||||||||||||
| 37 | Senior loan | 2/18/2016 | 108.1 | 108.1 | 108.0 | L + 3.75 | % | L + 4.41 | % | 4/20/2019 | London-UK |
Office | 918 / sqft | 44 | % | 3 | ||||||||||||||||||||||||||||
| 38 | Senior loan | 7/28/2016 | 119.0 | 105.2 | 104.6 | L + 3.60 | % | L + 4.00 | % | 8/9/2021 | Atlanta |
Office | 167 / sqft | 70 | % | 3 | ||||||||||||||||||||||||||||
continued…
79
Table of Contents
| Loan Type(1) |
Origination Date(2) |
Total Loan(3) |
Principal Balance(3) |
Net Book Value |
Cash Coupon(4) |
All-in Yield(4) |
Maximum Maturity(5) |
Location |
Property Type |
Loan Per SQFT / Unit / Key |
LTV(2) | Risk Rating | ||||||||||||||||||||||||||||||||
| 39 | Senior loan | 6/24/2015 | 107.3 | 104.9 | 104.7 | L + 4.25 | % | L + 4.62 | % | 7/9/2020 | Honolulu |
Hotel | 176,048 / key | 67 | % | 2 | ||||||||||||||||||||||||||||
| 40 | Senior loan | 4/27/2016 | 100.8 | 100.8 | 100.8 | L + 4.35 | % | L + 5.02 | % | 5/9/2021 | Chicago |
Office | 133 / sqft | 74 | % | 2 | ||||||||||||||||||||||||||||
| 41 | Senior loan | 1/22/2016 | 128.5 | 99.9 | 99.4 | L + 4.25 | % | L + 4.69 | % | 2/9/2021 | Los Angeles |
Retail | 259 / sqft | 64 | % | 3 | ||||||||||||||||||||||||||||
| 42 | Senior loan | 6/23/2015 | 95.4 | 95.4 | 97.7 | L + 4.30 | % | L + 4.80 | % | 1/27/2018 | Diversified-US |
Other | 235,619 / unit | 57 | % | 3 | ||||||||||||||||||||||||||||
| 43 | Senior loan | 3/10/2016 | 98.5 | 91.8 | 91.4 | L + 4.10 | % | L + 4.52 | % | 4/9/2021 | Chicago |
Multi | 632,954 / unit | 63 | % | 3 | ||||||||||||||||||||||||||||
| 44 | Senior loan | 1/31/2017 | 134.8 | 91.7 | 90.7 | L + 5.00 | % | L + 5.48 | % | 2/9/2022 | Boston |
Other | 497 / sqft | 60 | % | 3 | ||||||||||||||||||||||||||||
| 45 | Senior loan | 5/16/2014 | 100.0 | 91.6 | 91.2 | L + 3.85 | % | L + 4.21 | % | 4/9/2022 | Miami |
Office | 197 / sqft | 67 | % | 3 | ||||||||||||||||||||||||||||
| 46 | Senior loan | 7/23/2014 | 90.0 | 89.6 | 89.4 | L + 3.85 | % | L + 4.05 | % | 7/9/2020 | Atlanta |
Office | 179 / sqft | 43 | % | 2 | ||||||||||||||||||||||||||||
| 47 | Senior loan | 2/18/2015 | 89.9 | 85.6 | 85.6 | L + 3.75 | % | L + 3.75 | % | 3/9/2020 | Diversified-CA |
Office | 177 / sqft | 71 | % | 2 | ||||||||||||||||||||||||||||
| 48 | Senior loan | 5/22/2014 | 95.3 | 85.1 | 85.0 | L + 3.75 | % | L + 4.07 | % | 6/15/2021 | Orange County |
Office | 149 / sqft | 67 | % | 2 | ||||||||||||||||||||||||||||
| 49 | Senior loan | 7/11/2014 | 87.2 | 82.2 | 81.8 | L + 3.55 | % | L + 3.83 | % | 8/9/2020 | Chicago |
Office | 157 / sqft | 65 | % | 2 | ||||||||||||||||||||||||||||
| 50 | Senior loan | 10/28/2014 | 85.0 | 82.1 | 81.9 | L + 3.75 | % | L + 4.01 | % | 11/9/2019 | New York |
Retail | 1,534 / sqft | 78 | % | 2 | ||||||||||||||||||||||||||||
| 51 | Senior loan | 2/12/2016 | 100.0 | 81.2 | 81.2 | L + 4.15 | % | L + 4.68 | % | 3/9/2021 | Long Island |
Office | 121 / sqft | 65 | % | 3 | ||||||||||||||||||||||||||||
| 52 | Senior loan | 5/1/2015 | 83.5 | 81.0 | 80.9 | L + 3.95 | % | L + 4.31 | % | 5/9/2020 | Maryland |
Hotel | 207,733 / key | 67 | % | 2 | ||||||||||||||||||||||||||||
| 53 | Senior loan | 6/23/2015 | 80.7 | 80.7 | 81.0 | L + 3.65 | % | L + 4.09 | % | 2/28/2018 | Diversified-US |
Hotel | 68,270 / key | 83 | % | 2 | ||||||||||||||||||||||||||||
| 54 | Senior loan | 2/27/2015 | 102.2 | 76.1 | 75.4 | L + 3.55 | % | L + 3.91 | % | 4/28/2022 | Chicago |
Office | 156 / sqft | 65 | % | 2 | ||||||||||||||||||||||||||||
| 55 | Senior loan | 8/18/2017 | 83.7 | 74.4 | 73.8 | L + 4.10 | % | L + 4.46 | % | 8/18/2022 | Brussels |
Office | 118 / sqft | 59 | % | 3 | ||||||||||||||||||||||||||||
| 56 | Senior loan | 6/4/2015 | 76.9 | 73.4 | 74.1 | 5.13 | %(6) | 5.42 | %(6) | 3/28/2019 | Diversified-CAN |
Retail | 42 / sqft | 74 | % | 3 | ||||||||||||||||||||||||||||
| 57 | Senior loan | 3/31/2017 | 91.2 | 70.5 | 69.8 | L + 4.30 | % | L + 4.88 | % | 4/9/2022 | New York |
Office | 346 / sqft | 64 | % | 3 | ||||||||||||||||||||||||||||
| 58 | Senior loan | 9/1/2017 | 76.0 | 66.5 | 65.8 | L + 4.15 | % | L + 4.58 | % | 9/9/2021 | New York |
Condo | 699 / sqft | 64 | % | 3 | ||||||||||||||||||||||||||||
| 59 | Senior loan | 10/6/2014 | 67.0 | 65.4 | 65.3 | L + 4.35 | % | L + 4.61 | % | 10/9/2019 | Long Island |
Hotel | 106,407 / key | 56 | % | 3 | ||||||||||||||||||||||||||||
| 60 | Senior loan | 6/29/2016 | 75.4 | 65.0 | 64.6 | L + 3.65 | % | L + 4.08 | % | 7/9/2021 | Fort Lauderdale |
Office | 251 / sqft | 64 | % | 3 | ||||||||||||||||||||||||||||
| 61 | Senior loan | 11/30/2016 | 79.0 | 63.9 | 63.4 | L + 3.95 | % | L + 4.39 | % | 12/9/2021 | Chicago |
Retail | 1,263 / sqft | 54 | % | 3 | ||||||||||||||||||||||||||||
| 62 | Senior loan | 5/11/2017 | 135.9 | 63.4 | 62.2 | L + 3.40 | % | L + 3.91 | % | 6/10/2023 | Northern Virginia |
Office | 147 / sqft | 38 | % | 2 | ||||||||||||||||||||||||||||
| 63 | Senior loan | 3/11/2014 | 65.0 | 62.1 | 62.1 | L + 4.50 | % | L + 4.77 | % | 4/9/2019 | New York |
Multi | 698,177 / unit | 65 | % | 3 | ||||||||||||||||||||||||||||
| 64 | Senior loan | 5/9/2017 | 73.7 | 60.1 | 59.5 | L + 3.85 | % | L + 4.30 | % | 5/9/2022 | New York |
Multi | 361,850 / unit | 67 | % | 3 | ||||||||||||||||||||||||||||
| 65 | Senior loan | 7/13/2017 | 86.3 | 60.0 | 59.2 | L + 3.75 | % | L + 4.18 | % | 8/9/2022 | Honolulu |
Hotel | 192,926 / key | 66 | % | 3 | ||||||||||||||||||||||||||||
| 66 | Senior loan | 1/13/2014 | 60.0 | 60.0 | 59.7 | L + 3.45 | % | L + 4.89 | % | 6/9/2020 | New York |
Office | 284 / sqft | 53 | % | 2 | ||||||||||||||||||||||||||||
| 67 | Senior loan | 11/28/2013 | 63.5 | 58.8 | 58.9 | L + 4.15 | % | L + 5.07 | % | 1/20/2020 | London-UK |
Office | 720 / sqft | 58 | % | 3 | ||||||||||||||||||||||||||||
| 68 | Senior loan | 6/29/2017 | 64.2 | 57.5 | 56.9 | L + 3.40 | % | L + 3.71 | % | 7/9/2023 | New York |
Multi | 167,638 / unit | 69 | % | 3 | ||||||||||||||||||||||||||||
| 69 | Senior loan | 10/6/2017 | 55.9 | 54.4 | 54.0 | L + 2.95 | % | L + 3.21 | % | 10/9/2022 | Nashville |
Multi | 97,077 / unit | 74 | % | 3 | ||||||||||||||||||||||||||||
| 70 | Senior loan | 9/9/2014 | 56.0 | 52.5 | 52.4 | L + 4.00 | % | L + 4.25 | % | 9/9/2019 | Ft. Lauderdale |
Office | 151 / sqft | 71 | % | 2 | ||||||||||||||||||||||||||||
| 71 | Senior loan | 11/23/2016 | 55.4 | 50.8 | 50.4 | L + 3.50 | % | L + 3.80 | % | 12/9/2022 | New York |
Multi | 211,682 / unit | 65 | % | 3 | ||||||||||||||||||||||||||||
| 72 | Senior loan | 11/1/2017 | 52.1 | 50.6 | 50.2 | L + 2.95 | % | L + 3.21 | % | 11/9/2022 | Denver |
Multi | 150,545 / unit | 74 | % | 3 | ||||||||||||||||||||||||||||
| 73 | Senior loan | 5/20/2015 | 58.0 | 49.5 | 49.5 | 5.28 | %(6) | 5.56 | %(6) | 6/30/2019 | Charlotte |
Office | 97 / sqft | 71 | % | 3 | ||||||||||||||||||||||||||||
| 74 | Senior loan | 12/27/2016 | 57.2 | 49.5 | 49.1 | L + 4.65 | % | L + 5.08 | % | 1/9/2022 | New York |
Multi | 1,260,476 / unit | 64 | % | 3 | ||||||||||||||||||||||||||||
| 75 | Senior loan | 11/19/2015 | 48.7 | 45.9 | 45.8 | L + 4.00 | % | L + 4.50 | % | 10/9/2018 | New York |
Office | 1,178 / sqft | 57 | % | 3 | ||||||||||||||||||||||||||||
| 76 | Senior loan | 9/22/2016 | 46.0 | 45.5 | 45.4 | L + 4.25 | % | L + 4.90 | % | 10/9/2019 | New York |
Office | 456 / sqft | 51 | % | 3 | ||||||||||||||||||||||||||||
| 77 | Senior loan | 2/9/2017 | 47.0 | 44.8 | 44.4 | L + 4.50 | % | L + 4.98 | % | 2/9/2022 | London |
Office | 732 / sqft | 69 | % | 3 | ||||||||||||||||||||||||||||
| 78 | Senior loan | 5/20/2015 | 45.0 | 44.0 | 43.8 | L + 3.00 | % | L + 3.32 | % | 11/1/2022 | Los Angeles |
Office | 205 / sqft | 59 | % | 2 | ||||||||||||||||||||||||||||
| 79 | Senior loan | 8/29/2017 | 51.2 | 43.5 | 43.0 | L + 3.10 | % | L + 3.52 | % | 10/9/2022 | Southern California |
Industrial | 91 / sqft | 65 | % | 3 | ||||||||||||||||||||||||||||
| 80 | Senior loan | 10/6/2017 | 41.1 | 41.0 | 40.7 | L + 2.95 | % | L + 3.20 | % | 10/9/2022 | Las Vegas |
Multi | 138,345 / unit | 77 | % | 3 | ||||||||||||||||||||||||||||
| 81 | Senior loan | 10/30/2017 | 41.0 | 41.0 | 40.9 | L + 3.95 | % | L + 4.37 | % | 5/1/2019 | Washington DC |
Multi | 149,635 / unit | 59 | % | 2 | ||||||||||||||||||||||||||||
continued…
80
Table of Contents
| Loan Type(1) |
Origination Date(2) |
Total Loan(3) |
Principal Balance(3) |
Net Book Value |
Cash Coupon(4) |
All-in Yield(4) |
Maximum Maturity(5) |
Location |
Property Type |
Loan Per SQFT / Unit / Key |
LTV(2) | Risk Rating | ||||||||||||||||||||||||||||||||
| 82 | Senior loan | 9/1/2016 | 40.8 | 40.8 | 40.8 | L + 4.35 | % | L + 4.96 | % | 9/1/2021 | Atlanta |
Multi | 220,719 / unit | 72 | % | 3 | ||||||||||||||||||||||||||||
| 83 | Senior loan | 6/26/2015 | 42.1 | 39.3 | 39.3 | L + 3.75 | % | L + 3.76 | % | 7/9/2020 | San Diego |
Office | 179 / sqft | 73 | % | 2 | ||||||||||||||||||||||||||||
| 84 | Senior loan | 11/17/2014 | 38.2 | 38.2 | 38.1 | L + 5.50 | % | L + 5.76 | % | 12/9/2019 | Diversified-CAN |
Office | 61 / sqft | 53 | % | 2 | ||||||||||||||||||||||||||||
| 85 | Senior loan | 8/25/2015 | 43.8 | 37.4 | 37.3 | L + 4.50 | % | L + 4.76 | % | 9/9/2018 | Los Angeles |
Office | 166 / sqft | 46 | % | 3 | ||||||||||||||||||||||||||||
| 86 | Senior loan | 10/22/2015 | 35.1 | 35.1 | 35.1 | L + 4.50 | % | L + 4.76 | % | 10/22/2018 | London-UK |
Office | 2,654 / sqft | 64 | % | 3 | ||||||||||||||||||||||||||||
| 87 | Senior loan | 6/12/2014 | 34.6 | 34.6 | 34.4 | L + 4.00 | % | L + 4.23 | % | 6/30/2020 | Los Angeles |
Office | 39 / sqft | 44 | % | 2 | ||||||||||||||||||||||||||||
| 88 | Senior loan | 10/6/2017 | 34.8 | 34.5 | 34.3 | L + 2.95 | % | L + 3.20 | % | 10/9/2022 | Las Vegas |
Multi | 119,895 / unit | 75 | % | 3 | ||||||||||||||||||||||||||||
| 89 | Senior loan | 11/15/2017 | 34.0 | 34.0 | 33.9 | L + 4.35 | % | L + 4.83 | % | 6/1/2019 | Sacramento |
Multi | 193,182 / unit | 63 | % | 2 | ||||||||||||||||||||||||||||
| 90 | Senior loan | 7/14/2017 | 32.8 | 32.8 | 32.8 | L + 4.35 | % | L + 4.60 | % | 8/1/2018 | Davis |
Multi | 215,461 / unit | 69 | % | 2 | ||||||||||||||||||||||||||||
| 91 | Senior loan | 4/17/2015 | 32.4 | 32.4 | 32.4 | L + 4.50 | % | L + 4.95 | % | 4/20/2020 | Hague-NL |
Hotel | 105,926 / key | 71 | % | 2 | ||||||||||||||||||||||||||||
| 92 | Senior loan | 5/20/2015 | 36.4 | 31.9 | 31.8 | L + 3.60 | % | L + 4.08 | % | 7/11/2019 | Los Angeles |
Office | 386 / sqft | 46 | % | 1 | ||||||||||||||||||||||||||||
| 93 | Senior loan | 5/28/2015 | 48.6 | 31.6 | 31.4 | L + 4.00 | % | L + 4.53 | % | 6/30/2020 | Los Angeles |
Office | 36 / sqft | 53 | % | 2 | ||||||||||||||||||||||||||||
| 94 | Senior loan | 2/28/2014 | 26.0 | 26.0 | 26.0 | L + 4.00 | % | L + 4.26 | % | 3/9/2019 | Phoenix |
Other | 123,223 / unit | 69 | % | 2 | ||||||||||||||||||||||||||||
| 95 | Senior loan | 5/8/2017 | 80.0 | 25.6 | 24.8 | L + 3.75 | % | L + 4.59 | % | 5/8/2022 | Washington DC |
Office | 119 / sqft | 73 | % | 3 | ||||||||||||||||||||||||||||
| 96 | Senior loan | 6/18/2014 | 24.8 | 24.8 | 24.8 | L + 4.00 | % | L + 4.43 | % | 7/20/2019 | Diversified-NL |
Office | 64 / sqft | 69 | % | 3 | ||||||||||||||||||||||||||||
| 97 | Senior loan | 12/15/2017 | 22.5 | 22.5 | 22.1 | L + 3.25 | % | L + 4.31 | % | 12/9/2020 | Diversified-US |
Hotel | 8,465 / key | 50 | % | 2 | ||||||||||||||||||||||||||||
| 98 | Senior loan | 6/4/2015 | 21.0 | 21.0 | 20.8 | 4.50 | % | 5.06 | % | 12/23/2021 | Montreal-CAN |
Office | 57 / sqft | 45 | % | 2 | ||||||||||||||||||||||||||||
| 99 | Senior loan | 5/28/2015 | 20.6 | 20.6 | 20.6 | L + 3.95 | % | L + 5.65 | % | 3/31/2019 | Pittsburgh |
Hotel | 92,161 / key | 71 | % | 4 | ||||||||||||||||||||||||||||
| 100 | Senior loan | 6/4/2015 | 18.0 | 18.0 | 18.1 | 4.63 | % | 4.95 | % | 3/1/2019 | Ontario-CAN |
Other | 52,959 / unit | 59 | % | 2 | ||||||||||||||||||||||||||||
| 101 | Senior loan | 6/4/2015 | 17.1 | 17.1 | 17.2 | 5.20 | % | 5.55 | % | 9/4/2020 | Diversified-CAN |
Other | 3,727 / unit | 61 | % | 2 | ||||||||||||||||||||||||||||
| 102 | Senior loan | 11/2/2017 | 17.9 | 16.1 | 16.1 | L + 3.90 | % | L + 4.23 | % | 11/1/2020 | Phoenix |
Multi | 61,923 / unit | 59 | % | 3 | ||||||||||||||||||||||||||||
| 103 | Senior loan | 6/4/2015 | 15.5 | 14.7 | 15.3 | L + 4.50 | % | L + 4.44 | % | 1/12/2018 | Toronto-CAN |
Office | 88 / sqft | 58 | % | 2 | ||||||||||||||||||||||||||||
| 104 | Senior loan | 10/20/2017 | 17.2 | 14.0 | 13.9 | L + 4.25 | % | L + 4.60 | % | 11/1/2021 | Houston |
Multi | 110,714 / unit | 56 | % | 3 | ||||||||||||||||||||||||||||
| 105 | Senior loan | 9/6/2017 | 13.3 | 13.3 | 13.3 | L + 4.25 | % | L + 5.17 | % | 4/1/2019 | Austin |
Multi | 127,644 / unit | 67 | % | 3 | ||||||||||||||||||||||||||||
| 106 | Senior loan | 7/13/2017 | 13.1 | 13.1 | 13.1 | L + 4.50 | % | L + 4.88 | % | 2/1/2020 | Orlando |
Multi | 60,648 / unit | 72 | % | 2 | ||||||||||||||||||||||||||||
| 107 | Senior loan | 7/21/2017 | 10.7 | 10.7 | 10.7 | L + 4.50 | % | L + 4.76 | % | 8/1/2018 | Phoenix |
Multi | 72,297 / unit | 72 | % | 3 | ||||||||||||||||||||||||||||
| 108 | Senior loan | 7/21/2017 | 7.3 | 7.3 | 7.3 | L + 5.00 | % | L + 5.32 | % | 7/1/2019 | Phoenix |
Multi | 56,154 / unit | 78 | % | 3 | ||||||||||||||||||||||||||||
| 109 | Senior loan | 7/20/2017 | 193.2 | 2.3 | 0.4 | L + 5.10 | % | L + 6.06 | % | 8/9/2022 | Oakland |
Office | 4 / sqft | 58 | % | 3 | ||||||||||||||||||||||||||||
| 110 | Senior loan | 9/22/2017 | 91.0 | 0.0 | (0.9 | ) | L + 5.25 | % | L + 5.98 | % | 10/9/2022 | Oakland |
Multi | 0 / unit | 47 | % | 3 | |||||||||||||||||||||||||||
|
|
|
|
|
|
|
|
|
|
|
|
|
|
|
| ||||||||||||||||||||||||||||||
| $ | 12,706.4 | $ | 11,093.6 | $ | 10,056.7 | 5.38 | % | 5.83 | % | 3.5 yrs | 61 | % | 2.7 | |||||||||||||||||||||||||||||||
|
|
|
|
|
|
|
|
|
|
|
|
|
|
|
| ||||||||||||||||||||||||||||||
| (1) | Senior loans include senior mortgages and similar credit quality loans, including related contiguous subordinate loans and pari passu participations in senior mortgage loans. |
| (2) | Date loan was originated or acquired by us, and the LTV as of such date. Dates are not updated for subsequent loan modifications or upsizes. |
| (3) | In certain instances, we finance our loans through the non-recourse sale of a senior loan interest that is not included in our consolidated financial statements. As of December 31, 2017, three loans in our portfolio have been financed with an aggregate $985.4 million of non-consolidated senior interest, which are included in the table above. |
| (4) | As of December 31, 2017, our floating rate loans were indexed to various benchmark rates, with 93% of floating rate loans by loan exposure indexed to USD LIBOR. In addition to cash coupon, all-in yield includes the amortization of deferred origination and extension fees, loan origination costs, and purchase discounts, as well as the accrual of exit fees. |
| (5) | Maximum maturity assumes all extension options are exercised, however our loans may be repaid prior to such date. |
| (6) | Loan consists of one or more floating and fixed rate tranches. Coupon and all-in yield assume applicable floating benchmark rates for weighted-average calculation. |
81
Table of Contents
| ITEM 7A. | QUANTITATIVE AND QUALITATIVE DISCLOSURES ABOUT MARKET RISK |
Interest Rate Risk
Loan Portfolio Net Interest Income
Generally, our business model is such that rising interest rates will increase our net income, while declining interest rates will decrease net income. As of December 31, 2017, 94% of our loans by total loan exposure earned a floating rate of interest and were financed with liabilities that pay interest at floating rates, which resulted in an amount of net equity that is positively correlated to rising interest rates, subject to the impact of interest rate floors on certain of our floating rate loans. As of December 31, 2017, the remaining 6% of our loans by total loan exposure earned a fixed rate of interest, but are financed with liabilities that pay interest at floating rates, which resulted in a negative correlation to rising interest rates to the extent of our financing. In certain instances where we have financed fixed rate assets with floating rate liabilities, we have purchased interest rate swaps or caps to limit our exposure to increases in interest rates on such liabilities.
The following table projects the impact on our interest income and expense for the twelve-month period following December 31, 2017, assuming an immediate increase or decrease of both 25 and 50 basis points in the applicable interest rate benchmark by currency ($ in thousands):
| Assets (Liabilities) Subject to Interest |
25 Basis Point | 25 Basis Point | 50 Basis Point | 50 Basis Point | ||||||||||||||||||||
| Currency |
Rate Sensitivity(1)(2) | Increase | Decrease | Increase | Decrease | |||||||||||||||||||
| USD |
$ | 9,642,606 | Interest income | $ | 24,107 | $ | (24,050 | ) | $ | 48,213 | $ | (46,744 | ) | |||||||||||
| (6,635,529 | ) | Interest expense | (16,589 | ) | 16,589 | (33,046 | ) | 33,178 | ||||||||||||||||
|
|
|
|
|
|
|
|
|
|
|
|||||||||||||||
| $ | 3,007,077 | Total | $ | 7,518 | $ | (7,461 | ) | $ | 15,167 | $ | (13,566 | ) | ||||||||||||
|
|
|
|
|
|
|
|
|
|
|
|||||||||||||||
| GBP |
$ | 363,044 | Interest income | $ | 908 | $ | (908 | ) | $ | 1,815 | $ | (1,815 | ) | |||||||||||
| (190,224 | ) | Interest expense | (476 | ) | 476 | (951 | ) | 951 | ||||||||||||||||
|
|
|
|
|
|
|
|
|
|
|
|||||||||||||||
| $ | 172,820 | Total | $ | 432 | $ | (432 | ) | $ | 864 | $ | (864 | ) | ||||||||||||
|
|
|
|
|
|
|
|
|
|
|
|||||||||||||||
| EUR |
$ | 131,671 | Interest income | $ | — | $ | — | $ | 225 | $ | — | |||||||||||||
| (79,406 | ) | Interest expense | (199 | ) | 199 | (397 | ) | 397 | ||||||||||||||||
|
|
|
|
|
|
|
|
|
|
|
|||||||||||||||
| $ | 52,265 | Total | $ | (199 | ) | $ | 199 | $ | (172 | ) | $ | 397 | ||||||||||||
|
|
|
|
|
|
|
|
|
|
|
|||||||||||||||
| CAD(3) |
$ | 283,947 | Interest income | $ | 710 | $ | (710 | ) | $ | 1,420 | $ | (1,420 | ) | |||||||||||
| (249,536 | ) | Interest expense | (624 | ) | 624 | (1,240 | ) | 1,248 | ||||||||||||||||
|
|
|
|
|
|
|
|
|
|
|
|||||||||||||||
| $ | 34,411 | Total | $ | 86 | $ | (86 | ) | $ | 180 | $ | (172 | ) | ||||||||||||
|
|
|
|
|
|
|
|
|
|
|
|||||||||||||||
| Total | $ | 7,837 | $ | (7,780 | ) | $ | 16,039 | $ | (14,205 | ) | ||||||||||||||
|
|
|
|
|
|
|
|
|
|||||||||||||||||
| (1) | Our floating rate loans and related liabilities are indexed to the various benchmark rates relevant in each case in terms of currency and payment frequency. Therefore the net exposure to each benchmark rate is in direct proportion to our net assets indexed to that rate. |
| (2) | Includes borrowings under secured debt agreements, loan participations sold, non-consolidated senior interests, and securitized debt obligations. |
| (3) | Liabilities balance includes four interest rate swaps totaling C$108.1 million ($86.0 million as of December 31, 2017) that are used to hedge a portion of our fixed rate debt. |
Loan Portfolio Value
As of December 31, 2017, 6% of our loans by total loan exposure earned a fixed rate of interest and as such, the values of such loans are sensitive to changes in interest rates. We generally hold all of our loans to maturity and so do not expect to realize gains or losses on our fixed rate loan portfolio as a result of movements in market interest rates.
82
Table of Contents
Risk of Non-Performance
In addition to the risks related to fluctuations in cash flows and asset values associated with movements in interest rates, there is also the risk of non-performance on floating rate assets. In the case of a significant increase in interest rates, the additional debt service payments due from our borrowers may strain the operating cash flows of the collateral real estate assets and, potentially, contribute to non-performance or, in severe cases, default. This risk is partially mitigated by various facts we consider during our underwriting process, which in certain cases include a requirement for our borrower to purchase an interest rate cap contract.
Credit Risks
Our loans and investments are also subject to credit risk. The performance and value of our loans and investments depend upon the sponsors’ ability to operate the properties that serve as our collateral so that they produce cash flows adequate to pay interest and principal due to us. To monitor this risk, our Manager’s asset management team reviews our investment portfolios and in certain instances is in regular contact with our borrowers, monitoring performance of the collateral and enforcing our rights as necessary.
In addition, we are exposed to the risks generally associated with the commercial real estate market, including variances in occupancy rates, capitalization rates, absorption rates, and other macroeconomic factors beyond our control. We seek to manage these risks through our underwriting and asset management processes.
Capital Market Risks
We are exposed to risks related to the equity capital markets, and our related ability to raise capital through the issuance of our class A common stock or other equity instruments. We are also exposed to risks related to the debt capital markets, and our related ability to finance our business through borrowings under credit facilities or other debt instruments. As a REIT, we are required to distribute a significant portion of our taxable income annually, which constrains our ability to accumulate operating cash flow and therefore requires us to utilize debt or equity capital to finance our business. We seek to mitigate these risks by monitoring the debt and equity capital markets to inform our decisions on the amount, timing, and terms of capital we raise.
Counterparty Risk
The nature of our business requires us to hold our cash and cash equivalents and obtain financing from various financial institutions. This exposes us to the risk that these financial institutions may not fulfill their obligations to us under these various contractual arrangements. We mitigate this exposure by depositing our cash and cash equivalents and entering into financing agreements with high credit-quality institutions.
The nature of our loans and investments also exposes us to the risk that our counterparties do not make required interest and principal payments on scheduled due dates. We seek to manage this risk through a comprehensive credit analysis prior to making an investment and active monitoring of the asset portfolios that serve as our collateral.
Currency Risk
Our loans and investments that are denominated in a foreign currency are also subject to risks related to fluctuations in currency rates. We mitigate this exposure by matching the currency of our foreign currency assets to the currency of the borrowings that finance those assets. As a result, we substantially reduce our exposure to changes in portfolio value related to changes in foreign currency rates. In certain circumstances, we may also enter into foreign currency derivative contracts to further mitigate this exposure.
83
Table of Contents
The following tables outline our assets and liabilities that are denominated in a foreign currency (£/€/C$ in thousands):
| December 31, 2017 | ||||||||||||
| Foreign currency assets(1) |
£ | 652,211 | € | 146,570 | C$ | 528,739 | ||||||
| Foreign currency liabilities(1) |
(443,599 | ) | (66,682 | ) | (422,319 | ) | ||||||
| Foreign currency contracts – notional |
(112,700 | ) | — | (95,100 | ) | |||||||
|
|
|
|
|
|
|
|||||||
| Net exposure to exchange rate fluctuations |
£ | 95,912 | € | 79,888 | C$ | 11,320 | ||||||
|
|
|
|
|
|
|
|||||||
| (1) | Balances include non-consolidated senior interests of £302.0 million. |
| December 31, 2016 | ||||||||||||
| Foreign currency assets(1) |
£ | 1,113,124 | € | 276,407 | C$ | 660,747 | ||||||
| Foreign currency liabilities(1) |
(880,081 | ) | (150,199 | ) | (527,981 | ) | ||||||
| Foreign currency contracts – notional |
(141,900 | ) | (44,900 | ) | (122,900 | ) | ||||||
|
|
|
|
|
|
|
|||||||
| Net exposure to exchange rate fluctuations |
£ | 91,143 | € | 81,308 | C$ | 9,866 | ||||||
|
|
|
|
|
|
|
|||||||
| (1) | Balances include non-consolidated senior interests of £302.0 million |
We estimate that a 10% appreciation of the United States Dollar relative to the British Pound Sterling and the Euro would result in a decline in our net assets in U.S. Dollar terms of $28.2 million and $9.6 million, respectively, as of December 31, 2017. Substantially all of our net asset exposure to the Canadian Dollar has been hedged with foreign currency forward contracts.
| ITEM 8. | FINANCIAL STATEMENTS AND SUPPLEMENTARY DATA |
The financial statements required by this item and the reports of the independent accountants thereon required by Item 14(a)(2) appear on pages F-2 to F-46. See accompanying Index to the Consolidated Financial Statements on page F-1. The supplementary financial data required by Item 302 of Regulation S-K appears in Note 19 to the consolidated financial statements.
| ITEM 9. | CHANGES IN AND DISAGREEMENTS WITH ACCOUNTANTS ON ACCOUNTING AND FINANCIAL DISCLOSURE |
None.
| ITEM 9A. | CONTROLS AND PROCEDURES |
Evaluation of Disclosure Controls and Procedures
The company maintains disclosure controls and procedures (as that term is defined in Rules 13a-15(e) and 15d-15(e) under the Exchange Act) that are designed to ensure that information required to be disclosed in the company’s reports under the Exchange Act is recorded, processed, and summarized and reported within the time periods specified in the SEC’s rules and forms, and that such information is accumulated and communicated to the company’s management, including its Chief Executive Officer and Chief Financial Officer, as appropriate, to allow timely decisions regarding required disclosures. Any controls and procedures, no matter how well designed and operated, can provide only reasonable assurance of achieving the desired control objectives. An evaluation of the effectiveness of the design and operation of our disclosure controls and procedures as of the end of the period covered by this annual report on Form 10-K was made under the supervision and with the participation of our management, including our Chief Executive Officer and Chief Financial Officer. Based upon this evaluation, our Chief Executive Officer and Chief Financial Officer have concluded that our disclosure controls and procedures
84
Table of Contents
(a) are effective to ensure that information required to be disclosed by us in reports filed or submitted under the Exchange Act is timely recorded, processed, summarized and reported and (b) include, without limitation, controls and procedures designed to ensure that information required to be disclosed by us in reports filed or submitted under the Exchange Act is accumulated and communicated to our management, including our Chief Executive Officer and Chief Financial Officer, as appropriate to allow timely decisions regarding required disclosure.
Changes in Internal Controls
There were no changes in our internal control over financial reporting (as such term is defined in Rules 13a–15(f) and 15d–15(f) under the Exchange Act) that occurred during our most recent quarter, that has materially affected, or is reasonably likely to materially affect, our internal control over financial reporting.
Management’s Report on Internal Control Over Financial Reporting
Management of Blackstone Mortgage Trust, Inc. and subsidiaries, or Blackstone Mortgage Trust, is responsible for establishing and maintaining adequate internal control over financial reporting. Blackstone Mortgage Trust’s internal control over financial reporting is a process designed under the supervision of its Chief Executive Officer and Chief Financial Officer to provide reasonable assurance regarding the reliability of financial reporting and the preparation of its consolidated financial statements for external reporting purposes in accordance with accounting principles generally accepted in the United States of America (“generally accepted accounting principles”).
Blackstone Mortgage Trust’s internal control over financial reporting includes policies and procedures that pertain to the maintenance of records that, in reasonable detail, accurately and fairly reflect transactions and dispositions of assets of the company; provide reasonable assurances that transactions are recorded as necessary to permit preparation of financial statements in accordance with generally accepted accounting principles, and that receipts and expenditures are being made only in accordance with authorizations of the company’s management and directors; and provide reasonable assurance regarding prevention or timely detection of unauthorized acquisition, use or disposition of assets that could have a material effect on its financial statements.
Because of its inherent limitations, internal control over financial reporting may not prevent or detect misstatements. In addition, projections of any evaluation of effectiveness to future periods are subject to the risk that controls may become inadequate because of changes in conditions or that the degree of compliance with the policies or procedures may deteriorate.
Management conducted an assessment of the effectiveness of Blackstone Mortgage Trust’s internal control over financial reporting as of December 31, 2017, based on the framework established in Internal Control – Integrated Framework issued by the Committee of Sponsoring Organizations of the Treadway Commission in 2013. Based on this assessment, management has determined that Blackstone Mortgage Trust’s internal control over financial reporting as of December 31, 2017, was effective.
Deloitte & Touche LLP, an independent registered public accounting firm, has audited Blackstone Mortgage Trust’s financial statements included in this report on Form 10-K and issued its report on the effectiveness of Blackstone Mortgage Trust’s internal control over financial reporting as of December 31, 2017, which is included herein.
| ITEM 9B. | OTHER INFORMATION |
The following is a summary of additional material United States federal income tax considerations with respect to Blackstone Mortgage Trust. This discussion is being included in this Annual Report on Form 10-K for incorporation by reference into the Company’s Registration Statements on Form S-3 (No. 333-212769) (the
85
Table of Contents
“Form S-3”) and on Form S-8 (File Nos. 333-39743, 333-144929, 333-179668, 333-189806 and 333-212112), the prospectus filed as part of the Form S-3, and any applicable prospectus supplements thereto. This discussion supplements and updates the discussions contained in, or incorporated by reference into, the prospectus filed as part of the Form S-3, and any applicable prospectus supplements thereto, under the heading “Material United States Federal Income Tax Considerations,” and supersedes such discussions to the extent inconsistent with such discussions.
ADDITIONAL UNITED STATES FEDERAL INCOME TAX CONSIDERATIONS
The Tax Cuts and Jobs Act
Enactment of the Tax Act
On December 22, 2017, the federal tax legislation commonly known as the Tax Cuts and Jobs Act, or the Tax Act, was signed into law. The Tax Act makes major changes to the Internal Revenue Code, including several provisions of the Internal Revenue Code that affect the taxation of real estate investment trusts and holders of their securities. The most significant of these provisions are described below. The individual and collective impact of these changes on REITs such as the Company and their security holders is uncertain, and may not become evident for some period. Prospective investors should consult their tax advisors regarding the implications of the Tax Act on the Company and their investment.
Pass-Through Business Income Tax Rate Lowered through Deduction
Under the Tax Act, United States holders that are individuals, trusts or estates generally may deduct 20% of “qualified REIT dividends” (i.e., REIT dividends other than capital gain dividends and portions of REIT dividends designated as qualified dividend income eligible for capital gain tax rates). The overall deduction is limited to 20% of the sum of the taxpayer’s taxable income (less net capital gain) and certain cooperative dividends, subject to further limitations based on taxable income. The deduction, if allowed in full, equates to a maximum effective United States federal income tax rate on ordinary REIT dividends of 29.6%. As with the other individual income tax changes, the deduction provisions are effective beginning in 2018. Without further legislation, the deduction will sunset and no longer apply after 2025.
Maximum Corporate Tax Rate Lowered to 21%; Elimination of Corporate Alternative Minimum Tax
The Tax Act reduces the 35% maximum federal corporate income tax rate to a maximum 21% corporate rate, and reduces the dividends-received deduction for certain corporate subsidiaries. The Tax Act also permanently eliminates the corporate alternative minimum tax. These provisions are effective beginning in 2018.
Net Operating Loss Modifications
Net operating loss (“NOL”) provisions are modified by the Tax Act. The Tax Act limits the NOL deduction to 80% of taxable income (before the deduction). It also generally eliminates NOL carrybacks for individuals and non-REIT corporations (NOL carrybacks did not apply to REITs under prior law), but allows indefinite NOL carryforwards. The new NOL rules apply to losses arising in taxable years beginning in 2018.
Accrual of Income.
Under the Tax Act, the Company generally will be required to take certain amounts in income no later than the time such amounts are reflected on certain financial statements or the time income would be realized under the existing general tax principles. The application of this rule may require the accrual of income with respect to the Company’s debt instruments, such as original issue discount or market discount, earlier than would be the case under the general tax rules, although the precise application of this rule is unclear at this time. This rule generally will be effective for tax years beginning after December 31, 2017 or, for debt instruments issued with original
86
Table of Contents
issue discount, for tax years beginning after December 31, 2018. To the extent that this rule requires the accrual of income earlier than under the general tax rules, it could increase the Company’s “phantom income” (taxable income that is accrued without a corresponding receipt of cash), which may make it more likely that the Company could be required to borrow funds or take other action to satisfy the REIT distribution requirements for the taxable year in which this “phantom income” is recognized.
Other Provisions
The Tax Act makes other significant changes to the Internal Revenue Code. These changes include provisions limiting the ability to offset dividend and interest income with partnership or S corporation net active business losses. These provisions are effective beginning in 2018, but without further legislation, will sunset after 2025.
87
Table of Contents
| ITEM 10. | DIRECTORS, EXECUTIVE OFFICERS AND CORPORATE GOVERNANCE |
The information required by this item is incorporated by reference to the company’s definitive proxy statement to be filed not later than April 30, 2018 with the SEC pursuant to Regulation 14A under the Exchange Act.
| ITEM 11. | EXECUTIVE COMPENSATION |
The information required by this item is incorporated by reference to the company’s definitive proxy statement to be filed not later than April 30, 2018 with the SEC pursuant to Regulation 14A under the Exchange Act.
| ITEM 12. | SECURITY OWNERSHIP OF CERTAIN BENEFICIAL OWNERS AND MANAGEMENT AND RELATED STOCKHOLDER MATTERS |
The information required by this item is incorporated by reference to the company’s definitive proxy statement to be filed not later than April 30, 2018 with the SEC pursuant to Regulation 14A under the Exchange Act.
| ITEM 13. | CERTAIN RELATIONSHIPS AND RELATED TRANSACTIONS, AND DIRECTOR INDEPENDENCE |
The information required by this item is incorporated by reference to the company’s definitive proxy statement to be filed not later than April 30, 2018 with the SEC pursuant to Regulation 14A under the Exchange Act.
| ITEM 14. | PRINCIPAL ACCOUNTING FEES AND SERVICES |
The information required by this item is incorporated by reference to the company’s definitive proxy statement to be filed not later than April 30, 2018 with the SEC pursuant to Regulation 14A under the Exchange Act.
88
Table of Contents
| ITEM 15. | EXHIBITS, FINANCIAL STATEMENT SCHEDULES |
| (a) (1) | Financial Statements | |
| See the accompanying Index to Financial Statement Schedule on page F-1. | ||
| (a) (2) | Consolidated Financial Statement Schedules | |
| See the accompanying Index to Financial Statement Schedule on page F-1. | ||
| (a) (3) | Exhibits | |
89
Table of Contents
EXHIBIT INDEX
| Exhibit Number |
Exhibit Description | |||
| 2.1 | ||||
| 3.1.a | ||||
| 3.1.b | ||||
| 3.1.c | ||||
| 3.1.d | ||||
| 3.1.e | ||||
| 3.1.f | ||||
| 3.1.g | ||||
| 3.2 | ||||
| 4.1 | ||||
| 4.2 | ||||
| 4.3 | Form of 5.25% Convertible Senior Note due 2018 (included as Exhibit A in Exhibit 4.2) | |||
| 4.4 | ||||
| 4.5 | Form of 4.375% Convertible Senior Notes due 2022 (included as Exhibit A in Exhibit 4.4) | |||
| 10.1 | ||||
90
Table of Contents
| Exhibit Number |
Exhibit Description | |||
| 10.2 | * |
|||
| 10.3 | ||||
| 10.4 | + |
|||
| 10.5 | + |
|||
| 10.6 | + |
|||
| 10.7 | + |
|||
| 10.8 | + |
|||
| 10.9 | + |
|||
| 10.10 | + |
|||
| 10.11 | + |
|||
| 10.12 | + |
|||
| 10.13 | + |
|||
| 10.14 | + |
|||
| 10.15 | + |
|||
| 10.16 | + |
|||
91
Table of Contents
| Exhibit Number |
Exhibit Description | |||
| 10.17 | + |
|||
| 10.18 | + |
|||
| 10.19 | + |
|||
| 10.20 | + |
|||
| 10.21 | + |
|||
| 10.22 | ||||
| 10.23 | ||||
| 10.24 | ||||
| 10.25 | ||||
| 10.26 | ||||
| 10.27 | ||||
| 10.28 | ||||
| 10.29 | ||||
92
Table of Contents
| Exhibit Number |
Exhibit Description | |||
| 10.30 | ||||
| 10.31 | ||||
| 10.32 | ||||
| 10.33 | ||||
| 10.34 | ||||
| 10.35 | ||||
| 10.36 | ||||
| 10.37 | ||||
| 10.38 | ||||
| 10.39 | ||||
| 10.40 | ||||
| 10.41 | ||||
93
Table of Contents
| Exhibit Number |
Exhibit Description | |||
| 10.42 | ||||
| 10.43 | ||||
| 10.44 | ||||
| 10.45 | ||||
| 10.46 | ||||
| 10.47 | ||||
| 10.48 | ||||
| 10.49 | ||||
| 10.50 | ||||
| 10.51 | ||||
| 10.52 | ||||
94
Table of Contents
| Exhibit Number |
Exhibit Description | |||
| 10.53 | ||||
| 10.54 | ||||
| 10.55 | ||||
| 10.56 | ||||
| 10.57 | ||||
| 10.58 | ||||
| 10.59 | ||||
| 10.60 | ||||
| 10.61 | ||||
| 10.62 | ||||
| 10.63 | ||||
95
Table of Contents
| Exhibit Number |
Exhibit Description | |||
| 10.64 | ||||
| 10.65 | ||||
| 10.66 | ||||
| 10.67 | ||||
| 10.68 | ||||
| 10.69 | ||||
| 10.70 | ||||
| 10.71 | ||||
| 10.72 | ||||
| 10.73 | ||||
| 10.74 | ||||
| 10.75 | ||||
96
Table of Contents
| Exhibit Number |
Exhibit Description | |||
| 10.76 | ||||
| 10.77 | ||||
| 10.78 | ||||
| 10.79 | ||||
| 10.80 | ||||
| 21.1 | * |
|||
| 23.1 | * |
|||
| 31.1 | * |
|||
| 31.2 | * |
|||
| 32.1 | * |
|||
| 32.2 | * |
|||
| 101.INS | ++ |
XBRL Instance Document | ||
| 101.SCH | ++ |
XBRL Taxonomy Extension Schema Document | ||
| 101.CAL | ++ |
XBRL Taxonomy Extension Calculation Linkbase Document | ||
| 101.LAB | ++ |
XBRL Taxonomy Extension Label Linkbase Document | ||
| 101.PRE | ++ |
XBRL Taxonomy Extension Presentation Linkbase Document | ||
| 101.DEF | ++ |
XBRL Taxonomy Extension Definition Linkbase Document | ||
| * | Filed herewith. |
| + | This document has been identified as a management contract or compensatory plan or arrangement. |
| ++ | This exhibit shall not be deemed “filed” for purposes of Section 18 of the Securities Exchange Act of 1934, as amended (the “Exchange Act”) or otherwise subject to the liability of that Section. Such exhibit shall not be deemed incorporated into any filing under the Securities Act of 1933, as amended (the “Securities Act”), or the Exchange Act. |
97
Table of Contents
The agreements and other documents filed as exhibits to this report are not intended to provide factual information or other disclosure other than with respect to the terms of the agreements or other documents themselves, and you should not rely on them for that purpose. In particular, any representations and warranties made by us in these agreements or other documents were made solely within the specific context of the relevant agreement or document and may not describe the actual state of affairs as of the date they were made or at any other time.
| ITEM 16. | FORM 10-K SUMMARY |
None
98
Table of Contents
Pursuant to the requirements of Section 13 or Section 15(d) of the Securities Exchange Act of 1934, the Registrant has duly caused this report to be signed on its behalf by the undersigned, thereunto duly authorized.
| February 13, 2018 |
/s/ Stephen D. Plavin | |||
| Date |
Stephen D. Plavin Chief Executive Officer (Principal Executive Officer) |
Pursuant to the requirements of the Securities Exchange Act of 1934, this report has been signed below by the following persons on behalf of the Registrant and in the capacities and on the dates indicated.
| February 13, 2018 Date |
/s/ Michael B. Nash Michael B. Nash Executive Chairman of the Board of Directors | |||
| February 13, 2018 Date |
/s/ Stephen D. Plavin Stephen D. Plavin Chief Executive Officer and Director (Principal Executive Officer) | |||
| February 13, 2018 Date |
/s/ Anthony F. Marone, Jr. Anthony F. Marone, Jr. Chief Financial Officer (Principal Financial Officer and Principal Accounting Officer) | |||
| February 13, 2018 Date |
/s/ Leonard W. Cotton Leonard W. Cotton, Director | |||
| February 13, 2018 Date |
/s/ Thomas E. Dobrowksi Thomas E. Dobrowski, Director | |||
| February 13, 2018 Date |
/s/ Martin L. Edelman Martin L. Edelman, Director | |||
| February 13, 2018 Date |
/s/ Henry N. Nassau Henry N. Nassau, Director | |||
| February 13, 2018 Date |
/s/ Jonathan L. Pollack Jonathan L. Pollack, Director | |||
| February 13, 2018 Date |
/s/ Lynne B. Sagalyn Lynne B. Sagalyn, Director | |||
99
Table of Contents
INDEX TO CONSOLIDATED FINANCIAL STATEMENTS AND SCHEDULE
Schedules other than those listed are omitted as they are not applicable or the required or equivalent information has been included in the consolidated financial statements or notes thereto.
F-1
Table of Contents
Report of Independent Registered Public Accounting Firm
To the Stockholders and the Board of Directors of
Blackstone Mortgage Trust, Inc.
New York, New York
Opinions on the Financial Statements and Internal Control over Financial Reporting
We have audited the accompanying consolidated balance sheets of Blackstone Mortgage Trust, Inc. and subsidiaries (the “Company”) as of December 31, 2017 and 2016, the related consolidated statements of operations, comprehensive income, changes in equity, and cash flows for each of the three years in the period ended December 31, 2017, and the related notes and the schedule listed in the Index at Item 15(a) (collectively referred to as the “financial statements”). We also have audited the Company’s internal control over financial reporting as of December 31, 2017, based on criteria established in Internal Control – Integrated Framework (2013) issued by the Committee of Sponsoring Organizations of the Treadway Commission (COSO).
In our opinion, the financial statements referred to above present fairly, in all material respects, the financial position of the Company as of December 31, 2017 and 2016, and the results of its operations and its cash flows for each of the three years in the period ended December 31, 2017, in conformity with accounting principles generally accepted in the United States of America. Also, in our opinion, the financial statement schedule, when considered in relation to the basic consolidated financial statements taken as a whole, present fairly, in all material respects, the information set forth therein. Also, in our opinion, the Company maintained, in all material respects, effective internal control over financial reporting as of December 31, 2017, based on criteria established in Internal Control – Integrated Framework (2013) issued by COSO.
Basis for Opinions
The Company’s management is responsible for these financial statements, for maintaining effective internal control over financial reporting, and for its assessment of the effectiveness of internal control over financial reporting, included in the accompanying Management’s Report on Internal Control Over Financial Reporting. Our responsibility is to express an opinion on these financial statements and financial statement schedule and an opinion on the Company’s internal control over financial reporting based on our audits. We are a public accounting firm registered with the Public Company Accounting Oversight Board (United States) (PCAOB) and are required to be independent with respect to the Company in accordance with the U.S. federal securities laws and the applicable rules and regulations of the Securities and Exchange Commission and the PCAOB.
We conducted our audits in accordance with the standards of the PCAOB. Those standards require that we plan and perform the audits to obtain reasonable assurance about whether the financial statements are free of material misstatement, whether due to error or fraud, and whether effective internal control over financial reporting was maintained in all material respects.
Our audits of the financial statements included performing procedures to assess the risks of material misstatement of the financial statements, whether due to error or fraud, and performing procedures to respond to those risks. Such procedures included examining, on a test basis, evidence regarding the amounts and disclosures in the financial statements. Our audits also included evaluating the accounting principles used and significant estimates made by management, as well as evaluating the overall presentation of the financial statements. Our audit of internal control over financial reporting included obtaining an understanding of internal control over financial reporting, assessing the risk that a material weakness exists, and testing and evaluating the design and operating effectiveness of internal control based on the assessed risk. Our audits also included performing such other procedures as we considered necessary in the circumstances. We believe that our audits provide a reasonable basis for our opinions.
F-2
Table of Contents
Definition and Limitations of Internal Control over Financial Reporting
A company’s internal control over financial reporting is a process designed to provide reasonable assurance regarding the reliability of financial reporting and the preparation of financial statements for external purposes in accordance with generally accepted accounting principles. A company’s internal control over financial reporting includes those policies and procedures that (1) pertain to the maintenance of records that, in reasonable detail, accurately and fairly reflect the transactions and dispositions of the assets of the company; (2) provide reasonable assurance that transactions are recorded as necessary to permit preparation of financial statements in accordance with generally accepted accounting principles, and that receipts and expenditures of the company are being made only in accordance with authorizations of management and directors of the company; and (3) provide reasonable assurance regarding prevention or timely detection of unauthorized acquisition, use, or disposition of the company’s assets that could have a material effect on the financial statements.
Because of its inherent limitations, internal control over financial reporting may not prevent or detect misstatements. Also, projections of any evaluation of effectiveness to future periods are subject to the risk that controls may become inadequate because of changes in conditions, or that the degree of compliance with the policies or procedures may deteriorate.
/s/ Deloitte & Touche LLP
New York, New York
February 13, 2018
We have served as the Company’s auditor since 2013
F-3
Table of Contents
Blackstone Mortgage Trust, Inc.
(in thousands, except share data)
| December 31, 2017 |
December 31, 2016 |
|||||||
| Assets |
||||||||
| Cash and cash equivalents |
$ | 69,654 | $ | 75,567 | ||||
| Restricted cash |
32,864 | — | ||||||
| Loans receivable, net |
10,056,732 | 8,692,978 | ||||||
| Other assets |
99,575 | 44,070 | ||||||
|
|
|
|
|
|||||
| Total Assets |
$ | 10,258,825 | $ | 8,812,615 | ||||
|
|
|
|
|
|||||
| Liabilities and Equity |
||||||||
| Secured debt agreements, net |
$ | 5,273,855 | $ | 5,716,354 | ||||
| Loan participations sold, net |
80,415 | 348,077 | ||||||
| Securitized debt obligations, net |
1,282,412 | — | ||||||
| Convertible notes, net |
563,911 | 166,762 | ||||||
| Other liabilities |
140,826 | 87,819 | ||||||
|
|
|
|
|
|||||
| Total Liabilities |
7,341,419 | 6,319,012 | ||||||
|
|
|
|
|
|||||
| Commitments and contingencies |
— | — | ||||||
| Equity |
||||||||
| Class A common stock, $0.01 par value, 200,000,000 shares authorized, 107,883,860 and 94,540,263 shares issued and outstanding as of December 31, 2017 and 2016, respectively |
1,079 | 945 | ||||||
| Additional paid-in capital |
3,506,861 | 3,089,997 | ||||||
| Accumulated other comprehensive loss |
(29,706 | ) | (56,202 | ) | ||||
| Accumulated deficit |
(567,168 | ) | (541,137 | ) | ||||
|
|
|
|
|
|||||
| Total Blackstone Mortgage Trust, Inc. stockholders’ equity |
2,911,066 | 2,493,603 | ||||||
| Non-controlling interests |
6,340 | — | ||||||
|
|
|
|
|
|||||
| Total Equity |
2,917,406 | 2,493,603 | ||||||
|
|
|
|
|
|||||
| Total Liabilities and Equity |
$ | 10,258,825 | $ | 8,812,615 | ||||
|
|
|
|
|
|||||
Note: The consolidated balance sheet as of December 31, 2017 includes assets of consolidated variable interest entities, or VIEs, that can only be used to settle obligations of each respective VIE, and liabilities of consolidated VIEs for which creditors do not have recourse to Blackstone Mortgage Trust, Inc. As of December 31, 2017, assets of the VIEs totaled $1.5 billion and liabilities of the VIEs totaled $1.3 billion. We did not consolidate any VIEs as of December 31, 2016. Refer to Note 16 for additional discussion of the VIEs.
See accompanying notes to consolidated financial statements.
F-4
Table of Contents
Blackstone Mortgage Trust, Inc.
Consolidated Statements of Operations
(in thousands, except share and per share data)
| Year Ended December 31, | ||||||||||||
| 2017 | 2016 | 2015 | ||||||||||
| Income from loans and other investments |
||||||||||||
| Interest and related income |
$ | 537,915 | $ | 497,974 | $ | 410,635 | ||||||
| Less: Interest and related expenses |
234,870 | 184,270 | 152,416 | |||||||||
|
|
|
|
|
|
|
|||||||
| Income from loans and other investments, net |
303,045 | 313,704 | 258,219 | |||||||||
| Other expenses |
||||||||||||
| Management and incentive fees |
54,841 | 55,959 | 42,886 | |||||||||
| General and administrative expenses |
29,922 | 27,716 | 36,709 | |||||||||
|
|
|
|
|
|
|
|||||||
| Total other expenses |
84,763 | 83,675 | 79,595 | |||||||||
| Gain on investments at fair value |
— | 13,420 | 21,967 | |||||||||
| Income from equity investment in unconsolidated subsidiary |
— | 3,187 | 11,798 | |||||||||
|
|
|
|
|
|
|
|||||||
| Income before income taxes |
218,282 | 246,636 | 212,389 | |||||||||
| Income tax provision |
314 | 196 | 504 | |||||||||
|
|
|
|
|
|
|
|||||||
| Net income |
217,968 | 246,440 | 211,885 | |||||||||
|
|
|
|
|
|
|
|||||||
| Net income attributable to non-controlling interests |
(337 | ) | (8,143 | ) | (15,056 | ) | ||||||
|
|
|
|
|
|
|
|||||||
| Net income attributable to Blackstone Mortgage Trust, Inc. |
$ | 217,631 | $ | 238,297 | $ | 196,829 | ||||||
|
|
|
|
|
|
|
|||||||
| Net income per share of common stock basic and diluted |
$ | 2.27 | $ | 2.53 | $ | 2.41 | ||||||
|
|
|
|
|
|
|
|||||||
| Weighted-average shares of common stock outstanding, basic and diluted |
95,963,616 | 94,165,351 | 81,740,227 | |||||||||
|
|
|
|
|
|
|
|||||||
See accompanying notes to consolidated financial statements.
F-5
Table of Contents
Blackstone Mortgage Trust, Inc.
Consolidated Statements of Comprehensive Income
(in thousands)
| Year Ended December 31, | ||||||||||||
| 2017 | 2016 | 2015 | ||||||||||
| Net income |
$ | 217,968 | $ | 246,440 | $ | 211,885 | ||||||
| Other comprehensive income |
||||||||||||
| Unrealized gain (loss) on foreign currency translation |
47,124 | (49,686 | ) | (41,616 | ) | |||||||
| Realized and unrealized (loss) gain on derivative financial instruments |
(20,628 | ) | 26,242 | 23,882 | ||||||||
|
|
|
|
|
|
|
|||||||
| Other comprehensive income (loss) |
26,496 | (23,444 | ) | (17,734 | ) | |||||||
|
|
|
|
|
|
|
|||||||
| Comprehensive income |
244,464 | 222,996 | 194,151 | |||||||||
| Comprehensive income attributable to non-controlling interests |
(337 | ) | (8,143 | ) | (15,056 | ) | ||||||
|
|
|
|
|
|
|
|||||||
| Comprehensive income attributable to Blackstone Mortgage Trust, Inc. |
$ | 244,127 | $ | 214,853 | $ | 179,095 | ||||||
|
|
|
|
|
|
|
|||||||
See accompanying notes to consolidated financial statements.
F-6
Table of Contents
Blackstone Mortgage Trust, Inc.
Consolidated Statements of Changes in Equity
(in thousands)
| Blackstone Mortgage Trust, Inc. | ||||||||||||||||||||||||||||
| Class A Common Stock |
Additional Paid- In Capital |
Accumulated Other Comprehensive (Loss) Income |
Accumulated Deficit |
Stockholders’ Equity |
Non-Controlling Interests |
Total Equity |
||||||||||||||||||||||
| Balance at December 31, 2014 |
$ | 583 | $ | 2,027,404 | $ | (15,024 | ) | $ | (547,592 | ) | $ | 1,465,371 | $ | 35,515 | $ | 1,500,886 | ||||||||||||
| Shares of class A common stock issued, net |
354 | 1,029,186 | — | — | 1,029,540 | — | 1,029,540 | |||||||||||||||||||||
| Restricted class A common stock earned |
— | 12,960 | — | — | 12,960 | — | 12,960 | |||||||||||||||||||||
| Dividends reinvested |
— | 275 | — | (259 | ) | 16 | — | 16 | ||||||||||||||||||||
| Deferred directors’ compensation |
— | 375 | — | — | 375 | — | 375 | |||||||||||||||||||||
| Other comprehensive loss |
— | — | (17,734 | ) | — | (17,734 | ) | — | (17,734 | ) | ||||||||||||||||||
| Net income |
— | — | — | 196,829 | 196,829 | 15,056 | 211,885 | |||||||||||||||||||||
| Dividends declared on common stock |
— | — | — | (194,769 | ) | (194,769 | ) | — | (194,769 | ) | ||||||||||||||||||
| Distributions to non-controlling interests |
— | — | — | — | — | (37,428 | ) | (37,428 | ) | |||||||||||||||||||
|
|
|
|
|
|
|
|
|
|
|
|
|
|
|
|||||||||||||||
| Balance at December 31, 2015 |
$ | 937 | $ | 3,070,200 | $ | (32,758 | ) | $ | (545,791 | ) | $ | 2,492,588 | $ | 13,143 | $ | 2,505,731 | ||||||||||||
|
|
|
|
|
|
|
|
|
|
|
|
|
|
|
|||||||||||||||
| Shares of class A common stock issued, net |
8 | — | — | — | 8 | — | 8 | |||||||||||||||||||||
| Restricted class A common stock earned |
— | 19,045 | — | — | 19,045 | — | 19,045 | |||||||||||||||||||||
| Dividends reinvested |
— | 377 | — | (350 | ) | 27 | — | 27 | ||||||||||||||||||||
| Deferred directors’ compensation |
— | 375 | — | — | 375 | — | 375 | |||||||||||||||||||||
| Other comprehensive loss |
— | — | (23,444 | ) | — | (23,444 | ) | — | (23,444 | ) | ||||||||||||||||||
| Net income |
— | — | — | 238,297 | 238,297 | 8,143 | 246,440 | |||||||||||||||||||||
| Dividends declared on common stock |
— | — | — | (233,293 | ) | (233,293 | ) | — | (233,293 | ) | ||||||||||||||||||
| Distributions to non-controlling interests |
— | — | — | — | — | (21,286 | ) | (21,286 | ) | |||||||||||||||||||
|
|
|
|
|
|
|
|
|
|
|
|
|
|
|
|||||||||||||||
| Balance at December 31, 2016 |
$ | 945 | $ | 3,089,997 | $ | (56,202 | ) | $ | (541,137 | ) | $ | 2,493,603 | $ | — | $ | 2,493,603 | ||||||||||||
|
|
|
|
|
|
|
|
|
|
|
|
|
|
|
|||||||||||||||
| Shares of class A common stock issued, net |
134 | 391,434 | — | — | 391,568 | — | 391,568 | |||||||||||||||||||||
| Restricted class A common stock earned |
— | 23,584 | — | — | 23,584 | — | 23,584 | |||||||||||||||||||||
| Issuance of convertible notes |
— | 964 | — | — | 964 | — | 964 | |||||||||||||||||||||
| Dividends reinvested |
— | 444 | — | (400 | ) | 44 | — | 44 | ||||||||||||||||||||
| Deferred directors’ compensation |
— | 438 | — | — | 438 | — | 438 | |||||||||||||||||||||
| Other comprehensive income |
— | — | 26,496 | — | 26,496 | — | 26,496 | |||||||||||||||||||||
| Net income |
— | — | — | 217,631 | 217,631 | 337 | 217,968 | |||||||||||||||||||||
| Dividends declared on common stock |
— | — | — | (243,262 | ) | (243,262 | ) | — | (243,262 | ) | ||||||||||||||||||
| Contributions from non-controlling interests |
— | — | — | — | — | 12,165 | 12,165 | |||||||||||||||||||||
| Distributions to non-controlling interests |
— | — | — | — | — | (6,162 | ) | (6,162 | ) | |||||||||||||||||||
|
|
|
|
|
|
|
|
|
|
|
|
|
|
|
|||||||||||||||
| Balance at December 31, 2017 |
$ | 1,079 | $ | 3,506,861 | $ | (29,706 | ) | $ | (567,168 | ) | $ | 2,911,066 | $ | 6,340 | $ | 2,917,406 | ||||||||||||
|
|
|
|
|
|
|
|
|
|
|
|
|
|
|
|||||||||||||||
See accompanying notes to consolidated financial statements.
F-7
Table of Contents
Blackstone Mortgage Trust, Inc.
Consolidated Statements of Cash Flows
(in thousands)
| Year Ended December 31, | ||||||||||||
| 2017 | 2016 | 2015 | ||||||||||
| Cash flows from operating activities |
||||||||||||
| Net income |
$ | 217,968 | $ | 246,440 | $ | 211,885 | ||||||
| Adjustments to reconcile net income to net cash provided by operating activities |
||||||||||||
| Non-cash compensation expense |
24,031 | 21,899 | 20,717 | |||||||||
| Amortization of deferred fees on loans |
(38,373 | ) | (40,345 | ) | (36,053 | ) | ||||||
| Amortization of deferred financing costs and premiums/ discount on debt obligations |
21,988 | 19,339 | 20,708 | |||||||||
| Gain on investments at fair value |
— | (13,420 | ) | (21,967 | ) | |||||||
| Income from equity investment in unconsolidated subsidiary |
— | (3,187 | ) | (11,798 | ) | |||||||
| Distributions of income from unconsolidated subsidiary |
— | 9,977 | 5,007 | |||||||||
| Changes in assets and liabilities, net |
||||||||||||
| Other assets |
(4,632 | ) | 6,069 | (22,385 | ) | |||||||
| Other liabilities |
6,479 | (10,120 | ) | 5,280 | ||||||||
|
|
|
|
|
|
|
|||||||
| Net cash provided by operating activities |
227,461 | 236,652 | 171,394 | |||||||||
|
|
|
|
|
|
|
|||||||
| Cash flows from investing activities |
||||||||||||
| Origination and fundings of loans receivable |
(3,598,166 | ) | (3,151,882 | ) | (7,204,487 | ) | ||||||
| Principal collections and sales proceeds from loans receivable and other assets |
2,780,431 | 3,514,429 | 2,347,966 | |||||||||
| Origination and exit fees received on loans receivable |
55,441 | 44,697 | 33,501 | |||||||||
| Receipts under derivative financial instruments |
6,453 | 41,573 | — | |||||||||
| Payments under derivative financial instruments |
(20,870 | ) | (14,730 | ) | — | |||||||
| Return of collateral deposited under derivative agreements |
16,120 | — | — | |||||||||
| Collateral deposited under derivative agreements |
(20,161 | ) | — | — | ||||||||
|
|
|
|
|
|
|
|||||||
| Net cash (used in) provided by investing activities |
(780,752 | ) | 434,087 | (4,823,020 | ) | |||||||
|
|
|
|
|
|
|
|||||||
continued…
See accompanying notes to consolidated financial statements.
F-8
Table of Contents
Blackstone Mortgage Trust, Inc.
Consolidated Statements of Cash Flows
(in thousands)
| Year Ended December 31, | ||||||||||||
| 2017 | 2016 | 2015 | ||||||||||
| Cash flows from financing activities |
||||||||||||
| Borrowings under secured debt agreements |
$ | 4,306,301 | $ | 3,185,933 | $ | 6,885,393 | ||||||
| Repayments under secured debt agreements |
(4,778,194 | ) | (3,534,803 | ) | (3,030,091 | ) | ||||||
| Proceeds from issuance of collateralized loan obligations |
817,500 | — | — | |||||||||
| Proceeds from sale of loan participations |
80,706 | 54,441 | 256,000 | |||||||||
| Repayment of loan participations |
(381,310 | ) | (136,000 | ) | (238,164 | ) | ||||||
| Payment of deferred financing costs |
(27,465 | ) | (15,350 | ) | (21,230 | ) | ||||||
| Receipts under derivative financial instruments |
— | — | 17,076 | |||||||||
| Contributions from non-controlling interests |
12,165 | — | — | |||||||||
| Distributions to non-controlling interests |
(6,162 | ) | (21,070 | ) | (37,428 | ) | ||||||
| Net proceeds from issuance of convertible notes |
394,632 | — | — | |||||||||
| Net proceeds from issuance of class A common stock |
391,558 | 27 | 1,029,540 | |||||||||
| Dividends paid on class A common stock |
(234,989 | ) | (232,775 | ) | (166,978 | ) | ||||||
|
|
|
|
|
|
|
|||||||
| Net cash provided by (used in) financing activities |
574,742 | (699,597 | ) | 4,694,118 | ||||||||
|
|
|
|
|
|
|
|||||||
| Net increase (decrease) in cash, cash equivalents, and restricted cash |
21,451 | (28,858 | ) | 42,492 | ||||||||
| Cash, cash equivalents, and restricted cash at beginning of year |
75,567 | 106,006 | 63,401 | |||||||||
| Effects of currency translation on cash, cash equivalents, and restricted cash |
5,500 | (1,581 | ) | 113 | ||||||||
|
|
|
|
|
|
|
|||||||
| Cash, cash equivalents, and restricted cash at end of year |
$ | 102,518 | $ | 75,567 | $ | 106,006 | ||||||
|
|
|
|
|
|
|
|||||||
| Supplemental disclosure of cash flows information |
||||||||||||
| Payments of interest |
$ | (206,966 | ) | $ | (164,905 | ) | $ | (127,429 | ) | |||
|
|
|
|
|
|
|
|||||||
| Payments of income taxes |
$ | (296 | ) | $ | (286 | ) | $ | (125 | ) | |||
|
|
|
|
|
|
|
|||||||
| Supplemental disclosure of non-cash investing and financing activities |
||||||||||||
| Dividends declared, not paid |
$ | (66,888 | ) | $ | (58,615 | ) | $ | (58,095 | ) | |||
|
|
|
|
|
|
|
|||||||
| Loan principal payments held by servicer, net |
$ | 15,763 | $ | 670 | $ | 118,074 | ||||||
|
|
|
|
|
|
|
|||||||
| Consolidation of loans receivable of a VIE |
$ | 500,000 | $ | — | $ | — | ||||||
|
|
|
|
|
|
|
|||||||
| Consolidation of securitized debt obligations of a VIE |
$ | (474,620 | ) | $ | — | $ | — | |||||
|
|
|
|
|
|
|
|||||||
See accompanying notes to consolidated financial statements.
F-9
Table of Contents
Blackstone Mortgage Trust, Inc.
Notes to Consolidated Financial Statements
1. ORGANIZATION
References herein to “Blackstone Mortgage Trust,” “Company,” “we,” “us” or “our” refer to Blackstone Mortgage Trust, Inc. and its subsidiaries unless the context specifically requires otherwise.
Blackstone Mortgage Trust is a real estate finance company that originates senior loans collateralized by commercial real estate in North America and Europe. Our investment objective is to preserve and protect shareholder capital while producing attractive risk-adjusted returns primarily through dividends generated from current income from our loan portfolio. We are externally managed by BXMT Advisors L.L.C., or our Manager, a subsidiary of The Blackstone Group L.P., or Blackstone, and are a real estate investment trust, or REIT, traded on the New York Stock Exchange, or NYSE, under the symbol “BXMT.” Our principal executive offices are located at 345 Park Avenue, 42nd Floor, New York, New York 10154. We were incorporated in Maryland in 1998, when we reorganized from a California common law business trust into a Maryland corporation.
We conduct our operations as a REIT for U.S. federal income tax purposes. We generally will not be subject to U.S. federal income taxes on our taxable income to the extent that we annually distribute all of our net taxable income to stockholders and maintain our qualification as a REIT. We also operate our business in a manner that permits us to maintain an exclusion from registration under the Investment Company Act of 1940, as amended. We are organized as a holding company and conduct our business primarily through our various subsidiaries.
2. SUMMARY OF SIGNIFICANT ACCOUNTING POLICIES
Basis of Presentation
The accompanying consolidated financial statements have been prepared in accordance with accounting principles generally accepted in the United States of America, or GAAP, and include, on a consolidated basis, our accounts, the accounts of our wholly-owned subsidiaries, majority-owned subsidiaries, and variable interest entities, or VIEs, of which we are the primary beneficiary. All intercompany balances and transactions have been eliminated in consolidation.
Principles of Consolidation
We consolidate all entities that we control through either majority ownership or voting rights. In addition, we consolidate all VIEs of which we are considered the primary beneficiary. VIEs are defined as entities in which equity investors (i) do not have the characteristics of a controlling financial interest and/or (ii) do not have sufficient equity at risk for the entity to finance its activities without additional subordinated financial support from other parties. The entity that consolidates a VIE is known as its primary beneficiary and is generally the entity with (i) the power to direct the activities that most significantly affect the VIE’s economic performance and (ii) the right to receive benefits from the VIE or the obligation to absorb losses of the VIE that could be significant to the VIE. Refer to Note 16 for additional discussion of our consolidated VIE.
In April 2017, we entered into a joint venture, or our Multifamily Joint Venture, with Walker & Dunlop Inc. to originate, hold, and finance multifamily bridge loans. Pursuant to the terms of the agreements governing the joint venture, Walker & Dunlop contributed 15% of the venture’s equity capital and we contributed 85%. We consolidate the Multifamily Joint Venture as we have a controlling financial interest. The non-controlling interests included on our consolidated balance sheets represent the equity interests in our Multifamily Joint Venture that are owned by Walker & Dunlop. A portion of our Multifamily Joint Venture’s consolidated equity and results of operations are allocated to these non-controlling interests based on Walker & Dunlop’s pro rata ownership of our Multifamily Joint Venture.
F-10
Table of Contents
Blackstone Mortgage Trust, Inc.
Notes to Consolidated Financial Statements (continued)
Use of Estimates
The preparation of consolidated financial statements in conformity with GAAP requires us to make estimates and assumptions that affect the reported amounts of assets and liabilities and disclosure of contingent assets and liabilities as of the date of the consolidated financial statements and the reported amounts of revenues and expenses during the reporting period. Actual results may ultimately differ from those estimates.
Revenue Recognition
Interest income from our loans receivable portfolio is recognized over the life of each investment using the effective interest method and is recorded on the accrual basis. Recognition of fees, premiums, and discounts associated with these investments is deferred until the loan is advanced and is then recorded over the term of the loan as an adjustment to yield. Income accrual is generally suspended for loans at the earlier of the date at which payments become 90 days past due or when, in the opinion of our Manager, recovery of income and principal becomes doubtful. Income is then recorded on the basis of cash received until accrual is resumed when the loan becomes contractually current and performance is demonstrated to be resumed. In addition, for loans we originate, the related origination expenses are deferred and recognized as a component of interest income, however expenses related to loans we acquire are included in general and administrative expenses as incurred.
Cash, Cash Equivalents, and Restricted Cash
Cash and cash equivalents represent cash held in banks, cash on hand, and liquid investments with original maturities of three months or less. We may have bank balances in excess of federally insured amounts; however, we deposit our cash and cash equivalents with high credit-quality institutions to minimize credit risk exposure. We have not experienced, and do not expect, any losses on our cash or cash equivalents.
Restricted cash represents cash held in a segregated bank account related to a letter of credit.
The following table provides a reconciliation of cash, cash equivalents, and restricted cash in our consolidated balance sheets to the total amount shown in our consolidated statements of cash flows ($ in thousands):
| December 31, 2017 |
December 31, 2016 |
|||||||
| Cash and cash equivalents |
$ | 69,654 | $ | 75,567 | ||||
| Restricted cash |
32,864 | — | ||||||
|
|
|
|
|
|||||
| Total cash, cash equivalents, and restricted cash shown in our consolidated statements of cash flows |
$ | 102,518 | $ | 75,567 | ||||
|
|
|
|
|
|||||
Loans Receivable and Provision for Loan Losses
We originate and purchase commercial real estate debt and related instruments generally to be held as long-term investments at amortized cost. We are required to periodically evaluate each of these loans for possible impairment. Impairment is indicated when it is deemed probable that we will not be able to collect all amounts due to us pursuant to the contractual terms of the loan. If a loan is determined to be impaired, we write down the loan through a charge to the provision for loan losses. Impairment of these loans, which are collateral dependent, is measured by comparing the estimated fair value of the underlying collateral, less costs to sell, to the book value of the respective loan. These valuations require significant judgments, which include assumptions regarding capitalization rates, leasing, creditworthiness of major tenants, occupancy rates, availability of financing, exit plan, loan sponsorship, actions of other lenders, and other factors deemed necessary by our Manager. Actual losses, if any, could ultimately differ from these estimates.
F-11
Table of Contents
Blackstone Mortgage Trust, Inc.
Notes to Consolidated Financial Statements (continued)
Our Manager performs a quarterly review of our portfolio of loans. In conjunction with this review, our Manager assesses the risk factors of each loan, and assigns a risk rating based on a variety of factors, including, without limitation, loan-to-value ratio, or LTV, debt yield, property type, geographic and local market dynamics, physical condition, cash flow volatility, leasing and tenant profile, loan structure and exit plan, and project sponsorship. Based on a 5-point scale, our loans are rated “1” through “5,” from less risk to greater risk, which ratings are defined as follows:
| 1 – | Very Low Risk |
| 2 – | Low Risk |
| 3 – | Medium Risk |
| 4 – | High Risk/Potential for Loss: A loan that has a risk of realizing a principal loss. |
| 5 – | Impaired/Loss Likely: A loan that has a very high risk of realizing a principal loss or has otherwise incurred a principal loss. |
During the second quarter of 2015, we acquired a portfolio of loans from General Electric Capital Corporation and certain of its affiliates, or the GE portfolio, for a total purchase price of $4.7 billion. We allocated the aggregate purchase price between each loan based on its fair value relative to the overall portfolio, which allocation resulted in purchase discounts or premiums determined on an asset-by-asset basis. Each loan accretes from its allocated purchase price to its expected collection value over the life of the loan, consistent with the other loans in our portfolio.
Equity Investment in Unconsolidated Subsidiary
Our carried interest in CT Opportunity Partners I, LP, or CTOPI, was accounted for using the equity method. CTOPI’s assets and liabilities were not consolidated into our financial statements due to our determination that (i) it was not a VIE and (ii) the other investors in CTOPI had sufficient rights to preclude consolidation by us. As such, we reported our allocable percentage of the net assets of CTOPI on our consolidated balance sheets. The investment was fully realized as of December 31, 2016 and we no longer have any equity investments in unconsolidated subsidiaries in our consolidated financial statements.
Derivative Financial Instruments
We classify all derivative financial instruments as either other assets or other liabilities on our consolidated balance sheets at fair value.
On the date we enter into a derivative contract, we designate each contract as (i) a hedge of a net investment in a foreign operation, or net investment hedge, (ii) a hedge of a forecasted transaction or of the variability of cash flows to be received or paid related to a recognized asset or liability, or cash flow hedge, (iii) a hedge of a recognized asset or liability, or fair value hedge, or (iv) a derivative instrument not to be designated as a hedging derivative, or non-designated hedge. For all derivatives other than those designated as non-designated hedges, we formally document our hedge relationships and designation at the contract’s inception. This documentation includes the identification of the hedging instruments and the hedged items, its risk management objectives, strategy for undertaking the hedge transaction and our evaluation of the effectiveness of its hedged transaction.
On a quarterly basis, we also formally assess whether the derivative we designated in each hedging relationship is expected to be, and has been, highly effective in offsetting changes in the value or cash flows of the hedged items. If it is determined that a derivative is not highly effective at hedging the designated exposure, hedge accounting is discontinued and the changes in fair value of the instrument are included in net income prospectively. Changes in the fair value of our derivative instruments that qualify as hedges are reported as a
F-12
Table of Contents
Blackstone Mortgage Trust, Inc.
Notes to Consolidated Financial Statements (continued)
component of accumulated other comprehensive income (loss) on our consolidated financial statements. Deferred gains and losses are reclassified out of accumulated other comprehensive income (loss) and into net income in the same period or periods during which the hedged transaction affects earnings, and are presented in the same line item as the earnings effect of the hedged item. For cash flow hedges, this is typically when the periodic swap settlements are made, while for net investment hedges, this occurs when the hedged item is sold or substantially liquidated. To the extent a derivative does not qualify for hedge accounting and is deemed a non-designated hedge, the changes in its fair value are included in net income concurrently.
Secured Debt Agreements
Where applicable, we record investments financed with repurchase agreements as separate assets and the related borrowings under any repurchase agreements are recorded as separate liabilities on our consolidated balance sheets. Interest income earned on the investments and interest expense incurred on the repurchase agreements are reported separately on our consolidated statements of operations.
Senior Loan Participations
In certain instances, we finance our loans through the non-recourse syndication of a senior loan interest to a third-party. Depending on the particular structure of the syndication, the senior loan interest may remain on our GAAP balance sheet or, in other cases, the sale will be recognized and the senior loan interest will no longer be included in our consolidated financial statements. When these sales are not recognized under GAAP we reflect the transaction by recording a loan participations sold liability on our consolidated balance sheet, however this gross presentation does not impact stockholders’ equity or net income. When the sales are recognized, our balance sheet only includes our remaining subordinate loan and not the non-consolidated senior interest we sold.
Convertible Notes
The “Debt with Conversion and Other Options” Topic of the Financial Accounting Standards Board, or FASB, Accounting Standards Codification, or ASC, requires the liability and equity components of convertible debt instruments that may be settled in cash upon conversion, including partial cash settlement, to be separately accounted for in a manner that reflects the issuer’s nonconvertible debt borrowing rate. The initial proceeds from the sale of convertible notes are allocated between a liability component and an equity component in a manner that reflects interest expense at the rate of similar nonconvertible debt that could have been issued at such time. The equity component represents the excess initial proceeds received over the fair value of the liability component of the notes as of the date of issuance. We measured the estimated fair value of the debt component of our convertible notes as of the respective issuance dates based on our nonconvertible debt borrowing rate. The equity component of each series of our convertible notes is reflected within additional paid-in capital on our consolidated balance sheet, and the resulting debt discount is amortized over the period during which such convertible notes are expected to be outstanding (through the maturity date) as additional non-cash interest expense. The additional non-cash interest expense attributable to such convertible notes will increase in subsequent periods through the maturity date as the notes accrete to their par value over the same period.
Deferred Financing Costs
The deferred financing costs that are included as a reduction in the net book value of the related liability on our consolidated balance sheets include issuance and other costs related to our debt obligations. These costs are amortized as interest expense using the effective interest method over the life of the related obligations.
F-13
Table of Contents
Blackstone Mortgage Trust, Inc.
Notes to Consolidated Financial Statements (continued)
Fair Value of Financial Instruments
The “Fair Value Measurements and Disclosures” Topic, or ASC 820, defines fair value, establishes a framework for measuring fair value, and requires certain disclosures about fair value measurements under GAAP. Specifically, this guidance defines fair value based on exit price, or the price that would be received upon the sale of an asset or the transfer of a liability in an orderly transaction between market participants at the measurement date.
ASC 820 also establishes a fair value hierarchy that prioritizes and ranks the level of market price observability used in measuring financial instruments. Market price observability is affected by a number of factors, including the type of financial instrument, the characteristics specific to the financial instrument, and the state of the marketplace, including the existence and transparency of transactions between market participants. Financial instruments with readily available quoted prices in active markets generally will have a higher degree of market price observability and a lesser degree of judgment used in measuring fair value.
Financial instruments measured and reported at fair value are classified and disclosed based on the observability of inputs used in the determination, as follows:
| • | Level 1: Generally includes only unadjusted quoted prices that are available in active markets for identical financial instruments as of the reporting date. |
| • | Level 2: Pricing inputs include quoted prices in active markets for similar instruments, quoted prices in less active or inactive markets for identical or similar instruments where multiple price quotes can be obtained, and other observable inputs, such as interest rates, yield curves, credit risks, and default rates. |
| • | Level 3: Pricing inputs are unobservable for the financial instruments and include situations where there is little, if any, market activity for the financial instrument. These inputs require significant judgment or estimation by management of third-parties when determining fair value and generally represent anything that does not meet the criteria of Levels 1 and 2. |
The estimated value of each asset reported at fair value using Level 3 inputs is determined by an internal committee composed of members of senior management of our Manager, including our Chief Executive Officer, Chief Financial Officer, and other senior officers.
Certain of our other assets are reported at fair value either (i) on a recurring basis, as of each quarter-end, or (ii) on a nonrecurring basis, as a result of impairment or other events. Our assets that are recorded at fair value are discussed further in Note 15. We generally value our assets recorded at fair value by either (i) discounting expected cash flows based on assumptions regarding the collection of principal and interest and estimated market rates, or (ii) obtaining assessments from third-party dealers. For collateral-dependent loans that are identified as impaired, we measure impairment by comparing our Manager’s estimation of the fair value of the underlying collateral, less costs to sell, to the book value of the respective loan. These valuations may require significant judgments, which include assumptions regarding capitalization rates, leasing, creditworthiness of major tenants, occupancy rates, availability of financing, exit plan, loan sponsorship, actions of other lenders, and other factors deemed necessary by our Manager.
We are also required by GAAP to disclose fair value information about financial instruments, that are not otherwise reported at fair value in our consolidated balance sheet, to the extent it is practicable to estimate a fair value for those instruments. These disclosure requirements exclude certain financial instruments and all non-financial instruments.
F-14
Table of Contents
Blackstone Mortgage Trust, Inc.
Notes to Consolidated Financial Statements (continued)
The following methods and assumptions are used to estimate the fair value of each class of financial instruments, for which it is practicable to estimate that value:
| • | Cash and cash equivalents: The carrying amount of cash and cash equivalents approximates fair value. |
| • | Restricted cash: The carrying amount of restricted cash approximates fair value. |
| • | Loans receivable, net: The fair values of these loans were estimated by our Manager based on a discounted cash flow methodology, taking into consideration various factors including capitalization rates, discount rates, leasing, occupancy rates, availability and cost of financing, exit plan, sponsorship, actions of other lenders, and indications of market value from other market participants. |
| • | Derivative financial instruments: The fair value of our foreign currency and interest rate contracts was estimated using advice from a third-party derivative specialist, based on contractual cash flows and observable inputs comprising foreign currency rates and credit spreads. |
| • | Secured debt agreements, net: The fair value of these instruments was estimated based on the rate at which a similar credit facility would currently be priced. |
| • | Loan participations sold, net: The fair value of these instruments was estimated based on the value of the related loan receivable asset. |
| • | Securitized debt obligations, net: The fair value of these instruments was estimated by utilizing third-party pricing service providers. In determining the value of a particular investment, pricing service providers may use broker-dealer quotations, reported trades, or valuation estimates from their internal pricing models to determine the reported price. |
| • | Convertible notes, net: Each series of the convertible notes is actively traded and their fair values were obtained using quoted market prices. |
Income Taxes
Our financial results generally do not reflect provisions for current or deferred income taxes on our REIT taxable income. We believe that we operate in a manner that will continue to allow us to be taxed as a REIT and, as a result, we generally do not expect to pay substantial corporate level taxes other than those payable by our taxable REIT subsidiaries. If we were to fail to meet these requirements, we may be subject to federal, state, and local income tax on current and past income, and penalties. Refer to Note 13 for additional information.
Stock-Based Compensation
Our stock-based compensation consists of awards issued to our Manager and certain individuals employed by an affiliate of our Manager that vest over the life of the awards, as well as deferred stock units issued to certain members of our Board of Directors. Stock-based compensation expense is recognized for these awards in net income on a variable basis over the applicable vesting period of the awards, based on the value of our class A common stock. Refer to Note 14 for additional information.
Earnings per Share
Basic earnings per share, or Basic EPS, is computed in accordance with the two-class method and is based on the net earnings allocable to our class A common stock, including restricted class A common stock and deferred stock units, divided by the weighted-average number of shares of our class A common stock, including restricted class A common stock and deferred stock units outstanding during the period. Our restricted class A common stock is considered a participating security, as defined by GAAP, and has been included in our Basic EPS under the two- class method as these restricted shares have the same rights as our other shares of class A common stock, including participating in any gains or losses.
F-15
Table of Contents
Blackstone Mortgage Trust, Inc.
Notes to Consolidated Financial Statements (continued)
Diluted earnings per share, or Diluted EPS, is determined using the treasury stock method, and is based on the net earnings allocable to our class A common stock, including restricted class A common stock and deferred stock units, divided by the weighted-average number of shares of our class A common stock, including restricted class A common stock and deferred stock units. Refer to Note 11 for additional discussion of earnings per share.
Foreign Currency
In the normal course of business, we enter into transactions not denominated in United States, or U.S., dollars. Foreign exchange gains and losses arising on such transactions are recorded as a gain or loss in our consolidated statements of operations. In addition, we consolidate entities that have a non-U.S. dollar functional currency. Non-U.S. dollar denominated assets and liabilities are translated to U.S. dollars at the exchange rate prevailing at the reporting date and income, expenses, gains, and losses are translated at the average exchange rate over the applicable period. Cumulative translation adjustments arising from the translation of non-U.S. dollar denominated subsidiaries are recorded in other comprehensive income (loss).
Underwriting Commissions and Offering Costs
Underwriting commissions and offering costs incurred in connection with common stock offerings are reflected as a reduction of additional paid-in capital. Costs incurred that are not directly associated with the completion of a common stock offering are expensed when incurred.
Recent Accounting Pronouncements
In August 2017, the FASB issued ASU 2017-12 “Derivatives and Hedging Topic 815: Targeted Improvements to Accounting for Hedging Activities,” or ASU 2017-12. ASU 2017-12 is intended to better align an entity’s financial reporting for hedging activities with the economic objectives of those activities. Upon adoption of ASU 2017-12, the cumulative ineffectiveness that has previously been recognized on existing cash flow and net investment hedges will be adjusted and removed from beginning retained earnings and placed in accumulated other comprehensive income (loss). We adopted ASU 2017-12 in the third quarter of 2017, which did not have an impact on our financial statements as we had not previously recognized any hedge ineffectiveness related to our existing cash flow and net investment hedges. In future periods, for hedges that are deemed effective, we will no longer need to bifurcate hedges into an effective and ineffective portion, and all gains or losses on effective hedges will be recognized in other comprehensive income (loss).
In November 2016, the FASB issued ASU 2016-18 “Statement of Cash Flows (Topic 230): Restricted Cash,” or ASU 2016-18. ASU 2016-18 is intended to clarify how entities present restricted cash in the statement of cash flows. The guidance requires entities to show the changes in the total of cash and cash equivalents and restricted cash in the statement of cash flows. As a result, entities will no longer present transfers between cash and cash equivalents and restricted cash in the statement of cash flows. We adopted ASU 2016-18 in the second quarter of 2017 and applied the guidance retrospectively to our prior period consolidated statement of cash flows.
In June 2016, the FASB issued ASU 2016-13 “Financial Instruments – Credit Losses – Measurement of Credit Losses on Financial Instruments (Topic 326),” or ASU 2016-13. ASU 2016-13 significantly changes how entities will measure credit losses for most financial assets and certain other instruments that are not measured at fair value through net income. ASU 2016-13 will replace the “incurred loss” model under existing guidance with an “expected loss” model for instruments measured at amortized cost, and require entities to record allowances for available-for-sale debt securities rather than reduce the carrying amount, as they do today under the other-than-temporary impairment model. It also simplifies the accounting model for purchased credit-impaired debt securities and loans. ASU 2016-13 is effective for fiscal years beginning after December 15, 2019 and is to be
F-16
Table of Contents
Blackstone Mortgage Trust, Inc.
Notes to Consolidated Financial Statements (continued)
adopted through a cumulative-effect adjustment to retained earnings as of the beginning of the first reporting period in which the guidance is effective. While we are currently evaluating the impact ASU 2016-13 will have on our consolidated financial statements, we expect that the adoption will result in an increased amount of provisions for potential loan losses as well as the recognition of such provisions earlier in the lending cycle. We currently do not have any provision for loan losses on our consolidated financial statements.
In May 2014, the FASB issued ASU 2014-09, “Revenue from Contracts with Customers (Topic 606),” or ASU 2014-09. ASU 2014-09 broadly amends the accounting guidance for revenue recognition. ASU 2014-09 is effective for the first interim or annual period beginning after December 15, 2017, and is to be applied retrospectively. We do not anticipate that the adoption of ASU 2014-09 will have a material impact on our consolidated financial statements.
3. LOANS RECEIVABLE, NET
The following table details overall statistics for our loans receivable portfolio ($ in thousands):
| December 31, 2017 |
December 31, 2016 |
|||||||
| Number of loans |
110 | 107 | ||||||
| Principal balance |
$ | 10,108,226 | $ | 8,727,218 | ||||
| Net book value |
$ | 10,056,732 | $ | 8,692,978 | ||||
| Unfunded loan commitments(1) |
$ | 1,573,107 | $ | 882,472 | ||||
| Weighted-average cash coupon(2) |
5.55 | % | 5.01 | % | ||||
| Weighted-average all-in yield(2) |
5.95 | % | 5.36 | % | ||||
| Weighted-average maximum maturity (years)(3) |
3.5 | 3.2 | ||||||
| (1) | Unfunded commitments will primarily be funded to finance property improvements or lease-related expenditures by the borrowers. These future commitments will be funded over the term of each loan, subject in certain cases to an expiration date. |
| (2) | As of December 31, 2017, our floating rate loans were indexed to various benchmark rates, with 92% of floating rate loans by principal balance indexed to USD LIBOR. As of December 31, 2016, our floating rate loans were indexed to various benchmark rates, with 84% of floating rate loans indexed to USD LIBOR. In addition, $216.3 million of our floating rate loans earned interest based on floors that are above the applicable index, with an average floor of 1.27%, as of December 31, 2016. In addition to cash coupon, all-in yield includes the amortization of deferred origination and extension fees, loan origination costs, and purchase discounts, as well as the accrual of exit fees. Cash coupon and all-in yield assume applicable floating benchmark rates as of December 31, 2017 for weighted-average calculation. |
| (3) | Maximum maturity assumes all extension options are exercised by the borrower, however our loans may be repaid prior to such date. As of December 31, 2017, 75% of our loans by principal balance were subject to yield maintenance or other prepayment restrictions and 25% were open to repayment by the borrower without penalty. As of December 31, 2016, 64% of our loans were subject to yield maintenance or other prepayment restrictions and 36% were open to repayment by the borrower without penalty. |
F-17
Table of Contents
Blackstone Mortgage Trust, Inc.
Notes to Consolidated Financial Statements (continued)
Activity relating to our loans receivable portfolio was as follows ($ in thousands):
| Principal Balance |
Deferred Fees / Other Items(1) |
Net Book Value |
||||||||||
| December 31, 2015 |
$ | 9,108,361 | $ | (31,354) | $ | 9,077,007 | ||||||
| Loan fundings |
3,151,882 | — | 3,151,882 | |||||||||
| Loan repayments |
(3,374,622 | ) | — | (3,374,622 | ) | |||||||
| Unrealized (loss) gain on foreign currency translation |
(158,403 | ) | 1,466 | (156,937 | ) | |||||||
| Deferred fees and other items |
— | (44,697 | ) | (44,697 | ) | |||||||
| Amortization of fees and other items |
— | 40,345 | 40,345 | |||||||||
|
|
|
|
|
|
|
|||||||
| December 31, 2016 |
$ | 8,727,218 | $ | (34,240 | ) | $ | 8,692,978 | |||||
|
|
|
|
|
|
|
|||||||
| Loan fundings |
4,072,786 | — | 4,072,786 | |||||||||
| Loan repayments |
(2,828,610 | ) | — | (2,828,610 | ) | |||||||
| Unrealized gain (loss) on foreign currency translation |
136,832 | (186 | ) | 136,646 | ||||||||
| Deferred fees and other items |
— | (55,441 | ) | (55,441 | ) | |||||||
| Amortization of fees and other items |
— | 38,373 | 38,373 | |||||||||
|
|
|
|
|
|
|
|||||||
| December 31, 2017 |
$ | 10,108,226 | $ | (51,494 | ) | $ | 10,056,732 | |||||
|
|
|
|
|
|
|
|||||||
| (1) | Other items primarily consist of purchase discounts or premiums, exit fees, and deferred origination expenses. |
F-18
Table of Contents
Blackstone Mortgage Trust, Inc.
Notes to Consolidated Financial Statements (continued)
The tables below detail the property type and geographic distribution of the properties securing the loans in our portfolio ($ in thousands):
| December 31, 2017 |
||||||||||||||||
| Property Type |
Number of Loans |
Net Book Value |
Total Loan Exposure(1) |
Percentage of Portfolio |
||||||||||||
| Office |
53 | $ | 5,773,972 | $ | 5,807,170 | 53 | % | |||||||||
| Hotel |
15 | 1,830,568 | 1,905,497 | 17 | ||||||||||||
| Multifamily |
25 | 1,220,423 | 1,228,959 | 11 | ||||||||||||
| Retail |
6 | 487,473 | 940,980 | 8 | ||||||||||||
| Condominium |
2 | 142,342 | 268,751 | 2 | ||||||||||||
| Other |
9 | 601,954 | 942,251 | 9 | ||||||||||||
|
|
|
|
|
|
|
|
|
|||||||||
| 110 | $ | 10,056,732 | $ | 11,093,608 | 100 | % | ||||||||||
|
|
|
|
|
|
|
|
|
|||||||||
| Geographic Location |
Number of Loans |
Net Book Value |
Total Loan Exposure(1) |
Percentage of Portfolio |
||||||||||||
| United States |
||||||||||||||||
| Northeast |
26 | $ | 2,857,948 | $ | 2,871,219 | 26 | % | |||||||||
| West |
29 | 2,672,069 | 2,816,276 | 24 | ||||||||||||
| Southeast |
17 | 2,007,202 | 2,470,992 | 22 | ||||||||||||
| Midwest |
9 | 856,559 | 862,578 | 8 | ||||||||||||
| Southwest |
10 | 380,204 | 380,120 | 3 | ||||||||||||
| Northwest |
2 | 283,381 | 286,221 | 3 | ||||||||||||
|
|
|
|
|
|
|
|
|
|||||||||
| Subtotal |
93 | 9,057,363 | 9,687,406 | 86 | ||||||||||||
| International |
||||||||||||||||
| United Kingdom |
6 | 440,317 | 794,789 | 7 | ||||||||||||
| Canada |
7 | 415,893 | 412,343 | 4 | ||||||||||||
| Belgium |
1 | 73,779 | 74,431 | 1 | ||||||||||||
| Germany |
1 | 12,237 | 67,399 | 1 | ||||||||||||
| Netherlands |
2 | 57,143 | 57,240 | 1 | ||||||||||||
|
|
|
|
|
|
|
|
|
|||||||||
| Subtotal |
17 | 999,369 | 1,406,202 | 14 | ||||||||||||
|
|
|
|
|
|
|
|
|
|||||||||
| Total |
110 | $ | 10,056,732 | $ | 11,093,608 | 100 | % | |||||||||
|
|
|
|
|
|
|
|
|
|||||||||
| (1) | In certain instances, we finance our loans through the non-recourse sale of a senior loan interest that is not included in our consolidated financial statements. See Note 2 for further discussion. Total loan exposure encompasses the entire loan we originated and financed, including $985.4 million of such non-consolidated senior interests as of December 31, 2017. |
F-19
Table of Contents
Blackstone Mortgage Trust, Inc.
Notes to Consolidated Financial Statements (continued)
| December 31, 2016 |
||||||||||||||
| Property Type |
Number of Loans |
Net Book Value |
Total Loan Exposure(1) |
Percentage of Portfolio |
||||||||||
| Office |
55 | $ | 4,800,609 | $ | 4,889,456 | 50 | % | |||||||
| Hotel |
18 | 1,889,732 | 1,957,334 | 20 | ||||||||||
| Retail |
9 | 769,813 | 1,173,592 | 12 | ||||||||||
| Multifamily |
17 | 817,387 | 819,781 | 8 | ||||||||||
| Condominium |
2 | 66,070 | 258,360 | 3 | ||||||||||
| Other |
6 | 349,367 | 658,211 | 7 | ||||||||||
|
|
|
|
|
|
|
|
||||||||
| 107 | $ | 8,692,978 | $ | 9,756,734 | 100 | % | ||||||||
|
|
|
|
|
|
|
|
||||||||
| Geographic Location |
Number of Loans |
Net Book Value |
Total Loan Exposure(1) |
Percentage of Portfolio |
||||||||||||
| United States |
||||||||||||||||
| Northeast |
26 | $ | 2,548,257 | $ | 2,562,149 | 26 | % | |||||||||
| Southeast |
21 | 1,492,530 | 1,899,748 | 19 | ||||||||||||
| West |
22 | 1,628,811 | 1,828,667 | 19 | ||||||||||||
| Midwest |
7 | 695,713 | 698,093 | 7 | ||||||||||||
| Southwest |
8 | 380,639 | 379,766 | 4 | ||||||||||||
| Northwest |
3 | 227,747 | 293,564 | 3 | ||||||||||||
|
|
|
|
|
|
|
|
|
|||||||||
| Subtotal |
87 | 6,973,697 | 7,661,987 | 78 | ||||||||||||
| International |
||||||||||||||||
| United Kingdom |
9 | 977,136 | 1,305,816 | 13 | ||||||||||||
| Canada |
8 | 487,835 | 483,923 | 5 | ||||||||||||
| Germany |
1 | 204,241 | 254,644 | 3 | ||||||||||||
| Netherlands |
2 | 50,069 | 50,364 | 1 | ||||||||||||
|
|
|
|
|
|
|
|
|
|||||||||
| Subtotal |
20 | 1,719,281 | 2,094,747 | 22 | ||||||||||||
|
|
|
|
|
|
|
|
|
|||||||||
| Total |
107 | $ | 8,692,978 | $ | 9,756,734 | 100 | % | |||||||||
|
|
|
|
|
|
|
|
|
|||||||||
| (1) | In certain instances, we finance our loans through the non-recourse sale of a senior loan interest that is not included in our consolidated financial statements. See Note 2 for further discussion. Total loan exposure encompasses the entire loan we originated and financed, including $1.0 billion of such non-consolidated senior interests as of December 31, 2016. |
Loan Risk Ratings
As further described in Note 2, our Manager evaluates our loan portfolio on a quarterly basis. In conjunction with our quarterly loan portfolio review, our Manager assesses the risk factors of each loan, and assigns a risk rating based on several factors. Factors considered in the assessment include, but are not limited to, risk of loss, current LTV, debt yield, collateral performance, structure, exit plan, and sponsorship. Loans are rated “1” (less risk) through “5” (greater risk), which ratings are defined in Note 2.
F-20
Table of Contents
Blackstone Mortgage Trust, Inc.
Notes to Consolidated Financial Statements (continued)
The following table allocates the principal balance and net book value of our loans receivable based on our internal risk ratings ($ in thousands):
| December 31, 2017 |
December 31, 2016 | ||||||||||||||||||||||||||||||||
| Risk |
Number of Loans |
Net Book Value |
Total Loan Exposure(1) |
Risk |
Number of Loans |
Net Book Value |
Total Loan Exposure(1) | ||||||||||||||||||||||||||
| 1 |
1 | $ | 31,842 | $ | 31,890 | 1 |
8 | $ | 361,100 | $ | 361,574 | ||||||||||||||||||||||
| 2 |
41 | 3,512,709 | 3,521,701 | 2 |
52 | 4,011,992 | 4,083,678 | ||||||||||||||||||||||||||
| 3 |
67 | 6,491,617 | 7,519,465 | 3 |
46 | 4,299,026 | 5,290,668 | ||||||||||||||||||||||||||
| 4 |
1 | 20,564 | 20,552 | 4 |
1 | 20,860 | 20,814 | ||||||||||||||||||||||||||
| 5 |
— | — | — | 5 |
— | — | — | ||||||||||||||||||||||||||
|
|
|
|
|
|
|
|
|
|
|
|
|
||||||||||||||||||||||
| 110 | $ | 10,056,732 | $ | 11,093,608 | 107 | $ | 8,692,978 | $ | 9,756,734 | ||||||||||||||||||||||||
|
|
|
|
|
|
|
|
|
|
|
|
|
||||||||||||||||||||||
| (1) | In certain instances, we finance our loans through the non-recourse sale of a senior loan interest that is not included in our consolidated financial statements. See Note 2 for further discussion. Total loan exposure encompasses the entire loan we originated and financed, including $985.4 million and $1.0 billion of such non-consolidated senior interests as of December 31, 2017 and December 31, 2016, respectively. |
The weighted-average risk rating of our total loan exposure was 2.7 and 2.5 as of December 31, 2017 and December 31, 2016, respectively. The increase in weighted-average risk rating was primarily driven by repayments of loans with lower risk ratings, and not rating downgrades in the existing portfolio.
We did not have any impaired loans, nonaccrual loans, or loans in maturity default as of December 31, 2017 or 2016.
Multifamily Joint Venture
As discussed in Note 2, we entered into a Multifamily Joint Venture in April 2017. As of December 31, 2017, our Multifamily Joint Venture held $182.2 million of loans, which are included in the loan disclosures above. Refer to Note 2 for additional discussion of our Multifamily Joint Venture.
4. EQUITY INVESTMENT IN UNCONSOLIDATED SUBSIDIARY
Our equity investment in unconsolidated subsidiary consisted solely of our carried interest in CTOPI, a fund formerly sponsored and managed by an affiliate of our Manager. The investment was fully realized as of December 31, 2016 and we no longer have any investments in unconsolidated subsidiaries on our consolidated financial statements.
Our carried interest in CTOPI entitled us to earn promote revenue in an amount equal to 17.7% of the fund’s profits, after a 9% preferred return and 100% return of capital to the CTOPI partners. During the years ended December 31, 2016 and 2015, we recognized $3.2 million and $11.8 million, respectively, of promote income from CTOPI in respect of our carried interest and recorded such amounts as income in our consolidated statement of operations.
CTOPI Incentive Management Fee Grants
In January 2011, we created a management compensation pool for employees equal to 45% of the CTOPI promote distributions received by us. During the years ended December 31, 2016 and 2015, we recognized
F-21
Table of Contents
Blackstone Mortgage Trust, Inc.
Notes to Consolidated Financial Statements (continued)
$1.6 million and $5.4 million, respectively, of expenses under the CTOPI incentive plan. Such amounts were recognized as a component of general and administrative expenses in our consolidated statements of operations.
5. OTHER ASSETS AND LIABILITIES
The following table details the components of our other assets ($ in thousands):
| December 31, 2017 |
December 31, 2016 |
|||||||
| Loan portfolio payments held by servicer(1) |
$ | 54,759 | $ | 5,765 | ||||
| Accrued interest receivable |
38,573 | 32,871 | ||||||
| Collateral deposited under derivative agreements |
4,120 | 79 | ||||||
| Derivative assets |
1,214 | 4,086 | ||||||
| Prepaid expenses |
798 | 803 | ||||||
| Prepaid taxes |
31 | 16 | ||||||
| Other |
80 | 450 | ||||||
|
|
|
|
|
|||||
| Total |
$ | 99,575 | $ | 44,070 | ||||
|
|
|
|
|
|||||
| (1) | Represents loan principal and interest payments held by our third-party loan servicer as of the balance sheet date which were remitted to us during the subsequent remittance cycle. |
The following table details the components of our other liabilities ($ in thousands):
| December 31, 2017 |
December 31, 2016 |
|||||||
| Accrued dividends payable |
$ | 66,888 | $ | 58,615 | ||||
| Secured debt repayments pending servicer remittance(1) |
38,456 | 5,372 | ||||||
| Accrued management and incentive fees payable |
14,284 | 12,798 | ||||||
| Accrued interest payable |
14,162 | 9,049 | ||||||
| Derivative liabilities |
4,911 | 210 | ||||||
| Accounts payable and other liabilities |
2,125 | 1,775 | ||||||
|
|
|
|
|
|||||
| Total |
$ | 140,826 | $ | 87,819 | ||||
|
|
|
|
|
|||||
| (1) | Represents pending transfers from our third-party loan servicer that were remitted to our banking counterparties during the subsequent remittance cycle. |
F-22
Table of Contents
Blackstone Mortgage Trust, Inc.
Notes to Consolidated Financial Statements (continued)
6. SECURED DEBT AGREEMENTS, NET
Our secured debt agreements include credit facilities, the GE portfolio acquisition facility, asset-specific financings, and a revolving credit agreement. The following table details our secured debt agreements ($ in thousands):
| Secured Debt Agreements Borrowings Outstanding |
||||||||
| December 31, 2017 |
December 31, 2016 |
|||||||
| Credit facilities |
$ | 4,068,249 | $ | 3,572,837 | ||||
| GE portfolio acquisition facility |
703,423 | 1,479,582 | ||||||
| Asset-specific financings |
518,864 | 679,207 | ||||||
| Revolving credit agreement |
— | — | ||||||
|
|
|
|
|
|||||
| Total secured debt agreements |
$ | 5,290,536 | $ | 5,731,626 | ||||
|
|
|
|
|
|||||
| Deferred financing costs(1) |
(16,681 | ) | (15,272 | ) | ||||
|
|
|
|
|
|||||
| Net book value of secured debt |
$ | 5,273,855 | $ | 5,716,354 | ||||
|
|
|
|
|
|||||
| (1) | Costs incurred in connection with our secured debt agreements are recorded on our consolidated balance sheet when incurred and recognized as a component of interest expense over the life of each related agreement. |
F-23
Table of Contents
Blackstone Mortgage Trust, Inc.
Notes to Consolidated Financial Statements (continued)
Credit Facilities
During the year ended December 31, 2017, we (i) added two new credit facilities related to our Multifamily Joint Venture, providing an aggregate additional $450.0 million of credit capacity, (ii) increased the maximum facility size of two of our existing credit facilities, providing an additional £250.0 million and €250.0 million of credit capacity, respectively, and (iii) converted one of our asset-specific financings to a $500.0 million credit facility. The following tables detail our credit facilities ($ in thousands):
| December 31, 2017 | ||||||||||||||||||||
| Maximum Facility Size(1) |
Collateral Assets(2) |
Credit Borrowings | ||||||||||||||||||
| Lender |
Potential(3) | Outstanding | Available(3) | |||||||||||||||||
| Wells Fargo |
$ | 2,000,000 | $ | 1,680,325 | $ | 1,289,135 | $ | 1,170,801 | $ | 118,334 | ||||||||||
| MetLife |
1,000,000 | 1,039,231 | 807,164 | 807,164 | — | |||||||||||||||
| Bank of America |
750,000 | 765,049 | 573,542 | 573,542 | — | |||||||||||||||
| JP Morgan(4) |
500,000 | 579,218 | 443,496 | 319,755 | 123,741 | |||||||||||||||
| Société Générale(5) |
480,200 | 373,181 | 300,871 | 300,871 | — | |||||||||||||||
| Deutsche Bank |
500,000 | 399,203 | 295,743 | 295,743 | — | |||||||||||||||
| Citibank(6) |
800,125 | 455,433 | 354,354 | 240,881 | 113,473 | |||||||||||||||
| Morgan Stanley(7) |
675,650 | 591,168 | 456,344 | 216,044 | 240,300 | |||||||||||||||
| Bank of America - Multi. JV(8) |
200,000 | 106,950 | 85,560 | 85,560 | — | |||||||||||||||
| Goldman Sachs - Multi. JV(8) |
250,000 | 75,225 | 57,888 | 57,888 | — | |||||||||||||||
|
|
|
|
|
|
|
|
|
|
|
|||||||||||
| $ | 7,155,975 | $ | 6,064,983 | $ | 4,664,097 | $ | 4,068,249 | $ | 595,848 | |||||||||||
|
|
|
|
|
|
|
|
|
|
|
|||||||||||
| December 31, 2016 | ||||||||||||||||||||
| Maximum Facility Size(1) |
Collateral Assets(2) |
Credit Borrowings | ||||||||||||||||||
| Lender |
Potential(3) | Outstanding | Available(3) | |||||||||||||||||
| Wells Fargo |
$ | 2,000,000 | $ | 1,718,874 | $ | 1,339,942 | $ | 1,107,733 | $ | 232,209 | ||||||||||
| MetLife |
1,000,000 | 1,106,017 | 862,454 | 862,454 | — | |||||||||||||||
| Bank of America |
750,000 | 794,881 | 617,694 | 617,694 | — | |||||||||||||||
| JP Morgan(4) |
500,000 | 550,560 | 420,414 | 316,219 | 104,195 | |||||||||||||||
| Morgan Stanley(7) |
308,500 | 344,056 | 272,221 | 231,930 | 40,291 | |||||||||||||||
| Citibank(6) |
500,000 | 508,989 | 394,677 | 229,629 | 165,048 | |||||||||||||||
| Société Générale(5) |
420,680 | 274,351 | 207,178 | 207,178 | — | |||||||||||||||
|
|
|
|
|
|
|
|
|
|
|
|||||||||||
| $ | 5,479,180 | $ | 5,297,728 | $ | 4,114,580 | $ | 3,572,837 | $ | 541,743 | |||||||||||
|
|
|
|
|
|
|
|
|
|
|
|||||||||||
| (1) | Maximum facility size represents the largest amount of borrowings available under a given facility once sufficient collateral assets have been approved by the lender and pledged by us. |
| (2) | Represents the principal balance of the collateral assets. |
| (3) | Potential borrowings represents the total amount we could draw under each facility based on collateral already approved and pledged. When undrawn, these amounts are immediately available to us at our sole discretion under the terms of each credit facility. |
| (4) | As of December 31, 2017 and December 31, 2016, the JP Morgan maximum facility size was composed of a general $500.0 million facility size, under which U.S. Dollars and British Pounds Sterling borrowings are contemplated. |
| (5) | As of December 31, 2017 and December 31, 2016, the Société Générale maximum facility size was composed of a €400.0 million facility size, which translated to $480.2 million and $420.7 million, respectively. Borrowings denominated in U.S. Dollars, British Pounds Sterling, and Euros are contemplated under this facility. |
| (6) | As of December 31, 2017, the Citibank maximum facility size was composed of a $500.0 million facility denominated in U.S. Dollars plus a €250.0 million facility, which translated to $300.1 million as of such date, which contemplated borrowings denominated in British Pounds Sterling and Euros. As of December 31, 2016, the maximum facility size was composed of a general $500.0 million facility. |
| (7) | As of December 31, 2017, the Morgan Stanley maximum facility size was composed of a £500.0 million facility size, which translated to $675.7 million as of such date. As of December 31, 2016, the maximum facility size was composed of a £250.0 million facility size, which translated to $308.5 million as of such date. Borrowings denominated in U.S. Dollars, British Pounds Sterling, and Euros are contemplated under this facility. |
| (8) | These facilities finance the loan investments of our consolidated Multifamily Joint Venture. Refer to Note 2 to our consolidated financial statements for additional discussion of our Multifamily Joint Venture. |
F-24
Table of Contents
Blackstone Mortgage Trust, Inc.
Notes to Consolidated Financial Statements (continued)
The weighted-average outstanding balance of our credit facilities was $4.1 billion for the year ended December 31, 2017. As of December 31, 2017, we had aggregate borrowings of $4.1 billion outstanding under our credit facilities, with a weighted-average cash coupon of LIBOR plus 1.90% per annum, a weighted-average all-in cost of credit, including associated fees and expenses, of LIBOR plus 2.12% per annum, and a weighted-average advance rate of 78.7%. As of December 31, 2017, outstanding borrowings under these facilities had a weighted-average maturity, excluding extension options and term-out provisions, of 1.5 years.
The weighted-average outstanding balance of our credit facilities was $3.0 billion for the year ended December 31, 2016. As of December 31, 2016, we had aggregated borrowings of $3.6 billion outstanding under our credit facilities, with a weighted-average cash coupon of LIBOR plus 1.82% per annum, a weighted-average all-in cost of credit, including associated fees and expenses, of LIBOR plus 2.02% per annum, and a weighted-average advance rate of 79.1%. As of December 31, 2016, outstanding borrowings under these facilities had a weighted-average maturity, excluding extension options and term-out provisions, of 1.5 years.
Borrowings under each facility are subject to the initial approval of eligible collateral loans by the lender and the maximum advance rate and pricing rate of individual advances are determined with reference to the attributes of the respective collateral loan.
The following tables outline the key terms of our credit facilities as of December 31, 2017:
| Lender |
Currency | Guarantee(1) | Margin Call(2) | Term/Maturity | ||||
| Wells Fargo |
$ | 25% | Collateral marks only | Term matched(3) | ||||
| MetLife |
$ | 50% | Collateral marks only | April 21, 2023(4) | ||||
| Bank of America |
$ | 50% | Collateral marks only | May 21, 2021(5) | ||||
| JP Morgan |
$ / £ | 50% | Collateral marks only | January 7, 2020 | ||||
| Société Générale |
$ / £ / € | 25% | Collateral marks only | Term matched(3) | ||||
| Deutsche Bank |
$ | 35% | Collateral marks only | Term matched(3) | ||||
| Citibank |
$ / £ / € | 25% | Collateral marks only | Term matched(3) | ||||
| Morgan Stanley |
$ / £ / € | 25% | Collateral marks only | March 3, 2020 | ||||
| Bank of America - Multi. JV(6) |
$ | 43% | Collateral marks only | July 19, 2021 | ||||
| Goldman Sachs - Multi. JV(6) |
$ | 25% | Collateral marks only | July 12, 2020 |
| (1) | Other than amounts guaranteed based on specific collateral asset types, borrowings under our credit facilities are non-recourse to us. |
| (2) | Margin call provisions under our credit facilities do not permit valuation adjustments based on capital markets events, and are limited to collateral-specific credit marks. |
| (3) | These credit facilities have various availability periods during which new advances can be made and which are generally subject to each lender’s discretion. Maturity dates for advances outstanding are tied to the term of each respective collateral asset. |
| (4) | Includes five one-year extension options which may be exercised at our sole discretion. |
| (5) | Includes two one-year extension options which may be exercised at our sole discretion. |
| (6) | These facilities finance the loan investments of our consolidated Multifamily Joint Venture. Refer to Note 2 for additional discussion of our Multifamily Joint Venture. |
F-25
Table of Contents
Blackstone Mortgage Trust, Inc.
Notes to Consolidated Financial Statements (continued)
|
Currency |
Outstanding Borrowings |
Potential Borrowings(1) |
Index | Rate(2) | Advance Rate(3) | |||||||||
| $ | $ | 3,798,619 | $ | 4,275,789 | 1-month USD LIBOR | L+1.87% | 78.6% | |||||||
| € | € | 66,144 | € | 87,744 | 3-month EURIBOR | L+2.24% | 80.0% | |||||||
| £ | £ | 140,771 | £ | 209,406 | 3-month GBP LIBOR | L+2.24% | 78.6% | |||||||
|
|
|
|
|
|
| |||||||||
| $ | 4,068,249 | $ | 4,664,097 | L+1.90% | 78.7% | |||||||||
| (1) | Potential borrowings represents the total amount we could draw under each facility based on collateral already approved and pledged. When undrawn, these amounts are immediately available to us at our sole discretion under the terms of each credit facility. |
| (2) | Represents weighted-average cash coupon based on borrowings outstanding. |
| (3) | Represents weighted-average advance rate based on the outstanding principal balance of the collateral assets pledged. |
GE Portfolio Acquisition Facility
During the second quarter of 2015, concurrently with our acquisition of the GE portfolio, we entered into an agreement with Wells Fargo to provide us with secured financing for the acquired portfolio. As of December 31, 2017, this facility provided for $816.3 million of financing, of which $703.4 million was outstanding and an additional $112.9 million was available to finance future loan fundings in the GE portfolio. The GE portfolio acquisition facility is non-revolving and consists of a single master repurchase agreement providing for asset-specific borrowings for each collateral asset.
The asset-specific borrowings under the GE portfolio acquisition facility were advanced at a weighted-average rate of 80% of our purchase price of the collateral assets and are repaid pro rata from collateral asset repayment proceeds. The asset-specific borrowings are currency matched to the collateral assets and accrue interest at a rate equal to the sum of (i) the applicable base rate plus (ii) a margin of 1.75%, which will increase to 1.80% and 1.85% in year four and year five, respectively. As of December 31, 2017, those borrowings were denominated in U.S. Dollars and Canadian Dollars. The asset-specific borrowings are term matched to the underlying collateral assets with an outside maturity date of May 20, 2020, which may be extended pursuant to two one-year extension options. We guarantee obligations under the GE portfolio acquisition facility in an amount equal to the greater of (i) 25% of outstanding asset-specific borrowings, and (ii) $250.0 million. We had outstanding asset-specific borrowings under the GE portfolio acquisition facility of $703.4 million and a weighted-average all-in cost of credit, including associated fees and expenses, of LIBOR plus 1.72% per annum as of December 31, 2017, compared to $1.5 billion of outstanding asset-specific borrowings and a weighted-average all-in cost of credit, including associated fees and expenses, of LIBOR plus 1.83% per annum as of December 31, 2016.
F-26
Table of Contents
Blackstone Mortgage Trust, Inc.
Notes to Consolidated Financial Statements (continued)
Asset-Specific Financings
The following tables detail our asset-specific financings ($ in thousands):
| December 31, 2017 | ||||||||||||||||||||||
| Asset-Specific Financings |
Count | Principal Balance |
Book Value |
Wtd. Avg. Yield/Cost(1) |
Guarantee(2) | Wtd. Avg. Term(3) |
||||||||||||||||
| Collateral assets |
6 | $ | 682,259 | $ | 677,296 | L+4.76 | % | n/a | Dec. 2020 | |||||||||||||
| Financing provided(4) |
6 | $ | 518,864 | $ | 517,088 | L+2.50 | % | $ | 162,475 | Dec. 2020 | ||||||||||||
| (1) | These floating rate loans and related liabilities are indexed to the various benchmark rates relevant in each arrangement in terms of currency and payment frequency. Therefore the net exposure to each benchmark rate is in direct proportion to our net assets indexed to that rate. In addition to cash coupon, yield/cost includes the amortization of deferred origination fees / financing costs. |
| (2) | Other than amounts guaranteed on an asset-by-asset basis, borrowings under our asset-specific financings are non-recourse to us. |
| (3) | The weighted-average term is determined based on the maximum maturity of the corresponding loans, assuming all extension options are exercised by the borrower. Each of our asset-specific financings are term-matched to the corresponding collateral loans. |
| (4) | Borrowings of $394.8 million under these asset specific financings are cross collateralized with related credit facilities with the same lenders. |
| December 31, 2016 | ||||||||||||||||||||||
| Asset-Specific Financings |
Count | Principal Balance |
Book Value |
Wtd. Avg. Yield/Cost(1) |
Guarantee(2) | Wtd. Avg. Term(3) |
||||||||||||||||
| Collateral assets |
7 | $ | 876,083 | $ | 869,417 | L+4.84 | % | n/a | Aug. 2020 | |||||||||||||
| Financing provided(4) |
7 | $ | 679,207 | $ | 676,333 | L+2.60 | % | $ | 231,585 | Aug. 2020 | ||||||||||||
| (1) | These floating rate loans and related liabilities are indexed to the various benchmark rates relevant in each arrangement in terms of currency and payment frequency. Therefore the net exposure to each benchmark rate is in direct proportion to our net assets indexed to that rate. In addition to cash coupon, yield/cost includes the amortization of deferred origination fees / financing costs. |
| (2) | Other than amounts guaranteed on an asset-by-asset basis, borrowings under our asset-specific financings are non-recourse to us. |
| (3) | The weighted-average term is determined based on the maximum maturity of the corresponding loans, assuming all extension options are exercised by the borrower. Each of our asset-specific financings are term-matched to the corresponding collateral loans. |
| (4) | Borrowings of $392.3 million under these asset specific financings are cross collateralized with related credit facilities with the same lenders. |
The weighted-average outstanding balance of our asset-specific financings was $576.4 million for the year ended December 31, 2017 and $584.7 million for the year ended December 31, 2016.
Revolving Credit Agreement
During the second quarter of 2017, we increased the borrowing capacity under our secured revolving credit agreement with Barclays by $125.0 million to $250.0 million. This full recourse facility is designed to finance first mortgage originations for up to six months as a bridge to term financing or syndication. Advances under the agreement are subject to availability under a specified borrowing base and accrue interest at a per annum pricing rate equal to the sum of (i) an applicable base rate or Eurodollar rate and (ii) an applicable margin, in each case, dependent on the applicable type of loan collateral. The maturity date of the facility is April 4, 2020.
F-27
Table of Contents
Blackstone Mortgage Trust, Inc.
Notes to Consolidated Financial Statements (continued)
During the year ended December 31, 2017, the weighted-average outstanding borrowings under the revolving credit agreement were $30.7 million and we recorded interest expense of $3.0 million, including $829,000 of amortization of deferred fees and expenses. As of December 31, 2017, we had no outstanding borrowings under the agreement.
During the year ended December 31, 2016, the weighted-average outstanding borrowings under the revolving credit agreement were $31.6 million and we recorded interest expense of $1.4 million, including $376,000 of amortization of deferred fees and expenses. As of December 31, 2016 we had no outstanding borrowings under the agreement.
Debt Covenants
Each of the guarantees related to our secured debt agreements contain the following uniform financial covenants: (i) our ratio of earnings before interest, taxes, depreciation, and amortization, or EBITDA, to fixed charges, as defined in the agreements, shall be not less than 1.4 to 1.0; (ii) our tangible net worth, as defined in the agreements, shall not be less than $2.2 billion as of each measurement date plus 75% of the net cash proceeds of future equity issuances subsequent to December 31, 2017; (iii) cash liquidity shall not be less than the greater of (x) $10.0 million or (y) 5% of our recourse indebtedness; and (iv) our indebtedness shall not exceed 83.33% of our total assets. As of December 31, 2017 and December 31, 2016, we were in compliance with these covenants.
7. LOAN PARTICIPATIONS SOLD, NET
The financing of a loan by the non-recourse sale of a senior interest in the loan through a participation agreement generally does not qualify as a sale under GAAP. Therefore, in the instance of such sales, we present the whole loan as an asset and the loan participation sold as a liability on our consolidated balance sheet until the loan is repaid. The obligation to pay principal and interest on these liabilities is generally based on the performance of the related loan obligation. The gross presentation of loan participations sold does not impact stockholders’ equity or net income.
F-28
Table of Contents
Blackstone Mortgage Trust, Inc.
Notes to Consolidated Financial Statements (continued)
The following tables detail our loan participations sold ($ in thousands):
| December 31, 2017 | ||||||||||||||||||||||
| Loan Participations Sold |
Count | Principal Balance |
Book Value |
Yield/Cost(1) | Guarantee(2) | Term | ||||||||||||||||
| Total loan |
1 | $ | 141,119 | $ | 138,907 | L+5.94 | % | n/a | Feb. 2022 | |||||||||||||
| Senior participation(3) |
1 | 80,706 | 80,415 | L+4.14 | % | n/a | Feb. 2022 | |||||||||||||||
| December 31, 2016 | ||||||||||||||||||||||
| Loan Participations Sold |
Count | Principal Balance |
Book Value |
Yield/Cost(1) | Guarantee(2) | Term | ||||||||||||||||
| Total loan |
1 | $ | 419,560 | $ | 416,233 | L+4.48 | % | n/a | Dec. 2019 | |||||||||||||
| Senior participation(3)(4) |
1 | 349,633 | 348,077 | L+2.72 | % | $ | 29,616 | Dec. 2019 | ||||||||||||||
| (1) | Our floating rate loans and related liabilities are indexed to the various benchmark rates relevant in each arrangement in terms of currency and payment frequency. Therefore the net exposure to each benchmark rate is in direct proportion to our net assets indexed to that rate. In addition to cash coupon, yield/cost includes the amortization of deferred fees / financing costs. |
| (2) | As of December 31, 2017, our loan participation sold was non-recourse to us. As of December 31, 2016, our loan participation was subject to a related guarantee agreement for £24.0 million ($29.6 million as of December 31, 2016). |
| (3) | During the years ended December 31, 2017 and 2016, we recorded $10.1 million and $13.7 million, respectively, of interest expense related to our loan participations sold, of which $8.4 million and $13.1 million was paid in cash. |
| (4) | The difference between principal balance and book value of loan participations sold is due to deferred financing costs of $291,000 and $1.6 million as of December 31, 2017 and December 31, 2016, respectively. |
8. SECURITIZED DEBT OBLIGATIONS, NET
In the fourth quarter of 2017, we financed a pool of our loans through a collateralized loan obligation, or the CLO, which is consolidated in our financial statements. In the second quarter of 2017, we financed one of our loans through a single asset securitization vehicle, or the Single Asset Securitization, which is also consolidated in our financial statements. The CLO and the Single Asset Securitization have issued securitized debt obligations that are non-recourse to us. Refer to Note 16 for further discussion of our CLO and Single Asset Securitization.
F-29
Table of Contents
Blackstone Mortgage Trust, Inc.
Notes to Consolidated Financial Statements (continued)
The following table details our securitized debt obligations ($ in thousands):
| December 31, 2017 | ||||||||||||||||||||
| Securitized Debt Obligations |
Count | Principal Balance |
Book Value | Wtd. Avg. Yield/Cost(1) |
Term(2) | |||||||||||||||
| Collateralized Loan Obligation |
||||||||||||||||||||
| Collateral assets |
31 | $ | 1,000,000 | $ | 1,000,000 | 5.16 | % | Nov. 2021 | ||||||||||||
| Financing provided |
1 | 817,500 | 808,083 | L+1.76 | % | June 2035 | ||||||||||||||
| Single Asset Securitization |
||||||||||||||||||||
| Collateral assets(3) |
1 | 656,406 | 652,880 | L+3.60 | % | June 2023 | ||||||||||||||
| Financing provided |
1 | 474,620 | 474,328 | L+1.94 | % | June 2033 | ||||||||||||||
| Total |
||||||||||||||||||||
| Collateral assets |
32 | $ | 1,656,406 | $ | 1,652,880 | 5.17 | % | |||||||||||||
|
|
|
|
|
|
|
|
|
|||||||||||||
| Financing provided(4) |
2 | $ | 1,292,120 | $ | 1,282,411 | L+1.83 | % | |||||||||||||
|
|
|
|
|
|
|
|
|
|||||||||||||
| (1) | As of December 31, 2017, 98% of our loans financed by securitized debt obligations earned a floating rate of interest. In addition to cash coupon, all-in yield includes the amortization of deferred origination and extension fees, loan origination costs, purchase discounts, and accrual of exit fees. All-in yield for the total portfolio assume applicable floating benchmark rates for weighted-average calculation. |
| (2) | Loan term represents final maturity, assuming all extension options are exercised by the borrower. Repayments of securitized debt obligations are tied to timing of the related collateral loan asset repayments. The term of these obligations represents the rated final distribution date of the securitizations. |
| (3) | The collateral assets for the Single Asset Securitization include the total loan amount, of which we securitized $500.0 million. |
| (4) | During the year ended December 31, 2017, we recorded $8.5 million of interest expense related to our securitized debt obligations. |
We did not have any securitized debt obligations as of December 31, 2016.
9. CONVERTIBLE NOTES, NET
As of December 31, 2017, the following convertible senior notes, or Convertible Notes, were outstanding ($ in thousands):
| Convertible Notes Issuance |
Face Value | Coupon Rate | All-in Cost(1) | Conversion Rate(2) | Maturity | |||||||||||||
| November 2013 |
$ | 172,500 | 5.25 | % | 5.87 | % | 36.1380 | December 1, 2018 | ||||||||||
| May 2017 |
402,500 | 4.38 | % | 4.85 | % | 28.0324 | May 5, 2022 | |||||||||||
| (1) | Includes issuance costs that are amortized through interest expense over the life of the Convertible Notes using the effective interest method. |
| (2) | Represents the shares of class A common stock per $1,000 principal amount of Convertible Notes, which is equivalent to a conversion price of $27.67 and $35.67 per share of class A common stock, respectively, for the November 2013 and May 2017 convertible notes. As a result of exceeding the cumulative dividend threshold, as defined in the November 2013 convertible notes supplemental indenture, the conversion rate on the November 2013 convertible notes was most recently adjusted on June 28, 2017 from the prior conversion rate of 35.7236 shares of class A common stock per $1,000 principal amount of convertible notes, which was equivalent to a conversion price of $27.99 per share of class A common stock. The cumulative dividend threshold as defined in the May 2017 convertible notes supplemental indenture has not been exceeded as of December 31, 2017. |
F-30
Table of Contents
Blackstone Mortgage Trust, Inc.
Notes to Consolidated Financial Statements (continued)
In May 2017 we issued $287.5 million of convertible notes. In the third quarter of 2017, we issued an additional $115.0 million of convertible notes under the same indenture and with the same terms as the May 2017 convertible notes. Accordingly, as of December 31, 2017, the May 2017 convertible notes had an aggregate outstanding face value of $402.5 million.
The Convertible Notes are convertible at the holders’ option into shares of our class A common stock, only under specific circumstances, prior to the close of business on August 31, 2018 and January 31, 2022, for the November 2013 and May 2017 convertible notes, respectively, at the applicable conversion rate in effect on the conversion date. Thereafter, the Convertible Notes are convertible at the option of the holder at any time until the second scheduled trading day immediately preceding the maturity date. We may not redeem the Convertible Notes prior to maturity. The last reported sale price of our class A common stock of $32.18 on December 29, 2017, the last trading day in the year ended December 31, 2017, was greater than the per share conversion price of the November 2013 convertible notes but less than the per share conversion price of the May 2017 convertible notes. We have the intent and ability to settle each series of the Convertible Notes in cash and, as a result, the Convertible Notes did not have any impact on our diluted earnings per share.
Upon our issuance of the November 2013 convertible notes, we recorded a $9.1 million discount based on the implied value of the conversion option and an assumed effective interest rate of 6.50%, as well as $4.1 million of initial issuance costs. Including the amortization of this discount and the issuance costs, our total cost of the November 2013 convertible notes issuance is 7.16% per annum. Upon our issuance of the May 2017 convertible notes, including our additional issuance in the third quarter of 2017, we recorded a $979,000 discount based on the implied value of the conversion option and an assumed effective interest rate of 4.57%, as well as $8.4 million of initial debt discount and issuance costs. Including the amortization of the discount and issuance costs, our total cost of the May 2017 convertible notes issuance is 4.91% per annum.
The following table details our interest expense related to the Convertible Notes ($ in thousands):
| Year Ended December 31, | ||||||||||||
| 2017 | 2016 | 2015 | ||||||||||
| Cash coupon |
$ | 19,259 | $ | 9,056 | $ | 9,056 | ||||||
| Discount and issuance cost amortization |
4,040 | 2,736 | 2,571 | |||||||||
|
|
|
|
|
|
|
|||||||
| Total interest expense |
$ | 23,299 | $ | 11,792 | $ | 11,627 | ||||||
|
|
|
|
|
|
|
|||||||
The following table details the net book value of our Convertible Notes on our consolidated balance sheets ($ in thousands):
| December 31, 2017 |
December 31, 2016 |
|||||||
| Face value |
$ | 575,000 | $ | 172,500 | ||||
| Unamortized discount |
(10,279 | ) | (5,532 | ) | ||||
| Deferred financing costs |
(810 | ) | (206 | ) | ||||
|
|
|
|
|
|||||
| Net book value |
$ | 563,911 | $ | 166,762 | ||||
|
|
|
|
|
|||||
Accrued interest payable for the Convertible Notes was $3.7 million and $755,000 as of December 31, 2017 and December 31, 2016, respectively. Refer to Note 2 for additional discussion of our accounting policies for the Convertible Notes.
F-31
Table of Contents
Blackstone Mortgage Trust, Inc.
Notes to Consolidated Financial Statements (continued)
10. DERIVATIVE FINANCIAL INSTRUMENTS
The sole objective of our use of derivative financial instruments is to minimize the risks and/or costs associated with our investments and/or financing transactions. These derivatives may or may not qualify as net investment, cash flow, or fair value hedges under the hedge accounting requirements of ASC 815 – “Derivatives and Hedging.” Derivatives not designated as hedges are not speculative and are used to manage our exposure to interest rate movements and other identified risks. For more information on the accounting for designated and non-designated hedges, refer to Note 2.
The use of derivative financial instruments involves certain risks, including the risk that the counterparties to these contractual arrangements do not perform as agreed. To mitigate this risk, we only enter into derivative financial instruments with counterparties that have appropriate credit ratings and are major financial institutions with which we and our affiliates may also have other financial relationships. We do not anticipate that any of the counterparties will fail to meet their obligations.
Net Investment Hedges of Foreign Currency Risk
Certain of our international investments expose us to fluctuations in foreign interest rates and currency exchange rates. These fluctuations may impact the value of our cash receipts and payments in terms of our functional currency, the U.S. Dollar. We use foreign currency forward contracts to protect the value or fix the amount of certain investments or cash flows in terms of the U.S. Dollar.
The following table details our outstanding foreign exchange derivatives that were designated as net investment hedges of foreign currency risk (notional amount in thousands):
| December 31, 2017 |
December 31, 2016 |
|||||||||||||
| Foreign Currency |
Number of |
Notional Amount |
Foreign Currency |
Number of |
Notional Amount |
|||||||||
| Sell GBP Forward |
1 | £ | 112,700 | Sell GBP Forward | 2 | £ | 141,900 | |||||||
| Sell CAD Forward |
1 | C$ | 95,100 | Sell CAD Forward | 2 | C$ | 122,900 | |||||||
| Sell EUR Forward | 1 | € | 44,900 | |||||||||||
Cash Flow Hedges of Interest Rate Risk
Certain of our financing transactions expose us to a fixed versus floating rate mismatch between our assets and liabilities. We use derivative financial instruments, which include interest rate caps and swaps, and may also include interest rate options, floors, and other interest rate derivative contracts, to hedge interest rate risk associated with our borrowings where there is potential for an index mismatch.
The following tables detail our outstanding interest rate derivatives that were designated as cash flow hedges of interest rate risk (notional amount in thousands):
| December 31, 2017 | ||||||||||||||
| Interest Rate |
Number of Instruments |
Notional Amount |
Strike | Index | Wtd.-Avg. Maturity (Years) | |||||||||
| Interest Rate Swaps |
4 | C$ | 108,094 | 1.0 | % | CDOR | 1.4 | |||||||
| Interest Rate Caps |
9 | $ | 204,248 | 2.4 | % | USD LIBOR | 1.5 | |||||||
| Interest Rate Caps |
3 | C$ | 23,370 | 2.0 | % | CDOR | 0.3 | |||||||
F-32
Table of Contents
Blackstone Mortgage Trust, Inc.
Notes to Consolidated Financial Statements (continued)
| December 31, 2016 | ||||||||||||||
| Interest Rate |
Number of Instruments |
Notional Amount |
Strike | Index | Wtd.-Avg. Maturity (Years) | |||||||||
| Interest Rate Swaps |
4 | C$ | 108,271 | 1.0 | % | CDOR | 2.4 | |||||||
| Interest Rate Caps |
21 | $ | 802,256 | 2.0 | % | USD LIBOR | 0.4 | |||||||
| Interest Rate Caps |
5 | C$ | 400,035 | 2.0 | % | CDOR | 0.4 | |||||||
| Interest Rate Caps |
1 | £ | 15,142 | 2.0 | % | GBP LIBOR | 0.3 | |||||||
Amounts reported in accumulated other comprehensive income (loss) related to derivatives will be reclassified to interest expense as interest payments are made on our floating rate debt. During the twelve months following December 31, 2017, we estimate that an additional $619,000 will be reclassified from accumulated other comprehensive income (loss) as an increase to interest income.
Non-designated Hedges
During the years ended December 31, 2017, 2016, and 2015, we recorded losses of $449,000, $1.9 million, and $698,000, respectively, related to non-designated hedges that were reported as a component of interest expense in our consolidated financial statements.
The following tables summarize our non-designated hedges (notional amount in thousands):
| December 31, 2017 |
||||||
| Non-designated Hedges |
Number of Instruments |
Notional Amount |
||||
| Buy GBP / Sell EUR Forward |
1 | € | 12,857 | |||
| December 31, 2016 |
||||||
| Non-designated Hedges |
Number of Instruments |
Notional Amount | ||||
| Interest Rate Caps | 3 | $ | 256,875 | |||
| Interest Rate Caps | 2 | C$ | 37,221 | |||
| Buy GBP / Sell EUR Forward | 1 | € | 12,857 | |||
F-33
Table of Contents
Blackstone Mortgage Trust, Inc.
Notes to Consolidated Financial Statements (continued)
Valuation of Derivative Instruments
The following table summarizes the fair value of our derivative financial instruments ($ in thousands):
| Fair Value of Derivatives in an Asset Position(1) as of |
Fair Value of Derivatives in a Liability Position(2) as of |
|||||||||||||||
| December 31, 2017 | December 31, 2016 | December 31, 2017 | December 31, 2016 | |||||||||||||
| Derivatives designated as |
||||||||||||||||
| Foreign exchange contracts |
$ | — | $ | 3,268 | $ | 4,872 | $ | 210 | ||||||||
| Interest rate derivatives |
1,214 | 331 | — | — | ||||||||||||
|
|
|
|
|
|
|
|
|
|||||||||
| Total |
$ | 1,214 | $ | 3,599 | $ | 4,872 | $ | 210 | ||||||||
|
|
|
|
|
|
|
|
|
|||||||||
| Derivatives not designated as hedging instruments: |
||||||||||||||||
| Foreign exchange contracts |
$ | — | $ | 487 | $ | 39 | $ | — | ||||||||
| Interest rate derivatives |
— | — | — | — | ||||||||||||
|
|
|
|
|
|
|
|
|
|||||||||
| Total |
$ | — | $ | 487 | $ | 39 | $ | — | ||||||||
|
|
|
|
|
|
|
|
|
|||||||||
| Total Derivatives |
$ | 1,214 | $ | 4,086 | $ | 4,911 | $ | 210 | ||||||||
|
|
|
|
|
|
|
|
|
|||||||||
| (1) | Included in other assets in our consolidated balance sheets. |
| (2) | Included in other liabilities in our consolidated balance sheets. |
The following table presents the effect of our derivative financial instruments on our consolidated statements of operations ($ in thousands):
| Derivatives in Hedging Relationships |
Amount of (Loss) Gain Recognized in OCI on Derivatives |
Location of Gain (Loss) Reclassified from |
Amount of Loss Reclassified from Accumulated OCI into Income |
|||||||||||||||||||||||||
| Year Ended December 31, | Accumulated | Year Ended December 31, | ||||||||||||||||||||||||||
| 2017 | 2016 | 2015 | OCI into Income | 2017 | 2016 | 2015 | ||||||||||||||||||||||
| Net Investment Hedges |
||||||||||||||||||||||||||||
| Foreign exchange contracts(1) |
$ | (22,216 | ) | $ | 25,355 | $ | 25,356 | Interest Expense | $ | — | $ | — | $ | — | ||||||||||||||
| Cash Flow Hedges |
||||||||||||||||||||||||||||
| Interest rate derivatives |
757 | 89 | (1,474 | ) | Interest Expense | (2) | (831 | ) | (798 | ) | (4 | ) | ||||||||||||||||
|
|
|
|
|
|
|
|
|
|
|
|
|
|||||||||||||||||
| Total |
$ | (21,459 | ) | $ | 25,444 | $ | 23,882 | $ | (831 | ) | $ | (798 | ) | $ | (4 | ) | ||||||||||||
|
|
|
|
|
|
|
|
|
|
|
|
|
|||||||||||||||||
| (1) | During the year ended December 31, 2017, we paid net cash settlements of $14.2 million on our foreign currency forward contracts. During the years ended December 31, 2016 and 2015, we received net cash settlements of $26.8 million and $18.8 million, respectively, on our foreign currency forward contracts. Those amounts are included as a component of accumulated other comprehensive loss on our consolidated balance sheets. |
| (2) | During the years ended December 31, 2017, 2016, and 2015, we recorded total interest and related expenses of $234.9 million, $184.3 million, and 152.4 million, respectively, which included interest expense of $831,000, $798,000, and $4,000, respectively, related to our cash flow hedges. |
F-34
Table of Contents
Blackstone Mortgage Trust, Inc.
Notes to Consolidated Financial Statements (continued)
Credit-Risk Related Contingent Features
We have entered into agreements with certain of our derivative counterparties that contain provisions where if we were to default on any of our indebtedness, including default where repayment of the indebtedness has not been accelerated by the lender, we may also be declared in default on our derivative obligations. In addition, certain of our agreements with our derivative counterparties require that we post collateral to secure net liability positions. As of December 31, 2017, we were in a net asset position with one of our derivative counterparties and in a net liability position with our other derivative counterparty, and posted collateral of $4.1 million under these derivative contracts. As of December 31, 2016, we were in a net asset position with each such derivative counterparty and posted collateral of $79,000 under these derivative contracts.
11. EQUITY
Stock and Stock Equivalents
Authorized Capital
As of December 31, 2017, we had the authority to issue up to 300,000,000 shares of stock, consisting of 200,000,000 shares of class A common stock and 100,000,000 shares of preferred stock. Subject to applicable NYSE listing requirements, our board of directors is authorized to cause us to issue additional shares of authorized stock without stockholder approval. In addition, to the extent not issued, currently authorized stock may be reclassified between class A common stock and preferred stock. We did not have any shares of preferred stock issued and outstanding as of December 31, 2017.
Class A Common Stock and Deferred Stock Units
Holders of shares of our class A common stock are entitled to vote on all matters submitted to a vote of stockholders and are entitled to receive such dividends as may be authorized by our board of directors and declared by us, in all cases subject to the rights of the holders of shares of outstanding preferred stock, if any.
The following table details our issuance of class A common stock during the years ended December 31, 2017, 2016 and 2015 ($ in thousands, except share and per share data):
| Class A Common Stock Offerings | ||||||||||||
| 2017 | 2016 | 2015(1) | ||||||||||
| Shares issued |
12,420,000 | — | 34,780,025 | |||||||||
| Share issue price(2) |
$ | 31.57 | $ | — | $ | 29.64 | ||||||
| Net proceeds(3) |
$ | 391,558 | $ | — | $ | 1,029,535 | ||||||
| (1) | Consists of 23.0 million shares issued in April 2015, 11.5 million shares issued in June 2015, and 280,025 shares issued over a five-day period in May 2015 under our at-the-market program. Share issue price reflects the weighted-average of such stock offerings. |
| (2) | Represents price per share paid by the underwriters or sales agents, as applicable. |
| (3) | Net proceeds represents proceeds received from the underwriters less applicable transaction costs. |
We also issue restricted class A common stock under our stock-based incentive plans. Refer to Note 14 for additional discussion of these long-term incentive plans. In addition to our class A common stock, we also issue deferred stock units to certain members of our board of directors in lieu of cash compensation for services rendered. These deferred stock units are non-voting, but carry the right to receive dividends in the form of additional deferred stock units in an amount equivalent to the cash dividends paid to holders of shares of class A common stock.
F-35
Table of Contents
Blackstone Mortgage Trust, Inc.
Notes to Consolidated Financial Statements (continued)
The following table details the movement in our outstanding shares of class A common stock, including restricted class A common stock and deferred stock units:
| Year Ended December 31, | ||||||||||||
| Common Stock Outstanding(1) |
2017 | 2016 | 2015 | |||||||||
| Beginning balance |
94,709,290 | 93,843,847 | 58,388,808 | |||||||||
| Issuance of class A common stock(2) |
12,421,401 | 1,070 | 34,780,622 | |||||||||
| Issuance of restricted class A common stock, net |
922,196 | 836,867 | 651,815 | |||||||||
| Issuance of deferred stock units |
28,190 | 27,506 | 22,602 | |||||||||
|
|
|
|
|
|
|
|||||||
| Ending balance |
108,081,077 | 94,709,290 | 93,843,847 | |||||||||
|
|
|
|
|
|
|
|||||||
| (1) | Includes deferred stock units held by members of our board of directors of 197,217, 169,027, and 141,521, as of December 31, 2017, 2016, and 2015, respectively. |
| (2) | Includes 1,401, 1,070, and 597 shares issued under our dividend reinvestment program during the years ended December 31, 2017, 2016, and 2015, respectively. |
Dividend Reinvestment and Direct Stock Purchase Plan
On March 25, 2014, we adopted a dividend reinvestment and direct stock purchase plan, under which we registered and reserved for issuance, in the aggregate, 10,000,000 shares of class A common stock. Under the dividend reinvestment component of this plan, our class A common stockholders can designate all or a portion of their cash dividends to be reinvested in additional shares of class A common stock. The direct stock purchase component allows stockholders and new investors, subject to our approval, to purchase shares of class A common stock directly from us. During the years ended December 31, 2017, 2016, and 2015 we issued 1,401 shares, 1,070 shares, and 597 shares, respectively, of class A common stock under the dividend reinvestment component of the plan. As of December 31, 2017, a total of 9,996,926 shares of class A common stock remained available for issuance under the dividend reinvestment and direct stock purchase plan.
At the Market Stock Offering Program
On May 9, 2014, we entered into equity distribution agreements, or ATM Agreements, pursuant to which we may sell, from time to time, up to an aggregate sales price of $200.0 million of our class A common stock. On July 29, 2016, in connection with filing a new universal shelf registration statement on Form S-3, we entered into amendments to each of the ATM Agreements. Sales of class A common stock made pursuant to the ATM Agreements may be made in negotiated transactions or transactions that are deemed to be “at the market” offerings as defined in Rule 415 under the Securities Act of 1933, as amended. Actual sales will depend on a variety of factors including market conditions, the trading price of our class A common stock, our capital needs, and our determination of the appropriate sources of funding to meet such needs. We did not sell any shares of our class A common stock under the ATM Agreements during the years ended December 31, 2017 and 2016. As of December 31, 2017, sales of our class A common stock with an aggregate sales price of $188.6 million remained available for issuance under the ATM Agreements.
Dividends
We generally intend to distribute substantially all of our taxable income, which does not necessarily equal net income as calculated in accordance with GAAP, to our stockholders each year to comply with the REIT provisions of the Internal Revenue Code. Our dividend policy remains subject to revision at the discretion of our
F-36
Table of Contents
Blackstone Mortgage Trust, Inc.
Notes to Consolidated Financial Statements (continued)
board of directors. All distributions will be made at the discretion of our board of directors and will depend upon our taxable income, our financial condition, our maintenance of REIT status, applicable law, and other factors as our board of directors deems relevant.
On December 14, 2017, we declared a dividend of $0.62 per share, or $66.9 million, that was paid on January 16, 2018, to stockholders of record as of December 29, 2017. The following table details our dividend activity ($ in thousands, except per share data):
| Year Ended December 31, | ||||||||||||
| 2017 | 2016 | 2015 | ||||||||||
| Dividends declared per share of common stock |
$ | 2.48 | $ | 2.48 | $ | 2.28 | ||||||
| Percent taxable as ordinary dividends |
97.20 | % | 92.77 | % | 92.36 | % | ||||||
| Percent taxable as capital gain dividends |
2.80 | % | 7.23 | % | 7.64 | % | ||||||
|
|
|
|
|
|
|
|||||||
| 100.0 | % | 100.0 | % | 100.0 | % | |||||||
Earnings Per Share
We calculate our basic and diluted earnings per share using the two-class method for all periods presented, as the unvested shares of our restricted class A common stock qualify as participating securities, as defined by GAAP. These restricted shares have the same rights as our other shares of class A common stock, including participating in any dividends, and therefore have been included in our basic and diluted net income per share calculation. Our Convertible Notes are excluded from dilutive earnings per share as we have the intent and ability to settle these instruments in cash.
The following table sets forth the calculation of basic and diluted net income per share of class A common stock based on the weighted-average of both restricted and unrestricted class A common stock outstanding ($ in thousands, except per share data):
| Year Ended December 31, | ||||||||||||
| 2017 | 2016 | 2015 | ||||||||||
| Net income(1) |
$ | 217,631 | $ | 238,297 | $ | 196,829 | ||||||
| Weighted-average shares outstanding, basic and diluted |
95,963,616 | 94,165,351 | 81,740,227 | |||||||||
|
|
|
|
|
|
|
|||||||
| Per share amount, basic and diluted |
$ | 2.27 | $ | 2.53 | $ | 2.41 | ||||||
|
|
|
|
|
|
|
|||||||
| (1) | Represents net income attributable to Blackstone Mortgage Trust, Inc. |
Other Balance Sheet Items
Accumulated Other Comprehensive Loss
As of December 31, 2017, total accumulated other comprehensive loss was $29.7 million, primarily representing (i) $60.3 million of cumulative unrealized currency translation adjustments on assets and liabilities denominated in foreign currencies and (ii) an offsetting $30.6 million of net realized and unrealized gains related to changes in the fair value of derivative instruments. As of December 31, 2016, total accumulated other comprehensive loss was $56.2 million, primarily representing (i) $107.5 million of cumulative unrealized currency translation adjustments on assets and liabilities denominated in foreign currencies and (ii) an offsetting $51.3 million of net realized and unrealized gains related to changes in the fair value of derivative instruments.
F-37
Table of Contents
Blackstone Mortgage Trust, Inc.
Notes to Consolidated Financial Statements (continued)
Non-Controlling Interests
The non-controlling interests included on our consolidated balance sheets represent the equity interests in our Multifamily Joint Venture that are not owned by us. A portion of our Multifamily Joint Venture’s consolidated equity and results of operations are allocated to these non-controlling interests based on their pro rata ownership of our Multifamily Joint Venture. As of December 31, 2017, our Multifamily Joint Venture’s total equity was $42.3 million, of which $36.0 million was owned by us, and $6.3 million was allocated to non-controlling interests. As of December 31, 2016, we did not have any non-controlling interests on our consolidated financial statements.
12. OTHER EXPENSES
Our other expenses consist of the management and incentive fees we pay to our Manager and our general and administrative expenses.
Management and Incentive Fees
Pursuant to our Management Agreement, our Manager earns a base management fee in an amount equal to 1.50% per annum multiplied by our outstanding equity balance, as defined in the Management Agreement. In addition, our Manager is entitled to an incentive fee in an amount equal to the product of (i) 20% and (ii) the excess of (a) our Core Earnings (as defined in our Management Agreement) for the previous 12-month period over (b) an amount equal to 7.00% per annum multiplied by our outstanding Equity, provided that our Core Earnings over the prior three-year period is greater than zero. Core Earnings, as defined in our Management Agreement, is generally equal to our net income (loss) prepared in accordance with GAAP, excluding (i) certain non-cash items (ii) the net income (loss) related to our legacy portfolio and (iii) incentive management fees.
During the years ended December 31, 2017, 2016, and 2015, we incurred $38.6 million, $38.0 million, and $32.2 million, respectively, of management fees payable to our Manager. In addition, during the years ended December 31, 2017, 2016, and 2015, we incurred $16.2 million, $18.0 million, and $10.7 million, respectively, of incentive fees payable to our Manager.
As of December 31, 2017 and 2016, we had accrued management and incentive fees payable to our Manager of $14.3 million and $12.8 million, respectively.
F-38
Table of Contents
Blackstone Mortgage Trust, Inc.
Notes to Consolidated Financial Statements (continued)
General and Administrative Expenses
General and administrative expenses consisted of the following ($ in thousands):
| Year Ended December 31, | ||||||||||||
| 2017 | 2016 | 2015 | ||||||||||
| Professional services(1) |
$ | 3,812 | $ | 3,311 | $ | 3,156 | ||||||
| Operating and other costs(1) |
1,903 | 2,147 | 2,709 | |||||||||
| GE transaction costs |
— | — | 9,623 | |||||||||
|
|
|
|
|
|
|
|||||||
| Subtotal |
5,715 | 5,458 | 15,488 | |||||||||
| Non-cash and CT Legacy Portfolio compensation expenses |
||||||||||||
| Management incentive awards plan - CTOPI(2) |
— | 1,568 | 5,370 | |||||||||
| Management incentive awards plan - CT Legacy Partners(3) |
— | 1,094 | 2,177 | |||||||||
| Restricted class A common stock earned |
23,593 | 19,052 | 12,966 | |||||||||
| Director stock-based compensation |
438 | 375 | 375 | |||||||||
|
|
|
|
|
|
|
|||||||
| Subtotal |
24,031 | 22,089 | 20,888 | |||||||||
|
|
|
|
|
|
|
|||||||
| Total BXMT expenses |
29,746 | 27,547 | 36,376 | |||||||||
| Other expenses |
176 | 169 | 333 | |||||||||
|
|
|
|
|
|
|
|||||||
| Total general and administrative expenses |
$ | 29,922 | $ | 27,716 | $ | 36,709 | ||||||
|
|
|
|
|
|
|
|||||||
| (1) | During the year ended December 31, 2017, we recognized an aggregate $232,000 of expenses related to our Multifamily Joint Venture. |
| (2) | Represents the portion of CTOPI promote revenue recorded under compensation awards. See Note 4 for further discussion. |
| (3) | Represents the amounts recorded under the CT Legacy Partners management incentive awards during the period. See below for discussion of the CT Legacy Partners management incentive awards plan. |
CT Legacy Partners Management Incentive Awards Plan
In conjunction with our March 2011 restructuring, we created an employee pool for up to 6.75% of the distributions paid to the common equity holders of our subsidiary, CT Legacy Partners (subject to certain caps and priority distributions). During the years ended December 31, 2016 and 2015, we recognized $1.1 million and $2.2 million, respectively, of expenses under the CT Legacy Partners incentive plan. Our investment in CT Legacy Partners was substantially realized as of December 31, 2016.
13. INCOME TAXES
We elected to be taxed as a REIT, effective January 1, 2003, under the Internal Revenue Code for U.S. federal income tax purposes. We generally must distribute annually at least 90% of our net taxable income, subject to certain adjustments and excluding any net capital gain, in order for U.S. federal income tax not to apply to our earnings that we distribute. To the extent that we satisfy this distribution requirement, but distribute less than 100% of our net taxable income, we will be subject to U.S. federal income tax on our undistributed taxable income. In addition, we will be subject to a 4% nondeductible excise tax if the actual amount that we pay out to our stockholders in a calendar year is less than a minimum amount specified under U.S. federal tax laws.
Our qualification as a REIT also depends on our ability to meet various other requirements imposed by the Internal Revenue Code, which relate to organizational structure, diversity of stock ownership, and certain
F-39
Table of Contents
Blackstone Mortgage Trust, Inc.
Notes to Consolidated Financial Statements (continued)
restrictions with regard to the nature of our assets and the sources of our income. Even if we qualify as a REIT, we may be subject to certain U.S. federal income and excise taxes and state and local taxes on our income and assets. If we fail to maintain our qualification as a REIT for any taxable year, we may be subject to material penalties as well as federal, state, and local income tax on our taxable income at regular corporate rates and we would not be able to qualify as a REIT for the subsequent four full taxable years. As of December 31, 2017 and 2016, we were in compliance with all REIT requirements.
During the years ended December 31, 2017, 2016, and 2015, we recorded a current income tax provision of $314,000, $196,000, and $504,000, respectively, primarily related to activities of our taxable REIT subsidiaries and various state and local taxes. We did not have any deferred tax assets or liabilities as of December 31, 2017 or 2016.
Effective January 1, 2018, under recent legislation from the Tax Cuts and Jobs Act of 2017, the maximum U.S. federal corporate income tax rate was reduced from 35% to 21%. Accordingly, to the extent that the activities of our taxable REIT subsidiaries generate taxable income in future periods, they may be subject to lower U.S. federal income tax rates.
We have net operating losses, or NOLs, generated by our predecessor business that may be carried forward and utilized in current or future periods. As a result of our issuance of 25,875,000 shares of class A common stock in May 2013, the availability of our NOLs is generally limited to $2.0 million per annum by change of control provisions promulgated by the Internal Revenue Service with respect to the ownership of Blackstone Mortgage Trust. As of December 31, 2017, we had estimated NOLs of $159.0 million that will expire in 2029, unless they are utilized by us prior to expiration.
As of December 31, 2017, tax years 2014 through 2017 remain subject to examination by taxing authorities.
14. STOCK-BASED INCENTIVE PLANS
We are externally managed by our Manager and do not currently have any employees. However, as of December 31, 2017, our Manager, certain individuals employed by an affiliate of our Manager, and certain members of our board of directors were compensated, in part, through the issuance of stock-based instruments.
We had stock-based incentive awards outstanding under seven benefit plans as of December 31, 2017: (i) our amended and restated 1997 non-employee director stock plan, or 1997 Plan; (ii) our 2007 long-term incentive plan, or 2007 Plan; (iii) our 2011 long-term incentive plan, or 2011 Plan; (iv) our 2013 stock incentive plan, or 2013 Plan; (v) our 2013 manager incentive plan, or 2013 Manager Plan; (vi) our 2016 stock incentive plan, or 2016 Plan; and (vii) our 2016 manager incentive plan, or 2016 Manager Plan. We refer to our 1997 Plan, our 2007 Plan, our 2011 Plan, our 2013 Plan, and our 2013 Manager Plan, collectively, as our Expired Plans and we refer to our 2016 Plan and 2016 Manager Plan, collectively, as our Current Plans.
Our Expired Plans have expired and no new awards may be issued under them. Under our Current Plans, a maximum of 2,400,000 shares of our class A common stock may be issued to our Manager, our directors and officers, and certain employees of affiliates of our Manager. As of December 31, 2017, there were 805,799 shares available under the Current Plans.
F-40
Table of Contents
Blackstone Mortgage Trust, Inc.
Notes to Consolidated Financial Statements (continued)
The following table details the movement in our outstanding shares of restricted class A common stock and the weighted-average grant date fair value per share:
| Restricted Class A Common Stock |
Weighted-Average Grant Date Fair Value Per Share |
|||||||
| Balance as of December 31, 2015 |
1,114,908 | $ | 27.64 | |||||
| Granted |
872,294 | 28.88 | ||||||
| Vested |
(641,780 | ) | 27.21 | |||||
| Forfeited |
(35,427 | ) | 27.49 | |||||
|
|
|
|
|
|||||
| Balance as of December 31, 2016 |
1,309,995 | $ | 28.68 | |||||
|
|
|
|
|
|||||
| Granted |
925,319 | 31.78 | ||||||
| Vested |
(748,016 | ) | 28.69 | |||||
| Forfeited |
(3,123 | ) | 27.37 | |||||
|
|
|
|
|
|||||
| Balance as of December 31, 2017 |
1,484,175 | $ | 30.61 | |||||
|
|
|
|
|
|||||
These shares generally vest in installments over a three-year period, pursuant to the terms of the respective award agreements and the terms of the Current Plans. The 1,484,175 shares of restricted class A common stock outstanding as of December 31, 2017 will vest as follows: 754,597 shares will vest in 2018; 517,026 shares will vest in 2019; and 212,552 shares will vest in 2020. As of December 31, 2017, total unrecognized compensation cost relating to nonvested share-based compensation arrangements was $45.6 million based on the closing price of our class A common stock of $32.18 on December 29, 2017, the last trading day in the quarter ended December 31, 2017. This cost is expected to be recognized over a weighted average period of 1.2 years from December 31, 2017.
15. FAIR VALUES
Assets and Liabilities Measured at Fair Value
The following table summarizes our assets and liabilities measured at fair value on a recurring basis ($ in thousands):
| December 31, 2017 | December 31, 2016 | |||||||||||||||||||||||||||||||
| Level 1 | Level 2 | Level 3 | Fair Value | Level 1 | Level 2 | Level 3 | Fair Value | |||||||||||||||||||||||||
| Assets |
||||||||||||||||||||||||||||||||
| Derivatives |
$ | — | $ | 1,214 | $ | — | $ | 1,214 | $ | — | $ | 4,086 | $ | — | $ | 4,086 | ||||||||||||||||
| Liabilities |
||||||||||||||||||||||||||||||||
| Derivatives |
$ | — | $ | 4,911 | $ | — | $ | 4,911 | $ | — | $ | 210 | $ | — | $ | 210 | ||||||||||||||||
F-41
Table of Contents
Blackstone Mortgage Trust, Inc.
Notes to Consolidated Financial Statements (continued)
The following table reconciles the beginning and ending balances of assets measured at fair value on a recurring basis using Level 3 inputs ($ in thousands):
| Year Ended December 31, | ||||||||
| 2017 | 2016(1) | |||||||
| January 1, |
$ | — | $ | 12,561 | ||||
| Proceeds from investment realizations |
— | (3,609 | ) | |||||
| Transfers out of level 3(2) |
— | (20,745 | ) | |||||
| Adjustments to fair value included in earnings |
||||||||
| Gain on investments at fair value |
— | 11,793 | ||||||
|
|
|
|
|
|||||
| December 31, |
$ | — | $ | — | ||||
|
|
|
|
|
|||||
| (1) | All assets measured at fair value on a recurring basis using Level 3 inputs were included as a component of other assets in the consolidated Balance Sheets. |
| (2) | During the second quarter of 2016, $20.7 million of collateralized debt obligations, or CDOs, were transferred out of Level 3 and into Level 1 as a result of a binding agreement to sell the underlying collateral assets of the CDO to an independent third-party. These investments were realized in the third quarter of 2016. |
Refer to Note 2 for further discussion regarding fair value measurement.
Fair Value of Financial Instruments
As discussed in Note 2, GAAP requires disclosure of fair value information about financial instruments, whether or not recognized in the statement of financial position, for which it is practicable to estimate that value. The following table details the carrying amount, face amount, and fair value of the financial instruments described in Note 2 ($ in thousands):
| December 31, 2017 | December 31, 2016 | |||||||||||||||||||||||
| Carrying Amount |
Face Amount |
Fair Value |
Carrying Amount |
Face Amount |
Fair Value |
|||||||||||||||||||
| Financial assets |
||||||||||||||||||||||||
| Cash and cash equivalents |
$ | 69,654 | $ | 69,654 | $ | 69,654 | $ | 75,567 | $ | 75,567 | $ | 75,567 | ||||||||||||
| Restricted cash |
32,864 | 32,864 | 32,864 | — | — | — | ||||||||||||||||||
| Loans receivable, net |
10,056,732 | 10,108,226 | 10,112,331 | 8,692,978 | 8,727,218 | 8,733,784 | ||||||||||||||||||
| Financial liabilities |
||||||||||||||||||||||||
| Secured debt agreements, net |
5,273,855 | 5,290,536 | 5,290,536 | 5,716,354 | 5,731,626 | 5,731,626 | ||||||||||||||||||
| Loan participations sold, net |
80,415 | 80,706 | 80,706 | 348,077 | 349,633 | 349,633 | ||||||||||||||||||
| Securitized debt obligations, net |
1,282,412 | 1,292,120 | 1,292,589 | — | — | — | ||||||||||||||||||
| Convertible notes, net |
563,911 | 575,000 | 610,201 | 166,762 | 172,500 | 191,763 | ||||||||||||||||||
Estimates of fair value for cash and cash equivalents, restricted cash, and convertible notes are measured using observable, quoted market prices, or Level 1 inputs. Estimates of fair value for securitized debt obligations are measured using observable, quoted market prices, in inactive markets, or Level 2 inputs. All other fair value significant estimates are measured using unobservable inputs, or Level 3 inputs. See Note 2 for further discussion regarding fair value measurement of certain of our assets and liabilities.
F-42
Table of Contents
Blackstone Mortgage Trust, Inc.
Notes to Consolidated Financial Statements (continued)
16. VARIABLE INTEREST ENTITIES
We have financed a portion of our loans through the CLO and the Single Asset Securitization, both of which are VIEs. We are the primary beneficiary and consolidate the CLO and the Single Asset Securitization on our balance sheet as we (i) control the relevant interests of the CLO and the Single Asset Securitization that give us power to direct the activities that most significantly affect the CLO and the Single Asset Securitization, and (ii) have the right to receive benefits and obligation to absorb losses of the CLO and the Single Asset Securitization through the subordinate interests we own.
The following table details the assets and liabilities of our consolidated CLO and Single Asset Securitization VIEs ($ in thousands):
| December 31, 2017 | December 31, 2016 | |||||||
| Assets: |
||||||||
| Loans receivable, net |
$ | 1,500,000 | $ | — | ||||
| Other assets |
2,407 | — | ||||||
|
|
|
|
|
|||||
| Total assets |
$ | 1,502,407 | $ | — | ||||
|
|
|
|
|
|||||
| Liabilities: |
||||||||
| Securitized debt obligations, net |
$ | 1,282,412 | $ | — | ||||
| Other liabilities |
1,379 | — | ||||||
|
|
|
|
|
|||||
| Total liabilities |
$ | 1,283,791 | $ | — | ||||
|
|
|
|
|
|||||
Assets held by these VIEs are restricted and can be used only to settle obligations of these VIEs, including the subordinate interests owned by us. The liabilities of these VIEs are non-recourse to us and can only be satisfied from the assets of these VIEs. The consolidation of these VIEs results in an increase in our gross assets, liabilities, interest income and interest expense, however it does not affect our stockholders’ equity or net income. We are not obligated to provide, have not provided, and do not intend to provide financial support to these VIEs.
17. TRANSACTIONS WITH RELATED PARTIES
We are managed by our Manager pursuant to the Management Agreement, the current term of which expires on December 19, 2018, and will be automatically renewed for a one-year term each anniversary thereafter unless earlier terminated.
As of December 31, 2017 and 2016, our consolidated balance sheet included $14.3 million and $12.8 million of accrued management and incentive fees payable to our Manager, respectively. During the years ended December 31, 2017, 2016, and 2015, we paid management and incentive fees of $53.4 million, $57.5 million and $34.8 million, respectively, to our Manager. In addition, during the years ended December 31, 2017, 2016, and 2015, we reimbursed our Manager for expenses incurred on our behalf of $621,000, $462,000, and $311,000, respectively. During the years ended December 31, 2016 and 2015, CT Legacy Partners made aggregate preferred distributions of $616,000 and $1.3 million, respectively, to an affiliate of our Manager. CT Legacy Partners did not make any preferred distributions during the year ended December 31, 2017.
As of December 31, 2017, our Manager held 869,058 shares of unvested restricted class A common stock, which had an aggregate grant date fair value of $26.9 million, and vest in installments over three years from the date of issuance. During the years ended December 31, 2017, 2016, and 2015, we recorded non-cash expenses related to shares held by our Manager of $11.7 million, $9.6 million, and $6.7 million, respectively. Refer to Note 14 for further details on our restricted class A common stock.
F-43
Table of Contents
Blackstone Mortgage Trust, Inc.
Notes to Consolidated Financial Statements (continued)
During the year ended December 31, 2017, an affiliate of our Manager was named special servicer of the CLO. This affiliate did not earn any special servicing fees related to the CLO during the year ended December 31, 2017.
During the year ended December 31, 2017 and 2016, we originated six loans and three loans, respectively, whereby each respective borrower engaged an affiliate of our Manager to act as title insurance agent in connection with each transaction. We did not incur any expenses or receive any revenues as a result of these transactions.
On June 30, 2017, in a fully subscribed offering totaling $474.6 million, certain Blackstone-advised investment vehicles purchased, in the aggregate, $72.9 million of securitized debt obligations issued by the Single Asset Securitization. These investments by the Blackstone-advised investment vehicles represented no more than a 49% participation in any individual tranche and were purchased by the Blackstone-advised investment vehicles from third-party investment banks on market terms negotiated by the majority third-party investors. Refer to Note 8 for further details on the Single Asset Securitization.
In the fourth quarter of 2016, we originated a $79.0 million senior loan to a borrower to finance its purchase of a property that it acquired from an affiliate of our Manager. The purchase price of the property was fixed between the borrower and the affiliate of our Manager prior to us engaging in discussions with the borrower to act as its potential lender.
On May 8, 2015, a joint venture of CT Legacy Partners, certain affiliates of our Manager, and other non-affiliated parties, which we refer to as the Three-Pack JV, sold a hotel portfolio it owned to an investment vehicle managed by an affiliate of our Manager. We consented to the sale of the hotel portfolio by the Three-Pack JV, which resulted in the ultimate liquidation of the Three-Pack JV and distribution of net sale proceeds to CT Legacy Partners in respect of its investment therein. An aggregate of $41.3 million of net sales proceeds was paid to CT Legacy Partners, of which $37.3 million was received during 2015, and the remaining $3.6 million was received during 2016. As a result of the sale transaction, employees of our Manager, including certain of our executive officers, received incentive compensation payments totaling $2.8 million under the CT Legacy Partners Management Incentive Awards Plan, of which $2.5 million was paid during 2015, and the remaining $244,000 was paid during 2016. See Note 12 for further discussion of the CT Legacy Partners Management Incentive Awards Plan.
In conjunction with our April 2015 stock offering, affiliates of our Manager, including certain of our executive officers and directors, purchased 1,885,245 shares of our class A common stock at the same $30.50 per share price offered to the public. We did not, however, pay the underwriters any fees for these affiliate share purchases. An affiliate of our Manager acted as co-manager of the offering, for which it was compensated $761,000 on terms consistent with those for other non-affiliated underwriters.
During the years ended December 31, 2017, 2016, and 2015, we incurred $411,000, $385,000, and $372,000, respectively, of expenses for various administrative, compliance, and capital market data services to third-party service providers that are affiliates of our Manager.
On April 10, 2015, we entered into a memorandum of designation and understanding, or Designation Agreement, with GE and certain affiliates of our Manager to acquire a $4.6 billion portfolio of commercial mortgage loans from GE. Pursuant to the terms of the Designation Agreement, we were designated as the purchaser of this loan portfolio by an affiliate of our Manager that entered into a purchase and sale agreement dated as of April 10, 2015 with GE to acquire the majority of GE’s global real estate debt and equity business for an aggregate purchase price of approximately $23.0 billion. Certain transaction-related expenses incurred by us in connection
F-44
Table of Contents
Blackstone Mortgage Trust, Inc.
Notes to Consolidated Financial Statements (continued)
with the acquisition of this loan portfolio represent an allocation of transaction expenses paid by affiliates of our Manager in connection with the overall acquisition transaction with GE. In August 2015, we paid an aggregate $53,000 to certain independent members of our board of directors for special committee services related to the GE portfolio acquisition.
On June 20, 2014, CT Legacy Partners, CTOPI, our previously consolidated CT CDO I subsidiary, and other affiliates of our Manager entered into a deed-in-lieu of foreclosure transaction that resulted in a restructuring of the loan interests held by each entity. The interests held by CT Legacy Partners and CT CDO I had a principal balance of $8.0 million and $27.0 million, respectively, and a carrying value of zero and $27.0 million, respectively, at the time of the transaction. During the fourth quarter of 2015, the collateral property securing the interests held by these entities was sold, with no net proceeds to our investments in CT Legacy Partners and CT CDO I. As a result of the collateral sale transaction, an affiliate of our Manager earned a $1.1 million special servicing fee, which fee was not paid by us.
18. COMMITMENTS AND CONTINGENCIES
Unfunded Commitments Under Loans Receivable
As of December 31, 2017, we had unfunded commitments of $1.6 billion related to 74 of our loans receivable, which amounts will generally be funded to finance lease-related or capital expenditures by our borrowers. These future commitments will expire variously over the next four years.
Litigation
From time to time, we may be involved in various claims and legal actions arising in the ordinary course of business. As of December 31, 2017, we were not involved in any material legal proceedings.
Board of Directors’ Compensation
In April 2017, our board of directors approved changes to the compensation of our five independent directors which were effective as of the beginning of the third quarter of 2017. The other three board members, including our chairman and our chief executive officer, will continue to serve as directors without compensation for such service. These changes increased the annual compensation of our independent directors from $125,000 to $175,000, $75,000 of which will be paid in the form of cash and $100,000 in the form of deferred stock units. In addition, (i) the chair of our audit committee received an increase in the additional annual cash compensation from $12,000 to $20,000, (ii) the other members of our audit committee received additional annual cash compensation of $10,000, and (iii) the chairs of each of our compensation and corporate governance committees received additional annual cash compensation of $10,000.
F-45
Table of Contents
Blackstone Mortgage Trust, Inc.
Notes to Consolidated Financial Statements (continued)
19. SUMMARY OF QUARTERLY RESULTS OF OPERATIONS (UNAUDITED)
The following is a summary of the unaudited quarterly results of operations for the years ended December 31, 2017 and 2016 ($ in thousands except per share data):
| March 31 | June 30 | September 30 | December 31 | |||||||||||||
| 2017 |
||||||||||||||||
| Income from loans and other investments, net |
$ | 71,843 | $ | 72,473 | $ | 78,555 | $ | 80,174 | ||||||||
| Net income |
$ | 51,405 | $ | 50,613 | $ | 57,810 | $ | 58,140 | ||||||||
| Net income attributable to |
||||||||||||||||
| Blackstone Mortgage Trust, Inc. |
$ | 51,405 | $ | 50,613 | $ | 57,722 | $ | 57,891 | ||||||||
| Net income per share of class A common stock: |
||||||||||||||||
| Basic and diluted |
$ | 0.54 | $ | 0.53 | $ | 0.61 | $ | 0.59 | ||||||||
| 2016 |
||||||||||||||||
| Income from loans and other investments, net |
$ | 77,644 | $ | 81,406 | $ | 82,817 | $ | 71,837 | ||||||||
| Net income |
$ | 57,199 | $ | 69,450 | $ | 66,392 | $ | 53,399 | ||||||||
| Net income attributable to |
||||||||||||||||
| Blackstone Mortgage Trust, Inc. |
$ | 57,047 | $ | 63,081 | $ | 64,794 | $ | 53,375 | ||||||||
| Net income per share of class A common stock: |
||||||||||||||||
| Basic and diluted |
$ | 0.61 | $ | 0.67 | $ | 0.69 | $ | 0.57 | ||||||||
Basic and diluted earnings per share are computed independently based on the weighted-average shares of common stock and stock units outstanding for each period. Accordingly, the sum of the quarterly earnings per share amounts may not agree to the total for the year.
F-46
Table of Contents
Blackstone Mortgage Trust, Inc.
Schedule IV – Mortgage Loans on Real Estate
As of December 31, 2017
(in thousands)
| Type of Loan/Borrower |
Description / Location | Interest Payment Rates | Maximum Maturity Date(2) |
Periodic Payment Terms(3) |
Prior Liens(4) | Face Amount of Loans |
Carrying Amount of Loans(5) |
|||||||||||||||||||||
|
Senior Mortgage Loans(1) |
|
|||||||||||||||||||||||||||
| Senior loans in excess of 3% of the carrying amount of total loans |
|
|||||||||||||||||||||||||||
| Borrower A | Office / Southeast | L+3.40% | 2023 | I/O | $ | — | $ | 656,406 | $ | 652,880 | ||||||||||||||||||
| Senior loans less than 3% of the carrying amount of total loans |
|
|||||||||||||||||||||||||||
| Senior mortgage loans | Office / Diversified | L+3.00% – 5.75% | 2018 – 2023 | I/O & P/I | — | 5,357,888 | 5,327,333 | |||||||||||||||||||||
| Fixed 2.30 % – 5.29% | ||||||||||||||||||||||||||||
| Senior mortgage loans | Hotel / Diversified | L+3.25% – 5.16% | 2018 – 2022 | I/O & P/I | — | 1,843,143 | 1,837,222 | |||||||||||||||||||||
| Senior mortgage loans | Multifamily / Diversified | L+2.80% – 5.25% | 2018 – 2023 | I/O & P/I | — | 1,122,532 | 1,114,353 | |||||||||||||||||||||
| Senior mortgage loans | Retail / Diversified | L+3.10% – 4.25% | 2019 –2021 | I/O & P/I | — | 319,223 | 318,789 | |||||||||||||||||||||
| Fixed 5.14% | ||||||||||||||||||||||||||||
| Senior mortgage loans | Condo / Northeast | L+4.15% | 2021 | I/O | — | 66,451 | 65,775 | |||||||||||||||||||||
| Senior mortgage loans | Other / Diversified | L+3.10% – 5.00% | 2018 –2022 | I/O & P/I | — | 527,962 | 526,736 | |||||||||||||||||||||
| Fixed 4.63% –5.20% | ||||||||||||||||||||||||||||
|
|
|
|
|
|
|
|||||||||||||||||||||||
| — | 9,237,199 | 9,190,208 | ||||||||||||||||||||||||||
|
|
|
|
|
|
|
|||||||||||||||||||||||
| Total senior mortgage loans |
|
$ | — | $ | 9,893,605 | $ | 9,843,088 | |||||||||||||||||||||
|
|
|
|
|
|
|
|||||||||||||||||||||||
continued…
S-1
Table of Contents
Blackstone Mortgage Trust, Inc.
Schedule IV – Mortgage Loans on Real Estate
As of December 31, 2017
(in thousands)
| Type of Loan/Borrower |
Description / Location | Interest Payment Rates | Maximum Maturity Date(2) |
Periodic Payment Terms(3) |
Prior Liens(4) |
Face Amount of Loans |
Carrying Amount of Loans(5) |
|||||||||||||||||||||
| Subordinate Loans(6) |
|
|||||||||||||||||||||||||||
| Subordinate loans less than 3% of the carrying amount of total loans |
|
|||||||||||||||||||||||||||
| Subordinate loans | Various / Diversified | L+10.75% - 12.83% | 2020 - 2022 | I/O & P/I | 985,382 | 214,621 | 213,644 | |||||||||||||||||||||
| Fixed 12.22% | ||||||||||||||||||||||||||||
|
|
|
|
|
|
|
|||||||||||||||||||||||
| Total subordinate loans |
|
985,382 | 214,621 | 213,644 | ||||||||||||||||||||||||
|
|
|
|
|
|
|
|||||||||||||||||||||||
| Total loans |
|
$ | 985,382 | $ | 10,108,226 | $ | 10,056,732 | |||||||||||||||||||||
|
|
|
|
|
|
|
|||||||||||||||||||||||
| (1) | Includes senior mortgages and similar credit quality loans, including related contiguous subordinate loans, and pari passu participations in senior mortgage loans. |
| (2) | Maximum maturity date assumes all extension options are exercised. |
| (3) | I/O = interest only, P/I = principal and interest. |
| (4) | Represents only third party liens. |
| (5) | The tax basis of the loans included above is $9.5 billion as of December 31, 2017. |
| (6) | Includes subordinate interests in mortgages and mezzanine loans. |
S-2
Table of Contents
Blackstone Mortgage Trust, Inc.
Notes to Schedule IV
As of December 31, 2017
(in thousands)
| 1. | Reconciliation of Mortgage Loans on Real Estate: |
The following table reconciles mortgage loans on real estate for the years ended:
| 2017 | 2016 | 2015 | ||||||||||
| Balance at January 1, |
$ | 8,692,978 | $ | 9,077,007 | $ | 4,428,500 | ||||||
| Additions during period: |
||||||||||||
| Loan fundings |
4,072,786 | 3,151,882 | 7,203,145 | |||||||||
| Amortization of deferred fees and expenses |
38,373 | 40,345 | 36,052 | |||||||||
| Deductions during period: |
||||||||||||
| Collections of principal |
(2,828,610 | ) | (3,351,042 | ) | (2,407,920 | ) | ||||||
| Unrealized gain (loss) on foreign currency translation |
136,646 | (156,937 | ) | (149,269 | ) | |||||||
| Deferred origination fees and expenses |
(55,441 | ) | (44,697 | ) | (33,501 | ) | ||||||
| Loans sold |
— | (23,580 | ) | — | ||||||||
|
|
|
|
|
|
|
|||||||
| Balance at December 31, |
$ | 10,056,732 | $ | 8,692,978 | $ | 9,077,007 | ||||||
|
|
|
|
|
|
|
|||||||
S-3