Attached files
| file | filename |
|---|---|
| EX-99.1 - PRESS RELEASE - Simulations Plus, Inc. | simulations_8k-ex9901.htm |
| 8-K - FORM 8-K - Simulations Plus, Inc. | simulations_8k.htm |
Exhibit 99.2

Earnings Call – Q2 FY21 Shawn O’Connor, CEO William Frederick, CFO April 12, 2021 (NASDAQ:SLP)

2 With the exception of historical information, the matters discussed in this presentation are forward - looking statements that involve a number of risks and uncertainties . The actual results of the Company could differ significantly from those statements . Factors that could cause or contribute to such differences include, but are not limited to : continuing demand for the Company’s products, competitive factors, the Company’s ability to finance future growth, the Company’s ability to produce and market new products in a timely fashion, the Company’s ability to continue to attract and retain skilled personnel, and the Company’s ability to sustain or improve current levels of productivity . Further information on the Company’s risk factors is contained in the Company’s quarterly and annual reports and filed with the Securities and Exchange Commission . Safe Harbor Statement

Quarter Highlights Strong performance across the board in 2 nd quarter Year over year r evenue growth of 27% for the quarter Profitability improvements with continued favorable revenue mix toward increased software contribution MIDD+ conference demonstrating industry leadership position Inaugural ESG report released reflecting commitment to good governance practices 3

Revenue Mix – Q2 (in millions) Total • 27% Y/Y growth • 12% Y/Y growth (excl. Lixoft) Software • 45% Y/Y growth • 15% Y/Y growth (excl. Lixoft) • 60% of total revenue Services • 7% Y/Y growth • 40% of total revenue 4 $4.7 $5.4 $7.8 $3.8 $5.0 $5.3 FY19 FY20 FY21 Software Services 55% 45% 48% 52% 60% 40% $8.5 $10.4 $13.1

Revenue Mix – YTD (in millions) Total • 21% Y/Y growth • 28% Y/Y growth (excl. DILIsym) Software • 40% Y/Y growth • 13% Y/Y growth (excl. Lixoft) • 59% of total revenue Services • 1% Y/Y growth • 41% of total revenue 5 $8.8 $10.0 $14.0 $7.2 $9.8 $9.8 FY19 FY20 FY21 Software Services 55% 45% 49% 51% 59% 41% $16 $19.8 $23.8
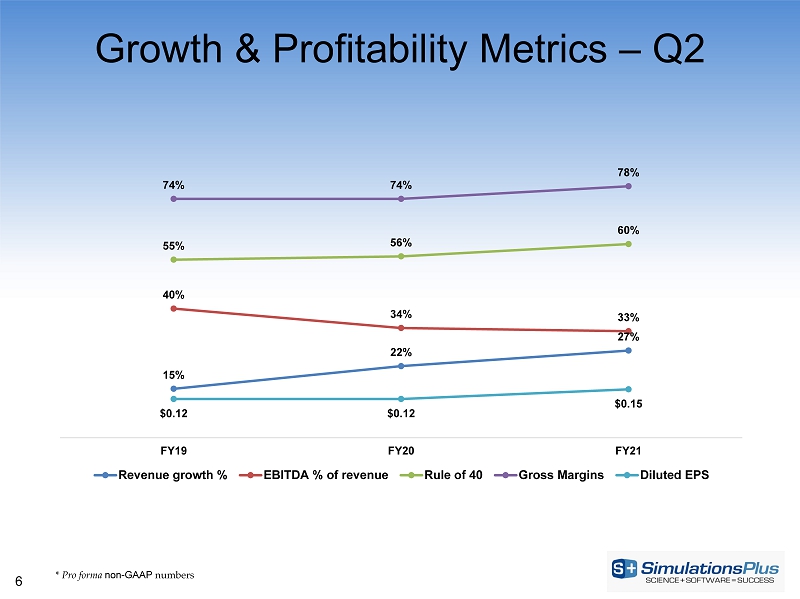
Growth & Profitability Metrics – Q2 * Pro forma non - GAAP numbers 6 15% 22% 27% 40% 34% 33% 55% 56% 60% 74% 74% 78% $0.12 $0.12 $0.15 FY19 FY20 FY21 Revenue growth % EBITDA % of revenue Rule of 40 Gross Margins Diluted EPS

Growth & Profitability Metrics – YTD * Pro forma non - GAAP numbers 7 11% 23% 21% 39% 35% 34% 50% 58% 55% 73% 73% 78% $0.20 $0.23 $0.27 FY19 FY20 FY21 Revenue growth % EBITDA % of revenue Rule of 40 Gross Margins Diluted EPS

Software Revenue by Product 8 57% 20% 16% 7% GastroPlus Monolix Suite ADMET Predictor Other Software Q2 FY21 Software Products as % of Software Revenue 56% 19% 17% 8% GastroPlus Monolix Suite ADMET Predictor Other Software YTD FY21

Software Highlights • Client Success – Successful progress with large pharma partner on AIDD lead optimization project; pipeline build of client candidates – Uptick in Monolix lead activity following release last quarter • New Products & Releases – GastroPlus V9.8.1 released – MonolixSuite R2020 training workshop conducted over 5 days with approximate 300 participants daily • Other – Extended software distributor network to South America and in China 9
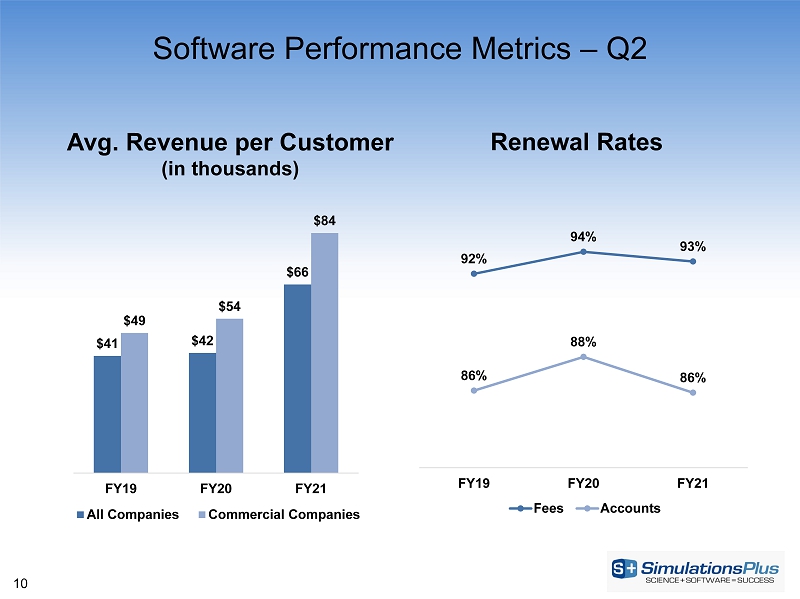
Software Performance Metrics – Q2 Avg. Revenue per Customer (in thousands) 10 $41 $42 $66 $49 $54 $84 FY19 FY20 FY21 All Companies Commercial Companies Renewal Rates 92% 94% 93% 86% 88% 86% FY19 FY20 FY21 Fees Accounts

Software Performance Metrics – YTD Avg. Revenue per Customer (in thousands) 11 $45 $49 $71 $59 $67 $97 FY19 FY20 FY21 All Companies Commercial Companies Renewal Rates 93% 93% 93% 85% 88% 86% FY19 FY20 FY21 Fees Accounts
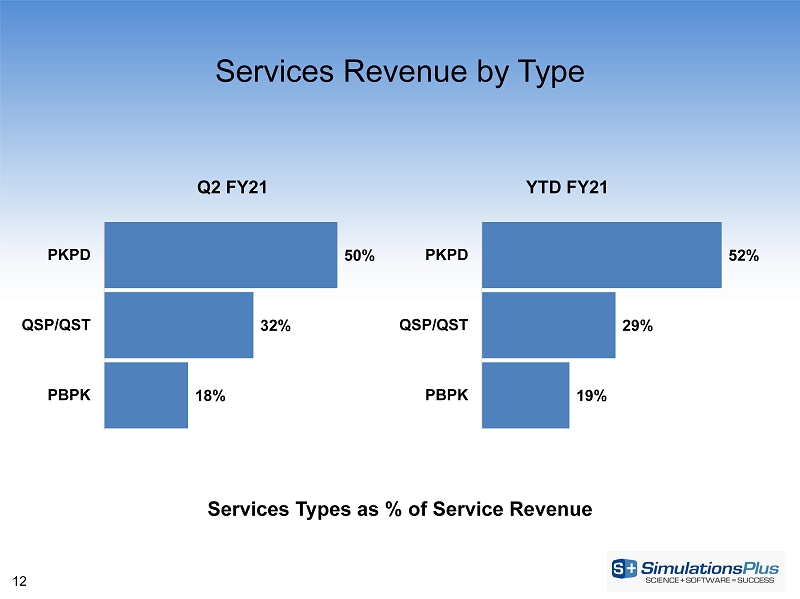
Services Revenue by Type 12 18% 32% 50% PBPK QSP/QST PKPD Q2 FY21 Services Types as % of Service Revenue 19% 29% 52% PBPK QSP/QST PKPD YTD FY21
Services Highlights • Significant large pharma PK/PD project in support of regulatory interactions • More than a dozen projects performed utilizing Monolix as primary analysis platform • 7 new PK/PD clients and 3 large project contracts with existing clients • Large QSP engagement in a new disease area • RENAsym Consortium announcement • Entered into large molecule safety collaboration • New funded collaboration to improve lung exposure models for pulmonary infection treatments • New funded collaboration to enhance GastroPlus ACAT model for oral absorption peptides • Provided grant to Makerere University (Uganda) in support of pharmacometrics education program 13

Services Performance Metrics 14 44 53 73 15 27 19 36 37 47 95 117 139 2Q19 2Q20 2Q21 Total Projects During Qtr. PKPD QSP/QST PBPK Backlog $12.7 $11.2 2Q20 2Q21 Backlog (in millions)

YTD Performance & FY21 Outlook • Total Revenue Growth – YTD performance: 21% growth – Full - year target range: 15 - 20% organic growth plus 3 - 5% from Lixoft • Software Revenue Growth – YTD performance: 40% growth – Full - year target range: 20 - 25% growth • Services Revenue Growth – YTD performance: 1% growth – Full - year target range: 25 - 30% growth • M&A Effort – Acquisitions would be incremental to revenue growth targets above – Focus: • Companies that extend our product portfolio • Companie s that provide new service capabilities/capacity • Companies that expand our geographic coverage 15

Financial Results

17 Income Statement Summar y – Q2 (in millions) FY21 % of Rev FY20 % of Rev Revenues $ 13.1 100% $ 10.4 100% Revenue Growth 27% 22% Gross profit 10.2 78% 7.7 74% SG&A 5.4 42% 4.1 40% R&D 1.3 10% 0.7 7% Total operating exp 6.7 51% 4.9 47% Income from operations 3.5 27% 2.8 27% Other income (expense) (0.1) (0)% 0.0 0% Income before income taxes 3.4 26% 2.8 27% Income taxes (0.2) 2% (0.7) 7% Effective tax rate 6% 24% Net income $ 3.2 24% $ 2.2 21% Diluted earnings per share (in dollars) $ 0.15 $ 0.12 EBITDA $ 4.3 33% $ 3.5 34%

18 Income Statement Summary – YTD (in millions) FY21 % of Rev FY20 % of Rev Revenues $ 23.8 100% $ 19.8 100% Revenue Growth 21% 23% Gross profit 18.5 78% 14.4 73% SG&A 9.9 41% 7.6 39% R&D 2.1 9% 1.3 6% Total operating exp 12.0 50% 8.9 45% Income from operations 6.5 27% 5.5 28% Other income (expense) (0.1) (0)% 0.0 0% Income before income taxes 6.4 27% 5.6 28% Income taxes 0.7 3% 1.4 7% Effective tax rate 11% 24% Net income $ 5.7 24% $ 4.2 21% Diluted earnings per share (in dollars) $ 0.27 $ 0.23 EBITDA $ 8.1 34% $ 6.9 35%

Gross Margin Trend – Q2 * Pro forma non - GAAP numbers 19 83% 85% 89% 63% 63% 61% 74% 74% 78% FY19 FY20 FY21 Software Services Total

Gross Margin Trend - YTD * Pro forma non - GAAP numbers 20 81% 84% 88% 62% 62% 63% 72% 73% 78% FY19 FY20 FY21 Software Services Total

21 Balance Sheet Summary (in millions, except where indicated) Feb. 28, 2021 Aug. 31, 2020 Cash and short - term investments $ 117.8 $ 116.0 Total current assets 135.6 129.1 Total assets 175.8 168.4 Current liabilities 6.5 5.5 Long - term liabilities 7.8 6.9 Total liabilities 14.3 12.4 Shareholders’ equity 161.5 156.0 Total liabilities and shareholders’ equity 175.8 168.4
Conclusion Q2 revenue growth strong and in line with FY21 outlook Richer mix of software revenues is enhancing our profitability metrics Reinforcing our biosimulation leadership with successful conference sponsorship and good market momentum with the close of new business, renewal and growth of existing relationships, key collaborations and grants Continued progress in our M&A efforts 22

Selected Financial Information Nasdaq SLP Cash and short - term investments $118 M Borrowed Debt Outstanding $0 Market Capitalization (a/o 4/05/21) $ 1.3B Fully Diluted Shares Outstanding 2Q21 20.8M Average Daily Trading Volume (current 30 day - a/o 4/05/21) ~210,000 23

24 Thank you! https://www.simulations - plus.com