Attached files
| file | filename |
|---|---|
| EX-23.1 - CONSENT - Simulations Plus, Inc. | slp_10k-ex2301.htm |
| EX-31.2 - CERTIFICATION - Simulations Plus, Inc. | slp_10k-ex3102.htm |
| EX-32 - CERTIFICATION - Simulations Plus, Inc. | slp_10k-ex3200.htm |
| EX-31.1 - CERTIFICATION - Simulations Plus, Inc. | slp_10k-ex3101.htm |
UNITED STATES
SECURITIES AND EXCHANGE COMMISSION
Washington, DC 20549
FORM 10-K
| S | ANNUAL REPORT PURSUANT TO SECTION 13 OR 15(d) OF THE SECURITIES EXCHANGE ACT OF 1934 |
| For the fiscal year ended August 31, 2012 |
or
| £ | TRANSITION REPORT PURSUANT TO SECTION 13 OR 15(d) OF THE SECURITIES EXCHANGE ACT OF 1934 |
| For the transition period from _________ to _________ | |
Commission file number: 001-32046
Simulations Plus, Inc.
(Exact name of registrant as specified in its charter)
|
California (State or other jurisdiction of incorporation or organization)
|
95-4595609 (I.R.S. Employer Identification No.)
|
|
42505 Tenth Street West Lancaster, CA 93534-7059 (Address of principal executive offices including zip code) |
(661) 723-7723 (Registrant’s telephone number, including area code)
|
SECURITIES REGISTERED PURSUANT TO SECTION 12(b) OF THE ACT:
|
Title of Each Class Common Stock, par value $0.001 per share |
Name of Each Exchange on Which Registered NASDAQ Stock Market LLC |
SECURITIES REGISTERED PURSUANT TO SECTION 12(G) OF THE ACT: NONE
Indicate by check mark if the registrant is a well-known seasoned issuer, as defined in Rule 405 of the Securities Act.
Yes £ No S
Indicate by check mark if the registrant is not required to file reports pursuant to Section 13 or Section 15(d) of the Act.
Yes £ No S
Indicate by check mark whether the registrant (1) filed all reports required to be filed by Section 13 or 15(d) of the Securities Exchange Act of 1934 during the preceding 12 months (or for such shorter period that the registrant was required to file such reports), and (2) has been subject to such filings requirements for the past 90 days.
Yes S No £
Indicate by check mark whether the registrant has submitted electronically and posted on its corporate Website, if any, every Interactive Data File required to be submitted and posted pursuant to Rule 405 of Regulation S-T (§232.405 of this chapter) during the preceding 12 months (or for such shorter period that the registrant was required to submit and post such files).
Yes S No £
Indicate by check mark if disclosure of delinquent filers pursuant to Item 405 of Regulation S-K (§229.405) is not contained herein, and will not be contained, to the best of registrant’s knowledge, in definitive proxy or information statements incorporated by reference in Part III of this Form 10-K or any amendment to this Form 10-K. £
Indicate by check mark whether the registrant is a large accelerated filer, an accelerated filer, a non-accelerated filer, or a smaller reporting company. See the definitions of “large accelerated filer,” “accelerated filer” and “smaller reporting company” in Rule 12b-2 of the Exchange Act (Check one):
| £ Large accelerated filer | £ Accelerated filer |
| £ Non-accelerated filer (Do not check if a smaller reporting company) | S Smaller reporting company |
Indicate by check mark whether the registrant is a shell company (as defined in Rule 12b-2 of the Exchange Act). Yes £ No S
The aggregate market value of the registrant’s common stock held by non-affiliates of the registrant as of February 29, 2012, based upon the closing price of the common stock as reported by The Nasdaq Stock Market on such date, was approximately $38,035,604. This calculation does not reflect a determination that persons are affiliates for any other purposes.
As of November 13, 2012, 15,927,806 shares of the registrant’s common stock, par value $0.001 per share were outstanding, and no shares of preferred stock were outstanding.
DOCUMENTS INCORPORATED BY REFERENCE
Certain portions of the definitive Proxy Statement to be delivered to shareholders in connection with the 2013 Annual Meeting of Shareholders are incorporated by reference into Part III of this Form 10-K to be filed with the Securities and Exchange Commission within 120 days after the close of the fiscal year covered by this annual report.
The Exhibit Index (Item 15) lists several documents incorporated by reference.
Simulations Plus, Inc.
FORM 10-K
For the Fiscal Year Ended August 31, 2012
Table of Contents
| Page | ||
| PART I | ||
| Item 1 | Business | 1 |
| Item 1A | Risk Factors | 8 |
| Item 1B | Unresolved Staff Comments | 8 |
| Item 2 | Properties | 8 |
| Item 3 | Legal Proceedings | 9 |
| Item 4 | Mine Safety Disclosures | 9 |
| PART II | ||
| Item 5 | Market for Registrant’s Common Equity, Related Stockholder Matters and Issuer Purchases of Equity Securities | 9 |
| Item 6 | Selected Financial Data | 10 |
| Item 7 | Management’s Discussion and Analysis of Financial Condition and Results of Operations | 11 |
| Item 7A | Quantitative and Qualitative Disclosures About Market Risk | 20 |
| Item 8 | Financial Statements and Supplementary Data | 20 |
| Item 9 | Changes in and Disagreements With Accountants on Accounting and Financial Disclosure | 20 |
| Item 9A | Controls and Procedures | 20 |
| Item 9B | Other Information | 21 |
| PART III | ||
| Item 10 | Directors, Executive Officers and Corporate Governance | 21 |
| Item 11 | Executive Compensation | 22 |
| Item 12 | Security Ownership of Certain Beneficial Owners and Management and Related Stockholder Matters | 22 |
| Item 13 | Certain Relationships and Related Transactions, and Director Independence | 22 |
| Item 14 | Principal Accounting Fees and Services | 22 |
| PART IV | ||
| Item 15 | Exhibits, Financial Statement Schedules | 22 |
| Signatures | 24 | |
| i |
Forward-Looking Statements
This document and the documents incorporated in this document by reference contain forward-looking statements that are subject to risks and uncertainties. All statements other than statements of historical fact contained in this document and the materials accompanying this document are forward-looking statements.
The forward-looking statements are based on the beliefs of our management, as well as assumptions made by, and information currently available to, our management. Frequently, but not always, forward-looking statements are identified by the use of the future tense and by words such as “believes,” expects,” “anticipates,” “intends,” “will,” “may,” “could,” “would,” “projects,” “continues,” “estimates” or similar expressions. Forward-looking statements are not guarantees of future performance and actual results could differ materially from those indicated by the forward-looking statements. Forward-looking statements involve known and unknown risks, uncertainties, and other factors that may cause our or our industry’s actual results, levels of activity, performance or achievements to be materially different from any future results, levels of activity, performance or achievements expressed or implied by the forward-looking statements.
The forward-looking statements contained or incorporated by reference in this document are forward-looking statements within the meaning of Section 27A of the Securities Act of 1933, as amended (“Securities Act”) and Section 21E of the Securities Exchange Act of 1934, as amended (“Exchange Act”), and are subject to the safe harbor created by the Private Securities Litigation Reform Act of 1995. These statements include declarations regarding our plans, intentions, beliefs or current expectations.
Among the important factors that could cause actual results to differ materially from those indicated by forward-looking statements are the risks and uncertainties described under “Risk Factors” in our other filings with the Securities and Exchange Commission (“SEC”).
Forward-looking statements are expressly qualified in their entirety by this cautionary statement. The forward-looking statements included in this document are made as of the date of this document and we do not undertake any obligation to update forward-looking statements to reflect new information, subsequent events or otherwise.
PART I
Item 1 –Business
OVerview
Simulations Plus, Inc. (“Simulations Plus” or the “Company,” “us,” “we,” or “our”), which was incorporated in California in 1996, develops and produces software for use in pharmaceutical research and for education, and provides consulting and contract research services to the pharmaceutical industry. Simulations Plus also assumed responsibility for producing a personal productivity software program called Abbreviate!, originally spun out of products for the disabled created by our former subsidiary, Words+, for the retail market. Words+, founded in 1981, produces computer software and specialized hardware for use by persons with disabilities. During the first quarter of our fiscal year ended August 31, 2012, Words+ continued to refine its products for the disabled. We sold Words+, pursuant to that certain stock purchase agreement with the Prentke Romich Company of Wooster, Ohio, effective as of November 30, 2011. Words+ is now a wholly-owned subsidiary of the Prentke Romich Company. As a result of this sale, Words+ is treated as “discontinued operations” in our financial statements attached hereto. For more information regarding the Stock Purchase Agreement, please see the full text of such document filed as Exhibit 10.50 to this Annual Report on Form 10-K, which is incorporated herein by reference. Also see Note 12 under the Notes to the Financial Statements included in this Annual Report on Form 10-K for more information. The discussion in this Annual Report on Form 10-K will therefore focus on our ongoing operations for pharmaceutical software and services.
| 1 |
Products
We currently offer five software products for pharmaceutical research: ADMET Predictor™, MedChem Designer™, MedChem Studio™, DDDPlus™, and GastroPlus™. We call the combination of ADMET Predictor, MedChem Studio, and MedChem Designer our ADMET Design Suite™.
ADMET Predictor™
ADMET (Absorption, Distribution, Metabolism, Excretion and Toxicity) Predictor is a computer program that takes molecular structures as inputs and predicts over 140 different properties for them at the rate of about 200,000 compounds per hour on a laptop computer. This capability means that a pharmaceutical scientist can screen a very large number of molecules in a very short time using ADMET Predictor. The current state-of-the-art of this type of software allows identifying molecules that are sure to fail as potential drug candidates without the need to synthesize and test them. Millions of “virtual” compounds can now be created and screened in a day, compared to potentially months of work to synthesize and test a few hundred actual compounds. The ability to quickly eliminate obviously poor compounds in this manner enables chemists to investigate a much larger “chemical space” in their search for new medicines.
Pharmaceutical companies spend enormous amounts of money conducting a wide variety of experiments on new molecules each year, resulting in large databases of experimental data. Using this proprietary data to build predictive models can provide a second return on their investment; however, model building has traditionally been a tedious activity performed by specialists. The ADMET Modeler subprogram that is integrated into ADMET Predictor enables scientists without model-building experience to use their own experimental data to quickly create high-quality, proprietary predictive models using the same powerful modeling methods we use to build our top-ranked property predictions.
We released Version 6.0 of ADMET Predictor in April 2012. This new version incorporates a new feature that enables users to generate likely metabolites for any molecule using an embedded version of our MedChem Designer™ program. It also increases the number of predictive models for metabolism and toxicity, and refines many of our earlier predictions, which had already been top-rated in almost every published independent comparison study. In March 2010, we entered into the a royalty agreement with Enslein Research pursuant to which royalties were paid to Enslein Research from revenues on each license for the Enslein Metabolism Module. On February 28, 2012, we agreed to buyout this royalty agreement from Enslein Research. This buyout gave us sole ownership of the intellectual property rights used in the Enslein Metabolism Module and allowed us to merge the former Enslein Metabolism Module and our Metabolite Module into a single Metabolism Module, making it easier for customers to realize the value in the combined capabilities of the two separate functions. We are also progressing with curating the scientific literature for a much larger data set for certain enzymes known as the cytochrome P450 (“CYP”) family to further enhance our predictive capabilities for metabolism. These improvements to metabolism and metabolite prediction are now also available via MedChem Designer and MedChem Studio for customers who also license ADMET Predictor.
MedChem Designer™
MedChem Designer was launched in February 2011. It was initially a molecule drawing program, or “sketcher”, but now has capabilities beyond those of other molecule drawing programs because of its integration with both MedChem Studio and ADMET Predictor. We provide MedChem Designer for free because we believe that in the long run it will help to increase demand for ADMET Predictor and MedChem Studio. Most other existing molecule drawing programs are also free. The free version includes a small set of ADMET Predictor property predictions, allowing the chemist to modify molecular structures and then see a few key properties very quickly. The chemist also sees that with a paid ADMET Predictor license, over 140 predictions would be available.
| 2 |
When coupled with a license for ADMET Predictor, MedChem Designer becomes a de novo design tool for medicinal chemists. With it, they can draw one or more molecular structures, then click on the ADMET Predictor icon and have over 140 properties for each structure calculated in seconds, including our proprietary ADMET Risk™ index. ADMET Risk provides a single number that tells the chemist how many threshold values for more than 20 predicted properties were crossed (or violated) by each structure. Thus, in a single number, the chemist can instantly compare how different structural changes affect a variety of predicted properties. As chemists attempt to modify structures to improve one property, they often cause others to become unacceptable. Without ADMET Risk, the chemist would have to separately examine many key properties for each new molecule to check whether any became unacceptable as a result of changing the structure. Thus, ADMET Risk lets them “see” in many dimensions at once. We believe this provides a novel and unequaled capability for new molecule design. In addition to affecting the therapeutic target, there are many properties that are required for a molecule to become a drug, and ADMET Predictor can predict a large number of such properties.
We released MedChem Designer 2.0 in May 2012 with its new capabilities that show the most likely metabolites that would be produced from a parent molecule by the most dominant CYP enzymes. With this capability, the chemist can not only see predicted likely metabolites, but can also use ADMET Predictor to assess whether any of the predicted metabolites would be likely to result in unacceptable adverse effects. It is often the case that a molecule that could have been a good medicine is converted into a toxic metabolite that renders the original molecule dangerous or useless. This ability to predict metabolites and their properties is another way to reduce the number of molecules that are taken forward into development only to fail at a later stage after considerable time and money have been expended.
MedChem Studio™
Over the past several years, MedChem Studio updates have resulted in a better tool for medicinal and computational chemists for both data mining and for designing new drug-like molecules.
MedChem Designer can be used to refine a small number of molecules; however, refining a very large number of molecules down to a few promising lead candidates is the primary function of MedChem Studio (with ADMET Predictor). MedChem Studio has features that enable it to generate very large numbers of new molecular structures using a variety of de novo design methods. Coupled with ADMET Predictor, we believe the two programs provide an unmatched capability for chemists to search through large libraries of compounds that have undergone high-throughput screening experiments to find the most promising classes and molecules that are active against a particular target. In addition, MedChem Studio with ADMET Predictor can take an interesting (but not acceptable) molecule and very quickly generate many thousands of high quality analogs (i.e., similar new molecules) using a variety of design algorithms to generate new molecules that are predicted to be both active against the target as well as acceptable in a variety of ADMET properties. MedChem Designer (see above) is also a part of MedChem Studio, so the user can click on the MedChem Designer icon and bring up the drawing window to investigate how further modifications to the structures of molecules generated by MedChem Studio can improve their properties.
MedChem Studio version 3.0 was released in May 2012.
NCE Project
In March 2011, we initiated our own program of designing and making new molecules (NCEs, or New Chemical Entities) using the ADMET Design Suite (MedChem Studio/MedChem Designer/ADMET Predictor) based on our belief in the suite’s capabilities. We selected as a target the malaria parasite Plasmodium falciparum, both because there is an unmet need for a very low-cost cure, and because we believed that external funding opportunities might exist if we were successful in generating high-quality lead compounds using our software. We completed the design process early in the first quarter of fiscal year 2012 and in September 2012 we announced that we had requested quotations from chemical synthesis companies for the cost and time to make a small set of molecules. Five molecules of our own design were synthesized and tested for inhibition of the parasite at the University of California at Riverside. We were hoping that at least one would show inhibition of the growth cycle of the parasite.
| 3 |
Every molecule showed activity against the parasite at less than micromolar concentrations, with two showing activity at less than 100 nanomolar concentration (high potency) against the drug-sensitive strain of the parasite. They were then tested against the drug-resistant strain of the malaria parasite, and again potency was observed, with two molecules showing nanomolar activity. Several of these molecules were sent to another outside laboratory for additional experiments to measure a few key properties to compare the values versus our ADMET Predictor predictions. Our predictions for solubility, ionization constants (pKa), and lipophilicity were all well within accepted tolerances. Metabolism by human liver microsomes was much faster than predicted, probably due to metabolism by pathways our models do not yet predict. These molecules were only expected to be good lead molecules, not to be final drug molecules, so further structural changes would be expected to meet all requirements for an approved drug.
Our goal for this project was not actually to cure malaria. Rather, our goal was to demonstrate that a method of using our software tools to quickly and efficiently analyze high-throughput data, to generate new molecular structures, and to assess their qualities via ADMET Predictor, could result in high-quality lead candidates in a fraction of the time and cost usually required to reach that stage of drug development. We accomplished that and we have been presenting our results in scientific meetings and in webinars to a worldwide audience. We expect to pursue at least one more therapeutic target in the coming months.
DDDPlus
DDDPlus simulates in vitro laboratory experiments used to measure the rate of dissolution of the drug and sometimes the additives (excipients) contained in tablets and capsules under a variety of experimental conditions. This software program is used by formulation scientists in industry and the U.S. Food and Drug Administration (FDA) to (1) understand the physical mechanisms affecting the dissolution rate for various formulations, (2) reduce the number of cut-and-try attempts to design new drug formulations, and (3) to design in vitro dissolution experiments to better mimic in vivo conditions.
During fiscal year 2011, improvements were added to further enhance the value of this product, including numerous user convenience features, as well as more sophisticated handling of dosage forms that incorporate multiple polymers for controlled-release formulations. The FDA and a growing number of companies use DDDPlus in their work.
Development efforts for DDDPlus during fiscal year 2012 were limited because of priorities on other programs.
GastroPlus
Our flagship product and largest source of revenues is GastroPlus. GastroPlus simulates the absorption, pharmacokinetics, and pharmacodynamics of drugs administered to humans and animals, and is currently in use at numerous pharmaceutical companies, the FDA, the U.S. National Institutes of Health (NIH), and other government agencies in the U.S. and other countries. Because of GastroPlus, we were invited to joint the European Innovative Medicines Initiative (IMI) program for Oral Bioavailibility Tools (“OrBiTo”). We were the only non-European company invited to participate. OrBiTo is a collaboration among 27 industry, academic, and government organizations working in the area of oral absorption of pharmaceutical products. Because we are outside of Europe, our participation in this project is at our own expense, while other members are compensated for their work; however, we are a full member with access to all of the data and discussions of any other members. We believe participation in this initiative will enable us to benefit from and to contribute to advancing the prediction of human oral absorption from preclinical data.
| 4 |
We released version 8.0 of GastroPlus in April 2012. This new version added many new features, including:
| (1) | extending the predictive capabilities for ocular and nasal/pulmonary dosing; |
| (2) | adding a paracellular permeability capability that distinguishes between how some drug molecules permeate the intestinal membrane by moving through gaps between the epithelial cells from the diffusion through the cells; |
| (3) | enhancing the PDPlus™ pharmacodynamic module to incorporate a tumor compartment model and to better deal with multiple metabolites; and |
| (4) | providing enhanced graphical outputs and reporting capabilities requested by customers. |
We are expecting to release version 8.5 of GastroPlus before the end of calendar year 2012. This interim release adds several new capabilities requested by customers.
Contract Research and Consulting Services
Our expertise in oral absorption and pharmacokinetics is evidenced by the fact that our staff members have been speakers or presenters at over 80 prestigious scientific meetings worldwide in the past four years. We frequently conduct contracted studies for large customers (including top 5 pharmaceutical companies) who have particularly difficult problems and who recognize our expertise in solving them, as well as for smaller customers who prefer to have studies run by our scientists rather than to license our software and train someone to use it. The demand for our consulting services has been steady. Long-term collaborations and shorter-term consulting contracts serve both to showcase our technologies and to build and strengthen customer relationships.
During fiscal year 2012 we continued to work on our 5-year collaboration agreement with the Center for Food Safety and Applied Nutrition (CFSAN) of the FDA using ADMET Predictor/Modeler to build predictive models for likely toxicities of food additives and contaminants. During this first year of the collaboration, we analyzed FDA databases and worked with FDA scientists to ensure that the FDA data to be used for building new predictive models is as accurate as we can reasonably make it. Both FDA scientists and our scientists are building a series of models to classify new compounds as toxic or nontoxic from FDA datasets. Included in this effort was a special modification to ADMET Predictor to allow the user to set a minimum value for specificity or sensitivity when building a model. Sensitivity refers to how well a model identifies toxic (or any other property) compounds. A model that determined all compounds are toxic would have 100% sensitivity, because all toxic compounds would be labeled as such; however, all nontoxic compounds would also be labeled toxic. Specificity refers to how well a model distinguishes between toxic and nontoxic compounds. Increasing one usually results in decreasing the other. Depending on the purpose of the model, some scientists will prefer to train models that emphasize one statistic over the other.
Product Development
Development of our software is focused on expanding product lines, designing enhancements to our core technology and integrating existing and new products into our principal software architecture and platform technology. We intend to offer regular updates to our products and to continue to look for opportunities to expand our existing product suite.
| 5 |
We develop all of our products internally. We have also licensed products or have otherwise acquired products, or portions of our products, from other organizations. These arrangements sometimes require the payment of royalties by us. We intend to continue to license or otherwise acquire technology or products from third parties. We currently have two royalty agreements, one with TSRL, Inc. (“TSRL”) and another with Symyx Technologies (“Symyx”). In July 1997, we entered into a royalty agreement with TSRL pursuant to which royalties were paid to TSRL from revenues on each license for GastroPlus basic software. In March 2010, we entered into a royalty agreement with Symyx, which was merged with Accelrys, Inc., pursuant to which royalties were paid to Symyx from revenues on each license for Metabolite module. After we made a buyout agreement with Enslein Research, we combined Metabolism module and Metabolite module, and currently we pay royalties to Symyx from the sale of a new Metabolism module.
Marketing and Distribution
We market our pharmaceutical software and consulting services through attendance and presentations at scientific meetings, exhibits at trade shows, seminars at pharmaceutical companies and government agencies, through our web pages on the Internet, and using various communication media to our compiled database of prospects and customer names. At the American Association of Pharmaceutical Scientists (AAPS) conference in Chicago in October 2012, there were numerous different presentations and posters presented in which the research that was reported was done using our software. Many of those were from industry and FDA scientists, seven were from our staff.
During fiscal year 2012 we added one full-time salesperson. We have one independent distributor in Japan and two independent representatives in China; however, our scientific team is also the majority of our sales and marketing team, assisting our Vice President of Marketing and Sales and his staff with trade shows, seminars, and customer training both via Internet and on-site. We believe that this is more effective than a completely separate sales team for several reasons: (1) customers appreciate talking directly with developers who can answer a wide range of technical questions about methods and features in depth; (2) our scientists benefit from direct customer contact by gaining an appreciation for the environment and problems of the customer; and (3) the relationships we build through scientist-to-scientist contact are stronger than through salesperson-to-scientist contacts.
We use the Internet to provide product information and software updates, and as a forum for user feedback and information exchange. We have cultivated market share in North America, South America, Europe, Japan, Australia, New Zealand, Singapore, and the People’s Republic of China. Internet and e-mail technologies have had a positive influence on our ability to communicate with existing and potential customers worldwide.
Production
Our pharmaceutical software products are designed and developed entirely by our development team in California, with locations in Lancaster, Petaluma, San Jose, and San Diego. The principal materials and components used in the manufacture of simulation software products include CD-ROMs and instruction manuals, which are also produced in-house and through outside contractors. In-house graphic art and engineering talent enables us to accomplish this production in a cost-efficient manner.
Competition
In our pharmaceutical software and services business, we compete against a number of established companies that provide screening, testing and research services, and products that are not based on simulation software. There are also software companies whose products do not compete directly, but are sometimes closely related, to ours. Our competitors in this field include some companies with financial, personnel, research and marketing resources that are greater than ours. Management believes there is currently no significant competitive threat to GastroPlus or DDDPlus, however, one could be developed over time. MedChem Studio, MedChem Designer, and ADMET Predictor/ADMET Modeler operate in a more competitive environment. Several other companies presently offer simulation or modeling software, or simulation-software-based services, to the pharmaceutical industry.
| 6 |
Major pharmaceutical companies conduct drug discovery and development efforts through their internal development staffs and through outsourcing some of this work. Smaller companies generally need to outsource a greater percentage of this research. Thus, we compete not only with other software suppliers, but also with the in-house development teams at some of the larger pharmaceutical companies.
Although competitive products exist, both new licenses and license renewals for GastroPlus have continued to grow in spite of this competition. We believe that we enjoy a dominant market share in this segment. We believe that the success of our recent NCE project in which we designed, had synthesized, and tested a number of new molecules to treat malaria has cultivated strong interest in our ADMET Design Suite (ADMET Predictor/ MedChem Studio/ MedChem Designer). Presentations in the U.S., Japan, and Europe over the past several months since the results were released have been well received and companies have requested evaluation copies of the software to determine whether it can increase their productivity.
We believe the key factors in competing in this field are our ability to develop industry-leading simulation and modeling software and related products and services to effectively predict activities and ADMET-related behaviors of new drug-like compounds, to design new molecules with acceptable activity and ADMET properties, to develop and maintain a proprietary database of results of physical experiments that will serve as a basis for simulated studies and empirical models, to attract and retain a highly skilled scientific and engineering team, and to develop and maintain relationships with research and development departments of pharmaceutical companies, universities and government agencies.
We are actively seeking acquisitions to expand the pharmaceutical software and services business. Earlier attempts to acquire other companies have not been successful either in arriving at mutually agreeable terms and conditions, or because of adverse conditions discovered during our due diligence process.
TRAINING AND TECHNICAL SUPPORT
Customer training and technical support are important factors in customer satisfaction for our pharmaceutical products, and we believe we are an industry leader in providing customer training and technical support in our business areas. We provide in-house seminars at customers’, and potential customers’, sites. These seminars often serve as initial training in the event the potential customer decides to license or evaluate our software. Technical support is provided after the sale of any software in the form of on-site training (at the customer’s expense), web meetings, telephone, fax, and e-mail assistance to the customer’s users during the customer’s license period. We have used Internet meetings extensively to provide demonstrations and customer assistance, resulting in rapid response to requests worldwide and reducing our travel time and expenses.
Technical support for pharmaceutical software is provided by our life sciences team and our inside sales and support staff based at our headquarters facilities in Lancaster, California. We provide free telephone support offering toll-free numbers in the U.S. and Canada, and e-mail and web-based support for all of our pharmaceutical software products worldwide. Technical support for pharmaceutical software products is minimal, averaging a few person-hours per month.
RESEARCH AND DEVELOPMENT
We believe that our ability to grow and remain competitive in our markets is strongly dependent on investment into research and development (“R&D”). R&D activities include both enhancement of existing products and development of new products. Development of new products and adding functionality to existing products are capitalized in accordance with Financial Accounting Standards Board (“FASB”) Accounting Standards Codification (“ASC”) 985-20, “Costs of Software to Be Sold Leased, or Marketed”. R&D expenditures, which primarily relate to both capitalized and expensed salaries, R&D supplies, laboratory testing, and R&D consulting, were approximately $1,900,000 during fiscal year 2012, of which $952,000 was capitalized. R&D expenditures during fiscal year 2011 were approximately $1,261,000, of which $797,000 was capitalized.
| 7 |
Our pharmaceutical business R&D activities during fiscal year 2012 were focused on improving our ADMET Predictor/ADMET Modeler, MedChem Studio, MedChem Designer and GastroPlus products.
EMPLOYEES
As of August 31, 2012, we employed 25 full-time employees and no part-time employees, including 17 in research and development, 4 in marketing and sales, 4 in administration and accounting. Currently 15 employees hold Ph.D.s and 1 is a Ph.D. candidate in their respective science or engineering disciplines. Additionally, 4 employees hold one or more Master’s degrees. Most of the senior management team and the members of our Board of Directors hold graduate degrees. We believe that our future success will depend, in part, on our ability to continue to attract, hire and retain qualified personnel. We continue to seek additions to our life sciences team although the competition for such personnel in the pharmaceutical industry is intense. None of our employees is represented by a labor union, and we have never experienced a work stoppage. We believe that our relations with our employees are good.
Intellectual Property and Other Proprietary Rights
We own two patents that were acquired as part of our acquisition of certain assets of Bioreason, Inc. in November 2005. We primarily protect our intellectual property through copyrights and trade secrecy. Our intellectual property consists primarily of source code for computer programs and data files for various applications of those programs in the pharmaceutical software businesses. The expertise of our staff is a considerable asset closely related to intellectual property, and attracting and retaining highly qualified scientists and engineers is essential to our business.
EFFECT OF GOVERNMENT REGULATIONS
Our pharmaceutical software products are tools used in research and development and are neither approved nor approvable by the FDA or other government agencies.
Item 1A – risk factors
Not applicable because we are a smaller reporting company.
Item 1B – UNRESOLVED STAFF COMMENTS
Not applicable.
Item 2 –propertIES
We lease approximately 13,500 square feet of space in Lancaster, California. The original agreement had a five-year term with two (2), three (3)-year options to extend. Since the original five-year term expired in February 2011, we have exercised the first of the two (2), three (3)-year options. The base rent started at the rate of $18,445 per month plus common area maintenance fees. The base rental rate increases at 4% annually and it is currently $23,339 per month, plus common area maintenance fees. We believe that this facility is sufficient for our current needs and growth for the foreseeable future.
After the sale of our subsidiary, Words+, we entered into a sublease agreement under which Words+ pays 20%of the monthly rent we pay to our landlord, plus 20% of facility-related operating expenses. This sublease is on a month-to-month basis commencing on January 1, 2012. We report all of our lease expense under Selling, General and Administrative expense; however, the payments received from Words+ are reported under Other Income. Also see Item 7 “Management’s Discussion and Analysis of Financial Condition and Results of Operations” and Note 4 under the Notes to the Financial Statements included in this Annual Report on Form 10-K for more information.
| 8 |
Item 3 – LEGAL PROCEEDINGS
We are not a party to any legal proceedings and are not aware of any pending legal proceedings of any kind.
Item 4 – MINE SAFETY DISCLOSURES.
Not applicable.
PART II
Item 5 – MARKET for Registrant’s Common Equity and Related Stockholder Matters AND ISSUER PURCHASES OF EQUITY SECURITIES
There is currently no share repurchase program pending, and the Company made no repurchases of its securities within the fourth quarter of the fiscal year 2012.
The following table shows low and high sales price for the Company’s common stock for the last eight fiscal quarters.
| Low Sales Price | High Sales Price | |||||||
| FY11: | ||||||||
| Quarter ended August 31, 2012 | 3.76 | 4.46 | ||||||
| Quarter ended May 31, 2012 | 3.66 | 4.61 | ||||||
| Quarter ended February 29, 2012 | 2.91 | 4.25 | ||||||
| Quarter ended November 30, 2011 | 2.97 | 3.24 | ||||||
| FY10: | ||||||||
| Quarter ended August 31, 2011 | 2.76 | 3.47 | ||||||
| Quarter ended May 31, 2011 | 2.68 | 3.27 | ||||||
| Quarter ended February 28, 2011 | 2.42 | 3.69 | ||||||
| Quarter ended November 30, 2010 | 2.40 | 3.50 | ||||||
COMPANY STOCK PRICE PERFORMANCE
The stock price performance graph below and stock price tables above are not required by the SEC and shall not be deemed to be incorporated by reference by any general statement incorporating by reference this Annual Report on Form 10-K into any filing under the Securities Act or under the Exchange Act except to the extent that the Company specifically incorporates this information by reference, and shall not otherwise be deemed soliciting material or filed under such the Securities Act or the Exchange Act.
| 9 |
The graph below compares the cumulative total shareholder return on the common stock of the Company from the last day of the first month of trading of the Company’s common stock from August 31, 2002 to August 31, 2012 with the cumulative total return on the Russell 2000 Index, and the S&P 600 Small Cap Index (assuming the investment of $100 in the Company’s common stock and in each of the indices on August 31, 2002, and reinvestment of all dividends). The stock price performance on the graph is not necessarily indicative of future stock price performance.
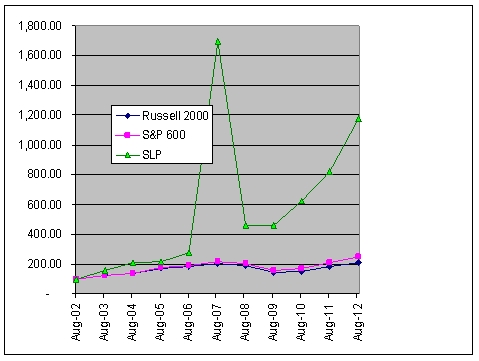
The graph above was plotted using the following data:
| Russell 2000 | S&P 600 | SLP | ||||||||||||||||||||||
| 30-Aug-02 | $ | 390.96 | 100.00 | $ | 30.35 | 100.00 | $ | 0.38 | 100.00 | |||||||||||||||
| 29-Aug-03 | $ | 497.42 | 127.23 | $ | 37.29 | 122.87 | $ | 0.61 | 160.53 | |||||||||||||||
| 31-Aug-04 | $ | 547.93 | 140.15 | $ | 42.80 | 141.02 | $ | 0.80 | 210.53 | |||||||||||||||
| 31-Aug-05 | $ | 666.51 | 170.48 | $ | 54.07 | 178.15 | $ | 0.82 | 215.79 | |||||||||||||||
| 31-Aug-06 | $ | 720.53 | 184.30 | $ | 57.63 | 189.88 | $ | 1.06 | 278.95 | |||||||||||||||
| 31-Aug-07 | $ | 792.86 | 202.80 | $ | 65.33 | 215.26 | $ | 6.44 | 1,694.74 | |||||||||||||||
| 29-Aug-08 | $ | 739.50 | 189.15 | $ | 61.01 | 201.02 | $ | 1.75 | 460.53 | |||||||||||||||
| 31-Aug-09 | $ | 572.07 | 146.32 | $ | 48.21 | 158.85 | $ | 1.74 | 457.89 | |||||||||||||||
| 31-Aug-10 | $ | 602.06 | 154.00 | $ | 51.82 | 170.74 | $ | 2.37 | 623.68 | |||||||||||||||
| 31-Aug-11 | $ | 726.81 | 185.90 | $ | 64.43 | 212.29 | $ | 3.12 | 821.05 | |||||||||||||||
| 31-Aug-12 | $ | 812.09 | 207.72 | $ | 75.33 | 248.20 | $ | 4.46 | 1,173.68 | |||||||||||||||
* Close price adjusted for dividends and splits.
Item 6 – SELECTED FINANCIAL DATA
Not applicable because we are a smaller reporting company.
| 10 |
Item 7 – Management’s Discussion and Analysis oF FINANCIAL CONDITION AND RESULTS of OperationS
The following discussion and analysis should be read in conjunction with the Financial Statements and related notes included in this Annual Report on Form 10-K.
Management Overview
Fiscal year 2012 highlights:
| · | We signed two funded collaboration agreements with top-5 pharmaceutical companies to extend the capabilities of our flagship GastroPlus™ software with an enhanced oral cavity absorption model and to add the ability to simulate dosing through the skin. |
| · | We successfully completed the first year of our five-year renewable collaboration with the Center for Food Safety and Nutrition of the FDA to develop predictive toxicity models for food additives and contaminants |
| · | On November 30, 2011, we completed the sale of Words+, Inc. for $1,973,000 in cash. Words+ operations are now presented as discontinued operations in this Form 10K |
| · | We completed a drug design process targeting the malaria parasite, including data mining of a large public domain database, design of new molecular structures, synthesizing a selected set of molecules, and testing them against the parasite. Every molecule we designed and synthesized inhibited the growth of the parasite. |
| · | We attempted to acquire certain assets of Entelos through their bankruptcy proceeding. We were unsuccessful in that offering. |
| · | We expanded our technical staff, adding three new Ph.D. scientists to the Life Sciences department and one new scientist to our marketing and sales department. |
| · | We reinitiated the development of the MembranePlus™ software program for simulation of in vitro permeability experiments. This project had begin in 2004 but was postponed for more pressing activities. With our expanded scientific staff, we have now been able to continue the development of this new product. We expect to release it during calendar year 2013. |
| · | The Board of Directors declared an ongoing quarterly cash dividend of $0.05 per share ($0.20 per year). We made dividend distributions in March, May, and August and the board declared the next distribution for November 13, 2012, which is in fiscal year 2013. The total cash distribution each quarter is just below $800,000, so we paid out approximately $2.4 million in dividends in fiscal year 2012. |
| · | Our cash position remained strong, with cash at the end of the fiscal year of $12.7 million, compared to $10.2 million at the end of fiscal year 2011. |
Fiscal year 2012 Financial Summary:
| · | Gross revenues increased 8.1% to $9,449,000 from $8,739,000 in fiscal year 2011 |
| · | Selling, General and Administrative expenses increased 6.1% to $3,379,000 from $3,186,000 in fiscal year 2011 |
| · | Research and Development expenditures increased 50.7% to $1,900,000 from $1,261,000 in fiscal year 2011. Approximately $140,000 of this increase was for outside services to synthesize and test the new molecules we designed to inhibit the growth of the malaria parasite. |
| · | Income from continuing operations increased 5.6% to $2,812,000 from $2,663,000 in fiscal year 2011 |
| 11 |
Strategy Going Forward:
| · | Continue to advance our software offerings through both our in-house developments and our funded and unfunded collaborations with our industry and government customers |
| · | Continue to seek acquisition and partnership possibilities to broaden our offerings of products and services |
| · | Continue our aggressive marketing and sales campaign including attending and exhibiting at numerous scientific conferences and meetings, expanded use of social media, and expanded advertising |
| · | Increase our marketing and sales efforts with respect our consulting services in both pharmacokinetics and in small molecule design |
| · | Seek partners for our malaria new chemical initiative to take it further into development |
| · | Select a new target and repeat our drug design, synthesis, and test activities as we did for malaria to further demonstrate the capabilities of our ADMET Design Suite to generate high-quality lead compounds in a fraction of the time and cost normally required |
Fiscal year 2012 was a record year comprised of four record quarters. We believe the continued growth of our pharmaceutical software and services business segment is the result of increasing adoption of simulation and modeling software tools such as those we produce, as well as the expertise we offer as consultants to assist companies involved in the research and development of new medicines, which has resulted in a continuing series of study contracts with pharmaceutical companies ranging from several of the largest in the world to a number of medium-sized and smaller companies in the U.S. and Europe.
During fiscal year 2012 we released upgrades to three of our five pharmaceutical software offerings, as well as to our software product called MedChem Designer. Our financial performance enabled us to continue to increase our cash deposits, remain debt-free, and continue to invest in the marketing and sales activities we began in early 2009 in order to reach a wider customer base.
We have not been successful in identifying and completing any acquisitions during this reporting period in spite of a number of investigations and due diligence activities. In every case, either our due diligence activities revealed undesirable aspects of the potential acquisition, or terms and conditions agreeable to both sides were not able to be reached. It is our intent to continue to search for acquisition opportunities that would be compatible with our current businesses and that would be accretive, i.e., adding to both revenues and earnings.
In the past, we have used some of our cash to repurchase shares of our common stock because we believe that reducing the number of fully diluted shares provides greater value to our shareholders than receiving a low interest rate on our cash deposits, and because we believe that our cash deposits after such repurchases remain sufficient to accomplish any reasonable potential acquisitions as well as to maintain sufficient cash reserves to ensure meeting operational needs for the foreseeable future. Although there are no stock repurchase programs pending, the board of directors may consider additional repurchases at any time at prices and under conditions set by the board.
Results of Operations
The following sets forth selected items from our statements of operations (in thousands) and the percentages that such items bear to net sales for the fiscal years ended August 31, 2012 (“FY12”) and August 31, 2011 (“FY11”).
| 12 |
| Fiscal years ended | ||||||||||||||||
| 8/31/12 | 8/31/11 | |||||||||||||||
| Net sales | $ | 9,449 | 100% | $ | 8,739 | 100% | ||||||||||
| Cost of sales | 1,510 | 16.0 | 1,559 | * | 17.8 | |||||||||||
| Gross profit | 7,939 | 84.0 | 7,180 | 82.2 | ||||||||||||
| Selling, general and administrative | 3,379 | 35.8 | 3,186 | * | 36.5 | |||||||||||
| Research and development | 948 | 10.0 | 464 | * | 5.3 | |||||||||||
| Total operating expenses | 4,327 | 45.8 | 3,650 | 41.8 | ||||||||||||
| Income from operations | 3,612 | 38.2 | 3,530 | 40.4 | ||||||||||||
| Other income | 343 | 3.6 | 168 | 1.9 | ||||||||||||
| Net income before taxes | 3,955 | 41.9 | 3,698 | 42.3 | ||||||||||||
| (Provision) for income taxes | (1,143 | ) | (12.1 | ) | (1,035 | ) | (11.8 | ) | ||||||||
| Income from continuing operations | 2,812 | 29.8% | 2,663 | 30.5 | ||||||||||||
| Results of discontinued operations, net of tax | 216 | 2.3 | 52 | 0.6 | ||||||||||||
| Net income | $ | 3,028 | 32.1% | $ | 2,715 | 31.1% | ||||||||||
* Numbers in the prior year have been reclassified to conform to the current year’s presentation.
FY12 Compared with FY11
Net Sales
Net sales increased $710,000, or 8.1%, to $9,449,000 in fiscal year 2012 from $8,739,000 in FY11. We attribute the increase in pharmaceutical software sales to increases in the number of licenses with new and existing customers, as well as licensing of new modules to existing customers, especially for our GastroPlus line of products because it has more modules than other products we offer. In addition, in the 4th quarter we began two funded collaborations that will expand the capabilities of our GastroPlus software.
Those increases outweighed the decreases in net sales from previously large funded collaborations and analytical studies (large collaboration contracts were completed by August 2010), workshops, and a Small Business Innovation Research Grant (2-year grant from NIH ended in March 2011.)
The revenue from software licenses resulted in an increase of $8,002,000, or 12.4%, while the revenue from services, such as funded collaborations contracts, grant, and analytical study contracts, resulted in a decrease of $281,000, or 38.2%.
Cost of Sales
Cost of sales decreased $49,000, or 3.1%, to $1,510,000 in FY12 from $1,559,000 in FY11. As a percentage of net sales, cost of sales also decreased by 1.8%.
A significant portion of cost of sales is the systematic amortization of capitalized software development costs, which is an independent fixed cost rather than a variable cost related to sales. This amortization cost increased approximately $7,000, or 1%, in FY12 compared with FY11.
Royalty expense, a variable cost related to sales of our GastroPlus core program as well as royalties from the agreement with Accelrys, Inc. (the original agreement was with Symyx Technologies which merged with Accelrys, Inc. in 2010) Metabolite/Metabolism, decreased approximately $26,000, or 5%, in FY12 compared with FY11. We also incurred royalty expense on the Enslein Metabolism Module; however, we signed an agreement to buy out this royalty agreement from Enslein Research of Rochester, New York on February 28, 2012 for $75,000, and as a result, we no longer had this royalty expense beginning March 2012.
| 13 |
Service cost, such as labor costs for trainings/workshops, analytical studies, and technical support, decreased approximately $85,000, or 26%, in FY12 compared with FY11 as a result of a lesser number of person-hours allocated to those services during FY12 compared with FY11.
Gross Profit
Gross profit increased $759,000, or 10.6%, to $7,939,000 in FY12 from $7,180,000 in FY11. We attribute this increase to the increased sales of pharmaceutical software and a decrease in the cost of goods sold.
Selling, General and Administrative Expenses
Selling, general and administrative (“SG&A”) expenses increased $193,000, or 6.1% to $3,379,000 in FY12, compared to $3,186,000 in FY11; however, as a percentage of sales, SG&A decreased to approximately 35.8% in FY12 from approximately 36.5% in FY11. The increase in SG&A expenses is due to an increase in the amount of our office rent to $293,000 from $144,000, because we now pay the entire office lease following the sale of our former subsidiary, Words+, on November 30, 2011. Although we continue to sublease approximately 20% of the office space to Words+, the income from the sublease is recorded as Other Income and so does not directly offset the increase in SG&A. Other increases in SG&A expense were due to increases in the costs associated with advertising, trade shows, marketing and labor, as we attended more trade shows and conferences in FY12, we also contracted additional labor, were subject to a new tax on sales generated in India which the Indian government regulates, and had additional payroll-related expenses, such as payroll taxes, 401k and insurances. These increases outweighed decreased consulting fees, equipment rental, and recruiting costs.
Research and Development
We incurred approximately $1,900,000 of research and development costs during FY12. Of this amount, $952,000 was capitalized and $948,000 was expensed. In FY11, we incurred $1,261,000 of research and development costs, of which $797,000 was capitalized and $464,000 was expensed. The increase of $639,000, or 50.7%, in total research and development expenditures from FY11 to FY12 was due to laboratory experimental costs of $140,000 for our NCE (new chemical entity) malaria project, staff increases, and salary increases for existing staff.
Income from operations
During FY12, we generated income from operations of $3,612,000, as compared to $3,530,000 for FY11, an increase of 2.3%. We attribute this increase to increases in gross profit and decreases in the cost of goods sold which outweighed increases in SG&A expense and research and development expenses.
Other Income and (Expense)
Net other income (expense) increased by $175,000, or 104.2%, to $343,000 in FY12 from $168,000 in FY11. This is due to gains from Japanese Yen and Chinese Yuan currency exchanges and sublease payments we received from Words+ for their rented space.
Provision for Income Taxes
Provision for income taxes for FY12 increased by $108,000, or 10.4%, to $1,143,000, compared to $1,035,000 for FY11 due to the increase in net income. The tax rate used in this report is lower than the standard rate because of various tax credits generated during the reporting period for this Annual Report on Form 10-K.
| 14 |
Income from Continuing Operations
Net income from continuing operations for FY12 increased by $149,000, or 5.6%, to $2,812,000, compared to $2,663,000 for FY11. We attribute this increase in net income to increased gross profit and other income, which outweighed increases in SG&A expenses and taxes.
Seasonality
Sales in our business segment exhibit some seasonal fluctuations, with the fourth fiscal quarter (June-August) generally having the lowest sales over the past three fiscal years because of summer vacations and reduced activities at our customers’ sites. This unaudited net sales information has been prepared on the same basis as the annual information presented elsewhere in this Annual Report on Form 10-K and, in the opinion of management, reflects all adjustments (consisting of normal recurring entries) necessary for a fair presentation of the information presented. Net sales for any quarter are not necessarily indicative of sales for any future period; however, because our pharmaceutical software is licensed on an annual basis, renewals are generally within the same quarter year after year.
| Net Sales (in thousands) | ||||||||||||||||||||
| FY | First Quarter | Second Quarter | Third Quarter | Fourth Quarter | Total | |||||||||||||||
| 2012 | 2,248 | 2,789 | 2,772 | 1,640 | 9,449 | |||||||||||||||
| 2011 | 2,050 | 2,622 | 2,640 | 1,427 | 8,739 | |||||||||||||||
| 2010 | 1,735 | 2,227 | 2,325 | 1,334 | 7,621 | |||||||||||||||
| 2009 | 1,430 | 1,779 | 1,985 | 1,107 | 6,301 | |||||||||||||||
| 2008 | 1,438 | 1,550 | 1,975 | 1,092 | 6,055 | |||||||||||||||
| 2007 | 824 | 1,808 | 1,659 | 1,465 | 5,756 | |||||||||||||||
| 2006 | 199 | 884 | 1,096 | 1,007 | 3,186 | |||||||||||||||
| 2005 | 524 | 410 | 662 | 473 | 2,069 | |||||||||||||||
| 2004 | 642 | 742 | 603 | 869 | 2,856 | |||||||||||||||
| 2003 | 507 | 582 | 614 | 1,403 | 3,106 | |||||||||||||||
| 2002 | 390 | 554 | 504 | 595 | 2,043 | |||||||||||||||
| 2001 | 221 | 373 | 305 | 282 | 1,181 | |||||||||||||||
| 2000 | 151 | 467 | 143 | 174 | 935 | |||||||||||||||
| 1999 | 87 | 93 | 117 | 164 | 461 | |||||||||||||||
| 1998 | 11 | 11 | 13 | 27 | 62 | |||||||||||||||
Liquidity and Capital Resources
Our principal source of capital has been cash flow from our operations. We have achieved continuous positive operating cash flow over the last nine fiscal years. We believe that our existing capital and anticipated funds from operations will be sufficient to meet our anticipated cash needs for working capital and capital expenditures for the foreseeable future. Thereafter, if cash generated from operations is insufficient to satisfy our capital requirements, we may open a revolving line of credit with a bank, or we may have to sell additional equity or debt securities or obtain expanded credit facilities. In the event such financing is needed in the future, there can be no assurance that such financing will be available to us, or, if available, that it will be in amounts and on terms acceptable to us.
We are not aware of any trends or demands, commitments, or uncertainties that are reasonably likely to result in a decrease in liquidity of our assets. The trend over the last ten years has been increasing cash deposits from our operating cash flows, and we expect that trend to continue for the foreseeable future. We have no material commitments for capital expenditures as of the end of the latest fiscal period.
| 15 |
We continue to seek opportunities for strategic acquisitions. If one or more such acquisition is identified, a substantial portion of our cash reserves may be required to complete it; however, we intend to maintain sufficient cash reserves after any acquisition to provide reasonable assurance that outside financing will not be necessary to continue operations. If we identify an attractive acquisition that would require more cash to complete than we are willing or able to use from our cash reserves, we will consider financing options to complete the acquisition, including obtaining loans and issuing additional securities.
Because we have not been able to find suitable acquisitions for several years, the board of directors decided to distribute a portion of our cash reserves to our shareholders, declaring an ongoing $0.05 per share per quarter cash dividend beginning with the second quarter of FY12. Quarterly dividend payments were made on March 1, May 8, and August 10, 2012 during FY12. There can be no assurances that our Board of Directors will continue the dividend distributions for any specified number of quarters; however, there is no current plan to discontinue the quarterly dividend distributions.
UNUSUAL OR INFREQUENT EVENTS
On November 30, 2011, we sold our entire interest in our former wholly-owned subsidiary, Words+, an augmentative and alternative communication device manufacturer, for aggregate gross proceeds of $1.97 million. We recognized a gain of approximately $465,820, net of tax, from the sale of Words+, which is included in discontinued operations in our statement of operations for the fiscal year ended August 31, 2012. The difference between the sales price and the net gain is a result of adjustments to net working capital from August 31, 2011, until the closing on November 30, 2011, legal fees, auditing fees, tax specialist’s fees, and severance compensation for terminated employees.
KNOWN TRENDS OR UNCERTAINTIES
Although we have not seen any significant reduction in revenues to date, we have seen consolidation in the pharmaceutical industry during the current economic downturn. This trend has not had a negative effect on our total sales to that industry; however, these consolidations and downsizing in the industry could have an impact on our revenues and earnings going forward.
We believe that the need for improved productivity in the research and development activities directed toward developing new medicines will continue to result in increasing adoption of simulation and modeling tools such as those we produce. New product developments in the pharmaceutical business segments could result in increased revenues and earnings if they are accepted by our markets; however, there can be no assurances that new products will result in significant improvements to revenues or earnings. For competitive reasons, we do not disclose all of our new product development activities.
Our continued quest for acquisitions in the pharmaceutical business segment could result in a significant change to revenues and earnings if one or more such acquisitions are completed.
INFLATION
We have not been affected materially by inflation during the periods presented, and no material effect is expected in the near future.
OFF-BALANCE SHEET ARRANGEMENTS
As of August 31, 2012, we did not have any relationships with unconsolidated entities or financial partnerships, such as entities often referred to as structured finance or special purpose entities, which would have been established for the purpose of facilitating off-balance sheet arrangements or other contractually narrow or limited purposes. As such, we are not materially exposed to any financing, liquidity, market or credit risk that could arise if we had engaged in such relationships.
| 16 |
We do not have relationships or transactions with persons or entities that derive benefits from their non-independent relationship with us or our related parties.
RECENTLY ISSUED or Newly adopted ACCOUNTING STANDARDS
In September 2009, the Financial Accounting Standards Board (“FASB”) issued Accounting Standards Update (“ASU”) 2009-14 which amends Statement of Position (“SOP”) 97-2, “Software Revenue Recognition”, to exclude tangible products containing software components and non-software components that function together to deliver the product’s essential functionality. ASU 2009-14 applies to revenue arrangements entered into or materially modified in fiscal years beginning on or after June 15, 2010, with early application permitted with EITF 08-1 (as defined below). We adopted this standard in the first quarter of fiscal 2011. We believe adoption did not have a material effect on our financial statements.
In September 2009, the FASB issued ASU 2009-13, “Revenue Arrangements with Multiple Deliverables” (“EITF 08-1”). EITF 08-1 amends Emerging Issues Task Force (“EITF”) 00-21, “Revenue Arrangements with Multiple Deliverables”, to require an entity to use an estimated selling price when vendor-specific objective evidence or acceptable third-party evidence does not exist for any products or services included in a multiple element arrangement. The arrangement consideration should be allocated among the products and services based upon their relative selling prices, thus eliminating the use of the residual method of allocation. EITF 08-1 also requires expanded qualitative and quantitative disclosures regarding significant judgments made and changes in applying the guidance. EITF 08-1 applies to fiscal years beginning after June 15, 2010, with early application permitted. We adopted this standard in the first quarter of fiscal 2011. We believe adoption did not have a material effect on our financial statements.
In May 2011, the FASB issued ASU 2011-04, Fair Value Measurement (“ASU 2011-04”), which amended Accounting Standard Codification (“ASC”) 820, Fair Value Measurements (“ASC 820”), providing a consistent definition and measurement of fair value, as well as similar disclosure requirements between U.S. generally accepted account principals and International Financial Reporting Standards. ASU 2011-04 changes certain fair value measurement principles, clarifies the application of existing fair value measurement and expands the disclosure requirements. We adopted this standard in the first quarter of 2012. We believe adoption did not have a material effect on our financial statements.
In June 2011, the FASB issued ASU 2011-05, Presentation of Comprehensive Income (“ASU 2011-05”). ASU 2011-05 requires the presentation of comprehensive income in either (1) a continuous statement of comprehensive income or (2) two separate but consecutive statements. We adopted this standard in the first quarter of 2012. We believe adoption did not have a material effect on our financial statements.
In September 2011, the FASB issued ASU 2011-08, Testing Goodwill for Impairment (“ASU 2011-08”), which amends the guidance in ASC 350-20, Intangibles—Goodwill and Other – Goodwill. ASU 2011-08 provides entities with the option of performing a qualitative assessment before calculating the fair value of the reporting unit when testing goodwill for impairment. If the fair value of the reporting unit is determined, based on qualitative factors, to be more likely than not less than the carrying amount of the reporting unit, the entities are required to perform a two-step goodwill impairment test. We adopted this standard in the first quarter of 2012. We believe adoption did not have a material effect on our financial statements.
| 17 |
In December 2011, the FASB issued ASU No. 2011-11, “Disclosures about Offsetting Assets and Liabilities.” The amendments in this update require enhanced disclosures around financial instruments and derivative instruments that are either (1) offset in accordance with either ASC 210-20-45 or ASC 815-10-45 or (2) subject to an enforceable master netting arrangement or similar agreement, irrespective of whether they are offset in accordance with either ASC 210-20-45 or ASC 815-10-45. An entity should provide the disclosures required by those amendments retrospectively for all comparative periods presented. The amendments are effective during interim and annual periods beginning after February 28, 2012. We adopted this standard in the third quarter of 2012. We believe adoption did not have a material effect on our financial statements.
In July 2012, the FASB issued ASU 2012-02, “Testing Indefinite-Lived Intangible Assets for Impairment”, which amended the guidance in ASU 2011-08 to simplify the testing of indefinite-lived intangible assets other than goodwill for impairment. ASU 2012-02 becomes effective for annual and interim impairment tests performed for fiscal years beginning on or after September 15, 2012 and earlier adoption is permitted. We adopted this standard in the first quarter of fiscal year 2013. We believe adoption did not have a material effect on our financial statements.
Revenue Recognition
We recognize revenues related to software licenses and software maintenance in accordance with the FASB ASC 985-605, “Software – Revenue Recognition”. Software products revenue is recorded when the following conditions are met: 1) evidence of arrangement exists; 2) delivery has been made; 3) the amount is fixed; and 4) collectability is probable. Post-contract customer support (“PCS”) obligations are insignificant; therefore, revenue for PCS is recognized at the same time as the licensing fee, and the costs of providing such support services are accrued and amortized over the obligation period.
As a byproduct of ongoing improvements and upgrades for the new programs and new modules of software, some modifications are provided to our customers who have already purchased software at no additional charge. Other software modifications result in new, additional cost modules that expand the functionality of the software. These are licensed separately. We consider the modifications that are provided without charge to be minimal, as they do not significantly change the basic functionality or utility of the software, but rather add convenience, such as being able to plot some additional variable on a graph in addition to the numerous variables that had been available before, or adding some additional calculations to supplement the information provided from running the software. Such software modifications for any single product have typically occurred once or twice per year, sometimes more, sometimes less. Thus, they are infrequent. The Company provides, for a fee, additional training and service calls to its customers and recognizes revenue at the time the training or service call is provided.
Generally, we enter into one-year license agreements with customers for the use of our pharmaceutical software products. We recognize revenue on these contracts when all the criteria are met.
Most license agreements have a term of one year; however, from time to time, we enter into multi-year license agreements. We generally unlock and invoice software one year at a time for multi-year licenses. Therefore, revenue is recognized one year at a time.
We recognize the revenue from collaboration research and the revenue from grants equally over their terms. However, we recognize the contract study revenue using the percentage of completion method, depending upon how the contract studies are engaged, in accordance with FASB ASC 605-35, “Revenue Recognition – Construction-Type and Production-Type Contracts”. To recognize revenue using the percentage of completion method, we must determine whether we meet the following criteria: 1) there is a long-term, legally enforceable contract and 2) it is possible to reasonably estimate the total project costs, and 3) it is possible to reasonably estimate the extent of progress toward completion.
| 18 |
Capitalized Computer Software Development Costs
Software development costs are capitalized in accordance with FASB ASC 985-20, “Costs of Software to Be Sold Leased, or Marketed”. Capitalization of software development costs begins upon the establishment of technological feasibility and is discontinued when the product is available for sale.
The establishment of technological feasibility and the ongoing assessment for recoverability of capitalized software development costs require considerable judgment by management with respect to certain external factors including, but not limited to, technological feasibility, anticipated future gross revenues, estimated economic life, and changes in software and hardware technologies. Capitalized computer software development costs are comprised primarily of salaries and direct payroll-related costs and the purchase of existing software to be used in the Company’s software products.
Amortization of capitalized computer software development costs is provided on a product-by-product basis on the straight-line method over the estimated economic life of the products (not to exceed five years). Amortization of software development costs amounted to $668,021 and $660,893 for the years ended August 31, 2012 and 2011, respectively. We expect future amortization expense to vary due to increases in capitalized computer software development costs.
We test capitalized computer software development costs for recoverability whenever events or changes in circumstances indicate that the carrying amount may not be recoverable.
Income Taxes
We utilize FASB ASC 740-10, “Income Taxes”, which requires the recognition of deferred tax assets and liabilities for the expected future tax consequences of events that have been included in the financial statements or tax returns.
Under this method, deferred income taxes are recognized for the tax consequences in future years of differences between the tax bases of assets and liabilities and their financial reporting amounts at each year-end based on enacted tax laws and statutory tax rates applicable to the periods in which the differences are expected to affect taxable income. Valuation allowances are established, when necessary, to reduce deferred tax assets to the amount expected to be realized. The provision for income taxes represents the tax payable for the period and the change during the period in deferred tax assets and liabilities.
Stock-Based Compensation
We account for stock options using the modified prospective method in accordance with FASB ASC 718-10, “Compensation-Stock Compensation”. Under this method, compensation costs include: (1) compensation cost for all share-based payments granted prior to, but not yet vested as of September 1, 2006, based on the grant-date fair value estimated in accordance with the original provisions of Statement of Financial Accounting Standards No. 123 amortized over the options’ vesting period, and (2) compensation cost for all share-based payments granted subsequent to September 1, 2006, based on the grant-date fair value estimated in accordance with the provisions of FASB ASC 718-10, amortized on a straight-line basis over the options’ vesting period. Stock-based compensation was $181,520 and $155,252 for the fiscal years ended August 31, 2012 and 2011, respectively, and is included in the consolidated statements of operations as Consulting, Salaries, and Research and Development expense.
Estimates
Our consolidated financial statements and accompanying notes are prepared in accordance with accounting principles generally accepted in the United States of America. Preparing financial statements requires management to make estimates and assumptions that affect the reported amounts of assets, liabilities, revenue, and expenses. These estimates and assumptions are affected by management’s application of accounting policies. Actual results could differ from those estimates. Significant accounting policies for us include revenue recognition, accounting for capitalized software development costs, and accounting for income taxes.
| 19 |
Item 7a – QUANTITATIVE AND QUALitaTiVe DISCLOSURES ABOUT MARKET RISK
Not applicable because we are a smaller reporting company.
Item 8 - Financial Statements AND SUPPLEMENTARY DATA
The responses to this item are included elsewhere in this Form 10-K (see pages F1 – F23) and incorporated herein by reference.
Item 9 – Changes in and Disagreements with Accountants on Accounting and Financial Disclosure
There have been no changes to our public accountants during the past two years.
ITEM 9A – CONTROLS AND PROCEDURES
We are responsible for maintaining disclosure controls and procedures, as defined in Rules 13a-15(e) and 15d-15(e) under the Exchange. Disclosure controls and procedures are controls and other procedures designed to provide reasonable assurance that the information required to be disclosed by us in the reports that we file or submit under the Exchange Act is recorded, processed, summarized, and reported within the time periods specified in the SEC’s rules and forms. Disclosure controls and procedures include, without limitation, controls and procedures designed to ensure that information required to be disclosed by us in the reports that we file or submit under the Exchange Act is accumulated and communicated to our management, including our principal executive officer and principal financial officer, as appropriate, to allow timely decisions regarding required disclosure. In designing and evaluating disclosure controls and procedures, management recognizes that any controls and procedures, no matter how well designed and operated, can provide only reasonable assurance of achieving the desired control objectives, and management is required to apply its judgment in evaluating the cost-benefit relationship of possible controls and procedures.
Based on our management’s evaluation (with the participation of our principal executive officer and principal financial officer) of our disclosure controls and procedures as required by Rule 13a-15(b) and 15d-15(b) under the Exchange Act, our principal executive officer and principal financial officer have concluded that our disclosure controls and procedures were effective as of August 31, 2012, the end of the fiscal year covered by this report.
Management’s Report on Internal Control Over Financial Reporting
Our management is responsible for establishing and maintaining adequate internal controls over financial reporting, as defined in Exchange Act Rules 13a-15(f) and 15d-15(f). Our internal controls over financial reporting are designed to provide reasonable assurance regarding the reliability of financial reporting and the preparation of consolidated financial statements for external purposes in accordance with generally accepted accounting principles.
| 20 |
Under the supervision and with the participation of our management, including our principal executive officer and principal financial officer, we conducted an evaluation of the effectiveness of our internal controls over financial reporting based on the framework established by the Committee of Sponsoring Organizations of the Treadway Commission. Based on our evaluation under such framework, including the completion and review of internal review assessment forms and the completion and review of financial reporting information systems and controls checklists in the framework, our management concluded that our internal control over financial reporting was effective as of August 31, 2012.
No changes were made in our internal controls over financial reporting (as defined in Rules 13a-15(f) and 15d-15(f) of the Exchange Act) during the quarter ended August 31, 2012, that have materially affected, or are reasonably likely to materially affect, our internal controls over financial reporting.
Our management, including our CEO and CFO, does not expect that our disclosure controls or internal controls over financial reporting will prevent all errors or all instances of fraud. A control system, no matter how well-designed and operated, can provide only reasonable, not absolute, assurance that the control system’s objectives will be met. Further, the design of a control system must reflect the fact that there are resource constraints, and the benefits of controls must be considered relative to their costs. Because of the inherent limitations in all control systems, no evaluation of controls can provide absolute assurance that all control issues and instances of fraud, if any, within our company have been detected. These inherent limitations include the realities that judgments in decision-making can be faulty, and that breakdowns can occur because of simple errors or mistakes. Controls can also be circumvented by the individual acts of some persons, by collusion of two or more people, or by management override of the controls. The design of any system of controls is based in part upon certain assumptions about the likelihood of future events, and any design may not succeed in achieving its stated goals under all potential future conditions. Over time, controls may become inadequate because of changes in conditions or deterioration in the degree of compliance with policies or procedures. Because of the inherent limitation of a cost-effective control system, misstatements due to error or fraud may occur and not be detected.
Item 9B - Other Information
Not applicable.
PART III
Item 10 – Directors, and Executive Officers, AND CORPORATE GOVERNANCE
Code of Ethics
Our code of ethics is posted on our website: www.simulations-plus.com.
Changes to Procedures for Recommending Nominees to the Board of Directors
There have been no material changes to the procedures by which security holders may recommend nominees to our board of directors since we last described such procedures.
The remaining information required by Item 10 is incorporated by reference from the sections entitled “Board Matters and Corporate Governance,” “Election of Directors,” “Executive Compensation and Other Information,” and “Security Ownership of Certain Beneficial Owners and Management” in our definitive proxy statement on Schedule 14A (the “Proxy Statement”) to be distributed in connection with our 2013 Annual Shareholders’ Meeting.
| 21 |
Item 11 – Executive Compensation
The information required by Item 11 is incorporated by reference from the sections entitled “Executive Compensation and Other Information” and “Board Matters and Corporate Governance” in our Proxy Statement to be distributed in connection with our 2013 Annual Shareholders’ Meeting.
Item 12 - Security Ownership of Certain Beneficial Owners and Management AND RELATED STOCKHOLDER MATTERS
The information required by Item 12 is incorporated by reference from the sections entitled “Security Ownership of Certain Beneficial Owners and Management” and “Executive Compensation and Other Information” in our Proxy Statement to be distributed in connection with our 2013 Annual Shareholders’ Meeting.
Item 13 – Certain Relationships and Related Transactions, AND DIRECTOR INDEPENDENCE
The information required by Item 13 is incorporated by reference from the subsection entitled “Certain Relationships and Related Transactions; Transactions with Related Persons” and the section entitled “Board Matters and Corporate Governance” in our Proxy Statement to be distributed in connection with our 2013 Annual Shareholders’ Meeting.
Item 14 – principal accountING fees and services
The information required by Item 14 is incorporated by reference from the section of the proposal entitled “Ratification of Selection of Independent Registered Public Accounting Firm” in our Proxy Statement to be distributed in connection with our 2013 Annual Shareholders’ Meeting.
PART IV
ITEM 15 – Exhibits, Financial Statement Schedules
(a) (1) Financial Statements. The consolidated financial statements are included in this Annual Report.
(2) Financial Statement Schedules. All financial statement schedules have been omitted since the information is either not applicable or required or was included in the financial statements or notes included in this Annual Report on Form 10-K
(3) List of Exhibits required by Item 601 of Regulation S-K. See part (b) below.
(b) Exhibits. The following exhibits are filed as part of this report. Those exhibits marked with a (†) refer to management contracts or compensatory plans or arrangements.
| 22 |
| EXHIBIT | |
| NUMBER | DESCRIPTION |
| 3.1 | Articles of Incorporation of the Company. (5) |
| 3.2 | Amended and Restated Bylaws of the Company. (5) |
| 4.1 | Articles of Incorporation of the Company. (incorporated by reference to Exhibit 3.1 hereof) |
| 4.2 | Bylaws of the Company. (incorporated by reference to Exhibit 3.2 hereof) |
| 4.3 | Form of Common Stock Certificate (1) |
| 4.4 | Share Exchange Agreement (1) |
| 10.1 | The Company’s 1996 Stock Option Plan (the “Option Plan”) and forms of agreements relating thereto (1) |
| 10.2 | Exclusive License Software Agreement by and between the Company and Therapeutic Systems Research Laboratories dated June 30, 1997. (2) |
| 10.3 | The Company’s 2007 Stock Option Plan. (3) |
| 10.4 | Notice of Election to Extend Term of Lease by and between the Company and Crest Development LLC formerly Freeway Ventures LLC, dated July 29, 2010.(4) |
| 10.5 | Employment Agreement by and between the Company and Walter S. Woltosz, dated as of July 22, 2011. (5) (†) |
| 10.6 | Bill of Sale by and between the Company and Entelos, Inc. dated September 19, 2011. (6) |
| 10.7 | Stock Purchase Agreement by and among the Company, Words+, Inc., and Prentke Romich Company dated November 15, 2011. (7) |
| 23.1 | Consent of Independent Registered Public Accounting Firm (8) |
| 31.1 | Section 302 – Certification of the Principal Executive Officer. (8) |
| 31.2 | Section 302 – Certification of the Principal Financial Officer. (8) |
| 32.1 | Section 906 – Certification of the Chief Executive Office and Chief Financial Officer. (8) |
| 101.INS | XBRL Instance Document.* |
| 101.SCH | XBRL Taxonomy Extension Schema Document.* |
| 101.CAL | XBRL Taxonomy Extension Calculation Linkbase Document.* |
| 101.DEF | XBRL Taxonomy Extension Definition Linkbase Document.* |
| 101.LAB | XBRL Taxonomy Extension Label Linkbase Document.* |
| 101.PRE | XBRL Taxonomy Extension Presentation Linkbase Document.* |
| (1) | Incorporated by reference to the Company’s Registration Statement on Form SB-2 (Registration No. 333-6680) filed on March 25, 1997. |
| (2) | Incorporated by reference to the Company’s Form 10-KSB for the fiscal year ended August 31, 1997. |
| (3) | Incorporated by reference to the Company’s Form 10-K for the fiscal year ended August 31, 2009. |
| (4) | Incorporated by reference to the Company’s Form 10-K for the fiscal year ended August 31, 2010. |
| (5) | Incorporated by reference to the Company’s Form 10-K for the fiscal year ended August 31, 2011. |
| (6) | Incorporated by reference to the Company’s Form 8-K filed September 22, 2011. |
| (7) | Incorporated by reference to the Company’s Form 8-K filed November 16, 2011. |
| (8) | Filed herewith |
* Pursuant to Rule 405(a)(2) of Regulation S-T, the Company will furnish the XBRL Interactive Data Files with detailed footnote tagging as Exhibit 101 in an amendment to this Form 10-Q within the permitted 30-day grace period granted for the first quarterly period in which detailed footnote tagging is required.
(c) Financial Statement Schedule.
See Item 15(a)(2) above.
| 23 |
SIGNATURES
Pursuant to the requirements of Section 13 or 15(d) of the Securities Exchange Act of 1934, the registrant has duly caused this report to be signed on its behalf by the undersigned, thereunto duly authorized, in the City of Lancaster, State of California, on November 13, 2012.
| SIMULATIONS PLUS, INC. | |||
| By: | /s/ Momoko A. Beran | ||
| Momoko A. Beran | |||
| Chief Financial Officer | |||
Pursuant to the requirements of the Securities Exchange Act of 1934, this report has been signed below by the following persons on behalf of the registrant and in the capacities and on the dates indicated.
| Signature | Title | |
| /s/ Walter S. Woltosz | Chairman of the Board of Directors | |
| Walter S. Woltosz | and Chief Executive Officer (Principal executive officer) | |
| /s/ Virginia E. Woltosz | Secretary and Director of the Company | |
| Virginia E. Woltosz | ||
| /s/ Dr. David Z. D’Argenio | Director | |
| Dr. David Z. D’Argenio | ||
| /s/ Dr. David L. Ralph | Director | |
| Dr. David L. Ralph | ||
| /s/ Harold W. Rosenberger | ||
| Harold W. Rosenberger | Director | |
| /s/ Momoko A. Beran | Chief Financial Officer of the Company | |
| Momoko A. Beran | (Principal financial officer and principal accounting officer) |
| 24 |
SIMULATIONS PLUS, INC.
CONTENTS
August 31, 2012 and 2011
| Page | |
| REPORT OF INDEPENDENT REGISTERED PUBLIC ACCOUNTING FIRM | F-2 |
| FINANCIAL STATEMENTS | |
| Balance Sheets | F-3 |
| Statements of Operations | F-4 |
| Statements of Shareholders’ Equity | F-5 |
| Statements of Cash Flows | F-6 |
| Notes to Financial Statements | F-7 – F-24 |
| F-1 |
REPORT OF INDEPENDENT REGISTERED PUBLIC ACCOUNTING FIRM
To the Board of Directors and Shareholders of
Simulations Plus, Inc.
Lancaster, California
We have audited the accompanying balance sheets of Simulations Plus, Inc. (a California corporation) as of August 31, 2012 and 2011 and the related statements of operations, shareholders’ equity and cash flows for the years then ended. These financial statements are the responsibility of the Company’s management. Our responsibility is to express an opinion on these financial statements based on our audits.
We conducted our audits in accordance with the standards established by the Public Company Accounting Oversight Board (United States). Those standards require that we plan and perform the audit to obtain reasonable assurance about whether the financial statements are free of material misstatement. The Company is not required to have, nor were we engaged to perform, an audit of its internal control over financial reporting. Our audits included consideration of internal control over financial reporting as a basis for designing audit procedures that are appropriate in the circumstances, but not for the purpose of expressing an opinion on the effectiveness of the Company’s internal control over financial reporting. Accordingly, we express no such opinion. An audit also includes examining, on a test basis, evidence supporting the amounts and disclosures in the financial statements, assessing the accounting principles used and significant estimates made by management, as well as evaluating the overall financial statement presentation. We believe that our audits provide a reasonable basis for our opinion.
In our opinion, the financial statements referred to above present fairly, in all material respects, the financial position of Simulation Plus, Inc. as of August 31, 2012 and 2011, and the results of its operations and its cash flows for the years then ended in conformity with accounting principles generally accepted in the United States of America.
Rose, Snyder & Jacobs LLP
Encino, California
November 13, 2012
| F-2 |
SIMULATIONS PLUS, INC.
BALANCE SHEETS
For the years ended
| August 31, | ||||||||
| ASSETS | 2012 | 2011 | ||||||
| Current assets | ||||||||
| Cash and cash equivalents | $ | 12,701,075 | $ | 10,181,049 | ||||
| Income tax refund receivable | 153,896 | 259,434 | ||||||
| Accounts receivable, net of allowance for doubtful accounts of $0 | 1,451,864 | 1,170,861 | ||||||
| Contracts receivable | 18,893 | 185,816 | ||||||
| Prepaid expenses and other current assets | 150,856 | 123,954 | ||||||
| Deferred income taxes | 193,712 | 302,076 | ||||||
| Current assets of discontinued operations | – | 1,051,637 | ||||||
| Total current assets | 14,670,296 | 13,274,827 | ||||||
| Long-term assets | ||||||||
| Capitalized computer software development costs, | ||||||||
| net of accumulated amortization of $5,084,690 and $4,416,669 | 2,479,468 | 2,188,982 | ||||||
| Property and equipment, net (note 3) | 107,410 | 43,010 | ||||||
| Intellectual property, net of accumulated amortization of $3,750 | 71,250 | – | ||||||
| Customer relationships, net of accumulated amortization of $128,042 and $126,172 | – | 1,870 | ||||||
| Other assets | 18,445 | 18,445 | ||||||
| Non-current assets of discontinued operations | – | 340,204 | ||||||
| Total assets | $ | 17,346,869 | $ | 15,867,338 | ||||
| LIABILITIES AND SHAREHOLDERS' EQUITY | ||||||||
| Current liabilities | ||||||||
| Accounts payable | $ | 177,509 | $ | 176,136 | ||||
| Accrued payroll and other expenses | 312,912 | 276,327 | ||||||
| Accrued bonuses to officer | 60,000 | – | ||||||
| Accrued income taxes | 733,233 | 168,897 | ||||||
| Deferred revenue | 131,782 | 141,191 | ||||||
| Current liabilities of discontinued operations | – | 378,567 | ||||||
| Total current liabilities | 1,415,436 | 1,141,118 | ||||||
| Long-term liabilities | ||||||||
| Deferred income taxes | 788,857 | 656,047 | ||||||
| Non-current liabilities of discontinued operations | – | 33,558 | ||||||
| Total liabilities | 2,204,293 | 1,830,723 | ||||||
| Commitments and contingencies (note 4) | ||||||||
| Shareholders' equity (note 5) | ||||||||
| Preferred stock, $0.001 par value 10,000,000 shares authorized no shares issued and outstanding | – | – | ||||||
| Common stock, $0.001 par value 50,000,000 shares authorized 15,923,019 and 15,572,943 shares issued and outstanding | 4,399 | 4,044 | ||||||
| Additional paid-in capital | 4,628,366 | 4,167,650 | ||||||
| Retained earnings | 10,509,811 | 9,864,921 | ||||||
| Total shareholders' equity | 15,142,576 | 14,036,615 | ||||||
| Total liabilities and shareholders' equity | $ | 17,346,869 | $ | 15,867,338 | ||||
The accompanying notes are an integral part of these financial statements.
| F-3 |
SIMULATIONS PLUS, INC.
STATEMENTS OF OPERATIONS
For the years ended
| August 31, | ||||||||
| 2012 | 2011 | |||||||
| Net sales | $ | 9,448,608 | $ | 8,738,739 | ||||
| Cost of sales | 1,510,148 | 1,558,178 | ||||||
| Gross profit | 7,938,460 | 7,180,561 | ||||||
| Operating expenses | ||||||||
| Selling, general, and administrative | 3,379,017 | 3,185,999 | ||||||
| Research and development | 947,556 | 464,281 | ||||||
| Total operating expenses | 4,326,573 | 3,650,280 | ||||||
| Income from operations | 3,611,887 | 3,530,281 | ||||||
| Other income (expense) | ||||||||
| Interest income | 89,265 | 91,224 | ||||||
| Miscellaneous income | 76,149 | – | ||||||
| Gain on currency exchange | 177,790 | 76,416 | ||||||
| Gain on sale of assets | (433 | ) | 240 | |||||
| Interest expense | (3 | ) | (43 | ) | ||||
| Total other income (expense) | 342,768 | 167,837 | ||||||
| Income from continuing operations before provision for income taxes | 3,954,655 | 3,698,118 | ||||||
| Provision for income taxes (note 6) | (1,142,693 | ) | (1,035,473 | ) | ||||
| Income from continuing operations | $ | 2,811,962 | $ | 2,662,645 | ||||
| Discontinued operations: | ||||||||
| Gain (loss) from discontinued operations, net of tax | (249,898 | ) | 51,996 | |||||
| Gain on sale of Words+, net of tax | 465,820 | – | ||||||
| Results of discontinued operations | 215,922 | 51,996 | ||||||
| Net Income | $ | 3,027,884 | $ | 2,714,641 | ||||
| Basic earnings per share: | ||||||||
| Continuing operations | $ | 0.18 | $ | 0.17 | ||||
| Discontinued operations | 0.01 | 0.00 | ||||||
| Net basic earning per share | $ | 0.19 | $ | 0.17 | ||||
| Diluted earnings per share | ||||||||
| Continuing operations | $ | 0.18 | $ | 0.17 | ||||
| Discontinued operations | 0.01 | 0.00 | ||||||
| Net basic earning per share | $ | 0.19 | $ | 0.17 | ||||
| Weighted-average common shares outstanding | ||||||||
| Basic | 15,763,674 | 15,540,047 | ||||||
| Diluted | 16,151,873 | 16,082,454 | ||||||
The accompanying notes are an integral part of these financial statements.
| F-4 |
SIMULATIONS PLUS, INC.
STATEMENTS OF SHAREHOLDERS' EQUITY
For the years ended
| Common Stock | Additional Paid-In | Retained | ||||||||||||||||||
| Shares | Amount | Capital | Earnings | Total | ||||||||||||||||
| Balance, August 31, 2010 | 15,833,006 | $ | 4,304 | $ | 5,891,268 | $ | 7,150,280 | $ | 13,045,852 | |||||||||||
| Exercise of stock options | 415,776 | 416 | 144,545 | 144,961 | ||||||||||||||||
| Stock-based Compensation | 155,252 | 155,252 | ||||||||||||||||||
| Stock Repurchases | (675,839 | ) | (676 | ) | (2,047,496 | ) | (2,048,172 | ) | ||||||||||||
| Deferred tax adjustments | 24,081 | 24,081 | ||||||||||||||||||
| Net income | 2,714,641 | 2,714,641 | ||||||||||||||||||
| Balance, August 31, 2011 | 15,572,943 | $ | 4,044 | $ | 4,167,650 | $ | 9,864,921 | $ | 14,036,615 | |||||||||||
| Exercise of stock options | 354,863 | 355 | 301,286 | 301,641 | ||||||||||||||||
| Stock-based Compensation | 181,521 | 181,521 | ||||||||||||||||||
| Deferred tax adjustments | ||||||||||||||||||||
| - Change in prior year tax refund | (36,868 | ) | (36,868 | ) | ||||||||||||||||
| - Current deferred tax adjustments | 14,777 | 14,777 | ||||||||||||||||||
| Declaration of Dividend | (2,382,994 | ) | (2,382,994 | ) | ||||||||||||||||
| Net income | 3,027,884 | 3,027,884 | ||||||||||||||||||
| Balance, August 31, 2012 | 15,927,806 | $ | 4,399 | $ | 4,628,366 | $ | 10,509,811 | $ | 15,142,576 | |||||||||||
The accompanying notes are an integral part of these financial statements.
| F-5 |
SIMULATIONS PLUS, INC.
STATEMENTS OF CASH FLOWS
For the years ended
| 2012 | 2011 | |||||||
| Cash flows from operating activities | ||||||||
| Net income | $ | 3,027,884 | $ | 2,714,641 | ||||
| Adjustments to reconcile net income to net cash provided by operating activities | ||||||||
| (Income) from Discontinued Operations | (215,922 | ) | (51,996 | ) | ||||
| Depreciation and amortization of property and equipment | 41,802 | 21,822 | ||||||
| Amortization of customer relationships | 1,871 | 7,730 | ||||||
| Amortization of capitalized computer software development costs | 668,021 | 660,893 | ||||||
| Amortization of Intellectual property | 3,750 | – | ||||||
| Excess tax benefits from share-based arrangement | 22,091 | (24,081 | ) | |||||
| Stock-based compensation | 127,738 | 155,253 | ||||||
| (Gain)/Loss from sale of assets | 433 | (240 | ) | |||||
| Deferred income taxes | 207,617 | 307,712 | ||||||
| (Increase) decrease in | ||||||||
| Accounts receivable and Contracts receivable | (114,080 | ) | (449,458 | ) | ||||
| Income tax refundable | 105,538 | (33,924 | ) | |||||
| Prepaid expenses and other assets | (26,902 | ) | (57,969 | ) | ||||
| Increase (decrease) in | ||||||||
| Accounts payable | 1,372 | 57,940 | ||||||
| Accrued payroll and other expenses | 28,798 | 30,209 | ||||||
| Accrued Bonus | 60,000 | (60,000 | ) | |||||
| Accrued income taxes | 542,245 | (88,683 | ) | |||||
| Deferred revenue | (9,409 | ) | 45,099 | |||||
| Net cash provided by operating activities of continuing operations | 4,472,847 | 3,234,948 | ||||||
| Net cash provided by (used in) operating activities of discontinued operations | (688,862 | ) | 262,595 | |||||
| Net cash provided by operating activities | 3,783,985 | 3,497,543 | ||||||
| Cash flows from investing activities | ||||||||
| Proceeds from sale of Words+, Inc. | 1,973,096 | – | ||||||
| Proceeds from sale of assets | 200 | 240 | ||||||
| Purchases of property and equipment | (106,835 | ) | (19,101 | ) | ||||
| Purchase of royalty | (75,000 | ) | ||||||
| Capitalized computer software development costs | (958,507 | ) | (797,319 | ) | ||||
| Net cash provided by (used in) investing activities of continuing operations | 832,954 | (816,180 | ) | |||||
| Net cash provided by (used in) investing activities of discontinued operations | 6,532 | (252,945 | ) | |||||
| Net cash provided by (used in) investing activities | 839,486 | (1,069,125 | ) | |||||
| Cash flows from financing activities | ||||||||
| Repurchase of common stock | – | (2,048,172 | ) | |||||
| Excess tax benefits from share-based arrangement | (22,091 | ) | 24,081 | |||||
| Dividends | (2,382,994 | ) | – | |||||
| Proceeds from the exercise of stock options | 301,641 | 144,960 | ||||||
| Net cash (used in) financing activities of continuing operations | (2,103,444 | ) | (1,879,131 | ) | ||||
| Net increase in cash and cash equivalents from continuing operations | 3,202,357 | 539,637 | ||||||
| Net increase (decrease) in cash and cash equivalents from discontinued operations | (682,330 | ) | 9,650 | |||||
| Net increase in cash and cash equivalents | 2,520,027 | 549,287 | ||||||
| Cash and cash equivalents, beginning of year | 10,181,049 | 9,631,762 | ||||||
| Cash and cash equivalents, end of period | $ | 12,701,076 | $ | 10,181,049 | ||||
| Supplemental disclosures of cash flow information | ||||||||
| Interest paid | $ | 3 | $ | 43 | ||||
| Income taxes paid | $ | 457,000 | $ | 320,232 | ||||
The accompanying notes are an integral part of these financial statements.
| F-6 |
SIMULATIONS PLUS, INC.
NOTES TO FINANCIAL STATEMENTS
August 31, 2012 and 2011
NOTE 1 - ORGANIZATION AND LINES OF BUSINESS
Organization
Simulations Plus, Inc. (the “Company”, “we”, “us”, “our”) was incorporated on July 17, 1996. On August 29, 1996, the shareholders of Words+, Inc. exchanged their 2,000 shares of Words+, Inc. common stock for 2,200,000 (Pre-split) shares of Simulations Plus, Inc. common stock, and Words+, Inc. became a wholly owned subsidiary of Simulations Plus, Inc. The Words+ subsidiary was sold effective November 30, 2011, and is treated as “discontinued operations” in the accompanying financial statements.
Lines of Business
The Company designs and develops pharmaceutical simulation software to promote cost-effective solutions to a number of problems in pharmaceutical research and in the education of pharmacy and medical students. The Company also developed and sells a productivity software program called Abbreviate! that was moved from the Words+ subsidiary to Simulations Plus.
NOTE 2 - SUMMARY OF SIGNIFICANT ACCOUNTING POLICIES
Use of Estimates
Our financial statements and accompanying notes are prepared in accordance with accounting principles generally accepted in the United States of America. Preparing financial statements requires management to make estimates and assumptions that affect the reported amounts of assets, liabilities, revenue, and expenses. These estimates and assumptions are affected by management’s application of accounting policies. Actual results could differ from those estimates.
Principles of Consolidation
The financial statements of Simulations Plus, Inc. include the accounts of Words+ up to November 30, 2011, the date of sale of the wholly owned subsidiary. All significant intercompany accounts and transactions were eliminated in consolidation. The operations of Words+ are presented as “discontinued operations” in the financial statements.
Revenue Recognition
We recognize revenues related to software licenses and software maintenance in accordance with Financial Accounting Standard Board (“FASB”) Accounting Standard Codification (“ASC”) 985-605, “Software - Revenue Recognition”. Software products revenue is recorded when the following conditions are met: 1) evidence of arrangement exists, 2) delivery has been made, 3) the amount is fixed, and 4) collectability is probable. Post-contract customer support ("PCS") obligations are insignificant; therefore, revenue for PCS is recognized at the same time as the licensing fee, and the costs of providing such support services are accrued and amortized over the obligation period.
| F-7 |
SIMULATIONS PLUS, INC.
NOTES TO FINANCIAL STATEMENTS
August 31, 2012 and 2011
As a byproduct of ongoing improvements and upgrades for the new programs and new modules of software, some modifications are provided to customers who have already purchased software at no additional charge. Other software modifications result in new, additional cost modules that expand the functionality of the software. These are licensed separately. We consider the modifications that are provided without charge to be minimal, as they do not significantly change the basic functionality or utility of the software, but rather add convenience, such as being able to plot some additional variable on a graph in addition to the numerous variables that had been available before, or adding some additional calculations to supplement the information provided from running the software. Such software modifications for any single product have typically occurred once or twice per year, sometimes more, sometimes less. Thus, they are infrequent. The Company provides, for a fee, additional training and service calls to its customers and recognizes revenue at the time the training or service call is provided.
Generally, we enter into one-year license agreements with customers for the use of our pharmaceutical software products. We recognize revenue on these contracts when all the criteria are met.
Most license agreements have a term of one year; however, from time to time, we enter into multi-year license agreements. We generally unlock and invoice software one year at a time for multi-year licenses. Therefore, revenue is recognized one year at a time.
We recognize the revenue from collaboration research and the revenue from grants equally over their terms. However, we recognize the contract study revenue using the percentage of completion method, depending upon how the contract studies are engaged, in accordance with ASC 605-35, Revenue Recognition – Construction-Type and Production-Type Contracts”. To recognize revenue using the percentage of completion method, we must determine whether we meet the following criteria: 1) there is a long-term, legally enforceable contract and 2) it is possible to reasonably estimate the total project costs, and 3) it is possible to reasonably estimate the extent of progress toward completion.
Reclassifications
Certain numbers in the prior year have been reclassified to conform to the current year’s presentation.
Cash and Cash Equivalents
For purposes of the statements of cash flows, the Company considers all highly liquid investments purchased with original maturities of three months or less to be cash equivalents.
Accounts Receivable
We analyze the age of customer balances, historical bad debt experience, customer creditworthiness, and changes in customer payment terms when making estimates of the collectability of the Company’s trade accounts receivable balances. If we determine that the financial conditions of any of its customers deteriorated, whether due to customer-specific or general economic issues, an increase in the allowance may be made. Accounts receivable are written off when all collection attempts have failed. The Company also estimated the contractual discount obligation for third party funding such as, Medicaid, and private insurance companies. Those estimated discounts were reflected in the allowance for doubtful accounts and contractual discounts and included in discontinued operations. Although we experienced significant collection problems with our former Words+ subsidiary, we have not had customers fail to pay on the pharmaceutical software and services side of the business, which now represents our entire business after the sale of our former subsidiary on November 30, 2011.
| F-8 |
SIMULATIONS PLUS, INC.
NOTES TO FINANCIAL STATEMENTS
August 31, 2012 and 2011
Capitalized Computer Software Development Costs
Software development costs are capitalized in accordance with ASC 985-20, “Costs of Software to Be Sold, Leased, or Marketed”. Capitalization of software development costs begins upon the establishment of technological feasibility and is discontinued when the product is available for sale.
The establishment of technological feasibility and the ongoing assessment for recoverability of capitalized software development costs require considerable judgment by management with respect to certain external factors including, but not limited to, technological feasibility, anticipated future gross revenues, estimated economic life, and changes in software and hardware technologies. Capitalized computer software development costs are comprised primarily of salaries and direct payroll-related costs and the purchase of existing software to be used in the Company's software products.
Amortization of capitalized computer software development costs is provided on a product-by-product basis on the straight-line method over the estimated economic life of the products (not to exceed five years). Amortization of software development costs amounted to $668,021 and $660,893 for the years ended August 31, 2012 and 2011, respectively. We expect future amortization expense to vary due to increases in capitalized computer software development costs.
We test capitalized computer software development costs for recoverability whenever events or changes in circumstances indicate that the carrying amount may not be recoverable.
Property and Equipment
Property and equipment are recorded at cost, less accumulated depreciation and amortization. Depreciation and amortization are provided using the straight-line method over the estimated useful lives as follows:
| Equipment | 5 years |
| Computer equipment | 3 to 7 years |
| Furniture and fixtures | 5 to 7 years |
| Leasehold improvements | Shorter of life of asset or lease |
Maintenance and minor replacements are charged to expense as incurred. Gains and losses on disposals are included in the results of operations.
Fair Value of Financial Instruments
Assets and liabilities recorded at fair value in the Balance Sheets are categorized based upon the level of judgment associated with the inputs used to measure their fair value. The categories, as defined by the standard, are as follows:
| F-9 |
SIMULATIONS PLUS, INC.
NOTES TO FINANCIAL STATEMENTS
August 31, 2012 and 2011
| Level Input: | Input Definition: | |
| Level I | Inputs are unadjusted, quoted prices for identical assets or liabilities in active markets at the measurement date. | |
| Level II | Inputs, other than quoted prices included in Level I, that are observable for the asset or liability through corroboration with market data at the measurement date. | |
| Level III | Unobservable inputs that reflect management’s best estimate of what market participants would use in pricing the asset or liability at the measurement date. |
The following table summarizes fair value measurements by level at August 31, 2012 for assets and liabilities measured at fair value on a recurring basis:
| Level I | Level II | Level III | Total | |||||||||
| Cash and cash equivalents | $ | 12,701,075 | $ | $ | $ | 12,701,075 | ||||||
| Total assets | $ | 12,701,075 | $ | $ | $ | 12,701,075 | ||||||
For certain of our financial instruments, including accounts receivable, accounts payable, accrued payroll and other expenses, accrued bonuses to officers, and accrued warranty and service costs, the carrying amounts are approximate fair value due to their short maturities.
Advertising
The Company expenses advertising costs as incurred. Advertising costs for the years ended August 31, 2012 and 2011 were $79,000 and $37,000, respectively.
Research and Development Costs
Research and development costs are charged to expense as incurred until technological feasibility has been established. These costs include salaries, laboratory experiment, and purchased software which was developed by other companies and incorporated into, or used in the development of, our final products.
Income Taxes
The Company accounts for income taxes in accordance with ASC 740-10, “Income Taxes” which requires the recognition of deferred tax assets and liabilities for the expected future tax consequences of events that have been included in the financial statements or tax returns.
Under this method, deferred income taxes are recognized for the tax consequences in future years of differences between the tax bases of assets and liabilities and their financial reporting amounts at each year-end based on enacted tax laws and statutory tax rates applicable to the periods in which the differences are expected to affect taxable income. Valuation allowances are established, when necessary, to reduce deferred tax assets to the amount expected to be realized. The provision for income taxes represents the tax payable for the period and the change during the period in deferred tax assets and liabilities.
| F-10 |
SIMULATIONS PLUS, INC.
NOTES TO FINANCIAL STATEMENTS
August 31, 2012 and 2011
The California Franchise Tax Board (“FTB”) audited us for the fiscal years ended (“FYE”) August 31, 2007 and 2008. We received refunds as we claimed; however they have now continued their audit to include FYE 2009 and 2010, and are reviewing 2007 and 2008 R&D credits since those credits were carried forward to FYE 2009 and 2010. In March 2012, we also received a notice from the Internal Revenue Service (IRS) that our fiscal year ended August 31, 2008 is subject to their examination. In October 2012, the IRS completed their examination of our 2007 tax filing. The outcome of this examination was a decrease of $36,868 in the amount refundable.
Intellectual property
On February 28, 2012, we bought out the royalty agreement with Enslein Research of Rochester, New York. The cost of $75,000 is being amortized over 10 years under the straight-line method. Amortization expense for the fiscal year ended August 31, 2012 was $3,750. Accumulated amortization as of August 31, 2012 was $3,750.
Customer relationships
We purchased customer relationships as a part of the acquisition of certain assets of Bioreason, Inc. in November 2005. Customer relationships was recorded at a cost of $128,042, and is being amortized over 78 months under the sum-of-the-years’-digits method. Amortization expense for the fiscal year ended August 31, 2012 and 2011 amounted to $1,871 and $7,730, respectively. Accumulated amortization as of August 31, 2012 and 2011 were $128,042 and $126,172, respectively.
Earnings per Share
The Company reports earnings per share in accordance with FASB ACS 260-10. Basic earnings per share is computed by dividing income available to common shareholders by the weighted-average number of common shares available. Diluted earnings per share is computed similarly to basic earnings per share except that the denominator is increased to include the number of additional common shares that would have been outstanding if the potential common shares had been issued and if the additional common shares were dilutive. The components of basic and diluted earnings per share for the years ended August 31, 2012 and 2011 were as follows:
| 2012 | 2011 | |||||||
| Numerator | ||||||||
| Net income attributable to common shareholders | $ | 3,027,884 | $ | 2,714,641 | ||||
| Denominator | ||||||||
| Weighted-average number of common shares outstanding during the year | 15,921,196 | 15,540,047 | ||||||
| Dilutive effect of stock options | 388,199 | 542,407 | ||||||
| Common stock and common stock equivalents used for diluted earnings per share | 16,309,395 | 16,082,454 | ||||||
| F-11 |
SIMULATIONS PLUS, INC.
NOTES TO FINANCIAL STATEMENTS
August 31, 2012 and 2011
Stock-Based Compensation
The Company accounts for stock options using the modified prospective method in accordance with FASB ACS 718-10, “Compensation-Stock Compensation”. Under this method, compensation costs include: (1) compensation cost for all share-based payments granted prior to, but not yet vested as of September 1, 2006, based on the grant date fair value estimated in accordance with the original provisions of Statement of Financial Accounting Standard (“SFAS”) No. 123 amortized over the options’ vesting period, and (2) compensation cost for all share-based payments granted subsequent to September 1, 2006, based on the grant-date fair value estimated in accordance with the provisions of SFAS No. 123R, amortized on a straight-line basis over the options’ vesting period. Stock-based compensation was $181,520 and $155,252 for the years ended August 31, 2012 and 2011, respectively, and is included in the statements of operations as Consulting, Salaries, and Research and Development expense.
Recently Issued Accounting Standards
In September 2009, the FASB issued ASU 2009-14 which amends Statement of Position (“SOP”) 97-2, “Software Revenue Recognition”, to exclude tangible products containing software components and non-software components that function together to deliver the product’s essential functionality. ASU 2009-14 applies to revenue arrangements entered into or materially modified in fiscal years beginning on or after June 15, 2010, with early application permitted with EITF 08-1. We adopted this standard in the first quarter of fiscal 2011. We believe adoption did not have a material effect on the Company’s financial statements.
In September 2009, the FASB issued ASU 2009-13, “Revenue Arrangements with Multiple Deliverables” (“EITF 08-1”). ASU 2009-13 amends EITF 00-21, “Revenue Arrangements with Multiple Deliverables”, to require an entity to use an estimated selling price when vendor-specific objective evidence or acceptable third-party evidence does not exist for any products or services included in a multiple element arrangement. The arrangement consideration should be allocated among the products and services based upon their relative selling prices, thus eliminating the use of the residual method of allocation. ASU 2009-13 also requires expanded qualitative and quantitative disclosures regarding significant judgments made and changes in applying the guidance. ASU 2009-13 applies to fiscal years beginning after June 15, 2010, with early application permitted. We adopted this standard in the first quarter of fiscal 2011. We believe adoption did not have a material effect on the Company’s financial statements.
In May 2011, the Financial Accounting Standards Board (“FASB”) issued ASU 2011-04, Fair Value Measurement (“ASU 2011-04”), which amended ASC 820, Fair Value Measurements (“ASC 820”), providing a consistent definition and measurement of fair value, as well as similar disclosure requirements between U.S. GAAP and International Financial Reporting Standards. ASU 2011-04 changes certain fair value measurement principles, clarifies the application of existing fair value measurement and expands the disclosure requirements. We adopted this standard in the first quarter of 2012. We believe adoption did not have a material effect on the Company’s financial statements.
| F-12 |
SIMULATIONS PLUS, INC.
NOTES TO FINANCIAL STATEMENTS
August 31, 2012 and 2011
In June 2011, the FASB issued ASU 2011-05, Presentation of Comprehensive Income (“ASU 2011-05”). ASU 2011-05 requires the presentation of comprehensive income in either (1) a continuous statement of comprehensive income or (2) two separate but consecutive statements. We adopted this standard in the first quarter of 2012. We believe adoption did not have a material effect on the Company’s financial statements.
In September 2011, the FASB issued ASU 2011-08, Testing Goodwill for Impairment (“ASU 2011-08”), which amends the guidance in ASC 350-20, Intangibles—Goodwill and Other – Goodwill. ASU 2011-08 provides entities with the option of performing a qualitative assessment before calculating the fair value of the reporting unit when testing goodwill for impairment. If the fair value of the reporting unit is determined, based on qualitative factors, to be more likely than not less than the carrying amount of the reporting unit, the entities are required to perform a two-step goodwill impairment test. We adopted this standard in the first quarter of 2012. We believe adoption did not have a material effect on the Company’s financial statements.
In December 2011, the FASB issued ASU No. 2011-11, "Disclosures about Offsetting Assets and Liabilities." The amendments in this update require enhanced disclosures around financial instruments and derivative instruments that are either (1) offset in accordance with either ASC 210-20-45 or ASC 815-10-45 or (2) subject to an enforceable master netting arrangement or similar agreement, irrespective of whether they are offset in accordance with either ASC 210-20-45 or ASC 815-10-45. An entity should provide the disclosures required by those amendments retrospectively for all comparative periods presented. The amendments are effective during interim and annual periods beginning after February 28, 2012. The Company does not expect this guidance to have any impact on its financial position, results of operations or cash flows.
NOTE 3 – PROPERTY AND EQUIPMENT
Property and equipment at August 31, 2012 and 2011 consisted of the following:
| 2012 | 2011 | |||||||
| Equipment | 123,062 | 39,374 | ||||||
| Computer equipment | 272,562 | 255,074 | ||||||
| Furniture and fixtures | 48,813 | 48,813 | ||||||
| Leasehold improvements | 53,898 | 53,898 | ||||||
| 498,335 | 397,159 | |||||||
| Less accumulated depreciation and Amortization | 390,925 | 354,149 | ||||||
| Total | $ | 107,410 | $ | 43,010 | ||||
Depreciation expense was $41,802 and $21,822 for the years ended August 31, 2012 and 2011, respectively.
| F-13 |
SIMULATIONS PLUS, INC.
NOTES TO FINANCIAL STATEMENTS
August 31, 2012 and 2011
NOTE 4 - COMMITMENTS AND CONTINGENCIES
Leases
We lease approximately 13,500 square feet of space under a five-year term with two (2), three (3)-year options to extend the lease. The base rent is $18,445 per month plus common area maintenance fees. The base rental rate increases at 4% annually. Rent expense, including common area maintenance fees, was $293,089 for the year ended August 31, 2012 and $288,979, of which $144,490 was recorded as Simulations Plus rent expense and $144,489 was recorded as Words+ (a former subsidiary) rent expense for the year ended August 31, 2011. During the year ended August 31, 2011, the Company exercised its option to extend the term of the lease to February 2, 2014.
After the sale of Words+, we entered into a month to month sublease agreement commencing January 1, 2012 under which Words+ pays 20 percent of the monthly rent we pay to our landlord, plus 20% of facility-related operating expenses. We report our gross lease expense under Selling, General and Administrative expense; however, the sublease payments received from Words+ are reported under Other Income.
Future minimum lease payments under non-cancelable operating leases with remaining terms of one year or more at August 31, 2012 were as follows:
| Years Ending August 31, | ||||
| 2013 | 286,601 | |||
| 2014 | 121,362 | |||
| $ | 407,963 | |||
On October 30, 2006, the Company entered into an equipment lease agreement. In this agreement, the Company leased a Ricoh Copier/Printer for 36 months with the option of earlier termination with a 60-day written notice. On October 30, 2009, we renewed the same agreement for another 36 months with an increment of 1 cent per copy on color printing which reflects their material cost. On April 17, 2012, we entered into a new lease agreement with ARC, a successor of former leasing company, for 36-month under the same term as the existing agreement.
Employment Agreement
On July 22, 2011, the Company entered into an employment agreement with its President/Chief Executive Officer that expires in August 2013. The employment agreement provides for an annual base salary of $300,000 per year, and a performance bonus in an amount not to exceed 10% of Employee’s salary, or $30,000 per year, at the end of each fiscal year. The specific amount of the bonus to be awarded will be determined by the Compensation Committee of the Board of Directors, based on the financial performance and achievements of the Company for the previous fiscal year. The agreement also provides Employee stock options, exercisable for five years, to purchase fifty (50) shares of Common Stock for each one thousand dollars ($1,000) of net income before taxes at the end of each fiscal year up to a maximum of 120,000 options over the term of the agreement. The Company may terminate the agreement upon 30 days' written notice if termination is without cause. The Company's only obligation would be to pay its President the greater of a) 12 months salary or b) the remainder of the term of the employment agreement from the date of notice of termination.
| F-14 |
SIMULATIONS PLUS, INC.
NOTES TO FINANCIAL STATEMENTS
August 31, 2012 and 2011
For fiscal year 2012, the Compensation Committee awarded a $30,000 performance bonus to Walter Woltosz, our President/Chief Executive Officer, and was paid in September 2012.
For fiscal year 2011, the Compensation Committee awarded a $27,500 performance bonus to Walter Woltosz. The bonus for FY2011, which was 100% of the previous year’s contract bonus amount, was paid in December 2011.
License Agreement
In 1997, the Company entered into an agreement with Therapeutic Systems Research Laboratory ("TSRL") to jointly develop a computer simulation software program of the absorption of drug compounds in the gastrointestinal tract. Upon execution of a definitive License Agreement on July 9, 1997, TSRL received an initial payment of $75,000, and thereafter, the Company is obligated to pay a royalty of 20% of the net sales of the basic GastroPlus software without additional modules.
In September 2007, we entered into an agreement with Enslein Research, Inc. (“Enslein”) to jointly create a new metabolism module as part of ADMET Predictor. The fee for the exclusive license to the Enslein Data, in the form of a royalty, is 50% of the gross sales revenues of the ADMET Predictor Enslein Metabolism Module, and a $50,000 bonus at the time the cumulative revenue from ADMET Predictor Enslein Metabolism Module sales reaches $250,000. On February 28, 2012, we signed a buyout agreement with Enslein for $75,000, and are amortizing its cost over 10 years after this date.
We also have a royalty agreement with Accelrys (the original agreement with Symyx in March 2010) for Metabolite Database access for developing our Metabolite module which was renamed as Metabolism module when we released ADMET Predictor version 6 on April 19, 2012. Under this agreement, we pay 25% of revenue derived from the sale of Metabolism/Metabolite module.
For the years ended August 31, 2012 and 2011, we incurred total royalties of approximately $601,000 and $575,000, respectively.
Legal Matters
We are not a party to any litigation at this time and we are not aware of any pending litigation of any kind.
NOTE 5 - SHAREHOLDERS' EQUITY
Dividend
The Board of Directors declared cash dividend during fiscal year 2012. The details of dividend paid are in the following table:
| F-15 |
SIMULATIONS PLUS, INC.
NOTES TO FINANCIAL STATEMENTS
August 31, 2012 and 2011
| Record Date | Distribution Date | Number of Shares Outstanding on Record Date | Dividend per Share | Total Amount | ||||||||
| 02/21/2012 | 03/01/2012 | 15,813,844 | $0.05 | $ | 790,692.20 | |||||||
| 04/27/2012 | 05/08/2012 | 15,923.019 | $0.05 | $ | 796,150.95 | |||||||
| 08/07/2012 | 08/10/2012 | 15,923.019 | $0.05 | $ | 796,150.95 | |||||||
| Total | $ | 2,382,994.10 | ||||||||||
Stock Repurchase
On January 10, 2010, the Board of Directors authorized a renewed share repurchase program (Phase II) effective as of February 15, 2010. The renewed program enabled the Company to buy back up to one million shares during a 12-month period.
The details of repurchases made under Phase II are listed in the following table:
| Period | Total Number of Shares Purchased | Average Price Paid per Share | Remaining Shares Authorized for Repurchase Under the Share Repurchase Plan – Phase II | |||||||||
| 04/01/10 to 04/30/10 | 86,976 | $ | 2.2237 | 913,024 | ||||||||
| 05/01/10 to 05/31/10 | 170,101 | $ | 2.3515 | 742,923 | ||||||||
| 06/01/10 to 06/30/10 | 33,665 | $ | 2.3670 | 709,258 | ||||||||
| 07/01/10 to 07/31/10 | 18,789 | $ | 2.4433 | 690,469 | ||||||||
| 08/01/10 to 08/31/10 | 10,878 | $ | 2.4283 | 679,591 | ||||||||
| 09/01/10 to 09/30/10 | 81,070 | $ | 2.6969 | 598,521 | ||||||||
| 10/01/10 to 10/31/10 | 170,494 | $ | 3.1671 | 428,027 | ||||||||
| 11/01/10 to 11/30/10 | 146,116 | $ | 2.9523 | 281,911 | ||||||||
| 12/01/10 to 12/31/10 | 41,214 | $ | 2.5716 | 240,697 | ||||||||
| 01/01/11 to 01/31/11 | 119,469 | $ | 2.9028 | 121,228 | ||||||||
| 02/01/11 to 02/28/11 | 117,476 | $ | 3.4510 | 3,752 | ||||||||
| Phase II Total | 996,248 | $ | 2.8041 | |||||||||
*Phase II repurchase program ended on 02/14/2011.
Stock Option Plan
In September 1996, the Board of Directors adopted, and the shareholders approved, the 1996 Stock Option Plan (the "Option Plan") under which a total of 1,000,000 shares of common stock had been reserved for issuance. In March 1999, the shareholders approved an increase in the number of shares that may be granted under the Option Plan to 2,000,000. In February 2000, the shareholders approved an increase in the number of shares that may be granted under the Option Plan to 4,000,000. In December 2000, the shareholders approved an increase in the number of shares that may be granted under the Option Plan to 5,000,000. Furthermore, in February 2005, the shareholders approved an additional 1,000,000 shares, resulting in the total number of shares that may be granted under the Option Plan to 6,000,000. The 1996 Stock Option Plan terminated in September 2006 by its term.
| F-16 |
SIMULATIONS PLUS, INC.
NOTES TO FINANCIAL STATEMENTS
August 31, 2012 and 2011
On February 23, 2007, the Board of Directors adopted and the shareholders approved the 2007 Stock Option Plan under which a total of 1,000,000 shares of common stock had been reserved for issuance.
The following table summarizes the stock option transactions.
TRANSACTIONS IN FY 2012 AND 2011
| Transactions in FY11 (Incentive Stock Option Plan) | Number of Options | Weighted-Average Exercise Price Per Share | Weighted-Average Remaining Contractual Life | |||||||||
| Outstanding, August 31, 2010 | 1,493,902 | $ | 1.13 | |||||||||
| Granted | 20,000 | $ | 3.27 | |||||||||
| Exercised | (442,300 | ) | $ | 0.54 | ||||||||
| Canceled/Forfeited | (107,066 | ) | $ | 1.61 | ||||||||
| Expired | (6,900 | ) | $ | 0.88 | ||||||||
| Outstanding, August 31, 2011 | 957,636 | $ | 1.40 | 5.22 | ||||||||
| Vested and Exercisable, August 31, 2011 | 687,102 | $ | 1.27 | 4.522 | ||||||||
| Vested and Expected to Vest, August 31, 2011 | 931,883 | $ | 1.37 | 5.132 | ||||||||
| Transactions in FY12 (Incentive Stock Option Plan) | Number of Options | Weighted-Average Exercise Price Per Share | Weighted-Average Remaining Contractual Life | |||||||||
| Outstanding, August 31, 2011 | 957,636 | $ | 1.40 | – | ||||||||
| Granted | 100,000 | $ | 3.25 | – | ||||||||
| Exercised | (360,736 | ) | $ | 1.22 | – | |||||||
| Expired | (7,100 | ) | $ | 2.54 | – | |||||||
| Outstanding, August 31, 2012 | 689,800 | $ | 1.74 | 4.523 | ||||||||
| Vested and Exercisable, August 31, 2012 | 467,100 | $ | 1.42 | 4.071 | ||||||||
| Vested and Expected to Vest, August 31, 2012 | 666,789 | $ | 1.71 | 4.451 | ||||||||
| F-17 |
SIMULATIONS PLUS, INC.
NOTES TO FINANCIAL STATEMENTS
August 31, 2012 and 2011
The fair value of the options, including options to outside board members, granted during the year ended August 31, 2012 is estimated at $167,124. The fair value of these options was estimated at the date of grant using the Black-Scholes option-pricing model with the following assumptions for the fiscal year ended August 31, 2012: dividend yield of 0.41%, pre-vest forfeiture rate of 5.61% to 6.09%, expected volatility of 62.27% to 69.87%, risk-free interest rate of 0.82% to 1.01%, and expected life of 5.0 years to 7.0 years. The total fair value of non-vested stock options as of August 31, 2012 was $292,426 and is amortizable over a weighted average period of 2.03 years.
During the previous fiscal year ended August 31, 2011, the fair value of the options granted is estimated at $57,384. The assumptions were dividend yield of 0%, pre-vest forfeiture rate of 2.32% to 40.71%, expected volatility of 54.71% to 79.91%, risk-free interest rate of 1.42% to 2.66%, and expected life of 4.0 years. The total fair value of non-vested stock options as of August 31, 2011 was $270,387 and is amortizable over a weighted average period of 2.18 years.
The Black-Scholes option valuation model was developed for use in estimating the fair value of traded options, which do not have vesting restrictions and are fully transferable. In addition, option valuation models require the input of highly subjective assumptions, including the expected stock price volatility. Because our employee stock options have characteristics significantly different from those of traded options, and because changes in the subjective input assumptions can materially affect the fair value estimate, in management's opinion, the existing models do not necessarily provide a reliable single measure of the fair value of its employee stock options.
The weighted-average remaining contractual life of options outstanding issued under the Plan was 4.17 years at August 31, 2012. The exercise prices for the options outstanding at August 31, 2012 ranged from $1.00 to $6.68, and the information relating to these options is as follows:
| Exercise Price | Awards Outstanding | Awards Exercisable | ||||||||||||||||
| Low | High | Quantity | Weighted Average Remaining Contractual Life | Weighted Average Exercise Price | Quantity | Weighted Average Remaining Contractual Life | Weighted Average Exercise Price | |||||||||||
| $1.00 | $1.50 | 382,700 | 4.8 years | $1.07 | 311,900 | 4.4 years | $1.08 | |||||||||||
| $1.51 | $3.00 | 154,600 | 4.1 years | $1.88 | 199,800 | 3.1 years | $1.73 | |||||||||||
| $3.01 | $4.50 | 185,100 | 5.0 years | $3.26 | 48,400 | 5.3 years | $3.08 | |||||||||||
| $4.51 | $6.68 | 4,000 | 5.0 years | $6.68 | 4,000 | 5.0 years | $6.68 | |||||||||||
| 726,400 | 484,100 | |||||||||||||||||
| F-18 |
SIMULATIONS PLUS, INC.
NOTES TO FINANCIAL STATEMENTS
August 31, 2012 and 2011
Intrinsic Value of options outstanding and options exercisable
| Intrinsic Value of Options Outstanding | Intrinsic Value of Options Exercisable | Intrinsic Value of Options Exercised | ||||||||||||
| FY11 | $ | 1,755,674 | $ | 1,348,809 | $ | 1,092,176 | ||||||||
| FY12 | $ | 1,918,904 | $ | 1,447,900 | $ | 982,786 | ||||||||
Other Stock Options
As of August 31, 2012, the outside members of the Board of Directors hold options to purchase 79,000 shares of common stock at exercise prices ranging from $0.38 to $6.68.
| Transactions in FY11 | Number of Options | Weighted-Average Exercise Price Per Share | ||||||
| Outstanding, August 31, 2010 | 71,000 | $ | 2.02 | |||||
| Granted | 12,000 | |||||||
| Exercised | (4,000 | ) | ||||||
| Outstanding, August 31, 2011 | 79,000 | $ | 2.29 | |||||
| Exercisable, August 31, 2011 | 50,950 | $ | 2.15 | |||||
| Transactions in FY12 | Number of Options | Weighted-Average Exercise Price Per Share | ||||||
| Outstanding, August 31, 2011 | 79,000 | $ | 2.29 | |||||
| Granted | 10,000 | $ | 4.46 | |||||
| Exercised | (40,800 | ) | $ | 1.25 | ||||
| Canceled/Forfeited | (11,600 | ) | $ | 4.10 | ||||
| Outstanding, August 31, 2012 | 36,600 | $ | 3.47 | |||||
| Exercisable, August 31, 2012 | 17,000 | $ | 3.35 | |||||
NOTE 6 - INCOME TAXES
The components of the income tax provision for the years ended August 31, 2012 and 2011 were as follows:
| 2012 | 2011 | |||||||
| Current | ||||||||
| Federal | $ | (872,907 | ) | $ | (623,006 | ) | ||
| State | (177,975 | ) | (148,171 | ) | ||||
| (1,050,882 | ) | (771,177 | ) | |||||
| Deferred | ||||||||
| Federal | 114,712 | (262,536 | ) | |||||
| State | (22,901 | ) | (21,560 | ) | ||||
| 91,811 | (284,096 | ) | ||||||
| Total | $ | (1,142,693 | ) | $ | (1,055,273 | ) | ||
| F-19 |
SIMULATIONS PLUS, INC.
NOTES TO FINANCIAL STATEMENTS
August 31, 2012 and 2011
A reconciliation of the expected income tax (benefit) computed using the federal statutory income tax rate to the Company's effective income tax rate is as follows for the years ended August 31, 2012 and 2011:
| 2012 | 2011 | |||||||
| Income tax computed at federal statutory tax rate | 34.0% | 34.0% | ||||||
| State taxes, net of federal benefit | 3.3 | 2.6 | ||||||
| Meals & Entertainment | 0.1 | 0.1 | ||||||
| Other permanent differences | 0.8 | (1.0 | ) | |||||
| Research and development credit | (8.4 | ) | (8.2 | ) | ||||
| Change in prior year estimated taxes | (0.9 | ) | 0.5 | |||||
| Total | 28.9% | 28.0% | ||||||
Significant components of the Company's deferred tax assets and liabilities for income taxes for the years ended August 31, 2012 and 2011 are as follows:
| 2012 | 2011 | |||||||
| Deferred tax assets | ||||||||
| Accrued payroll and other expenses | $ | 79,922 | $ | 91,489 | ||||
| Accrued warranty and service costs | – | 18,732 | ||||||
| Bad debt allowance | – | 99,982 | ||||||
| Deferred revenue | 56,456 | 60,486 | ||||||
| Property and equipment | 32,916 | 60,626 | ||||||
| Research and development credit | 261,526 | 289,357 | ||||||
| State taxes | 66,902 | 50,378 | ||||||
| Total deferred tax assets | 497,722 | 671,050 | ||||||
| Less: Valuation allowance | – | – | ||||||
| 497,722 | 671,050 | |||||||
| Deferred tax liabilities | ||||||||
| State Tax Deferred | (30,663 | ) | (26,710 | ) | ||||
| Capitalized computer software development costs | (1,062,204 | ) | (1,031,869 | ) | ||||
| Total deferred tax liabilities | (1,092,867 | ) | (1,058,579 | ) | ||||
| Net deferred tax liabilities | $ | (595,145 | ) | $ | (387,529 | ) | ||
| F-20 |
SIMULATIONS PLUS, INC.
NOTES TO FINANCIAL STATEMENTS
August 31, 2012 and 2011
We follow guidance issued by the FASB with regard to its accounting for uncertainty in income taxes recognized in the financial statements. Such guidance prescribes a recognition threshold of more likely than not and a measurement process for financial statement recognition and measurement of a tax position taken or expected to be taken in a tax return. In making this assessment, a company must determine whether it is more likely than not that a tax position will be sustained upon examination, based solely on the technical merits of the position and must assume that the tax position will be examined by taxing authorities. Our policy is to include interest and penalties related to unrecognized tax benefits in income tax expense. Interest and penalties totaled $1,300 and $1,035 for the years ended August 31, 2012 and 2011, respectively. We file income tax returns with the Internal Revenue Service (“IRS”) and the state of California. For jurisdictions in which tax filings are prepared, we are no longer subject to income tax examinations by state tax authorities for years through 2006, and by the IRS for years through 2007. As of August 31, 2012, the Company’s tax returns for tax year ends August 31, 2009 and 2010 are under examination by the California Franchise Tax Board. The potential outcome of these examinations cannot be determined as of August 31, 2012. As of August 31, 2012, our 2007 tax filing was also under examination by the IRS. In October 2012, the IRS completed their examination of our 2007 tax filing, the result of which was a decrease of $36,868 in the amount refundable. Our review of prior year tax positions using the criteria and provisions presented in guidance issued by FASB did not resultin in a material impact on the Company’s financial position or results of operations.
NOTE 7 – CONCENTRATIONS AND UNCERTAINTIES
Financial instruments that potentially subject the Company to concentration of credit risk consist principally of cash, cash equivalents and trade accounts receivable. The Company holds cash and cash equivalents at banks located in California, with balances that often exceed FDIC insured limits. Historically, the Company has not experienced any losses in such accounts and believes it is not exposed to any significant credit risk on cash and cash equivalents. However, considering the current banking environment, the Company is investigating alternative ways to minimize its exposure to such risks. While the Company may be exposed to credit losses due to the nonperformance of its counterparties, the Company does not expect the settlement of these transactions to have a material effect on its results of operations, cash flows or financial condition.
Revenue concentration shows that International sales accounted for 49% and 36% of net sales for the years ended August 31, 2012 and 2011, respectively. Two customers accounted for 10% (one is a dealer account representing various customers) and 6% of net sales for the year ended August 31, 2012. For the year ended August 31, 2011, three customers accounted for 11% (one is a dealer account representing various customers), 8% and 7% of net sales.
Accounts receivable concentration shows that two customers comprised 28% (a dealer account representing various customers) and 22% of accounts receivable at August 31, 2012, and two customers comprised 36% (a dealer account representing various customers) and 18% of accounts receivable at August 31, 2011.
| F-21 |
SIMULATIONS PLUS, INC.
NOTES TO FINANCIAL STATEMENTS
August 31, 2012 and 2011
We operate in the computer software industry, which is highly competitive and changes rapidly. Our operating results could be significantly affected by our ability to develop new products and find new distribution channels for new and existing products.
The majority of our customers are in the pharmaceutical industry. During the current economy downturn, we have seen consolidation in the pharmaceutical industry. Although we have not seen any significant reduction in revenues to date, continued consolidation and downsizing in the pharmaceutical industry could have an impact on our revenues and earnings going forward.
NOTE 8 - GEOGRAPHIC REPORTING
Prior to the sale of Words+ on November 30, 2011, the Company operated in two business segments, which consisted of the pharmaceutical software and consulting services business and the augmentative communication devise business. Upon the sale of Words+ on November 30, 2011, the Company ceased operations in the augmentative communication devise business. The results of this segment are presented as discontinued operations in the accompanying financial statements. The pharmaceutical software segment, which represents the Company’s ongoing business, is presented as continuing operations.
The Company allocates revenues to geographic areas based on the locations of its customers. Geographical revenues were as follows for the fiscal years ended August 31, 2012 and 2011:
| August 31, 2012 | ||||||||||||||||||||
| (in ‘000) | North America |
Europe |
Asia | South America |
Total | |||||||||||||||
| Simulations Plus, Inc. | 4,805 | 2,986 | 1,633 | 25 | 9,449 | |||||||||||||||
| August 31, 2011 | ||||||||||||||||||||
| (in ‘000) | North America |
Europe |
Asia | South America |
Total | |||||||||||||||
| Simulations Plus, Inc. | 4,548 | 2,606 | 1,554 | 31 | 8,739 | |||||||||||||||
NOTE 9 – RELATED PARTY TRANSACTIONS
As of August 31, 2012, included in bonus expenses to officers was $87,500, of which $60,000 was accrued bonus representing 5% of the Company’s FY12 net income before bonuses and taxes, not exceeding $60,000, paid to the Corporate Secretary, Virginia Woltosz, as an annual bonus as part of the terms of the sale of Words+ to Simulations Plus in 1996. The other $27,500, paid in December 2011, was FY2011 performance bonus to Walter Woltosz, our President/Chief Executive Officer.
| F-22 |
SIMULATIONS PLUS, INC.
NOTES TO FINANCIAL STATEMENTS
August 31, 2012 and 2011
NOTE 10 – CUSTOMER RELATIONSHIPS
The Company purchased customer relationships as a part of the acquisition of certain assets of Bioreason, Inc. in November 2005. Customer relationships was recorded at a cost of $128,042 and is being amortized over 78 months under the sum-of-the-years’-digits method. Amortization expense for the years ended August 31, 2012 and 2011 amounted to $1,871 and $7,730, respectively. Accumulated amortization was $128,042 as of August 31, 2012.
NOTE 11 - EMPLOYEE BENEFIT PLAN
We maintain a 401(k) Plan for all eligible employees. We make matching contributions equal to 100% of the employee’s elective deferral, not to exceed 4% of the total employee compensation. We can also elect to make a profit-sharing contribution. Contributions by the Company to this Plan amounted to $89,258 and $81,074 for the years ended August 31, 2012 and 2011, respectively.
NOTE 12 - DISCONTINUED OPERATIONS
On November 30, 2011, we sold our interest in Words+, Inc. for $1,973,096 in cash. Words+ operations are now presented as discontinued operations in accordance with accounting rules related to the disposal of long-lived assets.
We recognized a gain of $465,820, net of tax, from this sale, which is included in income from discontinued operations in our statement of operations for the fiscal quarter ended November 30, 2011. The revenue and expenses of discontinued operations for the first fiscal quarter of 2012 and the fiscal year ended August 31, 2011 are as follows:
| (in thousands) | Period from 09/01/11 to 11/30/11 | For the fiscal year ended 08/31/11 | ||||||
| Net sales | $ | 479 | $ | 2,981 | ||||
| Cost of sales | 265 | 1,381 | ||||||
| Gross profit | 214 | 1,600 | ||||||
| Selling, general and administrative | 563 | 1,466 | ||||||
| Research and development | 55 | 64 | ||||||
| Total operating expenses | 618 | 1,530 | ||||||
| Income (Loss) from discontinued operations | (404 | ) | 70 | |||||
| Other income | – | 2 | ||||||
| Income (Loss) from discontinued operations before income taxes | (404 | ) | 72 | |||||
| (Provision for) income taxes | 154 | 20 | ||||||
| Results from discontinued operations, net of tax | $ | (250 | ) | $ | 52 | |||
| F-23 |
SIMULATIONS PLUS, INC.
NOTES TO FINANCIAL STATEMENTS
August 31, 2012 and 2011
The carrying amount of the assets and liabilities of discontinued operations at August 31, 2011 and just prior to the date of the sale on November 30, 2011 were as follows:
| (in thousands) | 11/30/11 | 08/31/11 | ||||||
| Cash and cash equivalents | $ | 6 | $ | 143 | ||||
| Receivables, net | 357 | 603 | ||||||
| Inventory | 392 | 392 | ||||||
| Prepaid and other current assets | 33 | 57 | ||||||
| Capitalized software development costs, net | 212 | 220 | ||||||
| Property and equipment, net | 91 | 120 | ||||||
| Total Assets | 1,091 | 1,535 | ||||||
| Accounts payable | 72 | 116 | ||||||
| Accrued payroll and other expenses | 109 | 219 | ||||||
| Accrued warranty and service costs | 37 | 44 | ||||||
| Total Liabilities | 218 | 379 | ||||||
| Net Assets of discontinued operations | $ | 873 | $ | 1,156 | ||||
NOTE 13 - SUBSEQUENT EVENTS
On October 26, 2012, our board of directors declared the next quarterly cash dividend of $0.05 per share to our shareholders. The dividend will be distributed on Wednesday, November 13, 2012, for shareholders of record as of Friday, November 8, 2012.
F-20