Attached files
| file | filename |
|---|---|
| EX-32.1 - CERTIFICATION - Simulations Plus, Inc. | simulations_10k-ex3201.htm |
| EX-31.2 - CERTIFICATION - Simulations Plus, Inc. | simulations_10k-ex3102.htm |
| EX-31.1 - CERTIFICATION - Simulations Plus, Inc. | simulations_10k-ex3101.htm |
| EX-23.1 - CONSENT OF INDEPENDENT REGISTERED PUBLIC ACCOUNTING FIRM - Simulations Plus, Inc. | simulations_10k-ex2301.htm |
| EX-21.1 - LIST OF SUBSIDIARIES - Simulations Plus, Inc. | simulations_10k-ex2101.htm |
UNITED STATES
SECURITIES AND EXCHANGE COMMISSION
Washington, DC 20549
FORM 10-K
x ANNUAL REPORT PURSUANT TO SECTION 13 OR 15(d) OF THE SECURITIES EXCHANGE ACT OF 1934
For the fiscal year ended August 31, 2017
or
o TRANSITION REPORT PURSUANT TO SECTION 13 OR 15(d) OF THE SECURITIES EXCHANGE ACT OF 1934
For the transition period from _________ to _________
Commission file number: 001-32046

Simulations Plus, Inc.
(Exact name of registrant as specified in its charter)
|
California (State or other jurisdiction of incorporation or organization) |
95-4595609 (I.R.S. Employer Identification No.) |
|
42505 Tenth Street West Lancaster, CA 93534-7059 (Address of principal executive offices including zip code) |
(661) 723-7723 (Registrant’s telephone number, including area code) |
SECURITIES REGISTERED PURSUANT TO SECTION 12(b) OF THE ACT:
|
Title of Each Class Common Stock, par value $0.001 per share |
Name of Each Exchange on Which Registered NASDAQ Stock Market LLC |
SECURITIES REGISTERED PURSUANT TO SECTION 12(G) OF THE ACT: NONE
Indicate by check mark if the registrant is a well-known seasoned issuer, as defined in Rule 405 of the Securities Act. Yes o No x
Indicate by check mark if the registrant is not required to file reports pursuant to Section 13 or Section 15(d) of the Act. Yes o No x
Indicate by check mark whether the registrant (1) has filed all reports required to be filed by Section 13 or 15(d) of the Securities Exchange Act of 1934 during the preceding 12 months (or for such shorter period that the registrant was required to file such reports), and (2) has been subject to such filings requirements for the past 90 days. Yes x No o
Indicate by check mark whether the registrant has submitted electronically and posted on its corporate Website, if any, every Interactive Data File required to be submitted and posted pursuant to Rule 405 of Regulation S-T (§232.405 of this chapter) during the preceding 12 months (or for such shorter period that the registrant was required to submit and post such files). Yes x No o
Indicate by check mark if disclosure of delinquent filers pursuant to Item 405 of Regulation S-K (§229.405) is not contained herein, and will not be contained, to the best of registrant’s knowledge, in definitive proxy or information statements incorporated by reference in Part III of this Form 10-K or any amendment to this Form 10-K. x
Indicate by check mark whether the registrant is a large accelerated filer, an accelerated filer, a non-accelerated filer, or a smaller reporting company. See the definitions of “large accelerated filer,” “accelerated filer” and “smaller reporting company” in Rule 12b-2 of the Exchange Act (Check one):
| Large accelerated filer o | Accelerated filer x | |
| Non-accelerated filer o | Smaller reporting company o | |
| Emerging growth company o |
If an emerging growth company, indicate by check mark if the registrant has elected not to use the extended transition period for complying with any new or revised financial accounting standards provided pursuant to Section 13(a) of the Exchange Act. o
Indicate by check mark whether the registrant is a shell company (as defined in Rule 12b-2 of the Exchange Act). Yes o No x
The aggregate market value of the registrant’s common stock held by non-affiliates of the registrant as of February 28, 2017, based upon the closing price of the common stock as reported by The Nasdaq Stock Market on such date, was approximately $106,370,782. This calculation does not reflect a determination that persons are affiliates for any other purposes.
As of November 14, 2017, 17,284,792 shares of the registrant’s common stock were outstanding.
DOCUMENTS INCORPORATED BY REFERENCE
Certain portions of the registrant’s definitive proxy statement to be delivered to its shareholders in connection with the registrant’s 2017 Annual Meeting of Shareholders are incorporated by reference into Part III of this Form 10-K. Such definitive proxy statement will be filed with the Securities and Exchange Commission within 120 days after the end of the fiscal year covered by this annual report on Form 10-K.
Simulations Plus, Inc.
FORM 10-K
For the Fiscal Year Ended August 31, 2017
| i |
Forward-Looking Statements
This document and the documents incorporated in this document by reference contain forward-looking statements that are subject to risks and uncertainties. All statements other than statements of historical fact contained in this document and the materials accompanying this document are forward-looking statements.
The forward-looking statements are based on the beliefs of our management, as well as assumptions made by, and information currently available to, our management. Frequently, but not always, forward-looking statements are identified by the use of the future tense and by words such as “believes,” expects,” “anticipates,” “intends,” “will,” “may,” “could,” “would,” “projects,” “continues,” “estimates” or similar expressions. Forward-looking statements are not guarantees of future performance and actual results could differ materially from those indicated by the forward-looking statements. Forward-looking statements involve known and unknown risks, uncertainties, and other factors that may cause our or our industry’s actual results, levels of activity, performance or achievements to be materially different from any future results, levels of activity, performance or achievements expressed or implied by the forward-looking statements.
The forward-looking statements contained or incorporated by reference in this document are forward-looking statements within the meaning of Section 27A of the Securities Act of 1933, as amended (“Securities Act”) and Section 21E of the Securities Exchange Act of 1934, as amended (“Exchange Act”), and are subject to the safe harbor created by the Private Securities Litigation Reform Act of 1995. These statements include declarations regarding our plans, intentions, beliefs or current expectations.
Among the important factors that could cause actual results to differ materially from those indicated by forward-looking statements are the risks and uncertainties described under “Risk Factors” in our other filings with the Securities and Exchange Commission (“SEC”).
Forward-looking statements are expressly qualified in their entirety by this cautionary statement. The forward-looking statements included in this document are made as of the date of this document and we do not undertake any obligation to update forward-looking statements to reflect new information, subsequent events or otherwise, except as required by law.
As used in this report, each of the terms “we,” “us,” “our,” the “Company” and “Simulations Plus” refers to Simulations Plus, Inc. and its wholly owned subsidiaries Cognigen Corporation, of Buffalo, New York, and DILIsym Services, Inc of Research Triangle Park, North Carolina, unless otherwise stated or the context otherwise requires.
OVERVIEW
Simulations Plus, Inc., incorporated in 1996, is a premier developer of groundbreaking drug discovery and development software for mechanistic modeling and simulation, for machine-learning-based prediction of properties of molecules solely from their structure, and is exploring the application of its machine-learning technologies in other industries, including aerospace/military and general healthcare. Our pharmaceutical/chemistry software is licensed to major pharmaceutical, biotechnology, agrochemical, and food industry companies and to regulatory agencies worldwide for use in the conduct of industry-based research. We also provide consulting services ranging from early drug discovery through preclinical and clinical trial data analysis and for submissions to regulatory agencies. Simulations Plus is headquartered in Southern California, with offices in Buffalo, New York, and Research Triangle Park, North Carolina, and its common stock trades on the NASDAQ Capital Market under the symbol “SLP.”
In September 2014, Simulations Plus acquired Cognigen Corporation (Cognigen) as a wholly owned subsidiary pursuant to that certain Agreement and Plan of Merger, dated as of July 23, 2014, by and between Simulations Plus and Cognigen (the “Merger Agreement”). Cognigen was originally incorporated in 1992. Through the integration of Cognigen into Simulations Plus, Simulations Plus is now also a leading provider of population modeling and simulation contract research services for the pharmaceutical and biotechnology industries. Our clinical-pharmacology-based consulting services include pharmacokinetic and pharmacodynamic modeling, clinical trial simulations, data programming, and technical writing services in support of regulatory submissions. We have also developed software for harnessing cloud-based computing in support of modeling and simulation activities and secure data archiving, and we provide consulting services to improve interdisciplinary collaborations and research and development productivity.
| 1 |
In June 2017, Simulation Plus acquired DILIsym Services, Inc (DILIsym) as a wholly owned subsidiary pursuant to a stock purchase agreement dated May 1, 2017. On June 1, 2017, the Company consummated the acquisition of all outstanding equity interests of DILIsym pursuant to the terms of the Stock Agreement, with DILIsym becoming a wholly owned subsidiary of the Company. We believe the combination of Simulations Plus and DILIsym provides substantial future potential based on the complementary strengths of each of the companies. The acquisition of DILIsym positions the Company as the leading provider of Drug Induced Liver Injury (DILI) modeling and simulations software and contract research services. In addition to the DILIsym® software for analysis of potential drug-induced liver injury, DILIsym Services, Inc. also has developed a simulation program for analyzing nonalcoholic fatty liver disease (NAFLD) called NAFLDsym™. The difference between DILIsym and NAFLDsym is that DILIsym estimates the potential for a particular drug molecule to induce liver injury, while NAFLDsym estimates the likelihood of new molecules to treat nonalcoholic fatty liver disease, and is unique to the mechanisms involved in such treatment. As such, DILIsym can be a single program that addresses a wide variety of molecules across various companies, while NAFLDsym requires customizing the software for each mechanism of action. Both the DILIsym and NAFLDsym software programs require outputs from physiologically based pharmacokinetics (PBPK) software as inputs. The GastroPlus™ software from Simulations Plus provides such information; thus, the integration of these technologies will provide a seamless capability for analyzing the potential for drug-induced liver injury for new drug compounds and for investigating the potential for new therapeutic agents to treat nonalcoholic fatty liver disease.
We are a global leader focused on improving the ways scientists use knowledge and data to predict the properties and outcomes of pharmaceutical and biotechnology agents, and provide the most comprehensive suite of software and consulting services ranging from early drug discovery through development, clinical trials, and post-patent support to generic pharmaceutical companies. Our innovations in integrating new and existing science in medicinal chemistry, computational chemistry, pharmaceutical science, biology, physiology, systems pharmacology/toxicology, and machine learning into our software have made us the leading software provider for physiologically based pharmacokinetics (PBPK) modeling and simulation, prediction of molecular properties from structure, and analysis of drug-induced liver injury and nonalcoholic fatty liver disease.
We generate revenue by delivering relevant, cost-effective software and creative and insightful consulting services. Pharmaceutical and biotechnology companies use our software programs and scientific knowledge to guide early drug discovery (molecule design and screening), preclinical, and clinical development programs. They also use it to enhance their understanding of the properties of potential new medicines and to use emerging data to improve formulations, select and justify dosing regimens, support the generics industry, optimize clinical trial design, avoid toxicological problems, and simulate outcomes in special populations, such as the elderly and pediatric patients.
PRODUCTS
General
We currently offer ten software products for pharmaceutical research and development: five simulation programs that provide time-dependent results based on solving large sets of differential equations: GastroPlus™; DDDPlus™; MembranePlus™; DILIsym; and NAFLDsym; three programs that are based on predicting and analyzing static (not time-dependent) properties of chemicals: ADMET Predictor™; MedChem Designer™; and MedChem Studio™ (the combination of ADMET Predictor, MedChem Designer, and MedChem Studio is called our ADMET Design Suite™); our newest program which is designed for rapid clinical trial data analysis and regulatory submissions called PKPlus™; and one program called KIWI™ from our Cognigen division that provides an integrated platform for data analysis and reporting through our proprietary secure cloud.
GastroPlus
Our flagship product, and currently our largest single source of software revenue, is GastroPlus. GastroPlus simulates the absorption, pharmacokinetics, and pharmacodynamics of drugs administered to humans and animals, and is currently the most widely used commercial software of its type by pharmaceutical companies, the U.S. Food and Drug Administration (FDA), the U.S. National Institutes of Health (NIH), and other government agencies in the U.S. and other countries. The FDA currently has 30 floating GastroPlus licenses shared across various divisions.
Because of the widespread use of GastroPlus, we were the only non-European company invited to join the European Innovative Medicines Initiative (IMI) program for Oral Bioavailability Tools (OrBiTo). OrBiTo, begun in 2012 and completed in 2017, was an international collaboration among 27 industry, academic, and government organizations working in the area of oral absorption of pharmaceutical products. Because we are outside of the European Union, our participation in this project was at our own expense, while other members were compensated for their work; however, we were a full member with access to all of the data and discussions of all other members. We believe our investment to participate in this initiative enabled us to benefit from, and to contribute to, advancing the prediction of human oral bioavailability from preclinical data, and ensured that we are well-known to member pharmaceutical companies and regulatory agencies.
| 2 |
In September 2016 we announced that Simulations Plus had been invited to join the European SimInhale Consortium and had been admitted to this prestigious group focused on advancing the state of the art for simulation of inhaled dosage forms. As one of only two U.S. participants, Simulations Plus is participating in activities designed to advance particle designs for improved deposition and interaction with lung tissue; promote realistic computer simulations of particle aerosolization, delivery, and deposition; promote patient-tailored inhaled medicines; promote integration of device and formulation design; and promote critical assessment of toxicity issues and related risks.
In September 2014, we entered into a research collaboration agreement (RCA) with the FDA to enhance the Ocular Compartmental Absorption and Transit (OCAT™) model within the Additional Dosing Routes Module of GastroPlus. The objective of this agreement is to provide a tool for generic companies and the FDA to assess the likely bioequivalence of generic drug formulations dosed to the eye. Under this RCA, we receive up to $200,000 per year. This RCA could be renewed for up to a total of three years based on the progress achieved during the project. After a successful second year, the RCA was renewed for its third year in September 2016, and was completed in September 2017.
We were awarded another RCA by the FDA in September 2015, this one to expand the capabilities of GastroPlus to simulate the dosing of long-acting injectable microspheres. This type of dosage form is usually injected via subcutaneous or intramuscular routes, but can also be used for ocular dosing. Once again, this RCA provides up to $200,000 per year for up to three years. Under this agreement, we are developing simulation models to deal with the very slow dissolution/decomposition of the microsphere carrier material that gradually releases the active drug over periods as long as weeks or months. After a successful second year, the RCA was renewed for the third year in September 2017, and will expire in September 2018 unless further renewed.
In addition to the two funded efforts with the FDA described above, we also have an unfunded RCA with the FDA’s Office of Generic Drugs (OGD) that began in 2014. The objective of this RCA, which has a five-year term, is directed toward the FDA’s evaluation of mechanistic IVIVCs (in vitro-in vivo correlations) to determine whether mechanistic absorption modeling (MAM) can relate laboratory (in vitro) dissolution experiment results to the behavior of dosage forms in humans and animals (in vivo) better than traditional empirical methods.
In April 2017, we released Version 9.5 of GastroPlus after nearly two years of improvements over version 9.0, which was released in April 2015. Version 9.5 is now the largest single upgrade we’ve made to the program. New functionalities that we believe provide the most advanced decision-making tool for preclinical and early clinical trial simulation and modeling analysis available today include:
| · | ability to simulate the absorption and distribution of antibody-drug conjugates (ADCs), which are antibodies that are used to carry small drug molecules to the intended target tissue | |
| · | ability to dose via intramuscular injection and an improved model for subcutaneous injection | |
| · | several new physiology models, including Chinese and hepatic impairment populations | |
| · | revamped workflows for building in vitro-in vivo correlations (IVIVCs) and performing virtual bioequivalence trial simulations | |
| · | improved reporting capabilities, making it easier for companies wishing to submit results to regulatory agencies |
Our goal with GastroPlus is to integrate the most advanced science into user-friendly software to enable pharmaceutical researchers and regulators to perform sophisticated analyses of complex drug behaviors in humans and laboratory animals. Already the most widely used program in the world for physiologically based pharmacokinetics (PBPK), the addition of these new capabilities is expected to expand the user base in the early pharmaceutical research and development process, while also helping us further penetrate the biopharmaceuticals, food, cosmetics, and general toxicology markets.
Version 9.6 is now in development and release is expected in early calendar 2018. This version will add a number of important new capabilities, including improvements to absorption, metabolism, drug-drug interaction, and output reporting, among others.
DDDPlus
DDDPlus simulates in vitro (laboratory) experiments that measure the rate of dissolution of a drug and, if desired, the additives (excipients) in a particular dosage form (e.g., powder, tablet, capsule, or injectable solids) under a variety of experimental conditions. This unique software program is used by formulation scientists in industry and the FDA to (1) understand the physical mechanisms affecting the disintegration and dissolution rates of various formulations, (2) reduce the number of cut-and-try attempts to design new drug formulations, and (3) design in vitro dissolution experiments to better mimic in vivo (animal and human) conditions. Version 5.0 of DDDPlus, which added a number of significant enhancements, was released in April 2016. This version added new formulation types (controlled release bilayer tablet, delayed release coated tablet, and immediate release coated beads), expanded formulation specification options, biorelevant solubilities and surfactant effects on dissolution, tablet compression and disintegration models, links with GastroPlus, and updated licensing. Current improvements in development and testing include new capabilities to simulate in vitro dissolution experiments for long-acting injectable microspheres as part of our work under the FDA-funded grant mentioned above.
| 3 |
Version 6.0 of DDDPlus is in final development testing and will offer a series of new capabilities, including:
| · | simulation of the in vitro dissolution of long-acting injectable dosage forms |
| · | simulation of the in vitro dissolution of controlled release bead formulations |
| · | improved simulation of transfer assay experiments |
| · | ability to fit models from precipitation experiments |
| · | new dissolution apparatus models |
| · | improved output reporting |
MembranePlus™
MembranePlus was released in October 2014. Similar to DDDPlus, MembranePlus simulates laboratory experiments, but in this case, the experiments are for measuring permeability of drug-like molecules through various membranes, including several different standard cell cultures (Caco-2, MDCK), as well as artificially formulated membranes (PAMPA). The value of such simulations derives from the fact that when the permeabilities of the same molecules are measured in different laboratories using (supposedly) the same experimental conditions, the results are often significantly different. These differences are caused by a complex interplay of factors in how the experiment was set up and run. MembranePlus simulates these experiments with their specific experimental details, and this enables scientists to better interpret how results from specific experimental protocols can be used to predict permeability in human and animals, which is the ultimate goal.
Version 2.0 of MembranePlus is in final development testing. This version will add:
| · | simulation of sandwich hepatocyte assays |
| · | simulation of suspended hepatocyte assays |
| · | intracellular protein binding |
| · | integration of ADMET Predictor metabolism predictions |
| · | improved output reporting |
PKPlus™
On August 25, 2016, we announced the release of a new standalone software product called PKPlus, based on the internal PKPlus Module in GastroPlus that has been available since 2000. The PKPlus Module in GastroPlus provides quick and easy fitting of compartmental pharmacokinetic (PK) models as well as noncompartmental analysis (NCA) for intravenous and extravascular (oral, dermal, ocular, pulmonary, etc.) doses; however, the PKPlus Module in GastroPlus was not designed to meet all of the requirements for performing these analyses for Phase 2 and 3 clinical trials, nor to produce report-quality output for regulatory submissions. The new standalone PKPlus program has been developed to provide the full level of functionality needed by pharmaceutical industry scientists to perform the analyses and generate the outputs needed to fully satisfy regulatory agency requirements for both NCA and compartmental PK modeling. After receiving considerable feedback on version 1.0, we are modifying the program to include a number of additional features requested by our users and potential users and expect to release the next version later this year. We believe the potential number of eventual users for PKPlus is in the thousands world-wide and that it has the potential to eventually become one of our leading revenue producers.
We are now in final development testing of PKPlus version 2.0, which has incorporated a wide variety of requested features from current users as well as evaluators of version 1.0,including:
| · | 21 CFR Part 11 compliance for audit trail and validation |
| · | nonparametric superstition for analysis of multiple dose pharmacokinetics |
| · | ability to edit input data prior to incorporating it into a project |
| · | ability to save templates for various types of analyses to reduce the time required when working with new datasets |
| · | new statistics graphical outputs |
| · | command line version for rapid validation and for batch processing |
ADMET Predictor™
ADMET (Absorption, Distribution, Metabolism, Excretion, and Toxicity) Predictor is a chemistry-based computer program that takes molecular structures (i.e., drawings of molecules represented in various formats) as inputs and predicts approximately 150 different properties for them at an average rate of over 100,000 compounds per hour on a modern laptop computer. This capability allows chemists to generate estimates for a large number of important molecular properties without the need to synthesize and test the molecules, as well as to generate estimates of unknown properties for molecules that have been synthesized, but for which only a limited number of experimental properties have been measured. Thus, a chemist can assess the likely success of a large number of existing molecules in a company’s chemical library, as well as molecules that have never been made, by providing their molecular structures, either by drawing them using a tool such as our MedChem Designer software, or by automatically generating large numbers of molecules using various computer algorithms, including those embedded in our MedChem Studio software.
For many years, ADMET Predictor has been top-ranked for predictive accuracy in multiple peer-reviewed, independent comparison studies, while generating its results at a high throughput rate. Although the state of the art of this type of software does not enable identifying the best molecule in a series, it does allow early screening of molecules that are highly likely to fail as potential drug candidates (i.e., the worst molecules, which is usually the majority of a chemical library) before synthesizing and testing them. Thus, millions of virtual compounds can be created and screened in a day, compared to potentially months or years of work to actually synthesize and test a much smaller number of actual compounds.
| 4 |
The most recent release of ADMET Predictor, version 8.0, was released on August 1, 2016. This new version features a completely redesigned and modernized interface as well as a number of new capabilities to enhance the performance and user-friendliness of the program. In addition, we have integrated a number of MedChem Studio features into the new ADMET Predictor, and created a tighter integration between the two programs when a MedChem Studio license is obtained along with an ADMET Predictor license.
The optional ADMET Modeler Module™ in ADMET Predictor enables scientists to use their own experimental data to quickly create proprietary high-quality predictive models using the same powerful machine-learning methods we use to build our top-ranked property predictions. Pharmaceutical companies expend substantial time and money conducting a wide variety of experiments on new molecules each year, generating large databases of experimental data. Using this proprietary data to build predictive models can provide a second return on their investment; however, model building has traditionally been a difficult and tedious activity performed by specialists. The automation in ADMET Modeler makes it easy for a scientist to create very powerful models with minimal training.
We released version 8.1 in January 2017. This new release includes:
| · | Both 64-bit and 32-bit executables, making it possible to handle larger data sets | |
| · | Optimization of spreadsheet and model-building functions to improve efficiency | |
| · | Model-building in ADMET Modeler has been streamlined and made much more efficient | |
| · | The MedChem Studio™ Module includes combinatorial substituent and scaffold replacement operations | |
| · | New in silico Ames tests have been added to produce reliable confidence predictions and are more broadly applicable | |
| · | ADMET Risk™ scores are now accessible graphically in histograms |
The release of version 8.5 is imminent. This new version will include:
| · | a new Simulation Module to predict absorption and bioavailability for libraries of molecules from their structure |
| · | ability to optimize doses to achieve desired steady-state concentrations |
| · | new property models for rat fraction unbound in plasma, blood/plasma concentration ratio, and metabolism by certain enzymes |
| · | all MedChem Studio™ features now available through the same graphical user interface as ADMET Predictor |
| · | new synthetic difficulty model |
| · | improved visualization |
| · | multithreading and other speed enhancements |
Potential new markets for machine learning
We are currently investigating applications of our sophisticated machine-learning engine outside of our normal pharmaceutical markets. To date, we have conducted several proof-of-concept studies including: (1) building predictive models for missile aerodynamic force and moment coefficients as a function of missile geometry, Mach number, and angle of attack, (2) classifying/identifying missiles and other objects from radar tracking data, (3) mapping jet engine compressor performance to predict when maintenance might be required, and (4) classifying patients as healthy or experiencing some disease state or genetic disorder evidenced by magnetic resonance imaging (MRI) of the brain. Other potential applications for this modeling engine have also been identified; however, our focus to date has been primarily in these areas.
We believe our proprietary machine-learning software engine has a wide variety of potential applications and we intend to pursue funding to develop customized tools to further monetize our investment in this technology by expanding our markets beyond the life sciences and chemistry. In addition, we are examining a variety of expanded capabilities to add to the basic modeling engine to accommodate even larger data sets (“big data analytics”) and new applications.
MedChem Designer™
MedChem Designer was launched in 2011. It was initially a molecule-drawing program, or “sketcher”, but now has capabilities exceeding those of other molecule-drawing programs because of its integration with both MedChem Studio and ADMET Predictor. We provide MedChem Designer for free because we believe that in the long run it will help to increase demand for ADMET Predictor and MedChem Studio, and because most other existing molecule-drawing programs are also provided for free. Our free version includes a small set of ADMET Predictor’s best-in-class property predictions, allowing the chemist to modify molecular structures and then see a few key properties very quickly. With a paid ADMET Predictor license, the chemist would see the entire approximately 150 predictions that are available. Over 22,000 copies of MedChem Designer have been downloaded by scientists around the world to date.
| 5 |
When used with a license for ADMET Predictor, MedChem Designer becomes a de novo molecule design tool. With it, a researcher can draw one or more molecular structures, then click on the ADMET Predictor icon and have approximately 150 properties for each structure calculated in seconds, including our proprietary ADMET Risk index. Researchers can also click on an icon to generate the likely metabolites of a molecule and then predict all of the properties of those metabolites from ADMET Predictor, including each of their ADMET Risk scores. This is important because a metabolite of a molecule can be therapeutically beneficial (or harmful) even though the parent molecule is not.
Our proprietary ADMET Risk score provides a single number that tells the chemist how many default threshold values for various predicted properties were crossed (or violated) by each structure. Thus, in a single number, the chemist can instantly compare the effects of different structural changes in many dimensions. The ideal score is zero; however, a low score greater than zero might be acceptable, depending on what property(s) caused the points to be assigned. If the number is too high (greater than 5 or 6), the molecule is not likely to be successful as a drug. The default rules can be modified and new rules can be added by the user to include any desired rule set based on any combination of calculated descriptors, predicted properties, and user inputs. As chemists attempt to modify structures to improve one property, they often cause others to become unacceptable. Without ADMET Risk, the chemist would have to individually examine many key properties for each new molecule (and its metabolites) to determine whether any of them became unacceptable as a result of changing the structure.
MedChem Studio™
MedChem Studio has been integrated into the ADMET Predictor platform, but can still be licensed separately without requiring a license for ADMET Predictor. MedChem Studio is a powerful software tool that is used both for data mining and for de novo design of new molecules. In its data-mining role, MedChem Studio facilitates searching large chemical libraries to find molecules that contain identified substructures, and it enables rapid identification of clusters (classes) of molecules that share common substructures. We have now merged MedChem Studio with ADMET Predictor so that either program can be entered through the same interface, and the communication between the two programs is enhanced through the seamless integration of both technologies. We believe this will enhance the attractiveness of both ADMET Predictor and MedChem Studio to medicinal and computational chemists.
While MedChem Designer can be used to refine a small number of molecules, MedChem Studio can be used to create and screen (with ADMET Predictor) very large numbers of molecules down to a few promising lead candidates. MedChem Studio has features that enable it to generate new molecular structures using a variety of de novo design methods. When MedChem Studio is used with ADMET Predictor and MedChem Designer (the combination of which we refer to as our ADMET Design Suite), we believe the programs provide an unmatched capability for chemists to search through large libraries of compounds that have undergone high-throughput screening experiments to find the most promising classes (groups of molecules with a large common part of their structures) and molecules that are active against a particular target. In addition, MedChem Studio can take an interesting (but not acceptable) molecule and, using a variety of design algorithms, quickly generate many thousands to millions of high quality analogs (similar new molecules). These molecules can then be screened using ADMET Predictor to find molecules that are predicted to be both active against the target and acceptable in a variety of ADMET properties. We demonstrated the power of the ADMET Design Suite during two NCE (new chemical entity) projects wherein we designed lead molecules to inhibit the growth of the plasmodium falciparum malaria parasite in one study, and lead molecules that were able to inhibit two targets at the same time: COX-1 and COX-2. In each case, we announced ahead of time that we were attempting to do this, and we reported the results when the projects were complete. Every molecule we designed and had synthesized hit their targets in both projects, clearly demonstrating the power of the ADMET Design Suite.
KIWITM
Drug development programs rely increasingly on modeling and simulation analyses to support decision-making and submissions to regulatory agencies. To ensure high-quality analyses, organizations must not only apply high-quality science, but must also be able to support the science by being able to validate the results. KIWI is a cloud-based web application that was developed to efficiently organize, process, maintain, and communicate the volume of data and results generated by pharmacologists and scientists over the duration of a drug development program. The validated workflow and tools within KIWI promote traceability and reproducibility of results.
The pharmaceutical industry has been rapidly adopting cloud technology as a solution to ever-expanding computer processing needs. Leveraging our 20-plus years of experience in providing an architecture supporting modeling and simulation efforts, we have developed KIWI as a secure, validated, enterprise-scale environment, enabling global teams to collaborate on model-based decision making. KIWI has proven to be a valuable platform for encouraging interdisciplinary discussions about the model development process and interpretation of results. We continue to receive positive feedback about the functionality implemented in KIWI and the value of the approach we have taken to harness cloud technology. We continue to improve functionality and collaboration within the KIWI platform, and we expect the licensing fee will be a source of recurring revenue for further development and growth. KIWI Version 1.3 was released in May 2015. This version of KIWI provides our user community with access to new features that accelerate completion of modeling projects by decreasing run times and facilitating the comparison and exporting of results across models. These features include dynamic comparisons of model parameter estimates and diagnostic plots, export of model run records for regulatory submissions, and accelerated infrastructure with the upgrade to the latest versions of NONMEM® and Perl-speaks-NONMEM running in a 64-bit Linux environment.
| 6 |
KIWI Version 1.6 was released in September 2016. This new version introduced major enhancements in the functionality of visualization tools offered by the platform. These enhancements include simplifying the creation of plots and comparing them across multiple models, thus accelerating the model refinement process. In addition, analysts can now conveniently copy visualization preferences across projects, improving consistency and facilitating collaboration and communication with clients and colleagues. We are now further enhancing KIWI as part of our five-year, almost-$5 million contract with a leading global research foundation.
DILIsym
The DILIsym software is a quantitative systems pharmacology (QSP) program that has been in development since 2011. QSP software models are based on the fundamental understanding of complex biological pathways, disease processes, and drug mechanisms of action, integrating information from experiments and forming hypotheses for the next experimental model. DILIsym deals with the propensity for some drug molecules to induce temporary or permanent changes in biological functions within liver cells (hepatocytes) that can result in damage to the liver. Some drugs cause temporary changes in liver function but the body soon compensates and liver function returns to normal. Other drugs cause liver function to permanently decline as they continue to be taken. The DILIsym software models a variety of interactions within the hepatocytes to determine whether a particular drug molecule interrupts normal signaling pathways in a manner to induce injury to the cells.
NAFLDsym
Where DILIsym is used to investigate the likelihood that a known drug molecule would cause injury to the liver, NAFLDsym is concerned with a liver that is already diseased by excess fat and investigated the likelihood that various molecules might provide beneficial therapeutic benefits to treat or cure the disease. DILIsym can be considered a “shrink wrap” software product, usable across many companies and drug development projects. NAFLDsym, on the other hand, requires modification for each of a number of different mechanisms of action that potential new drug compounds could use to treat the disease, and so is a customized tool used in consulting projects for each new client project.
Contract Research and Consulting Services
Our scientists and engineers have expertise in drug absorption via various dosing routes (oral, intravenous, ocular, nasal/pulmonary, and dermal), pharmacokinetics, and pharmacodynamics. They have attended over 200 scientific meetings worldwide in the past four years, often speaking and presenting. We frequently conduct contracted consulting studies for large customers (including the five largest pharmaceutical companies) who have particularly difficult problems and who recognize our expertise in solving them, as well as for smaller customers who prefer to have studies run by our scientists rather than to license our software and train someone to use it. The demand for our consulting services has been steadily increasing, and we have expanded our consulting teams to meet the increased workload.
We continue working on a five-year consulting agreement with a major research foundation to implement a platform for coordinating the data generated by global teams engaged in model-based drug development.
We currently are working with the FDA on two Research Collaboration Agreements (RCAs): the funded efforts for long-acting injectable microspheres and the unfunded IVIVC effort, both described above under “GastroPlus”. We also successfully completed the third year of our funded collaboration for ocular dosing just after the end of FY2017.
Pharmacometric Modeling
We have a reputation for high-quality analyses and regulatory reporting of data collected during preclinical experiments as well as clinical trials of new and existing pharmaceutical products, typically working on 30-40 drug projects per year. Traditionally, the model-based analysis of clinical trial data was different from the modeling analysis offered by GastroPlus; the former relied more on statistical and semi-mechanistic models, whereas the latter is based on very detailed mechanistic models. Statistical models rely on direct observation and mathematical equations that are used to fit data collected across multiple studies along with describing the variability within and between patients. Mechanistic models are based on a detailed understanding of the human body and the chemistry of the drug and involve mathematical and scientific representation of the phenomena involved in drug dissolution/precipitation, absorption, distribution, metabolism, and elimination. Collectively, the models guide drug formulation design and dose selection. Beginning in 2014, the U.S. F.D.A and other regulatory agencies began to emphasize the need to push mechanistic PBPK modeling and simulation into clinical pharmacology, and we have seen the benefit of having our clinical pharmacology team in the Cognigen division and our scientists in our Lancaster, California (Simulations Plus) division working together to achieve this goal.
| 7 |
PRODUCT DEVELOPMENT
Development of our software is focused on expanding product lines, designing enhancements to our core technologies, and integrating existing and new products into our principal software architecture and platform technologies. We intend to continue to offer regular updates to our products and to continue to look for opportunities to expand our existing suite of products and services.
To date, we have developed products internally, sometimes also licensing or acquiring products, or portions of products, from third parties. These arrangements sometimes require that we pay royalties to third parties. We intend to continue to license or otherwise acquire technology or products from third parties when it makes business sense to do so. We currently have one license agreement, with BIOVIA, a San Diego division of Dassault Systemes in France (formerly known as Accelrys, Inc.), pursuant to which a small royalty is paid to BIOVIA from revenues on each license for the Metabolite module in ADMET Predictor. This license agreement continues in perpetuity and either party has the right to terminate it.
In 1997 we entered into an exclusive software licensing agreement with TSRL, Inc. (aka Therapeutic Systems Research Laboratories) (TSRL), pursuant to which TSRL licensed certain software technology and databases to us, and we paid royalties to TSRL. On May 15, 2014, we and TSRL entered into a termination and nonassertion agreement pursuant to which the parties agreed to terminate the 1997 exclusive software licensing agreement. As a result, the Company obtained a perpetual right to use certain source code and data, and TSRL relinquished any rights and claims to any GastroPlus products and to any claims to royalties or other payments under that agreement, and we agreed to pay TSRL total consideration of $6,000,000. All payments have now been made as of April 2017. Our payment obligation is being amortized at a constant rate of $150,000 per quarter until it is completely amortized, after which no further expense will be incurred. To date, this has resulted in expense savings over $950,000 compared to the royalty payments that would have been paid to TSRL if paid consistent with past practices.
MARKETING AND DISTRIBUTION
We distribute our products and offer our services in North America, South America, Europe, Japan, Australia, New Zealand, India, Singapore, Taiwan, and the People’s Republic of China.
We market our pharmaceutical software and consulting services through attendance and presentations at scientific meetings, exhibits at trade shows, seminars at pharmaceutical companies and government agencies, through our website, and using various communication channels to our database of prospects and customers. At various scientific meetings around the world each year there are numerous presentations and posters presented in which the reported research was performed using our software. Many of these presentations are from industry and FDA scientists; some are from our staff. In addition, more than 50 peer-reviewed scientific journal articles, posters, and podium presentations are typically published each year using our software, mostly by our customers, further supporting its use in a wide range of preclinical and clinical studies.
Our sales and marketing efforts are handled primarily internally with our scientific team and several senior management staff assisting our marketing and sales staff with trade shows, seminars, and customer trainings both online and on-site. We believe that this is more effective than a completely separate sales team for several reasons: (1) customers appreciate talking directly with software developers and consulting scientists who can answer a wide range of in-depth technical questions about methods and features; (2) our scientists and engineers gain an appreciation for the customer’s environment and problems; and (3) we believe the relationships we build through scientist-to-scientist contact are stronger than relationships built through salesperson-to-scientist contacts. We also have one independent distributor in Japan and two independent representatives in China who also sell and market our products with support from our scientists and engineers.
We provide support to the GastroPlus User Group in Japan, which was organized by Japanese researchers in 2009. In early 2013, a group of scientists in Europe and North America organized another GastroPlus User Group following the example set in Japan. Nearly 1,000 members have joined this group to date. We support this group through coordination of online meetings each month and managing the user group web site for exchange of information among members. These user groups provide us valuable feedback with respect to desired new features and suggested interface changes.
PRODUCTION
Our pharmaceutical software products are designed and developed by our development teams in California (Lancaster, Gureneville, San Jose, and San Diego), North Carolina (Research Triangle Park), and New York (Buffalo). In addition, our Chief Executive Officer works primarily from Auburn, Alabama. Our products and services are now delivered electronically – we no longer provide CD-ROMs and printed manuals or reports.
COMPETITION
In our pharmaceutical software and services business, we compete against a number of established companies that provide screening, testing and research services, and products that are not based on simulation software. There are also software companies whose products do not compete directly with, but are sometimes closely related to, ours. Our competitors in this field include some companies with financial, personnel, research, and marketing resources that are larger than ours. Our management believes there is currently no significant competitive threat to GastroPlus; however, in spite of a high barrier to entry, one could be developed over time. Our new PKPlus software product will compete with one major and a few minor software programs; however, the capabilities and design features of PKPlus, along with more affordable licensing, are expected to generate significant interest. MedChem Studio, MedChem Designer, and ADMET Predictor/ADMET Modeler operate in a more competitive environment. Several other companies presently offer simulation or modeling software, or simulation-software-based services, to the pharmaceutical industry. We believe DILIsym and NAFLDsym enjoy a unique market position, with no significant competition.
| 8 |
Major pharmaceutical companies conduct drug discovery and development efforts through their internal development staffs and through outsourcing. Smaller companies generally need to outsource a greater percentage of this research. Thus, we compete not only with other software suppliers, but also with the in-house development teams at some of the larger pharmaceutical companies.
Although competitive products exist, both new licenses and license renewals for GastroPlus have continued to grow. We believe that we enjoy a dominant market share in this segment. We believe our ADMET Predictor/ADMET Modeler, MedChem Studio, MedChem Designer, DDDPlus, MembranePlus, PKPlus, KIWI, DILIsym, and NAFLDsym software offerings are each unique in their combination of capabilities and we intend to continue to market them aggressively.
We believe the key factors in our ability to successfully compete in this field are our ability to: (1) continue to invest in research and development, and develop and support industry-leading simulation and modeling software and related products and services to effectively predict activities and ADMET-related behaviors of new drug-like compounds, (2) design new molecules with acceptable activity and ADMET properties, (3) develop and maintain a proprietary database of results of physical experiments that serve as a basis for simulated studies and empirical models, (4) attract and retain a highly skilled scientific and engineering team, (5) aggressively our products and services to our global market, and (6) develop and maintain relationships with research and development departments of pharmaceutical companies, universities, and government agencies.
In addition, we actively seek strategic acquisitions to expand the pharmaceutical software and services business and to explore opportunities in aerospace and general healthcare.
TRAINING AND TECHNICAL SUPPORT
Customer training and technical support are important factors in customer satisfaction for our pharmaceutical products, and we believe we are an industry leader in providing customer training and technical support in our business areas. We provide in-house seminars at customers’ and potential customers’ sites, as well at selected universities to train students who will soon be industry scientists. These seminars often serve as initial training in the event the potential customer decides to license or evaluate our software. Technical support is provided after the sale of any software in the form of on-site training (at the customer’s expense), web meetings and telephone, fax, and e-mail assistance to the customer’s users during the customer’s license period.
Technical support for pharmaceutical software is provided by our life sciences team and our inside sales and support staff based at our headquarters facilities in Lancaster, California. We provide free telephone support offering toll-free numbers in the U.S. and Canada, and e-mail and web-based support for all of our pharmaceutical software products worldwide. Technical support for pharmaceutical software products is minimal, averaging a few person-hours per month.
RESEARCH AND DEVELOPMENT
Research and development (R&D) activities include both enhancement of existing products and development of new products. Development of new products and adding functionality to existing products are capitalized in accordance with Financial Accounting Standards Board (FASB) Accounting Standards Codification (ASC) 985-20, “Costs of Software to Be Sold Leased, or Marketed”. R&D expenditures, which primarily relate to both capitalized and expensed salaries, R&D supplies, laboratory testing, and R&D consulting, were approximately $2,743,000 during fiscal year 2017, of which $1,376,000 was capitalized. R&D expenditures were approximately $2,641,000 during fiscal year 2016, of which $1,196,000 was capitalized. R&D expenditures during fiscal year 2015 were approximately $2,496,000 during fiscal year 2015, of which $1,168,000 was capitalized.
CUSTOMERS
Our customers include large, medium-sized and smaller biotech and pharmaceutical companies, universities, and regulatory agencies and other government organizations. We concentrate on serving the needs of our customers in drug discovery, development, clinical trials, and post-patent generic formulation development. Our current customer base is highly fragmented, with the exception of 2017 the 2 largest customers each made up 7% of our revenues.
SEASONALITY
We have traditionally experienced seasonal revenue weakness during our fiscal fourth quarter (June-August) due to summer vacations and reduced activities at our customers’ sites. Though our net sales figures for any quarter are not necessarily indicative of sales for any future period, our pharmaceutical software is typically licensed on an annual basis which means renewals usually fall in the same quarter year after year.
ENVIRONMENTAL MATTERS
We believe we are in compliance in all material respects with all applicable environmental laws. Presently, we do not anticipate that such compliance will have a material effect on capital expenditures, earnings or competitive position with respect to any of our operations.
EMPLOYEES
As of August 31, 2017, Simulations Plus and its subsidiaries Cognigen Corporation and DILIsym, employed a total of 86 employees, including 83 full-time employees and 3 part-time employee, including 67 in technical and research and development, 7 in marketing and sales, 12 in administration and accounting. Currently 39 employees hold Ph.Ds. in their respective science or engineering disciplines, and 19 employees hold one or more Master’s degrees. Most of the senior management team and the members of our Board of Directors hold graduate degrees.
We believe that our future success will depend, in part, on our ability to continue to attract, hire and retain qualified personnel. We continue to seek additions to our life sciences team although the competition for such personnel in the pharmaceutical industry is intense. None of our employees is represented by a labor union, and we have never experienced a work stoppage. We believe that our relations with our employees are good.
| 9 |
INTELLECTUAL PROPERTY AND OTHER PROPRIETARY RIGHTS
We primarily protect our intellectual property through copyrights and trade secrets. Our intellectual property consists primarily of source code for computer programs and data files for various applications of those programs in the pharmaceutical software businesses. The expertise of our staff is a considerable asset closely related to intellectual property, and attracting and retaining highly qualified scientists and engineers is essential to our business.
EFFECT OF GOVERNMENT REGULATIONS
Our pharmaceutical software products are tools used in research and development and are neither approved nor approvable by the FDA or other government agencies.
You should carefully consider the risks described below before investing in our publicly traded securities. The risks described below are not the only ones facing us. Our business is also subject to the risks that affect many other companies, such as competition, technological obsolescence, labor relations, general economic conditions, geopolitical changes, and international operations. We operate in a rapidly changing environment that involves a number of risks, some of which are beyond our control. Additional risks not currently known to us or that we currently believe are immaterial also may impair our business operations and our liquidity. The risks described below could cause our actual results to differ materially from those contained in the forward-looking statements we have made in this Annual Report on Form 10-K, the information incorporated herein by reference, and those forward-looking statements we may make from time to time. We note these factors for investors as permitted by the Private Securities Litigation Reform Act of 1995. You should understand that it is not possible to predict or identify all such factors. Consequently, you should not consider the following to be a complete discussion of all potential risks or uncertainties.
Certain Risks Related to Our Marketplace and Environment
Our ability to sustain or increase revenues will depend upon our success in entering new markets, continuing to increase our customer base, and in deriving additional revenues from our existing customers.
Our products are currently used primarily by molecular modeling and simulation specialists in pharmaceutical, biotechnology, agrotech, cosmetics, and government research organizations. One component of our overall business strategy is to derive more revenues from our existing customers by expanding their use of our products and services. Such strategy would have our customers utilize our scientific informatics platforms and our tools and components to leverage vast amounts of information stored in both corporate databases and public data sources in order to make informed scientific and business decisions during the research and development process. In addition, we seek to expand into new markets, and new areas within our existing markets, by acquiring businesses in these markets, attracting and retaining personnel knowledgeable in these markets, identifying the needs of these markets, and developing marketing programs to address these needs. If successfully implemented, these strategies would increase the usage of our software and services by biologists, chemists, engineers, and informaticians operating within our existing pharmaceutical, biotechnology, and chemical customers, as well as by new customers in other industries. However, if our strategies are not successfully implemented, our products and services may not achieve market acceptance or penetration in targeted new departments within our existing customers or in new industries. As a result, we may incur additional costs and expend additional resources without being able to sustain or increase revenue.
Consolidation within the pharmaceutical and biotechnology industries may continue to lead to fewer potential customers for our products and services.
A significant portion of our customer base consists of pharmaceutical and biotechnology companies. Consolidation within the pharmaceutical and biotechnology industries may result in fewer customers for our products and services. Although the industry consolidation that has taken place over the past 20 years has not prevented our business from growing to date, if one of the parties to a consolidation uses the products or services of our competitors, we may lose existing customers as a result of such consolidation.
Increasing competition and increasing costs within the pharmaceutical and biotechnology industries may affect the demand for our products and services, which may affect our results of operations and financial condition.
Our pharmaceutical and biotechnology customers' demand for our products is impacted by continued demand for their products and by our customers' research and development costs. Demand for our customers' products could decline, and prices charged by our customers for their products may decline, as a result of increasing competition, including competition from companies manufacturing generic drugs. In addition, our customers' expenses could continue to increase as a result of increasing costs of complying with government regulations and other factors. A decrease in demand for our customers' products, pricing pressures associated with the sales of these products and additional costs associated with product development could cause our customers to reduce research and development expenditures. Although our products increase productivity and reduce costs in many areas, because our products and services depend on such research and development expenditures, our revenues may be significantly reduced.
| 10 |
Health care reform and restrictions on reimbursement may affect the pharmaceutical, biotechnology, and industrial chemical companies that purchase or license our products or services, which may affect our results of operations and financial condition.
The continuing efforts of government and third-party payers in the markets we serve to contain or reduce the cost of health care may reduce the profitability of pharmaceutical, biotechnology, and industrial chemical companies, causing them to reduce research and development expenditures. Because some of our products and services depend on such research and development expenditures, our revenues may be significantly reduced. We cannot predict what actions federal, state, or private payers for health care goods and services may take in response to any health care reform proposals or legislation.
We face strong competition in the life science market for computer-aided design modeling and simulation software and for cheminformatics products.
The market for our computer-aided design modeling and simulation software products for the life science market is intensely competitive. We currently face competition from other scientific software providers, larger technology and solutions companies, in-house development by our customers and academic and government institutions, and the open source community. Some of our competitors and potential competitors have longer operating histories in certain segments of our industry than we do and could have greater financial, technical, marketing, research and development, and other resources. Many of our competitors offer products and services directed at more specific markets than those we target, enabling these competitors to focus a greater proportion of their efforts and resources on these markets. Some offerings that compete with our products are developed and made available at lower cost by government organizations and academic institutions, and these entities may be able to devote substantial resources to product development and also offer their products to users for little or no charge. We could also face competition from open source software initiatives, in which developers provide software and intellectual property free over the Internet. In addition, some of our customers spend significant internal resources in order to develop their own software. Moreover, we intend to leverage our scientific informatics platform in order to enable our customers to more effectively utilize the vast amounts of information stored in both their databases and public data sources in order to make informed scientific and business decisions during the research and development process. This strategy could lead to competition from much larger companies that provide general data storage and management software. There can be no assurance that our current or potential competitors will not develop products, services, or technologies that are comparable to, superior to, or render obsolete, the products, services, and technologies we offer. There can be no assurance that our competitors will not adapt more quickly than we to technological advances and customer demands, thereby increasing such competitors' market share relative to ours. Any material decrease in demand for our technologies or services may have a material adverse effect on our business, financial condition, and results of operations.
We are subject to pricing pressures in some of the markets we serve.
The market for computer-aided design modeling and simulation products for the life science industry is intensely competitive. Although the average price of our software licenses has increased slightly or remained relatively constant for fiscal 2015, 2016, and 2017, we may experience a decline in the future. In response to increased competition and general adverse economic conditions in this market, we may be required to modify our pricing practices. Changes in our pricing model could adversely affect our revenue and earnings.
Our operations may be interrupted by the occurrence of a natural disaster or other catastrophic event at our primary facilities.
Our research and development operations and administrative functions are primarily conducted at our facilities in Lancaster, California, Buffalo, New York and Research Triangle Park, North Carolina. Although we have contingency plans in effect for natural disasters or other catastrophic events, the occurrence of such events could still disrupt our operations. For example, our Lancaster, California facility is located in a state that is particularly susceptible to earthquakes. Any natural disaster or catastrophic event in our facilities or the areas in which they are located could have a significant negative impact on our operations.
Our insurance coverage may not be sufficient to avoid material impact on our financial position or results of operations resulting from claims or liabilities against us, and we may not be able to obtain insurance coverage in the future.
We maintain insurance coverage for protection against many risks of liability. The extent of our insurance coverage is under continuous review and is modified as we deem it necessary. Despite this insurance, it is possible that claims or liabilities against us may have a material adverse impact on our financial position or results of operations. In addition, we may not be able to obtain any insurance coverage, or adequate insurance coverage, when our existing insurance coverage expires. For example, we do not carry earthquake insurance for our facilities in Lancaster, California, because we do not believe the costs of such insurance are reasonable in relation to the potential risk for our part of California.
| 11 |
Changes in government regulation or in practices relating to the pharmaceutical or biotechnology industries, including potential health care reform, could decrease the need for the services we provide.
Governmental agencies throughout the world, but particularly in the U.S., strictly regulate the drug development process. Our business involves helping pharmaceutical and biotechnology companies, among others, navigate the regulatory drug approval process. Accordingly, many regulations, and often new regulations, are expected to result in higher regulatory standards and often additional revenues for companies that service these industries. However, some changes in regulations, such as a relaxation in regulatory requirements or the introduction of streamlined or expedited drug approval procedures, or an increase in regulatory requirements that we have difficulty satisfying or that make our services less competitive, could eliminate or substantially reduce the demand for our services.
Any negative commentaries made by any regulatory agencies or any failure by us to comply with applicable regulations and related guidance could harm our reputation and operating results, and compliance with new regulations and guidance may result in additional costs.
Any negative commentaries made by any regulatory agencies or any failure on our part to comply with applicable regulations could result in the termination of ongoing research or the disqualification of data for submission to regulatory authorities. This could harm our reputation, our prospects for future work, and our operating results. If our operations are found to violate any applicable law or other governmental regulations, we might be subject to civil and criminal penalties, damages, and fines. Any action against us for violation of these laws, even if we successfully defend against it, could cause us to incur significant legal expenses, divert our management's attention from the operation of our business, and damage our reputation.
Many of our contracts are fixed-price and may be delayed or terminated or reduced in scope for reasons beyond our control, or we may underprice or overrun cost estimates with these contracts, potentially resulting in financial losses.
Many of our contracts provide for services on a fixed-price or fee-for-service with a cap basis and, accordingly, we bear the financial risk if we initially underprice our contracts or otherwise overrun our cost estimates. In addition, these contracts may be terminated or reduced in scope either immediately or upon notice. Cancellations may occur for a variety of reasons, and often at the discretion of the client. The loss, reduction in scope, or delay of a large contract or the loss or delay of multiple contracts could materially adversely affect our business, although our contracts frequently entitle us to receive the costs of winding down the terminated projects, as well as all fees earned by us up to the time of termination. Some contracts also entitle us to a predetermined termination fee and irrevocably committed costs/expenses.
We could experience a breach of the confidentiality of the information we hold or of the security of our computer systems.
We operate large and complex computer systems that contain significant amounts of client data. As a routine element of our business, we collect, analyze, and retain substantial amounts of data pertaining to the clinical study data analysis we conduct for our clients. Unauthorized third parties could attempt to gain entry to such computer systems for the purpose of stealing data or disrupting the systems. We believe that we have taken appropriate measures to protect them from intrusion, and we continue to improve and enhance our systems in this regard, but in the event that our efforts are unsuccessful, we could suffer significant harm. Our contracts with our clients typically contain provisions that require us to keep confidential the information generated from these studies. In the event the confidentiality of such information was compromised, we could suffer significant harm.
Impairment of goodwill or other intangible assets may adversely impact future results of operations.
We have intangible assets, including goodwill and other indefinite-lived intangibles, on our balance sheet due to our acquisitions of businesses. The initial identification and valuation of these intangible assets and the determination of the estimated useful lives at the time of acquisition involve use of management judgments and estimates. These estimates are based on, among other factors, input from accredited valuation consultants, reviews of projected future income cash flows and statutory regulations. The use of alternative estimates and assumptions might have increased or decreased the estimated fair value of our goodwill and other intangible assets that could potentially result in a different impact to our results of operations. If the future growth and operating results of our business are not as strong as anticipated and/or our market capitalization declines, this could impact the assumptions used in calculating the fair value of goodwill or other indefinite-lived intangibles. To the extent goodwill or other indefinite-lived intangibles are impaired, their carrying value will be written down to its implied fair value and a charge will be made to our income from continuing operations. Such an impairment charge could materially and adversely affect our operating results. As of August 31, 2017, the carrying amount of goodwill and other intangibles was $10,387,198 on our consolidated balance sheet.
Certain Risks Related to Our Operations
Software Defects or malfunctions in our products could hurt our reputation among our customers, result in delayed or lost revenue, and expose us to liability.
Our business and the level of customer acceptance of our products depend upon the continuous, effective, and reliable operation of our software and related tools and functions. To the extent that defects cause our software to malfunction and our customers' use of our products is interrupted, our reputation could suffer and our revenue could decline or be delayed while such defects are remedied. We may also be subject to liability for the defects and malfunctions of third party technology partners and others with whom our products and services are integrated.
| 12 |
Delays in the release of new or enhanced products or services or undetected errors in our products or services may result in increased cost to us, delayed market acceptance of our products, and delayed or lost revenue.
To achieve market acceptance, new or enhanced products or services can require long development and testing periods, which may result in delays in scheduled introduction. Any delays in the release schedule for new or enhanced products or services may delay market acceptance of these products or services and may result in delays in new customer orders for these new or enhanced products or services or the loss of customer orders. In addition, new or enhanced products or services may contain a number of undetected errors or “bugs” when they are first released. Although we extensively test each new or enhanced software product or service before it is released to the market, there can be no assurance that significant errors will not be found in existing or future releases. As a result, in the months following the introduction of certain releases, we may need to devote significant resources to correct these errors. There can be no assurance, however, that all of these errors can be corrected.
We are subject to risks associated with the operation of a global business.
We derive a significant portion of our total revenue from our operations in international markets. During the years ended August 31, 2017, 2016 and 2015, 38%, 38% and 37% respectively, of our total revenue was derived from our international operations. Our global business may be affected by local economic conditions, including inflation, recession, and currency exchange rate fluctuations. In addition, political and economic changes, including international conflicts, including terrorist acts, throughout the world may interfere with our or our customers' activities in particular locations and result in a material adverse effect on our business, financial condition, and operating results. Potential trade restrictions, exchange controls, adverse tax consequences, and legal restrictions may affect the repatriation of funds into the U.S. Also, we could be subject to unexpected changes in regulatory requirements, the difficulties of compliance with a wide variety of foreign laws and regulations, potentially negative consequences from changes in or interpretations of US and foreign tax laws, import and export licensing requirements, and longer accounts receivable cycles in certain foreign countries. These risks, individually or in the aggregate, could have an adverse effect on our results of operations and financial condition. For example, we are subject to compliance with the U.S. Foreign Corrupt Practices Act and similar anti-bribery laws, which generally prohibit companies and their intermediaries from making improper payments to foreign government officials for the purpose of obtaining or retaining business. While our employees, distributors, and agents are required to comply with these laws, we cannot be sure that our internal policies and procedures will always protect us from violations of these laws despite our commitment to legal compliance and corporate ethics. The occurrence or allegation of these types of risks may adversely affect our business, performance, prospects, value, financial condition, and results of operations.
The drug discovery and development services industry is highly competitive.
Our clinical pharmacology division often competes for business not only with other clinical research organization (CROs), but also with internal discovery and development departments within our larger clients, who may have greater resources than ours. We also compete with universities and teaching hospitals for outsourced services. We compete based on a variety of factors, including:
| · | reputation for on-time quality performance; |
| · | reputation for regulatory compliance; |
| · | expertise and experience in multiple specialized areas; |
| · | scope and breadth of service and product offerings across the drug discovery and development spectrum; |
| · | ability to provide flexible and customized solutions to support our clients' drug discovery and development needs; |
| · | price/value; |
| · | technological expertise and efficient drug development processes; |
| · | financial stability; |
| · | accessibility of client data through secure portals; and |
| · | ability to acquire, process, analyze, and report data in an accurate manner. |
If we do not compete successfully, our business could suffer. Increased competition might lead to price and other concessions that might adversely affect our operating results. The drug discovery and development services industry has continued to see a trend towards consolidation, particularly among biotechnology companies, who are targets for each other and for larger pharmaceutical companies. If this trend continues, it is likely to produce more competition among the larger companies and CROs generally, with respect to both clients and acquisition candidates. In addition, while there are substantial barriers to entry for large, global competitors with broad-based services, small, specialized entities considering entering the CRO industry will continue to find lower barriers to entry, and private equity firms may determine that there are opportunities to acquire and consolidate these companies, thus further increasing possible competition. More generally, our competitors or others might develop technologies, services, or products that are more effective or commercially attractive than our current or future technologies, services, or products, or that render our technologies, services, or products less competitive or obsolete. If competitors introduce superior technologies, services, or products and we cannot make enhancements to ours to remain competitive, our competitive position, and in turn our business, revenue, and financial condition, would be materially and adversely affected. In the aggregate, these competitive pressures may affect the attractiveness of our technologies, services, or products and could adversely affect our financial results.
| 13 |
Potential Changes in U.S. and International Tax Law.
In the U.S., there are several proposals to reform corporate tax law that are currently under consideration. These proposals include reducing the corporate statutory tax rate, broadening the corporate tax base through the elimination or reduction of deductions, exclusions, and credits, implementing a territorial regime of taxation, limiting the ability of U.S. corporations to deduct interest expense associated with offshore earnings, modifying the foreign tax credit rules, and reducing the ability to defer U.S. tax on offshore earnings. These or other changes in the U.S. tax laws could increase our effective tax rate, which would affect our profitability.
Contract research services create a risk of liability.
As a CRO, we face a range of potential liabilities which may include:
| · | Errors or omissions in reporting of study detail in preclinical studies that may lead to inaccurate reports, which may undermine the usefulness of a study or data from the study, or which may potentially advance studies absent the necessary support or inhibit studies from proceeding to the next level of testing; and | |
| · | Risks associated with our possible failure to properly care for our clients' property, such as research models, records, work in progress, or other archived materials. |
Contractual risk transfer indemnifications generally do not protect us against liability arising from certain of our own actions, such as negligence or misconduct. We could be materially and adversely affected if we are required to pay damages or bear the costs of defending any claim that is outside any contractual indemnification provision, or if a party does not fulfill its indemnification obligations, or the damage is beyond the scope or level of insurance coverage. We also often contractually indemnify our clients (subject to a limitation of liability), similar to the way they indemnify us, and we may be materially adversely affected if we have to fulfill our indemnity obligations. Furthermore, there can be no assurance that we nor a party required to indemnify us will be able to maintain such insurance coverage (either at all or on terms acceptable to us).
Upgrading our software could result in implementation issues and business disruptions.
In recent years we implemented a project to refactor our software programs. In doing so we face the possibility that existing users will find the software unacceptable, or new users may not be as interested as they have been in the past versions. Translation errors might introduce new software bugs that will not be caught.
The drug discovery and development industry has a history of patent and other intellectual property litigation, and we might be involved in costly intellectual property lawsuits.
The drug discovery and development industry has a history of patent and other intellectual property litigation and these lawsuits will likely continue. Accordingly, we face potential patent infringement suits by companies that have patents for similar products and methods used in business or other suits alleging infringement of their intellectual property rights. Legal proceedings relating to intellectual property could be expensive, take significant time and divert management's attention from other business concerns, whether we win or lose. If we do not prevail in an infringement lawsuit brought against us, we might have to pay substantial damages, including treble damages, and we could be required to stop the infringing activity or obtain a license to use technology on unfavorable terms.
We may not be able to successfully develop and market new services and products.
We may seek to develop and market new services and products that complement or expand our existing business or service offerings. We cannot guarantee that we will be able to identify new technologies of interest to our customers. Even if we are able to identify new technologies of interest, we may not be able to negotiate license agreements on acceptable terms, or at all. If we are unable to develop new services and products and/or create demand for those newly developed services and products, our future business, results of operations, financial condition, and cash flows could be adversely affected.
Ability to incur debt could adversely affect our business and growth prospects.
At August 31, 2017, we had no borrowed debt and have no need to do so to fund normal operations in the foreseeable future; however, should circumstances require us to incur debt and a lender could not be found to provide that debt, this could have a significant adverse effect on our business, including making it more difficult for us to obtain financing on favorable terms, limiting our ability to capitalize on significant business opportunities, and making us more vulnerable to rising interest rates.
| 14 |
We depend on key personnel and may not be able to retain these employees or recruit additional qualified personnel, which could harm our business.
Our success depends to a significant extent on the continued services of our senior management and other members of management. Walter S. Woltosz, our Chief Executive Officer and Chairman of the Board, has held his position since our founding in 1996. We have a one-year employment agreement with Mr. Woltosz and we have employment agreements with our division presidents that range from two to three years. If Mr. Woltosz, our division presidents or other members of senior management do not continue in their present positions, our business may suffer. Because of the specialized scientific nature of our business, we are highly dependent upon attracting and retaining qualified scientific and technical and managerial personnel. While we have a strong record of employee retention, there is still significant competition for qualified personnel in the software, pharmaceutical and biotechnology fields. Therefore, we may not be able to attract and retain the qualified personnel necessary for the development of our business. The loss of the services of existing personnel, as well as the failure to recruit additional key scientific, technical, and managerial personnel in a timely manner, could harm our business.
If we are not successful in selecting and integrating the businesses and technologies we acquire, or in managing our current and future divestitures, our business may suffer.
In September 2014 and June 2017, the Company expanded our business through acquisitions. We continue to search to acquire businesses and technologies and form strategic alliances. However, businesses and technologies may not be available on terms and conditions we find acceptable. We risk spending time and money investigating and negotiating with potential acquisition or alliance partners, but not completing transactions. Even if completed, acquisitions and alliances involve numerous risks which may include: difficulties in achieving business and continuing financial success; difficulties and expenses incurred in assimilating and integrating operations, services, products, technologies, or pre-existing relationships with our customers, distributors, and suppliers; challenges with developing and operating new businesses, including those which are materially different from our existing businesses and which may require the development or acquisition of new internal capabilities and expertise; challenges of maintaining staffing at the acquired entities, including loss of key employees; potential losses resulting from undiscovered liabilities of acquired companies that are not covered by the indemnification we may obtain from the seller(s); the presence or absence of adequate internal controls and/or significant fraud in the financial systems of acquired companies; diversion of management's attention from other business concerns; acquisitions could be dilutive to earnings, or in the event of acquisitions made through the issuance of our common stock to the shareholders of the acquired company, dilutive to the percentage of ownership of our existing shareholders; new technologies and products may be developed which cause businesses or assets we acquire to become less valuable; and risks that disagreements or disputes with prior owners of an acquired business, technology, service, or product may result in litigation expenses and distribution of our management's attention. In the event that an acquired business or technology or an alliance does not meet our expectations, our results of operations may be adversely affected.
Some of the same risks exist when we decide to sell a business, site, or product line. In addition, divestitures could involve additional risks, including the following: difficulties in the separation of operations, services, products, and personnel; and the need to agree to retain or assume certain current or future liabilities in order to complete the divestiture. We evaluate the performance and strategic fit of our businesses. These and any divestitures may result in significant write-offs, including those related to goodwill and other intangible assets, which could have an adverse effect on our results of operations and financial condition. In addition, we may encounter difficulty in finding buyers or alternative exit strategies at acceptable prices and terms and in a timely manner. We may not be successful in managing these or any other significant risks that we encounter in divesting a business, site, or product line, and as a result, we may not achieve some or all of the expected benefits of the divestitures.
Our quarterly and annual operating results fluctuate and may continue to fluctuate in the future, and if we fail to meet the expectations of analysts or investors, our stock price and the value of your investment could decline substantially.
We believe that operating results for any particular quarter are not necessarily a meaningful indication of future results. Nonetheless, fluctuations in our quarterly operating results could negatively affect the market price of our common stock. Our results of operations in any quarter or annual period have varied in the past and may vary from quarter to quarter or year to year and are influenced by such factors as:
| · | changes in the general global economy; | |
| · | the number and scope of ongoing client engagements; the commencement, postponement, delay, progress, completion, or cancellation of client contracts in the quarter; | |
| · | changes in customer budget cycles; | |
| · | the number and scope of ongoing client engagements; | |
| · | the commencement, postponement, delay, progress, completion, or cancellation of client contracts in the quarter; | |
| · | changes in the mix of our products and services; | |
| · | competitive pricing pressures; | |
| · | the extent of cost overruns; | |
| · | buying patterns of our clients; |
| 15 |
| · | budget cycles of our clients; | |
| · | the effect of potential acquisitions and consequent integration; | |
| · | the timing of new product releases by us or our competitors; | |
| · | general economic factors, including factors relating to disruptions in the world credit and equity markets and the related impact on our customers’ access to capital; | |
| · | changes in tax laws, rules, regulations, and tax rates in the locations in which we operate; | |
| · | the timing and charges associated with completed acquisitions and other events; | |
| · | the financial performance of the limited partnerships in which we invest; and | |
| · | exchange rate fluctuations. |
We derive a significant percentage of our revenues from a concentrated group of customers and the loss of more than one of our major customers could materially and adversely affect our business, results of operations or financial condition.
Three customers accounted for 7% (a dealer account in Japan representing various customers), 7%, and 5% of net sales for fiscal year 2017. Three customers accounted for 10% (a dealer account in Japan representing various customers), 7%, and 6% of net sales for fiscal year 2016. Three customers accounted for 10% (a dealer account in Japan representing various customers), 8%, and 6% of net sales for fiscal year 2015. The loss of any of our major customers could have a material adverse effect on our results of operations and financial condition. We may not be able to maintain our customer relationships, and our customers may delay payment under, or fail to renew, their agreements with us, which could adversely affect our business, results of operations, or financial condition. Any reduction in the amount of revenues that we derive from these customers, without an offsetting increase in new sales to other customers, could have a material adverse effect on our operating results. A significant change in the liquidity or financial position of our customers could also have a material adverse effect on the collectability of our accounts receivable, our liquidity, and our future operating results.
A significant portion of our operating expenses is relatively fixed and planned expenditures are based in part on expectations regarding future revenues.
Accordingly, unexpected revenue shortfalls may decrease our gross margins and could cause significant changes in our operating results from year to year. As a result, in future quarters our operating results could fall below the expectations of securities analysts or investors, in which event our stock price would likely decrease.
If our customers cancel their contracts or terminate or delay their clinical trials, we may lose or delay revenues and our business may be harmed.
Certain of our customer contracts are subject to cancellation by our customers at any time with limited notice. Customers engaged in clinical trials may terminate or delay a clinical trial for various reasons, including the failure of the tested product to satisfy safety or efficacy requirements, unexpected or undesired clinical results, decisions to deemphasize a particular product or forgo a particular clinical trial, decisions to downsize clinical development programs, insufficient patient enrollment or investigator recruitment, and production problems resulting in shortages of required clinical supplies. Any termination or delay in the clinical trials would likely result in a consequential delay or termination in those customers’ service contracts. We have experienced terminations and delays of our customer service contracts in the past (although no such past terminations have had a significant impact on our results of operations) and we expect to experience additional terminations and delays in the future. The termination of single-study arrangements could result in decreased revenues and the delay of our customers’ clinical trials could result in delayed professional services revenues, which could materially harm our business.
If our security is breached, our business could be disrupted, our operating results could be harmed, and customers could be deterred from using our products and services.
Our business relies on the secure electronic transmission, storage, and hosting of sensitive information, including clinical data, financial information, and other sensitive information relating to our customers, company, and workforce. As a result, we face some risk of a deliberate or unintentional incident involving unauthorized access to our computer systems (including, among other methods, cyber- attacks or social engineering) that could result in misappropriation or loss of assets or sensitive information, data corruption, or other disruption of business operations. In light of this risk, we have devoted significant resources to protecting and maintaining the confidentiality of our information, including implementing security and privacy programs and controls, training our workforce, and implementing new technology. We have no guarantee that these programs and controls will be adequate to prevent all possible security threats. We believe that any compromise of our electronic systems, including the unauthorized access, use, or disclosure of sensitive information or a significant disruption of our computing assets and networks, would adversely affect our reputation and our ability to fulfill contractual obligations, and would require us to devote significant financial and other resources to mitigate such problems, and could increase our future cyber security costs. Moreover, unauthorized access, use, or disclosure of such sensitive information could result in contractual or other liability. In addition, any real or perceived compromise of our security or disclosure of sensitive information may result in lost revenues by deterring customers from using or purchasing our products and services in the future or prompting them to use competing service providers.
| 16 |
Any failure by us to properly protect customer data we possess or are deemed to possess in connection with the conduct of clinical trials, could subject us to significant liability.
Our customers use our solutions to collect, manage, and report information in connection with the conduct of clinical trials. This information may be considered our customers’ proprietary information. Since we receive and process our customers’ data from customers utilizing our hosted solutions, there is a risk that we could be liable if there were a breach of any obligation to a protected person under contract, standard of practice, or regulatory requirement. If we fail to properly protect our customers’ data that is in our possession or deemed to be in our possession, we could be subjected to significant liability and our reputation would be harmed.
We rely upon a single internal hosting facility and Amazon Web Services to deliver our solutions to our customers and any disruption of or interference with our hosting systems, operations, or use of the Amazon Web Services could harm our business and results of operations.
Substantially all of the computer hardware necessary to deliver our CRO and KIWI solutions is located at our internal hosting facility in Buffalo, New York. In addition to our dedicated hosting facility, we utilize third-party cloud computing services from Amazon Web Services ("AWS") to help us efficiently scale our cloud-based solutions and provide training. Because we cannot easily switch our AWS-serviced operations to another cloud provider, any disruption of or interference with our use of AWS would impact our operations, and our business would be adversely impacted. Our systems and operations or those of AWS could suffer damage or interruption from human error, fire, flood, power loss, telecommunications failure, break-ins, terrorist attacks, acts of war, and similar events. The occurrence of a natural disaster, an act of terrorism or other unanticipated problems at our or AWS' hosting facilities could result in lengthy interruptions in our service. Although we and AWS maintain backup facilities and disaster recovery services in the event of a system failure, these may be insufficient or fail. Any system failure, including network, software, or hardware failure, that causes an interruption in our Buffalo data center or our use of AWS or that causes a decrease in responsiveness of our cloud-based solutions could damage our reputation and cause us to lose customers, which could harm our business and results of operations. Our business may be harmed if our customers and potential customers believe our service is unreliable.
Defects or errors in our software applications could harm our reputation, result in significant cost to us and impair our ability to market our solutions.
Our software applications are inherently complex and may contain defects or errors, some of which may be material. Errors may result from our own technology or from the interface of our cloud-based solutions with legacy systems and data, which we did not develop. The risk of errors is particularly significant when a new product is first introduced or when new versions or enhancements of existing products are released. The likelihood of errors is increased when we do more frequent releases of new products and enhancements of existing products. We have, from time to time, found defects in our solutions. Although these past defects have not resulted in any litigation against us to date, we have invested significant capital, technical, managerial, and other resources to investigate and correct these past defects and we have needed to divert these resources from other development efforts. In addition, material performance problems or defects in our solutions may arise in the future. Material defects in our cloud-based solutions could result in a reduction in sales, delay in market acceptance of our solutions, or credits or refunds to our customers. In addition, such defects may lead to the loss of existing customers and difficulty in attracting new customers, diversion of development resources, or harm to our reputation. Correction of defects or errors could prove to be impossible or impractical. The costs incurred in correcting any defects or errors or in responding to resulting claims or liability may be substantial and could adversely affect our operating results.
If we are not able to reliably meet our data storage and management requirements, or if we experience any failure or interruption in the delivery of our services over the Internet, customer satisfaction and our reputation could be harmed and customer contracts may be terminated.
As part of our current business model, we deliver our software over the Internet and store and manage hundreds of terabytes of data for our customers, resulting in substantial information technology infrastructure and ongoing technological challenges, which we expect to continue to increase over time. If we do not reliably meet these data storage and management requirements, or if we experience any failure or interruption in the delivery of our services over the Internet, customer satisfaction and our reputation could be harmed, leading to reduced revenues and increased expenses. Our hosting services are subject to service-level agreements and, in the event that we fail to meet guaranteed service or performance levels, we could be subject to customer credits or termination of these customer contracts. If the cost of meeting these data storage and management requirements increases, our results of operations could be harmed.
Some of our software solutions and services utilize open source software, and any failure to comply with the terms of one or more of these open source licenses could adversely affect our business.
Some of our software solutions utilize software covered by open source licenses. Open source software is typically freely accessible, usable and modifiable, and is used by our development team in an effort to reduce development costs and speed up the development process. Certain open source software licenses require a user who intends to distribute the open source software as a component of the user's software to disclose publicly part or all of the source code to the user's software. In addition, certain open source software licenses require the user of such software to make any derivative works of the open source code available to others on unfavorable terms or at no cost. This can subject previously proprietary software to open source license terms. While we monitor the use of all open source software in our products, processes and technology and try to ensure that no open source software is used in such a way as to require us to disclose or make available the source code to the related product or solution, such use could inadvertently occur. This could harm our intellectual property position and have a material adverse effect on our business.
| 17 |
We may be unable to adequately enforce or defend our ownership and use of our intellectual property and other proprietary rights.
Our success is heavily dependent upon our intellectual property and other proprietary rights. We rely upon a combination of trademark, trade secret, copyright, patent, and unfair competition laws, as well as license and access agreements and other contractual provisions, to protect our intellectual property and other proprietary rights. In addition, we attempt to protect our intellectual property and proprietary information by requiring certain of our employees and consultants to enter into confidentiality, non-competition, and assignment-of-inventions agreements. The steps we take to protect these rights may not be adequate to prevent misappropriation of our technology by third parties, or may not be adequate under the laws of some foreign countries, which may not protect our intellectual property rights to the same extent as do the laws of the United States. Our attempts to protect our intellectual property may be challenged by others or invalidated through administrative process or litigation, and agreement terms that address non-competition are difficult to enforce in many jurisdictions and may not be enforceable in any particular case. In addition, there remains the possibility that others will “reverse engineer” our products in order to introduce competing products, or that others will develop competing technology independently. If we resort to legal proceedings to enforce our intellectual property rights or to determine the validity and scope of the intellectual property or other proprietary rights of others, the proceedings could be burdensome and expensive, even if we were to prevail. The failure to adequately protect our intellectual property and other proprietary rights may have a material adverse effect on our business, results of operations or financial condition.
Current and future litigation against us, which may arise in the ordinary course of our business, could be costly and time consuming to defend.
We are subject to claims that arise in the ordinary course of business, such as claims brought by our customers in connection with commercial disputes and employment claims made by our current or former employees. Third parties may in the future assert intellectual property rights to technologies that are important to our business and demand back royalties or demand that we license their technology. Litigation may result in substantial costs and may divert management’s attention and resources, which may seriously harm our business, overall financial condition, and operating results. Insurance may not cover such claims, may not be sufficient for one or more such claims, and may not continue to be available on terms acceptable to us. A claim brought against us that is uninsured or underinsured could result in unanticipated costs, negatively affecting our business, results of operations, and financial condition.
We could incur substantial costs resulting from product liability claims relating to our products or services or our customers’ use of our products or services.
Any failure or errors in a customer’s clinical trial caused or allegedly caused by our products or services could result in a claim for substantial damages against us by our customers or the clinical trial participants, regardless of our responsibility for the failure. Although we are generally entitled to indemnification under our customer contracts against claims brought against us by third parties arising out of our customers’ use of our products, we might find ourselves entangled in lawsuits against us that, even if unsuccessful, may divert our resources and energy and adversely affect our business. Further, in the event we seek indemnification from a customer, a court may not enforce our indemnification right if the customer challenges it or the customer may not be able to fund any amounts for indemnification owed to us. In addition, our existing insurance coverage may not continue to be available on reasonable terms or may not be available in amounts sufficient to cover one or more large claims, or the insurer may disclaim coverage as to any future claim.
Our Buffalo Subsidiary (Cognigen) depends on the clinical trial market, and a downturn in this market could cause our revenues to decrease.
Our Buffalo business depends entirely on the clinical trials conducted or sponsored by pharmaceutical, biotechnology and medical device companies, CROs, and other entities. Our revenues may decline as a result of conditions affecting these industries, including general economic downturns, increased consolidation, decreased competition, or fewer products under development. Other developments that may affect these industries and harm our operating results include product liability claims, changes in government regulation, changes in governmental price controls or third-party reimbursement practices, and changes in medical practices. Disruptions in the world credit and equity markets may also result in a global downturn in spending on research and development and clinical trials and may impact our customers’ access to capital and their ability to pay for our solutions. Any decrease in research and development expenditures or in the size, scope, or frequency of clinical trials could materially adversely affect our business, results of operations, or financial condition.
As a public company, we may incur significant administrative workload and expenses in connection with new and changing compliance requirements.
As a public company with common stock listed on The NASDAQ Stock Market, we must comply with various laws, regulations and requirements. New laws and regulations, as well as changes to existing laws and regulations affecting public companies, including the provisions of the Sarbanes-Oxley Act of 2002, the Dodd-Frank Wall Street Reform and Consumer Protection Act of 2010, and rules adopted by the SEC and by The NASDAQ Stock Market, may result in increased general and administrative expenses and a diversion of management's time and attention as we respond to new requirements.
| 18 |
We have been paying quarterly dividends on our common stock, and although there has been a consistent track record of paying these dividends, the Board of Directors may suspend the dividend, and, consequently, your ability to achieve a return on your investment will depend on appreciation in the price of our common stock.
Should the Board of Directors suspend the dividend and decide to use those funds to invest more into the business, you may not receive any dividends on your investment in our common stock for the foreseeable future and the success of an investment in shares of our common stock will depend upon any future appreciation in its value. Shares of our common stock may depreciate in value or may not appreciate in value.
Risks Related to Our Common Stock - The price of our common stock may fluctuate significantly and investors could lose all or part of their investments.
Shares of our common stock were sold in our initial public offering ("IPO") in 1996 at a price of $1.25 per share (on a post-split basis), and our common stock has subsequently traded as high as $15.85 and as low as $0.38 from our IPO through August 31, 2017. However, an active, liquid, and orderly market for our common stock on The NASDAQ Stock Market or otherwise may not be sustained, which could depress the trading price of our common stock. The trading price of our common stock may be subject to wide fluctuations in response to various factors, some of which are beyond our control, including:
| · | our quarterly or annual earnings or those of other companies in our industry; |
| · | announcements by us or our competitors of significant contracts or acquisitions; |
| · | changes in accounting standards, policies, guidance, interpretations, or principles; |
| · | general economic and stock market conditions, including disruptions in the world credit and equity markets; |
| · | the failure of securities analysts to cover our common stock or changes in financial estimates by analysts; |
| · | future sales of our common stock; and |
| · | the other factors described in these “Risk Factors.” |
In recent years, the stock market in general, and the market for technology-related companies in particular, has experienced wide price and volume fluctuations. This volatility has had a significant impact on the market price of securities issued by many companies, including companies in our industry. The price of our common stock could fluctuate based upon factors that have little to do with our performance, and these fluctuations could materially reduce our stock price.
In the past, some companies, including companies in our industry, have had volatile market prices for their securities and have had securities class action suits filed against them. The filing of a lawsuit against us, regardless of the outcome, could have a material adverse effect on our business, financial condition, and results of operations, as it could result in substantial legal costs and a diversion of our management’s attention and resources.
ITEM 1B – UNRESOLVED STAFF COMMENTS
None.
We lease approximately 13,500 square feet of office space in Lancaster, California. The original lease had a five-year term with two, three-year options to extend. The initial five-year term expired in February 2011, and we extended the lease to February 2, 2014. In June 2013, the lease was amended to extend the term to February 2, 2017. The amended lease also provides for an annual base rent increase of 3% per year and two, two-year options to extend. In May 2016 the Company exercised the two, two-year options extending the term of the lease through February 2, 2021 at a fixed rate of $25,000 per month. The new extension agreement gives the Company the right, upon 90 days’ prior notice, to terminate the lease in the last two years of the term upon payment of a recapture payment equal to the 3% base payment increase that would have been due under the original agreement.
Our Cognigen subsidiary leases approximately 12,623 square feet of office space in Buffalo, New York. The initial five-year term expires in October 2018; the lease allows for a three-year option to extend to October 2021. The current base rent is $15,638 per month.
In September 2017 DILIsym Services, Inc. signed a 3-year lease for approximately 1,900 rentable square feet of space in Research Triangle Park, North Carolina. The initial three-year term expires in October 2020. The base rent is $3,975 per month with an annual 3% adjustment. Prior to this lease DILIsym was on a month-to-month rental.
| 19 |
Rent expense, including common area maintenance fees for the fiscal years ended August 31, 2017, 2016 and 2015 was $509,600, $491,800, and $488,888, respectively.
The Company believes its existing facilities and equipment are in good operating condition and are suitable for the conduct of its business.
Except as described below, we are not a party to any legal proceedings and are not aware of pending legal proceedings.
In June 2014, the Company was served with a complaint in a civil action entitled Sherri Winslow v. Incredible Adventures, Inc., et al. (Los Angeles Superior Court Case No. BC545789) alleging wrongful death and seeking unspecified damages arising out of a May 18, 2012 plane crash in the State of Nevada. The Company’s Chief Executive Officer owns the subject aircraft and is also a named defendant. The complaint alleged that the Company was the owner of the subject aircraft. The Company denied all material allegations against it, including that it owns or has ever owned any interest in the subject aircraft.
In June 2017 the Plaintiff settled the case with certain of the Defendants; the case was dismissed on June 20, 2017. The Company incurred no liability as part of the settlement and has been dismissed with prejudice.
ITEM 4 – MINE SAFETY DISCLOSURES.
Not applicable.
ITEM 5 – MARKET FOR REGISTRANT’S COMMON EQUITY AND RELATED STOCKHOLDER MATTERS AND ISSUER PURCHASES OF EQUITY SECURITIES
The Company’s common stock, par value $0.001 per share, trades on the NASDAQ Capital Market under the symbol “SLP.”
Price Range of Common Stock
The following table shows high and low sales prices for the Company’s common stock for each quarter during the past two fiscal years:
| High | Low | |||||||
| FY16: | ||||||||
| Quarter ended November 30, 2015 | $ | 10.27 | $ | 6.49 | ||||
| Quarter ended February 29, 2016 | $ | 11.89 | $ | 7.30 | ||||
| Quarter ended May 31, 2016 | $ | 9.88 | $ | 7.52 | ||||
| Quarter ended August 31, 2016 | $ | 8.86 | $ | 6.74 | ||||
| FY17: | ||||||||
| Quarter ended November 30, 2016 | $ | 10.75 | $ | 8.10 | ||||
| Quarter ended February 28, 2017 | $ | 10.50 | $ | 8.81 | ||||
| Quarter ended May 31, 2017 | $ | 12.75 | $ | 9.70 | ||||
| Quarter ended August 31, 2017 | $ | 16.15 | $ | 11.50 | ||||
Holders
As of November 14, 2017, there were 42 shareholders of record.
| 20 |
Dividends
We paid a total of approximately $3.4 million in cash dividends during each of fiscal years 2017, and 2016 as set forth in the table below. We expect to pay quarterly dividends of $0.06 per share of common stock each quarter, subject to declaration by our Board of Directors. However, there can be no assurances that our Board of Directors will continue the dividend distributions for any specified number of quarters.
| Fiscal Year | Record Date | Distribution Date |
# of Shares Outstanding on Record Date |
Dividend per Share |
Total Amount |
|||||||||||||
| 2016 | 11/09/2015 | 11/16/2015 | 16,996,001 | $ | 0.05 | $ | 849,800 | |||||||||||
| 1/29/2016 | 2/05/2016 | 17,018,001 | $ | 0.05 | $ | 850,900 | ||||||||||||
| 5/02/2016 | 5/09/2016 | 17,029,501 | $ | 0.05 | $ | 851,475 | ||||||||||||
| 8/11/2016 | 8/18/2016 | 17,221,978 | $ | 0.05 | $ | 861,099 | ||||||||||||
| 2017 | 11/10/2016 | 11/17/2016 | 17,226,478 | $ | 0.05 | $ | 861,324 | |||||||||||
| 1/30/2017 | 2/6/2017 | 17,233,758 | $ | 0.05 | $ | 861,688 | ||||||||||||
| 5/08/2017 | 5/15/2017 | 17,240,626 | $ | 0.05 | $ | 862,031 | ||||||||||||
| 7/28/2017 | 8/4/2017 | 17,268,920 | $ | 0.05 | $ | 863,446 | ||||||||||||
Shareholder Return Performance Presentation
The following graph compares the cumulative total stockholder return on our common stock of a $100 investment from August 31, 2012 through August 31, 2017 assuming reinvestment of dividends, with a similar investment in the Russell 3000 index (the “Russell 3000”) and with the companies listed in the NASDAQ Composite - Total Returns (“IXIC”), and the S&P600 Health Care Equipment & Services Industry Group Index (SP600-3510). The historical information set forth below is not necessarily indicative of future performance. This performance graph shall not be deemed “filed” for purposes of Section 18 of the Securities Exchange Act of 1934, as amended or incorporated by reference into any of our filings under the Securities Act of 1933, as amended, of the Exchange Act, except as shall be expressly set forth by specific reference in such filing.
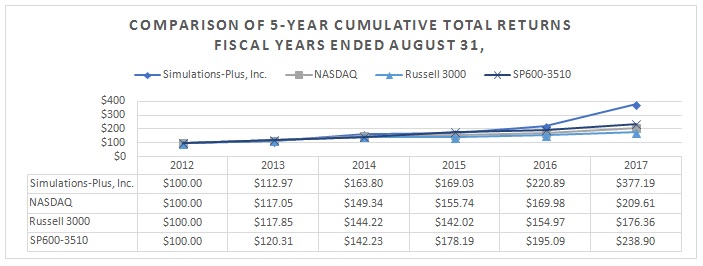
Equity Compensation Plan Information
The following information is provided as of August 31, 2017:
| Plan category | Number of securities to be issued upon exercise of outstanding options, warrants and rights (a) | Weighted-average exercise price of outstanding options, warrants and rights (b) | Number of securities remaining available for future issuance under equity compensation plans (excluding securities reflected in column (a)) (c) | |||||||||
| Equity compensation plans approved by security holders | 1,249,126 | $ | 8.51 | 987,084 | ||||||||
| Equity compensation plans not approved by security holders | -0- | -0- | -0- | |||||||||
| Total | 1,249,126 | $ | 8.51 | 987,084 | ||||||||
| 21 |
Repurchases
There is currently no share repurchase program pending, and the Company has made no repurchases of its securities since fiscal year 2011.
ITEM 6 – SELECTED FINANCIAL DATA
The following tables set forth the selected consolidated financial data for each of the fiscal years in the five-year period ended August 31, 2017. We derived the selected consolidated financial data from our audited consolidated financial statements, which should be read in conjunction with Item 7, Management’s Discussion and Analysis of Financial Condition and Results of Operations in Part II of this Annual Report on Form 10-K and our consolidated financial statements and the related notes included elsewhere in this report.
| Year ended August 31, | ||||||||||||||||||||
| Statements of operations data | 2017[a] | 2016 | 2015[b] | 2014[c] | 2013[d] | |||||||||||||||
| Net Revenues | $ | 24,137,913 | $ | 19,972,079 | $ | 18,314,248 | $ | 11,460,880 | $ | 10,070,770 | ||||||||||
| Cost of revenues | 6,307,800 | 4,601,513 | 4,392,477 | 1,628,069 | 1,646,530 | |||||||||||||||
| Gross margin | 17,830,113 | 15,370,566 | 13,921,771 | 9,832,811 | 8,424,240 | |||||||||||||||
| SG&A expenses | 8,198,184 | 6,693,691 | 6,736,767 | 4,439,665 | 3,549,495 | |||||||||||||||
| R&D | 1,367,645 | 1,445,069 | 1,328,476 | 952,774 | 802,374 | |||||||||||||||
| Total operating expenses | 9,565,829 | 8,138,760 | 8,065,243 | 5,392,439 | 4,351,869 | |||||||||||||||
| Income from operations | 8,264,284 | 7,231,806 | 5,856,528 | 4,440,372 | 4,072,371 | |||||||||||||||
| Other income (expense) | (24,017 | ) | 4,586 | (163,599 | ) | 73,925 | 184,409 | |||||||||||||
| Income from operations before income taxes | 8,240,267 | 7,236,392 | 5,692,929 | 4,514,297 | 4,256,780 | |||||||||||||||
| Provision for income taxes | (2,452,670 | ) | (2,286,256 | ) | (1,849,968 | ) | (1,487,806 | ) | (1,370,182 | ) | ||||||||||
| Net Income | $ | 5,787,597 | $ | 4,950,136 | $ | 3,842,961 | $ | 3,026,491 | $ | 2,886,598 | ||||||||||
| Earnings per share | ||||||||||||||||||||
| Basic | $ | 0.34 | $ | 0.29 | $ | 0.23 | $ | 0.19 | $ | 0.18 | ||||||||||
| Diluted | $ | 0.33 | $ | 0.29 | $ | 0.23 | $ | 0.18 | $ | 0.18 | ||||||||||
| Weighted-average common shares outstanding | ||||||||||||||||||||
| Basic | 17,239,490 | 17,028,566 | 16,864,670 | 16,173,674 | 15,996,432 | |||||||||||||||
| Diluted | 17,515,917 | 17,209,506 | 17,032,158 | 16,407,751 | 16,319,983 | |||||||||||||||
| Dividend per common share | $ | 0.20 | $ | 0.20 | $ | 0.20 | $ | 0.19 | $ | 0.25 | ||||||||||
| Dividends | $ | 3,448,489 | $ | 3,413,274 | $ | 3,375,566 | $ | 3,075,585 | $ | 4,001,212 | ||||||||||
| As of August 31, 2017* | ||||||||||||||||||||
| Balance sheet data at year end | 2017 | 2016 | 2015 | * | 2014 | * | 2013 | * | ||||||||||||
| Cash and cash equivalents | 6,215,718 | 8,030,284 | 8,551,275 | 8,614,929 | 10,179,298 | |||||||||||||||
| Net working capital | 10,625,437 | 10,574,712 | 7,708,494 | 10,027,035 | 12,161,266 | |||||||||||||||
| Total assets | 38,512,468 | 27,814,317 | 27,133,254 | 20,865,998 | 15,878,923 | |||||||||||||||
| Total liabilities associated with business and intangible acquisitions | 5,985,516 | 1,000,000 | 3,604,404 | 2,500,000 | – | |||||||||||||||
| Total liabilities | 12,707,581 | 5,081,723 | 7,601,052 | 5,430,647 | 1,636,430 | |||||||||||||||
| Total shareholders’ equity | 25,804,887 | 22,732,594 | 19,532,202 | 15,435,351 | 14,242,493 | |||||||||||||||
* Amounts reclassified for presentation used in 2017
| 22 |
Notes to Five-Year Summary
[a] Effective June 1, 2017, we acquired DILIsym Services, Inc. and incurred approximately $620,000 of acquisition related costs in FY2017.
[b] Effective September 2, 2014 we acquired Cognigen Corporation and incurred approximately $308,000 of acquisition related costs in FY 2014 and $410,000 in FY 2015.
[c] In May 2014, the Company entered into an exclusive software licensing agreement with TSRL, Inc. (aka Therapeutic Systems Research Laboratories), pursuant to which TSRL licensed certain software technology and databases to us, and we paid royalties to TSRL. As a result, the Company obtained a perpetual right to use certain source code and data, and TSRL relinquished any rights and claims to any GastroPlus products and to any claims to royalties or other payments under that agreement, and we agreed to pay TSRL total consideration of $6,000,000. All payments were made as of April 2017. The $6,000,000 is being amortized at a constant rate of $600,000 per year until it is completely amortized, after which no further expense will be incurred.
[d] As a tax benefit to shareholders considering the increase in federal income tax for capital gains in 2013, the Board of Directors declared an accelerated cash dividend of $0.14 per share on December 14, 2012, consisting of all of the planned February 2013 dividend of $0.05 per share, plus $0.03 per share of the planned $0.05 dividend per quarter per share for the remaining three fiscal quarters ending in calendar year 2013. The Board decided to do additional dividends later that year.
ITEM 7 – MANAGEMENT’S DISCUSSION AND ANALYSIS OF FINANCIAL CONDITION AND RESULTS OF OPERATIONS
The following discussion and analysis should be read in conjunction with the Financial Statements and related notes included in this Annual Report on Form 10-K.
Management Overview
Fiscal year 2017 highlights:
| · | We released ADMET Predictor version 8.1 |
| · | We announced that Simulations Plus was invited to join the European SimInhale Consortium |
| · | We released GastroPlus version 9.5 |
| · | Dr. Daniel Weiner joined the Board of Directors as an outside director |
| · | We acquired DILIsym Services, Inc. in a potential $10 million deal |
| · | We signed a distributor agreement with Quantum Bio Solutions in South Korea |
| · | We signed a distributor agreement with Electrolab in India |
| · | We released DILIsym® version 6A |
| · | We announced the promotion of Mr. John DiBella to president of the Lancaster Simulations Plus division |
Fiscal Year 2017 Financial Summary:
| · | Consolidated net revenues increased by $4.17 million, or 20.9%, to $24.14 million in fiscal year 2017 from $19.97 million in fiscal year 2016. |
| · | Consolidated gross margin increased $2.46 million or 16.0%, to $17.83 million in fiscal year 2017 from $15.37 million in fiscal year 2016. |
| · | Net income from operations increased $1.03 million, or 14.3%, to $8.26 million in fiscal year 2017 from $7.23 million in fiscal year 2016. |
| · | Net income increased by $837,000, or 16.9%, to $5.79 million in fiscal year 2017 from $4.95 million in fiscal year 2016. |
| · | Diluted earnings share increased by $0.04 or 14.9% to $0.33 in 2017 from $0.29 from 2016. |
Strategy Going Forward:
| · |
| · | Continue to pursue funded and unfunded collaborations in support of improving our products and services |
| · | Continue to seek accretive acquisitions that complement our existing offerings and expand our markets |
| · | Continue our aggressive marketing and sales campaign, including numerous scientific conferences and meetings |
| · | Continue to expand our use of social media and advertising |
| · | Continue to expand our sales staff, both in-house and in the field |
| · | Continue to pursue monetizing our artificial intelligence platform in other industries | |
| · | Expand our publishing activities in scientific journals |
Fiscal year 2017 was yet another record year. We believe the continued growth of our pharmaceutical software and services business is the result of steadily increasing adoption of simulation and modeling software tools across the pharmaceutical industry, the push by regulatory agencies for increased use of modeling and simulation, and the expertise we offer as consultants to assist companies involved in the research and development of new medicines. We have received a continuing series of study contracts with pharmaceutical companies ranging from several of the largest in the world to a number of medium-sized and smaller companies in the U.S., Europe, and Japan.
| 23 |
Our financial performance has enabled us to maintain significant cash deposits in spite of paying out one-time charges of over $5.5 million during the last six months of FY2017, and to continue to invest in our marketing and sales activities in order to reach a wider customer base, as well as to distribute significant cash dividends to our shareholders.
We do not have any stock repurchase programs currently in place or pending; however, our Board of Directors may consider additional programs from time to time.
Results of Operations
FY17 COMPARED WITH FY16
The following sets forth selected items from our statements of operations (in thousands) and the percentages that such items bear to net sales for the fiscal years ended August 31, 2017 (FY17) and August 31, 2016 (FY16) (because of rounding, numbers may not foot).
| Fiscal years ended | ||||||||||||||||
| 08/31/17 | 08/31/16 | |||||||||||||||
| Net sales | $ | 24,138 | 100.0% | $ | 19,972 | 100.0% | ||||||||||
| Cost of sales | 6,308 | 26.1 | 4,602 | 23.0 | ||||||||||||
| Gross profit | 17,830 | 73.9 | 15,370 | 77.0 | ||||||||||||
| Selling, general and administrative | 8,198 | 34.0 | 6,694 | 33.5 | ||||||||||||
| Research and development | 1,368 | 5.6 | 1,445 | 7.3 | ||||||||||||
| Total operating expenses | 9,566 | 39.6 | 8,139 | 40.8 | ||||||||||||
| Income from operations | 8,264 | 34.2 | 7,232 | 36.2 | ||||||||||||
| Other income (Exp) | (24 | ) | (0.1 | ) | 4 | (0.0 | ) | |||||||||
| Net income before taxes | 8,240 | 34.1 | 7,236 | 36.2 | ||||||||||||
| (Provision) for income taxes | (2,453 | ) | (10.1 | ) | (2,286 | ) | (11.4 | ) | ||||||||
| Net income | $ | 5,788 | 24.0% | $ | 4,950 | 24.8% | ||||||||||
Net Revenues
Consolidated net revenues increased by 20.9% or $4.17 million to $24.14 million in FY17 from $19.97 million in FY16. $1.75 million of this increase was from revenues generated by our Buffalo subsidiary (Cognigen), an increase of 31.4%. Our Lancaster, California division increased $1.18 million or 8.2%, to $15.6 million in FY17 from $14.42 million in FY16. DILIsym Services, Inc. (DILIsym), our June 1st 2017 acquisition located in North Carolina, recorded revenues of $1.24 million. FY17 software license sales increased $1.07 million while consulting revenues increased by $3.1 million compared to FY16.
Cost of Revenues
Consolidated cost of revenues increased by $1.71 million or 37.1% to $6.31 million in FY17 from $4.60 million in FY16. Labor-related cost accounted for $1.02 million of this increase, a combination of increased labor count, salary increases, and bonuses at our subsidiaries based on increased earnings. Included in the increase was $115,000 of salary expense at DILIsym. Other significant increases in cost of revenues included $314,000 of direct contract expenses paid for testing at DILIsym, and approximately $119,000 of increased training related expenses.
| 24 |
A significant portion of cost of revenues for pharmaceutical software products is the systematic amortization of capitalized software development costs, which is an independent fixed cost rather than a variable cost related to revenues. This amortization cost increased approximately $116,000 in FY17 compared with FY16. In addition, in 2017 there was an additional $86,000 of amortization expense associated with acquired technologies associated with DILIsym’s drug-induced liver injury technologies.
Cost of revenues as a percentage of revenue increased to 26.1% in FY17 from 23.0% in FY16. The majority of this percentage change is a result of the increased salary costs associated with consulting costs and the blend of software sales compared to consulting services during FY17.
Gross Margin
Consolidated gross margin increased $2.46 million or 16.0%, to $17.83 million in FY17 from $15.37 million in FY16. $805,000 of this increase is from the California division, which showed an 83.0% gross margin. The Buffalo Division Gross margins increased $972,000 or 30.2% with margins of 58%, and DILIsym of North Carolina showed $683,000, a 55.2% margin.
Overall gross margin decreased to 73.9% in FY17 from 76.9% in FY16 due to increased salary costs associated with the relatively higher revenue mix of consulting to software in FY17.
Selling, General and Administrative Expenses
Selling, general, and administrative (SG&A) expenses increased $1.50 million, or 22.5% to $8.19 million in FY17 from $6.69 million in FY16. As a percent of revenues, SG&A was 33.96% for FY17, compared to 33.52% in FY16 and 36.78% in FY15.
The major increases in SG&A expense were:
| o | In 2017 the Company incurred approximately $620,000 of one-time charges associated with the acquisition of DILIsym Services, Inc.; these included legal, accounting, and investment banking fees |
| o | Commission expenses were up $62,000, related to increased sales through representatives in Asia |
| o | Accounting and audit fees increased by $127,000 associated with costs of consolidated audits and other compliance-related expenses for the first year of accelerated filer status | |
| o | G&A Salaries and Wages increased by $400,000; this increase is a combination of increased stock compensation costs of $70,000, salaries of $62,000 at DILIsym during the last fiscal quarter after acquisition, annual salary increases and increased head count in Lancaster and Buffalo. | |
| o | Insurance Expense increased $95,000; $86,000 was health-related medical costs of which $33,000 was associated with DILIsym. | |
| o | Payroll tax expense increased $80,000, the effect of higher salary expense of which $22,000 was DILIsym | |
| o | Legal expenses increased $61,000 due to document review and review of other strategic initiatives | |
| o | Amortization expense increased $53,000 due to new acquisition amortization for DILIsym intangibles |
The major decreases in SG&A expense were:
| o | Advertising expenses decreased by $73,000; in 2016 the Company incurred greater advertising expense to upgrade its website |
Research and Development
We incurred approximately $2,743,000 of research and development costs during FY17. Of this amount, $1,376,000 was capitalized and $1,367,000 was expensed. We incurred approximately $2,641,000 of research and development costs during FY16. Of this amount, $1,196,000 was capitalized and $1,445,000 was expensed. The increase of $104,000, or 4%, in total research and development expenditures from FY16 to FY17 was mainly from $71,000 of costs incurred by DILIsym Services Inc.
Provision for Income Taxes
The provision for income taxes was $2.45 million for FY17 compared to $2.29 million for FY16. Our effective tax rate decreased to 29.8% in FY17 from 31.6% in FY16. This decrease is a result of additional tax deductions for stock-based compensation.
Net Income
Net income increased by $837,000 or 16.9%, to $5.79 million in FY17 from $4.95 million in FY16. Of note, this increase is in spite of the fact that during FY17 stock compensation costs increased by $238,000 and $620,000 of one-time pretax costs were incurred associated with the acquisition of DILIsym services.
| 25 |
FY16 COMPARED WITH FY15
The following sets forth selected items from our statements of operations (in thousands) and the percentages that such items bear to net sales for the fiscal years ended August 31, 2016 (FY16) and August 31, 2015 (FY15) (because of rounding, numbers may not foot).
| Fiscal years ended | ||||||||||||||||
| 08/31/16 | 08/31/15 * | |||||||||||||||
| Net sales | $ | 19,972 | 100.0% | $ | 18,314 | 100.0% | ||||||||||
| Cost of sales | 4,602 | 23.0 | 4,392 | 24.0 | ||||||||||||
| Gross profit | 15,370 | 77.0 | 13,922 | 76.0 | ||||||||||||
| Selling, general and administrative | 6,694 | 33.5 | 6,736 | 36.8 | ||||||||||||
| Research and development | 1,445 | 7.3 | 1,329 | 7.2 | ||||||||||||
| Total operating expenses | 8,139 | 40.8 | 8,065 | 44.0 | ||||||||||||
| Income from operations | 7,232 | 36.2 | 5,857 | 32.0 | ||||||||||||
| Other income | 4 | (0.0 | ) | (164 | ) | (0.9 | ) | |||||||||
| Net income before taxes | 7,236 | 36.2 | 5,693 | 31.1 | ||||||||||||
| (Provision) for income taxes | (2,286 | ) | (11.4 | ) | (1,850 | ) | (10.1 | ) | ||||||||
| Net income | $ | 4,950 | 24.8% | $ | 3,843 | 21.0% | ||||||||||
* Numbers in the prior year have been reclassified to conform to the current year presentation
Net Revenues
Consolidated net revenues increased by 9.1% or $1.658 million to $19.97 million in FY16 from $18.31 million in FY15. $326,000 of this increase was from revenues generated by our Buffalo subsidiary (Cognigen), while net revenues of the California division increased $1.33 million or 10.2%, to $14.42 million in FY16 from $13.09 million in FY15. FY16 software license sales increased $1.34 million, while consulting revenues increased by $318,000 compared to FY15.
Cost of Revenues
Consolidated cost of revenues increased by $209,000 to $4.60 million in FY16 from $4.39 million in FY15. The majority of this increase was salary-related expenses from annual salary increases and the first year of expensed bonuses for our Buffalo division (Cognigen).
Cost of revenues as a percentage of revenue decreased from 24.0% in FY15 to 23.0% in FY16. The majority of this percentage change is a result of the percentage blend of software sales compared to consulting services during FY16.
A significant portion of cost of revenues for pharmaceutical software products is the systematic amortization of capitalized software development costs, which is an independent fixed cost rather than a variable cost related to revenues. This amortization cost decreased approximately $42,000 in FY16 compared with FY15. In FY15, amortization expense increased approximately $215,000 due to releases of GastroPlus and ADMET Predictor and amortization of software acquired as part of the Cognigen acquisition.
Gross Margin
Consolidated gross margin increased $1.45 million or 10.4%, to $15.37 million in FY16 from $13.92 in FY15. $1.37 of this increase is from the California division, which showed an 84.3% gross margin. The Buffalo Division Gross margins increased $77,000 with margins of 58% after first-time bonuses of $139,000.
Selling, General and Administrative Expenses
Selling, general, and administrative (SG&A) expenses decreased $43,000, or 0.6% to $6.69 million in FY16 from $6.74 million in FY15.
The major increases in SG&A expense were:
| o | Advertising expenses increased by $97,000 as the Company increased its web presence and incurred other advertising-related costs; |
| o | Marketing labor expenses increased by $46,000, related to more time spent by scientific staff; |
| o | Trade show expenses increased by $49,000, related to greater attendance and presence during FY16; |
| o | Professional fees increased by $120,000 associated with costs of consolidated audits and other compliance-related expenses; and |
| o | Outside software licensing fees increased by $59,000. |
| 26 |
The major decreases in SG&A expense were:
| o | Outside consulting fees decreased by $397,000; in FY15, we paid fees and expenses to our financial advisor/business broker related to the Cognigen acquisition. There were no such expenses in FY16. |
Research and Development
We incurred approximately $2,641,000 of research and development costs during FY16. Of this amount, $1,196,000 was capitalized and $1,445,000 was expensed. We incurred approximately $2,496,000 of research and development costs during FY15. Of this amount, $1,168,000 was capitalized and $1,328,000 was expensed. The increase of $ 145,000, or 5.8%, in total research and development expenditures from FY15 to FY16 was mainly due to salary increases for existing staff.
Other income (expense)
Net other income (expense) in FY16 increased by $168,000 to a net other income of $5,000 from an expense of $164,000 in FY15. This is due mainly to a $168,000 reduction in currency losses in FY16.
Provision for Income Taxes
The provision for income taxes was $2.29 million for FY16 compared to $1.850 million for FY15. Our effective tax rate decreased to 31.6% in FY16 from 32.5% in FY15.
Net Income
Net income increased by $1,107,000, or 28.8%, to $4.950 million in FY15 from $3.84 million in FY15.
SEASONALITY
Our sales exhibit some seasonal fluctuations, with the fourth fiscal quarter (June-August) generally having the lowest sales over the past three fiscal years because of summer vacations and reduced activities at our customers’ sites. In 2017, revenues in the fourth quarter revenues were higher than normal due to the acquisition of DILIsym along with increased revenues at our Buffalo Division. This unaudited quarterly sales information has been prepared on the same basis as the annual information presented elsewhere in this Annual Report on Form 10-K and, in the opinion of management, reflects all adjustments (consisting of normal recurring entries) necessary for a fair presentation of the information presented. Net sales for any quarter are not necessarily indicative of sales for any future period; however, because our pharmaceutical software is licensed on an annual basis, renewals are usually within the same quarter year after year. (Numbers may not foot because of rounding)
| Net Sales (in thousands of dollars) | ||||||||||||||||||||
| FY | First Quarter | Second Quarter | Third Quarter | Fourth Quarter | Total | |||||||||||||||
| 2017 | $ | 5,418 | 5,706 | 6,748 | 6,265 | $ | 24,138 | |||||||||||||
| 2016 | $ | 4,839 | 5,164 | 6,011 | 3,958 | $ | 19,972 | |||||||||||||
| 2015 | $ | 4,086 | 4,574 | 5,942 | 3,712 | $ | 18,314 | |||||||||||||
| 2014 | $ | 2,641 | 3,081 | 3,741 | 1,998 | $ | 11,461 | |||||||||||||
| 2013 | $ | 2,290 | 3,118 | 3,095 | 1,568 | $ | 10,071 | |||||||||||||
| 2012 | $ | 2,248 | 2,789 | 2,772 | 1,640 | $ | 9,449 | |||||||||||||
| 2011 | $ | 2,050 | 2,622 | 2,640 | 1,427 | $ | 8,739 | |||||||||||||
| 2010 | $ | 1,735 | 2,227 | 2,325 | 1,334 | $ | 7,621 | |||||||||||||
LIQUIDITY AND CAPITAL RESOURCES
Our principal source of capital has been cash flow from our operations. We have achieved continuous positive operating cash flow over the last twelve fiscal years. We believe that our existing capital and anticipated funds from operations will be sufficient to meet our anticipated cash needs for working capital and capital expenditures for the foreseeable future. Thereafter, if cash generated from operations is insufficient to satisfy our capital requirements, we may open a revolving line of credit with a bank, or we may have to sell additional equity or debt securities or obtain credit facilities. In the event such financing is needed in the future, there can be no assurance that such financing will be available to us, or, if available, that it will be in amounts and on terms acceptable to us.
| 27 |
We are not aware of any trends or demands, commitments, events or uncertainties that are reasonably likely to result in a decrease in liquidity of our assets. The trend over the last ten years has been increasing cash deposits from our operating cash flows, and we expect that trend to continue for the foreseeable future. In FY14 we used $2,500,000 of our cash reserves to pay the initial installment of the amounts we owe under termination and non-assertion agreement we entered into with TSRL in May 2014 that terminated the exclusive software licensing agreement we entered with TSRL in 1997. We also incurred $2,500,000 of debt in connection with termination and non-assertion agreement. We have been paying that debt out of, and anticipate that that debt will continue to be, paid out of operations from the reduction in royalty payments that are no longer payable under the 1997 licensing agreement as a result of its termination.
On July 23, 2014, we signed the Merger Agreement with Cognigen. The merger closed on September 2, 2014, subsequent to the end of FY14, and Cognigen became our wholly-owned subsidiary. In connection with the closing we paid $2,080,000 in cash and issued 491,159 shares of common stock of the Company to the former Cognigen stockholders. The 491,159 shares were valued at $3,120,000 based on a $6.35 per share price, which was the volume-weighted average closing price of our common stock for the 30 consecutive trading-day period ending two trading days before the closing date. In July 2016, we paid the additional $720,000 in cash due, and issued the additional 170,014 shares of common stock due, to the former Cognigen stockholders, which additional shares were valued at $1,080,000 under the formula described above.
On May 1, 2017 we signed a stock acquisition agreement with DILIsym Services, Inc. of Research Triangle Circle, North Carolina, and on June 1, 2017 consummated the acquisition of all the outstanding capital stock of DILIsym Services, Inc. pursuant to a Stock Purchase Agreement. DILIsym became a wholly-owned subsidiary of Simulations Plus. Under the terms of the Agreement, the Company: (1) paid to the DILIsym Shareholders Five Million Dollars, $4,515,982 payable at the closing of the Acquisition subject to certain adjustments and holdbacks and will pay to the DILIsym Shareholders certain earn-out payments, to be measured by the earnings of DILIsym before income taxes, payable following the Closing, as more particularly described in the Agreement and as more fully described in Note 13.
We will continue to seek opportunities for strategic acquisitions. If one or more such acquisitions is identified, a substantial portion of our cash reserves may be required to complete it; however, we intend to maintain sufficient cash reserves after any acquisition to provide reasonable assurance that outside financing will not be necessary to continue operations. If we identify an attractive acquisition that would require more cash to complete than we are willing or able to use from our cash reserves, we will consider financing options to complete the acquisition, including obtaining loans and issuing additional securities.
Quarterly dividend payments made in FY16 and FY17 are listed in the following table.
| Fiscal Year | Record Date | Distribution Date | # of Shares Outstanding on Record Date | Dividend per Share | Total Amount | |||||||||||
| 2016 | 11/09/2015 | 11/16/2015 | 16,996,001 | $ | 0.05 | $ | 849,800 | |||||||||
| 1/29/2016 | 2/05/2016 | 17,018,001 | $ | 0.05 | $ | 850,900 | ||||||||||
| 5/02/2016 | 5/09/2016 | 17,029,501 | $ | 0.05 | $ | 851,475 | ||||||||||
| 8/11/2016 | 8/18/2016 | 17,221,978 | $ | 0.05 | $ | 861,099 | ||||||||||
| 2017 | 11/10/2016 | 11/17/2016 | 17,226,478 | $ | 0.05 | $ | 861,324 | |||||||||
| 1/30/2017 | 2/06/2017 | 17,233,758 | $ | 0.05 | $ | 861,688 | ||||||||||
| 5/08/2017 | 5/15/2017 | 17,240,626 | $ | 0.05 | $ | 862,031 | ||||||||||
| 7/28/2017 | 8/04/2017 | 17,268,920 | $ | 0.05 | $ | 863,446 | ||||||||||
The Board of directors has indicated its intension to pay $0.06 quarterly dividends; however, there can be no assurances that our Board of Directors will continue the dividend distributions as the decision is made on a quarterly basis based on current financial conditions and strategic plans. After the end of FY17, in November 2017, our Board of Directors declared a dividend distribution of $0.06 per share.
KNOWN TRENDS OR UNCERTAINTIES
Although we have not seen any significant reduction in revenues to date, we have seen some consolidation in the pharmaceutical industry during economic downturns. These consolidations have not had a negative effect on our total sales to that industry; however, should consolidations and downsizing in the industry continue to occur, those events could adversely impact our revenues and earnings going forward.
| 28 |
We believe that the need for improved productivity in the research and development activities directed toward developing new medicines will continue to result in increasing adoption of simulation and modeling tools such as those we produce. New product developments in the pharmaceutical business segments could result in increased revenues and earnings if they are accepted by our markets; however, there can be no assurances that new products will result in significant improvements to revenues or earnings. For competitive reasons, we do not disclose all of our new product development activities.
Our continued quest for acquisitions could result in a significant change to revenues and earnings if one or more such acquisitions are completed.
The potential for growth in new markets (e.g., aerospace and healthcare) is uncertain. We will continue to explore these opportunities until such time as we either generate sales or determine that resources would be more efficiently used elsewhere.
INFLATION
We have not been affected materially by inflation during the periods presented, and no material effect is expected in the near future.
OFF-BALANCE SHEET ARRANGEMENTS
As of August 31, 2017, we did not have any relationships with unconsolidated entities or financial partnerships, such as entities often referred to as structured finance or special purpose entities, which would have been established for the purpose of facilitating off-balance sheet arrangements or other contractually narrow or limited purposes. As such, we are not materially exposed to any financing, liquidity, market, or credit risk that could arise if we had engaged in such relationships.
We do not have relationships or transactions with persons or entities that derive benefits from their non-independent relationship with us or our related parties.
CONTRACTUAL OBLIGATIONS
The following table provides aggregate information regarding our contractual obligations as of August 31, 2017.
| Payments due by period | ||||||||||||||||||||
| Contractual obligations: | Total | Less than 1 year | 1–3 years | 3–5 years | More than 5 years | |||||||||||||||
| (in thousands) | ||||||||||||||||||||
| Operating lease obligations | $ | 1,393 | $ | 531 | $ | 731 | $ | 131 | $ | – | ||||||||||
| Contracts Payable | 5,985 | 247 | 5,738 | – | – | |||||||||||||||
| Total | $ | 7,378 | $ | 778 | $ | 6,469 | $ | 131 | $ | – | ||||||||||
RECENTLY ISSUED OR NEWLY ADOPTED ACCOUNTING STANDARDS
In May 2014, the Franchise Accounting Standards Board (FASB) issued Accounting Standards Update (ASU) No. 2014-09, Revenue from Contracts with Customers (ASU 2014-09). The standard will eliminate the transaction- and industry-specific revenue recognition guidance under current generally accepted accounting principles in the U.S. (GAAP) and replace it with a principles-based approach for determining revenue recognition. ASU 2014-09 is effective for annual and interim periods beginning after December 15, 2017. Early adoption is permitted for years beginning after December 15, 2016. The revenue recognition standard is required to be applied retrospectively, including any combination of practical expedients as allowed in the standard. We are evaluating the impact, if any, of the adoption of ASU 2014-09 to our financial statements and related disclosures. The Company has not yet selected a transition method nor has it determined the effect of the standard on its ongoing financial reporting.
In November 2015, the FASB issued ASU No 2015-17, Income Taxes (Topic 740) (“ASU 2015-17). The amendments in ASU 2015-17 change the requirements for the classification of deferred taxes on the balance sheet. Currently, GAAP requires an entity to separate deferred income tax liabilities and assets into current and noncurrent amounts in a classified statement of financial position. To simplify the presentation of deferred income taxes, the amendments in this ASU require that deferred tax liabilities and assets be classified as noncurrent in a classified statement of financial position. The pronouncement is effective for fiscal years and interim periods within those fiscal years beginning after December 15, 2016. Earlier application is permitted for all entities as of the beginning of an interim or annual reporting period. The Company has early adopted this pronouncement for the fiscal reporting period ended August 31, 2017 because it reduced complexity while maintaining the usefulness of the information. The retrospective application resulted in a reclassification of the current deferred tax asset at August 31, 2016 now being presented against the long term deferred tax liability.
| 29 |
In February 2016, the FASB issued ASU 2016-02, Leases (Topic 842), which supersedes existing guidance on accounting for leases in "Leases (Topic 840)" and generally requires all leases to be recognized in the consolidated balance sheet. ASU 2016-02 is effective for annual and interim reporting periods beginning after December 15, 2018; early adoption is permitted. The provisions of ASU 2016-02 are to be applied using a modified retrospective approach. The Company is currently evaluating the impact of the adoption of this standard on its consolidated financial statements.
In March 2016, the FASB issued ASU 2016-09, Improvements to Employee Share-Based Payment Accounting (ASU 2016-09). This ASU affects entities that issue share-based payment awards to their employees. The ASU is designed to simplify several aspects of accounting for share-based payment award transactions which include - the income tax consequences, classification of awards as either equity or liabilities, classification on the statement of cash flows and forfeiture rate calculations. ASU 2016-09 will become effective for the Company in the first quarter of fiscal 2019. Early adoption is permitted in any interim or annual period. The Company early adopted ASU No. 2016-09. The adoption had no material impact on the Company’s financial statements.
In April 2016, the FASB issued AS 2016-10, Revenue from Contracts with Customers (Topic 606), which amends certain aspects of the Board's new revenue standard, ASU 2014-09, Revenue from Contracts with Customers. The standard should be adopted concurrently with adoption of ASU 2014-09 which is effective for annual and interim periods beginning after December 15, 2017. The Company has not yet selected a transition method nor has it determined the effect of the standard on its ongoing financial reporting.
SIGNIFICANT ACCOUNTING POLICIES
Estimates
Our financial statements and accompanying notes are prepared in accordance with GAAP. Preparing financial statements requires management to make estimates and assumptions that affect the reported amounts of assets, liabilities, revenue, and expenses. These estimates and assumptions are affected by management’s application of accounting policies. Actual results could differ from those estimates. Significant accounting policies for us include revenue recognition, accounting for capitalized software development costs, valuation of stock options, and accounting for income taxes.
Revenue Recognition
We recognize revenues related to software licenses and software maintenance in accordance with the FASB Accounting Standards Codification (“ASC”) 985-605, “Software – Revenue Recognition”. Software product revenue is recorded when the following conditions are met: 1) evidence of arrangement exists; 2) delivery has been made; 3) the amount is fixed; and 4) collectability is probable. Post-contract customer support (“PCS”) obligations are insignificant; therefore, revenue for PCS is recognized at the same time as the licensing fee, and the costs of providing such support services are accrued and amortized over the obligation period.
As a byproduct of ongoing improvements and upgrades for the new programs and new modules of software, some modifications are provided to our customers who have already purchased software at no additional charge. Other software modifications result in new, additional cost modules that expand the functionality of the software. These are licensed separately. We consider the modifications that are provided without charge to be minimal, as they do not significantly change the basic functionality or utility of the software, but rather add convenience, such as being able to plot some additional variable on a graph in addition to the numerous variables that had been available before, or adding some additional calculations to supplement the information provided from running the software. Such software modifications for any single product have typically occurred once or twice per year, sometimes more, sometimes less. Thus, they are infrequent. The Company provides, for a fee, additional training and service calls to its customers and recognizes revenue at the time the training or service call is provided.
Generally, we enter into one-year license agreements with customers for the use of our pharmaceutical software products. We recognize revenue on these contracts when all the criteria are met. Most license agreements have a term of one year; however, from time to time, we enter into multi-year license agreements. We generally unlock and invoice software one year at a time for multi-year licenses. Therefore, revenue is recognized one year at a time. Certain of the Company's software products are housed and supported on the Company's computer networks. Software revenues for those products are included in income over the life of the contract.
We recognize revenue from collaboration research, revenue from grants and consortium memberships over their terms. For contract revenues based on actual hours incurred we recognize revenues when the work is performed. For fixed price contracts, we recognize contract study and other contract revenues using the percentage-of-completion method, depending upon how the contract studies are engaged, in accordance with ASC 605-35, “Revenue Recognition – Construction-Type and Production-Type Contracts”. To recognize revenue using the percentage-of-completion method, we must determine whether we meet the following criteria: 1) there is a long-term, legally enforceable contract, 2) it is possible to reasonably estimate the total project costs, and 3) it is possible to reasonably estimate the extent of progress toward completion.
| 30 |
Cash and Cash Equivalents
For purposes of the statements of cash flows, we consider all highly liquid investments purchased with original maturities of three months or less to be cash equivalents.
Accounts Receivable
We analyze the age of customer balances, historical bad-debt experience, customer creditworthiness, and changes in customer payment terms when making estimates of the collectability of the Company’s trade accounts receivable balances. If we determine that the financial conditions of any of its customers deteriorated, whether due to customer-specific or general economic issues, an increase in the allowance may be made. Accounts receivable are written off when all collection attempts have failed. We have not experienced any bad debts in our pharmaceutical software and services business.
Capitalized Computer Software Development Costs
Software development costs are capitalized in accordance with FASB ASC 985-20, “Costs of Software to Be Sold Leased, or Marketed”. Capitalization of software development costs begins upon the establishment of technological feasibility and is discontinued when the product is available for sale.
The establishment of technological feasibility and the ongoing assessment for recoverability of capitalized software development costs require considerable judgment by management with respect to certain external factors including, but not limited to, technological feasibility, anticipated future gross revenues, estimated economic life, and changes in software and hardware technologies. Capitalized computer software development costs are comprised primarily of salaries and direct payroll-related costs and the purchase or licensing of existing software to be used in the Company’s software products.
Amortization of capitalized computer software development costs is provided on a product-by-product basis on the straight-line method over the estimated economic life of the products not to exceed five years. Amortization of software development costs amounted to $1,089,238, $ $981,066 and $1,023,139 for FY17, FY16 and FY15, respectively. We expect future amortization expense to vary due to increases in capitalized computer software development costs.
We test capitalized computer software development costs for recoverability whenever events or changes in circumstances indicate that the carrying amount may not be recoverable.
Property and Equipment
Property and equipment are recorded at cost, less accumulated depreciation and amortization. Depreciation and amortization are provided using the straight-line method over the estimated useful lives as follows:
| Equipment | 5 years | |
| Computer equipment | 3 to 7 years | |
| Furniture and fixtures | 5 to 7 years | |
| Leasehold improvements | Shorter of life of asset or lease |
Maintenance and minor replacements are charged to expense as incurred. Gains and losses on disposals are included in the results of operations.
Intangible Assets and Goodwill
The Company performs valuations of assets acquired and liabilities assumed on each acquisition accounted for as a business combination and recognizes the assets acquired and liabilities assumed at their acquisition date fair value. Acquired intangible assets include customer relationships, software, trade name, and non-compete agreements. The Company determines the appropriate useful life by performing an analysis of expected cash flows based on historical experience of the acquired businesses. Intangible assets are amortized over their estimated useful lives using the straight-line method, which approximates the pattern in which the majority of the economic benefits are expected to be consumed.
Goodwill represents the excess of the cost of an acquired entity over the fair value of the acquired net assets. Goodwill is not amortized, instead it is tested for impairment annually or when events or circumstances change that would indicate that goodwill might be impaired. Events or circumstances that could trigger an impairment review include, but are not limited to, a significant adverse change in legal factors or in the business climate, an adverse action or assessment by a regulator, unanticipated competition, a loss of key personnel, significant changes in the manner of the Company's use of the acquired assets or the strategy for the Company's overall business, significant negative industry or economic trends or significant under-performance relative to expected historical or projected future results of operations.
| 31 |
Goodwill is tested for impairment at the reporting unit level, which is one level below or the same as an operating segment. As of August 31, 2017, the Company determined that it has three reporting units, Simulations Plus, Cognigen Corporation and DILIsym Services, Inc. When testing goodwill for impairment, the Company first performs a qualitative assessment to determine whether it is necessary to perform step one of a two-step annual goodwill impairment test for each reporting unit. The Company is required to perform step one only if it concludes that it is more likely than not that a reporting unit's fair value is less than its carrying value. Should this be the case, the first step of the two-step process is to identify whether a potential impairment exists by comparing the estimated fair values of the Company's reporting units with their respective book values, including goodwill. If the estimated fair value of the reporting unit exceeds book value, goodwill is considered not to be impaired, and no additional steps are necessary. If, however, the fair value of the reporting unit is less than book value, then the second step is performed to determine if goodwill is impaired and to measure the amount of impairment loss, if any. The amount of the impairment loss is the excess of the carrying amount of the goodwill over its implied fair value. The estimate of implied fair value of goodwill is primarily based on an estimate of the discounted cash flows expected to result from that reporting unit, but may require valuations of certain internally generated and unrecognized intangible assets such as the Company's software, technology, patents and trademarks. If the carrying amount of goodwill exceeds the implied fair value of that goodwill, an impairment loss is recognized in an amount equal to the excess.
As of August 31, 2017, the balance of goodwill was attributed to two of the Company's reporting units Cognigen and DILIsym. Intangible assets subject to amortization are reviewed for impairment whenever events or circumstances indicate that the carrying amount of these assets may not be recoverable. The Company has not recognized any impairment charges during FY17, FY16 and FY15.
Reconciliation of Goodwill for FY17, FY16 and FY15:
| Cognigen | DILIsym | Total | ||||||||||
| Balance, August 31, 2014 | $ | – | $ | – | $ | – | ||||||
| Addition | 4,789,248 | – | 4,789,248 | |||||||||
| Impairments | – | – | – | |||||||||
| Balance, August 31, 2015 | 4,789,248 | – | 4,789,248 | |||||||||
| Addition | – | – | – | |||||||||
| Impairments | – | – | – | |||||||||
| Balance, August 31, 2016 | 4,789,248 | – | 4,789,248 | |||||||||
| Addition | – | 5,597,950 | 5,597,950 | |||||||||
| Impairments | – | – | – | |||||||||
| Balance, August 31, 2017 | $ | 4,789,248 | $ | 5,597,950 | $ | 10,387,198 | ||||||
Other Intangible Assets
The following table summarizes other intangible assets as of August 31, 2017:
| Amortization Period | Acquisition Value | Accumulated Amortization | Net book value | |||||||||||
| Customer relationships-Cognigen | Straight line 8 years | $ | 1,100,000 | $ | 412,500 | $ | 687,500 | |||||||
| Trade Name-Cognigen | None | 500,000 | 0 | 500,000 | ||||||||||
| Covenants not to compete-Cognigen | Straight line 5 years | 50,000 | 30,000 | 20,000 | ||||||||||
| Covenants not to compete-DILIsym | Straight line 4 years | 80,000 | 5,000 | 75,000 | ||||||||||
| Trade Name-DILIsym | None | 860,000 | 0 | 860,000 | ||||||||||
| Customer relationships-DILIsym | Straight line 8 years | 1,900,000 | 47,500 | 1,852,500 | ||||||||||
| $ | 4,490,000 | $ | 495,000 | $ | 3,995,000 | |||||||||
Amortization expense for FY17, FY16, and FY15 was $200,000, $147,500, and $147,500, respectively.
| 32 |
Business Acquisitions
The Company accounted for the acquisition of Cognigen and DILIsym Services Inc. using the purchase method of accounting where the assets acquired and liabilities assumed are recognized based on their respective estimated fair values. The excess of the purchase price over the estimated fair values of the net assets acquired is recorded as goodwill. Determining the fair value of certain acquired assets and liabilities is subjective in nature and often involves the use of significant estimates and assumptions, including, but not limited to, the selection of appropriate valuation methodology, projected revenue, expenses and cash flows, weighted average cost of capital, discount rates, estimates of advertiser and publisher turnover rates and estimates of terminal values. Business acquisitions are included in the Company's consolidated financial statements as of the date of the acquisition.
Fair Value of Financial Instruments
Assets and liabilities recorded at fair value in the Condensed Balance Sheets are categorized based upon the level of judgment associated with the inputs used to measure their fair value. The categories, as defined by the standard are as follows:
| Level Input: | Input Definition: | |
| Level I | Inputs are unadjusted, quoted prices for identical assets or liabilities in active markets at the measurement date. | |
| Level II | Inputs, other than quoted prices included in Level I, that are observable for the asset or liability through corroboration with market data at the measurement date. | |
| Level III | Unobservable inputs that reflect management’s best estimate of what market participants would use in pricing the asset or liability at the measurement date. |
For certain of our financial instruments, including accounts receivable, accounts payable, contract payable, accrued payroll and other expenses, and accrued bonus to officer, the amounts approximate fair value due to their short maturities.
Research and Development Costs
Research and development costs are charged to expense as incurred until technological feasibility has been established. These costs consist primarily of salaries and direct payroll-related costs. It also includes purchased software and databases that were developed by other companies and incorporated into, or used in the development of, our final products.
Income Taxes
We utilize FASB ASC 740-10, “Income Taxes”, which requires the recognition of deferred tax assets and liabilities for the expected future tax consequences of events that have been included in the financial statements or tax returns.
Under this method, deferred income taxes are recognized for the tax consequences in future years of differences between the tax bases of assets and liabilities and their financial reporting amounts at each year-end based on enacted tax laws and statutory tax rates applicable to the periods in which the differences are expected to affect taxable income. Valuation allowances are established, when necessary, to reduce deferred tax assets to the amount expected to be realized. The provision for income taxes represents the tax payable for the period and the change during the period in deferred tax assets and liabilities.
Stock-Based Compensation
The Company accounts for stock options using the modified prospective method in accordance with FASB ASC 718-10, “Compensation-Stock Compensation”. Under this method, compensation costs include estimated grant date fair value of the awards amortized over the options’ vesting period. Stock-based compensation was $585,018, $347,077 and $295,243 for the fiscal years ended August 31, 2017, 2016 and 2015, respectively, and is included in the statements of operations as Consulting, Salaries, and Research and Development expense.
ITEM 7A – QUANTITATIVE AND QUALITATIVE DISCLOSURES ABOUT MARKET RISK
As of August 31, 2017, and August 31, 2016, we had cash and cash equivalents of $6.22 million and $8.03 million, respectively. We do not hold any investments that are exposed to market risk related to changes in interest rates, which could adversely affect the value of our assets and liabilities, and we do not hold any instruments for trading purposes and investment. Some of our cash and cash equivalents are held in money market accounts; however, they are not exposed to market rate risk.
In the years ended August 31, 2017, 2016, and 2015 we sold $2.75 million, $2.49 million and $2.27 million, respectively, of software through representatives in certain Asian markets in local currencies. As a result, our financial position, results of operations, and cash flows can be affected by fluctuations in foreign currency exchange rates, particularly fluctuations in the yen and RMB exchange rates. These transactions give rise to receivables that are denominated in currencies other than the entity’s functional currency. The value of these receivables is subject to changes because the receivables may become worth more or less due to changes in currency exchange rates. The majority of our software license agreements are denominated in U.S. dollars. We record foreign gains and losses as they are realized. We mitigate our risk from foreign currency fluctuations by adjusting prices in our foreign markets on a periodic basis. We base these changes on market conditions while working closely with our representatives. We do not hedge currencies or enter into derivative contracts.
| 33 |
ITEM 8 - FINANCIAL STATEMENTS AND SUPPLEMENTARY DATA
See the financial statements included elsewhere in this report beginning at page F-1, which are incorporated herein by reference.
ITEM 9 – CHANGES IN AND DISAGREEMENTS WITH ACCOUNTANTS ON ACCOUNTING AND FINANCIAL DISCLOSURE
None.
ITEM 9A. CONTROLS AND PROCEDURES
Evaluation of Disclosure Controls and Procedures
Our Chief Executive Officer and our Chief Financial Officer, after evaluating our “disclosure controls and procedures” (as defined in Securities Exchange Act of 1934 (the “Exchange Act”) Rules 13a-15(e) and 15d-15(e) as of the end of the period covered by this Annual Report on Form 10-K (the “Evaluation Date”), have concluded that as of the Evaluation Date, our disclosure controls and procedures are effective to ensure that information we are required to disclose in reports that we file or submit under the Exchange Act is recorded, processed, summarized and reported within the time periods specified in Securities and Exchange Commission rules and forms, and to ensure that information required to be disclosed by us in such reports is accumulated and communicated to our management, including our Chief Executive Officer and Chief Financial Officer, where appropriate, to allow timely decisions regarding required disclosure.
Management Report on Internal Control Over Financial Reporting
Our management is responsible for establishing and maintaining adequate internal control over financial reporting (as defined in Rules 13a-15(f) and 15d-15(f) under the Exchange Act) to provide reasonable assurance regarding the reliability of our financial reporting and the preparation of consolidated financial statements for external purposes in accordance with U.S. GAAP. Management assessed our internal control over financial reporting as of August 31, 2017, the end of our fiscal year. Management based its assessment on criteria established in Internal Control—Integrated Framework issued by the Committee of Sponsoring Organizations of the Treadway Commission (2013 framework). Management’s assessment included evaluation of elements such as the design and operating effectiveness of key financial reporting controls, process documentation, accounting policies, and our overall control environment.
Under guidelines established by the SEC, companies are permitted to exclude acquisitions from their first assessment of internal control over financial reporting following the date of acquisition. Management’s assessment of the effectiveness of the Company’s internal control over financial reporting excluded DILIsym Services, Inc. (DILIsym), a wholly owned subsidiary of Simulations Plus Inc. that consisted of the net assets purchased in June 2017. DILIsym represented 24.5% and 5.1% of the Company’s consolidated total assets and consolidated net sales, respectively, as of and for the year ended August 31, 2017. This acquisition is more fully discussed in Note 13 to our Consolidated Financial Statements for fiscal year 2017.
Based on this assessment, management has concluded that our internal control over financial reporting was effective as of the end of the fiscal year to provide reasonable assurance regarding the reliability of financial reporting and the preparation of consolidated financial statements for external reporting purposes in accordance with U.S. GAAP. We reviewed the results of management’s assessment with the Audit Committee of our Board of Directors.
Our independent registered public accounting firm, Rose Snyder and Jacobs LLP, independently assessed the effectiveness of the Company’s internal control over financial reporting, as stated in the firm’s attestation report, which is included within Part II, Item 8 of this Form 10-K.
Inherent Limitations on Effectiveness of Controls
Our management, including the CEO and CFO, does not expect that our disclosure controls and procedures or our internal control over financial reporting will prevent or detect all errors and all fraud. A control system, no matter how well-designed and operated, can provide only reasonable, not absolute, assurance that the control system’s objectives will be met. The design of a control system must reflect the fact that there are resource constraints, and the benefits of controls must be considered relative to their costs. Further, because of the inherent limitations in all control systems, no evaluation of controls can provide absolute assurance that misstatements due to error or fraud will not occur or that all control issues and instances of fraud, if any, have been detected. The design of any system of controls is based in part on certain assumptions about the likelihood of future events, and there can be no assurance that any design will succeed in achieving its stated goals under all potential future conditions. Projections of any evaluation of the effectiveness of controls to future periods are subject to risks. Over time, controls may become inadequate because of changes in conditions or deterioration in the degree of compliance with policies or procedures.
Changes in Internal Control Over Financial Reporting
No change in the Company’s internal controls over financial reporting (as defined in Rule 13a-15(f) and 15d-15(f) of the Exchange Act) occurred during the Company’s most recent fiscal quarter that has materially affected, or is reasonably likely to materially affect, our internal control over financial reporting.
None.
| 34 |
ITEM 10 – DIRECTORS, AND EXECUTIVE OFFICERS, AND CORPORATE GOVERNANCE
Information required by Item 10 is incorporated by reference from the sections entitled “Board Matters and Corporate Governance,” “Election of Directors,” “Executive Compensation and Other Information,” and “Security Ownership of Certain Beneficial Owners and Management” in our definitive proxy statement on Schedule 14A to be distributed in connection with our 2017 Annual Shareholders’ Meeting (the “Proxy Statement”).
There have been no material changes to the procedures by which security holders may recommend nominees to our board of directors since we last described such procedures.
We adopted a Corporate Code of Ethics which is posted on our website: www.simulations-plus.com.
ITEM 11 – EXECUTIVE COMPENSATION
The information required by Item 11 is incorporated by reference from the sections entitled “Executive Compensation and Other Information” and “Board Matters and Corporate Governance” in the Proxy Statement.
ITEM 12 - SECURITY OWNERSHIP OF CERTAIN BENEFICIAL OWNERS AND MANAGEMENT AND RELATED STOCKHOLDER MATTERS
The information required by Item 12 is incorporated by reference from the sections entitled “Security Ownership of Certain Beneficial Owners and Management” and “Executive Compensation and Other Information” in the Proxy Statement.
ITEM 13 – CERTAIN RELATIONSHIPS AND RELATED TRANSACTIONS, AND DIRECTOR INDEPENDENCE
The information required by Item 13 is incorporated by reference from the subsection entitled “Certain Relationships and Related Transactions; Transactions with Related Persons” and the section entitled “Board Matters and Corporate Governance” in the Proxy Statement.
ITEM 14 – PRINCIPAL ACCOUNTING FEES AND SERVICES
The information required by Item 14 is incorporated by reference from the section of the proposal entitled “Ratification of Selection of Independent Registered Public Accounting Firm” in the Proxy Statement.
| 35 |
ITEM 15 – EXHIBITS, FINANCIAL STATEMENT SCHEDULES
(a)
(1) Financial Statements. The consolidated financial statements are included in this Annual Report on Form 10-K beginning on page F-1.
(2) Financial Statement Schedules. All financial statement schedules have been omitted since the information is either not applicable or required or was included in the financial statements or notes included in this Annual Report on Form 10-K.
(3) List of Exhibits required by Item 601 of Regulation S-K. See part (b) below.
(b) Exhibits. The following exhibits are filed or furnished with this report. Those exhibits marked with a (†) refer to management contracts or compensatory plans or arrangements.
| 36 |
__________________________
| ^ | Schedules and exhibits omitted pursuant to Item 601(b)(2) of Registration S-K. The registrant agrees to furnish supplementally a copy of any omitted schedule to the SEC upon request. |
| * | Filed herewith. |
| ** | The XBRL related information in Exhibit 101 shall not be deemed filed for purposes of Section 18 of the Securities Exchange Act of 1934, as amended, or otherwise subject to liability of that section and shall not be incorporated by reference into any filing or other document pursuant to the Securities Act of 1933, as amended, except as shall be expressly set forth by specific reference in such filing or document. |
| (1) | Incorporated by reference to the Company’s Registration Statement on Form SB-2 (Registration No. 333-6680) filed on March 25, 1997. |
| (2) | Incorporated by reference to an exhibit to the Company’s Form 10-K for the fiscal year ended August 31, 2010. |
| (3) | Incorporated by reference to an exhibit to the Company’s Form 10-Q filed April 9, 2014. |
| (4) | Incorporated by reference to an exhibit to the Company’s Form 8-K/A filed November 18, 2014. |
| (5) | Incorporated by reference to an exhibit to the Company’s Form 8-K filed August 11, 2016. |
| (6) | Incorporated by reference to an exhibit to the Company’s Form 8-K filed August 10, 2016. |
| (7) | Incorporated by reference to an exhibit to the Company’s Form 10-Q filed July 10, 2017. |
| (8) | Incorporated by reference to Appendix A to the Company’s Schedule 14A filed December 29. 2016. |
| (9) | Incorporated by reference to an exhibit to the Company’s Form 8-K filed September 6, 2017. |
| (10) | Incorporated by reference to an exhibit to the Company’s Form 10-K for the fiscal year ended August 31, 2016. |
(c) Financial Statement Schedule.
See Item 15(a)(2) above.
| 38 |
Pursuant to the requirements of Section 13 or 15(d) of the Securities Exchange Act of 1934, the registrant has duly caused this report to be signed on its behalf by the undersigned, thereunto duly authorized.
November 14, 2017
| SIMULATIONS PLUS, INC. | ||
| By: | /s/ John R. Kneisel | |
| John R. Kneisel Chief Financial Officer | ||
Pursuant to the requirements of the Securities Exchange Act of 1934, this report has been signed below by the following persons on behalf of the registrant and in the capacities and on the dates indicated.
| Signature | Title | ||
|
/s/ Walter S. Woltosz |
Chairman of the Board of Directors and Chief Executive Officer | ||
| Walter S. Woltosz | (Principal executive officer) | ||
| November 14, 2017 | |||
| /s/ Dr. Thaddeus H. Grasela | Director | ||
|
Thaddeus H. Grasela |
|||
| November 14, 2017 | |||
|
/s/ Dr. Daniel Weiner |
Director | ||
| Dr. Daniel Weiner | |||
| November 14, 2017 | |||
|
/s/ Dr. David L. Ralph |
Director | ||
| Dr. David L. Ralph | |||
| November 14, 2017 | |||
|
/s/ Dr. John K. Paglia |
Director | ||
| John K. Paglia | |||
| November 14, 2017 | |||
|
/s/ John R. Kneisel |
Chief Financial Officer of the Company (Principal financial | ||
| John R. Kneisel | officer and principal accounting officer) | ||
| November 14, 2017 | |||
| 39 |
SIMULATIONS PLUS, INC. & SUBSIDIARY
CONTENTS
August 31, 2017, 2016 and 2015
| Page | |
| REPORT OF INDEPENDENT REGISTERED PUBLIC ACCOUNTING FIRM | F-2 |
| FINANCIAL STATEMENTS | |
| Consolidated Balance Sheets | F-4 |
| Consolidated Statements of Operations | F-5 |
| Consolidated Statements of Shareholders’ Equity | F-6 |
| Consolidated Statements of Cash Flows | F-7 |
| Notes to Consolidated Financial Statements | F-8 – F-27 |
| F-1 |
REPORT OF INDEPENDENT REGISTERED PUBLIC ACCOUNTING FIRM
To the Board
of Directors and Stockholders of
Simulations Plus, Inc. and Subsidiaries
We have audited the accompanying consolidated balance sheets of Simulations Plus, Inc. (a California Corporation) and subsidiaries (the “Company”) as of August 31, 2017 and 2016, and the related consolidated statements of operations, shareholders’ equity, and cash flows for each of the three years in the period ended August 31, 2017. The Company’s management is responsible for these consolidated financial statements. Our responsibility is to express an opinion on these financial statements based on our audits.
We conducted our audits in accordance with the standards of the Public Company Accounting Oversight Board (United States). Those standards require that we plan and perform the audit to obtain reasonable assurance about whether the financial statements are free of material misstatement. An audit includes examining, on a test basis, evidence supporting the amounts and disclosures in the financial statements. An audit also includes assessing the accounting principles used and significant estimates made by management, as well as evaluating the overall financial statement presentation. We believe that our audits provide a reasonable basis for our opinion.
In our opinion, the consolidated financial statements referred to above present fairly, in all material respects, the financial position of Simulations Plus, Inc. and subsidiaries as of August 31, 2017, and 2016, and the results of their operations and their cash flows for each of the three years in the period ended August 31, 2017, in conformity with accounting principles generally accepted in the United States of America.
We also have audited, in accordance with the standards of the Public Company Accounting Oversight Board (United States), Simulations Plus, Inc. and subsidiaries’ internal control over financial reporting as of August 31, 2017, based on criteria established in Internal Control—Integrated Framework issued by the Committee of Sponsoring Organizations of the Treadway Commission (2013 framework), and our report dated November 14, 2017, expressed an unqualified opinion.
/s/ Rose, Snyder & Jacobs LLP
Rose, Snyder & Jacobs LLP
Encino, California
November 14, 2017
| F-2 |
REPORT OF INDEPENDENT REGISTERED PUBLIC ACCOUNTING FIRM
To the Board of Directors and Stockholders of
Simulations Plus, Inc.
We have audited Simulations Plus, Inc. and Subsidiaries’ internal control over financial reporting as of August 31, 2017, based on criteria established in Internal Control—Integrated Framework issued by the Committee of Sponsoring Organizations of the Treadway Commission (2013 framework) (“the COSO Criteria”). As described in Management’s Report on Internal Control over Financial Reporting, management excluded from its assessment the internal control over financial reporting at DILIsym Services, Inc. (“DILI”), which was acquired on June 1, 2017 and whose financial statements constitute 35.8% and 5.1% of the Company’s consolidated total assets and consolidated net sales, respectively, as of and for the fiscal year ended August 31, 2017. Accordingly, our audit did not include the internal control over financial reporting at DILI. Simulations Plus, Inc. and Subsidiaries’ management is responsible for maintaining effective internal control over financial reporting and for its assessment of the effectiveness of internal control over financial reporting included in the accompanying Management’s Report on Internal Control Over Financial Reporting. Our responsibility is to express an opinion on the company’s internal control over financial reporting based on our audit.
We conducted our audit in accordance with the standards of the Public Company Accounting Oversight Board (United States). Those standards require that we plan and perform the audit to obtain reasonable assurance about whether effective internal control over financial reporting was maintained in all material respects. Our audit of internal control over financial reporting included obtaining an understanding of internal control over financial reporting, assessing the risk that a material weakness exists, and testing and evaluating the design and operating effectiveness of internal control based on the assessed risk. Our audit also included performing such other procedures as we considered necessary in the circumstances. We believe that our audit provides a reasonable basis for our opinion.
A company’s internal control over financial reporting is a process designed to provide reasonable assurance regarding the reliability of financial reporting and the preparation of financial statements for external purposes in accordance with generally accepted accounting principles. A company’s internal control over financial reporting includes those policies and procedures that (1) pertain to the maintenance of records that, in reasonable detail, accurately and fairly reflect the transactions and dispositions of the assets of the company; (2) provide reasonable assurance that transactions are recorded as necessary to permit preparation of financial statements in accordance with generally accepted accounting principles, and that receipts and expenditures of the company are being made only in accordance with authorizations of management and directors of the company; and (3) provide reasonable assurance regarding prevention or timely detection of unauthorized acquisition, use, or disposition of the company’s assets that could have a material effect on the financial statements.
Because of its inherent limitations, internal control over financial reporting may not prevent or detect misstatements. Also, projections of any evaluation of effectiveness to future periods are subject to the risk that controls may become inadequate because of changes in conditions, or that the degree of compliance with the policies or procedures may deteriorate.
In our opinion, Simulations Plus, Inc. and Subsidiaries’ maintained, in all material respects, effective internal control over financial reporting as of August 31, 2017, based on criteria established in Internal Control—Integrated Framework issued by the Committee of Sponsoring Organizations of the Treadway Commission (2013 framework).
We have also audited, in accordance with the standards of the Public Company Accounting Oversight Board (United States), the consolidated financial statements of Simulations Plus, Inc. and Subsidiaries as of August 31, 2017 and 2016 and for the three years in the period ended August 31, 2017, and our report dated November 14, 2017 expressed an unqualified opinion.
/s/ Rose, Snyder & Jacobs LLP
Rose, Snyder & Jacobs LLP
Encino, California
November 14, 2017
| F-3 |
SIMULATIONS PLUS, INC.
As of August 31
| ASSETS | ||||||||
| 2017 | 2016 | |||||||
| Current assets | ||||||||
| Cash and cash equivalents | $ | 6,215,718 | $ | 8,030,284 | ||||
| Accounts receivable, net of allowance for doubtful accounts of $0 | 4,048,725 | 3,009,517 | ||||||
| Revenues in excess of billings | 1,481,082 | 694,131 | ||||||
| Prepaid income taxes | 462,443 | 555,486 | ||||||
| Prepaid expenses and other current assets | 459,902 | 410,811 | ||||||
| Total current assets | 12,667,870 | 12,700,229 | ||||||
| Long-term assets | ||||||||
| Capitalized computer software development costs, net of accumulated amortization of $9,795,469 and $8,613,487 | 4,307,600 | 4,013,127 | ||||||
| Property and equipment, net (note 4) | 291,135 | 256,381 | ||||||
| Intellectual property, net of accumulated amortization of $2,095,417 and $1,408,750 | 6,829,583 | 4,666,250 | ||||||
| Other intangible assets net of accumulated amortization of $495,000 and $295,000 | 3,995,000 | 1,355,000 | ||||||
| Goodwill | 10,387,198 | 4,789,248 | ||||||
| Other assets | 34,082 | 34,082 | ||||||
| Total assets | $ | 38,512,468 | $ | 27,814,317 | ||||
| LIABILITIES AND SHAREHOLDERS' EQUITY | ||||||||
| Current liabilities | ||||||||
| Accounts payable | $ | 240,892 | $ | 108,111 | ||||
| Accrued payroll and other expenses | 983,293 | 602,610 | ||||||
| Other current liabilities | – | 8,274 | ||||||
| Current portion - Contracts payable (note 5) | 247,328 | 1,000,000 | ||||||
| Billings in excess of revenues | 216,958 | 230,100 | ||||||
| Deferred revenue | 353,962 | 176,422 | ||||||
| Total current liabilities | 2,042,433 | 2,125,517 | ||||||
| Long-term liabilities | ||||||||
| Deferred income taxes, net | 4,926,960 | 2,956,206 | ||||||
| Payments due under Contracts payable (note 5) | 5,738,188 | – | ||||||
| Total liabilities | 12,707,581 | 5,081,723 | ||||||
| Commitments and contingencies (note 6) | ||||||||
| Shareholders' equity (note 7) | ||||||||
| Preferred stock, $0.001 par value 10,000,000 shares authorized no shares issued and outstanding | $ | – | $ | – | ||||
| Common stock, $0.001 par value 50,000,000 shares authorized 17,277,604 and 17,225,478 shares issued and outstanding | 7,278 | 7,227 | ||||||
| Additional paid-in capital | 12,109,141 | 11,376,007 | ||||||
| Retained earnings | 13,688,468 | 11,349,360 | ||||||
| Total shareholders' equity | $ | 25,804,887 | $ | 22,732,594 | ||||
| $ | – | – | ||||||
| Total liabilities and shareholders' equity | $ | 38,512,468 | $ | 27,814,317 | ||||
The accompanying notes are an integral part of these financial statements.
| F-4 |
SIMULATIONS
PLUS, INC.
CONSOLIDATED STATEMENTS OF OPERATIONS
For the years ended August 31,
| 2017 | 2016 | 2015 | ||||||||||
| Net Revenues | $ | 24,137,913 | $ | 19,972,079 | $ | 18,314,248 | ||||||
| Cost of revenues | 6,307,800 | 4,601,513 | 4,392,477 | |||||||||
| Gross margin | 17,830,113 | 15,370,566 | 13,921,771 | |||||||||
| Operating expenses | ||||||||||||
| Selling, general, and administrative | 8,198,184 | 6,693,691 | 6,736,767 | |||||||||
| Research and development | 1,367,645 | 1,445,069 | 1,328,476 | |||||||||
| Total operating expenses | 9,565,829 | 8,138,760 | 8,065,243 | |||||||||
| Income from operations | 8,264,284 | 7,231,806 | 5,856,528 | |||||||||
| Other income (expense) | ||||||||||||
| Interest income | 15,857 | 18,014 | 17,935 | |||||||||
| Interest expense | (38,188 | ) | – | – | ||||||||
| Gain(loss) on currency exchange | (1,686 | ) | (13,428 | ) | (181,534 | ) | ||||||
| Total other income (expense) | (24,017 | ) | 4,586 | (163,599 | ) | |||||||
| Income before provision for income taxes | 8,240,267 | 7,236,392 | 5,692,929 | |||||||||
| Provision for income taxes | (2,452,670 | ) | (2,286,256 | ) | (1,849,968 | ) | ||||||
| Net Income | $ | 5,787,597 | $ | 4,950,136 | $ | 3,842,961 | ||||||
| Earnings per share | ||||||||||||
| Basic | $ | 0.34 | $ | 0.29 | $ | 0.23 | ||||||
| Diluted | $ | 0.33 | $ | 0.29 | $ | 0.23 | ||||||
| Weighted-average common shares outstanding | ||||||||||||
| Basic | 17,239,490 | 17,028,566 | 16,864,670 | |||||||||
| Diluted | 17,515,917 | 17,209,506 | 17,032,158 | |||||||||
The accompanying notes are an integral part of these financial statements.
| F-5 |
SIMULATIONS
PLUS, INC.
STATEMENTS OF SHAREHOLDERS' EQUITY
For the years ended August 31, 2017, 2016 and 2015
| Additional | ||||||||||||||||||||
| Common Stock | Paid-In | Retained | ||||||||||||||||||
| Shares | Amount | Capital | Earnings | Total | ||||||||||||||||
| Balance, August 31, 2014 | 16,349,955 | $ | 4,821 | $ | 6,085,427 | $ | 9,345,103 | $ | 15,435,351 | |||||||||||
| Exercise of stock options | 101,887 | 102 | 56,941 | 57,043 | ||||||||||||||||
| Stock-based Compensation | 295,243 | 295,243 | ||||||||||||||||||
| Issuance of stock-Cognigen Acquisition | 491,159 | 491 | 3,276,679 | 3,277,170 | ||||||||||||||||
| Declaration of Dividend | (3,375,566 | ) | (3,375,566 | ) | ||||||||||||||||
| Net income | 3,842,961 | 3,842,961 | ||||||||||||||||||
| Balance, August 31, 2015 | 16,943,001 | $ | 5,414 | $ | 9,714,290 | $ | 9,812,498 | $ | 19,532,202 | |||||||||||
| Exercise of stock options | 112,463 | 113 | 181,936 | 182,049 | ||||||||||||||||
| Stock-based Compensation | 347,077 | 347,077 | ||||||||||||||||||
| Issuance of stock-Cognigen Acquisition | 170,014 | 1,700 | 1,132,704 | 1,134,404 | ||||||||||||||||
| Declaration of Dividend | (3,413,274 | ) | (3,413,274 | ) | ||||||||||||||||
| Net income | 4,950,136 | 4,950,136 | ||||||||||||||||||
| Balance, August 31, 2016 | 17,225,478 | $ | 7,227 | $ | 11,376,007 | $ | 11,349,360 | $ | 22,732,594 | |||||||||||
| Exercise of stock options | 49,642 | 49 | 111,355 | 111,404 | ||||||||||||||||
| Stock-based Compensation | 585,018 | 585,018 | ||||||||||||||||||
| Shares issued to Directors for services | 2,484 | 2 | 36,761 | 36,763 | ||||||||||||||||
| Declaration of Dividend | (3,448,489 | ) | (3,448,489 | ) | ||||||||||||||||
| Net income | 5,787,597 | 5,787,597 | ||||||||||||||||||
| Balance, August 31, 2017 | 17,277,604 | $ | 7,278 | $ | 12,109,141 | $ | 13,688,468 | $ | 25,804,887 | |||||||||||
The accompanying notes are an integral part of these financial statements.
| F-6 |
SIMULATIONS
PLUS, INC.
CONSOLIDATED STATEMENTS OF CASH FLOWS
For the years ended August 31, 2017, 2016 and 2015
| 2017 | 2016 | 2015 | ||||||||||
| Cash flows from operating activities | ||||||||||||
| Net income | $ | 5,787,597 | $ | 4,950,136 | $ | 3,842,961 | ||||||
| Adjustments to reconcile net income to net cash provided by operating activities | ||||||||||||
| Depreciation and amortization of property and equipment | 151,444 | 196,250 | 211,454 | |||||||||
| Amortization of capitalized computer software development costs | 1,096,967 | 981,066 | 1,023,139 | |||||||||
| Amortization of Intellectual Property | 886,667 | 755,000 | 755,000 | |||||||||
| Change in value of contingent consideration | 38,188 | – | – | |||||||||
| Stock-based compensation | 585,018 | 347,077 | 295,243 | |||||||||
| Shares issued to directors for services | 36,763 | – | – | |||||||||
| Deferred income taxes | (178,374 | ) | (23,241 | ) | 55,919 | |||||||
| (Increase) decrease in | ||||||||||||
| Accounts receivable | (876,231 | ) | (1,415,810 | ) | 1,048,969 | |||||||
| Revenues in excess of billings | (634,409 | ) | 100,994 | (238,502 | ) | |||||||
| Prepaid income taxes | 93,043 | (555,486 | ) | 748,359 | ||||||||
| Prepaid expenses and other assets | 40,528 | (29,093 | ) | (104,836 | ) | |||||||
| Increase (decrease) in | ||||||||||||
| Accounts payable | 99,337 | (101,296 | ) | 19,443 | ||||||||
| Accrued payroll and other expenses | 283,831 | 52,030 | (353,567 | ) | ||||||||
| Billings in excess of revenues | (118,061 | ) | 123,566 | (239,906 | ) | |||||||
| Accrued income taxes | (153,713 | ) | (43,602 | ) | 43,602 | |||||||
| Other liabilities | (8,274 | ) | (19,859 | ) | (19,860 | ) | ||||||
| Deferred revenue | (252,582 | ) | 97,477 | 48,573 | ||||||||
| Net cash provided by operating activities | 6,877,739 | 5,415,209 | 7,135,991 | |||||||||
| Cash flows used in investing activities | ||||||||||||
| Purchases of property and equipment | (175,961 | ) | (39,121 | ) | (71,369 | ) | ||||||
| Cash used to acquire subsidiaries | (4,515,982 | ) | (720,000 | ) | (2,080,000 | ) | ||||||
| Cash received in acquisition | 1,720,434 | – | 190,184 | |||||||||
| Capitalized computer software development costs | (1,383,711 | ) | (1,195,854 | ) | (1,168,937 | ) | ||||||
| Net cash used in investing activities | (4,355,220 | ) | (1,954,975 | ) | (3,130,122 | ) | ||||||
| Cash flows used in financing activities | ||||||||||||
| Payment of dividends | (3,448,489 | ) | (3,413,274 | ) | (3,375,566 | ) | ||||||
| Payments on Contracts Payable | (1,000,000 | ) | (750,000 | ) | (750,000 | ) | ||||||
| Proceeds from the exercise of stock options | 111,404 | 182,049 | 57,043 | |||||||||
| Net cash used in financing activities | (4,337,085 | ) | (3,981,225 | ) | (4,068,523 | ) | ||||||
| Net increase (decrease) in cash and cash equivalents | (1,814,566 | ) | (520,991 | ) | (62,654 | ) | ||||||
| Cash and cash equivalents, beginning of year | 8,030,284 | 8,551,275 | 8,614,929 | |||||||||
| Cash and cash equivalents, end of period | $ | 6,215,718 | $ | 8,030,284 | $ | 8,552,275 | ||||||
| Supplemental disclosures of cash flow information | ||||||||||||
| Income taxes paid | $ | 2,687,921 | $ | 2,908,587 | $ | 961,907 | ||||||
| Non-Cash Investing and Financing Activities | ||||||||||||
| Stock issued for acquisition of Cognigen Corporation | $ | – | $ | 1,134,404 | $ | 3,277,170 | ||||||
| Creation of contract liabilities for acquisition of subsidiaries | $ | 5,738,188 | $ | – | $ | 1,854,404 | ||||||
The accompanying notes are an integral part of these financial statements.
| F-7 |
NOTE 1 - ORGANIZATION AND LINES OF BUSINESS
Organization
Simulations Plus, Inc. (the “Company”, “we”, “us”, “our”) was incorporated on July 17, 1996. On September 2, 2014, Simulations Plus, Inc. acquired all outstanding equity interests of Cognigen Corporation (“Cognigen”) pursuant to the terms of the Merger Agreement and Cognigen became a wholly owned subsidiary of Simulations Plus, Inc. "). On June 1, 2017, Simulation Plus acquired all outstanding equity interest of DILIsym Services, Inc. (“DILIsym”) pursuant to a stock purchase agreement and DILIsym became a wholly owned subsidiary of Simulations Plus, Inc. Simulation Plus, Cognigen, and DILIsym collectively, the "Company”
Lines of Business
The Company designs and develops pharmaceutical simulation software to promote cost-effective solutions to a number of problems in pharmaceutical research and in the education of pharmacy and medical students, and it provides consulting services to the pharmaceutical and chemical industries. Recently, the Company has begun to explore developing software applications for defense and for health care outside of the pharmaceutical industry.
NOTE 2 - SUMMARY OF SIGNIFICANT ACCOUNTING POLICIES
Principles of Consolidation
The consolidated financial statements include the accounts of Simulations Plus, Inc. and, as of September 2, 2014, its wholly owned subsidiary, Cognigen Corporation, and as of June 1, 2017 the accounts of DILIsym Services, Inc. All significant intercompany accounts and transactions are eliminated in consolidation.
Use of Estimates
Our financial statements and accompanying notes are prepared in accordance with accounting principles generally accepted in the United States of America. Preparing financial statements requires management to make estimates and assumptions that affect the reported amounts of assets, liabilities, revenue, and expenses. These estimates and assumptions are affected by management’s application of accounting policies. Actual results could differ from those estimates. Significant accounting policies for us include revenue recognition, accounting for capitalized computer software development costs, valuation of stock options, and accounting for income taxes.
Reclassifications
Certain numbers in the prior year have been reclassified to conform to the current year's presentation.
Revenue Recognition
We recognize revenues related to software licenses and software maintenance in accordance with the FASB Accounting Standards Codification (“ASC”) 985-605, “Software – Revenue Recognition”. Software product revenue is recorded when the following conditions are met: 1) evidence of arrangement exists; 2) delivery has been made; 3) the amount is fixed; and 4) collectability is probable. Post-contract customer support (“PCS”) obligations are insignificant; therefore, revenue for PCS is recognized at the same time as the licensing fee, and the costs of providing such support services are accrued and amortized over the obligation period.
As a byproduct of ongoing improvements and upgrades for the new programs and new modules of software, some modifications are provided to our customers who have already purchased software at no additional charge. Other software modifications result in new, additional cost modules that expand the functionality of the software. These are licensed separately. We consider the modifications that are provided without charge to be minimal, as they do not significantly change the basic functionality or utility of the software, but rather add convenience, such as being able to plot some additional variable on a graph in addition to the numerous variables that had been available before, or adding some additional calculations to supplement the information provided from running the software. Such software modifications for any single product have typically occurred once or twice per year, sometimes more, sometimes less. Thus, they are infrequent. The Company provides, for a fee, additional training and service calls to its customers and recognizes revenue at the time the training or service call is provided.
Generally, we enter into one-year license agreements with customers for the use of our pharmaceutical software products. We recognize revenue on these contracts when all the criteria are met. Most license agreements have a term of one year; however, from time to time, we enter into multi-year license agreements. We generally unlock and invoice software one year at a time for multi-year licenses. Therefore, revenue is recognized one year at a time. Certain of the Company's software products are housed and supported on the Company's computer networks. Software revenues for those products are included in income over the life of the contract.
| F-8 |
We recognize revenue on sales of our DILIsym Subsidiary in accordance with ASC 605-25, “Revenue Recognition, Multiple-Element Arrangements”. Our multiple-deliverable arrangements consist of consulting arrangements, at our DILIsym Subsidiary. We determined all elements to be separate units of accounting as they have standalone value to the customers. We allocate the revenue derived from these arrangements among all the deliverables. We base such allocation on the relative selling price of each deliverable. We recognize the allocated revenue for each deliverable when persuasive evidence of an arrangement exists, delivery has occurred or services have been rendered, the price is fixed and determinable and collectability is reasonably assured.
We recognize revenue from collaboration research, revenue from grants and consortium memberships over their terms. For contract revenues based on actual hours incurred we recognize revenues when the work is performed. For fixed price contracts, we recognize contract study and other contract revenues using the percentage-of-completion method, depending upon how the contract studies are engaged, in accordance with ASC 605-35, “Revenue Recognition – Construction-Type and Production-Type Contracts”. To recognize revenue using the percentage-of-completion method, we must determine whether we meet the following criteria: 1) there is a long-term, legally enforceable contract, 2) it is possible to reasonably estimate the total project costs, and 3) it is possible to reasonably estimate the extent of progress toward completion.
Cash and Cash Equivalents
For purposes of the statements of cash flows, the Company considers all highly liquid investments purchased with original maturities of three months or less to be cash equivalents.
Accounts Receivable
We analyze the age of customer balances, historical bad debt experience, customer creditworthiness, and changes in customer payment terms when making estimates of the collectability of the Company’s trade accounts receivable balances. If we determine that the financial conditions of any of our customers have deteriorated, whether due to customer-specific or general economic issues, an increase in the allowance may be made. Accounts receivable are written off when all collection attempts have failed.
Capitalized Computer Software Development Costs
Software development costs are capitalized in accordance with ASC 985-20, “Costs of Software to Be Sold, Leased, or Marketed”. Capitalization of software development costs begins upon the establishment of technological feasibility and is discontinued when the product is available for sale.
The establishment of technological feasibility and the ongoing assessment for recoverability of capitalized software development costs require considerable judgment by management with respect to certain external factors including, but not limited to, technological feasibility, anticipated future gross revenues, estimated economic life, and changes in software and hardware technologies. Capitalized computer software development costs are comprised primarily of salaries and direct payroll-related costs and the purchase of existing software to be used in the Company's software products.
Amortization of capitalized computer software development costs is provided on a product-by-product basis on the straight-line method over the estimated economic life of the products not to exceed five years. Amortization of software development costs amounted to $1,096,967, $981,066, and $1,023,139 for the years ended August 31, 2017, 2016, and 2015, respectively. We expect future amortization expense to vary due to increases in capitalized computer software development costs.
We test capitalized computer software development costs for recoverability whenever events or changes in circumstances indicate that the carrying amount may not be recoverable.
Property and Equipment
Property and equipment are recorded at cost, or fair market value for property and equipment acquired in business combinations, less accumulated depreciation and amortization. Depreciation and amortization are provided using the straight-line method over the estimated useful lives as follows:
| Equipment | 5 years |
| Computer equipment | 3 to 7 years |
| Furniture and fixtures | 5 to 7 years |
| Leasehold improvements | Shorter of life of asset or lease |
Maintenance and minor replacements are charged to expense as incurred. Gains and losses on disposals are included in the results of operations.
| F-9 |
Intangible Assets and Goodwill
The Company performs valuations of assets acquired and liabilities assumed on each acquisition accounted for as a business combination and recognizes the assets acquired and liabilities assumed at their acquisition date fair value. Acquired intangible assets include customer relationships, software, trade name, and non-compete agreements. The Company determines the appropriate useful life by performing an analysis of expected cash flows based on historical experience of the acquired businesses. Intangible assets are amortized over their estimated useful lives using the straight-line method, which approximates the pattern in which the majority of the economic benefits are expected to be consumed.
Goodwill represents the excess of the cost of an acquired entity over the fair value of the acquired net assets. Goodwill is not amortized, instead it is tested for impairment annually or when events or circumstances change that would indicate that goodwill might be impaired. Events or circumstances that could trigger an impairment review include, but are not limited to, a significant adverse change in legal factors or in the business climate, an adverse action or assessment by a regulator, unanticipated competition, a loss of key personnel, significant changes in the manner of the Company's use of the acquired assets or the strategy for the Company's overall business, significant negative industry or economic trends or significant under-performance relative to expected historical or projected future results of operations.
Goodwill is tested for impairment at the reporting unit level, which is one level below or the same as an operating segment. As of August 31, 2017, the Company determined that it has three reporting units, Simulations Plus, Cognigen Corporation and DILIsym Services, Inc. When testing goodwill for impairment, the Company first performs a qualitative assessment to determine whether it is necessary to perform step one of a two-step annual goodwill impairment test for each reporting unit. The Company is required to perform step one only if it concludes that it is more likely than not that a reporting unit's fair value is less than its carrying value. Should this be the case, the first step of the two-step process is to identify whether a potential impairment exists by comparing the estimated fair values of the Company's reporting units with their respective book values, including goodwill. If the estimated fair value of the reporting unit exceeds book value, goodwill is considered not to be impaired, and no additional steps are necessary. If, however, the fair value of the reporting unit is less than book value, then the second step is performed to determine if goodwill is impaired and to measure the amount of impairment loss, if any. The amount of the impairment loss is the excess of the carrying amount of the goodwill over its implied fair value. The estimate of implied fair value of goodwill is primarily based on an estimate of the discounted cash flows expected to result from that reporting unit, but may require valuations of certain internally generated and unrecognized intangible assets such as the Company's software, technology, patents and trademarks. If the carrying amount of goodwill exceeds the implied fair value of that goodwill, an impairment loss is recognized in an amount equal to the excess.
As of August 31, 2017, the entire balance of goodwill was attributed to two of the Company's reporting units, Cognigen Corporation and DILIsym Services. Intangible assets subject to amortization are reviewed for impairment whenever events or circumstances indicate that the carrying amount of these assets may not be recoverable. The Company has not recognized any impairment charges during the periods ended August 31, 2017, 2016 and 2015.
| F-10 |
Reconciliation of Goodwill for the period ended August 31, 2017:
| Cognigen | DILIsym | Total | ||||||||||
| Balance, August 31, 2014 | – | – | – | |||||||||
| Addition | 4,789,248 | – | 4,789,248 | |||||||||
| Impairments | – | – | – | |||||||||
| Balance, August 31, 2015 | 4,789,248 | – | 4,789,248 | |||||||||
| Addition | – | – | – | |||||||||
| Impairments | – | – | – | |||||||||
| Balance, August 31, 2016 | 4,789,248 | – | 4,789,248 | |||||||||
| Addition | – | 5,597,950 | 5,597,950 | |||||||||
| Impairments | – | – | – | |||||||||
| Balance, August 31, 2017 | 4,789,248 | 5,597,950 | 10,387,198 | |||||||||
Other Intangible Assets
The following table summarizes other intangible assets as of August 31, 2017:
| Amortization Period | Acquisition Value | Accumulated Amortization | Net book value | |||||||||||
| Customer relationships-Cognigen | Straight line 8 years | $ | 1,100,000 | $ | 412,500 | $ | 687,500 | |||||||
| Trade Name-Cognigen | None | 500,000 | 0 | 500,000 | ||||||||||
| Covenants not to compete-Cognigen | Straight line 5 years | 50,000 | 30,000 | 20,000 | ||||||||||
| Covenants not to compete-DILIsym | Straight line 4 years | 80,000 | 5,000 | 75,000 | ||||||||||
| Trade Name-DILIsym | None | 860,000 | 0 | 850,000 | ||||||||||
| Customer relationships-DILIsym | Straight line 8 years | 1,900,000 | 47,500 | 1,852,000 | ||||||||||
| $ | 4,490,000 | $ | 495,000 | $ | 3,995,000 | |||||||||
Amortization expense for the year ended August 31, 2017, 2016 and 2015 was $200,000, $147,500, and $147,500.
Future amortization for the next five years is as follows:
|
Year ending August 31, |
Amount |
| 2018 | 405,000 |
| 2019 | 405,000 |
| 2020 | 395,000 |
| 2021 | 390,000 |
| 2022 | 375,000 |
| F-11 |
Business Acquisitions
The Company accounted for the acquisition of Cognigen and DILIsym Services, Inc., using the purchase method of accounting where the assets acquired and liabilities assumed are recognized based on their respective estimated fair values. The excess of the purchase price over the estimated fair values of the net assets acquired is recorded as goodwill. Determining the fair value of certain acquired assets and liabilities is subjective in nature and often involves the use of significant estimates and assumptions, including, but not limited to, the selection of appropriate valuation methodology, projected revenue, expenses and cash flows, weighted average cost of capital, discount rates, estimates of advertiser and publisher turnover rates and estimates of terminal values. Business acquisitions are included in the Company's consolidated financial statements as of the date of the acquisition.
Fair Value of Financial Instruments
Financial assets and liabilities recorded at fair value in the Company’s Balance Sheet are categorized based upon the level of judgment associated with the inputs used to measure their fair value. The categories, as defined by the standard, are as follows:
| Level Input: | Input Definition: | |
| Level I | Inputs are unadjusted, quoted prices for identical assets or liabilities in active markets at the measurement date. | |
| Level II | Inputs, other than quoted prices included in Level I, that are observable for the asset or liability through corroboration with market data at the measurement date. | |
| Level III | Unobservable inputs that reflect management’s best estimate of what market participants would use in pricing the asset or liability at the measurement date. |
For certain of our financial instruments, including accounts receivable, accounts payable, accrued payroll and other expenses, and accrued bonuses to officers the carrying amounts are approximate fair value due to their short-term nature.
The following table summarizes fair value measurements at August 31, 2017 and August 31, 2016 for assets and liabilities measured at fair value on a recurring basis:
August 31, 2017:
| Level 1 | Level 2 | Level 3 | Total | |||||||||||||
| Cash and cash equivalents | $ | 6,215,718 | $ | – | $ | – | $ | 6,215,718 | ||||||||
| Acquisition-related contingent consideration obligations | $ | – | $ | – | $ | 4,738,188 | $ | 4,738,188 | ||||||||
August 31, 2016:
| Level 1 | Level 2 | Level 3 | Total | |||||||||||||
| Cash and cash equivalents | $ | 8,030,284 | $ | – | $ | – | $ | 8,030,284 | ||||||||
| F-12 |
As of August 31, 2017, the Company has a liability for contingent consideration related to its acquisition of the DILIsym Services, Inc. The fair value measurement of the contingent consideration obligations is determined using Level 3 inputs. The fair value of contingent consideration obligations is based on a discounted cash flow model using a probability-weighted income approach. These fair value measurements represent Level 3 measurements as they are based on significant inputs not observable in the market. Significant judgment is employed in determining the appropriateness of these assumptions as of the acquisition date and for each subsequent period. Accordingly, changes in assumptions could have a material impact on the amount of contingent consideration expense the Company records in any given period. Changes in the value of the contingent consideration obligations are recorded in the Company’s Consolidated Statement of Operations.
The following is a reconciliation of contingent consideration value.
| Value at August 31, 2016 | $ | 0 | ||
| Purchase price contingent consideration | 4,700,000 | |||
| Contingent consideration payments | – | |||
| Change in value of contingent consideration | 38,188 | |||
| Value at August 31, 2017 | $ | 4,738,188 |
Advertising
The Company expenses advertising costs as incurred. Advertising costs for the years ended August 31, 2017, 2016 and 2015 were approximately $58,445, $131,783 and $38,000, respectively.
Research and Development Costs
Research and development costs are charged to expense as incurred until technological feasibility has been established. These costs include salaries, laboratory experiment, and purchased software which was developed by other companies and incorporated into, or used in the development of, our final products.
Income Taxes
The Company accounts for income taxes in accordance with ASC 740-10, “Income Taxes” which requires the recognition of deferred tax assets and liabilities for the expected future tax consequences of events that have been included in the financial statements or tax returns.
Under this method, deferred income taxes are recognized for the tax consequences in future years of differences between the tax bases of assets and liabilities and their financial reporting amounts at each year-end based on enacted tax laws and statutory tax rates applicable to the periods in which the differences are expected to affect taxable income. Valuation allowances are established, when necessary, to reduce deferred tax assets to the amount expected to be realized. The provision for income taxes represents the tax payable for the period and the change during the period in deferred tax assets and liabilities.
| F-13 |
Intellectual property
On February 28, 2012, we bought out the royalty agreement with Enslein Research. The cost of $75,000 is being amortized over 10 years under the straight-line method. Amortization expense for each of the fiscal years ended August 31, 2017, 2016 and 2015 was $7,500. Accumulated amortization as of August 31, 2017 and 2016 was $41,250 and $33,750, respectively.
On May 15, 2014, we entered into a termination and non-assertion agreement with TSRL, Inc., pursuant to which the parties agreed to terminate an exclusive software licensing agreement entered into between the parties in 1997. As a result, the Company obtained a perpetual right to use certain source code and data, and TSRL relinquished any rights and claims to any GastroPlus products and to any claims to royalties or other payments under that 1997 agreement. We agreed to pay TSRL total consideration of $6,000,000, which is being amortized over 10 years under the straight-line method. Amortization for the year ended August 31, 2017, 2016 and 2015 was $600,000. Accumulated amortization as of August 31, 2017 and 2016 was $1,975,000 and $1,375,000, respectively. (See Note 5).
On June 1, 2017, as part of the acquisition of DILIsym Services, Inc. the Company acquired certain developed technologies associated with the drug induced liver disease (DILI). These technologies were valued at $2,850,000 and are being amortized over 9 years under the straight-line method. Amortization expense for the fiscal year ended August 31, 2017 was $79,176 and is included in cost of revenues. Total amortization as of August 31, 2017 was $79,176.
Total amortization expense for intellectual property agreements for the years ended August 31, 2017, 2016 and 2015 was $686,667, $607,500, and $607,500. Accumulated amortization as of August 31, 2017 and 2016 was $2,095,417 and $1,408,750, respectively.
Future amortization for the next five years is as follows:
| Years ending August 31, | TSRL | Enslein | DILI-Acquired Developed Technologies | Total |
| 2018 | $ 600,000 | $ 7,500 | $ 316,667 | $ 924,167 |
| 2019 | $ 600,000 | $ 7,500 | $ 316,667 | $ 924,167 |
| 2020 | $ 600,000 | $ 7,500 | $ 316,667 | $ 924,167 |
| 2021 | $ 600,000 | $ 7,500 | $ 316,667 | $ 924,167 |
| 2022 | $ 600,000 | $ 3,750 | $ 316,667 | $ 920,417 |
Earnings per Share
The Company reports earnings per share in accordance with FASB ACS 260-10. Basic earnings per share is computed by dividing income available to common shareholders by the weighted-average number of common shares available. Diluted earnings per share is computed similarly to basic earnings per share except that the denominator is increased to include the number of additional common shares that would have been outstanding if the potential common shares had been issued and if the additional common shares were dilutive. The components of basic and diluted earnings per share for the years ended August 31, 2017, 2016 and 2015 were as follows:
| 2017 | 2016 | 2015 | ||||||||||
| Numerator | ||||||||||||
| Net income attributable to common shareholders | $ | 5,787,897 | $ | 4,950,136 | $ | 3,842,961 | ||||||
| Denominator | ||||||||||||
| Weighted-average number of common shares outstanding during the year | 17,239,490 | 17,028,566 | 16,864,670 | |||||||||
| Dilutive effect of stock options | 276,427 | 180,940 | 167,488 | |||||||||
| Common stock and common stock equivalents used for diluted earnings per share | 17,515,917 | 17,209,506 | 17,032,158 | |||||||||
| F-14 |
Stock-Based Compensation
The Company accounts for stock options using the modified prospective method in accordance with FASB ASC 718-10, “Compensation-Stock Compensation”. Under this method, compensation costs include estimated grant date fair value of the awards amortized over the options’ vesting period. Stock-based compensation was $585,018, $347,077 and $295,243 for the fiscal years ended August 31, 2017, 2016 and 2015, respectively, and is included in the statements of operations as Consulting, Salaries, and Research and Development expense.
Impairment of Long-lived Assets
The Company accounts for the impairment and disposition of long-lived assets in accordance with ASC 350, “Intangibles – Goodwill and Other” and ASC 360, “Property and Equipment”. Long-lived assets to be held and used are reviewed for events or changes in circumstances that indicate that their carrying value may not be recoverable. We measure recoverability by comparing the carrying amount of an asset to the expected future undiscounted net cash flows generated by the asset. If we determine that the asset may not be recoverable, or if the carrying amount of an asset exceeds its estimated future undiscounted cash flows, we recognize an impairment charge to the extent of the difference between the fair value and the asset's carrying amount. No impairment losses were recorded during the years ended August 31, 2017, 2016 and 2015.
Recently Issued Accounting Standards
In May 2014, the Franchise Accounting Standards Board (FASB) issued Accounting Standards Update (ASU) No. 2014-09, Revenue from Contracts with Customers (ASU 2014-09). The standard will eliminate the transaction- and industry-specific revenue recognition guidance under current generally accepted accounting principles in the U.S. (GAAP) and replace it with a principles-based approach for determining revenue recognition. ASU 2014-09 is effective for annual and interim periods beginning after December 15, 2017. Early adoption is permitted for years beginning after December 15, 2016. The revenue recognition standard is required to be applied retrospectively, including any combination of practical expedients as allowed in the standard. We are evaluating the impact, if any, of the adoption of ASU 2014-09 to our financial statements and related disclosures. The Company has not yet selected a transition method nor has it determined the effect of the standard on its ongoing financial reporting.
In November 2015, the FASB issued ASU No 2015-17, Income Taxes (Topic 740) (“ASU 2015-17). The amendments in ASU 2015-17 change the requirements for the classification of deferred taxes on the balance sheet. Currently, GAAP requires an entity to separate deferred income tax liabilities and assets into current and noncurrent amounts in a classified statement of financial position. To simplify the presentation of deferred income taxes, the amendments in this ASU require that deferred tax liabilities and assets be classified as noncurrent in a classified statement of financial position. The pronouncement is effective for fiscal years and interim periods within those fiscal years beginning after December 15, 2016. Earlier application is permitted for all entities as of the beginning of an interim or annual reporting period. The Company has early adopted this pronouncement for the fiscal reporting period ended August 31, 2017 because it reduced complexity while maintaining the usefulness of the information. The retrospective application resulted in a reclassification of the current deferred tax asset at August 31, 2016 now being presented against the long term deferred tax liability.
In February 2016, the FASB issued ASU 2016-02, Leases (Topic 842), which supersedes existing guidance on accounting for leases in "Leases (Topic 840)" and generally requires all leases to be recognized in the consolidated balance sheet. ASU 2016-02 is effective for annual and interim reporting periods beginning after December 15, 2018; early adoption is permitted. The provisions of ASU 2016-02 are to be applied using a modified retrospective approach. The Company is currently evaluating the impact of the adoption of this standard on its consolidated financial statements.
In March 2016, the FASB issued ASU 2016-09, Improvements to Employee Share-Based Payment Accounting (ASU 2016-09). This ASU affects entities that issue share-based payment awards to their employees. The ASU is designed to simplify several aspects of accounting for share-based payment award transactions which include - the income tax consequences, classification of awards as either equity or liabilities, classification on the statement of cash flows and forfeiture rate calculations. ASU 2016-09 will become effective for the Company in the first quarter of fiscal 2019. Early adoption is permitted in any interim or annual period. The Company early adopted ASU No. 2016-09. The adoption had no material impact on the Company’s financial statements.
In April 2016, the FASB issued AS 2016-10, Revenue from Contracts with Customers (Topic 606), which amends certain aspects of the Board's new revenue standard, ASU 2014-09, Revenue from Contracts with Customers. The standard should be adopted concurrently with adoption of ASU 2014-09 which is effective for annual and interim periods beginning after December 15, 2017. The Company has not yet selected a transition method nor has it determined the effect of the standard on its ongoing financial reporting.
| F-15 |
NOTE 3 – CONTRACTS IN PROGRESS
Cost, estimated earnings, and billings on uncompleted contracts are summarized as follows as of August 31, 2017 and 2016:
| 2017 | 2016 | |||||||
| Revenues earned to date on uncompleted contracts | $ | 7,162,360 | $ | 2,557,507 | ||||
| Billings to date on uncompleted contracts | (5,898,236 | ) | (2,093,476 | ) | ||||
| $ | 1,264,124 | $ | 464,031 | |||||
Contracts in progress are included in the accompanying balance sheets under the following captions:
| 2017 | 2016 | |||||||
| Revenues in excess of billings | $ | 1,481,082 | $ | 694,131 | ||||
| Billings in excess of revenues | (216,958 | ) | (230,100 | ) | ||||
| $ | 1,264,124 | $ | 464,031 | |||||
NOTE 4 – PROPERTY AND EQUIPMENT
Property and equipment at August 31, 2017 and 2016 consisted of the following:
| 2017 | 2016 | |||||||
| Equipment | $ | 618,915 | $ | 487,458 | ||||
| Computer equipment | 141,615 | 125,385 | ||||||
| Furniture and fixtures | 239,105 | 200,595 | ||||||
| Leasehold improvements | 103,599 | 103,599 | ||||||
| 1,103,235 | 917,037 | |||||||
| Less accumulated depreciation and amortization | 812,100 | 660,656 | ||||||
| Total | $ | 291,135 | $ | 256,381 | ||||
Depreciation expense was $151,444, $196,250, and $211,454 for the years ended August 31, 2017, 2016, and 2015, respectively.
NOTE 5: CONTRACTS PAYABLE
TSRL
Pursuant to the termination and non-assertion agreement with TSRL (See note 2), the Company paid TSRL $2,500,000 over a three-year period. The final payment of $1,000,000 was made in April 2017.
Cognigen Acquisition Liability-Related Party
On September 2, 2014, the Company acquired Cognigen Corporation (See note 13). As part of the consideration the Company agreed that within three business days following the two year anniversary of July 23, 2014 (the date of the Merger Agreement) and subject to any offsets, the Company will pay the former shareholders of Cognigen a total of $1,854,404, comprised of $720,000 of cash and the issuance of 170,014 shares of stock. The former shareholders of Cognigen are currently employed by the consolidated Company, one of whom served as the President of Simulations Plus, Inc. and Cognigen through the end of FY17. In July 2016 the final payment was made and the shares were issued.
DILIsym Acquisition Liabilities:
On June 1, 2017, the Company acquired DILIsym Services, Inc. The agreement provided for a working capital adjustment, an eighteen-month $1,000,000 holdback provision against certain representations and warrantees, and an Earn-out agreement of up to an additional $5,000,000 in Earn-out payments based on earnings over the next three years. The Earn-out liability has been recorded at an estimated fair value. Payments under the Earn-out liability will be due starting in FY 2019, it is estimated that approximately half of the liability will be paid in 2019 and the remainder of the Earn-out will be paid in the following year.
| F-16 |
As of August 31, 2017 the following liabilities have been recorded:
| Working Capital Liability | $ | 247,328 | ||
| Holdback Liability | 1,000,000 | |||
| Earn-out Liability | 4,738,188 | |||
| Sub Total | $ | 5,985,516 | ||
| Less: Current Portion | 247,328 | |||
| Long-Term | $ | 5,738,188 | ||
NOTE 6 - COMMITMENTS AND CONTINGENCIES
Leases
We lease approximately 13,500 square feet of space in Lancaster, California. The original lease had a five-year term with two, three-year options to extend. The initial five-year term expired in February 2011, and we extended the lease to February 2, 2014. In June 2013, the lease was amended to extend the term to February 2, 2017. The amended lease also provides for an annual base rent increase of 3% per year and two, two-year options to extend. In May 2016 the Company exercised the two, two-year options extending the term of the lease through February 2, 2021 at a fixed rate of $25,000 per month. The new extension agreement allowed the Company with 90 days notice to opt out of the remaining lease in the last two years of the term upon payment of a recapture payment equal to the 3% base payment increase that would have been due under the original agreement.
Our Buffalo subsidiary leases approximately 12,623 square feet of space in Buffalo, New York. The initial five-year term expires in October 2018; the lease allows for a three year option to extend to October 2021. The current base rent is $15,638 per month.
In September 2017 DILIsym service signed a 3-year lease for approximately 1,900 rentable square feet of space in Research Triangle Park, North Carolina. The initial three-year term expires in October 2020. The initial base rent is $3,975 per month with an annual 3% adjustment. Prior to this lease DILIsym was on a month-to-month rental.
Rent expense, including common area maintenance fees for the years ended August 31, 2017, 2016 and 2015 was $509,600, $491,800 and $488,888, respectively.
Future minimum lease payments under non-cancelable operating leases with remaining terms of one year or more at August 31, 2017 were as follows:
| Years Ending August 31, | ||||
| 2018 | $ | 531,379 | ||
| 2019 | 380,407 | |||
| 2020 | 350,605 | |||
| 2021 | 131,130 | |||
| $ | 1,393,521 | |||
Employment Agreements
In the normal course of business the Company has entered into employment agreements with certain of its key management personnel that may require compensation payments upon termination.
License Agreement
The Company executed a royalty agreement with Accelrys, Inc. (the original agreement was entered into with Symyx Technologies in March 2010; Symyx Technologies later merged with Accelrys, Inc.) for access to their Metabolite Database for developing our Metabolite Module within ADMET Predictor™. The module was renamed the Metabolism Module when we released ADMET Predictor version 6 on April 19, 2012. Under this agreement, we pay a royalty of 25% of revenue derived from the sale of the Metabolism/Metabolite module to Accelrys. In 2014, Dassault Systemes of France acquired Accelrys and the Company now operates under the name Biovia. Under this agreement for the year ended August 31, 2017, 2016 and 2015 we incurred royalty expense of $139,551, $119,620 and $77,307, respectively.
Litigation
Except as described below, we are not a party to any legal proceedings and are not aware of any pending legal proceedings of any kind.
| F-17 |
In June 2014, the Company was served with a complaint in a civil action entitled Sherri Winslow v. Incredible Adventures, Inc., et al. (Los Angeles Superior Court Case No. BC545789) alleging wrongful death and seeking unspecified damages arising out of a May 18, 2012 plane crash in the State of Nevada. The Company’s Chief Executive Officer owned the subject aircraft and is also a named defendant. The complaint alleged that the Company was the owner of the subject aircraft. The Company denied all material allegations against it, including that it owns or has ever owned any interest in the subject aircraft.
In June 2017, the Plaintiff settled the case with certain of the Defendants; the case was dismissed on June 20, 2017. The Company incurred no liability as part of the settlement and has been dismissed with prejudice.
NOTE 7 - SHAREHOLDERS' EQUITY
Dividend
The Company’s Board of Directors declared cash dividends during fiscal year 2017, 2016 and 2015. The details of dividend paid are in the following tables:
FY2015
| Record Date | Distribution Date | Number of Shares Outstanding on Record Date |
Dividend per Share |
Total Amount | ||||||||
| 11/7/2014 | 11/14/2014 | 16,841,114 | $ | 0.05 | $ | 842,056 | ||||||
| 1/26/2015 | 2/02/2015 | 16,852,117 | $ | 0.05 | $ | 842,606 | ||||||
| 5/11/2015 | 5/18/2015 | 16,875,117 | $ | 0.05 | $ | 843,754 | ||||||
| 7/23/2015 | 7/30/2015 | 16,943,001 | $ | 0.05 | $ | 847,150 | ||||||
| Total | $ | 3,375,566 | ||||||||||
FY2016
| Record Date | Distribution Date | Number of Shares Outstanding on Record Date |
Dividend per Share |
Total Amount | ||||||||
| 11/09/2015 | 11/16/2015 | 16,996,001 | $ | 0.05 | $ | 849,800 | ||||||
| 1/29/2016 | 2/05/2016 | 17,018,001 | $ | 0.05 | $ | 850,900 | ||||||
| 5/02/2016 | 5/09/2016 | 17,029,501 | $ | 0.05 | $ | 851,475 | ||||||
| 8/11/2016 | 8/18/2016 | 17,221,978 | $ | 0.05 | $ | 861,099 | ||||||
| Total | $ | 3,413,274 | ||||||||||
FY2017
| Record Date | Distribution Date | Number of Shares Outstanding on Record Date |
Dividend per Share |
Total Amount | ||||||||
| 11/10/2016 | 11/17/2016 | 17,226,478 | $ | 0.05 | $ | 861,324 | ||||||
| 1/30/2017 | 2/06/2017 | 17,233,758 | $ | 0.05 | $ | 861,688 | ||||||
| 5/08/2017 | 5/15/2017 | 17,240,626 | $ | 0.05 | $ | 862,031 | ||||||
| 7/28/2017 | 8/04/2017 | 17,268,920 | $ | 0.05 | $ | 863,446 | ||||||
| Total | $ | 3,448,489 | ||||||||||
Although dividend distributions are currently expected to continue on a quarterly basis, the Company’s Board of Directors reserves the right to discontinue the dividend distribution any time.
| F-18 |
Stock Option Plan
In September 1996, the Board of Directors adopted, and the shareholders approved, the 1996 Stock Option Plan (the "Option Plan") under which a total of 1,000,000 shares of common stock had been reserved for issuance. In March 1999, the shareholders approved an increase in the number of shares that may be granted under the Option Plan to 2,000,000. In February 2000, the shareholders approved an increase in the number of shares that may be granted under the Option Plan to 4,000,000. In December 2000, the shareholders approved an increase in the number of shares that may be granted under the Option Plan to 5,000,000. Furthermore, in February 2005, the shareholders approved an additional 1,000,000 shares, resulting in the total number of shares that may be granted under the Option Plan to 6,000,000. The 1996 Stock Option Plan terminated in September 2006 by its term.
On February 23, 2007, the Board of Directors adopted, and the shareholders approved, the 2007 Stock Option Plan under which a total of 1,000,000 shares of common stock had been reserved for issuance. On February 25, 2014 the shareholders approved an additional 1,000,000 shares increasing the total number of shares that may be granted under the Option Plan to 2,000,000. This plan terminated in February 2017 by its term.
On December 23, 2016 the Board of Directors adopted, and on February 23, 2017 the shareholders approved, the 2017 Equity Incentive Plan under which a total of 1,000,000 shares of common stock has been reserved for issuance. This plan will terminate in December 2026.
Incentive Stock Options (“ISOs”)
As of August 31, 2017, employees hold ISOs to purchase in the aggregate 1,194,042 shares of the Company’s common stock at exercise prices ranging from $1.00 to $14.50 per share.
| Transactions in FY15 (ISOs) | Number of Options | Weighted-Average Exercise Price Per Share | Weighted-Average Remaining Contractual Life | |||||||||
| Outstanding, August 31, 2014 | 798,500 | $ | 4.59 | 6.27 | ||||||||
| Granted | 37,000 | $ | 6.99 | |||||||||
| Exercised | (95,384 | ) | $ | 2.49 | ||||||||
| Canceled/Forfeited | (119,116 | ) | $ | 4.86 | ||||||||
| Outstanding, August 31, 2015 | 621,000 | $ | 5.01 | 6.01 | ||||||||
| Vested and Exercisable, August 31, 2015 | 265,700 | $ | 2.81 | 4.40 | ||||||||
| Vested and Expected to Vest, August 31, 2015 | 576,952 | $ | 4.87 | 6.32 | ||||||||
| Transactions in FY16 (ISOs) | Number of Options | Weighted-Average Exercise Price Per Share | Weighted-Average Remaining Contractual Life | |||||||||
| Outstanding, August 31, 2015 | 621,000 | $ | 5.01 | 6.01 | ||||||||
| Granted | 412,100 | $ | 9.71 | |||||||||
| Exercised | (100,863 | ) | $ | 1.45 | ||||||||
| Canceled/Forfeited | (27,487 | ) | $ | 7.66 | ||||||||
| Expired | (10,000 | ) | $ | 1.13 | ||||||||
| Outstanding, August 31, 2016 | 894,750 | $ | 7.54 | 7.72 | ||||||||
| Vested and Exercisable, August 31, 2016 | 253,380 | $ | 4.85 | 5.26 | ||||||||
| Vested and Expected to Vest, August 31, 2016 | 812,458 | $ | 7.40 | 7.58 | ||||||||
Transactions in FY17 (ISO’s) | Number of Options | Weighted-Average Exercise Price Per Share | Weighted-Average Remaining Contractual Life | |||||||||
| Outstanding, August 31, 2016 | 894,750 | $ | 7.54 | 7.72 | ||||||||
| Granted | 409,582 | $ | 10.10 | |||||||||
| Exercised | (40,142 | ) | $ | 3.01 | ||||||||
| Cancelled/Forfeited | (70,148 | ) | $ | 8.92 | ||||||||
| Outstanding, August 31, 2017 | 1,194,042 | $ | 8.49 | 7.70 | ||||||||
| Exercisable, August 31, 2017 | 380,360 | $ | 6.45 | 5.49 | ||||||||
| Vested and Expected to Vest, August 31, 2017 | 1,091,981 | $ | 8.38 | 7.59 | ||||||||
| F-19 |
Non-Qualified Stock Options (“NQSOs”)
As of August 31, 2017, the outside members of the Company’s Board of Directors hold NQSOs to purchase in the aggregate 55,084 shares of the Company’s common stock at exercise prices ranging from $1.67 to $14.50 per share.
| Transactions in FY15 (NQSOs) | Number of Options | Weighted-Average Exercise Price Per Share | Weighted-Average Remaining Contractual Life | |||||||||
| Outstanding, August 31, 2014 | 56,600 | $ | 4.82 | 7.96 | ||||||||
| Granted | 13,750 | $ | 6.75 | |||||||||
| Exercised | (6,503 | ) | $ | 3.28 | ||||||||
| Cancelled/Forfeited | (14,497 | ) | $ | 4.97 | ||||||||
| Outstanding, August 31, 2015 | 49,350 | $ | 5.52 | 7.75 | ||||||||
| Exercisable, August 31, 2015 | 27,200 | $ | 4.70 | 6.31 | ||||||||
| Transactions in FY16 (NQSOs) | Number of Options | Weighted-Average Exercise Price Per Share | Weighted-Average Remaining Contractual Life | |||||||||
| Outstanding, August 31, 2015 | 49,350 | $ | 5.52 | 7.75 | ||||||||
| Granted | 15,000 | $ | 8.62 | |||||||||
| Exercised | (11,600 | ) | $ | 3.33 | ||||||||
| Cancelled/Forfeited | (0 | ) | $ | – | ||||||||
| Outstanding, August 31, 2016 | 52,750 | $ | 6.88 | 8.07 | ||||||||
| Exercisable, August 31, 2016 | 26,500 | $ | 5.95 | 6.70 | ||||||||
Transactions in FY17 (NQSOs) | Number of Options | Weighted-Average Exercise Price Per Share | Weighted-Average Remaining Contractual Life | |||||||||
| Outstanding, August 31, 2016 | 52,750 | $ | 6.88 | 8.07 | ||||||||
| Granted | 25,334 | $ | 11.44 | |||||||||
| Exercised | (9,500 | ) | $ | 5.88 | ||||||||
| Cancelled/Forfeited | (13,500 | ) | $ | 7.43 | ||||||||
| Outstanding, August 31, 2017 | 55,084 | $ | 9.02 | 8.59 | ||||||||
| Exercisable, August 31, 2017 | 21,125 | $ | 6.51 | 7.29 | ||||||||
The fair value of the options, including both ISOs and NQSOs, granted during fiscal year 2017 is estimated at $1,294,826. The fair value of these options was estimated at the date of grant using the Black-Scholes option-pricing model with the following assumptions: dividend yield of 2.15%, pre-vest forfeiture rate of 6.17%, expected volatility of 32.93%, risk-free interest rate of 2.16%, and expected life of 6.78 years. The total fair value of non-vested stock options as of August 31, 2017 was $1,866,395 and is amortizable over a weighted average period of 7.59 years.
The fair value of the options, including both ISOs and NQSOs, granted during fiscal year 2016 is estimated at $1,189,730. The fair value of these options was estimated at the date of grant using the Black-Scholes option-pricing model with the following assumptions: dividend yield of 2.32%, pre-vest forfeiture rate of 6.31%, expected volatility of 34.22%, risk-free interest rate of 1.42%, and expected life of 6.80 years. The total fair value of non-vested stock options as of August 31, 2016 was $1,366,269 and is amortizable over a weighted average period of 7.58 years.
The fair value of the options, including both ISOs and NQSOs, granted during fiscal year 2015 was estimated at $113,435. The fair value of these options was estimated at the date of grant using the Black-Scholes option-pricing model with the following assumptions: dividend yield of 3.03%, pre-vest forfeiture rate of 6.20%, expected volatility of 47.13%, risk-free interest rate of 2.09%, and expected life of 6.89 years.
| F-20 |
The Black-Scholes option valuation model was developed for use in estimating the fair value of traded options, which do not have vesting restrictions and are fully transferable. In addition, option valuation models require the input of highly subjective assumptions, including the expected stock price volatility. Because our stock options have characteristics significantly different from those of traded options, and because changes in the subjective input assumptions can materially affect the fair value estimate, in management's opinion, the existing models do not necessarily provide a reliable single measure of the fair value of its stock options.
Intrinsic Value of options outstanding and options exercisable
| Intrinsic Value of Options Outstanding | Intrinsic Value of Options Exercisable | Intrinsic Value of Options Exercised | ||||||||||||
| FY15 | $ | 1,182,797 | $ | 1,109,489 | $ | 396,485 | ||||||||
| FY16 | $ | 1,500,659 | $ | 1,025,718 | $ | 853,423 | ||||||||
| FY17 | $ | 7,479,068 | $ | 3,232,356 | $ | 479,713 | ||||||||
The weighted-average remaining contractual life of options outstanding issued under the 2007 and 2017 Plan was 7.74 years at August 31, 2017. The exercise prices for the options outstanding at August 31, 2017 ranged from $1.00 to $14.50 per share, and the information relating to these options is as follows:
| Exercise Price | Awards Outstanding | Awards Exercisable | ||||||||||||
| Low | High | Quantity | Weighted Average Remaining Contractual Life | Weighted Average Exercise Price | Quantity | Weighted Average Remaining Contractual Life | Weighted Average Exercise Price | |||||||
| $1.00 | $ 1.50 | 42,000 | 1.6 years | $ 1.00 | 42,000 | 1.6 years | $1.00 | |||||||
| $3.01 | $ 4.50 | 14,000 | 1.0 years | $ 3.22 | 14,000 | 1.1 years | $3.22 | |||||||
| $4.51 | $ 6.00 | 70,000 | 1.4 years | $ 5.52 | 70,000 | 1.4 years | $5.52 | |||||||
| $6.01 | $ 7.50 | 327,510 | 7.0 years | $ 6.86 | 194,905 | 7.0 years | $6.86 | |||||||
| $7.51 | $ 9.00 | 10,000 | 9.0 years | $ 8.62 | 4,000 | 9.0 years | $9.72 | |||||||
| $9.01 | $ 10.50 | 772,700 | 9.0 years | $ 9.88 | 76,580 | 8.5 years | $0.00 | |||||||
| $13.01 | $ 14.50 | 12,916 | 10.0 years | $14.44 | 0 | |||||||||
| 1,249,126 | 7.74 years | $8.51 | 401,485 | 5.6 years | $6.45 | |||||||||
NOTE 8 - INCOME TAXES
We utilize FASB ASC 740-10, “Income Taxes” which requires the recognition of deferred tax assets and liabilities for the expected future tax consequences of events that have been included in the financial statements or tax returns.
Under this method, deferred income taxes are recognized for the tax consequences in future years of differences between the tax bases of assets and liabilities and their financial reporting amounts at each year end based on enacted tax laws and statutory tax rates applicable to the periods in which the differences are expected to affect taxable income. Valuation allowances are established, when necessary, to reduce deferred tax assets to the amount expected to be realized. The provision for income taxes represents the tax payable for the period and the change during the period in deferred tax assets and liabilities.
The components of the income tax provision for fiscal year 2017, 2016 and 2015 were as follows:
| 2017 | 2016 | 2015 | ||||||||||
| Current | ||||||||||||
| Federal | $ | 2,385,660 | $ | 2,118,229 | $ | 1,482,798 | ||||||
| State | 217,281 | 171,840 | 236,152 | |||||||||
| Foreign | 28,103 | 19,428 | 75,099 | |||||||||
| 2,631,044 | 2,309,497 | 1,794,049 | ||||||||||
| Deferred | ||||||||||||
| Federal | (612,629 | ) | 22,936 | (15,036 | ) | |||||||
| State | 434,255 | (46,177 | ) | 70,955 | ||||||||
| (178,374 | ) | (23,241 | ) | 55,919 | ||||||||
| Total | $ | 2,452,670 | $ | 2,286,256 | $ | 1,849,968 | ||||||
| F-21 |
A reconciliation of the expected income tax (benefit) computed using the federal statutory income tax rate to the Company's effective income tax rate is as follows for fiscal year 2016 and 2015:
| 2017 | 2016 | 2015 | ||||||||||
| Income tax computed at federal statutory tax rate | 34.0% | 34.0% | 34.0% | |||||||||
| State taxes, net of federal benefit | 3.5 | 3.4 | 5.0 | |||||||||
| Meals & Entertainment | 0.0 | 0.1 | 0.1 | |||||||||
| Stock Based Compensation | 0.0 | 1.3 | 0.3 | |||||||||
| Other permanent differences | (0.5 | ) | (0.6 | ) | (0.0 | ) | ||||||
| Research and development credit | (3.6 | ) | (2.7 | ) | (4.5 | ) | ||||||
| Domestic Production Activities | (2.3 | ) | (3.6 | ) | (2.9 | ) | ||||||
| Change in prior year estimated taxes | (1.3 | ) | (0.3 | ) | 0.5 | |||||||
| Total | 29.8% | 31.6% | 32.5% | |||||||||
Significant components of the Company's deferred tax assets and liabilities for income taxes for the fiscal years ended August 31, 2017 and 2016 are as follows:
| 2017 | 2016 | |||||||
| Deferred tax assets | ||||||||
| Accrued payroll and other expenses | $ | 254,897 | $ | 108,769 | ||||
| Deferred revenue | 62,617 | 71,009 | ||||||
| Capitalized merger costs | 540,312 | 292,693 | ||||||
| Intellectual property | 18,775 | 21,205 | ||||||
| Research and development credit | – | 54,427 | ||||||
| State taxes | 91,513 | 58,426 | ||||||
| State Tax Deferred | 293,879 | 160,391 | ||||||
| Total deferred tax assets | 1,261,993 | 766,920 | ||||||
| Less: Valuation allowance | – | – | ||||||
| 1,261,993 | 766,920 | |||||||
| Deferred tax liabilities | ||||||||
| Property and equipment | (95,071 | ) | (93,900 | ) | ||||
| State Tax Deferred | (16,763 | ) | (9,491 | ) | ||||
| Intellectual Property | (4,343,311 | ) | (2,004,451 | ) | ||||
| Capitalized computer software development costs | (1,733,808 | ) | (1,615,284 | ) | ||||
| Total deferred tax liabilities | (6,188,953 | ) | (3,723,126 | ) | ||||
| Net deferred tax liabilities | $ | (4,926,960 | ) | $ | (2,956,206 | ) | ||
We follow guidance issued by the FASB with regard to our accounting for uncertainty in income taxes recognized in the financial statements. Such guidance prescribes a recognition threshold of more likely than not and a measurement process for financial statement recognition and measurement of a tax position taken or expected to be taken in a tax return. In making this assessment, a company must determine whether it is more likely than not that a tax position will be sustained upon examination, based solely on the technical merits of the position and must assume that the tax position will be examined by taxing authorities. Our policy is to include interest and penalties related to unrecognized tax benefits in income tax expense. Interest and penalties totaled $ -0- and $-0- for fiscal year 2017, 2016, and 2015, respectively. We file income tax returns with the IRS and various state jurisdictions and India. Our federal income tax returns for fiscal year 2012 thru 2013 and 2015 thru 2016 are open for audit, and our state tax returns for fiscal year 2011 through 2016 remain open for audit. In addition our California tax return for the fiscal year 2007 and fiscal year 2008 remains open with regard to R&D tax credits as a result of a previous audit for which we received a letter from the California Franchise Tax Board stating that an audit will not be conducted for those years at this time; however it may be subject to future audit. In 2015 the Company was informed that the IRS was auditing the Company’s tax return for 2014. This audit was completed during FY2016; there were no changes as a result of the audit.
| F-22 |
Our review of prior year tax positions using the criteria and provisions presented in guidance issued by FASB did not result in a material impact on our financial position or results of operations.
NOTE 9 – CONCENTRATIONS AND UNCERTAINTIES
Financial instruments that potentially subject the Company to concentration of credit risk consist principally of cash, cash equivalents and trade accounts receivable. The Company holds cash and cash equivalents at banks located in California, with balances that often exceed FDIC insured limits. Historically, the Company has not experienced any losses in such accounts and believes it is not exposed to any significant credit risk on cash and cash equivalents. However, considering the current banking environment, the Company is investigating alternative ways to minimize its exposure to such risks. While the Company may be exposed to credit losses due to the nonperformance of its counterparties, the Company does not expect the settlement of these transactions to have a material effect on its results of operations, cash flows or financial condition. The Company maintains cash at financial institutions that may, at times, exceed federally insured limits. At August 31, 2017 the Company had cash and cash equivalents exceeding insured limits by $5,231,000.
Revenue concentration shows that international sales accounted for 38%, 38% and 37% of net sales for fiscal years 2017, 2016 and 2015, respectively. Three customers accounted for 7% (a dealer account in Japan representing various customers), 7% and 5% of net sales for fiscal year 2017. Three customers accounted for 10% (a dealer account in Japan representing various customers), 7% and 6% of net sales for fiscal year 2016. Three customers accounted for 10% (a dealer account in Japan representing various customers), 8% and 6% of net sales for fiscal year 2015.
FY17 accounts receivable concentrations show that one customer comprised 10% (a dealer account in Japan representing various customers), of accounts receivable as of August 31, 2017. FY16 accounts receivable concentrations showed that three customers comprised 16% (a dealer account in Japan representing various customers), 10%, and 10% of accounts receivable at August 31, 2016.
We operate in the computer software industry, which is highly competitive and changes rapidly. Our operating results could be significantly affected by our ability to develop new products and find new distribution channels for new and existing products.
The majority of our customers are in the pharmaceutical industry. During economic downturns, we have seen consolidations in the pharmaceutical industry. Although we have not seen any significant reduction in total revenues to date, our growth rate could be affected by consolidation and downsizing in the pharmaceutical industry.
NOTE 10 SEGMENT AND Geographic Reporting
We account for segments and geographic revenues in accordance with guidance issued by the FASB. Our reportable segments are strategic business units that offer different products and services.
Results for each segment and consolidated results are as follows years ended August 31, 2017, 2016 and 2015 (in thousands, because of rounding, numbers may not foot):
| Year ended August 31, 2017 | ||||||||||||||||||||
| Simulations Plus, Inc. | Cognigen Corporation | DILIsym | Eliminations | Total | ||||||||||||||||
| Net Revenues | $ | 15,600 | $ | 7,300 | $ | 1,238 | 0 | $ | 24,138 | |||||||||||
| Income from operations before income taxes | $ | 6,194 | $ | 1,750 | $ | 320 | 0 | $ | 8,264 | |||||||||||
| Total assets | $ | 33,056 | $ | 9,363 | $ | 13,794 | $ | (17,702 | ) | $ | 38,512 | |||||||||
| Goodwill | $ | 0 | $ | 4,789 | $ | 5,598 | $ | 10,387 | ||||||||||||
| Capital expenditures | $ | 48 | $ | 96 | $ | 32 | $ | 176 | ||||||||||||
| Capitalized software costs | $ | 1,133 | $ | 219 | $ | 24 | $ | 1,376 | ||||||||||||
| Depreciation and Amortization | $ | 1618 | $ | 374 | $ | 135 | $ | 2,127 | ||||||||||||
| F-23 |
| Year ended August 31, 2016 | ||||||||||||||||
| Simulations Plus, Inc. | Cognigen Corporation | Eliminations | Total | |||||||||||||
| Net Revenues | $ | 14,417 | 5,554 | $ | 19,972 | |||||||||||
| Income from operations before income taxes | $ | 6,330 | $ | 901 | $ | 7,231 | ||||||||||
| Total assets | $ | 26,306 | $ | 8,975 | $ | (7,238 | ) | $ | 28,043 | |||||||
| Goodwill | $ | 0 | $ | 4,789 | $ | 4,789 | ||||||||||
| Capital expenditures | $ | 6 | $ | 32 | $ | 38 | ||||||||||
| Capitalized software costs | $ | 1,017 | $ | 178 | $ | 1,195 | ||||||||||
| Depreciation and Amortization | $ | 1,556 | $ | 375 | $ | 1,931 | ||||||||||
| Year ended August 31, 2015 | ||||||||||||||||
| Simulations Plus, Inc. | Cognigen Corporation | Eliminations | Total | |||||||||||||
| Net Revenues | $ | 13,086 | $ | 5,228 | $ | 18,314 | ||||||||||
| Income from operations before income taxes | $ | 4,816 | $ | 1,041 | $ | 5,857 | ||||||||||
| Total assets | $ | 25,549 | $ | 9,033 | $ | (7,238 | ) | $ | 27,344 | |||||||
| Goodwill | $ | 0 | $ | 4,789 | $ | 4,789 | ||||||||||
| Capital expenditures | $ | 23 | $ | 14 | $ | 37 | ||||||||||
| Capitalized software costs | $ | 1,019 | $ | 151 | $ | 1,170 | ||||||||||
| Depreciation and Amortization | $ | 1,633 | $ | 357 | $ | 1,990 | ||||||||||
In addition, the Company allocates revenues to geographic areas based on the locations of its customers. Geographical revenues for the years ended August 31, 2017, 2016 and 2015 were as follows (in thousands, because of rounding, numbers may not foot):
Year ended August 31, 2017
| North America | Europe | Asia | South America | Total | ||||||||||||||||
| Simulations Plus, Inc. | $ | 7,846 | $ | 3,826 | $ | 3,926 | $ | 1 | $ | 15,600 | ||||||||||
| Cognigen Corporation | 7,300 | – | – | – | 7,300 | |||||||||||||||
| DILIsym Services, Inc* | 851 | 151 | 236 | 1,238 | ||||||||||||||||
| Total | $ | 15,997 | $ | 3,977 | $ | 4,162 | $ | 1 | $ | 24,138 | ||||||||||
*DILIsym was acquired on June 1, 2017.
Year ended August 31, 2016
| North America | Europe | Asia | South America | Total | ||||||||||||||||
| Simulations Plus, Inc. | $ | 6,830 | $ | 4,022 | $ | 3,564 | $ | 2 | $ | 14,418 | ||||||||||
| Cognigen Corporation | 5,554 | – | – | – | 5,554 | |||||||||||||||
| Total | $ | 12,384 | $ | 4,022 | $ | 3,564 | $ | 2 | $ | 19,972 | ||||||||||
Year ended August 31, 2015
| North America | Europe | Asia | South America | Total | ||||||||||||||||
| Simulations Plus, Inc. | $ | 6,261 | $ | 3,629 | $ | 3,153 | $ | 43 | $ | 13,086 | ||||||||||
| Cognigen Corporation | 5,228 | – | – | – | 5,228 | |||||||||||||||
| Total | $ | 11,489 | $ | 3,629 | $ | 3,153 | $ | 43 | $ | 18,314 | ||||||||||
| F-24 |
NOTE 11 – RELATED PARTY TRANSACTIONS
On September 2, 2014 the Company acquired Cognigen Corporation. The Company incurred a liability of $1,854,404 due to the former shareholders of Cognigen Corporation who are currently employees and shareholders of the Consolidated Company. (See note 5). This liability was settled in July 2016 with a cash payment of $720,000 and the balance of $1,134,404 stock issuance.
On June 1, 2017 the Company acquired DILIsym Service, Inc. As part of that agreement the Company paid $1,704,000 to former shareholders of DILIsym Services, Inc. who are currently employees of the Consolidated Company. In addition, as part of the acquisition agreement the Company owes approximately $1,980,000 of acquisition liabilities at August 31, 2017 to the former shareholders who are still employees of the Consolidated Company. One of the former shareholders of DILIsym is currently a director of Simulations Plus, under the agreement he received approximately, $29,000 and could receive up to approximately $34,000 in future earn-out payments.
NOTE 12 - EMPLOYEE BENEFIT PLAN
We maintain a 401(k) Plan for eligible employees. We make matching contributions equal to 100% of the employee’s elective deferral, not to exceed 4% of the total employee compensation. We can also elect to make a profit-sharing contribution. We contributed $251,899, $219,756 and $237,300 for fiscal year 2017, 2016 and 2015, respectively.
NOTE 13 - ACQUISITION/MERGER WITH SUBSIDIARIES
Cognigen Corporation
On July 23, 2014, the Company entered into an Agreement and Plan of Merger (the “Merger Agreement”) with Cognigen Corporation (“Cognigen”). On September 2, 2014, the Company consummated the acquisition of all outstanding equity interests of Cognigen pursuant to the terms of the Merger Agreement, with Cognigen merging with and into a newly formed, wholly owned subsidiary of the Company. We believe the combination of Simulations Plus and Cognigen provides substantial future potential based on the complementary strengths of each of the companies.
Under the terms of the Merger Agreement, as described below, the Company will pay the former shareholders of Cognigen total consideration of $7,000,000, consisting of $2,800,000 of cash and $4,200,000 worth of newly issued, unregistered shares of the Company’s common stock.
On September 2, 2014, the Company paid the former shareholders of Cognigen a total of $5,200,000, comprised of cash in the amount of $2,080,000 and the issuance of 491,159 shares of the Company’s common stock valued at $3,120,000 (under the terms of the Merger Agreement a price of approximately $6.35 dollars per share was used based upon the volume-weighted average closing price of the Company’s shares of common stock for the 30-consecutive-trading-day period ending two trading days prior to September 2, 2014). The actual stock price at September 2, 2014 was $6.67, so the total value of the stock issued was approximately $3,277,000. The Merger Agreement provides for a two-year market standoff period in which the newly issued shares may not be sold by the recipients thereof.
Within three business days following the two-year anniversary of July 23, 2014 (the date of the Merger Agreement) and subject to any offsets, the Company will pay the former shareholders of Cognigen a total of $1,800,000, comprised of $720,000 of cash and the issuance of 170,014 shares of stock valued at $1,080,000 under the formula described above.
The Merger Agreement provided for a targeted working capital adjustment to be made 120 days after the closing date.
Under the acquisition method of accounting, the total estimated purchase price is allocated to Cognigen’s tangible and intangible assets and liabilities based on their estimated fair values at the date of the completion of the acquisition (September 2, 2014). The following table summarizes the preliminary allocation of the purchase price for Cognigen:
| Assets acquired, including accounts receivable of $934,000 and estimated Contracts receivable of $398,000 | $ | 1,524,389 | ||
| Fixed assets acquired | 458,351 | |||
| Estimated value of software acquired | 200,000 | |||
| Estimated value of Intangibles acquired (Customer Lists, trade name etc.) | 1,600,000 | |||
| Working Capital Adjustment | (26,707 | ) | ||
| Current Liabilities assumed | (644,499 | ) | ||
| Goodwill | 4,789,248 | |||
| Estimated Deferred income taxes | (662,500 | ) | ||
| Total Consideration | $ | 7,238,282 |
| F-25 |
Goodwill has been provided in the transaction based on estimates of future earnings of this subsidiary including anticipated synergies associated with the positioning of the combined company as a leader in model-based drug development. Based on the structure of the transaction, the Company does not anticipate benefiting from any tax deductions in future periods for recognized goodwill.
DILIsym Services, Inc.
On May 1, 2017, the Company entered into an Stock Purchase Agreement (the “Stock Agreement”) with DILIsym Services, Inc (“DILIsym”). On June 1 2016, the Company consummated the acquisition of all outstanding equity interests of DILIsym pursuant to the terms of the Stock Agreement, with DILIsym becoming a wholly owned subsidiary of the Company. We believe the combination of Simulations Plus and DILIsym provides substantial future potential based on the complementary strengths of each of the companies.
Under the terms of the Stock Agreement, as described below, the Company will pay the former shareholders of DILIsym total consideration of approximately $10,463,000.
On June 1, 2017, the Company paid the former shareholders of DILIsym a total of $4,515,982, which included a $4,000,000 initial payment and a preliminary working capital payment of $515,982. Additional working capital adjustments of $247,328 are due under the agreement and will be paid subsequent to August 31, 2017.
Within three business days following the eighteen month anniversary of acquisition, May 1, 2017, (the date of the Stock Agreement) and subject to any offsets, the Company will pay the former shareholders of DILIsym a total of $1,000,000. The agreement calls for Earn-out payments up to an additional $5,000,000 based on a formula of pre-tax earnings over the next three years. The Earn-out liability has been recorded at fair value.
Under the acquisition method of accounting, the total estimated purchase price is allocated to DILIsym’s tangible and intangible assets and liabilities based on their estimated fair values at the date of the completion of the acquisition (June 1, 2017). The following table summarizes the preliminary allocation of the purchase price for DILIsym:
| Assets acquired, including accounts receivable of $255,000 and estimated Contracts receivable of $153,000 | $ | 2,283,110 | ||
| Developed Technologies Acquired | 2,850,000 | |||
| Estimated value of Intangibles acquired (Customer Lists, trade name etc.) | 2,840,000 | |||
| Current Liabilities assumed | (911,049 | ) | ||
| Goodwill | 5,597,950 | |||
| Estimated Deferred income taxes | (2,212,160 | ) | ||
| Total Consideration | $ | 10,463,310 |
Goodwill has been provided in the transaction based on estimates of future earnings of this subsidiary including anticipated synergies associated with the positioning of the combined company as a leader in model-based drug development. Based on the structure of the transaction, the Company does not anticipate benefiting from any tax deductions in future periods for recognized goodwill.
PROFORMA INFORMATION (UNAUDITED)
Consolidated supplemental Pro Forma information
The following consolidated supplemental pro forma information assumes that the acquisition of DILIsym took place on September 1, 2015 for the income statements for the fiscal year ended August 31, 2017, and 2016. These amounts have been calculated after applying the Company’s accounting policies and adjusting the results of DILIsym to reflect the same expenses in the fiscal year ended August 31, 2017 that were incurred in the fiscal year ended August 31, 2016. The adjustments include costs of acquisition of $620,000, and the amortization of intangibles and other technologies acquired during the merger assuming the fair value adjustments applied on September 1, 2015, together with consequential tax effects.
| F-26 |
| For the fiscal year ended August 31 (in 1000’s) | ||||||||
| (Pro forma)* | (Pro forma) | |||||||
| 2017 | 2016 | |||||||
| Net Sales | $ | 27,184 | $ | 22,847 | ||||
| Net Income | $ | 6,325 | $ | 5,423 | ||||
*Includes 3 months actual results for the period of June 1, 2017 to August 31, 2017
NOTE 14. UNAUDITED QUARTERLY FINANCIAL DATA
The following table presents selected unaudited quarterly financial data for each full quarterly period of the years ended August 31, 2017 and 2016:
(in 1,000’s except for per share data)
| First | Second | Third | Fourth* | |||||||||||||
| Year ended August 31, 2017 | Quarter | Quarter | Quarter | Quarter | ||||||||||||
| Revenues | $ | 5,418 | $ | 5,705 | $ | 6,749 | $ | 6,266 | ||||||||
| Gross Profit | $ | 4,082 | $ | 4,151 | $ | 5,304 | $ | 4,293 | ||||||||
| Net Income | $ | 1,362 | $ | 1,196 | $ | 2,080 | $ | 1,151 | ||||||||
| Earnings per share, Basic | $ | 0.08 | $ | 0.07 | $ | 0.12 | $ | 0.07 | ||||||||
| Earnings per share, Diluted | $ | 0.08 | $ | 0.07 | $ | 0.12 | $ | 0.06 | ||||||||
| First | Second | Third | Fourth | |||||||||||||
| Year ended August 31, 2016 | Quarter | Quarter | Quarter | Quarter | ||||||||||||
| Revenues | $ | 4,839 | $ | 5.164 | $ | 6,012 | $ | 3,958 | ||||||||
| Gross Profit | $ | 3,755 | $ | 3,900 | $ | 4,817 | $ | 2,898 | ||||||||
| Net Income | $ | 1,106 | $ | 1,145 | $ | 1,909 | $ | 789 | ||||||||
| Earnings per share, Basic | $ | 0.07 | $ | 0.07 | $ | 0.11 | $ | 0.07 | ||||||||
| Earnings per share, Diluted | $ | 0.06 | $ | 0.07 | $ | 0.11 | $ | 0.06 | ||||||||
*On June 1, 2017 the Company acquired DILIsym Services Inc., fourth quarter revenues include their results of operations and certain expenses of acquisition.
NOTE 15 - SUBSEQUENT EVENTS
Dividend Declared
On November 1, 2017, our Board of Directors declared a quarterly cash dividend of $0.06 per share to our shareholders. The dividend will be distributed on Monday, November 20, 2017, for shareholders of record as of Monday, November 13, 2017.
| F-27 |