Attached files
| file | filename |
|---|---|
| 8-K - FORM 8-K - LANNETT CO INC | tm2112095d1_8k.htm |
Exhibit 99.1
| INVESTOR PRESENTATION April 2021 © 2021 Lannett Company, Inc. All Rights Reserved. For Discussion Purposes Only |
| 1 This presentation contains forward-looking statements. All statements other than statements of historical fact contained in this presentation, including statements regarding our future results of operations and financial position, business strategy and plans and objectives of management for future operations, are forward- looking statements. In some cases, you can identify forward-looking statements by terms such as "may," "will," "should," "expects," "plans," "anticipates," "could,“ “would,” "intends," "target," "projects," "contemplates," "believes," "estimates," "predicts," “pursues,” "potential" or "continue" or the negative of these terms, any variations thereof or other similar expressions. Forward-looking statements are based on current perspectives of the Company’s business and current expectations of future events. We cannot guarantee that any forward-looking statement will be accurate, although we believe that we have been reasonable in our expectations and assumptions. Investors should realize that if underlying assumptions prove inaccurate or that known or unknown risks or uncertainties materialize, actual results could vary materially from the Company’s expectations and projections. Investors are therefore cautioned not to place undue reliance on any forward-looking statements. These forward-looking statements speak only as of the date of this presentation and, except as required by applicable law, we undertake no obligation to publicly update or revise any forward-looking statements contained herein, whether as a result of any new information, future events or otherwise. Factors that could cause or contribute to differences in our future results include, but are not limited to: the potential impact of the current and ongoing coronavirus (COVID-19) pandemic, the Company’s beliefs about future revenue and expense levels, growth rates, prospects related to our strategic initiatives and business strategies, express or implied assumptions about government regulatory action or inaction, anticipated product approvals and launches, business initiatives and product development activities, assessments related to clinical trial results, product performance and competitive environment, anticipated financial performance and integration of acquisitions. A further list and description of these risks, uncertainties and other factors can be found under the heading “Risk Factors” in the offering circular and in Part I, Item 1A, Risk Factors in the Company’s Annual Report on Form 10-K for the fiscal year ended June 30, 2020 and the Company’s subsequent filings with the Securities and Exchange Commission incorporated by reference in the offering circular for the offering to which this presentation relates. The Company qualifies all of its forward-looking statements by these cautionary statements. Market data information used in this presentation are based on management’s knowledge of the industry and the good faith estimates of management. Management has relied, to the extent available, upon their review of industry surveys and publications and other publicly available information prepared by a number of third party sources. The market data information included in this presentation involves a number of assumptions and limitations, and you are cautioned not to give undue weight to such information. Although the Company believes that these sources are reliable as of their respective dates, it has not verified the accuracy or completeness of this information from independent sources. In addition, this information involves important risks, uncertainties and assumptions, including those discussed above, which could cause results to differ materially. In addition to U.S. GAAP financials, this presentation includes certain non GAAP financial measures. These non GAAP measures are in addition to, not a substitute for or superior to, measures of financial performance prepared in accordance with U.S. GAAP. Adjusted EBITDA excludes, among other things, the effects of (1) amortization of purchased intangibles and other purchase accounting entries, (2) restructuring expenses, (3) non-cash interest expense, as well as (4) certain other items considered unusual or non-recurring in nature, including the unrealized cost savings related to restructurings. A reconciliation of non GAAP measures to GAAP measures is contained in the Appendix to this presentation. This presentation shall not constitute an offer to sell or the solicitation of an offer to buy any securities in any state or jurisdiction which such offer, solicitation or sale would be unlawful, nor shall there be any sale of these securities in any state or jurisdiction in which such offer, solicitation or sale would be unlawful prior to registration or qualification under the securities laws of any such state or jurisdiction. The Lannett logo, "Lannett" and the Company's other trademarks are the property of Lannett Company, Inc. or its subsidiaries. Other trademarks, including names, logos and brands, referenced in this presentation are the property of their respective owners. Cautionary Statements |
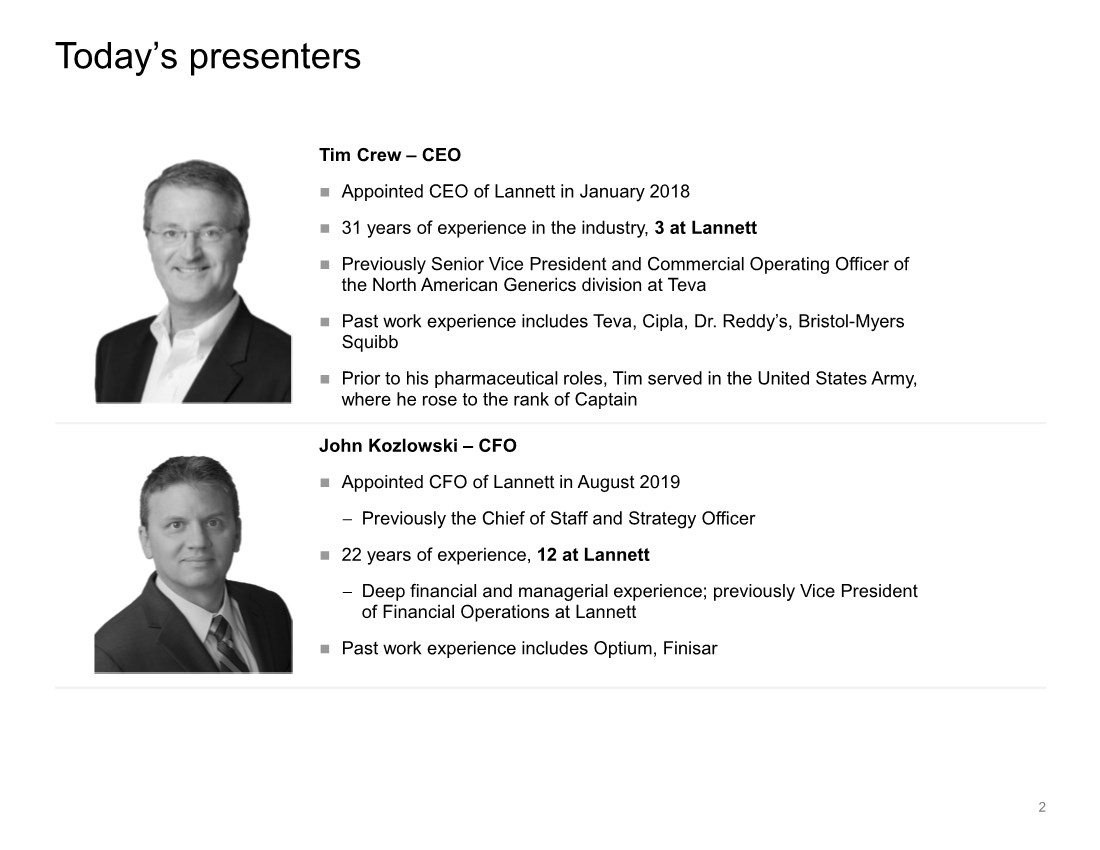
| Today’s presenters Tim Crew – CEO Appointed CEO of Lannett in January 2018 31 years of experience in the industry, 3 at Lannett Previously Senior Vice President and Commercial Operating Officer of the North American Generics division at Teva Past work experience includes Teva, Cipla, Dr. Reddy’s, Bristol-Myers Squibb Prior to his pharmaceutical roles, Tim served in the United States Army, where he rose to the rank of Captain John Kozlowski – CFO Appointed CFO of Lannett in August 2019 − Previously the Chief of Staff and Strategy Officer 22 years of experience, 12 at Lannett − Deep financial and managerial experience; previously Vice President of Financial Operations at Lannett Past work experience includes Optium, Finisar 2 |
| Company Overview Financial Summary Appendix | Supplemental Information Agenda 3 |
| COMPANY OVERVIEW |
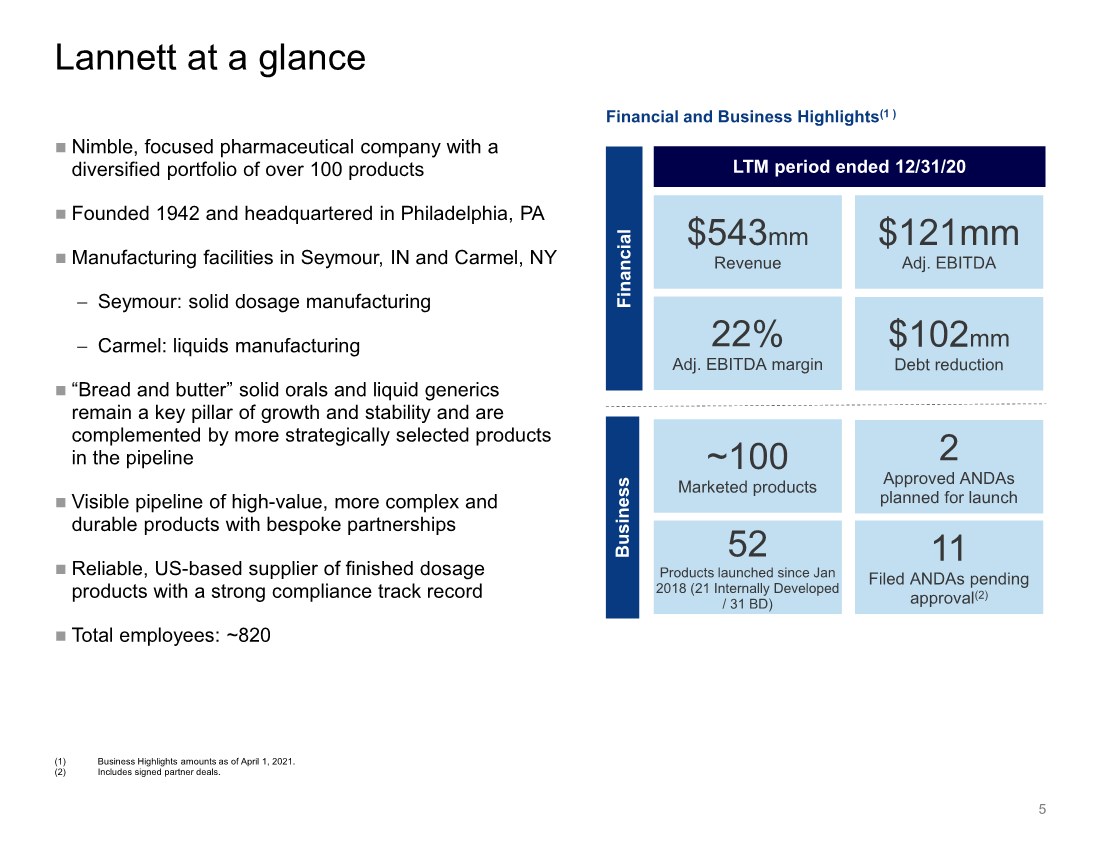
| $543mm Revenue 5 Lannett at a glance ~100 Marketed products Business Financial (1) Business Highlights amounts as of April 1, 2021. (2) Includes signed partner deals. $102mm Debt reduction Financial and Business Highlights(1 ) 52 Products launched since Jan 2018 (21 Internally Developed / 31 BD) LTM period ended 12/31/20 Nimble, focused pharmaceutical company with a diversified portfolio of over 100 products Founded 1942 and headquartered in Philadelphia, PA Manufacturing facilities in Seymour, IN and Carmel, NY − Seymour: solid dosage manufacturing − Carmel: liquids manufacturing “Bread and butter” solid orals and liquid generics remain a key pillar of growth and stability and are complemented by more strategically selected products in the pipeline Visible pipeline of high-value, more complex and durable products with bespoke partnerships Reliable, US-based supplier of finished dosage products with a strong compliance track record Total employees: ~820 $121mm Adj. EBITDA 2 Approved ANDAs planned for launch 22% Adj. EBITDA margin 11 Filed ANDAs pending approval(2) |
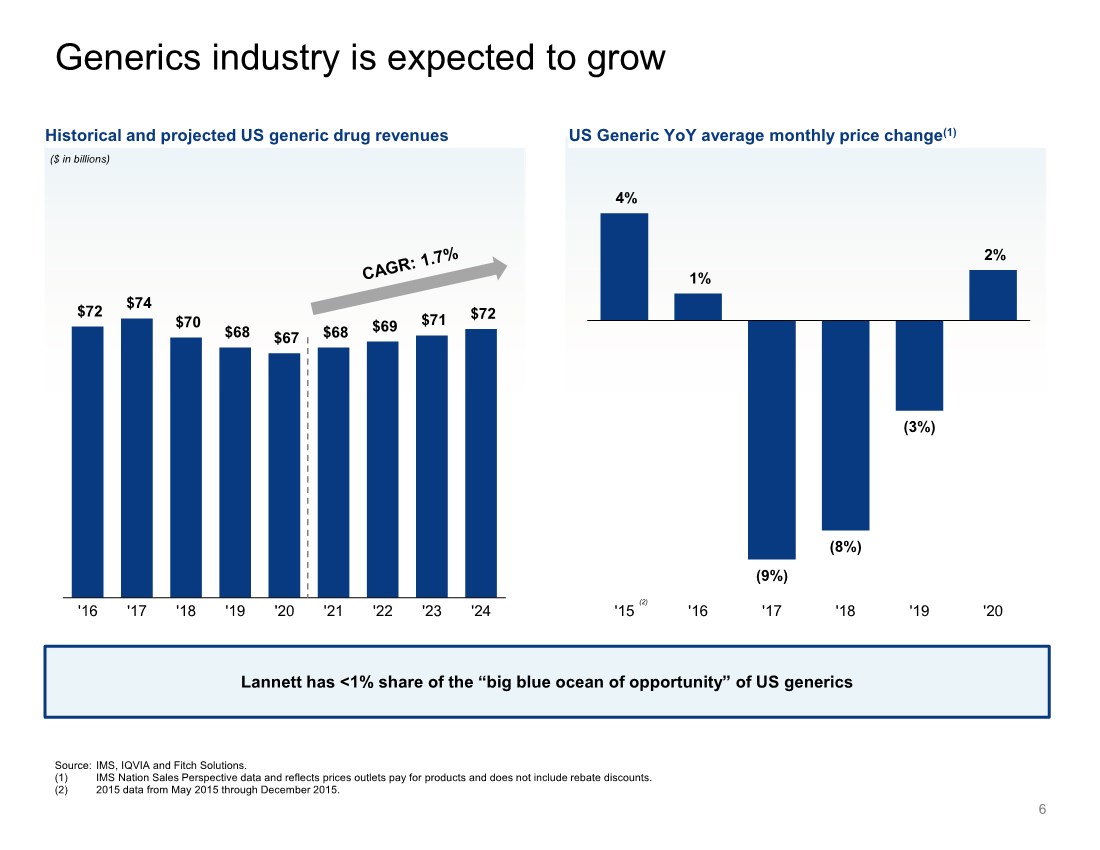
| 6 Generics industry is expected to grow Source: IMS, IQVIA and Fitch Solutions. (1) IMS Nation Sales Perspective data and reflects prices outlets pay for products and does not include rebate discounts. (2) 2015 data from May 2015 through December 2015. Historical and projected US generic drug revenues ($ in billions) US Generic YoY average monthly price change(1) $72 $74 $70 $68 $67 $68 $69 $71 $72 '16 '17 '18 '19 '20 '21 '22 '23 '24 Lannett has <1% share of the “big blue ocean of opportunity” of US generics (2) 4% 1% (9%) (8%) (3%) 2% '15 '16 '17 '18 '19 '20 |
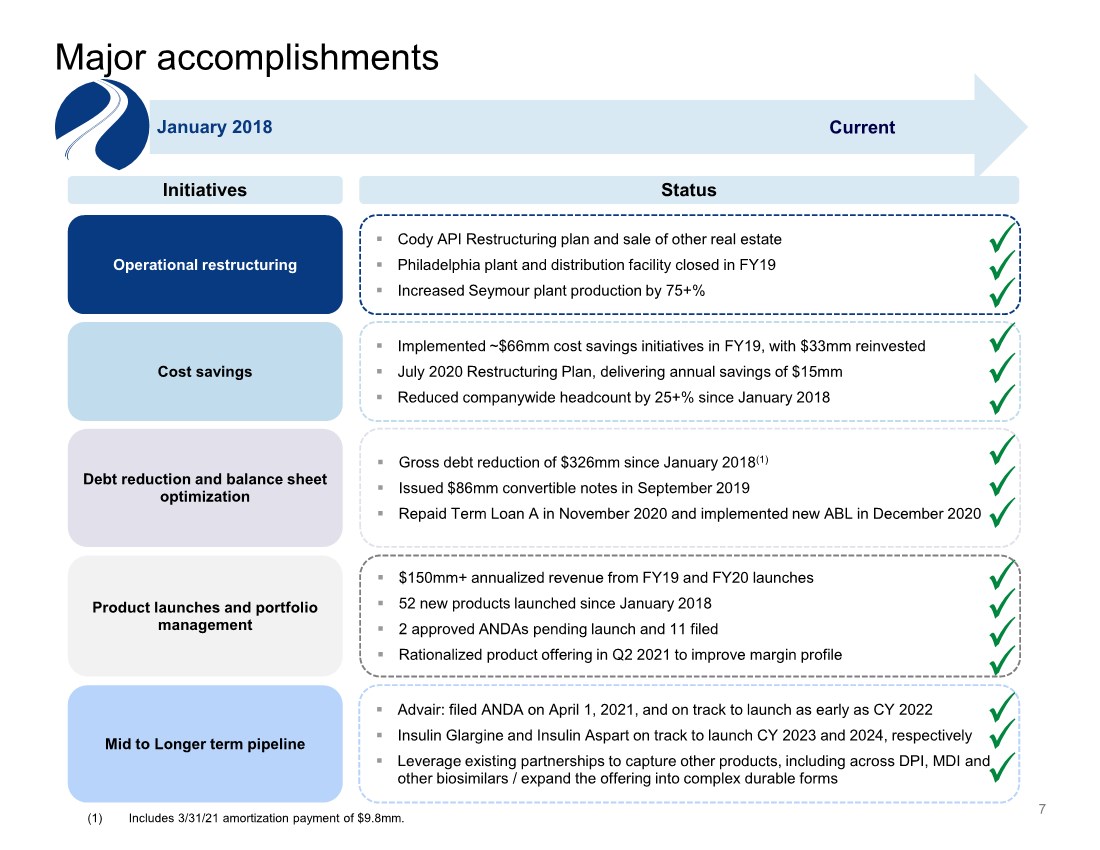
| 7 Major accomplishments January 2018 Current Initiatives Status . Cody API Restructuring plan and sale of other real estate . Philadelphia plant and distribution facility closed in FY19 . Increased Seymour plant production by 75+% . Implemented ~$66mm cost savings initiatives in FY19, with $33mm reinvested . July 2020 Restructuring Plan, delivering annual savings of $15mm . Reduced companywide headcount by 25+% since January 2018 . Gross debt reduction of $326mm since January 2018(1) . Issued $86mm convertible notes in September 2019 . Repaid Term Loan A in November 2020 and implemented new ABL in December 2020 . $150mm+ annualized revenue from FY19 and FY20 launches . 52 new products launched since January 2018 . 2 approved ANDAs pending launch and 11 filed . Rationalized product offering in Q2 2021 to improve margin profile Operational restructuring Cost savings Debt reduction and balance sheet optimization Product launches and portfolio management . Advair: filed ANDA on April 1, 2021, and on track to launch as early as CY 2022 . Insulin Glargine and Insulin Aspart on track to launch CY 2023 and 2024, respectively . Leverage existing partnerships to capture other products, including across DPI, MDI and other biosimilars / expand the offering into complex durable forms Mid to Longer term pipeline (1) Includes 3/31/21 amortization payment of $9.8mm. |
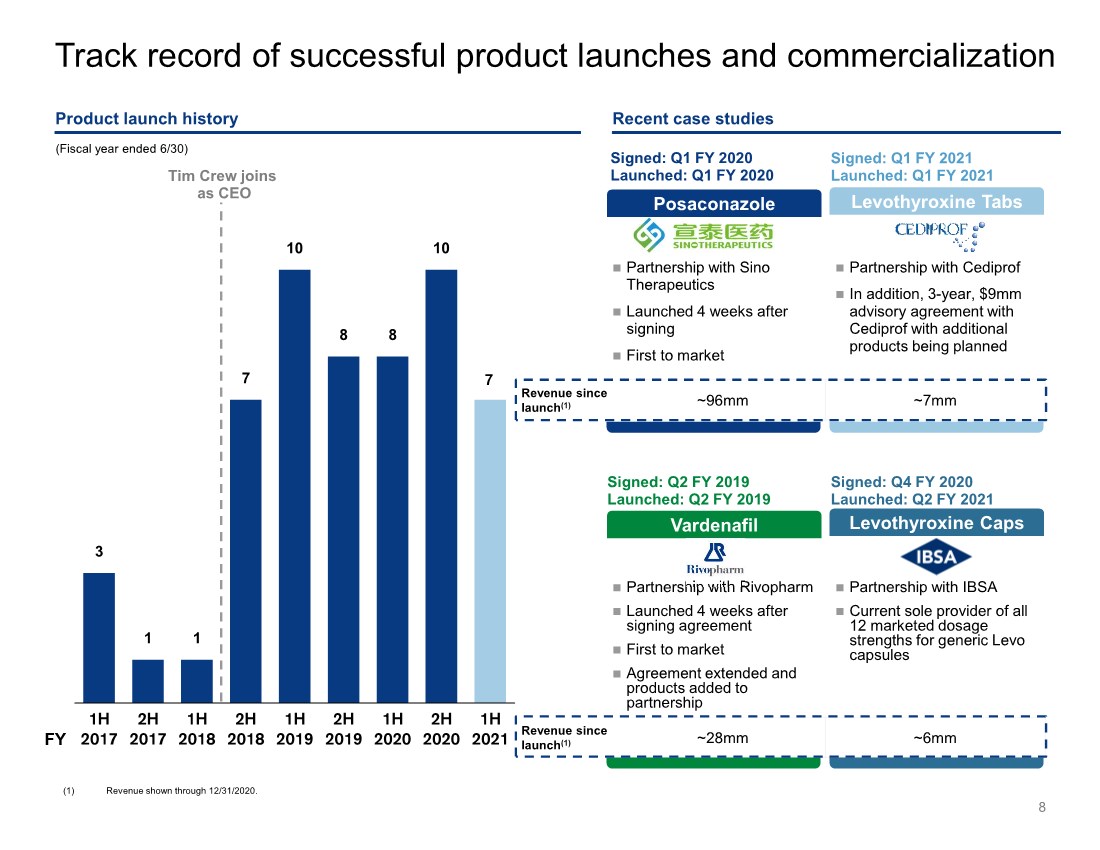
| Revenue since launch(1) ~28mm ~6mm Partnership with Cediprof In addition, 3-year, $9mm advisory agreement with Cediprof with additional products being planned Partnership with Sino Therapeutics Launched 4 weeks after signing First to market Revenue since launch(1) ~96mm ~7mm 8 Product launch history Track record of successful product launches and commercialization 3 1 1 7 10 8 8 10 7 1H 2017 2H 2017 1H 2018 2H 2018 1H 2019 2H 2019 1H 2020 2H 2020 1H 2021 Tim Crew joins as CEO Levothyroxine Tabs Signed: Q1 FY 2021 Launched: Q1 FY 2021 Posaconazole Signed: Q1 FY 2020 Launched: Q1 FY 2020 Recent case studies Partnership with IBSA Current sole provider of all 12 marketed dosage strengths for generic Levo capsules Partnership with Rivopharm Launched 4 weeks after signing agreement First to market Agreement extended and products added to partnership Levothyroxine Caps Signed: Q4 FY 2020 Launched: Q2 FY 2021 Vardenafil Signed: Q2 FY 2019 Launched: Q2 FY 2019 (Fiscal year ended 6/30) FY (1) Revenue shown through 12/31/2020. |
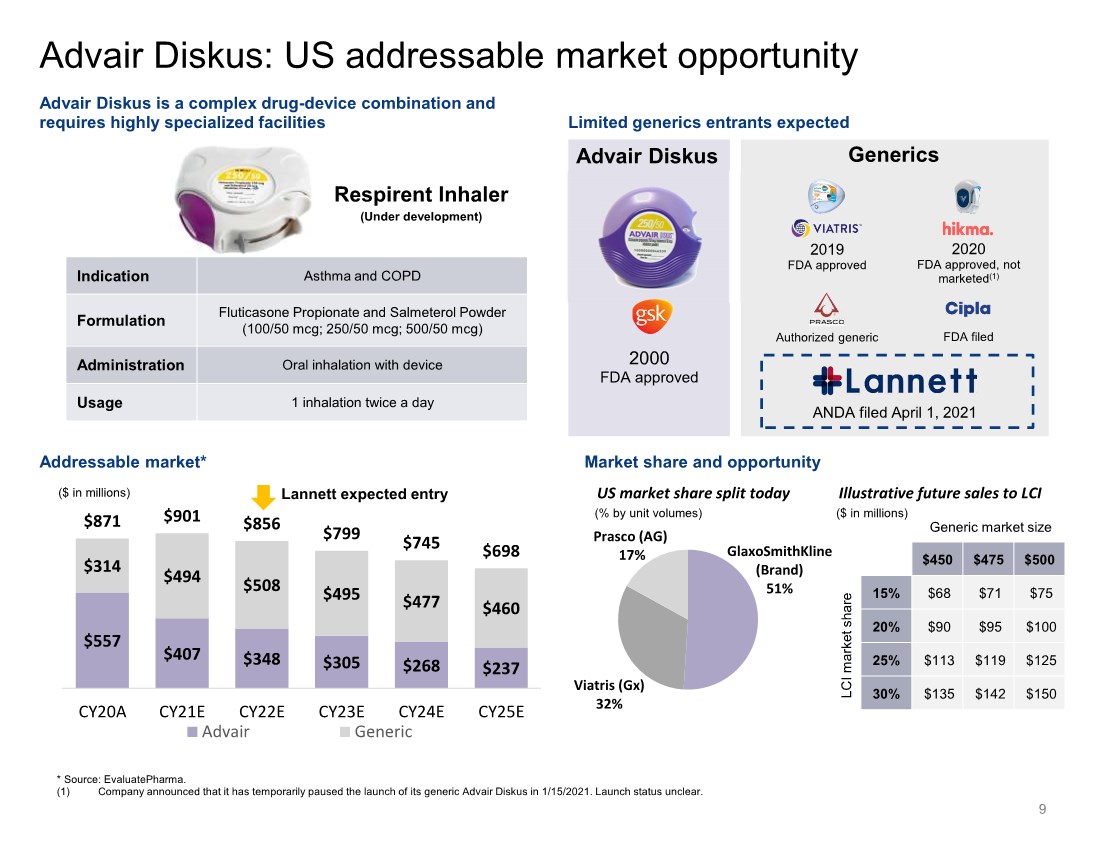
| GlaxoSmithKline (Brand) 51% Viatris (Gx) 32% Prasco (AG) 17% * Source: EvaluatePharma. (1) Company announced that it has temporarily paused the launch of its generic Advair Diskus in 1/15/2021. Launch status unclear. $557 $407 $348 $305 $268 $237 $314 $494 $508 $495 $477 $460 $871 $901 $856 $799 $745 $698 CY20A CY21E CY22E CY23E CY24E CY25E Advair Generic Limited generics entrants expected Advair Diskus is a complex drug-device combination and requires highly specialized facilities Addressable market* 2019 FDA approved 2000 FDA approved 2020 FDA approved, not marketed(1) Generics ($ in millions) Advair Diskus Indication Asthma and COPD Formulation Fluticasone Propionate and Salmeterol Powder (100/50 mcg; 250/50 mcg; 500/50 mcg) Administration Oral inhalation with device Usage 1 inhalation twice a day Authorized generic FDA filed Respirent Inhaler (Under development) US market share split today Market share and opportunity Illustrative future sales to LCI Advair Diskus: US addressable market opportunity ANDA filed April 1, 2021 Lannett expected entry 9 $450 $475 $500 15% $68 $71 $75 20% $90 $95 $100 25% $113 $119 $125 30% $135 $142 $150 Generic market size LCI market share (% by unit volumes) ($ in millions) |
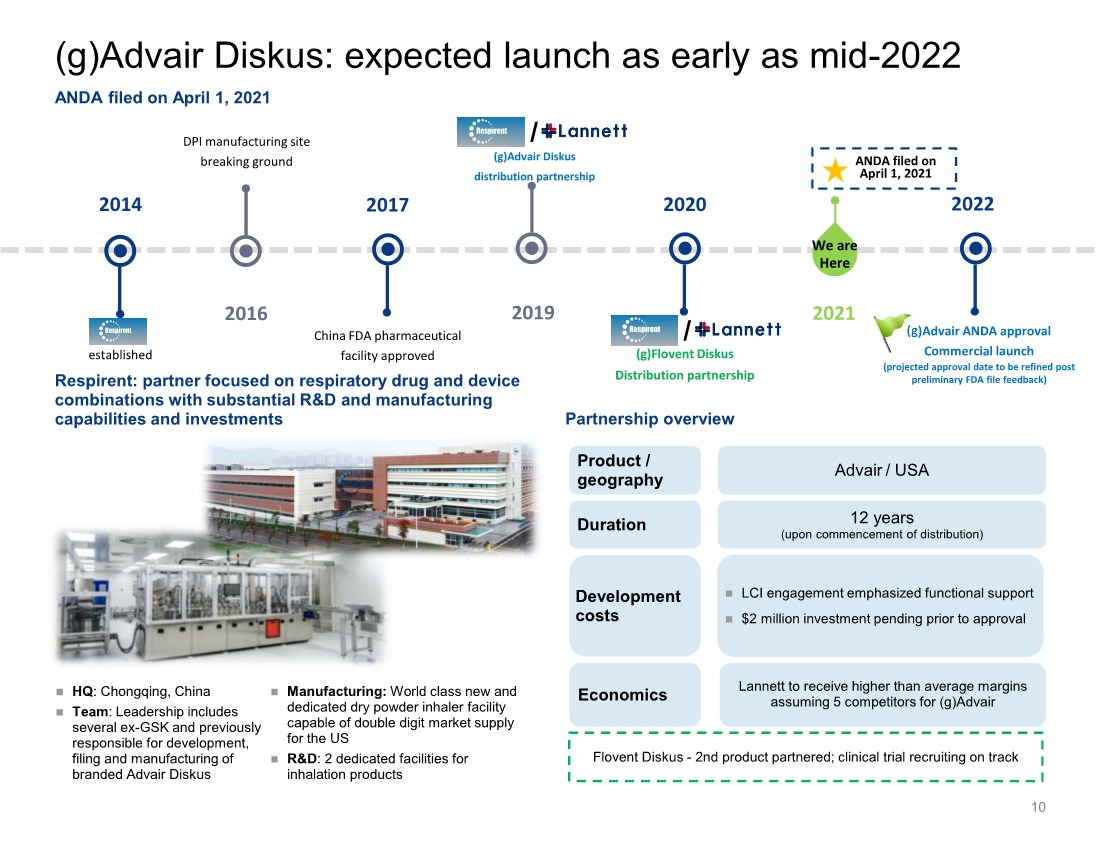
| 10 2014 established 2017 2016 DPI manufacturing site breaking ground China FDA pharmaceutical facility approved 2019 2020 2021 (g)Flovent Diskus Distribution partnership ANDA filed on April 1, 2021 2022 (g)Advair ANDA approval Commercial launch (projected approval date to be refined post preliminary FDA file feedback) Respirent: partner focused on respiratory drug and device combinations with substantial R&D and manufacturing capabilities and investments Partnership overview HQ: Chongqing, China Team: Leadership includes several ex-GSK and previously responsible for development, filing and manufacturing of branded Advair Diskus We are Here Product / geography Duration Development costs Advair / USA 12 years (upon commencement of distribution) LCI engagement emphasized functional support $2 million investment pending prior to approval (g)Advair Diskus distribution partnership / / ANDA filed on April 1, 2021 Manufacturing: World class new and dedicated dry powder inhaler facility capable of double digit market supply for the US R&D: 2 dedicated facilities for inhalation products Economics Lannett to receive higher than average margins assuming 5 competitors for (g)Advair (g)Advair Diskus: expected launch as early as mid-2022 Flovent Diskus - 2nd product partnered; clinical trial recruiting on track |
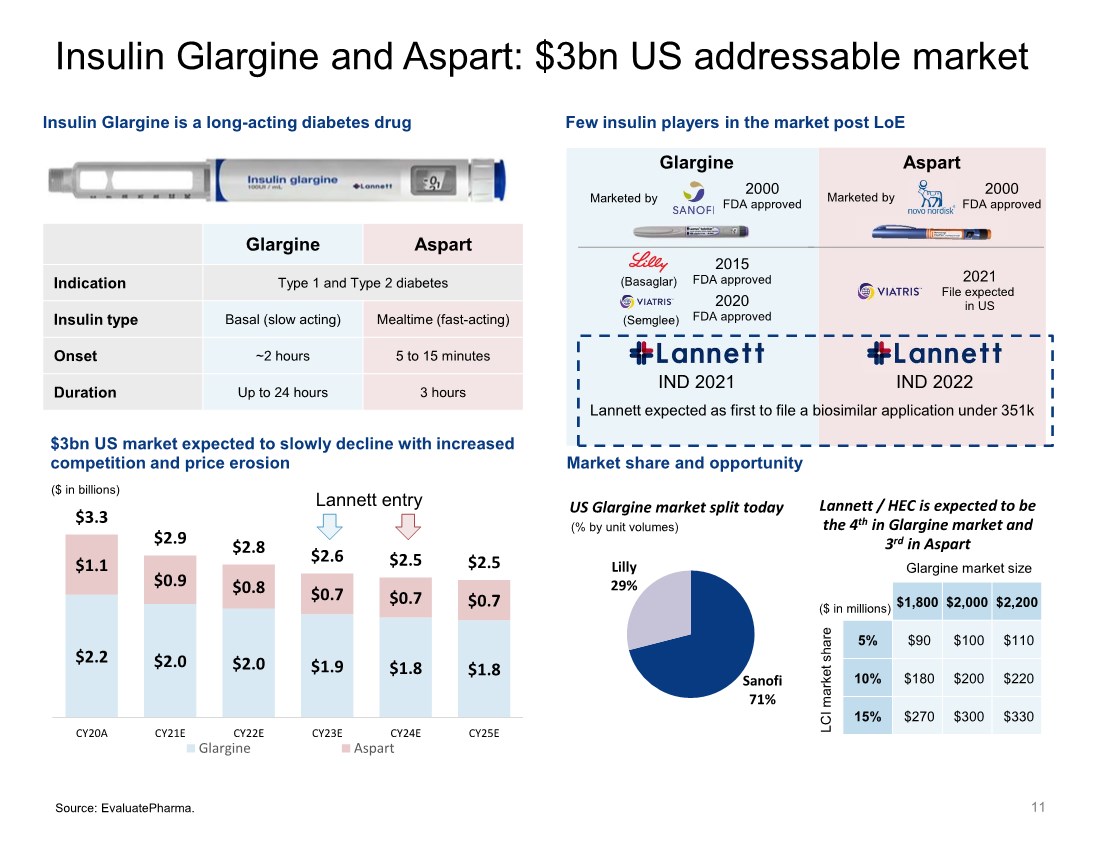
| Sanofi 71% Lilly 29% 11 $2.2 $2.0 $2.0 $1.9 $1.8 $1.8 $1.1 $0.9 $0.8 $0.7 $0.7 $0.7 $3.3 $2.9 $2.8 $2.6 $2.5 $2.5 CY20A CY21E CY22E CY23E CY24E CY25E Glargine Aspart US Glargine market split today Lannett / HEC is expected to be the 4th in Glargine market and 3rd in Aspart Glargine Aspart Indication Type 1 and Type 2 diabetes Insulin type Basal (slow acting) Mealtime (fast-acting) Onset ~2 hours 5 to 15 minutes Duration Up to 24 hours 3 hours Glargine Marketed by 2000 FDA approved 2015 FDA approved 2020 FDA approved Few insulin players in the market post LoE Insulin Glargine is a long-acting diabetes drug Market share and opportunity $3bn US market expected to slowly decline with increased competition and price erosion ($ in billions) IND 2021 Insulin Glargine and Aspart: $3bn US addressable market Aspart Marketed by 2000 FDA approved Lannett entry Source: EvaluatePharma. (Basaglar) (Semglee) IND 2022 2021 File expected in US Lannett expected as first to file a biosimilar application under 351k $1,800 $2,000 $2,200 5% $90 $100 $110 10% $180 $200 $220 15% $270 $300 $330 Glargine market size LCI market share ($ in millions) (% by unit volumes) |
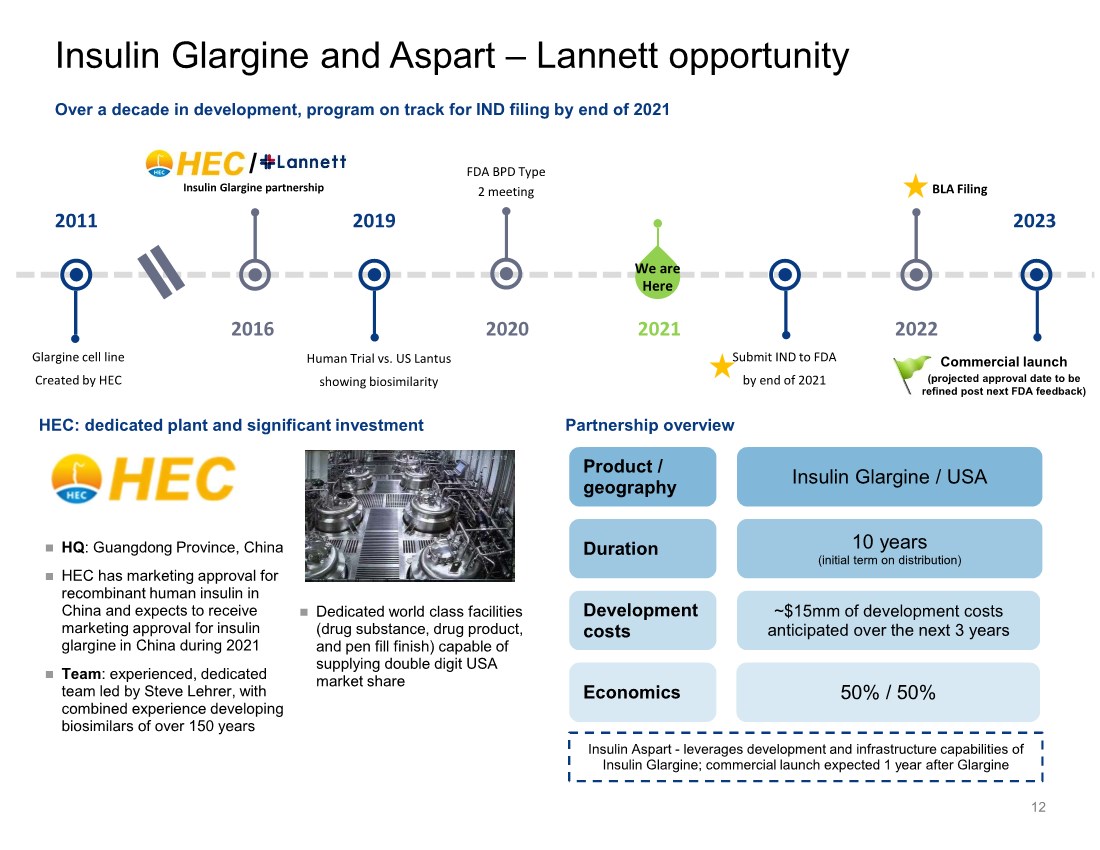
| Insulin Glargine and Aspart – Lannett opportunity 12 2011 Glargine cell line Created by HEC 2019 2020 Human Trial vs. US Lantus showing biosimilarity FDA BPD Type 2 meeting 2021 2022 BLA Filing 2023 We are Here Insulin Glargine partnership 2016 Submit IND to FDA by end of 2021 HEC: dedicated plant and significant investment Partnership overview Over a decade in development, program on track for IND filing by end of 2021 / HQ: Guangdong Province, China HEC has marketing approval for recombinant human insulin in China and expects to receive marketing approval for insulin glargine in China during 2021 Team: experienced, dedicated team led by Steve Lehrer, with combined experience developing biosimilars of over 150 years Dedicated world class facilities (drug substance, drug product, and pen fill finish) capable of supplying double digit USA market share Product / geography Duration Economics Insulin Glargine / USA 10 years (initial term on distribution) 50% / 50% ~$15mm of development costs anticipated over the next 3 years Development costs Insulin Aspart - leverages development and infrastructure capabilities of Insulin Glargine; commercial launch expected 1 year after Glargine Commercial launch (projected approval date to be refined post next FDA feedback) |
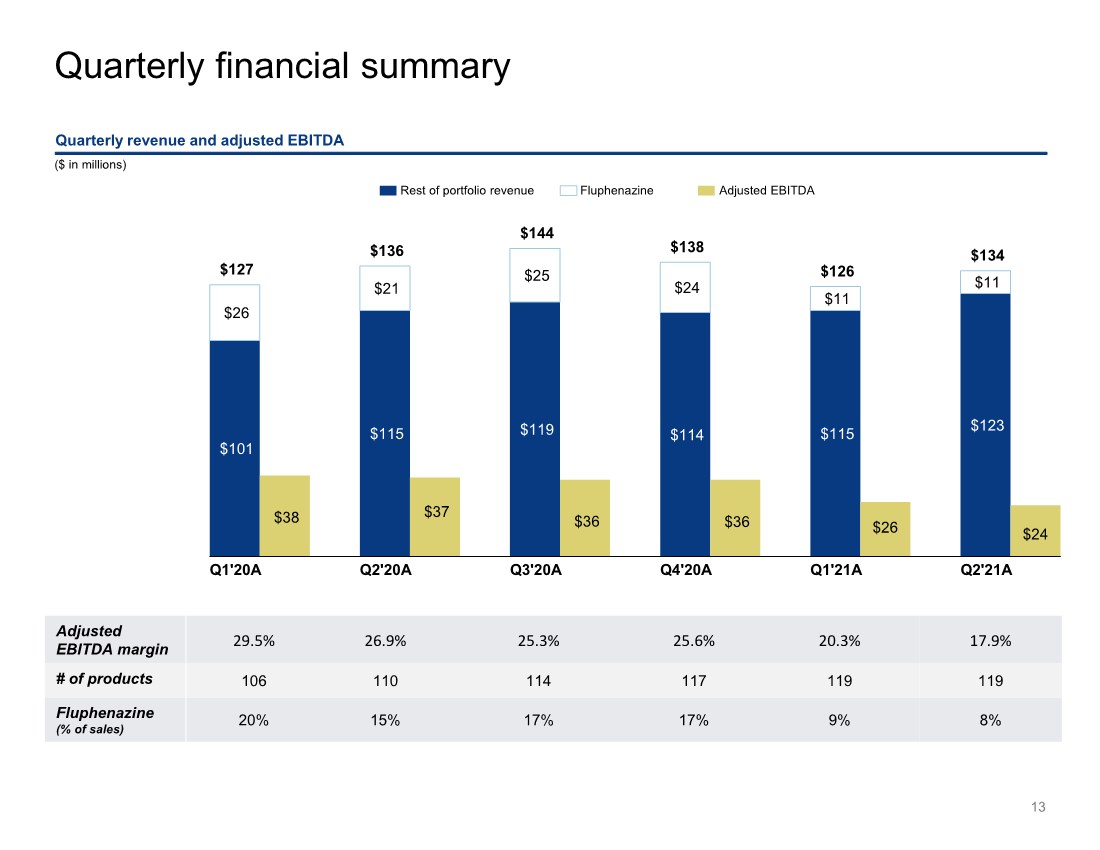
| $101 $115 $119 $114 $115 $123 $26 $21 $25 $24 $11 $11 $38 $37 $36 $36 $26 $24 $127 $136 $144 $138 $126 $134 Q1'20A Q2'20A Q3'20A Q4'20A Q1'21A Q2'21A Quarterly financial summary 13 ($ in millions) Quarterly revenue and adjusted EBITDA Rest of portfolio revenue Fluphenazine Adjusted EBITDA Adjusted EBITDA margin 29.5% 26.9% 25.3% 25.6% 20.3% 17.9% # of products 106 110 114 117 119 119 Fluphenazine (% of sales) 20% 15% 17% 17% 9% 8% |
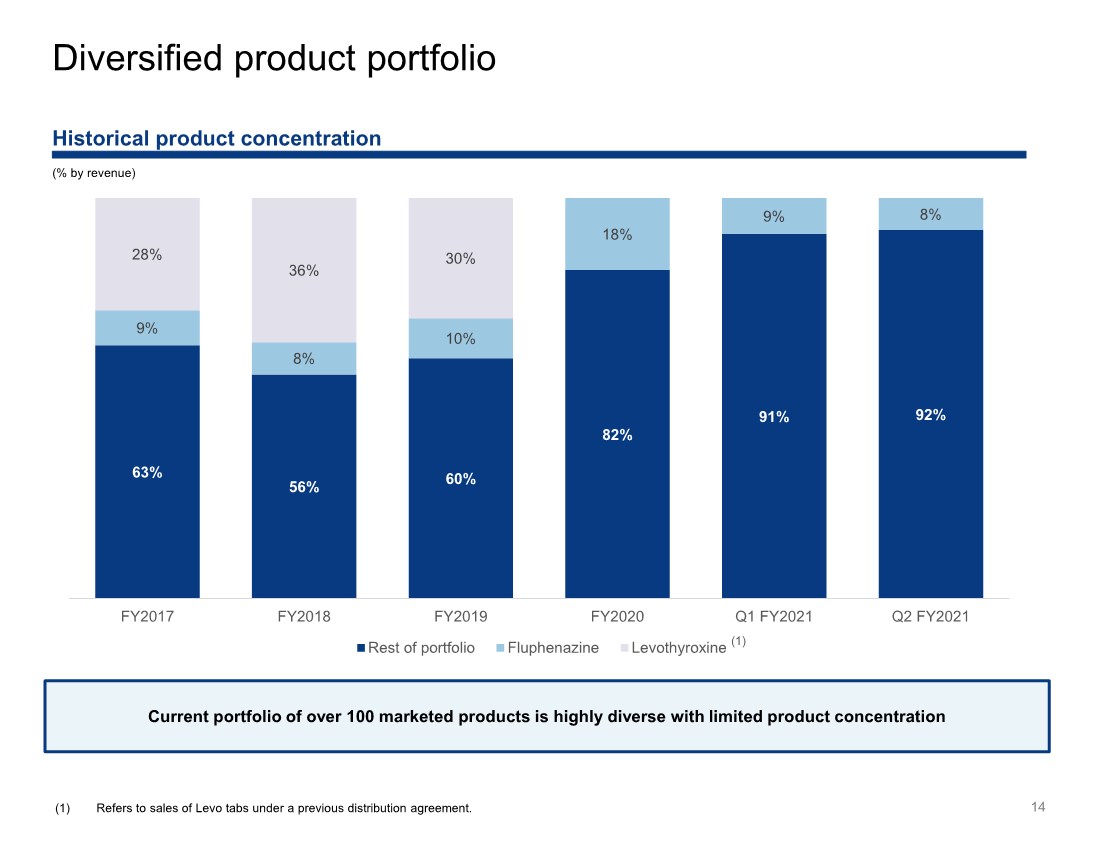
| 14 Historical product concentration (% by revenue) Diversified product portfolio 63% 56% 60% 82% 91% 92% 9% 8% 10% 18% 9% 8% 28% 36% 30% FY2017 FY2018 FY2019 FY2020 Q1 FY2021 Q2 FY2021 Rest of portfolio Fluphenazine Levothyroxine (1) Refers to sales of Levo tabs under a previous distribution agreement. (1) Current portfolio of over 100 marketed products is highly diverse with limited product concentration |
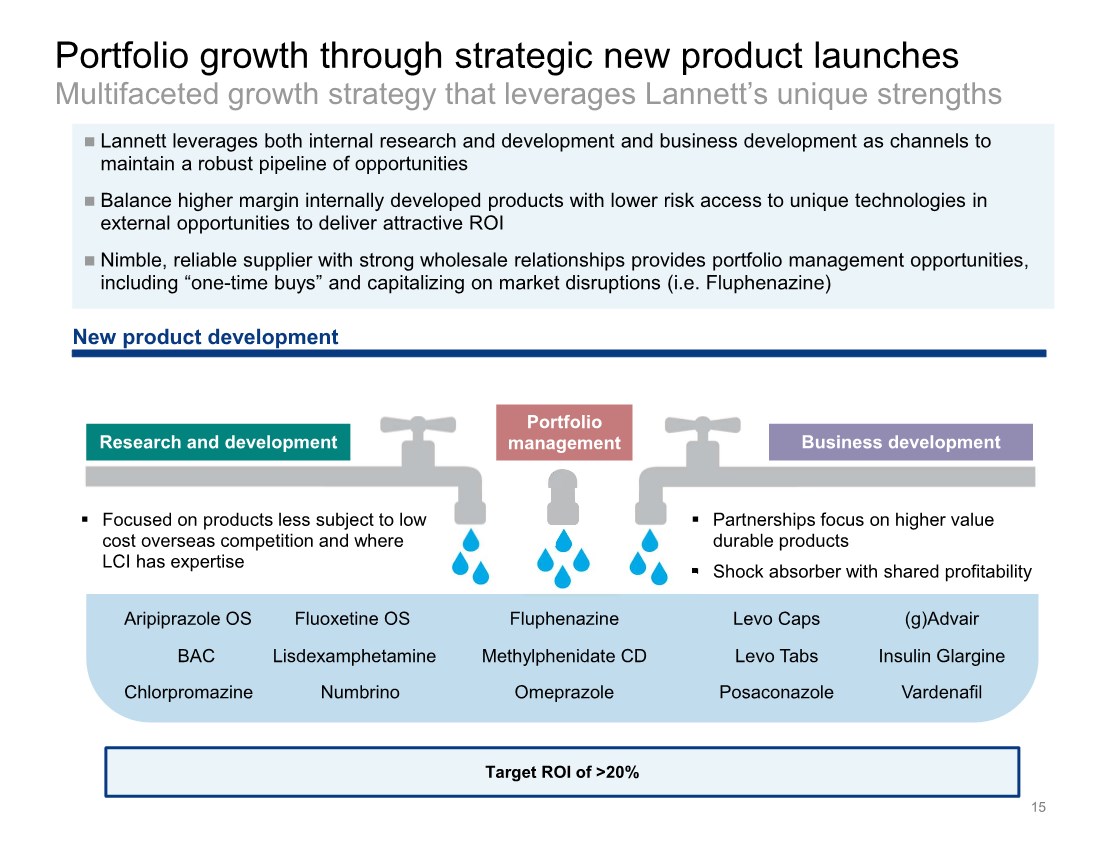
| Lannett leverages both internal research and development and business development as channels to maintain a robust pipeline of opportunities Balance higher margin internally developed products with lower risk access to unique technologies in external opportunities to deliver attractive ROI Nimble, reliable supplier with strong wholesale relationships provides portfolio management opportunities, including “one-time buys” and capitalizing on market disruptions (i.e. Fluphenazine) Portfolio growth through strategic new product launches Multifaceted growth strategy that leverages Lannett’s unique strengths 15 Research and development Business development New product development . Focused on products less subject to low cost overseas competition and where LCI has expertise . Partnerships focus on higher value durable products . Shock absorber with shared profitability Portfolio management Fluphenazine Levo Caps (g)Advair Posaconazole Levo Tabs Numbrino Methylphenidate CD Omeprazole BAC Chlorpromazine Target ROI of >20% Vardenafil Insulin Glargine Aripiprazole OS Fluoxetine OS Lisdexamphetamine |
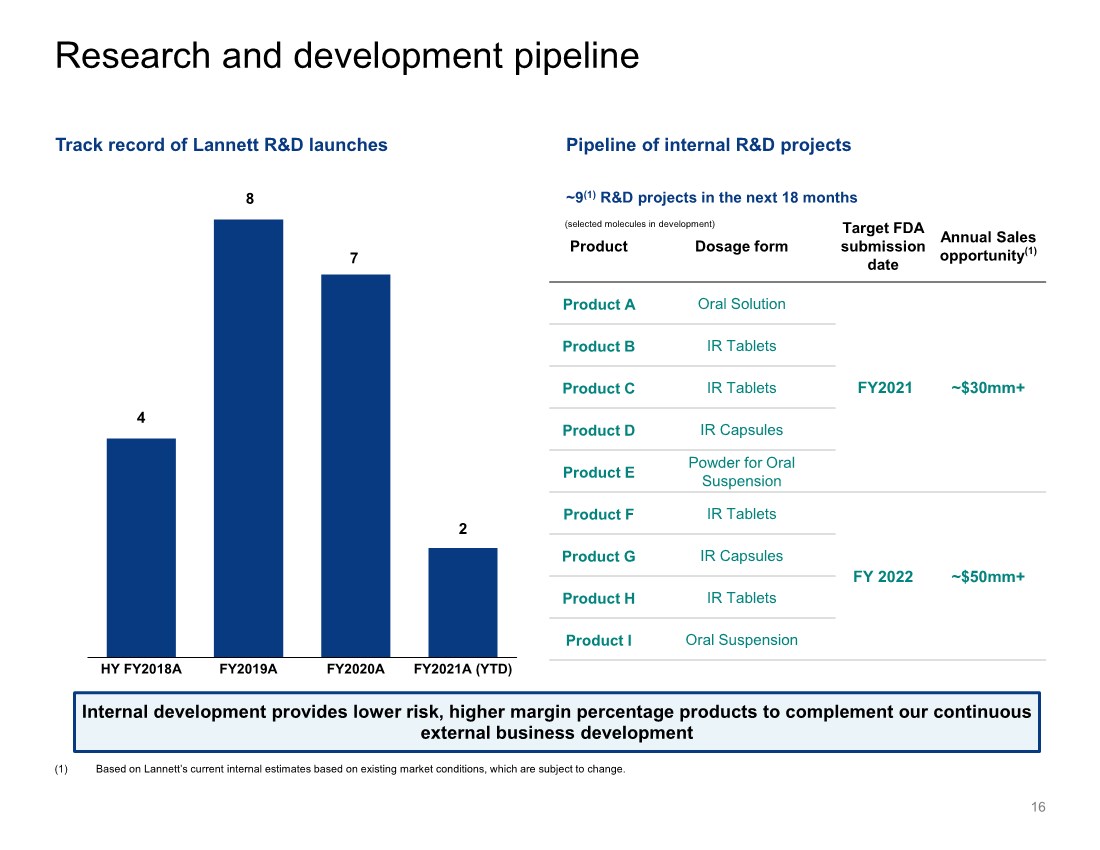
| 4 8 7 2 HY FY2018A FY2019A FY2020A FY2021A (YTD) Research and development pipeline 16 (selected molecules in development) (1) Based on Lannett’s current internal estimates based on existing market conditions, which are subject to change. Track record of Lannett R&D launches Pipeline of internal R&D projects ~9(1) R&D projects in the next 18 months Product Dosage form Target FDA submission date Annual Sales opportunity(1) Product A Oral Solution FY2021 ~$30mm+ Product B IR Tablets Product C IR Tablets Product D IR Capsules Product E Powder for Oral Suspension Product F IR Tablets FY 2022 ~$50mm+ Product G IR Capsules Product H IR Tablets Product I Oral Suspension Internal development provides lower risk, higher margin percentage products to complement our continuous external business development |
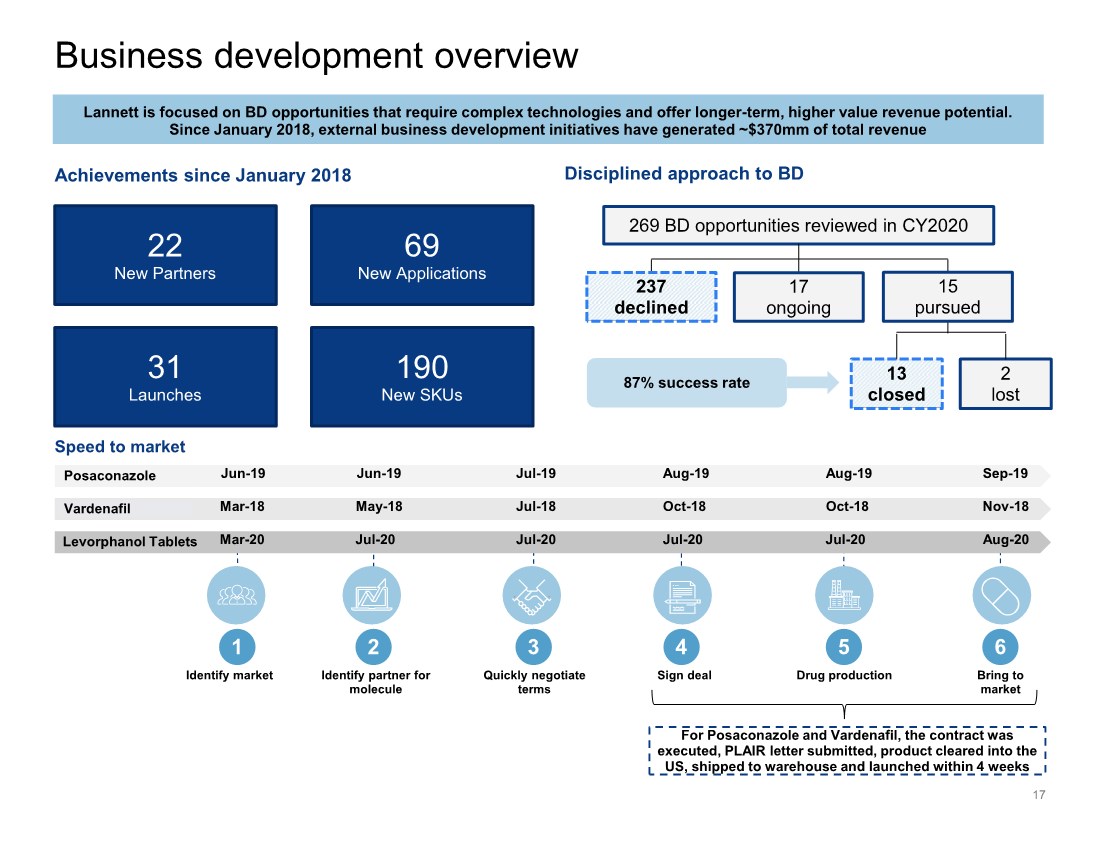
| Business development overview 17 190 New SKUs 69 New Applications 22 New Partners 31 Launches Achievements since January 2018 Lannett is focused on BD opportunities that require complex technologies and offer longer-term, higher value revenue potential. Since January 2018, external business development initiatives have generated ~$370mm of total revenue 269 BD opportunities reviewed in CY2020 2 lost 13 closed 87% success rate 237 declined 17 ongoing 15 pursued Disciplined approach to BD Speed to market Identify market Identify partner for molecule Quickly negotiate terms Sign deal Drug production Bring to market 1 2 3 4 5 6 Mar-18 May-18 Nov-18 Jul-18 Oct-18 Oct-18 Vardenafil For Posaconazole and Vardenafil, the contract was executed, PLAIR letter submitted, product cleared into the US, shipped to warehouse and launched within 4 weeks Jun-19 Jun-19 Sep-19 Jul-19 Aug-19 Aug-19 Posaconazole Mar-20 Jul-20 Aug-20 Jul-20 Jul-20 Jul-20 Levorphanol Tablets |
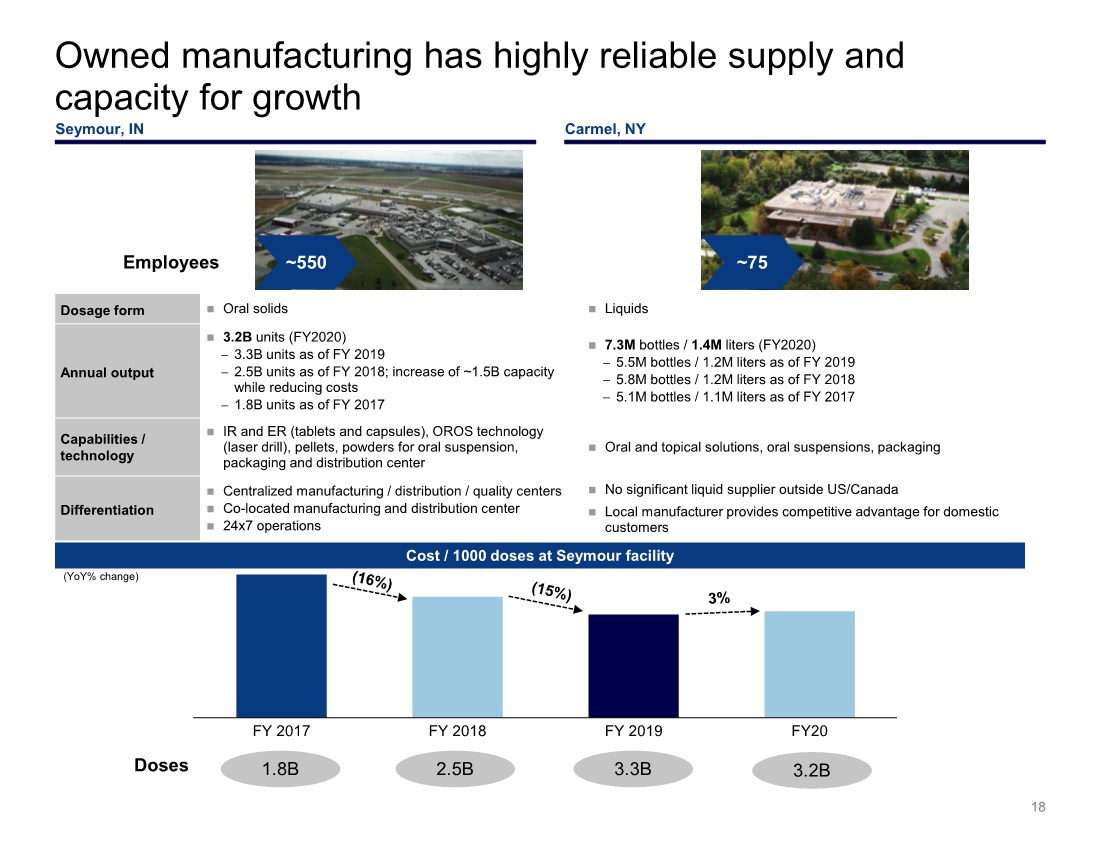
| Doses Owned manufacturing has highly reliable supply and capacity for growth 18 Cost / 1000 doses at Seymour facility Employees ~550 ~75 Dosage form Oral solids Liquids Annual output 3.2B units (FY2020) − 3.3B units as of FY 2019 − 2.5B units as of FY 2018; increase of ~1.5B capacity while reducing costs − 1.8B units as of FY 2017 7.3M bottles / 1.4M liters (FY2020) − 5.5M bottles / 1.2M liters as of FY 2019 − 5.8M bottles / 1.2M liters as of FY 2018 − 5.1M bottles / 1.1M liters as of FY 2017 Capabilities / technology IR and ER (tablets and capsules), OROS technology (laser drill), pellets, powders for oral suspension, packaging and distribution center Oral and topical solutions, oral suspensions, packaging Differentiation Centralized manufacturing / distribution / quality centers Co-located manufacturing and distribution center 24x7 operations No significant liquid supplier outside US/Canada Local manufacturer provides competitive advantage for domestic customers (YoY% change) Seymour, IN Carmel, NY FY 2017 FY 2018 FY 2019 FY20 1.8B 2.5B 3.3B 3.2B |
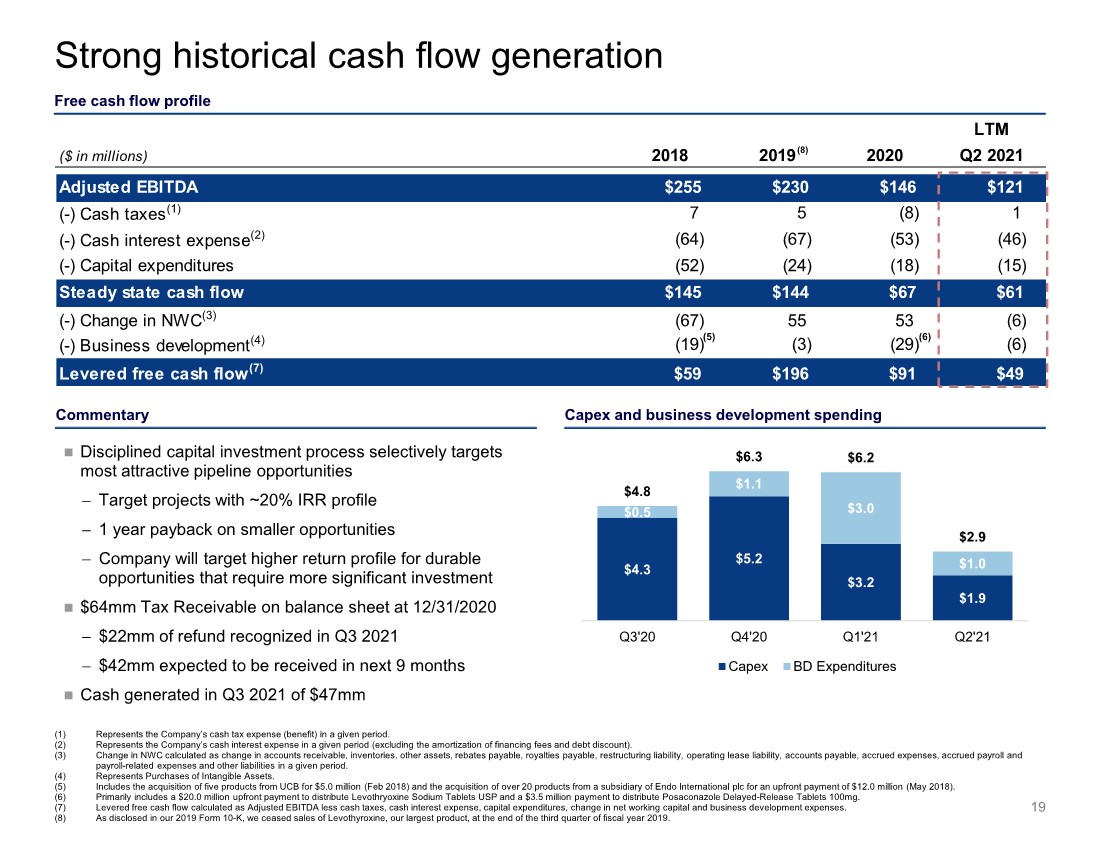
| $4.3 $5.2 $3.2 $1.9 $0.5 $1.1 $3.0 $1.0 $4.8 $6.3 $6.2 $2.9 0 1 2 3 4 5 6 7 8 Q3'20 Q4'20 Q1'21 Q2'21 Capex BD Expenditures Commentary LTM ($ in millions) 2018 2019 2020 Q2 2021 Adjusted EBITDA $255 $230 $146 $121 (-) Cash taxes(1) 7 5 (8) 1 (-) Cash interest expense(2) (64) (67) (53) (46) (-) Capital expenditures (52) (24) (18) (15) Steady state cash flow $145 $144 $67 $61 (-) Change in NWC(3) (67) 55 53 (6) (-) Business development(4) (19) (3) (29) (6) Levered free cash flow(7) $59 $196 $91 $49 Strong historical cash flow generation Free cash flow profile (1) Represents the Company’s cash tax expense (benefit) in a given period. (2) Represents the Company’s cash interest expense in a given period (excluding the amortization of financing fees and debt discount). (3) Change in NWC calculated as change in accounts receivable, inventories, other assets, rebates payable, royalties payable, restructuring liability, operating lease liability, accounts payable, accrued expenses, accrued payroll and payroll-related expenses and other liabilities in a given period. (4) Represents Purchases of Intangible Assets. (5) Includes the acquisition of five products from UCB for $5.0 million (Feb 2018) and the acquisition of over 20 products from a subsidiary of Endo International plc for an upfront payment of $12.0 million (May 2018). (6) Primarily includes a $20.0 million upfront payment to distribute Levothryoxine Sodium Tablets USP and a $3.5 million payment to distribute Posaconazole Delayed-Release Tablets 100mg. (7) Levered free cash flow calculated as Adjusted EBITDA less cash taxes, cash interest expense, capital expenditures, change in net working capital and business development expenses. (8) As disclosed in our 2019 Form 10-K, we ceased sales of Levothyroxine, our largest product, at the end of the third quarter of fiscal year 2019. 19 (8) (6) (5) Disciplined capital investment process selectively targets most attractive pipeline opportunities − Target projects with ~20% IRR profile − 1 year payback on smaller opportunities − Company will target higher return profile for durable opportunities that require more significant investment $64mm Tax Receivable on balance sheet at 12/31/2020 − $22mm of refund recognized in Q3 2021 − $42mm expected to be received in next 9 months Cash generated in Q3 2021 of $47mm Capex and business development spending |
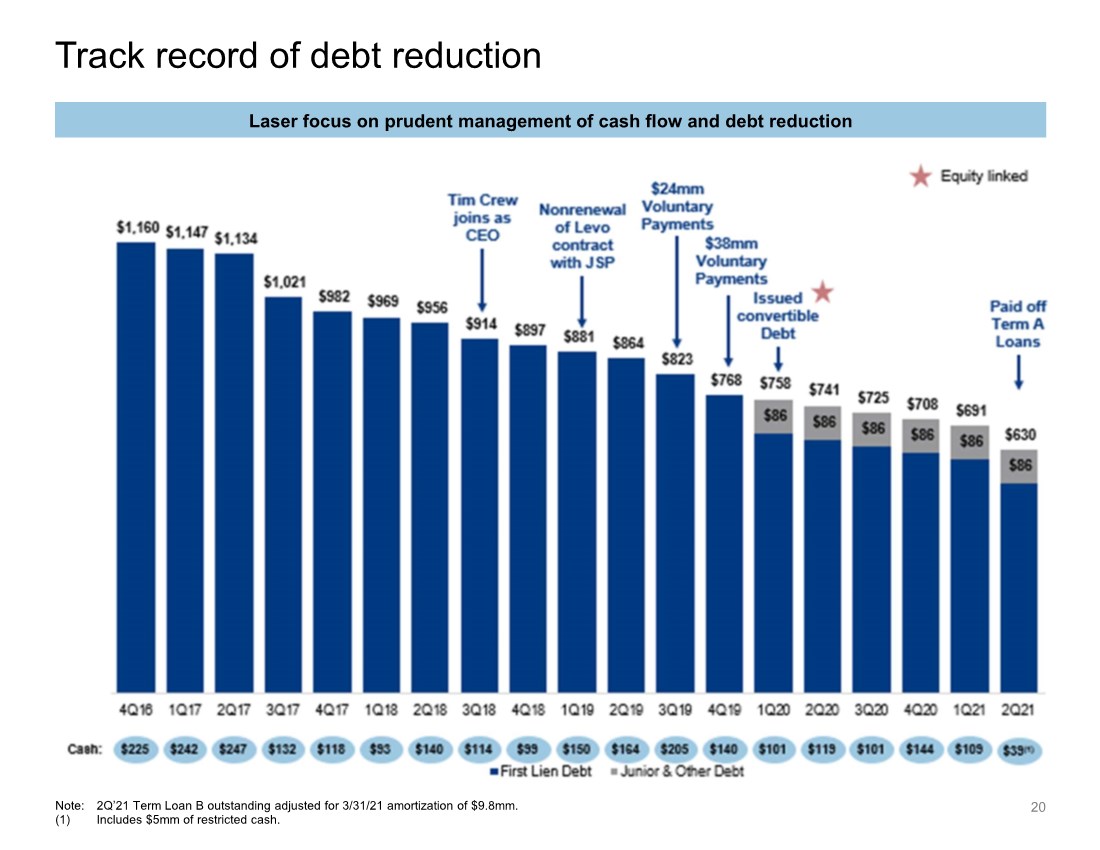
| Track record of debt reduction 20 Note: 2Q’21 Term Loan B outstanding adjusted for 3/31/21 amortization of $9.8mm. (1) Includes $5mm of restricted cash. Laser focus on prudent management of cash flow and debt reduction |
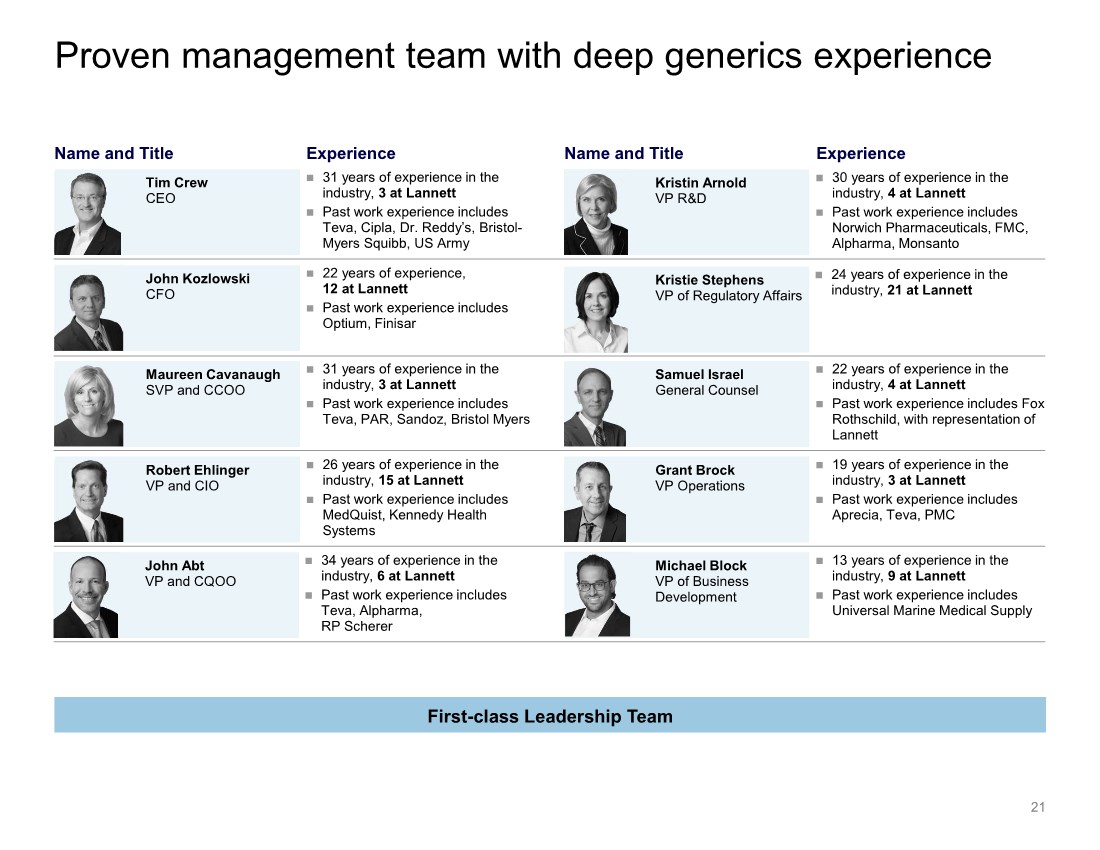
| First-class Leadership Team Proven management team with deep generics experience 21 Experience Name and Title Experience Name and Title Tim Crew CEO 31 years of experience in the industry, 3 at Lannett Past work experience includes Teva, Cipla, Dr. Reddy’s, Bristol- Myers Squibb, US Army Kristin Arnold VP R&D 30 years of experience in the industry, 4 at Lannett Past work experience includes Norwich Pharmaceuticals, FMC, Alpharma, Monsanto Maureen Cavanaugh SVP and CCOO 31 years of experience in the industry, 3 at Lannett Past work experience includes Teva, PAR, Sandoz, Bristol Myers Samuel Israel General Counsel 22 years of experience in the industry, 4 at Lannett Past work experience includes Fox Rothschild, with representation of Lannett Robert Ehlinger VP and CIO 26 years of experience in the industry, 15 at Lannett Past work experience includes MedQuist, Kennedy Health Systems Grant Brock VP Operations 19 years of experience in the industry, 3 at Lannett Past work experience includes Aprecia, Teva, PMC John Kozlowski CFO 22 years of experience, 12 at Lannett Past work experience includes Optium, Finisar Kristie Stephens VP of Regulatory Affairs 24 years of experience in the industry, 21 at Lannett John Abt VP and CQOO 34 years of experience in the industry, 6 at Lannett Past work experience includes Teva, Alpharma, RP Scherer Michael Block VP of Business Development 13 years of experience in the industry, 9 at Lannett Past work experience includes Universal Marine Medical Supply |
| FINANCIAL SUMMARY |
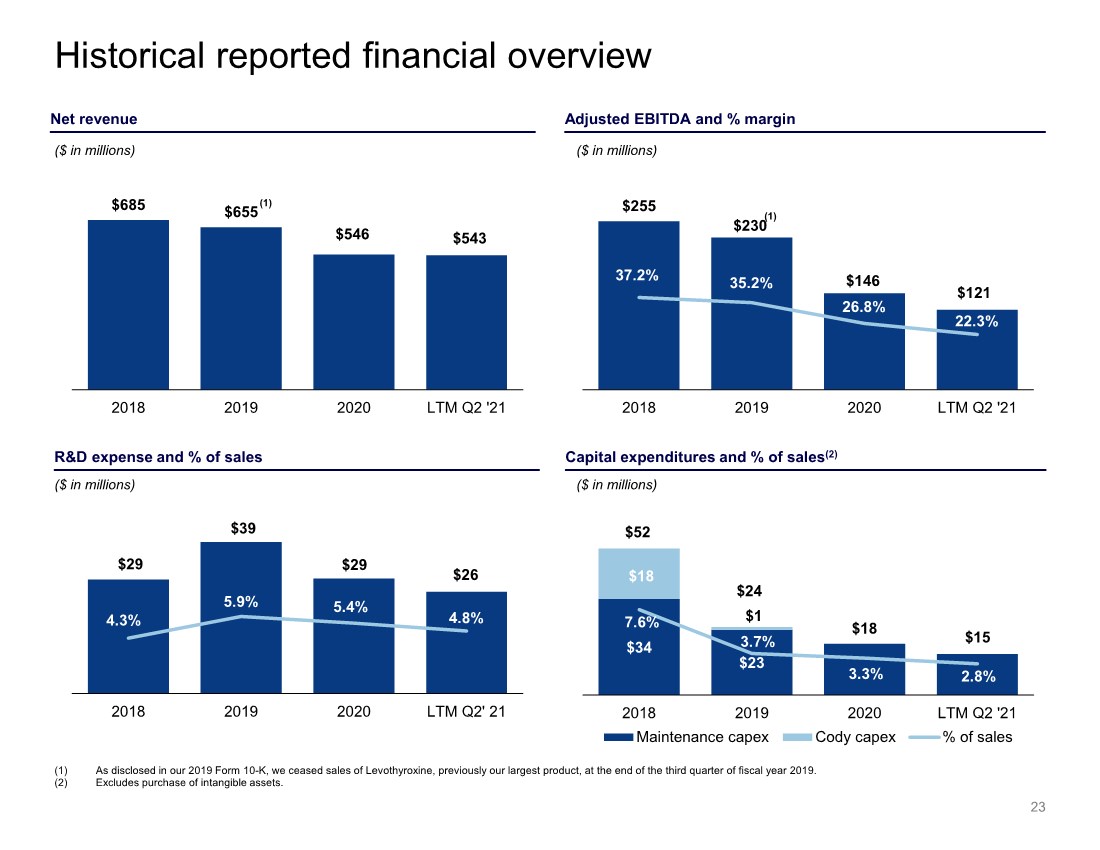
| $255 $230 $146 $121 37.2% 35.2% 26.8% 22.3% 2018 2019 2020 LTM Q2 '21 $685 $655 $546 $543 2018 2019 2020 LTM Q2 '21 Historical reported financial overview (1) As disclosed in our 2019 Form 10-K, we ceased sales of Levothyroxine, previously our largest product, at the end of the third quarter of fiscal year 2019. (2) Excludes purchase of intangible assets. Capital expenditures and % of sales(2) R&D expense and % of sales $29 $39 $29 $26 4.3% 5.9% 5.4% 4.8% 2018 2019 2020 LTM Q2' 21 ($ in millions) ($ in millions) ($ in millions) ($ in millions) Adjusted EBITDA and % margin Net revenue (1) 23 $34 $23 $18 $1 7.6% 3.7% 3.3% 2.8% 2018 2019 2020 LTM Q2 '21 Maintenance capex Cody capex % of sales $52 $24 $18 $15 (1) |
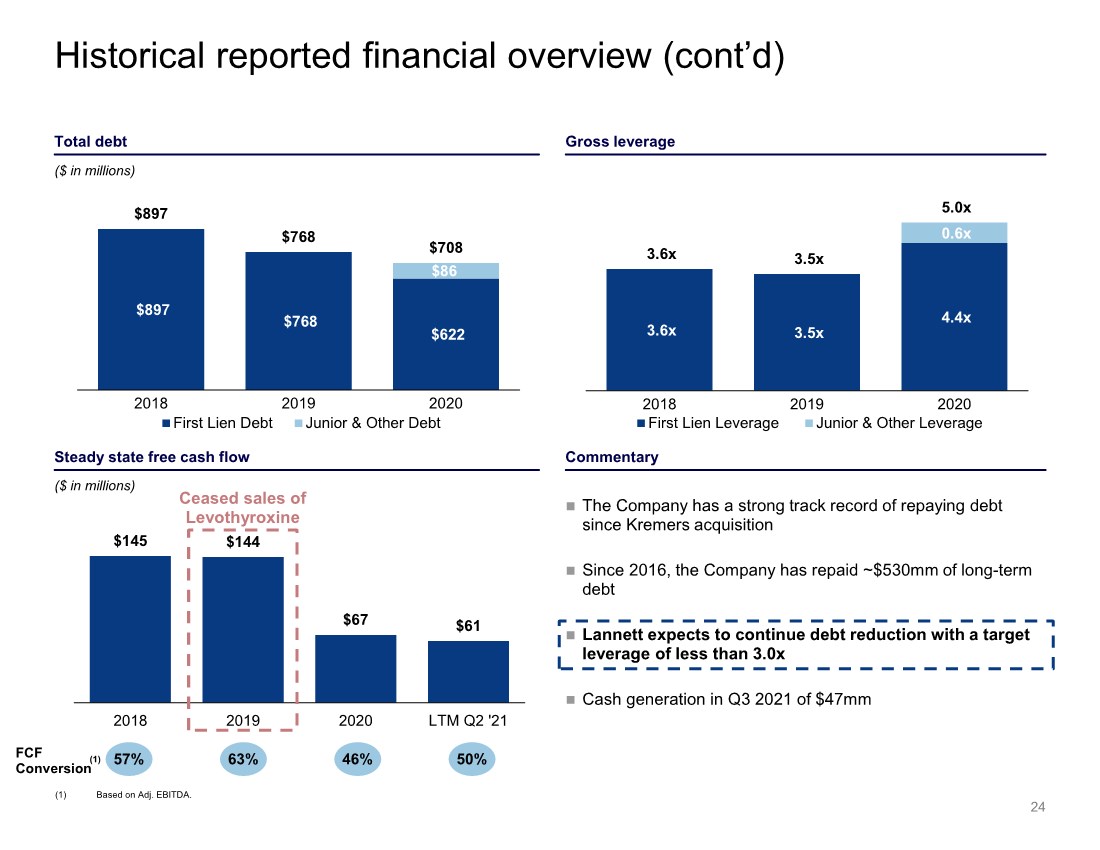
| $145 $144 $67 $61 2018 2019 2020 LTM Q2 '21 Ceased sales of Levothyroxine 3.6x 3.5x 4.4x 0.6x 3.6x 3.5x 5.0x 2018 2019 2020 First Lien Leverage Junior & Other Leverage $897 $768 $622 $86 $897 $768 $708 2018 2019 2020 First Lien Debt Junior & Other Debt Historical reported financial overview (cont’d) 24 Gross leverage Total debt Commentary Steady state free cash flow The Company has a strong track record of repaying debt since Kremers acquisition Since 2016, the Company has repaid ~$530mm of long-term debt Lannett expects to continue debt reduction with a target leverage of less than 3.0x Cash generation in Q3 2021 of $47mm ($ in millions) ($ in millions) 57% FCF Conversion 63% 46% 50% (1) (1) Based on Adj. EBITDA. |
| APPENDIX |
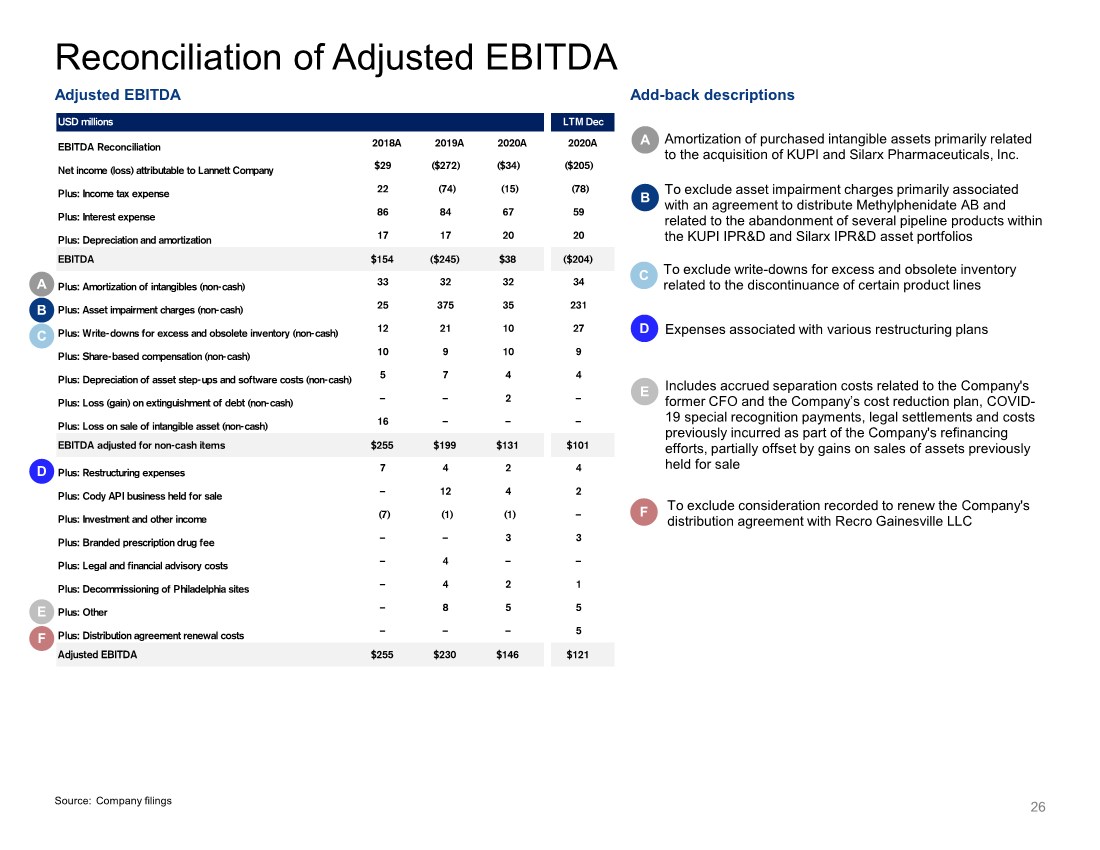
| USD millions LTM Dec EBITDA Reconciliation 2018A 2019A 2020A 2020A Net income (loss) attributable to Lannett Company $29 ($272) ($34) ($205) Plus: Income tax expense 22 (74) (15) (78) Plus: Interest expense 86 84 67 59 Plus: Depreciation and amortization 17 17 20 20 EBITDA $154 ($245) $38 ($204) Plus: Amortization of intangibles (non-cash) 33 32 32 34 Plus: Asset impairment charges (non-cash) 25 375 35 231 Plus: Write-downs for excess and obsolete inventory (non-cash) 12 21 10 27 Plus: Share-based compensation (non-cash) 10 9 10 9 Plus: Depreciation of asset step-ups and software costs (non-cash) 5 7 4 4 Plus: Loss (gain) on extinguishment of debt (non-cash) – – 2 – Plus: Loss on sale of intangible asset (non-cash) 16 – – – EBITDA adjusted for non-cash items $255 $199 $131 $101 Plus: Restructuring expenses 7 4 2 4 Plus: Cody API business held for sale – 12 4 2 Plus: Investment and other income (7) (1) (1) – Plus: Branded prescription drug fee – – 3 3 Plus: Legal and financial advisory costs – 4 – – Plus: Decommissioning of Philadelphia sites – 4 2 1 Plus: Other – 8 5 5 Plus: Distribution agreement renewal costs – – – 5 Adjusted EBITDA $255 $230 $146 $121 26 Reconciliation of Adjusted EBITDA A Amortization of purchased intangible assets primarily related to the acquisition of KUPI and Silarx Pharmaceuticals, Inc. A B C D E F C Expenses associated with various restructuring plans D To exclude write-downs for excess and obsolete inventory related to the discontinuance of certain product lines Includes accrued separation costs related to the Company's former CFO and the Company’s cost reduction plan, COVID- 19 special recognition payments, legal settlements and costs previously incurred as part of the Company's refinancing efforts, partially offset by gains on sales of assets previously held for sale E To exclude consideration recorded to renew the Company's distribution agreement with Recro Gainesville LLC F B To exclude asset impairment charges primarily associated with an agreement to distribute Methylphenidate AB and related to the abandonment of several pipeline products within the KUPI IPR&D and Silarx IPR&D asset portfolios Adjusted EBITDA Add-back descriptions Source: Company filings |
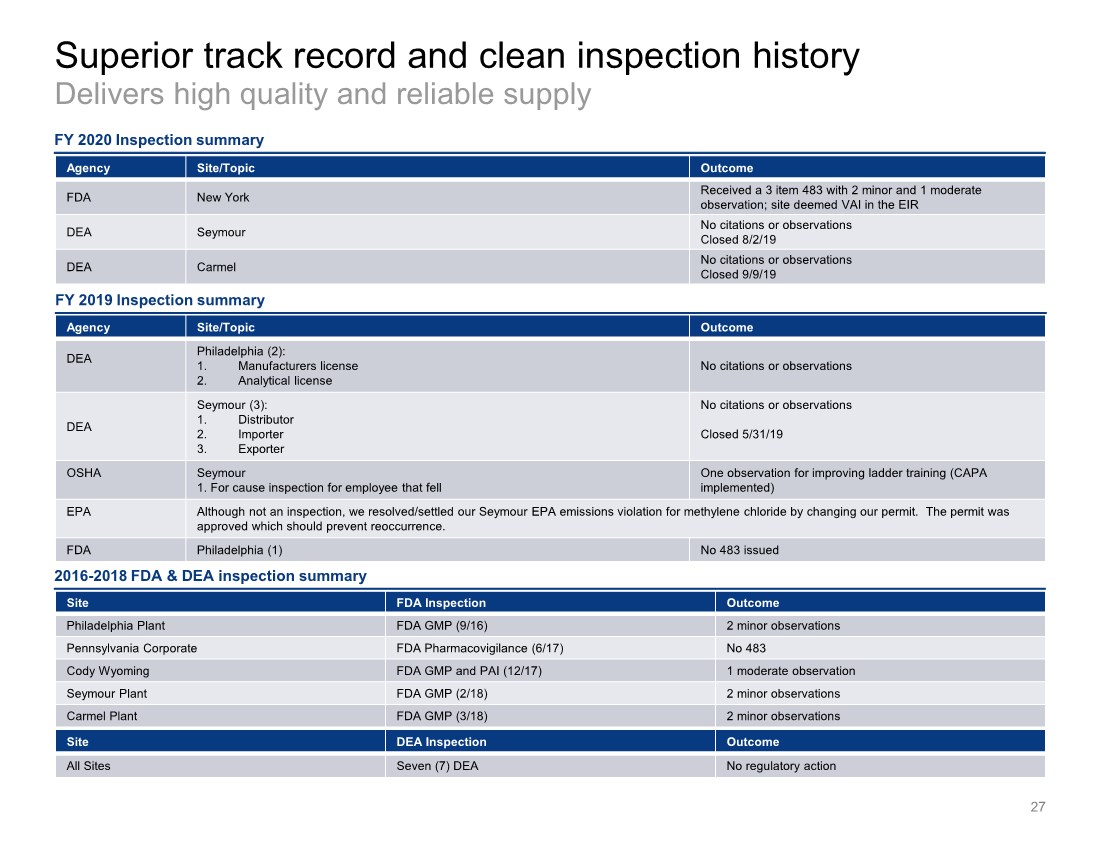
| Superior track record and clean inspection history Delivers high quality and reliable supply 27 Agency Site/Topic Outcome DEA Philadelphia (2): 1. Manufacturers license 2. Analytical license No citations or observations DEA Seymour (3): 1. Distributor 2. Importer 3. Exporter No citations or observations Closed 5/31/19 OSHA Seymour 1. For cause inspection for employee that fell One observation for improving ladder training (CAPA implemented) EPA Although not an inspection, we resolved/settled our Seymour EPA emissions violation for methylene chloride by changing our permit. The permit was approved which should prevent reoccurrence. FDA Philadelphia (1) No 483 issued FY 2020 Inspection summary Site FDA Inspection Outcome PhiladelphiaPlant FDA GMP(9/16) 2 minor observations Pennsylvania Corporate FDAPharmacovigilance (6/17) No 483 Cody Wyoming FDA GMP and PAI (12/17) 1 moderateobservation Seymour Plant FDA GMP (2/18) 2 minor observations Carmel Plant FDA GMP (3/18) 2 minor observations Site DEA Inspection Outcome All Sites Seven (7) DEA No regulatory action 2016-2018 FDA & DEA inspection summary Agency Site/Topic Outcome FDA New York Received a 3 item 483 with 2 minor and 1 moderate observation; site deemed VAI in the EIR DEA Seymour No citations or observations Closed 8/2/19 DEA Carmel No citations or observations Closed 9/9/19 FY 2019 Inspection summary |
|