Attached files
| file | filename |
|---|---|
| EX-21.1 - EX-21.1 - LANNETT CO INC | a18-14506_1ex21d1.htm |
| EX-32 - EX-32 - LANNETT CO INC | a18-14506_1ex32.htm |
| EX-31.2 - EX-31.2 - LANNETT CO INC | a18-14506_1ex31d2.htm |
| EX-31.1 - EX-31.1 - LANNETT CO INC | a18-14506_1ex31d1.htm |
| EX-23.1 - EX-23.1 - LANNETT CO INC | a18-14506_1ex23d1.htm |
UNITED STATES
SECURITIES AND EXCHANGE COMMISSION
Washington, D.C. 20549
FORM 10-K
(Mark One)
x ANNUAL REPORT UNDER SECTION 13 OR 15(d) OF THE SECURITIES EXCHANGE ACT OF 1934
For the fiscal year ended June 30, 2018
OR
o TRANSITION REPORT UNDER SECTION 13 OR 15(d) OF THE SECURITIES EXCHANGE ACT OF 1934
For the transition period from to
Commission File No. 001-31298
LANNETT COMPANY, INC.
(Exact name of registrant as specified in its charter)
|
State of Delaware |
|
23-0787699 |
|
State of Incorporation |
|
I.R.S. Employer I.D. No. |
9000 State Road
Philadelphia, Pennsylvania 19136
Registrant’s telephone number, including area code: (215) 333-9000
(Address of principal executive offices and telephone number)
Securities registered under Section 12(b) of the Exchange Act:
Common Stock, $.001 Par Value
(Title of class)
Securities registered under Section 12(g) of the Exchange Act: None
Indicate by check mark if the registrant is a well-known seasoned issuer, as defined in Rule 405 of the Securities Act. Yes x No o
Indicate by check mark if the registrant is not required to file reports pursuant to Section 13 or Section 15(d) of the Act. Yes o No x
Indicate by check mark whether the registrant (1) has filed all reports required to be filed by Section 13 or 15(d) of the Securities Exchange Act of 1934 during the preceding 12 months (or for such shorter period that the registrant was required to file such reports) and (2) has been subject to such filing requirements for the past 90 days. Yes x No o
Indicate by check mark if disclosure of delinquent filers pursuant to Item 405 of Regulation S-K is not contained herein and will not be contained, to the best of registrant’s knowledge, in definitive proxy or information statements incorporated by reference in Part III of this Form 10-K or any amendment to this Form 10-K. o
Indicate by check mark whether the registrant is a large accelerated filer, an accelerated filer, a non-accelerated filer, or a smaller reporting company. See definitions of “large accelerated filer,” “accelerated filer,” “smaller reporting company” and “emerging growth company” in Rule 12b-2 of the Exchange Act. (Check one):
|
Large accelerated filer x |
Accelerated filer o |
|
|
|
|
Non-accelerated filer o |
Smaller reporting company o |
|
(Do not check if a smaller reporting company) |
Emerging growth company o |
Indicate by check mark whether the registrant has submitted electronically and posted on its corporate Web site, if any, every Interactive Data File required to be submitted and posted pursuant to Rule 405 of Regulation S-T (§232.405 of this chapter) during the preceding 12 months (or for such shorter period that the registrant was required to submit and post such files). Yes x No o
If an emerging growth company, indicate by check mark if the registrant has elected not to use the extended transition period for complying with any new or revised financial accounting standards provided pursuant to Section 13(a) of the Exchange Act. o
Indicate by check mark whether the registrant is a shell company (as defined in Rule 12B-12 of the Exchange Act). Yes o No x
Aggregate market value of common stock held by non-affiliates of the registrant, as of December 31, 2017 was $661,533,778 based on the closing price of the stock on the NYSE.
As of July 31, 2018, there were 38,901,532 shares of the registrant’s common stock, $.001 par value, outstanding.
CAUTIONARY STATEMENT REGARDING FORWARD-LOOKING STATEMENTS
This Annual Report on Form 10-K contains forward-looking statements. Any statements made in this Annual Report that are not statements of historical fact or that refer to estimated or anticipated future events are forward-looking statements. We have based our forward-looking statements on management’s beliefs and assumptions based on information available to them at this time. Without limiting the generality of the foregoing, words such as “may,” “will,” “expect,” “believe,” “anticipate,” “intend,” “could,” “would,” “estimate,” “continue,” or “pursue,” or the negative other variations thereof or comparable terminology, are intended to identify forward-looking statements. Such forward-looking statements reflect our current perspective of our business, future performance, existing trends and information as of the date of this filing. These include, but are not limited to the impact of the nonrenewal of the exclusive distribution agreement with Jerome Stevens Pharmaceuticals on our future business and prospects, our beliefs about future revenue and expense levels, growth rates, prospects related to our strategic initiatives and business strategies, express or implied assumptions about government regulatory action or inaction, anticipated product approvals and launches, business initiatives and product development activities, assessments related to clinical trial results, product performance and competitive environment, anticipated financial performance and integration of acquisitions. The statements are not guarantees of future performance and involve certain risks, uncertainties and assumptions that are difficult to predict. We caution the reader that certain important factors may affect our actual operating results and could cause such results to differ materially from those expressed or implied by forward-looking statements. We believe the risks and uncertainties discussed under the “Item 1A - Risk Factors” and other risks and uncertainties detailed herein and from time to time in our SEC filings may affect our actual results.
We disclaim any obligation to publicly update any forward-looking statements, whether as a result of new information, future events or otherwise. We also may make additional disclosures in our Quarterly Reports on Form 10-Q, Current Reports on Form 8-K and in other filings that we may make from time to time with the SEC. Other factors besides those listed here could also adversely affect us.
ITEM 1. DESCRIPTION OF BUSINESS
Business Overview
Lannett Company, Inc. and subsidiaries (the “Company,” “Lannett,” “we,” or “us”) was incorporated in 1942 under the laws of the Commonwealth of Pennsylvania and reincorporated in 1991 as a Delaware corporation. We primarily develop, manufacture, market and distribute generic versions of brand pharmaceutical products. We report financial information on a quarterly and fiscal year basis with the most recent being the fiscal year ended June 30, 2018. All references herein to a “fiscal year” or “Fiscal” refer to the applicable fiscal year ended June 30.
The Company has experienced total net sales growth at a compounded annual growth rate in excess of 27% over the past seventeen years. In that time period, total net sales increased from $12.1 million in fiscal year 2001 to $684.6 million in fiscal year 2018. This growth has been achieved through filing and receiving approvals for abbreviated new drug applications (“ANDAs”), strategic partnerships and launches of additional manufactured drugs, opportunities resulting from our strong historical record of regulatory compliance, as well as the acquisitions of Silarx Pharmaceuticals, Inc. (“Silarx”) and Kremers Urban Pharmaceuticals Inc. (“KUPI”).
Most products that we currently manufacture and/or distribute are prescription products. Our top five products in fiscal years 2018, 2017 and 2016 accounted for 58%, 53% and 57% of total net sales, respectively. On August 20, 2018, the Company announced that its distribution agreement (the “JSP Distribution Agreement”) with Jerome Stevens Pharmaceuticals (“JSP”), which expires on March 23, 2019 will not be renewed. Accordingly, future compounded annual growth rates and top product concentration rates will decline. Net sales of JSP products, primarily Levothyroxine Sodium Tablets USP, which is one of our top five products, totaled $253.1 million, $187.0 million and $190.4 million in fiscal year 2018, 2017 and 2016, respectively, or 37%, 30% and 35% of total net sales, respectively.
Competitive Strengths
Dependable U.S. Based Supplier to our Customers. We believe we are viewed within the generic pharmaceutical industry as a strong, dependable supplier due in part to our agile and reliable operations network, as well as having a less complex manufacturing/supply chain based mostly within the U.S. We have cultivated strong and dependable customer relationships by focusing what is important to our customers and patients along with maintaining adequate inventory levels, employing a responsive order filling system and prioritizing timely fulfillment of those orders. A majority of our orders are filled and shipped on or the day after we receive the order.
Market Orientation. We believe that our success depends on our ability to properly assess the competitive market for new products, including market share, the number of competitors and the generic unit price erosion. We intend to reduce our exposure to competitive influences that may negatively affect our sales and profits, including the potential saturation of the market for certain products, by continuing to emphasize maintenance of a strong product selection process with a focus on internal development where we have technological expertise and external development partnerships for other technologies.
Extensive Experience with Productive Partnerships. We continue to grow, diversify and strengthen our business by entering into partnerships to distribute both externally developed products and authorized generic equivalents of brand products. In fiscal year 2018, we successfully launched products such as Diclofenac Sodium ER tablets (Voltaren SR®), Metoprolol Succinate ER tablets (Toprol XR®) and Niacin ER tablets (Niaspan®). We believe that our success with these products, along with existing alliances, has established us as a strong distribution partner creating the foundation for continued productive partnership alliances in the future.
Ability to Develop Successful Products and Achieve Scale in Production. We believe that our ability to select viable products for development, efficiently develop such products, including obtaining any applicable regulatory approvals and achieve economies of scale in production are critical to our success in the generic pharmaceutical industry. We intend to focus on long-term profitability driven in part by securing market positions where fewer competitors are expected.
Strong Track Record of Obtaining Regulatory Approvals for New Products. During the past three fiscal years, we have received 17 approved ANDAs from the Food and Drug Administration (the “FDA”). Although the timing of ANDA approvals by the FDA is uncertain, we currently expect to receive several more during Fiscal 2019. These regulatory approvals will enable us to manufacture and supply a broader portfolio of generic pharmaceutical products.
Efficient Development Systems and Manufacturing Expertise for New Products. We believe that our manufacturing expertise, low overhead expenses and skilled product development can help us remain competitive in the generic pharmaceutical market. We intend to dedicate significant capital toward developing new products because we believe our success is linked to our ability to continually introduce new generic products into the marketplace.
Reputation for Regulatory Compliance. We have a strong track record of regulatory compliance. We believe that we have strong effective regulatory compliance capabilities and practices due to the hiring of qualified individuals and the implementation of strong current Good Manufacturing Practices (“cGMP”). Our agility in responding quickly to market events and a reputation for regulatory compliance position us to avail ourselves of market opportunities as they are presented to us.
In addition, narcotics which are classified by the Drug Enforcement Agency (“DEA”) as “controlled drugs” are subject to a rigorous regulatory compliance regimen. We have been granted a license from the DEA to import raw concentrated poppy straw for conversion into commercial APIs. Such licenses are renewed annually and non-compliance could result in a license not being renewed. As a result, we believe that our strong reputation for regulatory compliance allows us to have a competitive edge in managing the production and distribution of controlled drugs.
Business Strategies
Continue to Broaden our Product Lines Through Internal Development and Strategic Partnerships.
We are focused on increasing our market share in the generic pharmaceutical industry while concentrating additional resources on the development of new products, including controlled substance products. We continue to improve our financial performance by expanding our line of generic products, increasing unit sales to current customers, creating manufacturing efficiencies and managing our overhead and administrative costs.
We have three primary strategies for expanding our product offerings: (1) deploying our experienced R&D staff to develop products in-house; (2) entering into product development agreements or strategic alliances with third-party product developers and formulators; and (3) purchasing ANDAs or New Drug Application’s (“NDA”) from other manufacturers. We expect that each strategy will facilitate our identification, selection and development of additional pharmaceutical products that we may distribute through our existing network of customers.
Due to the expiration of the JSP Distribution Agreement in March 2019, management is re-assessing its overall business strategies. Although management cannot predict with certainty the precise impact its plans will have on offsetting the loss of the JSP Distribution Agreement, management is continuing to finalize plans to offset the impact of the loss on a short- and long-term basis. These plans currently include, among other things, an emphasis on reducing cost of sales, R&D and SG&A expenses; continuing to accelerate new product launches; increasing the level of strategic partnerships; and reducing capital expenditures. Management will also continue its emphasis on accelerating ANDA filings. Management also plans to attempt, at the appropriate time, to refinance a significant portion of its outstanding long-term debt to reduce principal repayment requirements and eliminate existing financial covenants, which will increase related interest expense, but will positively impact cash flows.
In certain situations, we may increase our focus on particular specialty markets within the generic pharmaceutical industry. By narrowing our focus to specialty markets, we can provide product alternatives in categories with relatively fewer market participants. We plan to strengthen our relationships with strategic partners, including providers of product development research, raw materials, APIs and finished products. We believe that mutually beneficial strategic relationships in such areas, including potential financing arrangements, partnerships, joint ventures or acquisitions, could enhance our competitive advantages in the generic pharmaceutical market.
In Fiscal 2018, the Company filed its first NDA for Numbrino (C-Topical® Solution).
In 2016, the Company announced a strategic partnership with YiChang HEC ChangJiang Pharmaceutical Co., Ltd, an HEC Group company, to co-develop a biosimilar insulin pharmaceutical product for the U.S. market. The product is currently in development. The Company plans to manage the clinical and regulatory steps specific for an FDA approval to market and will have the exclusive U.S. marketing rights to the product. In addition, we will market other generic products developed by HEC with several launches expected over the next few years.
We have several existing supply and development agreements with both international and domestic companies; in addition, we are currently in negotiations on similar agreements with additional companies through which we can market and distribute future products. We intend to capitalize on our strong customer relationships to build our market share for such products.
Mergers and Acquisitions.
We evaluate potential mergers and acquisitions opportunities that are a strategic fit and accretive to our business. During Fiscal 2016, we completed the acquisition of KUPI, the former subsidiary of global biopharmaceuticals company UCB S.A. KUPI is a U.S. specialty pharmaceuticals manufacturer focused on the development of products that are difficult to formulate or utilize specialized delivery technologies. Strategic benefits of the acquisition include expanded manufacturing capacity, a diversified product portfolio and pipeline and complementary R&D expertise.
Leverage our Flexibility and Speed.
We believe flexibility and speed in decision-making are critical success factors in the generic industry. Our mid-sized scale and relatively less complex organizational structure as a U.S. based organization results in a more nimble response to securing market opportunities.
Leverage Ability to Vertically Integrate as a Manufacturer, Supplier and Distributor of Controlled Substance Products.
In July 2008, the DEA granted our subsidiary, Cody Labs, a license to directly import concentrated poppy straw for conversion into opioid-based commercial APIs for use in various dosage forms for pain management. The value of this license comes from the fact that, to date, only a limited number of companies in the U.S. have been granted this license. This license, along with Cody Labs’ expertise in API development and manufacture, allows the Company to perform in a market with barriers to entry, no foreign manufactured dosage form competition and limited domestic competition. Because of this vertical integration, the Company has direct control of its supply and the potential for a more competitive cost position. The Company can also leverage this vertical integration not only for direct supply of opioid-based APIs, but also for the manufacture of non-opioid-based APIs.
The Company believes that the demand for pain management drugs will remain significant as the “Baby Boomer” generation ages. By concentrating on a selective portfolio that includes appropriate use pain management medications along with proper customer development, the Company is well-positioned to take advantage of this opportunity. The Company is currently vertically integrated on three products with several others in various stages of development.
Key Products
Key Products were selected based on current and future sales and profitability.
Levothyroxine Sodium Tablets
Levothyroxine Sodium tablets, which are used for the treatment of thyroid deficiency by patients of various ages and demographic backgrounds, are the most prescribed drug in the United States. The product is manufactured by JSP and distributed under the JSP Distribution Agreement and is produced and marketed in 12 potencies. Net sales of Levothyroxine Sodium tablets totaled $245.9 million in fiscal year 2018. Levothyroxine is a narrow therapeutic index drug and very difficult to formulate and also requires multiple AB ratings to the various brands. This has resulted in a less competitive market environment for this molecule. In our distribution of these products, we primarily compete with two brand Levothyroxine Sodium products, AbbVie’s Synthroid® and Pfizer’s Levoxyl®, as well as generic products from Mylan and Sandoz, each of which have multiple AB ratings as required. As described above, on August 20, 2018, the Company announced that the JSP Distribution Agreement which expires on March 23, 2019 will not be renewed.
Fluphenazine Tablets
Fluphenazine tablets are used for the treatment of schizophrenia and other mental disorders. Net sales of Fluphenazine tablets totaled $53.3 million in fiscal year 2018. Currently, our primary generic competitor for this drug is Mylan.
Digoxin Tablets
Digoxin tablets, which are used to treat congestive heart failure in patients of various ages and demographics, are produced and marketed with two different potencies. This product is manufactured by JSP and we distribute it under the JSP Distribution Agreement. Net sales of this product totaled $4.9 million in fiscal year 2018. The product is highly potent based on Environment, Health & Safety (“EHS”), regulations and its API availability is limited given there are only two active suppliers, based on the FDA Drug Master File (“DMF”) list. In our distribution of these products, we compete with generic products from Mylan, Amneal and Hikma, as well as the brand product Lanoxin® distributed by Concordia and an authorized generic (“AG”) distributed by Endo. On August 20, 2018, the Company announced that the JSP Distribution Agreement which expires on March 23, 2019 will not be renewed.
Metoprolol Succinate ER Tablets
Metoprolol Succinate ER is a beta-blocker that affects the heart and circulation (blood flow through arteries and veins). It is used to treat angina (chest pain) and hypertension (high blood pressure). It is also used to treat or prevent heart attack. This product is the generic version of Toprol XL®. Net sales of Metoprolol Succinate ER totaled $25.9 million in fiscal year 2018. We compete with generic products from Teva and Dr. Reddy’s Labs.
Ursodiol Capsules
Ursodiol Capsules are produced and marketed in 300 mg capsules and are used for the treatment of gallstones. Net sales of Ursodiol capsules totaled $20.3 million in fiscal year 2018. We compete with generic products from Teva, PureCap and Mylan.
Omeprazole Capsules
Omeprazole is a proton pump inhibitor that decreases the amount of acid produced in the stomach. The product is a generic version of the branded drug Prilosec®. It is indicated for heartburn or irritation of the esophagus caused by gastroesophageal reflux disease. KUPI produces Omeprazole DR capsules in 10mg, 20mg and 40mg dosages. Net sales of Omeprazole capsules totaled $20.1 million in fiscal year 2018. In distributing this product, we compete primarily with Sandoz, Dr. Reddy’s Labs, Apotex and Zydus.
Pantoprazole Sodium DR Tablets
Pantoprazole is a proton pump inhibitor that decreases the amount of acid produced in the stomach. The product is a generic version of the branded drug Nexium®. It is indicated for heartburn or irritation of the esophagus caused by gastroesophageal reflux disease. KUPI produces Pantoprazole tablets in 20mg and 40mg dosages. Net sales of Pantoprazole in fiscal year 2018 were $19.3 million. We complete primarily with products from Amneal, Aurobindo, Camber, Cadista, Prasco, Teva and Torrent.
Sumatriptan Nasal Spray
Sumatriptan Nasal Spray is indicated for the acute treatment of migraine attacks. This product is a generic version of Imitrex® Nasal Spray. The Company distributes the 5mg and 20mg dosages. Net sales of Sumatriptan Nasal Spray totaled $42.1 million in fiscal year 2018. We compete with the generic product from Sandoz.
Diclofenac Sodium Tablets
Diclofenac Sodium Tablets is a non- steroidal anti-inflammatory drug (“NSAID”) indicated to relieve pain, inflammation and joint stiffness caused by arthritis. It is the generic version of Voltaren SR®. We launched this product in the last month of fiscal year 2018 with net sales of $1.1 million. It is manufactured by Dexcel Pharma and we distribute under our distribution agreement with Dexcel Pharma. We compete along with the generic product from Oceanside.
Metolazone Tablets
Metolazone is a thiazide-like diuretic. It is primarily used to treat congestive heart failure and high blood pressure. It is the generic version of Zarocolyn®. We launched this product in the last month of fiscal year 2018 with net sales of $1.5 million. We compete with generic products from Mylan and Sandoz.
Methylphenidate Hydrochloride ER
Methylphenidate ER is a central nervous system stimulant indicated for the treatment of Attention Deficit Hyperactivity Disorder (“ADHD”) in children six years of age and older, adolescents and adults up to the age of 65. The product is a generic version of the branded drug Concerta®, which is currently marketed by Janssen Pharmaceuticals, Inc, and competes with a generic product marketed by Mallinckrodt Pharmaceuticals, TriGen, Amneal and Mylan as well as an AG marketed by Teva. The product was approved by the FDA in 2013 with a therapeutic equivalence rating of AB, meaning the FDA deemed it therapeutically equivalent to the brand-name drug, Concerta®. Net sales of Methylphenidate ER tablets totaled $33.2 million in fiscal year 2018.
Per a teleconference win November 2014 the FDA informed KUPI that it was changing the therapeutic equivalence rating of its product from “AB” (therapeutically equivalent) to “BX.” A BX-rated drug is a product for which data are insufficient to determine therapeutic equivalence; it is still approved and can be prescribed, but the FDA does not recommend it as automatically substitutable for the brand-name drug at the pharmacy.
During the November 2014 teleconference, the FDA also asked KUPI to either voluntarily withdraw its product or to conduct new bioequivalence (“BE”) testing in accordance with the recommendations for demonstrating bioequivalence to Concerta proposed in a new draft BE guidance that the FDA issued earlier that November. The Company agreed to conduct new BE studies per the new draft BE guidance. KUPI submitted the data from those studies to the FDA in June 2015 and met with the FDA to discuss the results in July 2015.
On October 18, 2016, the Company received notice from the FDA that it will seek to withdraw approval of the Company’s ANDA for Methylphenidate ER. The FDA’s notice includes an opportunity for the Company to request a hearing on this matter. Following the Company’s request under the Freedom of Information Act (“FOIA”) for documents to support its request for a hearing, the FDA granted an extension to submit all data, information and analyses upon which the request for a hearing relies. The FDA has not yet made a decision as to whether to grant a hearing to the Company.
The Company intends to continue working with the FDA to regain the “AB” rating, and in the meantime, maintain the drug on the U.S. market with a BX rating. However, there can be no assurance as to when or if the Company will regain the “AB” rating or be permitted to remain on the market. If the Company were to receive the “AB” rating, net sales of the product could increase subject to market factors existing at that time. The Company also agreed to potential acquisition-related contingent payments to UCB related to Methylphenidate ER if the FDA reinstates the AB-rating and certain sales thresholds are met. Such potential contingent payments are set to expire after December 31, 2020.
In August 2018, the Company entered into an exclusive perpetual licensing agreement with Andor Pharmaceuticals, LLC for Methylphenidate Hydrochloride Extended Release (ER) tablets USP (CII) in 18 mg, 27 mg, 36 mg and 54 mg strengths. Andor’s pending ANDA of Methylphenidate included all bioequivalence metrics recommended by the FDA and is expected to be approved as an AB-rated generic equivalent to the brand Concerta®.
Under the licensing agreement, Lannett will primarily provide sales, marketing and distribution support of Andor’s Methylphenidate ER product, for which it will receive a percentage of the net profits. See Note 22 “Subsequent events” for more information.
Pain Management Products
Cocaine Topical® Solution (“C-Topical®”), a vertically integrated product, is produced and marketed under a preliminary new drug application (“PIND”) in two different strengths and two different size containers. C-Topical® is utilized primarily for the anesthetization of the patient during ear, nose or throat surgery, sinuplasty and in emergency rooms.
In December 2017, a competitor received approval from the FDA to market and sell a Cocaine Hydrochloride topical product. This approval affects the Company’s right to market and sell its unapproved Grandfathered C-Topical product. According to FDA guidance, the FDA typically allows the marketing of unapproved products for up to one year following the approval of an NDA for the product. Subsequently, the Company would not be permitted to market and sell its unapproved C-Topical product.
The competitor’s Cocaine Hydrochloride topical product first appeared in FDA’s Orange Book in January 2018, and the Orange Book listing was updated in February 2018 to include New Chemical Entity (NCE) exclusivity. Under the Federal Food Drug and Cosmetic Act, the grant of NCE exclusivity provides that additional applications for approval of the same product under Section 505(b)(2) may not be submitted to the FDA for approval before the expiration of five years from the date of the approval of the first application. Because the Company submitted its application for approval prior to the date of approval of the competitor’s Cocaine Hydrochloride topical application, the Company does not believe the NCE exclusivity will apply to the Company’s application. The FDA continues to review the Company’s application, and in July 2018 issued a Complete Response Letter which required an additional study and other information. The Company cannot say for certain when or if the application will be approved.
At this time, the Company cannot predict the ultimate impact that these developments will have on its business and financial performance, including but not limited to any possible price reductions should the competitor commence marketing and selling its C-Topical product in the future, for how long the Company will continue to be permitted to market and sell C-Topical or the possible effect on the Company’s pending NDA application.
Morphine Sulfate Oral Solution is produced and marketed in three different size containers. We manufacture this product at Cody Labs and are currently finishing the manufacturing methods and capabilities to make the API. This drug is prescribed primarily for the management of pain in adults.
Oxycodone HCl Oral Solution (“Oxycodone”) was produced until August 20, 2012 and marketed until October 4, 2012 in two different size containers, at which point, as a result of FDA enforcement actions against all market participants, the Company voluntarily exited the market. Prior to the enforcement actions the Company had submitted an ANDA to the FDA and subsequently received approval and commenced shipping Oxycodone in September 2014. This drug is prescribed primarily for the management and relief of moderate to moderately severe pain.
Other products in the pain management franchise include Hydromorphone HCl tablets, which we are vertically integrated, and Codeine Sulfate tablets. Additionally, the Company added several pain management products through the Silarx acquisition. Net sales of pain management products totaled $23.0 million in Fiscal Year 2018.
Validated Pharmaceutical Capabilities
KUPI’s 432,000 square foot Seymour, Indiana facility contains approximately 107,000 square feet of manufacturing space as well as a leased 116,000 square foot temperature/humidity controlled storage warehouse. The Seymour facility has had satisfactory inspections conducted by the FDA and EMA and similar regulatory authorities of Japan, Taiwan, Brazil, China, Korea and Turkey. Since 2008, KUPI has made significant improvements to its facility and equipment. These improvements enabled the facility to increase production from approximately 1.2 billion doses in 2008 to over 2.7 billion doses in 2014. Prior to the acquisition, KUPI also completed a 20,000 square foot expansion of the facility which increased capacity to 3.9 billion doses.
In connection with the acquisition of Silarx, the Company acquired an 110,000 square foot manufacturing facility located in Carmel, New York, which sits on 25.8 acres of land. The facility specializes in liquid products and currently houses manufacturing, packaging, quality and research and development and has capacity for additional manufacturing space, if needed.
The manufacturing facility of our wholly-owned subsidiary, Cody Labs, consists of a 73,000 square foot structure located on approximately 15.0 acres in Cody, Wyoming. The Cody Labs’ manufacturing facility specializes in API and controlled substance production and currently has capacity for further expansion, both inside and outside the existing structure. In June 2018, the Company announced the Cody Restructuring Plan, as further described in Note 3. “Restructuring Charges”.
Lannett owns several facilities in Philadelphia, Pennsylvania. Certain administrative functions, manufacturing and research and development facilities are located in a 31,000 square foot facility at 9000 State Road, Philadelphia, PA. A second, 63,000 square foot facility is located within one mile of the State Road facility at 9001 Torresdale Avenue, Philadelphia, PA and contains our analytical research and development and quality control laboratories. The facility has capacity for additional manufacturing, packaging or laboratory space, if needed. We also own a building at 13200 Townsend Road in Philadelphia, PA consisting of 66,000 square feet on 7.3 acres of land which is currently used for warehouse space and shipping. In June 2018, the Company initiated a process to begin consolidating all shipping and receiving activities to its Seymour, Indiana facility. The consolidation of shipping and receiving will allow us to vacate the 13200 Townsend Road facility in the future.
We have adopted many processes in support of regulations relating to cGMPs in the last several years and we believe we are operating our facilities in substantial compliance with the FDA’s cGMP regulations. In designing our facilities, full attention was given to material flow, equipment and automation, quality control and inspection.
We continue to pursue “Quality by Design” for improving and maintaining product quality in our pharmaceutical development and manufacturing facilities, which is outlined in the FDA report entitled, “Pharmaceutical Quality for the 21st Century: A Risk-Based Approach.” The FDA periodically inspects our production facilities to determine our compliance with the FDA’s manufacturing standards. Typically, after completing its inspection, the FDA will issue a report, entitled a “Form 483,” containing observations arising from an inspection. The FDA’s observations may be minor or severe in nature and the degree of severity is generally determined by potential consequences to the consumer. By strictly complying with cGMPs and the various FDA guidelines as well as adherence to our Standard Operating Procedures, we have never received a cGMP Warning Letter in more than 70 years of business.
Research and Development Process
Over the past several years, we have invested heavily in R&D projects. The costs of these R&D efforts are expensed during the periods incurred. We believe that such costs may be recovered in future years when we receive approval from the FDA to manufacture and distribute such products. We have embarked on a plan to grow in future years, which includes organic growth to be achieved through our R&D efforts. We expect that our growing list of generic products under development will drive future growth. Over the past several years, we have hired additional personnel in product development, production and formulation. The following steps outline the numerous stages in the generic drug development process:
1.) Formulation and Analytical Method Development. After a drug candidate is selected for future sale, product development scientists perform various experiments to incorporate excipients with the APIs to product a robust, stable and bioequivalent dosage form that will then, not only be therapeutically equivalent to the brand name drug, but match its size and shape as per FDA guidance. These experiments will result in the creation of a number of product formulations to determine which formula will be most suitable for our subsequent development process. Various formulations are tested in the laboratory to measure results against the innovator brand drug. During this time, we may use reverse engineering methods on samples of the innovator drug to determine the type and quantity of inactive ingredients. During the formulation phase, our R&D chemists begin to develop an analytical, laboratory testing method. The successful development of this test method will allow us to test developmental and commercial batches of the product in the future. All of the information used in the final formulation, including the analytical test methods adopted for the generic drug candidate, will be included as part of the Chemistry, Manufacturing and Controls (“CMC”) section of the ANDA submitted to the FDA.
2.) Scale-up and Tech Transfer. After product development, scientists and the R&D chemists agree on a final formulation for use in moving the drug candidate forward in the developmental process, we then attempt to increase the batch size of the product. The batch size represents the standard magnitude to be used in manufacturing a batch of the product. The determination of batch size affects the amount of raw material that is used in the manufacturing process and the number of expected dosages to be created during the production cycle. We attempt to determine batch size based on the amount of active ingredient in each dosage, the available production equipment and unit sales projections. The scaled-up batch is then generally produced in our commercial manufacturing facilities. During this manufacturing process, we document the equipment used, the amount of time in each major processing step and any other steps needed to consistently produce a batch of that product.
3.) Bio equivalency and Clinical Testing. After a successful scale-up of the generic drug batch, we schedule and perform generally required bio equivalency testing on the product and in some cases, clinical testing, if required by the FDA. These procedures, which are generally outsourced to third parties, include testing the absorption rate and extent of the generic product in the human bloodstream compared to the absorption of the innovator drug. The results of this testing are then documented and reported to us to determine the “success” of the generic drug product. Success, in this context, means that we are able to demonstrate that our product is comparable to the innovator product in dosage form, strength, route of administration, quality, performance characteristics and intended use.
Bioequivalence (meaning that the product has the same blood levels and dosage form as the innovator drug) and a stable formula are the primary requirements for a generic drug approval (assuming the manufacturing plant is in compliance with the FDA’s cGMP regulations). Lengthy and costly clinical trials proving safety and efficacy, which are required by the FDA for NDAs (and may include 505(b)(2)NDAs), are typically unnecessary for generic companies. If the results are successful, we will continue the collection of information and documentation for assembly of the drug application.
4.) Submission of the ANDA for FDA Review and Approval. An ANDA is a comprehensive submission that contains, among other things, data and information pertaining to the proposed labeling, active pharmaceutical ingredient, excipients, container/closure, drug product formulation, drug product testing specification, methodology and results. Bioequivalence study reports are also included in the ANDA submission.
Our ANDAs and NDAs are submitted to the FDA electronically using the most current eCTD standards. Lannett strives to achieve a first cycle approval for each ANDA under the Generic Drug User Fee Amendments of 2012 (“GDUFA”) review metrics.
Sales and Customer Relationships
We sell our pharmaceutical products to generic pharmaceutical distributors, drug wholesalers, chain drug retailers, private label distributors, mail-order pharmacies, other pharmaceutical manufacturers, managed care organizations, hospital buying groups, governmental entities and health maintenance organizations. We promote our products through direct sales, trade shows and bids. Our practice of maintaining adequate inventory levels, employing a responsive order filling system and prioritizing timely fulfillment of those orders have contributed to a strong reputation among our customers as a dependable supplier of high quality generic pharmaceuticals.
Management
We have been focused on enhancing the quality of our management team in anticipation of continuing growth. As part of our growth, we have established corporate and non-corporate officer positions. We have hired experienced personnel from large, established, brand pharmaceutical companies as well as competing generic companies to complement the skills and knowledge of the existing management team. As we continue to grow, additional personnel may need to be added to our management team. We intend to hire the best people available to expand the knowledge base and expertise within our team.
Current Products
As of the date of this filing, we manufactured and/or distributed the following products:
|
Name of Product* |
|
Medical Indication |
|
Equivalent Brand | |
|
1 |
Atorvastatin Calcium Tablets |
|
Cholesterol |
|
Lipitor® |
|
2 |
Baclofen Tablets |
|
Muscle Spasm |
|
Lioresal® |
|
3 |
C-Topical ® Solution |
|
Pain Management |
|
N/A |
|
4 |
Dicyclomine Tablets and Capsules |
|
Irritable Bowel |
|
Bentyl® |
|
5 |
Fluphenazine Tablets |
|
Antipsychosis |
|
Prolixin® |
|
6 |
Glycolax Rx |
|
Gastrointestinal |
|
MiraLAX® |
|
7 |
Isosorbide Mononitrate CR |
|
Cardiovascular |
|
Imdur® |
|
8 |
Levothyroxine Sodium Tablets (1) |
|
Thyroid Deficiency |
|
Levoxyl®/ Synthroid® |
|
9 |
Methylphenidate ER (Bx) |
|
Central Nervous System |
|
Concerta® |
|
10 |
Metoprolol Succinate ER Tablets (2) |
|
Cardiovascular |
|
Toprol-XL® |
|
11 |
Omeprazole DR |
|
Gastrointestinal |
|
Prilosec® |
|
12 |
Oxybutynin ER |
|
Urinary |
|
Ditropan® |
|
13 |
Pantoprazole DR |
|
Gastrointestinal |
|
Protonix® |
|
14 |
Sumatriptan Nasal Spray |
|
Migraine |
|
Imitrex® |
|
15 |
Terbutaline Sulfate Capsules |
|
Bronchospasms |
|
Brethine® |
|
16 |
Ursodiol Capsules |
|
Gallstone |
|
Actigall ® |
(1) Distributed under the JSP Distribution Agreement, which will expire in March 2019
(2) Distributed under a distribution agreement with Aralez Pharmaceuticals
*Products not listed each represent less than 1% of total net sales in Fiscal 2018
Unlike brand, innovator companies, we generally do not develop new molecules. However, we have filed and received two patents for APIs at our Cody, Wyoming manufacturing facility, with additional patents in process.
In fiscal year 2018, we received several approvals from the FDA. The following summary contains more specific details regarding our latest ANDA approvals. Market data was obtained from Wolters Kluwer and IMS.
On July 13, 2017, we received FDA approval for Cyproheptadine Hydrochloride Syrup (Cyproheptadine Hydrochloride Oral Solution, USP) 2 mg/5 mL, the therapeutic equivalent to the reference listed drug, Periactin® Syrup, 2 mg/5 mL of Merck and Co., Inc. For the 12 months ended May 2017, total U.S. sales of Cyproheptadine Hydrochloride Syrup, 2 mg/5 mL, at Average Wholesale Price (AWP) were approximately $6 million, according to IMS.
On September 1, 2017, we received FDA approval for Esomeprazole Magnesium Delayed-Release Capsules USP, 20 mg and 40 mg, the therapeutic equivalent to the reference listed drug, Nexium Delayed-Release Capsules, 20 mg and 40 mg of AstraZeneca Pharmaceuticals LP. For the 12 months ended July 2017, total U.S. sales of Esomeprazole Magnesium Delayed-Release Capsules USP, 20 mg and 40 mg, at AWP were approximately $1.4 billion, according to IMS.
On September 25, 2017, we received FDA approval for Dexmethylphenidate Hydrochloride Tablets, 2.5 mg, 5 mg, and 10 mg, the therapeutic equivalent to the reference listed drug, Focalin® Tablets, 2.5 mg, 5 mg, and 10 mg, of Novartis Pharmaceuticals Corporation. For the 12 months ended July 2017, total U.S. sales of Dexmethylphenidate Hydrochloride Tablets, 2.5 mg, 5 mg, and 10 mg, at AWP were approximately $34 million, according to IMS.
On September 25, 2017, we received FDA approval for Oxycodone and Acetaminophen Tablets, USP, 5 mg/325 mg and 10 mg/325 mg, the therapeutic equivalent to the reference listed drug, Percocet® Tablets, 5 mg/325 mg and 10 mg/325 mg, of Vintage Pharmaceuticals, LLC. For the 12 months ended July 2017, total U.S. sales of Oxycodone and Acetaminophen Tablets, USP, 5 mg/325 mg and 10 mg/325 mg, at AWP were approximately $571 million, according to IMS.
On September 28, 2017, we received FDA approval for Lansoprazole Delayed-Release Capsules USP, 15 mg and 30 mg, the therapeutic equivalent to the reference listed drug, Prevacid® Delayed-Release Capsules, 15 mg and 30 mg, of Takeda Pharmaceuticals. Additionally, on September 29, 2017, we received FDA approval for Lansoprazole Delayed-Release Capsules USP, 15 mg (OTC), the bioequivalent to the reference listed drug, Prevacid® 24HR Delayed-Release Capsules, 15 mg, of GlaxoSmithKline. For the 12 months ended July 2017, total U.S. sales at AWP of Lansoprazole Delayed-Release Capsules USP, 15 mg and 30 mg, was approximately $76 million, according to IMS.
On May 18, 2018, we received FDA approval for Dronabinol Capsules USP, 2.5 mg, 5 mg and 10 mg, the therapeutic equivalent to the reference listed drug, Marinol® Capsules 2.5 mg, 5 mg and 10 mg of AbbVie Inc. For the 12 months ended March 2018, total U.S. sales of Dronabinol Capsules USP, 2.5 mg, 5 mg and 10 mg, was approximately $120 million, according to IMS.
On May 25, 2018, we received FDA approval for Levofloxacin Oral Solution USP, 25 mg/mL, the therapeutic equivalent to the reference listed drug, Levaquin® Oral Solution, 25 mg/mL, of Janssen Pharmaceuticals, Inc. For the 12 months ended April 2018, total U.S. sales of Levofloxacin Oral Solution USP, 25 mg/mL, was approximately $6 million, according to IMS.
We have additional products of various dosage forms currently under development. Our developmental drug products are intended to treat a diverse range of indications. The products under development are at various stages in the development cycle—formulation, scale-up, clinical testing and/or FDA review.
The cost associated with each product that we are currently developing is dependent on numerous factors, including but not limited to, the complexity of the active ingredient’s chemical characteristics, the price of the raw materials and the FDA-mandated requirement of bioequivalence studies (depending on the FDA’s Product Specific Guidance). With the introduction of GDUFA and additional guidance issued by the FDA, the cost to develop a new generic product varies but now totals several million dollars.
In addition, we currently own several ANDAs for products that are not currently marketed and noted as Discontinued in FDA’s Orange Book. Occasionally, we review such discontinued products to determine if the market potential for any of these products has recently changed to make it attractive for us to reconsider manufacturing and selling. If we decide to commercially market one of these products, we evaluate the requirements necessary for commercial launch, including a filing strategy to properly report the relaunch to the FDA so that the product is moved to the Active section of the Orange Book.
In addition to the efforts of our internal product development group, we have contracted with numerous outside firms for the formulation and development of several new generic drug products. These outsourced R&D products are at various stages in the development cycle—formulation, analytical method development and testing and manufacturing scale-up. These products include orally administered solid dosage products, injectables and nasal delivery products that are intended to treat a diverse range of medical indications.
We intend to ultimately transfer the formulation technology and manufacturing process for some of these R&D products to our own commercial manufacturing sites. We initiated these outsourced R&D efforts to complement the progress of our own internal R&D efforts.
We recorded R&D expenses of $29.2 million in fiscal year 2018, $42.1 million in fiscal year 2017 and $45.1 million in fiscal year 2016. These amounts included expenses associated with bioequivalence studies, internal development resources as well as outsourced development. While we manage all R&D from our principal executive office in Philadelphia, Pennsylvania, we have also been taking steps to capitalize on favorable development costs in other countries. We have strategic relationships with various companies that either act as contract research organizations or API suppliers as well as dosage form manufacturers. In addition, U.S.-based research organizations have been engaged for product development to enhance our internal development. Fixed payment arrangements are established between Lannett and these research organizations and in some cases include a royalty provision. Development payments are normally scheduled in advance, based on attaining development milestones.
Raw Materials and Finished Goods Suppliers
Our use of raw materials in the production process consists of pharmaceutical chemicals in various forms that are generally available from several sources. In addition to the raw materials we purchase for the production process, we purchase certain finished dosage inventories. We sell these finished dosage form products directly to our customers along with the finished dosage form products manufactured in-house. We generally take precautionary measures to avoid a disruption in raw materials and finished goods, such as finding secondary suppliers for certain raw materials or finished goods when available and maintaining adequate inventory levels.
The Company’s primary finished goods inventory supplier is JSP, in Bohemia, New York. Purchases of finished goods from JSP accounted for 37% of our inventory purchases in fiscal year 2018, 36% in fiscal year 2017 and 52% in fiscal year 2016. On March 23, 2004, the Company entered into an agreement with JSP for the exclusive distribution rights in the United States to the current line of JSP products, in exchange for 4.0 million shares of the Company’s common stock. The JSP products covered under the agreement included Butalbital, Aspirin, Caffeine with Codeine Phosphate Capsules USP; Digoxin Tablets; and Levothyroxine Sodium Tablets, sold generically and under the brand-name Unithroid®. On August 19, 2013, the Company entered into an agreement with JSP to extend its initial contract to continue as the exclusive distributor in the United States of three JSP products: Butalbital, Aspirin, Caffeine with Codeine Phosphate Capsules USP; Digoxin Tablets USP; and Levothyroxine Sodium Tablets USP. The amendment to the original agreement extended the term of the initial contract, which was due to expire on March 22, 2014, for five years through March 23, 2019.
In connection with the amendment, the Company issued a total of 1.5 million shares of the Company’s common stock to JSP and its designees. The Company recorded a $20.1 million expense in cost of sales, which represented the fair value of the shares on August 19, 2013. Both Lannett and JSP have the right to terminate the contract if one of the parties does not cure a material breach of the contract within thirty (30) days of notice from the non-breaching party. On August 20, 2018, the Company announced that the JSP Distribution Agreement which expires on March 23, 2019 will not be renewed.
Over time, we have entered into supply and development agreements with JSP, Summit Bioscience LLC, HEC Pharm Group, Andor Pharmaceuticals LLC, Dexcel Pharma, Aralez Pharmaceuticals (“Aralez”) and various other international and domestic companies. The Company is currently in negotiations on similar agreements with other companies and is actively seeking additional strategic partnerships, through which it will market and distribute products manufactured in-house or by third parties. The Company plans to continue evaluating potential merger and acquisition opportunities as well as product acquisitions that are a strategic fit and accretive to the business.
Customers and Marketing
We sell our products primarily to wholesale distributors, generic drug distributors, mail-order pharmacies, group purchasing organizations, chain drug stores and other pharmaceutical companies. The pharmaceutical industry’s largest wholesale distributors, Amerisource Bergen, McKesson and Cardinal Health, accounted for 29%, 17% and 5%, respectively, of our total net sales in fiscal year 2018 and 28%, 21% and 6%, respectively, of our total net sales in fiscal year 2017. Our largest chain drug store customer accounted for 6% and 5% of total net sales in fiscal year 2018 and fiscal year 2017, respectively.
Sales to wholesale customers include “indirect sales,” which represent sales to third-party entities, such as independent pharmacies, managed care organizations, hospitals, nursing homes and group purchasing organizations, collectively referred to as “indirect customers.”
We enter into definitive agreements with our indirect customers to establish pricing for certain covered products. Under such agreements, the indirect customers independently select a wholesaler from which to purchase the products at these agreed-upon prices. We will provide credit to the wholesaler for the difference between the agreed-upon price with the indirect customer and the wholesaler’s invoice price. This credit is called a “chargeback.” For more information on chargebacks, see the section entitled “Critical Accounting Policies” in Item 7, “Management’s Discussion and Analysis of Financial Condition and Results of Operations” of this Form 10-K. These indirect sale transactions are recorded on our books as sales to wholesale customers.
We promote our products through direct sales, trade shows and group purchasing organizations’ bidding processes. We also market our products through private label arrangements, under which we manufacture our products with a label containing the name and logo of our customer. This practice is commonly referred to as “private label.” Private label allows us to leverage our internal sales efforts by using the marketing services from other well-respected pharmaceutical competitors. The focus of our sales efforts is the relationships we create with our customer accounts.
Strong and dependable customer relationships have created a positive platform for us to increase our sales volumes. Historically and in fiscal years 2018, 2017 and 2016, our advertising expenses were immaterial. When our sales representatives make contact with a customer, we will generally offer to supply the customer our products at fixed prices. If accepted, the customer’s purchasing department will coordinate the purchase, receipt and distribution of the products throughout its distribution centers and retail outlets. Once a customer accepts our supply of a product, the customer typically expects a high standard of service, including timely receipt of products ordered, availability of convenient, user-friendly and effective customer service functions and maintaining open lines of communication.
We believe that retail-level consumer demand dictates the total volume of sales for various products. In the event that wholesale and retail customers adjust their purchasing volumes, we believe that consumer demand will be fulfilled by other wholesale or retail sources of supply. As a result, we attempt to develop and maintain strong relationships with most of the major retail chains, wholesale distributors and mail-order pharmacies in order to facilitate the supply of our products through whatever channel the consumer prefers. Although we have agreements with customers governing the transaction terms of our sales, generally there are no minimum purchase quantities applicable to these agreements.
Competition
The manufacturing and distribution of generic pharmaceutical products is a highly competitive industry. Competition is based primarily on a reliable supply and price. In addition to competitive pricing, our competitive advantages are our ability to provide strong and dependable customer service by maintaining adequate inventory levels, employing a responsive order filling system and prioritizing timely fulfillment of orders. We ensure that our products are available from national wholesale, chain drug and mail-order suppliers as well as our own warehouse. The modernization of our facilities, hiring of experienced staff and implementation of inventory and quality control programs have improved our competitive cost position.
We compete with other manufacturers and marketers of generic and brand-name drugs. Each product manufactured and/or sold by us has a different set of competitors. The list below identifies the companies with which we primarily compete with respect to each of our major products in Fiscal 2018:
|
Key Products |
|
Primary Competitors |
|
|
|
|
|
C-Topical® Solution |
|
Compounding pharmacies and combining two alternative drugs |
|
|
|
|
|
Diclofenac Sodium Tablets |
|
Oceanside |
|
|
|
|
|
Digoxin Tablets* |
|
Amneal, Concordia, Endo, Hikma and Mylan |
|
|
|
|
|
Fluphenazine Tablets |
|
Mylan |
|
|
|
|
|
Levothyroxine Sodium Tablets* |
|
AbbVie, Mylan, Pfizer and Sandoz |
|
|
|
|
|
Methylphenidate ER Tablets |
|
Amneal, Janssen, Mallinckrodt, Mylan, Teva and TriGen |
|
|
|
|
|
Metolazone Tablets |
|
Mylan and Sandoz |
|
|
|
|
|
Metoprolol Succinate ER Tablets |
|
Dr. Reddy’s Labs and Teva |
|
|
|
|
|
Omeprazole Capsules |
|
Apotex, Dr. Reddy’s Labs, Sandoz and Zydus |
|
|
|
|
|
Pantoprazole Sodium DR Tablets |
|
Amneal, Aurobindo, Camber, Cadista, Prasco, Teva and Torrent |
|
|
|
|
|
Sumatriptan Nasal Spray |
|
Sandoz |
|
|
|
|
|
Ursodiol Capsules |
|
Mylan, PureCap and Teva |
*Distributed under the JSP Distribution Agreement, which will expire in March 2019.
Government Regulation
Pharmaceutical manufacturers are subject to extensive regulation by the federal government, including the FDA and, in cases of controlled substance products the DEA, as well as other federal regulatory bodies and state governments. The Federal Food, Drug and Cosmetic Act (the “FDCA”), the Controlled Substance Act (the “CSA”) and other federal statutes and regulations govern or influence the testing, manufacture, safety, labeling, storage, record keeping, approval, pricing, advertising and promotion of our generic drug products. Non-compliance with applicable regulations can result in fines, product recalls and seizure of products, total or partial suspension of production, personal and/or corporate prosecution and debarment and refusal of the government to approve NDAs. The FDA also has the authority to revoke previously approved drug applications.
Generally, FDA approval is required before a drug can be marketed. A new drug is one not generally recognized by qualified experts as safe and effective for its intended use and submitted to FDA as a NDA. The FDA review process for new drugs is very extensive and requires a substantial investment to research and test the drug candidate. A less burdensome approval pathway is used for generic drug products, the ANDA. Typically, the investment required to develop a generic drug is less costly than the new drug. Some drug product may be submitted as a 505(b)(2) NDA, allowing some of the required research and testing to be waived by relying on FDA’s previous findings of safety and efficacy and literature. For additional information on the FDA approval pathways, refer to section 505(b)(1) and 505(b)(2) of the FD&C Act for NDAs, section 505(j) for ANDAs and resources available on the FDA website, www.fda.gov.
There are currently three ways to obtain FDA approval of a drug:
· New Drug Applications (NDA): Unless one of the two procedures discussed in the following sections is available, a manufacturer must conduct and submit to the FDA complete clinical studies to establish a drug’s safety and efficacy. The new drug approval process generally involves:
· completion of preclinical laboratory and animal testing in compliance with the FDA’s GLP regulations;
· submission to the FDA of an Investigational New Drug (“IND”) application for human clinical testing, which must become effective before human clinical trials may begin;
· performance of adequate and well-controlled human clinical trials to establish the safety and efficacy of the proposed drug product for each intended use;
· satisfactory completion of an FDA pre-approval inspection of the facility or facilities at which the product is produced to assess compliance with the FDA’s cGMP regulations; and
· submission to and approval by the FDA of an NDA.
The results of preclinical tests, together with manufacturing information and analytical data, are submitted to the FDA as part of an IND, which must become effective before human clinical trials may begin. Further, each clinical trial must be reviewed and approved by an independent Institutional Review Board. Human clinical trials are typically conducted in three sequential phases that may overlap. These phases generally include:
· Phase I, during which the drug is introduced into healthy human subjects or, on occasion, patients and is tested for safety, stability, dose tolerance and metabolism;
· Phase II, during which the drug is introduced into a limited patient population to determine the efficacy of the product in specific targeted indications, to determine dosage tolerance and optimal dosage and to identify possible adverse effects and safety risks; and
· Phase III, during which the clinical trial is expanded to a larger and more diverse patient group at geographically dispersed clinical trial sites to further evaluate clinical efficacy, optimal dosage and safety.
The drug sponsor, the FDA, or the independent Institutional Review Board at each institution at which a clinical trial is being performed may suspend a clinical trial at any time for various reasons, including a belief that the subjects are being exposed to an unacceptable health risk.
The results of preclinical animal studies and human clinical studies, together with other detailed information, are submitted to the FDA as part of the NDA. The NDA also must contain extensive manufacturing information. The FDA may disapprove the NDA if applicable FDA regulatory criteria are not satisfied or it may require additional clinical data. Once approved, the FDA may withdraw the product approval if compliance with pre- and post-market regulatory standards is not maintained or if problems occur or are identified after the product reaches the marketplace. In addition, the FDA may require post-marketing studies to monitor the effect of approved products and may limit further marketing of the product based on the results of these post-marketing studies.
The FDA has broad post-market regulatory and enforcement powers, including the ability to levy fines and civil penalties, suspend or delay issuance of approvals, seize or recall products and withdraw approvals.
Satisfaction of FDA new drug approval requirements typically takes several years and the actual time required may vary substantially based upon the type, complexity and novelty of the product or disease. Government regulation may delay or prevent marketing of potential products for a considerable period of time and/or require additional procedures which increase manufacturing costs. Success in early stage clinical trials does not assure success in later stage clinical trials. Data obtained from clinical activities is not always conclusive and may be subject to varying interpretations that could delay, limit, or prevent regulatory approval. Even if a product receives regulatory approval, later discovery of previously unknown problems with a product may result in restrictions on the product or even complete withdrawal of the product from the market.
· Abbreviated New Drug Applications: An ANDA is similar to an NDA except that the FDA generally waives the requirement of complete clinical studies of safety and efficacy. However, it may require bioavailability and bioequivalence studies. Bioavailability indicates the rate of absorption and levels of concentration of a drug in the bloodstream needed to produce a therapeutic effect. Bioequivalence compares one drug product with another and indicates if the rate of absorption and the levels of concentration of a generic drug in the body are within prescribed statistical limits to those of a previously approved drug. Under the Hatch-Waxman Act, an ANDA may be submitted for a drug on the basis that it is the equivalent of an approved drug regardless of when such other drug was approved. The FDA will approve the generic product as suitable for an ANDA application if it finds that the generic product does not raise new questions of safety and effectiveness as compared to the innovator product. A product is not eligible for ANDA approval if the FDA determines that it is not equivalent to the referenced innovator drug, if it is intended for a different use, or if it is not subject to an approved Suitability Petition. However, such a product might be approved under an NDA, with supportive data from clinical trials.
In addition to establishing a new ANDA procedure, the Hatch-Waxman Act created statutory protections for approved brand-name drugs. Under the Hatch-Waxman Act, an ANDA for a generic drug may not be made effective until all relevant product and use patents for the brand-name drug have expired or have been determined to be invalid. Prior to this act, the FDA gave no consideration to the patent status of a previously approved drug.
Upon NDA approval, the FDA lists in its Orange Book the approved drug product and any patents identified by the NDA applicant that relate to the drug product. Any applicant who files an ANDA seeking approval of a generic equivalent version of a drug listed in the FDA’s Orange Book before expiration of the referenced patent(s), must certify to the FDA that (1) no patent information on the drug product that is the subject of the ANDA has been submitted to the FDA; (2) such patent has expired; (3) the date on which such patent expires; or (4) such patent is invalid or will not be infringed upon by the manufacture, use, or sale of the drug product for which the ANDA is submitted. This last certification is known as a paragraph IV certification. A notice of the paragraph IV certification must be provided to each owner of the patent that is the subject of the certification and to the holder of the approved NDA to which the ANDA refers. Before the enactment of the Medicare Prescription Drug Improvement and Modernization Act of 2003 (the “MMA”), which amended the Hatch-Waxman Act, if the NDA holder or patent owner(s) asserted a patent challenge within 45 days of its receipt of the certification notice, the FDA was prevented from approving that ANDA until the earlier of 30 months from the receipt of the notice of the paragraph IV certification, the expiration of the patent, when the infringement case concerning each such patent was favorably decided in an ANDA applicant’s favor, or such shorter or longer period as may be ordered by a court. This prohibition is generally referred to as the 30-month stay. In some cases, NDA owners and patent holders have obtained additional patents for their products after an ANDA had been filed but before that ANDA received final marketing approval and then initiated a new patent challenge, which resulted in more than one 30-month stay. The MMA amended the Hatch-Waxman Act to eliminate certain unfair advantages of patent holders in the implementation of the Hatch-Waxman Act. As a result, the NDA owner remains entitled to an automatic 30-month stay if it initiates a patent infringement lawsuit within 45 days of its receipt of notice of a paragraph IV certification, but only if the patent infringement lawsuit is directed to patents that were listed in the FDA’s Orange Book before the ANDA was filed. An ANDA applicant is now permitted to take legal action to enjoin or prohibit the listing of certain of these patents as a counterclaim in response to a claim by the NDA owner that its patent covers its approved drug product.
If an ANDA applicant is the first-to-file a substantially complete ANDA with a paragraph IV certification and provides appropriate notice to the FDA, the NDA holder and all patent owner(s) for a particular generic product, the applicant may be awarded a 180-day period of marketing exclusivity against other companies that subsequently file ANDAs for that same product. A substantially complete ANDA is one that contains all the information required by the Hatch-Waxman Act and the FDA’s regulations, including the results of any required bioequivalence studies. The FDA may refuse to accept the filing of an ANDA that is not substantially complete or may determine during substantive review of the ANDA that additional information, such as an additional bioequivalence study, is required to support approval.
Such a determination may affect an applicant’s first-to-file status and eligibility for a 180-day period of marketing exclusivity for the generic product. The MMA also modified the rules governing when the 180-day marketing exclusivity period is triggered or forfeited and shared. Prior to the legislation, the 180-day marketing exclusivity period was triggered upon the first commercial marketing of the ANDA or a court decision holding the patent invalid, unenforceable, or not infringed. For ANDAs accepted for filing before March 2000, that court decision had to be final and non-appealable (other than a petition to the U.S. Supreme Court for a writ of certiorari). In March 2000, the FDA changed its position in response to two court cases that challenged the FDA’s original interpretation of what constituted a court decision under the Hatch-Waxman Act. Under the changed policy, the 180-day marketing exclusivity period began running immediately upon a district court decision holding the patent at issue invalid, unenforceable, or not infringed, regardless of whether the ANDA had been approved and the generic product had been marketed. In codifying the FDA’s original policy, the MMA retroactively applies a final and non-appealable court decision trigger for all ANDAs filed before December 8, 2003 leaving intact the first commercial marketing trigger. As for ANDAs filed after December 8, 2003, the marketing exclusivity period is only triggered upon the first commercial marketing of the ANDA product, but that exclusivity may be forfeited under certain circumstances, including if the ANDA is not marketed within 75 days after a final and non-appealable court decision by the first-to-file or other ANDA applicant, or if the FDA does not tentatively approve the first-to-file applicant’s ANDA within 30 months.
In addition to patent exclusivity, the holder of the NDA for the listed drug may be entitled to a period of non-patent market exclusivity, during which the FDA cannot approve an ANDA. If the listed drug is a NCE, the FDA may not accept an ANDA for a bioequivalent product for up to five years following approval of the NDA for the NCE.
If the listed drug is not a NCE but the holder of the NDA conducted clinical trials essential to approval of the NDA or a supplement thereto, the FDA may not approve an ANDA for a bioequivalent product before expiration of three years. Certain other periods of exclusivity may be available if the listed drug is indicated for treatment of a rare disease or is studied for pediatric indications.
· Section 505(b)(2) New Drug Applications: For a drug that is identical to a previously approved drug, a prospective manufacturer need not go through the full NDA procedure. Instead, it may demonstrate safety and efficacy by relying on published literature and reports where at least some of the information required for approval comes from studies not conducted by or for the applicant and for which the applicant has not obtained a right of reference. The Hatch-Waxman Act permits the applicant to rely upon certain preclinical or clinical studies conducted for an approved product. The manufacturer must also submit, if the FDA so requires, bioavailability or bioequivalence data illustrating that the generic drug formulation produces the same effects, within an acceptable range, as the previously approved innovator drug. Because published literature to support the safety and efficacy of post-1962 drugs may not be available, this procedure is of limited utility to generic drug manufacturers and the resulting approved product will not be interchangeable with the innovator drug as an ANDA drug would be unless bio equivalency testing were undertaken and approved by FDA. Moreover, the utility of Section 505(b)(2) applications have with the exception of “Grandfathered drugs” been diminished by the availability of the ANDA process, as described above.
Additionally, certain products marketed prior to the FDCA may be considered GRASE (“Generally Recognized As Safe and Effective”) or Grandfathered. GRASE products are those “old drugs that do not require prior approval from FDA in order to be marketed because they are generally recognized as safe and effective based on published scientific literature.” Similarly, Grandfathered products are those which “entered the market before the passage of the 1938 act or the 1962 amendments to the act.” Under the grandfather clause, such a product is exempted from the “effectiveness requirements [of the act] if its composition and labeling have not changed since 1962 and if, on the day before the 1962 amendments became effective, it was (1) used or sold commercially in the United States, (2) not a new drug as defined by the act at that time and (3) not covered by an effective application.”
Manufacturing cGMP Requirements
Among the requirements for a new drug approval, facilities identified in each application that perform operations related to the drug product, including drug substance manufacturers and outside contract facilities, must conform to FDA cGMP regulations. The FDA may perform pre-approval inspections to assess a company’s compliance with cGMP regulations. These inspections include reviews of procedures, operations, and data used to support the application and ongoing drug product manufacturing and testing. FDA’s cGMP regulations require, among other things, quality control and quality assurance systems as well as the corresponding records and documentation. In complying with the evolving standards set forth in the cGMP regulations, we must continue to expend time, money and effort in many areas of the company ensure compliance.
Failure to comply with statutory and regulatory requirements subject a manufacturer to possible legal or regulatory action, including but not limited to, the seizure of non-complying drug products, injunctions, consent decrees placing significant restrictions on or suspending manufacturing operations and/or civil and criminal penalties.
Adverse experiences with the product and certain non-compliance events may need to be reported to the FDA and could result in regulatory actions such as labeling changes or FDA request for application withdrawal or product removal.
Other Regulatory Requirements
With respect to post-market product advertising and promotion, the FDA imposes a number of complex regulations on entities that advertise and promote pharmaceuticals, which include, among others, standards for direct-to-consumer advertising, off-label promotion, industry-sponsored scientific and educational activities and promotional activities involving the internet. The FDA has very broad enforcement authority under the FDCA and failure to abide by these regulations can result in penalties, including the issuance of a warning letter directing entities to correct deviations from FDA standards, a requirement that future advertising and promotional materials be pre-cleared by the FDA and state and/or federal civil and criminal investigations and prosecutions. Some of our products require participation in Risk Evaluation and Mitigation Strategies (REMS) programs, including our opioid products. A shared system REMS encompasses multiple prescription drug products and is developed and implemented jointly by two or more companies marketing the same products. These programs can add significant costs for the Company, depending on market share and complexity of the program.
We are also subject to various laws and regulations regarding laboratory practices, the experimental use of animals and the use and disposal of hazardous or potentially hazardous substances in connection with our research. In each of these areas, as above, the FDA has broad regulatory and enforcement powers, including the ability to levy fines and civil penalties, suspend or delay issuance of approvals, seize or recall products and withdraw approvals.
Any one or a combination of FDA regulatory or enforcement actions against the Company could have a material adverse effect on our financial results.
DEA Regulation
We maintain registrations with the DEA that enable us to receive, manufacture, store, develop, test and distribute controlled substances in connection with our operations. Controlled substances are those drugs that appear on one of five schedules promulgated and administered by the DEA under the CSA. The CSA governs, among other things, the distribution, recordkeeping, handling, security and disposal of controlled substances. We are subject to periodic and ongoing inspections by the DEA and similar state drug enforcement authorities to assess our ongoing compliance with the DEA’s regulations. Any failure to comply with these regulations could lead to a variety of sanctions, including the revocation or a denial of renewal of our DEA registration, injunctions, or civil or criminal penalties.
Fraud and Abuse Laws
Because of the significant federal funding involved in Medicare and Medicaid, Congress and state legislatures have enacted and actively enforce, a number of laws whose purpose is to eliminate fraud and abuse in federal health care programs. Our business is subject to compliance with these laws, such as the Sarbanes-Oxley Act of 2002, Dodd-Frank and the Foreign Corrupt Practices Act (“FCPA”).
Anti-Kickback Statutes and Federal False Claims Act
The federal health care program’s fraud and abuse law (sometimes referred to as the “Anti-Kickback Statute”) prohibits persons from knowingly and willfully soliciting, offering, receiving, or providing remuneration, directly or indirectly, in exchange for or to induce either the referral of an individual, or the furnishing or arranging for a good or service, for which payment may be made under a federal health care program such as Medicare or Medicaid. The definition of “remuneration” has been broadly interpreted to include anything of value, including for example gifts, certain discounts, the furnishing of free supplies, equipment or services, credit arrangements, payment of cash and waivers of payments. Several courts have interpreted the statute’s intent requirement to mean that if any one purpose of an arrangement involving remuneration is to induce referrals of federal health care covered business, the statute has been violated. Penalties for violations include criminal penalties and civil sanctions such as fines, imprisonment and possible exclusion from Medicare, Medicaid and other federal health care programs. In addition, some kickback allegations have been claimed to violate the Federal False Claims Act, discussed in more detail below.
The Anti-Kickback Statute is broad and prohibits many arrangements and practices that are lawful in businesses outside of the health care industry. Recognizing that the Anti-Kickback Statute is broad and may technically prohibit many innocuous or beneficial arrangements, Congress authorized the Office of Inspector General of the U.S. Department of Health and Human Services (“OIG”) to issue a series of regulations, known as “safe harbors.” These safe harbors, issued by the OIG beginning in July 1991, set forth provisions that, if all of their applicable requirements are met, will assure health care providers and other parties that they will not be prosecuted under the Anti-Kickback Statute. The failure of a transaction or arrangement to fit precisely within one or more safe harbors does not necessarily mean that it is illegal or that prosecution will be pursued.
However, conduct and business arrangements that do not fully satisfy each applicable safe harbor may result in increased scrutiny by government enforcement authorities such as OIG.
Many states have adopted laws similar to the Anti-Kickback Statute. Some of these state prohibitions apply to referral of patients for health care items or services reimbursed by any source, not only the Medicare and Medicaid programs.
Government officials have focused their enforcement efforts on marketing of health care services and products, among other activities and recently have brought cases against companies and certain sales, marketing and executive personnel, for allegedly offering unlawful inducements to potential or existing customers in an attempt to procure their business.
Another development affecting the health care industry is the increased use of the Federal False Claims Act (“FFCA”) and in particular, action brought pursuant to the FFCA’s “Whistleblower” or “Qui Tam” provisions. The FFCA imposes liability on any person or entity who, among other things, knowingly presents, or causes to be presented, a false or fraudulent claim for payment by a federal health care program. The Qui Tam provisions of the FFCA allow a private individual to bring actions on behalf of the federal government alleging that the defendant has submitted a false claim to the federal government and to share in any monetary recovery. In recent years, the number of suits brought against health care providers by private individuals has increased dramatically. In addition, various states have enacted false claims law analogous to the FFCA, although many of these state laws apply where a claim is submitted to any third-party payer and not merely a federal health care program.
When an entity is determined to have violated the FFCA, it may be required to pay up to three times the actual damages sustained by the government, plus civil penalties. Liability arises, primarily, when an entity knowingly submits or causes another to submit a false claim for reimbursement to the federal government. The federal government has used the FFCA to assert liability on the basis of inadequate care, kickbacks and other improper referrals and improper use of Medicare numbers when detailing the provider of services, in addition to the more predictable allegations as to misrepresentations with respect to the services rendered. In addition, the federal government has prosecuted companies under the FFCA in connection with off-label promotion of products. Our future activities relating to the reporting of wholesale or estimated retail prices of our products, the reporting of discount and rebate information and other information affecting federal, state and third-party reimbursement of our products and the sale and marketing of our products may be subject to scrutiny under these laws. We are unable to predict whether we will be subject to actions under the FFCA or a similar state law, or the impact of such actions. However, the costs of defending such claims, as well as any sanctions imposed, could significantly affect our financial performance.
Foreign Corrupt Practices Act (“FCPA”)
The FCPA of 1977, as amended, was enacted for the purpose of making it unlawful for certain classes of persons and entities to make payments to foreign government officials to assist in obtaining or retaining business. Specifically, the anti-bribery provisions of the FCPA prohibit the bribery of government officials.
HIPAA and Other Fraud and Privacy Regulations
The Health Insurance Portability and Accountability Act of 1996 (“HIPAA”) created two new federal crimes: health care fraud and false statements relating to health care matters. The HIPAA health care fraud statute prohibits, among other things, knowing and willfully executing, or attempting to execute, a scheme to defraud any health care benefit program, including private payors. A violation of this statute is a felony and may result in fines, imprisonment and/or exclusion from government-sponsored programs. The HIPAA false statements statute prohibits knowingly and willfully falsifying, concealing, or covering up a material fact or making any materially false, fictitious, or fraudulent statement or representation in connection with the delivery of or payment for health care benefits, items, or services. A violation of this statute is a felony and may result in fines and/or imprisonment.
Pricing
In the United States, our sales are dependent upon the availability of coverage and reimbursement for our products from third-party payors, including federal and state programs such as Medicare and Medicaid and private organizations such as commercial health insurance and managed care companies. Such third-party payors increasingly challenge the price of medical products and services and instituting cost containment measures to control or significantly influence the purchase of medical products and services.
Over the past several years, the rising costs of providing health care services has triggered legislation to make certain changes to the way in which pharmaceuticals are covered and reimbursed, particularly by government programs. For instance, recent federal legislation and regulations have created a voluntary prescription drug benefit, Medicare Part D, which revised the formula used to reimburse health care providers and physicians under Medicare Part B and imposed significant revisions to the Medicaid Drug Rebate Program. These changes have resulted in and may continue to result in, coverage and reimbursement restrictions and increased rebate obligations by manufacturers.
In addition, there continues to be legislative and regulatory proposals at the federal and state levels directed at containing or lowering the cost of health care. Examples of how limits on drug coverage and reimbursement in the United States may cause reduced payments for drugs in the future include:
· changing Medicare reimbursement methodologies;
· revising drug rebate calculations under the Medicaid program;
· reforming drug importation laws;
· fluctuating decisions on which drugs to include in formularies; and
· requiring pre-approval of coverage for new or innovative drug therapies.
Also, over the last few years, several states have passed legislation or have proposed legislation that have imposed price reporting requirements for both generic and brand pharmaceutical products and that include price transparency, price increase notification and supplement rebate requirements.
We cannot predict the likelihood or pace of such additional changes or whether there will be significant legislative or regulatory reform impacting our products, nor can we predict with precision what effect such governmental measures would have if they were ultimately enacted into law. However, in general, we believe that legislative and regulatory reform activity likely will continue.
Current or future federal or state laws and regulations may influence the prices of drugs and, therefore, could adversely affect the prices that we receive for our products. Programs in existence in certain states seek to set prices of all drugs sold within those states through the regulation and administration of the sale of prescription drugs. Expansion of these programs, in particular, state Medicaid programs, or changes required in the way in which Medicaid rebates are calculated under such programs, could adversely affect the price we receive for our products and could have a material adverse effect on our business, results of operations and financial condition. Further, generic pharmaceutical drug prices have been the focus of increased scrutiny by certain states’ attorney generals, the U.S. Department of Justice and Congress. Decreases in health care reimbursements or prices of our prescription drugs could limit our ability to sell our products or decrease our revenues, which could have a material adverse effect on our business, results of operations and financial condition.
The Company believes that under the current regulatory environment, the generic pharmaceutical industry as a whole will be the target of increased governmental scrutiny, especially with respect to state and federal anti-trust and price-fixing claims.
See Note 11 “Legal, Regulatory Matters and Contingencies” for a description of current state and federal anti-trust and price-fixing claims.
Other Applicable Laws
We are also subject to federal, state and local laws of general applicability, including laws regulating working conditions and the storage, transportation, or discharge of items that may be considered hazardous substances, hazardous waste, or environmental contaminants. We monitor our compliance with laws and we believe we are in substantial compliance with all regulatory bodies.
As a publicly-traded company, we are also subject to significant regulations and laws, including the Sarbanes-Oxley Act of 2002. Since its enactment, we have developed and instituted a corporate compliance program based on what we believe are the current best practices and we continue to update the program in response to newly implemented or changing regulatory requirements.
Employees
As of June 30, 2018, we had 1,251 full-time employees.
Securities and Exchange Act Reports
We maintain a website at www.lannett.com. We make available on or through our website our current and periodic reports, including any amendments to those reports, that are filed with the Securities and Exchange Commission (the “SEC”) in accordance with the Securities Exchange Act of 1934, as amended (the “Exchange Act”). These reports include annual reports on Form 10-K, quarterly reports on Form 10-Q and current reports on Form 8-K. This information is available on our website free of charge as soon as reasonably practicable after we electronically file the information with, or furnish it to, the SEC.
The contents of our website are not incorporated by reference in this Form 10-K and shall not be deemed “filed” under the Exchange Act.
A substantial portion of our total net sales and gross profits are generated from products manufactured by JSP that we distribute pursuant to an agreement with JSP, and the termination of our distribution agreement with JSP will materially decrease our net sales, results of operations and cash flows.
Net sales of JSP products totaled $253.1 million in fiscal year 2018. Of that amount, Levothyroxine Sodium Tablets USP net sales totaled $245.9 million, with gross margins of approximately 60%, in fiscal year 2018. As described above, our current distribution agreement with JSP will not be renewed when it expires on March 23, 2019. After the close of business on August 17, 2018, JSP notified the Company that it will not extend or renew the JSP Distribution Agreement. This will significantly decrease our net sales, results of operations and cash flows beginning in the fourth quarter of Fiscal 2019.
We rely on an uninterrupted supply of finished products from JSP for a significant amount of our sales through March 23, 2019. If we were to experience an interruption of that supply, our operating results would suffer.
In fiscal year 2018, 37% of our total net sales consists of distributed products manufactured by JSP. Two of these products are Levothyroxine Sodium and Digoxin, which accounted for 36% and 1%, respectively, of our Fiscal 2018 total net sales and 27% and 2%, respectively, of our total net sales for Fiscal 2017. On August 19, 2013, the Company entered into an agreement with JSP to extend its initial contract to continue as the exclusive distributor in the United States of three JSP products: Butalbital, Aspirin, Caffeine with Codeine Phosphate Capsules USP; Digoxin Tablets USP; and Levothyroxine Sodium Tablets USP. The amendment to the original agreement extended the initial contract, which was due to expire on March 22, 2014, for five years through March 23, 2019, at which time the distribution agreement will expire and not be renewed. If the supply of these products is interrupted in any way by any form of temporary or permanent business interruption to JSP, including but not limited to fire or other naturally-occurring, damaging event to their physical plant and/or equipment, condemnation of their facility, legislative or regulatory cease and desist declaration regarding their operations, FDA action or any interruption in their source of API for their products, our operating results could be materially adversely affected. We do not have, at this time, a second source for these products.
Management’s plans to address the impact of the nonrenewal of the JSP Distribution Agreement may not be successful.
Management is continuing to finalize plans to offset the impact of the nonrenewal of the JSP Distribution Agreement. These plans currently include, among other things, an emphasis on reducing cost of sales, R&D and SG&A expenses, continuing to accelerate new product launches, increasing its level of strategic partnerships and reducing capital expenditures. Management will also continue its emphasis on accelerating ANDA filings. However, the impact that these actions will have cannot be assured and they may not be sufficient to offset the impact, in whole or in part, of the loss of net sales, earnings or cash flows resulting from the nonrenewal of the JSP Distribution Agreement.
Our substantial indebtedness may adversely affect our financial health.
We currently have substantial indebtedness. As of June 30, 2018, we had total indebtedness of $897.3 million, which primarily consists of an amended term loan facility (the “Amended Term Loan Facility”). We also have an undrawn $125.0 million revolving credit facility (the “Revolving Credit Facility”). The Amended Term Loan Facility consists of an initial $910.0 million senior secured term loan facility (the “Senior Secured Term Loan Facility”), which was amended in June 2016 to include an additional $150.0 million incremental term loan (the “Incremental Term Loan”). The Amended Term Loan Facility, together with the Revolving Credit Facility comprises the amended senior secured credit facility (the “Amended Senior Secured Credit Facility”).
Our substantial indebtedness may have important consequences for us. For example, it may:
·increase our vulnerability to general economic and industry conditions, including recessions and periods of significant inflation and financial market volatility;
·expose us to the risk of increased interest rates, because any borrowings we make under the Revolving Facility and other borrowings under the Term Loan Facility under certain circumstances, will bear interest at variable rates;
·require us to use a substantial portion of cash flow from operations to service our indebtedness, thereby reducing our ability to fund working capital, capital expenditures and other expenses;
·limit our flexibility in planning for, or reacting to, changes in our business and the industry in which we operate;
·place us at a competitive disadvantage compared to competitors that have less indebtedness; and
·limit our ability to borrow additional funds that may be needed to operate and expand our business.
The Amended Senior Secured Credit Facility imposes operating and financial restrictions, which may prevent us from pursuing certain business opportunities and taking certain actions that may be potentially profitable or in our best interests.
The operating and financial restrictions and covenants in our Amended Senior Secured Credit Facility restrict and future debt instruments may restrict, subject to certain important exceptions and qualifications, our and our subsidiaries’ ability to, among other things:
·incur or guarantee additional indebtedness;
·make certain investments or acquisitions;
·grant or permit certain liens on our assets;
·enter into certain transactions with affiliates;
·pay dividends, redeem our equity or make other restricted payments;
·prepay, repurchase or redeem contractually subordinated debt and certain other debt;
·merge, consolidate or transfer substantially all of our assets;
·transfer, sell or dispose of property and assets; and
·change the business we conduct or enter into new kinds of business.
These covenants could adversely affect our ability to finance our future operations or capital needs, withstand a future downturn in our business or the economy in general, engage in business activities, including future opportunities that may be in our interest and plan for or react to market conditions or otherwise execute our business strategies. Our ability to comply with these covenants may be affected by events beyond our control. See Note 22. “Subsequent Events” for more information related to the JSP Distribution Agreement. A breach of any of these covenants could result in a default in respect of the related indebtedness. If an event of default occurs, the relevant lenders or holders of such indebtedness could elect to declare the indebtedness, together with accrued interest, fees and other liabilities, to be immediately due and payable and proceed against any collateral securing that indebtedness. Acceleration of our other indebtedness could result in a default under the terms of the Amended Senior Secured Credit Facility. There is no guarantee that we would be able to satisfy our obligations if any of our indebtedness is accelerated.
In addition, the limitations imposed in the Amended Senior Secured Credit Facility on our ability to incur certain additional debt and to take other corporate actions might significantly impair our ability to obtain other financing. If, for any reason, we are unable to comply with the restrictions in the Amended Senior Secured Credit Facility, we may not be granted waivers or amendments to such restrictions or we may not be able to refinance our debt on terms acceptable to us, or at all. The lenders under the Amended Senior Secured Credit Facility also have the right in these circumstances to terminate any commitments they have to provide further borrowings. If we fail to meet any covenants in our Amended Senior Secured Credit Facility and cannot secure a waiver for such failure, the lenders under our Amended Senior Secured Credit Facility would be entitled to exercise various rights, including causing the amounts outstanding under the entire Amended Senior Secured Credit Facility to become immediately due and payable. If we were unable to pay such amounts, the lenders under the Amended Senior Secured Credit Facility could recover amounts owed to them by foreclosing against the collateral pledged to them. We have pledged a substantial portion of our assets to the lenders under the Amended Senior Secured Credit Facility, including the equity of our subsidiaries.
Our Amended Senior Secured Credit Facility contains a financial covenant and other restrictive covenants that limit our flexibility. We may not be able to comply with these covenants, which could result in the amounts outstanding under our Amended Senior Secured Credit Facility becoming immediately due and payable.
Our Revolving Credit Facility requires us to comply with a first lien net leverage ratio not to exceed 3.75:1.00 when there are outstanding loans and letters of credit (other than (i) drawn letters of credit that have been cash collateralized and (ii) up to $5.0 million of undrawn letters of credit) thereunder that exceed 30% of the aggregate commitment amount under the Revolving Credit Facility of $125.0 million as of the last day of the applicable fiscal quarter (with a step-down occurring as of December 31, 2019 of 3.25:1.00).
In addition, the Term Loan A Facility is subject to a financial performance covenant, which provides that the Company shall not permit its secured net leverage ratio as of the last day of any four consecutive fiscal quarters to be greater than 3.75:1.00 (with a step-down occurring as of December 31, 2019 to 3.25:1.00). Accordingly, if our liquidity and performance significantly worsens, we could become non-compliant with such covenants. See Note 22. “Subsequent Events” for more information related to the JSP Distribution Agreement, which will not be renewed.
As of June 30, 2018, the Company was in compliance with the financial and other covenants included in its debt agreements. See Note. 10 “Long-Term Debt”. Based on its current projections, the Company expects to have sufficient liquidity and cash flows to be able to meet its debt service requirements through June 30, 2019 and expects to be in compliance with its financial covenants throughout Fiscal 2019. If actual results for the year ending June 30, 2019 are less than the Company’s current projections and/or if management’s plans to offset the loss of the revenues and cash flows from the products distributed under the JSP Distribution Agreement are not successful, the Company could be in violation of its covenants, which may require significant accelerated payments of debt.
We are also subject to requirements to make mandatory prepayments, with the net proceeds of certain asset sales, excess cash flows and debt issuances. These requirements could limit our ability to obtain future financing, make acquisitions or needed capital expenditures, withstand any downturns in our business or the economy in general, conduct operations or otherwise take advantage of business opportunities that may arise, any of which could place us at a competitive disadvantage relative to our competitors that have less debt and are not subject to such restrictions.
Our variable rate indebtedness subjects us to interest rate risk, which could cause our debt service obligations to increase significantly.
Borrowings under the Amended Senior Secured Credit Facility are at variable rates of interest and expose us to interest rate risk. Interest rates are currently at historically low levels. If interest rates increase, our debt service obligations on our variable rate indebtedness will increase even though the amount borrowed remained the same and our net income and cash flows, including cash available for servicing our indebtedness, will correspondingly decrease. Based on total indebtedness as of June 30, 2018 and the assumption that interest rates are above the interest rate floor set forth in the Amended Senior Secured Credit Facility, each 1/8th percentage point change in interest rates would result in a $1.1 million change in annual interest expense on our indebtedness under the Amended Senior Secured Credit Facility.
Due to many factors beyond our control, we may not be able to generate sufficient cash to service all of our indebtedness and meet our other ongoing liquidity needs and we may be forced to take other actions to satisfy our obligations under our debt agreements, which may not be successful.
Our ability to make payments on and to refinance, our indebtedness and to fund planned capital expenditures will depend on our ability to generate cash in the future. This is subject to general economic, financial, competitive, legislative, regulatory and other factors, many of which are beyond our control.
Our business may not generate sufficient cash flow from operations and we may not have available to us future borrowings in an amount sufficient, to enable us to pay our indebtedness or to fund our other liquidity needs. In these circumstances, we may need to refinance all or a portion of our indebtedness on or before maturity. Any refinancing of our debt could be at higher interest rates and may require us to comply with more onerous covenants, which could further restrict our business operations. Our ability to refinance our indebtedness or obtain additional financing will depend on, among other things:
·our financial condition at the time;
·restriction in the agreements governing our indebtedness;
·the condition of the financial markets and the industry in which we operate; and
·our debt credit ratings
As a result, we may not be able to refinance any of our indebtedness on commercially reasonable terms or at all. In such a case, we could be forced to sell assets, reduce or delay capital expenditures or issue equity securities to make up for any shortfall in our payment obligations under unfavorable circumstances. The terms of the Amended Senior Secured Credit Facility limit our ability to sell assets. In addition, we may not be able to sell assets quickly enough or for sufficient amounts to enable us to meet our obligations. Any failure to make scheduled payments of interest and principal on our outstanding indebtedness when due would permit the holders of such indebtedness to declare an event of default and accelerate the indebtedness. This could result in the lenders under the Amended Senior Secured Credit Facility terminating their commitments to lend us money and foreclosing against the assets securing the borrowings and we could be forced into bankruptcy or other insolvency proceedings. In addition, any failure to make payments of interest and principal on our outstanding indebtedness on a timely basis would likely result in a reduction of our credit rating, which could harm our ability to incur additional indebtedness on acceptable terms. In August 2018, both Moody’s and S&P reduced the Company’s debt credit rating to “B3” and “B-”, respectively, and they indicated that they were going to perform additional reviews. See Note 22. “Subsequent Events” for more information related to the JSP Distribution Agreement, which will not be renewed.
If our goodwill or other intangible assets become impaired, we may be required to record a significant charge to earnings.
Under accounting principles generally accepted in the U.S. (“U.S. GAAP”), we review our goodwill and indefinite lived intangible assets for impairment at least annually and when there are changes in circumstances. We may be required to record additional significant charges to earnings in our financial statements during the period in which any impairment of our goodwill or indefinite lived intangible assets is determined, resulting in a negative effect on our results of operations. Changes in market conditions or other changes in the future outlook of value may lead to further impairments in the future. In addition, we continue to review the potential divestment of certain assets as part of our future plans, which may lead to additional impairments. Future events or decisions may lead to asset impairments and/or related charges. For assets that are not impaired, we may adjust the remaining useful lives. Certain non-cash impairments may result from a change in our strategic goals, business direction or other factors relating to the overall business environment. Any significant impairment could have a material adverse effect on our results of operations.
As described above, on August 20, 2018, the Company announced that the JSP Distribution Agreement which expires on March 23, 2019 will not be renewed. As a result, the Company has determined that such nonrenewal represents a “triggering event” under United States Generally Accepted Accounting Principles (“U.S. GAAP”) and, accordingly, will perform an analysis to determine the potential for any impairment of goodwill and certain long-lived assets of the Company in the first quarter of Fiscal 2019. In management’s opinion, the impairment assessment will likely result in a material impairment of goodwill and may result in an impairment of certain long-lived assets; however, at this time the Company cannot estimate the amount or range of amounts of such impairment. As of June 30, 2018, the carrying value of goodwill was $339.6 million. Any impairment would result in a noncash charge to earnings in the first quarter of Fiscal 2019. See Note 22. “Subsequent Events” for more information related to potential impairment in Fiscal 2019 related to the JSP Distribution Agreement not being renewed.
Our gross profit may fluctuate from period to period depending upon our product sales mix, our product pricing and our costs to manufacture or purchase products.
Our future results of operations, financial condition and cash flows depend to a significant extent upon our product sales mix. Sales of certain products that we manufacture tend to create higher gross margins than the products we purchase and resell. As a result, our sales mix will significantly impact our gross profit from period to period.
Factors that may cause our sales mix to vary include:
·the number of new product introductions;
·marketing exclusivity, if any, which may be obtained on certain new products;
·the level of competition in the marketplace for certain products;
·the availability of raw materials and finished products from our suppliers; and
·the scope and outcome of governmental regulatory action that may involve us.
The Company is continuously seeking to keep product costs low, however there can be no guarantee that gross profit percentages will stay consistent in future periods. Pricing pressure from competitors, changes in product mix and the costs of producing or purchasing new drugs may also fluctuate in future periods.
Acquisitions could result in operating difficulties, dilution and other harmful consequences that may adversely impact our business and results of operations.
Acquisitions are an important element of our overall corporate strategy and use of capital. These transactions could be material to our financial condition and results of operations. We also expect to continue to evaluate and enter into discussions regarding a wide array of potential strategic transactions. We may compete for certain acquisition targets with companies having greater financial resources than us or other advantages over us that may hinder or prevent us from acquiring a target company or completing another transaction, which could also result in significant diversion of management time, as well as substantial out-of-pocket costs. The process of integrating an acquired company, business, or technology may create unforeseen operating difficulties and expenditures. The areas where we may face risks include but are not limited to (i) diversion of management time and focus from operating our business to acquisition integration challenges, (ii) implementation or remediation of controls, procedures and policies at the acquired company, (iii) integration of the acquired company’s accounting, human resource and other administrative systems and coordination of product, engineering and sales and marketing functions, (iv) transition of operations, users and customers onto our existing platforms, (v) failure to obtain required approvals from governmental authorities under competition and antitrust laws on a timely basis, if at all, which could, among other things, delay or prevent us from completing a transaction, or otherwise restrict our ability to realize the expected financial or strategic goals of an acquisition, (vi) cultural challenges associated with integrating employees from the acquired company into our organization and retention of employees from the businesses we acquire and (vii) liability for activities of the acquired company before the acquisition, including infringement claims, violations of laws, commercial disputes, tax liabilities, claims from current and former employees and customers and other known and unknown liabilities.
Our failure to address these risks or other problems encountered in connection with our past or future acquisitions could cause us to fail to realize the anticipated benefits of such acquisitions, incur unanticipated liabilities and harm our business generally. Future acquisitions could also result in dilutive issuances of our equity securities, the incurrence of debt, contingent liabilities, or amortization expenses, or write-offs of goodwill, any of which could harm our financial condition. Also, the anticipated benefit of many of our acquisitions may not materialize.
We have been and may continue to be adversely affected by increased governmental rebates and regulations with respect to matters relating to the pricing of our products and we may experience pricing pressure or reduce pricing flexibility on the price of certain of our products due to competitive or governmental pressure to lower the cost of drugs, which could reduce our revenue and future profitability.
There has been increased press coverage and increased scrutiny from regulatory and enforcement agencies and legislative bodies with respect to matters relating to the pricing of generic pharmaceuticals, including publicity and pressure resulting from prices charged by our competitors. We have experienced and may continue to experience downward pricing pressure on the price of our products due to competitive pressure to lower the cost of drugs to the ultimate consumer, which could reduce our revenue and future profitability. This increased press coverage and public scrutiny have resulted in, and may continue to result in, investigations, and calls for investigations, by governmental agencies at both the federal and state level and have resulted in, and may continue to result in, claims brought against us by private parties or by regulators taking other measures that could have a negative effect on our business. For a description of current and federal and state investigations and claims by private parties, see Note 11 “Legal, Regulatory Matters and Contingencies”. Additional actions are possible. It is not possible at this time to predict the ultimate outcome of any such investigations or claims or what other investigations or lawsuits or regulatory responses may result from such assertions, or their impact on our business, financial condition, results of operations, cash flows, and/or ordinary share price. Any such investigation or claim could also result in reputational harm and reduced market acceptance and demand for our products, could harm our ability to market our products in the future, could cause us to incur significant expense, could cause our senior management to be distracted from execution of our business strategy, and could have a material adverse effect on our business, financial condition, results of operations and growth prospects. Accompanying the press and media coverage of pharmaceutical pricing practices and public complaints about the same, there has been increasing U.S. federal and state legislative and enforcement interest with respect to drug pricing. In recent years, both the U.S. House of Representatives and the U.S. Senate have conducted numerous hearings with respect to pharmaceutical drug pricing practices, including in connection with the investigation of specific price increases by pharmaceutical companies. In addition to the effects of any investigations or claims brought against us described above, our revenue and future profitability could also be negatively affected if any such inquiries, of us or of other pharmaceutical companies or the industry more generally, were to result in legislative or regulatory proposals that limit our ability to increase the prices of our products. Any of the events or developments described above could have a material adverse impact on our business, financial condition or results of operations, as well as on our reputation.
The generic pharmaceutical industry is highly competitive.
We face strong competition in our generic product business. Revenues and gross profit derived from the sales of generic pharmaceutical products tend to follow a pattern based on certain regulatory and competitive factors. Typically, as patents for brand-name products and related exclusivity periods expire or fall under patent challenges, the first generic manufacturer to receive regulatory approval for generic equivalents of such products is generally able to achieve significant market penetration. As competing off-patent manufacturers receive regulatory approvals on similar products or as brand manufacturers launch generic versions of such products (for which no separate regulatory approval is required), market share, revenues and gross profit typically decline, in some cases dramatically. Accordingly, the level of market share, revenue and gross profit attributable to a particular generic product is normally related to the number of competitors in that product’s market and the timing of that product’s regulatory approval and launch, in relation to competing approvals and launches. Consequently, we must continue to develop and introduce new products in a timely and cost-effective manner to maintain our revenues and gross margins.
Extensive industry regulation has had and will continue to have, a significant impact on our business in the area of cost of goods, especially our product development, manufacturing and distribution capabilities.
All pharmaceutical companies, including Lannett, are subject to extensive, complex, costly and evolving regulation by the federal government, including the FDA and, in the case of controlled drugs, the DEA and state government agencies. The FDCA, the CSA and other federal statutes, regulations and guidance govern or influence the development, testing, manufacturing, packing, labeling, storing, record keeping, safety, approval, advertising, promotion, sale and distribution of our products.
The process for obtaining governmental approval to manufacture and market pharmaceutical products is rigorous, time-consuming and costly and we cannot predict the extent to which we may be affected by legislative and regulatory developments. We are dependent on receiving FDA and other governmental or third-party approvals prior to manufacturing, marketing and shipping our products. The FDA approval process for a particular product candidate can take several years and requires us to dedicate substantial resources to complete all activities necessary to secure approvals and we may not be able to obtain regulatory approval for our product candidates in a timely manner, or at all. In order to obtain approval for our generic product candidates, we must demonstrate that our drug product is therapeutically equivalent and bioequivalent to a drug previously approved by the FDA through the drug approval process, known as the reference listed drug (“RLD”) or reference standard drug (“RS”). Bioequivalence may be demonstrated in vivo or in vitro by comparing the generic product candidate to the innovator drug product. During the FDA review process, the FDA may request additional information and studies to support approval of an application, which could delay approval of the product and impair our ability to compete with other versions of the generic drug product.
Consequently, there is always the chance that we will not obtain FDA or other necessary approvals, or that the rate, timing and cost of such approvals will adversely affect our product introduction plans or results of operations. We carry inventories of certain products in anticipation of launch and if such products are not subsequently launched, we may be required to write-off the related inventory. Furthermore, the FDA also has the authority to withdraw drug approvals previously granted after a hearing and require a firm to remove these products from the market for a variety of reasons, including a failure to comply with applicable regulations or the discovery of previously unknown safety problems with the product.
Additionally, certain products marketed prior to the FDCA may be considered GRASE or Grandfathered. GRASE products are those “old drugs that do not require prior approval from FDA in order to be marketed because they are generally recognized as safe and effective based on published scientific literature.” Similarly, Grandfathered products are those which “entered the market before the passage of the 1906 Act, 1938 Act or the 1962 amendments to the Act.” Under the Grandfathered drug clause, such a product is exempted from the “effectiveness requirements [of the act] if its composition and labeling have not changed since 1962 and if, on the day before the 1962 amendments became effective, it was (1) used or sold commercially in the United States, (2) not a new drug as defined by the act at that time and (3) not covered by an effective application.” Recently, the FDA has increased its efforts to force companies to file and seek FDA approval for Grandfathered products. Efforts have included issuing notices to companies currently producing these products to cease its distribution of said products. Lannett currently manufactures and markets Grandfathered products, including cocaine hydrochloride oral solution and hyosyne solution/elixir.
In addition, facilities used to manufacture and/or test materials and drug products we market are subject to periodic inspection of facilities by the FDA, the DEA and other authorities to confirm that firms are in compliance with all applicable regulations. The FDA conducts pre-approval and/or post-approval inspections to determine whether systems and processes are in compliance with cGMP and other FDA regulations. A Form 483 notice is generally issued at the conclusion of a FDA inspection and lists conditions the FDA inspectors believe may violate cGMP or other FDA regulations. If more serious violations are identified, the FDA may take additional action, such as issuing warning letters, import alerts, etc. The DEA and comparable state-level agencies also heavily regulate the manufacturing, holding, processing, security, record-keeping and distribution of drugs that are controlled substances. Lannett manufactures and/or distributes a variety of controlled substances. The DEA periodically inspects facilities for compliance with its regulations. If our manufacturing facilities or those of our suppliers fail to comply with applicable regulatory requirements, it could result in regulatory action and additional costs.
Our inability or the inability of our suppliers to comply with applicable FDA and other regulatory requirements can result in, among other things, delays in or denials of new product approvals, warning letters, import alerts, fines, consent decrees restricting or suspending manufacturing operations, injunctions, civil penalties, recall or seizure of products, total or partial suspension of sales and/or criminal prosecution. Any of these or other regulatory actions could materially harm our operating results and financial condition. Although we have instituted internal compliance programs, if these programs do not meet regulatory agency standards or if compliance is deemed deficient in any significant way, it could materially harm our business. Additionally, if the FDA were to undertake additional enforcement activities with Lannett’s Grandfathered products, their actions could result in, among other things, removal of some products from the market, seizure of the product and total or partial suspension of sales. Any of these regulatory actions could materially harm our operating results and financial condition.
Our manufacturing operations as well as our suppliers’ manufacturing operations are subject to establishment registration by the FDA and/or DEA. If we or our suppliers are do not maintain the current registrations, our operating results would be materially negatively impacted.
All of our facilities as well as applicable contract/supplier facilities, rely on maintaining current FDA registration and other licenses to produce and develop generic drugs. Specifically, our Cody Labs operations rely on a DEA license to directly import and convert raw concentrated poppy straw into several APIs or dosage forms. This license is granted for a one-year period and must be renewed successfully each year in order for us to maintain Cody Lab’s current operations and allow the Company to continue to work towards becoming a fully integrated organization. If the Company does not successfully renew its FDA registrations and/or DEA licenses, the financial results of Lannett would be negatively impacted.
If we are unable to successfully develop or commercialize new products, our operating results will suffer.
Our future results of operations will depend to a significant extent upon our ability to successfully commercialize new generic products in a timely manner. There are numerous difficulties in developing and commercializing new products, including:
·developing, testing and manufacturing products in compliance with regulatory standards in a timely manner;
·receiving requisite regulatory approvals for such products in a timely manner;
·the availability, on commercially reasonable terms, of raw materials, including APIs and other key ingredients;
·developing and commercializing a new product is time consuming, costly and subject to numerous factors that may delay or prevent the successful commercialization of new products; and
·commercializing generic products may be substantially delayed by unexpired patents covering the brand drug.
As a result of these and other difficulties, products currently in development by Lannett may or may not receive the regulatory approvals necessary for marketing. If any of our products, when developed and approved, cannot be successfully or timely commercialized, our operating results could be adversely affected. We cannot guarantee that any investment we make in developing products will be recouped, even if we are successful in commercializing those products.
The loss of key personnel could cause our business to suffer.
The success of our present and future operations will depend, to a significant extent, upon the experience, abilities and continued services of our key personnel. If we lose the services of our key personnel, or if they are unable to devote sufficient attention to our operations for any other reason, our business may be significantly impaired. If the employment of any of our current key personnel is terminated, we cannot assure you that we will be able to attract and replace the employee with the same caliber of key personnel. As such, we have entered into employment agreements with all of our senior executive officers in order to help retain these key individuals.
If brand pharmaceutical companies are successful in limiting the use of generics through their legislative and regulatory efforts, our sales of generic products may suffer.
Many brand pharmaceutical companies have increasingly used state and federal legislative and regulatory means to delay generic competition. These efforts have included:
·pursuing new patents for existing products which may be granted just before the expiration of one patent which could extend patent protection for additional years or otherwise delay the launch of generics;
·using the Citizen Petition process to request amendments to FDA standards;
·seeking changes to U.S. Pharmacopeia, an organization which publishes industry recognized compendia of drug standards;
·attaching patent extension amendments to non-related federal legislation;
·engaging in state-by-state initiatives to enact legislation that restricts the substitution of some generic drugs, which could have an impact on products that we are developing;
·persuading regulatory bodies to withdraw the approval of brand-name drugs for which the patents are about to expire and converting the market to another product of the brand company on which longer patent protection exists;
·entering into agreements whereby other generic companies will begin to market an AG, a generic equivalent of a branded product, at the same time or after generic competition initially enters the market;
·filing suits for patent infringement and other claims that may delay or prevent regulatory approval, manufacture and/or scale of generic products; and,
·introducing “next-generation” products prior to the expiration of market exclusivity for the reference product, which often materially reduces the demand for the generic or the reference product for which we seek regulatory approval.
In the U.S., some pharmaceutical companies have lobbied Congress for amendments to the Hatch-Waxman Act that would give them additional advantages over generic competitors. For example, although the term of a company’s drug patent can be extended to reflect a portion of the time an NDA is under regulatory review, some companies have proposed extending the patent term by a full year for each year spent in clinical trials rather than the one-half year that is currently permitted.
If proposals like these were to become effective, or if any other actions by our competitors and other third parties to prevent or delay activities necessary to the approval, manufacture, or distribution of our products are successful, our entry into the market and our ability to generate revenues associated with new products may be delayed, reduced, or eliminated, which could have a material adverse effect on our business, financial condition, results of operations, cash flows and/or share price.
The generic pharmaceutical industry is characterized by intellectual property litigation and third parties may claim that we infringe on their proprietary rights which could result in litigation that could be costly, result in the diversion of management’s time and efforts, require us to pay damages or prevent us from marketing our existing or future products.
Our commercial success will depend in part on not infringing or violating the intellectual property rights of others. The manufacture, use and sale of new products that are the subject of conflicting patent rights have been the subject of substantial litigation in the pharmaceutical industry. These lawsuits relate to the validity and infringement of patents or proprietary rights of third parties. We may have to defend against charges that we violated patents or proprietary rights of third parties. This is especially true in the case of generic products on which the patent covering the brand product is expiring, an area where infringement litigation is prevalent and in the case of new brand products in which a competitor has obtained patents for similar products. Our competitors, some of which have substantially greater resources than we do and have made substantial intellectual property investments in competing technologies, may have applied for or obtained, or may in the future apply for and obtain, patent rights and other intellectual property that will prevent, limit or otherwise interfere with our ability to make, use and sell our products. We may not be aware of whether our products do or will infringe existing or future patents or the intellectual property rights of others. In addition, patent applications can be pending for many years and may be confidential for a number of months after filing and because pending patent claims can be revised before issuance, there may be applications of others now pending of which we are unaware that may later result in issued patents that will prevent, limit or otherwise interfere with our ability to make, use or sell our products. Even if we prevail, litigation may be costly and time-consuming and could divert the attention of our management and technical personnel. Any potential intellectual property litigation also could force us to do one or more of the following:
·stop making, selling or using products or technologies that allegedly infringe the asserted intellectual property;
·lose the opportunity to license our technology to others or to collect royalty payments based upon successful protection and assertion of our intellectual property rights against others;
·incur significant legal expenses;
·pay substantial damages or royalties to the party whose intellectual property rights we may be found to be infringing;
·pay the attorney fees and costs of litigation to the party whose intellectual property rights we may be found to be infringing;
·redesign or rename, in the case of trademark claims, those products that contain the allegedly infringing intellectual property, which could be costly, disruptive and/or infeasible; or
·attempt to obtain a license to the relevant intellectual property from third parties, which may not be available on reasonable terms or at all.
Any litigation or claim against us, even those without merit, may cause us to incur substantial costs and could place a significant strain on our financial resources, divert the attention of management from our core business and harm our reputation. For a description of intellectual property-related litigation matters, see Note 11 “Legal, Regulatory Matters and Contingencies.” If we are found to infringe the intellectual property rights of third parties, we could be required to pay substantial damages and/or substantial royalties and could be prevented from selling our products unless we obtain a license or are able to redesign our products to avoid infringement. If we fail to obtain any required licenses or make any necessary changes to our products or technologies, we may have to withdraw existing products from the market or may be unable to commercialize one or more of our products, all of which could have a material adverse effect on our business, results of operations and financial condition.
Although the parties to patent and intellectual property disputes in the pharmaceutical industry have often settled their disputes through licensing or similar arrangements, the costs associated with these arrangements may be substantial and could include ongoing royalties. Any such license may not be available on reasonable terms, if at all and there can be no assurance that we would be able to redesign our products in a way that would not infringe the intellectual property rights of others. Even if we were able to obtain rights to the third-party’s intellectual property, these rights may be non-exclusive, thereby giving our competitors access to the same intellectual property. As a result, an adverse determination in a judicial or administrative proceeding or failure to obtain necessary licenses could prevent us from manufacturing and selling a number of our products, or force us to redesign or rename our products to avoid infringing the intellectual property rights of third parties, which, even if it is possible to so redesign or rename our products, which could harm our business, financial condition, results of operations and cash flows.
If we are unable to obtain sufficient supplies from key suppliers that in some cases may be the only source of finished products or raw materials, our ability to deliver our products to the market may be impeded.
We are required to identify the supplier(s) of all the raw materials for our products in our applications with the FDA. To the extent practicable, we attempt to identify more than one supplier in each drug application. However, some products and raw materials are available only from a single source and, in some of our drug applications, only one supplier of products and raw materials has been identified, even in instances where multiple sources exist. To the extent any difficulties experienced by our suppliers cannot be resolved within a reasonable time and at reasonable cost, or if raw materials for a particular product become unavailable from an approved supplier and we are required to qualify a new supplier with the FDA, our profit margins and market share for the affected product could decrease and our development and sales and marketing efforts could be delayed.
Our policies regarding returns, allowances and chargebacks and marketing programs adopted by wholesalers may reduce our revenues in future fiscal periods.
Based on industry practice, generic drug manufacturers have liberal return policies and have been willing to give customers post-sale inventory allowances. Under these arrangements, from time to time we give our customers credits on our generic products that our customers hold in inventory after we have decreased the market prices of the same generic products due to competitive pricing. Therefore, if new competitors enter the marketplace and significantly lower the prices of any of their competing products, we would likely reduce the price of our products. As a result, we would likely be obligated to provide credits to our customers who are then holding inventories of such products, which could reduce sales revenue and gross margin for the period the credit is provided. Like our competitors, we also give credits for chargebacks to wholesalers that have contracts with us for their sales to hospitals, group purchasing organizations, pharmacies or other customers.
A chargeback is the difference between the price the wholesaler pays and the price that the wholesaler’s end-customer pays for a product. Although we establish reserves based on our prior experience and our best estimates of the impact that these policies may have in subsequent periods, we cannot ensure that our reserves are adequate or that actual product returns, allowances and chargebacks will not exceed our estimates.
Health care initiatives and other third-party payor cost-containment pressures have and could continue to cause us to sell our products at lower prices, resulting in decreased revenues.
Some of our products are purchased or reimbursed by state and federal government authorities, private health insurers and other organizations, such as health maintenance organizations, or HMOs and managed care organizations, or MCOs. Third-party payors increasingly challenge pharmaceutical product pricing. There also continues to be a trend toward managed health care in the United States. Pricing pressures by third-party payors and the growth of organizations such as HMOs and MCOs could result in lower prices and a reduction in demand for our products.
In addition, legislative and regulatory proposals and enactments to reform health care and government insurance programs could significantly influence the manner in which pharmaceutical products and medical devices are prescribed and purchased. We expect there will continue to be federal and state laws and/or regulations, proposed and implemented, that could limit the amounts that federal and state governments will pay for health care products and services. The extent to which future legislation or regulations, if any, relating to the health care industry or third-party coverage and reimbursement may be enacted or what effect such legislation or regulation would have on our business remains uncertain. For example, the American Recovery and Reinstatement Act of 2009, also known as the Stimulus Package, includes $1.1 billion in funding to study the comparative effectiveness of health care treatments and strategies. The Stimulus Package funding is expected to be used for, among other things, to conduct, support or synthesize research that compares and evaluates the risk and benefits, clinical outcomes, effectiveness and appropriateness of products. Although Congress has indicated that this funding is intended for improvement in quality of health care, it remains unclear how the research will impact coverage, reimbursement or other third-party payor policies. Such measures or other health care system reforms that are adopted could have a material adverse effect on our industry generally and our ability to successfully commercialize our products or could limit or eliminate our spending on development projects and affect our ultimate profitability.
We may need to change our business practices to comply with changes to fraud and abuse laws.
We are subject to various federal and state laws pertaining to health care fraud and abuse, including the Medicare and Medicaid Anti-Kickback Statute (the “Anti-Kickback Statute”), which apply to our sales and marketing practices and our relationships with physicians and other referral sources. At the federal level, the Anti-Kickback Statute prohibits any person or entity from knowingly and willfully soliciting, receiving, offering, or paying any remuneration, including a bribe, kickback, or rebate, directly or indirectly, in return for or to induce the referral of patients for items or services covered by federal health care programs, or the furnishing, recommending, or arranging for products or services covered by federal health care programs. Federal health care programs have been defined to include plans and programs that provide health benefits funded by the federal government, including Medicare and Medicaid, among others. The definition of “remuneration” has been broadly interpreted to include anything of value, including, for example, gifts, discounts, the furnishing of supplies or equipment, credit arrangements, payments of cash and waivers of payments. Several courts have interpreted the federal Anti-Kickback Statute’s intent requirement to mean that if even one purpose in an arrangement involving remuneration is to induce referrals or otherwise generate business involving goods or services reimbursed in whole or in part under federal health care programs, the statute has been violated. The federal government has issued regulations, commonly known as safe harbors that set forth certain provisions which, if fully met, will assure parties that they will not be prosecuted under the federal Anti-Kickback Statute. The failure of a transaction or arrangement to fit within a specific safe harbor does not necessarily mean that the transaction or arrangement will be illegal or that prosecution under the federal Anti-Kickback Statute will be pursued, but such transactions or arrangements face an increased risk of scrutiny by government enforcement authorities and an ongoing risk of prosecution. If our sales and marketing practices or our relationships with physicians are considered by federal or state enforcement authorities to be knowingly and willfully soliciting, receiving, offering, or providing any remuneration in exchange for arranging for or recommending our products and services and such activities do not fit within a safe harbor, then these arrangements could be challenged under the federal Anti-Kickback Statute.
If our operations are found to be in violation of the federal Anti-Kickback Statute we may be subject to civil and criminal penalties including fines of up to $25 thousand per violation, civil monetary penalties of up to $50 thousand per violation, assessments of up to three times the amount of the prohibited remuneration, imprisonment and exclusion from participating in the federal health care programs. Violations of the Anti-Kickback Statute also may result in a finding of civil liability under the FFCA (as further discussed below) and the potential imposition of additional civil fines and monetary penalties that could be substantial. In addition, HIPAA and its implementing regulations created two new federal crimes: health care fraud and false statements relating to health care matters. The HIPAA health care fraud statute prohibits, among other things, knowingly and willfully executing, or attempting to execute, a scheme to defraud any health care benefit program, including private payors. A violation of this statue is a felony and may result in fines, imprisonment and/or exclusion from government-sponsored programs. The HIPAA false statements statute prohibits, among other things, knowingly and willfully falsifying, concealing or covering up a material fact or making any materially false, fictitious or fraudulent statement or representation in connection with the delivery of or payment for health care benefits, items, or services.
A number of states also have anti-fraud and anti-kickback laws similar to the federal Anti-Kickback Statute that prohibit certain direct or indirect payments if such arrangements are designed to induce or encourage the referral of patients or the furnishing of goods or services. Some states’ anti-fraud and anti-kickback laws apply only to goods and services covered by Medicaid. Other states’ anti-fraud and anti-kickback laws apply to all health care goods and services, regardless of whether the source of payment is governmental or private. Due to the breadth of these laws and the potential for changes in laws, regulations, or administrative or judicial interpretations, we may have to change our business practices or our existing business practices could be challenged as unlawful, which could materially adversely affect our business.
Certain federal and state governmental agencies, including the U.S. Department of Justice and the U.S. Department of Health and Human Services, have been investigating issues surrounding pricing information reported by drug manufacturers and used in the calculation of reimbursements as well as sales and marketing practices. For example, many government and third-party payors, including Medicare and Medicaid, reimburse doctors and others for the purchase of certain pharmaceutical products based on the product’s AWP reported by pharmaceutical companies, although the Company has not used the term AWP since 2000. The federal government, certain state agencies and private payors are investigating and have begun to file court actions related to pharmaceutical companies’ reporting practices with respect to AWP, alleging that the practice of reporting prices for pharmaceutical products has resulted in a false and overstated AWP, which in turn is alleged to have improperly inflated the reimbursement paid by Medicare beneficiaries, insurers, state Medicaid programs, medical plans and others to health care providers who prescribed and administered those products. In addition, some of these same payors are also alleging that companies are not reporting their “best price” to the states under the Medicaid program.
Furthermore, under the FDCA, it is illegal for pharmaceutical companies to promote their products for uses that are not approved by the FDA, and companies that market drugs for so-called “off-label” indications may be subject to civil liability under the FFCA (as further discussed below), as well as to criminal penalties. Over the past decade, numerous lawsuits have been filed against pharmaceutical companies challenging their off-label promotional activities, and pharmaceutical companies, in the aggregate, have paid billions of dollars to defend and settle these cases.
We may become subject to federal and state false claims litigation brought by private individuals and the government.
We are subject to state and federal laws that govern the submission of claims for reimbursement. The FFCA imposes civil liability on individuals or entities that knowingly submit, or cause to be submitted, false or fraudulent claims for payment to the government. Violations of the FFCA and other similar laws may result in criminal fines, imprisonment and substantial civil penalties for each false claim submitted (including civil penalties presently in excess of $21,000 per claim, plus treble damages, plus liability for attorney’s fees) and exclusion from federally funded health care programs, including Medicare and Medicaid. The FFCA also allows private individuals to bring a suit on behalf of the government against an individual or entity for violations of the FFCA. These suits, also known as Qui Tam or whistleblower actions, may be brought by, with only a few exceptions, any private citizen who has material information of a false claim that has not yet been previously disclosed. These suits have increased significantly in recent years because the FFCA allows an individual to share in the amounts paid to the federal government in fines or settlement as a result of a successful Qui Tam action, in addition to the recovery of legal fees in bringing such an action. If our past or present operations are found to be in violation of any of such laws or any other governmental regulations that may apply to us, we may be subject to penalties, including civil and criminal penalties, damages, fines, exclusion from federal health care programs and/or the curtailment or restructuring of our operations. Any penalties, damages, fines, curtailment, or restructuring of our operations could adversely affect our ability to operate our business and our financial results, action against us for violation of these laws, even if we successfully defend against them, could cause us to incur significant legal expenses and divert our management’s attention from the operation of our business.
Sales of our products may continue to be adversely affected by the continuing consolidation of our distribution network and the concentration of our customer base.
Our principal customers are wholesale drug distributors, major retail drug store chains and mail-order pharmacies. These customers comprise a significant part of the distribution network for pharmaceutical products in the U.S. This distribution network is continuing to undergo significant consolidation marked by mergers and acquisitions among wholesale distributors and the growth of large retail drug store chains. As a result, a small number of large wholesale distributors control a significant share of the market and the number of independent drug stores and small drug store chains has decreased. We expect that consolidation of drug wholesalers and retailers will increase pricing and other competitive pressures on drug manufacturers, including Lannett.
Our three largest customers accounted for 29%, 17% and 6%, respectively, of our total net sales for Fiscal 2018 and 28%, 21% and 6%, respectively, of our total net sales for Fiscal 2017. The loss of any of these customers could materially adversely affect our business, results of operations and financial condition and our cash flows. In addition, the Company generally does not enter into long-term supply agreements with its customers that would require them to purchase our products.
A relatively small group of products may represent a significant portion of our revenues, gross profit, or net earnings from time to time.
Sales of a limited number of our products from time to time represent a significant portion of our revenues, gross profit and net earnings. For the fiscal years ended June 30, 2018, 2017 and 2016, our top five products in terms of sales, in the aggregate, represented approximately 58%, 53% and 57%, respectively, of our total net sales. If the volume or pricing of our largest selling products decline in the future, our business, financial condition, results of operations, cash flows and/or share price could be materially adversely affected. See Item 1. Description of Business for more information on our top products. On August 20, 2018, the Company announced that the JSP Distribution Agreement which expires on March 23, 2019 will not be renewed. Accordingly, future top product concentration rates will decline. Net sales of JSP products, primarily Levothyroxine Sodium Tablets USP, which is one of our top five products, totaled $253.1 million, $187.0 million and $190.4 million in fiscal year 2018, 2017 and 2016, respectively or 37%, 30% and 35%, respectively, of our net sales.
We are increasingly dependent on information technology and our systems and infrastructure face certain risks, including cybersecurity and data leakage risks.
Significant disruptions to our information technology systems or breaches of information security could adversely affect our business. We are increasingly dependent on information technology systems and infrastructure to operate our business. In the ordinary course of business, we collect, store and transmit large amounts of confidential information (including trade secrets or other intellectual property, proprietary business information and personal information) and it is critical that we do so in a secure manner to maintain the confidentiality and integrity of such confidential information. We could be susceptible to third-party attacks on our information technology systems, which attacks are of ever increasing levels of sophistication and are made by groups and individuals with a wide range of motives and expertise, including state and quasi-state actors, criminal groups, “hackers” and others. Maintaining the security, confidentiality and integrity of this confidential information (including trade secrets or other intellectual property, proprietary, business information and personal information) is important to our competitive business position. There can be no assurance that we can prevent service interruptions or security breaches in our systems or the unauthorized or inadvertent wrongful use or disclosure of confidential information that could adversely affect our business operations or result in the loss, misappropriation and/or unauthorized access, use or disclosure of, or the prevention of access to, confidential information. A breach of our security measures or the accidental loss, inadvertent disclosure, unapproved dissemination, misappropriation or misuse of trade secrets, proprietary information, or other confidential information, whether as a result of theft, hacking, fraud, trickery or other forms of deception, or for any other cause, could enable others to produce competing products, use our proprietary technology or information and/or adversely affect our business position. Further, any such interruption, security breach, or loss, misappropriation and/or unauthorized access, use or disclosure of confidential information could result in financial, legal, business and reputational harm to us and could have a material adverse effect on our business, financial condition and results of operations.
The design, development, manufacture and sale of our products involves the risk of product liability claims by consumers and other third parties and insurance against such potential claims is expensive and may be difficult to obtain.
The design, development, manufacture and sale of our products involve an inherent risk of product liability claims and the associated adverse publicity. Insurance coverage is expensive and may be difficult to obtain and may not be available in the future on acceptable terms, or at all. Although we currently maintain product liability insurance for our products in amounts we believe to be commercially reasonable, if the coverage limits of these insurance policies are not adequate, a claim brought against Lannett, whether covered by insurance or not, could have a material adverse effect on our business, results of operations, financial condition and cash flows.
Rising insurance costs, as well as the inability to obtain certain insurance coverage for risks faced by us, could negatively impact profitability.
The cost of insurance, including workers compensation, product liability and general liability insurance, has risen in recent years and may increase in the future. In response, we may increase deductibles and/or decrease certain coverage to mitigate these costs. These increases and our increased risk due to increased deductibles and reduced coverage, could have a negative impact on our results of operations, financial condition and cash flows.
Additionally, certain insurance coverage may not be available to us for risks faced by us. Sometimes the coverage we obtain for certain risks may not be adequate to fully reimburse the amount of damage that we could possibly sustain. Should either of these events occur, the lack of insurance to cover our entire cost would adversely affect our results of operations and financial condition.
Federal regulation of arrangements between manufacturers of brand and generic products could adversely affect our business.
As part of the Medicare Prescription Drug, Improvement and Modernization Act of 2003, companies are now required to file with the Federal Trade Commission (“FTC”) and the Department of Justice certain types of agreements entered into between brand and generic pharmaceutical companies related to the manufacture, marketing and sale of generic versions of brand drugs. This new requirement could affect the manner in which generic drug manufacturers resolve intellectual property litigation and other disputes with brand pharmaceutical companies and could result generally in an increase in private-party litigation against pharmaceutical companies or additional investigations or proceedings by the FTC or other governmental authorities. The impact of this new requirement and the potential private-party lawsuits associated with arrangements between brand-name and generic drug manufacturers is uncertain and could adversely affect our business.
We expend a significant amount of resources on research and development efforts that may not lead to successful product introductions.
We conduct R&D primarily to enable us to gain approval for, manufacture, and market pharmaceuticals in accordance with applicable laws and regulations. We also partner with third parties to develop products. We cannot be certain that any investment made in developing products will be recovered, even if we are successful in commercialization. To the extent that we expend significant resources on R&D efforts and are not able, ultimately, to introduce successful new and/or complex products as a result of those efforts, there could be a material adverse effect on our business, financial condition, results of operations, cash flows, and/or the price of our common stock.
Investigations of the calculation of average wholesale prices may adversely affect our business.
Many government and third-party payers, including Medicare, Medicaid, Health Maintenance Organization and Managed Care Organization, have historically reimbursed doctors, pharmacies and others for the purchase of certain prescription drugs based on a drug’s AWP or wholesale acquisition cost (“WAC”). In the past several years, state and federal government agencies have conducted ongoing investigations of manufacturers’ reporting practices with respect to AWP and WAC, in which they have suggested that reporting of inflated AWP’s or WAC’s has led to excessive payments for prescription drugs. For a description of current and federal and state investigations and claims by private parties, see Note 11 “Legal, Regulatory Matters and Contingencies.” Additional actions are possible. These actions, if successful, could adversely affect us and may have a material adverse effect on our business, results of operations, financial condition and cash flows.
The market price of our common stock has been volatile and may continue to be volatile in the future, and the value of any investment in our common stock could decline significantly.
The market price for our shares of common stock listed on the NYSE has fluctuated significantly from time to time, for example, varying between an intra-day high of $30.35 to an intra-day low of $12.70 during Fiscal 2018. As described above, on August 20, 2018, the Company announced that the JSP Distribution Agreement which expires on March 23, 2019 will not be renewed. As a result, our closing stock price significantly declined to $5.35 on August 20, 2018. The market price of our common stock is likely to continue to be volatile and subject to significant price and volume fluctuations in response to market, industry and other factors, including the risks described in this section. Further, the stock market for pharmaceutical companies has recently experienced extreme price and volume fluctuations that have often been unrelated or disproportionate to the operating performance of those companies. In particular, recent negative publicity regarding pricing and price increases by pharmaceutical companies has negatively impacted, and may continue to negatively impact, the market for pharmaceutical companies. These broad market and industry factors have negatively impacted, and in the future may seriously negatively impact, the market price of our common stock, regardless of our operating performance. Our stock market price may also be dependent upon the valuations and recommendations of the analysts who cover our business. If our results do not meet these analysts’ forecasts, the expectations of our investors or the financial guidance we provide to investors in any period, the market price of our common stock could decline. In the past, following periods of volatility in the market or significant price decline, securities class-action litigation has often been instituted against companies and we have been subject to one such suit, as further described in Note 11 “Legal, Regulatory Matters and Contingencies”. Such suits could result in substantial costs and diversion of management’s attention and resources, which could materially and adversely affect our business, results of operations and financial condition.
The recent enactment of State laws affecting the pricing of our products could have the effect of reducing our profitability.
Between 2016 and 2018, several state legislatures have enacted laws regulating the pricing of various types of pharmaceutical products, including generic pharmaceutical products. These laws vary in applicability and scope, and generally require manufacturers to notify various state agencies of price increases over a given threshold for a given period of time and to include a justification for any price increases. At least one state law (subsequently struck by the court) authorized the state attorney general to seek civil penalties and disgorgement in the event a price increase is deemed unconscionable. To the extent these laws apply to our products, they could limit the prices which the company may to be to charge for its products and reduce the company’s profitability and could have a material adverse effect on our financial condition, results of operations and growth prospects.
Other manufacturers and distributors of pain management products have had complaints filed against and investigations commenced them, and if similar actions are taken against us it could reduce our revenue and future profitability.
During the past few years, a number of complaints have been filed with respect to sales and distribution of various types of pain management medications against various pharmaceutical companies (not including Lannett), by a number of cities, counties and states across the country alleging among other things that such companies failed to develop and implement systems sufficient to identify suspicious orders of such products and prevent the diversion of such products to individuals who used them for other than legitimate medical purposes. The complaints generally contend that the defendants allegedly engaged in improper marketing of pain management products, and seek a variety of remedies, including restitution, civil penalties, disgorgement of profits, treble damages, attorneys’ fees and injunctive relief. In addition, a number of State Attorneys General, including a coordinated multistate effort, have initiated investigations into sales and marketing practices of various pharmaceutical companies (not including Lannett) with respect to such pain management products. If any similar investigations or claims are commenced against us, it could result in reputational harm and reduced market acceptance and demand for our products, could harm our ability to market our products in the future, could cause us to incur significant expense, could cause our senior management to be distracted from execution of our business strategy, and could have a material adverse effect on our business, financial condition, results of operations and growth prospects.
Guidelines and recommendations published by various organizations can reduce the use of our pain management products.
Government agencies promulgate regulations and guidelines directly applicable to us and to our products. In addition, professional societies, practice management groups, private health and science foundations and organizations from time to time may also publish guidelines or recommendations to the healthcare and patient communities. Recommendations of government agencies or these other groups or organizations may relate to such matters as usage, dosage, route of administration and use of concomitant therapies. For example, the Centers for Disease Control and Prevention has issued guidelines about the use of pain management products for chronic pain, the FDA has issued an Opioid Action Plan and in 2017 President Trump signed an executive order establishing the President’s Commission on Combatting Drug Addiction. Additionally, the FDA has required all opioid products, including immediate release drugs, to join a shared REMS program that educates healthcare providers to reduce serious adverse outcomes resulting from inappropriate prescribing, misuse, and abuse of opioid analgesics while maintaining patient access to pain medications. REMS participation has added significant costs to the company. Recommendations or guidelines suggesting the reduced use of our products or the use of competitive or alternative products as the standard of care to be followed by patients and healthcare providers could result in decreased use of our products and could have a material adverse effect on our business, financial condition, results of operations and growth prospects.
Risks Related to our Acquisition (the “Acquisition”) of Kremers Urban Pharmaceuticals, Inc.
We have not yet realized all the anticipated synergies, cost savings and growth opportunities from the Acquisition.
The benefits that we expect to achieve as a result of the Acquisition will depend, in part, on the ability of the combined company to realize anticipated growth opportunities and cost synergies. Our success in realizing these growth opportunities and cost synergies and the timing of this realization, depends on the successful integration of the historical Lannett business and operations and the historical KUPI business and operations. Even if we are able to integrate the Lannett and KUPI businesses and operations successfully, this integration may not result in the realization of the full benefits of the growth opportunities and cost synergies that we currently expect from this integration within the anticipated time frame or at all. Moreover, we may incur substantial expenses in connection with this integration. While we anticipate that certain expenses will be incurred, such expenses are difficult to estimate accurately and may exceed current estimates. Accordingly, the benefits from the Acquisition may be offset by costs or delays incurred in integrating the businesses.
The Company is in the process of seeking restoration by the FDA of an AB rating for its methylphenidate hydrochloride extended release product. Such restoration could take significant time, if it occurs at all, and failure to timely reestablish an AB rating may adversely affect our financial results.
During a teleconference in November 2014, the FDA informed KUPI that it had concerns about whether generic versions of Concerta (methylphenidate hydrochloride extended release tablets), including KUPI’s Methylphenidate ER product, are therapeutically equivalent to Concerta. The FDA indicated that its concerns were based in part on adverse event reports concerning lack of effect and its analyses of pharmacokinetic data. The FDA informed KUPI that it was changing the therapeutic equivalence rating of its product from “AB” (therapeutically equivalent) to “BX.” A BX-rated drug is a product for which data are insufficient to determine therapeutic equivalence; it is still approved and can be prescribed, but the FDA does not recommend it as automatically substitutable for the brand-name drug at the pharmacy.
During the November 2014 teleconference, the FDA also asked KUPI to either voluntarily withdraw its product or to conduct new bioequivalence (“BE”) testing in accordance with the recommendations for demonstrating bioequivalence to Concerta proposed in a new draft BE guidance that the FDA issued earlier that November. The FDA had approved the KUPI product (and originally granted it an AB rating) in 2013, on the basis of KUPI data showing its product met BE criteria set forth in draft BE guidance that the FDA had issued in 2012. The FDA’s position concerning the KUPI product was the subject of a public announcement by the agency. The Company agreed to conduct new BE studies per the new draft BE guidance. KUPI submitted the data from those studies to the FDA in June 2015 and met with the FDA to discuss the results in July 2015.
On October 18, 2016, the Company received notice from the FDA that it will seek to withdraw approval of the Company’s ANDA for Methylphenidate ER. The FDA’s notice includes an opportunity for the Company to request a hearing on this matter. Following the Company’s request under the FOIA for documents to support its request for a hearing, the FDA granted an extension to submit all data, information and analyses upon which the request for a hearing relies.
In response to the Company’s FOIA requests, the FDA provided four sets of documents between April 4, 2017 and October 25, 2017 and, on December 4, 2017, the Company submitted extensive information, data, analyses, and expert reports to the FDA that demonstrate the existence of genuine and substantial issues of fact that necessitate a hearing to prove the therapeutic equivalence of its product. On December 8, 2017, the documents were posted on the public docket. The FDA has not yet made a decision as to whether to grant a hearing to the Company.
The Company intends to continue working with the FDA to regain the “AB” rating, and in the meantime, maintain the drug on the U.S. market with a BX rating. However, there can be no assurance as to when or if the Company will regain the “AB” rating or be permitted to remain on the market. If the Company were to receive the “AB” rating, net sales of the product could increase subject to market factors existing at that time. The Company also agreed to potential acquisition-related contingent payments to UCB related to Methylphenidate ER if the FDA reinstates the AB-rating and certain sales thresholds are met. Such potential contingent payments are set to expire after December 31, 2020.
KUPI has received notification regarding state inquiries into its pricing practices.
In August 2015, KUPI received a letter from the Texas Office of the Attorney General alleging that KUPI had inaccurately reported certain price information in violation of the Texas Medicaid Fraud Prevention Act. The Company is currently cooperating with the Texas Attorney General’s Office, however, the outcome of the investigation could result in serious fines being levied on us, along with harm to our reputation. Any negative outcome from this or any other investigation related to our pricing could have a material adverse effect on our business, financial condition and results of operations.
ITEM 2. DESCRIPTION OF PROPERTY
Lannett owns several facilities in Philadelphia, Pennsylvania. Certain administrative functions, manufacturing and research and development facilities are located in a 31,000 square foot facility at 9000 State Road, Philadelphia, PA. A second, 63,000 square foot facility is located within one mile of the State Road facility at 9001 Torresdale Avenue, Philadelphia, PA and contains our analytical research and development and quality control laboratories. The facility has capacity for additional manufacturing, packaging or laboratory space, if needed. We also own a building at 13200 Townsend Road in Philadelphia, PA consisting of 66,000 square feet on 7.3 acres of land which is currently used for warehouse space and shipping. In June 2018, the Company initiated a process to begin consolidating all shipping and receiving activities to its Seymour, Indiana facility. The consolidation of shipping and receiving will allow us to vacate the 13200 Townsend Road facility in the future.
As of June 30, 2018, Lannett also owned two separate properties at 11501 Roosevelt Boulevard and 11601 Roosevelt Boulevard, which were purchased in December 2013 for $4.0 million and $5.0 million respectively. On July 13, 2018, the Company completed the sale of both properties for total consideration of $14.6 million before fees and selling costs.
The manufacturing facility of our wholly-owned subsidiary, Cody Labs, consists of a 73,000 square foot structure located on approximately 15.0 acres in Cody, Wyoming. The Cody Labs’ manufacturing facility specializes in API and controlled substance production and currently has capacity for further expansion, both inside and outside the existing structure. In June 2018, the Company announced the Cody Restructuring Plan, as further described in Note 3. “Restructuring Charges”.
In connection with the acquisition of Silarx, the Company acquired an 110,000 square foot manufacturing facility located in Carmel, New York, which sits on 25.8 acres of land. The facility specializes in liquid products and currently houses manufacturing, packaging, quality and research and development and has capacity for additional manufacturing space, if needed.
KUPI’s 432,000 square foot Seymour, Indiana facility contains approximately 107,000 square feet of manufacturing space as well as a leased 116,000 square foot temperature/humidity-controlled storage warehouse. The Seymour facility has had satisfactory inspections conducted by the FDA and EMA and similar regulatory authorities of Japan, Taiwan, Brazil, China, Korea and Turkey. Since 2008, KUPI has made significant improvements to its facility and equipment. These improvements enabled the facility to increase production from approximately 1.2 billion doses in 2008 to over 2.7 billion doses in 2014. Prior to the acquisition, KUPI also completed a 20,000 square foot expansion of the facility which increased capacity to 3.9 billion doses.
Information pertaining to legal proceedings can be found in Note 11 “Legal, Regulatory Matters and Contingencies” under Item 15. Exhibits and Financial Statement Schedule and is incorporated by reference herein.
ITEM 4. MINE SAFETY DISCLOSURES
Not applicable
ITEM 5. MARKET FOR COMMON EQUITY AND RELATED STOCKHOLDER MATTERS
Market Information
The Company’s common stock trades on the NYSE. The following table sets forth certain information with respect to the intraday high and intraday low sales prices per share of the Company’s common stock during Fiscal 2018 and 2017, as quoted by the NYSE.
Fiscal Year Ended June 30, 2018
|
|
|
High |
|
Low |
| ||
|
|
|
|
|
|
| ||
|
First quarter |
|
$ |
23.75 |
|
$ |
14.90 |
|
|
|
|
|
|
|
| ||
|
Second quarter |
|
$ |
30.35 |
|
$ |
18.40 |
|
|
|
|
|
|
|
| ||
|
Third quarter |
|
$ |
25.40 |
|
$ |
14.40 |
|
|
|
|
|
|
|
| ||
|
Fourth quarter |
|
$ |
17.58 |
|
$ |
12.70 |
|
Fiscal Year Ended June 30, 2017
|
|
|
High |
|
Low |
| ||
|
|
|
|
|
|
| ||
|
First quarter |
|
$ |
39.99 |
|
$ |
23.78 |
|
|
|
|
|
|
|
| ||
|
Second quarter |
|
$ |
28.21 |
|
$ |
16.75 |
|
|
|
|
|
|
|
| ||
|
Third quarter |
|
$ |
23.95 |
|
$ |
18.25 |
|
|
|
|
|
|
|
| ||
|
Fourth quarter |
|
$ |
27.90 |
|
$ |
17.80 |
|
Holders
As of June 30, 2018, there were 1,030 holders of record of the Company’s common stock.
Dividends
The Company did not pay cash dividends in Fiscal 2018 or Fiscal 2017. The Company intends to use available funds for working capital, to pay down outstanding debt, plant and equipment additions, various product extension ventures and merger and acquisition or other growth opportunities. In addition, the Company is subject to certain restrictions on dividends under its Amended Senior Secured Credit Facility. The Company does not expect to pay, nor should stockholders expect to receive, cash dividends in the foreseeable future.
The following table sets forth certain information with respect to the Company’s share repurchase activity.
ISSUER PURCHASES OF EQUITY SECURITIES
|
Period |
|
(a) Total |
|
(b) Average |
|
(c) Total |
|
(d) Maximum |
| ||
|
|
|
|
|
|
|
|
|
|
| ||
|
April 1 to April 30, 2018 |
|
162 |
|
$ |
15.80 |
|
— |
|
$ |
— |
|
|
May 1 to May 31, 2018 |
|
619 |
|
15.94 |
|
— |
|
— |
| ||
|
June 1 to June 30, 2018 |
|
4,505 |
|
13.59 |
|
— |
|
— |
| ||
|
Total |
|
5,286 |
|
13.93 |
|
— |
|
— |
| ||
*Shares were repurchased to settle employee tax withholding obligations pursuant to equity award programs.
Stock Performance Chart
The following graph presents a comparison of the cumulative total stockholder return on the Company’s stock with the cumulative total return of various indexes for the period of five fiscal years commencing July 1, 2013 and ending June 30, 2018. The graph assumes that $100 was invested on July 1, 2013 in each of the various indexes.
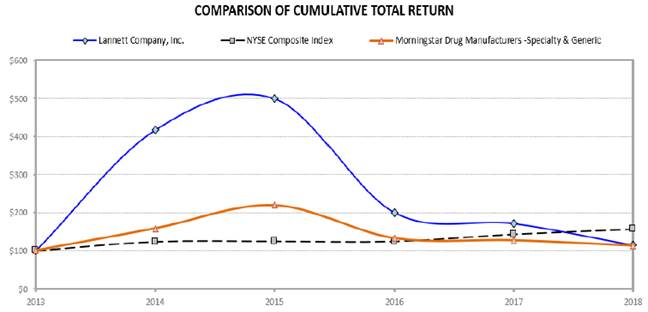
ITEM 6. SELECTED FINANCIAL DATA
The following financial information as of and for the five years ended June 30, 2018, has been derived from our consolidated financial statements. This information should be read in conjunction with our consolidated financial statements and related notes thereto included elsewhere herein.
Lannett Company, Inc. and Subsidiaries
Financial Highlights
|
(In thousands, except per share data) |
|
2018 |
|
2017 |
|
2016 |
|
2015 |
|
2014 |
| |||||
|
Operating Highlights |
|
|
|
|
|
|
|
|
|
|
| |||||
|
|
|
|
|
|
|
|
|
|
|
|
| |||||
|
Net sales |
|
$ |
684,563 |
|
$ |
637,341 |
|
$ |
566,091 |
|
$ |
406,837 |
|
$ |
273,771 |
|
|
Settlement agreement |
|
$ |
— |
|
$ |
(4,000 |
) |
$ |
(23,598 |
) |
$ |
— |
|
$ |
— |
|
|
Total net sales |
|
$ |
684,563 |
|
$ |
633,341 |
|
$ |
542,493 |
|
$ |
406,837 |
|
$ |
273,771 |
|
|
Gross profit |
|
$ |
288,706 |
|
$ |
301,213 |
|
$ |
286,493 |
|
$ |
306,356 |
|
$ |
154,408 |
|
|
Operating income |
|
$ |
129,696 |
|
$ |
86,446 |
|
$ |
130,758 |
|
$ |
226,487 |
|
$ |
88,089 |
|
|
Net income (loss) attributable to Lannett Company, Inc. |
|
$ |
28,690 |
|
$ |
(581 |
) |
$ |
44,782 |
|
$ |
149,919 |
|
$ |
57,101 |
|
|
Basic earnings (loss) per common share attributable to Lannett Company, Inc. |
|
$ |
0.77 |
|
$ |
(0.02 |
) |
$ |
1.23 |
|
$ |
4.18 |
|
$ |
1.70 |
|
|
Diluted earnings (loss) per common share attributable to Lannett Company, Inc. |
|
$ |
0.75 |
|
$ |
(0.02 |
) |
$ |
1.20 |
|
$ |
4.04 |
|
$ |
1.62 |
|
|
|
|
|
|
|
|
|
|
|
|
|
| |||||
|
Balance Sheet Highlights |
|
|
|
|
|
|
|
|
|
|
| |||||
|
|
|
|
|
|
|
|
|
|
|
|
| |||||
|
Total Assets |
|
$ |
1,575,304 |
|
$ |
1,603,312 |
|
$ |
1,764,018 |
|
$ |
508,766 |
|
$ |
342,773 |
|
|
Total Debt, net |
|
$ |
839,270 |
|
$ |
903,647 |
|
$ |
1,061,848 |
|
$ |
1,009 |
|
$ |
1,138 |
|
|
Long-Term Debt, net |
|
$ |
772,425 |
|
$ |
843,530 |
|
$ |
883,612 |
|
$ |
874 |
|
$ |
1,009 |
|
|
Total Stockholders’ Equity |
|
$ |
598,915 |
|
$ |
561,122 |
|
$ |
554,457 |
|
$ |
463,766 |
|
$ |
294,765 |
|
On November 25, 2015, the Company completed the acquisition of KUPI. The Company’s Consolidated Statements of Operations for Fiscal 2016, 2017 and 2018 includes the impact of KUPI from that date.
ITEM 7. MANAGEMENT’S DISCUSSION AND ANALYSIS OF FINANCIAL CONDITION AND RESULTS OF OPERATIONS
The following discussion and analysis describes significant changes in the financial condition and results of operations, as well as liquidity and capital resources of the Company. Additionally, it addresses accounting policies that management has deemed are “critical accounting policies.” This discussion and analysis is intended as a supplement to and should be read in conjunction with the Consolidated Financial Statements, the Notes to the Consolidated Financial Statements and other sections of this Form 10-K.
The following discussion contains forward-looking statements. You should refer to the “Cautionary Statement Regarding Forward-Looking Statements” set forth in Part I of this Annual Report.
All references to “Fiscal 2019” or “Fiscal Year 2019” shall mean the fiscal year ended June 30, 2019 and all references to “Fiscal 2018” or “Fiscal Year 2018” shall mean the fiscal year ended June 30, 2018 and all references to “Fiscal 2017” or “Fiscal Year 2017” shall mean the fiscal year ended June 30, 2017.
Company Overview
Lannett Company, Inc. (a Delaware corporation) and its subsidiaries (collectively, the “Company”, “Lannett”, “we” or “us”) primarily develop, manufacture, package, market and distribute solid oral and extended release (tablets and capsules), topical, liquids, nasal and oral solution finished dosage forms of drugs, generic forms of both small molecule and biologic medications, that address a wide range of therapeutic areas. Certain of these products are manufactured by others and distributed by the Company. The Company also manufactures active pharmaceutical ingredients through its Cody Labs subsidiary, providing a vertical integration benefit. Additionally, the Company is pursuing partnerships, research contracts and internal expansion for the development and production of other dosage forms including: ophthalmic, nasal, patch, foam, buccal, sublingual, suspensions, soft gel, injectable and oral dosages.
On November 25, 2015, the Company completed the acquisition of Kremers Urban Pharmaceutical, Inc. (“KUPI”), the former subsidiary of global biopharmaceuticals company UCB S.A. KUPI is a specialty pharmaceuticals manufacturer focused on the development of products that are difficult to formulate or utilize specialized delivery technologies. Strategic benefits of the acquisition include expanded manufacturing capacity, a diversified product portfolio and pipeline and complementary research and development expertise.
The Company operates pharmaceutical manufacturing plants in Philadelphia, Pennsylvania; Cody, Wyoming; Carmel, New York and Seymour, Indiana. The Company’s customers include generic pharmaceutical distributors, drug wholesalers, chain drug stores, private label distributors, mail-order pharmacies, other pharmaceutical manufacturers, managed care organizations, hospital buying groups, governmental entities and health maintenance organizations.
JSP Distribution Agreement
On March 23, 2004, the Company entered into an agreement with JSP (the “JSP Distribution Agreement”) for the exclusive distribution rights in the United States to four different JSP products, in exchange for 4.0 million shares of the Company’s common stock. On August 19, 2013, the Company entered into an agreement with JSP to extend the JSP Distribution Agreement to continue as the exclusive distributor in the United States of three JSP products: Butalbital, Aspirin, Caffeine with Codeine Phosphate Capsules USP; Digoxin Tablets USP; and Levothyroxine Sodium Tablets USP. The amendment to the JSP Distribution Agreement extended the term of the initial contract, which was due to expire on March 22, 2014, for five years through March 23, 2019. In connection with the amendment, the Company issued a total of 1.5 million shares of the Company’s common stock to JSP and JSP’s designees.
Net sales of JSP products totaled $253.1 million in fiscal year 2018. Of that amount, Levothyroxine Sodium Tablets USP net sales totaled $245.9 million, with gross margins of approximately 60%, in fiscal year 2018.
After the close of business on August 17, 2018, JSP notified the Company that it will not extend or renew the JSP Distribution Agreement when the current term expires on March 23, 2019.
Because products covered by the JSP Distribution Agreement generate a significant portion of our revenues and gross profits, JSP’s decision not to renew or extend its distribution agreement with us will materially adversely affect our future operating results and cash flows beginning in the fourth quarter of Fiscal 2019. When announced on August 20, 2018, this resulted in a significant decline in the Company’s market capitalization.
The Company has determined that such nonrenewal represents a “triggering event” under United States Generally Accepted Accounting Principles (“U.S. GAAP”) and, accordingly, will perform an analysis to determine the potential for any impairment of goodwill and certain long-lived assets of the Company in the first quarter of Fiscal 2019. In management’s opinion, the impairment assessment will likely result in a material impairment of goodwill and may result in an impairment of certain long-lived assets; however, at this time the Company cannot estimate the amount or a reasonable range of amounts of such impairment. As of June 30, 2018, the carrying value of goodwill was $339.6 million. Any impairment would result in a noncash charge to earnings in the first quarter of Fiscal 2019.
As noted above, JSP’s decision not to renew or extend its distribution agreement with us will materially adversely affect our future operating results, liquidity and cash flows, which could impact our ability to comply with the financial and other covenants in our Amended Senior Secured Credit Facility. As of June 30, 2018, the Company was in compliance with its financial covenants. As of June 30, 2018, cash and cash equivalents totaled $98.6 million in addition to availability under our undrawn Revolver totaling $125.0 million.
Based on its projections for Fiscal 2019 excluding revenue and related gross profits generated by the products distributed under the JSP Distribution Agreement subsequent to March 23, 2019 and without further analysis of potential restructuring and/or refinancing, the Company expects to have sufficient liquidity and cashflows to meet its operating and debt service requirements for at least the next twelve months from the issuance of the June 30, 2018 consolidated financial statements. The Company also expects to be in compliance with its financial covenants for Fiscal 2019.
Although management cannot predict with certainty the precise impact its plans will have on offsetting the loss of the JSP Distribution Agreement, management is continuing to finalize plans to offset the impact of the loss on a short- and long-term basis. These plans currently include, among other things, an emphasis on reducing cost of sales, research and development (“R&D”) and selling, general and administrative (“SG&A”) expenses; continuing to accelerate new product launches; increasing the level of strategic partnerships; and reducing capital expenditures. Management will also continue its emphasis on accelerating ANDA filings. Management also plans to attempt, at the appropriate time, to refinance a significant portion of its outstanding long-term debt to reduce principal repayment requirements and eliminate existing financial covenants, which will increase related interest expense, but will positively impact short-term cash flows.
Cody Restructuring Plan
On June 29, 2018, the Company announced a restructuring plan related to the future of Cody Laboratories, Inc. and the Company’s operations (the “Cody Restructuring Plan”). The plan focuses on a more select set of opportunities which will result in streamlined operations, improved efficiencies and a reduced cost structure. The Company currently estimates that it will incur approximately $5.0 million of total costs to implement the Cody Restructuring Plan, comprised primarily of approximately $3.5 million of severance and employee-related costs, of which approximately $3.1 million was recorded in the quarter ended June 30, 2018. The Cody Restructuring Plan is expected to generate annualized cost savings of approximately $10.0 million. These amounts are preliminary estimates based on the information currently available to management. It is possible that additional charges and future cash payments could occur in relation to the restructuring actions.
In addition, impairment charges were incurred related to the restructuring plan for Cody Laboratories, Inc. as well as with respect to other corporate initiatives. The Company recorded an impairment charge of approximately $21.5 million relating to the facility, equipment and other plant-related assets primarily associated with the expansion project at Cody Laboratories, Inc.
2016 Restructuring Plan
On February 1, 2016, in connection with the acquisition of KUPI, the Company announced a plan related to the future integration of KUPI and the Company’s operations (the “2016 Restructuring Program”). The plan focuses on the closure of KUPI’s corporate functions and the consolidation of manufacturing, sales, research and development and distribution functions. The Company estimates that it will incur an aggregate of up to approximately $19.0 million in restructuring charges for actions that have been announced or communicated since the 2016 Restructuring Program began. Of this amount, approximately $10.0 million relates to employee separation costs, approximately $1.0 million relates to contract termination costs and approximately $8.0 million relates to facility closures costs and other actions.
The plan is currently estimated to achieve an ultimate annual run rate of synergies totaling approximately $65.0 million by the end of Fiscal 2020.
These amounts are preliminary estimates based on the information currently available to management. It is possible that additional charges and future cash payments could occur in relation to the restructuring actions.
Financial Summary
For Fiscal 2018, net sales increased to $684.6 million compared to $637.3 million in the same prior-year period. Total net sales, increased to $684.6 million compared to $633.3 million in the prior-year period, which reflected a $4.0 million settlement agreement adjustment. Gross profit decreased $12.5 million to $288.7 million compared to the prior-year period and gross profit percentage decreased to 42% compared to 48% in Fiscal 2017. R&D expenses decreased 31% to $29.2 million compared to the prior-year period while SG&A expenses increased 12% to $82.2 million. Acquisition and integration-related expenses decreased by $3.9 million as compared to the prior-year period. Restructuring expenses totaling $7.1 million were consistent with the $7.2 million recorded in the prior-year period. Operating income for Fiscal 2018, which included a $15.5 million loss on sale of an intangible asset and a $25.0 million assets impairment charge, was $129.7 million compared to $86.4 million in the prior-year period, which included an $88.1 million intangible assets impairment charge. Net income attributable to Lannett Company, Inc. for Fiscal 2018 was $28.7 million, or $0.75 per diluted share. Comparatively, net loss attributable to Lannett Company, Inc. in the prior-year period was $581 thousand, or $0.02 per diluted share.
A more detailed discussion of the Company’s financial results can be found below.
Results of Operations — Fiscal 2018 compared to Fiscal 2017
Total net sales increased to $684.6 million from $633.3 million in the prior-year period, which included a $4.0 million reduction for a settlement agreement adjustment.
Net sales increased 7% to $684.6 million for the fiscal year ended June 30, 2018. The following table identifies the Company’s net product sales by medical indication for the fiscal years ended June 30, 2018 and 2017:
|
(In thousands) |
|
Fiscal Year Ended June 30, |
| ||||
|
Medical Indication |
|
2018 |
|
2017 |
| ||
|
Antibiotic |
|
$ |
14,509 |
|
$ |
16,748 |
|
|
Anti-Psychosis |
|
59,557 |
|
58,625 |
| ||
|
Cardiovascular |
|
64,011 |
|
50,628 |
| ||
|
Central Nervous System |
|
31,789 |
|
39,451 |
| ||
|
Gallstone |
|
20,280 |
|
48,600 |
| ||
|
Gastrointestinal |
|
60,294 |
|
71,887 |
| ||
|
Glaucoma |
|
6,540 |
|
18,763 |
| ||
|
Migraine |
|
54,015 |
|
29,014 |
| ||
|
Muscle Relaxant |
|
13,496 |
|
13,636 |
| ||
|
Pain Management |
|
23,036 |
|
26,135 |
| ||
|
Respiratory |
|
7,891 |
|
10,516 |
| ||
|
Thyroid Deficiency |
|
245,929 |
|
174,005 |
| ||
|
Urinary |
|
8,661 |
|
14,695 |
| ||
|
Other |
|
54,720 |
|
47,196 |
| ||
|
Contract manufacturing revenue |
|
19,835 |
|
17,442 |
| ||
|
Net sales |
|
684,563 |
|
637,341 |
| ||
|
Settlement agreement |
|
— |
|
(4,000 |
) | ||
|
Total net sales |
|
$ |
684,563 |
|
$ |
633,341 |
|
The increase in net sales was driven by increased volumes of $109.5 million, partially offset by decreased average selling price of products in several key products of $62.2 million. Volumes were favorably impacted due to a temporary disruption of our competitor’s supplies in the Thyroid Deficiency and Migraine medical indications, additional sales in the Cardiovascular medical indication related to a distribution agreement entered into with Aralez in November 2017 as well as increased customer orders in June 2018, with an estimated impact of approximately $15.0 million, in advance of a mid-week holiday as well as a related maintenance shutdown of the Company’s Seymour, Indiana manufacturing facility in the first week of July 2018. On August 10, 2018, Aralez filed a Chapter 11 petition in the United States Bankruptcy Court for the Southern District of New York and continues to operate its business in the normal course. The Company does not believe this will materially affect our distribution agreement with Aralez. Average selling prices were impacted by competitive pricing pressure across a number of products, product mix and changes within distribution channels. Although the Company has benefited in the past from favorable pricing trends, these trends have reversed.
In January 2017, a provision in the Bipartisan Budget Act of 2015 required drug manufacturers to pay additional rebates to state Medicaid programs if the prices of their generic drugs rise at a rate faster than inflation. The provision negatively impacted the Company’s net sales by $31.0 million in Fiscal 2018 and $10.2 million in Fiscal 2017.
The following chart details price and volume changes by medical indication:
|
Medical indication |
|
Sales volume |
|
Sales price |
|
|
Antibiotic |
|
(2) |
% |
(11) |
% |
|
Anti-Psychosis |
|
(2) |
% |
4 |
% |
|
Cardiovascular |
|
67 |
% |
(41) |
% |
|
Central Nervous System |
|
(10) |
% |
(9) |
% |
|
Gallstone |
|
(18) |
% |
(40) |
% |
|
Gastrointestinal |
|
5 |
% |
(21) |
% |
|
Glaucoma |
|
(26) |
% |
(39) |
% |
|
Migraine |
|
87 |
% |
(1) |
% |
|
Muscle Relaxant |
|
36 |
% |
(37) |
% |
|
Pain Management |
|
(1) |
% |
(11) |
% |
|
Respiratory |
|
(8) |
% |
(17) |
% |
|
Thyroid Deficiency |
|
30 |
% |
11 |
% |
|
Urinary |
|
1 |
% |
(42) |
% |
Central Nervous System. Methylphenidate Hydrochloride Extended Release Tablets (“Methylphenidate ER”)
Per a teleconference in November 2014, the FDA informed KUPI that it was changing the therapeutic equivalence rating of its product from “AB” (therapeutically equivalent) to “BX.” A BX-rated drug is a product for which data are insufficient to determine therapeutic equivalence; it is still approved and can be prescribed, but the FDA does not recommend it as automatically substitutable for the brand-name drug at the pharmacy.
During the November 2014 teleconference, the FDA also asked KUPI to either voluntarily withdraw its product or to conduct new bioequivalence (“BE”) testing in accordance with the recommendations for demonstrating bioequivalence to Concerta proposed in a new draft BE guidance that the FDA issued earlier that November. The Company agreed to conduct new BE studies per the new draft BE guidance. KUPI submitted the data from those studies to the FDA in June 2015 and met with the FDA to discuss the results in July 2015.
On October 18, 2016, the Company received notice from the FDA that it will seek to withdraw approval of the Company’s ANDA for Methylphenidate ER. The FDA’s notice includes an opportunity for the Company to request a hearing on this matter. Following the Company’s request under the FOIA for documents to support its request for a hearing, the FDA granted an extension to submit all data, information and analyses upon which the request for a hearing relies. The FDA has not yet made a decision as to whether to grant a hearing to the Company.
The Company intends to continue working with the FDA to regain the “AB” rating, and in the meantime, maintain the drug on the U.S. market with a BX rating. However, there can be no assurance as to when or if the Company will regain the “AB” rating or be permitted to remain on the market. If the Company were to receive the “AB” rating, net sales of the product could increase subject to market factors existing at that time. The Company also agreed to potential acquisition-related contingent payments to UCB related to Methylphenidate ER if the FDA reinstates the AB-rating and certain sales thresholds are met. Such potential contingent payments are set to expire after December 31, 2020.
In August 2018, the Company entered into an exclusive perpetual licensing agreement with Andor Pharmaceuticals, LLC for Methylphenidate Hydrochloride Extended Release (ER) tablets USP (CII) in 18 mg, 27 mg, 36 mg and 54 mg strengths. Andor’s pending ANDA of Methylphenidate included all bioequivalence metrics recommended by the FDA and is expected to be approved as an AB-rated generic equivalent to the brand Concerta®.
Under the agreement, Lannett will primarily provide sales, marketing and distribution support of Andor’s Methylphenidate ER product, for which it will receive a percentage of the net profits. See Note 22. “Subsequent events” for more information.
Pain Management. Cocaine Topical Solution (“C-Topical”)
In December 2017, a competitor received approval from the FDA to market and sell a Cocaine Hydrochloride topical product. This approval affects the Company’s right to market and sell its unapproved Grandfathered C-Topical product. According to FDA guidance, the FDA typically allows the marketing of unapproved products for up to one year following the approval of an NDA for the product. Subsequently, the Company would not be permitted to market and sell its unapproved C-Topical product. During Fiscal 2018 and 2017, the Company’s net sales of C-Topical were $18.9 million and $21.5 million, respectively.
The competitor’s Cocaine Hydrochloride topical product first appeared in FDA’s Orange Book in January 2018, and the Orange Book listing was updated in February 2018 to include NCE exclusivity. Under the Federal Food Drug and Cosmetic Act, the grant of NCE exclusivity provides that additional applications for approval of the same product under Section 505(b)(2) may not be submitted to the FDA for approval before the expiration of five years from the date of the approval of the first application. Because the Company submitted its application for approval prior to the date of approval of the competitor’s Cocaine Hydrochloride topical application, the Company does not believe the NCE exclusivity will apply to the Company’s application. In July 2018, the Company received a complete response letter and is in the process of addressing the issues raised by the FDA. The FDA continues to review the Company’s application and in July 2018, issued a Complete Response Letter which required an additional study and other information. The Company cannot say for certain when or if the application will be approved.
At this time, the Company cannot predict the ultimate impact that these developments will have on its business and financial performance, including but not limited to any possible price reductions should the competitor commence marketing and selling its C-Topical product in the future, for how long the Company will continue to be permitted to market and sell C-Topical, or the possible effect on the Company’s pending NDA application.
Gastrointestinal. Polyethylene Glycol (PEG)3350 (“Glycolax”)
On April 2, 2018, the FDA issued a Federal Register notice (Docket No. FDA-2008-N-0549) indicating that it was affirming a preliminary summary judgment decision that the FDA issued in 2014, denying a hearing, and withdrawing all ANDAs for prescription PEG 3350 products, including the Company’s Glycolax product. The FDA’s decision is based on the FDA finding that there are no meaningful differences between Rx PEG 3350 products and OTC PEG 3350 products and, therefore, that the Rx products are misbranded. The FDA ordered the Company’s ANDA withdrawn effective May 2, 2018, after which the Company would no longer be permitted to market or sell its Glycolax product. The Company disputes that there are no meaningful differences and disputes that summary judgment was appropriate in light of the factual issues raised by the ANDA holders. On April 9, 2018, the Company, along with three other PEG 3350 ANDA holders, filed a request for a stay of the FDA order pending appeal of the decision to the District of Columbia Circuit Court of Appeals. On April 16, 2018, the FDA granted a stay of its order withdrawing the Company’s ANDA through November 2, 2018, after which the Company will no longer be permitted to market or sell its Glycolax product. The Company filed an appeal of the FDA withdrawal order to the United States Court of Appeals for the District of Columbia. In July 2018, the Company filed a brief in support of the appeal. All briefing is scheduled to be completed by September 15, 2018 although the Company is unable to say whether the Court will decide the appeal prior to the November 2, 2018 withdrawal date. During Fiscal 2018 and 2017, the Company’s net sales of Glycolax were $17.9 million and $17.7 million, respectively, although gross profit percentages for this product were in the single-digits in each of these years. At this time, the Company is unable to determine the outcome of this matter and cannot predict when or if the Company’s product will be removed from the market.
The Company sells its products to customers through various distribution channels. The table below presents the Company’s net sales to each distribution channel for the fiscal year ended June 30:
|
(In thousands) |
|
June 30, |
|
June 30, |
| ||
|
Wholesaler/Distributor |
|
$ |
504,030 |
|
$ |
487,969 |
|
|
Retail Chain |
|
117,331 |
|
82,864 |
| ||
|
Mail-Order Pharmacy |
|
43,367 |
|
49,066 |
| ||
|
Contract manufacturing revenue |
|
19,835 |
|
17,442 |
| ||
|
Net sales |
|
684,563 |
|
637,341 |
| ||
|
Settlement agreement |
|
— |
|
(4,000 |
) | ||
|
Total net sales |
|
$ |
684,563 |
|
$ |
633,341 |
|
Net sales to retail chains increased significantly as a result of additional sales to a customer that was unable to obtain supply from a competitor due to a temporary disruption in the competitor’s supply chain, and to a lesser extent, additional sales of a product in the Cardiovascular medical indication related to a distribution agreement entered into with Aralez in November 2017.
Cost of Sales, including amortization of intangibles. Cost of sales, including amortization of intangibles, for Fiscal 2018 increased 19% to $395.9 million from $332.1 million in the same prior-year period. The increase was primarily attributable to higher sales as well as increased product royalties. Product royalties expense included in cost of sales totaled $29.7 million for Fiscal 2018 and $19.0 million for Fiscal 2017. Amortization expense included in cost of sales totaled $32.1 million for Fiscal 2018 and for Fiscal Year 2017.
Gross Profit. Gross profit for Fiscal 2018 decreased 4% to $288.7 million or 42% of total net sales. In comparison, gross profit for Fiscal 2017 was $301.2 million or 48% of total net sales. The decrease in gross profit percentage was primarily attributable to lower average selling prices of certain key products as well as additional product royalties related to a distribution agreement entered into with Aralez in November 2017.
Research and Development Expenses. Research and development expenses decreased 31% to $29.2 million in Fiscal 2018 from $42.1 million in Fiscal 2017. The decrease was primarily due to lower product development expenses as well as decreased spend related to the C-Topical clinical trials. Research and development expenses decreased due to a credit in Fiscal 2018 for a cancelled order of pre-launch inventory purchased in Fiscal 2017.
Selling, General and Administrative Expenses. Selling, general and administrative expenses increased 12% to $82.2 million in Fiscal 2018 compared with $73.5 million in Fiscal 2017. The increase was primarily driven by approximately $5.1 million related to separation benefits for former executive officers as well as other former employees. Additional headcount in Fiscal 2018 also contributed to an increase in selling, general and administrative expenses.
The Company is focused on controlling operating expenses and has implemented its 2016 Restructuring Plan and Cody Restructuring Plan as noted above, however increases in personnel and other costs to facilitate enhancements in the Company’s infrastructure and expansion may continue to impact operating expenses in future periods.
Acquisition and Integration-related Expenses. Acquisition and integration-related expenses decreased $3.9 million as compared to the prior-year period. The decrease was due to the timing of the acquisition of KUPI.
Restructuring Expenses. Restructuring expenses of $7.1 million for Fiscal Year 2018 were consistent to the prior-year period primarily due to higher employee separation costs incurred in connection with the 2016 Restructuring Program during Fiscal 2017, offset by an additional $3.1 million of employee separation costs incurred in connection with the Cody Restructuring program in Fiscal 2018.
Loss on sale of intangible asset. In the third quarter of Fiscal 2018, the Company sold an intangible asset acquired as part of the KUPI acquisition. In connection with the transaction, the Company recorded a $15.5 million loss on sale of intangible asset.
Asset impairment charges. In the fourth quarter of Fiscal 2018, the Company recorded impairment charges totaling $25.0 million, of which $21.5 million relates to the Cody Restructuring Plan and $3.5 million resulting from the consolidation of the Company’s manufacturing activities with respect to plant-related assets located at the Company’s Townsend Road facility.
In Fiscal 2017, as a result of a notice from the FDA that it will seek to withdraw approval of the Company’s ANDA for Methylphenidate ER, the Company recorded a $65.1 million impairment charge in the first quarter of Fiscal 2017. Additionally, the Company abandoned a project within KUPI’s in-process research and development portfolio, which resulted in a $23.0 million impairment charge in the second quarter of Fiscal 2017.
Other Income (Loss). Interest expense for the period ended June 30, 2018 totaled $85.6 million compared to $89.4 million for the period ended June 30, 2017. The weighted average interest rate for Fiscal 2018 and 2017 was 8.7% and 8.0%, respectively. Investment income totaled $4.8 million in Fiscal 2018 compared with $3.8 million in Fiscal 2017. In December 2017, the Company received $3.5 million as part of the settlement of a patent litigation. See Note 11 “Legal, Regulatory Matters and Contingencies” for further details.
Income Tax. The Company recorded income tax expense in Fiscal 2018 of $22.4 million compared to income tax expense of $1.1 million in Fiscal 2017. The effective tax rate for Fiscal 2018 was 43.8%, compared to 199.5% for Fiscal 2017. The effective tax rate for the period ended June 30, 2018 was lower compared to the same prior-year period primarily due to the impact of higher pre-tax income and a lowered blended U.S. statutory rate from 35.0% to 28.1% as a result of the 2017 Tax Reform, partially offset by a $13.1 million re-measurement of the U.S. deferred tax assets, or 25.6% as a result of the 2017 Tax Reform. Overall, the Company anticipates the decrease in the U.S. federal statutory rate, which is 21% for the entire Fiscal 2019, will have a favorable impact on future U.S. tax expense and operating cash flows.
Net Income. For the period ended June 30, 2018, the Company reported net income attributable to Lannett Company, Inc. of $28.7 million, or $0.75 per diluted share. Comparatively, net loss attributable to Lannett Company, Inc. in the corresponding prior-year period was $581 thousand, or $0.02 per diluted share.
Results of Operations — Fiscal 2017 compared to Fiscal 2016
Total net sales, which included a $4.0 million reduction for an adjustment to the Fiscal 2016 Settlement Agreement amount, increased to $633.3 million from $542.5 million in the prior-year period, which included a $23.6 million reduction for the Fiscal 2016 Settlement Agreement. The Fiscal 2016 Settlement Agreement relates to a Settlement Agreement Release and Mutual Release with one of the Company’s former customers.
Net sales increased 13% to $637.3 million for the fiscal year ended June 30, 2017. The following table identifies the Company’s approximate net product sales by medical indication for the fiscal years ended June 30, 2017 and 2016:
|
(In thousands) |
|
Fiscal Year Ended June 30, |
| ||||
|
Medical Indication |
|
2017 |
|
2016 |
| ||
|
Antibiotic |
|
$ |
16,748 |
|
$ |
14,558 |
|
|
Anti-Psychosis |
|
58,625 |
|
5,462 |
| ||
|
Cardiovascular |
|
50,628 |
|
53,541 |
| ||
|
Central Nervous System |
|
39,451 |
|
36,291 |
| ||
|
Gallstone |
|
48,600 |
|
67,348 |
| ||
|
Gastrointestinal |
|
71,887 |
|
52,699 |
| ||
|
Glaucoma |
|
18,763 |
|
25,336 |
| ||
|
Migraine |
|
29,014 |
|
21,776 |
| ||
|
Muscle Relaxant |
|
13,636 |
|
5,403 |
| ||
|
Obesity |
|
3,956 |
|
3,809 |
| ||
|
Pain Management |
|
26,135 |
|
29,804 |
| ||
|
Respiratory |
|
10,516 |
|
9,982 |
| ||
|
Thyroid Deficiency |
|
174,005 |
|
162,411 |
| ||
|
Urinary |
|
14,695 |
|
17,398 |
| ||
|
Other |
|
43,240 |
|
38,230 |
| ||
|
Contract manufacturing revenue |
|
17,442 |
|
22,043 |
| ||
|
Net sales |
|
637,341 |
|
566,091 |
| ||
|
Settlement agreement |
|
(4,000 |
) |
(23,598 |
) | ||
|
Total net sales |
|
$ |
633,341 |
|
$ |
542,493 |
|
The increase in net sales was primarily driven by additional sales of KUPI products of $87.9 million due to the timing of the acquisition as well as increased volumes of $21.5 million, partially offset by decreased average selling price of products of $38.2 million. Average selling prices were impacted by competitive pricing pressure across a number of products, product mix and changes within distribution channels.
Effective January 2017, a provision in the Bipartisan Budget Act of 2015 required drug manufacturers to pay additional rebates to state Medicaid programs if the prices of their generic drugs rise at a rate faster than inflation. The provision negatively impacted the Company’s net sales by $10.2 million in Fiscal 2017.
The following chart details price, volume and acquisition changes by medical indication:
|
Medical indication |
|
Sales volume |
|
Sales price |
|
Acquisition |
|
|
Antibiotic |
|
59 |
% |
(44 |
)% |
— |
|
|
Anti Psychosis |
|
13 |
% |
960 |
% |
— |
|
|
Cardiovascular |
|
(1 |
)% |
(30 |
)% |
26 |
% |
|
Central Nervous System |
|
(9 |
)% |
(31 |
)% |
49 |
% |
|
Gallstone |
|
(16 |
)% |
(12 |
)% |
— |
|
|
Gastrointestinal |
|
5 |
% |
(29 |
)% |
60 |
% |
|
Glaucoma |
|
(2 |
)% |
(24 |
)% |
— |
|
|
Migraine |
|
49 |
% |
(16 |
)% |
— |
|
|
Muscle Relaxant |
|
339 |
% |
(187 |
)% |
— |
|
|
Obesity |
|
27 |
% |
(23 |
)% |
— |
|
|
Pain Management |
|
1 |
% |
(13 |
)% |
— |
|
|
Respiratory |
|
(16 |
)% |
(19 |
)% |
40 |
% |
|
Thyroid Deficiency |
|
12 |
% |
(5 |
)% |
— |
|
|
Urinary |
|
(26 |
)% |
(38 |
)% |
50 |
% |
The Company sells its products to customers through various distribution channels. The table below presents the Company’s net sales to each distribution channel for the fiscal year ended June 30:
|
(In thousands) |
|
June 30, |
|
June 30, |
| ||
|
Wholesaler/Distributor |
|
$ |
487,969 |
|
$ |
419,375 |
|
|
Retail Chain |
|
82,864 |
|
84,614 |
| ||
|
Mail-Order Pharmacy |
|
49,066 |
|
40,059 |
| ||
|
Contract manufacturing revenue |
|
17,442 |
|
22,043 |
| ||
|
Net sales |
|
637,341 |
|
566,091 |
| ||
|
Settlement agreement |
|
(4,000 |
) |
(23,598 |
) | ||
|
Total net sales |
|
$ |
633,341 |
|
$ |
542,493 |
|
Net sales to wholesaler/distributor and mail-order pharmacies increased primarily as a result of additional net sales related to the KUPI acquisition. Net sales to retail chain decreased as a result of strategic partnerships within the industry, in which certain retailers have begun to submit orders through the wholesalers.
Cost of Sales, including amortization of intangibles. Cost of sales, including amortization of intangibles, for Fiscal 2017 increased $76.1 million to $332.1 million. The increase was primarily attributable to additional cost of sales from KUPI due to the timing of the acquisition, partially offset by the effects of purchase accounting related to the amortization of inventory step-up of $17.0 million in Fiscal 2016. Product royalties expense included in cost of sales totaled $19.0 million for Fiscal 2017 and $17.0 million for Fiscal 2016. Amortization expense included in cost of sales totaled $32.1 million for Fiscal 2017 and $18.6 million for Fiscal 2016. The increase primarily reflected additional amortization of the acquired intangibles from the acquisition of KUPI.
Gross Profit. Gross profit for the fiscal year ended June 30, 2017 increased 5% to $301.2 million or 48% of total net sales. In comparison, gross profit for the fiscal year ended June 30, 2016 was $286.5 million or 53% of total net sales. The decrease in gross profit percentage was attributable to the dilutive impact of KUPI products, sales mix, changes within distribution channels, additional amortization of intangibles, as well as amortization of inventory step-up and depreciation of property, plant and equipment related to the acquisition of KUPI.
Research and Development Expenses. Research and development expenses decreased 7% to $42.1 million for the fiscal year ended June 30, 2017 compared to $45.1 million in the prior-year period. The decrease was primarily due to lower product development and bio-equivalency studies expenses in the fiscal year ended 2017, partially offset by an increase due to the timing of the KUPI acquisition, as well as a $3.8 million write-off of inventory related to the delay of an anticipated approval.
Selling, General and Administrative Expenses. Selling, general and administrative expenses increased 8% to $73.5 million for the fiscal year ended June 30, 2017 compared with $68.3 million in the prior-year period. The increase was primarily due to the timing of the KUPI acquisition, which resulted in additional selling, general and administrative expenses. Increased headcount as well as additional legal and consulting costs also contributed to the increase.
The Company is focused on controlling operating expenses and has implemented its 2016 Restructuring Plan as noted above, however increases in personnel and other costs to facilitate enhancements in the Company’s infrastructure and expansion may continue to impact operating expenses in future periods.
Acquisition and Integration-related Expenses. Acquisition and integration-related expenses decreased $23.2 million to $4.0 million for the fiscal year ended June 30, 2017 compared with $27.2 million compared to the prior-year period. The decrease was due to higher costs during Fiscal 2016 associated with the acquisition of KUPI.
Restructuring Expenses. Restructuring expenses were consistent with the prior-year period as a result of an increase in facility closure costs, offset by a decrease in employee separation costs.
Asset Impairment Charges. On October 18, 2016, the Company received notice from the FDA that it will seek to withdraw approval of the Company’s ANDA for Methylphenidate ER. As a result of the notice, the Company performed an impairment analysis including a review of revised net sales projections for Methylphenidate ER. This analysis resulted in the Company recording a $65.1 million impairment charge in the first quarter of Fiscal 2017. Additionally, in the second quarter of Fiscal 2017, the Company abandoned a project within KUPI’s in-process research and development portfolio. The value assigned to the project was $23.0 million. Accordingly, the Company recorded a $23.0 million impairment charge in the second quarter.
Other Income (Loss). Interest expense in Fiscal 2017 totaled $89.4 million compared to $65.9 million in the prior-year period. The fiscal year ended June 30, 2016 included approximately seven months of interest expense related to the acquisition of KUPI as compared to the twelve months ended June 30, 2017. The weighted average interest rate for Fiscal 2017 was 8.0%. Investment income in Fiscal 2017 totaled $3.8 million compared to investment income of $368 thousand in the prior-year period.
The Company also recorded a $3.0 million loss on extinguishment of debt related to the repurchase of the 12.0% Senior Notes in the fourth quarter of Fiscal 2016.
Income Tax. The Company recorded income tax expense for the fiscal year ended June 30, 2017 of $1.1 million compared to $17.3 million for the fiscal year ended June 30, 2016. The effective tax rate for the fiscal year ended June 30, 2017 was 199.5%, compared to 27.9% for the prior-year period. The increase in the effective tax rate in the fiscal year ended June 30, 2017 as compared to the fiscal year ended June 30, 2016 was primarily due to the impact of state deferred income tax in Fiscal 2017 relative to pre-tax income.
At June 30, 2017 and 2016, the Company had recognized a net deferred tax asset of $52.8 million and $52.4 million, respectively. The net deferred tax assets as of June 30, 2017 and 2016 are reduced by a valuation allowance of $6.4 million and $3.9 million, respectively, which are primarily related to the realizability of deferred tax assets for various states, the impairment on the Cody note receivable as well as foreign net operating losses. The Company increased the valuation allowance in Fiscal 2017 primarily related to an increase of state deferred tax assets.
Net Income (Loss). For the fiscal year ended June 30, 2017, the Company reported net loss attributable to Lannett Company, Inc. of $581 thousand, or $0.02 basic and diluted per share. Comparatively, net income attributable to Lannett Company, Inc. in the prior-year was $44.8 million, or $1.23 basic and $1.20 per diluted share.
Liquidity and Capital Resources
Cash Flow
Until November 25, 2015, the date of the KUPI acquisition, the Company had historically financed its operations with cash flow generated from operations supplemented with borrowings from various government agencies and financial institutions. At June 30, 2018, working capital was $326.0 million as compared to $302.6 million at June 30, 2017, an increase of $23.4 million. Current product portfolio sales as well as sales related to future product approvals are anticipated to continue to generate positive cash flow from operations.
Net cash from operating activities of $118.5 million for the fiscal year ended June 30, 2018 reflected net income of $28.7 million, adjustments for non-cash items of $155.5 million, as well as cash used by changes in operating assets and liabilities of $65.7 million. In comparison, net cash from operating activities of $165.4 million for the fiscal year ended June 30, 2017 reflected net loss of $547 thousand, adjustments for non-cash items of $170.7 million, as well as cash used by changes in operating assets and liabilities of $4.8 million.
Significant changes in operating assets and liabilities from June 30, 2017 to June 30, 2018 are comprised of:
· An increase in accounts receivable of $48.6 million mainly due to increased sales as well as the timing of collections during the quarter ended June 30, 2018 compared to the quarter ended June 30, 2017. The Company’s days sales outstanding (“DSO”) at June 30, 2018, based on gross sales for the fiscal year ended June 30, 2018 and gross accounts receivable at June 30, 2018 was 83 days. The level of DSO at June 30, 2018 was higher compared to the Company’s expectations that DSO will be in the 70 to 80 day range based on customer payment terms mainly due to the timing of customer orders in advance of a mid-week holiday as well as a related maintenance shutdown of the Company’s Seymour, Indiana manufacturing facility in the first week of July 2018.
· An increase in inventories of $19.0 million primarily due to the timing of customer order fulfillment as well as an expanded product portfolio at June 30, 2018 as compared to the prior-year.
· An increase in rebates payable of $4.8 million primarily due to an increase in sales to government programs as well as the timing of processed rebates.
· A decrease in accounts payable and accrued expenses totaling $5.0 million and $5.1 million, respectively, due to the timing of payments.
Significant changes in operating assets and liabilities from June 30, 2016 to June 30, 2017 are comprised of:
· An increase in prepaid income taxes totaling $17.7 million mainly due to estimated tax payments made during Fiscal 2017 relative to estimated taxable income.
· An increase in inventories of $7.7 million primarily due to the timing of customer order fulfillment.
· An increase in rebates payable of $14.4 million due to an increase in rebate-eligible sales to government programs as well as the timing of processed rebates.
· An increase in accounts payable totaling $5.0 million due to the timing of payments.
Net cash used in investing activities of $51.2 million for the fiscal year ended June 30, 2018 was primarily due to purchases of investment securities of $63.6 million, purchases of property, plant and equipment of $52.3 million, loan advances to a variable interest entity of $10.3 million and purchases of intangible assets of $19.0 million, partially offset by proceeds from the sale of investment securities of $94.0 million. Net cash used in investing activities of $58.7 million for the fiscal year ended June 30, 2017 was primarily due to purchases of investment securities of $77.9 million and purchases of property, plant and equipment of $48.7 million, partially offset by proceeds from the sale of investment securities of $67.8 million.
Net cash used in financing activities of $86.2 million for the fiscal year ended June 30, 2018 was primarily due to debt repayments of $85.7 million and purchases of treasury stock totaling $4.6 million, partially offset by proceeds from issuance of stock pursuant to stock compensation plans of $4.1 million. Net cash used in financing activities of $213.8 million for the fiscal year ended June 30, 2017 was primarily due to debt repayments of $178.2 million, payment of contingent consideration to UCB of $35.0 million, purchases of treasury stock totaling $1.9 million and purchase of the noncontrolling interest in Realty of $1.5 million, partially offset by proceeds from issuance of stock pursuant to stock compensation plans of $2.8 million.
Credit Facility and Other Indebtedness
The Company has previously entered into and may enter future agreements with various government agencies and financial institutions to provide additional cash to help finance the Company’s various capital investments and potential strategic opportunities. These borrowing arrangements as of June 30, 2018 are as follows:
Amended Senior Secured Credit Facility
On November 25, 2015, in connection with its acquisition of KUPI, Lannett entered into a credit and guaranty agreement (the “Credit and Guaranty Agreement”) among certain of its wholly-owned domestic subsidiaries, as guarantors, Morgan Stanley Senior Funding, Inc., as administrative agent and collateral agent and other lenders providing for a senior secured credit facility (the “Senior Secured Credit Facility”). The Senior Secured Credit Facility consisted of Term Loan A in an aggregate principal amount of $275.0 million, Term Loan B in an aggregate principal amount of $635.0 million and a revolving credit facility providing for revolving loans in an aggregate principal amount of up to $125.0 million. As of June 30, 2018, there was no balance outstanding under the revolving credit facility.
On June 17, 2016, Lannett amended the Senior Secured Credit Facility and the Credit and Guaranty Agreement to raise an incremental term loan in the principal amount of $150.0 million (the “Incremental Term Loan”) and amended certain sections of the agreement (the “Amended Senior Secured Credit Facility”). The terms of this Incremental Term Loan are substantially the same as those applicable to the Term Loan B. The Company used the proceeds of the Incremental Term Loan and cash on hand to repurchase the outstanding $250.0 million aggregate principal amount of Lannett’s 12.0% Senior Notes due 2023 (the “Senior Notes”) issued in connection with the KUPI acquisition.
The Term Loan A Facility will mature on November 25, 2020. The Term Loan A Facility amortizes in quarterly installments (a) through December 31, 2017 in amounts equal to 1.25% of the original principal amount of the Term Loan A Facility and (b) from January 1, 2018 through September 30, 2020 in amounts equal to 2.50% of the original principal amount of the Term Loan A Facility, with the balance payable on November 25, 2020. The Term Loan B Facility will mature on November 25, 2022. The Term Loan B Facility amortizes in equal quarterly installments in amounts equal to 1.25% of the original principal amount of the Term Loan B Facility with the balance payable on November 25, 2022. Any outstanding Revolving Loans will mature on November 25, 2020.
The Amended Senior Secured Credit Facility is guaranteed by all of Lannett’s significant wholly-owned domestic subsidiaries (the “Subsidiary Guarantors”) and is collateralized by substantially all present and future assets of Lannett and the Subsidiary Guarantors.
The interest rates applicable to the Amended Term Loan Facility are based on a fluctuating rate of interest of the greater of an adjusted LIBOR and 1.00%, plus a borrowing margin of 4.75% (for Term Loan A Facility) or 5.375% (for Term Loan B Facility). The interest rates applicable to the Revolving Credit Facility is based on a fluctuating rate of interest of an adjusted LIBOR plus a borrowing margin of 4.75%. The interest rate applicable to the unused commitment for the Revolving Credit Facility was initially 0.50%. Since March 2016, the interest margins and unused commitment fee on the Revolving Credit Facility have been subject to a leveraged based pricing grid.
The Amended Senior Secured Credit Facility contains a number of covenants that, among other things, limit the ability of Lannett and its restricted subsidiaries to: incur more indebtedness; pay dividends; redeem stock or make other distributions of equity; make investments; create restrictions on the ability of Lannett’s restricted subsidiaries that are not Subsidiary Guarantors to pay dividends to Lannett or make intercompany transfers; create negative pledges; create liens; transfer or sell assets; merge or consolidate; enter into sale leasebacks; enter into certain transactions with Lannett’s affiliates; and prepay or amend the terms of certain indebtedness.
The Amended Senior Secured Credit Facility contains a financial performance covenant that is triggered when the aggregate principal amount of outstanding Revolving Credit Facility and outstanding letters of credit as of the last day of the most recent fiscal quarter is greater than 30% of the aggregate commitments under the Revolving Credit Facility. The covenant provides that Lannett shall not permit its first lien net senior secured leverage ratio as of the last day of any four consecutive fiscal quarters (i) from and after December 31, 2015, to be greater than 4.25:1.00 (ii) from and after December 31, 2017 to be greater than 3.75:1.00 and (iii) from and after December 31, 2019 to be greater than 3.25:1.00.
The Amended Senior Secured Credit Facility also contains a financial performance covenant for the benefit of the Term Loan A Facility lenders which provides that Lannett shall not permit its net senior secured leverage ratio as of the last day of any four consecutive fiscal quarters (i) prior to December 31, 2017, to be greater than 4.25:1.00, (ii) as of December 31, 2017 and prior to December 31, 2019 to be greater than 3.75:1.00 and (iii) as of December 31, 2019 and thereafter to be greater than 3.25:1.00. The Amended Senior Secured Credit Facility also contains certain affirmative covenants, including financial and other reporting requirements.
Other Liquidity Matters
Refer to the “JSP Distribution Agreement” section above for the impact of the nonrenewal of the JSP agreement on our future liquidity.
Future Acquisitions
We are continuously evaluating the potential for product and company acquisitions as a part of our future growth strategy. In conjunction with a potential acquisition, the Company may utilize current resources or seek additional sources of capital to finance any such acquisition, which could have an impact on future liquidity.
We may also from time to time depending on market conditions and prices, contractual restrictions, our financial liquidity and other factors, seek to prepay outstanding debt or repurchase our outstanding debt through open market purchases, privately negotiated purchases, or otherwise. The amounts involved in any such transactions, individually or in the aggregate, may be material and may be funded from available cash or from additional borrowings.
Contractual Obligations
The following table represents annual contractual obligations as of June 30, 2018:
|
|
|
|
|
Less than 1 |
|
|
|
|
|
More than 5 |
| |||||
|
(In thousands) |
|
Total |
|
year |
|
1-3 years |
|
3-5 years |
|
Years |
| |||||
|
Long-Term Debt |
|
$ |
897,287 |
|
$ |
66,845 |
|
$ |
278,466 |
|
$ |
551,976 |
|
$ |
— |
|
|
Operating Lease Obligations |
|
11,414 |
|
1,835 |
|
3,261 |
|
2,160 |
|
4,158 |
| |||||
|
Purchase Obligations |
|
24,710 |
|
24,710 |
|
— |
|
— |
|
— |
| |||||
|
Interest on Obligations |
|
225,989 |
|
64,680 |
|
107,606 |
|
53,703 |
|
— |
| |||||
|
Total |
|
$ |
1,159,400 |
|
$ |
158,070 |
|
$ |
389,333 |
|
$ |
607,839 |
|
$ |
4,158 |
|
Long-term debt and interest on obligations amounts above primarily relate to the Company’s Amended Senior Secured Credit Facility. Refer to Note 10 “Long-Term Debt” for additional information. Interest on obligations was calculated based on interest rates in effect at June 30, 2018.
The purchase obligations above are primarily related to noncancelable open purchase orders for API and ongoing capital expenditure projects.
Operating lease obligations primarily relate to a 116,000 square foot leased warehouse in Seymour, Indiana as well as a 25 year lease with Forward Cody, which commenced on April 2015.
Research and Development Arrangements
In the normal course of business, the Company has entered into certain research and development and other arrangements. As part of these arrangements, the Company has agreed to certain contingent payments which generally become due and payable only upon the achievement of certain developmental, regulatory, commercial and/or other milestones. In addition, under certain arrangements, we may be required to make royalty payments based on a percentage of future sales, or other metric, for products currently in development in the event that the Company begins to market and sell the product. Due to the inherent uncertainty related to these developmental, regulatory, commercial and/or other milestones, it is unclear if the Company will ever be required to make such payments. As such, these contingencies are not reflected in the expected cash requirements for Contractual Obligations in the table above.
Critical Accounting Policies
The preparation of our consolidated financial statements in accordance with accounting principles generally accepted in the United States and the rules and regulations of the U.S. Securities & Exchange Commission requires the use of estimates and assumptions. A listing of the Company’s significant accounting policies are detailed in Note 2 “Summary of Significant Accounting Policies.” A subsection of these accounting policies have been identified by management as “Critical Accounting Policies.” Critical accounting policies are those which require management to make estimates using assumptions that were uncertain at the time the estimates were made and for which the use of different assumptions, which reasonably could have been used, could have a material impact on the financial condition or results of operations.
Management has identified the following as “Critical Accounting Policies”: Revenue Recognition, Inventories, Income Taxes, Business Combinations, Valuation of Long-Lived Assets, including Goodwill and Intangible Assets, In-Process Research and Development and Share-based Compensation.
Revenue Recognition
The Company recognizes revenue when title and risk of loss have transferred to the customer and provisions for estimates, including rebates, promotional adjustments, price adjustments, returns, chargebacks and other potential adjustments are reasonably determinable. The Company also considers all other relevant criteria specified in SEC Staff Accounting Bulletin No. 104, Topic No. 13, “Revenue Recognition,” in determining when to recognize revenue.
When revenue is recognized, a simultaneous adjustment to gross sales is made for chargebacks, rebates, returns, promotional adjustments and other potential adjustments. These provisions are primarily estimated based on historical experience, future expectations, contractual arrangements with wholesalers and indirect customers and other factors known to management at the time of accrual. Accruals for provisions are presented in the Consolidated Financial Statements as a reduction to gross sales with the corresponding reserve presented as a reduction of accounts receivable or included as rebates payable. The reserves presented as a reduction of accounts receivable totaled $249.2 million and $175.8 million at June 30, 2018 and June 30, 2017, respectively. Rebates payable at June 30, 2018 and June 30, 2017 totaled $49.4 million and $44.6 million, respectively, which is comprised of certain rebate programs, primarily related to Medicare Part D, Medicaid as well as certain sales allowances and other adjustments paid to indirect customers.
The following table identifies the activity and ending balances of each major category of revenue reserve for fiscal years 2018, 2017 and 2016:
|
Reserve Category |
|
Chargebacks |
|
Rebates |
|
Returns |
|
Other |
|
Total |
| |||||
|
Balance at June 30, 2015 |
|
$ |
35,801 |
|
$ |
20,498 |
|
$ |
19,209 |
|
$ |
1,528 |
|
$ |
77,036 |
|
|
Additions related to the KUPI acquisition |
|
49,333 |
|
38,471 |
|
20,498 |
|
6,455 |
|
114,757 |
| |||||
|
Current period provision |
|
646,926 |
|
189,210 |
|
21,298 |
|
49,976 |
|
907,410 |
| |||||
|
Credits issued during the period |
|
(645,565 |
) |
(194,095 |
) |
(20,412 |
) |
(41,108 |
) |
(901,180 |
) | |||||
|
Balance at June 30, 2016 |
|
86,495 |
|
54,084 |
|
40,593 |
|
16,851 |
|
198,023 |
| |||||
|
Additions related to the KUPI acquisition |
|
— |
|
8,329 |
|
5,955 |
|
— |
|
14,284 |
| |||||
|
Current period provision |
|
881,283 |
|
297,050 |
|
25,416 |
|
53,398 |
|
1,257,147 |
| |||||
|
Credits issued during the period |
|
(888,241 |
) |
(271,847 |
) |
(29,829 |
) |
(59,153 |
) |
(1,249,070 |
) | |||||
|
Balance at June 30, 2017 |
|
79,537 |
|
87,616 |
|
42,135 |
|
11,096 |
|
220,384 |
| |||||
|
Current period provision |
|
1,141,995 |
|
296,784 |
|
24,024 |
|
69,898 |
|
1,532,701 |
| |||||
|
Credits issued during the period |
|
(1,068,498 |
) |
(301,898 |
) |
(23,100 |
) |
(60,973 |
) |
(1,454,469 |
) | |||||
|
Balance at June 30, 2018 |
|
$ |
153,034 |
|
$ |
82,502 |
|
$ |
43,059 |
|
$ |
20,021 |
|
$ |
298,616 |
|
For the fiscal years ended June 30, 2018, 2017 and 2016, as a percentage of gross sales the provision for chargebacks was 52.0%, 47.0% and 44.6%, respectively, the provision for rebates was 13.5%, 15.8% and 13.0%, respectively, the provision for returns was 1.1%, 1.4% and 1.5%, respectively and the provision for other adjustments was 3.2%, 2.8% and 3.4%, respectively.
The increase in total reserves from June 30, 2017 to June 30, 2018 was mainly due to an increase in the chargebacks reserve, which was the result of a higher chargeback rate associated with the distribution agreement entered into with Aralez in November 2017. The chargebacks reserve also increased due to higher inventory levels on-hand at the Company’s wholesaler customers as of June 30, 2018 as compared to June 30, 2017. In addition, a change in the Company’s billing practices required by one of our major wholesaler customers resulted in a shift from rebates to chargebacks with no significant change to the total reserve balance. The activity in the “Other” category includes shelf-stock, shipping and other sales adjustments including prompt payment discounts. The increase in this reserve category for Fiscal 2018 as compared to the prior-year period was a result of sales adjustments related to the inability to fulfill certain customer orders. Historically, we have not recorded any material amounts in the current period related to reversals or additions of prior period reserves. If the Company were to record a material reversal or addition of any prior period reserve amount, it would be separately disclosed.
Provisions for chargebacks, rebates, returns and other adjustments require varying degrees of subjectivity. While rebates generally are based on contractual terms and require minimal estimation, chargebacks and returns require management to make more subjective assumptions. Each major category is discussed in detail below:
Chargebacks
The provision for chargebacks is the most significant and complex estimate used in the recognition of revenue. The Company sells its products directly to wholesale distributors, generic distributors, retail pharmacy chains and mail-order pharmacies. The Company also sells its products indirectly to independent pharmacies, managed care organizations, hospitals, nursing homes and group purchasing organizations, collectively referred to as “indirect customers.” The Company enters into agreements with its indirect customers to establish pricing for certain products. The indirect customers then independently select a wholesaler from which to purchase the products. If the price paid by the indirect customers is lower than the price paid by the wholesaler, the Company will provide a credit, called a chargeback, to the wholesaler for the difference between the contractual price with the indirect customers and the wholesaler purchase price. The provision for chargebacks is based on expected sell-through levels by the Company’s wholesale customers to the indirect customers and estimated wholesaler inventory levels. As sales to the large wholesale customers, such as Cardinal Health, AmerisourceBergen and McKesson increase (decrease), the reserve for chargebacks will also generally increase (decrease). However, the size of the increase (decrease) depends on product mix and the amount of sales made to indirect customers with which the Company has specific chargeback agreements. The Company continually monitors the reserve for chargebacks and makes adjustments when management believes that expected chargebacks may differ from the actual chargeback reserve.
Rebates
Rebates are offered to the Company’s key chain drug store, distributor and wholesaler customers to promote customer loyalty and increase product sales. These rebate programs provide customers with credits upon attainment of pre-established volumes or attainment of net sales milestones for a specified period. Other promotional programs are incentive programs offered to the customers. Additionally, as a result of the Patient Protection and Affordable Care Act (“PPACA”) enacted in the U.S. in March 2010, the Company participates in a new cost-sharing program for certain Medicare Part D beneficiaries designed primarily for the sale of brand drugs and certain generic drugs if their FDA approval was granted under a NDA or 505(b) NDA versus an ANDA. Because our drugs used for the treatment of thyroid deficiency and our Morphine Sulfate Oral Solution product were both approved by the FDA as 505(b)(2) NDAs, they are considered “brand” drugs for purposes of the PPACA. Drugs purchased within the Medicare Part D coverage gap (commonly referred to as the “donut hole”) result in additional rebates. The Company estimates the reserve for rebates and other promotional credit programs based on the specific terms in each agreement when revenue is recognized. The reserve for rebates increases (decreases) as sales to certain wholesale and retail customers increase (decrease). However, since these rebate programs are not identical for all customers, the size of the reserve will depend on the mix of sales to customers that are eligible to receive rebates.
Returns
Consistent with industry practice, the Company has a product returns policy that allows customers to return product within a specified time period prior to and subsequent to the product’s expiration date in exchange for a credit to be applied to future purchases. The Company’s policy requires that the customer obtain pre-approval from the Company for any qualifying return. The Company estimates its provision for returns based on historical experience, changes to business practices, credit terms and any extenuating circumstances known to management. While historical experience has allowed for reasonable estimations in the past, future returns may or may not follow historical trends. The Company continually monitors the reserve for returns and makes adjustments when management believes that actual product returns may differ from the established reserve. Generally, the reserve for returns increases as net sales increase.
Other Adjustments
Other adjustments consist primarily of price adjustments, also known as “shelf-stock adjustments” and “price protections,” which are both credits issued to reflect increases or decreases in the invoice or contract prices of the Company’s products. In the case of a price decrease, a credit is given for product remaining in customer’s inventories at the time of the price reduction. Contractual price protection results in a similar credit when the invoice or contract prices of the Company’s products increase, effectively allowing customers to purchase products at previous prices for a specified period of time. Amounts recorded for estimated shelf-stock adjustments and price protections are based upon specified terms with direct customers, estimated changes in market prices and estimates of inventory held by customers. The Company regularly monitors these and other factors and evaluates the reserve as additional information becomes available. Other adjustments also include prompt payment discounts.
Inventories
Inventories are stated at the lower of cost or net realizable value determined by the first-in, first-out method. Inventories are regularly reviewed and write-downs for excess and obsolete inventory are recorded based primarily on current inventory levels and estimated sales forecasts.
Income Taxes
The Company uses the liability method to account for income taxes as prescribed by ASC 740, Income Taxes. Deferred taxes are recorded to reflect the tax consequences on future years of events that the Company has already recognized in the financial statement or tax returns. Deferred income tax assets and liabilities are adjusted to recognize the effect of changes in tax law or tax rates in the period during which the new law is enacted. Under ASC 740, Income Taxes, a valuation allowance is required when it is more likely than not that all or some portion of the deferred tax assets will not be realized through generating sufficient future taxable income. Failure to achieve forecasted taxable income in applicable tax jurisdictions could affect the ultimate realization of deferred tax assets and could result in an increase in the Company’s effective tax rate on future earnings.
The Company may recognize the tax benefit from an uncertain tax position claimed on a tax return only if it is more likely than not that the tax position will be sustained on examination by the taxing authorities, based on the technical merits of the position. The tax benefits recognized in the financial statements from such a position should be measured based on the largest benefit that has a greater than 50% likelihood of being realized upon ultimate settlement. The benefit from uncertain tax positions recorded in the financial statements was immaterial for all periods presented.
The Company’s future effective income tax rate is highly reliant on future projections of taxable income, tax legislation, and potential tax planning strategies. A change in any of these factors could materially affect the effective income tax rate of the Company in future periods.
Business Combinations
Acquired businesses are accounted for using the acquisition method of accounting, which requires that the assets acquired and liabilities assumed be recorded at the date of acquisition at their respective estimated fair values. The fair values and useful lives assigned to each class of assets acquired and liabilities assumed are based on, among other factors, the expected future period of benefit of the asset, the various characteristics of the asset and projected future cash flows. Significant judgment is employed in determining the assumptions utilized as of the acquisition date and for each subsequent measurement period. Accordingly, changes in assumptions described above could have a material impact on our consolidated results of operations.
Valuation of Long-Lived Assets, including Goodwill and Intangible Assets
The Company’s long-lived assets primarily consist of property, plant and equipment, definite and indefinite-lived intangible assets and goodwill.
Property, plant and equipment are stated at cost less accumulated depreciation. Depreciation is computed on a straight-line basis over the assets’ estimated useful lives, generally for periods ranging from 5 to 39 years. Definite-lived intangible assets are stated at cost less accumulated amortization and are amortized on a straight-line basis over the assets’ estimated useful lives, generally for periods ranging from 10 to 15 years. The Company continually evaluates the reasonableness of the useful lives of these assets.
Property, plant and equipment and definite-lived intangible assets are reviewed for impairment whenever events or changes in circumstances (“triggering events”) indicate that the carrying amount of the asset may not be recoverable. The nature and timing of triggering events by their very nature are unpredictable; however, management regularly considers the performance of an asset as compared to its expectations, industry events, industry and economic trends, as well as any other relevant information known to management when determining if a triggering event occurred.
If a triggering event is determined to have occurred, the first step in the impairment test is to compare the asset’s carrying value to the undiscounted cash flows expected to be generated by the asset. If the carrying value exceeds the undiscounted cash flows of the asset, then an impairment exists. An impairment loss is measured as the excess of the asset’s carrying value over its fair value, which in most cases is calculated using a discounted cash flow model. Discounted cash flow models are highly reliant on various assumptions which are considered Level 3 inputs, including estimates of future cash flows (including long-term growth rates), discount rates and the probability of achieving the estimated cash flows. The judgments made in determining the estimated fair value can materially impact our results of operations. There can be no assurances as to when, or if, future impairments may occur.
Goodwill and indefinite-lived intangible assets, including in-process research and development, are not amortized. Instead, goodwill and indefinite-lived intangible assets are tested for impairment annually during the fourth quarter of each fiscal year, or more frequently whenever events or triggering events indicate that the asset might be impaired. The Company utilizes a quantitative assessment to determine the fair value of our reporting unit (generic pharmaceuticals). If the net book value of our reporting unit exceeds its fair value, the difference will be recorded as a goodwill impairment, not to exceed the carrying amount of goodwill. The Company’s fair value assessments are highly reliant on various assumptions which are considered Level 3 inputs, including estimates of future cash flows (including long-term growth rates), discount rates and the probability of achieving the estimated cash flows. The judgments made in determining the estimated fair value of goodwill and indefinite-lived intangible asset can materially impact our results of operations. There can be no assurances as to when, or if, future impairments may occur. The Company has one reportable segment and one reporting unit, generic pharmaceuticals.
In-Process Research and Development
Acquired businesses are accounted for using the acquisition method of accounting. The acquisition purchase price is allocated to the net assets of the acquired business at their respective fair values. Amounts allocated to in-process research and development are recorded at fair value and are considered indefinite-lived intangible assets subject to the impairment testing in accordance with the Company’s impairment testing policy for indefinite-lived intangible assets as described above. As products in development are approved for sale, amounts will be allocated to product rights and will be amortized over their estimated useful lives. Definite-lived intangible assets are amortized over the expected life of the asset. The Company’s fair value assessments are highly reliant on various assumptions which are considered Level 3 inputs, including estimates of future cash flows (including long-term growth rates), discount rates and the probability of achieving the estimated cash flows. The judgments made in determining the estimated fair value of in-process research and development, as well as asset lives, can materially impact our results of operations. There can be no assurances as to when, or if, future impairments may occur.
Share-based Compensation
Share-based compensation costs are recognized over the vesting period, using a straight-line method, based on the fair value of the instrument on the date of grant less an estimate for expected forfeitures. The Company uses the Black-Scholes valuation model to determine the fair value of stock options, the stock price on the grant date to value restricted stock and the Monte-Carlo simulation model to determine the fair value of performance-based shares. The Black-Scholes valuation and Monte-Carlo simulation models include various assumptions, including the expected volatility, the expected life of the award, dividend yield and the risk-free interest rate.
Expected volatility is based on the historical volatility of the price of our common shares during the historical period equal to the expected term of the option. The Company uses historical information to estimate the expected term, which represents the period of time that options granted are expected to be outstanding. The risk-free rate for the period equal to the expected life of the option is based on the U.S. Treasury yield curve in effect at the time of grant. The forfeiture rate assumption is the estimated annual rate at which unvested awards are expected to be forfeited during the vesting period. This assumption is based on our actual forfeiture rate on historical awards. Periodically, management will assess whether it is necessary to adjust the estimated rate to reflect changes in actual forfeitures or changes in expectations. Additionally, the expected dividend yield is equal to zero, as the Company has not historically issued and has no immediate plans to issue, a dividend. These assumptions involve inherent uncertainties based on market conditions which are generally outside the Company’s control. Changes in these assumptions could have a material impact on share-based compensation costs recognized in the financial statements.
Recent Accounting Pronouncements
In May 2014, the Financial Accounting Standards Board (“FASB”) issued ASU 2014-09, Revenue from Contracts with Customers. The core principle of the guidance is that an entity should recognize revenue to depict the transfer of promised goods or services to customers in an amount that reflects the consideration to which the entity expects to be entitled in exchange for those goods or services. The authoritative guidance is effective for annual reporting periods beginning after December 15, 2017. Based on a review of the contracts representing a substantial portion of our revenues, the Company does not expect the guidance to have a material impact on our disclosures or the timing and recognition of our revenues. The majority of the Company’s revenues is generated from product sales and based on the Company’s initial assessment, it currently does not anticipate a material impact to the revenue and disclosures related to these arrangements. Under the new standard, the Company will need to estimate certain amounts as variable consideration at the point of product sale in future periods. The Company does not anticipate a material impact on revenue related to these variable amounts which need to be estimated earlier under the new standard.
The new revenue standard will also impact the timing of the Company’s revenue recognition by requiring recognition of certain contract manufacturing arrangements to move from upon shipment or delivery to over-time. However, the recognition of these arrangements over-time is not expected to have a material impact on the Company’s consolidated results of operations or financial position.
The Company is finalizing the establishment and documentation of key accounting policies, conducting training and education throughout the organization, and evaluating impacts on business processes, information technology, and controls resulting from the adoption of this new standard. The Company also continues to accumulate the necessary information to determine the cumulative effects of the accounting change to be recorded upon adoption of the guidance, but the magnitude of this adjustment is not expected to be material. The Company intends to use the modified retrospective approach upon implementation with the cumulative effect of applying the standard recognized at the date of initial application.
In November 2015, the FASB issued ASU 2015-17, Income Taxes — Balance Sheet Classification of Deferred Taxes. ASU 2015-17 requires all deferred tax assets and liabilities to be classified as noncurrent on the balance sheet. The guidance may be applied either prospectively or retrospectively. The guidance became effective for the Company in the first quarter of Fiscal 2018. Accordingly, the Company currently presents all deferred tax assets and liabilities as noncurrent on the balance sheet. All prior period amounts have also been reclassified to conform with the current year presentation.
In February 2016, the FASB issued ASU 2016-02, Leases. ASU 2016-02 requires an entity to recognize right-of-use assets and liabilities on its balance sheet for all leases with terms longer than 12 months. Lessees and lessors are required to disclose quantitative and qualitative information about leasing arrangements to enable a user of the financial statements to assess the amount, timing and uncertainty of cash flows arising from leases. ASU 2016-02 is effective for annual reporting periods beginning after December 15, 2018, including interim periods within that reporting period and requires a modified retrospective application, with early adoption permitted. The Company is currently in the process of assessing the impact this guidance will have on the consolidated financial statements.
In August 2016, the FASB issued ASU 2016-15, Statement of Cash Flows — Classification of Certain Cash Receipts and Cash Payments. ASU 2016-15 addresses how certain cash receipts and cash payments are presented and classified in the statement of cash flows. ASU 2016-15 is effective for annual reporting periods, and interim periods therein, beginning after December 15, 2017. The Company is currently in the process of assessing the impact this guidance will have on the consolidated financial statements.
ITEM 7A. QUANTITATIVE AND QUALITATIVE DISCLOSURES ABOUT MARKET RISK
On November 25, 2015, in connection with the acquisition of KUPI, the Company entered into a Senior Secured Credit Facility, which was subsequently amended in June 2016. Based on the variable-rate debt outstanding at June 30, 2018, each 1/8% increase in interest rates would yield $1.1 million of incremental annual interest expense.
The Company has historically invested in equity securities, U.S. government agency securities and corporate bonds, which are exposed to market and interest rate fluctuations. The market value, interest and dividends earned on these investments may vary based on fluctuations in interest rate and market conditions.
ITEM 8. FINANCIAL STATEMENTS AND SUPPLEMENTARY DATA
The Consolidated Financial Statements and Report of the Independent Registered Public Accounting Firm is set forth in Item 15 of this Annual Report on Form 10-K under the caption “Consolidated Financial Statements” and incorporated herein by reference.
ITEM 9. CHANGES IN AND DISAGREEMENTS WITH ACCOUNTANTS ON ACCOUNTING AND FINANCIAL DISCLOSURE
None.
ITEM 9A. CONTROLS AND PROCEDURES
Disclosure Controls and Procedures
We carried out an evaluation under the supervision and with the participation of our management, including our chief executive officer and chief financial officer, of the effectiveness of the design and operation of our disclosure controls and procedures, as such term is defined under Rule 13a-15(e) promulgated under the Exchange Act, as amended, for financial reporting as of June 30, 2018. Based on that evaluation, our chief executive officer and chief financial officer concluded that these controls and procedures are effective to ensure that information required to be disclosed by the Company in reports that it files or submits under the Exchange Act is recorded, processed, summarized and reported as specified in SEC rules and forms and is accumulated and communicated to our management to allow timely decisions regarding required disclosures. There were no changes in these controls or procedures identified in connection with the evaluation of such controls or procedures that occurred during our last fiscal quarter, or in other factors that have materially affected, or are reasonably likely to materially affect these controls or procedures.
Our disclosure controls and procedures are designed to ensure that information required to be disclosed by us in the reports that we file or submit under the Exchange Act is recorded, processed, summarized and reported, within the time periods specified in the rules and forms of the Securities and Exchange Commission. These disclosure controls and procedures include, among other things, controls and procedures designed to ensure that information required to be disclosed by us in the reports that we file under the Exchange Act is accumulated and communicated to our management, including our chief executive officer and chief financial officer, as appropriate to allow timely decisions regarding required disclosure.
Management’s Report on Internal Control over Financial Reporting
The report of management of the Company regarding internal control over financial reporting is set forth in Item 15 of this Annual Report on Form 10-K under the caption “Consolidated Financial Statements: Management’s Report on Internal Control Over Financial Reporting “and incorporated herein by reference.
Attestation Report of Independent Registered Public Accounting Firm
The attestation report of the Company’s independent registered public accounting firm regarding internal control over financial reporting is set forth in Item 15 of this Annual Report on Form 10-K under the caption “Consolidated Financial Statements: Report of Independent Registered Public Accounting Firm” and incorporated herein by reference.
Changes in Internal Control over Financial Reporting
During the quarter ended June 30, 2018, there were no changes in the Company’s internal control over financial reporting (as defined in Rule 13a-15(f) of the Exchange Act) that materially affected, or are reasonably likely to materially affect, the Company’s internal control over financial reporting.
None.
ITEM 10. DIRECTORS, EXECUTIVE OFFICERS AND CORPORATE GOVERNANCE
Directors and Executive Officers
The directors and executive officers of the Company are set forth below:
|
|
|
Age |
|
Position |
|
Directors: |
|
|
|
|
|
|
|
|
|
|
|
Patrick G. LePore |
|
63 |
|
Chairman of the Board |
|
|
|
|
|
|
|
John C. Chapman |
|
63 |
|
Director |
|
|
|
|
|
|
|
Timothy C. Crew |
|
57 |
|
Director |
|
|
|
|
|
|
|
David Drabik |
|
50 |
|
Director |
|
|
|
|
|
|
|
Jeffrey Farber |
|
57 |
|
Director |
|
|
|
|
|
|
|
James M. Maher |
|
65 |
|
Director |
|
|
|
|
|
|
|
Albert Paonessa, III |
|
58 |
|
Director |
|
|
|
|
|
|
|
Paul Taveira |
|
58 |
|
Director |
|
|
|
|
|
|
|
Officers: |
|
|
|
|
|
|
|
|
|
|
|
Timothy C. Crew |
|
57 |
|
Chief Executive Officer |
|
|
|
|
|
|
|
Martin P. Galvan |
|
66 |
|
Vice President of Finance and Chief Financial Officer |
|
|
|
|
|
|
|
John M. Abt |
|
53 |
|
Vice President and Chief Quality Operations Officer |
|
|
|
|
|
|
|
Maureen M. Cavanaugh |
|
58 |
|
Senior Vice President and Chief Commercial Operations Officer |
|
|
|
|
|
|
|
Robert Ehlinger |
|
60 |
|
Vice President and Chief Information Officer |
|
|
|
|
|
|
|
Samuel H. Israel |
|
56 |
|
General Counsel and Chief Legal Officer |
|
|
|
|
|
|
|
John Kozlowski |
|
46 |
|
Chief of Staff and Strategy Officer |
Patrick G. LePore was appointed as a Director of the Company in July 2017. Mr. LePore served as chairman, Chief Executive Officer and president of Par Pharmaceuticals, Inc., until the company’s acquisition by private equity investor TPG in 2012. He remained as chairman of the new company where he led the sale of the company to Endo Pharmaceuticals. LePore began his career with Hoffmann LaRoche. Later, he founded Boron LePore and Associates, a medical communications company, which he took public and was eventually sold to Cardinal Health. He is a member of the board of directors of PharMerica and Innoviva, and is a trustee of Villanova University. LePore earned his bachelor’s degree from Villanova University and Master of Business Administration from Fairleigh Dickinson University.
The Governance and Nominating Committee concluded that Mr. LePore is well qualified and should be nominated to serve as a Director due, in part, to his understanding and experience as a Chief Executive Officer and Director of highly regarded companies within the pharmaceutical industry. Mr. LePore is an independent director as defined by the rules of the NYSE.
John C. Chapman was appointed as a Director of the Company in July 2018. Mr. Chapman is a retired audit partner for KPMG, having specialized in providing audit services to large complex multinational pharmaceutical and consumer market companies. During his tenure at KPMG, he served for six years as a member of the firm’s board of directors and for several years as KPMG’s global chair of pharmaceuticals and chemicals. Mr. Chapman also served as global lead partner for some of KPMG’s largest clients, including Pfizer, Hoechst and PepsiCo, among others. Mr. Chapman, a certified public accountant (CPA), earned a Bachelor of Business Administration in accounting practice degree from Pace University, New York. On August 21, 2018, Mr. Chapman was appointed as Chairman of the Audit Committee, effective upon filing of the Company’s Fiscal 2018 consolidated financial statements.
The Governance and Nominating Committee concluded that Mr. Chapman is well qualified and should be nominated to serve as a Director, due to his extensive experience in the public accounting profession. Additionally, Mr. Chapman has significant experience in dealing with acquisitions, divestitures, initial public offerings and secondary offerings. Mr. Chapman is an independent director as defined by the rules of the NYSE.
Timothy C. Crew was appointed as the Company’s Chief Executive Officer in January 2018. Mr. Crew has more than 25 years of experience in the generic and branded pharmaceutical industries. Previously, he served as Chief Executive Officer of Cipla North America, a global pharmaceutical company based in Mumbai, India. Before Cipla, he worked for eight years at Teva Pharmaceuticals Industries Ltd. (“Teva”), where he ultimately served as Senior Vice President and Commercial Operating Officer of the North American Generics division, the world’s largest generic operation with multibillion dollars of annual sales. Before that, he was Teva’s Vice President, Alliances and Business Development. Mr. Crew was also an Executive Vice President, North America, for Dr. Reddy’s Laboratories Ltd. Mr. Crew began his pharmaceutical career at Bristol-Myers Squibb, where he held a number of senior management positions in global marketing, managed healthcare, marketing, business development and strategic planning. Prior to his pharmaceutical roles, Mr. Crew served in the United States Army, where he rose to the rank of Captain. Mr. Crew earned a Bachelor of Arts degree in economics from Pomona College and a Masters of Business Administration degree from Columbia Business School.
The Governance and Nominating Committee concluded that Mr. Crew is well qualified and should be nominated to serve as a Director due, in part, to his understanding and experience as a Chief Executive Officer and Director of highly regarded companies within the pharmaceutical industry.
David Drabik was elected a Director of the Company in January 2011. Mr. Drabik is a National Association of Corporate Directors Governance Fellow. Since 2002, Mr. Drabik has been President of Cranbrook & Co., LLC (“Cranbrook”), an advisory firm primarily serving the private equity and venture capital community. At Cranbrook, Mr. Drabik assists and advises its clientele on originating, structuring and executing private equity and venture capital transactions. From 1995 to 2002, Mr. Drabik served in various roles and positions with UBS Capital Americas (and its predecessor UBS Capital LLC), a New York City based private equity and venture capital firm that managed $1.5 billion of capital. From 1992 to 1995, Mr. Drabik was a banker with Union Bank of Switzerland’s Corporate and Institutional Banking division in New York City. Mr. Drabik graduated from the University of Michigan with a Bachelor of Business Administration degree.
The Governance and Nominating Committee concluded that Mr. Drabik is well qualified and should be nominated to serve as a Director due, in part, to his understanding and involvement in investment banking. As a global investment bank professional with extensive experience advising senior management, his skills include business analytics, financing and a strong familiarity with SEC documentation. Mr. Drabik is an independent director as defined by the rules of the NYSE.
Jeffrey Farber was appointed a Director of the Company in May 2006 and was appointed Chairman of the Board of Directors in July 2012. On July 2018, Patrick LePore succeeded Jeffrey Farber as the Chairman of the Board. Jeffrey Farber joined the Company in August 2003 as Secretary. Since 1994, Mr. Farber has been President and the owner of Auburn Pharmaceutical (“Auburn”), a national generic pharmaceutical distributor. Prior to starting Auburn, Mr. Farber served in various positions at Major Pharmaceutical (“Major”), where he was employed for over 15 years. At Major, Mr. Farber was involved in sales, purchasing and eventually served as President of the Midwest division. Mr. Farber also spent time working at Major’s manufacturing division, Vitarine Pharmaceuticals, where he served on its Board of Directors. Mr. Farber graduated from Western Michigan University with a Bachelors of Science Degree in Business Administration and participated in the Pharmacy Management Graduate Program at Long Island University.
The Governance and Nominating Committee concluded that Mr. Farber is qualified and should continue to serve, due, in part, to his significant experience in the generic drug industry and his ongoing role as the owner of a highly regarded and successful generic drug distributor. His skills include a thorough knowledge of the generic drug marketplace and drug supply chain management.
James M. Maher was appointed as a Director of the Company in June 2013. He spent his entire 37 year professional career with PricewaterhouseCoopers (PwC) LLP, including 27 years as a partner, before retiring in June 2012. Most recently, Maher served as the managing partner of PwC’s U.S. assurance practice, comprised of more than 1,100 partners and 12,000 staff. Previously, he served as the regional assurance leader for the metro assurance practice. During his tenure at PwC, Maher worked closely with senior management at several multinational companies, dealing extensively with significant acquisitions, divestitures, initial public offerings and secondary offerings. Maher earned a bachelor’s degree in Accounting from LIU Post. On April 30, 2018, the Company announced that Mr. Maher will step down from the Board upon the completion of the filing of the Fiscal 2018 financial statements.
The Governance and Nominating Committee concluded that Mr. Maher is well qualified and should be nominated to serve as a Director, due to his extensive experience in the public accounting profession. Additionally, Mr. Maher has significant experience in dealing with acquisitions, divestitures, initial public offerings and secondary offerings. Mr. Maher is an independent director as defined by the rules of the NYSE.
Albert Paonessa, III was appointed as a Director of the Company in July 2015. In May 2017, Mr. Paonessa was appointed the Chief Executive Officer of KeySource Medical, a generic distributor (“KeySource”). Prior to that, Mr. Paonessa served as the President of Anda, Inc., the fourth largest distributor of generic drugs in the U.S., for over 10 years until January 2015. He previously served as Anda’s Senior Vice President of Sales and before that as Vice President of IT. Earlier, Mr. Paonessa was Vice President of Operations for VIP Pharmaceuticals, which was acquired by Anda’s parent company Andrx, in 2000. Mr. Paonessa earned a Bachelor of Arts degree in Interpersonal Communications from Bowling Green State University.
The Governance and Nominating Committee concluded that Mr. Paonessa is well qualified and should be nominated to serve as a Director due, in part, to his significant experience in different executive roles within the generic pharmaceutical industry. Additionally, Mr. Paonessa has a strong operational and technical background, especially in the areas of sales, IT, planning and budgeting and business development.
Paul Taveira was appointed a Director of the Company in May 2012. Mr. Taveira has been Chief Executive Officer of the National Response Corporation, an international firm specializing in environmental services, since June 2015. He previously served on the Board of Directors and as the Chief Executive Officer of A&D Environmental Services Inc., an environmental and industrial services company. From 2007 to 2009, Mr. Taveira was a Managing Partner of Precision Source LLC, a manufacturer of precision parts for various industries across the United States. From 1997 to 2007, Mr. Taveira held several positions at PSC Inc., a national provider of environmental services, including President, Vice President and Regional General Manager. From 1987 to 1997, Mr. Taveira held several management positions with Clean Harbors Inc., an international provider of environmental and energy services. Mr. Taveira graduated from Worcester State University with a Bachelor of Science degree in Biology.
The Governance and Nominating Committee concluded that Mr. Taveira is well qualified and should be nominated to serve as a Director due, in part, to his understanding and experience as a Chief Executive Officer and Director of various companies. Mr. Taveira is an independent director as defined by the rules of the NYSE.
Martin P. Galvan, CPA was appointed as the Company’s Vice President of Finance and Chief Financial Officer in August 2011. Most recently, he was Chief Financial Officer of CardioNet, Inc., a medical technology and service company. From 2001 to 2007, Mr. Galvan was employed by Viasys Healthcare Inc., a healthcare technology company that was acquired by Cardinal Health, Inc. in June 2007. Prior to the acquisition, he served as Executive Vice President, Chief Financial Officer and Director Investor Relations. From 1999 to 2001, Mr. Galvan served as Chief Financial Officer of Rodel, Inc., a precision surface technologies company in the semiconductor industry. From 1979 to 1998, Mr. Galvan held several positions with Rhone-Poulenc Rorer Inc., a pharmaceutical company, including Vice President, Finance — The Americas; President & General Manager, RPR Mexico & Central America; Vice President, Finance, Europe/Asia Pacific; and Chief Financial Officer, United Kingdom & Ireland. Mr. Galvan began his career with the international accounting firm Ernst & Young LLP. He earned a Bachelor of Arts degree in economics from Rutgers University and is a member of the American Institute of Certified Public Accountants.
John M. Abt joined the Company in March 2015 as Vice President of Quality and was promoted to Vice President and Chief Quality and Operations Officer in April 2018. Prior to joining the Company, Mr. Abt held senior level positions in both quality and operations and has extensive knowledge in pharmaceutical manufacturing, quality, strategy, business improvement and site transformation. Prior to joining the Company, he most recently served as Teva Pharmaceuticals’ Vice President Global Quality Strategy, overseeing the development and implementation of strategy and associated initiatives for the global quality organization. Before that, he held a number of leadership positions of increasing responsibility in operations, continuous improvement, quality systems and compliance. He earned his Doctorate in Business Administration from Temple University, Masters of Administrative Science in Business Management from Johns Hopkins University and a Bachelor of Science in Biochemistry from Niagara University.
Maureen M. Cavanaugh joined the Company in May 2018 as Senior Vice President and Chief Commercial Operations Officer. Prior to joining the Company, Ms. Cavanaugh spent the past 11 years at Teva, most recently as Senior Vice President, Chief Commercial Officer, North American Generics. Earlier at Teva, Ms. Cavanaugh served as Senior Vice President and General Manager, US Generics and before that held a variety of positions in sales, marketing and customer operations. Ms. Cavanaugh also previously served as Senior Director of Marketing at PAR Pharmaceuticals, as Director, Product Management and Marketing Research at Sandoz Inc., and held a number of finance, sales and marketing operations positions at Bristol Myers-Squibb. Ms. Cavanaugh earned a Bachelor of Science in Business Administration degree from LaSalle University and a Masters of Business Administration degree from Rider University.
Robert Ehlinger joined the Company in July 2006 as Chief Information Officer. In June 2011, Mr. Ehlinger was promoted to Vice President of Logistics and Chief Information Officer. Prior to joining Lannett, Mr. Ehlinger was the Vice President of Information Technology at MedQuist, Inc., a healthcare services provider, where his career spanned 10 years in progressive operational and technology roles. Prior to MedQuist, Mr. Ehlinger was with Kennedy Health Systems as their Corporate Director of Information Technology supporting acute care and ambulatory care health information systems and biomedical support services. Earlier on, Mr. Ehlinger was with Dowty Communications where he held various technical and operational support roles prior to assuming the role of International Distribution Sales Executive managing the Latin America sales distribution channels. Mr. Ehlinger received a Bachelor’s of Arts degree in Physics from Gettysburg College in Gettysburg, PA.
Samuel H. Israel joined in the Company in July 2017 as General Counsel and Chief Legal Officer. Prior to joining Lannett, Mr. Israel was a partner with Fox Rothschild LLP, a national, full-service law firm, with 22 offices that provide services in more than 60 practice areas, since 1998. He served as chair of the firm’s Pharmaceutical and Biotechnology Practice and handled a variety of commercial litigation matters. Mr. Israel earned a bachelor of science degree in chemical engineering from the University of Pennsylvania and a juris doctor degree with honors from Rutgers University School of Law.
John Kozlowski joined the Company in 2009 as Corporate Controller and was promoted in 2016 to Vice President Financial Operations & Corporate Controller. In April 2018, Mr. Kozlowski was promoted to Chief of Staff and Strategy Officer. In October 2017, Mr. Kozlowski was promoted to Chief Operating Officer. Prior to joining the Company, Mr. Kozlowski served in senior finance and accounting roles for Optium Corporation and Finisar Australia. He earned a Bachelor of Arts degree in finance from James Madison University and a Masters of Business Administration degree from Rider University.
To the best of the Company’s knowledge, there have been no events under any bankruptcy act, no criminal proceedings and no judgments or injunctions that are material to the evaluation of the ability or integrity of any director, executive officer, or significant employee during the past ten years.
Section 16(a) Beneficial Ownership Reporting Compliance
Section 16(a) of the Securities Exchange Act of 1934 requires the Company’s directors, officers and persons who own more than 10% of a registered class of the Company’s equity securities to file with the SEC reports of ownership and changes in ownership of common stock and other equity securities of the Company. Officers, directors and greater-than-10% stockholders are required by SEC regulations to furnish the Company with copies of all Section 16(a) forms they file.
Based solely on review of the copies of such reports furnished to the Company or written representations that no other reports were required, the Company believes that during Fiscal 2018 all filing requirements applicable to its officers, directors and greater-than-10% beneficial owners under Section 16(a) of the Exchange Act were complied with in a timely manner.
Code of Ethics
The Company has adopted the Code of Professional Conduct (the “code of ethics”), a code of ethics that applies to the Company’s Chief Executive Officer and Chief Financial Officer, as well as all other company personnel. The code of ethics is publicly available on our website at www.lannett.com. If the Company makes any substantive amendments to the code of ethics or grants any waiver, including any implicit waiver, from a provision of the code to our Chief Executive Officer, Chief Financial Officer, or any other executive, we will disclose the nature of such amendment or waiver on our website or in a report on Form 8-K.
Audit Committee
The Audit Committee has responsibility for overseeing the Company’s financial reporting process on behalf of the Board. In addition, Audit Committee responsibilities include selection of the Company’s independent auditors, conferring with the independent auditors regarding their audit of the Company’s consolidated financial statements, pre-approving and reviewing the independent auditors’ fees and considering whether non-audit services are compatible with maintaining their independence and considering the adequacy of internal financial controls. The Audit Committee operates pursuant to a written charter adopted by the Board, which is available on the Company’s website at www.lannett.com. The charter describes the nature and scope of the Audit Committee’s responsibilities. The members of the Audit Committee consist of Paul Taveira, David Drabik, John Chapman and James M. Maher. All members of the Audit Committee are independent directors as defined by the rules of the NYSE.
Financial Expert on Audit Committee: The Board has determined that John Chapman and James M. Maher, current director and Chairman of the Audit Committee, are the Audit Committee financial experts as defined in section 3(a)(58) of the Exchange Act and the related rules of the Commission for the year ended June 30, 2018.
ITEM 11. EXECUTIVE COMPENSATION
Compensation Discussion and Analysis
This Compensation Discussion and Analysis (“CD&A”) describes our 2018 Executive Compensation Program. It provides an overview of the compensation program for the following Named Executive Officers (“NEOs”) and how the Compensation Committee of the Board of Directors (“the Committee”) made its decisions for our 2018 fiscal year.
|
NEO |
|
Title/Role |
|
Timothy C. Crew |
|
Chief Executive Officer (“CEO”) |
|
Martin P. Galvan |
|
Vice President of Finance and Chief Financial Officer |
|
Samuel H. Israel |
|
Chief Legal Officer and General Counsel |
|
John Kozlowski |
|
Chief of Staff and Strategy Officer |
|
John Abt |
|
Vice President and Chief Quality Operations Officer |
|
Arthur P. Bedrosian |
|
Former Chief Executive Officer* |
|
Kevin Smith |
|
Former Senior Vice President of Sales ** |
* Mr. Bedrosian departed the Company effective December 31, 2017
** Mr. Smith departed the Company effective June 30, 2018
Say on Pay Results in 2018
At our annual shareholders meeting in January 2012, our shareholders supported a triennial cycle for “say-on-pay” advisory votes relating to our Executive Compensation Program for NEOs. As a result, we held “say on pay” votes every three years, including 2012, 2015, and 2018. At our annual shareholders meeting in January 2018, our shareholders approved the “say-on-pay” proposal, with 72% of votes cast in support of our executive compensation program. This level of shareholder support was lower than historical levels (approximately 99% in 2012 and 96% in 2015). At the January 2018 meeting, the majority of our shareholders also supported an annual frequency for future “say on pay” advisory votes. As a result, we will conduct annual advisory votes going forward.
Although this vote is non-binding, its outcome, along with shareholder feedback and the competitive business environment, plays an important role in how the Committee makes decisions about the program’s structure. To this end, during the past few years, the Committee conducted periodic reviews of the Executive Compensation Program, monitored industry practices and sought feedback from some of our largest investors.
While most shareholders supported our 2018 say on pay proposal, a concern was raised by certain shareholder advisory groups regarding a provision within Mr. Crew’s employment agreement allowing for severance benefits upon a voluntary termination within thirty days following a Change in Control of the Company. This “walk away” provision was originally included in the agreement to help entice Mr. Crew, a highly experienced industry executive who has served in key leadership roles at several large global pharmaceutical organizations, to join the Company. In response to the relatively low shareholder support level for the 2018 say on pay vote, Mr. Crew’s employment agreement was amended in March 2018 to remove the “walk away” provision from the definition of a “Good Reason” voluntary resignation.
Our executive compensation program includes a significant emphasis on variable incentives to align pay with performance and long-term shareholder value creation. No short-term incentives or annual equity grants were earned in Fiscal 2017 and short-term incentives and equity grants for Fiscal 2018 were well-below target levels based on actual vs. planned Company performance. Our long-term incentive program for NEOs and other executives is entirely performance-based, with no grants of stock options or restricted stock unless minimum performance thresholds are achieved. Beginning in Fiscal 2018, our NEOs also receive performance shares tied to the Company’s three-year total shareholder returns relative to companies in the S&P Pharmaceuticals Select Industry Index. After giving consideration to the 2018 say-on-pay vote and shareholder feedback, the Compensation Committee decided to increase the weighting on performance shares from 25% of the total target long-term incentive award opportunity for NEOs to 33.3% for the Fiscal 2019 program, while also maintaining the performance requirements for stock option and restricted stock grants. We believe these actions demonstrate our responsiveness to shareholder concerns and our ongoing commitment to aligning executive pay with performance and long-term value creation.
The following pages of this CD&A highlight performance results since Fiscal 2015 that have had a direct impact on the compensation paid to our NEOs over the same period of time. It looks specifically at the performance measures used in the short- and long-term incentive awards under the Executive Compensation Program that the Committee believes drive shareholder value. It also describes recently approved changes for Fiscal 2019 to further align our Executive Compensation Program with our objectives and best competitive practice.
A Word About Risk
The Committee believes that incentive plans, along with the other elements of the Executive Compensation Program, provide appropriate rewards to our NEOs to keep them focused on our goals. The Committee also believes that the program’s structure, along with its oversight, continues to provide a setting that does not encourage the NEOs to take excessive risks in their business decisions.
Executive Summary
Business Highlights
Fiscal 2018 was a year of transition for the Company, including the appointment of a new CEO, General Counsel, Chief Commercial Officer, and Chief of Staff, as well as several other new executive hires. We also added two new non-employee directors to the Board in Fiscal 2018 or early Fiscal 2019 and appointed a new Board Chairman, effective July 1, 2018. Under the leadership of Mr. Crew and the Board of Directors, the Company also established a new strategy focused on growing our core business, building our R&D pipeline, and expanding strategic alliances. These actions take on heightened importance given the recently announced non-renewal of our product distribution agreement with Jerome Stevens Pharmaceuticals, Inc. (“JSP”), which accounts for a significant portion of our current revenues and will expire on March 23, 2019. Our leadership team and Board are focused on executing our strategy, streamlining our operations, and developing new products and alliances to diversify and enhance our revenue streams. We believe these actions will better position the Company for long-term profitable growth and shareholder value creation. As discussed below, the Company is executing on a number of key strategic initiatives and continuing to operate profitably despite ongoing challenging market conditions within the generic pharmaceuticals industry.
The Company achieved a number of strategic milestones in Fiscal 2018, including the ongoing success related to the integration of the Kremers Urban Pharmaceuticals Inc. (“KUPI”) acquisition, which closed in November 2015 and significantly increased our product portfolio and scope of operations. We also continued to execute on our 2016 Restructuring Plan, which resulted in the realization of transaction-related synergies. As noted above, we recruited a new CEO and expanded our executive leadership team and capabilities. In addition, we continued to reduce debt and strengthen our balance sheet. We recently initiated a restructuring and cost reduction plan for our Cody Laboratories subsidiary with targeted annualized cost savings of $10 million by the end of December 2018. After several years of extraordinary performance through Fiscal 2015, our profitability and total shareholder return results were lower in Fiscal 2016 and 2017, primarily due to competitive pressures in the generic pharmaceutical market from consolidation among the largest chains and wholesalers into consortium purchasing groups, which resulted in lower average selling prices for our products. While profitability improved in Fiscal 2018, results were below budgeted goals, which adversely impacted executive pay levels as discussed further below. Our total shareholder return continued to decline in Fiscal 2018, as was the case for many of our peers. As a result, most outstanding stock options held by our NEOs are currently “underwater” and the value of most other outstanding equity awards are well below grant date target values.
In addition, we continued to make important advances in product development and mix, market share, and in our regulatory approval process, allowing us to efficiently and safely place our products that span a variety of categories on the market. We launched 8 new products during Fiscal 2018, with additional launches planned in Fiscal 2019. As of June 30, 2018, we had over 100 products available to the market, with a significant number of Abbreviated New Drug Applications (“ANDAs”) pending regulatory approval. We also continue to capitalize on our strategic partnerships, both domestically and internationally. In Fiscal 2018, we acquired more than 20 products and entered into several new strategic alliance agreements which diversified and enhanced our revenue streams.
Key financial performance highlights, as reported in accordance with GAAP requirements, are shown below. See the section of our Form 10-K entitled “Management’s Discussion and Analysis of Financial Condition and Results of Operations” for additional details and discussion of Company performance.
|
|
|
|
|
|
|
|
|

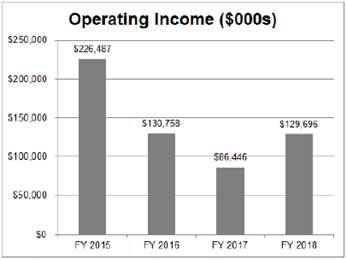
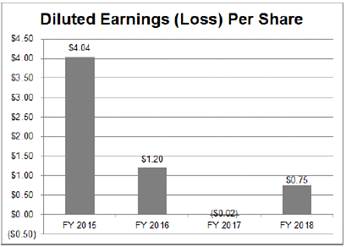

†Peer Group average pertains to the Fiscal 2018 peer group.
Comparison of Target Versus Actual CEO Pay (In Year Earned)
The following chart compares actual versus target CEO pay for the past three fiscal years. To more accurately demonstrate the impact of Company performance on executive pay, comparisons include annual equity grants in the year earned, as opposed to the year granted. Values for fiscal years 2016 and 2017 pertain to Mr. Bedrosian, our former CEO. Values for Fiscal 2018 pertain to Mr. Crew, and include annualized base salaries and short-term incentives (STI). Actual pay for Mr. Crew includes long-term incentives granted in Fiscal 2019 based on Fiscal 2018 performance and is shown with and without new hire equity grant values. As shown below, actual pay levels over the past 3 years were well below target opportunities, even when one-time awards are included. Based on full-year annualized cash compensation for Mr. Crew, actual pay equals 66% of target including new hire grants and 44% of target excluding these one-time grants.
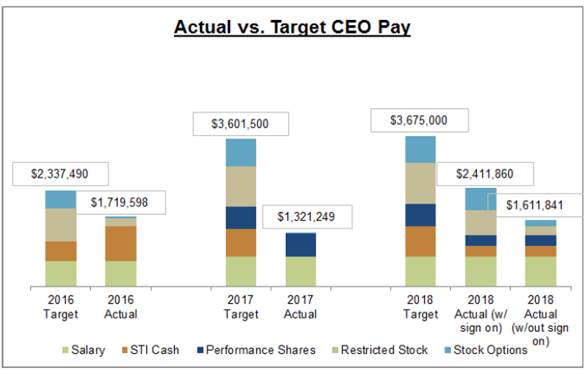
Fiscal 2018 Executive Compensation Program Changes
As our Company grows, the Committee is committed to the evolution and improvement of our Executive Compensation Program to ensure alignment with our business strategy and shareholder interests, as well as best competitive practices. The Committee made the following adjustments to the program’s core compensation elements for 2018:
|
What’s Changed |
|
How It’s Changed |
|
Explanation |
|
Short-Term Incentives (“Annual Bonus”) |
|
· Increased the target award opportunity for the CEO from 90% of salary to 100% of salary, to improve pay competitiveness. · Increased the weighting on the strategic / individual objectives component from 10% to 20% of the total target award opportunity. |
|
No changes were made to performance metrics. The weighting on the strategic / individual component was increased to further emphasize key strategic objectives such as product launches. The target award opportunity for the CEO was increased to position target annual cash compensation more in line with 50th percentile market values. |
|
Long-Term Incentives |
|
· Performance shares tied to our 3-year relative total shareholder return vs. a market index were granted for the first time in Fiscal 2018. · Grant levels for stock options and restricted stock will continue to be tied to Company performance and can range from 0% to 150% of target awards based on actual results versus pre-established goals. |
|
No change made to award opportunities, award vehicles, or mix. The Committee continued to link equity grant levels to Company performance, including financial results and multi-year total shareholder return, to strengthen alignment with shareholder interests. |
Our Commitment to Sound Corporate Governance
In order to align our executive compensation program with long-term shareholder interests, we have adopted a variety of sound corporate governance practices, as illustrated in the following table:
|
What We Do |
|
What We Don’t Do |
|
· Emphasize variable incentives to align pay with performance |
|
· Provide multi-year pay guarantees within employment agreements |
|
· Tie incentive compensation to multiple performance metrics that reinforce key business objectives |
|
· Allow stock option repricing without shareholder approval |
|
· Place primary emphasis on equity compensation to align executive and shareholder interests |
|
· Permit stock hedging or pledging activities |
|
· Use stock ownership guidelines for executive officers and non-employee directors |
|
· Provide uncapped incentive awards |
|
· Maintain a clawback policy allowing for the recoupment of excess compensation in the event of a material financial restatement and fraud or misconduct |
|
· Pay tax gross-ups on any awards |
|
· Engage an independent compensation consultant to advise the Compensation Committee |
|
· Provide excessive executive perquisites |
Overview of the Executive Compensation Program
Our Philosophy
A fundamental objective of our Executive Compensation Program is to focus our executives on creating long-term shareholder value — all aspects of our program are rooted in this goal and designed around the following guiding principles:
· Pay for performance: A significant portion of compensation should be variable and directly linked to corporate and individual performance goals and results.
· Competitiveness: Compensation should be sufficiently competitive to attract, motivate and retain an executive team fully capable of driving exceptional performance.
· Alignment: The interests of executives should be aligned with those of our shareholders through equity-based compensation and performance measures that help to drive shareholder value over the long term.
To support these guiding principles, our program includes the following compensation elements:
|
Pay Element |
|
Form |
|
Purpose |
|
Base Salary |
|
Cash |
|
Provides a competitive level of compensation that reflects position responsibilities, strategic importance of the position and individual experience. |
|
Short-Term Incentives (Annual Bonus) |
|
Cash |
|
Provides a cash-based award that recognizes the achievement of corporate goals in support of the annual business plan, as well as specific, qualitative and quantitative individual goals for the most recently completed fiscal year. |
|
Long-Term Incentives |
|
Equity |
|
Provides incentives for management to execute on financial and strategic goals that drive long-term shareholder value creation and support the Company’s retention strategy. |
Target Compensation Mix
The charts below show that most of our NEO’s target compensation for Fiscal 2018 is variable (80% for our CEO and an average of 69% for our other NEOs). Variable pay includes the target value of short-term cash incentives (“STI”), performance shares, stock options, and restricted stock.
|
|
|


Based upon Fiscal 2018 compensation as reported in the Summary Compensation Table on page 78 of this Form 10-K, variable pay represents 72% of total pay for our CEO and 51% of average total pay for our other NEOs. This mix reflects below-Target annual incentives earned in Fiscal 2018 under the Annual Bonus Plan (shown as STI), target performance share grants in Fiscal 2018, no regular stock option or restricted stock grants in Fiscal 2018 based on Fiscal 2017 Company performance, modest one-time modest stock option retention grants to 3 NEOs (excluding Messrs. Crew and Kozlowski), and one-time equity grants to newly-hired or promoted NEOs.
|
|
|
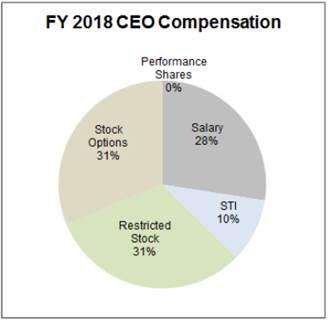
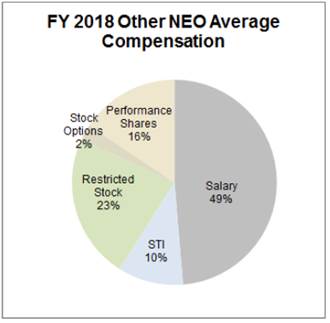
How Compensation Decisions Are Made
· The Role of the Compensation Committee. The Committee, composed entirely of independent directors, is responsible for making executive compensation decisions for the NEOs. The Committee works closely with its independent compensation consultant, Pearl Meyer & Partners (“Pearl Meyer”), and management to examine pay and performance matters throughout the year. The Committee’s charter, which sets out its objectives and responsibilities, can be found at our website at www.lannett.com under the “Investors” section.
The Committee has authority and responsibility to establish and periodically review our Executive Compensation Program and compensation philosophy. Importantly, the Committee also has the sole responsibility for approving the corporate performance goals upon which compensation for the CEO is based, evaluating the CEO’s performance and determining and approving the CEO’s compensation, including equity-based compensation, based on the achievement of his goals. The Committee also reviews and approves compensation levels for other NEOs, taking into consideration recommendations from the CEO.
In making its determinations, the Committee considers market data and advice from Pearl Meyer, as well as budgets, reports, performance assessments and other information provided by management. It also considers other factors, such as the experience, skill sets, and contributions of each NEO towards our overall success. However, the Committee is ultimately responsible for all compensation-related decisions for the NEOs and may exercise its own business judgment when evaluating performance results and making compensation decisions.
Timing of Committee Meetings and Grants; Option and Share Pricing
The Committee meets as necessary to fulfill its responsibilities, and the timing of these meetings is established during the year. The Committee holds special meetings from time to time as its workload requires. Annual equity grants typically occur after finalizing fiscal year end performance results. Historically, annual grants of equity awards were typically approved at a meeting of the Committee in August/September of each year to reward prior year performance. Beginning with grants made in Fiscal 2015, annual equity grants occur in the July/August time frame, reflecting the Company’s status change to a large accelerated filer (with an expedited filing date requirement). Individual grants (for example, associated with the timing of a new NEO or promotion to an NEO position) and special recognition awards may occur at any time of year. The exercise price of each stock option and fair value of restricted stock awarded to our NEOs is the closing price of our common stock on the date of grant.
· The Role of the CEO. The CEO does not play any role in the Committee’s determination of his own compensation. However, he presents the Committee with recommendations for each element of compensation including base salaries and short- and long-term incentive awards for the other NEOs, as well as non-executive employees who are eligible for equity grants. The CEO bases these recommendations upon his assessment of each individual’s performance, as well as market practice. The Committee has full discretion to modify the recommendations of the CEO in the course of its approvals.
· The Role of the Independent Consultant. The Committee consults, as needed, with an outside compensation consulting firm. As it makes decisions about executive compensation, the Committee reviews data and advice from its consultant about current compensation practices and trends among publicly-traded companies in general and comparable generic pharmaceutical companies in particular. The Committee also periodically reviews recommendations from its outside consultant and makes recommendations to the Board about the compensation for non-employee directors.
In Fiscal 2017, Pearl Meyer was retained by the Committee, as its independent consultant, to review the competitiveness of the Executive Compensation Program. Pearl Meyer provided the Committee with compensation data with respect to similarly sized biopharmaceutical and life sciences companies and consulted with the Committee about a variety of issues related to competitive compensation practices and incentive plan designs. Pearl Meyer was also retained by the Committee in Fiscal 2018 to review the competitiveness of the Executive Compensation Program and to provide ongoing advice relating to the Executive Compensation Program. The Committee assessed the independence of Pearl Meyer pursuant to the SEC rules and concluded that no conflict of interest exists that would prevent Pearl Meyer from independently advising the Committee.
Peer Group & Benchmarking
The Committee evaluates industry-specific and general market compensation practices and trends to ensure the Executive Compensation Program is appropriately competitive. When making decisions about the program for Fiscal 2018, the Committee considered publicly-available data, as well as a market study conducted by Pearl Meyer in April 2017. The Pearl Meyer study developed market values using a blend of peer group proxy pay data for the companies shown below as well as published survey data for the broader life sciences industry. Using this information, the Committee compared our program to the compensation practices of other companies which the Committee believes are comparable to the Company in terms of size, scope and business complexity (the “peer group”). As shown below, the Company ranked in the upper half of the peer group in terms of employee headcount and operating income and between the 25th and 50th percentiles for net sales and enterprise value.
Two peers from the 2017 study were subsequently acquired (Albany Molecular Research Inc. in 2017 and Impax Laboratories Inc. in 2018).
For purposes of a subsequent market pay analysis conducted by Pearl Meyer in May 2018, the Committee approved a revised peer group consisting of 15 companies, including the 10 remaining 2017 peers shown above (excluding former peer Albany Molecular Research) plus 5 new companies (Acorda Therapeutics Inc., AMAG Pharmaceuticals Inc., Amphastar Pharmaceuticals Inc., Emergent BioSolutions Inc., and Supernus Pharmaceuticals Inc.) to round out the sample size. The Committee uses external market data as a reference point to ensure the Company’s executive compensation program is sufficiently competitive to attract, retain, and motivate highly experienced and talented NEOs. The Committee generally seeks to position target total direct compensation for NEOs at or near 50th percentile market values for comparable positions but does not utilize a purely formulaic benchmarking approach. Based on the April 2017 Pearl Meyer study, target total direct compensation, including the sum of base salary plus target short-term and long-term incentives, was below the competitive range (defined as +/- 15%) of 50th percentile market values for all then-current NEOs other than Mr. Abt, who was slightly above the range based on his then-current position. Aggregate target total direct compensation was equal to 105% of the 50th percentile. Actual total direct compensation was well-below 50th percentile market values for most of our then-current NEOs and equal to 64% of the 50th percentile in the aggregate, reflecting below-target incentive awards based on actual vs. planned performance. As previously noted, when evaluating our executive compensation program, the Committee considers a variety of other factors in addition to external market data, such as Company and individual performance, and each NEO’s qualifications, skill sets, and past and expected future contributions towards our success.
2018 Executive Compensation Program Decisions
Base Salary
We attribute much of our success to our highly-experienced executive management team, and the strength of their leadership has been clearly demonstrated by our exceptional long-term performance results and growth. In order to remain competitive among our industry peers, the Committee believes it should set compensation at market-competitive levels that reflect the executive’s experience, role and responsibilities. Based on Pearl Meyer’s 2017 study, current salaries were below 50th percentile market values for 4 of the 5 then-current NEOs. However, in light of Fiscal 2017 performance, the Committee decided to not provide salary increases to any of our NEOs, other than a promotional increase of 16.8% for Mr. Abt who assumed additional responsibilities in Fiscal 2018. The following table summarizes annualized salaries for Fiscal 2017 and 2018 for our NEOs. Annualized Fiscal 2018 salaries differ from actual values received as reported in the Summary Compensation Table for certain incumbents with less than a full year of service and promotions.
|
NEO |
|
2017 Base Salary |
|
2018 Base Salary |
|
% Change |
| ||
|
Timothy C. Crew |
|
$ |
— |
|
$ |
735,000 |
|
N/A |
|
|
Martin P. Galvan |
|
$ |
415,000 |
|
$ |
415,000 |
|
— |
|
|
Samuel H. Israel |
|
$ |
— |
|
$ |
400,000 |
|
N/A |
|
|
John Kozlowski |
|
$ |
— |
|
$ |
325,000 |
|
N/A |
|
|
John Abt |
|
$ |
295,000 |
|
$ |
344,500 |
|
16.8 |
% |
|
Arthur P. Bedrosian |
|
$ |
735,000 |
|
$ |
735,000 |
|
— |
|
|
Kevin Smith |
|
$ |
370,000 |
|
$ |
370,000 |
|
— |
|
Short-Term Incentives (Annual Bonus)
The Company’s NEOs participate in an annual bonus program, which is designed to reinforce the annual business plan and budgeted goals and to recognize yearly performance achievements focused primarily on financial and operating results. Actual payouts can range from 0% (below threshold) to 200% (superior performance) of target awards and are paid in cash. The Committee sets each NEO’s threshold, target and superior bonus opportunity as a percentage of base salary, as follows:
|
|
|
Annual Bonus Opportunity As a % of Salary |
| ||||
|
NEO |
|
Threshold |
|
Target |
|
Superior |
|
|
Arthur P. Bedrosian, Timothy C. Crew |
|
25 |
% |
100 |
% |
200 |
% |
|
All Other NEOs |
|
15 |
% |
60 |
% |
120 |
% |
In Fiscal 2018, Mr. Bedrosian’s target award opportunity was increased from 90% of salary to 100% of salary to align more closely with 50th percentile market values. Upon his appointment as CEO, Mr. Crew’s target award opportunity was also set at 100% of base salary. Expressed as percentages of salary, Fiscal 2018 award opportunities were the same as those established in Fiscal 2017 for all other NEOs who were employed during both years.
The overall annual bonus plan for Fiscal 2018 was comprised of two components:
· Corporate Financial & Operational Goals: 80% of the total target award opportunity is tied to operating results versus targets established by the Committee to promote a focus on Company-wide profitable growth and collaboration:
|
Performance Metric |
|
Weighting (out of |
|
|
Adjusted Operating Income |
|
40 |
% |
|
Adjusted Earnings Per Share (“EPS”) |
|
20 |
% |
|
Adjusted Net Sales |
|
20 |
% |
|
Strategic / Individual Objectives |
|
20 |
% |
Fiscal 2018 performance metrics were the same as those established in Fiscal 2017. However, the weighting on strategic / individual objectives was increased to 20% of the total target award opportunity to place further emphasis on key strategic initiatives such as new product launches, and the weighting on Adjusted Operating Income was reduced to 40% of the total target award opportunity. Adjusted Operating Income is defined as operating income excluding bonus and stock-based compensation expense, as further adjusted for certain non-recurring items.
Adjusted EPS is defined as diluted EPS excluding bonus and stock-based compensation expense, as further adjusted for certain non-recurring items. Adjusted Net Sales is defined as Net Sales excluding the impact of customer settlement charges. Any adjustments are reviewed and approved by the Committee.
· Strategic / Individual Objectives: 20% of the total target award opportunity is based on the achievement of pre-established quantitative and qualitative strategic and individual goals, to reinforce key strategic objectives and to promote individual accountability and “line of sight.” For Fiscal 2018, half of the award opportunity for all NEOs was tied to new product launches and half was tied to various other strategic, financial and operational objectives, taking into consideration each NEO’s job function and responsibilities. For competitive harm reasons, the Company does not disclose specific details on individual goals and other strategic objectives.
2018 Short-Term Incentives (Annual Bonus): Results and Payouts
· Corporate Financial & Operational Results (Collectively Weighted 80% of Total Target Award). Fiscal 2018 Target goals for Adjusted Operating Income, Adjusted EPS, and Adjusted Net Sales were set above Fiscal 2017 actual levels and 2018 internal budgets which anticipated continued challenging market conditions within the generic pharmaceuticals sector. For Fiscal 2018, the Committee established Threshold performance hurdles at 95% of Target goals, to further encourage the achievement of Target goals, and Superior hurdles at 102% to 104% of Target to account for stretch goals. The Committee viewed these performance hurdles as very challenging in light of then-current internal forecasts and economic conditions. Fiscal 2018 financial performance goals and actual results are shown in the following table:
|
|
|
Weighting |
|
Performance Goals |
| ||||||||||
|
Performance Metric |
|
(Out of 80%) |
|
Threshold |
|
Target |
|
Superior |
|
Actual |
| ||||
|
Adjusted Operating Income ($ millions) |
|
40 |
% |
$ |
242.4 |
|
$ |
255.4 |
|
$ |
261.4 |
|
$ |
236.3 |
|
|
Adjusted EPS |
|
20 |
% |
$ |
3.00 |
|
$ |
3.16 |
|
$ |
3.23 |
|
$ |
2.97 |
|
|
Adjusted Net Sales ($ millions) |
|
20 |
% |
$ |
663.0 |
|
$ |
695.9 |
|
$ |
725.0 |
|
$ |
684.6 |
|
Actual Fiscal 2018 performance results were below Threshold levels for the Adjusted Operating Income and Adjusted EPS financial metrics and between Threshold and Target goals for Adjusted Net Sales. Actual Adjusted Operating Income for Fiscal 2018 excluded pre-tax items totaling approximately $106.6 million, including acquisition-related and restructuring expenses, impairments, purchase accounting-related expenses due to the KUPI acquisition, and other non-recurring items. Actual Adjusted EPS excluded the same $106.6 million in pre-tax items plus $16.7 million in non-cash interest expense and a litigation settlement gain as well as the related tax effects for all of these items. The Committee excluded the impact of the tax law change, effective 1/1/18, from Adjusted EPS results, since it had not been factored into the originally established performance goals. For Fiscal 2018, the Adjusted Net Sales result was the same as the GAAP-reported value, with no adjustments applied.
· Strategic and Individual Performance Results (Collectively Weighted 20% of Total Target Award). For Fiscal 2018, the Target goal for new product launches was 7 for the fiscal year. The actual number of launches was 8, slightly above the Target goal. The Committee also considered each NEO’s contributions towards a variety of other company-wide strategic and function-specific objectives. While no specific weightings were assigned to these other objectives, the Committee considered each NEO’s contributions towards the Company’s ongoing success with the integration of KUPI and other restructuring activities, the continued strengthening of our balance sheet, maintaining operational discipline within a challenging market environment, and achievement of various other strategic growth milestones. Based on the Committee’s overall assessment, each NEO earned target award payouts for the strategic / individual performance component.
Total Annual Bonus
Based on our Fiscal 2018 performance results, the current NEOs (other than Messrs. Bedrosian and Smith, who terminated employment prior to fiscal year end) earned below-Target awards for the corporate financial and operational component and target awards for the strategic / individual objectives component under the Annual Bonus Plan. Overall awards for current NEOs were equal to approximately 35% of Target opportunities. Total Fiscal 2018 payouts for current NEOs are summarized in the following table:
|
Current NEO |
|
Corporate Financial / |
|
Strategic / Individual |
|
Total Actual Bonus for |
| |||
|
Timothy C. Crew |
|
$ |
53,759 |
|
$ |
72,493 |
|
$ |
126,252 |
|
|
Martin P. Galvan |
|
$ |
36,930 |
|
$ |
49,800 |
|
$ |
86,730 |
|
|
Samuel H. Israel |
|
$ |
34,035 |
|
$ |
45,896 |
|
$ |
79,931 |
|
|
John Kozlowski |
|
$ |
28,921 |
|
$ |
39,000 |
|
$ |
67,921 |
|
|
John Abt |
|
$ |
28,877 |
|
$ |
38,940 |
|
$ |
67,817 |
|
Payouts for Messrs. Crew and Israel were pro-rated to reflect their partial year of service during Fiscal 2018.
Long-Term Incentives
NEOs participate in a performance-based long-term incentive program. Target award opportunities, expressed as percentages of base salary, for Fiscal 2018 are summarized in the following table:
|
NEO |
|
Target Award as % of Base Salary |
|
|
Arthur P. Bedrosian, Timothy C. Crew |
|
300 |
% |
|
Martin P. Galvan |
|
200 |
% |
|
Samuel H. Israel |
|
175 |
% |
|
John Kozlowski, Kevin Smith |
|
150 |
% |
|
John Abt |
|
100 |
% |
The target value mix for our NEOs in Fiscal 2017 and Fiscal 2018 is summarized below:
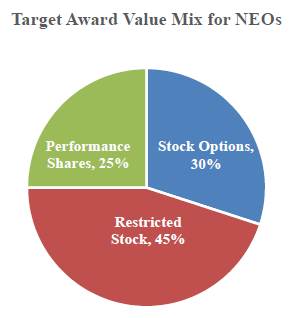
All equity grants are tied to performance. For the stock option and restricted stock components, grant levels are tied to Company and individual performance, using the same metrics and weightings as under the Annual Bonus Plan. Actual grants can range from 0% (for below Threshold results) to 150% (for Superior performance) of target award levels, as shown in the following table:
|
Performance Result |
|
Percentage of Target Equity Grants Earned |
|
|
Below Threshold |
|
0% (subject to Committee discretion) |
|
|
Threshold |
|
50% |
|
|
Target |
|
100% |
|
|
Superior |
|
150% |
|
Any earned stock option and restricted stock grants will be made following the end of the fiscal year in which performance is measured. These grants typically occur in the first quarter of the next fiscal year.
For the performance share component, award opportunities can range from 0% to 200% of target levels, based on our three-year TSR relative to companies in the S&P Pharmaceuticals Select Industry Index, as follows:
|
Lannett Three-Year Relative TSR vs. S&P |
|
Percentage of Target Grant |
|
|
Below 40th Percentile |
|
— |
|
|
40th Percentile |
|
50 |
% |
|
50th Percentile |
|
100 |
% |
|
80th Percentile or Higher |
|
200 |
% |
Because they are tied to prospective goals, performance share grants will occur during the first 90 days of each three-year cycle.
Grants Made in Fiscal 2018 (Based on Fiscal 2017 Performance)
In Fiscal 2017, Company performance was below Threshold goals for all metrics. As a result, no stock option or restricted stock grants were made under the regular long-term incentive program.
In September 2017, certain NEOs received the following TSR performance share target grants:
|
NEO |
|
Target Number of Performance Shares Granted |
|
|
Arthur P. Bedrosian |
|
21,550 |
|
|
Martin P. Galvan |
|
8,112 |
|
|
Samuel H. Israel |
|
6,841 |
|
|
Kevin Smith |
|
5,424 |
|
|
John Abt |
|
2,834 |
|
Grants were made on September 22, 2017 and were determined by dividing target award values by the grant date fair value of $25.58 per share, as determined using a Monte-Carlo binomial modeling valuation tool, as discussed in Note 16 “Share-based Compensation” of our consolidated financial statements. Messrs. Crew and Kozlowski did not receive performance share grants in Fiscal 2018 since they were not serving as NEOs at the time of grant. Award vesting will be based on the Company’s TSR relative to companies in the S&P Pharmaceuticals Index for the three-year period ending September 22, 2020, with no awards earned for below-Threshold results and maximum awards of up to 200% of target grants for Superior performance. Target grants for Messrs. Bedrosian and Smith vested upon their termination of employment and acceptance of the terms of their Separation Agreements.
Stock Option Retention Grants in Fiscal 2018
To enhance retention and to recognize the ongoing efforts related to the KUPI integration, restructuring activities, and various strategic milestones, the Committee approved modest, one-time stock option grants to certain NEOs in September 2017 as follows:
|
NEO |
|
Special Retention Stock Option |
|
|
Arthur P. Bedrosian |
|
3,863 |
|
|
Martin P. Galvan |
|
2,759 |
|
|
Samuel H. Israel |
|
2,759 |
|
|
Kevin Smith |
|
2,759 |
|
|
John Abt |
|
2,759 |
|
In approving these awards, the Committee considered the ongoing efforts and contributions of each executive towards the successful integration of KUPI, the maintenance and expansion of customer relationships, and significant progress made towards achieving targeted cost synergies. Grants were made on September 22, 2017 and vest in three annual increments, beginning on the first anniversary of grant. Each stock option has an exercise price of $17.40, equal to our closing stock price on the date of grant and expire on the tenth anniversary from grant date. Per the terms of their Separation Agreements, grants to Messrs. Bedrosian and Smith vested in full upon their termination of employment and remained exercisable for 90 days thereafter.
New Hire and Promotion Grants in Fiscal 2018
The Committee approved new hire grants during Fiscal 2018 for Messrs. Crew and Israel per the terms of their employment agreements. On January 2, 2018, Mr. Crew received a grant of 32,103 stock options, with an exercise price of $23.65, equal to the grant date closing stock price, which expire on the tenth anniversary from grant, and a grant of 16,914 restricted shares. Both awards vest in three equal annual increments, beginning on the first anniversary of the grant date. On July 15, 2017, Mr. Israel received a grant of 18,223 restricted shares, which vest in three equal annual increments, beginning on the first anniversary of the grant date.
The Committee also approved promotional grants to Messrs. Kozlowski and Abt during Fiscal 2018. On October 26, 2017, Mr. Kozlowski received a grant of 6,930 restricted shares, per the terms of his amended employment agreement, upon his promotion to his then-current role of Chief Operating Officer. He previously had received a grant of 915 restricted shares on September 22, 2017, while serving in a non-executive officer role. Both grants vest in three equal annual increments, beginning on the first anniversary from the grant date. On April 30, 2018, Mr. Abt received a grant of 5,193 restricted shares, vesting in three equal annual increments, beginning on the first anniversary from grant, to recognize his assumption of additional operational responsibilities.
Grants Made in Fiscal 2019 (Based on Fiscal 2018 Performance)
In Fiscal 2018, the Company achieved financial performance results between Threshold and Target levels for Adjusted Net Sales and below Threshold levels for the profitability metrics. Based on Company financial and strategic / individual objective performance results, the Committee approved the following stock option and restricted stock grants, effective as of July 30, 2018:
|
|
|
Equity Grants Earned Based on Fiscal 2018 Performance |
| ||
|
NEO |
|
# of Stock Options |
|
# of Restricted Shares |
|
|
Timothy C. Crew |
|
21,626 |
|
17,336 |
|
|
Martin P. Galvan |
|
16,085 |
|
12,895 |
|
|
Samuel H. Israel |
|
13,665 |
|
10,954 |
|
|
John Kozlowski |
|
9,953 |
|
7,979 |
|
|
John Abt |
|
6,454 |
|
5,174 |
|
These stock options vest in three equal annual increments, beginning on the first anniversary of the grant date and expire on the tenth anniversary from the date of grant. Each stock option has an exercise price of $12.20, equal to our closing stock price on the date of grant. Restricted stock also vests in three equal annual increments, beginning on the first anniversary of grant.
Our current NEOs also received the following TSR performance share grants:
|
NEO |
|
Target Number of Performance Shares Granted |
|
|
Timothy C. Crew |
|
15,368 |
|
|
Martin P. Galvan |
|
11,730 |
|
|
Samuel H. Israel |
|
9,459 |
|
|
John Kozlowski |
|
6,890 |
|
|
John Abt |
|
4,586 |
|
Grants were made on July 30, 2018 and were determined by dividing target award values by the grant date fair value of $17.69 per share, based on a Monte-Carlo binomial modeling valuation tool, as discussed in Note 16 “Share-based Compensation” of our consolidated financial statements. Award vesting will be based on the Company’s TSR relative to companies in the S&P Pharmaceuticals Index for the three-year period ending July 30, 2021, with no awards earned for below-Threshold results and maximum awards of up to 200% of target grants for Superior performance.
Grants made in Fiscal 2019 will be included in the Summary Compensation Table and Grants of Plan-Based Awards Table in the Form 10-K and proxy filings for Fiscal 2019, per current SEC reporting requirements.
Other Policies, Programs and Guidelines
The Company currently maintains a clawback policy under the Sarbanes-Oxley Act, with incentive awards for the CEO and CFO subject to recoupment in the event of a material financial restatement triggered by fraud or misconduct. Additionally, any employee who violates the provisions of the Company’s Code of Business Conduct and Ethics is subject to disciplinary penalties that may include termination of employment.
The Committee intends to comply with any regulatory requirements pertaining to clawback provisions under the Dodd-Frank Act once rules are finalized by the SEC and New York Stock Exchange. NEOs, like all other employees, have retirement programs and other benefits as part of their overall compensation package. The Committee believes that these programs and benefits support our compensation philosophy, part of which is to provide compensation that is sufficiently competitive to attract, motivate and retain an executive team fully capable of driving exceptional performance. The Committee periodically reviews these programs to validate that they are reasonable and consistent with market practice. Attributed costs of the personal benefits available to the NEOs are included in column (h) of the Summary Compensation Table on page 78.
· Retirement Benefits. Each of our NEOs is eligible to participate in a 401(k) plan that is available to all employees. The Company provides matching contributions on a $0.50 basis up to 8% of the contributing employee’s base salary, subject to limitations of the 401(k) plan and applicable law.
· Other Benefits. Our NEOs are eligible to participate in the same health benefits available to all other employees — there are no special medical plans for our NEOs. Lannett provides life insurance for NEOs which would, in the event of death, pay up to $500,000 to designated beneficiaries. Premiums paid for coverage above $50,000 are treated as imputed income. Lannett also provides short- and long-term disability insurance which would, in the event of disability, pay the NEO 70% of his base salary up to the plan limits of $2,000 per week for short-term disability and $15,000 per month for long-term disability. The NEOs are also provided with car allowances.
· Post-Termination Pay. The Committee believes that reasonable severance and change-in-control benefits are necessary in order to recruit and retain qualified senior executives and are generally required by the competitive recruiting environment within our industry and the marketplace in general. These severance benefits reflect the fact that it may be difficult for our NEOs to find comparable employment within a short period of time and are designed to alleviate concerns about the loss of his or her position without cause. The Committee also believes that a change-in-control arrangement will provide security that will likely reduce the reluctance of an NEO to pursue a change in control transaction that could be in the best interest of our shareholders. Lannett’s severance plan is designed to pay severance benefits to a NEO for a qualifying separation. For the CEO, the severance plan provides for payment of three times base salary, plus a pro-rated annual cash bonus for the current year calculated as if all targets and goals are achieved. For the other NEOs, the severance plan provides for a payment of 18-months of base salary, plus a pro-rated annual cash bonus for the current year calculated as if all targets and goals are achieved. Employment agreements with NEOs do not have any tax gross-up provisions, and include non-compete, non-solicitation, and other restrictive covenants for designated time frames. As previously noted, Mr. Crew’s employment agreement was amended during Fiscal 2018 to eliminate a “walk away” provision that would have entitled him to severance benefits upon a voluntary resignation within thirty days of a Change in Control of the Company. This change was made based on the 2018 say on pay vote and concerns raised by shareholder advisory groups and further demonstrates our commitment to sound corporate governance practices. None of the agreements with our other NEOs contain any type of “walk away” provision, with severance benefits only payable upon a qualifying termination of employment by the Company without “Cause” (as defined in the agreements) or a voluntary resignation for “Good Reason” (as defined in the agreements).
· Tax and Accounting Implications. Section 162(m) of the Internal Revenue Code of 1986, as amended, precludes the deductibility of an NEO’s compensation that exceeds $1,000,000 per year. The Tax Cuts and Jobs Act, which became effective as of January 1, 2018, modified Section 162(m) provisions, including the elimination of the “performance-based exception” that previously allowed certain performance-based compensation meeting specific requirements to qualify for full tax deductibility by the Company. The changes to Section 162(m) do not apply to certain compensation paid pursuant to a binding written contract that was in effect as of November 2, 2017. As a result of the tax law changes, compensation paid to designated “covered executives”, including current and former NEOs, in excess of $1,000,000 per individual will generally not be deductible, whether or not it is performance-based. Although the Committee has historically attempted to structure executive compensation to preserve deductibility, it also reserves the right to provide compensation that may not be fully deductible, in order to maintain flexibility in compensating NEOs in a manner consistent with our compensation philosophy, as deemed appropriate. The Committee believes that shareholder interests are best served by not restricting the Committee’s discretion in this regard, even though such compensation may result in non-deductible compensation expenses to the Company.
Looking Ahead: Executive Compensation Program Changes for Fiscal 2019
For Fiscal 2019, the Committee decided to not increase base salaries for NEOs, to maintain a similar short-term incentive (Annual Bonus) design as in Fiscal 2018, and to modify the long-term incentive plan design, as shown below. The Committee may revisit certain aspects of the 2019 compensation program design later in the fiscal year, due to the nonrenewal of the JSP contract, which will expire on March 23, 2019.
· Short-Term Incentives (Annual Bonus). For Fiscal 2019, target award opportunities, expressed as percentages of base salary, performance metrics, and weightings, are the same as in Fiscal 2018. Based on established Target performance goals for Fiscal 2019, the Committee chose to broaden performance ranges as compared with Fiscal 2018 goals, with Threshold performance hurdles set at 85% of Target and Superior performance hurdles at 120% of Target.
· Long-Term Incentives. Expressed as percentages of base salary, target long-term incentive award opportunities for all NEOs are the same as those for Fiscal 2018. The target value mix for equity grants will be equally weighted across all three award vehicles, as summarized below:
|
Award Vehicle |
|
Weighting (Out of 100%) |
|
Performance Criteria |
|
|
Restricted Stock |
|
33.3 |
% |
Grant levels based on Fiscal 2019 Company |
|
|
Stock Options |
|
33.3 |
% |
performance |
|
|
Performance Shares |
|
33.3 |
% |
3-year relative TSR |
|
Equity grant levels for the stock option and restricted stock components will be based on the Company’s Fiscal 2019 financial performance using the same corporate metrics as under the Annual Bonus Plan. Based on established Target performance goals for Fiscal 2019, and consistent with performance ranges within the Fiscal 2019 Annual Bonus Plan design, the Committee set award levels as follows:
|
Fiscal 2019 Performance Result |
|
Percentage of Target Award Opportunity |
|
|
Below Threshold |
|
— (subject to Committee discretion) |
|
|
Threshold (85% of Target) |
|
50% |
|
|
Target (100% of Target) |
|
100% |
|
|
Superior (120% of Target) |
|
150% |
|
Stock option and restricted stock grants, if any, will occur following the end of Fiscal 2019, with earned awards vesting in three equal annual increments based on continued service.
For the performance share component, award opportunities can range from 0% to 200% of target levels, based on our three-year TSR relative to companies in the S&P Pharmaceuticals Select Industry Index, as follows:
|
Lannett Three-Year Relative TSR vs. S&P |
|
Percentage of Target Award Opportunity |
|
|
Below 40th Percentile |
|
— |
|
|
40th Percentile |
|
50 |
% |
|
50th Percentile |
|
100 |
% |
|
80th Percentile or Higher |
|
200 |
% |
Because they are tied to prospective goals, performance share grants will occur during the first 90 days of each three-year cycle.
REPORT OF THE COMPENSATION COMMITTEE
The Compensation Committee has reviewed, discussed and approved the CD&A as set forth above with management. Taking this review and discussion into account, the undersigned Committee members recommend to the Board of Directors that the CD&A be included in the annual report on Form 10-K.
Paul Taveira, Chairman
David Drabik
James Maher
COMPENSATION OF EXECUTIVE OFFICERS
Overview
The tables and narratives set forth below provide specified information concerning the compensation of our Named Executive Officers (NEOs) for the fiscal year ended June 30, 2018.
Summary Compensation Table
This table summarizes all compensation paid to or earned by our Fiscal 2018 NEOs for the years indicated to the extent they were serving as NEOs.
|
|
|
|
|
|
|
|
|
|
|
|
|
Non-equity |
|
|
|
|
| |||||||
|
|
|
|
|
|
|
|
|
Restricted |
|
|
|
incentive plan |
|
All Other |
|
|
| |||||||
|
Name and Principal Position |
|
Fiscal Year |
|
Salary |
|
Bonus |
|
Stock Awards |
|
Options Awards |
|
compensation |
|
Compensation |
|
Total |
| |||||||
|
(a) |
|
(b) |
|
(c) |
|
(d) |
|
(e) |
|
(f) |
|
(g) |
|
(h) |
|
(i) |
| |||||||
|
Timothy Crew (1) |
|
2018 |
|
$ |
350,539 |
|
$ |
— |
|
$ |
400,016 |
|
$ |
400,003 |
|
$ |
126,252 |
|
$ |
52,971 |
|
$ |
1,329,781 |
|
|
Chief Executive Officer |
|
2017 |
|
— |
|
— |
|
— |
|
— |
|
— |
|
— |
|
— |
| |||||||
|
|
|
2016 |
|
— |
|
— |
|
— |
|
— |
|
— |
|
— |
|
— |
| |||||||
|
|
|
|
|
|
|
|
|
|
|
|
|
|
|
|
|
|
| |||||||
|
Martin P. Galvan |
|
2018 |
|
$ |
415,000 |
|
$ |
— |
|
$ |
207,505 |
|
$ |
24,997 |
|
$ |
86,730 |
|
$ |
29,513 |
|
$ |
763,745 |
|
|
Vice President of Finance and Chief Financial Officer |
|
2017 |
|
415,000 |
|
— |
|
104,786 |
|
27,119 |
|
— |
|
21,841 |
|
568,746 |
| |||||||
|
|
2016 |
|
354,916 |
|
492,928 |
|
239,168 |
|
235,915 |
|
23,844 |
|
28,917 |
|
1,375,688 |
| ||||||||
|
|
|
|
|
|
|
|
|
|
|
|
|
|
|
|
|
|
| |||||||
|
Samuel Israel (2) |
|
2018 |
|
$ |
376,923 |
|
$ |
— |
|
$ |
585,010 |
|
$ |
24,997 |
|
$ |
79,931 |
|
$ |
16,980 |
|
$ |
1,083,841 |
|
|
Chief Legal Officer and General Counsel |
|
2017 |
|
— |
|
— |
|
— |
|
— |
|
— |
|
— |
|
— |
| |||||||
|
|
2016 |
|
— |
|
— |
|
— |
|
— |
|
— |
|
— |
|
— |
| ||||||||
|
|
|
|
|
|
|
|
|
|
|
|
|
|
|
|
|
|
| |||||||
|
John Kozlowski (3) |
|
2018 |
|
$ |
325,000 |
|
$ |
— |
|
$ |
171,624 |
|
$ |
— |
|
$ |
67,921 |
|
$ |
31,769 |
|
$ |
596,314 |
|
|
Chief of Staff and Strategy |
|
2017 |
|
— |
|
— |
|
— |
|
— |
|
— |
|
— |
|
— |
| |||||||
|
Officer |
|
2016 |
|
— |
|
$ |
— |
|
— |
|
— |
|
— |
|
— |
|
— |
| ||||||
|
|
|
|
|
|
|
|
|
|
|
|
|
|
|
|
|
|
| |||||||
|
John Abt |
|
2018 |
|
$ |
299,539 |
|
$ |
— |
|
$ |
153,505 |
|
$ |
24,997 |
|
$ |
67,817 |
|
$ |
19,155 |
|
$ |
565,013 |
|
|
Vice President and Chief Quality Operations Officer |
|
2017 |
|
289,632 |
|
— |
|
87,289 |
|
17,706 |
|
— |
|
20,218 |
|
414,845 |
| |||||||
|
|
2016 |
|
289,632 |
|
154,321 |
|
52,688 |
|
51,697 |
|
19,458 |
|
16,341 |
|
584,137 |
| ||||||||
|
|
|
|
|
|
|
|
|
|
|
|
|
|
|
|
|
|
| |||||||
|
Arthur P. Bedrosian (4) |
|
2018 |
|
$ |
381,635 |
|
$ |
— |
|
$ |
551,249 |
|
$ |
34,999 |
|
$ |
— |
|
$ |
2,650,074 |
|
$ |
3,617,957 |
|
|
Former Chief Executive Officer |
|
2017 |
|
735,000 |
|
— |
|
184,399 |
|
62,669 |
|
— |
|
99,477 |
|
1,081,545 |
| |||||||
|
|
2016 |
|
615,129 |
|
811,484 |
|
657,298 |
|
400,977 |
|
45,917 |
|
78,382 |
|
2,609,187 |
| ||||||||
|
|
|
|
|
|
|
|
|
|
|
|
|
|
|
|
|
|
| |||||||
|
Kevin Smith (5) |
|
2018 |
|
$ |
370,000 |
|
$ |
— |
|
$ |
138,746 |
|
$ |
24,997 |
|
$ |
— |
|
$ |
1,120,135 |
|
$ |
1,653,878 |
|
|
Former Senior Vice President of Sales |
|
2017 |
|
370,000 |
|
— |
|
99,121 |
|
24,068 |
|
— |
|
21,967 |
|
515,156 |
| |||||||
|
|
2016 |
|
314,974 |
|
178,840 |
|
210,160 |
|
206,787 |
|
21,160 |
|
24,869 |
|
956,790 |
| ||||||||
(1) Mr. Crew joined the Company as CEO effective January 2, 2018.
(2) Mr. Israel joined the Company as Chief Legal Officer and General Counsel effective July 15, 2017.
(3) Mr. Kozlowski became an NEO in Fiscal 2018. Compensation is not shown for prior years when he was employed in a non-executive officer role.
(4) Mr. Bedrosian departed the Company effective December 31, 2017.
(5) Mr. Smith departed the Company effective June 30, 2018.
All Other Compensation
The following summarizes the components of column (h) of the Summary Compensation Table above:
|
Name and Principal Position |
|
Fiscal Year |
|
Company Match |
|
Auto |
|
Pay in Lieu of |
|
Separation |
|
Excess Life |
|
Relocation |
|
Total |
| ||||||||||||||
|
|
|
|
|
|
|
|
|
|
|
|
|
|
|
|
|
|
| ||||||||||||||
|
Timothy Crew |
|
2018 |
|
$ |
6,463 |
|
$ |
6,439 |
|
$ |
— |
|
$ |
— |
|
$ |
69 |
|
$ |
40,000 |
|
$ |
52,971 |
| |||||||
|
Chief Executive Officer |
|
2017 |
|
— |
|
— |
|
— |
|
— |
|
— |
|
— |
|
— |
| ||||||||||||||
|
|
|
2016 |
|
— |
|
— |
|
— |
|
— |
|
— |
|
— |
|
— |
| ||||||||||||||
|
|
|
|
|
|
|
|
|
|
|
|
|
|
|
|
|
|
| ||||||||||||||
|
Martin P. Galvan |
|
2018 |
|
$ |
9,343 |
|
$ |
10,800 |
|
$ |
8,579 |
|
$ |
— |
|
$ |
791 |
|
$ |
— |
|
$ |
29,513 |
| |||||||
|
Vice President of |
|
2017 |
|
10,447 |
|
10,800 |
|
— |
|
— |
|
594 |
|
— |
|
21,841 |
| ||||||||||||||
|
Finance and Chief Financial Officer |
|
2016 |
|
10,197 |
|
10,800 |
|
7,508 |
|
— |
|
411 |
|
— |
|
28,916 |
| ||||||||||||||
|
|
|
|
|
|
|
|
|
|
|
|
|
|
|
|
|
|
| ||||||||||||||
|
Samuel Israel |
|
2018 |
|
$ |
6,615 |
|
$ |
10,177 |
|
$ |
— |
|
$ |
— |
|
$ |
188 |
|
$ |
— |
|
$ |
16,980 |
| |||||||
|
Chief Legal Officer and |
|
2017 |
|
— |
|
— |
|
— |
|
— |
|
— |
|
— |
|
— |
| ||||||||||||||
|
General Counsel |
|
2016 |
|
— |
|
— |
|
— |
|
— |
|
— |
|
— |
|
— |
| ||||||||||||||
|
|
|
|
|
|
|
|
|
|
|
|
|
|
|
|
|
|
| ||||||||||||||
|
John Kozlowski |
|
2018 |
|
$ |
9,770 |
|
$ |
7,062 |
|
$ |
14,844 |
|
$ |
— |
|
$ |
93 |
|
$ |
— |
|
$ |
31,769 |
| |||||||
|
Chief of Staff and |
|
2017 |
|
— |
|
— |
|
— |
|
— |
|
— |
|
— |
|
— |
| ||||||||||||||
|
Strategy Officer |
|
2016 |
|
— |
|
— |
|
— |
|
— |
|
— |
|
— |
|
— |
| ||||||||||||||
|
|
|
|
|
|
|
|
|
|
|
|
|
|
|
|
|
|
| ||||||||||||||
|
John Abt |
|
2018 |
|
$ |
8,217 |
|
$ |
10,800 |
|
$ |
— |
|
$ |
— |
|
$ |
138 |
|
$ |
— |
|
$ |
19,155 |
| |||||||
|
Vice President and |
|
2017 |
|
9,275 |
|
10,800 |
|
— |
|
— |
|
143 |
|
— |
|
20,218 |
| ||||||||||||||
|
Chief Quality Operations Officer |
|
2016 |
|
5,403 |
|
10,800 |
|
— |
|
— |
|
138 |
|
— |
|
16,341 |
| ||||||||||||||
|
|
|
|
|
|
|
|
|
|
|
|
|
|
|
|
|
|
| ||||||||||||||
|
Arthur P. Bedrosian |
|
2018 |
|
$ |
— |
|
$ |
7,010 |
|
$ |
69,613 |
|
$ |
2,572,500 |
|
$ |
951 |
|
$ |
— |
|
$ |
2,650,074 |
| |||||||
|
Former Chief Executive Officer |
|
2017 |
|
8,152 |
|
13,500 |
|
76,327 |
|
— |
|
1,498 |
|
— |
|
99,477 |
| ||||||||||||||
|
|
2016 |
|
8,000 |
|
13,500 |
|
55,598 |
|
— |
|
1,284 |
|
— |
|
78,382 |
| |||||||||||||||
|
|
|
|
|
|
|
|
|
|
|
|
|
|
|
|
|
|
| ||||||||||||||
|
Kevin Smith |
|
2018 |
|
$ |
7,934 |
|
$ |
13,500 |
|
$ |
6,938 |
|
$ |
1,091,500 |
|
$ |
263 |
|
$ |
— |
|
$ |
1,120,135 |
| |||||||
|
Former Senior Vice President of Sales |
|
2017 |
|
8,199 |
|
13,500 |
|
— |
|
— |
|
268 |
|
— |
|
21,967 |
| ||||||||||||||
|
|
2016 |
|
8,678 |
|
13,500 |
|
2,423 |
|
— |
|
268 |
|
— |
|
24,869 |
| |||||||||||||||
Grants of Plan-Based Awards in Fiscal 2018
|
|
|
|
|
Estimated Future Payouts Under |
|
Estimated Future Payouts Under |
|
All Other Stock |
|
All Other |
|
Exercise or |
|
Grant Date |
| ||||||||||
|
Name |
|
Grant Date |
|
Threshold |
|
Target |
|
Maximum |
|
Threshold |
|
Target |
|
Maximum |
|
Stocks or Units |
|
Options |
|
of Option |
|
Options |
| ||
|
(a) |
|
(b) |
|
(c) |
|
(d) |
|
(e) |
|
(f) |
|
(g) |
|
(h) |
|
(i) |
|
(j) |
|
($/sh)(3) |
|
(i) |
| ||
|
|
|
|
|
|
|
|
|
|
|
|
|
|
|
|
|
|
|
|
|
|
|
|
| ||
|
Timothy Crew |
|
1/2/2018 |
|
|
|
|
|
|
|
|
|
|
|
|
|
16,914 |
|
|
|
|
|
$ |
400,016 |
| |
|
Chief Executive Officer |
|
1/2/2018 |
|
|
|
|
|
|
|
|
|
|
|
|
|
|
|
32,103 |
|
$ |
23.65 |
|
$ |
400,003 |
|
|
|
|
|
|
|
|
|
|
|
|
|
|
|
|
|
|
|
|
|
|
|
|
|
| ||
|
Martin P. Galvan |
|
9/22/2017 |
|
|
|
|
|
|
|
4,056 |
|
8,112 |
|
16,224 |
|
|
|
|
|
|
|
$ |
207,505 |
| |
|
Vice President of Finance and Chief Financial Officer |
|
9/22/2017 |
|
|
|
|
|
|
|
|
|
|
|
|
|
|
|
2,759 |
|
$ |
17.40 |
|
$ |
24,997 |
|
|
|
|
|
|
|
|
|
|
|
|
|
|
|
|
|
|
|
|
|
|
|
|
|
| ||
|
Samuel Israel |
|
7/15/2017 |
|
|
|
|
|
|
|
|
|
|
|
|
|
18,223 |
|
|
|
|
|
$ |
410,018 |
| |
|
Chief Legal Officer and General Counsel |
|
9/22/2017 |
|
|
|
|
|
|
|
3,421 |
|
6,841 |
|
13,683 |
|
|
|
|
|
|
|
$ |
174,993 |
| |
|
|
|
9/22/2017 |
|
|
|
|
|
|
|
|
|
|
|
|
|
|
|
2,759 |
|
$ |
17.40 |
|
$ |
24,997 |
|
|
|
|
|
|
|
|
|
|
|
|
|
|
|
|
|
|
|
|
|
|
|
|
|
| ||
|
John Kozlowski |
|
9/22/2017 |
|
|
|
|
|
|
|
|
|
|
|
|
|
915 |
|
|
|
|
|
$ |
15,006 |
| |
|
Chief of Staff and Strategy Officer |
|
10/26/2017 |
|
|
|
|
|
|
|
|
|
|
|
|
|
6,930 |
|
|
|
|
|
$ |
156,618 |
| |
|
|
|
|
|
|
|
|
|
|
|
|
|
|
|
|
|
|
|
|
|
|
|
|
| ||
|
John Abt |
|
4/30/2018 |
|
|
|
|
|
|
|
|
|
|
|
|
|
5,193 |
|
|
|
|
|
$ |
81,011 |
| |
|
Vice President and Chief Quality Operations Officer |
|
9/22/2017 |
|
|
|
|
|
|
|
1,417 |
|
2,834 |
|
5,668 |
|
|
|
|
|
|
|
$ |
72,494 |
| |
|
|
9/22/2017 |
|
|
|
|
|
|
|
|
|
|
|
|
|
|
|
2,759 |
|
$ |
17.40 |
|
$ |
24,997 |
| |
|
|
|
|
|
|
|
|
|
|
|
|
|
|
|
|
|
|
|
|
|
|
|
|
| ||
|
Arthur P. Bedrosian (5) |
|
9/22/2017 |
|
|
|
|
|
|
|
10,775 |
|
21,550 |
|
43,100 |
|
|
|
|
|
|
|
$ |
551,249 |
| |
|
Former Executive Chief Officer |
|
9/22/2017 |
|
|
|
|
|
|
|
|
|
|
|
|
|
|
|
3,863 |
|
$ |
17.40 |
|
$ |
34,999 |
|
|
|
|
|
|
|
|
|
|
|
|
|
|
|
|
|
|
|
|
|
|
|
|
|
| ||
|
|
|
|
|
|
|
|
|
|
|
|
|
|
|
|
|
|
|
|
|
|
|
|
| ||
|
Kevin Smith (5) |
|
9/22/2017 |
|
|
|
|
|
|
|
2,712 |
|
5,424 |
|
10,848 |
|
|
|
|
|
|
|
$ |
138,746 |
| |
|
Former Senior Vice President of Sales |
|
9/22/2017 |
|
|
|
|
|
|
|
|
|
|
|
|
|
|
|
2,759 |
|
$ |
17.40 |
|
$ |
24,997 |
|
|
|
|
|
|
|
|
|
|
|
|
|
|
|
|
|
|
|
|
|
|
|
|
| |||
(1) Stock options and restricted stock granted to Mr. Crew on 1/2/18 were new hire awards upon joining the Company. All other restricted stock grants represent new hire or promotional grants to NEOs, except for the grant on 9/22/17 to Mr. Kozlowski while serving in a non-executive officer role. All of the grants vest in three equal annual increments.
(2) Stock options grants on 9/22/17 were retention grants to then-current NEOs to recognize ongoing efforts towards acquisition integration and restructuring activities, and vest in three equal annual increments.
(3) The exercise price was equal to the Company’s closing stock price on the date of grant.
(4) Stock options were valued using the Black-Scholes option pricing model. Performance shares were valued using a Monte Carlo binomial model. The assumptions used in fair value calculations are described in Note 16 “Share-based Compensation,” in the Form 10-K. The grant date fair value for other stock grants reflects the number of shares multiplied by the Company’s closing stock price on the applicable date of grant.
(5) Grants to Messrs. Bedrosian and Smith fully vested upon termination of employment per the terms of their Separation Agreements.
Outstanding Equity Awards at 2018 Fiscal Year End
The following table sets forth information concerning the outstanding stock awards held at June 30, 2018 by each of the NEOs. The options were granted ten years prior to the option expiration date and vest over three years from that grant date. Restricted shares vest three years from the date of grant.
|
Name |
|
Number of |
|
Number of |
|
Equity |
|
Option |
|
Option |
|
Number of |
|
Market Value |
|
Equity |
|
Equity |
| ||
|
(a) |
|
(b) |
|
(c) |
|
(d) |
|
(e) |
|
(f) |
|
(g) |
|
(h) |
|
(i) |
|
Vested ($) |
| ||
|
Timothy Crew |
|
— |
|
32,103 |
|
— |
|
$ |
23.65 |
|
1/1/2018 |
|
|
|
|
|
|
|
|
| |
|
Chief Executive Officer |
|
|
|
|
|
|
|
|
|
|
|
16,914 |
|
$ |
230,030 |
|
|
|
|
| |
|
|
|
|
|
|
|
|
|
|
|
|
|
|
|
|
|
|
|
|
| ||
|
Martin P. Galvan |
|
40,000 |
|
— |
|
— |
|
$ |
4.73 |
|
7/15/2021 |
|
|
|
|
|
|
|
|
| |
|
Vice President of Finance and Chief Financial Officer |
|
32,000 |
|
— |
|
— |
|
$ |
4.16 |
|
10/25/2022 |
|
|
|
|
|
|
|
|
| |
|
|
50,000 |
|
— |
|
— |
|
$ |
13.86 |
|
9/4/2023 |
|
|
|
|
|
|
|
|
| ||
|
|
|
30,000 |
|
— |
|
— |
|
$ |
34.77 |
|
8/11/2024 |
|
|
|
|
|
|
|
|
| |
|
|
|
5,993 |
|
2,997 |
|
— |
|
$ |
59.20 |
|
7/21/2025 |
|
|
|
|
|
|
|
|
| |
|
|
|
589 |
|
1,180 |
|
— |
|
$ |
31.30 |
|
7/26/2026 |
|
|
|
|
|
|
|
|
| |
|
|
|
— |
|
2,759 |
|
— |
|
$ |
17.40 |
|
9/21/2027 |
|
|
|
|
|
|
|
|
| |
|
|
|
|
|
|
|
|
|
|
|
|
|
10,973 |
|
$ |
149,233 |
|
|
|
|
| |
|
|
|
|
|
|
|
|
|
|
|
|
|
|
|
|
|
|
|
|
| ||
|
Samuel Israel |
|
— |
|
2,759 |
|
— |
|
$ |
17.40 |
|
9/21/2027 |
|
|
|
|
|
|
|
|
| |
|
Chief Legal Officer and General Counsel |
|
|
|
|
|
|
|
|
|
|
|
|
|
|
|
|
|
|
| ||
|
|
|
|
|
|
|
|
|
|
|
|
25,064 |
|
$ |
340,870 |
|
|
|
|
| ||
|
|
|
|
|
|
|
|
|
|
|
|
|
|
|
|
|
|
|
|
| ||
|
John Kozlowski |
|
4,000 |
|
— |
|
— |
|
$ |
4.16 |
|
10/25/2022 |
|
|
|
|
|
|
|
|
| |
|
Chief of Staff and Strategy Officer |
|
9,334 |
|
— |
|
— |
|
$ |
13.86 |
|
9/4/2023 |
|
|
|
|
|
|
|
|
| |
|
|
4,200 |
|
— |
|
— |
|
$ |
34.77 |
|
8/11/2024 |
|
|
|
|
|
|
|
|
| ||
|
|
|
|
|
|
|
|
|
|
|
|
|
13,454 |
|
$ |
182,974 |
|
|
|
|
| |
|
|
|
|
|
|
|
|
|
|
|
|
|
|
|
|
|
|
|
|
| ||
|
John Abt |
|
1,313 |
|
657 |
|
— |
|
$ |
59.20 |
|
7/21/2025 |
|
|
|
|
|
|
|
|
| |
|
Vice President and Chief Quality Operations Officer |
|
385 |
|
770 |
|
— |
|
$ |
31.30 |
|
7/26/2026 |
|
|
|
|
|
|
|
|
| |
|
|
— |
|
2,759 |
|
— |
|
$ |
17.40 |
|
9/21/2027 |
|
|
|
|
|
|
|
|
| ||
|
|
|
|
|
|
|
|
|
|
|
|
|
10,812 |
|
$ |
147,043 |
|
|
|
|
| |
|
|
|
|
|
|
|
|
|
|
|
|
|
|
|
|
|
|
|
|
| ||
|
Arthur P. Bedrosian |
|
96,000 |
|
— |
|
— |
|
$ |
34.77 |
|
8/11/2024 |
|
|
|
|
|
|
|
|
| |
|
Former Chief Executive Officer |
|
15,280 |
|
— |
|
— |
|
$ |
59.20 |
|
7/21/2025 |
|
|
|
|
|
|
|
|
| |
|
|
4,088 |
|
— |
|
— |
|
$ |
31.30 |
|
7/26/2026 |
|
|
|
|
|
|
|
|
| ||
|
|
|
3,863 |
|
— |
|
— |
|
$ |
17.40 |
|
9/21/2027 |
|
|
|
|
|
|
|
|
| |
|
|
|
|
|
|
|
|
|
|
|
|
|
|
|
|
|
|
|
|
| ||
|
Kevin Smith |
|
30,000 |
|
— |
|
— |
|
$ |
13.86 |
|
9/4/2023 |
|
|
|
|
|
|
|
|
| |
|
Former Senior Vice President of Sales |
|
26,000 |
|
— |
|
— |
|
$ |
34.77 |
|
8/11/2024 |
|
|
|
|
|
|
|
|
| |
|
|
7,880 |
|
— |
|
— |
|
$ |
59.20 |
|
7/21/2025 |
|
|
|
|
|
|
|
|
| ||
|
|
|
1,570 |
|
— |
|
— |
|
$ |
31.30 |
|
7/27/2026 |
|
|
|
|
|
|
|
|
| |
|
|
|
2,759 |
|
— |
|
— |
|
$ |
17.40 |
|
9/21/2027 |
|
|
|
|
|
|
|
|
| |
Options Exercised and Stock Vested During the Fiscal Year Ended June 30, 2018
The following table sets forth information concerning stock options exercised and stock awards that vested during Fiscal 2018 for each of the NEOs.
|
|
|
Options |
|
Stock Awards |
| ||||||
|
Name and Principal Position |
|
Number of Shares |
|
Value Realized |
|
Number of Shares |
|
Value Realized |
| ||
|
Timothy Crew |
|
— |
|
$ |
— |
|
— |
|
$ |
— |
|
|
Chief Executive Officer |
|
|
|
|
|
|
|
|
| ||
|
|
|
|
|
|
|
|
|
|
| ||
|
Martin P. Galvan |
|
— |
|
$ |
— |
|
5,276 |
|
$ |
115,809 |
|
|
Vice President of Finance and Chief Financial Officer |
|
|
|
|
|
|
|
|
| ||
|
|
|
|
|
|
|
|
|
|
| ||
|
Samuel Israel |
|
— |
|
$ |
— |
|
— |
|
$ |
— |
|
|
Chief Legal Officer and General Counsel |
|
|
|
|
|
|
|
|
| ||
|
|
|
|
|
|
|
|
|
|
| ||
|
John Kozlowski |
|
— |
|
$ |
— |
|
3,129 |
|
$ |
67,481 |
|
|
Chief of Staff and Strategy Officer |
|
|
|
|
|
|
|
|
| ||
|
|
|
|
|
|
|
|
|
|
| ||
|
John Abt |
|
— |
|
$ |
— |
|
2,290 |
|
$ |
47,690 |
|
|
Vice President and Chief Quality Operations Officer |
|
|
|
|
|
|
|
|
| ||
|
|
|
|
|
|
|
|
|
|
| ||
|
Arthur P. Bedrosian |
|
348,500 |
|
$ |
2,395,706 |
|
38,206 |
|
$ |
872,435 |
|
|
Former Chief Executive Officer |
|
|
|
|
|
|
|
|
| ||
|
|
|
|
|
|
|
|
|
|
| ||
|
Kevin Smith |
|
11,667 |
|
$ |
144,071 |
|
14,900 |
|
$ |
248,930 |
|
|
Former Senior Vice President of Sales |
|
|
|
|
|
|
|
|
| ||
Employment and Separation Agreements
The Company has entered into employment agreements with its current NEOs. Each of the agreements provides for an annual base salary and eligibility to receive a bonus. The salary and bonus amounts of these executives are determined by the review and approval of the Compensation Committee in accordance with the Committee’s charter as approved by the Board of Directors. Additionally, these executives are eligible to receive stock options and restricted stock awards. In 2018, the Company amended each of the employment agreements it has entered into with its current NEOs and with other employees to confirm and clarify that nothing in the employment agreements prohibits or limits the right of any employee from providing confidential information to or otherwise communicating with the SEC or any other governmental entity or self-regulatory organization or from accepting financial awards from the SEC or any other governmental entity or self-regulatory organization. Under the terms of the employment agreements, these executive employees may be terminated at any time with or without cause, or by reason of death or disability. In certain termination situations, the Company is liable to pay these executives severance compensation as discussed in the table below.
Effective December 31, 2017, the Company entered into a Separation Agreement and General Release with Mr. Bedrosian, our former Chief Executive Officer, upon his termination of employment. The agreement provides for separation payments totaling $2,572,500, equal to thirty-six months of Mr. Bedrosian’s final base salary plus a pro-rated target cash bonus for the period of time employed during Fiscal 2018, payable in twelve monthly installments, beginning on March 31, 2018. The agreement also provides for full vesting of all unvested stock options and all other equity awards, plus health benefits continuation (via reimbursement of COBRA premiums) for up to eighteen months from the date of termination. Mr. Bedrosian agreed to release the Company from any claims and to cooperate in the resolution of any issues pertaining to filings, investigations, or claims relating to events that occurred during his tenure with the Company. He also agreed to various restrictive covenants during the thirty-six month period following his termination of employment.
Effective June 30, 2018, the Company entered into a Separation Agreement and General Release with Mr. Smith, our former Senior Vice President of Sales, upon his termination of employment. The agreement provides for separation payments totaling $1,091,500, equal to twenty-one months of Mr. Smith’s final base salary plus a cash bonus for Fiscal 2018 of $444,000, payable in twelve monthly installments, beginning on September 28, 2018. The agreement also provides for full vesting of all unvested stock options and all other equity awards, plus health benefits continuation (via reimbursement of COBRA premiums) for up to eighteen months from the date of termination. Mr. Smith agreed to release the Company from any claims and to cooperate in the resolution of any issues pertaining to filings, investigations, or claims relating to events that occurred during his tenure with the Company. He also agreed to various restrictive covenants during the eighteen-month period following his termination of employment.
Potential Payments upon Termination or Change in Control
The following table summarizes potential payments or benefits upon various termination of employment scenarios for our current NEOs as of fiscal year end and assumes that the relevant triggering event occurred on June 30, 2018. The fair market values of share-based compensation (i.e. Stock Options and Restricted Stock) were calculated using the closing price of Lannett Company, Inc. stock ($13.60) on June 29, 2018, which was the last trading day of Fiscal 2018. The “spread,” the difference between the fair market value of Lannett Company’s stock on June 29, 2018, and the option exercise price, was used for valuing stock options.
|
Name |
|
Base Salary |
|
Annual Cash |
|
Acceleration and |
|
Acceleration of |
|
Insurance |
|
Other |
|
Total |
|
|
Timothy Crew |
|
|
|
|
|
|
|
|
|
|
|
|
|
|
|
|
Without Cause/With Good Reason (1) (2) |
|
2,205,000 |
|
126,252 |
|
— |
|
230,030 |
|
50,102 |
|
2,120 |
|
2,613,504 |
|
|
For Cause (3) (4) |
|
— |
|
126,252 |
|
— |
|
— |
|
— |
|
2,120 |
|
128,372 |
|
|
Retirement / Death / Disability (3) |
|
— |
|
126,252 |
|
— |
|
— |
|
— |
|
2,120 |
|
128,372 |
|
|
Change in Control (5) |
|
2,205,000 |
|
126,252 |
|
— |
|
230,030 |
|
50,102 |
|
2,120 |
|
2,613,504 |
|
|
Martin P. Galvan |
|
|
|
|
|
|
|
|
|
|
|
|
|
|
|
|
Without Cause/With Good Reason (1) (2) |
|
622,500 |
|
86,730 |
|
— |
|
149,233 |
|
39,017 |
|
6,084 |
|
903,564 |
|
|
For Cause (3) (4) |
|
— |
|
86,730 |
|
— |
|
— |
|
— |
|
6,084 |
|
92,814 |
|
|
Retirement / Death / Disability (3) |
|
— |
|
86,730 |
|
— |
|
— |
|
— |
|
6,084 |
|
92,814 |
|
|
Change in Control (5) |
|
622,500 |
|
86,730 |
|
— |
|
149,233 |
|
39,017 |
|
6,084 |
|
903,564 |
|
|
Samuel Israel |
|
|
|
|
|
|
|
|
|
|
|
|
|
|
|
|
Without Cause/With Good Reason (1) (2) |
|
600,000 |
|
79,931 |
|
— |
|
340,870 |
|
5,534 |
|
3,712 |
|
1,030,047 |
|
|
For Cause (3) (4) |
|
— |
|
79,931 |
|
— |
|
— |
|
— |
|
3,712 |
|
83,643 |
|
|
Retirement / Death / Disability (3) |
|
— |
|
79,931 |
|
— |
|
— |
|
— |
|
3,712 |
|
83,643 |
|
|
Change in Control (5) |
|
600,000 |
|
79,931 |
|
— |
|
340,870 |
|
5,534 |
|
3,712 |
|
1,030,047 |
|
|
John Kozlowski |
|
|
|
|
|
|
|
|
|
|
|
|
|
|
|
|
Without Cause/With Good Reason (1) (2) |
|
487,500 |
|
67,921 |
|
— |
|
182,974 |
|
40,474 |
|
5,816 |
|
784,685 |
|
|
For Cause (3) (4) |
|
— |
|
67,921 |
|
— |
|
— |
|
— |
|
5,816 |
|
73,737 |
|
|
Retirement / Death / Disability (3) |
|
— |
|
67,921 |
|
— |
|
— |
|
— |
|
5,816 |
|
73,737 |
|
|
Change in Control (5) |
|
487,500 |
|
67,921 |
|
— |
|
182,974 |
|
40,474 |
|
5,816 |
|
784,685 |
|
|
John Abt |
|
|
|
|
|
|
|
|
|
|
|
|
|
|
|
|
Without Cause/With Good Reason (1) (2) |
|
516,750 |
|
67,817 |
|
— |
|
147,043 |
|
50,102 |
|
3,404 |
|
785,116 |
|
|
For Cause (3) (4) |
|
— |
|
67,817 |
|
— |
|
— |
|
— |
|
3,404 |
|
71,221 |
|
|
Retirement / Death / Disability (3) |
|
— |
|
67,817 |
|
— |
|
— |
|
— |
|
3,404 |
|
71,221 |
|
|
Change in Control (5) |
|
516,750 |
|
67,817 |
|
— |
|
147,043 |
|
50,102 |
|
3,404 |
|
785,116 |
|
(1) Each employment agreement ranges from 1-3 years and is automatically renewed unless notice is given by either party. Any non-renewal of the existing employment agreements by the Company and any resignation of the Executive with Good Reason both constitute a termination without Cause. Under the existing employment agreements base salary continuation for a period of 18-36 months, pro-rated cash bonus as if all targets and goals were achieved subject to any applicable cap on cash payments, acceleration of exercisability of unvested stock option awards, acceleration of unvested restricted stock, and insurance benefit continuation for a period of 18 months (collectively “Severance Compensation”) will only be made if the Executive executes and delivers to the Company, in a form prepared by the Company, a release of all claims against the Company and other appropriate parties, excluding the Company’s performance obligation to pay Severance Compensation and the Executive’s vested rights under the Company sponsored retirement plans, 401(k) plans and stock ownership plans (“General Release”). Severance Compensation is paid in equal monthly installments over a 12 month period to commence on the 90th day following the Termination Date provided the Executive has not revoked the General Release prior to that date. Earned but unpaid base salary, accrued but unpaid annual bonus (if the Executive otherwise meets the eligibility requirements) and accrued but unpaid paid time off and other miscellaneous items are to be paid in a single lump sum in cash no later than the earlier of: (1) the date required under applicable law; or (2) 60 days following the Termination Date.
(2) Under the existing employment agreements, Good Reason is defined as giving written notice of his resignation within thirty (30) days after Executive has actual knowledge of the occurrence, without the written consent of Executive, of one of the following events: (A) the assignment to Executive of duties materially and adversely inconsistent with Executive’s position or a material and adverse alteration in the nature of his duties, responsibilities and/or reporting obligations, (B) a reduction in Executive’s Base Salary or a failure to pay any such amounts when due; or (C) the relocation of Company headquarters more than 100 miles from its current location.
(3) Under the existing employment agreements, if the Executive is terminated For Cause; by death; by disability; resigns without Good Reason; or retires; earned but unpaid base salary, accrued but unpaid annual bonus (if the Executive otherwise meets the eligibility requirements) and accrued but unpaid paid time off and other miscellaneous items are to be paid in a single lump sum in cash no later than the earlier of: (1) the date required under applicable law; or (2) 60 days following the Termination Date.
(4) For Cause generally means Executive’s willful commission of an act constituting fraud, embezzlement, breach of fiduciary duty, material dishonesty with respect to the Company, gross negligence or willful misconduct in performance of Executive duties, willful violation of any law, rule or regulation relating to the operation of the Company, abuse of illegal drugs or other controlled substances or habitual intoxication, willful violation of published business conduct guidelines, code of ethics, conflict of interest or other similar policies, and Executive becoming under investigation by or subject to any disciplinary charges by any regulatory agency having jurisdiction over the Company (including but not limited to the Drug Enforcement Administration (DEA), Food and Drug Administration (FDA) or the Securities and Exchange Commission (SEC)) or if any complaint is filed against the Executive by any such regulatory agency.
(5) Under the existing employment agreements, a Change in Control is defined as a “change in ownership of the Company”, “a change in effective control of the Company”, or “a change in ownership of a substantial portion of the Company’s assets.” If the Executive is terminated by the Company without Cause or resigns with Good Reason within 24 months of a Change in Control event, the Executive shall be entitled to earned but unpaid base salary, accrued but unpaid annual bonus (if the Executive otherwise meets the eligibility requirements) and accrued but unpaid paid time off and other miscellaneous items. These items are to be paid in a single lump sum in cash no later than the earlier of: (1) the date required under applicable law; or (2) 60 days following the Termination Date. Additionally, the Executive shall be entitled to Severance Compensation to be paid in equal monthly installments over a 12 month period to commence on the 90th day following the Termination Date provided the Executive has not revoked the General Release prior to that date. A written notice that the Executive’s employment term is not extended within the 24-month period after a Change in Control shall be deemed a termination without Cause, unless the Executive and the Company execute a new employment agreement.
CEO Pay Ratio Disclosure
As required by the Dodd-Frank Wall Street Reform and Consumer Protection Act and the regulations of the SEC, we are providing the following information about the annual total compensation of our employees and the annual total compensation of our current CEO, Timothy Crew. We chose to use Mr. Crew’s annualized compensation, as opposed to also including compensation for Mr. Bedrosian, our former CEO through December 31, 2017, since Mr. Crew was serving as our CEO at the time median annual compensation for our other employees was identified and as of our fiscal year ended June 30, 2018.
We determined that as of May 31, 2018, our employee population consisted of 1,215 individuals working at our company and its consolidated subsidiaries, including 1,190 in the U.S. and 25 located in Armenia. For purposes of identifying the median employee, we excluded all 25 workers in Armenia, who represent 2.1% of our total population, as permitted under SEC guidelines. For each of the 1,189 U.S.-based employees (other than Mr. Crew), we used their annualized base salary and target cash and equity incentive awards as of May 31, 2018 as a consistently applied compensation measure to identify the median employee. Since substantially all our employees are eligible to receive equity awards, we included it in our determination of total compensation. We used target cash and equity incentives since actual awards for Fiscal 2018 for each employee were not yet determined. We annualized values for employees hired after July 1, 2017, the start of our fiscal year.
After determining the median employee, we calculated Fiscal 2018 total annual compensation for this employee of $57,002, in accordance with the requirements of Regulation S-K. For purposes of this pay ratio calculation, we annualized Mr. Crew’s Fiscal 2018 base salary, bonus, and values reported in “All Other Compensation” to account for his start date of January 2, 2018, with a total annualized value of $1,852,162. We did not annualize Mr. Crew’s sign-on equity award. The annualized amount differs from the value of $1,329,781 reported in the Summary Compensation Table for Mr. Crew. Based on this information, the ratio of the annual total compensation of Mr. Crew, our CEO, to the median of the total compensation of all employees was 32.5 to 1. This pay ratio information has been calculated in a manner consistent with SEC regulations.
Because the SEC rules permit significant flexibility in terms of approaches used to calculate compensation and identify the median employee, comparisons among companies may not be very meaningful, even for companies within the same industry.
COMPENSATION OF DIRECTORS
Our Board of Directors is actively involved in providing strategic direction and fiduciary oversight to the Company. During Fiscal 2018 we had a total of seven Board members, which resulted in a significant workload for our directors, with our four independent directors (five through December 31, 2017) serving on an average of three committees each. Our Board of Directors held numerous meetings and teleconferences in Fiscal 2018 in carrying out its responsibilities. One of the important roles the Board plays is in the area of mergers and acquisitions (M&A). The Company has been involved with a significant amount of M&A activity over the past several years, including the KUPI acquisition in Fiscal 2016 and the acquisition of Silarx Pharmaceuticals, Inc. in Fiscal 2015. The Board is actively involved in transactional due diligence as well as on-going reviews of business development activities. The Board was also actively involved in the search for a new CEO during Fiscal 2018, culminating in the seamless leadership transition from Mr. Bedrosian to Mr. Crew.
For Fiscal 2018, our non-employee directors received a cash retainer of $90,000, payable in monthly increments of $7,500, for Board and committee service. For serving as Lead Independent Director, Mr. Drabik also received an additional retainer of $18,000. Certain non-employee directors who served on a CEO Search Committee during Fiscal 2018 received additional cash fees ranging from $4,000 to $8,000. No other cash retainers or meeting fees were provided.
Board members receive annual equity grants to recognize their service during the prior fiscal year. Grant levels may vary from year to year based on Company performance. Based on the Company’s performance and the significant efforts and contributions of our directors in Fiscal 2017, in July 2017, each then-current non-employee Board member received an award of 6,977 common shares with a grant date value of $150,006, immediately vested at grant. Mr. LePore received a grant of 1,700 shares upon his appointment to the Board in July 2017 with a grant date value of $35,785. These grants are shown in the table below, since they occurred in Fiscal 2018. Based on the Company’s performance and the significant efforts and contributions of our directors in Fiscal 2018, in July 2018, each non-employee Board member received an award of 16,195 common shares with a grant date value of $200,008. Mr. Drabik received an additional 2,000 shares to recognize his efforts with the new CEO search. Grant date values for this grant will be reported in the director compensation table for Fiscal 2019, since the grant occurred after the end of Fiscal 2018. As an executive director, Mr. Crew does not receive an additional grant for board service.
Effective in July 2014, the Board of Directors approved stock ownership guidelines for non-employee directors equal to three times their cash retainer. Non-employee directors must meet required ownership levels within five years of first becoming subject to the guidelines. All directors other than Mr. Paonessa, who joined the board in Fiscal 2016, and Mr. Patrick LePore, who joined the board in Fiscal 2018, met required ownership levels as of the end of Fiscal 2018.
We maintain policies that prohibit Directors from pledging Lannett stock or engaging in activity considered hedging of our common stock, and none of our Directors has pledged Lannett stock as collateral for a personal loan or other obligations.
The following table shows compensation information for Fiscal 2018 for non-employee members of our Board of Directors.
|
Name |
|
Fees |
|
Stock |
|
Options |
|
Non-Equity |
|
Change in Pension |
|
All Other |
|
Total ($) |
| |
|
(a) |
|
(b) |
|
(c) |
|
(d) |
|
(e) |
|
(f) |
|
(g) |
|
(h) |
| |
|
Jeffrey Farber |
|
97,000 |
|
$ |
150,006 |
|
— |
|
— |
|
— |
|
— |
|
247,006 |
|
|
David Drabik |
|
116,000 |
|
$ |
150,006 |
|
— |
|
— |
|
— |
|
— |
|
266,006 |
|
|
Paul Taveira |
|
90,000 |
|
$ |
150,006 |
|
— |
|
— |
|
— |
|
— |
|
240,006 |
|
|
James Maher |
|
90,000 |
|
$ |
150,006 |
|
— |
|
— |
|
— |
|
— |
|
240,006 |
|
|
Albert Paonessa III |
|
98,000 |
|
$ |
150,006 |
|
— |
|
— |
|
— |
|
— |
|
248,006 |
|
|
Patrick LePore |
|
94,000 |
|
$ |
35,785 |
|
— |
|
— |
|
— |
|
— |
|
129,785 |
|
(1) Reflects grant date award value for equity grants received in Fiscal 2018 to recognize Board service in 2017.
ITEM 12. SECURITY OWNERSHIP OF CERTAIN BENEFICIAL OWNERS AND MANAGEMENT AND RELATED STOCKHOLDER MATTERS
The following table sets forth, as of July 31, 2018, information regarding the security ownership of the directors and certain executive officers of the Company and persons known to the Company to be beneficial owners of more than five (5%) percent of the Company’s common stock. Although grants of restricted stock under the Company’s 2006, 2011 and 2014 Long Term Incentive Plans (“LTIPs”) generally vest equally over a three year period from the grant date, the restricted shares are included below because the voting rights with respect to such restricted stock are acquired immediately upon grant.
|
Name and Address of |
|
|
|
|
|
|
|
|
|
|
|
|
|
|
|
|
Beneficial Owner / |
|
|
|
Excluding Options (*) |
|
Including Options (**) |
| ||||||||
|
Director / Executive |
|
Office |
|
Shares Held |
|
Shares Held |
|
Total |
|
Percent of |
|
Number of |
|
Percent of |
|
|
|
|
|
|
|
|
|
|
|
|
|
|
|
|
|
|
|
John M. Abt 13200 Townsend Road Philadelphia, PA 19154 |
|
VP and Chief |
|
18,114 |
|
0 |
|
18,114 |
(1) |
0.05 |
% |
21,773 |
(1),(2) |
0.06 |
% |
|
|
|
|
|
|
|
|
|
|
|
|
|
|
|
|
|
|
Maureen Cavanaugh 13200 Townsend Road Philadelphia, PA 19154 |
|
Senior VP & Chief |
|
23,638 |
|
0 |
|
23,638 |
(3) |
0.06 |
% |
23,638 |
(3) |
0.06 |
% |
|
|
|
|
|
|
|
|
|
|
|
|
|
|
|
|
|
|
John Chapman 13200 Townsend Road Philadelphia, PA 19154 |
|
Director |
|
2,574 |
|
0 |
|
2,574 |
|
0.01 |
% |
2,574 |
|
0.01 |
% |
|
|
|
|
|
|
|
|
|
|
|
|
|
|
|
|
|
|
Timothy Crew 13200 Townsend Road Philadelphia, PA 19154 |
|
Chief Executive Officer |
|
36,250 |
|
0 |
|
36,250 |
(4) |
0.09 |
% |
36,250 |
(4) |
0.09 |
% |
|
|
|
|
|
|
|
|
|
|
|
|
|
|
|
|
|
|
David Drabik 13200 Townsend Road Philadelphia, PA 19154 |
|
Director |
|
49,747 |
|
0 |
|
49,747 |
|
0.13 |
% |
49,747 |
|
0.13 |
% |
|
|
|
|
|
|
|
|
|
|
|
|
|
|
|
|
|
|
Robert Ehlinger 13200 Townsend Road Philadelphia, PA 19154 |
|
VP and Chief Information Officer |
|
28,160 |
|
0 |
|
28,160 |
(5) |
0.07 |
% |
57,691 |
(5),(6) |
0.15 |
% |
|
|
|
|
|
|
|
|
|
|
|
|
|
|
|
|
|
|
Jeffrey Farber 13200 Townsend Road Philadelphia, PA 19154 |
|
Director |
|
2,041,998 |
|
2,441,957 |
|
4,483,955 |
(7) |
11.53 |
% |
4,483,955 |
(7) |
11.46 |
% |
|
|
|
|
|
|
|
|
|
|
|
|
|
|
|
|
|
|
David Farber 13200 Townsend Road Philadelphia, PA 19154 |
|
|
|
1,890,870 |
|
1,766,169 |
|
3,657,039 |
(8) |
9.40 |
% |
3,657,039 |
(8) |
9.35 |
% |
|
|
|
|
|
|
|
|
|
|
|
|
|
|
|
|
|
|
Martin Galvan 13200 Townsend Road Philadelphia, PA 19154 |
|
VP of Finance and Chief Financial Officer |
|
51,238 |
|
0 |
|
51,238 |
(9) |
0.13 |
% |
213,407 |
(9),(10) |
0.55 |
% |
|
|
|
|
|
|
|
|
|
|
|
|
|
|
|
|
|
|
Samuel H. Israel 13200 Townsend Road Philadelphia, PA 19154 |
|
Chief Legal Officer and General Counsel |
|
28,665 |
|
0 |
|
28,665 |
(11) |
0.07 |
% |
29,584 |
(11),(12) |
0.08 |
% |
|
|
|
|
|
|
|
|
|
|
|
|
|
|
|
|
|
|
John Kozlowski 13200 Townsend Road Philadelphia, PA 19154 |
|
Chief of Staff & Strategy Officer |
|
25,287 |
|
0 |
|
25,287 |
(13) |
0.07 |
% |
42,821 |
(13),(14) |
0.11 |
% |
|
|
|
|
|
|
|
|
|
|
|
|
|
|
|
|
|
|
Patrick G. Lepore 13200 Townsend Road Philadelphia, PA 19154 |
|
Chairman of the Board, Director |
|
42,895 |
|
0 |
|
42,895 |
|
0.11 |
% |
42,895 |
|
0.11 |
% |
|
|
|
|
|
|
|
|
|
|
|
|
|
|
|
|
|
|
James M. Maher 13200 Townsend Road Philadelphia, PA 19154 |
|
Director |
|
43,492 |
|
0 |
|
43,492 |
|
0.11 |
% |
43,492 |
|
0.11 |
% |
|
|
|
|
|
|
|
|
|
|
|
|
|
|
|
|
|
|
Albert Paonessa, III 13200 Townsend Road Philadelphia, PA 19154 |
|
Director |
|
30,277 |
|
0 |
|
30,277 |
|
0.08 |
% |
30,277 |
|
0.08 |
% |
|
|
|
|
|
|
|
|
|
|
|
|
|
|
|
|
|
|
Paul Taveira 13200 Townsend Road Philadelphia, PA 19154 |
|
Director |
|
47,970 |
|
0 |
|
47,970 |
|
0.12 |
% |
47,970 |
|
0.12 |
% |
|
|
|
|
|
|
|
|
|
|
|
|
|
|
|
|
|
|
All directors and executive officers as a group (14 persons) |
|
|
|
2,470,305 |
|
2,441,957 |
|
4,912,262 |
|
12.63 |
% |
5,126,074 |
|
13.11 |
% |
(1) Includes 12,505 unvested shares received pursuant to restricted stock awards granted in July 2016, November 2016, April 2018 and July 2018.
(2) Includes 1,970 vested options to purchase common stock at an exercise price of $59.20 per share, 770 vested options to purchase common stock at an exercise price of $31.30 per share and 919 vested options to purchase common stock at an exercise price of $17.40.
(3) Includes 23,638 unvested shares received pursuant to restricted stock awards granted in May 2018.
(4) Includes 34,250 unvested shares received pursuant to restricted stock awards granted in January 2018 and July 2018.
(5) Includes 6,546 unvested shares received pursuant to restricted stock awards granted in July 2016, November 2016 and July 2018.
(6) Includes 11,667 vested options to purchase common stock at an exercise price of $13.86 per share, 10,000 vested options to purchase common stock at an exercise price of $34.77 per share, 6,300 vested options to purchase common stock at an exercise price of $59.20 per share, 645 vested options to purchase common stock at an exercise price of $31.30 per share and 919 vested options to purchase common stock at an exercise price of $17.40 per share.
(7) Includes 1,355,128 shares held by the Jeffrey Farber Family Foundation which is managed by Jeffrey Farber. Jeffrey Farber disclaims beneficial ownership of these shares. Includes 30,000 shares held by the Jeffrey and Jennifer Farber Family Foundation which is managed by Jeffrey Farber. Jeffrey Farber disclaims beneficial ownership of these shares. Includes 528,142 shares held by Farber Family LLC (“FFLLC”) which is managed by Jeffrey and David Farber. David Farber and Jeffrey Farber each disclaim beneficial ownership of these shares. Includes 73,408 shares held by Jeffrey Farber as custodian for his children, 17,279 shares held as joint custodian with David Farber for a relative, and also includes 38,000 shares held by Farber Investment Company (“FIC”). Jeffrey Farber and David Farber each beneficially own 25% of FIC and each disclaim beneficial ownership of all but 9,500 shares held by FIC. Includes 400,000 shares held by a Grantor Retained Annuity Trust, in which Jeffrey Farber is the trustee.
(8) Includes 854,443 shares held by the David and Nancy Family Foundation. David Farber disclaims beneficial ownership of these shares. Includes 528,142 shares held by FFLLC which is managed by Jeffrey and David Farber. David Farber and Jeffrey Farber each disclaim beneficial ownership of these shares. Includes 180,145 shares held by David Farber as joint custodian with his children, 148,160 shares held as trustee for his children and 17,279 shares held as joint custodian with Jeffrey Farber for a relative. David Farber disclaims beneficial ownership of these shares. Also includes 38,000 shares held by FIC. Jeffrey Farber and David Farber each beneficially own 25% of FIC and each disclaim beneficial ownership of all but 9,500 shares held by FIC.
(9) Includes 15,220 unvested shares received pursuant to restricted stock awards granted in July 2016, November 2016 and July 2018.
(10) Includes 40,000 vested options to purchase common stock at an exercise price of $4.73 per share, 32,000 vested options to purchase common stock at an exercise price of $4.16 per share, 50,000 vested options to purchase common stock at an exercise price of $13.86 per share, 30,000 vested options to purchase common stock at an exercise price of $34.77 per share and 8,990 vested options to purchase common stock at an exercise price of $59.20 per share, and 1,179 vested options to purchase common stock at an exercise price of $31.30 per share.
(11) Includes 23,103 unvested shares received pursuant to restricted stock awards granted in July 2017 and July 2018.
(12) Includes 919 vested options to purchase common stock at an exercise price of $17.40 per share.
(13) Includes 19,149 unvested shares received pursuant to restricted stock awards granted in July 2016, November 2016, September 2017, October 2017 and July 2018.
(14) Includes 4,000 vested options to purchase common stock at an exercise price of $4.16 per share, 9,334 vested options to purchase common stock at an exercise price of $13.86 per share and 4,200 vested options to purchase common stock at an exercise price of $34.77 per share.
* Percent of class calculation is based on 38,901,532 outstanding shares of common stock at July 31, 2018.
** Assumes that all options exercisable within sixty days have been exercised.
The following table sets forth, as of July 31, 2018, information regarding the names and addresses of the shareholders known to the Company to be beneficial owners of more than five (5%) percent of the Company’s common stock.
|
Name and Address of Beneficial Owner |
|
Number of |
|
Percent of |
|
|
|
|
|
|
|
|
|
BlackRock, Inc. 55 East 52nd Street New York, NY 10055 |
|
3,897,157 |
(1) |
10.30 |
% |
|
|
|
|
|
|
|
|
Snow Capital Management, L.P. 2000 Georgetowne Drive, Suite 200 Sewickley, PA 15143 |
|
3,039,716 |
(2) |
8.10 |
% |
|
|
|
|
|
|
|
|
Deerfield Management Company, L.P. 780 Third Avenue, 37th Floor New York, NY 10017 |
|
2,717,287 |
(3) |
7.21 |
% |
|
|
|
|
|
|
|
|
The Vanguard Group 100 Vanguard Blvd Malvern, PA 19355 |
|
2,944,186 |
(4) |
7.89 |
% |
(1) Based on Schedule 13G/A filed by Blackrock, Inc. with the SEC on January 19, 2018, Blackrock, Inc. has sole voting power over 3,844,376 shares, shared voting power over 0 shares, sole dispositive power over 3,897,157 shares and shared dispositive power over 0 shares.
(2) Based on Schedule 13G/A filed by Snow Capital Management, L.P. with the SEC on February 2, 2018, Snow Capital Management, L.P. has sole voting power over 2,953,714 shares, shared voting power over 0 shares, sole dispositive power over 3,039,716 shares and shared dispositive power over 0 shares.
(3) Based on Schedule 13G/A filed by Deerfield Management Company, L.P. with the SEC on February 14, 2018, Deerfield Management Company, L.P. has sole voting power over 0 shares, shared voting power over 2,717,287 shares, sole dispositive power over 0 shares and shared dispositive power over 2,717,287 shares.
(4) Based on Schedule 13G filed by The Vanguard Group with the SEC on February 9, 2018, The Vanguard Group has sole voting power over 33,357 shares, shared voting power over 3,298 shares, sole dispositive power over 2,944,186 shares and shared dispositive power over 33,186 shares.
Equity Compensation Plan Information
The following table summarizes the equity compensation plans as of June 30, 2018:
|
(In thousands, except for weighted average exercise price) |
|
Number of securities to |
|
Weighted average |
|
Number of securities |
| |
|
Equity Compensation plans approved by security holders |
|
1,057 |
|
$ |
22.46 |
|
1,488 |
|
|
Equity Compensation plans not approved by security holders |
|
— |
|
— |
|
— |
| |
|
Total |
|
1,057 |
|
$ |
22.46 |
|
1,488 |
|
ITEM 13. CERTAIN RELATIONSHIPS AND RELATED TRANSACTIONS AND DIRECTOR INDEPENDENCE
Review and Approval of Transactions with Related Persons
The responsibility for the review of transactions with “related persons” (as defined below) has been assigned to the Audit Committee of the Board of Directors, which is comprised of three independent directors. “Related persons” are defined as directors and executive officers or their immediate family members or stockholders owning more than five percent of the Company’s common stock. The Audit Committee annually reviews related party transactions with any related person in which the amount exceeds $120,000.
The Company had net sales of $3.9 million, $3.7 million and $3.1 million during the fiscal years ended June 30, 2018, 2017 and 2016, respectively, to a generic distributor, Auburn. Jeffrey Farber, a current board member, is the owner of Auburn. Accounts receivable includes amounts due from Auburn of $585 thousand and $751 thousand at June 30, 2018 and 2017, respectively.
The Company also had net sales of $1.9 million and $1.7 million during the fiscal years ended June 30, 2018 and 2017 to a generic distributor, KeySource. Albert Paonessa, a current board member, was appointed the CEO of KeySource in May 2017. Accounts receivable includes amounts due from KeySource of $514 thousand and $606 thousand as of June 30, 2018 and 2017.
The Company incurred expenses totaling $332 thousand during the fiscal year ended June 30, 2018 for online medical benefit services provided by a subsidiary of a variable interest entity. See Note 12 “Commitments” for more information. Accounts payable includes amounts due to the variable interest entity of $58 thousand as of June 30, 2018.
As part of its review, the Audit Committee noted that the amount of net sales to Auburn approximated 0.6% of total net sales during the fiscal years ended June 30, 2018, 2017 and 2016, respectively. The Audit Committee also noted that the amount of net sales to KeySource approximated 0.3% of total net sales during each of the fiscal years ended June 30, 2018 and 2017.
The Audit Committee reviewed an analysis of sales prices charged to Auburn and KeySource, which compared the average sales prices by product for Auburn, which is a member of the Premier Buying Group, and KeySource, which is a member of the OptiSource Buying Group, sales to the average sales prices by product to other Lannett customers during the same period. As a result of this analysis, the Audit Committee ratified the net sales made to Auburn and KeySource during the fiscal years ended June 30, 2018 and 2017.
ITEM 14. PRINCIPAL ACCOUNTANT FEES AND SERVICES
Grant Thornton LLP served as the independent auditors of the Company during Fiscal 2018, 2017 and 2016. No relationship exists, other than the usual relationship between independent public accountant and client. The following table identifies the fees incurred for services rendered by Grant Thornton LLP in Fiscal 2018, 2017 and 2016.
|
(In thousands) |
|
Audit Fees |
|
Audit-Related |
|
Tax Fees (1) |
|
All Other Fees (2) |
|
Total Fees |
| |||||
|
|
|
|
|
|
|
|
|
|
|
|
| |||||
|
Fiscal 2018: |
|
$ |
1,586 |
|
$ |
— |
|
$ |
180 |
|
$ |
26 |
|
$ |
1,792 |
|
|
Fiscal 2017: |
|
$ |
1,502 |
|
$ |
— |
|
$ |
167 |
|
$ |
— |
|
$ |
1,669 |
|
|
Fiscal 2016: |
|
$ |
1,482 |
|
$ |
— |
|
$ |
154 |
|
$ |
— |
|
$ |
1,636 |
|
(1) Tax fees include fees paid for preparation of annual federal, state and local income tax returns, quarterly estimated income tax payments and various tax planning services.
(2) Other fees include fees paid for review of various correspondences including IRS audit assistance, miscellaneous studies, etc.
The non-audit services provided to the Company by Grant Thornton LLP were pre-approved by the Company’s Audit Committee. Prior to engaging its auditor to perform non-audit services, the Company’s Audit Committee reviews the particular service to be provided and the fee to be paid by the Company for such service and assesses the impact of the service on the auditor’s independence.
ITEM 15. EXHIBITS, FINANCIAL STATEMENT SCHEDULE
1. Consolidated Financial Statements:
See accompanying Index to Consolidated Financial Statements.
2. Consolidated Financial Statement Schedule:
Lannett Company, Inc.
Schedule II - Valuation and Qualifying Accounts
For the years ended June 30:
|
Description |
|
Balance at |
|
Charged to |
|
Deductions |
|
Balance at |
| ||||
|
|
|
|
|
|
|
|
|
|
| ||||
|
Allowance for Doubtful Accounts |
|
|
|
|
|
|
|
|
| ||||
|
2018 |
|
$ |
796 |
|
$ |
1,560 |
|
$ |
(1,048 |
) |
$ |
1,308 |
|
|
2017 |
|
610 |
|
186 |
|
— |
|
796 |
| ||||
|
2016 |
|
374 |
|
236 |
|
— |
|
610 |
| ||||
|
|
|
|
|
|
|
|
|
|
| ||||
|
Deferred Tax Asset Valuation Allowance |
|
|
|
|
|
|
|
|
| ||||
|
2018 |
|
$ |
6,391 |
|
$ |
1,729 |
|
$ |
— |
|
$ |
8,120 |
|
|
2017 |
|
3,927 |
|
2,464 |
|
— |
|
6,391 |
| ||||
|
2016 |
|
2,326 |
|
1,601 |
|
— |
|
3,927 |
| ||||
3. Exhibits:
Those exhibits marked with a (*) refer to management contracts or compensatory plans or arrangements.
|
Exhibit |
|
Description |
|
Method of Filing |
|
|
|
|
|
|
|
2.1 |
|
|
Incorporated by reference to Exhibit 2.1 on Form 8-K dated May 18, 2015 | |
|
|
|
|
|
|
|
2.2 |
|
|
Incorporated by reference to Exhibit 2.2 on Form 8-K dated September 4, 2015 | |
|
|
|
|
|
|
|
2.3 |
|
|
Incorporated by reference to Exhibit 2.3 on Form 8-K dated December 2, 2015 | |
|
|
|
|
|
|
|
3.1 |
|
Certificate of Incorporation |
|
Incorporated by reference to the Proxy Statement filed with respect to the Annual Meeting of Shareholders held on December 6, 1991 (the “1991 Proxy Statement”). |
|
|
|
|
|
|
|
3.2 |
|
By-Laws, as amended |
|
Incorporated by reference to the 1991 Proxy Statement. |
|
|
|
|
|
|
|
3.3 |
|
|
Incorporated by reference to Exhibit 3.3 on Form 8-K dated January 16, 2014 | |
|
|
|
|
|
|
|
3.4 |
|
|
Incorporated by reference to Exhibit 3.4 on Form 8-K dated July 17, 2014 | |
|
|
|
|
|
|
|
3.5 |
|
|
Incorporated by reference to Exhibit 3.5 to the Annual Report on 2014 Form 10-K | |
|
|
|
|
|
|
|
3.6 |
|
|
Incorporated by reference to Exhibit 3.6 to the Annual Report on 2014 Form 10-K | |
|
|
|
|
|
|
|
3.7 |
|
Amended and Restated Bylaws of Lannett Company Inc., as amended through January 21, 2015. |
|
Incorporated by reference to Exhibit 3.7 on Form 8-K dated April 3, 2015 |
|
|
|
|
|
|
|
3.8 |
|
Amended and Restated Bylaws of Lannett Company Inc., as amended through July 6, 2015. |
|
Incorporated by reference to Exhibit 3.8 on Form 8-K dated July 9, 2015 |
|
|
|
|
|
|
|
4 |
|
Specimen Certificate for Common Stock |
|
Incorporated by reference to Exhibit 4(a) to Form 8 dated April 23, 1993 (Amendment No. 3 to Form 10-KSB for Fiscal 1992) (“Form 8”) |
|
|
|
|
|
|
|
4.1 |
|
|
Incorporated by reference to Exhibit 4.1 on Form 8-K dated December 2, 2015 | |
|
|
|
|
|
|
|
4.2 |
|
|
Incorporated by reference to Exhibit 4.2 on Form 8-K dated December 2, 2015 | |
|
|
|
|
|
|
|
4.3 |
|
|
Incorporated by reference to Exhibit 4.3 on Form 8-K dated December 2, 2015 | |
|
|
|
|
|
|
|
10.1 |
|
Line of Credit Note dated March 11, 1999 between the Company and First Union National Bank |
|
Incorporated by reference to Exhibit 10(ad) to the Annual Report on 1999 Form 10-KSB |
|
Exhibit |
|
Description |
|
Method of Filing |
|
|
|
|
|
|
|
10.2 |
|
|
Incorporated by reference to Exhibit 10(ae) to the Annual Report on 1999 Form 10-KSB | |
|
|
|
|
|
|
|
10.3 |
|
|
Incorporated by reference to Exhibit 10(af) to the Annual Report on 1999 Form 10-KSB | |
|
|
|
|
|
|
|
10.4 |
|
|
Incorporated by reference to Exhibit 10(ag) to the Annual Report on 1999 Form 10-KSB | |
|
|
|
|
|
|
|
10.5* |
|
|
Incorporated by reference to the Proxy Statement for Fiscal Year Ending June 30, 2002 | |
|
|
|
|
|
|
|
10.6* |
|
|
Incorporated by reference to Exhibit 10.6 to the Annual Report on 2003 Form 10-KSB | |
|
|
|
|
|
|
|
10.7* |
|
|
Incorporated by reference to Exhibit 10 to the Quarterly Report on Form 10-Q dated May 12, 2004. | |
|
|
|
|
|
|
|
10.9 |
|
Agreement between Lannett Company, Inc and Siegfried (USA), Inc. |
|
Incorporated by reference to Exhibit 10.9 to the Annual Report on 2003 Form 10-KSB |
|
|
|
|
|
|
|
10.10 |
|
Agreement between Lannett Company, Inc and Jerome Stevens Pharmaceuticals, Inc. |
|
Incorporated by reference to Exhibit 2.1 to Form 8-K dated May 5, 2004 |
|
|
|
|
|
|
|
10.11* |
|
|
Incorporated by reference to Exhibit 10.11 to the Annual Report on 2009 Form 10-K | |
|
|
|
|
|
|
|
10.12 |
|
Agreement of Sale Between Anvil Construction Company, Inc. and Lannett Company, Inc. |
|
Incorporated by reference to Exhibit 10.12 to the Annual Report on 2009 Form 10-K |
|
|
|
|
|
|
|
10.13* |
|
|
Incorporated by reference to the Proxy Statement dated January 5, 2007 | |
|
|
|
|
|
|
|
10.15* |
|
|
Incorporated by reference to the Proxy Statement dated January 19, 2011 | |
|
|
|
|
|
|
|
10.16* |
|
|
Incorporated by reference to Exhibit 10.1 on Form 8-K dated August 11, 2011 | |
|
|
|
|
|
|
|
10.17 |
|
|
Incorporated by reference to Exhibit 10.17 to the Annual Report on 2011 Form 10-K | |
|
|
|
|
|
|
|
10.18 |
|
|
Incorporated by reference to Exhibit 10.18 to the Annual Report on 2011 Form 10-K | |
|
|
|
|
|
|
|
10.19* |
|
Second Amended and Restated Employment Agreement of Arthur P. Bedrosian |
|
Incorporated by reference to Exhibit 10.19 on Form 8-K dated January 3, 2013 |
|
|
|
|
|
|
|
10.20* |
|
Amended and Restated Employment Agreement of Martin P. Galvan |
|
Incorporated by reference to Exhibit 10.20 on Form 8-K dated January 3, 2013 |
|
|
|
|
|
|
|
10.21* |
|
Amended and Restated Employment Agreement of William F. Schreck |
|
Incorporated by reference to Exhibit 10.21 on Form 8-K dated January 3, 2013 |
|
Exhibit |
|
Description |
|
Method of Filing |
|
|
|
|
|
|
|
10.22* |
|
|
Incorporated by reference to Exhibit 10.22 on Form 8-K dated January 3, 2013 | |
|
|
|
|
|
|
|
10.23* |
|
|
Incorporated by reference to Exhibit 10.23 on Form 8-K dated January 3, 2013 | |
|
|
|
|
|
|
|
10.24* |
|
Amended and Restated Employment Agreement of Robert Ehlinger |
|
Incorporated by reference to Exhibit 10.24 on Form 8-K dated January 3, 2013 |
|
|
|
|
|
|
|
10.25 |
|
|
Incorporated by reference to Exhibit 10.25 on Form 8-K dated August 19, 2013 | |
|
|
|
|
|
|
|
10.26 |
|
|
Incorporated by reference to Exhibit 10.26 on Form 8-K dated December 19, 2013 | |
|
|
|
|
|
|
|
10.27 |
|
|
Incorporated by reference to Exhibit 10.27 on Form 8-K dated December 19, 2013 | |
|
|
|
|
|
|
|
10.28* |
|
Employment Agreement of Michael Bogda dated December 1, 2014 |
|
Incorporated by reference to Exhibit 10.28 on Form 8-K dated December 5, 2014 |
|
|
|
|
|
|
|
10.29 |
|
|
Incorporated by reference to Exhibit 10.29 on Form 8-K dated April 24, 2015 | |
|
|
|
|
|
|
|
10.30* |
|
|
Incorporated by reference to Exhibit 10.30 on Form 10-Q dated May 8, 2015 | |
|
|
|
|
|
|
|
10.31* |
|
|
Incorporated by reference to Exhibit 10.31 to the Annual Report on 2015 Form 10-K | |
|
|
|
|
|
|
|
10.32* |
|
|
Incorporated by reference to Exhibit 10.32 to the Annual Report on 2015 Form 10-K | |
|
|
|
|
|
|
|
10.33 |
|
|
Incorporated by reference to Exhibit 10.33 on Form 8-K dated September 4, 2015 | |
|
|
|
|
|
|
|
10.34* |
|
|
Incorporated by reference to Exhibit 10.34 on Form 8-K dated September 15, 2015 | |
|
|
|
|
|
|
|
10.35 |
|
|
Incorporated by reference to Exhibit 10.35 on Form 8-K dated September 25, 2015 | |
|
|
|
|
|
|
|
10.36 |
|
|
Incorporated by reference to Exhibit 10.36 on Form 8-K dated December 2, 2015 | |
|
|
|
|
|
|
|
10.37 |
|
|
Incorporated by reference to Exhibit 10.37 on Form 8-K dated December 2, 2015 |
|
Exhibit |
|
Description |
|
Method of Filing |
|
|
|
|
|
|
|
10.38 |
|
|
Incorporated by reference to Exhibit 10.38 on Form 8-K dated December 2, 2015 | |
|
|
|
|
|
|
|
10.39 |
|
|
Incorporated by reference to Exhibit 10.39 on Form 8-K dated December 2, 2015 | |
|
|
|
|
|
|
|
10.40 |
|
|
Incorporated by reference to Exhibit 10.40 on Form 8-K dated December 2, 2015 | |
|
|
|
|
|
|
|
10.41 |
|
|
Incorporated by reference to Exhibit 10.41 on Form 8-K dated December 2, 2015 | |
|
|
|
|
|
|
|
10.42* |
|
|
Incorporated by reference to Exhibit 10.42 on Form 8-K dated April 12, 2016 | |
|
|
|
|
|
|
|
10.43 |
|
Amendment No. 1 to Credit and Guaranty Agreement dated June 17, 2016 |
|
Incorporated by reference to Exhibit 10.43 on Form 8-K dated June 20, 2016 |
|
|
|
|
|
|
|
10.44 |
|
Amendment No. 2 to Credit and Guaranty Agreement dated June 17, 2016 |
|
Incorporated by reference to Exhibit 10.44 on Form 8-K dated June 20, 2016 |
|
|
|
|
|
|
|
10.45* |
|
|
Incorporated by reference to Exhibit 10.45 on Form 8-K dated July 19, 2017 | |
|
|
|
|
|
|
|
10.46* |
|
Restated Employment Agreement of John Kozlowski dated October 26, 2017 |
|
Incorporated by reference to Exhibit 10.46 on Form 8-K dated November 1, 2017 |
|
|
|
|
|
|
|
10.47* |
|
Employment Agreement of Timothy C. Crew effective as of January 2, 2018 |
|
Incorporated by reference to Exhibit 10.47 on Form 8-K dated December 21, 2017 |
|
|
|
|
|
|
|
10.48* |
|
|
Incorporated by reference to Exhibit 10.48 on Form 8-K dated January 24, 2018 | |
|
|
|
|
|
|
|
10.49* |
|
Addendum to Employment Agreement of Timothy C. Crew dated March 28, 2018 |
|
Incorporated by reference to Exhibit 10.49 on Form 8-K dated April 2, 2018 |
|
|
|
|
|
|
|
10.50* |
|
Employment Agreement of Maureen M. Cavanaugh effective as of May 7, 2018 |
|
Incorporated by reference to Exhibit 10.50 on Form 8-K dated April 23, 2018 |
|
|
|
|
|
|
|
10.51* |
|
|
Incorporated by reference to Exhibit 10.51 on Form 8-K dated June 22, 2018 |
|
Exhibit |
|
Description |
|
Method of Filing |
|
|
|
|
|
|
|
21.1 |
|
|
Filed Herewith | |
|
|
|
|
|
|
|
23.1 |
|
|
Filed Herewith | |
|
|
|
|
|
|
|
31.1 |
|
Certification of Chief Executive Officer Pursuant to Section 302 of the Sarbanes-Oxley Act of 2002 |
|
Filed Herewith |
|
|
|
|
|
|
|
31.2 |
|
Certification of Chief Financial Officer Pursuant to Section 302 of the Sarbanes-Oxley Act of 2002 |
|
Filed Herewith |
|
|
|
|
|
|
|
32 |
|
|
Filed Herewith | |
|
|
|
|
|
|
|
101.INS |
|
XBRL Instance Document |
|
|
|
|
|
|
|
|
|
101.SCH |
|
XBRL Extension Schema Document |
|
|
|
|
|
|
|
|
|
101.CAL |
|
XBRL Calculation Linkbase Document |
|
|
|
|
|
|
|
|
|
101.DEF |
|
XBRL Definition Linkbase Document |
|
|
|
|
|
|
|
|
|
101.LAB |
|
XBRL Label Linkbase Document |
|
|
|
|
|
|
|
|
|
101.PRE |
|
XBRL Presentation Linkbase Document |
|
|
Pursuant to the requirements of Section 13 or 15(d) of the Securities Exchange Act of 1934, the registrant has duly caused this report to be signed on its behalf by the undersigned, thereunto duly authorized.
|
|
|
|
LANNETT COMPANY, INC. | |
|
|
|
|
|
|
|
Date: |
August 28, 2018 |
|
By: |
/s/ Timothy C. Crew |
|
|
|
|
|
Timothy C. Crew, |
|
|
|
|
|
Chief Executive Officer |
Pursuant to the requirements of the Securities Exchange Act of 1934, this report has been signed by the following persons on behalf of the registrant and in the capacities and on the dates indicated.
|
Date: |
August 28, 2018 |
|
By: |
/s/ Martin P. Galvan |
|
|
|
|
|
Martin P. Galvan, |
|
|
|
|
|
Vice President of Finance and Chief Financial Officer |
|
|
|
|
|
|
|
Date: |
August 28, 2018 |
|
By: |
/s/ G. Michael Landis |
|
|
|
|
|
G. Michael Landis, |
|
|
|
|
|
Senior Director of Finance and Treasurer |
|
|
|
|
|
|
|
Date: |
August 28, 2018 |
|
By: |
/s/ Patrick G. LePore |
|
|
|
|
|
Patrick G. LePore, |
|
|
|
|
|
Director, Chairman of the Board of Directors |
|
|
|
|
|
|
|
Date: |
August 28, 2018 |
|
By: |
/s/ Timothy C. Crew |
|
|
|
|
|
Timothy C. Crew, |
|
|
|
|
|
Director, Chief Executive Officer |
|
|
|
|
|
|
|
Date: |
August 28, 2018 |
|
By: |
/s/ David Drabik |
|
|
|
|
|
David Drabik, |
|
|
|
|
|
Director, Chairman of Governance and Nominating Committee |
|
|
|
|
|
|
|
Date: |
August 28, 2018 |
|
By: |
/s/ Paul Taveira |
|
|
|
|
|
Paul Taveira, |
|
|
|
|
|
Director, Chairman of Compensation Committee |
|
|
|
|
|
|
|
Date: |
August 28, 2018 |
|
By: |
/s/ James M. Maher |
|
|
|
|
|
James M. Maher, |
|
|
|
|
|
Director, Chairman of Audit Committee |
|
|
|
|
|
|
|
Date: |
August 28, 2018 |
|
By: |
/s/ John C. Chapman |
|
|
|
|
|
John C. Chapman, |
|
|
|
|
|
Director |
|
|
|
|
|
|
|
Date: |
August 28, 2018 |
|
By: |
/s/ Albert Paonessa III |
|
|
|
|
|
Albert Paonessa III, |
|
|
|
|
|
Director, Chairman of Strategic Planning Committee |
|
|
|
|
|
|
|
Date: |
August 28, 2018 |
|
By: |
/s/ Jeffrey Farber |
|
|
|
|
|
Jeffrey Farber, |
|
|
|
|
|
Director |
Index to Consolidated Financial Statements
Management’s Report on Internal Control over Financial Reporting
Management of Lannett Company Inc. (the “Company”) is responsible for establishing and maintaining adequate internal control over financial reporting. Internal control over financial reporting is defined in Rule 13a-15(f) and 15d-15(f) under the Securities Exchange Act of 1934, as amended. The Company’s internal control framework was designed to provide the Company’s management and Board of Directors, reasonable assurance regarding the reliability of financial reporting and the preparation of financial statements for external purposes in accordance with accounting principles generally accepted in the United States of America.
Because of its inherent limitations, internal control over financial reporting may not prevent or detect misstatements. Projections of any evaluation of effectiveness to future periods are subject to the risk that controls may become inadequate because of changes in conditions, or that the degree of compliance with policies or procedures may deteriorate.
Management used the criteria set forth by the Committee of Sponsoring Organizations of the Treadway Commission (“COSO”) in Internal Control — Integrated Framework (2013) in conducting its assessment as of June 30, 2018. As a result of this assessment, management has concluded that, as of June 30, 2018, the Company’s internal control over financial reporting is effective.
The Company’s independent registered public accounting firm, Grant Thornton, LLP, has issued its report on the effectiveness of the Company’s internal control over financial reporting as of June 30, 2018. Grant Thornton, LLP’s opinion on the Company’s internal control over financial reporting appears on page 100 of this Form 10-K.
Report of Independent Registered Public Accounting Firm
To the Board of Directors and Stockholders of
Lannett Company, Inc.
Opinion on the financial statements
We have audited the accompanying consolidated balance sheets of Lannett Company, Inc. (a Delaware corporation) and subsidiaries (the “Company”) as of June 30, 2018 and 2017, the related consolidated statements of operations, comprehensive income (loss), changes in stockholders’ equity, and cash flows for each of the three fiscal years in the period ended June 30, 2018, and the related notes (collectively referred to as the “financial statements”). Our audits of the consolidated financial statements included the consolidated financial statement schedule listed in the index appearing under Item 15. In our opinion, the financial statements present fairly, in all material respects, the financial position of the Company as of June 30, 2018 and 2017, and the results of its operations and its cash flows for each of the three years in the period ended June 30, 2018, in conformity with accounting principles generally accepted in the United States of America. Also in our opinion, the related consolidated financial statement schedule, when considered in relation to the consolidated financial statements taken as a whole, presents fairly, in all material respects, the information set forth therein.
We also have audited, in accordance with the standards of the Public Company Accounting Oversight Board (United States) (“PCAOB”), the Company’s internal control over financial reporting as of June 30, 2018, based on criteria established in the 2013 Internal Control—Integrated Framework issued by the Committee of Sponsoring Organizations of the Treadway Commission (“COSO”), and our report dated August 28, 2018 expressed an unqualified opinion.
Basis for opinion
These financial statements and financial statement schedule are the responsibility of the Company’s management. Our responsibility is to express an opinion on the Company’s financial statements and financial statement schedule based on our audits. We are a public accounting firm registered with the PCAOB and are required to be independent with respect to the Company in accordance with the U.S. federal securities laws and the applicable rules and regulations of the Securities and Exchange Commission and the PCAOB.
We conducted our audits in accordance with the standards of the PCAOB. Those standards require that we plan and perform the audit to obtain reasonable assurance about whether the financial statements are free of material misstatement, whether due to error or fraud. Our audits included performing procedures to assess the risks of material misstatement of the financial statements, whether due to error or fraud, and performing procedures that respond to those risks. Such procedures included examining, on a test basis, evidence supporting the amounts and disclosures in the financial statements. Our audits also included evaluating the accounting principles used and significant estimates made by management, as well as evaluating the overall presentation of the financial statements. We believe that our audits provide a reasonable basis for our opinion.
|
/s/ GRANT THORNTON LLP |
|
|
|
|
|
We have served as the Company’s auditor since 2000. |
|
|
|
|
|
Iselin, New Jersey |
|
|
August 28, 2018 |
|
Report of Independent Registered Public Accounting Firm
To the Board of Directors and Stockholders of
Lannett Company, Inc.
Opinion on internal control over financial reporting
We have audited the internal control over financial reporting of Lannett Company, Inc. (a Delaware corporation) and subsidiaries (the “Company”) as of June 30, 2018, based on criteria established in the 2013 Internal Control—Integrated Framework issued by the Committee of Sponsoring Organizations of the Treadway Commission (“COSO”). In our opinion, the Company maintained, in all material respects, effective internal control over financial reporting as of June 30, 2018, based on criteria established in the 2013 Internal Control—Integrated Framework issued by COSO.
We also have audited, in accordance with the standards of the Public Company Accounting Oversight Board (United States) (“PCAOB”), the consolidated financial statements and financial statement schedule of the Company as of and for the year ended June 30, 2018, and our report dated August 28, 2018 expressed an unqualified opinion on those financial statements.
Basis for opinion
The Company’s management is responsible for maintaining effective internal control over financial reporting and for its assessment of the effectiveness of internal control over financial reporting, included in the accompanying Management’s Report on Internal Control over Financial Reporting. Our responsibility is to express an opinion on the Company’s internal control over financial reporting based on our audit. We are a public accounting firm registered with the PCAOB and are required to be independent with respect to the Company in accordance with the U.S. federal securities laws and the applicable rules and regulations of the Securities and Exchange Commission and the PCAOB.
We conducted our audit in accordance with the standards of the PCAOB. Those standards require that we plan and perform the audit to obtain reasonable assurance about whether effective internal control over financial reporting was maintained in all material respects. Our audit included obtaining an understanding of internal control over financial reporting, assessing the risk that a material weakness exists, testing and evaluating the design and operating effectiveness of internal control based on the assessed risk, and performing such other procedures as we considered necessary in the circumstances. We believe that our audit provides a reasonable basis for our opinion.
Definition and limitations of internal control over financial reporting
A company’s internal control over financial reporting is a process designed to provide reasonable assurance regarding the reliability of financial reporting and the preparation of financial statements for external purposes in accordance with generally accepted accounting principles. A company’s internal control over financial reporting includes those policies and procedures that (1) pertain to the maintenance of records that, in reasonable detail, accurately and fairly reflect the transactions and dispositions of the assets of the company; (2) provide reasonable assurance that transactions are recorded as necessary to permit preparation of financial statements in accordance with generally accepted accounting principles, and that receipts and expenditures of the company are being made only in accordance with authorizations of management and directors of the company; and (3) provide reasonable assurance regarding prevention or timely detection of unauthorized acquisition, use, or disposition of the company’s assets that could have a material effect on the financial statements.
Because of its inherent limitations, internal control over financial reporting may not prevent or detect misstatements. Also, projections of any evaluation of effectiveness to future periods are subject to the risk that controls may become inadequate because of changes in conditions, or that the degree of compliance with the policies or procedures may deteriorate.
|
/s/ GRANT THORNTON LLP |
|
|
|
|
|
Iselin, New Jersey |
|
|
August 28, 2018 |
|
LANNETT COMPANY, INC.
(In thousands, except share and per share data)
|
|
|
June 30, 2018 |
|
June 30, 2017 |
| ||
|
ASSETS |
|
|
|
|
| ||
|
Current assets: |
|
|
|
|
| ||
|
Cash and cash equivalents |
|
$ |
98,586 |
|
$ |
117,737 |
|
|
Investment securities |
|
— |
|
27,091 |
| ||
|
Accounts receivable, net |
|
252,651 |
|
204,066 |
| ||
|
Inventories |
|
141,635 |
|
122,604 |
| ||
|
Prepaid income taxes |
|
15,159 |
|
16,703 |
| ||
|
Assets held for sale |
|
13,976 |
|
— |
| ||
|
Other current assets |
|
4,863 |
|
6,592 |
| ||
|
Total current assets |
|
526,870 |
|
494,793 |
| ||
|
Property, plant and equipment, net |
|
233,247 |
|
243,148 |
| ||
|
Intangible assets, net |
|
424,425 |
|
453,861 |
| ||
|
Goodwill |
|
339,566 |
|
339,566 |
| ||
|
Deferred tax assets |
|
22,063 |
|
52,753 |
| ||
|
Other assets |
|
29,133 |
|
19,191 |
| ||
|
TOTAL ASSETS |
|
$ |
1,575,304 |
|
$ |
1,603,312 |
|
|
|
|
|
|
|
| ||
|
LIABILITIES |
|
|
|
|
| ||
|
Current liabilities: |
|
|
|
|
| ||
|
Accounts payable |
|
$ |
56,767 |
|
$ |
44,720 |
|
|
Accrued expenses |
|
7,425 |
|
12,499 |
| ||
|
Accrued payroll and payroll-related expenses |
|
7,819 |
|
4,833 |
| ||
|
Rebates payable |
|
49,400 |
|
44,593 |
| ||
|
Royalties payable |
|
5,955 |
|
3,015 |
| ||
|
Restructuring liability |
|
6,706 |
|
5,431 |
| ||
|
Settlement liability |
|
— |
|
17,000 |
| ||
|
Short-term borrowings and current portion of long-term debt |
|
66,845 |
|
60,117 |
| ||
|
Total current liabilities |
|
200,917 |
|
192,208 |
| ||
|
Long-term debt, net |
|
772,425 |
|
843,530 |
| ||
|
Other liabilities |
|
3,047 |
|
6,452 |
| ||
|
TOTAL LIABILITIES |
|
976,389 |
|
1,042,190 |
| ||
|
Commitments and contingencies (Note 11 and 12) |
|
|
|
|
| ||
|
|
|
|
|
|
| ||
|
STOCKHOLDERS’ EQUITY |
|
|
|
|
| ||
|
Common stock ($0.001 par value, 100,000,000 shares authorized; 38,256,839 and 37,528,450 shares issued; 37,380,517 and 36,919,296 shares outstanding at June 30, 2018 and 2017, respectively) |
|
38 |
|
37 |
| ||
|
Additional paid-in capital |
|
306,817 |
|
292,780 |
| ||
|
Retained earnings |
|
306,464 |
|
277,774 |
| ||
|
Accumulated other comprehensive loss |
|
(515 |
) |
(222 |
) | ||
|
Treasury stock (876,322 and 609,154 shares at June 30, 2018 and 2017, respectively) |
|
(13,889 |
) |
(9,247 |
) | ||
|
Total Lannett Company, Inc. stockholders’ equity |
|
598,915 |
|
561,122 |
| ||
|
Noncontrolling Interest |
|
— |
|
— |
| ||
|
Total stockholders’ equity |
|
598,915 |
|
561,122 |
| ||
|
TOTAL LIABILITIES AND STOCKHOLDERS’ EQUITY |
|
$ |
1,575,304 |
|
$ |
1,603,312 |
|
The accompanying notes are an integral part of the consolidated financial statements.
LANNETT COMPANY, INC.
CONSOLIDATED STATEMENTS OF OPERATIONS
(In thousands, except share and per share data)
|
|
|
Fiscal Year Ended June 30, |
| |||||||
|
|
|
2018 |
|
2017 |
|
2016 |
| |||
|
|
|
|
|
|
|
|
| |||
|
Net sales |
|
$ |
684,563 |
|
$ |
637,341 |
|
$ |
566,091 |
|
|
Settlement agreement |
|
— |
|
(4,000 |
) |
(23,598 |
) | |||
|
Total net sales |
|
684,563 |
|
633,341 |
|
542,493 |
| |||
|
Cost of sales |
|
363,729 |
|
300,030 |
|
237,371 |
| |||
|
Amortization of intangibles |
|
32,128 |
|
32,098 |
|
18,629 |
| |||
|
Gross profit |
|
288,706 |
|
301,213 |
|
286,493 |
| |||
|
Operating expenses: |
|
|
|
|
|
|
| |||
|
Research and development expenses |
|
29,196 |
|
42,073 |
|
45,054 |
| |||
|
Selling, general and administrative expenses |
|
82,196 |
|
73,477 |
|
68,325 |
| |||
|
Acquisition and integration-related expenses |
|
83 |
|
3,965 |
|
27,190 |
| |||
|
Restructuring expenses |
|
7,061 |
|
7,168 |
|
7,166 |
| |||
|
Loss on sale of intangible asset |
|
15,514 |
|
— |
|
— |
| |||
|
Asset impairment charges |
|
24,960 |
|
88,084 |
|
8,000 |
| |||
|
Total operating expenses |
|
159,010 |
|
214,767 |
|
155,735 |
| |||
|
Operating income |
|
129,696 |
|
86,446 |
|
130,758 |
| |||
|
Other income (loss): |
|
|
|
|
|
|
| |||
|
Loss on extinguishment of debt |
|
— |
|
— |
|
(3,009 |
) | |||
|
Investment income |
|
4,753 |
|
3,768 |
|
368 |
| |||
|
Interest expense |
|
(85,634 |
) |
(89,420 |
) |
(65,937 |
) | |||
|
Other |
|
2,278 |
|
(244 |
) |
(1 |
) | |||
|
Total other loss |
|
(78,603 |
) |
(85,896 |
) |
(68,579 |
) | |||
|
Income before income taxes |
|
51,093 |
|
550 |
|
62,179 |
| |||
|
Income tax expense |
|
22,403 |
|
1,097 |
|
17,322 |
| |||
|
Net income (loss) |
|
28,690 |
|
(547 |
) |
44,857 |
| |||
|
Less: Net income attributable to noncontrolling interest |
|
— |
|
34 |
|
75 |
| |||
|
Net income (loss) attributable to Lannett Company, Inc. |
|
$ |
28,690 |
|
$ |
(581 |
) |
$ |
44,782 |
|
|
|
|
|
|
|
|
|
| |||
|
Earnings (loss) per common share attributable to Lannett Company, Inc.: |
|
|
|
|
|
|
| |||
|
Basic |
|
$ |
0.77 |
|
$ |
(0.02 |
) |
$ |
1.23 |
|
|
Diluted |
|
$ |
0.75 |
|
$ |
(0.02 |
) |
$ |
1.20 |
|
|
|
|
|
|
|
|
|
| |||
|
Weighted average common shares outstanding: |
|
|
|
|
|
|
| |||
|
Basic |
|
37,127,306 |
|
36,812,524 |
|
36,442,782 |
| |||
|
Diluted |
|
38,162,514 |
|
36,812,524 |
|
37,389,445 |
| |||
The accompanying notes are an integral part of the consolidated financial statements.
LANNETT COMPANY, INC.
CONSOLIDATED STATEMENTS OF COMPREHENSIVE INCOME (LOSS)
(In thousands)
|
|
|
Fiscal Year Ended June 30, |
| |||||||
|
|
|
2018 |
|
2017 |
|
2016 |
| |||
|
|
|
|
|
|
|
|
| |||
|
Net income (loss) |
|
$ |
28,690 |
|
$ |
(547 |
) |
$ |
44,857 |
|
|
Other comprehensive income (loss), before taxes: |
|
|
|
|
|
|
| |||
|
Foreign currency translation gain (loss) |
|
(293 |
) |
73 |
|
— |
| |||
|
Total other comprehensive income (loss), net of taxes |
|
(293 |
) |
73 |
|
— |
| |||
|
Comprehensive income (loss) |
|
28,397 |
|
(474 |
) |
44,857 |
| |||
|
Less: Total comprehensive income attributable to noncontrolling interest |
|
— |
|
34 |
|
75 |
| |||
|
Comprehensive income (loss) attributable to Lannett Company, Inc. |
|
$ |
28,397 |
|
$ |
(508 |
) |
$ |
44,782 |
|
The accompanying notes are an integral part of the consolidated financial statements.
LANNETT COMPANY, INC.
CONSOLIDATED STATEMENTS OF CHANGES IN STOCKHOLDERS’ EQUITY
(In thousands)
|
|
|
Stockholders’ Equity Attributable to Lannett Company Inc. |
|
|
|
|
| ||||||||||||||||||||
|
|
|
|
|
|
|
|
|
|
|
Accumulated |
|
|
|
Stockholders’ |
|
|
|
|
| ||||||||
|
|
|
Common Stock |
|
Additional |
|
|
|
Other |
|
|
|
Equity |
|
|
|
Total |
| ||||||||||
|
|
|
Shares |
|
|
|
Paid-In |
|
Retained |
|
Comprehensive |
|
Treasury |
|
Attributable to |
|
Noncontrolling |
|
Stockholders’ |
| ||||||||
|
|
|
Issued |
|
Amount |
|
Capital |
|
Earnings |
|
Income (loss) |
|
Stock |
|
Lannett Co., Inc. |
|
Interest |
|
Equity |
| ||||||||
|
|
|
|
|
|
|
|
|
|
|
|
|
|
|
|
|
|
|
|
| ||||||||
|
Balance, June 30, 2015 |
|
36,783 |
|
$ |
37 |
|
$ |
236,178 |
|
$ |
233,573 |
|
$ |
(295 |
) |
$ |
(6,080 |
) |
$ |
463,413 |
|
$ |
353 |
|
$ |
463,766 |
|
|
|
|
|
|
|
|
|
|
|
|
|
|
|
|
|
|
|
|
|
| ||||||||
|
Shares issued in connection with share-based compensation plans |
|
367 |
|
— |
|
4,134 |
|
— |
|
— |
|
— |
|
4,134 |
|
— |
|
4,134 |
| ||||||||
|
Share-based compensation |
|
— |
|
— |
|
11,562 |
|
— |
|
— |
|
— |
|
11,562 |
|
— |
|
11,562 |
| ||||||||
|
Excess tax benefits on share-based compensation awards |
|
— |
|
— |
|
1,507 |
|
— |
|
— |
|
— |
|
1,507 |
|
— |
|
1,507 |
| ||||||||
|
Purchase of treasury stock |
|
— |
|
— |
|
— |
|
— |
|
— |
|
(1,269 |
) |
(1,269 |
) |
— |
|
(1,269 |
) | ||||||||
|
Issuance of warrant |
|
— |
|
— |
|
29,920 |
|
— |
|
— |
|
— |
|
29,920 |
|
— |
|
29,920 |
| ||||||||
|
Distribution to noncontrolling interests |
|
— |
|
— |
|
— |
|
— |
|
— |
|
— |
|
— |
|
(20 |
) |
(20 |
) | ||||||||
|
Net income |
|
— |
|
— |
|
— |
|
44,782 |
|
— |
|
— |
|
44,782 |
|
75 |
|
44,857 |
| ||||||||
|
|
|
|
|
|
|
|
|
|
|
|
|
|
|
|
|
|
|
|
| ||||||||
|
Balance, June 30, 2016 |
|
37,150 |
|
$ |
37 |
|
$ |
283,301 |
|
$ |
278,355 |
|
$ |
(295 |
) |
$ |
(7,349 |
) |
$ |
554,049 |
|
$ |
408 |
|
$ |
554,457 |
|
|
|
|
|
|
|
|
|
|
|
|
|
|
|
|
|
|
|
|
|
| ||||||||
|
Shares issued in connection with share-based compensation plans |
|
378 |
|
— |
|
2,818 |
|
— |
|
— |
|
— |
|
2,818 |
|
— |
|
2,818 |
| ||||||||
|
Share-based compensation |
|
— |
|
— |
|
7,719 |
|
— |
|
— |
|
— |
|
7,719 |
|
— |
|
7,719 |
| ||||||||
|
Purchase of noncontrolling interest |
|
— |
|
— |
|
(1,058 |
) |
— |
|
— |
|
— |
|
(1,058 |
) |
(442 |
) |
(1,500 |
) | ||||||||
|
Purchase of treasury stock |
|
— |
|
— |
|
— |
|
— |
|
— |
|
(1,898 |
) |
(1,898 |
) |
— |
|
(1,898 |
) | ||||||||
|
Other comprehensive income, net of income tax |
|
— |
|
— |
|
— |
|
— |
|
73 |
|
— |
|
73 |
|
— |
|
73 |
| ||||||||
|
Net income (loss) |
|
— |
|
— |
|
— |
|
(581 |
) |
— |
|
— |
|
(581 |
) |
34 |
|
(547 |
) | ||||||||
|
|
|
|
|
|
|
|
|
|
|
|
|
|
|
|
|
|
|
|
| ||||||||
|
Balance, June 30, 2017 |
|
37,528 |
|
$ |
37 |
|
$ |
292,780 |
|
$ |
277,774 |
|
$ |
(222 |
) |
$ |
(9,247 |
) |
$ |
561,122 |
|
$ |
— |
|
$ |
561,122 |
|
|
Shares issued in connection with share-based compensation plans |
|
729 |
|
1 |
|
4,141 |
|
— |
|
— |
|
— |
|
4,142 |
|
— |
|
4,142 |
| ||||||||
|
Share-based compensation |
|
— |
|
— |
|
9,896 |
|
— |
|
— |
|
— |
|
9,896 |
|
— |
|
9,896 |
| ||||||||
|
Purchase of treasury stock |
|
— |
|
— |
|
— |
|
— |
|
— |
|
(4,642 |
) |
(4,642 |
) |
— |
|
(4,642 |
) | ||||||||
|
Other comprehensive income, net of income tax |
|
— |
|
— |
|
— |
|
— |
|
(293 |
) |
— |
|
(293 |
) |
— |
|
(293 |
) | ||||||||
|
Net income |
|
— |
|
— |
|
— |
|
28,690 |
|
— |
|
— |
|
28,690 |
|
— |
|
28,690 |
| ||||||||
|
|
|
|
|
|
|
|
|
|
|
|
|
|
|
|
|
|
|
|
| ||||||||
|
Balance, June 30, 2018 |
|
38,257 |
|
$ |
38 |
|
$ |
306,817 |
|
$ |
306,464 |
|
$ |
(515 |
) |
$ |
(13,889 |
) |
$ |
598,915 |
|
$ |
— |
|
$ |
598,915 |
|
The accompanying notes are an integral part of the consolidated financial statements.
LANNETT COMPANY, INC.
CONSOLIDATED STATEMENTS OF CASH FLOWS
(In thousands)
|
|
|
Fiscal Year Ended June 30, |
| |||||||
|
|
|
2018 |
|
2017 |
|
2016 |
| |||
|
OPERATING ACTIVITIES: |
|
|
|
|
|
|
| |||
|
Net income (loss) |
|
$ |
28,690 |
|
$ |
(547 |
) |
$ |
44,857 |
|
|
Adjustments to reconcile net income (loss) to net cash provided by operating activities: |
|
|
|
|
|
|
| |||
|
Depreciation and amortization |
|
55,115 |
|
55,340 |
|
33,433 |
| |||
|
Deferred income tax expense (benefit) |
|
30,690 |
|
(305 |
) |
(19,497 |
) | |||
|
Share-based compensation |
|
9,896 |
|
7,719 |
|
11,562 |
| |||
|
Excess tax benefits on share-based compensation awards |
|
— |
|
— |
|
(1,507 |
) | |||
|
Asset impairment charges |
|
24,960 |
|
88,084 |
|
8,000 |
| |||
|
Loss on sale/disposal of assets |
|
848 |
|
290 |
|
92 |
| |||
|
Loss (gain) on investment securities |
|
(3,313 |
) |
(2,914 |
) |
11 |
| |||
|
Loss on extinguishment of debt |
|
— |
|
— |
|
3,009 |
| |||
|
Loss on sale of intangible asset |
|
15,514 |
|
— |
|
— |
| |||
|
Amortization of debt discount and other debt issuance costs |
|
21,866 |
|
20,577 |
|
12,484 |
| |||
|
Other noncash expenses |
|
5 |
|
1,889 |
|
523 |
| |||
|
Changes in assets and liabilities which provided (used) cash, net of acquisitions: |
|
|
|
|
|
|
| |||
|
Accounts receivable, net |
|
(48,585 |
) |
1,701 |
|
15,149 |
| |||
|
Inventories |
|
(19,031 |
) |
(7,700 |
) |
15,296 |
| |||
|
Prepaid income taxes/Income taxes payable |
|
2,174 |
|
(17,748 |
) |
1,717 |
| |||
|
Other assets |
|
(2,287 |
) |
1,916 |
|
7,719 |
| |||
|
Rebates payable |
|
4,807 |
|
14,369 |
|
4,525 |
| |||
|
Royalties payable |
|
2,940 |
|
(2,112 |
) |
1,524 |
| |||
|
Restructuring liability |
|
1,275 |
|
1,301 |
|
4,130 |
| |||
|
Settlement liability |
|
— |
|
1,000 |
|
18,598 |
| |||
|
Accounts payable |
|
(4,953 |
) |
5,000 |
|
(3,723 |
) | |||
|
Accrued expenses |
|
(5,074 |
) |
3,252 |
|
(1,760 |
) | |||
|
Accrued payroll and payroll-related expenses |
|
2,986 |
|
(5,739 |
) |
(20,865 |
) | |||
|
Net cash provided by operating activities |
|
118,523 |
|
165,373 |
|
135,277 |
| |||
|
INVESTING ACTIVITIES: |
|
|
|
|
|
|
| |||
|
Purchases of property, plant and equipment |
|
(52,316 |
) |
(48,694 |
) |
(24,267 |
) | |||
|
Proceeds from sale of property, plant and equipment |
|
28 |
|
112 |
|
16 |
| |||
|
Advance to variable interest entity |
|
(10,254 |
) |
— |
|
— |
| |||
|
Purchases of intangible assets |
|
(19,038 |
) |
— |
|
— |
| |||
|
Acquisitions, net of cash acquired |
|
— |
|
— |
|
(934,178 |
) | |||
|
Proceeds from sale of investment securities |
|
94,047 |
|
67,828 |
|
39,895 |
| |||
|
Purchase of investment securities |
|
(63,643 |
) |
(77,911 |
) |
(40,533 |
) | |||
|
Net cash used in investing activities |
|
(51,176 |
) |
(58,665 |
) |
(959,067 |
) | |||
|
FINANCING ACTIVITIES: |
|
|
|
|
|
|
| |||
|
Proceeds from issuance of debt |
|
— |
|
— |
|
1,048,610 |
| |||
|
Short-term borrowings under revolving credit facility |
|
— |
|
— |
|
125,000 |
| |||
|
Repayments of short-term borrowings and long-term debt |
|
(85,705 |
) |
(178,233 |
) |
(295,033 |
) | |||
|
Purchase of noncontrolling interest |
|
— |
|
(1,500 |
) |
— |
| |||
|
Acquisition-related contingent consideration |
|
— |
|
(35,000 |
) |
— |
| |||
|
Proceeds from issuance of stock |
|
4,142 |
|
2,818 |
|
4,134 |
| |||
|
Payment of debt issuance costs |
|
— |
|
— |
|
(34,710 |
) | |||
|
Excess tax benefits on share-based compensation awards |
|
— |
|
— |
|
1,507 |
| |||
|
Purchase of treasury stock |
|
(4,642 |
) |
(1,898 |
) |
(1,269 |
) | |||
|
Distributions to noncontrolling shareholders |
|
— |
|
— |
|
(20 |
) | |||
|
Net cash provided by (used in) financing activities |
|
(86,205 |
) |
(213,813 |
) |
848,219 |
| |||
|
Effect on cash and cash equivalents of changes in foreign exchange rates |
|
(293 |
) |
73 |
|
— |
| |||
|
NET INCREASE (DECREASE) IN CASH AND CASH EQUIVALENTS |
|
(19,151 |
) |
(107,032 |
) |
24,429 |
| |||
|
CASH AND CASH EQUIVALENTS, BEGINNING OF PERIOD |
|
117,737 |
|
224,769 |
|
200,340 |
| |||
|
CASH AND CASH EQUIVALENTS, END OF PERIOD |
|
$ |
98,586 |
|
$ |
117,737 |
|
$ |
224,769 |
|
|
SUPPLEMENTAL DISCLOSURE OF CASH FLOW INFORMATION: |
|
|
|
|
|
|
| |||
|
Interest paid (net of amounts capitalized of $1.6 million, $1.3 million and $0 for the years ended June 30, 2018, 2017 and 2016, respectively) |
|
$ |
63,563 |
|
$ |
67,115 |
|
$ |
52,916 |
|
|
Income taxes paid (refunded) |
|
$ |
(6,559 |
) |
$ |
19,150 |
|
$ |
35,141 |
|
|
Credits issued pursuant to Settlement Agreement |
|
$ |
17,000 |
|
$ |
5,000 |
|
$ |
— |
|
|
Issuance of unsecured 12.0% Senior Notes to finance KUPI acquisition |
|
$ |
— |
|
$ |
— |
|
$ |
200,000 |
|
|
Issuance of a warrant to finance KUPI acquisition |
|
$ |
— |
|
$ |
— |
|
$ |
29,920 |
|
|
Acquisition-related contingent consideration |
|
$ |
— |
|
$ |
— |
|
$ |
35,000 |
|
The accompanying notes are an integral part of the consolidated financial statements.
LANNETT COMPANY, INC.
NOTES TO CONSOLIDATED FINANCIAL STATEMENTS
Note 1. The Business and Nature of Operations
Lannett Company, Inc. (a Delaware corporation) and its subsidiaries (collectively, the “Company” or “Lannett”) primarily develop, manufacture, package, market and distribute solid oral and extended release (tablets and capsules), topical, nasal and oral solution finished dosage forms of drugs that address a wide range of therapeutic areas. Certain of these products are manufactured by others and distributed by the Company, most notably under the Jerome Stevens Distribution Agreement. The Company also manufactures active pharmaceutical ingredients through its Cody Laboratories, Inc. (“Cody Labs”) subsidiary.
On November 25, 2015, the Company completed the acquisition of Kremers Urban Pharmaceuticals, Inc. (“KUPI”), the former U.S. specialty generic pharmaceuticals subsidiary of global biopharmaceuticals company UCB S.A. (“UCB”). KUPI is a specialty pharmaceuticals manufacturer focused on the development of products that are difficult to formulate or utilize specialized delivery technologies. Strategic benefits of the acquisition include expanded manufacturing capacity, a diversified product portfolio and pipeline and complementary research and development expertise.
The Company operates pharmaceutical manufacturing plants in Philadelphia, Pennsylvania; Cody, Wyoming; Carmel, New York and Seymour, Indiana. The Company’s customers include generic pharmaceutical distributors, drug wholesalers, chain drug stores, private label distributors, mail-order pharmacies, other pharmaceutical manufacturers, managed care organizations, hospital buying groups, governmental entities and health maintenance organizations.
Note 2. Summary of Significant Accounting Policies
Basis of Presentation
The Consolidated Financial Statements have been prepared in conformity with generally accepted accounting principles in the United States (“U.S. GAAP”).
Principles of consolidation
The Consolidated Financial Statements include the accounts of Lannett Company, Inc. and its wholly-owned subsidiaries, as well as Cody LCI Realty, LLC (“Realty”), a former variable interest entity (“VIE”) in which the Company had a 50% ownership interest until November 30, 2016, when the Company acquired the remaining 50% interest. Noncontrolling interest in Realty was recorded net of tax as net income attributable to the noncontrolling interest. In December 2017, the Company legally dissolved Realty. Additionally, all intercompany accounts and transactions have been eliminated.
Business Combinations
Acquired businesses are accounted for using the acquisition method of accounting, which requires that the assets acquired and liabilities assumed be recorded at the date of acquisition at their respective estimated fair values. The fair values and useful lives assigned to each class of assets acquired and liabilities assumed are based on, among other factors, the expected future period of benefit of the asset, the various characteristics of the asset and projected future cash flows. Significant judgment is employed in determining the assumptions utilized as of the acquisition date and for each subsequent measurement period. Accordingly, changes in assumptions described above could have a material impact on our consolidated results of operations.
Reclassifications
Certain prior year amounts have been reclassified to conform to the current year financial statement presentation.
Use of estimates
The preparation of financial statements in conformity with U.S. GAAP requires management to make estimates and assumptions that affect the reported amounts of assets and liabilities at the date of the financial statements and the reported amounts of revenues and expenses during the reporting period. Significant estimates and assumptions are required in the determination of revenue recognition and sales deductions for estimated chargebacks, rebates, returns and other adjustments including a provision for the Company’s liability under the Medicare Part D program. Additionally, significant estimates and assumptions are required when determining the fair value of long-lived assets, including goodwill and intangible assets, income taxes, contingencies and share-based compensation.
Because of the inherent subjectivity and complexity involved in these estimates and assumptions, actual results could differ from those estimates.
Foreign currency translation
The Consolidated Financial Statements are presented in U.S. Dollars, the reporting currency of the Company. The financial statements of the Company’s foreign subsidiary are maintained in local currency and translated into U.S. dollars at the end of each reporting period. Assets and liabilities are translated at period-end exchange rates, while revenues and expenses are translated at average exchange rates during the period. The adjustments resulting from the use of differing exchange rates are recorded as part of stockholders’ equity in accumulated other comprehensive income (loss). Gains and losses resulting from transactions denominated in foreign currencies are recognized in the Consolidated Statements of Operations under Other income (loss). Amounts recorded due to foreign currency fluctuations are immaterial to the Consolidated Financial Statements.
Cash and cash equivalents
The Company considers all highly liquid investments with original maturities less than or equal to three months at the date of purchase to be cash and cash equivalents. Cash and cash equivalents are stated at cost, which approximates fair value, and consist of bank deposits and certificates of deposit that are readily convertible into cash. The Company maintains its cash deposits and cash equivalents at well-known, stable financial institutions. Such amounts frequently exceed insured limits.
Investment securities
The Company’s investment securities consisted of publicly-traded equity securities which are classified as trading investments. Investment securities are recorded at fair value based on quoted market prices from broker or dealer quotations or transparent pricing sources at each reporting date. Realized and unrealized gains and losses are included in the Consolidated Statements of Operations under Other income (loss). In May 2018, the Company liquidated the remainder of the investment securities portfolio. As of June 30, 2018, the Company does not own investment securities.
Allowance for doubtful accounts
The Company continuously monitors collections and payments from its customers and maintains a provision for estimated credit losses. The Company determines its allowance for doubtful accounts by considering a number of factors, including the length of time balances are past due, the Company’s previous loss history, the customer’s current ability to pay its obligations to the Company and the condition of the general economy and the industry as a whole. The Company writes off accounts receivable when they are determined to be uncollectible.
Inventories
Inventories are stated at the lower of cost or net realizable value by the first-in, first-out method. Inventories are regularly reviewed and write-downs for excess and obsolete inventory are recorded based primarily on current inventory levels, expiration date and estimated sales forecasts.
Property, Plant and Equipment
Property, plant and equipment are stated at cost less accumulated depreciation. Depreciation is computed on a straight-line basis over the assets’ estimated useful lives.
Intangible Assets
Definite-lived intangible assets are stated at cost less accumulated amortization. Amortization of definite-lived intangible assets is computed on a straight-line basis over the assets’ estimated useful lives, generally for periods ranging from 10 to 15 years. The Company continually evaluates the reasonableness of the useful lives of these assets. Indefinite-lived intangible assets are not amortized, but instead are tested at least annually for impairment. Costs to renew or extend the term of a recognized intangible asset are expensed as incurred.
Valuation of Long-Lived Assets, including Intangible Assets
The Company’s long-lived assets primarily consist of property, plant and equipment and definite and indefinite-lived intangible assets. Property, plant and equipment and definite-lived intangible assets are reviewed for impairment whenever events or changes in circumstances (“triggering events”) indicate that the carrying amount of the asset may not be recoverable. If a triggering event is determined to have occurred, the asset’s carrying value is compared to the future undiscounted cash flows expected to be generated by the asset. If the carrying value exceeds the undiscounted cash flows of the asset, then impairment exists. Indefinite-lived intangible assets are tested for impairment at least annually during the fourth quarter of each fiscal year or more frequently if events or triggering events indicate that the asset might be impaired.
An impairment loss is measured as the excess of the asset’s carrying value over its fair value, which in most cases is calculated using a discounted cash flow model. Discounted cash flow models are highly reliant on various assumptions which are considered Level 3 inputs, including estimates of future cash flows (including long-term growth rates), discount rates and the probability of achieving the estimated cash flows.
In-Process Research and Development
Amounts allocated to in-process research and development in connection with a business combination are recorded at fair value and are considered indefinite-lived intangible assets subject to impairment testing in accordance with the Company’s impairment testing policy for indefinite-lived intangible assets. As products in development are approved for sale, amounts will be allocated to product rights and will be amortized over their estimated useful lives. Definite-lived intangible assets are amortized over the expected lives of the related assets. The judgments made in determining the estimated fair value of in-process research and development, as well as asset lives, can materially impact our results of operations. The Company’s fair value assessments are highly reliant on various assumptions which are considered Level 3 inputs, including estimates of future cash flows (including long-term growth rates), discount rates and the probability of achieving the estimated cash flows.
Goodwill
Goodwill, which represents the excess of purchase price over the fair value of net assets acquired, is carried at cost. Goodwill is tested for impairment on an annual basis on the first day of the fourth quarter of each fiscal year or more frequently if events or triggering events indicate that the asset might be impaired. The Company utilizes a quantitative assessment to determine the fair value of our reporting unit (generic pharmaceuticals). If the carrying value of our reporting unit exceeds its fair value, the difference will be recorded as a goodwill impairment, not to exceed the carrying amount of goodwill. The Company’s fair value assessments are highly reliant on various assumptions which are considered Level 3 inputs, including estimates of future cash flows (including long-term growth rates), discount rates and the probability of achieving the estimated cash flows. The judgments made in determining the estimated fair value of goodwill can materially impact our results of operations.
Segment Information
The Company operates in one reportable segment, generic pharmaceuticals. As such, the Company aggregates its financial information for all products. The following table identifies the Company’s net sales by medical indication for fiscal years ended June 30, 2018, 2017 and 2016:
|
(In thousands) |
|
Fiscal Year Ended June 30, |
| |||||||
|
Medical Indication |
|
2018 |
|
2017 |
|
2016 |
| |||
|
Antibiotic |
|
$ |
14,509 |
|
$ |
16,748 |
|
$ |
14,558 |
|
|
Anti-Psychosis |
|
59,557 |
|
58,625 |
|
5,462 |
| |||
|
Cardiovascular |
|
64,011 |
|
50,628 |
|
53,541 |
| |||
|
Central Nervous System |
|
31,789 |
|
39,451 |
|
36,291 |
| |||
|
Gallstone |
|
20,280 |
|
48,600 |
|
67,348 |
| |||
|
Gastrointestinal |
|
60,294 |
|
71,887 |
|
52,699 |
| |||
|
Glaucoma |
|
6,540 |
|
18,763 |
|
25,336 |
| |||
|
Migraine |
|
54,015 |
|
29,014 |
|
21,776 |
| |||
|
Muscle Relaxant |
|
13,496 |
|
13,636 |
|
5,403 |
| |||
|
Pain Management |
|
23,036 |
|
26,135 |
|
29,804 |
| |||
|
Respiratory |
|
7,891 |
|
10,516 |
|
9,982 |
| |||
|
Thyroid Deficiency |
|
245,929 |
|
174,005 |
|
162,411 |
| |||
|
Urinary |
|
8,661 |
|
14,695 |
|
17,398 |
| |||
|
Other |
|
54,720 |
|
47,196 |
|
42,039 |
| |||
|
Contract manufacturing revenue |
|
19,835 |
|
17,442 |
|
22,043 |
| |||
|
Net sales |
|
684,563 |
|
637,341 |
|
566,091 |
| |||
|
Settlement agreement |
|
— |
|
(4,000 |
) |
(23,598 |
) | |||
|
Total net sales |
|
$ |
684,563 |
|
$ |
633,341 |
|
$ |
542,493 |
|
Customer, Supplier and Product Concentration
The following table presents the percentage of total net sales, for the fiscal years ended June 30, 2018, 2017 and 2016, for certain of the Company’s products, defined as products containing the same active ingredient or combination of ingredients, which accounted for at least 10% of total net sales in any of those periods:
|
|
|
June 30, |
|
June 30, |
|
June 30, |
|
|
|
|
|
|
|
|
|
|
|
Product 1 |
|
36 |
% |
27 |
% |
30 |
% |
|
Product 2 |
|
3 |
% |
8 |
% |
12 |
% |
The following table presents the percentage of total net sales, for the fiscal years ended June 30, 2018, 2017 and 2016, for certain of the Company’s customers which accounted for at least 10% of total net sales in any of those periods:
|
|
|
June 30, |
|
June 30, |
|
June 30, |
|
|
|
|
|
|
|
|
|
|
|
Customer A |
|
29 |
% |
28 |
% |
25 |
% |
|
Customer B |
|
17 |
% |
21 |
% |
16 |
% |
The Company’s primary finished goods inventory supplier is Jerome Stevens Pharmaceuticals, Inc. (“JSP”), in Bohemia, New York. Purchases of finished goods inventory from JSP accounted for 37%, 36% and 52% of the Company’s inventory purchases in fiscal years 2018, 2017 and 2016, respectively. See Note 20 “Material Contracts with Suppliers” for more information.
Revenue Recognition
The Company recognizes revenue when title and risk of loss have transferred to the customer and provisions for rebates, promotional adjustments, price adjustments, returns, chargebacks and other potential adjustments are reasonably determinable and collection is reasonably assured. The Company also considers all other relevant criteria specified in Securities and Exchange Commission Staff Accounting Bulletin No. 104, Topic No. 13, “Revenue Recognition”, in determining when to recognize revenue.
Net Sales Adjustments
When revenue is recognized a simultaneous adjustment to gross sales is made for estimated chargebacks, rebates, returns, promotional adjustments and other potential adjustments. These provisions are primarily estimated based on historical experience, future expectations, contractual arrangements with wholesalers and indirect customers and other factors known to management at the time of accrual. Accruals for provisions are presented in the Consolidated Financial Statements as a reduction to gross sales with the corresponding reserve presented as a reduction of accounts receivable or included as rebates payable, depending on the nature of the reserve. The reserves, presented as a reduction of accounts receivable, totaled $249.2 million and $175.8 million at June 30, 2018 and 2017, respectively. Rebates payable at June 30, 2018 and 2017 totaled $49.4 million and $44.6 million, respectively, which is comprised of certain rebate programs, primarily related to Medicare Part D, and Medicaid as well as certain sales allowances and other adjustments paid to indirect customers.
Cost of Sales, including Amortization of Intangibles
Cost of sales includes all costs related to bringing products to their final selling destination, which includes direct and indirect costs, such as direct material, labor and overhead expenses. Additionally, cost of sales includes product royalties, depreciation, amortization and costs to renew or extend recognized intangible assets, freight charges and other shipping and handling expenses.
Research and Development Expenses
Research and development costs are expensed as incurred, including all production costs until a drug candidate is approved by the Food and Drug Administration (“FDA”). Research and development expenses include costs associated with internal projects as well as costs associated with third-party research and development contracts.
Contingencies
Loss contingencies, including litigation-related contingencies, are included in the Consolidated Statements of Operations when the Company concludes that a loss is both probable and reasonably estimable. Legal fees for litigation-related matters are expensed as incurred and included in the Consolidated Statements of Operations under the Selling, general and administrative expense line item.
Restructuring Costs
The Company records charges associated with approved restructuring plans to remove duplicative headcount and infrastructure associated with business acquisitions or to simplify business processes. Restructuring charges can include severance costs to eliminate a specified number of employees, infrastructure charges to vacate facilities and consolidate operations and contract cancellation costs. The Company records restructuring charges based on estimated employee terminations, site closure and consolidation plans. The Company accrues severance and other employee separation costs under these actions when it is probable that a liability exists and the amount is reasonably estimable.
Share-Based Compensation
Share-based compensation costs are recognized over the vesting period, using a straight-line method, based on the fair value of the instrument on the date of grant less an estimate for expected forfeitures. The Company uses the Black-Scholes valuation model to determine the fair value of stock options, the stock price on the grant date to value restricted stock and the Monte-Carlo simulation model to determine the fair value of performance-based shares. The Black-Scholes valuation and Monte-Carlo simulation models include various assumptions, including the expected volatility, the expected life of the award, dividend yield and the risk-free interest rate as well as performance assumptions of peer companies. These assumptions involve inherent uncertainties based on market conditions which are generally outside the Company’s control. Changes in these assumptions could have a material impact on share-based compensation costs recognized in the consolidated financial statements.
Self-Insurance
Effective January 1, 2017, the Company self-insures for certain employee medical and prescription benefits. The Company also maintains stop loss coverage with third party insurers to limit its total liability exposure. The liability for self-insured risks is primarily calculated using independent third party actuarial valuations which take into account actual claims, claims growth and claims incurred but not yet reported. Actual experience, including claim frequency and severity as well as health-care inflation, could result in different liabilities than the amounts currently recorded. The liability for self-insured risks under this plan was not material to the consolidated financial position of the Company as of June 30, 2018 and 2017.
Income Taxes
The Company uses the liability method to account for income taxes as prescribed by Accounting Standards Codification (“ASC”) 740, Income Taxes. Deferred tax assets and liabilities are determined based on the difference between the financial statement and tax bases of assets and liabilities as measured by the enacted tax rates which will be in effect when these differences reverse. Deferred tax expense (benefit) is the result of changes in deferred tax assets and liabilities. Deferred income tax assets and liabilities are adjusted to recognize the effects of changes in tax laws or enacted tax rates in the period during which they are signed into law. The factors used to assess the likelihood of realization are the Company’s forecast of future taxable income and available tax planning strategies that could be implemented to realize the net deferred tax assets. Under ASC 740, Income Taxes, a valuation allowance is required when it is more likely than not that all or some portion of the deferred tax assets will not be realized through generating sufficient future taxable income. Failure to achieve forecasted taxable income in applicable tax jurisdictions could affect the ultimate realization of deferred tax assets and could result in an increase in the Company’s effective tax rate on future earnings.
The Company may recognize the tax benefit from an uncertain tax position claimed on a tax return only if it is more likely than not that the tax position will be sustained on examination by the taxing authorities, based on the technical merits of the position. The tax benefits recognized in the financial statements from such a position should be measured based on the largest benefit that has a greater than 50% likelihood of being realized upon ultimate settlement. The authoritative accounting standards also provide guidance on de-recognition, classification, interest and penalties on income taxes, accounting in interim periods and requires increased disclosures.
On December 22, 2017, President Trump signed the Tax Cut and Jobs Act legislation (“2017 Tax Reform”) into law, which included a broad range of tax reform provisions affecting businesses, including corporate tax rates, business deductions and international tax provisions. Many of these provisions significantly differ from current U.S. tax law, resulting in pervasive financial reporting implications. As a result of the new law, the SEC issued Staff Accounting Bulletin No. 118 (“SAB 118”) to address the application of U.S. GAAP in situations when a registrant does not have the necessary information available, prepared, or analyzed in reasonable detail to complete the accounting for certain income tax effects of 2017 Tax Reform. SAB 118 requires registrants to report the tax effects of 2017 Tax Reform, inclusive of provisional amounts for which the accounting is incomplete but a reasonable estimate can be determined. SAB 118 also allows for a measurement period of up to one year in cases where a registrant reports a provisional amount or is unable to reasonably estimate the impact of 2017 Tax Reform.
Earnings (Loss) Per Common Share
Basic earnings (loss) per common share attributable to the Company is computed by dividing net income attributable to Lannett Company, Inc. common stockholders by the weighted average number of shares outstanding during the period. Diluted earnings (loss) per common share attributable to the Company is computed by dividing net income attributable to Lannett Company, Inc. common stockholders by the weighted average number of shares outstanding during the period including additional shares that would have been outstanding related to potentially dilutive securities. These potentially dilutive securities consist of stock options, unvested restricted stock, performance-based shares and an outstanding warrant. Anti-dilutive securities are excluded from the calculation. Dilutive shares are also excluded in the calculation in periods of net loss because the effect of including such securities would be anti-dilutive.
Comprehensive Income (Loss)
Comprehensive income (loss) includes all changes in equity during a period except those that resulted from investments by or distributions to the Company’s stockholders. Other comprehensive income (loss) refers to gains and losses that are included in comprehensive income (loss), but excluded from net income as these amounts are recorded directly as an adjustment to stockholders’ equity.
Recent Accounting Pronouncements
In May 2014, the Financial Accounting Standards Board (“FASB”) issued ASU 2014-09, Revenue from Contracts with Customers. The core principle of the guidance is that an entity should recognize revenue to depict the transfer of promised goods or services to customers in an amount that reflects the consideration to which the entity expects to be entitled in exchange for those goods or services. The authoritative guidance is effective for annual reporting periods beginning after December 15, 2017. Based on a review of the contracts representing a substantial portion of our revenues, the Company does not expect the guidance to have a material impact on our disclosures or the timing and recognition of our revenues. The majority of the Company’s revenues is generated from product sales and based on the Company’s initial assessment, it currently does not anticipate a material impact to the revenue and disclosures related to these arrangements. Under the new standard, the Company will need to estimate certain amounts as variable consideration at the point of product sale in future periods. The Company does not anticipate a material impact on revenue related to these variable amounts which need to be estimated and recorded earlier under the new standard.
The new revenue standard will also impact the timing of the Company’s revenue recognition by requiring recognition of certain contract manufacturing arrangements to move from upon shipment or delivery to over time. However, the recognition of these arrangements over time is not expected to have a material impact on the Company’s consolidated results of operations or financial position.
The Company is finalizing the establishment and documentation of key accounting policies, conducting training and education throughout the organization, and evaluating impacts on business processes, information technology, and controls resulting from the adoption of this new standard. The Company also continues to accumulate the necessary information to determine the cumulative effects of the accounting change to be recorded upon adoption of the guidance, but the magnitude of this adjustment is not expected to be material. The Company intends to use the modified retrospective approach upon implementation with the cumulative effect of applying the standard recognized at the date of initial application.
In November 2015, the FASB issued ASU 2015-17, Income Taxes — Balance Sheet Classification of Deferred Taxes. ASU 2015-17 requires all deferred tax assets and liabilities to be classified as noncurrent on the balance sheet. The guidance may be applied either prospectively or retrospectively. The guidance became effective for the Company in the first quarter of Fiscal 2018. Accordingly, the Company currently presents all deferred tax assets and liabilities as noncurrent on the balance sheet. All prior period amounts have also been reclassified to conform with the current year presentation.
In February 2016, the FASB issued ASU 2016-02, Leases. ASU 2016-02 requires an entity to recognize right-of-use assets and liabilities on its balance sheet for all leases with terms longer than 12 months. Lessees and lessors are required to disclose quantitative and qualitative information about leasing arrangements to enable a user of the financial statements to assess the amount, timing and uncertainty of cash flows arising from leases. ASU 2016-02 is effective for annual reporting periods beginning after December 15, 2018, including interim periods within that reporting period and requires a modified retrospective application, with early adoption permitted. The Company is currently in the process of assessing the impact this guidance will have on the consolidated financial statements.
In August 2016, the FASB issued ASU 2016-15, Statement of Cash Flows — Classification of Certain Cash Receipts and Cash Payments. ASU 2016-15 addresses how certain cash receipts and cash payments are presented and classified in the statement of cash flows. ASU 2016-15 is effective for annual reporting periods, and interim periods therein, beginning after December 15, 2017. The Company is currently in the process of assessing the impact this guidance will have on the consolidated financial statements.
Note 3. Restructuring Charges
Cody Restructuring Program
On June 29, 2018, the Company announced a restructuring plan with respect to Cody Labs (the “Cody Restructuring Plan”). The plan focuses on a more select set of opportunities which will result in streamlined operations, improved efficiencies and a reduced cost structure. The Company currently estimates that it will incur approximately $5.0 million of total costs to implement the Cody Restructuring Plan, comprised primarily of approximately $3.5 million of severance and employee-related costs, of which approximately $3.1 million was recorded in the quarter ended June 30, 2018. In addition, the Company recorded a $21.5 million non-cash impairment charge in connection with the Cody Restructuring Plan relating to the facility, equipment and other plant-related assets primarily associated with the expansion project at Cody Labs. See Note 6 “Property, Plant and Equipment” for more information.
The expenses associated with the Cody Restructuring Plan included in restructuring expenses during the fiscal year ended June 30, 2018 were as follows:
|
(In thousands) |
|
Twelve |
| |
|
Employee separation costs |
|
$ |
3,092 |
|
|
Facility closure costs |
|
— |
| |
|
Total |
|
$ |
3,092 |
|
A reconciliation of the changes in restructuring liabilities associated with the Cody Restructuring Plan from June 30, 2017 through June 30, 2018 is set forth in the following table:
|
(In thousands) |
|
Employee |
|
Facility Closure |
|
Total |
| |||
|
Balance at June 30, 2017 |
|
$ |
— |
|
$ |
— |
|
$ |
— |
|
|
Restructuring Charges |
|
3,092 |
|
— |
|
3,092 |
| |||
|
Payments |
|
— |
|
— |
|
— |
| |||
|
Balance at June 30, 2018 |
|
$ |
3,092 |
|
— |
|
$ |
3,092 |
| |
2016 Restructuring Plan
On February 1, 2016, in connection with the acquisition of KUPI, the Company announced a plan related to the future integration of KUPI and the Company’s operations. The plan focuses on the closure of KUPI’s corporate functions and the consolidation of manufacturing, sales, research and development and distribution functions. The Company estimates that it will incur an aggregate of up to approximately $19.0 million in restructuring charges for actions that have been announced or communicated since the 2016 Restructuring Program began. Of this amount, approximately $10.0 million relates to employee separation costs, approximately $1.0 million relates to contract termination costs and approximately $8.0 million relates to facility closure costs and other actions. The 2016 Restructuring Program is expected to be completed by the end of Fiscal 2019. The expenses associated with the restructuring program included in restructuring expenses during the twelve months ended June 30, 2018 and 2017 were as follows:
|
(In thousands) |
|
Twelve |
|
Twelve |
| ||
|
Employee separation costs |
|
$ |
246 |
|
$ |
3,486 |
|
|
Contract termination costs |
|
— |
|
— |
| ||
|
Facility closure costs |
|
3,723 |
|
3,682 |
| ||
|
Total |
|
$ |
3,969 |
|
$ |
7,168 |
|
A reconciliation of the changes in restructuring liabilities associated with the 2016 Restructuring Program from June 30, 2016 through June 30, 2018 is set forth in the following table:
|
(In thousands) |
|
Employee |
|
Contract |
|
Facility Closure |
|
Total |
| ||||
|
Balance at June 30, 2016 |
|
$ |
3,833 |
|
$ |
297 |
|
$ |
— |
|
$ |
4,130 |
|
|
Restructuring Charges |
|
3,486 |
|
— |
|
3,682 |
|
7,168 |
| ||||
|
Payments |
|
(1,888 |
) |
(297 |
) |
(3,682 |
) |
(5,867 |
) | ||||
|
Balance at June 30, 2017 |
|
5,431 |
|
— |
|
— |
|
5,431 |
| ||||
|
Restructuring Charges |
|
246 |
|
— |
|
3,723 |
|
3,969 |
| ||||
|
Payments |
|
(2,063 |
) |
— |
|
(3,723 |
) |
(5,786 |
) | ||||
|
Balance at June 30, 2018 |
|
$ |
3,614 |
|
$ |
— |
|
$ |
— |
|
$ |
3,614 |
|
Note 4. Accounts Receivable
Accounts receivable consisted of the following components at June 30, 2018 and 2017:
|
(In thousands) |
|
June 30, |
|
June 30, |
| ||
|
Gross accounts receivable |
|
$ |
503,175 |
|
$ |
380,653 |
|
|
Less Chargebacks reserve |
|
(153,034 |
) |
(79,537 |
) | ||
|
Less Rebates reserve |
|
(33,102 |
) |
(43,023 |
) | ||
|
Less Returns reserve |
|
(43,059 |
) |
(42,135 |
) | ||
|
Less Other deductions |
|
(20,021 |
) |
(11,096 |
) | ||
|
Less Allowance for doubtful accounts |
|
(1,308 |
) |
(796 |
) | ||
|
Accounts receivable, net |
|
$ |
252,651 |
|
$ |
204,066 |
|
For the fiscal year ended June 30, 2018, the Company recorded a provision for chargebacks, rebates, returns and other deductions of $1.1 billion, $296.8 million, $24.0 million and $69.9 million, respectively. For the fiscal year ended June 30, 2017, the Company recorded a provision for chargebacks, rebates, returns and other deductions of $881.3 million, $297.0 million, $25.4 million and $53.4 million, respectively. For the fiscal year ended June 30, 2016, the Company recorded a provision for chargebacks, rebates, returns and other deductions of $646.9 million, $189.2 million, $21.3 million and $50.0 million, respectively.
Note 5. Inventories
Inventories at June 30, 2018 and 2017 consisted of the following:
|
(In thousands) |
|
June 30, |
|
June 30, |
| ||
|
Raw Materials |
|
$ |
64,647 |
|
$ |
57,442 |
|
|
Work-in-process |
|
19,983 |
|
15,676 |
| ||
|
Finished Goods |
|
57,005 |
|
49,486 |
| ||
|
Total |
|
$ |
141,635 |
|
$ |
122,604 |
|
During the fiscal years ended June 30, 2018, 2017 and 2016, the Company recorded write-downs to net realizable value for excess and obsolete inventory of $12.2 million, $10.4 million and $9.4 million, respectively. At June 30, 2018 and 2017, inventory balances were written-down by $11.9 million and $4.5 million, respectively, for excess and obsolete inventory amounts.
Note 6. Property, Plant and Equipment
Property, plant and equipment at June 30, 2018 and 2017 consisted of the following:
|
(In thousands) |
|
Useful Lives |
|
June 30, |
|
June 30, |
| ||
|
Land |
|
— |
|
$ |
2,900 |
|
$ |
6,191 |
|
|
Building and improvements |
|
10 - 39 years |
|
105,041 |
|
108,730 |
| ||
|
Machinery and equipment |
|
5 - 10 years |
|
173,988 |
|
142,086 |
| ||
|
Furniture and fixtures |
|
5 - 7 years |
|
4,099 |
|
2,953 |
| ||
|
Less accumulated depreciation |
|
|
|
(89,996 |
) |
(71,461 |
) | ||
|
|
|
|
|
196,032 |
|
188,499 |
| ||
|
Construction in progress |
|
|
|
37,215 |
|
54,649 |
| ||
|
Property, plant and equipment, net |
|
|
|
$ |
233,247 |
|
$ |
243,148 |
|
Depreciation expense for the fiscal years ended June 30, 2018, 2017 and 2016 was $22.4 million, $21.8 million and $13.9 million, respectively.
During the fiscal year ended June 30, 2018, the Company recorded impairment charges totaling approximately $25.0 million, of which $21.5 million relates to the Cody Restructuring Plan and $3.5 million resulting from the consolidation of the Company’s manufacturing activities with respect to plant-related assets located at the Company’s Townsend Road facility. The impairment charges were based on the appraised fair values of the property, plant and equipment at each of these sites. See Note 3 “Restructuring Charges” for more information. The Company had no impairment charges for the fiscal years ended June 30, 2017 and 2016.
Property, plant and equipment, net included amounts held in foreign countries in the amount of $1.1 million and $1.0 million at June 30, 2018 and June 30, 2017, respectively.
Note 7. Fair Value Measurements
The Company’s financial instruments recorded in the Consolidated Balance Sheets include cash and cash equivalents, accounts receivable, investment securities, accounts payable, accrued expenses and debt obligations. Included in cash and cash equivalents are certificates of deposit with maturities less than or equal to three months at the date of purchase and money market funds. The carrying value of certain financial instruments, primarily cash and cash equivalents, accounts receivable, accounts payable and accrued expenses, approximate their estimated fair values based upon the short-term nature of their maturity dates. The carrying amount of the Company’s debt obligations approximates fair value based on current interest rates available to the Company on similar debt obligations.
The Company follows the authoritative guidance of ASC Topic 820 “Fair Value Measurements and Disclosures.” Fair value is defined as the exchange price that would be received for an asset or paid to transfer a liability (an exit price) in the principal or most advantageous market for the asset or liability in an orderly transaction between market participants on the measurement date. The authoritative guidance also establishes a fair value hierarchy which requires an entity to maximize the use of observable inputs and minimize the use of unobservable inputs when measuring fair value. The Company’s financial assets and liabilities measured at fair value are entirely within Level 1 of the hierarchy as defined below:
Level 1 — Quoted prices (unadjusted) in active markets for identical assets or liabilities that the reporting entity can access at the measurement date.
Level 2 — Directly or indirectly observable inputs, other than quoted prices, such as quoted prices for similar assets or liabilities; quoted prices for identical or similar instruments in markets that are not active; or model-derived valuations whose inputs are observable or whose significant value drivers are observable.
Level 3 — Unobservable inputs that are supported by little or no market activity and that are material to the fair value of the asset or liability. Financial instruments whose values are determined using pricing models, discounted cash flow methodologies, or similar techniques, as well as instruments for which the determination of fair value requires significant judgment or estimation are examples of Level 3 assets and liabilities.
If the inputs used to measure the financial assets and liabilities fall within more than one level described above, the categorization is based on the lowest level input that is significant to the fair value measurement of the instrument.
The fair values utilized to calculate the impairment charges related to the Cody Restructuring Plan and the Townsend Road facility were based on third-party appraisals, which are Level 3 inputs. See Note 6 “Property, Plant and Equipment” for more information.
The Company’s financial assets measured at fair value at June 30, 2018 and June 30, 2017 were as follows:
|
|
|
June 30, 2018 |
| ||||||||||
|
(In thousands) |
|
Level 1 |
|
Level 2 |
|
Level 3 |
|
Total |
| ||||
|
Assets |
|
|
|
|
|
|
|
|
| ||||
|
Equity securities |
|
$ |
— |
|
$ |
— |
|
$ |
— |
|
$ |
— |
|
|
Total Assets |
|
$ |
— |
|
$ |
— |
|
$ |
— |
|
$ |
— |
|
|
|
|
June 30, 2017 |
| ||||||||||
|
(In thousands) |
|
Level 1 |
|
Level 2 |
|
Level 3 |
|
Total |
| ||||
|
Assets |
|
|
|
|
|
|
|
|
| ||||
|
Equity securities |
|
$ |
27,091 |
|
$ |
— |
|
$ |
— |
|
$ |
27,091 |
|
|
Total Assets |
|
$ |
27,091 |
|
$ |
— |
|
$ |
— |
|
$ |
27,091 |
|
In May 2018, the Company liquidated the remainder of its equity securities portfolio. As of June 30, 2018, the Company does not own any equity securities.
Note 8. Investment Securities
The Company uses the specific identification method to determine the cost of securities sold, which consisted entirely of securities classified as trading.
The Company had a net gain on investment securities of $3.3 million during the fiscal year ended June 30, 2018.
The Company had a net gain on investment securities of $2.9 million during the fiscal year ended June 30, 2017, which included an unrealized gain related to securities still held at June 30, 2017 of $964 thousand.
The Company had a net loss on investment securities of $11 thousand during the fiscal year ended June 30, 2016, which included an unrealized loss related to securities still held at June 30, 2016 of $51 thousand.
Note 9. Intangible Assets
Intangible assets, net as of June 30, 2018 and June 30, 2017, consisted of the following:
|
|
|
Weighted |
|
Gross Carrying Amount |
|
Accumulated Amortization |
|
Intangible Assets, Net |
| ||||||||||||
|
(In thousands) |
|
Avg. Life |
|
June 30, |
|
June 30, |
|
June 30, |
|
June 30, |
|
June 30, |
|
June 30, |
| ||||||
|
|
|
|
|
|
|
|
|
|
|
|
|
|
|
|
| ||||||
|
Definite-lived: |
|
|
|
|
|
|
|
|
|
|
|
|
|
|
| ||||||
|
Cody Labs import license |
|
15 |
|
$ |
581 |
|
$ |
582 |
|
$ |
(386 |
) |
$ |
(347 |
) |
$ |
195 |
|
$ |
235 |
|
|
KUPI product rights |
|
15 |
|
416,154 |
|
434,000 |
|
(69,840 |
) |
(43,286 |
) |
346,314 |
|
390,714 |
| ||||||
|
KUPI trade name |
|
2 |
|
2,920 |
|
2,920 |
|
(2,920 |
) |
(2,338 |
) |
— |
|
582 |
| ||||||
|
KUPI other intangible assets |
|
15 |
|
19,000 |
|
19,000 |
|
(3,295 |
) |
(2,028 |
) |
15,705 |
|
16,972 |
| ||||||
|
Silarx product rights |
|
15 |
|
10,000 |
|
10,000 |
|
(2,056 |
) |
(1,389 |
) |
7,944 |
|
8,611 |
| ||||||
|
Other product rights |
|
14 |
|
19,693 |
|
653 |
|
(1,875 |
) |
(355 |
) |
17,818 |
|
298 |
| ||||||
|
Total definite-lived |
|
|
|
$ |
468,348 |
|
$ |
467,155 |
|
$ |
(80,372 |
) |
$ |
(49,743 |
) |
$ |
387,976 |
|
$ |
417,412 |
|
|
|
|
|
|
|
|
|
|
|
|
|
|
|
|
|
| ||||||
|
Indefinite-lived: |
|
|
|
|
|
|
|
|
|
|
|
|
|
|
| ||||||
|
KUPI in-process research and development |
|
— |
|
$ |
18,000 |
|
$ |
18,000 |
|
$ |
— |
|
$ |
— |
|
$ |
18,000 |
|
$ |
18,000 |
|
|
Silarx in-process research and development |
|
— |
|
18,000 |
|
18,000 |
|
— |
|
— |
|
18,000 |
|
18,000 |
| ||||||
|
Other product rights |
|
— |
|
449 |
|
449 |
|
— |
|
— |
|
449 |
|
449 |
| ||||||
|
Total indefinite-lived |
|
|
|
36,449 |
|
36,449 |
|
— |
|
— |
|
36,449 |
|
36,449 |
| ||||||
|
Total intangible assets, net |
|
|
|
$ |
504,797 |
|
$ |
503,604 |
|
$ |
(80,372 |
) |
$ |
(49,743 |
) |
$ |
424,425 |
|
$ |
453,861 |
|
In the third quarter of Fiscal 2018, the Company sold an intangible asset related to a product right acquired as part of the KUPI acquisition. In connection with the transaction, the Company recorded a $15.5 million loss on sale of the intangible asset, which had a carrying value of $15.8 million at the time of sale.
In February 2018, the Company completed the acquisition of five products from UCB for $5.0 million which is included within the “Other product rights” category of intangible assets. In May 2018, the Company also completed the acquisition of over 20 products from a subsidiary of Endo International plc for an upfront payment of $12.0 million and future milestone payments, which is also included within the “Other product rights” category.
On October 18, 2016, the Company received a notice from the FDA indicating that the FDA will seek to withdraw approval of the Company’s Methylphenidate ER Abbreviated New Drug Applications (“ANDAs”). As a result of the notice, the Company performed an impairment analysis including a review of revised net sales projections for Methylphenidate ER. This analysis resulted in the Company recording a $65.1 million impairment charge in the first quarter of Fiscal 2017.
In the second quarter of Fiscal 2017, the Company abandoned a project within KUPI’s in-process research and development portfolio. The value assigned to the project was $23.0 million. Accordingly, the Company recorded a $23.0 million impairment charge.
For the fiscal years ended June 30, 2018, 2017 and 2016, the Company recorded amortization expense of $32.7 million, $33.6 million and $19.5 million, respectively.
Future annual amortization expense consists of the following:
|
(In thousands) |
|
Annual Amortization Expense |
| |
|
2019 |
|
$ |
31,723 |
|
|
2020 |
|
30,882 |
| |
|
2021 |
|
30,882 |
| |
|
2022 |
|
30,882 |
| |
|
2023 |
|
30,882 |
| |
|
Thereafter |
|
232,725 |
| |
|
|
|
$ |
387,976 |
|
Note 10. Long-Term Debt
Long-term debt, net consisted of the following:
|
|
|
June 30, |
|
June 30, |
| ||
|
(In thousands) |
|
2018 |
|
2017 |
| ||
|
Term Loan A due 2020; 6.84% as of June 30, 2018 |
|
$ |
227,276 |
|
$ |
254,375 |
|
|
Unamortized discount and other debt issuance costs |
|
(10,178 |
) |
(16,238 |
) | ||
|
Term Loan A, net |
|
217,098 |
|
238,137 |
| ||
|
Term Loan B due 2022; 7.47% as of June 30, 2018 |
|
670,011 |
|
727,881 |
| ||
|
Unamortized discount and other debt issuance costs |
|
(47,839 |
) |
(63,106 |
) | ||
|
Term Loan B, net |
|
622,172 |
|
664,775 |
| ||
|
Revolving Credit Facility due 2020 |
|
— |
|
— |
| ||
|
Other |
|
— |
|
735 |
| ||
|
Total debt, net |
|
839,270 |
|
903,647 |
| ||
|
Less short-term borrowings and current portion of long-term debt |
|
(66,845 |
) |
(60,117 |
) | ||
|
Total long-term debt, net |
|
$ |
772,425 |
|
$ |
843,530 |
|
During the third quarter of Fiscal 2018, the Company made a voluntary payment of $25.0 million against its outstanding Term Loan A and Term Loan B debt. As a result of the prepayment, the Company wrote off a proportionate amount of the related debt issuance costs totaling $2.6 million which was included in interest expense.
Long-term debt amounts due, for the twelve month periods ending June 30 were as follows:
|
|
|
Amounts Payable |
| |
|
(In thousands) |
|
to Institutions |
| |
|
2019 |
|
$ |
66,845 |
|
|
2020 |
|
66,845 |
| |
|
2021 |
|
211,621 |
| |
|
2022 |
|
39,345 |
| |
|
2023 |
|
512,631 |
| |
|
Thereafter |
|
— |
| |
|
Total |
|
$ |
897,287 |
|
The outstanding debt amounts above are guaranteed by all of Lannett’s significant wholly-owned domestic subsidiaries and is collateralized by substantially all present and future assets of the Company.
Note 11. Legal, Regulatory Matters and Contingencies
Connecticut Attorney General Inquiry
In July 2014, the Company received interrogatories and subpoena from the State of Connecticut Office of the Attorney General concerning its investigation into the pricing of digoxin. According to the subpoena, the Connecticut Attorney General is investigating whether anyone engaged in any activities that resulted in (a) fixing, maintaining or controlling prices of digoxin or (b) allocating and dividing customers or territories relating to the sale of digoxin in violation of Connecticut antitrust law. In June 2016, the Connecticut Attorney General issued interrogatories and a subpoena to an employee of the Company in order to gain access to documents and responses previously supplied to the Department of Justice. In December 2016, the Connecticut Attorney General, joined by numerous other State Attorneys General, filed a civil complaint alleging that six pharmaceutical companies engaged in anti-competitive behavior related to doxycycline hyclate and gliburide. The Company was not named in the action and does not compete on the products that formed the basis of the complaint. The complaint was later transferred for pretrial purposes to the United States District Court for the Eastern District of Pennsylvania as part of a multidistrict litigation captioned In re: Generic Pharmaceuticals Pricing Antitrust Litigation. On October 31, 2017, the state Attorneys General filed a motion in the District Court for leave to amend their complaint to add numerous additional defendants, including the Company, and claims relating to 13 additional drugs. The claim relating to Lannett involves alleged price-fixing for one drug, doxycycline monohydrate, but does not involve the pricing for digoxin. The state Attorneys General also allege that all defendants were part of an overarching, industry-wide conspiracy to allocate markets and fix prices generally. The Court granted that motion on June 5, 2018. The state Attorneys General filed their amended complaint on June 15, 2018. None of the defendants, including the Company, has responded yet to the amended complaint.
The Company maintains that it acted in compliance with all applicable laws and regulations and continues to cooperate with the Connecticut Attorney General investigation.
Federal Investigation into the Generic Pharmaceutical Industry
The Company and certain affiliated individuals and customers have been served with grand jury subpoenas relating to a federal investigation of the generic pharmaceutical industry into possible violations of the Sherman Act. The subpoenas request corporate documents of the Company relating to corporate, financial and employee information, communications or correspondence with competitors regarding the sale of generic prescription medications and the marketing, sale, or pricing of certain products, generally for the period of 2005 through the dates of the subpoenas.
The Company received a Civil Investigative Demand (“CID”) from the Department of Justice on May 14, 2018. The CID requests information regarding allegations that the generic pharmaceutical industry engaged in market allocation, price fixing, payment of illegal remuneration and submission of false claims. The CID requests information from 2009-present. The Company is in the process of responding to the CID.
Based on reviews performed to date by outside counsel, the Company currently believes that it has acted in compliance with all applicable laws and regulations and continues to cooperate with the federal investigation.
Texas Medicaid Investigation
In August 2015, KUPI received a letter from the Texas Office of the Attorney General alleging that it had inaccurately reported certain price information in violation of the Texas Medicaid Fraud Prevention Act. UCB, KUPI’s previous parent company is handling the defense and is evaluating the allegations and cooperating with the Texas Attorney General’s Office. Per the terms of the Stock Purchase Agreement between the Company and UCB (“Stock Purchase Agreement”) dated September 2, 2015, the Company is fully indemnified for any pre-acquisition amounts. The Company is currently unable to estimate the timing or the outcome of this matter.
Government Pricing
During the quarter ended December 31, 2016, the Company completed a contract compliance review, for the period January 1, 2012 through June 30, 2016, for one of KUPI’s government-entity customers. As a result of the review, the Company identified certain commercial customer prices and other terms that were not properly disclosed to the government-entity resulting in potential overcharges. As of June 30, 2018 and June 30, 2017, the Company’s best estimate of the liability for potential overcharges was approximately $9.3 million. For the period January 1, 2012 through November 24, 2015 (“the pre-acquisition period”), the Company is fully indemnified per the Stock Purchase Agreement. Accordingly, the Company has recorded an indemnification asset and related liability of $8.3 million related to the pre-acquisition period. The Company does not believe that the ultimate resolution of this matter will have a significant impact on our financial position, results of operations or cash flows.
EPA Violation Notice
On July 13, 2017, the United States Department of Environmental Protection Agency (“EPA”) sent a Finding of Violation to KUPI alleging several violations of national emissions standards for hazardous air pollutants at KUPI’s Seymour, Indiana facility. The EPA is giving the Company the opportunity to discuss the matter with the agency before filing a formal complaint or assessing fines with respect to the alleged violations. The Company is conducting an investigation into the matter and cannot reasonably predict the outcome of any potential EPA action at this time.
Private Antitrust and Consumer Protection Litigation
The Company and certain competitors have been named as defendants in a number of lawsuits filed in 2016 and 2017 alleging that the Company and certain generic pharmaceutical manufacturers have conspired to fix prices of generic digoxin, levothyroxine, ursodiol and baclofen. These cases are part of a larger group of more than 100 lawsuits generally alleging that over 30 generic pharmaceutical manufacturers and distributors conspired to fix prices for at least 18 different generic drugs in violation of the federal Sherman Act, various state antitrust laws, and various state consumer protection statutes. The United States also has been granted leave to intervene in the cases. On April 6, 2017, the Judicial Panel on Multidistrict Litigation (the “JPML”) ordered that all of the cases alleging price-fixing for generic drugs be consolidated for pretrial proceedings in the United States District Court for the Eastern District of Pennsylvania under the caption In re: Generic Pharmaceuticals Pricing Antitrust Litigation. The various plaintiffs are grouped into three categories — Direct Purchaser Plaintiffs, End Payer Plaintiffs, and Indirect Reseller Purchasers — and filed Consolidated Amended Complaints (“CACs”) against the Company and the other defendants on August 15, 2017.
The CACs naming the Company as a defendant involve generic digoxin, levothyroxine, ursodiol and baclofen. Pursuant to a court-ordered schedule grouping the 18 different drug cases into three separate tranches, the Company and other generic pharmaceutical manufacturer defendants on October 6, 2017 filed joint and individual motions to dismiss the CACs involving the six drugs in the first tranche, including digoxin. Those motions are pending.
On January 22, 2018, three opt-out direct purchasers filed a complaint alleging an overarching conspiracy and individual conspiracies on behalf of the Company and numerous other defendants to fix the prices of and allocate markets for at least 30 different drugs, including digoxin, doxycycline, levothyroxine, ursodiol and baclofen. On August 3, 2018, another opt-out direct purchaser filed a complaint alleging an overarching conspiracy and individual conspiracies on behalf of the Company and numerous other defendants to fix the prices of and allocate markets for 16 different drugs, including digoxin, doxycycline, levothyroxine, ursodiol and baclofen. None of the defendants, including the Company, has responded yet to the opt-out complaints.
In addition to the lawsuits brought by private plaintiffs, the Attorneys General of 45 states, the District of Columbia and Puerto Rico have filed parens patriae lawsuits alleging price-fixing conspiracies by various generic pharmaceutical manufacturers. The JPML has consolidated the suits by the state Attorneys General in the Eastern District of Pennsylvania as part of the multidistrict litigation. The original lawsuits did not name the Company, but the state Attorneys General on October 31, 2017 filed a motion with the District Court for leave to amend their complaint to add numerous additional defendants, including the Company, and claims relating to 13 additional drugs. The claim relating to Lannett involves alleged price-fixing for one drug, doxycycline monohydrate, although the state Attorneys General allege that all defendants were part of an overarching, industry-wide conspiracy to allocate markets and fix prices generally. The Court granted that motion on June 5, 2018. The state Attorneys General filed their amended complaint on June 15, 2018. None of the defendants, including the Company, has responded yet to the amended complaint.
Following the lead of the state Attorneys General, the Direct Purchaser Plaintiffs, End Payer Plaintiffs and Indirect Reseller Plaintiffs have filed their own complaints also alleging an overarching conspiracy, making similar allegations to those contained in the state Attorneys General complaint, relating to 14 generic drugs in the End Payer complaint and 15 generic drugs in the Indirect Reseller complaint. The End Payer Plaintiffs filed their complaint on June 7, 2018, the Indirect Reseller Plaintiffs filed their complaint on June 18, 2018, and the Direct Purchaser Plaintiffs filed their complaint on June 22, 2018. Although the complaints allege an overarching conspiracy with respect to all of the drugs identified, the specific allegations related to drugs Lannett makes involve acetazolamide and doxycycline monohydrate. None of the defendants, including the Company, has responded yet to these complaints.
The Company believes that it acted in compliance with all applicable laws and regulations. Accordingly, the Company disputes the allegations set forth in these class actions.
Shareholder Litigation
In November 2016, a putative class action lawsuit was filed against the Company and two of its officers claiming that the Company damaged the purported class by including in its securities filings false and misleading statements regarding the Company’s drug pricing methodologies and internal controls. An amended complaint was filed in May 2017, and the Company filed a motion to dismiss the amended complaint in September 2017. In December 2017, counsel for the putative class filed a second amended complaint, and the Court denied as moot the Company’s motion to dismiss the first amended complaint. The Company filed a motion to dismiss the second amended complaint in February 2018. In July 2018, the court granted the Company’s motion to dismiss the second amended complaint and granted the putative lead plaintiffs twenty-one days to file an amended complaint. The Company cannot reasonably predict the outcome of the suit at this time.
In July 2018, a shareholder derivative complaint was filed against the Company and certain of its current and former directors and executives in the United States District Court for the Eastern District of Pennsylvania. The derivative complaint alleges that the Company engaged in an illegal conspiracy to fix generic drug prices and that the Company’s directors and executives violated their fiduciary duties by allowing the Company to violate the applicable laws and regulations and failing to take any action to curtail management’s deliberate price-fixing scheme. The derivative complaint includes causes of action for violation of Section 10(b) of the Exchange Act, violation of Section 14(a) of the Exchange Act, violation of Section 29(a) of the Exchange Act, and for breach of fiduciary duty. The Company cannot reasonably predict the outcome of the suit at this time.
Patent Infringement (Paragraph IV Certification)
There is substantial litigation in the pharmaceutical industry with respect to the manufacture, use and sale of new products which are the subject of conflicting patent and intellectual property claims. Certain of these claims relate to paragraph IV certifications, which allege that an innovator patent is invalid or would not be infringed upon by the manufacture, use, or sale of the new drug.
Zomig®
The Company filed with the FDA an ANDA No. 206350, along with a paragraph IV certification, alleging that the two patents associated with the Zomig® nasal spray product (U.S. Patent No. 6,750,237 and U.S. Patent No. 67,220,767) are invalid.
In July 2014, AstraZeneca AB, AstraZeneca UK Limited and Impax Laboratories, Inc. filed two patent infringement lawsuits in the United States District Court for the District of Delaware, alleging that the Company’s filing of ANDA No. 206350 constitutes an act of patent infringement and seeking a declaration that the two patents at issue are valid and infringed.
In September 2014, the Company filed a motion to dismiss one patent infringement lawsuit for lack of standing and responded to the second lawsuit by denying that any valid patent claim would be infringed. In the second lawsuit, the Company also counterclaimed for a declaratory judgment that the patent claims are invalid and not infringed. The Court has consolidated the two actions and denied the motion to dismiss the first action without prejudice.
In July 2015, the Company filed with the United States Patent and Trademark Office (“USPTO”) a Petition for Inter Partes Review of each of the patents in suit seeking to reject as invalid all claims of the patents in suit. The USPTO has issued a decision denying initiation of the Inter Partes Review.
A trial was conducted in September 2016. The Court issued its decision on March 29, 2017, finding that Lannett did not prove that the patents at issue are invalid. The Company has appealed the decision. All briefing to the appellate court has been submitted, and oral argument before the appellate court was conducted on April 5, 2018. The appellate court issued an opinion on June 28, 2018, upholding the decision of the District Court. The Company requested a rehearing by the appellate court on August 13, 2018.
Thalomid®
The Company filed with the FDA an ANDA No. 206601, along with a paragraph IV certification, alleging that the fifteen patents associated with the Thalomid drug product (U.S. Patent Nos. 6,045,501; 6,315,720; 6,561,976; 6,561,977; 6,755,784; 6,869,399; 6,908,432; 7,141,018; 7,230,012; 7,435,745; 7,874,984; 7,959,566; 8,204,763; 8,315,886; 8,589,188 and 8,626,53) are invalid, unenforceable and/or not infringed. On January 30, 2015, Celgene Corporation and Children’s Medical Center Corporation filed a patent infringement lawsuit in the United States District Court for the District of New Jersey, alleging that the Company’s filing of ANDA No. 206601 constitutes an act of patent infringement and seeking a declaration that the patents at issue are valid and infringed. The Company filed an answer and affirmative defenses, and an amended answer to the complaint.
A settlement agreement was reached and the Court dismissed the lawsuit in October 2017. Pursuant to the settlement agreement, the Company entered into a license agreement that permits Lannett to manufacture and market in the U.S. its generic thalidomide product as of August 1, 2019 or earlier under certain circumstances.
SUPREP®
The Company filed ANDA No. 209941 with the FDA seeking approval to sell a bowel preparation oral solution (the “Company’s Oral Solution”), along with a paragraph IV certification, alleging that US Patent 6,946,149 associated with the Suprep® bowel preparation kit would not be infringed by the Company’s Oral Solution and/or that the patent is invalid.
In March 2017, Braintree Laboratories, Inc. (“Braintree”) filed a patent infringement lawsuit in the United States District Court for the District of Delaware (C.A. No. 1:17-cv-00293-GMS), alleging that the Company’s filing of ANDA No. 209941 constitutes an act of patent infringement and seeking a declaration that the patent at issue was infringed by the submission of ANDA No. 209941. The Company answered the complaint denying infringement and raising invalidity as a defense, and has filed counterclaims seeking a declaration of non-infringement and invalidity. On July 28, 2017, the Company filed a motion for judgment on the pleadings, seeking a ruling that its ANDA product does not infringe the Braintree patent and seeking judgment as a matter of law. Braintree opposed the motion and has alternatively requested that the Court delay its decision on the motion until discovery is taken. The Company opposed Braintree’s request to delay the decision. While the motions were pending, the parties agreed to resolve this dispute. The parties signed a confidential settlement agreement and filed a Stipulation of Dismissal Without Prejudice on December 13, 2017. On December 17, 2017, the Court granted the parties’ Stipulation of Dismissal Without Prejudice. In connection with the settlement agreement, the Company received $3.5 million, which is included in Other Income within the Consolidated Statements of Operations.
Although the Company cannot currently predict the length or outcome of any paragraph IV litigation, legal expenses associated with these lawsuits could have a significant impact on the financial position, results of operations and cash flows of the Company.
Other Litigation Matters
The Company is also subject to various legal proceedings arising out of the normal course of its business including, but not limited to, product liability, intellectual property, patent infringement claims and antitrust matters. It is not possible to predict the outcome of these various proceedings. An adverse determination in any of these proceedings in the future could have a significant impact on the financial position, results of operations and cash flows of the Company.
Note 12. Commitments
Leases
The Company leases certain manufacturing and office equipment, in the ordinary course of business. These leases are typically renewed annually. Rental and lease expense was not material for all periods presented.
Future minimum lease payments under noncancelable operating leases (with initial or remaining lease terms in excess of one year) for the twelve-month periods ending June 30 thereafter are as follows:
|
(In thousands) |
|
Amounts Due |
| |
|
2019 |
|
$ |
1,835 |
|
|
2020 |
|
1,855 |
| |
|
2021 |
|
1,406 |
| |
|
2022 |
|
1,080 |
| |
|
2023 |
|
1,080 |
| |
|
Thereafter |
|
4,158 |
| |
|
Total |
|
$ |
11,414 |
|
Other Commitment
During the third quarter of Fiscal 2017, the Company signed an agreement with a company operating in the pharmaceutical business, under which the Company agreed to provide up to $15.0 million in revolving loans, which expires in seven years and bears interest at 2.0%, for the purpose of expansion and other business needs. The decision to provide any portion of the revolving loan is at the Company’s sole discretion. At any time after the outstanding revolving loan balance is equal to or greater than $7.5 million, the Company has the option to convert the first $7.5 million into a 50% ownership interest in the entity. As of June 30, 2018, $11.2 million was outstanding under the revolving loan, which is included in Other Assets on the Consolidated Balance Sheet. The board of the entity is comprised of five members, two of which are employees of the Company. Based on the guidance set forth in ASC 810-10 Consolidation, the Company has concluded that it has a variable interest in the entity. However, the Company is not the primary beneficiary to the entity and as such, is not required to consolidate the entity’s results of operations.
Note 13. Accumulated Other Comprehensive Loss
The Company’s Accumulated Other Comprehensive Loss was comprised of the following components as of June 30, 2018 and 2017:
|
(In thousands) |
|
June 30, |
|
June 30, |
| ||
|
Foreign Currency Translation |
|
|
|
|
| ||
|
Beginning Balance |
|
$ |
(222 |
) |
$ |
(295 |
) |
|
Net (loss) on foreign currency translation (net of tax of $0 and $0) |
|
(293 |
) |
73 |
| ||
|
Reclassifications to net income (net of tax of $0 and $0) |
|
— |
|
— |
| ||
|
Other comprehensive (loss), net of tax |
|
(293 |
) |
73 |
| ||
|
Ending Balance |
|
(515 |
) |
(222 |
) | ||
|
Total Accumulated Other Comprehensive Loss |
|
$ |
(515 |
) |
$ |
(222 |
) |
Note 14. Earnings (Loss) Per Common Share
A dual presentation of basic and diluted earnings (loss) per common share is required on the face of the Company’s Consolidated Statement of Operations as well as a reconciliation of the computation of basic earnings per common share to diluted earnings per common share. Basic earnings (loss) per common share excludes the dilutive impact of potentially dilutive securities and is computed by dividing net income (loss) attributable to Lannett Company, Inc. by the weighted average number of common shares outstanding for the period. Diluted earnings (loss) per common share is computed using the treasury stock method and includes the effect of potential dilution from the exercise of outstanding stock options, a warrant and treats unvested restricted stock and performance-based shares as if they were vested. Potentially dilutive securities have been excluded in the weighted average number of common shares used for the calculation of earnings per share in periods of net loss because the effect of including such securities would be anti-dilutive. A reconciliation of the Company’s basic and diluted earnings (loss) per common share was as follows:
|
|
|
For Fiscal Year Ended June 30, |
| |||||||
|
(In thousands, except share and per share data) |
|
2018 |
|
2017 |
|
2016 |
| |||
|
|
|
|
|
|
|
|
| |||
|
Net income (loss) attributable to Lannett Company, Inc. |
|
$ |
28,690 |
|
$ |
(581 |
) |
$ |
44,782 |
|
|
|
|
|
|
|
|
|
| |||
|
Basic weighted average common shares outstanding |
|
37,127,306 |
|
36,812,524 |
|
36,442,782 |
| |||
|
Effect of potentially dilutive options and restricted stock awards |
|
1,035,208 |
|
— |
|
946,663 |
| |||
|
Diluted weighted average common shares outstanding |
|
38,162,514 |
|
36,812,524 |
|
37,389,445 |
| |||
|
|
|
|
|
|
|
|
| |||
|
Earnings (loss) per common share attributable to Lannett Company, Inc.: |
|
|
|
|
|
|
| |||
|
Basic |
|
$ |
0.77 |
|
$ |
(0.02 |
) |
$ |
1.23 |
|
|
Diluted |
|
$ |
0.75 |
|
$ |
(0.02 |
) |
$ |
1.20 |
|
The number of anti-dilutive shares that have been excluded in the computation of diluted earnings per share for the fiscal years ended June 30, 2018, 2017 and 2016 were 3.0 million, 4.3 million and 3.0 million, respectively.
Note 15. Warrant
In connection with the KUPI acquisition, Lannett issued to UCB Manufacturing a warrant to purchase up to a total of 2.5 million shares of Lannett’s common stock (the “Warrant”).
The Warrant has a term of three years (expiring November 25, 2018) and an exercise price of $48.90 per share, subject to customary adjustments, including for stock splits, dividends and combinations. The Warrant also has a “weighted average” anti-dilution adjustment provision. The fair value included as part of the total consideration transferred to UCB at the acquisition date was $29.9 million. The fair value assigned to the Warrant was determined using the Black-Scholes valuation model. The Company concluded that the warrant was indexed to its own stock and therefore the Warrant has been classified as an equity instrument.
Note 16. Share-based Compensation
At June 30, 2018, the Company had two share-based employee compensation plans (the 2011 Long-Term Incentive Plan “LTIP” and the 2014 “LTIP”). Together these plans authorized an aggregate total of 4.5 million shares to be issued. The plans have a total of 1.5 million shares available for future issuances.
The Company issues share-based compensation awards with a vesting period ranging up to 3 years and a maximum contractual term of 10 years. The Company issues new shares of stock when stock options are exercised. As of June 30, 2018, there was $8.3 million of total unrecognized compensation cost related to non-vested share-based compensation awards. That cost is expected to be recognized over a weighted average period of 2.1 years.
Stock Options
The Company measures share-based compensation cost for options using the Black-Scholes option pricing model. The following table presents the weighted average assumptions used to estimate fair values of the stock options granted during the fiscal years ended June 30, the estimated annual forfeiture rates used to recognize the associated compensation expense and the weighted average fair value of the options granted:
|
|
|
June 30, |
|
June 30, |
|
June 30, |
| |||
|
Risk-free interest rate |
|
2.1 |
% |
1.1 |
% |
1.7 |
% | |||
|
Expected volatility |
|
57.6 |
% |
55.6 |
% |
48.3 |
% | |||
|
Expected dividend yield |
|
— |
|
— |
|
— |
| |||
|
Forfeiture rate |
|
6.5 |
% |
6.5 |
% |
6.5 |
% | |||
|
Expected term |
|
5.4 years |
|
5.2 years |
|
5.2 years |
| |||
|
Weighted average fair value |
|
$ |
11.25 |
|
$ |
15.33 |
|
$ |
26.24 |
|
Expected volatility is based on the historical volatility of the price of our common shares during the historical period equal to the expected term of the option. The Company uses historical information to estimate the expected term, which represents the period of time that options granted are expected to be outstanding. The risk-free rate for the period equal to the expected life of the option is based on the U.S. Treasury yield curve in effect at the time of grant. The forfeiture rate assumption is the estimated annual rate at which unvested awards are expected to be forfeited during the vesting period. This assumption is based on our actual forfeiture rate on historical awards. Periodically, management will assess whether it is necessary to adjust the estimated rate to reflect changes in actual forfeitures or changes in expectations. Additionally, the expected dividend yield is equal to zero, as the Company has not historically issued and has no immediate plans to issue, a dividend.
A stock option roll-forward as of June 30, 2018, 2017 and 2016 and changes during the years then ended, is presented below:
|
|
|
|
|
|
|
|
|
Weighted |
| ||
|
|
|
|
|
Weighted- |
|
|
|
Average |
| ||
|
|
|
|
|
Average |
|
Aggregate |
|
Remaining |
| ||
|
|
|
|
|
Exercise |
|
Intrinsic |
|
Contractual |
| ||
|
(In thousands, except for weighted average price and life data) |
|
Awards |
|
Price |
|
Value |
|
Life (yrs.) |
| ||
|
|
|
|
|
|
|
|
|
|
| ||
|
Outstanding at June 30, 2015 |
|
1,975 |
|
$ |
15.39 |
|
$ |
86,983 |
|
7.2 |
|
|
Granted |
|
58 |
|
59.20 |
|
|
|
|
| ||
|
Exercised |
|
(254 |
) |
12.62 |
|
$ |
6,168 |
|
|
| |
|
Forfeited, expired or repurchased |
|
(49 |
) |
32.66 |
|
|
|
|
| ||
|
Outstanding at June 30, 2016 |
|
1,730 |
|
$ |
16.77 |
|
$ |
19,524 |
|
6.3 |
|
|
Granted |
|
11 |
|
31.30 |
|
|
|
|
| ||
|
Exercised |
|
(234 |
) |
7.38 |
|
$ |
4,849 |
|
|
| |
|
Forfeited, expired or repurchased |
|
(32 |
) |
33.04 |
|
|
|
|
| ||
|
Outstanding at June 30, 2017 |
|
1,475 |
|
$ |
18.02 |
|
$ |
12,212 |
|
5.7 |
|
|
Granted |
|
50 |
|
21.43 |
|
|
|
|
| ||
|
Exercised |
|
(445 |
) |
7.23 |
|
$ |
4,243 |
|
|
| |
|
Forfeited, expired or repurchased |
|
(23 |
) |
30.83 |
|
|
|
|
| ||
|
Outstanding at June 30, 2018 |
|
1,057 |
|
$ |
22.46 |
|
$ |
2,584 |
|
5.4 |
|
|
|
|
|
|
|
|
|
|
|
| ||
|
Vested and expected to vest at June 30, 2018 |
|
1,053 |
|
$ |
22.46 |
|
$ |
2,584 |
|
5.4 |
|
|
Exercisable at June 30, 2018 |
|
1,006 |
|
$ |
22.25 |
|
$ |
2,584 |
|
5.2 |
|
Restricted Stock
The Company measures restricted stock compensation costs based on the stock price at the grant date less an estimate for expected forfeitures. The annual forfeiture rate used to calculate compensation expense was 5.7%, 6.5% and 6.5% for fiscal years ended June 30, 2018, 2017 and 2016, respectively.
A summary of restricted stock awards as of June 30, 2018, 2017 and 2016 and changes during the fiscal years then ended, is presented below:
|
(In thousands) |
|
Awards |
|
Weighted |
|
Aggregate |
| ||
|
|
|
|
|
|
|
|
| ||
|
Non-vested at June 30, 2015 |
|
98 |
|
$ |
37.83 |
|
|
| |
|
Granted |
|
147 |
|
54.64 |
|
|
| ||
|
Vested |
|
(66 |
) |
47.11 |
|
$ |
3,511 |
| |
|
Forfeited |
|
(12 |
) |
47.67 |
|
|
| ||
|
Non-vested at June 30, 2016 |
|
167 |
|
$ |
48.22 |
|
|
| |
|
Granted |
|
298 |
|
24.73 |
|
|
| ||
|
Vested |
|
(86 |
) |
42.60 |
|
$ |
2,564 |
| |
|
Forfeited |
|
(45 |
) |
32.90 |
|
|
| ||
|
Non-vested at June 30, 2017 |
|
334 |
|
$ |
30.71 |
|
|
| |
|
Granted |
|
641 |
|
18.01 |
|
|
| ||
|
Vested |
|
(191 |
) |
31.30 |
|
$ |
4,104 |
| |
|
Forfeited |
|
(80 |
) |
20.95 |
|
|
| ||
|
Non-vested at June 30, 2018 |
|
704 |
|
$ |
20.06 |
|
|
| |
Performance-Based Shares
On September 22, 2017, the Company approved and granted performance-based awards to certain key executives. The stock-settled awards will cliff vest based on relative Total Shareholder Return (“TSR”) over a three-year period. The Company measures share-based compensation cost for TSR awards using a Monte-Carlo simulation model.
A summary of performance-based share awards as of June 30, 2018 and changes during the current fiscal year, is presented below:
|
(In thousands, except for weighted average price and life data) |
|
Awards |
|
Weighted |
|
Aggregate |
| ||
|
|
|
|
|
|
|
|
| ||
|
Non-vested at June 30, 2017 |
|
— |
|
$ |
— |
|
|
| |
|
Granted |
|
47 |
|
$ |
25.58 |
|
|
| |
|
Vested |
|
(27 |
) |
$ |
25.58 |
|
$ |
574 |
|
|
Forfeited |
|
— |
|
$ |
— |
|
|
| |
|
Non-vested at June 30, 2018 |
|
20 |
|
$ |
25.58 |
|
|
| |
In connection with the termination of the employment of Arthur P. Bedrosian and Kevin Smith, the Company’s former Chief Executive Officer and Senior Vice President of Sales, respectively, the Company entered into separation agreements which each individual pursuant to which both individuals received certain benefits including, among others, accelerated vesting of their outstanding equity awards.
Employee Stock Purchase Plan
In February 2003, the Company’s stockholders approved an Employee Stock Purchase Plan (“ESPP”). Employees eligible to participate in the ESPP may purchase shares of the Company’s stock at 85% of the lower of the fair market value of the common stock on the first day of the calendar quarter, or the last day of the calendar quarter. Under the ESPP, employees can authorize the Company to withhold up to 10% of their compensation during any quarterly offering period, subject to certain limitations. The ESPP was implemented on April 1, 2003 and is qualified under Section 423 of the Internal Revenue Code. The Board of Directors authorized an aggregate total of 1.1 million shares of the Company’s common stock for issuance under the ESPP. During the fiscal years ended June 30, 2018, 2017 and 2016, 66 thousand shares, 57 thousand shares and 47 thousand shares were issued under the ESPP, respectively. As of June 30, 2018, 608 thousand total cumulative shares have been issued under the ESPP.
The following table presents the allocation of share-based compensation costs recognized in the Consolidated Statements of Operations by financial statement line item:
|
|
|
For Fiscal Year Ended June 30, |
| |||||||
|
(In thousands) |
|
2018 |
|
2017 |
|
2016 |
| |||
|
Selling, general and administrative expenses |
|
$ |
7,570 |
|
$ |
5,855 |
|
$ |
9,529 |
|
|
Research and development expenses |
|
680 |
|
661 |
|
760 |
| |||
|
Cost of sales |
|
1,646 |
|
1,203 |
|
1,273 |
| |||
|
Total |
|
$ |
9,896 |
|
$ |
7,719 |
|
$ |
11,562 |
|
|
|
|
|
|
|
|
|
| |||
|
Tax benefit at statutory rate |
|
$ |
2,919 |
|
$ |
2,818 |
|
$ |
4,220 |
|
Note 17. Employee Benefit Plan
The Company has a 401k defined contribution plan (the “Plan”) covering substantially all employees. Pursuant to the Plan provisions, the Company is required to make matching contributions equal to 50% of each employee’s contribution, not to exceed 4% of the employee’s compensation for the Plan year. Contributions to the Plan during the fiscal years ended June 30, 2018, 2017 and 2016 were $2.3 million, $2.1 million and $1.6 million, respectively.
Note 18. Income Taxes
On December 22, 2017, the 2017 Tax Reform was enacted into law, which significantly revised the Internal Revenue Code of 1986, as amended. The 2017 Tax Reform includes, among other items, permanent reduction of the corporate tax rate from a top marginal rate of 35% to a flat rate of 21%; and modifying or repealing many other business deductions and credits.
The Company has assessed the impacts of the changes from the 2017 Tax Reform and recorded a provisional non-cash net tax charge of $13.1 million for the year ended June 30, 2018. This provisional tax charge consists primarily of a re-measurement of the net U.S. deferred tax assets to the lower enacted U.S. corporate tax rate of 21%. While we have completed our provisional analysis of the income tax effects of the 2017 Tax Reform, the related tax charge may differ, possibly materially, due to further refinement of our calculations, changes in interpretations and assumptions that we have made, additional guidance that may be issued by regulatory bodies, and actions and related accounting policy decisions we may take as a result of the new legislation. We will complete our analysis during the one-year measurement period from the enactment of the law as provided for by SAB 118, and any adjustments during this measurement period will be included in net earnings from continuing operations as an adjustment to income tax expense in the reporting period when such adjustments are determined.
The provision for income taxes consisted of the following for the fiscal years ended June 30:
|
(In thousands) |
|
June 30, |
|
June 30, |
|
June 30, |
| |||
|
Current Income Tax Expense (Benefit) |
|
|
|
|
|
|
| |||
|
Federal |
|
$ |
(9,439 |
) |
$ |
764 |
|
$ |
34,932 |
|
|
State and Local |
|
1,152 |
|
638 |
|
1,887 |
| |||
|
Total Current Income Tax Expense (Benefit) |
|
(8,287 |
) |
1,402 |
|
36,819 |
| |||
|
Deferred Income Tax Expense (Benefit) |
|
|
|
|
|
|
| |||
|
Federal |
|
31,263 |
|
(2,210 |
) |
(17,529 |
) | |||
|
State and Local |
|
(573 |
) |
1,905 |
|
(1,968 |
) | |||
|
Total Deferred Income Tax Expense (Benefit) |
|
30,690 |
|
(305 |
) |
(19,497 |
) | |||
|
Total Income Tax Expense |
|
$ |
22,403 |
|
$ |
1,097 |
|
$ |
17,322 |
|
A reconciliation of the differences between the effective rates and federal statutory rates was as follows:
|
|
|
June 30, |
|
June 30, |
|
June 30, |
|
|
|
|
|
|
|
|
|
|
|
Federal income tax at statutory rate |
|
28.1 |
% |
35.0 |
% |
35.0 |
% |
|
State and local income tax, net |
|
0.6 |
% |
293.6 |
% |
(0.1 |
)% |
|
Nondeductible expenses |
|
0.2 |
% |
45.4 |
% |
0.8 |
% |
|
Foreign rate differential |
|
0.4 |
% |
49.9 |
% |
0.5 |
% |
|
Income tax credits |
|
(1.4 |
)% |
(160.9 |
)% |
(3.0 |
)% |
|
Domestic production activity deduction |
|
(1.5 |
)% |
— |
|
(5.2 |
)% |
|
Unrecognized tax benefits |
|
(6.7 |
)% |
— |
|
— |
|
|
Change in tax laws |
|
25.6 |
% |
— |
|
— |
|
|
Excess tax benefits on share-based compensation |
|
(0.3 |
)% |
(134.3 |
)% |
— |
|
|
Other |
|
(1.2 |
)% |
70.8 |
% |
(0.1 |
)% |
|
Effective income tax rate |
|
43.8 |
% |
199.5 |
% |
27.9 |
% |
The principal types of differences between assets and liabilities for financial statement and tax return purposes are accruals, reserves, impairment of intangibles, accumulated amortization, accumulated depreciation and share-based compensation expense. A deferred tax asset is recorded for the future benefits created by the timing of accruals and reserves and the application of different amortization lives for financial statement and tax return purposes. The Company’s deferred tax liability is mainly attributable to different depreciation methods for financial statement and tax return purposes. A deferred tax asset valuation allowance is established if it is more likely than not that the Company will be unable to realize certain of the deferred tax assets. As of June 30, 2018 and 2017, temporary differences which give rise to deferred tax assets and liabilities were as follows:
|
(In thousands) |
|
June 30, |
|
June 30, |
| ||
|
Deferred tax assets: |
|
|
|
|
| ||
|
Accrued expenses |
|
$ |
1,085 |
|
$ |
1,869 |
|
|
Share-based compensation expense |
|
4,158 |
|
6,031 |
| ||
|
Reserve for returns |
|
9,342 |
|
15,032 |
| ||
|
Reserves for rebates |
|
— |
|
11,194 |
| ||
|
Reserves for accounts receivable and inventory |
|
5,425 |
|
2,026 |
| ||
|
Intangible impairment |
|
1,337 |
|
2,176 |
| ||
|
Federal net operating loss |
|
402 |
|
736 |
| ||
|
State net operating loss |
|
4,495 |
|
2,944 |
| ||
|
Impairment on Cody note receivable |
|
1,175 |
|
1,913 |
| ||
|
Accumulated amortization on intangible assets |
|
10,868 |
|
25,505 |
| ||
|
Settlement Liability |
|
— |
|
6,019 |
| ||
|
Foreign net operating loss |
|
880 |
|
736 |
| ||
|
Other |
|
404 |
|
290 |
| ||
|
Total deferred tax asset |
|
39,571 |
|
76,471 |
| ||
|
Valuation allowance |
|
(8,120 |
) |
(6,391 |
) | ||
|
Total deferred tax asset less valuation allowance |
|
31,451 |
|
70,080 |
| ||
|
Deferred tax liabilities: |
|
|
|
|
| ||
|
Prepaid expenses |
|
118 |
|
267 |
| ||
|
Property, plant and equipment |
|
9,231 |
|
16,807 |
| ||
|
Other |
|
39 |
|
253 |
| ||
|
Total deferred tax liability |
|
9,388 |
|
17,327 |
| ||
|
Net deferred tax asset |
|
$ |
22,063 |
|
$ |
52,753 |
|
The net deferred tax asset as of June 30, 2018 and 2017 is reduced by a valuation allowance of $8.1 million and $6.4 million, respectively, which are primarily related to deferred tax assets for various states, the impairment on the Cody note receivable as well as foreign net operating losses. The Company increased the valuation allowance in Fiscal 2018 primarily related to an increase of state deferred tax assets.
The Company may recognize the tax benefit from an uncertain tax position claimed on a tax return only if it is more likely than not that the tax position will be sustained on examination by the taxing authorities, based on the technical merits of the position. The tax benefits recognized in the financial statements from such a position should be measured based on the largest benefit that has a greater than 50% likelihood of being realized upon ultimate settlement.
A reconciliation of the beginning and ending amount of gross unrecognized tax benefits (exclusive of interest and penalties) was as follows:
|
(In thousands) |
|
Balance |
| |
|
Balance at June 30, 2016 |
|
$ |
6,244 |
|
|
Additions for tax positions of the current year |
|
168 |
| |
|
Additions for tax positions of prior years |
|
16 |
| |
|
Additions from acquisitions |
|
— |
| |
|
Reductions for tax positions of prior years |
|
— |
| |
|
Settlements |
|
— |
| |
|
Lapse of statute of limitations |
|
(486 |
) | |
|
Balance at June 30, 2017 |
|
$ |
5,942 |
|
|
Additions for tax positions of the current year |
|
294 |
| |
|
Additions for tax positions of prior years |
|
700 |
| |
|
Additions from acquisitions |
|
— |
| |
|
Reductions for tax positions of prior years |
|
— |
| |
|
Settlements |
|
— |
| |
|
Lapse of statute of limitations |
|
(4,399 |
) | |
|
Balance at June 30, 2018 |
|
$ |
2,537 |
|
The amount of unrecognized tax benefits at June 30, 2018, 2017 and 2016 was $2.5 million, $5.9 million and $6.2 million respectively, of which $2.3 million, $4.2 million and $4.4 million would impact the Company’s effective tax rate, respectively, if recognized.
The Company has not recorded any interest and penalties for the periods ended June 30, 2018, 2017 and 2016 in the statement of operations and no cumulative interest and penalties have been recorded either in the Company’s consolidated balance sheet as of June 30, 2018 and 2017. The Company will recognize interest accrued on unrecognized tax benefits in interest expense and any related penalties in operating expenses.
The Company files income tax returns in the United States federal jurisdiction and various states. The Company’s tax returns for Fiscal Year 2014 and prior generally are no longer subject to review as such years generally are closed. The Company’s Fiscal Year 2016 federal return is currently under examination by the Internal Revenue Service (“IRS”). The Company cannot reasonably predict the outcome of the examination at this time. In July 2018, the Company was notified that the IRS will also expand their examination to include the Company’s Fiscal 2015 and Fiscal 2017 federal returns.
Note 19. Related Party Transactions
The Company had sales of $3.9 million, $3.7 million and $3.1 million during the fiscal years ended June 30, 2018, 2017 and 2016, respectively, to a generic distributor, Auburn Pharmaceutical Company (“Auburn”). Jeffrey Farber, a current board member, is the owner of Auburn. Accounts receivable includes amounts due from Auburn of $585 thousand and $751 thousand at June 30, 2018 and 2017, respectively.
The Company also had net sales of $1.9 million and $1.7 million during the fiscal years ended June 30, 2018 and 2017 to a generic distributor, KeySource Medical (“KeySource”). Albert Paonessa, a current board member, was appointed the CEO of KeySource in May 2017. Accounts receivable includes amounts due from KeySource of $514 thousand and $606 thousand as of June 30, 2018 and 2017.
The Company incurred expenses totaling $332 thousand during the fiscal year ended June 30, 2018 for online medical benefit services provided by a subsidiary of a variable interest entity. See Note 12. “Commitments” for more information. Accounts payable includes amounts due to the variable interest entity of $58 thousand as of June 30, 2018.
Note 20. Material Contracts with Suppliers
Jerome Stevens Pharmaceuticals Distribution Agreement:
The Company’s primary finished goods inventory supplier is JSP, in Bohemia, New York. Purchases of finished goods inventory from JSP accounted for 37%, 36% and 52% of the Company’s inventory purchases in the fiscal year ending June 30, 2018, 2017 and 2016, respectively.
On August 19, 2013, the Company entered into an agreement with JSP to extend its initial contract to continue as the exclusive distributor in the United States of three JSP products: Butalbital, Aspirin, Caffeine with Codeine Phosphate Capsules USP; Digoxin Tablets USP; and Levothyroxine Sodium Tablets USP. The amendment to the original agreement extends the initial contract, which was due to expire on March 22, 2014, for five years through March 2019. In connection with the amendment, the Company issued a total of 1.5 million shares of the Company’s common stock to JSP and JSP’s designees. In accordance with its policy related to renewal and extension costs for recognized intangible assets, the Company recorded a $20.1 million expense in cost of sales, which represents the fair value of the shares on August 19, 2013. On August 20, 2018, the Company announced that the JSP Distribution Agreement which expires on March 23, 2019 will not be renewed. See Note 22. “Subsequent Events” for more information.
Note 21. Acquisitions
On November 25, 2015, the Company completed the acquisition of KUPI, the former U.S. specialty generic pharmaceuticals subsidiary of global biopharmaceuticals company UCB S.A., pursuant to the terms and conditions of a Stock Purchase Agreement. KUPI is a specialty pharmaceuticals manufacturer focused on the development of products that are difficult to formulate or utilize specialized delivery technologies. Strategic benefits of the acquisition include expanded manufacturing capacity, a diversified product portfolio and pipeline and complementary research and development expertise.
Unaudited Pro Forma Financial Results
The following supplemental unaudited pro forma information presents the financial results as if the acquisition of KUPI had occurred on July 1, 2014 for the fiscal year ended June 30, 2016. This supplemental pro forma information has been prepared for comparative purposes and does not purport to be indicative of what would have occurred had the acquisition been made on July 1, 2014, nor are they indicative of any future results:
|
(In thousands, except per share data) |
|
For the fiscal year |
| |
|
Total net sales |
|
$ |
689,754 |
|
|
Net income attributable to Lannett Company, Inc. |
|
61,916 |
| |
|
Earnings per common share attributable to Lannett Company, Inc.: |
|
|
| |
|
Basic |
|
$ |
1.70 |
|
|
Diluted |
|
$ |
1.66 |
|
The supplemental pro forma earnings for the fiscal year ended June 30, 2016 were adjusted to exclude $28.9 million of acquisition-related costs, of which $21.5 million was incurred by Lannett and $7.4 million was incurred by KUPI and $17.0 million of expense related to the amortization of fair value adjustments to acquisition-date inventory.
Note 22. Subsequent Events
Sale of buildings
On July 13, 2018, the Company completed the sale of real property located at 11501 Roosevelt Boulevard and 11601 Roosevelt Boulevard in Philadelphia, Pennsylvania for total consideration of $14.6 million before fees and selling costs. The carrying value of the property was included within the Assets Held for Sale line of the Consolidated Balance Sheet as of June 30, 2018.
License Agreement with Andor Pharmaceuticals
On July 30, 2018, the Company entered into a license agreement (the “License Agreement”) with Andor Pharmaceuticals, LLC (“Andor”), pursuant to which Andor granted the Company an exclusive license (the “License”) with respect to all rights and interests of Andor in and to the ANDA Application for Methylphenidate Hydrochloride (the “Products”).
As consideration for the grant of the License, the Company has agreed to pay Andor (a) $1,500,000 in cash, of which $500,000 was paid at closing on August 3, 2018, and $1,000,000 will be paid upon approval by the United States FDA of an AB rating with respect to the Products (the “AB Rating Approval”), and (b) royalties based upon the net profits realized from the sale of the Products by the Company. The License Agreement, as amended by Amendment No. 1 to License Agreement dated August 2, 2018, by and between the Company and Andor (the “Amendment”), requires the Company to make minimum royalty payments to Andor during the initial four year period following the first commercial sale of the Products by the Company of $16,000,000 (the “Royalty Guaranty”). The amount of the Royalty Guaranty will be reduced by $4,000,000 for each application, if any, by a third party with respect to the Products that both receives regulatory approval from the FDA and is commercially launched after February 2, 2019 and prior to the receipt of the AB Rating Approval.
JSP Distribution Agreement
After the close of business on August 17, 2018, JSP notified the Company that it will not extend or renew the JSP Distribution Agreement when the current term expires on March 23, 2019. Because products covered by the JSP Distribution Agreement generate a significant portion of our revenues and gross profits, JSP’s decision not to renew or extend its distribution agreement with us will materially adversely affect our future operating results and cash flows beginning in the fourth quarter of Fiscal 2019. Net sales of JSP products totaled $253.1 million in fiscal year 2018. Of that amount, Levothyroxine Sodium Tablets USP net sales totaled $245.9 million, with gross margins of approximately 60%, in fiscal year 2018. When announced on August 20, 2018, this resulted in a significant decline in the Company’s market capitalization.
The Company has determined that such nonrenewal represents a “triggering event” under U.S. GAAP and, accordingly, will perform an analysis to determine the potential for any impairment of goodwill and certain long-lived assets of the Company in the first quarter of Fiscal 2019. In management’s opinion, the impairment assessment will likely result in a material impairment of goodwill and may result in an impairment of certain long-lived assets; however, at this time the Company cannot estimate the amount or a reasonable range of amounts of such impairment. As of June 30, 2018, the carrying value of goodwill was $339.6 million. Any impairment would result in a noncash charge to earnings in the first quarter of Fiscal 2019.
As noted above, JSP’s decision not to renew or extend its distribution agreement with us will materially adversely affect our future operating results, liquidity and cash flows, which could impact our ability to comply with the financial and other covenants in our Amended Senior Secured Credit Facility. As of June 30, 2018, the Company was in compliance with its financial covenants. As of June 30, 2018, cash and cash equivalents totaled $98.6 million in addition to availability under our undrawn Revolver totaling $125.0 million.
Based on its projections for Fiscal 2019 excluding revenue and related gross profits generated by the products distributed under the JSP Distribution Agreement subsequent to March 23, 2019 and without further analysis of potential restructuring and/or refinancing, the Company expects to have sufficient liquidity and cashflows to meet its operating and debt service requirements for at least the next twelve months from the issuance of the June 30, 2018 consolidated financial statements. The Company also expects to be in compliance with its financial covenants for Fiscal 2019.
Class Action Lawsuit
In August 2018, a putative class action lawsuit was filed against the Company and two of its officers claiming that the Company damaged the purported class by including in its securities filings false and misleading statements regarding the sustainability of the Company’s revenues and/or by failing to disclose material adverse facts regarding the risk of the loss of a particular distribution agreement. The Company has not been served with a copy of the complaint. The Company cannot reasonably predict the outcome of the suit at this time.
Note 23. Quarterly Financial Information (Unaudited)
Lannett’s quarterly consolidated results of operations are shown below:
|
|
|
Fourth |
|
Third |
|
Second |
|
First |
| ||||
|
(In thousands, except per share data) |
|
Quarter |
|
Quarter |
|
Quarter |
|
Quarter |
| ||||
|
Fiscal 2018 |
|
|
|
|
|
|
|
|
| ||||
|
Net sales |
|
$ |
170,911 |
|
$ |
174,386 |
|
$ |
184,305 |
|
$ |
154,961 |
|
|
Cost of sales |
|
104,383 |
|
107,329 |
|
96,855 |
|
87,290 |
| ||||
|
Gross profit |
|
66,528 |
|
67,057 |
|
87,450 |
|
67,671 |
| ||||
|
Operating expenses |
|
57,926 |
|
33,777 |
|
40,315 |
|
26,992 |
| ||||
|
Operating income |
|
8,602 |
|
33,280 |
|
47,135 |
|
40,679 |
| ||||
|
Other loss |
|
(20,844 |
) |
(22,785 |
) |
(14,975 |
) |
(19,999 |
) | ||||
|
Income tax expense (benefit) |
|
(883 |
) |
(2,275 |
) |
18,138 |
|
7,423 |
| ||||
|
Net income (loss) attributable to Lannett Company, Inc. |
|
$ |
(11,359 |
) |
$ |
12,770 |
|
$ |
14,022 |
|
$ |
13,257 |
|
|
Earnings (loss) per common share attributable to Lannett Company Inc. (1) |
|
|
|
|
|
|
|
|
| ||||
|
Basic |
|
$ |
(0.30 |
) |
$ |
0.34 |
|
$ |
0.38 |
|
$ |
0.36 |
|
|
Diluted |
|
$ |
(0.30 |
) |
$ |
0.33 |
|
$ |
0.37 |
|
$ |
0.35 |
|
|
|
|
Fourth |
|
Third |
|
Second |
|
First |
| ||||
|
(In thousands, except per share data) |
|
Quarter |
|
Quarter |
|
Quarter |
|
Quarter |
| ||||
|
Fiscal 2017 |
|
|
|
|
|
|
|
|
| ||||
|
Net sales |
|
$ |
139,118 |
|
$ |
165,720 |
|
$ |
170,944 |
|
$ |
161,559 |
|
|
Settlement agreement |
|
— |
|
(4,000 |
) |
— |
|
— |
| ||||
|
Total net sales |
|
139,118 |
|
161,720 |
|
170,944 |
|
161,559 |
| ||||
|
Cost of sales |
|
80,240 |
|
89,290 |
|
82,891 |
|
79,707 |
| ||||
|
Gross profit |
|
58,878 |
|
72,430 |
|
88,053 |
|
81,852 |
| ||||
|
Operating expenses |
|
30,069 |
|
28,793 |
|
53,747 |
|
102,158 |
| ||||
|
Operating income (loss) |
|
28,809 |
|
43,637 |
|
34,306 |
|
(20,306 |
) | ||||
|
Other loss |
|
(19,983 |
) |
(21,371 |
) |
(22,578 |
) |
(21,964 |
) | ||||
|
Income tax expense (benefit) |
|
3,100 |
|
7,337 |
|
3,542 |
|
(12,882 |
) | ||||
|
Less: Net income attributable to noncontrolling interest |
|
— |
|
— |
|
14 |
|
20 |
| ||||
|
Net income (loss) attributable to Lannett Company, Inc. |
|
$ |
5,726 |
|
$ |
14,929 |
|
$ |
8,172 |
|
$ |
(29,408 |
) |
|
Earnings (loss) per common share attributable to Lannett Company Inc. (1) |
|
|
|
|
|
|
|
|
| ||||
|
Basic |
|
$ |
0.16 |
|
$ |
0.41 |
|
$ |
0.22 |
|
$ |
(0.80 |
) |
|
Diluted |
|
$ |
0.15 |
|
$ |
0.40 |
|
$ |
0.22 |
|
$ |
(0.80 |
) |
|
|
|
Fourth |
|
Third |
|
Second |
|
First |
| ||||
|
(In thousands, except per share data) |
|
Quarter |
|
Quarter |
|
Quarter |
|
Quarter |
| ||||
|
Fiscal 2016 |
|
|
|
|
|
|
|
|
| ||||
|
Net sales |
|
$ |
168,887 |
|
$ |
163,712 |
|
$ |
127,059 |
|
$ |
106,433 |
|
|
Settlement agreement |
|
— |
|
(23,598 |
) |
— |
|
— |
| ||||
|
Total net sales |
|
168,887 |
|
140,114 |
|
127,059 |
|
106,433 |
| ||||
|
Cost of sales |
|
88,957 |
|
82,623 |
|
55,414 |
|
29,006 |
| ||||
|
Gross profit |
|
79,930 |
|
57,491 |
|
71,645 |
|
77,427 |
| ||||
|
Operating expenses |
|
49,535 |
|
38,874 |
|
41,320 |
|
26,006 |
| ||||
|
Operating income |
|
30,395 |
|
18,617 |
|
30,325 |
|
51,421 |
| ||||
|
Other loss |
|
(29,752 |
) |
(26,830 |
) |
(10,827 |
) |
(1,170 |
) | ||||
|
Income tax expense (benefit) |
|
(2,948 |
) |
(2,743 |
) |
5,958 |
|
17,055 |
| ||||
|
Less: Net income attributable to noncontrolling interest |
|
20 |
|
20 |
|
20 |
|
15 |
| ||||
|
Net income (loss) attributable to Lannett Company, Inc. |
|
$ |
3,571 |
|
$ |
(5,490 |
) |
$ |
13,520 |
|
$ |
33,181 |
|
|
Earnings (loss) per common share attributable to Lannett Company Inc. (1) |
|
|
|
|
|
|
|
|
| ||||
|
Basic |
|
$ |
0.10 |
|
$ |
(0.15 |
) |
$ |
0.37 |
|
$ |
0.91 |
|
|
Diluted |
|
$ |
0.10 |
|
$ |
(0.15 |
) |
$ |
0.36 |
|
$ |
0.89 |
|
(1) Due to differences in weighted average common shares outstanding, quarterly earnings per share may not add up to the totals reported for the full fiscal year.
The increase in net sales and gross profit in the second quarter of Fiscal 2018 is primarily due to a temporary disruption of our competitor’s supplies in the Thyroid Deficiency and Migraine medical indications. The declines in operating income in the third and fourth quarters of Fiscal 2018 were primarily related to a loss on sale of an intangible asset and asset impairment charges as a result of the Cody Restructuring Plan as well as other activities related to the consolidation of the Company’s manufacturing facilities. Income tax expense in the second quarter of Fiscal 2018 was negatively impacted due to the adoption of 2017 Tax Reform which resulted in a revaluation of the Company’s net long term deferred tax assets.
The decline in operating income in the first and second quarters of Fiscal 2017 is primarily attributable to a $65.1 million and $23.0 million intangible assets impairment charge, respectively. Total net sales in the third and fourth quarters of Fiscal 2017 were negatively impacted by $4.5 million and $5.7 million, respectively, due to the Bipartisan Budget Act of 2015 which required drug manufacturers to pay additional rebates to state Medicaid programs. Total net sales in the third quarter of Fiscal 2017 was also negatively impacted by a $4.0 million adjustment to the Fiscal 2016 settlement agreement amount with a former customer.
The decline in operating income in the third and fourth quarters of Fiscal 2016 is primarily attributable to a $23.6 million settlement agreement with a former customer and an $8.0 million intangible assets impairment charge, respectively. Net income attributable to Lannett Company, Inc. in the fourth quarter of Fiscal 2016 also included a $3.0 million loss on extinguishment of debt.
The decrease in the effective tax rate in the fourth quarter of Fiscal 2016 is primarily due to state deferred tax benefits recorded as a result of the KUPI acquisition. In addition, research and development tax credits and domestic manufacturing deductions relative to pre-tax income also contributed to the lower rate.