Attached files
| file | filename |
|---|---|
| 8-K - 8-K - TIAA REAL ESTATE ACCOUNT | tiaarealestate8-k93020.htm |

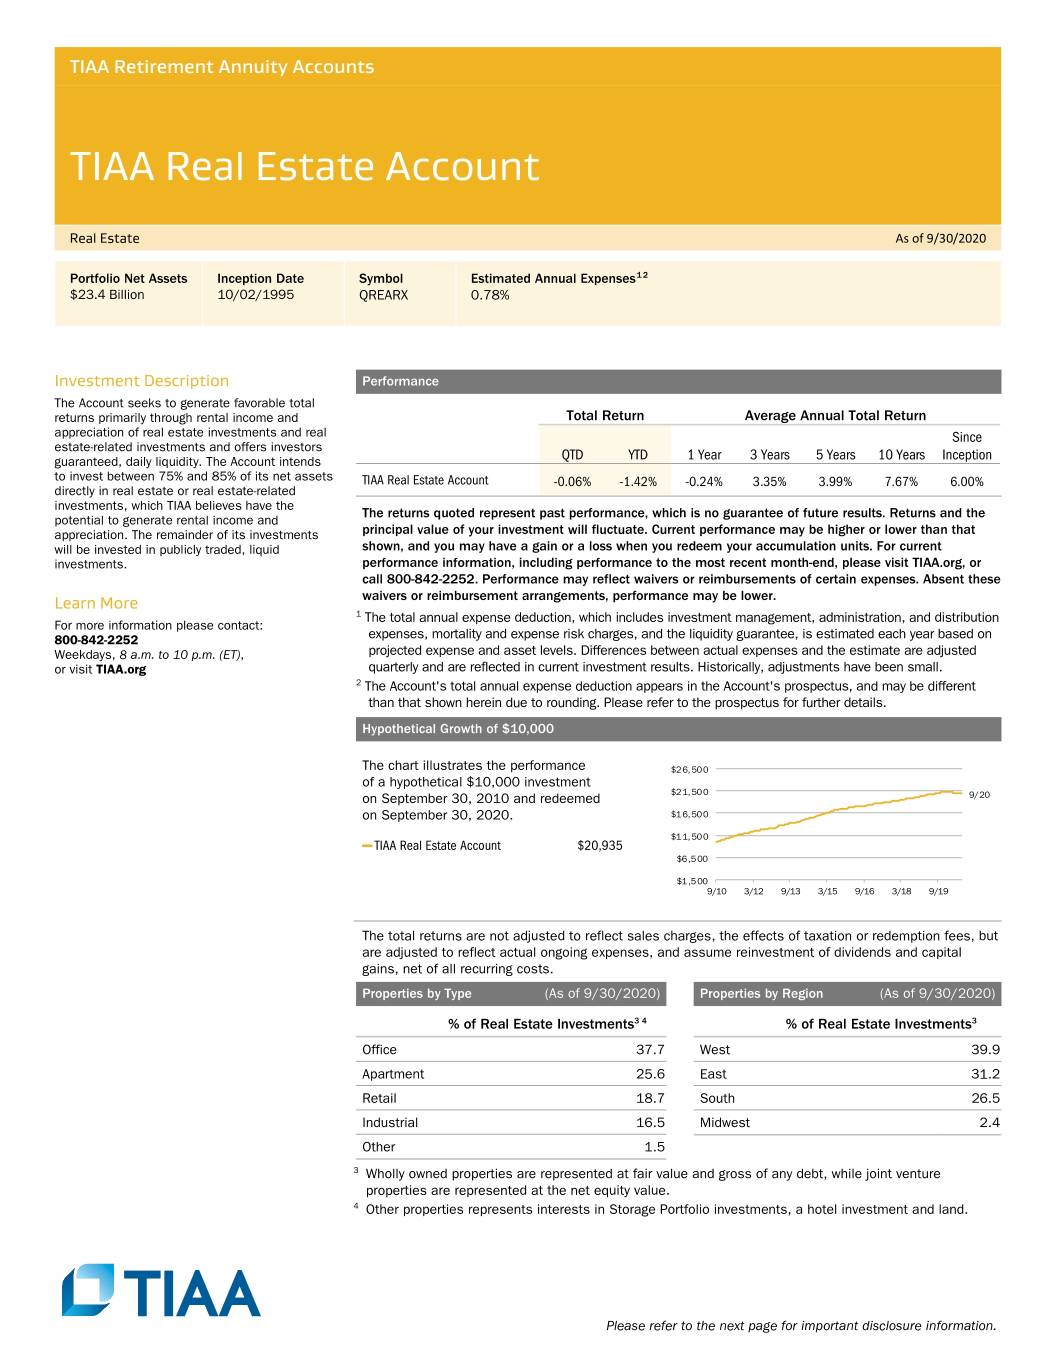
TIAA Retirement Annuity Accounts TIAA Real Estate Account Real Estate As of 9/30/2020 1 2 Portfolio Net Assets Inception Date Symbol Estimated Annual Expenses $23.4 Billion 10/02/1995 QREARX 0.78% Investment Description Performance The Account seeks to generate favorable total Total Return Average Annual Total Return returns primarily through rental income and appreciation of real estate investments and real Since estate-related investments and offers investors guaranteed, daily liquidity. The Account intends QTD YTD 1 Year 3 Years 5 Years 10 Years Inception to invest between 75% and 85% of its net assets TIAA Real Estate Account -0.06% -1.42% -0.24% 3.35% 3.99% 7.67% 6.00% directly in real estate or real estate-related investments, which TIAA believes have the The returns quoted represent past performance, which is no guarantee of future results. Returns and the potential to generate rental income and appreciation. The remainder of its investments principal value of your investment will fluctuate. Current performance may be higher or lower than that will be invested in publicly traded, liquid shown, and you may have a gain or a loss when you redeem your accumulation units. For current investments. performance information, including performance to the most recent month-end, please visit TIAA.org, or call 800-842-2252. Performance may reflect waivers or reimbursements of certain expenses. Absent these Learn More waivers or reimbursement arrangements, performance may be lower. 1 The total annual expense deduction, which includes investment management, administration, and distribution For more information please contact: 800-842-2252 expenses, mortality and expense risk charges, and the liquidity guarantee, is estimated each year based on Weekdays, 8 a.m. to 10 p.m. (ET), projected expense and asset levels. Differences between actual expenses and the estimate are adjusted or visit TIAA.org quarterly and are reflected in current investment results. Historically, adjustments have been small. 2 The Account's total annual expense deduction appears in the Account's prospectus, and may be different than that shown herein due to rounding. Please refer to the prospectus for further details. Hypothetical Growth of $10,000 The chart illustrates the performance $2 6, 50 0 of a hypothetical $10,000 investment $2 1, 50 0 on September 30, 2010 and redeemed 9/20 on September 30, 2020. $1 6, 50 0 $1 1, 50 0 — TIAA Real Estate Account $20,935 $6 ,5 00 $1 ,5 00 9/10 3/12 9/13 3/15 9/16 3/18 9/19 The total returns are not adjusted to reflect sales charges, the effects of taxation or redemption fees, but are adjusted to reflect actual ongoing expenses, and assume reinvestment of dividends and capital gains, net of all recurring costs. Properties by Type (As of 9/30/2020) Properties by Region (As of 9/30/2020) % of Real Estate Investments3 4 % of Real Estate Investments3 Office 37.7 West 39.9 Apartment 25.6 East 31.2 Retail 18.7 South 26.5 Industrial 16.5 Midwest 2.4 Other 1.5 3 Wholly owned properties are represented at fair value and gross of any debt, while joint venture properties are represented at the net equity value. 4 Other properties represents interests in Storage Portfolio investments, a hotel investment and land. Please refer to the next page for important disclosure information.

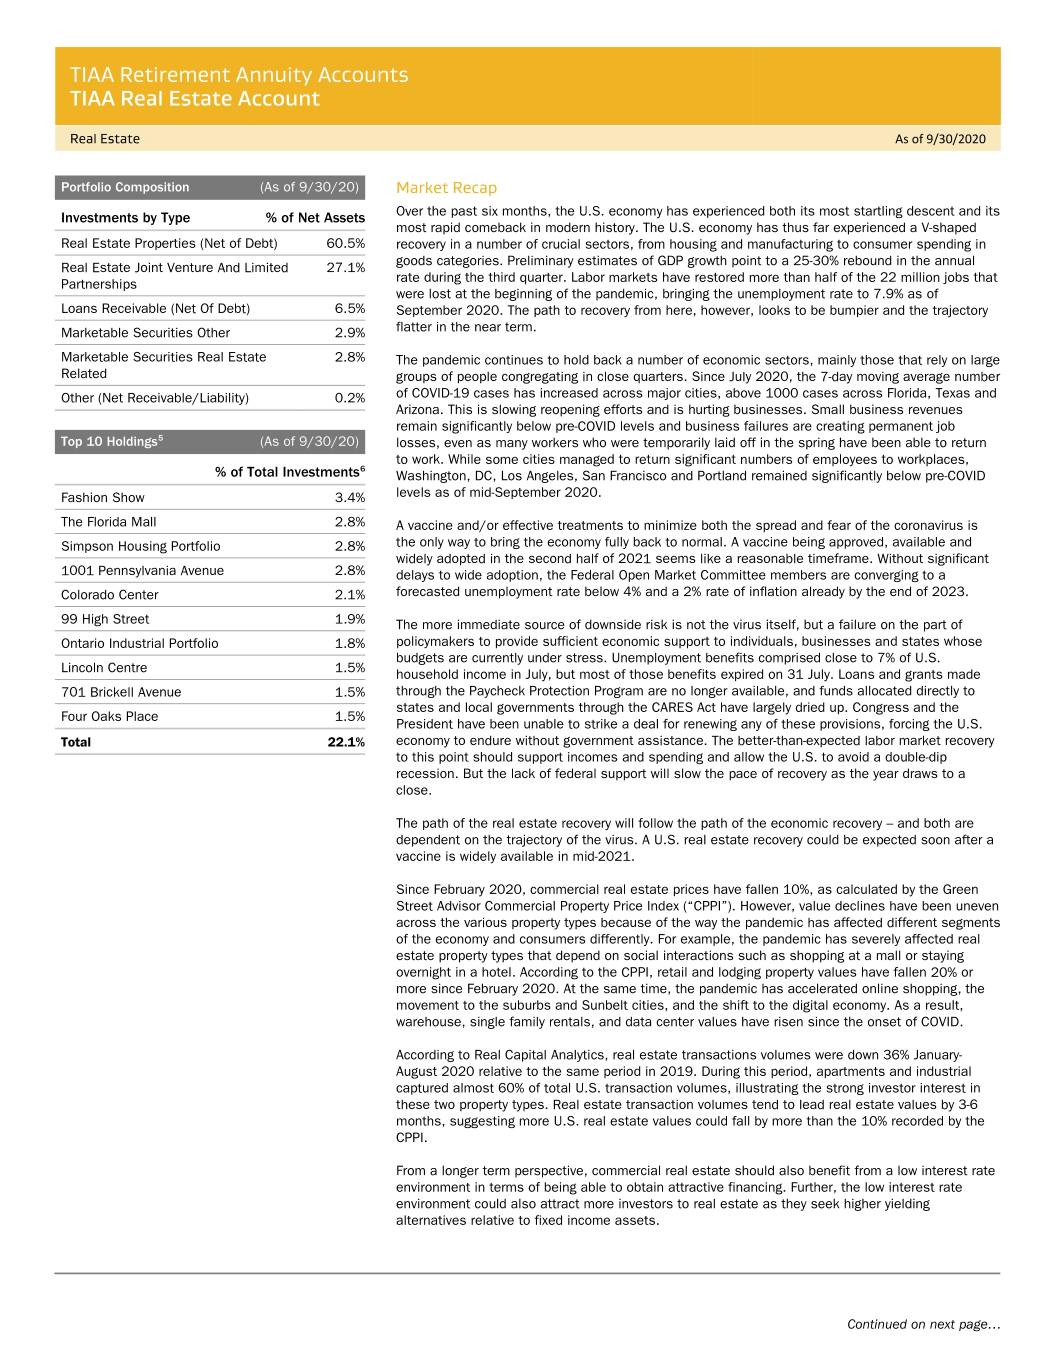
TIAA Retirement Annuity Accounts TIAA Real Estate Account Real Estate As of 9/30/2020 Portfolio Composition (As of 9/30/20) Market Recap Investments by Type % of Net Assets Over the past six months, the U.S. economy has experienced both its most startling descent and its most rapid comeback in modern history. The U.S. economy has thus far experienced a V-shaped Real Estate Properties (Net of Debt) 60.5% recovery in a number of crucial sectors, from housing and manufacturing to consumer spending in goods categories. Preliminary estimates of GDP growth point to a 25-30% rebound in the annual Real Estate Joint Venture And Limited 27.1% rate during the third quarter. Labor markets have restored more than half of the 22 million jobs that Partnerships were lost at the beginning of the pandemic, bringing the unemployment rate to 7.9% as of Loans Receivable (Net Of Debt) 6.5% September 2020. The path to recovery from here, however, looks to be bumpier and the trajectory Marketable Securities Other 2.9% flatter in the near term. Marketable Securities Real Estate 2.8% The pandemic continues to hold back a number of economic sectors, mainly those that rely on large Related groups of people congregating in close quarters. Since July 2020, the 7-day moving average number Other (Net Receivable/Liability) 0.2% of COVID-19 cases has increased across major cities, above 1000 cases across Florida, Texas and Arizona. This is slowing reopening efforts and is hurting businesses. Small business revenues remain significantly below pre-COVID levels and business failures are creating permanent job 5 Top 10 Holdings (As of 9/30/20) losses, even as many workers who were temporarily laid off in the spring have been able to return to work. While some cities managed to return significant numbers of employees to workplaces, 6 % of Total Investments Washington, DC, Los Angeles, San Francisco and Portland remained significantly below pre-COVID Fashion Show 3.4% levels as of mid-September 2020. The Florida Mall 2.8% A vaccine and/or effective treatments to minimize both the spread and fear of the coronavirus is Simpson Housing Portfolio 2.8% the only way to bring the economy fully back to normal. A vaccine being approved, available and widely adopted in the second half of 2021 seems like a reasonable timeframe. Without significant 1001 Pennsylvania Avenue 2.8% delays to wide adoption, the Federal Open Market Committee members are converging to a Colorado Center 2.1% forecasted unemployment rate below 4% and a 2% rate of inflation already by the end of 2023. 99 High Street 1.9% The more immediate source of downside risk is not the virus itself, but a failure on the part of Ontario Industrial Portfolio 1.8% policymakers to provide sufficient economic support to individuals, businesses and states whose budgets are currently under stress. Unemployment benefits comprised close to 7% of U.S. Lincoln Centre 1.5% household income in July, but most of those benefits expired on 31 July. Loans and grants made 701 Brickell Avenue 1.5% through the Paycheck Protection Program are no longer available, and funds allocated directly to states and local governments through the CARES Act have largely dried up. Congress and the Four Oaks Place 1.5% President have been unable to strike a deal for renewing any of these provisions, forcing the U.S. Total 22.1% economy to endure without government assistance. The better-than-expected labor market recovery to this point should support incomes and spending and allow the U.S. to avoid a double-dip recession. But the lack of federal support will slow the pace of recovery as the year draws to a close. The path of the real estate recovery will follow the path of the economic recovery – and both are dependent on the trajectory of the virus. A U.S. real estate recovery could be expected soon after a vaccine is widely available in mid-2021. Since February 2020, commercial real estate prices have fallen 10%, as calculated by the Green Street Advisor Commercial Property Price Index (“CPPI”). However, value declines have been uneven across the various property types because of the way the pandemic has affected different segments of the economy and consumers differently. For example, the pandemic has severely affected real estate property types that depend on social interactions such as shopping at a mall or staying overnight in a hotel. According to the CPPI, retail and lodging property values have fallen 20% or more since February 2020. At the same time, the pandemic has accelerated online shopping, the movement to the suburbs and Sunbelt cities, and the shift to the digital economy. As a result, warehouse, single family rentals, and data center values have risen since the onset of COVID. According to Real Capital Analytics, real estate transactions volumes were down 36% January- August 2020 relative to the same period in 2019. During this period, apartments and industrial captured almost 60% of total U.S. transaction volumes, illustrating the strong investor interest in these two property types. Real estate transaction volumes tend to lead real estate values by 3-6 months, suggesting more U.S. real estate values could fall by more than the 10% recorded by the CPPI. From a longer term perspective, commercial real estate should also benefit from a low interest rate environment in terms of being able to obtain attractive financing. Further, the low interest rate environment could also attract more investors to real estate as they seek higher yielding alternatives relative to fixed income assets. Continued on next page…

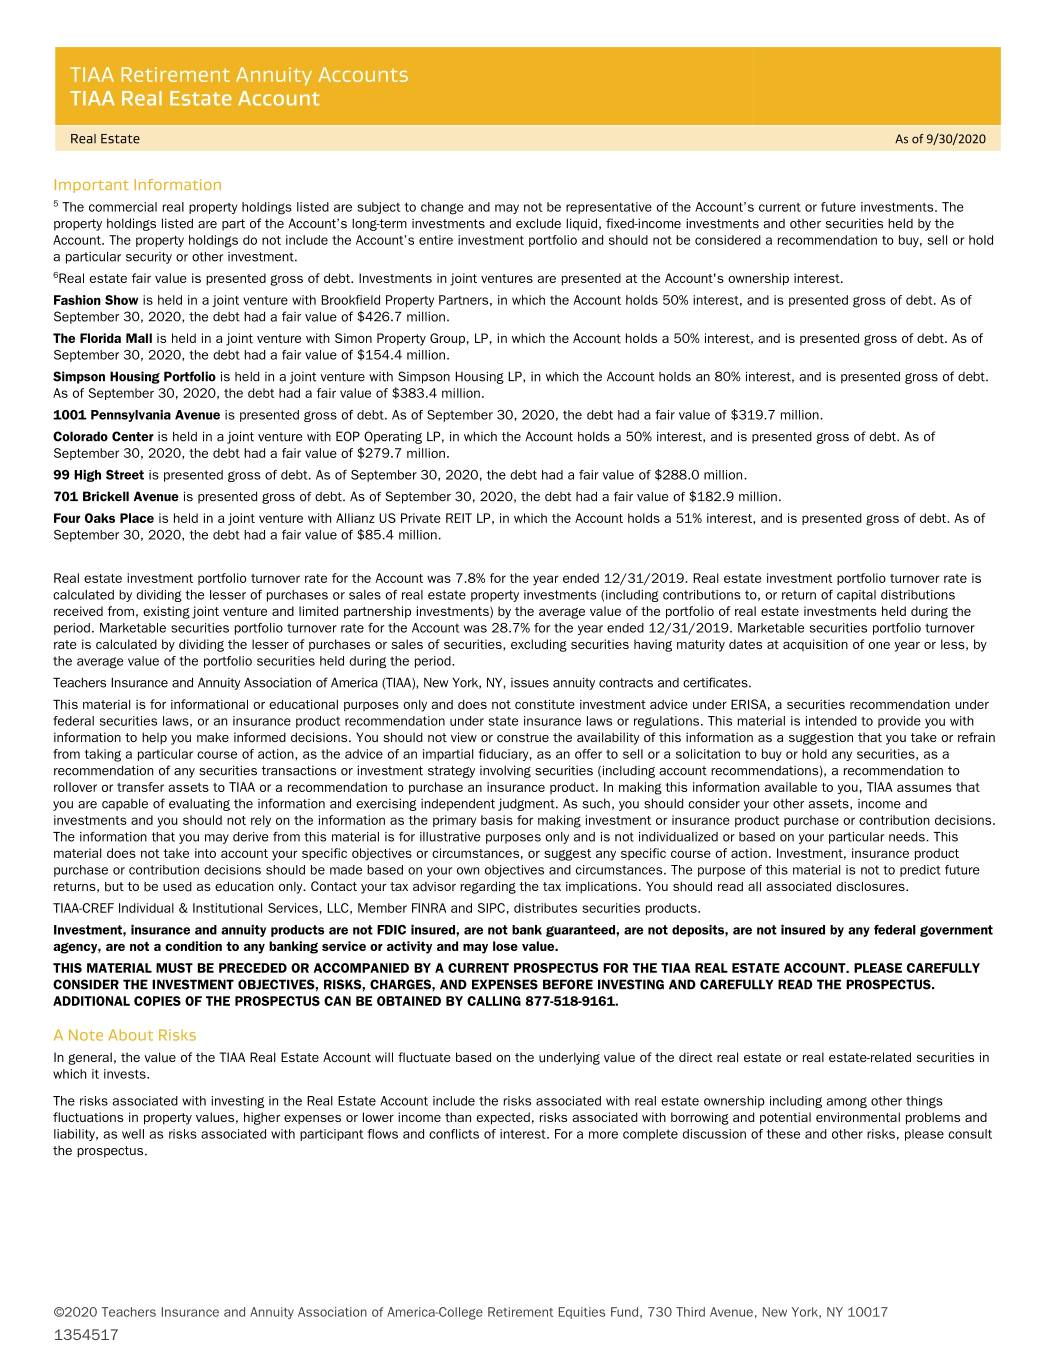
TIAA Retirement Annuity Accounts TIAA Real Estate Account Real Estate As of 9/30/2020 Important Information 5 The commercial real property holdings listed are subject to change and may not be representative of the Account’s current or future investments. The property holdings listed are part of the Account’s long-term investments and exclude liquid, fixed-income investments and other securities held by the Account. The property holdings do not include the Account’s entire investment portfolio and should not be considered a recommendation to buy, sell or hold a particular security or other investment. 6Real estate fair value is presented gross of debt. Investments in joint ventures are presented at the Account's ownership interest. Fashion Show is held in a joint venture with Brookfield Property Partners, in which the Account holds 50% interest, and is presented gross of debt. As of September 30, 2020, the debt had a fair value of $426.7 million. The Florida Mall is held in a joint venture with Simon Property Group, LP, in which the Account holds a 50% interest, and is presented gross of debt. As of September 30, 2020, the debt had a fair value of $154.4 million. Simpson Housing Portfolio is held in a joint venture with Simpson Housing LP, in which the Account holds an 80% interest, and is presented gross of debt. As of September 30, 2020, the debt had a fair value of $383.4 million. 1001 Pennsylvania Avenue is presented gross of debt. As of September 30, 2020, the debt had a fair value of $319.7 million. Colorado Center is held in a joint venture with EOP Operating LP, in which the Account holds a 50% interest, and is presented gross of debt. As of September 30, 2020, the debt had a fair value of $279.7 million. 99 High Street is presented gross of debt. As of September 30, 2020, the debt had a fair value of $288.0 million. 701 Brickell Avenue is presented gross of debt. As of September 30, 2020, the debt had a fair value of $182.9 million. Four Oaks Place is held in a joint venture with Allianz US Private REIT LP, in which the Account holds a 51% interest, and is presented gross of debt. As of September 30, 2020, the debt had a fair value of $85.4 million. Real estate investment portfolio turnover rate for the Account was 7.8% for the year ended 12/31/2019. Real estate investment portfolio turnover rate is calculated by dividing the lesser of purchases or sales of real estate property investments (including contributions to, or return of capital distributions received from, existing joint venture and limited partnership investments) by the average value of the portfolio of real estate investments held during the period. Marketable securities portfolio turnover rate for the Account was 28.7% for the year ended 12/31/2019. Marketable securities portfolio turnover rate is calculated by dividing the lesser of purchases or sales of securities, excluding securities having maturity dates at acquisition of one year or less, by the average value of the portfolio securities held during the period. Teachers Insurance and Annuity Association of America (TIAA), New York, NY, issues annuity contracts and certificates. This material is for informational or educational purposes only and does not constitute investment advice under ERISA, a securities recommendation under federal securities laws, or an insurance product recommendation under state insurance laws or regulations. This material is intended to provide you with information to help you make informed decisions. You should not view or construe the availability of this information as a suggestion that you take or refrain from taking a particular course of action, as the advice of an impartial fiduciary, as an offer to sell or a solicitation to buy or hold any securities, as a recommendation of any securities transactions or investment strategy involving securities (including account recommendations), a recommendation to rollover or transfer assets to TIAA or a recommendation to purchase an insurance product. In making this information available to you, TIAA assumes that you are capable of evaluating the information and exercising independent judgment. As such, you should consider your other assets, income and investments and you should not rely on the information as the primary basis for making investment or insurance product purchase or contribution decisions. The information that you may derive from this material is for illustrative purposes only and is not individualized or based on your particular needs. This material does not take into account your specific objectives or circumstances, or suggest any specific course of action. Investment, insurance product purchase or contribution decisions should be made based on your own objectives and circumstances. The purpose of this material is not to predict future returns, but to be used as education only. Contact your tax advisor regarding the tax implications. You should read all associated disclosures. TIAA-CREF Individual & Institutional Services, LLC, Member FINRA and SIPC, distributes securities products. Investment, insurance and annuity products are not FDIC insured, are not bank guaranteed, are not deposits, are not insured by any federal government agency, are not a condition to any banking service or activity and may lose value. THIS MATERIAL MUST BE PRECEDED OR ACCOMPANIED BY A CURRENT PROSPECTUS FOR THE TIAA REAL ESTATE ACCOUNT. PLEASE CAREFULLY CONSIDER THE INVESTMENT OBJECTIVES, RISKS, CHARGES, AND EXPENSES BEFORE INVESTING AND CAREFULLY READ THE PROSPECTUS. ADDITIONAL COPIES OF THE PROSPECTUS CAN BE OBTAINED BY CALLING 877-518-9161. A Note About Risks In general, the value of the TIAA Real Estate Account will fluctuate based on the underlying value of the direct real estate or real estate-related securities in which it invests. The risks associated with investing in the Real Estate Account include the risks associated with real estate ownership including among other things fluctuations in property values, higher expenses or lower income than expected, risks associated with borrowing and potential environmental problems and liability, as well as risks associated with participant flows and conflicts of interest. For a more complete discussion of these and other risks, please consult the prospectus. ©2020 Teachers Insurance and Annuity Association of America-College Retirement Equities Fund, 730 Third Avenue, New York, NY 10017 Continued on next page… 1354517
