Attached files
| file | filename |
|---|---|
| EXCEL - IDEA: XBRL DOCUMENT - TIAA REAL ESTATE ACCOUNT | Financial_Report.xls |
| EX-32 - TIAA REAL ESTATE ACCOUNT | c78270_ex32.htm |
| EX-31 - TIAA REAL ESTATE ACCOUNT | c78270_ex31.htm |
UNITED STATES
SECURITIES AND EXCHANGE COMMISSION
Washington, D.C. 20549
FORM 10-Q
(Mark One)
S QUARTERLY REPORT PURSUANT TO SECTION 13 OR 15(d) OF THE SECURITIES EXCHANGE ACT OF 1934 For the quarterly period ended June 30, 2014
OR
£ TRANSITION REPORT PURSUANT TO SECTION 13 OR 15(d) OF THE SECURITIES EXCHANGE ACT OF 1934
For the transition period from to
Commission file number: 33-92990; 333-194591
TIAA REAL ESTATE ACCOUNT
(Exact name of registrant as specified in its charter)
NEW YORK
(State or other jurisdiction
of incorporation or organization)
NOT APPLICABLE
(I.R.S. Employer Identification No.)
C/O TEACHERS INSURANCE AND
ANNUITY ASSOCIATION OF AMERICA
730 THIRD AVENUE
NEW YORK, NEW YORK 10017-3206
(Address of principal executive offices, including zip code)
Registrant’s telephone number, including area code: (212) 490-9000
Securities registered pursuant to Section 12(b) of the Act: None
Securities registered pursuant to Section 12(g) of the Act: None
Indicate by check mark if the registrant is a well-known seasoned issuer, as defined in Rule 405 of the Securities Act.
YES £ NO S
Indicate by check mark if the registrant is not required to file reports pursuant to Section 13 or Section 15(d) of the Exchange Act:
YES £ NO S
Indicate by check mark whether the Registrant (1) has filed all reports required to be filed by Section 13 or 15(d) of the Securities Exchange Act of 1934 during the preceding 12 months (or for such shorter period that the Registrant was required to file such reports), and (2) has been subject to such filing requirements for the past 90 days.
YES S NO £
Indicate by check mark if disclosure of delinquent filers pursuant to Item 405 or regulation S-K is not contained herein, and will not be contained, to the best of registrant’s knowledge, in definitive proxy or information statements incorporated by reference in Part III of this Form 10-Q or any amendment to this Form 10-Q: Not Applicable
Indicate by check mark whether the registrant has submitted electronically and posted on its corporate Web site, if any, every Interactive Data File required to be submitted and posted pursuant to Rule 405 of Regulation S-T (§232.405 of this chapter) during the preceding 12 months (or for such shorter period that the registrant was required to submit and post such files).
YES S NO £
Indicate by check mark whether the registrant is a large accelerated filer, an accelerated filer, a non-accelerated filer, or smaller reporting company. See the definitions of “large accelerated filer,” “accelerated filer” and “smaller reporting company” in Rule 12b-2 of the Exchange Act. (Check one):
|
|
|
Large accelerated filer £ |
Accelerated filer £ |
|
Non-accelerated filer S |
Smaller Reporting Company £ |
|
(Do not check if a smaller reporting company) |
|
|
Indicate by check mark whether the registrant is a shell company (as defined in Rule 12b-2 of the Exchange Act).
YES £ NO S
Aggregate market value of voting stock held by non-affiliates: Not Applicable
Documents Incorporated by Reference: None
PART I. FINANCIAL INFORMATION ITEM 1. UNAUDITED CONSOLIDATED FINANCIAL STATEMENTS. INDEX TO UNAUDITED CONSOLIDATED FINANCIAL STATEMENTS
Page
3
4
5
6
7
22 2
TIAA REAL ESTATE ACCOUNT
June 30, 2014
TIAA REAL ESTATE ACCOUNT
June 30,
December 31,
(Unaudited) ASSETS Investments, at fair value: Real estate properties
$
13,040.8
$
11,565.1 Real estate joint ventures and limited partnerships
3,027.4
2,925.6 Marketable securities: Real estate related
1,681.8
1,499.3 Other
2,743.0
3,119.6 Total investments
20,493.0
19,109.6 Cash and cash equivalents
15.9
14.6 Due from investment manager
4.7
2.5 Other
222.0
290.4 TOTAL ASSETS
20,735.6
19,417.1 LIABILITIES Mortgage loans payable, at fair value—Note 6
2,191.8
2,279.1 Accrued real estate property level expenses
174.8
198.6 Other
31.5
31.5 TOTAL LIABILITIES
2,398.1
2,509.2 COMMITMENTS AND CONTINGENCIES—Note 9 NET ASSETS Accumulation Fund
17,945.4
16,535.4 Annuity Fund
392.1
372.5 TOTAL NET ASSETS
$
18,337.5
$
16,907.9 NUMBER OF ACCUMULATION UNITS
56.8
55.3 NET ASSET VALUE, PER ACCUMULATION UNIT—Note 7
$
316.003
$
298.872 See notes to the consolidated financial statements 3
CONSOLIDATED STATEMENTS OF ASSETS AND LIABILITIES
(In millions, except per accumulation unit amounts)
2014
2013
(cost: $11,750.9 and $10,679.5)
(cost: $2,425.7 and $2,465.9)
(cost: $1,386.1 and $1,384.3)
(cost: $2,742.8 and $3,119.3)
(cost: $18,305.5 and $17,649.0)
(principal outstanding: $2,193.8 and $2,307.7)
OUTSTANDING—Note 8
TIAA REAL ESTATE ACCOUNT
For the Three Months
For the Six Months
2014
2013
2014
2013 INVESTMENT INCOME Real estate income, net: Rental income
$
221.4
$
207.0
$
437.2
$
411.4 Real estate property level expenses and taxes: Operating expenses
49.5
52.0
101.7
103.8 Real estate taxes
33.5
30.8
66.2
60.6 Interest expense
24.1
31.3
48.2
64.1 Total real estate property level expenses and taxes
107.1
114.1
216.1
228.5 Real estate income, net
114.3
92.9
221.1
182.9 Income from real estate joint ventures and limited partnerships
42.3
29.8
74.4
48.6 Interest
0.7
0.8
1.5
1.6 Dividends
11.0
10.1
19.2
19.3 TOTAL INVESTMENT INCOME
168.3
133.6
316.2
252.4 Expenses: Investment advisory charges
17.3
15.2
35.2
29.9 Administrative charges
11.1
9.6
22.1
18.2 Distribution charges
4.0
3.2
8.3
6.2 Mortality and expense risk charges
0.2
0.2
0.4
0.4 Liquidity guarantee charges
7.2
7.4
14.8
15.6 TOTAL EXPENSES
39.8
35.6
80.8
70.3 INVESTMENT INCOME, NET
128.5
98.0
235.4
182.1 NET REALIZED AND UNREALIZED GAIN (LOSS) ON Net realized gain (loss) on investments: Real estate properties
(1.6
)
(26.8
)
(2.6
)
(173.8
) Real estate joint ventures and limited partnerships
(4.5
)
(40.0
)
(4.3
)
(74.9
) Marketable securities
31.7
7.6
49.0
17.0 Net realized gain (loss) on investments
25.6
(59.2
)
42.1
(231.7
) Net change in unrealized appreciation (depreciation) on: Real estate properties
291.7
247.3
398.1
436.1 Real estate joint ventures and limited partnerships
93.2
124.6
156.5
198.5 Marketable securities
71.4
(53.8
)
176.5
39.3 Mortgage loans payable
(24.4
)
29.0
(26.6
)
41.8 Net change in unrealized appreciation on
431.9
347.1
704.5
715.7 NET REALIZED AND UNREALIZED GAIN ON
457.5
287.9
746.6
484.0 NET INCREASE IN NET ASSETS RESULTING FROM
$
586.0
$
385.9
$
982.0
$
666.1 See notes to the consolidated financial statements 4
CONSOLIDATED STATEMENTS OF OPERATIONS
(In millions)
(Unaudited)
Ended June 30,
Ended June 30,
INVESTMENTS AND MORTGAGE LOANS PAYABLE
investments and mortgage loans payable
INVESTMENTS AND MORTGAGE LOANS PAYABLE
OPERATIONS
TIAA REAL ESTATE ACCOUNT
For the Three Months
For the Six Months
2014
2013
2014
2013 FROM OPERATIONS Investment income, net
$
128.5
$
98.0
$
235.4
$
182.1 Net realized gain (loss) on investments
25.6
(59.2
)
42.1
(231.7
) Net change in unrealized appreciation on investments and mortgage loans payable
431.9
347.1
704.5
715.7 NET INCREASE IN NET ASSETS RESULTING
586.0
385.9
982.0
666.1 FROM PARTICIPANT TRANSACTIONS Premiums
557.2
618.6
1,082.8
1,176.4 Liquidity units redeemed—Note 3
—
—
—
(325.4
) Annuity payments
(7.9
)
(7.0
)
(15.5
)
(13.7
) Withdrawals and death benefits
(304.2
)
(350.5
)
(619.7
)
(622.1
) NET INCREASE IN NET ASSETS
245.1
261.1
447.6
215.2 NET INCREASE IN NET ASSETS
831.1
647.0
1,429.6
881.3 NET ASSETS Beginning of period
17,506.4
15,095.4
16,907.9
14,861.1 End of period
$
18,337.5
$
15,742.4
$
18,337.5
$
15,742.4 See notes to the consolidated financial statements 5
CONSOLIDATED STATEMENTS OF CHANGES IN NET ASSETS
(In millions)
(Unaudited)
Ended June 30,
Ended June 30,
FROM OPERATIONS
RESULTING FROM PARTICIPANT TRANSACTIONS
TIAA REAL ESTATE ACCOUNT
For the Six Months
2014
2013 CASH FLOWS FROM OPERATING ACTIVITIES Net increase in net assets resulting from operations
$
982.0
$
666.1 Adjustments to reconcile net changes in net assets resulting from operations to net cash used in operating activities: Net realized (gain) loss on investments
(42.1
)
231.7 Net change in unrealized appreciation on investments
(704.5
)
(715.7
) Purchase of real estate properties
(1,035.6
)
(289.3
) Capital improvements on real estate properties
(95.1
)
(101.0
) Proceeds from sale of real estate properties
45.4
411.8 Purchases of long term investments
(206.3
)
(247.9
) Proceeds from sale of long term investments
299.8
139.7 Decrease (increase) in other investments
376.6
(304.9
) Change in due from investment manager
(2.2
)
(20.5
) Decrease in other assets
68.4
17.6 Decrease in other liabilities
(18.8
)
(5.4
) NET CASH USED IN OPERATING ACTIVITIES
(332.4
)
(217.8
) CASH FLOWS FROM FINANCING ACTIVITIES Mortgage loan proceeds received
—
730.0 Payments of mortgage loans
(113.9
)
(733.8
) Premiums
1,082.8
1,176.4 Liquidity units redeemed
—
(325.4
) Annuity payments
(15.5
)
(13.7
) Withdrawals and death benefits
(619.7
)
(622.1
) NET CASH PROVIDED BY FINANCING ACTIVITIES
333.7
211.4 NET INCREASE (DECREASE) IN CASH AND CASH EQUIVALENTS
1.3
(6.4
) CASH AND CASH EQUIVALENTS Beginning of period
14.6
21.7 End of period
$
15.9
$
15.3 SUPPLEMENTAL DISCLOSURES: Cash paid for interest
$
47.6
$
64.1 See notes to the consolidated financial statements 6
CONSOLIDATED STATEMENTS OF CASH FLOWS
(In millions)
(Unaudited)
Ended June 30,
and mortgage loans payable
TIAA REAL ESTATE ACCOUNT Note 1—Organization and Significant Accounting Policies Business: The TIAA Real Estate Account (“Account”) is a segregated investment account of Teachers Insurance and Annuity Association of America (“TIAA”) and was established by resolution of TIAA’s Board of Trustees (the “Board”) on February 22, 1995, under the insurance laws of the State of New York,
for the purpose of funding variable annuity contracts issued by TIAA. The Account offers individual and group accumulating annuity contracts (with contributions made on a pre-tax or after-tax basis), as well as individual lifetime and term-certain variable payout annuity contracts (including the payment of death
benefits to beneficiaries). Investors are entitled to transfer funds to or from the Account, and make withdrawals from the Account on a daily basis under certain circumstances. Funds invested in the Account for each category of contract are expressed in terms of units, and unit values will fluctuate depending on the
Account’s performance. The investment objective of the Account is to seek favorable long-term returns primarily through rental income and capital appreciation from real estate and real estate-related investments owned by the Account. The Account holds real estate properties directly and through subsidiaries wholly owned by TIAA for
the benefit of the Account. The Account also holds interests in real estate joint ventures and limited partnerships in which the Account does not hold a controlling interest; as such, such interests are not consolidated into these consolidated financial statements. The Account also has invested in mortgage loans
receivable collateralized by commercial real estate properties. Additionally, the Account invests in real estate-related and non-real estate-related publicly-traded securities, cash and other instruments to maintain adequate liquidity levels for operating expenses, capital expenditures and to fund benefit payments
(withdrawals, transfers and related transactions). The consolidated financial statements were prepared in accordance with accounting principles generally accepted in the United States of America (“GAAP”), which requires the use of estimates made by management. Actual results may vary from those estimates and such differences may be material. The following
is a summary of the significant accounting policies of the Account. Basis of Presentation: The accompanying consolidated financial statements include the Account and those subsidiaries wholly owned by TIAA for the benefit of the Account. All significant intercompany accounts and transactions between the Account and such subsidiaries have been eliminated. The Accumulation Unit Value (“AUV”) used for financial reporting purposes may differ from the AUV used for processing transactions. The AUV used for financial reporting purposes includes security and participant transactions effective through the period end date to which this report relates. The amount disclosed in the consolidated statements
of assets and liabilities and consolidated statements of investments for the cost of real estate joint ventures and limited partnerships
as of December 31, 2013 has been revised by $41.2 million. This revision was not considered material to the previously issued
financial statements and it had no impact to the Account’s net assets, results of operations or cash flows. Determination of Investments at Fair Value: The Account reports all investments at fair value in accordance with the Financial Accounting Standards Board (“FASB”) Accounting Standards Codification (“ASC”) 946, Financial Services—Investment Companies, as the Account is considered an investment company.
Further, in accordance with the adoption of the fair value option allowed under ASC 825, Financial Instruments, and at the election of Account management, mortgage loans payable are reported at fair value. The FASB has defined fair value as the price that would be received to sell an asset or paid to transfer a
liability in an orderly transaction between market participants. The following is a description of the valuation methodologies used to determine the fair value of the Account’s investments and investment related mortgage loans payable. Valuation of Real Estate Properties—Investments in real estate properties are stated at fair value, as determined in accordance with policies and procedures reviewed by the Investment Committee of the Board and in accordance with the responsibilities of the Board as a whole. Accordingly, the Account does not
record depreciation. Determination of fair value involves significant levels of judgment because the actual fair value of real estate can be determined only by negotiation between the parties in a sales transaction. The Account’s primary objective when valuing its real estate investments will be to produce a valuation
that represents a reasonable estimate of the fair value of its investments. Implicit in the Account’s definition of 7
NOTES TO THE CONSOLIDATED FINANCIAL STATEMENTS
fair value are the consummation of a sale as of a specified date and the passing of title from seller to buyer under conditions whereby:
•
Buyer and seller are typically motivated;
•
Both parties are well informed or well advised, and acting in what they consider their best interests;
•
A reasonable time is allowed for exposure in the open market;
•
Payment is made in terms of cash or in terms of financial arrangements comparable thereto; and
•
The price represents the normal consideration for the property sold unaffected by special or creative financing or sales concessions granted by anyone associated with the sale. Property and investment values are affected by, among other things, the availability of capital, occupancy rates, rental rates, and interest and inflation rates. As a result, determining real estate and investment values involves many assumptions. Key inputs and assumptions include rental income and expense
amounts, related rental income and expense growth rates, discount rates and capitalization rates. Valuation techniques include discounted cash flow analysis, prevailing market capitalization rates or multiples applied to earnings from the property, analysis of recent comparable sales transactions, actual sale
negotiations and bona fide purchase offers received from third parties. Amounts ultimately realized from each investment may vary significantly from the fair value presented. Real estate properties owned by the Account are initially valued based on an independent third party appraisal, as reviewed by TIAA’s internal appraisal staff and as applicable the Account’s independent fiduciary at the time of the closing of the purchase, which may result in a potential unrealized gain or loss
reflecting the difference between an investment’s fair value (i.e., exit price) and its cost basis (which is inclusive of transaction costs). Subsequently, each property is appraised each quarter by an independent third party appraiser, reviewed by TIAA’s internal appraisal staff and as applicable the Account’s independent fiduciary. In general, the Account obtains appraisals of its real estate properties spread out throughout the quarter, which is
intended to result in appraisal adjustments, and thus, adjustments to the valuations of its holdings (to the extent such adjustments are made) that happen regularly throughout each quarter and not on one specific day or month in each period. Further, management reserves the right to order an appraisal and/or conduct another valuation outside of the normal quarterly process when facts or circumstances at a specific property change. For example, under certain circumstances a valuation adjustment could be made when the account receives a bona fide
bid for the sale of a property held within the Account or one of the Account’s joint ventures. In addition, adjustments may be made for events or circumstances indicating an impairment of a tenant’s ability to pay amounts due to the Account under a lease (including due to a bankruptcy filing of that tenant).
Alternatively, adjustments may be made to reflect the execution or renewal of a significant lease. Also, adjustments may be made to reflect factors (such as sales values for comparable properties or local employment rate) bearing uniquely on a particular region in which the Account holds properties. TIAA’s
internal appraisal staff oversees the entire appraisal process, in conjunction with the Account’s independent fiduciary (the independent fiduciary is more fully described in the paragraph below). Any differences in the conclusions of TIAA’s internal appraisal staff and the independent appraiser will be reviewed by
the independent fiduciary, which will make a final determination on the matter (which may include ordering a subsequent independent appraisal). The independent fiduciary has been appointed by a special subcommittee of the Investment Committee of the Board to, among other things, oversee the appraisal process. The independent fiduciary must approve all independent appraisers used by the Account. All appraisals are performed in accordance with
Uniform Standards of Professional Appraisal Practices, the real estate appraisal industry standards created by The Appraisal Foundation. Real estate appraisals are estimates of property values based on a professional’s opinion. Appraisals of properties held outside of the U.S. are performed in accordance with
industry standards commonly applied in the applicable jurisdiction. These independent appraisers are always expected to be MAI-designated members of the Appraisal Institute (or its European equivalent, Royal Institute of Chartered Surveyors) and state certified appraisers from national or regional firms with
relevant property 8
type experience and market knowledge. Under the Account’s current procedures, each independent appraisal firm will be rotated off of a particular property at least every three years, although such appraisal firm may perform appraisals of other Account properties subsequent to such rotation. Also, the independent fiduciary can require additional appraisals if factors or events have occurred that could materially change a property’s value (including those identified above) and such change is not reflected in the quarterly valuation review, or otherwise to ensure that the Account is valued appropriately.
The independent fiduciary must also approve any valuation change of real estate-related assets where a property’s value changed by more than 6% from the most recent independent annual appraisal, or if the value of the Account would change by more than 4% within any calendar quarter or more than 2% since
the prior calendar month. When a real estate property is subject to a mortgage, the property is valued independently of the mortgage and the property and mortgage fair values are reported separately (see Valuation of Mortgage Loans Payable below). The independent fiduciary reviews and approves all mortgage
valuation adjustments before such adjustments are recorded by the Account. The Account continues to use the revised value for each real estate property and mortgage loan payable to calculate the Account’s daily net asset value until the next valuation review or appraisal. Valuation of Real Estate Joint Ventures—Real estate joint ventures are stated at the fair value of the Account’s ownership interests of the underlying entities. The Account’s ownership interests are valued based on the fair value of the underlying real estate, any related mortgage loans payable, and other factors, such
as ownership percentage, ownership rights, buy/sell agreements, distribution provisions and capital call obligations. Upon the disposition of all real estate investments by an investee entity, the Account will continue to state its equity in the remaining net assets of the investee entity during the wind down period, if
any, which occurs prior to the dissolution of the investee entity. Valuation of Real Estate Limited Partnerships—Limited partnership interests are stated at the fair value of the Account’s ownership in the partnership which are recorded based upon the changes in the net asset values of the limited partnerships as determined from the financial statements of the limited partnerships
when received by the Account. Prior to the receipt of the financial statements from the limited partnerships, the Account estimates the value of its interest in good faith and will from time to time seek input from the issuer or the sponsor of the investments. Since market quotations are not readily available, the
limited partnership interests are valued at fair value as determined in good faith by management under the direction of the Investment Committee of the Board and in accordance with the responsibilities of the Board as a whole. Valuation of Marketable Securities—Equity securities listed or traded on any national market or exchange are valued at the last sale price as of the close of the principal securities market or exchange on which such securities are traded or, if there is no sale, at the mean of the last bid and asked prices on such market
or exchange, exclusive of transaction costs. Debt securities, other than money market instruments, are generally valued at the most recent bid price or the equivalent quoted yield for such securities (or those of comparable maturity, quality and type). Short-term investments with maturities of 60 days or less (excluding money market instruments) are valued at amortized cost. Short-term investments with maturities in excess of 60 days (excluding money market instruments) are valued in the same manner as debt securities, as described above. Money market instruments are valued at amortized cost. Equity and fixed income securities traded on a foreign exchange or in foreign markets are valued using their closing values under the valuation methods generally accepted in the country where traded, as of the valuation date. This value is converted to U.S. dollars at the exchange rate in effect on the valuation day.
Under certain circumstances (for example, if there are significant movements in the United States markets and there is an expectation the securities traded on foreign markets will adjust based on such movements when the foreign markets open the next day), the Account may adjust the value of equity or fixed
income securities that trade on a foreign exchange or market after the foreign exchange or market has closed. Valuation of Mortgage Loans Payable—Mortgage loans payable are stated at fair value. The estimated fair values of mortgage loans payable are based on the amount at which the liability could be transferred to a third party exclusive of transaction costs. Mortgage loans payable are valued internally by TIAA’s
internal valuation department, as reviewed by the Account’s independent fiduciary, at least quarterly based on 9
market factors, such as market interest rates and spreads for comparable loans, the performance of the underlying collateral (such as the loan-to-value ratio and the cash flow of the underlying collateral), the liquidity for mortgage loans of similar characteristics, the maturity date of the loan, and the return demands
of the market. See Note 5—Assets and Liabilities Measured at Fair Value on a Recurring Basis for further discussion and disclosure regarding the determination of the fair value of the Account’s investments. Foreign Currency Transactions and Translation: Portfolio investments and other assets and liabilities denominated in foreign currencies are translated into U.S. dollars at the exchange rates prevailing at the end of the period. Purchases and sales of securities, income receipts and expense payments made in foreign
currencies are translated into U.S. dollars at the exchange rates prevailing on the respective dates of the transactions. The effect of any changes in foreign currency exchange rates on portfolio investments and mortgage loans payable are included in net realized and unrealized gains and losses on real estate
properties and mortgage loans payable. Net realized gains and losses on foreign currency transactions include disposition of foreign currencies, and currency gains and losses between the accrual and receipt dates of portfolio investment income and between the trade and settlement dates of portfolio investment
transactions. Accumulation and Annuity Funds: The accumulation fund represents the net assets attributable to participants in the accumulation phase of their investment (“Accumulation Fund”). The annuity fund represents the net assets attributable to the participants currently receiving annuity payments (“Annuity Fund”).
The net increase or decrease in net assets from investment operations is apportioned between the accounts based upon their relative daily net asset values. Once an Account participant begins receiving lifetime annuity income benefits, payment levels cannot be reduced as a result of the Account’s actual mortality
experience. In addition, the contracts pursuant to which the Account is offered are required to stipulate the maximum expense charge for all Account level expenses that can be assessed, which is not to exceed 2.5% of average net assets per year. The Account pays a fee to TIAA to assume mortality and expense
risks. Accounting for Investments: The investments held by the Account are accounted for as follows: Real Estate Properties—Rent from real estate properties consists of all amounts earned under tenant operating leases, including base rent, recoveries of real estate taxes and other expenses and charges for miscellaneous services provided to tenants. Rental income is recognized in accordance with the billing terms of
the lease agreements. The Account bears the direct expenses of the real estate properties owned. These expenses include, but are not limited to, fees to local property management companies, property taxes, utilities, maintenance, repairs, insurance, and other operating and administrative costs. An estimate of the
net operating income earned from each real estate property is accrued by the Account on a daily basis and such estimates are adjusted when actual operating results are determined. Real Estate Joint Ventures—The Account has limited ownership interests in various real estate joint ventures (collectively, the “joint ventures”). The Account records its contributions as increases to its investments in the joint ventures, and distributions from the joint ventures are treated as income within income from
real estate joint ventures and limited partnerships in the Account’s consolidated statements of operations. Distributions that are identified as returns of capital are recorded as a reduction to the cost basis of the investment, whereas distributions identified as capital gains or losses are recorded as realized gains or
losses. Income from the joint ventures is recorded based on the Account’s proportional interest of the income distributed by the joint ventures. Income earned but not yet distributed to the Account by the joint ventures is recorded as unrealized gains and losses. Limited Partnerships—The Account has limited ownership interests in various private real estate funds (primarily limited partnerships) and a private real estate investment trust (collectively, the “limited partnerships”). The Account records its contributions as increases to the investments, and distributions from the
investments are treated as income within income from real estate joint ventures and limited partnerships in the Account’s consolidated statements of operations. Distributions that are identified as returns of capital are recorded as a reduction to the cost basis of the investment, whereas distributions identified as
capital gains or losses are recorded as realized gains or losses. Unrealized gains and losses are recorded based upon the changes in the net asset values of the limited partnerships as determined from the financial statements of the limited partnerships when received by the Account. Prior to the receipt of the financial
statements from the limited partnerships, the Account estimates the value of its interest in good faith and will from time to 10
time seek input from the issuer or the sponsor of the investments. Changes in value based on such estimates are recorded by the Account as unrealized gains and losses. Marketable Securities—Transactions in marketable securities are accounted for as of the date the securities are purchased or sold (trade date). Interest income is recorded as earned. Dividend income is recorded on the ex-dividend date within dividend income. Dividends that are identified as returns of capital are
recorded as a reduction to the cost basis of the investment, whereas dividends identified as capital gains or losses are recorded as realized gains or losses. Realized gains and losses on securities transactions are accounted for on the specific identification method. Realized and Unrealized Gains and Losses—Realized gains and losses are recorded at the time an investment is sold or a distribution is received in relation to an investment sale from a joint venture or limited partnership. Real estate transactions are accounted for as of the date on which the purchase or sale
transactions for the real estate properties close (settlement date). The Account recognizes a realized gain on the sale of a real estate property to the extent that the contract sales price exceeds the cost-to-date of the property being sold. A realized loss occurs when the cost-to-date exceeds the sales price. Unrealized gains and losses are recorded as the fair values of the Account’s investments are adjusted, and as discussed within the Real Estate Joint Ventures and Limited Partnerships sections above. Net Assets—The Account’s net assets as of the close of each valuation day are valued by taking the sum of:
•
the value of the Account’s cash; cash equivalents, and short-term and other debt instruments;
•
the value of the Account’s other securities and other non-real estate assets;
•
the value of the individual real properties (based on the most recent valuation of that property) and other real estate-related investments owned by the Account;
•
an estimate of the net operating income accrued by the Account from its properties, other real estate-related investments and non-real estate-related investments (including short-term marketable securities) since the end of the prior valuation day; and
•
actual net operating income earned from the Account’s properties, other real estate-related investments and non-real estate-related investments (but only to the extent any such item of income differs from the estimated income accrued on such investments), and then reducing the sum by liabilities held within the Account, including the daily investment management fee, administration and distribution fees, mortality and expense fee, and liquidity guarantee fee, and certain other expenses attributable to operating the Account. Daily estimates of net operating income are
adjusted to reflect actual net operating income on a monthly basis, at which time such adjustments (if any) are reflected in the Account’s unit value. After the end of every quarter, the Account reconciles the amount of expenses deducted from the Account (which is established in order to approximate the costs that the Account will incur) with the expenses the Account actually incurred. If there is a difference, the Account adds it to or deducts it from the
Account in equal daily installments over the remaining days of the following quarter. Material differences may be repaid in the current calendar quarter. The Account’s at-cost deductions are based on projections of Account assets and overall expenses, and the size of any adjusting payments will be directly affected
by the difference between management’s projections and the Account’s actual assets or expenses. Cash and Cash Equivalents: Cash and cash equivalents are balances held by the Account in bank deposit accounts which, at times, exceed federally insured limits. The Account’s management monitors these balances to mitigate the exposure of risk due to concentration and has not experienced any losses from such
concentration. Other Assets and Other Liabilities: Other assets and other liabilities are comprised of operating assets and liabilities utilized and held at each individual real estate property investment. Other assets consist of, amongst other items, cash, tenant receivables and prepaid expenses; whereas other liabilities consist of,
among other items, security deposits. Federal Income Taxes: Based on provisions of the Internal Revenue Code, Section 817, the Account is taxed as a segregated asset account of TIAA and as such, the Account incurs no material federal income tax 11
attributable to the net investment activity of the Account. The Account’s federal income tax return is generally subject to examination for a period of three years after filing. State and local tax returns may be subject to examination for an additional period of time depending on the jurisdiction. Management has
analyzed the Account’s tax positions taken for all open federal income tax years and has concluded that no provision for federal income tax is required in the Account’s consolidated financial statements. Restricted Cash: The Account held $29.8 million and $46.0 million as of June 30, 2014 and December 31, 2013, respectively, in escrow accounts for property taxes, insurance, and various other property related matters as required by certain creditors related to outstanding mortgage loans payable collateralized by
certain real estate investments. These amounts are recorded within other assets on the consolidated statements of assets and liabilities. See Note 6—Mortgage Loans Payable for additional information regarding the Account’s outstanding mortgage loans payable. Changes in Net Assets: Premiums include premiums paid by existing accumulation unit holders in the Account and transfers into the Account. Withdrawals and death benefits include withdrawals out of the Account which include transfers out of the Account and required minimum distributions. Due to/from Investment Manager: Due to/from investment manager represents amounts that are to be paid or received by TIAA on behalf of the Account. Amounts generally are paid or received by the Account within one or two business days and no interest is contractually charged on these amounts. New Accounting Pronouncement: In June 2013, the FASB issued Accounting Standards Update 2013-08 Financial Services—Investment Companies (Topic 946)—Amendments to the Scope, Measurement, and Disclosure Requirements (the “ASU”) which amends the criteria for an entity to qualify as an investment
company and introduces new disclosure requirements that apply to all investment companies. Effective January 1, 2014, the Account adopted the ASU. The adoption of the ASU did not have an impact on the Account’s consolidated financial statements. Note 2—Management Agreements and Arrangements Investment advisory services for the Account are provided by TIAA employees, under the direction of the Board and its Investment Committee, pursuant to investment management procedures adopted by TIAA for the Account. TIAA’s investment management decisions for the Account are subject to review by
the Account’s independent fiduciary. TIAA also provides various portfolio accounting and related services for the Account. The Account is a party to the Distribution Agreement for the Contracts Funded by the TIAA Real Estate Account (the “Distribution Agreement”), dated January 1, 2008, by and among TIAA, for itself and on behalf of the Account, and TIAA-CREF Individual and Institutional Services, LLC (“Services”), a
wholly owned subsidiary of TIAA, a registered broker-dealer and a member of the Financial Industry Regulatory Authority. Pursuant to the Distribution Agreement, Services performs distribution services for the Account which include, among other things, (i) distribution of annuity contracts issued by TIAA and
funded by the Account, (ii) advising existing annuity contract owners in connection with their accumulations and (iii) helping employers implement and manage retirement plans. In addition, TIAA performs administrative functions for the Account, which include, among other things, (i) maintaining accounting
records and performing accounting services, (ii) receiving and allocating premiums, (iii) calculating and making annuity payments, (iv) processing withdrawal requests, (v) providing regulatory compliance and reporting services, (vi) maintaining the Account’s records of contract ownership and (vii) otherwise
assisting generally in all aspects of the Account’s operations. Both distribution services (pursuant to the Distribution Agreement) and administrative services are provided to the Account by Services and TIAA, as applicable, on a cost basis. The Distribution Agreement is terminable by either party upon sixty days written notice and terminates automatically upon any assignment thereof. TIAA and Services provide investment management, administrative and distribution services at cost. TIAA and Services receive payments from the Account on a daily basis according to formulas established each year and adjusted periodically with the objective of keeping the payments as close as possible to the
Account’s expenses actually incurred. Any differences between actual expenses and the amounts paid by the Account are adjusted quarterly. 12
TIAA also provides a liquidity guarantee to the Account, for a fee, to ensure that sufficient funds are available to meet participant transfer and cash withdrawal requests in the event that the Account’s cash flows and liquid investments are insufficient to fund such requests. TIAA ensures sufficient funds are
available for such transfer and withdrawal requests by purchasing accumulation units of the Account. See Note 3—Related Party Transactions below. To the extent TIAA owns accumulation units issued pursuant to the liquidity guarantee, the independent fiduciary monitors and oversees, among other things, TIAA’s ownership interest in the Account and may require TIAA to eventually redeem some of its units, particularly when the Account has non-invested
cash or liquid investments available. TIAA also receives a fee for assuming certain mortality and expense risks. The expenses for the services noted above that are provided to the Account by TIAA and Services are identified in the accompanying consolidated statements of operations and are reflected in Note 7–Financial Highlights. Note 3—Related Party Transactions Pursuant to its existing liquidity guarantee obligation, the TIAA General Account purchased in multiple transactions an aggregate of 4.7 million accumulation units (which are generally referred to as “liquidity units”) in the Account between December 2008 and June 2009 for an aggregate amount of $1.2 billion.
TIAA has not purchased additional liquidity units since June 2009. In accordance with this liquidity guarantee obligation, TIAA guarantees that all participants in the Account may redeem their accumulation units at their accumulation unit value next determined after their transfer or cash withdrawal request is received in good order. Liquidity units owned by TIAA are valued in
the same manner as accumulation units owned by the Account’s participants. Management believes that TIAA has the ability to meet its obligations under the liquidity guarantee. As discussed in the Account’s prospectus and in accordance with a prohibited transaction exemption from the U.S. Department of Labor (PTE 96-76), the Account’s independent fiduciary has certain responsibilities with respect to the Account that it has undertaken or is currently undertaking with respect to
TIAA’s purchase of liquidity units, including among other things, reviewing the purchase and redemption of liquidity units by TIAA to ensure the Account uses the correct unit values. In addition, as set forth in PTE 96-76, the independent fiduciary’s responsibilities include:
•
establishing the percentage of total accumulation units that TIAA’s ownership should not exceed (the “trigger point”) and creating a method for changing the trigger point;
•
approving any adjustment of TIAA’s ownership interest in the Account and, in its discretion, requiring an adjustment if TIAA’s ownership of liquidity units reaches the trigger point; and
•
once the trigger point has been reached, participating in any program to reduce TIAA’s ownership in the Account by utilizing cash flow or liquid investments in the Account, or by utilizing the proceeds from asset sales. The independent fiduciary’s role in participating in any such asset sales program
would include (i) participating in the selection of properties for sale, (ii) providing sales guidelines and (iii) approving those sales if, in the independent fiduciary’s opinion, such sales are desirable to reduce TIAA’s ownership of liquidity units. As of March 31, 2013, the independent fiduciary had completed the systematic redemption of all of the liquidity units held by TIAA. Approximately one-quarter of such units were redeemed evenly over the business days in each of the months of June, September and December 2012, and March 2013, representing
a total of $940.3 million and $325.4 million redeemed during 2012 and 2013, respectively. As discussed in Note 2—Management Agreements and Arrangements, TIAA and Services provide certain services to the Account on an at cost basis. Note 4—Credit Risk Concentrations Concentrations of credit risk may arise when a number of properties or tenants are located in a similar geographic region such that the economic conditions of that region could impact tenants’ obligations to meet their contractual obligations or cause the values of individual properties to decline. The Account has
no 13
significant concentrations of tenants as no single tenant has annual contract rent that makes up more than 2.6% of the rental income of the Account. The substantial majority of the Account’s wholly owned real estate investments and investments in joint ventures are located in the United States. The following table represents the diversification of the Account’s portfolio by region and property type: Diversification by Fair Value(1)
East
West
South
Foreign(2)
Midwest
Total Office
19.2
%
16.1
%
6.5
%
—
0.3
%
42.1
% Apartment
10.7
%
8.7
%
4.5
%
—
—
23.9
% Retail
3.8
%
3.9
%
7.7
%
1.7
%
0.2
%
17.3
% Industrial
1.3
%
6.8
%
3.7
%
—
0.9
%
12.7
% Other(3)
3.0
%
0.2
%
0.7
%
—
0.1
%
4.0
% Total
38.0
%
35.7
%
23.1
%
1.7
%
1.5
%
100.0
%
(1)
Wholly owned properties are represented at fair value and gross of any debt, while joint venture properties are represented at net equity value.
(2)
Represents real estate investment in France.
(3)
Represents interest in Storage Portfolio investment, a fee interest encumbered by a ground lease real estate investment and a land development.
Properties in the “East” region are located in: CT, DC, DE, KY, MA, MD, ME, NC, NH, NJ, NY, PA, RI, SC, VA, VT, WV
Properties in the “West” region are located in: AK, AZ, CA, CO, HI, ID, MT, NM, NV, OR, UT, WA, WY
Properties in the “South” region are located in: AL, AR, FL, GA, LA, MS, OK, TN, TX
Properties in the “Midwest” region are located in: IA, IL, IN, KS, MI, MN, MO, ND, NE, OH, SD, WI Note 5—Assets and Liabilities Measured at Fair Value on a Recurring Basis Valuation Hierarchy: The Account’s fair value measurements are grouped categorically into three levels, as defined by the FASB. The levels are defined as follows: Level 1—Valuations using unadjusted quoted prices for assets traded in active markets, such as stocks listed on the New York Stock Exchange. Active markets are defined as having the following characteristics for the measured asset or liability: (i) many transactions, (ii) current prices, (iii) price quotes not varying
substantially among market makers, (iv) narrow bid/ask spreads and (v) most information regarding the issuer is publicly available. Level 1 assets held by the Account are generally marketable equity securities. Level 2—Valuations for assets and liabilities traded in less active, dealer or broker markets. Fair values are primarily obtained from third party pricing services for identical or comparable assets or liabilities. Level 2 inputs for fair value measurements are inputs, other than quoted prices included within Level 1, that
are observable for the asset or liability, either directly or indirectly. Level 2 inputs include: a. Quoted prices for similar assets or liabilities in active markets; b. Quoted prices for identical or similar assets or liabilities in markets that are not active (that is, markets in which there are few transactions for the asset (or liability), the prices are not current, price quotations vary substantially either over time or among market makers (for example, some brokered
markets), or in which little information is released publicly); c. Inputs other than quoted prices that are observable within the market for the asset (or liability) (for example, interest rates and yield curves, implied volatilities, and credit spreads that are observable at commonly quoted intervals); and d. Inputs that are derived principally from or corroborated by observable market data by correlation or other means (for example, market-corroborated inputs). 14
Examples of assets and liabilities which may be held by the Account and included in Level 2 include certificates of deposit, commercial paper, government agency notes, variable notes, United States Treasury securities, and debt securities. Level 3—Valuations for assets and liabilities that are derived from other valuation methodologies, including pricing models, discounted cash flow models and similar techniques, and are not based on market exchange, dealer, or broker-traded transactions. Level 3 valuations incorporate certain assumptions and
projections that are not observable in the market, and require significant professional judgment in determining the fair value assigned to such assets or liabilities. Examples of Level 3 assets and liabilities which may be held by the Account from time to time include investments in real estate, investments in joint
ventures and limited partnerships, and mortgage loans receivable and payable. An investment’s categorization within the valuation hierarchy described above is based upon the lowest level of input that is significant to the fair value measurement. The Account’s determination of fair value is based upon quoted market prices, where available. If listed prices or quotes are not available, fair value is based upon vendor-provided, evaluated prices or internally-developed models that primarily use market-based or independently-sourced market data, including
interest rate yield curves, market spreads, and currency rates. Valuation adjustments will be made to reflect changes in credit quality, counterparty creditworthiness, the Account’s creditworthiness, liquidity, and other observable and unobservable inputs that are applied consistently over time. The methods described above are considered to produce fair values that represent a good faith estimate of what an unaffiliated buyer in the marketplace would pay to purchase the asset or would receive to transfer the liability. Since fair value calculations involve significant professional judgment in the application
of both observable and unobservable attributes, actual realizable values or future fair values may differ from amounts reported. Furthermore, while the Account believes its valuation methods are appropriate and consistent with other market participants, the use of different methodologies or assumptions to
determine the fair value of certain financial instruments, while reasonable, could result in different estimates of fair value at the reporting date. As discussed in Note 1—Organization and Significant Accounting Policies in more detail, the Account generally obtains independent third party appraisals on a quarterly
basis; there may be circumstances in the interim in which the true realizable value of a property is not reflected in the Account’s daily net asset value calculation or in the Account’s periodic consolidated financial statements. This disparity may be more apparent when the commercial and/or residential real estate
markets experience an overall and possibly dramatic decline (or increase) in property values in a relatively short period of time between appraisals. The following tables show the major categories of assets and liabilities measured at fair value on a recurring basis as of June 30, 2014 (unaudited) and December 31, 2013, using unadjusted quoted prices in active markets for identical assets (Level 1); significant other observable inputs (Level 2); and significant
unobservable inputs (Level 3) (in millions): Description
Level 1:
Level 2:
Level 3:
Total at Real estate properties
$
—
$
—
$
13,040.8
$
13,040.8 Real estate joint ventures
—
—
2,660.8
2,660.8 Limited partnerships
—
—
366.6
366.6 Marketable securities: Real estate related
1,681.8
—
—
1,681.8 Government agency notes
—
1,999.5
—
1,999.5 United States Treasury securities
—
743.5
—
743.5 Total Investments at June 30, 2014
$
1,681.8
$
2,743.0
$
16,068.2
$
20,493.0 Mortgage loans payable
$
—
$
—
$
(2,191.8
)
$
(2,191.8
) 15
Quoted
Prices in
Active Markets
for Identical Assets
Significant
Other
Observable
Inputs
Significant
Unobservable
Inputs
June 30,
2014
Description
Level 1:
Level 2:
Level 3:
Total at Real estate properties
$
—
$
—
$
11,565.1
$
11,565.1 Real estate joint ventures
—
—
2,563.6
2,563.6 Limited partnerships
—
—
362.0
362.0 Marketable securities: Real estate related
1,499.3
—
—
1,499.3 Government agency notes
—
1,989.1
—
1,989.1 United States Treasury securities
—
1,130.5
—
1,130.5 Total Investments at December 31, 2013
$
1,499.3
$
3,119.6
$
14,490.7
$
19,109.6 Mortgage loans payable
$
—
$
—
$
(2,279.1
)
$
(2,279.1
) The following tables show the reconciliation of the beginning and ending balances for assets and liabilities measured at fair value on a recurring basis using significant unobservable inputs (Level 3) during the three and six months ended June 30, 2014 and June 30, 2013 (in millions, unaudited):
Real Estate
Real Estate
Limited
Total
Mortgage For the three months ended June 30, 2014 Beginning balance April 1, 2014
$
11,723.5
$
2,578.1
$
362.7
$
14,664.3
$
(2,168.0
) Total realized and unrealized gains (losses) included in changes in net assets
290.1
82.3
6.4
378.8
(24.4
) Purchases(1)
1,047.1
1.8
—
1,048.9
— Sales
(19.9
)
—
—
(19.9
)
— Settlements(2)
—
(1.4
)
(2.5
)
(3.9
)
0.6 Ending balance June 30, 2014
$
13,040.8
$
2,660.8
$
366.6
$
16,068.2
$
(2,191.8
)
Real Estate
Real Estate
Limited
Total
Mortgage For the six months ended June 30, 2014 Beginning balance January 1, 2014
$
11,565.1
$
2,563.6
$
362.0
$
14,490.7
$
(2,279.1
) Total realized and unrealized gains (losses) included in changes in net assets
395.5
142.3
9.9
547.7
(26.6
) Purchases(1)
1,125.6
37.1
—
1,162.7
— Sales
(45.4
)
—
—
(45.4
)
— Settlements(2)
—
(82.2
)
(5.3
)
(87.5
)
113.9 Ending balance June 30, 2014
$
13,040.8
$
2,660.8
$
366.6
$
16,068.2
$
(2,191.8
)
Real Estate
Real Estate
Limited
Total
Mortgage For the three months ended June 30, 2013 Beginning balance April 1, 2013
$
10,429.9
$
2,290.4
$
341.6
$
13,061.9
$
(2,092.3
) Total realized and unrealized gains included in changes in net assets
220.6
74.8
9.8
305.2
26.9 Purchases(1)
333.7
0.1
—
333.8
(730.0
) Sales
(185.3
)
—
—
(185.3
)
— Settlements(2)
—
(21.6
)
(3.2
)
(24.8
)
540.6 Ending balance June 30, 2013
$
10,798.9
$
2,343.7
$
348.2
$
13,490.8
$
(2,254.8
) 16
Quoted
Prices in
Active Markets
for Identical Assets
Significant
Other
Observable
Inputs
Significant
Unobservable
Inputs
December 31,
2013
Properties
Joint Ventures
Partnerships
Level 3
Investments
Loans
Payable
Properties
Joint Ventures
Partnerships
Level 3
Investments
Loans
Payable
Properties
Joint Ventures
Partnerships
Level 3
Investments
Loans
Payable
Real Estate
Real Estate
Limited
Total
Mortgage For the six months ended June 30, 2013 Beginning balance January 1, 2013
$
10,554.6
$
2,291.5
$
339.8
$
13,185.9
$
(2,282.6
) Total realized and unrealized gains included in changes in net assets
262.4
109.0
14.6
386.0
24.0 Purchases(1)
393.7
0.2
1.4
395.3
(730.0
) Sales
(411.8
)
—
—
(411.8
)
— Settlements(2)
—
(57.0
)
(7.6
)
(64.6
)
733.8 Ending balance June 30, 2013
$
10,798.9
$
2,343.7
$
348.2
$
13,490.8
$
(2,254.8
)
(1)
Includes purchases, contributions for joint ventures and limited partnerships, and capital expenditures.
(2)
Includes operating income for real estate joint ventures and limited partnerships, net of distributions and principal payments on mortgage loans payable. The following table shows quantitative information about unobservable inputs related to the Level 3 fair value measurements as of June 30, 2014 (unaudited).
Type
Asset
Valuation
Unobservable
Range
Real Estate Properties
and Joint Ventures
Office
Income Approach—Discounted Cash Flow
Discount Rate
6.0% - 8.8% (6.9%)
Income Approach—Direct Capitalization
Overall Capitalization Rate
4.5% - 7.5% (5.3%)
Industrial
Income Approach—Discounted Cash Flow
Discount Rate
6.5% - 10.0% (7.3%)
Income Approach—Direct Capitalization
Overall Capitalization Rate
4.8% - 8.3% (5.6%)
Residential
Income Approach—Discounted Cash Flow
Discount Rate
5.8% - 8.0% (6.7%)
Income Approach—Direct Capitalization
Overall Capitalization Rate
3.5% - 5.8% (4.4%)
Retail
Income Approach—Discounted Cash Flow
Discount Rate
6.0% - 13.0% (7.5%)
Income Approach—Direct Capitalization
Overall Capitalization Rate
4.3% - 12.3% (5.5%)
Mortgage Loans Payable
Office and
Discounted Cash Flow
Loan to Value Ratio
36.5% - 45.5% (42.0%)
Net Present Value
Loan to Value Ratio
36.5% - 45.5% (42.0%)
Residential
Discounted Cash Flow
Loan to Value Ratio
34.1% - 64.0% (47.0%)
Net Present Value
Loan to Value Ratio
34.1% - 64.0% (47.0%)
Retail
Discounted Cash Flow
Loan to Value Ratio
25.0% - 127.5% (56.5%)
Net Present Value
Loan to Value Ratio
25.0% - 127.5% (56.5%) Real Estate Properties and Joint Ventures: The significant unobservable inputs used in the fair value measurement of the Account’s real estate property and joint venture investments are the selection of certain investment rates (Discount Rate, Terminal Capitalization Rate, and Overall Capitalization Rate).
Significant increases or decreases in any of those inputs in isolation would result in significantly lower or higher fair value measurements, respectively. Mortgage Loans Payable: The significant unobservable inputs used in the fair value measurement of the Account’s mortgage loans payable are the loan to value ratios and the selection of certain credit spreads and weighted average cost of capital risk premiums. Significant increases (decreases) in any of those
inputs in isolation would result in a significantly lower (higher) fair value, respectively. 17
Properties
Joint Ventures
Partnerships
Level 3
Investments
Loans
Payable
Class
Technique(s)
Inputs
(Weighted
Average)
Terminal Capitalization Rate
5.0% - 7.8% (5.9%)
Terminal Capitalization Rate
5.3% - 8.0% (6.2%)
Terminal Capitalization Rate
4.3% - 6.3% (5.0%)
Terminal Capitalization Rate
5.0% - 12.8% (6.2%)
Industrial
Equivalency Rate
3.0% - 4.2% (3.9%)
Weighted Average Cost of Capital Risk Premium Multiple
1.2% - 1.3% (1.2%)
Equivalency Rate
2.3% - 4.1% (3.5%)
Weighted Average Cost of Capital Risk Premium Multiple
1.2% - 1.4% (1.3%)
Equivalency Rate
2.1% - 6.4% (3.8%)
Weighted Average Cost of Capital Risk Premium Multiple
1.1% - 3.0% (1.5%)
During the six months ended June 30, 2014 and 2013, there were no transfers between Levels 1, 2 or 3. The amount of total net unrealized gains (losses) included in changes in net assets attributable to the change in net unrealized gains (losses) relating to Level 3 investments and mortgage loans payable using significant unobservable inputs still held as of the reporting date is as follows (in millions, unaudited):
Real Estate
Real Estate
Limited
Total
Mortgage For the three months ended
$
290.7
$
82.3
$
10.9
$
383.9
$
(24.4
) For the six months ended
$
398.4
$
142.2
$
14.3
$
554.9
$
(26.6
) For the three months ended
$
222.0
$
77.4
$
9.0
$
308.4
$
26.9 For the six months ended
$
282.9
$
112.6
$
13.7
$
409.2
$
8.0 18
Properties
Joint
Ventures
Partnerships
Level 3
Investments
Loans
Payable
June 30, 2014
June 30, 2014
June 30, 2013
June 30, 2013
Note 6—Mortgage Loans Payable The Account had outstanding mortgage loans payable secured by the following properties (in millions):
Property
Interest Rate and
Principal
Maturity
June 30,
December 31,
(Unaudited) Wilshire Rodeo Plaza(4)(5)
5.28% paid monthly
$
—
$
112.7
April 11, 2014 1401 H Street NW(1)(5)
5.97% paid monthly
108.5
109.3
December 7, 2014 99 High Street
5.52% paid monthly
185.0
185.0
November 11, 2015 Lincoln Centre
5.51% paid monthly
153.0
153.0
February 1, 2016 Charleston Plaza(1)(5)
5.60% paid monthly
35.8
36.2
September 11, 2016 The Legend at Kierland(5)(6)
4.97% paid monthly
21.8
21.8
August 1, 2017 The Tradition at Kierland(5)(6)
4.97% paid monthly
25.8
25.8
August 1, 2017 Mass Court(5)
2.88% paid monthly
92.6
92.6
September 1, 2019 Red Canyon at Palomino Park(5)(7)
5.34% paid monthly
27.1
27.1
August 1, 2020 Green River at Palomino Park(5)(7)
5.34% paid monthly
33.2
33.2
August 1, 2020 Blue Ridge at Palomino Park(5)(7)
5.34% paid monthly
33.4
33.4
August 1, 2020 Ashford Meadows(5)
5.17% paid monthly
44.6
44.6
August 1, 2020 The Corner(5)
4.66% paid monthly
105.0
105.0
June 1, 2021 The Palatine(5)
4.25% paid monthly
80.0
80.0
January 10, 2022 The Forum at Carlsbad(5)
4.25% paid monthly
90.0
90.0
March 1, 2022 The Colorado(5)
3.69% paid monthly
91.7
91.7
November 1, 2022 The Legacy at Westwood(5)
3.69% paid monthly
46.7
46.7
November 1, 2022 Regents Court(5)
3.69% paid monthly
39.6
39.6
November 1, 2022 The Caruth(5)
3.69% paid monthly
45.0
45.0
November 1, 2022 Fourth & Madison(5)
3.75% paid monthly
200.0
200.0
June 1, 2023 1001 Pennsylvania Avenue
3.70% paid monthly
330.0
330.0
June 1, 2023 50 Fremont Street(5)
3.75% paid monthly
200.0
200.0
June 1, 2023 780 Third Avenue(5)
3.55% paid monthly
150.0
150.0
August 1, 2025 780 Third Avenue(5)
3.55% paid monthly
20.0
20.0
August 1, 2025 Publix at Weston Commons(5)
5.08% paid monthly
35.0
35.0
January 1, 2036 Total Principal Outstanding
$
2,193.8
$
2,307.7 Fair Value Adjustment(3)
(2.0
)
(28.6
) Total mortgage loans payable
$
2,191.8
$
2,279.1
(1)
The mortgage is adjusted monthly for principal payments.
(2)
Interest rates are fixed, unless stated otherwise.
(3)
The fair value adjustment consists of the difference (positive or negative) between the principal amount of the outstanding debt and the fair value of the outstanding debt. See Note 1- Organization and Significant Accounting Policies.
(4)
Represents a mortgage loan that was paid off before maturity in the first quarter of 2014.
(5)
These properties are each owned by separate wholly owned subsidiaries of TIAA for benefit of the Account. The assets and credit of each of these borrowing entities are not available to satisfy the debts and other obligations of the Account or any other entity or person other than such borrowing entity.
(6)
Represents mortgage loans on these individual properties, which are held within the Kierland Apartment Portfolio.
(7)
Represents mortgage loans on these individual properties, which are held within Palomino Park. 19
Payment Frequency(2)
Amounts as of
2014
2013
Note 7—Financial Highlights Selected condensed financial information for an Accumulation Unit of the Account is presented below. Per Accumulation Unit data is calculated on average units outstanding.
For the Six
Years Ended December 31,
2013
2012
2011
(Unaudited) Per Accumulation Unit data: Rental income
$
7.800
$
15.313
$
16.345
$
17.224 Real estate property level expenses and taxes
3.855
8.112
9.059
8.640 Real estate income, net
3.945
7.201
7.286
8.584 Other income
1.697
2.759
2.178
2.143 Total income
5.642
9.960
9.464
10.727 Expense charges(1)
1.442
2.672
2.562
2.390 Investment income, net
4.200
7.288
6.902
8.337 Net realized and unrealized gain on investments and mortgage loans payable
12.931
19.015
18.013
20.144 Net increase in Accumulation Unit Value
17.131
26.303
24.915
28.481 Accumulation Unit Value: Beginning of period
298.872
272.569
247.654
219.173 End of period
$
316.003
$
298.872
$
272.569
$
247.654 Total return
5.73%
9.65%
10.06%
12.99% Ratios to Average net Assets:(2) Expenses(1)
0.46%
0.92%
0.95%
0.98% Investment income, net
1.34%
2.50%
2.55%
3.42% Portfolio turnover rate:(2) Real estate properties(3)
0.90%
2.10%
10.22%
3.01% Marketable securities(4)
10.37%
8.36%
21.92%
3.43% Accumulation Units outstanding at end of period (in millions):
56.8
55.3
53.3
53.4 Net assets end of period (in millions)
$
18,337.5
$
16,907.9
$
14,861.1
$
13,527.2
(1)
Expense charges per Accumulation Unit and the Ratio of Expenses to average net assets reflect the year to date Account-level expenses and exclude real estate property level expenses which are included in real estate income, net.
(2)
Amounts for the six month period ended June 30, 2014 are not annualized.
(3)
Real estate investment portfolio turnover rate is calculated by dividing the lesser of purchases or sales of real estate property investments (including contributions to, or return of capital distributions received from, existing joint venture and limited partnership investments) by the average value of the portfolio of real estate investments held during the period.
(4)
Marketable securities portfolio turnover rate is calculated by dividing the lesser of purchases or sales of securities, excluding securities having maturity dates at acquisition of one year or less, by the average value of the portfolio securities held during the period. 20
Months Ended
June 30,
2014
Note 8—Accumulation Units Changes in the number of Accumulation Units outstanding were as follows (in millions):
For the
For the Year Ended
(Unaudited) Outstanding: Beginning of period
55.3
53.3 Credited for premiums
3.5
7.9 Liquidity units redeemed—Note 3
—
(1.2
) Annuity, other periodic payments, withdrawals and death benefits
(2.0
)
(4.7
) End of period
56.8
55.3 Note 9—Commitments and Contingencies Commitments—The Account had $0.2 million and $0.5 million of outstanding immediately callable commitments to purchase additional interests in its limited partnership investments as of June 30, 2014 and December 31, 2013, respectively. Contingencies—The Account is party to various claims and routine litigation arising in the ordinary course of business. Management of the Account does not believe the results of any such claims or litigation, individually, or in the aggregate, will have a material effect on the Account’s business, financial position, or
results of operations. 21
Six Months
Ended
June 30, 2014
December 31, 2013
REAL ESTATE PROPERTIES—63.6% and 60.5%
Location/Description
Type
Fair Value
2014
2013
(Unaudited) Arizona: Camelback Center
Office
$
40.5
$
38.6 Kierland Apartment Portfolio
Apartments
118.7
(1)
119.0
(1) California: 3 Hutton Centre Drive
Office
41.8
41.3 50 Fremont Street
Office
545.6
(1)
518.0
(1) 55 Second Street
Office
269.0
— 88 Kearny Street
Office
118.3
111.8 200 Middlefield Road
Office
50.2
— 275 Battery Street
Office
270.4
251.4 Centre Pointe and Valley View
Industrial
34.6
31.9 Cerritos Industrial Park
Industrial
89.5
86.4 Charleston Plaza
Retail
82.0
(1)
82.0
(1) Great West Industrial Portfolio
Industrial
123.7
119.0 Holly Street Village
Apartments
126.9
124.0 Larkspur Courts
Apartments
121.4
96.4 Northern CA RA Industrial Portfolio
Industrial
48.3
47.3 Northpark Village Square
Retail
43.2
40.8 Oceano at Warner Center
Apartments
83.7
87.3 Ontario Industrial Portfolio
Industrial
338.0
329.2 Pacific Plaza
Office
84.7
82.0 Rancho Cucamonga Industrial Portfolio
Industrial
132.7
124.4 Regents Court
Apartments
78.6
(1)
78.5
(1) Southern CA RA Industrial Portfolio
Industrial
89.6
88.6 Stella
Apartments
170.3
168.5 The Forum at Carlsbad
Retail
198.0
(1)
192.9
(1) The Legacy at Westwood
Apartments
129.4
(1)
126.0
(1) Township Apartments
Apartments
83.0
— West Lake North Business Park
Office
47.5
48.7 Westcreek
Apartments
38.0
36.8 Westwood Marketplace
Retail
110.4
108.0 Wilshire Rodeo Plaza
Office
193.4
181.1
(1) Colorado: Palomino Park
Apartments
269.7
(1)
264.3
(1) South Denver Marketplace
Retail
70.2
69.9 Connecticut: Ten & Twenty Westport Road
Office
141.2
150.0 Florida: 701 Brickell Avenue
Office
298.1
271.3 North 40 Office Complex
Office
35.0
27.8 Plantation Grove
Retail
—
12.5 Publix at Weston Commons
Retail
57.0
(1)
55.0
(1) Seneca Industrial Park
Industrial
75.9
73.8 South Florida Apartment Portfolio
Apartments
79.7
77.9 Suncrest Village Shopping Center
Retail
—
13.5 The Residences at the Village of Merrick Park
Apartments
67.7
63.8 Urban Centre
Office
105.7
107.6 Weston Business Center
Industrial
86.4
85.5 22
TIAA REAL ESTATE ACCOUNT
Location/Description
Type
Fair Value
2014
2013
(Unaudited) France: Printemps de L’Homme
Retail
$
275.2
$
226.9 Georgia: Atlanta Industrial Portfolio
Industrial
42.5
42.5 Glenridge Walk
Apartments
50.0
40.1 Shawnee Ridge Industrial Portfolio
Industrial
65.4
61.4 Windsor at Lenox Park
Apartments
75.3
64.9 Illinois: Chicago Caleast Industrial Portfolio
Industrial
66.0
62.7 Chicago Industrial Portfolio
Industrial
73.4
66.7 Parkview Plaza
Office
44.4
45.6 Maryland: Landover Logistics Center
Industrial
35.0
— The Shops at Wisconsin Place
Retail
105.9
99.1 Massachusetts: 99 High Street
Office
462.1
(1)
438.0
(1) 501 Boylston Street
Office
384.0
364.1 Northeast RA Industrial Portfolio
Industrial
31.0
29.6 Residence at Rivers Edge
Apartments
87.2
87.6 New Jersey: Konica Photo Imaging Headquarters
Industrial
—
20.4 Marketfair
Retail
91.4
84.7 Mohawk Distribution Center
Industrial
78.0
78.0 South River Road Industrial
Industrial
55.0
54.7 New York: 425 Park Avenue
Ground Lease
420.0
400.0 780 Third Avenue
Office
380.5
(1)
365.2
(1) The Colorado
Apartments
199.0
(1)
190.3
(1) The Corner
Apartments
240.0
(1)
230.0
(1) Pennsylvania: 1619 Walnut Street
Retail
19.2
19.0 The Pepper Building
Apartments
49.1
51.1 Tennessee: Southside at McEwen
Retail
44.3
— Summit Distribution Center
Industrial
16.9
17.0 Texas: Cliffs at Barton Creek
Apartments
42.3
39.1 Dallas Industrial Portfolio
Industrial
179.4
176.9 Four Oaks Place
Land
92.7
64.3 Houston Apartment Portfolio
Apartments
264.1
263.2 Lincoln Centre
Office
280.5
(1)
267.7
(1) Northwest Houston Industrial Portfolio
Industrial
65.2
— Park 10 Distribution
Industrial
13.4
— Pinnacle Industrial Portfolio
Industrial
43.6
44.1 The Caruth
Apartments
81.6
(1)
81.3
(1) The Maroneal
Apartments
50.9
51.7 23
CONSOLIDATED STATEMENTS OF INVESTMENTS
June 30, 2014 and December 31, 2013
(Dollar values shown in millions)
TIAA REAL ESTATE ACCOUNT
Location/Description
Type
Fair Value
2014
2013
(Unaudited) Virginia: 8270 Greensboro Drive
Office
$
44.3
$
41.8 Ashford Meadows Apartments
Apartments
105.4
(1)
105.6
(1) The Ellipse at Ballston
Office
87.3
85.3 The Palatine
Apartments
125.0
(1)
130.0
(1) Plaza America
Retail
98.4
— Washington: Circa Green Lake
Apartments
85.0
85.0 Fourth and Madison
Office
440.1
(1)
435.0
(1) Millennium Corporate Park
Office
162.5
149.0 Northwest RA Industrial Portfolio
Industrial
26.6
27.1 Pacific Corporate Park
Industrial
36.5
35.8 Prescott Wallingford Apartments
Apartments
53.9
53.6 Rainier Corporate Park
Industrial
87.5
86.5 Regal Logistics Campus
Industrial
68.7
73.4 Washington DC: 1001 Pennsylvania Avenue
Office
772.6
(1)
726.7
(1) 1401 H Street, NW
Office
227.0
(1)
231.8
(1) 1900 K Street, NW
Office
291.7
287.3 Mass Court
Apartments
170.1
(1)
170.3
(1) Mazza Gallerie
Retail
85.5
80.2 The Louis at 14th
Apartments
182.0
— The Woodley
Apartments
198.2
— TOTAL REAL ESTATE PROPERTIES
$
13,040.8
$
11,565.1 24
CONSOLIDATED STATEMENTS OF INVESTMENTS
June 30, 2014 and December 31, 2013
(Dollar values shown in millions)
(Cost $11,750.9 and $10,679.5)
TIAA REAL ESTATE ACCOUNT OTHER REAL ESTATE-RELATED INVESTMENTS—14.8% and 15.3%
Location/Description
Type
Fair Value
2014
2013
(Unaudited) California: CA—Colorado Center LP
Office
$
270.3
(2)
$
261.3
(2) Valencia Town Center Associates LP
Retail
110.0
(2)
113.5
(2) Florida: Florida Mall Associates, Ltd
Retail
529.4
(2)
490.9
(2) TREA Florida Retail, LLC
Retail
135.4
119.3 West Dade County Associates
Retail
117.5
(2)
196.4 Maryland: WP Project Developer
Retail
16.3
13.9 Massachusetts: MA—One Boston Place REIT
Office
223.7
208.3 New York: 401 West 14th Street, LLC
Retail
34.9
(2)
— RGM 42, LLC
Apartments
317.6
(2)
290.4
(2) Tennessee: West Town Mall, LLC
Retail
84.6
(2)
77.8
(2) Texas: Four Oaks Venture LP
Office
297.6
275.9 Various: DDR TC LLC
Retail
414.1
(2,3)
413.7
(2,3) Storage Portfolio I, LLC
Storage
108.8
(2,3)
101.6
(2,3) Strategic Ind Portfolio I, LLC
Industrial
0.6
(3,5)
0.6
(3,5) TOTAL REAL ESTATE JOINT VENTURES
$
2,660.8
$
2,563.6 25
CONSOLIDATED STATEMENTS OF INVESTMENTS
June 30, 2014 and December 31, 2013
(Dollar values shown in millions)
REAL ESTATE JOINT VENTURES—13.0% and 13.4%
Colorado Center (50% Account Interest)
Valencia Town Center (50% Account Interest)(6)
The Florida Mall (50% Account Interest)
Florida Retail Portfolio (80% Account Interest)
Miami International Mall (50% Account Interest)
The Shops at Wisconsin Place (33.33% Account Interest)
One Boston Place (50.25% Account Interest)
401 West 14th Street (42.2% Account Interest)
MiMA (70% Account Interest)
West Town Mall (50% Account Interest)
Four Oaks Place LP (51% Account Interest)
DDR Joint Venture (85% Account Interest)
Storage Portfolio (75% Account Interest)
IDI Nationwide Industrial Portfolio (60% Account Interest)
(Cost $2,178.0 and $2,208.5)
TIAA REAL ESTATE ACCOUNT
Location/Description
Fair Value
2014
2013
(Unaudited) LIMITED PARTNERSHIPS—1.8% and 1.9% Cobalt Industrial REIT (10.998% Account Interest)
$
26.0
$
24.8 Colony Realty Partners LP (5.27% Account Interest)
20.8
20.7 Heitman Value Partners Fund (8.43% Account Interest)
0.3
0.4 Lion Gables Apartment Fund (18.46% Account Interest)
296.7
288.4 Transwestern Mezz Realty Partners III, LLC (11.708% Account Interest)
22.8
27.7 TOTAL LIMITED PARTNERSHIPS
$
366.6
$
362.0 TOTAL REAL ESTATE JOINT VENTURES AND LIMITED PARTNERSHIPS (Cost $2,425.7 and $2,465.9)
$
3,027.4
$
2,925.6 26
CONSOLIDATED STATEMENTS OF INVESTMENTS
June 30, 2014 and December 31, 2013
(Dollar values shown in millions)
(Cost $247.7 and $257.4)
TIAA REAL ESTATE ACCOUNT MARKETABLE SECURITIES—21.6% and 24.2%
Shares Issuer
Fair Value
2014
2013
2014
2013
(Unaudited)
128,562
134,862 Acadia Realty Trust
$
3.6
$
3.3
31,670
33,840 Agree Realty Corporation
1.0
1.0
4,549
5,049 Alexander’s, Inc.
1.7
1.7
158,767
174,957 Alexandria Real Estate Equities, Inc.
12.2
11.1
78,213
86,953 American Assets Trust, Inc.
2.6
2.7
232,629
256,019 American Campus Communities, Inc.
8.9
8.2
295,690
114,990 American Homes 4 Rent
5.2
1.9
351,550
— American Realty Capital Healthcare Trust, Inc.
3.8
—
2,016,867
451,330 American Realty Capital Properties, Inc.
25.3
5.8
40,280
45,810 American Residential Properties
0.8
0.8
882,879
969,299 American Tower Corp.
79.4
77.5
324,603
355,553 Apartment Investment and Management Company
10.5
9.2
45,930
47,530 Armada Hoffler Properties Inc.
0.4
0.4
40,976
31,236 Ashford Hospitality Prime Inc.
0.7
0.6
150,323
156,183 Ashford Hospitality Trust, Inc.
1.7
1.3
131,435
143,225 Associated Estates Realty Corporation
2.4
2.3
287,380
316,410 Avalonbay Communities, Inc.
40.9
37.4
65,870
25,510 Aviv REIT, Inc.
1.9
0.6
427,097
470,857 BioMed Realty Trust, Inc.
9.3
8.5
337,165
370,695 Boston Properties, Inc.
39.8
37.2
348,099
386,249 Brandywine Realty Trust
5.4
5.4
—
187,688 BRE Properties, Inc.
—
10.3
92,700
101,190 Brixmore Property Group Inc
2.1
2.1
188,626
207,546 Camden Property Trust
13.4
11.8
146,878
161,828 Campus Crest Communities, Inc.
1.3
1.5
26,250
— Catchmark Timber Trust, Inc.
0.4
—
380,047
415,687 CBL & Associates Properties, Inc.
7.2
7.5
177,495
183,285 Cedar Shopping Centers, Inc.
1.1
1.1
533,610
578,960 Chambers Street Properties
4.3
4.4
60,127
57,737 Chatham Lodging Trust
1.3
1.2
111,642
123,712 Chesapeake Lodging Trust
3.4
3.1
—
1,146,830 Cole Real Estate Investments
—
16.1
277,710
270,050 Columbia Property Trust Inc
7.2
6.8
263,028
289,848 CommonWealth REIT
6.9
6.8
48,680
— Corenergy Infrastructure Trust, Inc.
0.4
—
48,733
52,653 CoreSite Realty Corporation
1.6
1.7
182,623
201,393 Corporate Office Properties Trust
5.1
4.8
247,990
271,810 Corrections Corporation of America
8.1
8.7
410,496
435,676 Cousins Properties Incorporated
5.1
4.5
743,210
— Crown Castle International Corporation
55.2
—
323,210
336,620 Cubesmart
5.9
5.4
41,620
44,330 CyrusOne Inc
1.0
1.0
718,710
773,940 DCT Industrial Trust, Inc.
5.9
5.5
679,738
748,278 DDR Corp
12.0
11.5
440,687
479,587 DiamondRock Hospitality Company
5.6
5.5
301,192
313,752 Digital Realty Trust, Inc.
17.6
15.4
295,214
326,594 Douglas Emmett, Inc.
8.3
7.6
732,456
795,686 Duke Realty Corporation
13.3
12.0
147,966
161,116 DuPont Fabros Technology, Inc.
4.0
4.0 27
CONSOLIDATED STATEMENTS OF INVESTMENTS
June 30, 2014 and December 31, 2013
(Dollar values shown in millions)
REAL ESTATE-RELATED MARKETABLE SECURITIES—8.2% and 7.9%
TIAA REAL ESTATE ACCOUNT
Shares Issuer
Fair Value
2014
2013
2014
2013
(Unaudited)
69,759
74,049 EastGroup Properties, Inc.
$
4.5
$
4.3
258,191
281,251 Education Realty Trust, Inc.
2.8
2.5
173,880
184,140 Empire State Realty Trust
2.9
2.8
117,462
124,602 EPR Properties
6.6
6.1
169,956
183,486 Equity Lifestyle Properties, Inc.
7.5
6.6
133,196
143,936 Equity One, Inc.
3.1
3.2
792,134
871,504 Equity Residential
49.9
45.2
138,117
92,809 Essex Property Trust, Inc.
25.5
13.3
101,275
111,535 Excel Trust, Inc.
1.3
1.3
242,082
280,022 Extra Space Storage, Inc.
12.9
11.8
148,236
160,436 Federal Realty Investment Trust
17.9
16.3
284,615
300,775 FelCor Lodging Trust Incorporated
3.0
2.5
248,203
273,923 First Industrial Realty Trust, Inc.
4.7
4.8
133,251
144,421 First Potomac Realty Trust
1.7
1.7
198,119
217,299 Franklin Street Properties Corp.
2.5
2.6
169,790
— Gaming and Leisure Properties, Inc.
5.8
—
1,122,269
1,270,239 General Growth Properties, Inc.
26.4
25.5
156,310
169,050 The GEO Group, Inc.
5.6
5.4
60,598
63,548 Getty Realty Corp.
1.2
1.2
34,020
34,020 Gladstone Commercial Corporation
0.6
0.6
326,692
360,422 Glimcher Realty Trust
3.5
3.4
119,857
136,327 Government Properties Income Trust
3.0
3.4
244,620
127,720 Gramercy Property Trust Inc
1.5
0.7
1,018,859
1,107,319 HCP, Inc.
42.2
40.2
683,099
695,326 Health Care REIT, Inc.
42.8
37.2
211,892
237,712 Healthcare Realty Trust Incorporated
5.4
5.1
527,820
579,520 Healthcare Trust of America
6.4
5.7
386,553
426,743 Hersha Hospitality Trust
2.6
2.4
199,899
219,889 Highwoods Properties, Inc.
8.4
8.0
126,710
140,210 Home Properties, Inc.
8.1
7.5
332,850
366,850 Hospitality Properties Trust
10.1
9.9
1,680,484
1,822,914 Host Hotels & Resorts, Inc.
37.0
35.4
123,652
106,312 Hudson Pacific Properties, Inc.
3.1
2.3
190,919
216,059 Inland Real Estate Corporation
2.0
2.3
241,151
256,491 Investors Real Estate Trust
2.2
2.2
1,500,000
1,500,000 iShares Dow Jones US Real Estate Index Fund
107.7
94.6
183,003
201,093 Kilroy Realty Corporation
11.4
10.1
901,023
993,333 Kimco Realty Corporation
20.7
19.6
292,773
321,483 Kite Realty Group Trust
1.8
2.1
231,852
254,432 LaSalle Hotel Properties
8.2
7.9
508,105
543,895 Lexington Realty Trust
5.6
5.6
328,620
355,290 Liberty Property Trust
12.5
12.0
78,226
84,816 LTC Properties, Inc.
3.1
3.0
198,023
217,063 Mack-Cali Realty Corporation
4.3
4.7
385,417
395,297 Medical Properties Trust, Inc.
5.1
4.8
165,185
181,705 Mid-America Apartment Communities, Inc.
12.1
11.0
103,597
102,977 Monmouth Real Estate Investment Corporation
1.0
0.9
65,594
72,294 National Health Investors, Inc.
4.1
4.1
274,270
296,600 National Retail Properties, Inc.
10.2
9.0
365,630
— New York REIT, Inc.
4.0
—
281,073
299,263 Omega Healthcare Investors, Inc.
10.4
8.9 28
CONSOLIDATED STATEMENTS OF INVESTMENTS
June 30, 2014 and December 31, 2013
(Dollar values shown in millions)
TIAA REAL ESTATE ACCOUNT
Shares Issuer
Fair Value
2014
2013
2014
2013
(Unaudited)
28,607
31,357 One Liberty Properties, Inc.
$
0.6
$
0.6
158,389
133,229 Parkway Properties, Inc.
3.3
2.6
144,657
153,837 Pebblebrook Hotel Trust
5.3
4.7
147,065
162,035 Pennsylvania Real Estate Investment Trust
2.8
3.1
69,250
47,950 Physicians Realty Trust
1.0
0.6
348,612
409,892 Piedmont Office Realty Trust, Inc.
6.6
6.8
393,917
432,157 Plum Creek Timber Company, Inc.
17.8
20.1
119,803
133,253 Post Properties, Inc.
6.4
6.0
84,078
92,248 Potlatch Corporation
3.5
3.9
1,108,021
1,218,251 ProLogis
45.5
45.0
44,040
49,510 PS Business Parks, Inc.
3.7
3.8
317,399
349,519 Public Storage, Inc.
54.4
52.6
152,400
150,090 Ramco-Gershenson Properties Trust
2.5
2.4
93,630
— Rayonier Advanced Materials, Inc.
3.6
—
280,889
308,209 Rayonier, Inc.
10.0
13.0
492,094
500,294 Realty Income Corporation
21.9
18.7
202,908
224,748 Regency Centers Corporation
11.3
10.4
197,186
178,566 Retail Opportunity Investment
3.1
2.6
520,915
468,255 Retail Properties of America
8.0
6.0
35,710
39,760 Rexford Industrial Realty Inc
0.5
0.5
294,194
300,884 RLJ Lodging Trust
8.5
7.3
83,313
53,113 Rouse Properties, Inc.
1.4
1.2
108,370
117,520 Ryman Hospitality Properties
5.2
4.9
104,343
91,983 Sabra Health Care REIT Inc
3.0
2.4
28,976
32,736 Saul Centers, Inc.
1.4
1.6
83,490
68,430 Select Income Real Estate Investment Trust
2.5
1.8
451,667
460,237 Senior Housing Properties Trust
11.0
10.2
82,090
93,740 Silver Bay Realty Trust Corp
1.3
1.5
691,096
750,616 Simon Property Group, Inc.
114.9
114.2
211,325
232,245 SL Green Realty Corp.
23.1
21.5
72,309
78,699 Sovran Self Storage, Inc.
5.6
5.1
855,541
868,341 Spirit Realty Capital Inc.
9.7
8.5
121,490
104,960 Stag Industrial, Inc.
2.9
2.1
89,340
— Starwood Waypoint Residential Trust
2.3
—
545,779
417,139 Strategic Hotels & Resorts, Inc.
6.4
3.9
186,578
199,598 Summit Hotel Properties, Inc.
2.0
1.8
87,386
85,816 Sun Communities, Inc.
4.4
3.7
406,906
447,056 Sunstone Hotel Investors, L.L.C.
6.1
6.0
212,284
228,624 Tanger Factory Outlet Centers, Inc.
7.4
7.3
142,439
155,209 Taubman Centers, Inc.
10.8
9.9
70,574
59,134 Terreno Realty Corporation
1.4
1.0
312,472
343,852 The Macerich Company
20.9
20.2
556,651
612,561 UDR, Inc.
15.9
14.3
31,724
31,724 UMH Properties, Inc.
0.3
0.3
29,158
31,798 Universal Health Realty Income Trust
1.3
1.3
51,473
58,833 Urstadt Biddle Properties, Inc.
1.1
1.1
654,468
719,138 Ventas, Inc.
42.0
41.2
372,533
409,723 Vornado Realty Trust
39.8
36.4
349,878
— Washington Prime Group, Inc.
6.6
—
148,507
164,207 Washington Real Estate Investment Trust
3.9
3.8
241,550
266,400 Weingarten Realty Investors
7.9
7.3 29
CONSOLIDATED STATEMENTS OF INVESTMENTS
June 30, 2014 and December 31, 2013
(Dollar values shown in millions)
TIAA REAL ESTATE ACCOUNT
Shares Issuer
Fair Value
2014
2013
2014
2013
(Unaudited)
1,295,128
1,423,998 Weyerhaeuser Company
$
42.9
$
45.0
50,900
45,930 Whitestone Real Estate Investment Trust B
0.8
0.6
75,457
80,257 Winthrop Realty Trust
1.2
0.9
186,930
141,520 WP Carey Inc.
12.0
8.7 TOTAL REAL ESTATE-RELATED MARKETABLE SECURITIES
$
1,681.8
$
1,499.3 30
CONSOLIDATED STATEMENTS OF INVESTMENTS
June 30, 2014 and December 31, 2013
(Dollar values shown in millions)
(Cost $1,386.1 and $1,384.3)
TIAA REAL ESTATE ACCOUNT OTHER MARKETABLE SECURITIES—13.4% and 16.3%
Principal Issuer
Yield(4)
Maturity
Fair Value
2014
2013
2014
2013
(Unaudited)
$
—
$
21.0 Fannie Mae Discount Notes
0.041%-0.046%
1/15/2014
$
—
$
21.0
—
3.5 Fannie Mae Discount Notes
0.112%
1/21/2014
—
3.5
—
7.0 Fannie Mae Discount Notes
0.035%-0.051%
1/22/2014
—
7.0
—
28.2 Fannie Mae Discount Notes
0.041%
1/29/2014
—
28.2
—
32.1 Fannie Mae Discount Notes
0.071%
2/3/2014
—
32.1
—
30.0 Fannie Mae Discount Notes
0.061%-0.066%
2/5/2014
—
30.0
—
50.0 Fannie Mae Discount Notes
0.077%
2/19/2014
—
50.0
—
31.0 Fannie Mae Discount Notes
0.061%
2/24/2014
—
31.0
—
22.0 Fannie Mae Discount Notes
0.086%
2/26/2014
—
22.0
—
31.0 Fannie Mae Discount Notes
0.066%
3/3/2014
—
31.0
—
14.0 Fannie Mae Discount Notes
0.066%
4/2/2014
—
13.9
—
18.0 Fannie Mae Discount Notes
0.091%-0.101%
4/23/2014
—
18.0
—
23.0 Fannie Mae Discount Notes
0.107%
5/1/2014
—
23.0
—
25.0 Fannie Mae Discount Notes
0.107%
5/7/2014
—
25.0
—
32.7 Fannie Mae Discount Notes
0.127%
6/4/2014
—
32.7
—
20.3 Fannie Mae Discount Notes
0.127%
6/11/2014
—
20.3
—
38.0 Fannie Mae Discount Notes
0.132%
6/18/2014
—
38.0
24.3
— Fannie Mae Discount Notes
0.122%
7/2/2014
24.3
—
22.8
— Fannie Mae Discount Notes
0.041%-0.096%
7/14/2014
22.8
—
20.4
— Fannie Mae Discount Notes
0.091%
7/30/2014
20.4
—
53.5
— Fannie Mae Discount Notes
0.086%-0.096%
8/20/2014
53.5
—
28.1
— Fannie Mae Discount Notes
0.089%
8/25/2014
28.1
—
35.0
— Fannie Mae Discount Notes
0.091%
8/26/2014
35.0
—
16.7
— Fannie Mae Discount Notes
0.086%
8/27/2014
16.7
—
6.1
— Fannie Mae Discount Notes
0.117%
9/2/2014
6.1
—
21.7
— Fannie Mae Discount Notes
0.068%
9/3/2014
21.7
—
50.0
— Fannie Mae Discount Notes
0.056%
9/8/2014
50.0
—
50.0
— Fannie Mae Discount Notes
0.056%
9/9/2014
50.0
—
23.0
— Fannie Mae Discount Notes
0.068%
9/10/2014
23.0
—
12.0
— Fannie Mae Discount Notes
0.056%
9/12/2014
12.0
—
50.0
— Fannie Mae Discount Notes
0.073%
9/15/2014
50.0
—
49.9
— Fannie Mae Discount Notes
0.083%-0.122%
9/24/2014
49.9
—
32.0
— Fannie Mae Discount Notes
0.081%-0.101%
10/1/2014
32.0
—
56.0
— Fannie Mae Discount Notes
0.071%
10/8/2014
56.0
—
26.5
— Fannie Mae Discount Notes
0.061%-0.081%
10/15/2014
26.5
—
85.8
— Fannie Mae Discount Notes
0.066%
10/22/2014
85.8
—
22.0
— Fannie Mae Discount Notes
0.112%
10/27/2014
22.0
—
34.0
— Fannie Mae Discount Notes
0.086%
11/3/2014
34.0
—
8.3
— Fannie Mae Discount Notes
0.081%
11/12/2014
8.3
—
24.1
— Fannie Mae Discount Notes
0.117%
11/17/2014
24.1
—
8.9
— Fannie Mae Discount Notes
0.117%
12/1/2014
8.9
—
25.0
— Fannie Mae Discount Notes
0.076%
12/2/2014
25.0
—
17.1
— Fannie Mae Discount Notes
0.091%
12/3/2014
17.1
—
20.8
— Fannie Mae Discount Notes
0.086%
12/10/2014
20.8
—
25.2
— Fannie Mae Discount Notes
0.090%
12/17/2014
25.2
—
—
25.0 Federal Home Loan Bank Discount Notes
0.056%
1/2/2014
—
25.0
—
27.2 Federal Home Loan Bank Discount Notes
0.066%
1/3/2014
—
27.2 31
CONSOLIDATED STATEMENTS OF INVESTMENTS
June 30, 2014 and December 31, 2013
(Dollar values shown in millions)
GOVERNMENT AGENCY NOTES—9.8% and 10.4%
Date
TIAA REAL ESTATE ACCOUNT
Principal Issuer
Yield(4)
Maturity
Fair Value
2014
2013
2014
2013
(Unaudited)
$
—
$
22.0 Federal Home Loan Bank Discount Notes
0.051%
1/8/2014
$
—
$
22.0
—
100.0 Federal Home Loan Bank Discount Notes
0.061%
1/10/2014
—
100.0
—
50.0 Federal Home Loan Bank Discount Notes
0.035%-0.066%
1/17/2014
—
50.0
—
14.0 Federal Home Loan Bank Discount Notes
0.051%
1/24/2014
—
14.0
—
14.1 Federal Home Loan Bank Discount Notes
0.086%-0.096%
2/21/2014
—
14.1
—
14.5 Federal Home Loan Bank Discount Notes
0.071%-0.076%
3/7/2014
—
14.5
—
19.5 Federal Home Loan Bank Discount Notes
0.076%
3/12/2014
—
19.5
—
50.0 Federal Home Loan Bank Discount Notes
0.066%-0.106%
3/21/2014
—
50.0
—
43.2 Federal Home Loan Bank Discount Notes
0.081%
3/26/2014
—
43.2
—
50.0 Federal Home Loan Bank Discount Notes
0.071%
3/28/2014
—
50.0
—
23.8 Federal Home Loan Bank Discount Notes
0.087%
4/2/2014
—
23.8
—
100.0 Federal Home Loan Bank Discount Notes
0.112%
4/9/2014
—
100.0
—
31.0 Federal Home Loan Bank Discount Notes
0.091%
4/16/2014
—
31.0
—
10.3 Federal Home Loan Bank Discount Notes
0.096%
4/23/2014
—
10.2
—
13.8 Federal Home Loan Bank Discount Notes
0.101%
4/25/2014
—
13.8
—
46.0 Federal Home Loan Bank Discount Notes
0.107%-0.122%
5/1/2014
—
46.0
—
25.0 Federal Home Loan Bank Discount Notes
0.101%
5/2/2014
—
25.0
—
5.0 Federal Home Loan Bank Discount Notes
0.112%
5/9/2014
—
5.0
—
16.0 Federal Home Loan Bank Discount Notes
0.112%
5/14/2014
—
16.0
—
20.0 Federal Home Loan Bank Discount Notes
0.122%
5/16/2014
—
20.0
—
55.1 Federal Home Loan Bank Discount Notes
0.122%-0.127%
5/28/2014
—
55.1
—
20.0 Federal Home Loan Bank Discount Notes
0.137%
6/25/2014
—
20.0
43.0
— Federal Home Loan Bank Discount Notes
0.066%
7/2/2014
43.0
—
3.0
3.0 Federal Home Loan Bank Discount Notes
0.122%
7/7/2014
3.0
3.0
14.0
— Federal Home Loan Bank Discount Notes
0.101%
7/9/2014
14.0
—
29.0
— Federal Home Loan Bank Discount Notes
0.093%
7/11/2014
29.0
—
37.0
— Federal Home Loan Bank Discount Notes
0.051%-0.056%
7/16/2014
37.0
—
30.3
— Federal Home Loan Bank Discount Notes
0.046%-0.096%
7/18/2014
30.3
—
22.0
— Federal Home Loan Bank Discount Notes
0.076%-0.096%
7/23/2014
22.0
—
28.3
— Federal Home Loan Bank Discount Notes
0.051%-0.066%
7/25/2014
28.3
—
25.3
— Federal Home Loan Bank Discount Notes
0.063%
7/30/2014
25.3
—
19.2
— Federal Home Loan Bank Discount Notes
0.056%-0.102%
8/1/2014
19.1
—
40.0
— Federal Home Loan Bank Discount Notes
0.059%
8/6/2014
40.0
—
24.5
— Federal Home Loan Bank Discount Notes
0.112%
8/19/2014
24.5
—
34.1
— Federal Home Loan Bank Discount Notes
0.081%
9/5/2014
34.1
—
12.0
— Federal Home Loan Bank Discount Notes
0.091%
9/15/2014
12.0
—
47.4
— Federal Home Loan Bank Discount Notes
0.066%-0.083%
9/19/2014
47.4
—
26.6
— Federal Home Loan Bank Discount Notes
0.086%
9/24/2014
26.6
—
17.1
— Federal Home Loan Bank Discount Notes
0.061%-0.071%
9/26/2014
17.1
—
41.4
— Federal Home Loan Bank Discount Notes
0.076%-0.078%
10/10/2014
41.4
—
33.3
— Federal Home Loan Bank Discount Notes
0.079%
10/24/2014
33.3
—
10.0
— Federal Home Loan Bank Discount Notes
0.096%
11/17/2014
10.0
—
40.5
— Federal Home Loan Bank Discount Notes
0.083%
11/21/2014
40.5
—
20.6
— Federal Home Loan Bank Discount Notes
0.107%
2/23/2015
20.6
—
—
40.0 Freddie Mac Discount Notes
0.061%
1/6/2014
—
40.0
—
25.1 Freddie Mac Discount Notes
0.046%-0.086%
1/13/2014
—
25.1
—
32.9 Freddie Mac Discount Notes
0.046%
1/21/2014
—
32.9
—
51.2 Freddie Mac Discount Notes
0.035%-0.051%
1/22/2014
—
51.2
—
13.2 Freddie Mac Discount Notes
0.147%
1/23/2014
—
13.2
—
26.0 Freddie Mac Discount Notes
0.058%-0.127%
2/4/2014
—
26.0 32
CONSOLIDATED STATEMENTS OF INVESTMENTS
June 30, 2014 and December 31, 2013
(Dollar values shown in millions)
Date
TIAA REAL ESTATE ACCOUNT
Principal Issuer
Yield(4)
Maturity
Fair Value
2014
2013
2014
2013
(Unaudited)
$
—
$
11.3 Freddie Mac Discount Notes
0.086%
2/14/2014
$
—
$
11.3
—
62.8 Freddie Mac Discount Notes
0.061%-0.066%
3/10/2014
—
62.7
—
24.5 Freddie Mac Discount Notes
0.086%
3/11/2014
—
24.4
—
30.0 Freddie Mac Discount Notes
0.081%
3/17/2014
—
30.0
—
33.0 Freddie Mac Discount Notes
0.064%
3/24/2014
—
33.0
—
15.0 Freddie Mac Discount Notes
0.061%
4/4/2014
—
15.0
—
33.0 Freddie Mac Discount Notes
0.091%
4/7/2014
—
33.0
—
30.0 Freddie Mac Discount Notes
0.106%
4/14/2014
—
30.0
—
32.9 Freddie Mac Discount Notes
0.096%-0.101%
4/21/2014
—
32.9
—
42.5 Freddie Mac Discount Notes
0.096%-0.112%
4/24/2014
—
42.5
—
6.0 Freddie Mac Discount Notes
0.101%
4/28/2014
—
6.0
—
12.8 Freddie Mac Discount Notes
0.096%
5/1/2014
—
12.8
—
25.0 Freddie Mac Discount Notes
0.112%
5/2/2014
—
25.0
—
50.7 Freddie Mac Discount Notes
0.091%-0.101%
5/6/2014
—
50.6
—
21.2 Freddie Mac Discount Notes
0.107%
5/12/2014
—
21.1
—
27.3 Freddie Mac Discount Notes
0.101%-0.122%
5/21/2014
—
27.2
—
19.6 Freddie Mac Discount Notes
0.101%
6/4/2014
—
19.6
—
18.5 Freddie Mac Discount Notes
0.101%
6/5/2014
—
18.5
—
6.0 Freddie Mac Discount Notes
0.127%
6/9/2014
—
6.0
—
18.8 Freddie Mac Discount Notes
0.131%
6/16/2014
—
18.7
15.9
15.9 Freddie Mac Discount Notes
0.117%
7/1/2014
15.9
15.9
34.6
— Freddie Mac Discount Notes
0.117%
7/7/2014
34.6
—
7.1
7.1 Freddie Mac Discount Notes
0.132%
7/11/2014
7.1
7.1
13.0
— Freddie Mac Discount Notes
0.112%
7/23/2014
13.0
—
25.0
25.0 Freddie Mac Discount Notes
0.134%
8/1/2014
25.0
25.0
16.8
— Freddie Mac Discount Notes
0.101%
8/5/2014
16.7
—
34.0
— Freddie Mac Discount Notes
0.101%
8/8/2014
34.0
—
1.5
— Freddie Mac Discount Notes
0.117%
8/11/2014
1.5
—
16.4
— Freddie Mac Discount Notes
0.096%-0.112%
8/19/2014
16.4
—
11.0
— Freddie Mac Discount Notes
0.081%-0.086%
9/2/2014
11.0
—
12.3
7.3 Freddie Mac Discount Notes
0.101%-0.132%
9/3/2014
12.3
7.3
25.0
— Freddie Mac Discount Notes
0.086%
9/22/2014
25.0
—
1.0
— Freddie Mac Discount Notes
0.081%
9/29/2014
1.0
—
84.4
— Freddie Mac Discount Notes
0.112%-0.117%
10/6/2014
84.4
—
22.0
— Freddie Mac Discount Notes
0.071%
10/20/2014
22.0
—
53.1
— Freddie Mac Discount Notes
0.132%-0.142%
11/3/2014
53.1
—
17.0
— Freddie Mac Discount Notes
0.076%
11/10/2014
17.0
—
13.0
— Freddie Mac Discount Notes
0.076%
11/12/2014
13.0
—
87.7
— Freddie Mac Discount Notes
0.072%-0.101%
11/14/2014
87.7
—
19.9
— Freddie Mac Discount Notes
0.076%
11/18/2014
19.9
—
11.7
— Freddie Mac Discount Notes
0.076%
11/19/2014
11.7
—
25.0
— Freddie Mac Discount Notes
0.089%
12/8/2014
25.0
—
3.3
— Freddie Mac Discount Notes
0.096%
1/8/2015
3.3
—
1.2
— Freddie Mac Discount Notes
0.096%
2/10/2015
1.2
— TOTAL GOVERNMENT AGENCY NOTES
$
1,999.5
$
1,989.1 33
CONSOLIDATED STATEMENTS OF INVESTMENTS
June 30, 2014 and December 31, 2013
(Dollar values shown in millions)
Date
(Cost $1,999.3 and $1,989.0)
TIAA REAL ESTATE ACCOUNT UNITED STATES TREASURY SECURITIES—3.6% and 5.9%
Principal Issuer
Yield(4)
Maturity
Fair Value
2014
2013
2014
2013
(Unaudited)
$
—
$
17.0 United States Treasury Bills
0.052%
1/2/2014
$
—
$
17.0
—
26.6 United States Treasury Bills
0.031%-0.069%
1/9/2014
—
26.6
—
30.0 United States Treasury Bills
0.046%-0.048%
1/16/2014
—
30.0
—
4.0 United States Treasury Bills
0.035%
1/23/2014
—
4.0
—
30.0 United States Treasury Bills
0.071%
1/30/2014
—
30.0
—
17.0 United States Treasury Bills
0.071%
3/6/2014
—
17.0
—
59.0 United States Treasury Bills
0.054%-0.061%
3/13/2014
—
59.0
—
50.0 United States Treasury Bills
0.030%-0.043%
3/20/2014
—
50.0
—
4.0 United States Treasury Bills
0.068%
4/3/2014
—
4.0
—
50.0 United States Treasury Bills
0.079%-0.089%
6/26/2014
—
50.0
—
206.0 United States Treasury Bills
0.102%-0.108%
7/24/2014
—
205.9
38.8
— United States Treasury Bills
0.056%-0.061%
7/17/2014
38.8
—
49.3
49.3 United States Treasury Bills
0.091%-0.097%
8/21/2014
49.2
49.2
50.0
50.0 United States Treasury Bills
0.093%
9/18/2014
50.0
50.0
19.0
— United States Treasury Bills
0.079%
10/16/2014
18.9
—
34.8
6.4 United States Treasury Bills
0.076%-0.117%
11/13/2014
34.8
6.4
28.2
25.0 United States Treasury Bills
0.085%-0.135%
12/11/2014
28.2
25.0
—
56.4 United States Treasury Notes
0.055%-0.113%
1/31/2014
—
56.4
—
17.7 United States Treasury Notes
0.052%-0.152%
3/31/2014
—
17.7
—
25.0 United States Treasury Notes
0.053%
4/15/2014
—
25.1
—
77.0 United States Treasury Notes
0.097%-0.150%
4/30/2014
—
77.0
—
24.9 United States Treasury Notes
0.082%-0.123%
5/15/2014
—
24.9
—
100.0 United States Treasury Notes
0.076%-0.136%
6/30/2014
—
100.1
10.0
— United States Treasury Notes
0.020%
7/3/2014
10.0
—
100.0
100.0 United States Treasury Notes
0.124%-0.147%
7/15/2014
100.0
100.3
54.8
54.8 United States Treasury Notes
0.121%-0.139%
7/31/2014
54.8
54.8
35.5
— United States Treasury Notes
0.020%-0.041%
8/14/2014
35.5
—
50.0
50.0 United States Treasury Notes
0.152%-0.167%
8/15/2014
50.0
50.1
1.0
— United States Treasury Notes
0.025%
8/28/2014
1.0
—
41.6
— United States Treasury Notes
0.031%
9/4/2014
41.6
—
50.0
— United States Treasury Notes
0.027%
9/25/2014
50.0
—
45.1
— United States Treasury Notes
0.060%-0.064%
9/30/2014
45.1
—
16.4
— United States Treasury Notes
0.046%
10/23/2014
16.4
—
47.0
— United States Treasury Notes
0.104%-0.130%
10/31/2014
47.0
—
32.2
— United States Treasury Notes
0.116%-0.140%
12/15/2014
32.2
—
39.0
— United States Treasury Notes
0.033%
12/18/2014
39.0
—
1.0
— United States Treasury Notes
0.111%
1/15/2015
1.0
— TOTAL UNITED STATES TREASURY SECURITIES
$
743.5
$1,130.5 TOTAL OTHER MARKETABLE SECURITIES
$
2,743.0
$
3,119.6 TOTAL MARKETABLE SECURITIES
$
4,424.8
$
4,618.9 TOTAL INVESTMENTS
$
20,493.0
$
19,109.6 34
CONSOLIDATED STATEMENTS OF INVESTMENTS
June 30, 2014 and December 31, 2013
(Dollar values shown in millions)
Date
(Cost $743.5 and $1,130.3)
(Cost $2,742.8 and $3,119.3)
(Cost $4,128.9 and $4,503.6)
(Cost $18,305.5 and $17,649.0)
TIAA REAL ESTATE ACCOUNT
(1)
The investment has a mortgage loan outstanding, as indicated in Note 6—Mortgage Loans Payable.
(2)
The fair value reflects the Account’s interest in the joint venture and is net of debt.
(3)
Properties within this investment are located throughout the United States.
(4)
Yield represents the annualized yield.
(5)
The market value reflects the final settlement due to the Account. The property investment held within the joint venture was sold during the quarter ended December 31, 2012.
(6)
Increase in ownership percentage of 0.1% due to contract agreement with seller. 35
CONSOLIDATED STATEMENTS OF INVESTMENTS
June 30, 2014 and December 31, 2013
(Dollar values shown in millions)
ITEM 2. MANAGEMENT’S DISCUSSION AND ANALYSIS OF FINANCIAL CONDITION AND RESULTS OF OPERATIONS The following discussion and analysis of the Account’s financial condition and results of operations should be read together with the consolidated financial statements and notes contained in this report and with consideration to the sub-section entitled “Forward-Looking Statements,” which begins below, and the section of
the Account’s Annual Report on Form 10-K for the year ended December 31, 2013 (the “Form 10-K”) entitled “Item 1A. Risk Factors.” The past performance of the Account is not indicative of future results. Forward-Looking Statements Some statements in this Form 10-Q which are not historical facts may be “forward-looking statements” within the meaning of Section 27A of the Securities Act of 1933, Section 21E of the Securities Exchange Act of 1934 and the Private Securities Litigation Reform Act of 1995. Forward-looking statements include
statements about management’s expectations, beliefs, intentions or strategies for the future, include the assumptions and beliefs underlying these forward-looking statements, and are based on current expectations, estimates and projections about the real estate industry, domestic and global economic conditions, including
conditions in the credit and capital markets, the sectors, and markets in which the Account invests and operates, and the transactions described in this Form 10-Q. While management believes the assumptions underlying any of its forward-looking statements and information to be reasonable, such information may be
subject to uncertainties and may involve certain risks which may be difficult to predict and are beyond management’s control. These risks and uncertainties could cause actual results to differ materially from those contained in any forward-looking statement. These risks and uncertainties include, but are not limited to, the
following:
•
Acquiring and Owning Real Estate: The risks associated with acquiring and owning real property, including general economic and real estate market conditions, the availability of, and economic cost associated with, financing the Account’s properties, the risk that the Account’s properties become too
concentrated (whether by geography, sector or tenant mix), competition for acquiring real estate properties, leasing risk (including tenant defaults) and the risk of uninsured losses at properties (including due to terrorism, natural disasters, and acts of violence);
•
Selling Real Estate: The risk that the sales price of a property might differ, perhaps significantly, from its estimated or appraised value, leading to losses or reduced profits to the Account, the risk that the Account might not be able to sell a property at a particular time for a price which management believes
represents its fair or full value, the risk of a lack of availability of financing (for potential purchasers of the Account’s properties), risks associated with disruptions in the credit and capital markets, and the risk that the Account may be required to make significant expenditures before the Account is able to
market and/or sell a property;
•
Valuation: The risks associated with property valuations, including the fact that appraisals can be subjective in a number of respects and the fact that the Account’s appraisals are generally obtained on a quarterly basis and there may be periods in between appraisals of a property during which the value
attributed to the property for purposes of the Account’s daily accumulation unit value may be more or less than the actual realizable value of the property;
•
Borrowing: Risks associated with financing the Account’s properties, including the risk of default on loans secured by the Account’s properties (which could lead to foreclosure), the risk associated with high loan to value ratios on the Account’s properties (including the fact that the Account may have
limited, or no net value in such a property), the risk that significant sums of cash could be required to make principal and interest payments on the loans and the risk that the Account may not have the ability to obtain financing or refinancing on favorable terms (or at all), which may be aggravated by
general disruptions in credit and capital markets;
•
Participant Transactions and Cash Management: Investment risk associated with participant transactions, in particular that (i) significant net participant transfers out of the Account may impair our ability to pursue or consummate new investment opportunities that are otherwise attractive to the Account and/
or may result in sales of real estate-related assets to generate liquidity, (ii) significant net participant transfers into the Account may result, on a temporary basis, in our cash holdings and/or holdings in liquid real estate-related investments exceeding our long-term targeted holding levels 36
and (iii) high levels of cash in the Account during times of appreciating real estate values can impair the Account’s overall return;
•
Joint Venture Investments: The risks associated with joint venture partnerships, including the risk that a co-venturer may have interests or goals inconsistent with that of the Account, that a co-venturer may have financial difficulties, and the risk that the Account may have limited rights with respect to
operation of the property and transfer of the Account’s interest;
•
Regulatory Matters: Uncertainties associated with environmental liability and regulations and other governmental regulatory matters such as zoning laws, rent control laws, and property taxes;
•
Foreign Investments: The risks associated with purchasing, owning and disposing foreign investments (primarily real estate properties), including political risk, the risk associated with currency fluctuations (whether hedged or not), regulatory and taxation risks and risks associated with enforcing judgments;
•
Conflicts of Interest: Conflicts of interest associated with TIAA serving as investment manager of the Account and provider of the liquidity guarantee at the same time as TIAA and its affiliates are serving as an investment manager to other real estate accounts or funds, including conflicts associated with
satisfying its fiduciary duties to all such accounts and funds associated with purchasing, selling and leasing of properties;
•
Required Property Sales: The risk that, if TIAA were to own too large a percentage of the Account’s accumulation units through funding the liquidity guarantee (as determined by the independent fiduciary), the independent fiduciary could require the sales of properties to reduce TIAA’s ownership interest,
which sales could occur at times and at prices that depress the sale proceeds to the Account;
•
Government and Government Agency Securities: Risks associated with investment securities issued by U.S. government agencies and U.S. government-sponsored entities, including the risk that the issuer may not have their securities backed by the full faith and credit of the U.S. government, and that
transaction activity may fluctuate significantly from time to time, which could negatively impact the value of the securities and the Account’s ability to dispose of a security at a favorable time; and
•
Liquid Assets and Securities: Risks associated with investments in real estate-related liquid assets (which could include, from time to time, real estate investment trust (“REIT”) securities and commercial mortgage-backed securities (“CMBS”)), and non-real estate-related liquid assets, including:
•
Financial/credit risk—Risks that the issuer will not be able to pay principal and interest when due or that the issuer’s earnings will fall;
•
Market volatility risk—Risk that the changing conditions in financial markets may cause the Account’s investments to experience price volatility;
•
Interest rate volatility risk—Risk that interest rate volatility may affect the Account’s current income from an investment or the pricing of that investment. As of the date of this Form 10-Q, interest rates in the United States are at or near historic lows, which may increase the Fund’s exposure to risk
associated with rising interest rates; and
•
Deposit/money market risk—Risks that the Account could experience losses if banks fail. More detailed discussions of certain of these risk factors are contained in the section of the Form 10-K entitled “Item 1A. Risk Factors” and in this section below and also in the section below entitled “Quantitative and Qualitative Disclosures About Market Risk,” that could cause actual results to differ materially from
historical experience or management’s present expectations. Caution should be taken not to place undue reliance on management’s forward-looking statements, which represent management’s views only as of the date that this report is filed. Neither management nor the Account undertake any obligation to update publicly or revise any forward-looking statement, whether as a result
of new information, changed assumptions, future events or otherwise. 37
Commercial real estate market statistics discussed in this section are obtained by the Account from sources that management considers reliable, but some of the data are preliminary for the period ended June 30, 2014 and may be subsequently revised. Prior period data may have been adjusted to reflect updated
calculations. Investors should not rely exclusively on the data presented below in forming a judgment regarding the current or prospective performance of the commercial real estate market generally. ABOUT THE TIAA REAL ESTATE ACCOUNT The TIAA Real Estate Account was established in February 1995 as a separate account of TIAA and interests in the Account were first offered to eligible participants on October 2, 1995. The Account offers individual and group accumulating annuity contracts (with contributions made on a pre-tax or after-tax
basis), as well as individual lifetime and term-certain variable payout annuity contracts (including the payment of death benefits to beneficiaries). Investors are entitled to transfer funds to or from the Account under certain circumstances. Funds invested in the Account for each category of contract are expressed in
terms of units, and unit values will fluctuate depending on the Account’s performance. Investment Objective and Strategy The Real Estate Account seeks favorable long-term returns primarily through rental income and appreciation of real estate investments owned by the Account. The Account will also invest in non-real estate-related publicly traded securities and short-term higher quality liquid investments that are easily converted
to cash to enable the Account to meet participant redemption requests, purchase or improve properties, or cover other expense needs. Real Estate-Related Investments. The Account intends to have between 75% and 85% of its net assets invested directly in real estate or real estate-related investments with the goal of producing favorable long-term returns primarily through rental income and appreciation. These investments may consist of:
•
Direct ownership interests in real estate,
•
Direct ownership of real estate through interests in joint ventures,
•
Indirect interests in real estate through real estate-related securities, such as:
•
equity investments in REITs, which investments may consist of common or preferred stock interests,
•
real estate limited partnerships,
•
investments in equity or debt securities of companies whose operations involve real estate (i.e., that primarily own or manage real estate) which may not be REITs, and
•
conventional commercial mortgage loans, participating mortgage loans, secured mezzanine loans and collateralized mortgage obligations, including CMBS and other similar investments. The Account’s principal strategy is to purchase direct ownership interests in income-producing real estate, primarily office, industrial, retail and multi-family residential properties. The Account is targeted to hold between 65% and 80% of the Account’s net assets in such direct ownership interests at any time.
Historically, approximately 70% of the Account’s net assets have been comprised of such direct ownership interests in real estate. In addition, while the Account is authorized to hold up to 25% of its net assets in liquid real estate-related securities, such as REITs and CMBS, management intends that the Account will not hold more than 10% of its net assets in such securities on a long-term basis. Traditionally, less than 10% of the Account’s
net assets have been comprised of interests in these securities, although the Account has recently held approximately 10% of its net assets in equity REIT securities. In addition, under the Account’s current investment guidelines, the Account is authorized to hold up to 10% of its net assets in CMBS. As of June 30,
2014, REIT securities comprised approximately 9.2% of the Account’s net assets, and the Account held no CMBS as of such date. Non-Real Estate-Related Investments. The Account will invest the remaining portion of its assets (targeted to be between 15% and 25% of its net assets) in publicly-traded, liquid investments; namely: 38
•
Short-term government related instruments, including U.S. Treasury bills,
•
Long-term government related instruments, such as securities issued by U.S. government agencies or U.S. government sponsored entities,
•
Short-term non-government related instruments, such as money market instruments and commercial paper,
•
Long-term non-government related instruments, such as corporate debt securities, and
•
Stock of companies that do not primarily own or manage real estate. However, from time to time, the Account’s non-real estate-related liquid investments may comprise less than 15% (and possibly less than 10%) of its assets (on a net basis and/or a gross basis), especially during and immediately following periods of significant net participant outflows, in particular due to significant
participant transfer activity. In addition, the Account, from time to time and on a temporary basis, may hold in excess of 25% of its net assets in non-real estate-related liquid investments, particularly during times of significant inflows into the Account and/or a lack of attractive real estate-related investments
available in the market. Liquid Securities Generally. Primarily due to management’s need to manage fluctuations in cash flows, in particular during and immediately following periods of significant participant net transfer activity into or out of the Account, the Account may, on a temporary basis (i) exceed the upper end of its targeted
holdings (currently 35% of the Account’s net assets) in liquid securities of all types, including both publicly-traded non-real estate-related liquid investments and liquid real estate-related securities, such as REITs and CMBS, or (ii) be below the low end of its targeted holdings in such liquid securities (currently 15%
of the Account’s net assets). The portion of the Account’s net assets invested in liquid investments of all types may exceed the upper end of its target, for example, if (i) the Account receives a large inflow of money in a short period of time, in particular due to significant participant transfer activity into the Account, (ii) the Account receives
significant proceeds from sales or financings of direct real estate assets, (iii) there is a lack of attractive direct real estate investments available on the market, and/or (iv) the Account anticipates more near-term cash needs, including to apply to acquire direct real estate investments, pay expenses or repay
indebtedness. Foreign Investments. The Account from time to time will also make foreign real estate investments. Under the Account’s investment guidelines, investments in direct foreign real estate, together with foreign real estate-related securities and foreign non-real estate-related liquid investments may not comprise more
than 25% of the Account’s net assets. However, through the date of this Form 10-Q, such foreign real estate-related investments have never represented more than 7.5% of the Account’s net assets and management does not intend such foreign investments to exceed 10% of the Account’s net assets. As of June 30,
2014, the Account held one foreign real estate investment in France which represented 1.5% of the Account’s net assets. SECOND QUARTER 2014 U.S. ECONOMIC AND COMMERCIAL REAL ESTATE OVERVIEW The Account invests primarily in high-quality, core commercial real estate in order to meet its investment objective of obtaining favorable long-term returns through rental income and the appreciation of its real estate holdings. Economic and Capital Markets Overview and Outlook Recent trends in key U.S. economic indicators are summarized in the table below. According to the advance estimate by the Bureau of Economic Analysis, U.S. Gross Domestic Product (“GDP”) grew by a healthy 4.0% in the second quarter of 2014 as compared with a decline of 2.1% in the first quarter of 2014.
The strong growth in the second quarter was partly due to the weather-related decline in GDP during the first quarter. With extremely cold weather depressing economic activity in much of the country during the first quarter, consumer and business spending was concentrated in the second quarter, resulting in
exceptionally strong economic activity. Most economists believe the healthy growth of the second quarter will continue through the second half of 2014 though at a more sustainable 3% pace. The acceleration of employment growth and strength of consumer and business spending during the second quarter are two
indicators that are 39
suggestive of ongoing growth. Further evidence of underlying strength in the U.S. economy was provided by growth in exports, residential and non-residential investment, and an increase in government spending. Economic Indicators*
1Q 2013
2Q 2013
3Q 2013
4Q 2013
1Q 2014
2Q 2014
Actual
Forecast
2013
2014
2015 Economy(1) Gross Domestic Product (GDP)
2.7
%
1.8
%
4.5
%
3.5
%
-2.1
%
4.0
%
2.2
%
1.6
%
3.0
% Employment Growth (Thousands)
618
603
515
595
569
816
2,331
2,500
3,300 Unemployment Rate
7.5
%
7.5
%
7.2
%
6.7
%
6.7
%
6.1
%
7.4
%
6.3
%
5.8
% Interest Rates(2) 10 Year Treasury
2.00
%
2.00
%
2.70
%
2.70
%
2.80
%
2.60
%
2.40
%
2.80
%
3.50
% Sources: Blue Chip Economic Indicators, BEA, BLS, Federal Reserve, and Moody’s Analytics
*
Data subject to revision
(1)
GDP growth rates are annual rates. Quaterly unemployment rates are the reported value for the final month of the quarter, while annual rates represented a twelve month average.
(2)
The Treasury rates are an average over the stated time period. The Federal Funds rates are as of the end of the stated time period. The Federal Open Market Committee (“FOMC”) continued its gradual withdrawal of monetary stimulus in the second quarter by reducing its monthly bond purchases by $10 billion per month. While the asset purchase program is on schedule to end in the fall of 2014, the policy statement released following the
FOMC’s June 17-18 meeting reiterated the Federal Reserve funds rate target would remain low for a considerable time after the asset purchase program ended. The FOMC also released a “summary of economic projections” which indicated a lower forecast GDP growth in 2014 due in large part to the weakness of
the first quarter. While GDP growth of 2.1-2.3% was forecast for 2014, growth of 3.0-3.2% is expected in 2015. Despite the recent increase, inflation is expected to remain at or below 2.0% in 2014 and 2015. In its statement, the FOMC was optimistic about prospects for the economy noting the pickup in economic
activity in recent months, the increases in household spending and business investment, and concluded that “there is sufficient underlying strength in the broader economy to support ongoing improvement in labor market conditions.” To date, the withdrawal of fiscal stimulus has had no evident negative impact on
economic growth or interest rates since the measures started in December 2013. Yields on ten year Treasuries started the second quarter at 2.76% but subsequently declined and remained in the range of 2.50% to 2.65% for much of the quarter. With strong growth during the second quarter, economists remain optimistic about prospects for the U.S. economy in the second half of 2014. The consensus Blue Chip forecast is for GDP to grow by just over 3.0% in the third and fourth quarters. However, because of the exceptionally weak growth of the first
quarter, the Blue Chip Consensus forecast is for GDP growth of only 1.6% for 2014 as a whole. Blue Chip economist’s optimistic outlook for the second half of 2014 is predicated on healthy household and business spending, ongoing improvement in labor market conditions, continued gradual improvement in the
housing market, and growing consumer and business confidence. In addition, the negative impacts of government spending cuts and fiscal policy measures have diminished and are likely to contribute modestly to economic growth in the coming quarters. Domestic factors that could potentially slow growth include a
rise in medium and long-term interest rates as investors anticipate stronger economic growth and the absence of fiscal stimulus. However, the majority of economists responding to the Blue Chip survey do not expect the FOMC to raise the federal funds rate until the third or fourth quarter of 2015. Similarly,
respondents do not expect the yield on ten year Treasuries to average 3.5% until 2015 or later. The consensus of economists surveyed as part of the July 10, 2014 Blue Chip Economic Indicators publication expect employment to grow by an average of 213,000 per month in the second half of 2014, up from an April forecast of 195,000 per month. The unemployment rate is expected to decline further over the
remainder of 2014. The consensus forecast is for GDP growth of 3.1% in the third and fourth quarters. Economic growth of this magnitude is in-line with the inherent growth potential of the U.S. economy and would provide sufficient support for additional improvement in commercial real estate market conditions
in the second half of 2014. 40
Real Estate Market Conditions and Outlook Industry sources such as CB Richard Ellis Econometric Advisors calculate vacancy based on square footage. Except where otherwise noted, the Account’s vacancy data is calculated as a percentage of net rentable space leased, weighted by square footage, in keeping with industry standards. Commercial real estate markets and sales activity remained healthy during the second quarter of 2014. Tenant demand for space remained at or above first quarter levels in most markets. Despite an increase in construction, real estate market fundamentals continued to improve modestly across all sectors. Sales of
office, industrial, retail and multi-family properties totaled $80 billion in the second quarter, up 22% from second quarter 2013. Sales volume increased a modest 1.8% compared with first quarter 2014; however, first half sales volume was the strongest since 2007. Green Street Advisors’ Commercial Property Price Index (“CPPI”) increased 2.9% during the second quarter of 2014 compared with a gain of 1.1% in the first quarter of 2014. Property values were boosted by second quarter’s strong economic growth and investor demand given the ongoing improvement in
property market fundamentals. In its July 2014 report, Green Street Advisors noted: “Property appreciation has gained momentum over the past few months and values are now at or above 2007 highs in nearly every major property sector.” The NAREIT All Equity REIT index return was 7.1% during the second quarter of 2014 following a gain of 8.5% in the first quarter of 2014. In its July 1, 2014 Real Estate Securities Monthly, Green Street Advisors concluded that REIT prices are in a “fair value range” based on a comparison of current and
prospective REIT yields and returns with those of fixed income investments like corporate and high-yield bonds as well as private real estate. Commercial property returns increased for the eighteenth consecutive quarter during the second quarter of 2014. For the quarter ending June 30, 2014, preliminary NCREIF Fund Index Open-End Diversified Core Equity (“NFI-OCDE”) returns were 2.93%, consisting of a 1.26% income return and a 1.67% capital
return. By comparison, the total return for first quarter 2014 was 2.52%. The NFI-ODCE is a leveraged fund-level return index including; property investments at ownership share, cash balances, and other investments. Data for the Account’s top five markets in terms of market value as of June 30, 2014 are provided below. These markets represent 52.9% of the Account’s total real estate portfolio. Top 5 Metro Areas by Fair Market Value
Account % Leased
Number of
Metro Area
Metro Area Washington-Arlington-Alexandria, DC-VA-MD-WV
74.9%
14
16.2%
12.4% New York-White Plains-Wayne, NY-NJ
90.5%
8
10.6%
8.1% Los Angeles-Long Beach-Glendale, CA
88.7%
14
9.8%
7.5% San Francisco-San Mateo-Redwood City, CA
87.6%
7
9.3%
7.1% Boston-Quincy, MA
83.3%
4
7.0%
5.4%
*
Weighted by fair market value, which differs from the calculations provided for market comparisons to CBRE-EA data and are used here to reflect the fair market value of the Account’s monetary investments in those markets. As discussed in detail below, the value weighted occupancy of properties in the Washington, DC metro area is low in large part because of two newly constructed apartment properties that were vacant when acquired in June. A portion of the available space in the Account’s largest San Francisco property has been
leased to a large technology company which has not yet taken occupancy, but which will ultimately lead to an increase in market value weighted occupancy. In Boston, a portion of the available space in the Account’s largest property has been leased and the remaining space is being marketed to prospective tenants. The Account calculates the percent leased or vacant as a percentage of a property’s net rental square footage that is under contractual lease obligation in effect at the end of the period. 41
Fair Market Value
Weighted*
Property
Investments
Fair Market
Value as a %
of Total
RE Portfolio
Fair Market
Value as a %
of Total
Investments
Office According to CB Richard Ellis Econometric Advisors (“CBRE-EA”), the national office vacancy rate declined to 14.5% in the second quarter of 2014 as compared to 14.8% in the first quarter of 2014. The national office vacancy rate has continued to decline slowly over the past two years due to modest job growth
and companies’ cost-cutting initiatives. However, technology- and energy-related markets have seen vacancy rates decline more rapidly due to above average job growth. The vacancy rate for the Account’s office portfolio increased modestly to 12.3% as of second quarter 2014 as compared with 12.0% in the first quarter of 2014. As shown in the table below, the average vacancy rate of the Account’s properties in three of its top five markets was below their respective market
averages. In Washington, DC, the Account’s top market, the vacancy rate of the Account’s properties increased to 13.9%, which is better than the market average; however, leasing activity in the area remains slow due to weaker federal government spending. In Boston, the average vacancy of the Account’s
properties remained above the market average due to the past move-out of a large tenant in one of the Account’s properties. However, a lease has recently been signed for 22% of the available space and lease negotiations are underway for several additional large spaces. In San Francisco, a major technology
company has leased additional floors in the Account’s largest building but has not yet occupied the space.
Account Square
Market
Sector Metropolitan Area
Total Sector
% of Total
2014 Q2
2014 Q1
2014 Q2
2014 Q1
Office Account/Nation
12.3%
12.0%
14.5%
14.8%
1 Washington-Arlington-Alexandria, DC-VA-MD-WV
$
1,422.9
6.9%
13.9%
10.0%
15.7%
15.8%
2 San Francisco-San Mateo-Redwood City, CA
$
1,253.5
6.1%
13.2%
13.8%
8.4%
8.9%
3 Boston-Quincy, MA
$
1,069.9
5.2%
15.5%
17.4%
11.5%
11.5%
4 Seattle-Bellevue-Everett, WA
$
602.5
2.9%
5.2%
12.2%
12.1%
12.9%
5 Los Angeles-Long Beach-Glendale, CA
$
511.2
2.5%
8.8%
8.3%
15.8%
16.4%
*
Source: CBRE-EA.
Historically, the financial services sector has been a significant source of office space demand; however, sector demand has diminished in the wake of the Great Recession and new regulatory requirements. Recent employment growth suggests that space demand may soon pick up, as the financial services sector
added 34,000 jobs in the second quarter following a gain of only 9,000 in the first quarter. Professional and business services have also been a significant source of demand and particularly over the past year due to healthy employment growth. This growth continued in the second quarter of 2014 as the sector added
197,000 jobs as compared with 178,000 in the first quarter. The only exception within the sector has been the legal industry which is growing slowly and economizing on space by reducing per employee space allocations and eliminating conference rooms, libraries and storage areas. Most recently, technology, media
and entertainment companies have accounted for a large portion of demand in a number of markets. Growth in the computer and technology industries was evident in markets like San Francisco, Seattle, Boston and New York, whereas Houston has seen continued growth in energy-related industries. On the whole,
continued gradual improvement in office market conditions appears likely, given recent office employment growth trends. Industrial Conditions in the industrial market are influenced to a large degree by growth in GDP, industrial production and international trade flows. U.S. industrial market conditions continued to improve in the second quarter due to ongoing growth in U.S. GDP and industrial production coupled with further improvement
in global trade flows. Coastal port markets continue to be the biggest beneficiaries of the growth in trade. During the second quarter of 2014, the national industrial availability rate fell to 10.8% as compared to 11.1% in the first 42
Foot Weighted
Average Vacancy
Vacancy*
by Metro Area
($M)
Investments
quarter of 2014. The national industrial availability rate has declined steadily since peaking at 14.5% in the third quarter of 2010. The vacancy rate for the Account’s industrial property portfolio averaged 13.0% in the second quarter of 2014, up from 12.0% in the first quarter. The vacancy rate of the Account’s properties in three of its top five industrial markets remained well below their respective market averages. In Riverside, the Account’s
top market, space in the Account’s properties remained fully leased in the second quarter. Similarly, all of the space in the Account’s Dallas properties was fully leased for the second consecutive quarter. The average vacancy rate in the Account’s Los Angeles and Ft. Lauderdale properties declined from first
quarter but remained above their respective market averages. In Los Angeles, the average vacancy rate declined due to recent leasing. In Ft. Lauderdale, the average vacancy of the Account’s properties remained high as space vacated by the move-out of a large tenant from one of the Account’s properties has been
subdivided to accommodate the moderate-sized tenants that are more prevalent in the market. A lease has recently been signed for 6% of the available space, and the remaining space is currently being marketed to prospective tenants.
Account Square
Market
Sector Metropolitan Area
Total Sector
% of Total
2014 Q2
2014 Q1
2014 Q2
2014 Q1 Industrial Account/Nation
13.0%
12.0%
10.8%
11.1%
1 Riverside-San Bernardino-Ontario, CA
$
594.4
2.9%
0.0%
0.0%
8.3%
8.2%
2 Dallas-Plano-Irving, TX
$
223.0
1.1%
0.0%
0.0%
10.2%
10.5%
3 Tacoma, WA
$
219.3
1.1%
3.6%
4.0%
7.7%
8.0%
4 Los Angeles-Long Beach-Glendale, CA
$
213.7
1.0%
11.8%
17.6%
5.8%
6.2%
5 Fort Lauderdale-Pompano Beach-Deerfield Beach, FL
$
162.3
0.8%
17.2%
18.9%
11.6%
12.7%
*
Source: CBRE-EA.
Multi-Family U.S. apartment markets remained tight during the second quarter of 2014. The national vacancy rate averaged 4.4% in the quarter as compared with 4.9% in the first quarter. However, the decline was due in large part to the seasonality of leasing as second quarter is typically a peak leasing period. Effective rents,
which include concessions like free rent, grew 2.5-3.0% nationally, with the strongest growth reported in markets with sizeable technology and energy sectors. Weaker growth was reported in Washington, DC and smaller metropolitan areas. Construction has picked up nationally, with new supply poised to hit the
market over the balance of 2014 and in early-2015. Over the near term, however, apartment markets are expected to benefit from favorable demographic and socio-economic trends. The vacancy rate of the Account’s multi-family portfolio averaged 10.8% in the second quarter of 2014 as compared with 5.5% in the first quarter. As discussed below, the vacancy rate increased in large part because of two newly constructed properties which were unleased when acquired. Excluding these two
properties, the vacancy rate of the Account’s portfolio averaged 6.9%. As shown in the table below, the average vacancy rate of the Account’s properties in Washington, DC, its top apartment market, was well above the metro market average. However, two properties were recently acquired with no existing
tenants in order to gain access to high quality properties, in a target market, which have strong long term prospects. The Account’s other Washington, DC apartment properties were 93.2% leased. In New York, the average vacancy rate of the Account’s properties increased during the second quarter and due to a
significant renovation and repositioning program that is underway at one of the Account’s Manhattan properties. The repositioning program, which requires vacating several floors in order to complete the planned work, involves unit combinations to create larger apartments, a new lobby and elevators, and new
amenities, all of which will increase unit demand and rents. Excluding these floors, the property was 96% leased. In Los Angeles, the average vacancy rate of properties owned by the Account declined during the second quarter but remained 43
Foot Weighted
Average Vacancy
Vacancy*
by Metro Area
($M)
Investments
above the market average in large part because of the recent acquisition of a newly constructed property which is in its initial lease-up.
Account Square
Market
Sector Metropolitan Area
Total Sector
% of Total
2014 Q2
2014 Q1
2014 Q2
2014 Q1 Apartment Account/Nation
10.8%
5.5%
4.4%
4.9%
1 Washington-Arlington-Alexandria, DC-VA-MD-WV
$
780.7
3.8%
35.0%
6.3%
4.4%
4.7%
2 New York-White Plains-Wayne, NY-NJ
$
756.6
3.7%
9.5%
4.7%
5.2%
5.2%
3 Los Angeles-Long Beach-Glendale, CA
$
548.3
2.7%
8.5%
10.1%
3.3%
3.6%
4 Houston-Sugar Land-Baytown, TX
$
315.0
1.5%
6.7%
4.7%
5.1%
6.2%
5 Denver-Aurora, CO
$
269.7
1.3%
3.6%
3.8%
3.5%
4.1%
*
Source: CBRE-EA.
Retail Retail sales rebounded in the second quarter following the inhibiting effect of cold weather in much of the country during the first quarter. Preliminary data from the U.S. Census Bureau indicated that retail sales excluding motor vehicles and parts increased 1.8% in the second quarter of 2014 as compared with the
first quarter of 2014 and 3.5% compared with the second quarter of 2013. U.S. retail markets experienced similar improvement during the quarter. Availability rates in neighborhood and community centers declined to an average of 11.7% in the second quarter as compared with 11.9% as of the end of the first
quarter. The vacancy rate for the Account’s retail portfolio remained low, averaging 6.0% during the second quarter as compared with 6.2% in the first quarter. The vacancy rate of the Account’s retail portfolio remained below the national average largely because regional malls and lifestyle centers generally have
lower vacancy rates nationwide and the Account’s retail portfolio includes several high quality regional malls and lifestyle centers with minimal vacancy. Outlook Commercial real estate fundamentals have improved gradually over the past several years and that improvement continued during the second quarter of 2014. Contributing factors were robust economic and employment growth, minimal construction, and low interest rates. Competition for top properties remained
intense, but commercial real estate continued to offer attractive returns compared with other asset classes. Markets with sizeable technology, energy, medical and biotechnology sectors have experienced the strongest growth while metro areas with sizeable U.S. government and defense sectors have lagged and will
require time for demand to recover. In addition to strong domestic growth, the U.S. economy is expected to benefit from improvement in the global economy as prospects now appear stronger than they have in a number of years. While economic and geopolitical risks remain, economic conditions in leading
European economies have stabilized and are improving gradually. Similarly, growth in China and several emerging markets has rebounded and contributed to an increase in global trade. If domestic and global economic conditions generally fall in-line with economists’ expectations, U.S. real estate market conditions
are likely to experience further improvement over the remainder of 2014. The Account acquired nine properties for a total of approximately $1.0 billion in the second quarter of 2014. The properties, all of which were located in target markets, consisted of two office buildings in leading West Coast technology markets, two industrial properties in a top Southwest market, a retail property
in a major East Coast market, a Whole Foods grocery anchored center in a major Southeast market, and two newly constructed apartment properties in Washington, DC, and a newly constructed apartment property in a major West Coast market. There was one disposition of an industrial property located in a
major East Coast market during the second quarter. Acquisitions activity during the second quarter was consistent with management’s 44
Foot Weighted
Average Vacancy
Vacancy*
by Metro Area
($M)
Investments
goal of investing in high quality properties in dense urban locations and maintaining the Account’s diversification across property sectors at or close to its current sector weightings. Management continued to maintain the Account’s income returns through aggressive property management and leasing in combination with expense management. As of the second quarter of 2014, the Account’s holdings were 89.1% leased as compared with 90.1% as of the first quarter of 2014. During the second
quarter of 2014, the Account generated a 3.32% total return. The Account’s real estate assets generated a leveraged 1.31% income return and a 2.75% capital return. As shown in the graph below, real estate asset returns for the second quarter of 2014 were the seventeenth consecutive quarter of positive income
and capital returns. Management intends to continue to manage the Account’s cash position in a manner that maintains adequate liquidity reserves for new property acquisitions, the potential redemption of units from participants, capital expenditures for existing properties, property and Account operating expenses, and the Account’s
targeted cash holdings. Management intends to balance potential property acquisitions with expected financing and disposition activities while maintaining adequate cash reserves, with the ultimate goal of generating incremental Account returns. In general, management intends to maintain the Account’s
diversification across property sectors at or close to its current sector weightings. In addition to ongoing investment activities, management will carefully evaluate opportunities to place commercial mortgage debt on recent acquisitions and refinance existing debt on existing encumbered assets at lower interest rates
in order to further reduce the Account’s overall weighted cost of capital. Management has significantly reduced the Account’s overall weighted cost of capital in recent quarters and believes that the current interest rate environment can provide an opportunity to both further reduce the overall weighted cost of
capital and benefit Account returns by locking in low cost long-term mortgage financing. However, refinancing activities will only be undertaken provided mortgage proceeds can be reinvested in real estate properties or other investments that will benefit overall Account returns. A portion of the Account’s liquid assets is invested in publicly traded REITs, which provides incremental exposure to U.S. commercial real estate, an attractive dividend yield, and a high degree of liquidity. The Account’s $1.7 billion portfolio consists of a mix of REIT stocks that closely replicates the NAREIT All
Equity REIT index, thereby providing the Account with exposure to a diverse mix of property types and geographic markets. By effectively replicating the index, the Account portfolio avoids the risks associated with concentrated investments in any particular company or sector. The return profile of REITs is
currently and has historically been favorable to corporate bonds and government agency debt, albeit with added short term volatility as compared to direct investments in commercial real estate property. The Account’s REIT investments, inclusive of dividends, returned 7.1% during the second quarter of 2014. During the latter half of 2013, the Account began construction of a build-to-suit office building on vacant land owned by the Account in Houston. The development property will consist of a 593,856 square foot, 30-story, Class A office tower, which, upon completion, will be fully leased under a fifteen year lease
with the 45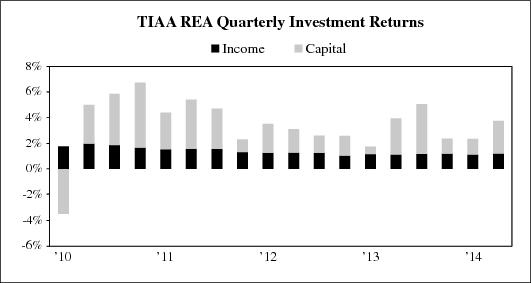
American subsidiary of a major global energy company. The project monetizes an existing land site that is adjacent to the Account’s other real estate investment in the Houston office market, and represents the Account’s first ground-up development. Construction of the property is on schedule for completion in
2016. Based on the economic and real estate market outlook for 2014, management will maintain its focus on selected property types in target markets with an emphasis on high quality properties in prime urban locations and dense suburban locations where there is limited available land for additional development.
These may include properties that have recently completed construction and have not yet begun leasing or are in their initial lease-up phase, and properties that are ground up development projects in selected markets with limited acquisition opportunities. This investment strategy will provide greater opportunity
to gain access to properties in prime locations in major metropolitan areas which have exceptional long term prospects and which management expects will lease at a steady pace given local market conditions. Given initial cash-on-cash returns for new acquisitions, management will also evaluate prospective
acquisitions based on short- and long-term growth potential, purchase price relative to replacement cost, and portfolio diversification benefits. Emphasis will be given to institutional quality properties with strong occupancy histories and favorable tenant rollover schedules. Management believes that a disciplined
investment strategy coupled with further strengthening of the U.S. economy and U.S. real estate market conditions will position the Account for favorable long-term performance. Investments as of June 30, 2014 As of June 30, 2014, the Account had total net assets of $18.3 billion, an 8.5% increase from December 31, 2013. The increase in the Account’s net assets from December 31, 2013 to June 30, 2014 was primarily driven by appreciation in value of the Account’s investments as well as net participant inflows into the
Account. As of June 30, 2014, the Account owned a total of 110 real estate property investments (96 of which were wholly owned, 14 of which were held in joint ventures). The real estate portfolio included 29 office property investments (including three held in joint ventures), 27 industrial property investments (including
one held in a joint venture), 30 apartment property investments (including one held in a joint venture), 21 retail property investments (including eight held in joint ventures and one located in Paris, France), one 75% owned joint venture interest in a portfolio of storage facilities, one land development investment,
and one fee interest encumbered by a ground lease. Of the real estate property investments, 29 are subject to debt (including nine joint venture investments). The outstanding principal on mortgage loans payable on the Account’s wholly owned real estate portfolio as of June 30, 2014 was $2.2 billion. The Account’s proportionate share of outstanding principal on mortgage loans payable within its joint venture investments was $1.7 billion. The Account’s proportionate
share of mortgage loans payable within its joint venture investments is netted against the underlying properties when determining the joint venture investment’s fair value presented on the consolidated statements of investments. When the mortgage loans payable within the joint venture investments are considered,
total outstanding principal on the Account’s portfolio as of June 30, 2014 was $3.9 billion, which represented a loan to value ratio of 17.2%. The Account currently has no Account-level debt. Management believes that the Account’s real estate portfolio is diversified by location and property type. The Account’s largest investment, 1001 Pennsylvania Avenue located in Washington, DC, represented 4.9% of total real estate investments and 3.8% of total investments. 46
The following charts reflect the diversification of the Account’s real estate assets by region and property type and list its ten largest investments. All information is based on the fair values of the investments at June 30, 2014. Diversification by Fair Value(1)
East
West
South
Foreign(2)
Midwest
Total Office
19.2
%
16.1
%
6.5
%
—
0.3
%
42.1
% Apartment
10.7
%
8.7
%
4.5
%
—
—
23.9
% Retail
3.8
%
3.9
%
7.7
%
1.7
%
0.2
%
17.3
% Industrial
1.3
%
6.8
%
3.7
%
—
0.9
%
12.7
% Other(3)
3.0
%
0.2
%
0.7
%
—
0.1
%
4.0
% Total
38.0
%
35.7
%
23.1
%
1.7
%
1.5
%
100.0
%
(1)
Wholly owned properties are represented at fair value and gross of any debt, while joint venture properties are represented at net equity value.
(2)
Represents real estate investment in France.
(3)
Represents interest in Storage Portfolio investment, a fee interest encumbered by a ground lease real estate investment and a land development. Properties in the “East” region are located in: CT, DC, DE, KY, MA, MD, ME, NC, NH, NJ, NY, PA, RI, SC, VA, VT, WV Properties in the “West” region are located in: AK, AZ, CA, CO, HI, ID, MT, NM, NV, OR, UT, WA, WY Properties in the “South” region are located in: AL, AR, FL, GA, LA, MS, OK, TN, TX Properties in the “Midwest” region are located in: IA, IL, IN, KS, MI, MN, MO, ND, NE, OH, SD, WI Top Ten Largest Real Estate Investments
Property Investment Name
City
State
Type
Value
Property as a
Property as a
1001 Pennsylvania Avenue
Washington
DC
Office
772.6
(2)
4.9
%
3.8
%
50 Fremont Street
San Francisco
CA
Office
545.6
(3)
3.5
%
2.7
%
The Florida Mall
Orlando
FL
Retail
529.4
(4)
3.4
%
2.6
%
99 High Street
Boston
MA
Office
462.1
(5)
2.9
%
2.3
%
Fourth and Madison
Seattle
WA
Office
440.1
(6)
2.8
%
2.1
%
425 Park Avenue
New York
NY
Land
420.0
2.7
%
2.0
%
DDR
Various
USA
Retail
414.1
(7)
2.6
%
2.0
%
501 Boylston Street
Boston
MA
Office
384.0
2.4
%
1.9
%
780 Third Avenue
New York
NY
Office
380.5
(8)
2.4
%
1.9
%
Ontario Industrial Portfolio
Ontario
CA
Industrial
338.0
2.2
%
1.6
%
(1)
Value as reported in the June 30, 2014 Consolidated Statement of Investments. Investments owned 100% by the Account are reported based on fair value. Investments in joint ventures are reported at fair value and are presented at the Account’s ownership interest.
(2)
This property investment is presented gross of debt. The value of the Account’s interest less the fair value of leverage is $452.5 million.
(3)
This property investment is presented gross of debt. The value of the Account’s interest less the fair value of leverage is $347.0 million.
(4)
This property investment is a 50% / 50% joint venture with Simon Property Group, L.P. and is presented net of debt. As of June 30, 2014, this debt had a fair value of $190.1 million.
(5)
This property investment is presented gross of debt. The value of the Account’s interest less the fair value of leverage is $277.1 million.
(6)
This property investment is presented gross of debt. The value of the Account’s interest less the fair value of leverage is $244.0 million.
(7)
This property is held in a 85% / 15% joint venture with Developers Diversified Realty Corporation (“DDR”), and consists of 27 retail properties located in 12 states and is presented net of debt. As of June 30, 2014, this debt had a fair value of $689.4 million.
(8)
This property investment is presented gross of debt. The value of the Account’s interest less the fair value of leverage is $217.2 million. At June 30, 2014, the Account held 76.6% of its total investments in real estate and real estate joint ventures. The Account also held investments in government agency notes representing 9.8% of total investments, real estate-related equity securities representing 8.2% of total investments, U.S. Treasury securities
representing 3.6% of total investments, and real estate limited partnerships representing 1.8% of total investments. 47
(in millions)(1)
% of Total
Real Estate
Portfolio
% of Total
Investments
Results of Operations Six months ended June 30, 2014 compared to six months ended June 30, 2013 Performance The Account’s total return was 5.73% for the six months ended June 30, 2014 as compared to 4.47% for the six months ended June 30, 2013. The Account’s annualized total returns over the past one, three, five, and ten year periods ended June 30, 2014 were 10.98%, 10.22%, 7.45%, and 4.95%, respectively. As of
June 30, 2014, the Account’s annualized total return since inception was 6.26%. Net Investment Income The table below shows the results of operations for the six months ended June 30, 2014 and 2013 and the dollar and percentage changes for those periods (dollars in millions, unaudited).
For the Six Months
Change
2014
2013
$
% INVESTMENT INCOME Real estate income, net: Rental income
$
437.2
$
411.4
$
25.8
6.3
% Real estate property level expenses and taxes: Operating expenses
101.7
103.8
(2.1
)
-2.0
% Real estate taxes
66.2
60.6
5.6
9.2
% Interest expense
48.2
64.1
(15.9
)
-24.8
% Total real estate property level expenses and taxes
216.1
228.5
(12.4
)
-5.4
% Real estate income, net
221.1
182.9
38.2
20.9
% Income from real estate joint ventures and limited partnerships
74.4
48.6
25.8
53.1
% Interest
1.5
1.6
(0.1
)
-6.3
% Dividends
19.2
19.3
(0.1
)
-0.5
% TOTAL INVESTMENT INCOME
316.2
252.4
63.8
25.3
% Expenses: Investment advisory charges
35.2
29.9
5.3
17.7
% Administrative charges
22.1
18.2
3.9
21.4
% Distribution charges
8.3
6.2
2.1
33.9
% Mortality and expense risk charges
0.4
0.4
—
0.0
% Liquidity guarantee charges
14.8
15.6
(0.8
)
-5.1
% TOTAL EXPENSES
80.8
70.3
10.5
14.9
% INVESTMENT INCOME, NET
$
235.4
$
182.1
$
53.3
29.3
% Rental Income: Rental income increased $25.8 million or 6.3% due in part to a $13.0 million increase in the office sector primarily driven by higher rental rates in the San Francisco, Miami, Seattle and Washington, DC markets. The remaining sectors drove a $6.8 million increase as a result of increases in occupancy, rental rates
and reductions in rent concessions. The remaining growth in rental income was related to a net increase associated with the acquisitions and sales of real estate investments. Operating Expenses: Operating expenses decreased $2.1 million or 2.0% primarily related to the sales of several office investments. This decrease was partially offset by a slight increase in various operating expenses at several properties. 48
Ended June 30,
Real Estate Taxes: Real estate taxes increased $5.6 million or 9.2% primarily due to acquisitions and higher property tax assessments resulting from increases in value, specifically in the apartment and office sectors, most notably in the Seattle, San Francisco, Boston and Washington, DC markets. Interest Expense: Interest expense decreased $15.9 million or 24.8% due to the payoff of mortgage loans associated with sold and existing real estate investments and the refinance of existing real estate investments, reducing the overall average interest rate of the Account’s mortgage loans payable. Income from Real Estate Joint Ventures and Limited Partnerships: Income from real estate joint ventures and limited partnerships increased $25.8 million or 53.1% due to increased cash distributions driven by increased earnings, specifically from the Account’s joint venture investments. Interest and Dividend Income: Interest and dividend income remained relatively consistent as a ratio of marketable securities held and when compared to the same period in 2013. Expenses: The Account’s expenses increased $10.5 million or 14.9%. Investment advisory, administrative, and distribution charges are costs charged to the Account associated with managing the Account. These costs have fixed and variable components, the latter of which generally correspond to the level of the Account’s net
assets under management and other cost drivers. Investment advisory, administrative, and distribution charges were, collectively, 0.37% and 0.36% of average net assets for the first half of 2014 and 2013, respectively. Mortality and expense risk and liquidity guarantee charges are contractual charges to the Account from TIAA for TIAA’s assumption of these risks and provision of the guarantee. The rate for these charges is established annually effective May 1 for each twelve month period ending each April 30 and is charged
based on the Account’s net assets. Even though net assets increased for the first half of 2014 compared to 2013, liquidity guarantee charges decreased slightly as a result of the change in deduction rates. 49
Net Realized and Unrealized Gains and Losses on Investments and Mortgage Loans Payable The table below shows the net realized and unrealized gains and losses on investments and mortgage loans payable for the six months ended June 30, 2014 and 2013 and the dollar and percentage changes for those periods (dollars in millions, unaudited).
For the Six Months
Change
2014
2013
$
% NET REALIZED AND UNREALIZED GAIN (LOSS) ON INVESTMENTS AND MORTGAGE LOANS PAYABLE Net realized gain (loss) on investments: Real estate properties
$
(2.6
)
$
(173.8
)
$
171.2
98.5
% Real estate joint ventures and limited partnerships
(4.3
)
(74.9
)
70.6
94.3
% Marketable securities
49.0
17.0
32.0
N/M Total realized gain (loss) on investments:
42.1
(231.7
)
273.8
N/M Net change in unrealized appreciation (depreciation) on: Real estate properties
398.1
436.1
(38.0
)
-8.7
% Real estate joint ventures and limited partnerships
156.5
198.5
(42.0
)
-21.2
% Marketable securities
176.5
39.3
137.2
N/M Mortgage loans payable
(26.6
)
41.8
(68.4
)
N/M Net change in unrealized appreciation on investments and mortgage loans payable
704.5
715.7
(11.2
)
-1.6
% NET REALIZED AND UNREALIZED GAIN ON INVESTMENTS AND MORTGAGE LOANS PAYABLE
$
746.6
$
484.0
$
262.6
54.3
% N/M—Not meaningful Real Estate Properties, Joint Ventures and Limited Partnerships: Net realized losses in the Account are primarily due to the sale of wholly owned real estate property investments and real estate property investments underlying the Account’s joint venture investments. See the Recent Transactions section herein for additional disclosure regarding the sale of the Account’s real
estate property investments. Real Estate Properties: The Account’s wholly owned real estate investments experienced net realized and unrealized gains of $395.5 million during the first half of 2014 compared to $262.3 million during the first half 2013. The resulting $133.2 million net increase was primarily driven by improved occupancy, continued compression in
capitalization rates, and increased market rents. The largest increases were in the office sector, most notably in the west region. Included within net unrealized gains of the Account were foreign exchange losses of $1.4 million and $20.4 million for the first half of 2014 and 2013, respectively. Real Estate Joint Ventures and Limited Partnerships: The Account’s real estate joint venture and limited partnerships experienced net realized and unrealized gains of $152.2 million during the first half of 2014 compared to $123.6 million during the first half 2013. The resulting $28.6 million net increase was a result of valuation gains driven by improved occupancy,
continued compression in capitalization rates, and increased market rents, with increases primarily concentrated in the retail sector of the Florida market. The increases were partially offset by decreases due to higher distributions of earnings, as previously discussed in Income from Real Estate Joint Ventures and
Limited Partnerships. The net valuation gains were primarily concentrated in the retail sector of the Florida market and residential sector of the New York market. 50
Ended June 30,
Marketable Securities: The Account’s marketable securities positions experienced net realized and unrealized gains of $225.5 million during the first half of 2014 compared to $56.3 million during the first half of 2013, resulting in a $169.2 million net increase. During the first six months of 2014, the markets for REITs in the U.S. increased
approximately 13.7% as measured by the FTSE NAREIT All Equity REITs Index compared to 4.0% for the first half of 2013. The Account’s real estate related equity securities appreciated in line with these market movements. Additionally, the Account held $2.7 billion of investments in government agency notes and U.S. Treasury Securities, which had nominal changes due to the short term nature of these investments. Mortgage Loans Payable: Mortgage loans payable experienced unrealized losses of $26.6 million during the first six months of 2014 compared to unrealized gains of $41.8 million for the comparable period of 2013. Valuation adjustments to mortgage loans payable are highly dependent upon interest rates, investment return demands, and the
performance of the underlying real estate investment. Overall the Account’s mortgage loans have increased in value as a result of reductions in the U.S. Treasury rates, the duration of the Account’s mortgage loans, as well as the Account’s loan to value ratio. Three months ended June 30, 2014 compared to three months ended June 30, 2013 Performance The Account’s total return was 3.32% for the three months ended June 30, 2014 as compared to 2.54% for June 30, 2013. The Account’s performance thus far during 2014 reflects an increase in the aggregate value of the Account’s real estate property investments, including investments in joint ventures and limited
partnerships, primarily as a result of continued improvement in overall market conditions. 51
Net Investment Income The table below shows the results of operations for the three months ended June 30, 2014 and 2013 and the dollar and percentage changes for those periods (dollars in millions, unaudited).
For the Three Months
Change
2014
2013
$
% INVESTMENT INCOME Real estate income, net: Rental income
$
221.4
$
207.0
$
14.4
7.0
% Real estate property level expenses and taxes: Operating expenses
49.5
52.0
(2.5
)
-4.8
% Real estate taxes
33.5
30.8
2.7
8.8
% Interest expense
24.1
31.3
(7.2
)
-23.0
% Total real estate property level expenses and taxes
107.1
114.1
(7.0
)
-6.1
% Real estate income, net
114.3
92.9
21.4
23.0
% Income from real estate joint ventures and limited partnerships
42.3
29.8
12.5
41.9
% Interest
0.7
0.8
(0.1
)
-12.5
% Dividends
11.0
10.1
0.9
8.9
% TOTAL INVESTMENT INCOME
168.3
133.6
34.7
26.0
% Expenses: Investment advisory charges
17.3
15.2
2.1
13.8
% Administrative charges
11.1
9.6
1.5
15.6
% Distribution charges
4.0
3.2
0.8
25.0
% Mortality and expense risk charges
0.2
0.2
—
0.0
% Liquidity guarantee charges
7.2
7.4
(0.2
)
-2.7
% TOTAL EXPENSES
39.8
35.6
4.2
11.8
% INVESTMENT INCOME, NET
$
128.5
$
98.0
$
30.5
31.1
% Rental Income: Rental income increased $14.4 million or 7.0% due primarily to net acquisition activity, as well as increases in the apartment and office sectors driven by higher occupancy and rental rates, particularly in the San Francisco, Miami, Seattle and Washington, DC markets. Operating Expenses: Operating expenses decreased $2.5 million or 4.8% as a result of general reductions in operating expenses, partially offset by increases attributed to net acquisition activity. Real Estate Taxes: Real estate taxes increased $2.7 million or 8.8% primarily due to net acquisition activity. Additional increases were caused by higher property tax assessments as a result of increases in value in the office sector, most notably in the Seattle, Boston and Washington, DC markets. Interest Expense: Interest expense decreased $7.2 million or 23.0% due to the payoff of mortgage loans associated with sold and existing real estate investments and the refinance of existing real estate investments, reducing the overall average interest rate of the Account’s mortgage loans payable. 52
Ended June 30,
Income from Real Estate Joint Ventures and Limited Partnerships: Income from real estate joint ventures and limited partnerships increased $12.5 million or 41.9% due to increased cash distributions driven by increased earnings, specifically from the Account’s joint venture investments. Interest and Dividend Income: Interest and dividend income remained relatively consistent as a ratio of marketable securities held and when compared to the same period in 2013. Expenses: The Account’s expenses increased $4.2 million or 11.8%. Investment advisory, administrative, and distribution charges are costs charged to the Account associated with managing the Account. These costs have fixed and variable components, the latter of which generally correspond to the level of the Account’s net
assets under management and other cost drivers. Investment advisory, administrative, and distribution charges were, collectively, 0.18% of average net assets for the second quarter of 2014 and 2013. Mortality and expense risk and liquidity guarantee charges are contractual charges to the Account from TIAA for TIAA’s assumption of these risks and provision of the guarantee. The rate for these charges generally is established annually effective May 1 for each twelve month period ending each April 30 and is
charged based on the Account’s net assets. Even though net assets increased for the second quarter of 2014 compared to 2013, liquidity guarantee charges decreased slightly as a result of the change in deduction rates. Net Realized and Unrealized Gains and Losses on Investments and Mortgage Loans Payable The table below shows the net realized and unrealized gains and losses on investments and mortgage loans payable for the three months ended June 30, 2014 and 2013 and the dollar and percentage changes for those periods (dollars in millions, unaudited).
For the Three Months
Change
2014
2013
$
% NET REALIZED AND UNREALIZED GAIN (LOSS) ON INVESTMENTS AND MORTGAGE LOANS PAYABLE Net realized gain (loss) on investments: Real estate properties
$
(1.6
)
$
(26.8
)
$
25.2
94.0
% Real estate joint ventures and limited partnerships
(4.5
)
(40.0
)
35.5
88.8
% Marketable securities
31.7
7.6
24.1
N/M Total realized gain (loss) on investments:
25.6
(59.2
)
84.8
N/M Net change in unrealized appreciation (depreciation) on: Real estate properties
291.7
247.3
44.4
18.0
% Real estate joint ventures and limited partnerships
93.2
124.6
(31.4
)
-25.2
% Marketable securities
71.4
(53.8
)
125.2
N/M Mortgage loans payable
(24.4
)
29.0
(53.4
)
N/M Net change in unrealized appreciation on investments and mortgage loans payable
431.9
347.1
84.8
24.4
% NET REALIZED AND UNREALIZED GAIN ON INVESTMENTS AND MORTGAGE LOANS PAYABLE
$
457.5
$
287.9
$
169.6
58.9
% N/M—Not meaningful Real Estate Properties, Joint Ventures and Limited Partnerships: Net realized losses in the Account are primarily due to the sale of wholly owned real estate property investments and real estate property investments underlying the Account’s joint venture investments. See the Recent Transactions section herein for additional disclosure regarding the sale of the Account’s real
estate property investments. 53
Ended June 30,
Real Estate Properties: The Account’s wholly owned real estate investments experienced net realized and unrealized gains of $290.1 million during the second quarter of 2014 compared to $220.5 million during the second quarter of 2013. The resulting $69.6 million net increase was primarily driven by improved occupancy, continued
compression in capitalization rates, and increased market rents. The largest increases were in the office sector, most notably in the northeast and west regions. Included within net unrealized gains of the Account were foreign exchange losses of $1.6 million and $2.9 million for the second quarters of 2014 and 2013,
respectively. Real Estate Joint Ventures and Limited Partnerships: The Account’s real estate joint venture and limited partnerships experienced net realized and unrealized gains of $88.7 million during the second quarter of 2014 compared to $84.6 million during the second quarter of 2013. The resulting $4.1 million net increase was a result of valuation gains driven by improved
occupancy, continued compression in capitalization rates, and increased market rents, with increases primarily concentrated in the retail sector of the Florida market. The increases were partially offset by decreases due to higher distributions of earnings, as previously discussed in Income from Real Estate Joint
Ventures and Limited Partnerships. Marketable Securities: The Account’s marketable securities positions experienced net realized and unrealized gains of $103.1 million during the second quarter of 2014 compared to net realized and unrealized losses of $46.2 million during the second quarter of 2013, resulting in a $149.3 million net increase. During the second quarter of
2014, the markets for REITs in the U.S. increased approximately 6.1% as measured by the FTSE NAREIT All Equity REITs Index compared to a decrease of 3.0% during the second quarter of 2013. The Account’s real estate related equity securities appreciated in line with these market movements. Additionally, the Account held $2.7 billion of investments in government agency notes and U.S. Treasury Securities, which had nominal changes due to the short term nature of these investments. Mortgage Loans Payable: Mortgage loans payable experienced unrealized losses of $24.4 million during the second quarter of 2014 compared to unrealized gains of $29.0 million during the comparable period of 2013. Valuation adjustments to mortgage loans payable are highly dependent upon interest rates, investment return demands, and
the performance of the underlying real estate investment. Overall the Account’s mortgage loans have increased in value as a result of reductions in the U.S. Treasury rates, the duration of the Account’s mortgage loans, as well as the Account’s loan to value ratio. Liquidity and Capital Resources As of June 30, 2014 and December 31, 2013, the Account’s cash, cash equivalents and non-real estate-related marketable securities (liquidity) had a value of $2.8 billion and $3.1 billion, respectively (15.0% and 18.5% of the Account’s net assets at such dates, respectively). The reduction in the Account’s overall
liquidity during the period was a result of real estate acquisitions. Participant Flows: Six months ended June 30, 2014 compared to the six months ended June 30, 2013 During the six months ended June 30, 2014, the Account received $1.1 billion in premiums, which included $556.2 million of participant transfers into the Account. The Account had outflows of $635.2 million in annuity payments and withdrawals and death benefits. The Account’s outflows included $279.4 million of
participant transfers out of the Account. During the six months ended June 30, 2013, the Account received $1.2 billion in premiums, which included $741.6 million of participant transfers into the Account. Additionally, the Account had outflows of $635.8 million from annuity payments, withdrawals (excluding
liquidity redemptions) and death benefits, which included $339.2 million of participant transfers out of the Account. See Note 1—Organization and Significant Accounting Policies of the consolidated financial statements as included herein. 54
Liquidity Guarantee Primarily as a result of significant net participant transfers out of the Account during late 2008 and mid-2009, pursuant to TIAA’s existing liquidity guarantee obligation, the TIAA General Account purchased $1.2 billion of liquidity units issued by the Account in a number of separate transactions between
December 2008 and June 2009. Subsequent to June 2009, the TIAA General Account has not purchased any additional liquidity units. As disclosed under “Establishing and Managing the Account—the Role of TIAA—Liquidity Guarantee” in the Account’s prospectus, in accordance with this liquidity guarantee
obligation, TIAA guarantees that all participants in the Account may redeem their accumulation units at their accumulation unit value next determined after their transfer or cash withdrawal request is received in good order. Net participant transfers out of the Account significantly slowed following the first quarter of 2009, and net participant transfer activity turned to net inflows in early 2010, which has continued through the date of this report. As a result, while management cannot predict whether any future TIAA liquidity unit
purchases will be required under this liquidity guarantee, it is unlikely that additional purchases will be required in the near term. However, management cannot predict for how long net inflows will continue to occur. If net outflows were to occur (even if not at the same intensity as in 2008 and early 2009), it could
have a negative impact on the Account’s operations and returns and could require TIAA to purchase additional liquidity units, perhaps to a significant degree, as was the case in late 2008 and early 2009. TIAA’s obligation to provide the Account’s participants liquidity through purchases of liquidity units is not subject to an express regulatory or contractual limitation, although as described in the paragraph below, the independent fiduciary may (but is not obligated to) require the reduction of TIAA’s interest
through sales of assets from the Account if TIAA’s interest exceeds the trigger point. Even if the independent fiduciary so requires, TIAA’s obligation to provide liquidity under the guarantee, which is required by the New York State Department of Financial Services, will continue. Management also believes that
TIAA has the ability to meet its obligations under this liquidity guarantee. Redemption of Liquidity Units. The independent fiduciary is vested with oversight and approval over any redemption of TIAA’s liquidity units, acting in the best interests of the Account’s participants. As of March 31, 2013, the independent fiduciary completed the systematic redemption of all of the liquidity units held by the TIAA General Account. Approximately one-quarter of such units were redeemed evenly over the business days in each of the months of June, September, and December 2012, and March
2013, representing a total of $1.3 billion redeemed during this period. As a general matter, the independent fiduciary may authorize or direct the redemption of all or a portion of liquidity units at any time and TIAA will request the approval of the independent fiduciary before any liquidity units are redeemed. Upon termination and liquidation of the Account (wind-up), any liquidity
units held by TIAA will be the last units redeemed, unless the independent fiduciary directs otherwise. The Account pays TIAA for the risk associated with providing the liquidity guarantee through a daily deduction from the Account’s net assets. Net Investment Income and Marketable Securities The Account’s net investment income continues to be an additional source of liquidity for the Account. Net investment income was $235.4 million for six months ended June 30, 2014, as compared to $182.1 million for the comparable period of 2013. Total net investment income increased as described more fully in
the Results of Operations section above. As of June 30, 2014, cash and cash equivalents, along with real estate-related and non-real estate-related marketable securities comprised 24.2% of the Account’s net assets. The Account’s real estate-related marketable securities consist of publicly traded REITs and a real estate index fund. The Account’s liquid assets
continue to be available to purchase additional suitable real estate properties, meet the Account’s debt obligations, expense needs, and participant redemption requests (i.e., cash withdrawals, benefit payments, or transfers). Leverage The Account may borrow money and assume or obtain mortgage loans on properties to leverage its real estate investments. Also, to meet any short-term cash needs, the Account may obtain a line of credit that 55
may be unsecured and/or contain terms that may require the Account to secure the loan with one or more of its properties. The Account is authorized to borrow money in accordance with its investment guidelines. Under the Account’s current investment guidelines, as further defined in its prospectus, the Account’s loan to value ratio (as described below) is to be maintained at or below 30%. Such incurrences of debt from time to time
may include:
•
placing new debt on properties;
•
refinancing outstanding debt;
•
assuming debt on acquired properties or interests in the Account’s properties; and/or
•
long term extensions of the maturity date of outstanding debt. In calculating this limit, only the Account’s actual percentage interest in any borrowings is included, and not that percentage interest held by any joint venture partner. Further, the Account may only borrow up to 70% of the then-current value of a property, although construction loans may be for 100% of the costs
incurred in developing a property. As of June 30, 2014, there were no amounts outstanding on the construction loan secured by a real estate investment held within the Account. Also, at the time the Account (or a joint venture in which the Account is a partner) enters into a revolving line of credit, management
deems the maximum amount which may be drawn under that line of credit as fully incurred, regardless of whether the maximum amount available has been drawn from time to time. The Account’s ratio of outstanding principal amount of debt (inclusive of the Account’s proportionate share of debt held within its joint venture investments) to total gross asset value (i.e., a “loan to value ratio”) was 17.2% as of June 30, 2014. The Account intends to maintain its loan to value ratio at or below
30% (this ratio is measured at the time of incurrence and after giving effect thereto). The Account’s total gross asset value, for these purposes, is equal to the total fair value of the Account’s assets (including the fair value of the Account’s interest in joint ventures), with no reduction associated with any
indebtedness on such assets. As of June 30, 2014, $108.5 million in principal amount of mortgage obligations secured by real estate investments wholly owned by the Account will mature within the next twelve months. The Account currently has sufficient liquidity in the form of cash and cash equivalents and short term securities to meet its
current mortgage obligations. In times of high net inflow activity, in particular during times of high net participant transfer inflows, management may determine to apply a portion of such cash flows to make prepayments of indebtedness prior to scheduled maturity, which would have the effect of reducing the Account’s loan to value ratio. Recent Transactions The following describes property transactions by the Account during the second quarter of 2014. Except as noted, the expenses for operating the properties purchased are either borne or reimbursed, in whole or in part, by the property tenants, although the terms vary under each lease. The Account is responsible for
operating expenses not reimbursed under the terms of a lease. All rental rates are quoted on an annual basis unless otherwise noted. Purchases Township Apartments—Redwood City, CA On May 13, 2014, the Account purchased a 120,635 square foot multi-family property located in Redwood City, California for $83.2 million. The newly constructed property is five stories and consists of 132 units. At the time of purchase, the property was 66% leased. 200 Middlefield Road—Menlo Park, CA On May 21, 2014, the Account purchased an office property located in Menlo Park, California for $49.8 million. The property is a two story, 41,933 square foot building that was 100% leased at the time of purchase. The major tenants include Summit Partners, OptumSoft, and The Blackstone Group. 56
55 Second Street—San Francisco, CA On May 23, 2014, the Account purchased a multi-use property in San Francisco, California for $268.9 million. The property is 25 stories consisting of 367,408 square feet of office space, 7,480 square feet of retail space and 4,440 square feet of storage. At the time of purchase, the property was 96% leased. The Louis at 14th—Washington, DC On June 4, 2014, the Account purchased a multi-use property located in Washington, DC for $179.4 million. The recently completed construction is nine stories and contains 268 apartment units, occupying 184,128 square feet. The property also consists of 43,641 square feet of retail space and will house Trader Joe’s
as the ground floor anchor tenant. At the time of purchase, the residential portion was not yet leased and the retail portion was 74% leased. Plaza America—Reston, VA On June 12, 2014, the Account purchased a retail property located in Reston, Virginia for $98.1 million. The 164,398 square foot property is two stories and is anchored by Whole Foods and Michael’s. At the time of purchase, the property was 93% leased. Northwest Houston Industrial Portfolio—Houston, TX On June 13, 2014, the Account purchased a 1,010,912 square foot industrial property located in Houston, Texas for $65.2 million. At the time of purchase, the property was 97% leased. Park 10 Distribution Center—Houston, TX On June 13, 2014, the Account purchased a 152,638 square foot industrial property located in Houston, Texas for $13.4 million. At the time of purchase, the property was 100% leased. Southside at McEwen—Franklin, TN On June 19, 2014, the Account purchased a 92,470 square foot retail property in Franklin, Tennessee for $44.3 million. The property’s tenants include Whole Foods, Brick Top’s, Mountain High Outfitters, and Charming Charlie. At the time of purchase, the property was 94% leased. The Woodley—Washington, DC On June 19, 2014, the Account purchased a newly constructed multi-family property located in Washington, DC for $198.3 million. The 278,400 square foot property is eight stories and contains 212 units. At the time of purchase, the property was not leased. Sales 725 Darlington Avenue, Konica Imaging Headquarters—Mahwah, NJ On April 9, 2014, the Account sold an industrial property located in Mahwah, New Jersey for a net sales price of $19.9 million, realizing a loss from the sale of $1.7 million, the majority of which had been previously recognized as unrealized losses in the Account’s consolidated statement of operations. The
Account’s cost basis in the property at the date of sale was $21.6 million. Critical Accounting Policies The consolidated financial statements of the Account are prepared in conformity with accounting principles generally accepted in the United States of America. In preparing the Account’s consolidated financial statements, management is required to make estimates and judgments that affect the reported amounts
of assets, liabilities, revenues, and expenses. Management bases its estimates on historical experience and assumptions that are believed to be reasonable under the circumstances, the results of which form the basis for making judgments about the carrying value of assets and liabilities that are not readily apparent
from other sources. Actual results may differ from these estimates and such differences may be material. 57
Determination of Investments at Fair Value: The Account reports all investments and investment related mortgage loans payable at fair value. The FASB has defined fair value as the price that would be received to sell an asset or paid to transfer a liability in an orderly transaction between market participants. The following is a description of the valuation methodologies used to determine the fair value of the Account’s investments and investment related mortgage payables. Valuation of Real Estate Properties—Investments in real estate properties are stated at fair value, as determined in accordance with policies and procedures reviewed by the Investment Committee of the Board and in accordance with the responsibilities of the Board as a whole. Accordingly, the Account does not
record depreciation. Determination of fair value involves judgment because the actual fair value of real estate can be determined only by negotiation between the parties in a sales transaction. The Account’s primary objective when valuing its real estate investments will be to produce a valuation that represents a
reasonable estimate of the fair value of its investments. Implicit in the Account’s definition of fair value are the consummation of a sale as of a specified date and the passing of title from seller to buyer under conditions whereby:
•
Buyer and seller are typically motivated;
•
Both parties are well informed or well advised, and acting in what they consider their best interests;
•
A reasonable time is allowed for exposure in the open market;
•
Payment is made in terms of cash or in terms of financial arrangements comparable thereto; and
•
The price represents the normal consideration for the property sold unaffected by special or creative financing or sales concessions granted by anyone associated with the sale. Property and investment values are affected by, among other things, the availability of capital, occupancy rates, rental rates, and interest and inflation rates. As a result, determining real estate and investment values involves many assumptions. Key inputs and assumptions include rental income and expense
amounts, related rental income and expense growth rates, discount rates and capitalization rates. Valuation techniques include discounted cash flow analysis, prevailing market capitalization rates or multiples applied to earnings from the property, analysis of recent comparable sales transactions, actual sale
negotiations and bona fide purchase offers received from third parties. Amounts ultimately realized from each investment may vary significantly from the fair value presented. Real estate properties owned by the Account are initially valued based on an independent third party appraisal, as reviewed by TIAA’s internal appraisal staff and as applicable the Account’s independent fiduciary at the time of the closing of the purchase, which may result in a potential unrealized gain or loss
reflecting the difference between an investment’s fair value (i.e., exit price) and its cost basis (which is inclusive of transaction costs). Subsequently, each property is appraised each quarter by an independent third party appraiser, reviewed by TIAA’s internal appraisal staff and as applicable the Account’s independent fiduciary. In general, the Account obtains appraisals of its real estate properties spread out throughout the quarter, which is
intended to result in appraisal adjustments, and thus, adjustments to the valuations of its holdings (to the extent such adjustments are made) that happen regularly throughout each quarter and not on one specific day or month in each period. Further, management reserves the right to order an appraisal and/or conduct another valuation outside of the normal quarterly process when facts or circumstances at a specific property change. For example, under certain circumstances a valuation adjustment could be made when the account receives a bona fide
bid for the sale of a property held within the Account or one of the Account’s joint ventures. In addition, adjustments may be made for events or circumstances indicating an impairment of a tenant’s ability to pay amounts due to the Account under a lease (including due to a bankruptcy filing of that tenant).
Alternatively, adjustments may be made to reflect the execution or renewal of a significant lease. Also, adjustments may be made to reflect factors (such as sales values for comparable properties or local employment rate) bearing uniquely on a particular region in which the Account holds properties. TIAA’s
internal appraisal staff oversees the entire appraisal process, in conjunction with the Account’s independent fiduciary (the independent fiduciary is more fully described in the paragraph below). Any differences in the conclusions of TIAA’s internal appraisal staff and the independent appraiser will be reviewed by
the independent fiduciary, 58
which will make a final determination on the matter (which may include ordering a subsequent independent appraisal). The independent fiduciary has been appointed by a special subcommittee of the Investment Committee of the Board to, among other things, oversee the appraisal process. The independent fiduciary must approve all independent appraisers used by the Account. All appraisals are performed in accordance with
Uniform Standards of Professional Appraisal Practices, the real estate appraisal industry standards created by The Appraisal Foundation. Real estate appraisals are estimates of property values based on a professional’s opinion. Appraisals of properties held outside of the U.S. are performed in accordance with
industry standards commonly applied in the applicable jurisdiction. These independent appraisers are always expected to be MAI-designated members of the Appraisal Institute (or its European equivalent, Royal Institute of Chartered Surveyors) and state certified appraisers from national or regional firms with
relevant property type experience and market knowledge. Under the Account’s current procedures, each independent appraisal firm will be rotated off of a particular property at least every three years, although such appraisal firm may perform appraisals of other Account properties subsequent to such rotation. Also, the independent fiduciary can require additional appraisals if factors or events have occurred that could materially change a property’s value (including those identified above) and such change is not reflected in the quarterly valuation review, or otherwise to ensure that the Account is valued appropriately.
The independent fiduciary must also approve any valuation change of real estate-related assets where a property’s value changed by more than 6% from the most recent independent annual appraisal, or if the value of the Account would change by more than 4% within any calendar quarter or more than 2% since
the prior calendar month. When a real estate property is subject to a mortgage, the property is valued independently of the mortgage and the property and mortgage fair values are reported separately (see Valuation of Mortgage Loans Payable below). The independent fiduciary reviews and approves all mortgage
valuation adjustments before such adjustments are recorded by the Account. The Account continues to use the revised value for each real estate property and mortgage loan payable to calculate the Account’s daily net asset value until the next valuation review or appraisal. Valuation of Real Estate Joint Ventures—Real estate joint ventures are stated at the fair value of the Account’s ownership interests of the underlying entities. The Account’s ownership interests are valued based on the fair value of the underlying real estate, any related mortgage loans payable, and other factors, such
as ownership percentage, ownership rights, buy/sell agreements, distribution provisions and capital call obligations. Upon the disposition of all real estate investments by an investee entity, the Account will continue to state its equity in the remaining net assets of the investee entity during the wind down period, if
any, which occurs prior to the dissolution of the investee entity. Valuation of Real Estate Limited Partnerships—Limited partnership interests are stated at the fair value of the Account’s ownership in the partnership which are recorded based upon the changes in the net asset values of the limited partnerships as determined from the financial statements of the limited partnerships
when received by the Account. Prior to the receipt of the financial statements from the limited partnerships, the Account estimates the value of its interest in good faith and will from time to time seek input from the issuer or the sponsor of the investments. Since market quotations are not readily available, the
limited partnership interests are valued at fair value as determined in good faith by management under the direction of the Investment Committee of the Board and in accordance with the responsibilities of the Board as a whole. Valuation of Marketable Securities—Equity securities listed or traded on any national market or exchange are valued at the last sale price as of the close of the principal securities market or exchange on which such securities are traded or, if there is no sale, at the mean of the last bid and asked prices on such market
or exchange, exclusive of transaction costs. Debt securities, other than money market instruments, are generally valued at the most recent bid price or the equivalent quoted yield for such securities (or those of comparable maturity, quality and type). Short-term investments with maturities of 60 days or less (excluding money market instruments) are valued at amortized cost. Short-term investments with maturities in excess of 60 days (excluding money market instruments) are valued in the same manner as debt securities, as described above. Money market instruments are valued at amortized cost. 59
Equity and fixed income securities traded on a foreign exchange or in foreign markets are valued using their closing values under the valuation methods generally accepted in the country where traded, as of the valuation date. This value is converted to U.S. dollars at the exchange rate in effect on the valuation day.
Under certain circumstances (for example, if there are significant movements in the United States markets and there is an expectation the securities traded on foreign markets will adjust based on such movements when the foreign markets open the next day), the Account may adjust the value of equity or fixed
income securities that trade on a foreign exchange or market after the foreign exchange or market has closed. Valuation of Mortgage Loans Payable—Mortgage loans payable are stated at fair value. The estimated fair value of mortgage loans payable are based on the amount at which the liability could be transferred to a third party exclusive of transaction costs. Mortgage loans payable are valued internally by TIAA’s
internal appraisal department, as reviewed by the Account’s independent fiduciary, at least quarterly based on market factors, such as market interest rates and spreads for comparable loans, the performance of the underlying collateral (such as the loan-to-value ratio and the cash flow of the underlying collateral),
the liquidity for mortgage loans of similar characteristics, the maturity date of the loan, the return demands of the market. Foreign currency transactions and translation: Portfolio investments and other assets and liabilities denominated in foreign currencies are translated into U.S. dollars at the exchange rates prevailing at the end of the period. Purchases and sales of securities, income receipts and expense payments made in foreign
currencies are translated into U.S. dollars at the exchange rates prevailing on the respective dates of the transactions. The effect of any changes in foreign currency exchange rates on portfolio investments and mortgage loans payable are included in net realized and unrealized gains and losses on real estate
properties and mortgage loans payable. Net realized gains and losses on foreign currency transactions include disposition of foreign currencies, and currency gains and losses between the accrual and receipt dates of portfolio investment income and between the trade and settlement dates of portfolio investment
transactions. Accumulation and Annuity Funds: The accumulation fund represents the net assets attributable to participants in the accumulation phase of their investment (“Accumulation Fund”). The annuity fund represents the net assets attributable to the participants currently receiving annuity payments (“Annuity Fund”).
The net increase or decrease in net assets from investment operations is apportioned between the accounts based upon their relative daily net asset values. Once an Account participant begins receiving lifetime annuity income benefits, payment levels cannot be reduced as a result of the Account’s adverse mortality
experience. In addition, the contracts pursuant to which the Account is offered are required to stipulate the maximum expense charge for all Account level expenses that can be assessed, which is not to exceed 2.5% of average net assets per year. The Account pays a fee to TIAA to assume mortality and expense
risks. Accounting for Investments: The investments held by the Account are accounted for as follows: Real Estate Properties—Rent from real estate properties consists of all amounts earned under tenant operating leases, including base rent, recoveries of real estate taxes and other expenses and charges for miscellaneous services provided to tenants. Rental income is recognized in accordance with the billing terms of
the lease agreements. The Account bears the direct expenses of the real estate properties owned. These expenses include, but are not limited to, fees to local property management companies, property taxes, utilities, maintenance, repairs, insurance, and other operating and administrative costs. An estimate of the
net operating income earned from each real estate property is accrued by the Account on a daily basis and such estimates are adjusted when actual operating results are determined. Real Estate Joint Ventures—The Account has limited ownership interests in various real estate joint ventures (collectively, the “joint ventures”). The Account records its contributions as increases to its investments in the joint ventures, and distributions from the joint ventures are treated as income within income from
real estate joint ventures and limited partnerships in the Account’s consolidated statements of operations. Distributions that are identified as returns of capital are recorded as a reduction to the cost basis of the investment, whereas distributions identified as capital gains or losses are recorded as realized gains or
losses. Income from the joint ventures is recorded based on the Account’s proportional interest of the income distributed by the joint ventures. Income earned by the joint ventures, but not yet distributed to the Account by the joint ventures is recorded as unrealized gains and losses. Limited Partnerships—The Account has limited ownership interests in various private real estate funds (primarily limited partnerships) and a private REIT (collectively, the “limited partnerships”). The Account 60
records its contributions as increases to the investments, and distributions from the investments are treated as income within income from real estate joint ventures and limited partnerships in the Account’s consolidated statements of operations. Distributions that are identified as returns of capital are recorded as a
reduction to the cost basis of the investment, whereas distributions identified as capital gains or losses are recorded as realized gains or losses. Unrealized gains and losses are recorded based upon the changes in the net asset values of the limited partnerships as determined from the financial statements of the
limited partnerships when received by the Account. Prior to the receipt of the financial statements from the limited partnerships, the Account estimates the value of its interest in good faith and will from time to time seek input from the issuer or the sponsor of the investment. Changes in value based on such
estimates are recorded by the Account as unrealized gains and losses. Marketable Securities—Transactions in marketable securities are accounted for as of the date the securities are purchased or sold (trade date). Interest income is recorded as earned. Dividend income is recorded on the ex-dividend date within dividend income. Dividends that are identified as returns of capital are
recorded as a reduction to the cost basis of the investment, whereas dividends identified as capital gains or losses are recorded as realized gains or losses. Realized gains and losses on securities transactions are accounted for on the specific identification method. Realized and Unrealized Gains and Losses—Unrealized gains and losses are recorded as the fair values of the Account’s investments are adjusted, and as discussed within the Real Estate Joint Ventures and Limited Partnerships sections above. Realized gains and losses are recorded at the time an investment is sold or
a distribution is received from the joint ventures or limited partnerships. Real estate transactions are accounted for as of the date on which the purchase or sale transactions for the real estate properties close (settlement date). The Account recognizes a realized gain on the sale of a real estate property to the extent
that the contract sales price exceeds the cost-to-date of the property being sold. A realized loss occurs when the cost-to-date exceeds the sales price. Net Assets—The Account’s net assets as of the close of each valuation day are valued by taking the sum of:
•
the value of the Account’s cash, cash equivalents, and short-term and other debt instruments;
•
the value of the Account’s other securities and other non-real estate assets;
•
the value of the individual real properties (based on the most recent valuation of that property) and other real estate-related investments owned by the Account;
•
an estimate of the net operating income accrued by the Account from its properties, other real estate-related investments and non-real estate-related investments (including short-term marketable securities) since the end of the prior valuation day; and
•
actual net operating income earned from the Account’s properties, other real estate-related investments and non-real estate-related investments (but only to the extent any such item of income differs from the estimated income accrued on such investments), and then reducing the sum by liabilities held within the Account, including the daily investment management fee, administration and distribution fees and certain other expenses attributable to operating the Account. After the end of every quarter, the Account reconciles the amount of expenses deducted from the Account (which is established in order to approximate the costs that the Account will incur) with the expenses the Account actually incurred. If there is a difference, the Account adds it to or deducts it from the
Account in equal daily installments over the remaining days of the following quarter. Material differences may be repaid in the current calendar quarter. The Account’s at-cost deductions are based on projections of Account assets and overall expenses, and the size of any adjusting payments will be directly affected
by the difference between management’s projections and the Account’s actual assets or expenses. Federal Income Taxes: Based on provisions of the Internal Revenue Code, Section 817, the Account is taxed as a segregated asset account of TIAA and as such, the Account should incur no material federal income tax attributable to the net investment activity of the Account. 61
ITEM 3. QUANTITATIVE AND QUALITATIVE DISCLOSURES ABOUT MARKET RISK The Account’s real estate holdings, including real estate joint ventures and limited partnerships, which, as of June 30, 2014, represented 78.4% of the Account’s total investments, expose the Account to a variety of risks. These risks include, but are not limited to:
•
General Real Estate Risk—The risk that the Account’s property values or rental and occupancy rates could go down due to general economic conditions, a weak market for real estate generally, disruptions in the credit and/or capital markets, or changing supply and demand for certain types of properties;
•
Appraisal Risk—The risk that the sale price of an Account property (i.e., the value that would be determined by negotiations between independent parties) might differ substantially from its estimated or appraised value, leading to losses or reduced profits to the Account upon sale;
•
Risk Relating to Property Sales—The risk that the Account might not be able to sell a property at a particular time for its full value, particularly in a poor market. This might make it difficult to raise cash quickly and also could lead to Account losses;
•
Risks of Borrowing—The risk that interest rate changes may impact Account returns if the Account takes out a mortgage on a property, buys a property subject to a mortgage or holds a property subject to a mortgage, and hedging against such interest rate changes, if undertaken by the Account, may entail
additional costs and be unsuccessful; and
•
Foreign Currency Risk—The risk that the value of the Account’s foreign investments, related debt, or rental income could increase or decrease due to changes in foreign currency exchange rates or foreign currency exchange control regulations, and hedging against such changes, if undertaken by the Account,
may entail additional costs and be unsuccessful. The Account believes the diversification of its real estate portfolio, both geographically and by sector, along with its quarterly valuation procedure, helps manage the real estate and appraisal risks described above. As of June 30, 2014, 21.6% of the Account’s total investments were comprised of marketable securities. Marketable securities included high-quality debt instruments (i.e., government agency notes) and predominately REIT securities. The consolidated statements of investments for the Account sets forth the general
financial terms of these instruments, along with their fair values, as determined in accordance with procedures described earlier in the Critical Accounting Policies section above and in Note 1—Organization and Significant Accounting Policies to the Account’s consolidated financial statements included herewith.
Currently, the Account does not invest in derivative financial investments, nor does the Account engage in any hedging activity. Risks associated with investments in real estate-related liquid assets (which could include, from time to time, REIT securities and CMBS), and non-real estate-related liquid assets, include financial/credit risk, market volatility risk, interest rate volatility risk and deposit/money market risk.
•
Financial/Credit Risk—The risk, for debt securities, that the issuer will not be able to pay principal and interest when due (and/or declare bankruptcy or be subject to receivership) and, for equity securities such as common or preferred stock, that the issuer’s current earnings will fall or that its overall financial
soundness will decline, reducing the security’s value.
•
Market Volatility Risk—The risk that the Account’s investments will experience price volatility due to changing conditions in the financial markets regardless of the credit quality or financial condition of the underlying issuer. This risk is particularly acute to the extent the Account holds equity securities, which
have experienced significant short-term price volatility over the past year. Also, to the extent the Account holds debt securities, changes in overall interest rates can cause price fluctuations.
•
Interest Rate Volatility—The risk that interest rate volatility may affect the Account’s current income from an investment.
•
Deposit/Money Market Risk—The risk that, to the extent the Account’s cash held in bank deposit accounts exceeds federally insured limits as to that bank, the Account could experience losses if 62
banks fail. The Account does not believe it has exposure to a significant concentration of deposit risk. In addition, there is some risk that investments held in money market funds can suffer losses. In addition, to the extent the Account were to hold mortgage-backed securities (including commercial mortgage-backed securities) these securities are subject to prepayment risk or extension risk (i.e., the risk that borrowers will repay the loans earlier or later than anticipated). If the underlying mortgage assets
experience faster than anticipated repayments of principal, the Account could fail to recoup some or all of its initial investment in these securities, since the original price paid by the Account was based in part on assumptions regarding the receipt of interest payments. If the underlying mortgage assets are repaid
later than anticipated, the Account could lose the opportunity to reinvest the anticipated cash flows at a time when interest rates might be rising. The rate of prepayment depends on a variety of geographic, social and other functions, including prevailing market interest rates and general economic factors. The fair
value of these securities is also highly sensitive to changes in interest rates. Note that the potential for appreciation, which could otherwise be expected to result from a decline in interest rates, may be limited by any increased prepayments. These securities may be harder to sell than other securities. In addition to these risks, real estate equity securities (such as REIT stocks and mortgage-backed securities) would be subject to many of the same general risks inherent in real estate investing, making mortgage loans and investing in debt securities. For more information on the risks associated with all of the
Account’s investments, see the Account’s most recent prospectus. ITEM 4. CONTROLS AND PROCEDURES (a) The registrant maintains a system of disclosure controls and procedures that are designed to provide reasonable assurance that information required to be disclosed in the registrant’s reports under the Securities Exchange Act of 1934, as amended (the “Exchange Act”), is recorded, processed, summarized and
reported within the time periods specified in the SEC’s rules and forms, and that such information is accumulated and communicated to management, including TIAA’s Executive Vice President and President, Asset Management (Principal Executive Officer (“PEO”)) and TIAA’s Executive Vice President and
Chief Financial Officer (Principal Financial Officer (“PFO”)), as appropriate, to allow timely decisions regarding required disclosure. Under the supervision and participation of the registrant’s management, including the registrant’s PEO and PFO, the registrant conducted an evaluation of the effectiveness of the registrant’s disclosure controls and procedures as defined in Rule 13a-15(e) under the Exchange Act as of June 30, 2014. Based upon
management’s review, the PEO and PFO concluded that the registrant’s disclosure controls and procedures were effective as of June 30, 2014. (b) Changes in internal control over financial reporting. There have been no changes in the registrant’s internal control over financial reporting that occurred during the registrant’s last fiscal quarter that materially affected, or are reasonably likely to materially affect, the registrant’s internal control over financial
reporting. 63
PART II. OTHER INFORMATION ITEM 1. LEGAL PROCEEDINGS. The Account is party to various claims and routine litigation arising in the ordinary course of business. Management of the Account does not believe that the results of any such claims or litigation, individually or in the aggregate, will have a material effect on the Account’s business, financial position or results of
operations. ITEM 1A. RISK FACTORS. There have been no material changes from the Account’s risk factors as previously reported in the Account’s Annual Report on Form 10-K for the year ended December 31, 2013. ITEM 2. UNREGISTERED SALES OF EQUITY SECURITIES AND USE OF PROCEEDS. Not applicable. ITEM 3. DEFAULTS UPON SENIOR SECURITIES. Not applicable. ITEM 4. MINE SAFETY DISCLOSURES. Not applicable. ITEM 5. OTHER INFORMATION. The Code of Ethics for TIAA’s senior financial officers, including its principal executive officer, principal financial officer, principal accounting officer, or controller, and persons performing similar functions, has been filed as an exhibit to the Account’s Annual Report on Form 10-K for the year ended December 31,
2013 and can also be found on the following two web sites, http://www.tiaa-cref.org/public/prospectuses/index.html and http://www.tiaa-cref.org/public/about/governance/corporate/annual-reports/index.html. 64
ITEM 6. EXHIBITS
(1)
(A)
Distribution Agreement for the Contracts Funded by the TIAA Real Estate Account, dated as of January 1, 2008, by and among Teachers Insurance and Annuity Association of America, for itself and on behalf of the Account, and TIAA-CREF Individual & Institutional Services, LLC.4
(3)
(A)
Charter of TIAA.6
(B)
Restated Bylaws of TIAA (as amended).7
(4)
(A)
Forms of RA, GRA, GSRA, SRA, IRA Real Estate Account Endorsements2, Keogh Contract,3 Retirement Select and Retirement Select Plus Contracts and Endorsements1 and Retirement Choice and Retirement Choice Plus Contracts.3
(B)
Forms of Income-Paying Contracts.2
(C)
Form of Contract Endorsement for Internal Transfer Limitation.8
(D)
Form of Accumulation Contract.9
(10)
(A)
Amended and Restated Independent Fiduciary Letter Agreement, dated as of November 23, 2011, between TIAA, on behalf of the Registrant, and Real Estate Research Corporation.10
(B)
Custodian Agreement, dated as of March 3, 2008, by and between TIAA, on behalf of the Registrant, and State Street Bank and Trust Company, N.A.5
*(31)
Rule 13(a)-15(e)/ Rule 13a-15(e)/15d-15(e) Certifications.
*(32)
Section 1350 Certifications.
**(101)
The following financial information from the Quarterly Report on Form 10-Q for the period ended June 30, 2014, formatted in XBRL (Extensible Business Reporting Language): (i) the Consolidated Statements of Assets and Liabilities, (ii) the Consolidated Statements of Operations, (iii) the
Consolidated Statements of Changes in Net Assets, (iv) the Consolidated Statements of Cash Flows, and (v) the Notes to the Consolidated Financial Statements.
*
Filed herewith.
**
Furnished electronically herewith.
(1)
Previously filed and incorporated herein by reference to the Account’s Pre-Effective Amendment No. 1 to the Registration Statement on Form S-1 filed April 29, 2004 (File No. 333-113602).
(2)
Previously filed and incorporated herein by reference to the Account’s Post-Effective Amendment No. 2 to the Registration Statement on Form S-1 filed April 30, 1996 (File No. 33-92990).
(3)
Previously filed and incorporated herein by reference to the Account’s Post-Effective Amendment No. 1 to the Registration Statement on Form S-1 filed May 2, 2005 (File No. 333-121493).
(4)
Previously filed and incorporated herein by reference to Exhibit 1(A) to the Account’s Registration Statement on Form S-1 filed March 15, 2013 (File No. 333-187309).
(5)
Previously filed and incorporated herein by reference to Exhibit 10.(b) to the Annual Report on Form 10-K of the Account for the fiscal year ended December 31, 2012 and filed with the Commission on March 14, 2013 (File No. 33-92990).
(6)
Previously filed and incorporated by reference to Exhibit 3(A) to the Account’s Quarterly Report on Form 10-Q for the quarter ended June 30, 2009 and filed with the Commission on August 13, 2009 (File No. 33-92990).
(7)
Previously filed and incorporated by reference to Exhibit 3(B) to the Account’s Quarterly Report on Form 10-Q for the quarter ended June 30, 2009 and filed with the Commission on August 13, 2009 (File No. 33-92990).
(8)
Previously filed and incorporated by reference to Exhibit 4(C) to the Account’s Quarterly Report on Form 10-Q for the quarter ended September 30, 2010 and filed with the Commission on November 12, 2010 (File No. 33-92990).
(9)
Previously filed and incorporated by reference to Exhibit 4(D) to the Account’s Pre-Effective Amendment No. 1 to the Registration Statement on Form S-1 filed April 27, 2011 (File No. 333-172900).
(10)
Previously filed and incorporated by reference to Exhibit 10.1 to the Account’s Current Report on Form 8-K, filed with the Commission on November 29, 2011 (File No. 33-92990). 65
SIGNATURES Pursuant to the requirements of the Securities Exchange Act of 1934, as amended, the registrant, TIAA Real Estate Account, has duly caused this Report to be signed on its behalf by the undersigned, thereunto duly authorized, in New York, New York, on the 7th day of August, 2014.
TIAA REAL ESTATE ACCOUNT
By:
TEACHERS INSURANCE AND ANNUITY
August 7, 2014
By:
/s/ Robert G. Leary
Robert G. Leary
August 7, 2014
By:
/s/ Virginia M. Wilson
Virginia M. Wilson 66
ASSOCIATION OF AMERICA
Executive Vice President and
President, Asset Management,
(Principal Executive Officer)
Executive Vice President and
Chief Financial Officer,
(Principal Financial Officer)